Embed Size (px)
Citation preview
Makassar Strait throughflow, 2004 to 2006
A. L. Gordon,1 R. D. Susanto,1 A. Ffield,2 B. A. Huber,1 W. Pranowo,3 and S. Wirasantosa3
Received 17 October 2008; revised 15 November 2008; accepted 21 November 2008; published 24 December 2008.
[1] The transfer of Pacific water into the Indian Oceanthrough the Indonesian seas affects the heat and freshwaterbudgets of both oceans. The observed transport in theMakassar Strait, the primary Indonesian throughflowpathway, from January 2004 through November 2006 is11.6 ± 3.3 Sv (Sv = 106 m3/s). This transport is 27% largerthan observed during 1997 when a strong El Nino suppressedthe flow. The 2004-06 Makassar transport displays clearseasonal behavior, with associated heat and freshwatervariability, in contrast to the El Nino dominated 1997transport. The 2004-06 transport reached maximum valuestowards the end of the northwest and southeast monsoons,with minimum transport are in October-December. A sustainedhigh transport is observed in early 2006, perhaps in responseto an La Nina condition. The maximum throughflow occurswithin the thermocline, as in 1997, though the longer 2004-06measurements also reveal a shallowing of transport as speedsincrease. The transport-weighted temperature is 15.6�C in2004-06, nearly 1�C warmer than that observed in 1997,presumably a consequence of El Nino. Citation: Gordon,
A. L., R. D. Susanto, A. Ffield, B. A. Huber, W. Pranowo, and
S. Wirasantosa (2008), Makassar Strait throughflow, 2004 to 2006,
Geophys. Res. Lett., 35, L24605, doi:10.1029/2008GL036372.
1. Introduction
[2] The Indonesian seas allow for transfer of tropicalwaters from the Pacific to the Indian Ocean in what isreferred to as the Indonesian throughflow [ITF], with sig-nificant impact on the oceanic heat and freshwater budgetsand on the climate system [Gordon, 2005]. Estimates basedon measurements obtained from 1985 to 1996 suggest anITF slightly greater than 10 Sv (Sv = 106 m3/s) [Gordon,2005]. Seasonal and intraseasonal fluctuations are apparentamidst the strong tidal currents [Ffield and Gordon, 1996;Susanto et al., 2000]. Interannual variability has been linkedto the El Nino-Southern Oscillation (ENSO) [Meyers, 1996;England and Huang, 2005].[3] Prior to 2004 the major corridors of the ITF (Figure 1)
were measured, though at different times (see Gordon 2005for a review). Because the ITF varies with time, thesemeasurements are not synoptic. The International NusantaraStratification and Transport (INSTANT) program [Sprintallet al., 2004] was established to overcome this deficiency bysimultaneously measuring the ITF from the Pacific inflow atMakassar Strait and Lifamatola Passage to the Indian Oceanexport channels of Timor, Ombai and Lombok, over a 3-
year period. The INSTANT fieldwork began in December/January 2003/04 and was completed in November/December2006.[4] To prompt comparison with other data sets and with
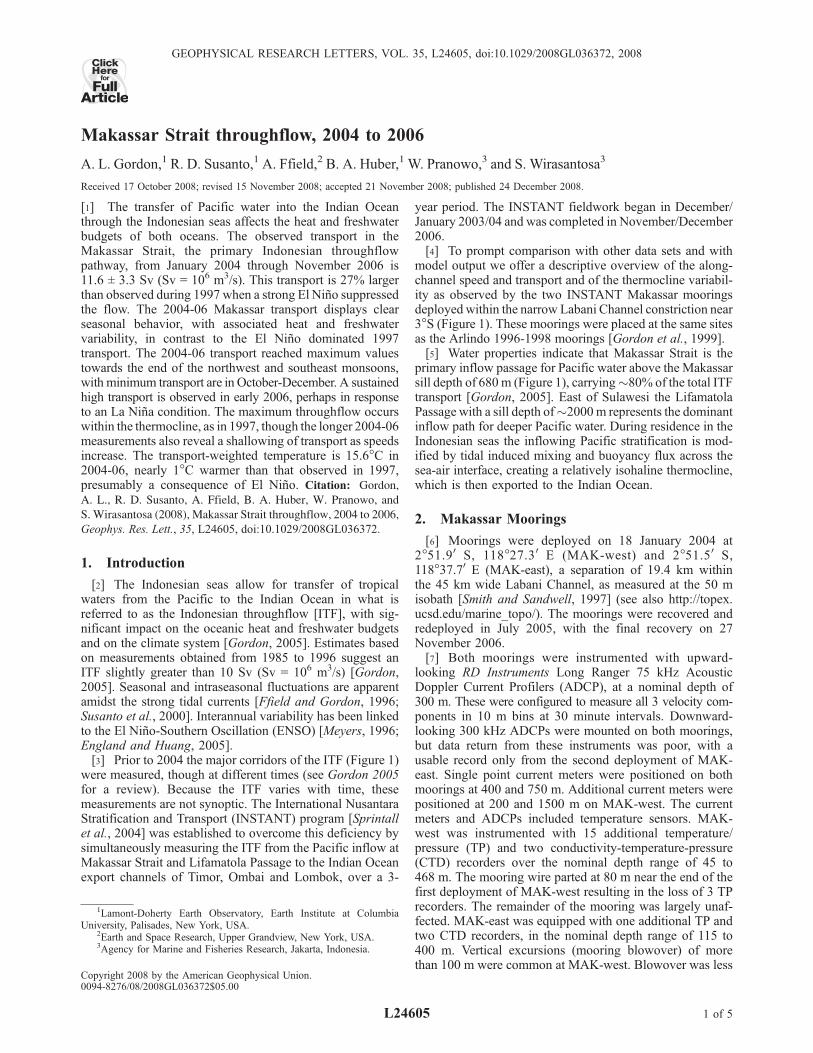
model output we offer a descriptive overview of the along-channel speed and transport and of the thermocline variabil-ity as observed by the two INSTANT Makassar mooringsdeployed within the narrow Labani Channel constriction near3�S (Figure 1). These moorings were placed at the same sitesas the Arlindo 1996-1998 moorings [Gordon et al., 1999].[5] Water properties indicate that Makassar Strait is the
primary inflow passage for Pacific water above the Makassarsill depth of 680 m (Figure 1), carrying�80% of the total ITFtransport [Gordon, 2005]. East of Sulawesi the LifamatolaPassage with a sill depth of�2000m represents the dominantinflow path for deeper Pacific water. During residence in theIndonesian seas the inflowing Pacific stratification is mod-ified by tidal induced mixing and buoyancy flux across thesea-air interface, creating a relatively isohaline thermocline,which is then exported to the Indian Ocean.
2. Makassar Moorings
[6] Moorings were deployed on 18 January 2004 at2�51.90 S, 118�27.30 E (MAK-west) and 2�51.50 S,118�37.70 E (MAK-east), a separation of 19.4 km withinthe 45 km wide Labani Channel, as measured at the 50 misobath [Smith and Sandwell, 1997] (see also http://topex.ucsd.edu/marine_topo/). The moorings were recovered andredeployed in July 2005, with the final recovery on 27November 2006.[7] Both moorings were instrumented with upward-
looking RD Instruments Long Ranger 75 kHz AcousticDoppler Current Profilers (ADCP), at a nominal depth of300 m. These were configured to measure all 3 velocity com-ponents in 10 m bins at 30 minute intervals. Downward-looking 300 kHz ADCPs were mounted on both moorings,but data return from these instruments was poor, with ausable record only from the second deployment of MAK-east. Single point current meters were positioned on bothmoorings at 400 and 750 m. Additional current meters werepositioned at 200 and 1500 m on MAK-west. The currentmeters and ADCPs included temperature sensors. MAK-west was instrumented with 15 additional temperature/pressure (TP) and two conductivity-temperature-pressure(CTD) recorders over the nominal depth range of 45 to468 m. The mooring wire parted at 80 m near the end of thefirst deployment of MAK-west resulting in the loss of 3 TPrecorders. The remainder of the mooring was largely unaf-fected. MAK-east was equipped with one additional TP andtwo CTD recorders, in the nominal depth range of 115 to400 m. Vertical excursions (mooring blowover) of morethan 100 m were common at MAK-west. Blowover was less
GEOPHYSICAL RESEARCH LETTERS, VOL. 35, L24605, doi:10.1029/2008GL036372, 2008ClickHere
for
FullArticle
1Lamont-Doherty Earth Observatory, Earth Institute at ColumbiaUniversity, Palisades, New York, USA.
2Earth and Space Research, Upper Grandview, New York, USA.3Agency for Marine and Fisheries Research, Jakarta, Indonesia.
Copyright 2008 by the American Geophysical Union.0094-8276/08/2008GL036372$05.00
L24605 1 of 5
at MAK-east, in part owing to the shorter length of mooringwire above the Long Ranger ADCP.
3. Along-Channel Speed
[8] The record length speeds at select depths at theINSTANT Makassar Strait moorings (Table 1) reveal amaximum speed within the thermocline (140 m in Table 1).The average ratio of the MAK-east to MAK-west speeds is0.95 (surface layer), 0.84 (mid-thermocline) and 0.76 (lowerthermocline), respectively. The thermocline speed maximumand the western intensification of the Labani throughfloware consistent with the Arlindo data [Gordon et al., 1999;Susanto and Gordon, 2005].[9] The average direction of the flow at MAK-east is
towards 165�. At MAK-west there is a stronger eastwardcomponent, with an average direction of 155�. The along-axis trend of Labani Channel is oriented along �170�, so theaverage direction of the two moorings is directed slightly tothe east of along-axis direction. The Naval Research Labo-ratory (NRL) 1/32� global Layered Ocean Model [Shriver
et al., 2007] (see also http://www7320.nrlssc.navy.mil/global_nlom/) shows the maximum southward currents inthe Makassar Strait north of Labani Channel along thewestern side of the Makassar Strait. The flow along thewestern side of the northern Makassar Strait must then shifteastward, around the shallow bathymetry, to transit LabaniChannel. The slight eastward flow relative to the along-axisorientation of the Channel may be due to inertia. That therelative eastward component increases as the meridionalcomponent exceeds 1 knot is consistent with this speculation.[10] Following the convention used for the Arlindo data,
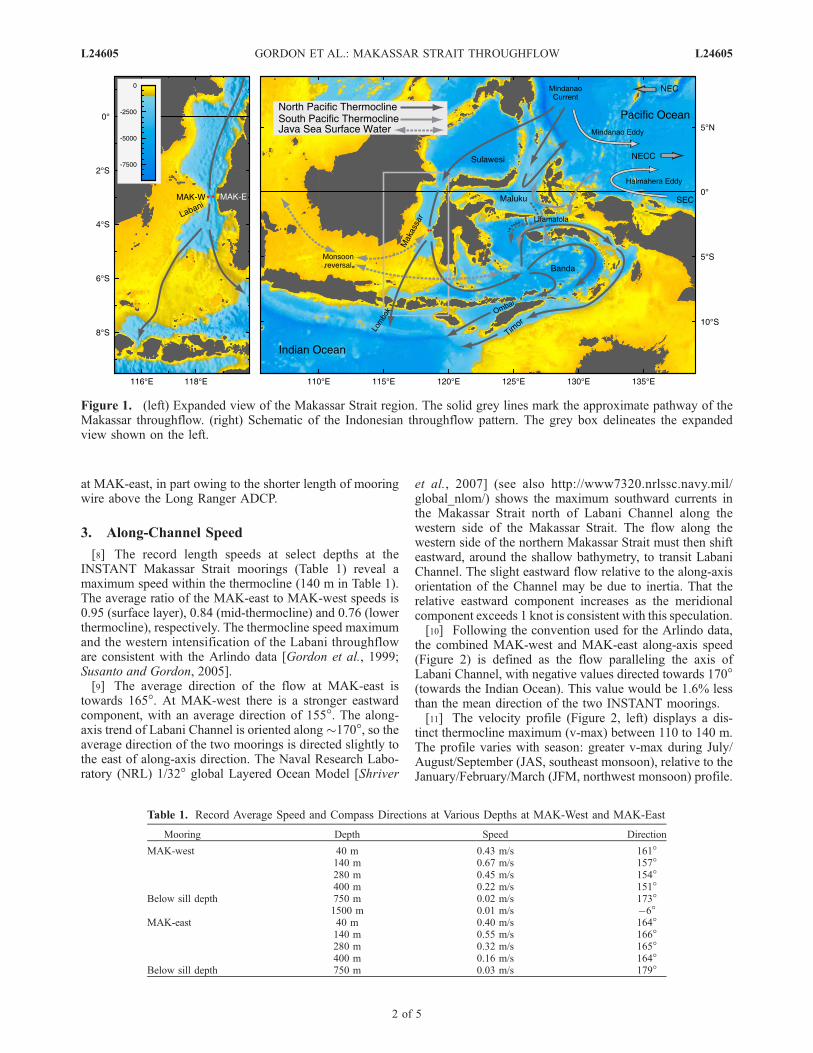
the combined MAK-west and MAK-east along-axis speed(Figure 2) is defined as the flow paralleling the axis ofLabani Channel, with negative values directed towards 170�(towards the Indian Ocean). This value would be 1.6% lessthan the mean direction of the two INSTANT moorings.[11] The velocity profile (Figure 2, left) displays a dis-
tinct thermocline maximum (v-max) between 110 to 140 m.The profile varies with season: greater v-max during July/August/September (JAS, southeast monsoon), relative to theJanuary/February/March (JFM, northwest monsoon) profile.
Figure 1. (left) Expanded view of the Makassar Strait region. The solid grey lines mark the approximate pathway of theMakassar throughflow. (right) Schematic of the Indonesian throughflow pattern. The grey box delineates the expandedview shown on the left.
Table 1. Record Average Speed and Compass Directions at Various Depths at MAK-West and MAK-East
Mooring Depth Speed Direction
MAK-west 40 m 0.43 m/s 161�140 m 0.67 m/s 157�280 m 0.45 m/s 154�400 m 0.22 m/s 151�
Below sill depth 750 m 0.02 m/s 173�1500 m 0.01 m/s �6�
MAK-east 40 m 0.40 m/s 164�140 m 0.55 m/s 166�280 m 0.32 m/s 165�400 m 0.16 m/s 164�
Below sill depth 750 m 0.03 m/s 179�
L24605 GORDON ET AL.: MAKASSAR STRAIT THROUGHFLOW L24605
2 of 5
The JAS and JFM profiles reverse their relative position atdepths below 220 db, indicating a deeper reaching Makassarthroughflow during the northwest monsoon. The time seriessection of the along-axis current (Figure 2, right) furtherdisplays the depth dependence of the v-max, with a tendencyfor the higher speeds as the v-max shallows. The v-maxdeepens during the northwest monsoon, February-March2004, March-April 2005 and February-April 2006; withthe shallowest v-max during the southeast monsoon, July-September 2004, 2005 and 2006. The thermocline v-maxdisplays a semi-annual fluctuation, with highest values withinthe middle to latter stage of each monsoon: February-April2004, July-September 2004, March-April 2005, August-September 2005, February-March 2006, June-September2006. The strong southward speeds in 2006 stand out as ananomaly, lacking the May/June throughflow relaxation asobserved in the two prior years. The period of sustainedthroughflow begins rather abruptly in early February 2006,
spanning a wide swath of depths, from the sea surface to wellbelow the thermocline.[12] Reduced throughflow in May 2004 and May 2005
may represent the impact of Kelvin Waves generated duringthe monsoon transitions in the Indian Ocean that propagateeastward to Sumatra, and then continue as coastal-trappedKelvin Waves [Sprintall et al., 2000] to the ITF export por-tals. This feature was absent in May 2006. The La Ninacondition of January to April 2006 (negative nino4; Figure 3)with commensurate higher Makassar throughflow transport(Figure 3) may have suppressed the propagation of theKelvin Wave into Labani Channel. A secondary weakeningof the southward speeds occur in November 2004, 2005 and2006, may also represent an Indian Ocean Kelvin Wavemonsoon transition event. Surface layer reversals of 1 to2 months duration are observed during the northwestmonsoon (primarily in December-January) of 2005 and2006, consistent with the Arlindo time series [Gordon et al.,
Figure 2. (left) The seasonal profiles and (right) along-channel velocity section. The velocities represent an average ofMAK-west and MAK-east values. The vertical coordinates are given in decibar (dbar), which is approximately a meter (m).
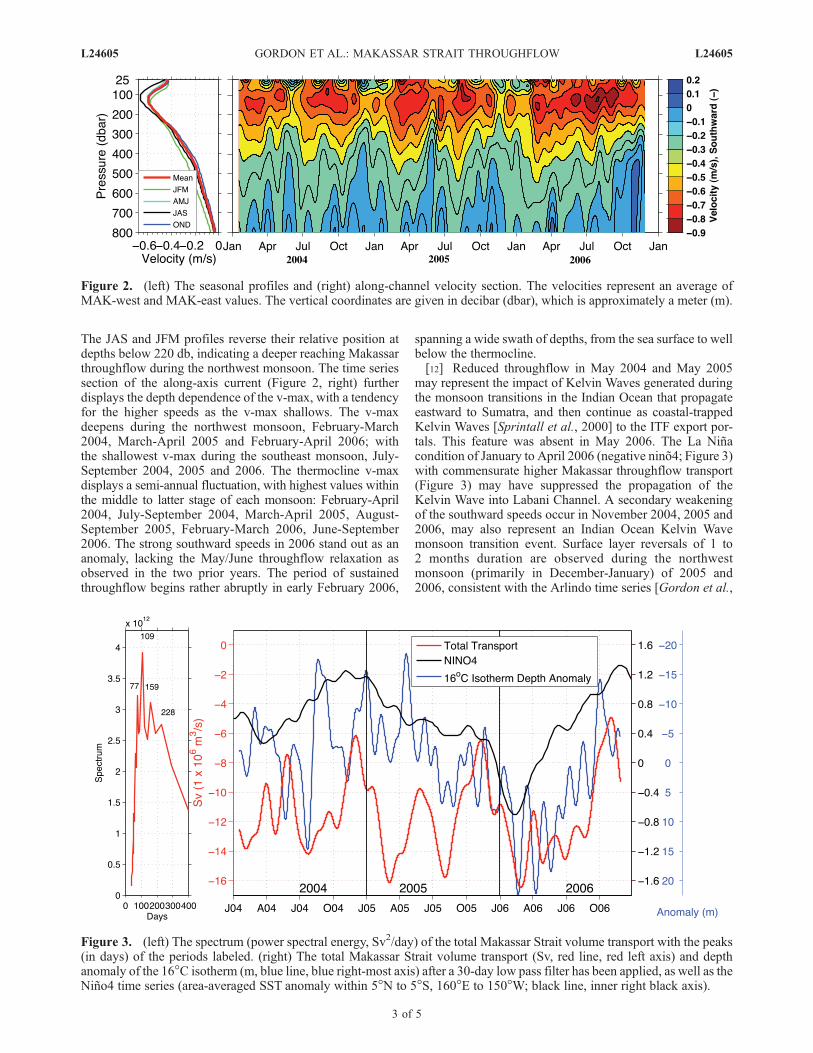
Figure 3. (left) The spectrum (power spectral energy, Sv2/day) of the total Makassar Strait volume transport with the peaks(in days) of the periods labeled. (right) The total Makassar Strait volume transport (Sv, red line, red left axis) and depthanomaly of the 16�C isotherm (m, blue line, blue right-most axis) after a 30-day low pass filter has been applied, as well as theNino4 time series (area-averaged SST anomaly within 5�N to 5�S, 160�E to 150�W; black line, inner right black axis).
L24605 GORDON ET AL.: MAKASSAR STRAIT THROUGHFLOW L24605
3 of 5
2003], though in 2004 a series of surface flow reversals occurthroughout the year.
4. Along-Channel Transport and Transport-Weighted Temperature
[13] The Makassar Strait transport (Figure 3 and Table 2)is derived by multiplying the average velocity profile ofMAK-west and MAK-east and the depth-dependent cross-section area of Labani channel. Above 800 m, an averagevelocity of MAK-west and MAK-east is used, and below800 m, only MAK-west velocity is used. The LabaniChannel cross section area is divided into 10 m depth bins.The velocity profile of MAK-west and MAK-east is griddedinto 10 m depths and 2 hour intervals, then combined toproduce an average velocity. While mathematically south-ward transport is denoted as a negative value (Figure 3),below we discuss the Makassar transport without sign.[14] Susanto and Gordon [2005] determined the calendar
1997 transport from the Arlindo data using two methods ofextrapolation to the Labani side-walls. A transport of 9.1 Svis calculated based on linear interpolation of the observedalong channel zonal shear dv/dx, to the side-walls (this isequivalent to the method used by Gordon et al. [1999],which yielded similar transport, 9.2 Sv); a lower transport of6.8 Sv assumes a linear drop-off to zero flow at the side-walls from each mooring. The average of the two methodsis 7.9 ± 1.2 Sv. The INSTANT Makassar transport estimateis determined by extending the average MAK-west andMAK-east along-axis speeds within 10 m bins to the side-walls. This is effectively the same as used by Gordon et al.[1999] and for the larger transport estimate of Susanto andGordon [2005] for the Arlindo data, of 9.2 Sv.[15] The Makassar Strait transport record length average
is 11.6 Sv with a standard deviation of 3.0 Sv (Table 2). Themost striking feature is the consistency in the average annualvalues: 11.2, 11.7 and 11.8 Sv, for 2004, 2005 and 2006,respectively. The INSTANT three year Makassar transport isabout 27% (2.5 Sv) larger than the Arlindo 1997 transport.That 1997 was dominated by a strong El Nino, whereas theENSO average for the three year INSTANT period was in arelative neutral state, with a La Nina period in late 2005 intoearly 2006 (Figure 3; the nino4 remained near +0.5 during theINSTANT period), provides a sense of the ENSO influenceon the ITF. This dramatic increase in the transfer of Pacificwater into the Indian Ocean is expected to have major impacton the mass and thermohaline budgets of the Indian Ocean (atopic to be explored in future studies).[16] The INSTANT Makassar transport displays consid-
erable seasonal fluctuations (Figure 3 and Table 2). The
minimum transport occurs in the monsoon transition monthsof April to June (AMJ; 11.7 Sv) and October to December(OND; 8.8 Sv), the latter representing the absolute seasonalminimum, signifying the presence of an annual signal. Themaximum transport occurs towards the end of each mon-soon, reaching 13.1 Sv in the northwest monsoon and 12.6 Svin the southeast monsoon. The energy peak of the seasonalfluctuations is further brought out by the power spectrum(Figure 3, left). The spectrum representing the accumulatedenergy (Sv2/day) over the entire time series as a function offrequency is produced by Hilbert-Huang Transform, whichis appropriate for nonlinear and nonstationary time series[Huang and Wu, 2008] (previously applied to the 1997Makassar data by Susanto et al. [2000]). The seasonalfluctuations are also observed within the Mindanao Current,where they are induced by local Ekman pumping combinedwith westward propagation of Rossby waves originatingin the central tropical Pacific [Qu et al., 2008]. As theMindanao Current is the primary source of the Makassarthroughflow, a Pacific origin of the Makassar seasonality issuggested.[17] The Makassar Strait transport time series (Figure 3)
attains maximum values of �16 Sv in February-March 2005and 2006, and in August 2005, with secondary maximumsof �14 Sv in February and August 2004. From lateFebruary to September 2006 the transport exhibits a sus-tained high value of >14 Sv, except for a brief relaxationto 11 Sv in early April. The transport dips to 6-7 Sv inNovember-December 2004 and again in November 2005,with the absolute minimum of 4 Sv in November 2006.[18] The depth anomaly of the 30 day low pass 16�C
isotherm (180 m mean depth; Table 2) reveals strong intra-seasonal (<90 days) fluctuations that do not correlate withtransport, varying from +20 m (deeper than the mean) inearly 2006 during a 9-month extended period of sustaineddeepening, to –15 m (shallower than the mean) mostnotably at three times between August 2004 and April2005 (Figure 3). During the periods of sustained hightransport in early 2006 to September 2006, the 16�Cisotherm is deep, following the La Nina trend revealed bythe nino4 index. A ENSO correlation of the thermoclinedepth to transport was observed during the Arlindo timeseries [Ffield et al., 2000].[19] The 3-year transport-weighted temperature (TWT) is
15.6� ± 3.7�C (Table 2), increasing in each of the three yearsfrom 14.4�C to 16.7�C from 2004 to 2006. Vranes et al.[2002] find a TWT of 14.7�C for the Arlindo record length.The TWT is a function of the vertical distribution of along-axis speed and the depth of the 16�C isotherm. The seasonof coolest TWT occurs in the October-December months,
Table 2. Makassar Strait Transport, Transport Weighted-Temperature and Depth of the 16�C Isotherm by Season and Year During the
INSTANT Observational Perioda
Seasonal JFM AMJ JAS OND
Transport �13.1 ± 2.8 Sv �11.7 ± 3.1 Sv �12.6 ± 2.5 Sv �8.8 ± 3.0 SvTransport-Weighted Temperature 16.6� ± 3.7�C 16.0� ± 3.9�C 16.9� ± 2.6�C 12.7� ± 3.0�C16�C Isotherm Depth 181 ± 10 m 182 ± 11 m 180 ± 10 m 178 ± 8 mAnnual 2004 2005 2006 3�YearTransport �11.2 ± 3.0 Sv �11.7 ± 3.2 Sv �11.8 ± 3.7 Sv �11.6 ± 3.3 SvTransport-Weighted Temperature 14.4� ± 3.6�C 15.6� ± 3.6�C 16.7� ± 3.7�C 15.6� ± 3.7�C16�C Isotherm Depth 177 ± 9 m 179 ± 9 m 185 ± 10 m 180 ± 10 m
aNorthwest Monsoon is JFM, January-March; AMJ, April-June. Southeast Monsoon is JAS, July-September; OND, October-December. Sv = 106 m3/s.
L24605 GORDON ET AL.: MAKASSAR STRAIT THROUGHFLOW L24605
4 of 5
the time of minimum speeds. The year of warmest TWT(16.7�C) is in 2006, corresponding to the combined effect ofthe averaged highest transports and deepest thermocline.[20] Although there are energetic intraseasonal fluctua-
tions of transport and thermocline depth, at lower frequencyboth exhibit a response to the phase of ENSO, with atendency of greater transport and deeper thermocline asthe El Nino condition [+nino4] is weak or absent. This isbest seen in early 2006 after the La Nina [-nino4] peak ofFebruary 2006. The maximum correlation coefficient of the30-day low pass transport to 30-day low pass nino4 is 0.42(weaker Makassar throughflow scales to positive nino4)with a one-week lag of transport relative to nino4. Themaximum correlation of the 16�C isotherm depth to nino4 is�0.70 with a five-week lag.
5. Conclusions
[21] From January 2004 through November 2006 theMakassar Strait throughflow was measured at two mooringsas part of the INSTANT program. Makassar Strait is themain conduit for the inflow of Pacific water into theIndonesian seas, carrying �80% or more of the Indonesianthroughflow. The INSTANT Makassar moorings wereplaced at the same sites as the December 1996 throughJune 1998 Arlindo moorings, thus allowing for comparisonof these two time periods.[22] The INSTANT time series displays similar vertical
profiles of along channel speed as the Arlindo time series,with a distinct velocity maximum, about 50% greater thanthe surface layer flow, within the thermocline. The thermo-cline speed maximum tends to shallow as its speedincreases. The more extended INSTANT observationalperiod reveals seasonality to the along-axis speed profile,which during the Arlindo period may have been masked bya strong El Nino. The thermocline along-axis speeds ob-served during INSTANT are highest in the southeast mon-soon, though the along-axis speed below 220 m is higherduring the northwest monsoon. During the northwest mon-soon while the transport is reduced, a larger percentage isdrawn from the cooler subthermocline stratum.[23] The strong and sustained southward along-axis
speeds in 2006 stand out as an anomaly, lacking theslackening in May/June 2006 as observed in those monthsfor the two prior years. The period of sustained throughflowbegins rather abruptly in early February 2006 spanning awide swath of depth.[24] The mean Makassar Strait transport during the
INSTANT period is 11.6 Sv, about 27% greater than the9.2 Sv transport found during the Arlindo period using com-parable methods of side-wall extrapolation. The INSTANTperiod was not dominated by a strong ENSO condition as wasthe Arlindo period, which occurred during a strong El Ninofrom April 1997 to May 1998, which is expected to suppressthe ITF. Indeed the INSTANT transport maximum occurredin early 2006, at a week lag to the peak of a La Nina episode,during which time the depth anomaly of the 16�C isothermwas 20 m deeper than the mean. A similar correlation ofthe thermocline to transport for greater than intraseasonaltime scales was observed during the Arlindo time series. TheINSTANT Makassar transport reveals seasonal signal withtheminimum transport during themonsoon transitionmonths
of April to June and October to December, the latter havingthe absolute seasonal minimum.[25] The INSTANT Makassar time series offers an in-
triguing view of the major inflow pathway of the ITF during2004-06 and of its contrast to an earlier El Nino dominatedcondition. We offer this concise descriptive account of theMakassar Strait throughflow to prompt comparison with otherdata sets and with model output. Amore detailed investigationof the INSTANT Makassar time series spatial/temporal fea-tures, as well as its comparison to the other passages measuredby the INSTANT program is planned.
[26] Acknowledgments. The INSTANT data analysis is funded byNational Science Foundation grants OCE-07-25935 (LDEO) and OCE-07-25561 (ESR). The professionalism and support of the R/V Baruna Jayaofficers and crew to a large measure led to the success of INSTANT. Wethank the capable CSIRO mooring team: D. McLaughlan, K. Miller,L. Pender and P. Adam. The support of Indroyono Soesilo of the Agency forMarine and Fisheries Research (BRKP) for the INSTANT program isappreciated. Lamont-Doherty Earth Observatory contribution 7221.
ReferencesEngland, M., and F. Huang (2005), On the interannual variability of theIndonesian throughflow and its linkagewith ENSO, J. Clim., 18, 1435–1444.
Ffield, A., and A. L. Gordon (1996), Tidal mixing signatures in the Indo-nesian seas, J. Phys. Oceanogr., 26(9), 1924–1937.
Ffield, A., K. Vranes, A. L. Gordon, R. D. Susanto, and S. L. Garzoli(2000), Temperature variability within Makassar Strait, Geophys. Res.Lett., 27, 237–240.
Gordon, A. L. (2005), Oceanography of the Indonesian seas and theirthroughflow, Oceanography, 18(4), 14–27.
Gordon, A. L., R. D. Susanto, and A. Ffield (1999), Throughflow withinMakassar Strait, Geophys. Res. Lett., 26, 3325–3328.
Gordon, A. L., R. D. Susanto, and K. Vranes (2003), Cool Indonesianthroughflow as a consequence of restricted surface layer flow, Nature,425, 824–828.
Huang, N. E., and Z. Wu (2008), A review on Hilbert-Huang transform:Method and its applications to geophysical studies, Rev. Geophys., 46,RG2006, doi:10.1029/2007RG000228.
Meyers, G. (1996), Variation of Indonesian throughflow and the El Nino–Southern Oscillation, J. Geophys. Res., 101, 12,255–12,263.
Qu, T., J. Gan, A. Ishida, Y. Kashino, and T. Tozuka (2008), Semiannualvariation in the western tropical Pacific Ocean, Geophys. Res. Lett., 35,L16602, doi:10.1029/2008GL035058.
Shriver, J. F., H. E. Hurlburt, O. M. Smedstad, A. J. Wallcraft, and R. C.Rhodes (2007), 1/32� real-time global ocean prediction and value-addedover 1/16� resolution, J. Mar. Syst., 65, 3–26.
Smith, W., and D. Sandwell (1997), Global sea floor topography fromsatellite altimetry and ship depth soundings, Science, 277(5334),1956–1962.
Sprintall, J., A. L. Gordon, R. Murtugudde, and R. D. Susanto (2000), Asemiannual Indian Ocean forced Kelvin wave observed in the Indonesianseas in May 1997, J. Geophys. Res., 105, 17,217–17,230.
Sprintall, J., S. Wijffels, A. L. Gordon, A. Ffield, R. Molcard, R. D. Susanto,I. Soesilo, J. Sopaheluwakan, Y. Surachman, and H. M. van Aken (2004),INSTANT: A new international array to measure the Indonesian through-flow, Eos Trans. AGU, 85(39), 369, doi:10.1029/2004EO390002.
Susanto, R. D., and A. L. Gordon (2005), Velocity and transport of theMakassar Strait throughflow, J. Geophys. Res., 110, C01005,doi:10.1029/2004JC002425.
Susanto, R. D., A. L. Gordon, J. Sprintall, and B. Herunadi (2000), Intra-seasonal variability and tides in Makassar Strait, Geophys. Res. Lett., 27,1499–1502.
Vranes, K., A. L. Gordon, and A. Ffield (2002), The heat transport of theIndonesian throughflow and implications for the Indian Ocean heat bud-get, Deep Sea Res., Part II, 49, 1391–1410.
�����������������������A. Ffield, Earth and Space Research, 290 Clausland Mountain Road,
Upper Grandview, NY 10960, USA.A. L. Gordon, B. A. Huber, and R. D. Susanto, Lamont-Doherty Earth
Observatory, Earth Institute at Columbia University, Palisades, NY 10964,USA. ([email protected])W. Pranowo and S. Wirasantosa, Agency for Marine and Fisheries
Research, Jakarta 12770, Indonesia.
L24605 GORDON ET AL.: MAKASSAR STRAIT THROUGHFLOW L24605
5 of 5


![ITF monitoring in a changing global climate Dongchull Jeon · 2 Warm Pool ... Halmahera] marks the feed of tropical Pacific Water into Makassar Strait ... ITF_monitoring in a changing](https://img.pdfslide.us/doc/110x75/5b5c9cb77f8b9a9c398c7dff/itf-monitoring-in-a-changing-global-climate-dongchull-2-warm-pool-halmahera.jpg)