Embed Size (px)
Citation preview
Richard J. DeKaser andJane Sneddon Little
Senior Economists, Bank of Boston,and Federal Reserve Bank of Boston,respectively. The authors would like tothank colleagues at the Federal ReserveBank of Boston for helpful co~nments.In addition, they are most grateful toRachel Deyette and Paula Fitzgibbonfor valuable research assistance. ¯
T he recession of the early 1990s hit New England much harderthan the nation. Over the period covered by this study (1987 to1993), New England’s manufacturing employment fell 22 per-
cent, as compared with a 5 percent decline for the nation; over the sameperiod, total nonfarm jobs grew 8 percent nationally but fell 5 percent inthe region. Although New England’s manufacturing employment hasstabilized recently, and the total number of nonfarm jobs has been risingfor two years, both series remain well below their previous peaks.Presumably, thus, New England firms are highly motivated to seekrapidly growing markets wherever they may be---~cluding overseas.
Exports have provided considerable support to the national econ-omy in recent years. During the 1990-91 downturn, real net exports cutthe depth of the U.S. recession by half. Looking ahead, moreover,recent forecasts by the International Monetary Fund suggest that worldgrowth will outpace U.S. growth in 1995. U.S. GDP is projected to risean inflation-adjusted 2.5 percent next year while, with the help of thedynamic developing countries, world growth is estimated to be 3.6percent. Global trade is expected to grow even faster, at a 7 percent pace.
Despite New Englanders’ obvious incentive to explore burgeoningforeign markets, however, the best available data indicate that theregion underperformed the nation in terms of export growth from 1987to 1993. How so? Indeed, the result seems surprising given the region’strading history and its traditional comparative advantage vis-a-vis thenation in the high-tech industries that dominate U.S. exports. Thisarticle explores the reasons for the region’s below-average merchandiseexport growth and concludes that it largely reflects the relative impor-tance of the regional computer industry and its recent structural prob-lems. Also contributing are New England exporters’ traditional ties tomarkets in mature industrial countries. As the authors point out,however, merchandise exports represent only one route to foreignconsumers. New Englanders are also reaching vibrant foreign markets
through exports of services and through sales madeby foreign affiliates of New England firms. Indeed,given the region’s hldustrial structure, these alterna-tive paths are likely to become increasingly importantover time.
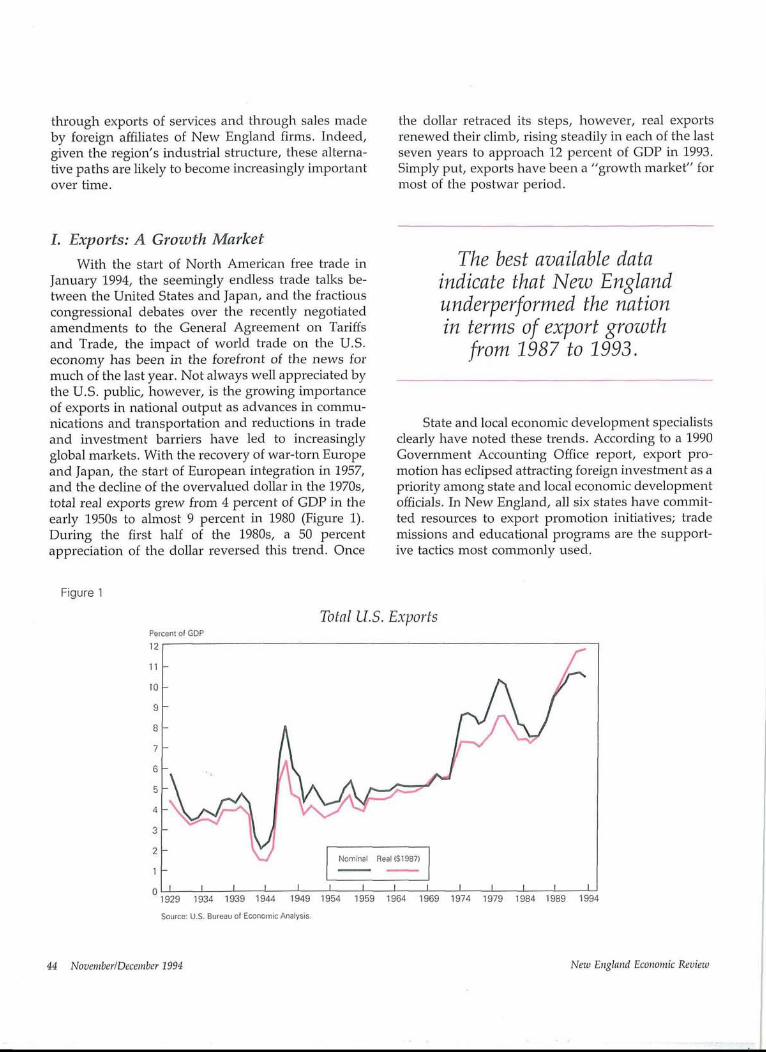
the dollar retraced its steps, however, real exportsrenewed their climb, rising steadily in each of the lastseven years to approach 12 percent of GDP in 1993.Simply put, exports have been a "growth market" formost of the postwar period.
L Exports: A Growth Market
With the start of North American free trade inJanuary 1994, the seemingly endless trade talks be-tween the United States and Japan, and the fractiouscongressional debates over the recently negotiatedamendments to the General Agreement on Tariffsand Trade, the impact of world trade on the U.S.economy has been in the forefront of the news formuch of the last year. Not always well appreciated bythe U.S. public, however, is the growing importanceof exports in national output as advances in commu-nications and transportation and reductions in tradeand investment barriers have led to increasinglyglobal markets. With the recovery of war-torn Europeand Japan, the start of European integration in 1957,and the decline of the overvalued dollar in the 1970s,total real exports grew from 4 percent of GDP in theearly 1950s to almost 9 percent in 1980 (Figure 1).During the first half of the 1980s, a 50 percentappreciation of the dollar reversed this trend. Once
The best available dataindicate that New Englandunderperformed the nationin terms of export growth
from 1987 to 1993.
State and local economic development specialistsclearly have noted these trends. According to a 1990Government Accounting Office report, export pro-motion has eclipsed attracting foreign investment as apriority among state and local economic developmentofficials. In New England, all six states have commit-ted resources to export promotion initiatives; trademissions and educational programs are the support-ive tactics most commonly used.
Figure 1
Percent of GDP12
11
10
9
8
7
6
5
4
3
1
0
Total U.S. Exports
1929 1934 t939
; Nominal Real (S1987)
1944 1949 1954 1959 1964 1969 1974 1979
Source: U.S. Bu~-eau of Economic Analysis.
1984I
19891
1994
44 NovemberlDecember 1994 Nezo England Economic Review
Given the growing importanceof exports nationally, as well as re-gional efforts to promote trade, therest of this article explores why exportsappear to have played a less dynamicrole in the New England economy inrecent years than they have for thecountry as a whole. The next two sec-tions address some basic questionsabout New England’s exports~whatthey are and where they go.
H. What Are New England’sExports?
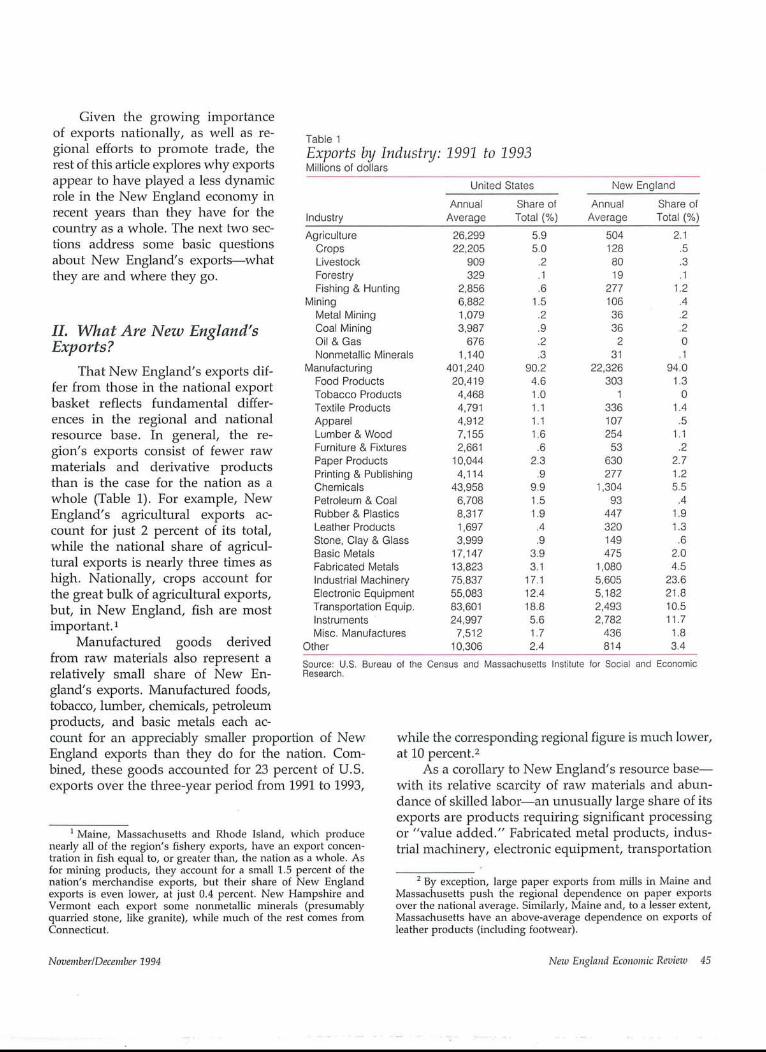
That New England’s exports dif-fer from those in the national exportbasket reflects fundamental differ-ences in the regional and nationalresource base. In general, the re-gion’s exports consist of fewer rawmaterials and derivative productsthan is the case for the nation as awhole (Table 1). For example, NewEngland’s agricultural exports ac-count for just 2 percent of its total,while the national share of agricul-tural exports is nearly three times ashigh. Nationally, crops account forthe great bulk of agricultural exports,but, in New England, fish are mostimportant. ~
Manufactured goods derivedfrom raw materials also represent arelatively small share of New En-gland’s exports. Manufactured foods,tobacco, lumber, chemicals, petroleumproducts, and basic metals each ac-count for an appreciably smaller proportion of NewEngland exports than they do for the nation. Com-bined, these goods accounted for 23 percent of U.S.exports over the three-year period from 1991 to 1993,
i Maine, Massachusetts and Rhode Island, which producenearly all of the region’s fishery exports, have an export concen-tration in fish equal to, or greater than, the nation as a whole. Asfor mining products, they account for a small 1.5 percent of thenation’s merchandise exports, but their share of New Englandexports is even lower, at just 0.4 percent. New Hampsl-fire andVermont each export some nonmetallic minerals (presumablyquarried stone, like granite), while much of the rest comes fromConnecticut.
Table 1Exports by Industry: 1991 to 1993Millions of dollars
United States New EnglandAnnual Share of Annual Share of
Industry Average Total (%) Average Total (%)Agriculture 26,299 5.9 504 2.1
Crops 22,205 5.0 128 .5Livestock 909 .2 80 .3Forestry 329 .1 19 .1Fishing & Hunting 2,856 .6 277 1.2
Mining 6,882 1.5 106 .4Metal Mining 1,079 .2 36 .2Coal Mining 3,987 .9 36 .2Oil & Gas 676 .2 2 0Nonmetallic Minerals I, 140 .3 31 .1
Manufacturing 401,240 90.2 22,326 94.0Food Products 20,419 4.6 303 1.3Tobacco Products 4,468 1.0 1 0Textile Products 4,791 1.1 336 1.4Apparel 4,912 1.1 107 .5Lumber & Wood 7,155 1.6 254 1.1Furniture & Fixtures 2,661 .6 53 .2Paper Products 10,044 2.3 630 2.7Printing & Publishing 4,114 .9 277 1.2Chemicals 43,958 9.9 1,304 5.5Petroleum & Coal 6,708 1.5 93 .4Rubber & Plastics 8,317 1.9 447 1.9Leather Products 1,697 .4 320 1.3Stone, Clay & Glass 3,999 .9 149 .6Basic Metals 17,147 3.9 475 2.0Fabricated Metals 13,823 3.1 1,080 4.5Industrial Machinery 75,837 17.1 5,605 23.6Electronic Equipment 55,083 12.4 5,182 21.8Transportation Equip. 83,601 18.8 2,493 10.5Instruments 24,997 5.6 2,782 11.7Misc. Manufactures 7,512 1.7 436 1.8
Other 10,306 2.4 814 3.4Source: U.S. Bureau of the Census and MassachusettsResearch.
Institute for Social and Economic
while the correspondh~g regional figure is much lower,at 10 percent.2
As a corollary to New England’s resource base--with its relative scarcity of raw materials and abun-dance of skilled labor--an unusually large share of itsexports are products requiring significant processingor "value added." Fabricated metal products, indus-trial machinery, electronic equipment, transportation
2 By exception, large paper exports from mills in Maine andMassachusetts push the regional dependence on paper exportsover the national average. Similarly, Maine and, to a lesser extent,Massachusetts have an above-average dependence on exports ofleather products (induding footwear).
November/December 1994 New England Economic Review 45
equipment, and instruments account for 57 percent ofnational exports, while the corresponding figure forNew England is 72 percent. Among these sectors,transportation equipment is the only one that loomsmore important in national than regional exports.
Exports have been a growthmarket for most of the
postwar period.
Still, because Connecticut is a major producer of jetengines and other aviation equipment, transportationaccounts for nearly one-third of Connecticut’s ex-ports--a figure well above the national average of19 percent.
III. Where Do New England’s Exports Go?New England’s exports also differ from the na-
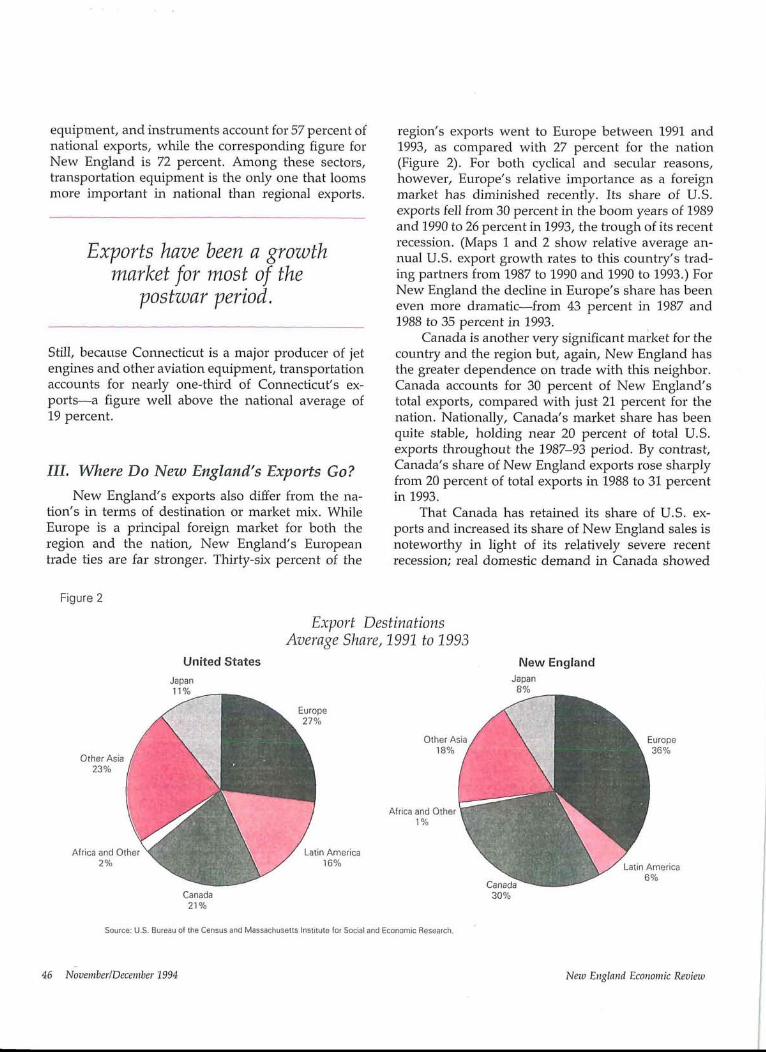
tion’s in terms of destination or market mix. WhileEurope is a principal foreign market for both theregion and the nation, New England’s Europeantrade ties are far stronger. Thirty-six percent of the
region’s exports went to Europe between 1991 and1993, as compared with 27 percent for the nation(Figure 2). For both cyclical and secular reasons,however, Europe’s relative importance as a foreignmarket has diminished recently. Its share of UoS.exports fell from 30 percent in the boom years of 1989and 1990 to 26 percent in 1993, the trough of its recentrecession. (Maps 1 and 2 show relative average an-nual U.S. export growth rates to this country’s trad-ing partners from 1987 to 1990 and 1990 to 1993.) ForNew England the decline in Europe’s share has beeneven more dramatic from 43 percent in 1987 and1988 to 35 percent in 1993.
Canada is another very significant market for thecountry and the region but, again, New England hasthe greater dependence on trade with this neighbor.Canada accounts for 30 percent of New England’stotal exports, compared with just 21 percent for thenation. Nationally, Canada’s market share has beenquite stable, holding near 20 percent of total U.S.exports throughout the 1987-93 period. By contrast,Canada’s share of New England exports rose sharplyfrom 20 percent of total exports in 1988 to 31 percentin 1993.
That Canada has retained its share of U.S. ex-ports and increased its share of New England sales isnoteworthy in light of its relatively severe recentrecession; real domestic demand in Canada showed
Figure 2
Other Asia23%
United StatesJapan
11Olo
Export DestinationsAverage Share, 1991 to 1993
Europe27%
Other Asia18%
New EnglandJapan
8%
Europe36%
Africa and Other1%
Africa and Other2% 16%
Canada21%
Source: U.S. Bureau of the Census and Massachusetts institute for Social and Economic Research,
3O%
Latin America6%
46 November/December 1994 New England Economic Review
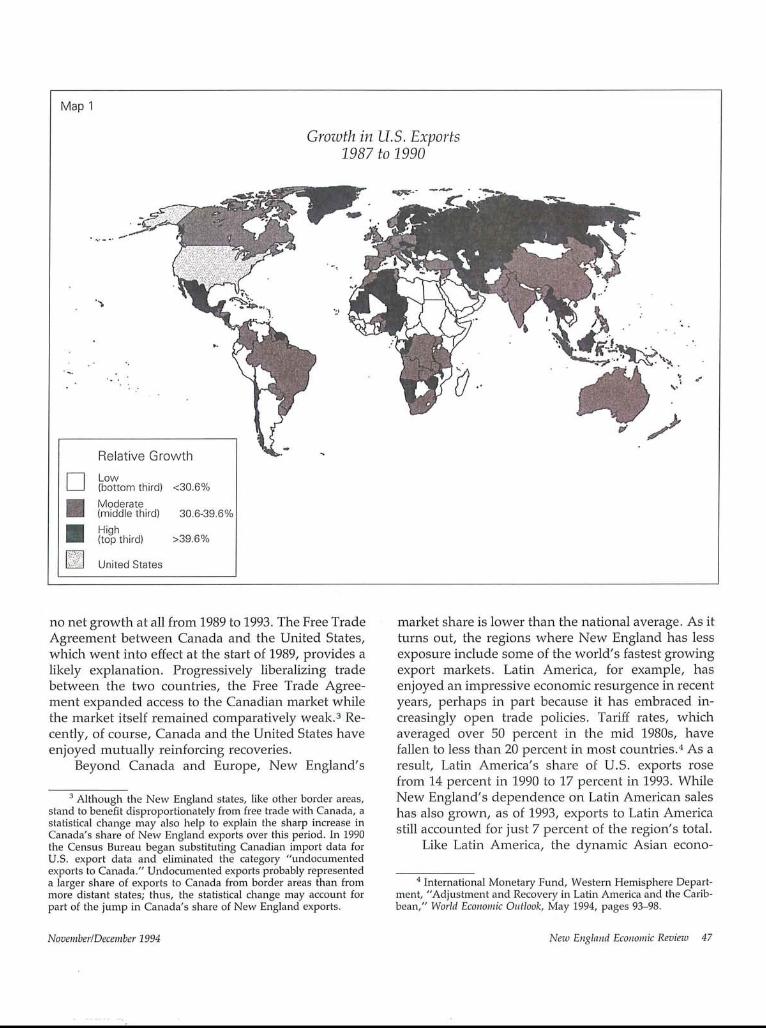
Map 1
Grozoth in U.S. Exports1987 to 1990
Relative GrowthLow(bottom third) <30.6%Moderate(middle third) 30.6-39.6%High(top third) >39.6%
United States
no net growth at all from 1989 to 1993. The Free TradeAgreement between Canada and the United States,which went into effect at the start of 1989, provides alikely explanation. Progressively liberalizing tradebetween the two countries, the Free Trade Agree-ment expanded access to the Canadian market whilethe market itself remained comparatively weak.3 Re-cently, of course, Canada and the United States haveenjoyed mutually reinforcing recoveries.
Beyond Canada and Europe, New England’s
3 Although the New England states, like other border areas,stand to benefit disproportionately from free trade with Canada, astatistical change may also help to explain the sharp increase inCanada’s share of New England exports over this period. In 1990the Census Bureau began substituting Canadian import data forU.S. export data and eliminated the category "undocumentedexports to Canada." Undocumented exports probably representeda larger share of exports to Canada from border areas than frommore distant states; thus, the statistical change may account forpart of the jump in Canada’s share of New England exports.
market share is lower than the national average. As itturns out, the regions where New England has lessexposure include some of the world’s fastest growingexport markets. Latin America, for example, hasenjoyed an impressive economic resurgence in recentyears, perhaps in part because it has embraced in-creasingly open trade policies. Tariff rates, whichaveraged over 50 percent in the mid 1980s, havefallen to less than 20 percent in most countries.4 As aresult, Latin America’s share of U.S. exports rosefrom 14 percent in 1990 to 17 percent in 1993. WhileNew England’s dependence on Latin American saleshas also grown, as of 1993, exports to Latin Americastill accounted for just 7 percent of the region’s total.
Like Latin America, the dynamic Asian econo-
4 International Monetary Fund, Western Hemisphere Depart-ment, "Adjustment and Recovery in Latin America and the Carib-bean," World Economic Outlook, May 1994, pages 93-98.
November/December 1994 New England Economic Review 47
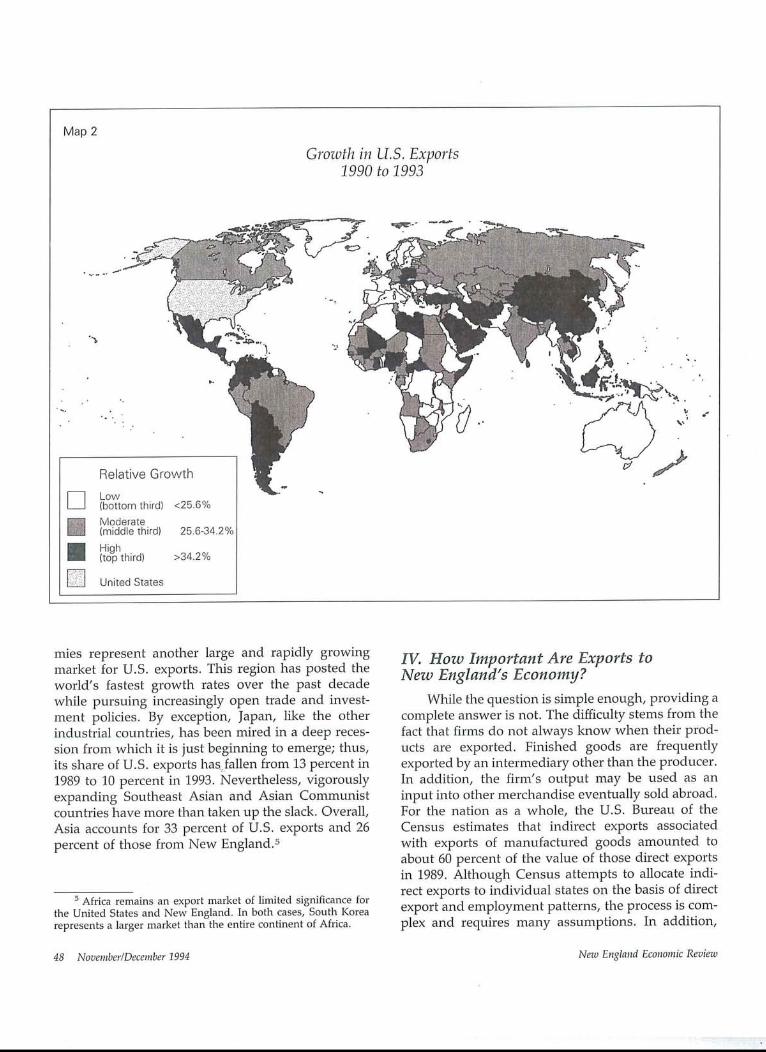
Map 2
Grozoth in U.S. Exports1990 to 1993
Relative Growth
r~ Low(bottom third) <25.6%
i Moderate(middle third) 25.6-34.2%High(top third) >34.2%
[] United States
mies represent another large and rapidly growingmarket for U.S. exports. This region has posted theworld’s fastest growth rates over the past decadewhile pursuing increasingly open trade and invest-ment policies. By exception, Japan, like the otherindustrial countries, has been mired in a deep reces-sion from which it is just beginning to emerge; thus,its share of U.S. exports has, fallen from 13 percent in1989 to 10 percent in 1993. Nevertheless, vigorouslyexpanding Southeast Asian and Asian Communistcountries have more than taken up the slack. Overall,Asia accounts for 33 percent of U.S. exports and 26percent of those from New England.5
s Africa remains an export market of limited significance forthe United States and New England. In both cases, South Korearepresents a larger market than the entire continent of Africa.
IV. How Important Are Exports toNew England’s Economy?
While the question is simple enough, providing acomplete answer is not. The difficulty stems from thefact that firms do not always know when their prod-ucts are exported. Finished goods are frequentlyexported by an intermediary other than the producer.In addition, the firm’s output may be used as aninput into other merchandise eventually sold abroad.For the nation as a whole, the U.S. Bureau of theCensus estimates that indirect exports associatedwith exports of manufactured goods amounted toabout 60 percent of the value of those direct exportsin 1989. Although Census attempts to allocate indi-rect exports to individual states on the basis of directexport and employment patterns, the process is com-plex and requires many assumptions. In addition,
48 November/December 1994 New England Economic Review
these data on direct and indirect exports provide noinformation on destination and are available onlywith a three- or four-year lag.
Accordingly, this article uses another data set,the origin-of-movement data for direct merchandiseexports. Although these data are relatively timely andinclude information on destination, they also havelimitations. (See Box for further discussion of theselimitations.) Nevertheless, using the origin-of-move-ment data as the best available indicator of recent
Given the predominance ofmanufacturing in national and
regional exports and the decline inNew England’s manufacturingemployment, it is remarkable
that New England has retainedas large a share of U.S.export activity as it has.
state export activity suggests that direct exports ac-count for a slightly smaller share of total New En-gland output than they do nationally, although theshares have trended up in both cases (Table 2).Following the sharp dollar depreciation of 1985, U.S.exports increased from 5.4 percent of GDP in 1987 to7.4 percent in recessionary 1991. In New England,similarly, exports rose from 5.2 percent of net outputin 1987 to 6.9 percent in 1991. During 1993, when theUnited States was growing faster than most of itsmajor trading partners, U.S. and New England ex-ports fell back to 7.3 and 6.7 percent of output,respectively. 6
While most New England states fit the regionalpattern, Massachusetts and Vermont are exceptions.In these states, exports account for a greater shareof net output than is the case nationally, as Table 2shows. In Vermont, the export share was a well-above-average 22 percent of output in 1993. Thatstate’s unusual export-dependence is largely attribut-able to exports of electronic equipment to Canada.The IBM Corporation manufactures semiconductorsin its Vermont facility and ships these components toCanada to be built into other products. Though IBMdoes not release precise figures on the magnitude of
such shipments, it acknowledges that their value wellexceeds $1 billion annually.7 This cross-border activ-ity underscores the importance of North Americanintegration and, indeed, U.S. producers’ ties to theirforeign affiliates generally, in determining the natureand behavior of regional exports.
Table 3 provides data to illustrate these relation-ships. As column 1 shows, over one-third of U.S.exports to Canada and over one-fourth of U.S. ex-ports to Mexico are shipments from U.S parents totheir foreign affiliates. In both cases, over half ofthese intra-firm exports reflect the ongoing integra-tion of North American auto production. In Mexico,another quarter of the affiliate trade involves electricaland electronics products. In combination with thefigures in column 4, which show foreign affiliate salesto the United States as a share of total foreign affiliatesales, these data suggest that the activities of affiliatesin Canada, Mexico, and some Southeast Asian coun-tries, like Singapore and Malaysia, are often closelylinked with U.S. production for U.S. markets; thus,U.S. exports to these countries reflect the strengthof the U.S. economy as well as demand conditionsoverseas. By contrast, affiliates of U.S. companies inEurope, South America, and Japan are generallyserving local or other foreign markets.
Given the predominance of manufacturing innational and regional exports and the relatively pre-cipitous decline in New England’s manufacturingemployment (down 25 percent in the region between1987 and 1993, compared with a 5 percent declinenationally), it is remarkable that New England hasretained as large a share of U.S. export activity as it
6 An alternative measure of New England’s export depen-dence--export-related employment as a share of total privateemployment--suggests that exports provide above-average sup-port for regional jobs. These figures, based on Census estimates ofemployment related to direct and indirect exports of manufacturedproducts for 1989, show that 6.6 percent of New England’s privateemployment was supported by manufactured exports, comparedwith 5.6 percent for the nation. According to these numbers, NewEngland was one of the most export-dependent regions in thecountry, following closely behind the Pacific and the East NorthCentral regions. These Census data also indicate that New En-gland’s export-related shipments as a share of total shipmentswere above the national average in a majority of the 2-digitindustries for which regional data are available. A significantexception, given the industry’s importance in U.S. and NewEngland exports, was one 3-digit component, computers and officemachinery.
7 The dramatic rise in Vermont’s exports over this periodpartly reflects the substitution of Canadian import records for U.S.export records and, thus, the elimination of "undocumentedexports to Canada" in 1990. This change makes origin-of-move-ment export figures for 1987-89 not entirely comparable with thosefor the later years~particularly for states bordering Canada.
November/December 1994 New England Economic Review 49
Limitations of Origin-of-Movement State Export Data
These origin-of-movement data on state exportsare collected by the U.S. Bureau of the Censusfrom shippers’ export declarations, which ask forthe "point of origin"--that is, the state where theproduct started its export journey. The instruc-tions indicate that shippers may choose among thestate where the product was produced or thelocation of a distributor, regional warehouse, cargoprocessing facility, or Foreign Trade Zone. For amulti-product shipment, the shipper may choosethe state of origin of the product having thegreatest value or, for a multi-product order, thestate of consolidation. According to Census-ITAresearch, manufacturers, who export about two-thirds of U.S. manufactured exports directly, pro-vide the state of production about 85 percent of thetime; for the rest of their exports, they tend to givethe location of the port through which the exportleft the country. Intermediaries, who handle theremaining one-third of U.S. manufactured exportsand most exports of nonmanufactured merchan-dise, tend to give their own location or the locationof the relevant port. As a result, these data tend tooverstate exports from states like Texas, where alarge number of intermediaries supply Mexican"maquiladora" plants with inputs from around thecountry. Similarly, the data tend to overstate ex-ports from states with major por~s--Louisiana, forinstance, where a large volume of farm productsshipped down the Mississippi start their journeyoverseas. Adding to these reporting weaknesses,roughly 15 percent of the shippers do not answerthe state-of-origin question.
Partly as a result of these problems, in 1993
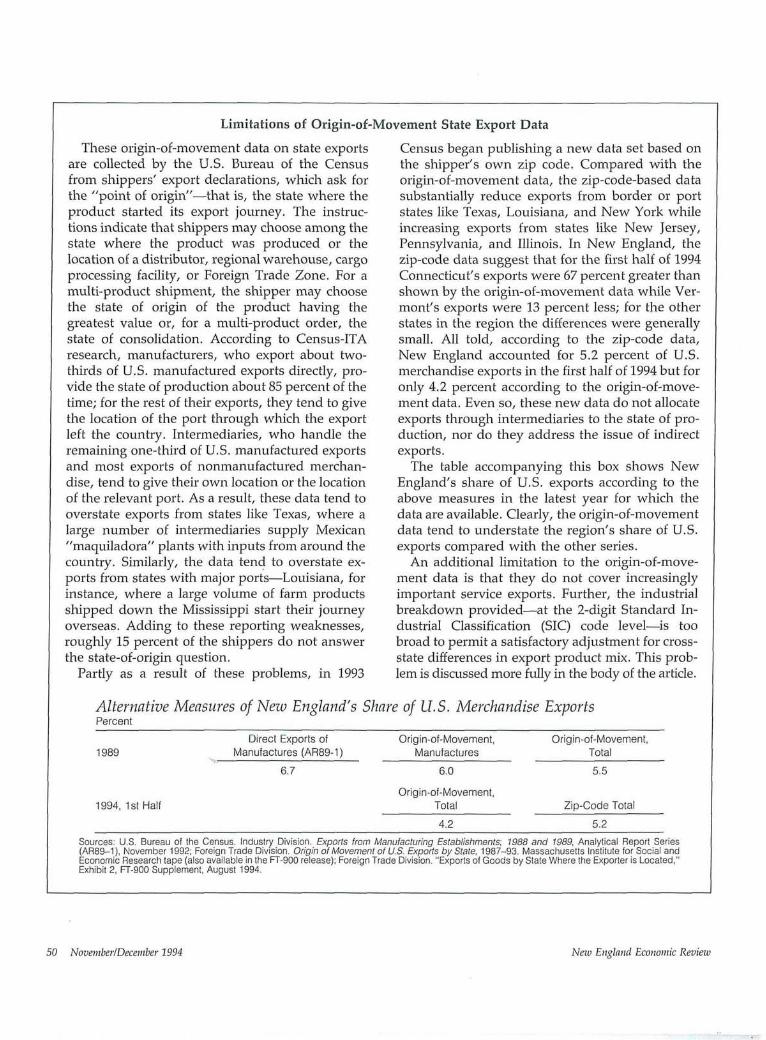
Census began publishing a new data set based onthe shipper’s own zip code. Compared with theorigin-of-movement data, the zip-code-based datasubstantially reduce exports from border or portstates like Texas, Louisiana, and New York whileincreasing exports from states like New Jersey,Pennsylvania, and Illinois. In New England, thezip-code data suggest that for the first half of 1994Connecticut’s exports were 67 percent greater thanshown by the origin-of-movement data while Ver-mont’s exports were 13 percent less; for the otherstates in the region the differences were generallysmall. All told, according to the zip-code data,New England accounted for 5.2 percent of U.S.merchandise exports in the first half of 1994 but foronly 4.2 percent according to the origin-of-move-ment data. Even so, these new data do not allocateexports through intermediaries to the state of pro-duction, nor do they address the issue of indirectexports.
The table accompanying this box shows NewEngland’s share of U.S. exports according to theabove measures in the latest year for which thedata are available. Clearly, the origin-of-movementdata tend to understate the region’s share of U.S.exports compared with the other series.
An additional limitation to the origin-of-move-ment data is that they do not cover increasinglyimportant service exports. Further, the industrialbreakdown provided--at the 2-digit Standard In-dustrial Classification (SIC) code level--is toobroad to permit a satisfactory adjustment for cross-state differences in export product mix. This prob-lem is discussed more fully in the body of the article.
Alternative Measures of New England’s Share of U.S. Merchandise ExportsPercent
Direct Exports of Origin-of-Movement, Origin-of-Movement,1989 Manufactures (AR89-1) Manufactures Total
6.7 6.0 5.5
Origin-of-Movement,1994, 1st Half Total Zip-Code Total
4.2 5.2Sources: U.S. Bureau of the Census. Industry Division. Exports from Manufacturing Establishments; 1988 and 1989, Analytical Report Series(AR89-1), November 1992; Foreign Trade Division. Origin of Movement of U.S. Exports by State, 1987-93. Massachusetts Institute for Social andEconomic Research tape (also available in the FT-900 release); Foreign Trade Division. "Exports of Goods by State Where the Exporter is Located,"Exhibit 2, FT-900 Supplement, August 1994.
50 November/December 1994 New England Economic Review
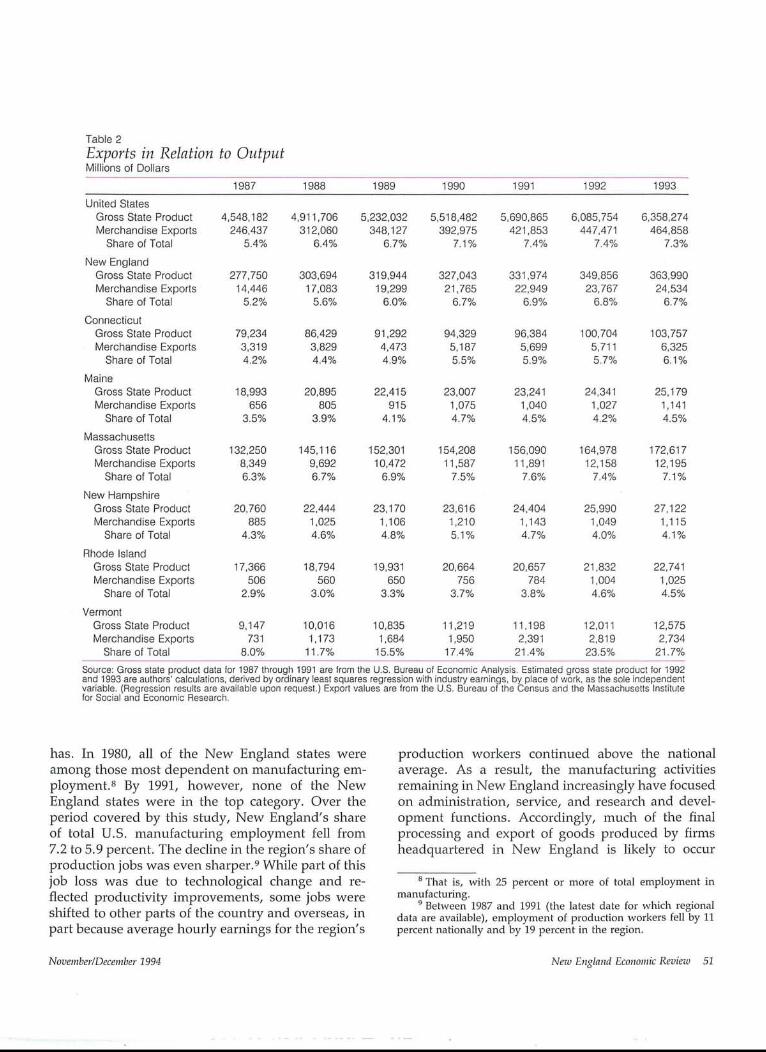
Table 2Exports in Relation to OutputMillions of Dollars
1987 1988 1989 1990 1991 1992 1993United States
Gross State Product 4,548,182 4,911,706 5,232,032 5,518,482 5,690,865 6,085,754 6,358,274Merchandise Exports 246,437 312,060 348,127 392,975 421,853 447,471 464,858
Share of Total 5.4% 6.4% 6.7% 7.1% 7.4% 7.4% 7.3%
New EnglandGross State Product 277,750 303,694 319,944 327,043 331,974 349,856 363,990Merchandise Exports 14,446 17,083 19,299 21,765 22,949 23,767 24,534
Share of Total 5.2% 5.6% 6.0% 6.7% 6.9% 6.8% 6.7%
ConnecticutGross State Product 79,234 86,429 91,292 94,329 96,384 100,704 103,757Merchandise Exports 3,319 3,829 4,473 5,187 5,699 5,711 6,325
Share of Total 4.2% 4.4% 4.9% 5.5% 5.9% 5.7% 6.1%
MaineGross State Product 18,993 20,895 22,415 23,007 23,241 24,341 25,179Merchandise Exports 656 805 915 1,075 1,040 1,027 1,141
Share of Total 3.5% 3.9% 4.1% 4.7% 4.5% 4.2% 4.5%Massachusetts
Gross State Product 132,250 145,116 152,301 154,208 156,090 164,978 172,617Merchandise Exports 8,349 9,692 10,472 11,587 11,891 12,158 12,195
Share of Total 6.3% 6.7% 6.9% 7.5% 7.6% 7.4% 7.1%
New HampshireGross State Product 20,760 22,444 23,170 23,616 24,404 25,990 27,122Merchandise Exports 885 1,025 1,106 1,210 1,143 1,049 1,115
Share of Total 4.3% 4.6% 4.8% 5.1% 4.7% 4.0% 4.1%
Rhode IslandGross State Product 17,366 18,794 19,931 20,664 20,657 21,832 22,741Merchandise Exports 506 560 650 756 784 1,004 1,025
Share of Total 2.9% 3.0% 3.3% 3.7% 3.8% 4.6% 4.5%
VermontGross State Product 9,147 10,016 10,835 11,219 11,198 12,011 12,575Merchandise Exports 731 1,173 1,684 1,950 2,391 2,819 2,734
Share of Total 8.0% 11.7% 15.5% I7.4% 21.4% 23.5% 21.7%Source: Gross state product data for 1987 through 1991 are from the U.S. Bureau of Economic Analysis. Estimated gross state product for 1992and 1993 are authors’ calculations, derived by ordinary least squares regression wilh industry earnings, by place of work, as the sole independentvariable. (Regression results are available upon request.) Export values are from the U.S. Bureau of the Census and the Massachusetts Institutefor Social and Economic Research.
has. In 1980, all of the New England states wereamong those most dependent on manufacturing em-ployment.8 By 1991, however, none of the NewEngland states were in the top category. Over theperiod covered by this study, New England’s shareof total U.S. manufacturing employment fell from7.2 to 5.9 percent. The decline in the region’s share ofproduction jobs was even sharper.9 While part of thisjob loss was due to technological change and re-flected productivity improvements, some jobs wereshifted to other parts of the country and overseas, inpart because average hourly earnings for the region’s
production workers continued above the nationalaverage. As a result, the manufacturing activitiesremaining in New England increasingly have focusedon administration, service, and research and devel-opment functions. Accordingly, much of the finalprocessing and export of goods produced by firmsheadquartered in New England is likely to occur
8 That is, with 25 percent or more of total employment inmanufacturing.
9 Between 1987 and 1991 (the latest date for which regionaldata are available), employment of production workers fell by 11percent nationally and by 19 percent in the region.
November/December 1994 Nezo England Economic Review 51
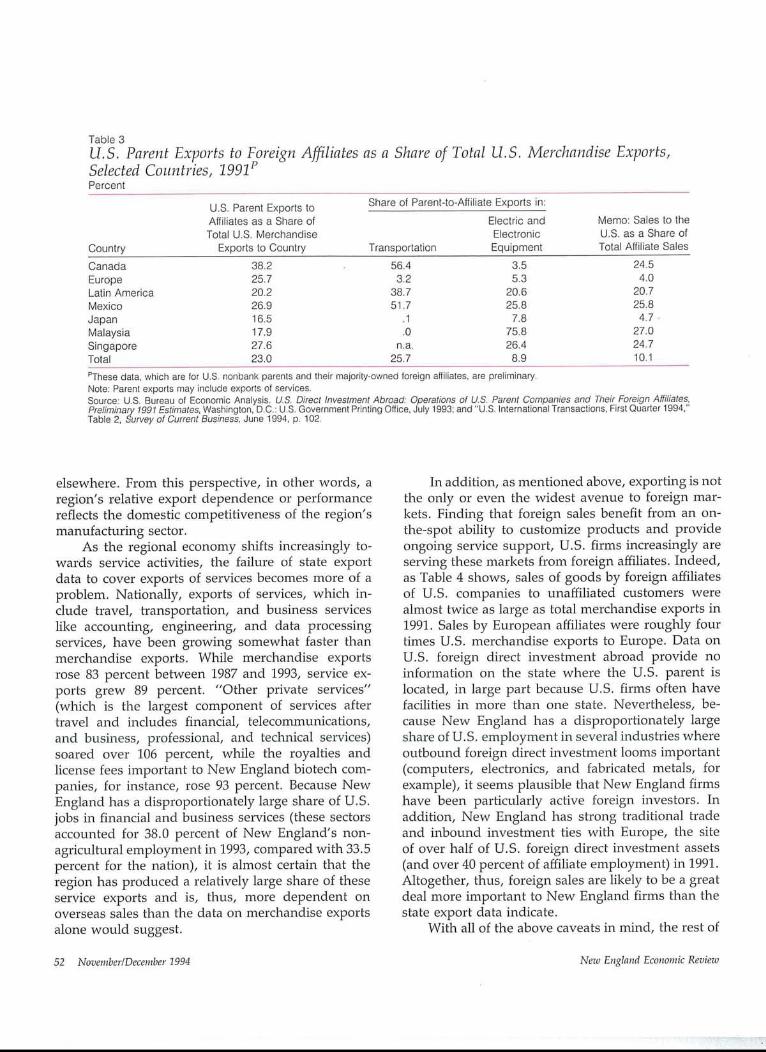
Table 3U.S. Parent Exports to Foreign Affiliates as a Share of Total U.S. Merchandise Exports,Selected Countries, 1991~Percent
Share of Parent-to-Affiliate Exports in:U.S. Parent Exports toAffiliates as a Share of Electric and Memo: Sales to theTotal U.S. Merchandise Electronic U.S. as a Share of
Country Exports to Country Transportation Equipment Total Affiliate Sales
Canada 38.2 56.4 3.5 24.5Europe 25.7 3.2 5.3 4.0Latin America 20.2 38.7 20.6 20.7Mexico 26.9 51.7 25.8 25.8Japan 16,5 .1 7.8 4.7Malaysia 17.9 .0 75.8 27.0Singapore 27.6 n.a. 26.4 24.7Total 23.0 25.7 8.9 10.1
PThese data, which are for U.S. nonbank parents and their majority-owned toreign affiliates, are preliminary.Note: Parent exports may include exports of services.Source: U.S. Bureau of Economic Analysis. U.S. Direct Investment Abroad: Operations of U.S. Parent Companies and Their Foreign Affiliates,Preliminary 1991 Estimates, Washington, D.C.: U.S. Government Printing Office, July 1993; and "U.S. International Transactions, First Quarter 1994,"Table 2, Survey of Current Business, June 1994, p. 102.
elsewhere. From this perspective, in other words, aregion’s relative export dependence or performancereflects the domestic competitiveness of the region’smanufacturing sector.
As the regional economy shifts increasingly to-wards service activities, the failure of state exportdata to cover exports of services becomes more of aproblem. Nationally, exports of services, which in-clude travel, transportation, and business serviceslike accounting, engineering, and data processingservices, have been growing somewhat faster thanmerchandise exports. While merchandise exportsrose 83 percent between 1987 and 1993, service ex-ports grew 89 percent. "Other private services"(which is the largest component of services aftertravel and includes financial, telecommunications,and business, professional, and technical services)soared over 106 percent, while the royalties andlicense fees important to New England biotech com-panies, for instance, rose 93 percent. Because NewEngland has a disproportionately large share of U.S.jobs in financial and business services (these sectorsaccounted for 38.0 percent of New England’s non-agricultural employment in 1993, compared with 33.5percent for the nation), it is almost certain that theregion has produced a relatively large share of theseservice exports and is, thus, more dependent onoverseas sales than the data on merchandise exportsalone would suggest.
In addition, as mentioned above, exporting is notthe only or even the widest avenue to foreign mar-kets. Finding that foreign sales benefit from an on-the-spot ability to customize products and provideongoing service support, U.So firms increasingly areserving these markets from foreign affiliates. Indeed,as Table 4 shows, sales of goods by foreign affiliatesof U.S. companies to unaffiliated customers werealmost twice as large as total merchandise exports in1991. Sales by European affiliates were roughly fourtimes U.S. merchandise exports to Europe. Data onU.S. foreign direct investment abroad provide noinformation on the state where the U.S. parent islocated, in large part because U.S. firms often havefacilities in more than one state. Nevertheless, be-cause New England has a disproportionately largeshare of U.S. employment in several industries whereoutbound foreign direct investment looms important(computers, electronics, and fabricated metals, forexample), it seems plausible that New England firmshave been particularly active foreign investors. Inaddition, New England has strong traditional tradeand inbound investment ties with Europe, the siteof over half of U.S. foreign direct investment assets(and over 40 percent of affiliate employment) in 1991.Altogether, thus, foreign sales are likely to be a greatdeal more important to New England firms than thestate export data indicate.
With all of the above caveats in mind, the rest of
52 November/December 1994 Nezo England Economic Review
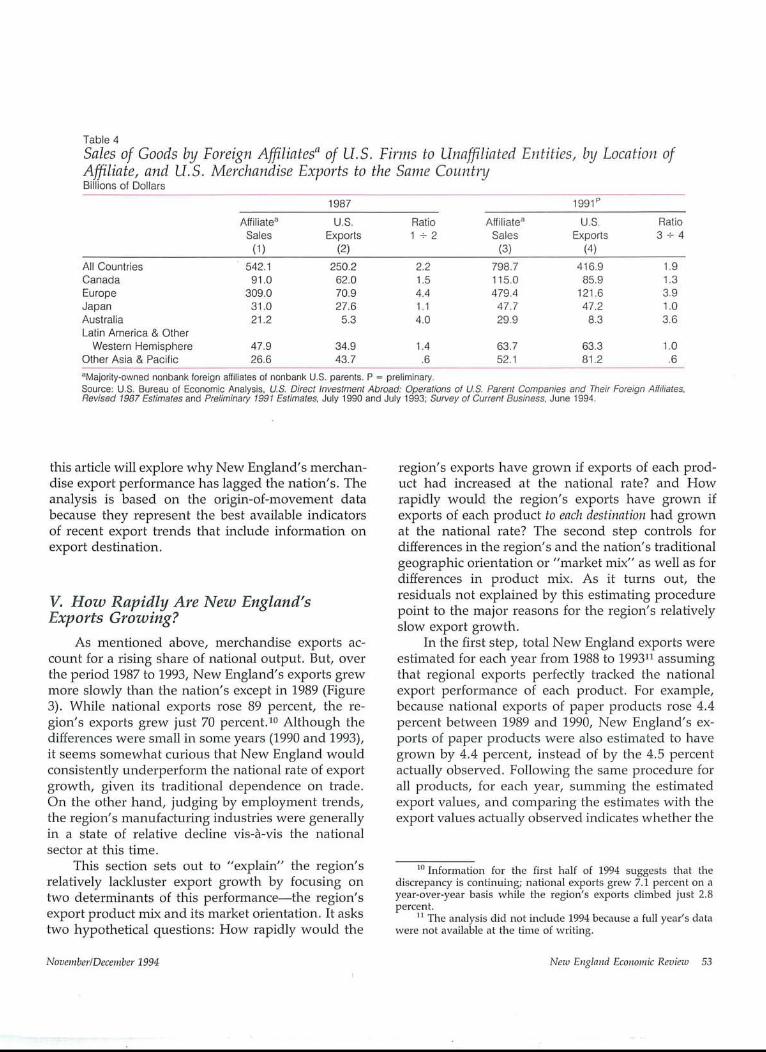
Table 4Sales of Goods by Foreign Affiliates" of U.S. Finns to Unaffiliated Entities, by Location ofAf-filiate, and U.S. Merchandise Exports to the Same CountndBillions of Dollars
All CountriesCanadaEuropeJapanAustraliaLatin America & Other
Western HemisphereOther Asia & Pacific
~987 1991P
Affiliatea U.S. Ratio Affiliatea U.S. RatioSales Exports 1 + 2 Sales Exports 3 ÷ 4
(1) (2) (3) (4)542.1 250.2 2.2 798.7 416.9 1.991.0 62.0 1.5 115.0 85.9 1.3
309.0 70.9 4.4 479.4 121.6 3.931.0 27.6 1.1 47.7 47.2 1.021.2 5.3 4.0 29.9 8.3 3.6
47.9 34.9 1.4 63.7 63.3 1.026.6 43.7 .6 52.1 81.2 .6
aMajority-owned nonbank foreign affiliates of nonbank U.S. parents. P = preliminary.Source: U.S. Bureau of Economic Analysis, U.S. Direct Investment Abroad: Operations of U.S. Parent Companies and Their Foreign Affiliates,Revised 1987 Estimates and Preliminary 1991 Estimates, July 1990 and July 1993; Survey of Current Business, June 1994.
this article will explore why New England’s merchan-dise export performance has lagged the nation’s. Theanalysis is based on the origin-of-movement databecause they represent the best available indicatorsof recent export trends that include information onexport destination.
V. How Rapidly Are New England’sExports Growing?
As mentioned above, merchandise exports ac-count for a rising share of national output. But, overthe period 1987 to 1993, New England’s exports grewmore slowly than the nation’s except in 1989 (Figure3). While national exports rose 89 percent, the re-gion’s exports grew just 70 percent,x° Although thedifferences were small in some years (1990 and 1993),it seems somewhat curious that New England wouldconsistently underperform the national rate of exportgrowth, given its traditional dependence on trade.On the other hand, judging by employment trends,the region’s manufacturing industries were generallyin a state of relative decline vis-a-vis the nationalsector at this time.
This section sets out to "explain" the region’srelatively lackluster export growth by focusing ontwo determinants of this performance--the region’sexport product mix and its market orientation. It askstwo hypothetical questions: How rapidly would the
region’s exports have grown if exports of each prod-uct had increased at the national rate? and Howrapidly would the region’s exports have grown ifexports of each product to each destination had grownat the national rate? The second step controls fordifferences in the region’s and the nation’s traditionalgeographic orientation or "market mix" as well as fordifferences in product mix. As it turns out, theresiduals not explained by this estimating procedurepoint to the major reasons for the region’s relativelyslow export growth.
In the first step, total New England exports wereestimated for each year from 1988 to 1993n assumingthat regional exports perfectly tracked the nationalexport performance of each product. For example,because national exports of paper products rose 4.4percent between 1989 and 1990, New England’s ex-ports of paper products were also estimated to havegrown by 4.4 percent, instead of by the 4.5 percentactually observed. Following the same procedure forall products, for each year, summing the estimatedexport values, and comparing the estimates with theexport values actually observed indicates whether the
~o Information for the first half of 1994 suggests that thediscrepancy is continuing; national exports grew 7.1 percent on ayear-over-year basis while the region’s exports climbed just 2.8percent.
~ The analysis did not include 1994 because a full year’s datawere not available at the time of writing.
November/December 1994 New England Economic Review 53
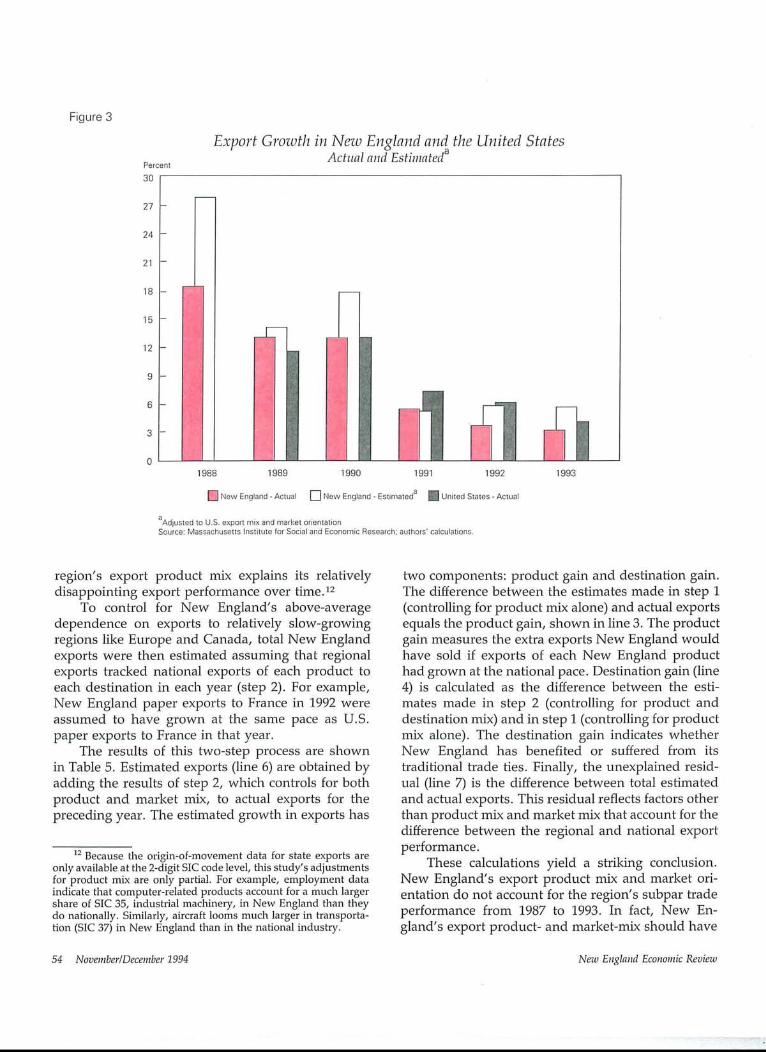
Figure 3
Percent3O
27
24
2]
18
15
12
9
6
3
0
Export Growth in New England and the United StatesActual and Estimateda
1988 1989 1990 1991 1992
[] New England - Actual [] New England - Estimateda ¯ United States - Actual
aAdjusted to U.S. export mix and market orientationSource: Massachusetts Institute for Social and Economic Research; authors’ calculations.
1993
region’s export product mix explains its relativelydisappointing export performance over time.12
To control for New England’s above-averagedependence on exports to relatively slow-growingregions like Europe and Canada, total New Englandexports were then estimated assuming that regionalexports tracked national exports of each product toeach destination in each year (step 2). For example,New England paper exports to France in 1992 wereassumed to have grown at the same pace as U.S.paper exports to France in that year.
The results of this two-step process are shownin Table 5. Estimated exports (line 6) are obtained byadding the results of step 2, which controls for bothproduct and market mix, to actual exports for thepreceding year. The estimated growth in exports has
12 Because the origin-of-movement data for state exports are
only available at the 2-digit SIC code level, this study’s adjustmentsfor product mix are only partial. For example, employment dataindicate that computer-related products account for a much largershare of SIC 35, industrial machinery, in New England than theydo nationally. Similarly, aircraft looms much larger in transporta-tion (SIC 37) in New England than in the national industry.
two components: product gain and destination gain.The difference between the estimates made in step 1(controlling for product mix alone) and actual exportsequals the product gain, shown in line 3. The productgain measures the extra exports New England wouldhave sold if exports of each New England producthad grown at the national pace. Destination gain (line4) is calculated as the difference between the esti-mates made in step 2 (controlling for product anddestination mix) and in step I (controlling for productn-dx alone). The destination gain indicates whetherNew England has benefited or suffered from itstraditional trade ties. Finally, the unexplained resid-ual (line 7) is the difference between total estimatedand actual exports. This residual reflects factors otherthan product mix and market mix that account for thedifference between the regional and national exportperformance.
These calculations yield a striking conclusion.New England’s export product mix and market ori-entation do not account for the region’s subpar tradeperformance from 1987 to 1993. In fact, New En-gland’s export product- and market-mix should have
54 November/December 1994 Nezo England Economic Review
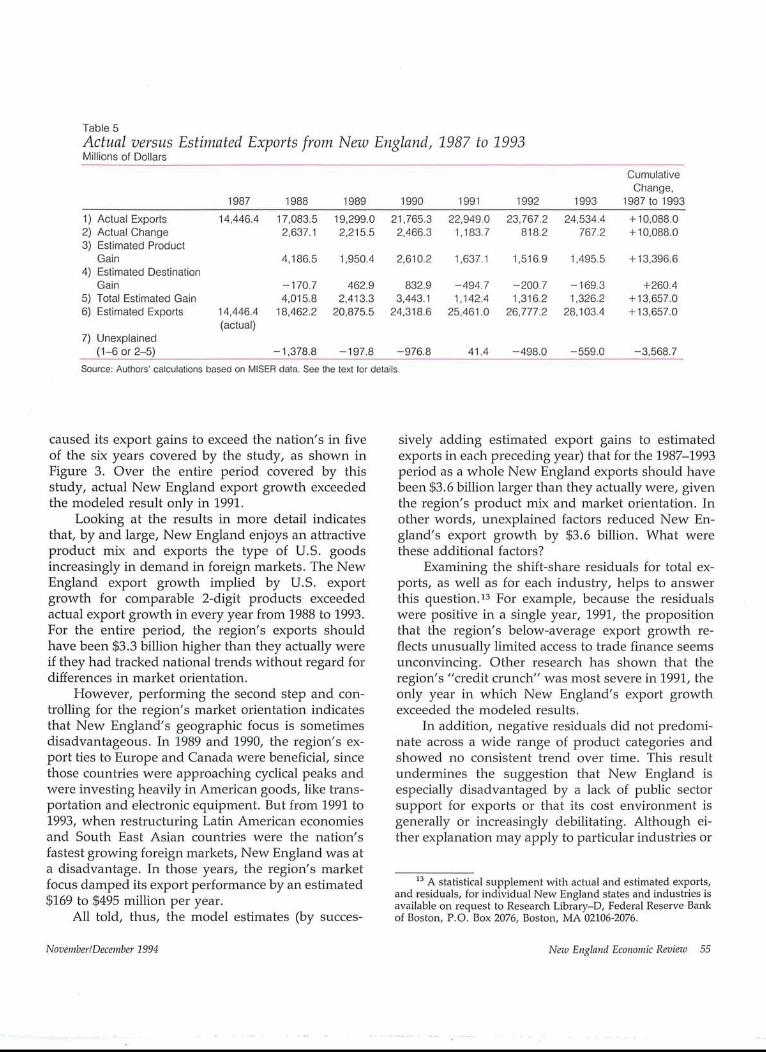
Table 5Actual versus Estimated Exports from Nezo England, 1987 to 1993Millions of Dollars
CumulativeChange,
1987 1988 1989 1990 1991 1992 1993 1987 to 19931 ) Actual Exports 14,446.4 17,083.5 19,299.0 21,765.3 22,949.0 23,767.2 24,534.4 + 10,088.02) Actual Change 2,637.1 2,215.5 2,466.3 1,183.7 818.2 767.2 +10,088.03) Estimated Product
Gain 4,186.5 1,950.4 2,610.2 1,637.1 1,516.9 1,495.5 +13,396.64) Estimated Destination
Gain -170.7 462.9 832.9 -494.7 -200.7 -169.3 +260.45) Total Estimated Gain 4,015.8 2,413.3 3,443.1 1,142.4 1,316.2 1,326.2 +13,657.06) Estimated Exports 14,446.4 18,462.2 20,875.5 24,318.6 25,461.0 26,777.2 28,103.4 +13,657.0
(actual)7) Unexplained
(14 or 2-5) -1,378.8 -197.8 -976.8 41.4 -498.0 -559.0Source: Authors’ calculations based on MISER data. See the text for details.
-3,568.7
caused its export gains to exceed the nation’s in fiveof the six years covered by the study, as shown inFigure 3. Over the entire period covered by thisstudy, actual New England export growth exceededthe modeled result only in 1991.
Looking at the results in more detail indicatesthat, by and large, New England enjoys an attractiveproduct mix and exports the type of U.S. goodsincreasingly in demand in foreign markets. The NewEngland export growth implied by U.S. exportgrowth for comparable 2-digit products exceededactual export growth in every year from 1988 to 1993.For the entire period, the region’s exports shouldhave been $3.3 billion higher than they actually wereif they had tracked national trends without regard fordifferences in market orientation.
However, performing the second step and con-trolling for the region’s market orientation indicatesthat New England’s geographic focus is sometimesdisadvantageous. In 1989 and 1990, the region’s ex-port ties to Europe and Canada were beneficial, sincethose countries were approaching cyclical peaks andwere investing heavily in American goods, like trans-portation and electronic equipment. But from 1991 to1993, when restructuring Latin American economiesand South East Asian countries were the nation’sfastest growing foreign markets, New England was ata disadvantage. In those years, the region’s marketfocus damped its export performance by an estimated$169 to $495 million per year.
All told, thus, the model estimates (by succes-
sively adding estimated export gains to estimatedexports in each preceding year) that for the 1987-1993period as a whole New England exports should havebeen $3.6 billion larger than they actually were, giventhe region’s product mix and market orientation. Inother words, unexplained factors reduced New En-gland’s export growth by $3.6 billion. What werethese additional factors?
Examining the shift-share residuals for total ex-ports, as well as for each industry, helps to answerthis question.13 For example, because the residualswere positive in a single year, 1991, the propositionthat the region’s below-average export growth re-flects unusually limited access to trade finance seemsunconvincing. Other research has shown that theregion’s "credit crunch" was most severe in 1991, theonly year in which New England’s export growthexceeded the modeled results.
In addition, negative residuals did not predomi-nate across a wide range of product categories andshowed no consistent trend over time. This resultundermines the suggestion that New England isespecially disadvantaged by a lack of public sectorsupport for exports or that its cost environment isgenerally or increasingly debilitating. Although ei-ther explanation may apply to particular industries or
13 A statistical supplement with actual and estimated exports,and residuals, for individual New England states and industries isavailable on request to Research Library-D, Federal Reserve Bankof Boston, P.O. Box 2076, Boston, MA 02106-2076.
November/December 1994 Nezo England Economic Review 55
states, the evidence does not support a broad-baseddeficiency.
Finally, it is noteworthy that, over time, onesector--industrial machinery--accounts for the bulkof the negative residuals. In fact, New Englandexports of this set of products fell well below themodeled results in each year and, for the entire1987-93 period, this one industry’s cumulative resid-ual amounted to $3.5 billion, virtually all of theregion’s unexplained export shortfall for the yearsstudied. While other industries, such as transporta-tion equipment and instruments, also had substantialnegative residuals (-$0.9 billion and -$0.5 billion,respectively), these residuals represent relativelysmall fractions of the total shortfall and were largelyoffset by positive residuals in industries like chemi-cals ($0.4 billion), fabricated metals ($0.4 billion) andelectronic equipment ($0.2 billion). In other words, if
By and large, New Englandenjoys an attractive productmix and exports the type ofU.S. goods increasingly indemand in foreign markets.
it were not for the industrial machinery industry,New England export growth would have done areasonably good job of tracking the nation’s exportperformance.
One explanation for the industrial machinerysector’s relatively poor performance may be the fa-miliar misfortunes besetting the region’s computerindustry during this period; more powerful micropro-cessor-based personal computers and the trend to-wards open-architecture systems have both cut intothe market share of the region’s mini-computer mak-ers. More generally, the lev61 of industry detail avail-able with the origin-of-movement export data (2-digitSIC codes) may simply be too broad to allow fulladjustment for differences in product mix. For exam-ple, computers account for a major part of the indus-trial machinery industry in New England, but for amuch smaller share of the national industry. Thus,using trends in U.S. exports of industrial machineryto estimate New England’s industrial machinery ex-ports (largely computers with falling prices) could
greatly exaggerate the region’s apparent export short-fall. Similar distortions could also contribute to therelatively large residuals found in the transportationand, to a lesser extent, the instruments industries. Inthe case of transportation equipment, for example,aircraft engines and parts dominate the regionalindustry whereas autos or complete aircraft loomlarger elsewhere.
VI. Summary and Policy Implications
This article uses the best available state exportdata, the U.S. Census Bureau’s origin-of-movementdata provided through the Massachusetts Institutefor Social and Economic Research, to explore thereasons for New England’s below-average exportperformance from 1987 to 1993. En route, the articlepoints out that the region’s exports differ from thenation’s because they comprise more highly pro-cessed merchandise and are disproportionately des-tined for European and Canadian markets.
Although New England’s recent export growthhas lagged the nation’s, the shift-share analysis ofproduct and market mix underlying this article indi-cates that the region has no pervasive "exportingproblem." On the contrary, the region’s apparentunderperformance seems to be substantially attribut-able to a single industry, industrial machinery. Al-though the origin-of-movement data cannot supportfurther conclusions, other data suggest that the re-gion’s relatively slow export growth largely relates toits above-average dependence on computers as wellas to the specific challenges confronting the regionalcomputer industry.14 Otherwise, the region appearsto enjoy a generally favorable export product mix,dominated by the high-tech capital equipment for-eigners seek from the United States. The data provideno indication that the region suffers from peculiarlylimited access to trade finance or that ongoing struc-tural shifts from manufacturing production activitiesto services have pulled its export growth belowaverage.
On the other hand, New England’s traditionaltrade ties to Atlantic Rim countries did prove detri-mental from 1991 to 1993. Europe and Canada, NewEngland’s major export markets, suffered severe re-cessions in those years, and the region’s exports
14 Another possible exception is the region’s above-averagedependence on aircraft engines and parts, rather than completeaircraft or autos, within the transportation industry.
56 November/December 1994 New England Economic Review
suffered as a consequence. As of late 1994, however,recovery is well under way in these areas. Accord-ingly, New England’s established market focus--rooted in geography and culture--should soon be-come less disadvantageous.
Nevertheless, Latin America and Asia will un-doubtedly continue to gain importance as U.S. exportmarkets, as these developing regions outpace growthin the mature industrial countries and become in-creasingly open to trade. Starting in early 1994, theNorth American Free Trade Agreement (NAFTA)gradually eliminates Mexican tariffs (presently aver-aging 10 percent) on U.S. products. Similarly,NAFTA provisions protecting U.S. intellectual prop-erty rights and a side agreement on enforcing Mexi-co’s environmental laws enhance export opportu-nities for the U.S. software and environmentalbusinesses, important in New England. Other LatinAmerican and Asian countries are also committed toreducing barriers to international trade and invest-ment and have made such policies a central aspect oftheir development strategies as their leaders haveincreasingly recognized that cutting trade barrierswill improve their nation’s productivity and livingstandards. Such policies led over 120 countries to thecommitments embodied in the Uruguay Roundamendments to the General Agreement on Tariffsand Trade (GATT), recently approved by the U.S.Congress.
Although the foregoing analysis suggests thatNew England exporters are generally aware of andresponsive to global market trends, obtaining a good
understanding of foreign markets requires timely andappropriate trade data. Given the growing impor-tance of services in international trade, informationon state service exports would be most welcome. Inaddition, the data on state merchandise exports byindustry would be much more useful if transporta-tion could be divided into autos and other transpor-tation, and if computers and office equipment couldbe segregated from other industrial machinery.
In light of New England’s traditional involve-ment in international trade and investment, it issomewhat reassuring to find that the region’s recentexport performance is probably akin to the nationalaverage, once remaining differences in product m~-~particularly the relative importance of computers--are taken into account. Still, since the computerindustry remains key to New England’s industrialfuture, this result provides no grounds for compla-cence. Indeed, the fact that New England merchan-dise exports have not grown faster than the nationalaverage, given New Englanders’ international so-phistication, probably reflects the region’s ongoingshift from manufacturing production activities to ser-vices. After all, relative merchandise export perfor-mance signals a region’s competitiveness as a manu-facturing production site. The ongoing restructuringof the regional economy suggests that New England-ers will increasingly serve global markets throughexports of services and overseas investments. For thisreason, the merchandise trade data discussed in thisarticle provide only a partial picture of New En-gland’s involvement with the world economy.
November/Dece~nber 1994 New England Economic Review 57
Index~1994
BankingThe Fed Must Continue to Supervise Banks
Richard F. SyronJanuary/February 1994 p. 3
The Geographic Boundaries of NewEngland’s Middle-Lending MarketsRobert TannenwaldSeptember/October 1994 p. 45
ANew Look at Reverse Mortgages: PotentialMarket and Institutional ConstraintsChristopher J. Mayer and
Katerina V. SimonsMarc~Apr~ 1994 p. 15
Safeguarding the Banking System in anEnvironment of Financial Cycles:An OverviewNchard E. Randa~March/Apr~ 1994, p. 3
International50 Years after Bretton Woods: What Is the
Future for the InternationalMonetand System?Rachel E. Cononi and
Rebecca HellersteinJuly/August 1994 p. 65
International Capital Transactions: ShouldThey Be Restricted?Norman S. FielekeMarch/April 1994, p. 27
The International Monetmnj Fund50 Years after Bretton WoodsNorman S. FielekeSeptember/October 1994 p. 17
IsGlobal Competition Making thePoor Even Poorer?Norman S. FielekeNovember/December 1994 p. 3
Macroeconomics and Monetary PolicyDiversity, Uncertainty, and Accuracy of
Inflation ForecastsStephen K. McNees with
Lauren K. FineJuly/August 1994 p. 33
Gifts for Home Purchase and HousingMarket BehaviorGary V. Engelhardt and
Christopher J. MayerMay/June 1994 p. 47
Goals, Guidelines, and Constraints FacingMonetm~y Policymakers: An OverviewJeffrey C. FuhrerSeptember/October 1994 p. 3
APanel Study of hwestment: Sales, CashFlow, the Cost of Capital, and LeverageRichard W. Kopcke with
Mark M. Howreyjanuary!February 1994 p. 9
Restructuring, the NAIRU, and thePhillips CurveGeoffrey M.B. TootellSeptember/October 1994 p. 31
Yield Curve Forecasts of Inflation:A Cautionanj TaleStephen R. BloughMay/June 1994 p. 3
]Regionali A Decade of Boom and Bust in the Prices of
Single-Family Homes: Boston andLos Angeles, 1983 to 1993Karl E. Case and Robert J. ShillerMarch!April 1994 p. 40
Explaining New England’s ExportPerformance: 1987 to 1993Richard J. DeKaser and
Jane Sneddon LittleNovember/December 1994 p. 43
Indexes of Econolnic Indicators: WhatCan They Tell Us about theNew England Economy?Alan Clayton-Matthews, Yolanda K.
Kodrzycki, and Daniel SwaineNovember!December 1994 p. 17
! Massachusetts’ Tax CompetitivenessRobert TannenwaldJanuary!February 1994 p. 31
New England Job Changes during theRecession: The Role of Self-EmploymentKatharine L. BradburySeptember/October 1994 p. 45;atization of Local Public Services:
Lessons for New EnglandYolanda K. KodrzyckiMay/June 1994 p. 31
The Regional hnpact of Health CareReform--with a Focus on New Englandane Sneddon Little with
Michael D. JudJuly/August 1994 p. 3
School District Spending and State Aid:Why Disparities PersistKatharine L. BradburyJanuary/February 1994 p. 50
Technology Life Cycles and State EconomicDevelopment StrategiesPatricia M. FlynnMay/June 1994 p. 17
November=December 1994 New England Economic Review 59