Embed Size (px)
Citation preview
THRIVE: Study on roll-out of Fuel Cell Electric Vehicles
and Hydrogen Refuelling Infrastructure for the Netherlands
P. Lebutsch M. Weeda
ECN-E--11-005 January 2011

2 ECN-E--11-005
Acknowledgements This report describes the results of the THRIVE project, a study on the possible build-up of a hydrogen infrastructure in the Netherlands. The study is jointly carried out by ECN, Shell, Linde and TNO in the period June 2007 - June 2010. Within ECN, the units Hydrogen & Clean Fossil Fuels and Policy Studies have contributed to the project. The Dutch Ministry of Economic Affairs and AgentschapNL (previously known as SenterNo-vem) are gratefully acknowledged for financial support. The project is part of the EOS-LT pro-gram and is filed as contract number EOSLT06025. This project is registered by ECN under the numbers 7.0325 (Clean Fossil Fuels) and 7.7897 (Policy Studies). Contact person for this publi-cation is Marcel Weeda, email: [email protected]. The authors would like to thank following people for their contributions to the project: ECN: Austine Ajah, Julia Backhaus, Bas van Bree, Maarten de Bruijne, Bram van den Broek,
Ingo Bunzeck, Coen Hanschke, Bart Hoevenaars, Harold Meerwaldt, Ruth Mourik, Wim Roeterdink, Koen Schoots. Students/trainees Usman Iljaz Dar (TU Delft), Kennedy Ke-sieme (EU Master program ME3), Erik Klaassen (University of Utrecht).
Shell Global Solutions International BV: Gert Jan Kramer, Steven Rouvroy. Linde Gas Benelux: Fred Hage, Pascal Meyvaert, Jaco Reijerkerk. TNO: Koos Ham, Ingrid Heidebrink, Vincent van den Hoogenband, Matthijs de Maaijer This document reflects the results of a research project that has been conducted at ECN in coop-eration with companies and organisations listed above. The information and conclusions con-tained in this document represent the view of the document authors and the collective view of the working groups and not that of individual companies or organisations. Any information pro-vided in this document are for reference purposes only and are not intended, nor should they be used as a substitute for professional advice or judgement with respect to certain circumstances.
ECN-E--11-005 3
Abstract This report describes the result of a study on the rollout of fuel cell electric vehicles (FCEV) and a corresponding hydrogen refuelling infrastructure in the Netherlands. The study has focused on the rollout in the period following the large-scale demonstration phase, when the new cars be-come commercially available and show up in car dealers’ showrooms. A model has been developed that simulates deployment of FCEVs and refuelling infrastructure in spatial and temporal domains. In this model rollout results from consumers buying cars. The number of consumers that buy an FCEV depends on conditions that affect the attractiveness of this option for consumers. These conditions are determined by settings representing investment behaviour and strategies of car industry and fuel suppliers. Furthermore the number of consum-ers buying an FCEV is a function of the willingness of consumers to adapt their current refuel-ling behaviour to local availability of hydrogen, and the expectations of consumers regarding the overall utility of the new cars. On the whole, rollout simulations suggest that by 2050 up to 35-40% of all cars in the Nether-lands could be hydrogen-powered FCEVs under the condition that technical performance of FCEVs proves to be comparable to conventional cars and sufficient incentives are introduced. Cost analysis and greenhouse gas emission analysis of rollout scenarios have been carried out for a hydrogen delivery pathway based on central production of hydrogen and transport of liquid hydrogen to refuelling stations. This study concludes that hydrogen is affordable, viable and of-fers good prospects for large emission reductions in road transport. The costs involved are sig-nificant, but not insurmountable. This is illustrated by the finding that the cost gaps that need to be bridged during rollout can be covered with a levy of about € 80 per car sold on average, or about 0.5 €ct/litre of fuel for a period of about 25-30 years. The cumulative cost gap is of the order of 1 to 2 billion euro and needs to be bridged in a period of about 3 decades. This amount can decrease by up to 50%, if consumers are willing to pay € 500 more for an FCEV compared to the reference car.
4 ECN-E--11-005
Contents
List of tables 6
List of figures 6
List of abbreviations 8
Summary 9 S.1. Main Conclusions and Messages 9 S.2. Battery and Fuel Cell Electric Mobility 9 S.3. Fuel Cell Electric Cars and Corresponding Hydrogen Refuelling
Infrastructure 9 S.4. Rollout Simulation Model 9 S.5. Rollout Simulation Results 10 S.6. Cost Analysis of Refuelling Infrastructure Rollout 11 S.7. Cost Analysis of FCEV Rollout 12 S.8. Overall Cost Analysis 12 S.9. Greenhouse Gas Emission Analysis of Rollout Scenarios 13 S.10. Cost Effectiveness Rollout Scenarios 14
1. Introduction 15 1.1 Background and Objective 15 1.2 Approach 16
2. Rollout of Hydrogen Cars and Refuelling Infrastructure 18 2.1 THRIVE ALLOCATE - The Model and its Principles 18 2.2 Overview of Model Input and Parameters 20
2.2.1 General Input Data 20 2.2.2 Government Policy Related Input and Parameters 20 2.2.3 Consumer Related Input and Parameters 21 2.2.4 Fuel Supplier Related Input and Parameters 24 2.2.5 Car Industry Related Input and Parameters 25
3. Rollout Scenarios and Results 26 3.1 THRIVE Scenarios 26
3.1.1 Fuel Supplier Strategies 26 3.1.2 Car Industry Strategies 28
3.2 Base Case Scenario Results 29
4. Economic Analysis of Rollout Scenarios 33 4.1 Cost of Hydrogen Refuelling Infrastructure 33
4.1.1 Hydrogen Refuelling Unit: Concept and Cost 33 4.1.2 Cost of Hydrogen from overall rollout perspective 35 4.1.3 Cost of Hydrogen from Single Investor Perspective 39
4.2 Cost of Fuel Cell Electric Vehicles 40 4.3 Cost Gap Analysis 43
4.3.1 Cost gaps for Refuelling Infrastructure and FCEVs 43 4.3.2 Missing Revenues from Excise Duties 45
4.4 Cost Effectiveness Rollout Scenarios 46
5. Greenhouse Gas Emission Analysis 47
6. Policy Analysis 49 6.1 Technology Development Phases 49 6.2 Overview of Policy Instruments 49 6.3 Cost of Policy Measures in Practice 51
7. Conclusions 52

ECN-E--11-005 5
References 55
Appendix A Sensitivity analysis rollout simulations 58
Appendix B Hydrogen Production Pathways 62
Appendix C Hydrogen Refuelling Unit Capacity 64
Appendix D Study on Safety Aspects 65
6 ECN-E--11-005
List of tables
Table 2.1 TNS-NIPO survey data on drive time 21 Table 3.1 Initial refuelling station network (‘Seeding Scenarios’) 27 Table 4.1 Pros and cons of a liquid hydrogen delivery pathway 33 Table 4.2 HRU related parameters used in the economic analysis 34 Table 4.3 Overview of parameter values for DCF analysis 35 Table 4.4 Parameters for the learning curve methodology applied in the car cost model. 42 Table 5.1 Overview of emission scenarios defined in the GHG emission module 47 Table 5.2 Reduction of GHG emissions on a WTW basis in 2050 for different THRIVE
scenarios 48 Table 6.1 Types of policy tools 50 Table 6.2 Financial support measures for hydrogen 51 Table B.1 Cost of H2 production for main hydrogen production processes 63 Table D.1 Far field distances for side-on overpressure levels from the blast wave of a jet
explosion which occurs during rupture of a high pressure hydrogen pipeline (scenario 11a) 67
Table D.2 Consequence to property and people from blast with certain peak overpressures 68
List of figures
Figure 1.1 Comparison of projected GHG emissions from the European Transport sector with overall GHG emission targets for 2050 15
Figure 1.2 Industry vision on role of batteries and fuel cells in road vehicles 16 Figure 1.3 Schematic overview of the THRIVE project approach 17 Figure 2.1 Illustration of the actors and issues involved in rollout of FCEVs and matching
H2 refuelling infrastructure 18 Figure 2.2 THRIVE ALLOCATE: Model schematics 19 Figure 2.3 ‘Drive Time Function’; solid line - best fit of data points -, represents current
refuelling behaviour; dashed line represents modified behaviour (see also §3.2) 22 Figure 2.4 Relation between Drive Time Function and an average Dutch zip code region 23 Figure 2.5 Local availability function 23 Figure 2.6 General/Countrywide availability function 24 Figure 3.1 Illustration of industry strategies in the three base scenarios and the effect on
the attractiveness of FCEVs for consumers 26 Figure 3.2 Fuel supplier strategies for development of overall average hydrogen refuelling
infrastructure utilisation 27 Figure 3.3 Car industry strategies for FCEV model deployment 29 Figure 3.4 Base case scenario results and sensitivities for car fleet penetrations of FCEVs 29 Figure 3.5 Relative HV sales derived from the base case scenario results 30 Figure 3.6 Maps of the Netherlands with simulation results for 2020, 2035 and 2050 32 Figure 4.1 Process Flow Diagram of a standardised modular hydrogen refuelling unit 34 Figure 4.2 Illustration of the cost components of a hydrogen HRU and their developments. 35 Figure 4.3 Calculation scheme for Discounted Cash Flow analysis 35 Figure 4.4 Results of DCF analysis for whole refuelling infrastructure perspective. 37 Figure 4.5 Impact of non-equipment cost for the high scenario. 38 Figure 4.6 Discounted Cash Flow analysis for the ‘Low’ scenario 38 Figure 4.7 Discounted Cash Flow analysis for the ‘Medium’ scenario 39 Figure 4.8 Discounted Cash Flow analysis for the ‘High’ scenario 39 Figure 4.9 Single investor perspective; results of DCF analysis for the ‘High’ scenario 40
ECN-E--11-005 7
Figure 4.10 Comparison of single investor perspective levelised cost of hydrogen for the ‘High’ scenario with the hydrogen equivalent price of gasoline 40
Figure 4.11 Global cumulative FCEV production numbers based on the THRIVE base cases and the HyWays ‘high policy support, fast learning’ scenario 41
Figure 4.12 Cost Development of a 80 kW FCEV drive train for the ‘High’ scenario case 42 Figure 4.13 Annual and total annual infrastructure cost gaps for the ‘High’ scenario 43 Figure 4.14 Total annual refuelling infrastructure and annual FCEV cost gaps for the
‘Low’, ‘Medium’ and ‘High’ scenario 44 Figure 4.15 Overall annual and cumulative cost gaps for the ‘Low’,’Medium’ and ‘High’
scenario 45 Figure 4.16 Indication of missing revenues from excise duties 45 Figure 5.1 Conceptual model for analysis of rollout WTW GHG emission impact 47 Figure 5.2 ICEVs’ and FCEVs’ WTW GHG emission factors 48 Figure 6.1 Technology development phases 49 Figure 6.2 Conversion of total annual cost gaps to additional price per sold passenger car
or additional price per litre conventional fuel 51 Figure S.1 THRIVE ALLOCATE: Model schematics 10 Figure S.2 Base case scenario results and sensitivities for car fleet penetrations of FCEVs 11 Figure S.3 Cost of dispensed hydrogen from a single investor or refuelling unit perspective 12 Figure S.4 Cost Development of a 80 kW FCEV drive train for the ‘High’ scenario case 12 Figure S.5 Overall annual and cumulative cost gaps for ‘Low’,’Medium’ and ‘High’
scenario 13 Figure S.6 ICEVs’ and FCEVs’ WTW GHG emission factors 14 Figure A.1 Impact of changes in size of initial station network on FCEV fleet penetration 58 Figure A.2 Impact of changes in station utilisation development on FCEV fleet penetration 59 Figure A.3 Impact of changes in FCEV deployment scheme on FCEV fleet penetration 59 Figure A.4 Impact of changing car replacement rate on FCEV fleet penetration 60 Figure A.5 Impact of refuelling behaviour on FCEV fleet penetration 60 Figure A.6 Impact of refuelling behaviour on extent of hydrogen rollout in 2050 61 Figure B.1 Flowchart of hydrogen production pathways and methods 62 Figure C.1 HRU capacity as a function of number of HRUs at a refuelling station 64 Figure D.1 (a) Bottom view on used geometry; (b) Top view on used geometry 66 Figure D.2 Side-on overpressure levels of blast from a worst case exploding hydrogen jet 67
8 ECN-E--11-005
List of abbreviations
BEV Battery-Electric Vehicle CAPEX CAPital EXpenditures CCS Carbon Capture and Storage CFD Computational Fluid Dynamics CG Coal Gasification CGH2 Compressed Gaseous Hydrogen CNG Compressed Natural Gas DCF Discounted Cash Flow FCEV Fuel Cell Electric Vehicle FCI Fixed Capital Investment GHG Greenhouse Gas HEV Hybrid Electric Vehicle HRS Hydrogen Refuelling Station HRU Hydrogen Refuelling Unit ICE Internal Combustion Engine ICEV Internal Combustion Engine Vehicle IRR Internal Rate of Return LH2 Liquid Hydrogen LoC Loss of Containment NG Natural Gas NPV Net Present Value OPEX OPerational EXpenditures PHEV Plug-in Hybrid Electric Vehicles QRA Quantitative Risk Analysis RS Refuelling Station RU Refuelling Unit SMR Steam Methane Reforming TTW Tank-to-Wheel VAT Value Added Tax WTT Well-to-Tank WTW Well-to-Wheel ZC Zip Code
ECN-E--11-005 9
Summary
S.1. Main Conclusions and Messages This report describes the result of a study on the rollout of fuel cell electric vehicles (FCEV) and a corresponding hydrogen refuelling infrastructure in the Netherlands. The study focuses on the rollout in the period following the large-scale demonstration phase, when the new cars become commercially available and show up in car dealers’ showrooms. Based on rollout simulations this study concludes that by 2050 about 35-40% of all cars in the Netherlands could be hydrogen powered FCEVs if technical performance of FCEVs proves to be comparable to conventional cars and sufficient incentives are introduced. Cost analysis and greenhouse gas emission analysis of rollout scenarios show that hydrogen is affordable, viable and offers good prospects for large emission reductions in road transport. Cost involved are significant, but are not insurmountable. This is illustrated by the finding that the cost gaps that need to be bridged during rollout can be covered with a levy of about € 80 per car sold on average, or about 0.5 €ct/litre of fuel. The cumulative cost gap is of the order of 1 to 2 billion euro and needs to be bridged in a period of about 3 decades. This amount can decrease by up to 50% if consumers would be willing to pay € 500 more for an FCEV compared to the reference car.
S.2. Battery and Fuel Cell Electric Mobility Although the focus of this study is on hydrogen-powered fuel cell vehicles, it is worth noticing that these are electric vehicles. Batteries and fuel cells are considered as complementary tech-nologies. Batteries, are typically suitable for city cars and small cars which are only used for lo-cal trips and commuting. In these cases limited range and recharging times in the order of hours is usually not a problem. Fuels cells using hydrogen as fuel, enable electric cars with long range and short refuelling time. This makes them suitable for larger cars used regularly for longer trips.
S.3. Fuel Cell Electric Cars and Corresponding Hydrogen Refuelling Infrastructure
Introduction and rollout of FCEVs is not just about cars. It also needs development of a corre-sponding hydrogen refuelling infrastructure. As significant high risk investments are involved, rollout of both requires a well coordinated process. Policymakers, car industry and fuel suppli-ers are key players in this process. Together, they create the conditions necessary to convince consumers to buy FCEVs. A rollout model has been developed which captures the main interac-tions between these interested parties. The model is able to simulate spatial deployment of FCEVs and refuelling infrastructure on an annual basis.
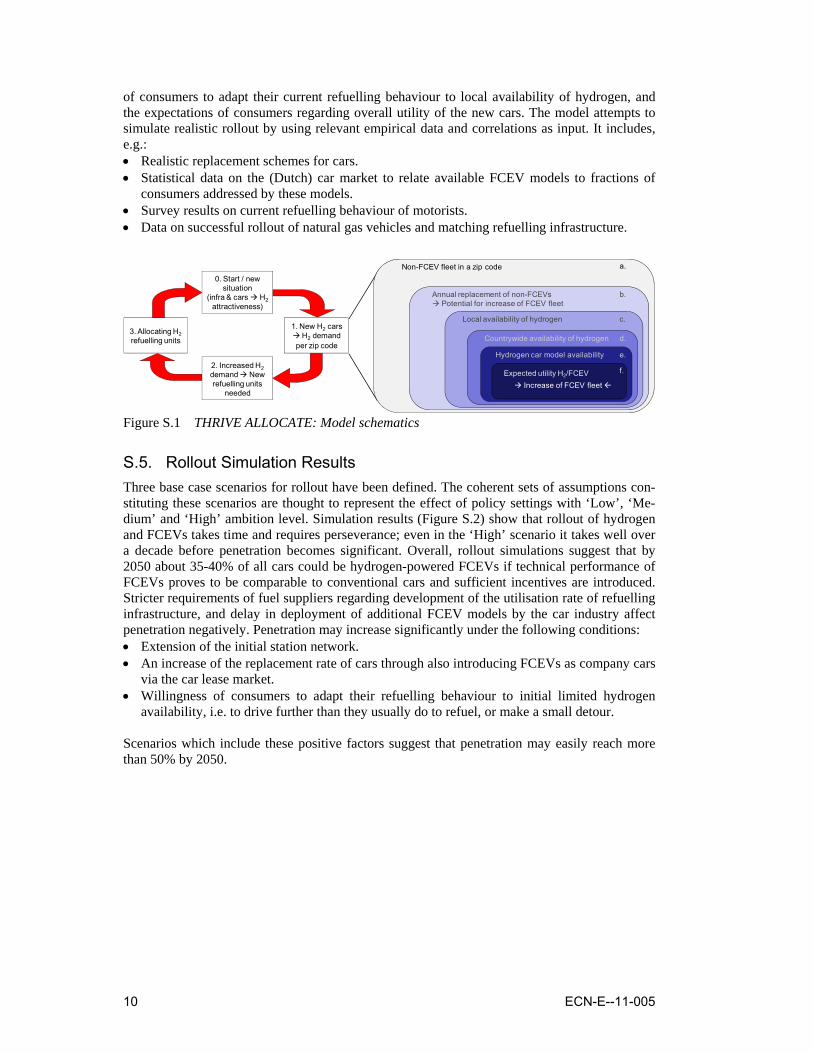
S.4. Rollout Simulation Model Figure S.1 illustrates the model approach. In the model, rollout occurs as a result of consumers buying cars. The number of consumers that buy a FCEV is modelled as a function of conditions that affect the attractiveness of the option for consumers, i.e. availability of hydrogen, both lo-cally and countrywide, and the availability of different FCEV modes. These conditions are de-termined by settings representing investment behaviour and strategies of car industry and fuel suppliers. Furthermore the number of consumers buying a FCEV is a function of the willingness
10 ECN-E--11-005
of consumers to adapt their current refuelling behaviour to local availability of hydrogen, and the expectations of consumers regarding overall utility of the new cars. The model attempts to simulate realistic rollout by using relevant empirical data and correlations as input. It includes, e.g.: • Realistic replacement schemes for cars. • Statistical data on the (Dutch) car market to relate available FCEV models to fractions of
consumers addressed by these models. • Survey results on current refuelling behaviour of motorists. • Data on successful rollout of natural gas vehicles and matching refuelling infrastructure.
1. New H2 cars H2 demand
per zip code
2. Increased H2demand New refuelling units
needed
3. Allocating H2refuelling units
0. Start / new situation
(infra & cars H2attractiveness)
Non-FCEV fleet in a zip code
Expected utility H2/FCEVIncrease of FCEV fleet
Hydrogen car model availability
Countrywide availability of hydrogen
Local availability of hydrogen
Annual replacement of non-FCEVsPotential for increase of FCEV fleet
a.
b.
c.
d.
e.
f.
Figure S.1 THRIVE ALLOCATE: Model schematics
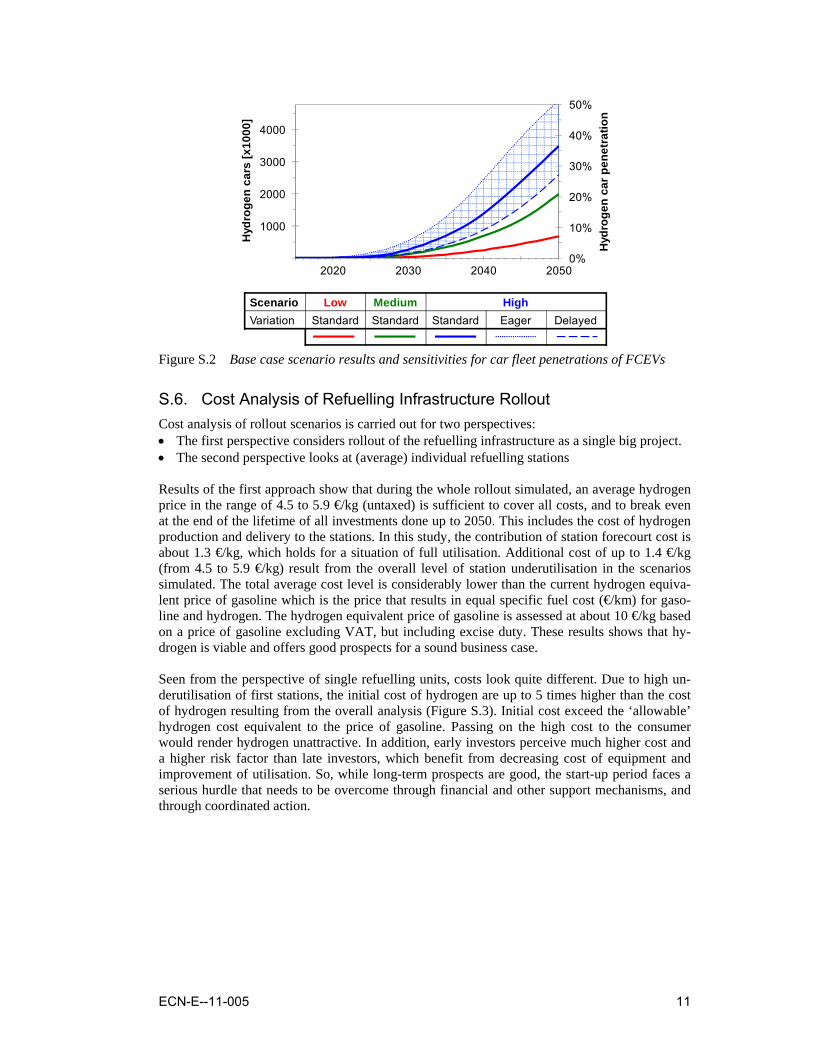
S.5. Rollout Simulation Results Three base case scenarios for rollout have been defined. The coherent sets of assumptions con-stituting these scenarios are thought to represent the effect of policy settings with ‘Low’, ‘Me-dium’ and ‘High’ ambition level. Simulation results (Figure S.2) show that rollout of hydrogen and FCEVs takes time and requires perseverance; even in the ‘High’ scenario it takes well over a decade before penetration becomes significant. Overall, rollout simulations suggest that by 2050 about 35-40% of all cars could be hydrogen-powered FCEVs if technical performance of FCEVs proves to be comparable to conventional cars and sufficient incentives are introduced. Stricter requirements of fuel suppliers regarding development of the utilisation rate of refuelling infrastructure, and delay in deployment of additional FCEV models by the car industry affect penetration negatively. Penetration may increase significantly under the following conditions: • Extension of the initial station network. • An increase of the replacement rate of cars through also introducing FCEVs as company cars
via the car lease market. • Willingness of consumers to adapt their refuelling behaviour to initial limited hydrogen
availability, i.e. to drive further than they usually do to refuel, or make a small detour. Scenarios which include these positive factors suggest that penetration may easily reach more than 50% by 2050.
ECN-E--11-005 11
2020 2030 2040 20500%
10%
20%
30%
40%
50%
1000
2000
3000
4000
Hyd
roge
n ca
r pen
etra
tion
Hyd
roge
n ca
rs [x
1000
]
Scenario Low Medium HighVariation Standard Standard Standard Eager Delayed
Figure S.2 Base case scenario results and sensitivities for car fleet penetrations of FCEVs
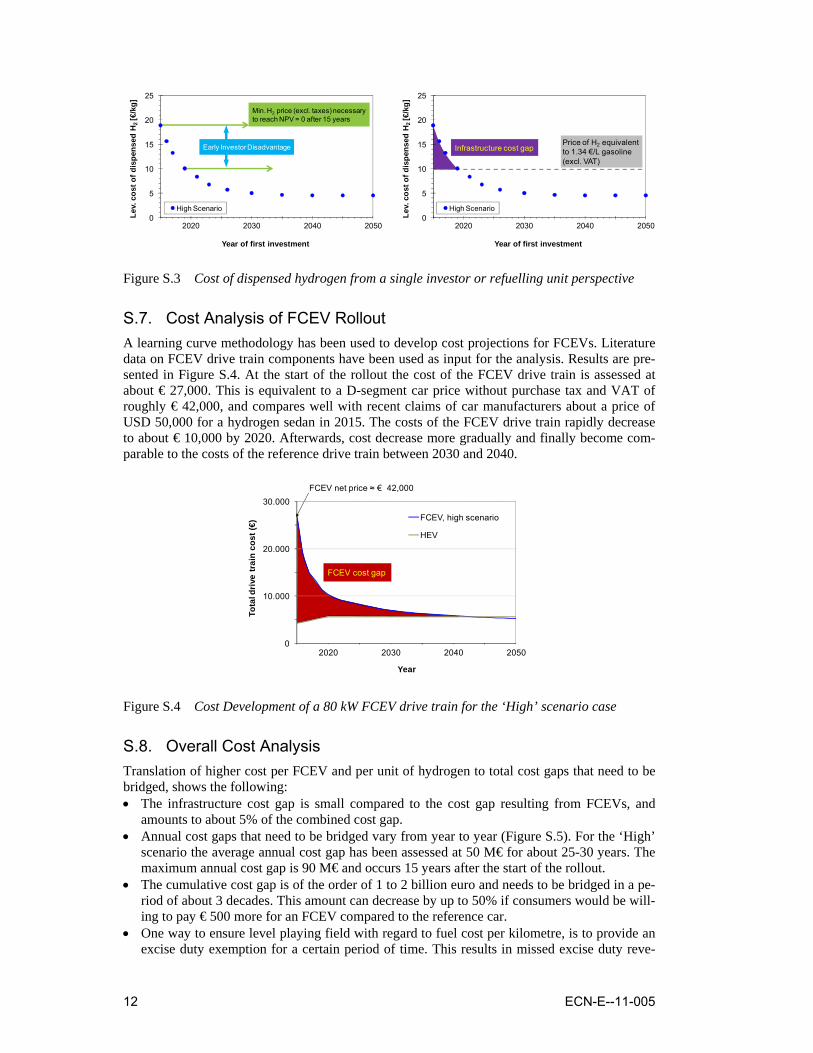
S.6. Cost Analysis of Refuelling Infrastructure Rollout Cost analysis of rollout scenarios is carried out for two perspectives: • The first perspective considers rollout of the refuelling infrastructure as a single big project. • The second perspective looks at (average) individual refuelling stations Results of the first approach show that during the whole rollout simulated, an average hydrogen price in the range of 4.5 to 5.9 €/kg (untaxed) is sufficient to cover all costs, and to break even at the end of the lifetime of all investments done up to 2050. This includes the cost of hydrogen production and delivery to the stations. In this study, the contribution of station forecourt cost is about 1.3 €/kg, which holds for a situation of full utilisation. Additional cost of up to 1.4 €/kg (from 4.5 to 5.9 €/kg) result from the overall level of station underutilisation in the scenarios simulated. The total average cost level is considerably lower than the current hydrogen equiva-lent price of gasoline which is the price that results in equal specific fuel cost (€/km) for gaso-line and hydrogen. The hydrogen equivalent price of gasoline is assessed at about 10 €/kg based on a price of gasoline excluding VAT, but including excise duty. These results shows that hy-drogen is viable and offers good prospects for a sound business case. Seen from the perspective of single refuelling units, costs look quite different. Due to high un-derutilisation of first stations, the initial cost of hydrogen are up to 5 times higher than the cost of hydrogen resulting from the overall analysis (Figure S.3). Initial cost exceed the ‘allowable’ hydrogen cost equivalent to the price of gasoline. Passing on the high cost to the consumer would render hydrogen unattractive. In addition, early investors perceive much higher cost and a higher risk factor than late investors, which benefit from decreasing cost of equipment and improvement of utilisation. So, while long-term prospects are good, the start-up period faces a serious hurdle that needs to be overcome through financial and other support mechanisms, and through coordinated action.
12 ECN-E--11-005
2020 2030 2040 20500
5
10
15
20
25
Lev.
cos
t of d
ispe
nsed
H2
[€/k
g]
Year of first investment
High Scenario
Early Investor Disadvantage
Min. H2 price (excl. taxes) necessary to reach NPV = 0 after 15 years
2020 2030 2040 20500
5
10
15
20
25
Lev.
cos
t of d
ispe
nsed
H2
[€/k
g]
Year of first investment
High Scenario
Price of H2 equivalent to 1.34 €/L gasoline (excl. VAT)
Infrastructure cost gap
Figure S.3 Cost of dispensed hydrogen from a single investor or refuelling unit perspective
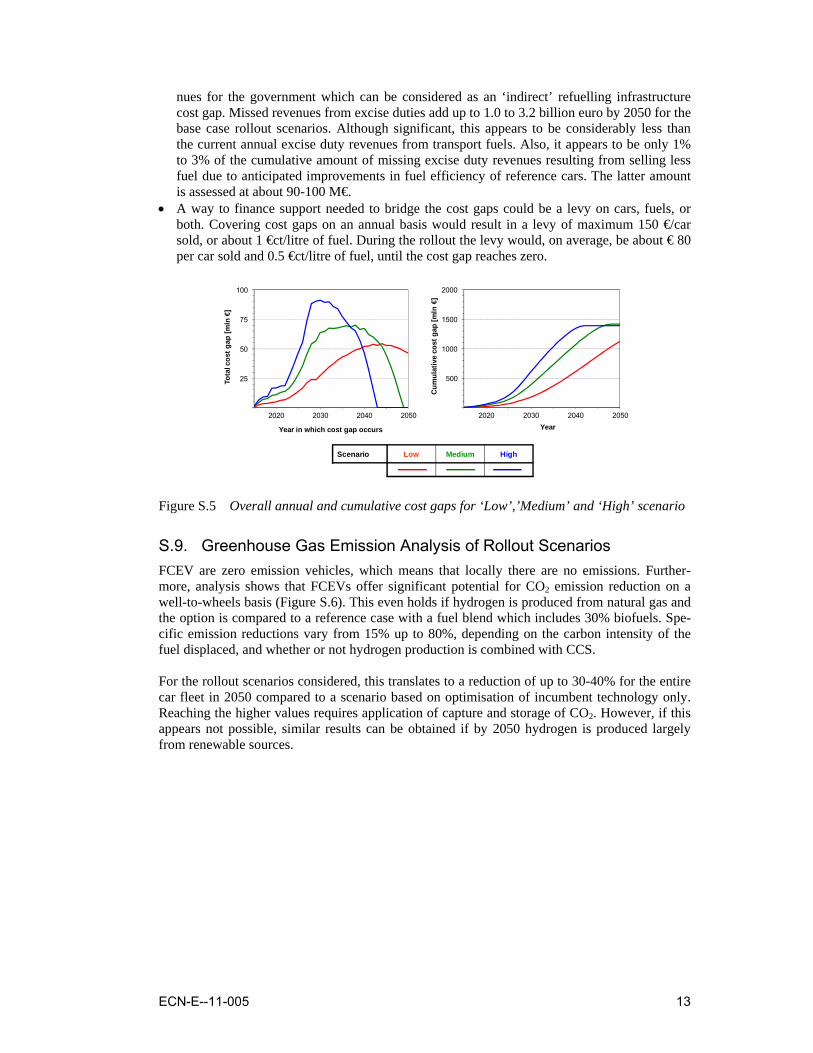
S.7. Cost Analysis of FCEV Rollout A learning curve methodology has been used to develop cost projections for FCEVs. Literature data on FCEV drive train components have been used as input for the analysis. Results are pre-sented in Figure S.4. At the start of the rollout the cost of the FCEV drive train is assessed at about € 27,000. This is equivalent to a D-segment car price without purchase tax and VAT of roughly € 42,000, and compares well with recent claims of car manufacturers about a price of USD 50,000 for a hydrogen sedan in 2015. The costs of the FCEV drive train rapidly decrease to about € 10,000 by 2020. Afterwards, cost decrease more gradually and finally become com-parable to the costs of the reference drive train between 2030 and 2040.
FCEV cost gap
FCEV net price ≈ € 42,000
2020 2030 2040 20500
10.000
20.000
30.000
Tota
l driv
e tr
ain
cost
(€)
Year
FCEV, high scenario
HEV
Figure S.4 Cost Development of a 80 kW FCEV drive train for the ‘High’ scenario case
S.8. Overall Cost Analysis Translation of higher cost per FCEV and per unit of hydrogen to total cost gaps that need to be bridged, shows the following: • The infrastructure cost gap is small compared to the cost gap resulting from FCEVs, and
amounts to about 5% of the combined cost gap. • Annual cost gaps that need to be bridged vary from year to year (Figure S.5). For the ‘High’
scenario the average annual cost gap has been assessed at 50 M€ for about 25-30 years. The maximum annual cost gap is 90 M€ and occurs 15 years after the start of the rollout.
• The cumulative cost gap is of the order of 1 to 2 billion euro and needs to be bridged in a pe-riod of about 3 decades. This amount can decrease by up to 50% if consumers would be will-ing to pay € 500 more for an FCEV compared to the reference car.
• One way to ensure level playing field with regard to fuel cost per kilometre, is to provide an excise duty exemption for a certain period of time. This results in missed excise duty reve-
ECN-E--11-005 13
nues for the government which can be considered as an ‘indirect’ refuelling infrastructure cost gap. Missed revenues from excise duties add up to 1.0 to 3.2 billion euro by 2050 for the base case rollout scenarios. Although significant, this appears to be considerably less than the current annual excise duty revenues from transport fuels. Also, it appears to be only 1% to 3% of the cumulative amount of missing excise duty revenues resulting from selling less fuel due to anticipated improvements in fuel efficiency of reference cars. The latter amount is assessed at about 90-100 M€.
• A way to finance support needed to bridge the cost gaps could be a levy on cars, fuels, or both. Covering cost gaps on an annual basis would result in a levy of maximum 150 €/car sold, or about 1 €ct/litre of fuel. During the rollout the levy would, on average, be about € 80 per car sold and 0.5 €ct/litre of fuel, until the cost gap reaches zero.
Scenario Low Medium High
2020 2030 2040 2050
25
50
75
100
Tota
l cos
t gap
[mln
€]
Year in which cost gap occurs
2020 2030 2040 2050
500
1000
1500
2000
Cum
ulat
ive
cost
gap
[mln
€]
Year
Figure S.5 Overall annual and cumulative cost gaps for ‘Low’,’Medium’ and ‘High’ scenario
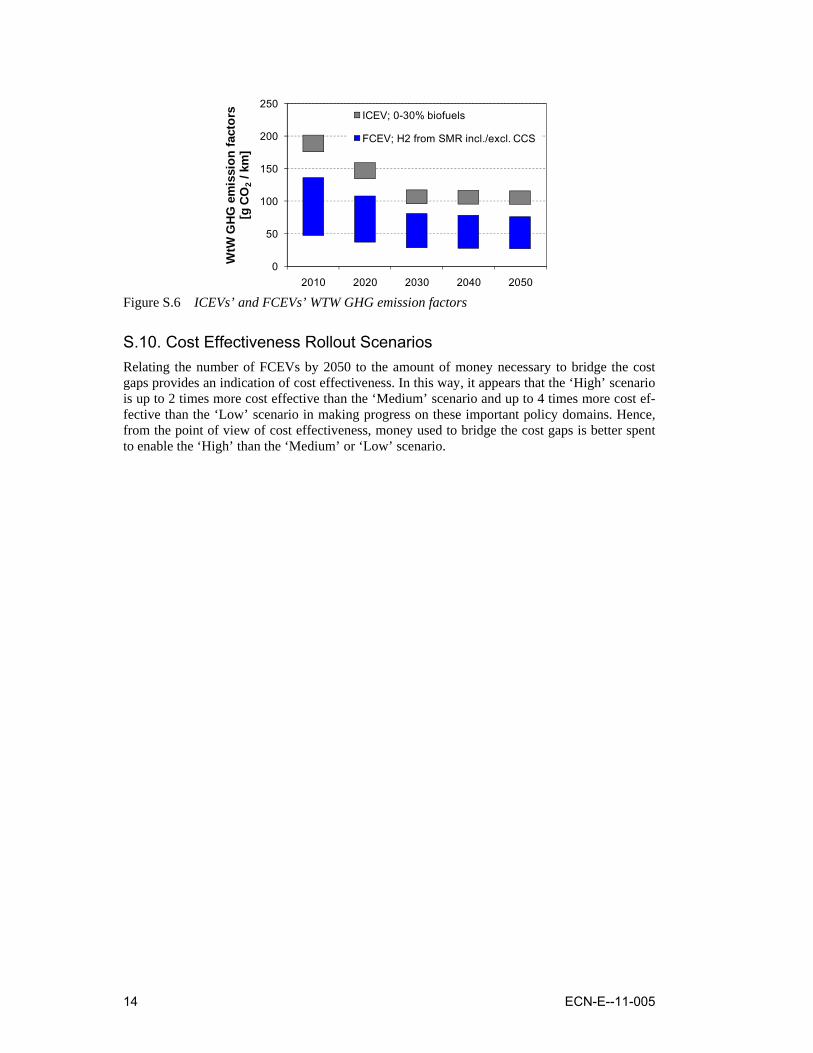
S.9. Greenhouse Gas Emission Analysis of Rollout Scenarios FCEV are zero emission vehicles, which means that locally there are no emissions. Further-more, analysis shows that FCEVs offer significant potential for CO2 emission reduction on a well-to-wheels basis (Figure S.6). This even holds if hydrogen is produced from natural gas and the option is compared to a reference case with a fuel blend which includes 30% biofuels. Spe-cific emission reductions vary from 15% up to 80%, depending on the carbon intensity of the fuel displaced, and whether or not hydrogen production is combined with CCS. For the rollout scenarios considered, this translates to a reduction of up to 30-40% for the entire car fleet in 2050 compared to a scenario based on optimisation of incumbent technology only. Reaching the higher values requires application of capture and storage of CO2. However, if this appears not possible, similar results can be obtained if by 2050 hydrogen is produced largely from renewable sources.
14 ECN-E--11-005
0
50
100
150
200
250
2010 2020 2030 2040 2050
WtW
GH
G e
mis
sion
fact
ors
[g C
O2
/ km
]
ICEV; 0-30% biofuels
FCEV; H2 from SMR incl./excl. CCS
Figure S.6 ICEVs’ and FCEVs’ WTW GHG emission factors
S.10. Cost Effectiveness Rollout Scenarios Relating the number of FCEVs by 2050 to the amount of money necessary to bridge the cost gaps provides an indication of cost effectiveness. In this way, it appears that the ‘High’ scenario is up to 2 times more cost effective than the ‘Medium’ scenario and up to 4 times more cost ef-fective than the ‘Low’ scenario in making progress on these important policy domains. Hence, from the point of view of cost effectiveness, money used to bridge the cost gaps is better spent to enable the ‘High’ than the ‘Medium’ or ‘Low’ scenario.
ECN-E--11-005 15
1. Introduction
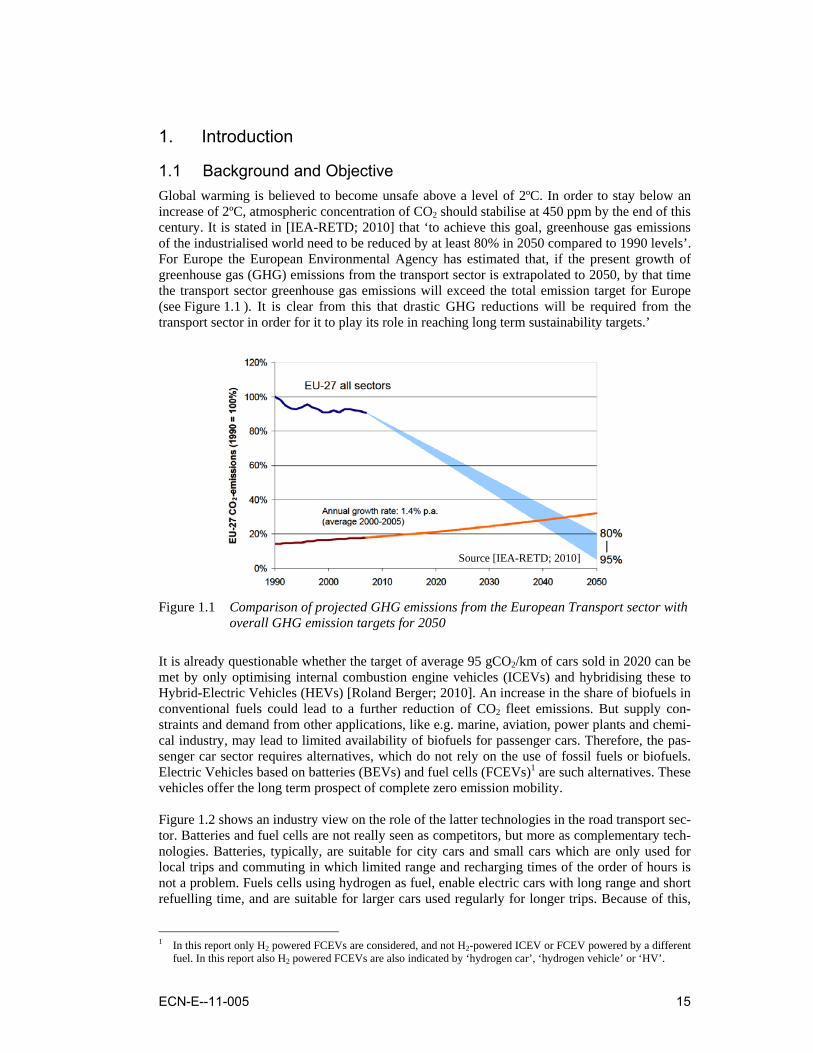
1.1 Background and Objective Global warming is believed to become unsafe above a level of 2ºC. In order to stay below an increase of 2ºC, atmospheric concentration of CO2 should stabilise at 450 ppm by the end of this century. It is stated in [IEA-RETD; 2010] that ‘to achieve this goal, greenhouse gas emissions of the industrialised world need to be reduced by at least 80% in 2050 compared to 1990 levels’. For Europe the European Environmental Agency has estimated that, if the present growth of greenhouse gas (GHG) emissions from the transport sector is extrapolated to 2050, by that time the transport sector greenhouse gas emissions will exceed the total emission target for Europe (see Figure 1.1 ). It is clear from this that drastic GHG reductions will be required from the transport sector in order for it to play its role in reaching long term sustainability targets.’
Figure 1.1 Comparison of projected GHG emissions from the European Transport sector with
overall GHG emission targets for 2050
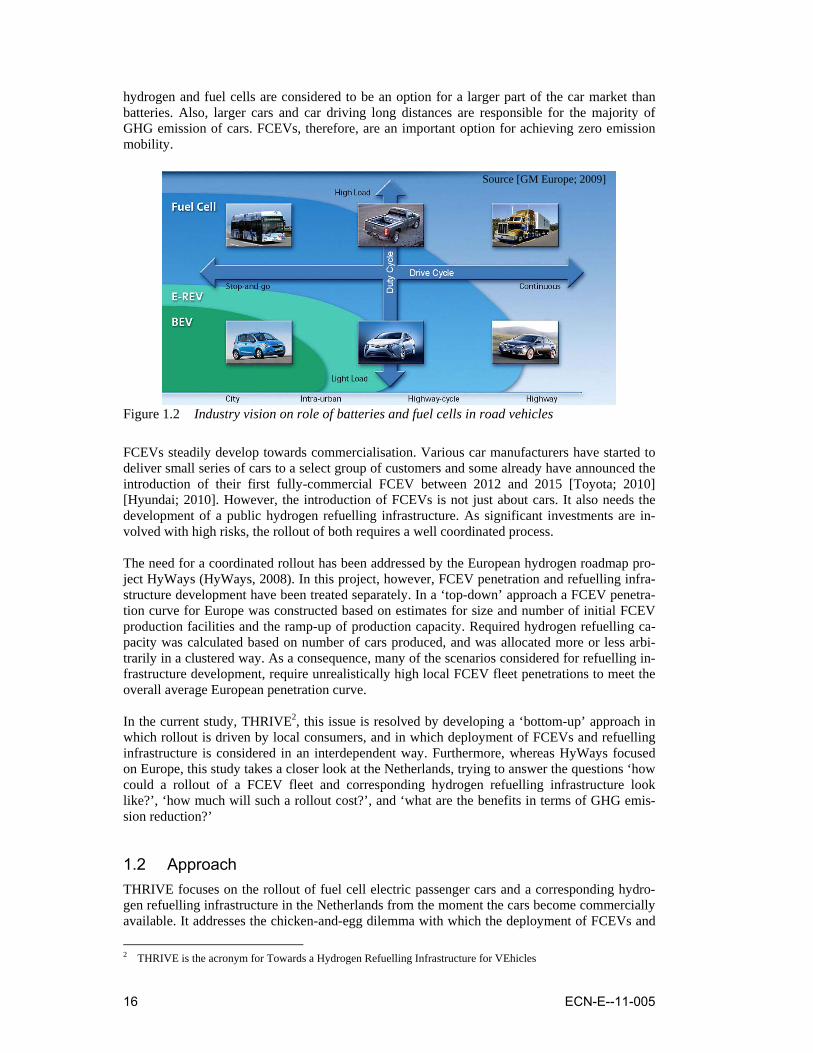
It is already questionable whether the target of average 95 gCO2/km of cars sold in 2020 can be met by only optimising internal combustion engine vehicles (ICEVs) and hybridising these to Hybrid-Electric Vehicles (HEVs) [Roland Berger; 2010]. An increase in the share of biofuels in conventional fuels could lead to a further reduction of CO2 fleet emissions. But supply con-straints and demand from other applications, like e.g. marine, aviation, power plants and chemi-cal industry, may lead to limited availability of biofuels for passenger cars. Therefore, the pas-senger car sector requires alternatives, which do not rely on the use of fossil fuels or biofuels. Electric Vehicles based on batteries (BEVs) and fuel cells (FCEVs)1 are such alternatives. These vehicles offer the long term prospect of complete zero emission mobility. Figure 1.2 shows an industry view on the role of the latter technologies in the road transport sec-tor. Batteries and fuel cells are not really seen as competitors, but more as complementary tech-nologies. Batteries, typically, are suitable for city cars and small cars which are only used for local trips and commuting in which limited range and recharging times of the order of hours is not a problem. Fuels cells using hydrogen as fuel, enable electric cars with long range and short refuelling time, and are suitable for larger cars used regularly for longer trips. Because of this,
1 In this report only H2 powered FCEVs are considered, and not H2-powered ICEV or FCEV powered by a different
fuel. In this report also H2 powered FCEVs are also indicated by ‘hydrogen car’, ‘hydrogen vehicle’ or ‘HV’.
Source [IEA-RETD; 2010]
16 ECN-E--11-005
hydrogen and fuel cells are considered to be an option for a larger part of the car market than batteries. Also, larger cars and car driving long distances are responsible for the majority of GHG emission of cars. FCEVs, therefore, are an important option for achieving zero emission mobility.
Figure 1.2 Industry vision on role of batteries and fuel cells in road vehicles
FCEVs steadily develop towards commercialisation. Various car manufacturers have started to deliver small series of cars to a select group of customers and some already have announced the introduction of their first fully-commercial FCEV between 2012 and 2015 [Toyota; 2010] [Hyundai; 2010]. However, the introduction of FCEVs is not just about cars. It also needs the development of a public hydrogen refuelling infrastructure. As significant investments are in-volved with high risks, the rollout of both requires a well coordinated process. The need for a coordinated rollout has been addressed by the European hydrogen roadmap pro-ject HyWays (HyWays, 2008). In this project, however, FCEV penetration and refuelling infra-structure development have been treated separately. In a ‘top-down’ approach a FCEV penetra-tion curve for Europe was constructed based on estimates for size and number of initial FCEV production facilities and the ramp-up of production capacity. Required hydrogen refuelling ca-pacity was calculated based on number of cars produced, and was allocated more or less arbi-trarily in a clustered way. As a consequence, many of the scenarios considered for refuelling in-frastructure development, require unrealistically high local FCEV fleet penetrations to meet the overall average European penetration curve. In the current study, THRIVE2, this issue is resolved by developing a ‘bottom-up’ approach in which rollout is driven by local consumers, and in which deployment of FCEVs and refuelling infrastructure is considered in an interdependent way. Furthermore, whereas HyWays focused on Europe, this study takes a closer look at the Netherlands, trying to answer the questions ‘how could a rollout of a FCEV fleet and corresponding hydrogen refuelling infrastructure look like?’, ‘how much will such a rollout cost?’, and ‘what are the benefits in terms of GHG emis-sion reduction?’
1.2 Approach THRIVE focuses on the rollout of fuel cell electric passenger cars and a corresponding hydro-gen refuelling infrastructure in the Netherlands from the moment the cars become commercially available. It addresses the chicken-and-egg dilemma with which the deployment of FCEVs and
2 THRIVE is the acronym for Towards a Hydrogen Refuelling Infrastructure for VEhicles
Source [GM Europe; 2009]
ECN-E--11-005 17
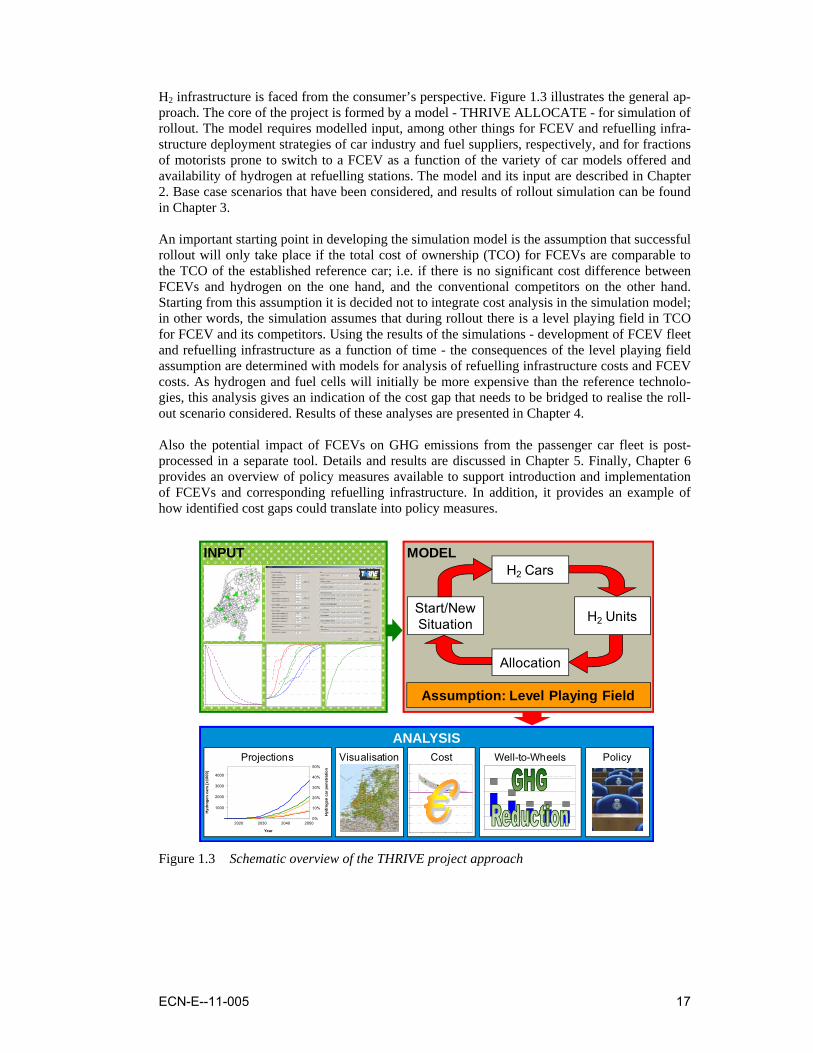
H2 infrastructure is faced from the consumer’s perspective. Figure 1.3 illustrates the general ap-proach. The core of the project is formed by a model - THRIVE ALLOCATE - for simulation of rollout. The model requires modelled input, among other things for FCEV and refuelling infra-structure deployment strategies of car industry and fuel suppliers, respectively, and for fractions of motorists prone to switch to a FCEV as a function of the variety of car models offered and availability of hydrogen at refuelling stations. The model and its input are described in Chapter 2. Base case scenarios that have been considered, and results of rollout simulation can be found in Chapter 3. An important starting point in developing the simulation model is the assumption that successful rollout will only take place if the total cost of ownership (TCO) for FCEVs are comparable to the TCO of the established reference car; i.e. if there is no significant cost difference between FCEVs and hydrogen on the one hand, and the conventional competitors on the other hand. Starting from this assumption it is decided not to integrate cost analysis in the simulation model; in other words, the simulation assumes that during rollout there is a level playing field in TCO for FCEV and its competitors. Using the results of the simulations - development of FCEV fleet and refuelling infrastructure as a function of time - the consequences of the level playing field assumption are determined with models for analysis of refuelling infrastructure costs and FCEV costs. As hydrogen and fuel cells will initially be more expensive than the reference technolo-gies, this analysis gives an indication of the cost gap that needs to be bridged to realise the roll-out scenario considered. Results of these analyses are presented in Chapter 4. Also the potential impact of FCEVs on GHG emissions from the passenger car fleet is post-processed in a separate tool. Details and results are discussed in Chapter 5. Finally, Chapter 6 provides an overview of policy measures available to support introduction and implementation of FCEVs and corresponding refuelling infrastructure. In addition, it provides an example of how identified cost gaps could translate into policy measures.
ANALYSISPolicyCost Well-to-Wheels
ICE - 0-30% biofuels
H2 - SMR, incl / excl CCS
Projections
INPUT MODEL
2020 2030 2040 2050
1000
2000
3000
4000
Year
Hyd
roge
n ca
rs [x
1000
]
0%
10%
20%
30%
40%
50%
Hyd
roge
n ca
r pen
etra
tion
Visualisation
H2 Units
Allocation
Start/New Situation
H2 Cars
Assumption: Level Playing Field
Figure 1.3 Schematic overview of the THRIVE project approach
18 ECN-E--11-005
2. Rollout of Hydrogen Cars and Refuelling Infrastructure
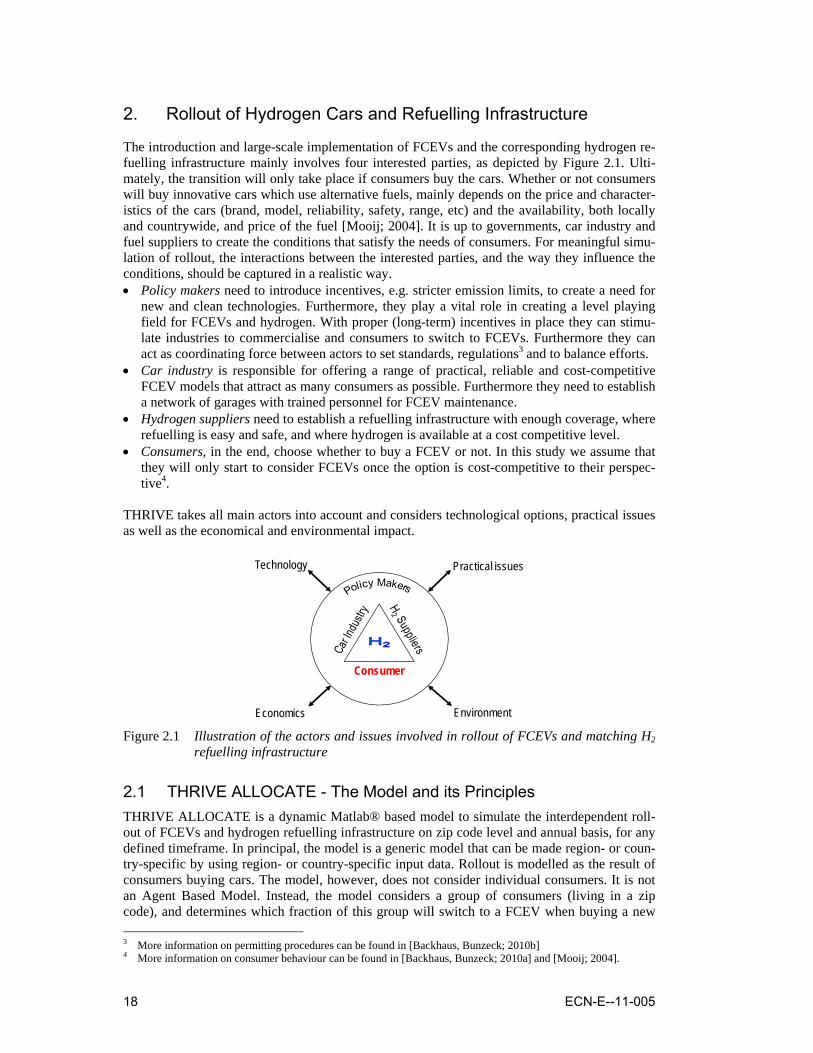
The introduction and large-scale implementation of FCEVs and the corresponding hydrogen re-fuelling infrastructure mainly involves four interested parties, as depicted by Figure 2.1. Ulti-mately, the transition will only take place if consumers buy the cars. Whether or not consumers will buy innovative cars which use alternative fuels, mainly depends on the price and character-istics of the cars (brand, model, reliability, safety, range, etc) and the availability, both locally and countrywide, and price of the fuel [Mooij; 2004]. It is up to governments, car industry and fuel suppliers to create the conditions that satisfy the needs of consumers. For meaningful simu-lation of rollout, the interactions between the interested parties, and the way they influence the conditions, should be captured in a realistic way. • Policy makers need to introduce incentives, e.g. stricter emission limits, to create a need for
new and clean technologies. Furthermore, they play a vital role in creating a level playing field for FCEVs and hydrogen. With proper (long-term) incentives in place they can stimu-late industries to commercialise and consumers to switch to FCEVs. Furthermore they can act as coordinating force between actors to set standards, regulations3 and to balance efforts.
• Car industry is responsible for offering a range of practical, reliable and cost-competitive FCEV models that attract as many consumers as possible. Furthermore they need to establish a network of garages with trained personnel for FCEV maintenance.
• Hydrogen suppliers need to establish a refuelling infrastructure with enough coverage, where refuelling is easy and safe, and where hydrogen is available at a cost competitive level.
• Consumers, in the end, choose whether to buy a FCEV or not. In this study we assume that they will only start to consider FCEVs once the option is cost-competitive to their perspec-tive4.
THRIVE takes all main actors into account and considers technological options, practical issues as well as the economical and environmental impact.
Consumer
Practical issues
Environment
Technology
Economics Figure 2.1 Illustration of the actors and issues involved in rollout of FCEVs and matching H2
refuelling infrastructure
2.1 THRIVE ALLOCATE - The Model and its Principles THRIVE ALLOCATE is a dynamic Matlab® based model to simulate the interdependent roll-out of FCEVs and hydrogen refuelling infrastructure on zip code level and annual basis, for any defined timeframe. In principal, the model is a generic model that can be made region- or coun-try-specific by using region- or country-specific input data. Rollout is modelled as the result of consumers buying cars. The model, however, does not consider individual consumers. It is not an Agent Based Model. Instead, the model considers a group of consumers (living in a zip code), and determines which fraction of this group will switch to a FCEV when buying a new 3 More information on permitting procedures can be found in [Backhaus, Bunzeck; 2010b] 4 More information on consumer behaviour can be found in [Backhaus, Bunzeck; 2010a] and [Mooij; 2004].
ECN-E--11-005 19
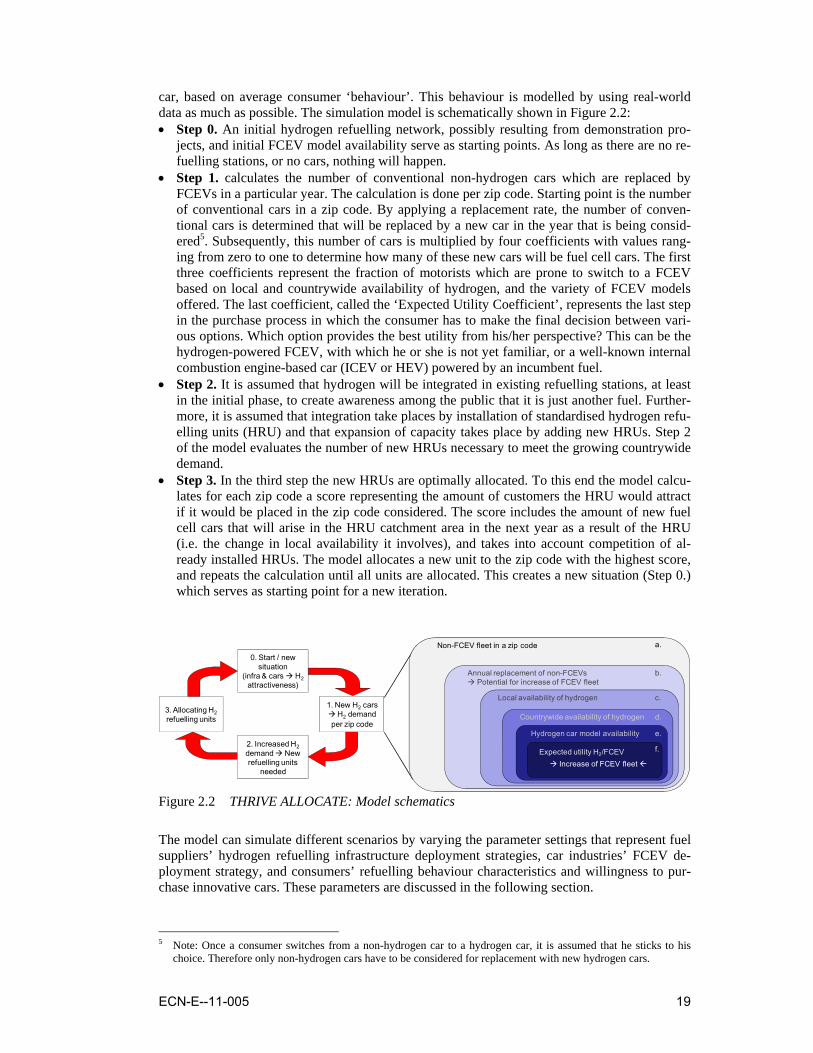
car, based on average consumer ‘behaviour’. This behaviour is modelled by using real-world data as much as possible. The simulation model is schematically shown in Figure 2.2: • Step 0. An initial hydrogen refuelling network, possibly resulting from demonstration pro-
jects, and initial FCEV model availability serve as starting points. As long as there are no re-fuelling stations, or no cars, nothing will happen.
• Step 1. calculates the number of conventional non-hydrogen cars which are replaced by FCEVs in a particular year. The calculation is done per zip code. Starting point is the number of conventional cars in a zip code. By applying a replacement rate, the number of conven-tional cars is determined that will be replaced by a new car in the year that is being consid-ered5. Subsequently, this number of cars is multiplied by four coefficients with values rang-ing from zero to one to determine how many of these new cars will be fuel cell cars. The first three coefficients represent the fraction of motorists which are prone to switch to a FCEV based on local and countrywide availability of hydrogen, and the variety of FCEV models offered. The last coefficient, called the ‘Expected Utility Coefficient’, represents the last step in the purchase process in which the consumer has to make the final decision between vari-ous options. Which option provides the best utility from his/her perspective? This can be the hydrogen-powered FCEV, with which he or she is not yet familiar, or a well-known internal combustion engine-based car (ICEV or HEV) powered by an incumbent fuel.
• Step 2. It is assumed that hydrogen will be integrated in existing refuelling stations, at least in the initial phase, to create awareness among the public that it is just another fuel. Further-more, it is assumed that integration take places by installation of standardised hydrogen refu-elling units (HRU) and that expansion of capacity takes place by adding new HRUs. Step 2 of the model evaluates the number of new HRUs necessary to meet the growing countrywide demand.
• Step 3. In the third step the new HRUs are optimally allocated. To this end the model calcu-lates for each zip code a score representing the amount of customers the HRU would attract if it would be placed in the zip code considered. The score includes the amount of new fuel cell cars that will arise in the HRU catchment area in the next year as a result of the HRU (i.e. the change in local availability it involves), and takes into account competition of al-ready installed HRUs. The model allocates a new unit to the zip code with the highest score, and repeats the calculation until all units are allocated. This creates a new situation (Step 0.) which serves as starting point for a new iteration.
1. New H2 cars H2 demand
per zip code
2. Increased H2demand New refuelling units
needed
3. Allocating H2refuelling units
0. Start / new situation
(infra & cars H2attractiveness)
Non-FCEV fleet in a zip code
Expected utility H2/FCEVIncrease of FCEV fleet
Hydrogen car model availability
Countrywide availability of hydrogen
Local availability of hydrogen
Annual replacement of non-FCEVsPotential for increase of FCEV fleet
a.
b.
c.
d.
e.
f.
Figure 2.2 THRIVE ALLOCATE: Model schematics
The model can simulate different scenarios by varying the parameter settings that represent fuel suppliers’ hydrogen refuelling infrastructure deployment strategies, car industries’ FCEV de-ployment strategy, and consumers’ refuelling behaviour characteristics and willingness to pur-chase innovative cars. These parameters are discussed in the following section.
5 Note: Once a consumer switches from a non-hydrogen car to a hydrogen car, it is assumed that he sticks to his
choice. Therefore only non-hydrogen cars have to be considered for replacement with new hydrogen cars.
20 ECN-E--11-005
2.2 Overview of Model Input and Parameters This paragraph describes required model input and available parameters to model behaviour and strategies of the main actors involved in the rollout of hydrogen and FCEVs. In addition, some general input data is required which is not specifically related to any of the main actors.
2.2.1 General Input Data
Current Number of Passenger Cars per Zip Code The spatial resolution considered in the rollout simulation model is the zip code level6. Data on the current number of cars per zip code are obtained from the Dutch Central Bureau of Statistics [CBS; 2008a]. Summing up the car fleet in each zip code results in the total car fleet in the Netherlands. Drive Times between Zip Codes Perception of local availability of hydrogen is related to the distance to the nearest hydrogen re-fuelling stations and the number of stations available. In the model refuelling stations are lo-cated in zip codes. To be able to determine the local availability of hydrogen the distance be-tween the zip code where people live and the zip codes with hydrogen refuelling stations must be known. The model measures distance in minutes, i.e. in drive time, and not kilometres. The data used in this study represent drive times between centres of the built-up area within the zip code areas [Postcode.nl; 2008]. Current Refuelling Station (RS) Network To maximise the chance for hydrogen and FCEVs to become a success, the option should match the current habits and routines of consumers as much as possible [Bunzeck et al.; 2010]. There-fore, the study assumes integration of hydrogen in existing refuelling stations rather than build-ing separate new hydrogen refuelling stations. Consequently, data on the current RS network, which consists of about 4300 stations, is used as input for rollout simulation. Data used includes zip code address, type of location (e.g. highway, urban transient, rural), dispensed fuel volume, fuel brand, fuels available at the station and whether or not there is space for expansion at the station [Catalist; 2008].
2.2.2 Government Policy Related Input and Parameters A number of policy actions are implicit in the simulation. The simulation of rollout itself al-ready assumes that there is a certain necessity to develop and deploy FCEVs. Policy measures play an important role in creating such a necessity. Furthermore, by neglecting cost in the simu-lation, it is assumed that policy measures are in place to assure FCEVs can compete with con-ventional cars. Parameters that can be used to model government policy more explicitly are: Annual Car Replacement Rate The annual maximum market potential for additional FCEVs is the total amount of cars sold each year. In the model, the maximum potential for additional FCEVs is calculated by multiply-
6 This study focuses on the Netherlands. Zip codes in the Netherlands are specified by four digits and two letters,
e.g. 1755 LE. The digits refer to a district. The letters refer to roads and streets within the district. The model only uses the digits, so the district level. Currently, the Netherlands is divided in more than 4000 four digit zip code ar-eas. With a total land surface area of almost 34,000 km2, the surface area of a zip code on average is about 8,5 km2. However, in cities and densely populated area, zip code surface areas are much smaller, whereas in rural ar-eas they can be much larger.
ECN-E--11-005 21
ing the conventional car fleet7 with the annual replacement rate. In this study, the latter parame-ter is defined as the ratio between cars sales in a certain year and the total car fleet size at the start of that year. The ratio between sales and fleet size fluctuates, but tends to decrease, repre-senting an increase in durability of cars. In the last 5 years of the period examined (through 2008), the ratio is almost constant at 1/15 [BOVAG, 2009]. This value is used as default in the model. Development of the Number of Passenger Cars The model offers the possibility to include a scenario for overall growth of the car fleet. In the current study, projections on development of car ownership have been included from a scenario study for the Netherlands up to 2040 [Hoen; 2006]. Data for a relatively ‘green’ scenario, called ‘Strong Europe’ have been used. In this scenario the car fleet grows from 7,5 million cars in 2010 to 9,7 million cars in 2040. In the roll-out model, at the start of the calculations for each new year, the car fleet in zip codes areas is first adjusted to the growing total car fleet assuming equal relative growth in all zip codes.
2.2.3 Consumer Related Input and Parameters
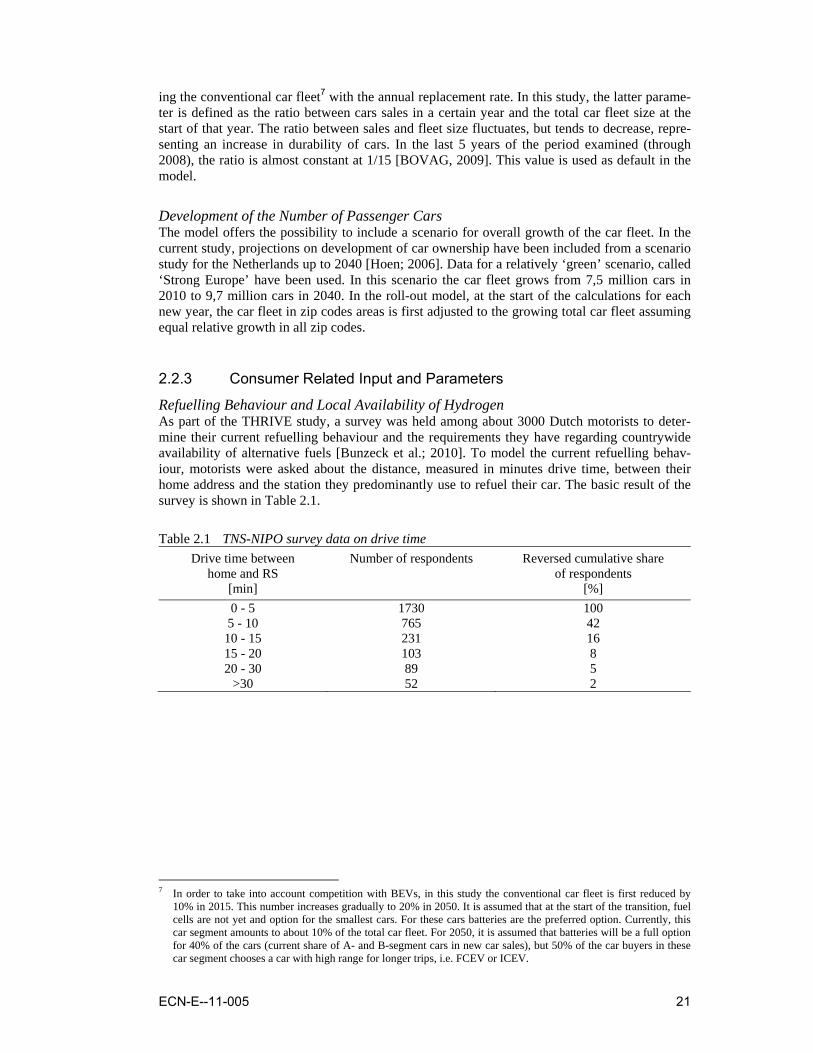
Refuelling Behaviour and Local Availability of Hydrogen As part of the THRIVE study, a survey was held among about 3000 Dutch motorists to deter-mine their current refuelling behaviour and the requirements they have regarding countrywide availability of alternative fuels [Bunzeck et al.; 2010]. To model the current refuelling behav-iour, motorists were asked about the distance, measured in minutes drive time, between their home address and the station they predominantly use to refuel their car. The basic result of the survey is shown in Table 2.1.
Table 2.1 TNS-NIPO survey data on drive time Drive time between
home and RS [min]
Number of respondents Reversed cumulative share of respondents
[%] 0 - 5 1730 100 5 - 10 765 42 10 - 15 231 16 15 - 20 103 8 20 - 30 89 5
>30 52 2
7 In order to take into account competition with BEVs, in this study the conventional car fleet is first reduced by
10% in 2015. This number increases gradually to 20% in 2050. It is assumed that at the start of the transition, fuel cells are not yet and option for the smallest cars. For these cars batteries are the preferred option. Currently, this car segment amounts to about 10% of the total car fleet. For 2050, it is assumed that batteries will be a full option for 40% of the cars (current share of A- and B-segment cars in new car sales), but 50% of the car buyers in these car segment chooses a car with high range for longer trips, i.e. FCEV or ICEV.
22 ECN-E--11-005
0%
25%
50%
75%
100%
0 10 20 30 40
Frac
tion
of m
otor
ists
Drive time from home to RS [min]
TNS-NIPO dataUsualEager
Figure 2.3 ‘Drive Time Function’; solid line - best fit of data points -, represents current
refuelling behaviour; dashed line represents modified behaviour (see also §3.2)
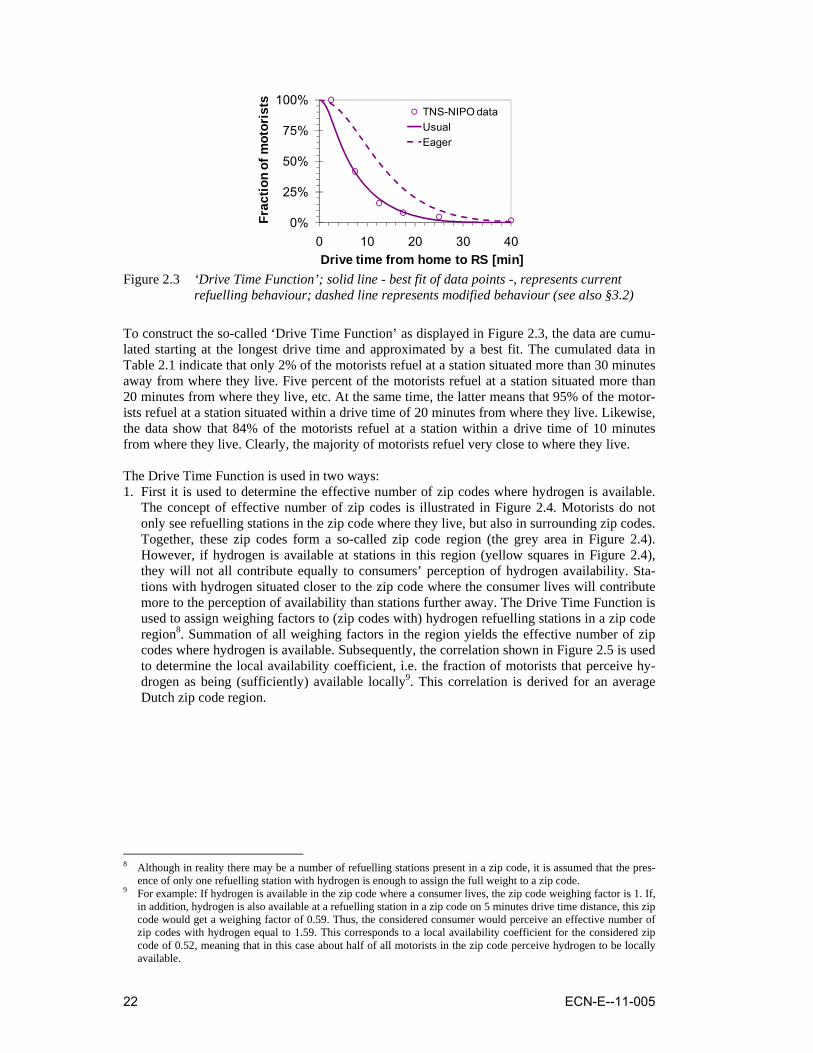
To construct the so-called ‘Drive Time Function’ as displayed in Figure 2.3, the data are cumu-lated starting at the longest drive time and approximated by a best fit. The cumulated data in Table 2.1 indicate that only 2% of the motorists refuel at a station situated more than 30 minutes away from where they live. Five percent of the motorists refuel at a station situated more than 20 minutes from where they live, etc. At the same time, the latter means that 95% of the motor-ists refuel at a station situated within a drive time of 20 minutes from where they live. Likewise, the data show that 84% of the motorists refuel at a station within a drive time of 10 minutes from where they live. Clearly, the majority of motorists refuel very close to where they live. The Drive Time Function is used in two ways: 1. First it is used to determine the effective number of zip codes where hydrogen is available.
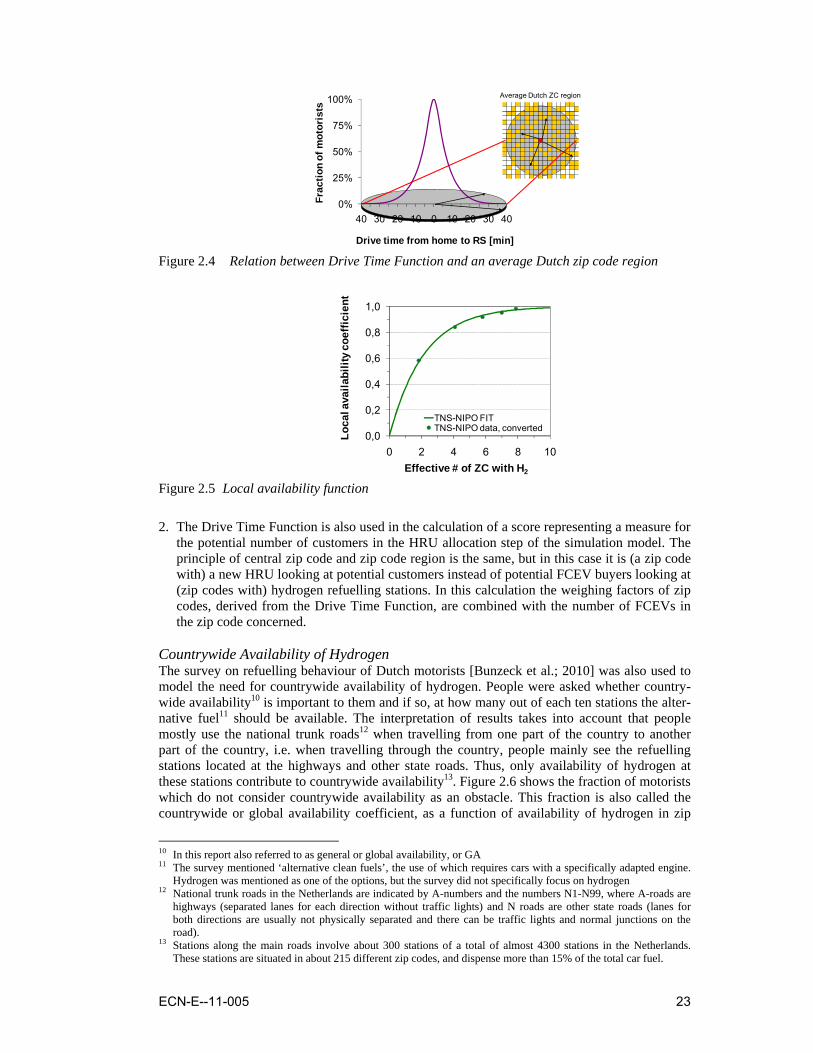
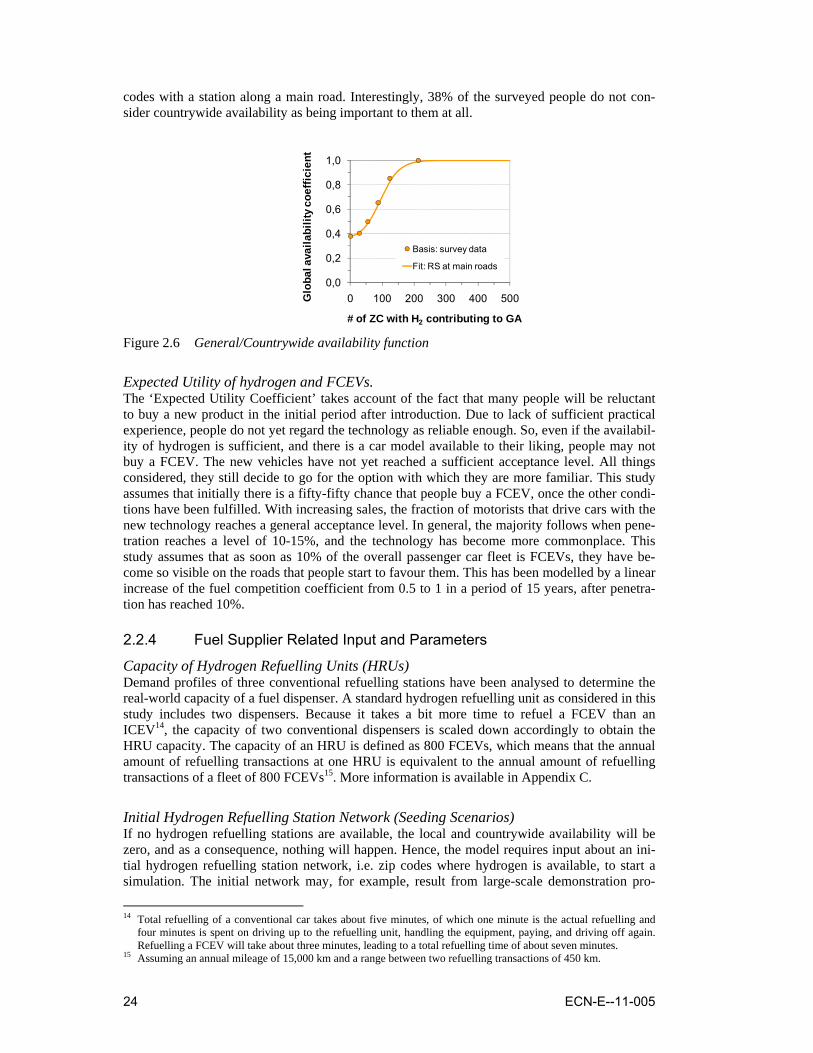
The concept of effective number of zip codes is illustrated in Figure 2.4. Motorists do not only see refuelling stations in the zip code where they live, but also in surrounding zip codes. Together, these zip codes form a so-called zip code region (the grey area in Figure 2.4). However, if hydrogen is available at stations in this region (yellow squares in Figure 2.4), they will not all contribute equally to consumers’ perception of hydrogen availability. Sta-tions with hydrogen situated closer to the zip code where the consumer lives will contribute more to the perception of availability than stations further away. The Drive Time Function is used to assign weighing factors to (zip codes with) hydrogen refuelling stations in a zip code region8. Summation of all weighing factors in the region yields the effective number of zip codes where hydrogen is available. Subsequently, the correlation shown in Figure 2.5 is used to determine the local availability coefficient, i.e. the fraction of motorists that perceive hy-drogen as being (sufficiently) available locally9. This correlation is derived for an average Dutch zip code region.
8 Although in reality there may be a number of refuelling stations present in a zip code, it is assumed that the pres-
ence of only one refuelling station with hydrogen is enough to assign the full weight to a zip code. 9 For example: If hydrogen is available in the zip code where a consumer lives, the zip code weighing factor is 1. If,
in addition, hydrogen is also available at a refuelling station in a zip code on 5 minutes drive time distance, this zip code would get a weighing factor of 0.59. Thus, the considered consumer would perceive an effective number of zip codes with hydrogen equal to 1.59. This corresponds to a local availability coefficient for the considered zip code of 0.52, meaning that in this case about half of all motorists in the zip code perceive hydrogen to be locally available.
ECN-E--11-005 23
Average Dutch ZC region
0%
25%
50%
75%
100%
40 30 20 10 0 10 20 30 40
Frac
tion
of m
otor
ists
Drive time from home to RS [min] Figure 2.4 Relation between Drive Time Function and an average Dutch zip code region
0,0
0,2
0,4
0,6
0,8
1,0
0 2 4 6 8 10
Loca
l ava
ilabi
lity
coef
ficie
nt
Effective # of ZC with H2
TNS-NIPO FITTNS-NIPO data, converted
Figure 2.5 Local availability function
2. The Drive Time Function is also used in the calculation of a score representing a measure for the potential number of customers in the HRU allocation step of the simulation model. The principle of central zip code and zip code region is the same, but in this case it is (a zip code with) a new HRU looking at potential customers instead of potential FCEV buyers looking at (zip codes with) hydrogen refuelling stations. In this calculation the weighing factors of zip codes, derived from the Drive Time Function, are combined with the number of FCEVs in the zip code concerned.
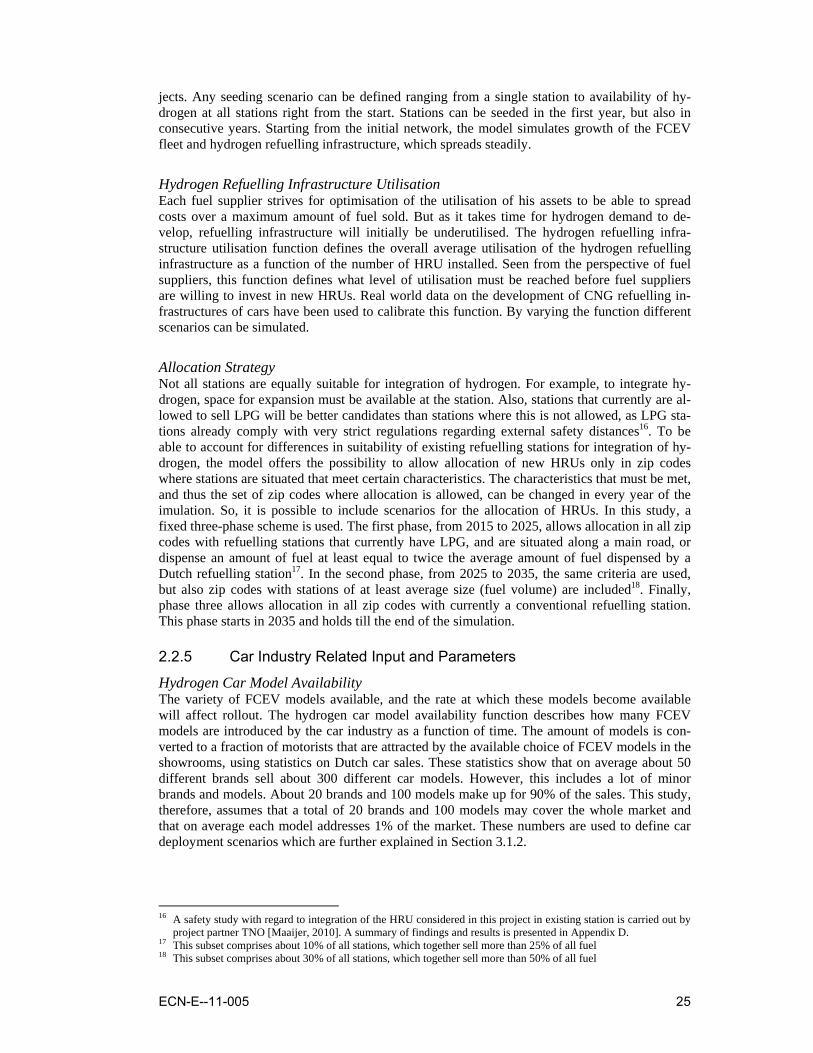
Countrywide Availability of Hydrogen The survey on refuelling behaviour of Dutch motorists [Bunzeck et al.; 2010] was also used to model the need for countrywide availability of hydrogen. People were asked whether country-wide availability10 is important to them and if so, at how many out of each ten stations the alter-native fuel11 should be available. The interpretation of results takes into account that people mostly use the national trunk roads12 when travelling from one part of the country to another part of the country, i.e. when travelling through the country, people mainly see the refuelling stations located at the highways and other state roads. Thus, only availability of hydrogen at these stations contribute to countrywide availability13. Figure 2.6 shows the fraction of motorists which do not consider countrywide availability as an obstacle. This fraction is also called the countrywide or global availability coefficient, as a function of availability of hydrogen in zip
10 In this report also referred to as general or global availability, or GA 11 The survey mentioned ‘alternative clean fuels’, the use of which requires cars with a specifically adapted engine.
Hydrogen was mentioned as one of the options, but the survey did not specifically focus on hydrogen 12 National trunk roads in the Netherlands are indicated by A-numbers and the numbers N1-N99, where A-roads are
highways (separated lanes for each direction without traffic lights) and N roads are other state roads (lanes for both directions are usually not physically separated and there can be traffic lights and normal junctions on the road).
13 Stations along the main roads involve about 300 stations of a total of almost 4300 stations in the Netherlands. These stations are situated in about 215 different zip codes, and dispense more than 15% of the total car fuel.
24 ECN-E--11-005
codes with a station along a main road. Interestingly, 38% of the surveyed people do not con-sider countrywide availability as being important to them at all.
0,0
0,2
0,4
0,6
0,8
1,0
0 100 200 300 400 500Glo
bal a
vaila
bilit
y co
effic
ient
# of ZC with H2 contributing to GA
Basis: survey data
Fit: RS at main roads
Figure 2.6 General/Countrywide availability function
Expected Utility of hydrogen and FCEVs. The ‘Expected Utility Coefficient’ takes account of the fact that many people will be reluctant to buy a new product in the initial period after introduction. Due to lack of sufficient practical experience, people do not yet regard the technology as reliable enough. So, even if the availabil-ity of hydrogen is sufficient, and there is a car model available to their liking, people may not buy a FCEV. The new vehicles have not yet reached a sufficient acceptance level. All things considered, they still decide to go for the option with which they are more familiar. This study assumes that initially there is a fifty-fifty chance that people buy a FCEV, once the other condi-tions have been fulfilled. With increasing sales, the fraction of motorists that drive cars with the new technology reaches a general acceptance level. In general, the majority follows when pene-tration reaches a level of 10-15%, and the technology has become more commonplace. This study assumes that as soon as 10% of the overall passenger car fleet is FCEVs, they have be-come so visible on the roads that people start to favour them. This has been modelled by a linear increase of the fuel competition coefficient from 0.5 to 1 in a period of 15 years, after penetra-tion has reached 10%.
2.2.4 Fuel Supplier Related Input and Parameters
Capacity of Hydrogen Refuelling Units (HRUs) Demand profiles of three conventional refuelling stations have been analysed to determine the real-world capacity of a fuel dispenser. A standard hydrogen refuelling unit as considered in this study includes two dispensers. Because it takes a bit more time to refuel a FCEV than an ICEV14, the capacity of two conventional dispensers is scaled down accordingly to obtain the HRU capacity. The capacity of an HRU is defined as 800 FCEVs, which means that the annual amount of refuelling transactions at one HRU is equivalent to the annual amount of refuelling transactions of a fleet of 800 FCEVs15. More information is available in Appendix C. Initial Hydrogen Refuelling Station Network (Seeding Scenarios) If no hydrogen refuelling stations are available, the local and countrywide availability will be zero, and as a consequence, nothing will happen. Hence, the model requires input about an ini-tial hydrogen refuelling station network, i.e. zip codes where hydrogen is available, to start a simulation. The initial network may, for example, result from large-scale demonstration pro-
14 Total refuelling of a conventional car takes about five minutes, of which one minute is the actual refuelling and
four minutes is spent on driving up to the refuelling unit, handling the equipment, paying, and driving off again. Refuelling a FCEV will take about three minutes, leading to a total refuelling time of about seven minutes.
15 Assuming an annual mileage of 15,000 km and a range between two refuelling transactions of 450 km.
ECN-E--11-005 25
jects. Any seeding scenario can be defined ranging from a single station to availability of hy-drogen at all stations right from the start. Stations can be seeded in the first year, but also in consecutive years. Starting from the initial network, the model simulates growth of the FCEV fleet and hydrogen refuelling infrastructure, which spreads steadily. Hydrogen Refuelling Infrastructure Utilisation Each fuel supplier strives for optimisation of the utilisation of his assets to be able to spread costs over a maximum amount of fuel sold. But as it takes time for hydrogen demand to de-velop, refuelling infrastructure will initially be underutilised. The hydrogen refuelling infra-structure utilisation function defines the overall average utilisation of the hydrogen refuelling infrastructure as a function of the number of HRU installed. Seen from the perspective of fuel suppliers, this function defines what level of utilisation must be reached before fuel suppliers are willing to invest in new HRUs. Real world data on the development of CNG refuelling in-frastructures of cars have been used to calibrate this function. By varying the function different scenarios can be simulated. Allocation Strategy Not all stations are equally suitable for integration of hydrogen. For example, to integrate hy-drogen, space for expansion must be available at the station. Also, stations that currently are al-lowed to sell LPG will be better candidates than stations where this is not allowed, as LPG sta-tions already comply with very strict regulations regarding external safety distances16. To be able to account for differences in suitability of existing refuelling stations for integration of hy-drogen, the model offers the possibility to allow allocation of new HRUs only in zip codes where stations are situated that meet certain characteristics. The characteristics that must be met, and thus the set of zip codes where allocation is allowed, can be changed in every year of the imulation. So, it is possible to include scenarios for the allocation of HRUs. In this study, a fixed three-phase scheme is used. The first phase, from 2015 to 2025, allows allocation in all zip codes with refuelling stations that currently have LPG, and are situated along a main road, or dispense an amount of fuel at least equal to twice the average amount of fuel dispensed by a Dutch refuelling station17. In the second phase, from 2025 to 2035, the same criteria are used, but also zip codes with stations of at least average size (fuel volume) are included18. Finally, phase three allows allocation in all zip codes with currently a conventional refuelling station. This phase starts in 2035 and holds till the end of the simulation.
2.2.5 Car Industry Related Input and Parameters
Hydrogen Car Model Availability The variety of FCEV models available, and the rate at which these models become available will affect rollout. The hydrogen car model availability function describes how many FCEV models are introduced by the car industry as a function of time. The amount of models is con-verted to a fraction of motorists that are attracted by the available choice of FCEV models in the showrooms, using statistics on Dutch car sales. These statistics show that on average about 50 different brands sell about 300 different car models. However, this includes a lot of minor brands and models. About 20 brands and 100 models make up for 90% of the sales. This study, therefore, assumes that a total of 20 brands and 100 models may cover the whole market and that on average each model addresses 1% of the market. These numbers are used to define car deployment scenarios which are further explained in Section 3.1.2.
16 A safety study with regard to integration of the HRU considered in this project in existing station is carried out by
project partner TNO [Maaijer, 2010]. A summary of findings and results is presented in Appendix D. 17 This subset comprises about 10% of all stations, which together sell more than 25% of all fuel 18 This subset comprises about 30% of all stations, which together sell more than 50% of all fuel
26 ECN-E--11-005
3. Rollout Scenarios and Results
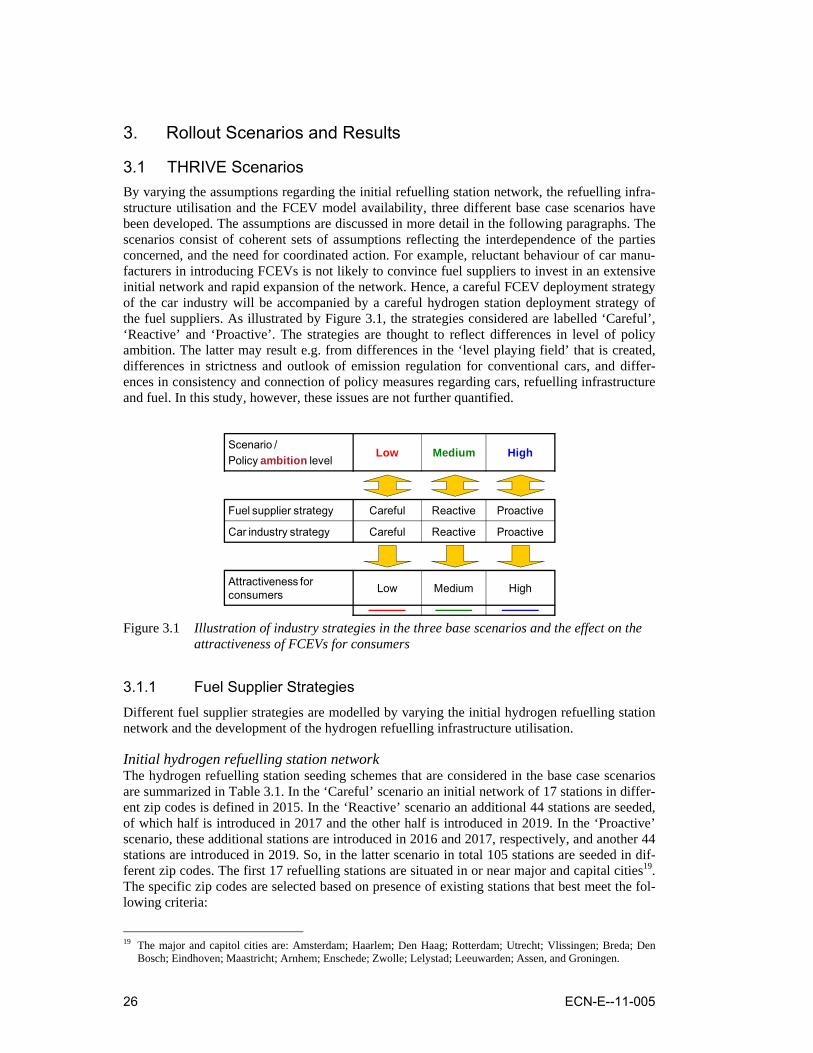
3.1 THRIVE Scenarios By varying the assumptions regarding the initial refuelling station network, the refuelling infra-structure utilisation and the FCEV model availability, three different base case scenarios have been developed. The assumptions are discussed in more detail in the following paragraphs. The scenarios consist of coherent sets of assumptions reflecting the interdependence of the parties concerned, and the need for coordinated action. For example, reluctant behaviour of car manu-facturers in introducing FCEVs is not likely to convince fuel suppliers to invest in an extensive initial network and rapid expansion of the network. Hence, a careful FCEV deployment strategy of the car industry will be accompanied by a careful hydrogen station deployment strategy of the fuel suppliers. As illustrated by Figure 3.1, the strategies considered are labelled ‘Careful’, ‘Reactive’ and ‘Proactive’. The strategies are thought to reflect differences in level of policy ambition. The latter may result e.g. from differences in the ‘level playing field’ that is created, differences in strictness and outlook of emission regulation for conventional cars, and differ-ences in consistency and connection of policy measures regarding cars, refuelling infrastructure and fuel. In this study, however, these issues are not further quantified.
Scenario / Policy ambition level
Low Medium High
Attractiveness for consumers Low Medium High
Fuel supplier strategy Careful Reactive Proactive
Car industry strategy Careful Reactive Proactive
Figure 3.1 Illustration of industry strategies in the three base scenarios and the effect on the
attractiveness of FCEVs for consumers
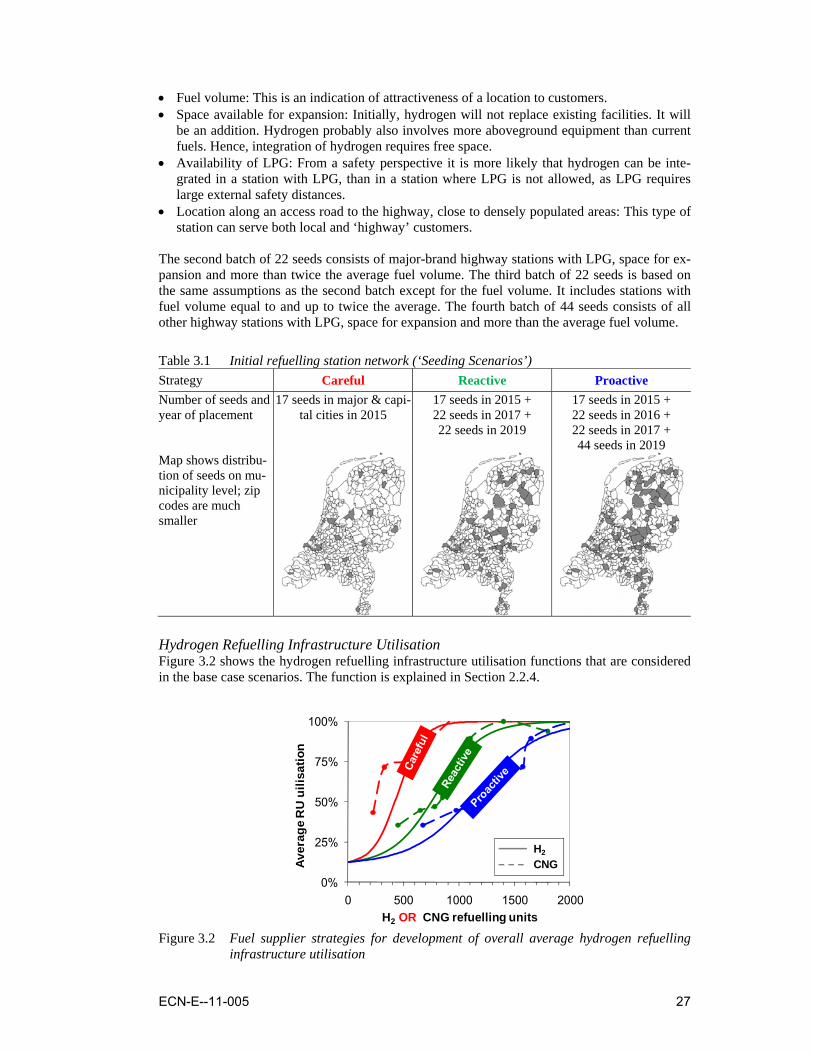
3.1.1 Fuel Supplier Strategies Different fuel supplier strategies are modelled by varying the initial hydrogen refuelling station network and the development of the hydrogen refuelling infrastructure utilisation. Initial hydrogen refuelling station network The hydrogen refuelling station seeding schemes that are considered in the base case scenarios are summarized in Table 3.1. In the ‘Careful’ scenario an initial network of 17 stations in differ-ent zip codes is defined in 2015. In the ‘Reactive’ scenario an additional 44 stations are seeded, of which half is introduced in 2017 and the other half is introduced in 2019. In the ‘Proactive’ scenario, these additional stations are introduced in 2016 and 2017, respectively, and another 44 stations are introduced in 2019. So, in the latter scenario in total 105 stations are seeded in dif-ferent zip codes. The first 17 refuelling stations are situated in or near major and capital cities19. The specific zip codes are selected based on presence of existing stations that best meet the fol-lowing criteria:
19 The major and capitol cities are: Amsterdam; Haarlem; Den Haag; Rotterdam; Utrecht; Vlissingen; Breda; Den
Bosch; Eindhoven; Maastricht; Arnhem; Enschede; Zwolle; Lelystad; Leeuwarden; Assen, and Groningen.
ECN-E--11-005 27
• Fuel volume: This is an indication of attractiveness of a location to customers. • Space available for expansion: Initially, hydrogen will not replace existing facilities. It will
be an addition. Hydrogen probably also involves more aboveground equipment than current fuels. Hence, integration of hydrogen requires free space.
• Availability of LPG: From a safety perspective it is more likely that hydrogen can be inte-grated in a station with LPG, than in a station where LPG is not allowed, as LPG requires large external safety distances.
• Location along an access road to the highway, close to densely populated areas: This type of station can serve both local and ‘highway’ customers.
The second batch of 22 seeds consists of major-brand highway stations with LPG, space for ex-pansion and more than twice the average fuel volume. The third batch of 22 seeds is based on the same assumptions as the second batch except for the fuel volume. It includes stations with fuel volume equal to and up to twice the average. The fourth batch of 44 seeds consists of all other highway stations with LPG, space for expansion and more than the average fuel volume.
Table 3.1 Initial refuelling station network (‘Seeding Scenarios’) Strategy Careful Reactive Proactive Number of seeds and year of placement
17 seeds in major & capi-tal cities in 2015
17 seeds in 2015 + 22 seeds in 2017 + 22 seeds in 2019
17 seeds in 2015 + 22 seeds in 2016 + 22 seeds in 2017 + 44 seeds in 2019
Map shows distribu-tion of seeds on mu-nicipality level; zip codes are much smaller
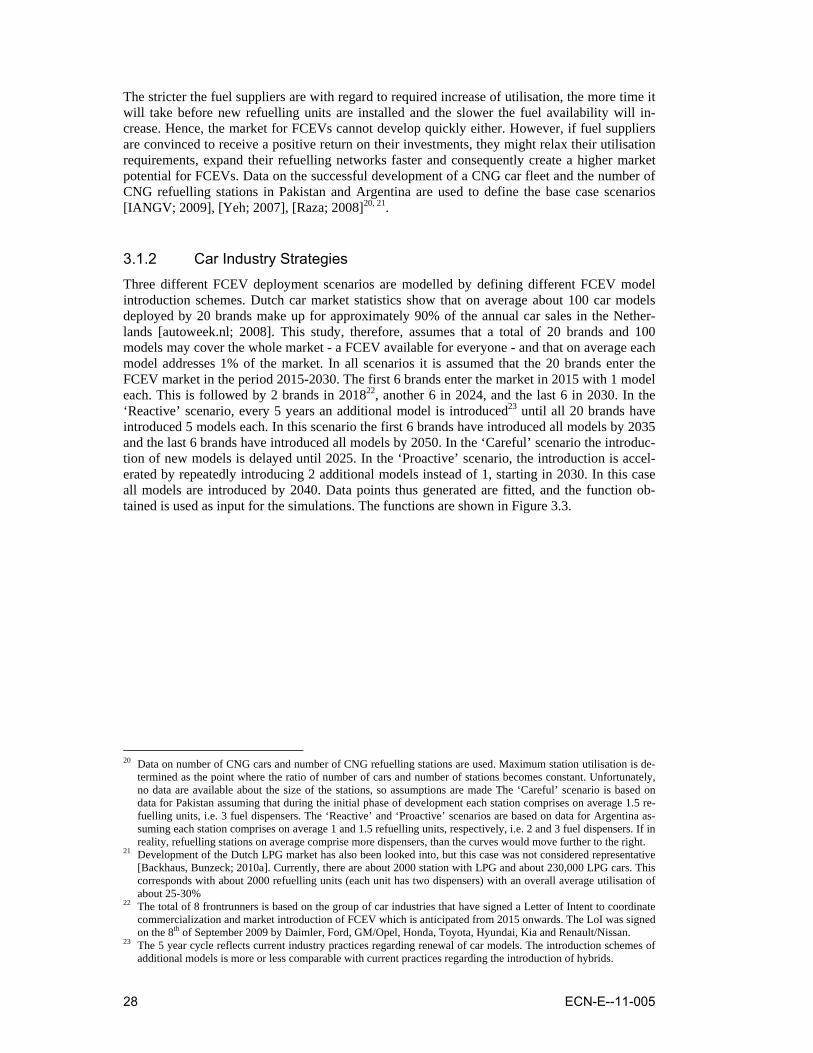
Hydrogen Refuelling Infrastructure Utilisation Figure 3.2 shows the hydrogen refuelling infrastructure utilisation functions that are considered in the base case scenarios. The function is explained in Section 2.2.4.
0%
25%
50%
75%
100%
0 500 1000 1500 2000
Aver
age
RU
uili
satio
n
H2 OR CNG refuelling units
H2
CNG
Figure 3.2 Fuel supplier strategies for development of overall average hydrogen refuelling
infrastructure utilisation
28 ECN-E--11-005
The stricter the fuel suppliers are with regard to required increase of utilisation, the more time it will take before new refuelling units are installed and the slower the fuel availability will in-crease. Hence, the market for FCEVs cannot develop quickly either. However, if fuel suppliers are convinced to receive a positive return on their investments, they might relax their utilisation requirements, expand their refuelling networks faster and consequently create a higher market potential for FCEVs. Data on the successful development of a CNG car fleet and the number of CNG refuelling stations in Pakistan and Argentina are used to define the base case scenarios [IANGV; 2009], [Yeh; 2007], [Raza; 2008]20, 21.
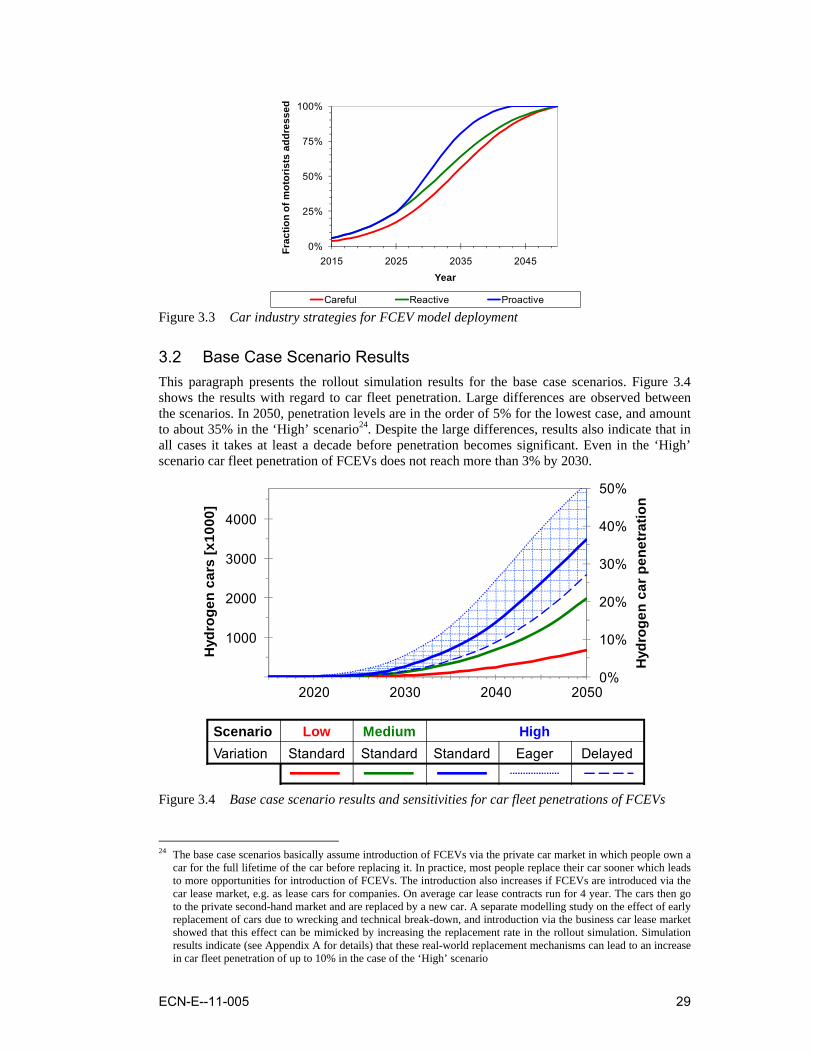
3.1.2 Car Industry Strategies Three different FCEV deployment scenarios are modelled by defining different FCEV model introduction schemes. Dutch car market statistics show that on average about 100 car models deployed by 20 brands make up for approximately 90% of the annual car sales in the Nether-lands [autoweek.nl; 2008]. This study, therefore, assumes that a total of 20 brands and 100 models may cover the whole market - a FCEV available for everyone - and that on average each model addresses 1% of the market. In all scenarios it is assumed that the 20 brands enter the FCEV market in the period 2015-2030. The first 6 brands enter the market in 2015 with 1 model each. This is followed by 2 brands in 201822, another 6 in 2024, and the last 6 in 2030. In the ‘Reactive’ scenario, every 5 years an additional model is introduced23 until all 20 brands have introduced 5 models each. In this scenario the first 6 brands have introduced all models by 2035 and the last 6 brands have introduced all models by 2050. In the ‘Careful’ scenario the introduc-tion of new models is delayed until 2025. In the ‘Proactive’ scenario, the introduction is accel-erated by repeatedly introducing 2 additional models instead of 1, starting in 2030. In this case all models are introduced by 2040. Data points thus generated are fitted, and the function ob-tained is used as input for the simulations. The functions are shown in Figure 3.3.
20 Data on number of CNG cars and number of CNG refuelling stations are used. Maximum station utilisation is de-
termined as the point where the ratio of number of cars and number of stations becomes constant. Unfortunately, no data are available about the size of the stations, so assumptions are made The ‘Careful’ scenario is based on data for Pakistan assuming that during the initial phase of development each station comprises on average 1.5 re-fuelling units, i.e. 3 fuel dispensers. The ‘Reactive’ and ‘Proactive’ scenarios are based on data for Argentina as-suming each station comprises on average 1 and 1.5 refuelling units, respectively, i.e. 2 and 3 fuel dispensers. If in reality, refuelling stations on average comprise more dispensers, than the curves would move further to the right.
21 Development of the Dutch LPG market has also been looked into, but this case was not considered representative [Backhaus, Bunzeck; 2010a]. Currently, there are about 2000 station with LPG and about 230,000 LPG cars. This corresponds with about 2000 refuelling units (each unit has two dispensers) with an overall average utilisation of about 25-30%
22 The total of 8 frontrunners is based on the group of car industries that have signed a Letter of Intent to coordinate commercialization and market introduction of FCEV which is anticipated from 2015 onwards. The LoI was signed on the 8th of September 2009 by Daimler, Ford, GM/Opel, Honda, Toyota, Hyundai, Kia and Renault/Nissan.
23 The 5 year cycle reflects current industry practices regarding renewal of car models. The introduction schemes of additional models is more or less comparable with current practices regarding the introduction of hybrids.
ECN-E--11-005 29
0%
25%
50%
75%
100%
2015 2025 2035 2045
Frac
tion
of m
otor
ists
add
ress
edYear
Careful Reactive Proactive Figure 3.3 Car industry strategies for FCEV model deployment
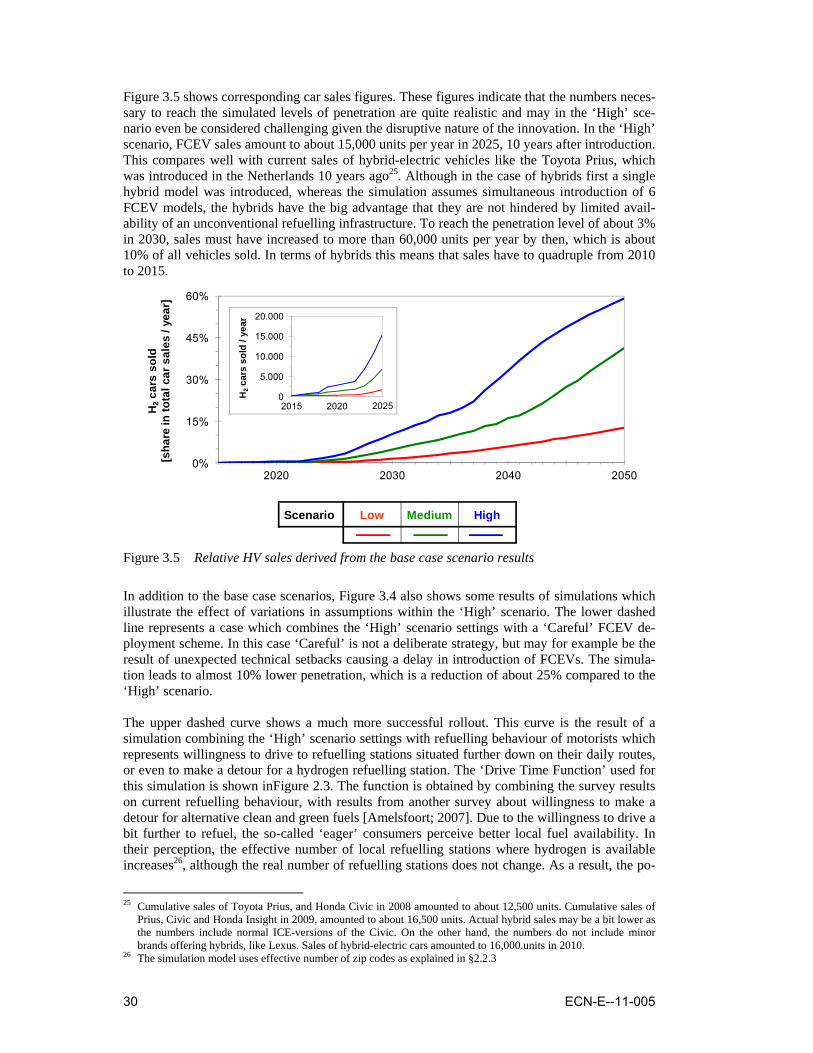
3.2 Base Case Scenario Results This paragraph presents the rollout simulation results for the base case scenarios. Figure 3.4 shows the results with regard to car fleet penetration. Large differences are observed between the scenarios. In 2050, penetration levels are in the order of 5% for the lowest case, and amount to about 35% in the ‘High’ scenario24. Despite the large differences, results also indicate that in all cases it takes at least a decade before penetration becomes significant. Even in the ‘High’ scenario car fleet penetration of FCEVs does not reach more than 3% by 2030.
2020 2030 2040 20500%
10%
20%
30%
40%
50%
1000
2000
3000
4000
Hyd
roge
n ca
r pen
etra
tion
Hyd
roge
n ca
rs [x
1000
]
Scenario Low Medium HighVariation Standard Standard Standard Eager Delayed
Figure 3.4 Base case scenario results and sensitivities for car fleet penetrations of FCEVs
24 The base case scenarios basically assume introduction of FCEVs via the private car market in which people own a
car for the full lifetime of the car before replacing it. In practice, most people replace their car sooner which leads to more opportunities for introduction of FCEVs. The introduction also increases if FCEVs are introduced via the car lease market, e.g. as lease cars for companies. On average car lease contracts run for 4 year. The cars then go to the private second-hand market and are replaced by a new car. A separate modelling study on the effect of early replacement of cars due to wrecking and technical break-down, and introduction via the business car lease market showed that this effect can be mimicked by increasing the replacement rate in the rollout simulation. Simulation results indicate (see Appendix A for details) that these real-world replacement mechanisms can lead to an increase in car fleet penetration of up to 10% in the case of the ‘High’ scenario
30 ECN-E--11-005
Figure 3.5 shows corresponding car sales figures. These figures indicate that the numbers neces-sary to reach the simulated levels of penetration are quite realistic and may in the ‘High’ sce-nario even be considered challenging given the disruptive nature of the innovation. In the ‘High’ scenario, FCEV sales amount to about 15,000 units per year in 2025, 10 years after introduction. This compares well with current sales of hybrid-electric vehicles like the Toyota Prius, which was introduced in the Netherlands 10 years ago25. Although in the case of hybrids first a single hybrid model was introduced, whereas the simulation assumes simultaneous introduction of 6 FCEV models, the hybrids have the big advantage that they are not hindered by limited avail-ability of an unconventional refuelling infrastructure. To reach the penetration level of about 3% in 2030, sales must have increased to more than 60,000 units per year by then, which is about 10% of all vehicles sold. In terms of hybrids this means that sales have to quadruple from 2010 to 2015.
Scenario Low Medium High
2020 2030 2040 20500%
15%
30%
45%
60%
H2
cars
sol
d[s
hare
in to
tal c
ar s
ales
/ ye
ar]
2015 2020 20250
5.000
10.000
15.000
20.000
H2
cars
sol
d / y
ear
Figure 3.5 Relative HV sales derived from the base case scenario results
In addition to the base case scenarios, Figure 3.4 also shows some results of simulations which illustrate the effect of variations in assumptions within the ‘High’ scenario. The lower dashed line represents a case which combines the ‘High’ scenario settings with a ‘Careful’ FCEV de-ployment scheme. In this case ‘Careful’ is not a deliberate strategy, but may for example be the result of unexpected technical setbacks causing a delay in introduction of FCEVs. The simula-tion leads to almost 10% lower penetration, which is a reduction of about 25% compared to the ‘High’ scenario. The upper dashed curve shows a much more successful rollout. This curve is the result of a simulation combining the ‘High’ scenario settings with refuelling behaviour of motorists which represents willingness to drive to refuelling stations situated further down on their daily routes, or even to make a detour for a hydrogen refuelling station. The ‘Drive Time Function’ used for this simulation is shown inFigure 2.3. The function is obtained by combining the survey results on current refuelling behaviour, with results from another survey about willingness to make a detour for alternative clean and green fuels [Amelsfoort; 2007]. Due to the willingness to drive a bit further to refuel, the so-called ‘eager’ consumers perceive better local fuel availability. In their perception, the effective number of local refuelling stations where hydrogen is available increases26, although the real number of refuelling stations does not change. As a result, the po-
25 Cumulative sales of Toyota Prius, and Honda Civic in 2008 amounted to about 12,500 units. Cumulative sales of
Prius, Civic and Honda Insight in 2009, amounted to about 16,500 units. Actual hybrid sales may be a bit lower as the numbers include normal ICE-versions of the Civic. On the other hand, the numbers do not include minor brands offering hybrids, like Lexus. Sales of hybrid-electric cars amounted to 16,000.units in 2010.
26 The simulation model uses effective number of zip codes as explained in §2.2.3
ECN-E--11-005 31
tential market increases and rollout will develop more rapidly. The simulation indicates that the effect is potentially quite large. Results show doubling of penetration in 2030 to about 5%. Fi-nally, penetration reaches more than 50% in 2050, which is an increase by about 40% compared to the ‘High’ scenario. Of course, the big question is whether people will change their behaviour voluntarily, and if not, which incentives are necessary to get them to change the refuelling be-haviour they are used to, and they are comfortable with. If changing the consumer appears to be difficult, one might decide to extend the initial network to boost rollout. A simulation with an increase from 105 to more than 350 initial stations shows an increase in penetration of 7% in 2050 compared to the ‘High’ scenario. Further details on the effect of changes in parameter settings in relation to the ‘High’ scenario can be found in Appen-dix A. Overall simulation results suggest that by 2050 about 35-40% of all cars could be hydro-gen-powered FCEVs if technical performance of FCEVs proves to be comparable to conven-tional cars and sufficient incentives are introduced. This might increase to more than 50% if consumers are willing to adapt their refuelling behaviour to the initially limited availability of hydrogen. Low Scenario High Scenario
2020 2020
2035 2035
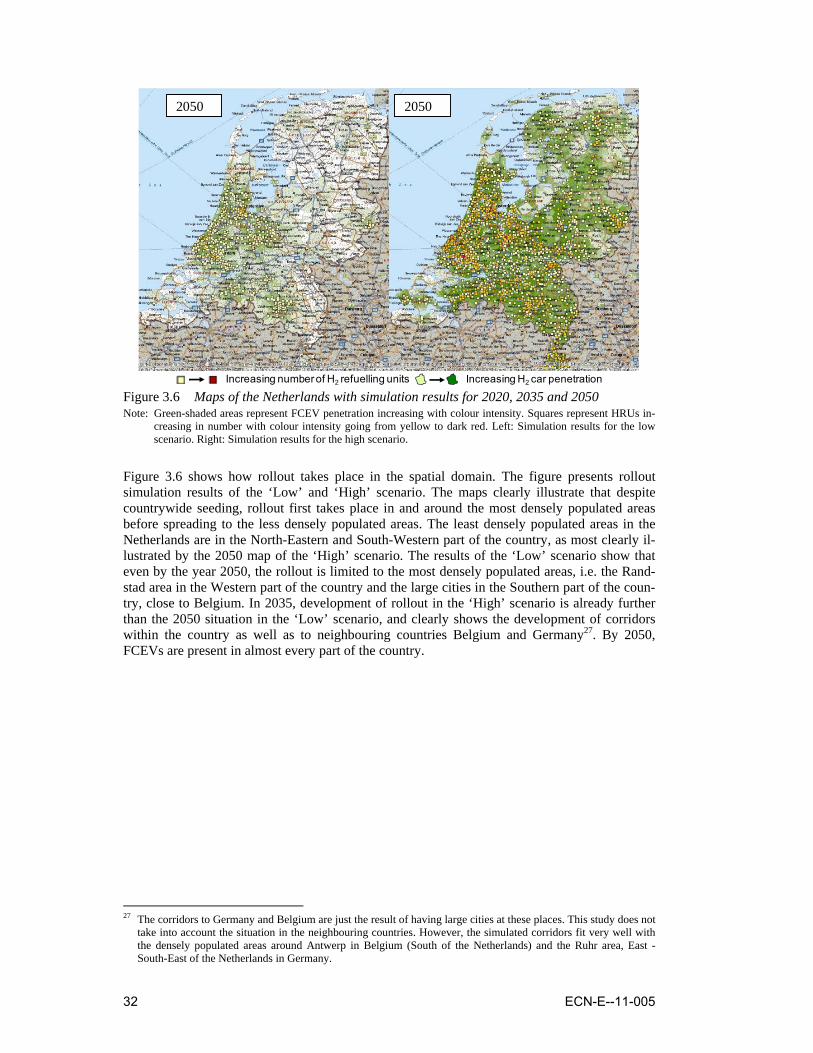
32 ECN-E--11-005
Increasing number of H2 refuelling units Increasing H2 car penetration
Figure 3.6 Maps of the Netherlands with simulation results for 2020, 2035 and 2050 Note: Green-shaded areas represent FCEV penetration increasing with colour intensity. Squares represent HRUs in-
creasing in number with colour intensity going from yellow to dark red. Left: Simulation results for the low scenario. Right: Simulation results for the high scenario.
Figure 3.6 shows how rollout takes place in the spatial domain. The figure presents rollout simulation results of the ‘Low’ and ‘High’ scenario. The maps clearly illustrate that despite countrywide seeding, rollout first takes place in and around the most densely populated areas before spreading to the less densely populated areas. The least densely populated areas in the Netherlands are in the North-Eastern and South-Western part of the country, as most clearly il-lustrated by the 2050 map of the ‘High’ scenario. The results of the ‘Low’ scenario show that even by the year 2050, the rollout is limited to the most densely populated areas, i.e. the Rand-stad area in the Western part of the country and the large cities in the Southern part of the coun-try, close to Belgium. In 2035, development of rollout in the ‘High’ scenario is already further than the 2050 situation in the ‘Low’ scenario, and clearly shows the development of corridors within the country as well as to neighbouring countries Belgium and Germany27. By 2050, FCEVs are present in almost every part of the country.
27 The corridors to Germany and Belgium are just the result of having large cities at these places. This study does not
take into account the situation in the neighbouring countries. However, the simulated corridors fit very well with the densely populated areas around Antwerp in Belgium (South of the Netherlands) and the Ruhr area, East - South-East of the Netherlands in Germany.
20502050
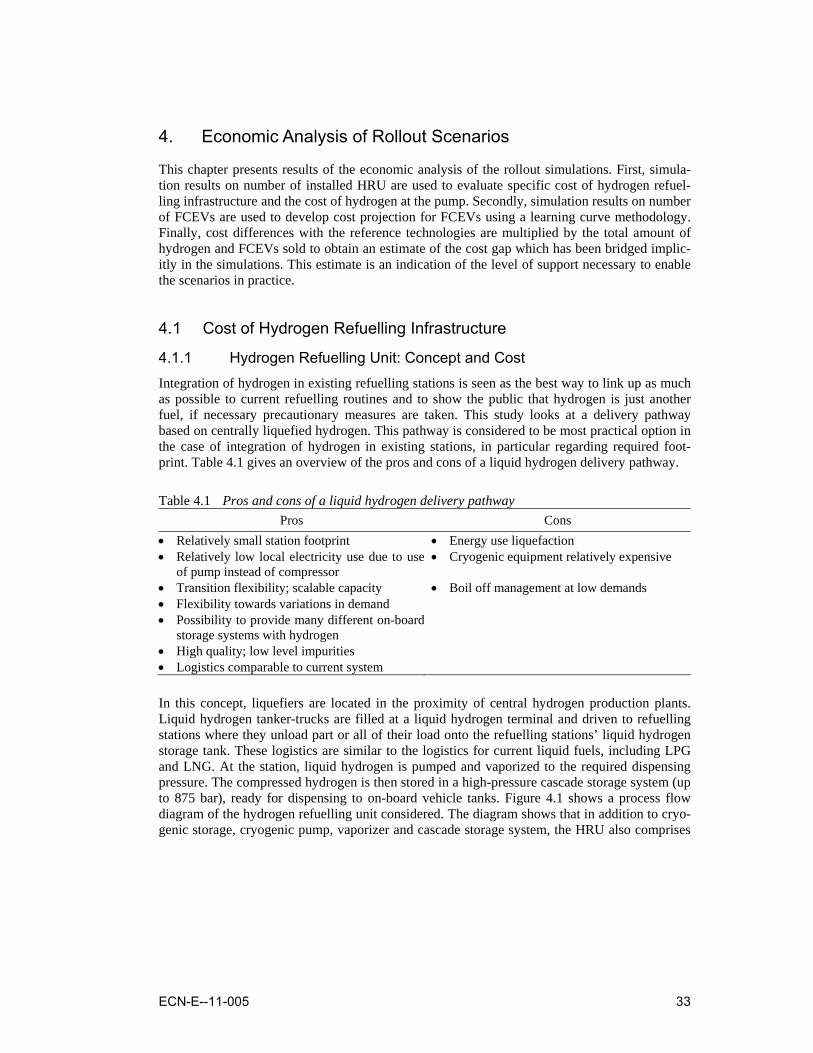
ECN-E--11-005 33
4. Economic Analysis of Rollout Scenarios
This chapter presents results of the economic analysis of the rollout simulations. First, simula-tion results on number of installed HRU are used to evaluate specific cost of hydrogen refuel-ling infrastructure and the cost of hydrogen at the pump. Secondly, simulation results on number of FCEVs are used to develop cost projection for FCEVs using a learning curve methodology. Finally, cost differences with the reference technologies are multiplied by the total amount of hydrogen and FCEVs sold to obtain an estimate of the cost gap which has been bridged implic-itly in the simulations. This estimate is an indication of the level of support necessary to enable the scenarios in practice.
4.1 Cost of Hydrogen Refuelling Infrastructure
4.1.1 Hydrogen Refuelling Unit: Concept and Cost Integration of hydrogen in existing refuelling stations is seen as the best way to link up as much as possible to current refuelling routines and to show the public that hydrogen is just another fuel, if necessary precautionary measures are taken. This study looks at a delivery pathway based on centrally liquefied hydrogen. This pathway is considered to be most practical option in the case of integration of hydrogen in existing stations, in particular regarding required foot-print. Table 4.1 gives an overview of the pros and cons of a liquid hydrogen delivery pathway.
Table 4.1 Pros and cons of a liquid hydrogen delivery pathway Pros Cons
• Relatively small station footprint • Energy use liquefaction • Relatively low local electricity use due to use
of pump instead of compressor • Cryogenic equipment relatively expensive
• Transition flexibility; scalable capacity • Boil off management at low demands • Flexibility towards variations in demand • Possibility to provide many different on-board
storage systems with hydrogen • High quality; low level impurities • Logistics comparable to current system In this concept, liquefiers are located in the proximity of central hydrogen production plants. Liquid hydrogen tanker-trucks are filled at a liquid hydrogen terminal and driven to refuelling stations where they unload part or all of their load onto the refuelling stations’ liquid hydrogen storage tank. These logistics are similar to the logistics for current liquid fuels, including LPG and LNG. At the station, liquid hydrogen is pumped and vaporized to the required dispensing pressure. The compressed hydrogen is then stored in a high-pressure cascade storage system (up to 875 bar), ready for dispensing to on-board vehicle tanks. Figure 4.1 shows a process flow diagram of the hydrogen refuelling unit considered. The diagram shows that in addition to cryo-genic storage, cryogenic pump, vaporizer and cascade storage system, the HRU also comprises
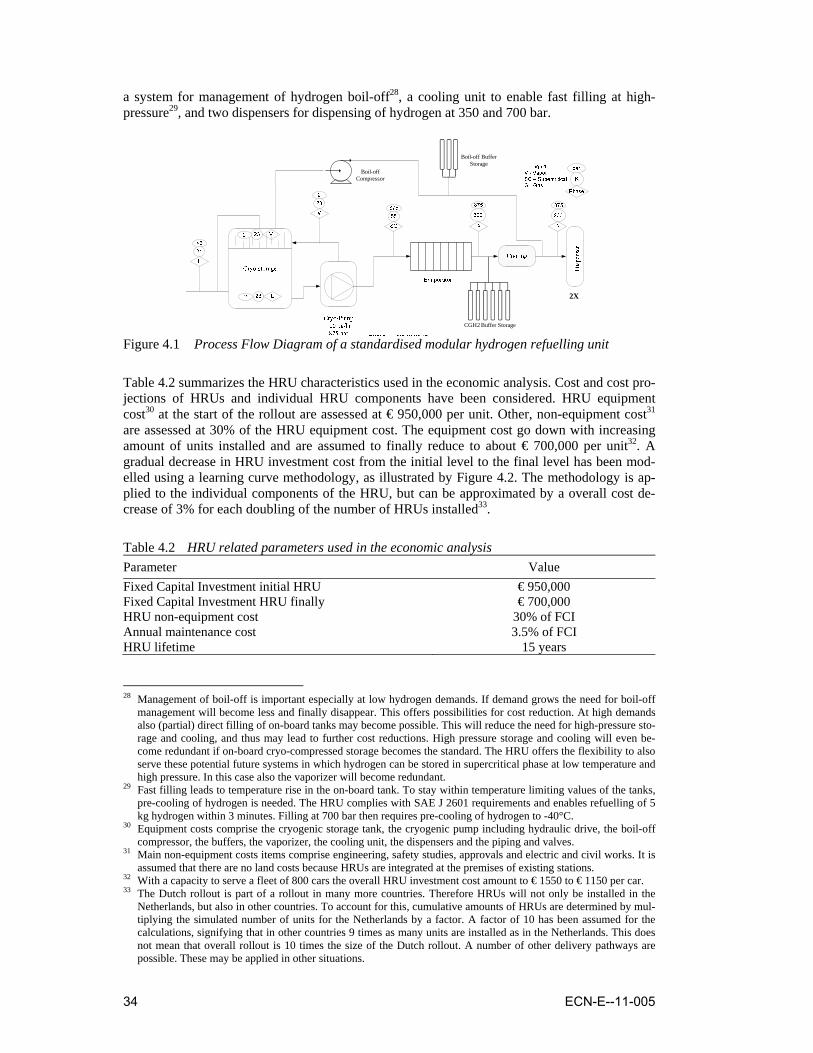
34 ECN-E--11-005
a system for management of hydrogen boil-off28, a cooling unit to enable fast filling at high-pressure29, and two dispensers for dispensing of hydrogen at 350 and 700 bar.
CGH2 Buffer Storage
Boil-off Buffer Storage
Boil-off Compressor
2X
Figure 4.1 Process Flow Diagram of a standardised modular hydrogen refuelling unit
Table 4.2 summarizes the HRU characteristics used in the economic analysis. Cost and cost pro-jections of HRUs and individual HRU components have been considered. HRU equipment cost30 at the start of the rollout are assessed at € 950,000 per unit. Other, non-equipment cost31 are assessed at 30% of the HRU equipment cost. The equipment cost go down with increasing amount of units installed and are assumed to finally reduce to about € 700,000 per unit32. A gradual decrease in HRU investment cost from the initial level to the final level has been mod-elled using a learning curve methodology, as illustrated by Figure 4.2. The methodology is ap-plied to the individual components of the HRU, but can be approximated by a overall cost de-crease of 3% for each doubling of the number of HRUs installed33.
Table 4.2 HRU related parameters used in the economic analysis Parameter Value Fixed Capital Investment initial HRU € 950,000 Fixed Capital Investment HRU finally € 700,000 HRU non-equipment cost 30% of FCI Annual maintenance cost 3.5% of FCI HRU lifetime 15 years 28 Management of boil-off is important especially at low hydrogen demands. If demand grows the need for boil-off
management will become less and finally disappear. This offers possibilities for cost reduction. At high demands also (partial) direct filling of on-board tanks may become possible. This will reduce the need for high-pressure sto-rage and cooling, and thus may lead to further cost reductions. High pressure storage and cooling will even be-come redundant if on-board cryo-compressed storage becomes the standard. The HRU offers the flexibility to also serve these potential future systems in which hydrogen can be stored in supercritical phase at low temperature and high pressure. In this case also the vaporizer will become redundant.
29 Fast filling leads to temperature rise in the on-board tank. To stay within temperature limiting values of the tanks, pre-cooling of hydrogen is needed. The HRU complies with SAE J 2601 requirements and enables refuelling of 5 kg hydrogen within 3 minutes. Filling at 700 bar then requires pre-cooling of hydrogen to -40°C.
30 Equipment costs comprise the cryogenic storage tank, the cryogenic pump including hydraulic drive, the boil-off compressor, the buffers, the vaporizer, the cooling unit, the dispensers and the piping and valves.
31 Main non-equipment costs items comprise engineering, safety studies, approvals and electric and civil works. It is assumed that there are no land costs because HRUs are integrated at the premises of existing stations.
32 With a capacity to serve a fleet of 800 cars the overall HRU investment cost amount to € 1550 to € 1150 per car. 33 The Dutch rollout is part of a rollout in many more countries. Therefore HRUs will not only be installed in the
Netherlands, but also in other countries. To account for this, cumulative amounts of HRUs are determined by mul-tiplying the simulated number of units for the Netherlands by a factor. A factor of 10 has been assumed for the calculations, signifying that in other countries 9 times as many units are installed as in the Netherlands. This does not mean that overall rollout is 10 times the size of the Dutch rollout. A number of other delivery pathways are possible. These may be applied in other situations.
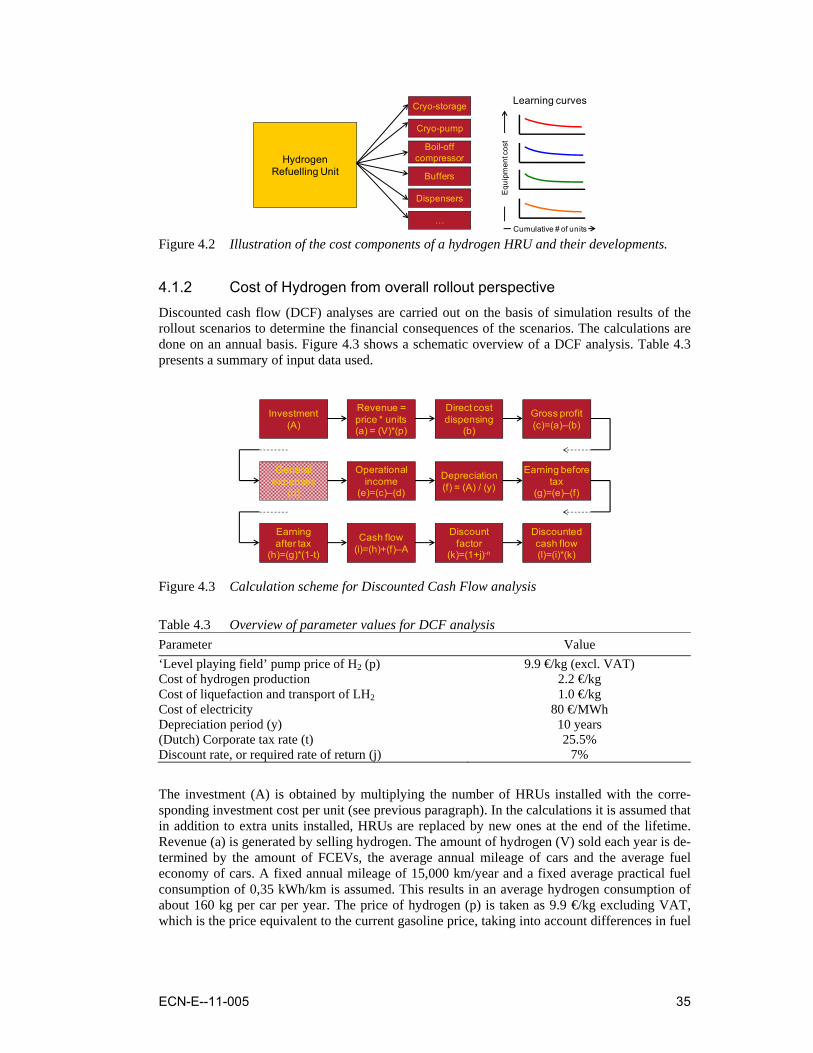
ECN-E--11-005 35
Hydrogen Refuelling Unit
Cryo-storage
Cryo-pump
Boil-off compressor
Buffers
Dispensers
…
Equ
ipm
ent c
ost
Cumulative # of units
Learning curves
Figure 4.2 Illustration of the cost components of a hydrogen HRU and their developments.
4.1.2 Cost of Hydrogen from overall rollout perspective Discounted cash flow (DCF) analyses are carried out on the basis of simulation results of the rollout scenarios to determine the financial consequences of the scenarios. The calculations are done on an annual basis. Figure 4.3 shows a schematic overview of a DCF analysis. Table 4.3 presents a summary of input data used.
Gross profit(c)=(a)–(b)
Investment(A)
Revenue = price * units(a) = (V)*(p)
Direct cost dispensing
(b)
General expenses
(d)
Discounted cash flow(l)=(i)*(k)
Operational income
(e)=(c)–(d)
Depreciation(f) = (A) / (y)
Earning before tax
(g)=(e)–(f)
Earningafter tax
(h)=(g)*(1-t)
Cash flow(i)=(h)+(f)–A
Discountfactor
(k)=(1+j)-n
Figure 4.3 Calculation scheme for Discounted Cash Flow analysis
Table 4.3 Overview of parameter values for DCF analysis Parameter Value ‘Level playing field’ pump price of H2 (p) 9.9 €/kg (excl. VAT) Cost of hydrogen production 2.2 €/kg Cost of liquefaction and transport of LH2 1.0 €/kg Cost of electricity 80 €/MWh Depreciation period (y) 10 years (Dutch) Corporate tax rate (t) 25.5% Discount rate, or required rate of return (j) 7%
The investment (A) is obtained by multiplying the number of HRUs installed with the corre-sponding investment cost per unit (see previous paragraph). In the calculations it is assumed that in addition to extra units installed, HRUs are replaced by new ones at the end of the lifetime. Revenue (a) is generated by selling hydrogen. The amount of hydrogen (V) sold each year is de-termined by the amount of FCEVs, the average annual mileage of cars and the average fuel economy of cars. A fixed annual mileage of 15,000 km/year and a fixed average practical fuel consumption of 0,35 kWh/km is assumed. This results in an average hydrogen consumption of about 160 kg per car per year. The price of hydrogen (p) is taken as 9.9 €/kg excluding VAT, which is the price equivalent to the current gasoline price, taking into account differences in fuel
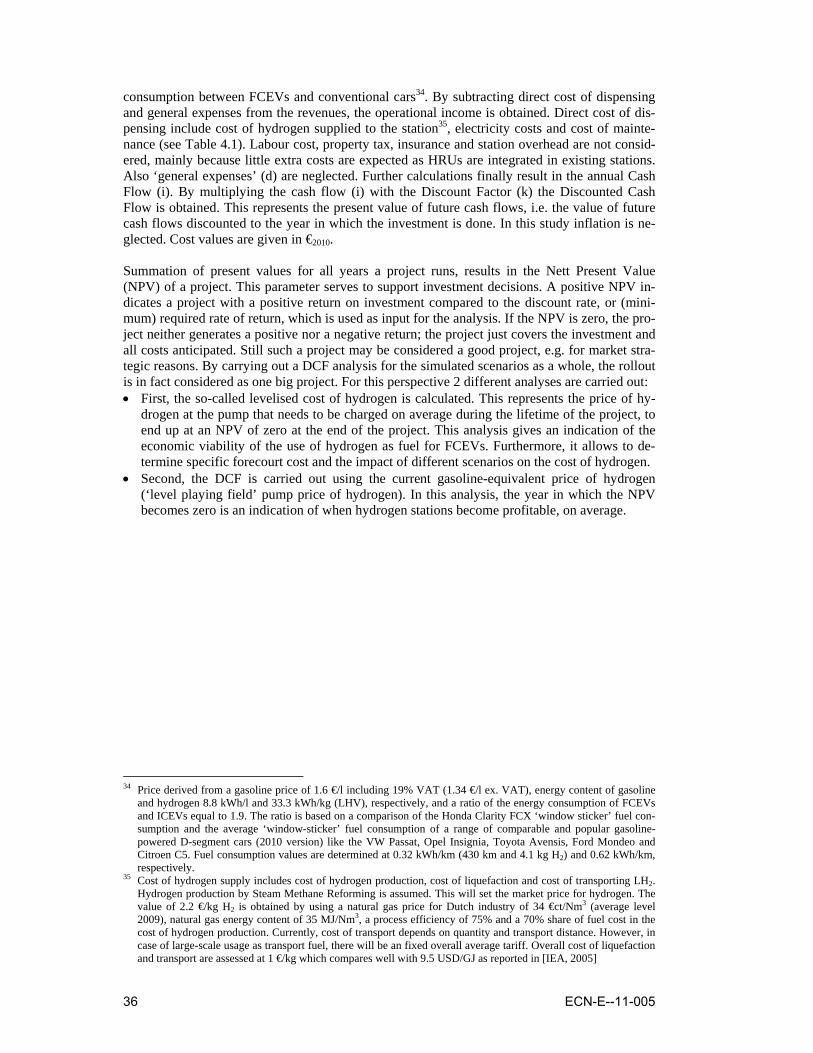
36 ECN-E--11-005
consumption between FCEVs and conventional cars34. By subtracting direct cost of dispensing and general expenses from the revenues, the operational income is obtained. Direct cost of dis-pensing include cost of hydrogen supplied to the station35, electricity costs and cost of mainte-nance (see Table 4.1). Labour cost, property tax, insurance and station overhead are not consid-ered, mainly because little extra costs are expected as HRUs are integrated in existing stations. Also ‘general expenses’ (d) are neglected. Further calculations finally result in the annual Cash Flow (i). By multiplying the cash flow (i) with the Discount Factor (k) the Discounted Cash Flow is obtained. This represents the present value of future cash flows, i.e. the value of future cash flows discounted to the year in which the investment is done. In this study inflation is ne-glected. Cost values are given in €2010. Summation of present values for all years a project runs, results in the Nett Present Value (NPV) of a project. This parameter serves to support investment decisions. A positive NPV in-dicates a project with a positive return on investment compared to the discount rate, or (mini-mum) required rate of return, which is used as input for the analysis. If the NPV is zero, the pro-ject neither generates a positive nor a negative return; the project just covers the investment and all costs anticipated. Still such a project may be considered a good project, e.g. for market stra-tegic reasons. By carrying out a DCF analysis for the simulated scenarios as a whole, the rollout is in fact considered as one big project. For this perspective 2 different analyses are carried out: • First, the so-called levelised cost of hydrogen is calculated. This represents the price of hy-
drogen at the pump that needs to be charged on average during the lifetime of the project, to end up at an NPV of zero at the end of the project. This analysis gives an indication of the economic viability of the use of hydrogen as fuel for FCEVs. Furthermore, it allows to de-termine specific forecourt cost and the impact of different scenarios on the cost of hydrogen.
• Second, the DCF is carried out using the current gasoline-equivalent price of hydrogen (‘level playing field’ pump price of hydrogen). In this analysis, the year in which the NPV becomes zero is an indication of when hydrogen stations become profitable, on average.
34 Price derived from a gasoline price of 1.6 €/l including 19% VAT (1.34 €/l ex. VAT), energy content of gasoline
and hydrogen 8.8 kWh/l and 33.3 kWh/kg (LHV), respectively, and a ratio of the energy consumption of FCEVs and ICEVs equal to 1.9. The ratio is based on a comparison of the Honda Clarity FCX ‘window sticker’ fuel con-sumption and the average ‘window-sticker’ fuel consumption of a range of comparable and popular gasoline-powered D-segment cars (2010 version) like the VW Passat, Opel Insignia, Toyota Avensis, Ford Mondeo and Citroen C5. Fuel consumption values are determined at 0.32 kWh/km (430 km and 4.1 kg H2) and 0.62 kWh/km, respectively.
35 Cost of hydrogen supply includes cost of hydrogen production, cost of liquefaction and cost of transporting LH2. Hydrogen production by Steam Methane Reforming is assumed. This will set the market price for hydrogen. The value of 2.2 €/kg H2 is obtained by using a natural gas price for Dutch industry of 34 €ct/Nm3 (average level 2009), natural gas energy content of 35 MJ/Nm3, a process efficiency of 75% and a 70% share of fuel cost in the cost of hydrogen production. Currently, cost of transport depends on quantity and transport distance. However, in case of large-scale usage as transport fuel, there will be an fixed overall average tariff. Overall cost of liquefaction and transport are assessed at 1 €/kg which compares well with 9.5 USD/GJ as reported in [IEA, 2005]
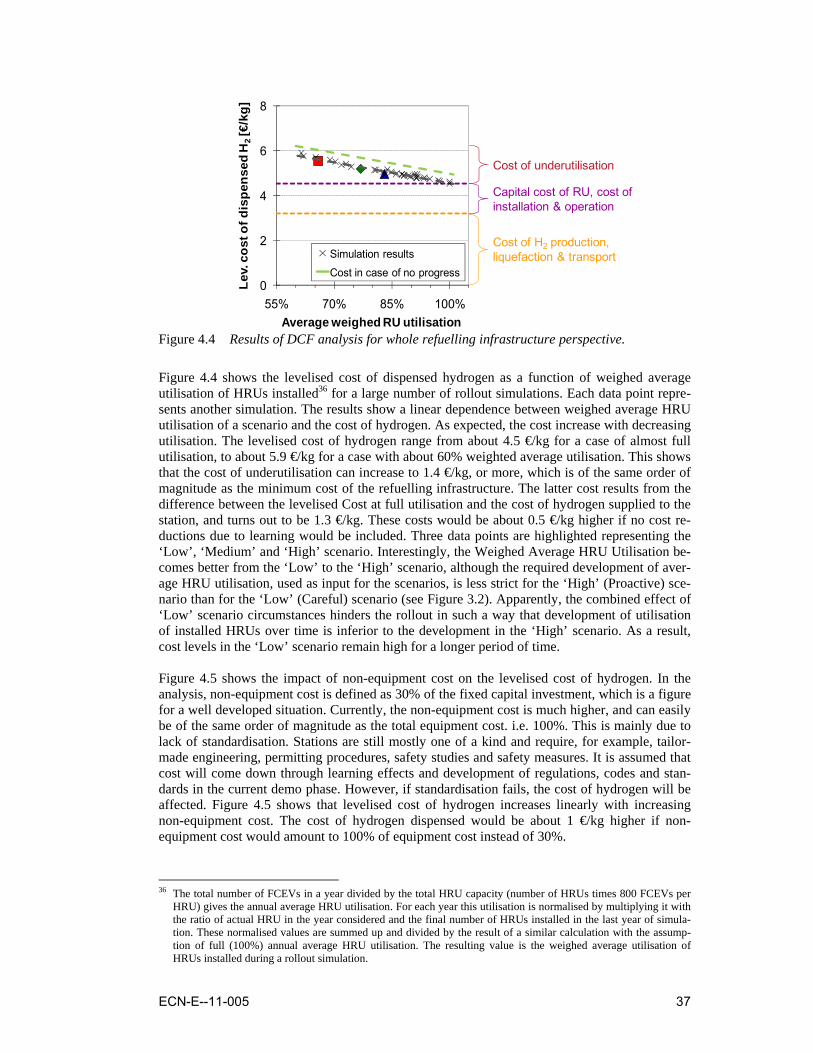
ECN-E--11-005 37
0
2
4
6
8
55% 70% 85% 100%
Lev.
cos
t of d
ispe
nsed
H2
[€/k
g]
Average weighed RU utilisation
Simulation results
Cost in case of no progress
Cost of underutilisation
Capital cost of RU, cost of installation & operation
Cost of H2 production, liquefaction & transport
Figure 4.4 Results of DCF analysis for whole refuelling infrastructure perspective.
Figure 4.4 shows the levelised cost of dispensed hydrogen as a function of weighed average utilisation of HRUs installed36 for a large number of rollout simulations. Each data point repre-sents another simulation. The results show a linear dependence between weighed average HRU utilisation of a scenario and the cost of hydrogen. As expected, the cost increase with decreasing utilisation. The levelised cost of hydrogen range from about 4.5 €/kg for a case of almost full utilisation, to about 5.9 €/kg for a case with about 60% weighted average utilisation. This shows that the cost of underutilisation can increase to 1.4 €/kg, or more, which is of the same order of magnitude as the minimum cost of the refuelling infrastructure. The latter cost results from the difference between the levelised Cost at full utilisation and the cost of hydrogen supplied to the station, and turns out to be 1.3 €/kg. These costs would be about 0.5 €/kg higher if no cost re-ductions due to learning would be included. Three data points are highlighted representing the ‘Low’, ‘Medium’ and ‘High’ scenario. Interestingly, the Weighed Average HRU Utilisation be-comes better from the ‘Low’ to the ‘High’ scenario, although the required development of aver-age HRU utilisation, used as input for the scenarios, is less strict for the ‘High’ (Proactive) sce-nario than for the ‘Low’ (Careful) scenario (see Figure 3.2). Apparently, the combined effect of ‘Low’ scenario circumstances hinders the rollout in such a way that development of utilisation of installed HRUs over time is inferior to the development in the ‘High’ scenario. As a result, cost levels in the ‘Low’ scenario remain high for a longer period of time. Figure 4.5 shows the impact of non-equipment cost on the levelised cost of hydrogen. In the analysis, non-equipment cost is defined as 30% of the fixed capital investment, which is a figure for a well developed situation. Currently, the non-equipment cost is much higher, and can easily be of the same order of magnitude as the total equipment cost. i.e. 100%. This is mainly due to lack of standardisation. Stations are still mostly one of a kind and require, for example, tailor-made engineering, permitting procedures, safety studies and safety measures. It is assumed that cost will come down through learning effects and development of regulations, codes and stan-dards in the current demo phase. However, if standardisation fails, the cost of hydrogen will be affected. Figure 4.5 shows that levelised cost of hydrogen increases linearly with increasing non-equipment cost. The cost of hydrogen dispensed would be about 1 €/kg higher if non-equipment cost would amount to 100% of equipment cost instead of 30%.
36 The total number of FCEVs in a year divided by the total HRU capacity (number of HRUs times 800 FCEVs per
HRU) gives the annual average HRU utilisation. For each year this utilisation is normalised by multiplying it with the ratio of actual HRU in the year considered and the final number of HRUs installed in the last year of simula-tion. These normalised values are summed up and divided by the result of a similar calculation with the assump-tion of full (100%) annual average HRU utilisation. The resulting value is the weighed average utilisation of HRUs installed during a rollout simulation.
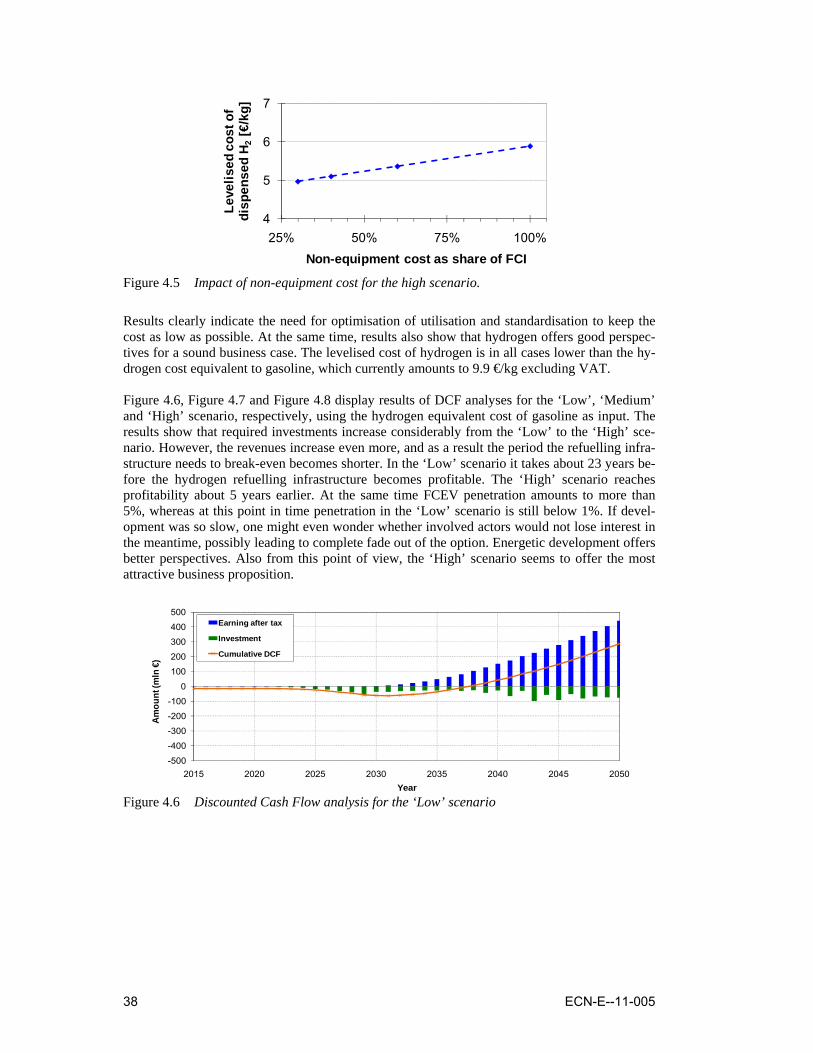
38 ECN-E--11-005
4
5
6
7
25% 50% 75% 100%Le
velis
ed c
ost o
f di
spen
sed
H 2[€
/kg]
Non-equipment cost as share of FCI Figure 4.5 Impact of non-equipment cost for the high scenario.
Results clearly indicate the need for optimisation of utilisation and standardisation to keep the cost as low as possible. At the same time, results also show that hydrogen offers good perspec-tives for a sound business case. The levelised cost of hydrogen is in all cases lower than the hy-drogen cost equivalent to gasoline, which currently amounts to 9.9 €/kg excluding VAT. Figure 4.6, Figure 4.7 and Figure 4.8 display results of DCF analyses for the ‘Low’, ‘Medium’ and ‘High’ scenario, respectively, using the hydrogen equivalent cost of gasoline as input. The results show that required investments increase considerably from the ‘Low’ to the ‘High’ sce-nario. However, the revenues increase even more, and as a result the period the refuelling infra-structure needs to break-even becomes shorter. In the ‘Low’ scenario it takes about 23 years be-fore the hydrogen refuelling infrastructure becomes profitable. The ‘High’ scenario reaches profitability about 5 years earlier. At the same time FCEV penetration amounts to more than 5%, whereas at this point in time penetration in the ‘Low’ scenario is still below 1%. If devel-opment was so slow, one might even wonder whether involved actors would not lose interest in the meantime, possibly leading to complete fade out of the option. Energetic development offers better perspectives. Also from this point of view, the ‘High’ scenario seems to offer the most attractive business proposition.
-500
-400
-300
-200
-100
0
100
200
300
400
500
2015 2020 2025 2030 2035 2040 2045 2050
Amou
nt (m
ln €
)
Year
Earning after tax
Investment
Cumulative DCF
Figure 4.6 Discounted Cash Flow analysis for the ‘Low’ scenario
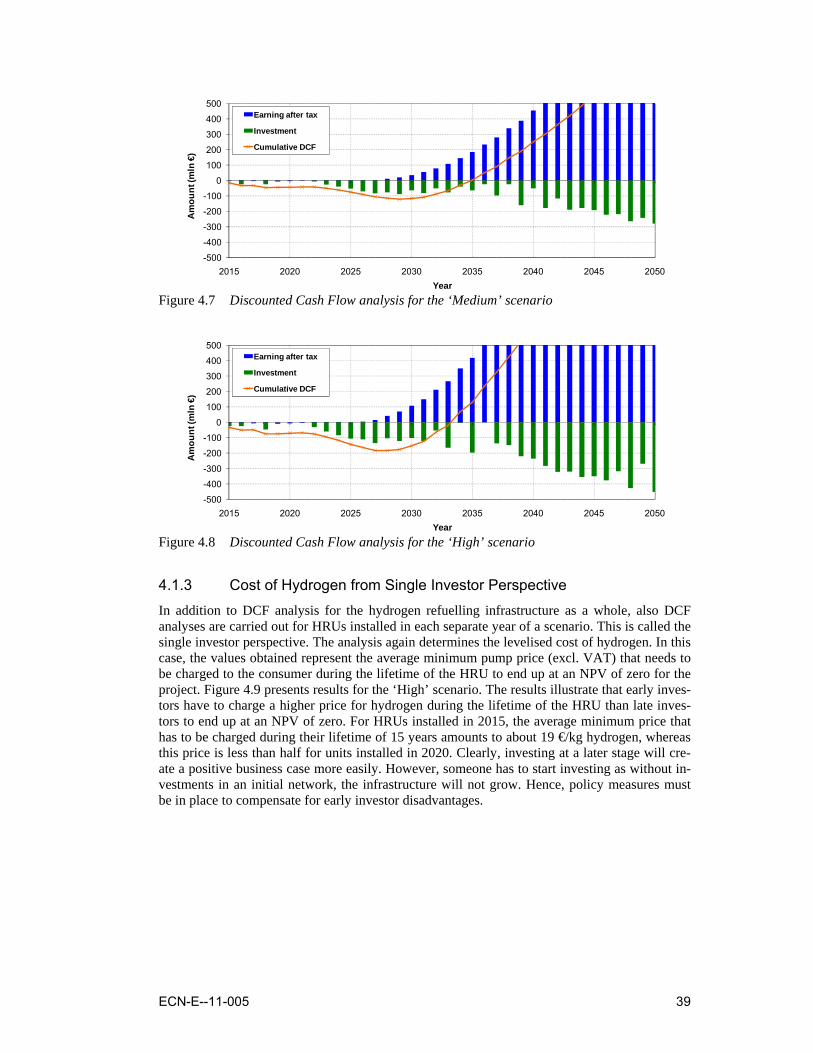
ECN-E--11-005 39
-500
-400
-300
-200
-100
0
100
200
300
400
500
2015 2020 2025 2030 2035 2040 2045 2050
Am
ount
(mln
€)
Year
Earning after tax
Investment
Cumulative DCF
Figure 4.7 Discounted Cash Flow analysis for the ‘Medium’ scenario
-500
-400
-300
-200
-100
0
100
200
300
400
500
2015 2020 2025 2030 2035 2040 2045 2050
Am
ount
(mln
€)
Year
Earning after tax
Investment
Cumulative DCF
Figure 4.8 Discounted Cash Flow analysis for the ‘High’ scenario
4.1.3 Cost of Hydrogen from Single Investor Perspective In addition to DCF analysis for the hydrogen refuelling infrastructure as a whole, also DCF analyses are carried out for HRUs installed in each separate year of a scenario. This is called the single investor perspective. The analysis again determines the levelised cost of hydrogen. In this case, the values obtained represent the average minimum pump price (excl. VAT) that needs to be charged to the consumer during the lifetime of the HRU to end up at an NPV of zero for the project. Figure 4.9 presents results for the ‘High’ scenario. The results illustrate that early inves-tors have to charge a higher price for hydrogen during the lifetime of the HRU than late inves-tors to end up at an NPV of zero. For HRUs installed in 2015, the average minimum price that has to be charged during their lifetime of 15 years amounts to about 19 €/kg hydrogen, whereas this price is less than half for units installed in 2020. Clearly, investing at a later stage will cre-ate a positive business case more easily. However, someone has to start investing as without in-vestments in an initial network, the infrastructure will not grow. Hence, policy measures must be in place to compensate for early investor disadvantages.
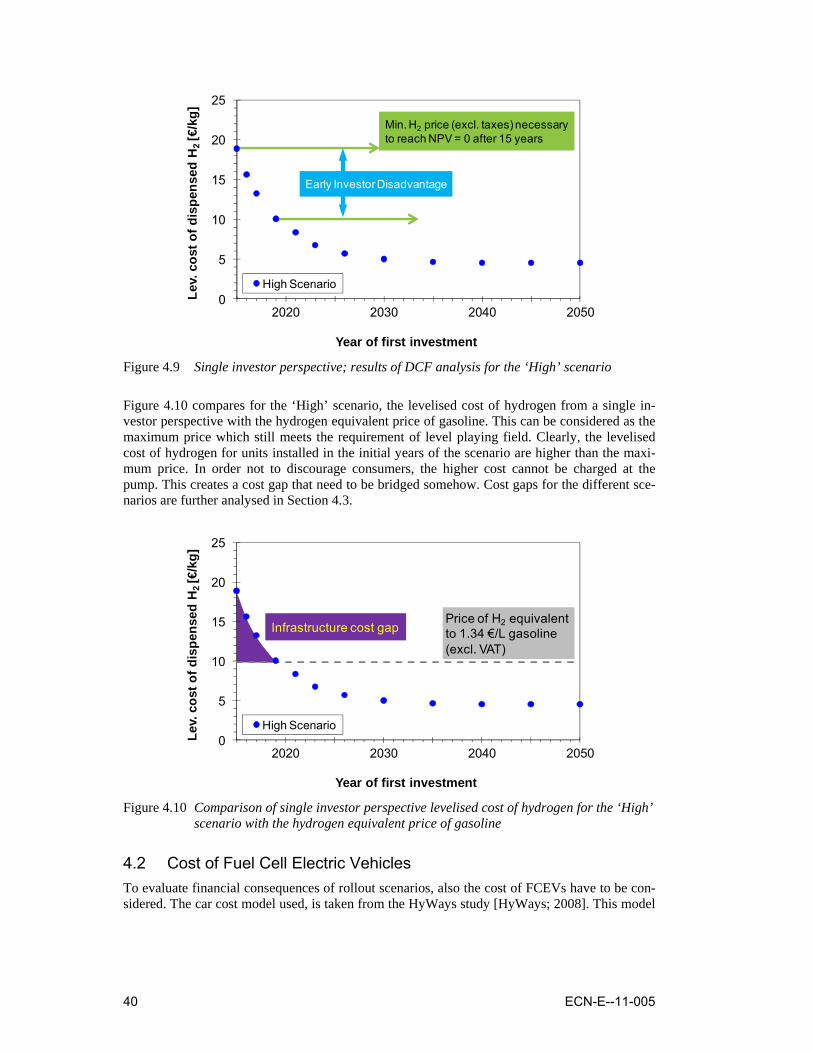
40 ECN-E--11-005
2020 2030 2040 20500
5
10
15
20
25
Lev.
cos
t of d
ispe
nsed
H2
[€/k
g]
Year of first investment
High Scenario
Early Investor Disadvantage
Min. H2 price (excl. taxes) necessary to reach NPV = 0 after 15 years
Figure 4.9 Single investor perspective; results of DCF analysis for the ‘High’ scenario
Figure 4.10 compares for the ‘High’ scenario, the levelised cost of hydrogen from a single in-vestor perspective with the hydrogen equivalent price of gasoline. This can be considered as the maximum price which still meets the requirement of level playing field. Clearly, the levelised cost of hydrogen for units installed in the initial years of the scenario are higher than the maxi-mum price. In order not to discourage consumers, the higher cost cannot be charged at the pump. This creates a cost gap that need to be bridged somehow. Cost gaps for the different sce-narios are further analysed in Section 4.3.
2020 2030 2040 20500
5
10
15
20
25
Lev.
cos
t of d
ispe
nsed
H2
[€/k
g]
Year of first investment
High Scenario
Price of H2 equivalent to 1.34 €/L gasoline (excl. VAT)
Infrastructure cost gap
Figure 4.10 Comparison of single investor perspective levelised cost of hydrogen for the ‘High’
scenario with the hydrogen equivalent price of gasoline
4.2 Cost of Fuel Cell Electric Vehicles To evaluate financial consequences of rollout scenarios, also the cost of FCEVs have to be con-sidered. The car cost model used, is taken from the HyWays study [HyWays; 2008]. This model
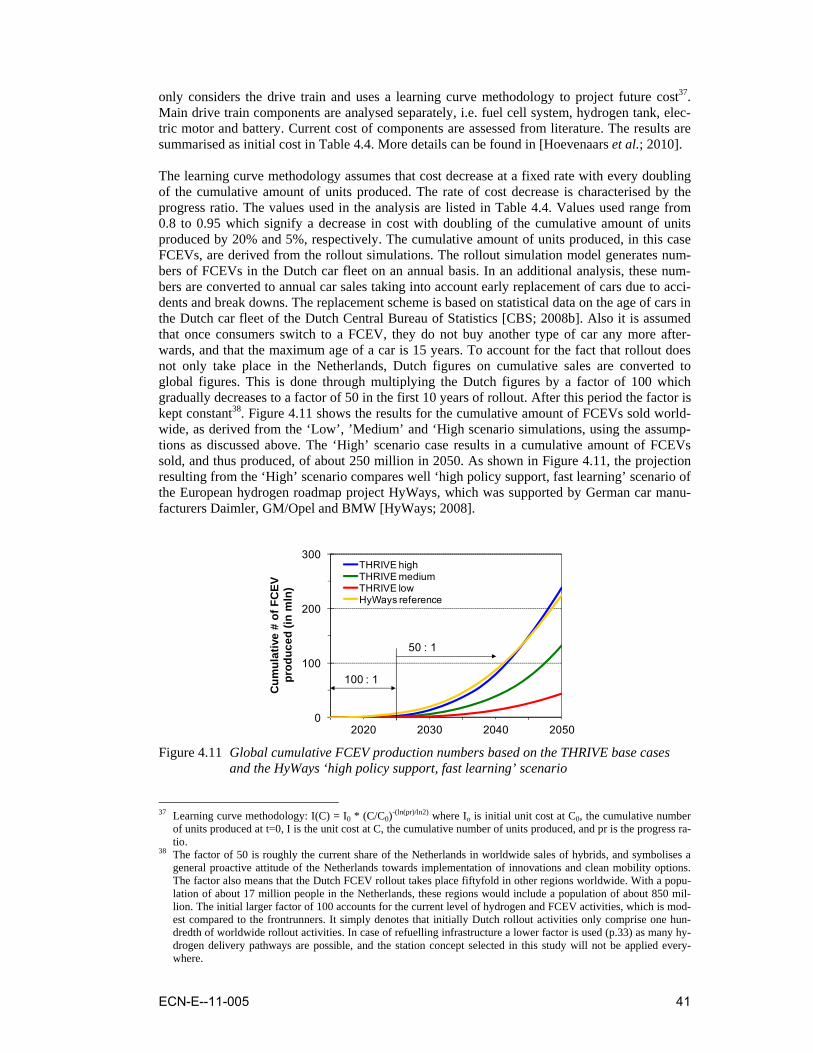
ECN-E--11-005 41
only considers the drive train and uses a learning curve methodology to project future cost37. Main drive train components are analysed separately, i.e. fuel cell system, hydrogen tank, elec-tric motor and battery. Current cost of components are assessed from literature. The results are summarised as initial cost in Table 4.4. More details can be found in [Hoevenaars et al.; 2010]. The learning curve methodology assumes that cost decrease at a fixed rate with every doubling of the cumulative amount of units produced. The rate of cost decrease is characterised by the progress ratio. The values used in the analysis are listed in Table 4.4. Values used range from 0.8 to 0.95 which signify a decrease in cost with doubling of the cumulative amount of units produced by 20% and 5%, respectively. The cumulative amount of units produced, in this case FCEVs, are derived from the rollout simulations. The rollout simulation model generates num-bers of FCEVs in the Dutch car fleet on an annual basis. In an additional analysis, these num-bers are converted to annual car sales taking into account early replacement of cars due to acci-dents and break downs. The replacement scheme is based on statistical data on the age of cars in the Dutch car fleet of the Dutch Central Bureau of Statistics [CBS; 2008b]. Also it is assumed that once consumers switch to a FCEV, they do not buy another type of car any more after-wards, and that the maximum age of a car is 15 years. To account for the fact that rollout does not only take place in the Netherlands, Dutch figures on cumulative sales are converted to global figures. This is done through multiplying the Dutch figures by a factor of 100 which gradually decreases to a factor of 50 in the first 10 years of rollout. After this period the factor is kept constant38. Figure 4.11 shows the results for the cumulative amount of FCEVs sold world-wide, as derived from the ‘Low’, ’Medium’ and ‘High scenario simulations, using the assump-tions as discussed above. The ‘High’ scenario case results in a cumulative amount of FCEVs sold, and thus produced, of about 250 million in 2050. As shown in Figure 4.11, the projection resulting from the ‘High’ scenario compares well ‘high policy support, fast learning’ scenario of the European hydrogen roadmap project HyWays, which was supported by German car manu-facturers Daimler, GM/Opel and BMW [HyWays; 2008].
2020 2030 2040 20500
100
200
300
Cum
ulat
ive
# of
FC
EV
prod
uced
(in
mln
)
THRIVE highTHRIVE mediumTHRIVE lowHyWays reference
50 : 1
100 : 1
Figure 4.11 Global cumulative FCEV production numbers based on the THRIVE base cases
and the HyWays ‘high policy support, fast learning’ scenario
37 Learning curve methodology: I(C) = I0 * (C/C0)-(ln(pr)/ln2) where Io is initial unit cost at C0, the cumulative number
of units produced at t=0, I is the unit cost at C, the cumulative number of units produced, and pr is the progress ra-tio.
38 The factor of 50 is roughly the current share of the Netherlands in worldwide sales of hybrids, and symbolises a general proactive attitude of the Netherlands towards implementation of innovations and clean mobility options. The factor also means that the Dutch FCEV rollout takes place fiftyfold in other regions worldwide. With a popu-lation of about 17 million people in the Netherlands, these regions would include a population of about 850 mil-lion. The initial larger factor of 100 accounts for the current level of hydrogen and FCEV activities, which is mod-est compared to the frontrunners. It simply denotes that initially Dutch rollout activities only comprise one hun-dredth of worldwide rollout activities. In case of refuelling infrastructure a lower factor is used (p.33) as many hy-drogen delivery pathways are possible, and the station concept selected in this study will not be applied every-where.
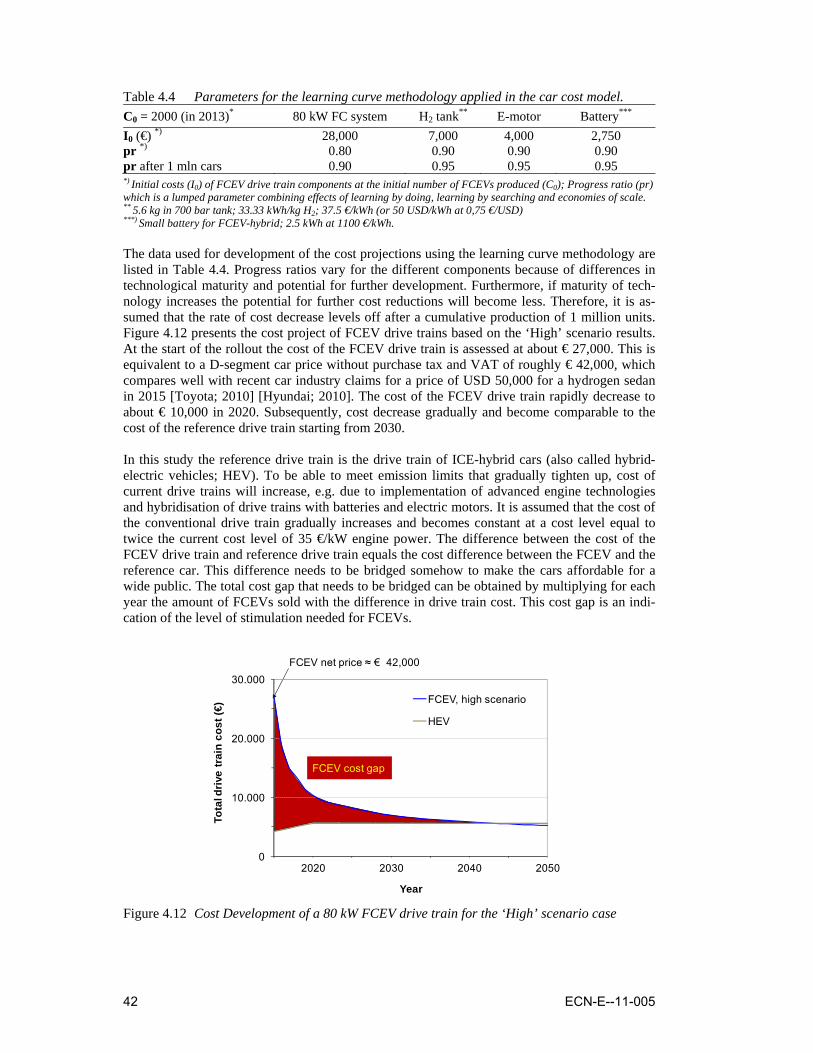
42 ECN-E--11-005
Table 4.4 Parameters for the learning curve methodology applied in the car cost model. C0 = 2000 (in 2013)* 80 kW FC system H2 tank** E-motor Battery***
I0 (€) *) 28,000 7,000 4,000 2,750 pr *) 0.80 0.90 0.90 0.90 pr after 1 mln cars 0.90 0.95 0.95 0.95 *) Initial costs (I0) of FCEV drive train components at the initial number of FCEVs produced (C0); Progress ratio (pr) which is a lumped parameter combining effects of learning by doing, learning by searching and economies of scale. ** 5.6 kg in 700 bar tank; 33.33 kWh/kg H2; 37.5 €/kWh (or 50 USD/kWh at 0,75 €/USD) ***) Small battery for FCEV-hybrid; 2.5 kWh at 1100 €/kWh. The data used for development of the cost projections using the learning curve methodology are listed in Table 4.4. Progress ratios vary for the different components because of differences in technological maturity and potential for further development. Furthermore, if maturity of tech-nology increases the potential for further cost reductions will become less. Therefore, it is as-sumed that the rate of cost decrease levels off after a cumulative production of 1 million units. Figure 4.12 presents the cost project of FCEV drive trains based on the ‘High’ scenario results. At the start of the rollout the cost of the FCEV drive train is assessed at about € 27,000. This is equivalent to a D-segment car price without purchase tax and VAT of roughly € 42,000, which compares well with recent car industry claims for a price of USD 50,000 for a hydrogen sedan in 2015 [Toyota; 2010] [Hyundai; 2010]. The cost of the FCEV drive train rapidly decrease to about € 10,000 in 2020. Subsequently, cost decrease gradually and become comparable to the cost of the reference drive train starting from 2030. In this study the reference drive train is the drive train of ICE-hybrid cars (also called hybrid-electric vehicles; HEV). To be able to meet emission limits that gradually tighten up, cost of current drive trains will increase, e.g. due to implementation of advanced engine technologies and hybridisation of drive trains with batteries and electric motors. It is assumed that the cost of the conventional drive train gradually increases and becomes constant at a cost level equal to twice the current cost level of 35 €/kW engine power. The difference between the cost of the FCEV drive train and reference drive train equals the cost difference between the FCEV and the reference car. This difference needs to be bridged somehow to make the cars affordable for a wide public. The total cost gap that needs to be bridged can be obtained by multiplying for each year the amount of FCEVs sold with the difference in drive train cost. This cost gap is an indi-cation of the level of stimulation needed for FCEVs.
FCEV cost gap
FCEV net price ≈ € 42,000
2020 2030 2040 20500
10.000
20.000
30.000
Tota
l driv
e tr
ain
cost
(€)
Year
FCEV, high scenario
HEV
Figure 4.12 Cost Development of a 80 kW FCEV drive train for the ‘High’ scenario case
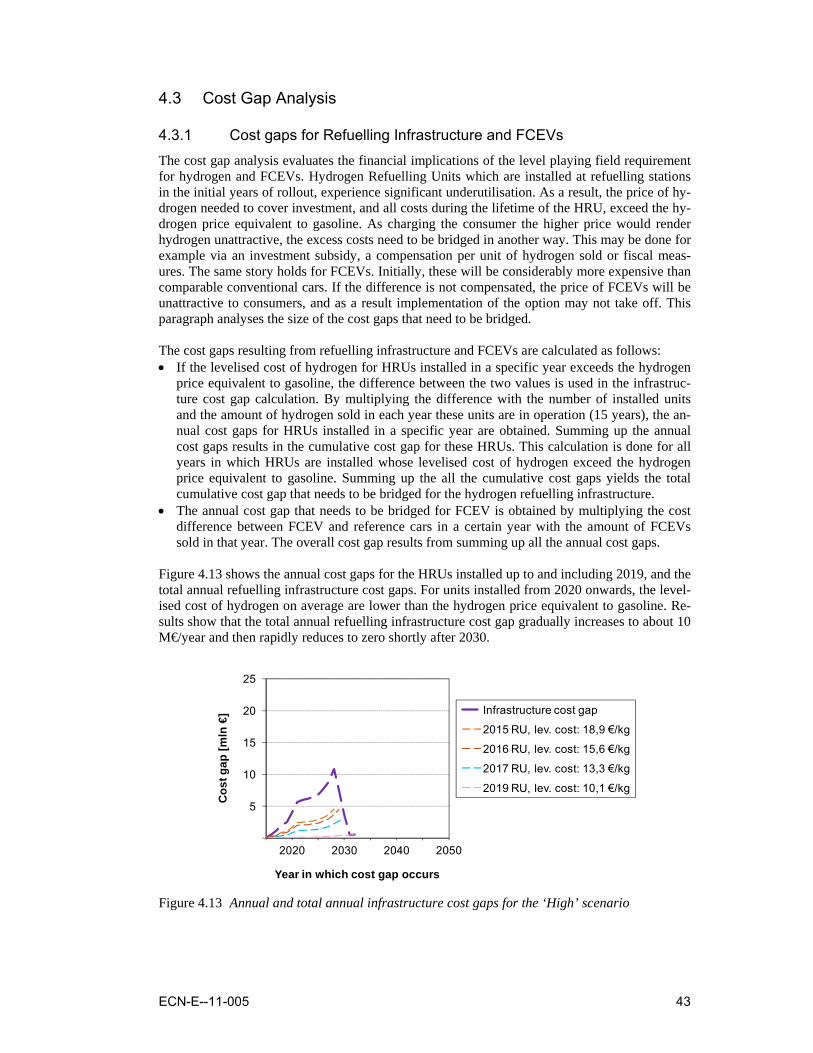
ECN-E--11-005 43
4.3 Cost Gap Analysis
4.3.1 Cost gaps for Refuelling Infrastructure and FCEVs The cost gap analysis evaluates the financial implications of the level playing field requirement for hydrogen and FCEVs. Hydrogen Refuelling Units which are installed at refuelling stations in the initial years of rollout, experience significant underutilisation. As a result, the price of hy-drogen needed to cover investment, and all costs during the lifetime of the HRU, exceed the hy-drogen price equivalent to gasoline. As charging the consumer the higher price would render hydrogen unattractive, the excess costs need to be bridged in another way. This may be done for example via an investment subsidy, a compensation per unit of hydrogen sold or fiscal meas-ures. The same story holds for FCEVs. Initially, these will be considerably more expensive than comparable conventional cars. If the difference is not compensated, the price of FCEVs will be unattractive to consumers, and as a result implementation of the option may not take off. This paragraph analyses the size of the cost gaps that need to be bridged. The cost gaps resulting from refuelling infrastructure and FCEVs are calculated as follows: • If the levelised cost of hydrogen for HRUs installed in a specific year exceeds the hydrogen
price equivalent to gasoline, the difference between the two values is used in the infrastruc-ture cost gap calculation. By multiplying the difference with the number of installed units and the amount of hydrogen sold in each year these units are in operation (15 years), the an-nual cost gaps for HRUs installed in a specific year are obtained. Summing up the annual cost gaps results in the cumulative cost gap for these HRUs. This calculation is done for all years in which HRUs are installed whose levelised cost of hydrogen exceed the hydrogen price equivalent to gasoline. Summing up the all the cumulative cost gaps yields the total cumulative cost gap that needs to be bridged for the hydrogen refuelling infrastructure.
• The annual cost gap that needs to be bridged for FCEV is obtained by multiplying the cost difference between FCEV and reference cars in a certain year with the amount of FCEVs sold in that year. The overall cost gap results from summing up all the annual cost gaps.
Figure 4.13 shows the annual cost gaps for the HRUs installed up to and including 2019, and the total annual refuelling infrastructure cost gaps. For units installed from 2020 onwards, the level-ised cost of hydrogen on average are lower than the hydrogen price equivalent to gasoline. Re-sults show that the total annual refuelling infrastructure cost gap gradually increases to about 10 M€/year and then rapidly reduces to zero shortly after 2030.
2020 2030 2040 2050
5
10
15
20
25
Cos
t gap
[mln
€]
Year in which cost gap occurs
Infrastructure cost gap
2015 RU, lev. cost: 18,9 €/kg
2016 RU, lev. cost: 15,6 €/kg
2017 RU, lev. cost: 13,3 €/kg
2019 RU, lev. cost: 10,1 €/kg
Figure 4.13 Annual and total annual infrastructure cost gaps for the ‘High’ scenario
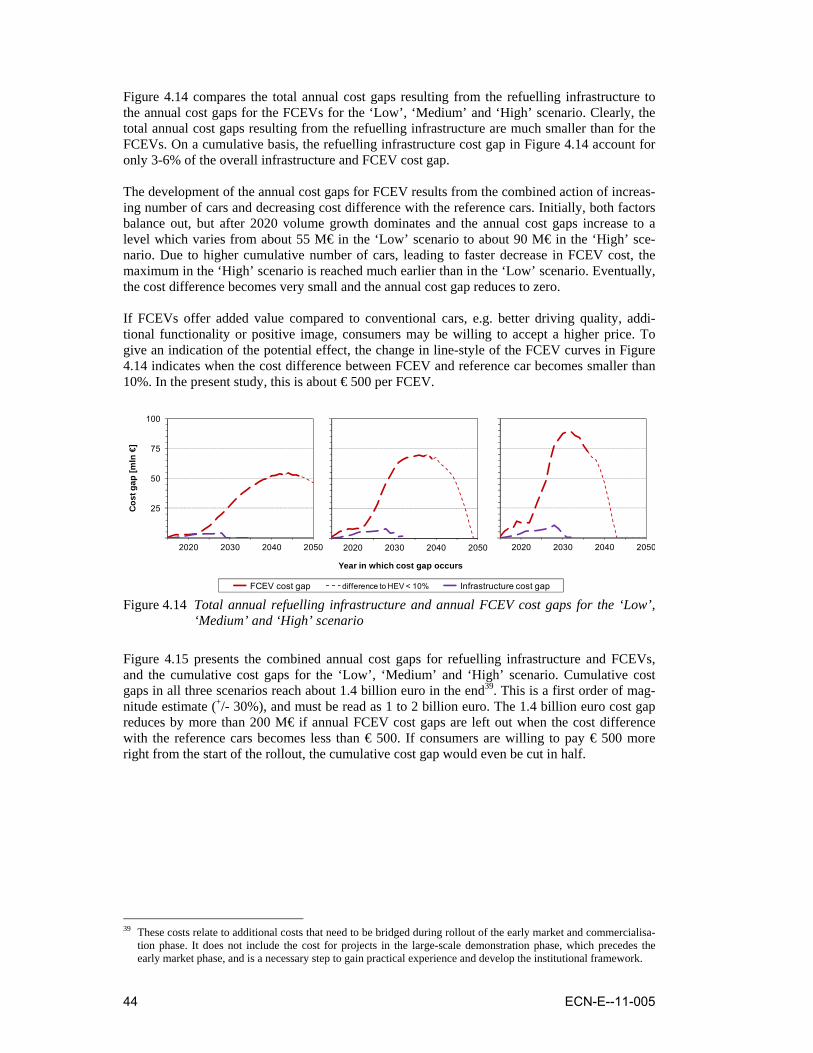
44 ECN-E--11-005
Figure 4.14 compares the total annual cost gaps resulting from the refuelling infrastructure to the annual cost gaps for the FCEVs for the ‘Low’, ‘Medium’ and ‘High’ scenario. Clearly, the total annual cost gaps resulting from the refuelling infrastructure are much smaller than for the FCEVs. On a cumulative basis, the refuelling infrastructure cost gap in Figure 4.14 account for only 3-6% of the overall infrastructure and FCEV cost gap. The development of the annual cost gaps for FCEV results from the combined action of increas-ing number of cars and decreasing cost difference with the reference cars. Initially, both factors balance out, but after 2020 volume growth dominates and the annual cost gaps increase to a level which varies from about 55 M€ in the ‘Low’ scenario to about 90 M€ in the ‘High’ sce-nario. Due to higher cumulative number of cars, leading to faster decrease in FCEV cost, the maximum in the ‘High’ scenario is reached much earlier than in the ‘Low’ scenario. Eventually, the cost difference becomes very small and the annual cost gap reduces to zero. If FCEVs offer added value compared to conventional cars, e.g. better driving quality, addi-tional functionality or positive image, consumers may be willing to accept a higher price. To give an indication of the potential effect, the change in line-style of the FCEV curves in Figure 4.14 indicates when the cost difference between FCEV and reference car becomes smaller than 10%. In the present study, this is about € 500 per FCEV.
2020 2030 2040 2050
25
50
75
100
Cos
t gap
[mln
€]
2020 2030 2040 2050
Year in which cost gap occurs
2020 2030 2040 2050
FCEV cost gap difference to HEV < 10% Infrastructure cost gap Figure 4.14 Total annual refuelling infrastructure and annual FCEV cost gaps for the ‘Low’,
‘Medium’ and ‘High’ scenario
Figure 4.15 presents the combined annual cost gaps for refuelling infrastructure and FCEVs, and the cumulative cost gaps for the ‘Low’, ‘Medium’ and ‘High’ scenario. Cumulative cost gaps in all three scenarios reach about 1.4 billion euro in the end39. This is a first order of mag-nitude estimate (+/- 30%), and must be read as 1 to 2 billion euro. The 1.4 billion euro cost gap reduces by more than 200 M€ if annual FCEV cost gaps are left out when the cost difference with the reference cars becomes less than € 500. If consumers are willing to pay € 500 more right from the start of the rollout, the cumulative cost gap would even be cut in half.
39 These costs relate to additional costs that need to be bridged during rollout of the early market and commercialisa-
tion phase. It does not include the cost for projects in the large-scale demonstration phase, which precedes the early market phase, and is a necessary step to gain practical experience and develop the institutional framework.
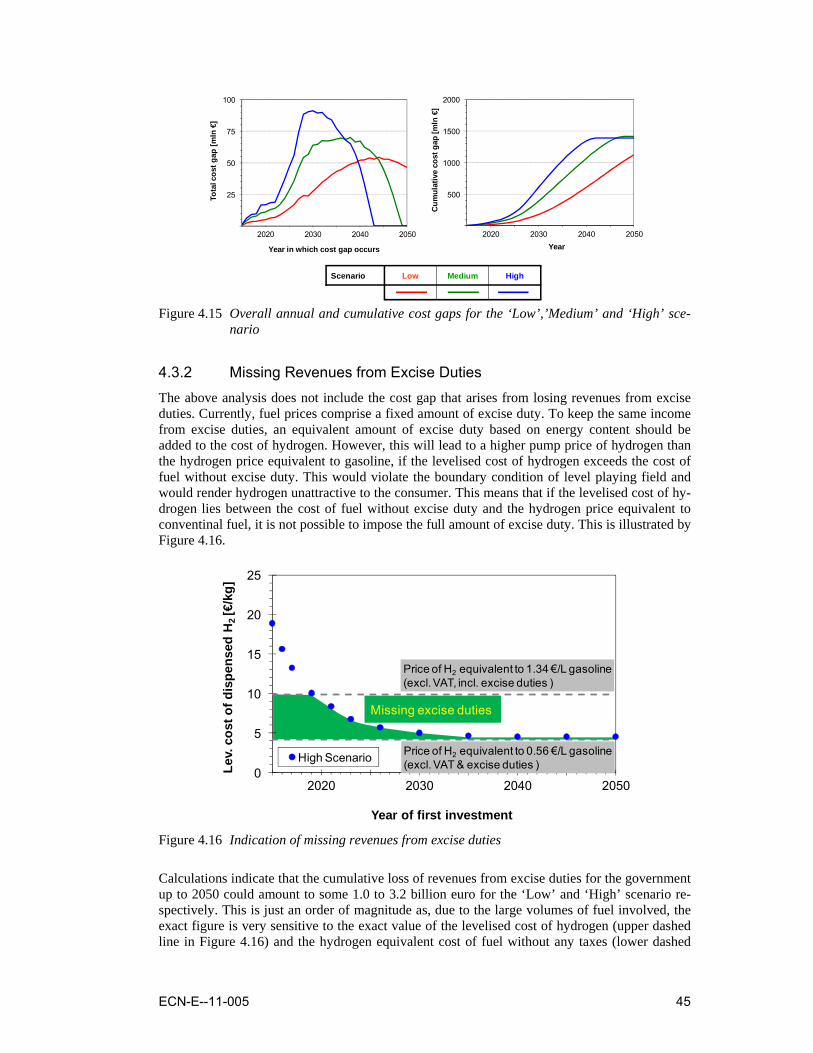
ECN-E--11-005 45
Scenario Low Medium High
2020 2030 2040 2050
25
50
75
100
Tota
l cos
t gap
[mln
€]
Year in which cost gap occurs
2020 2030 2040 2050
500
1000
1500
2000
Cum
ulat
ive
cost
gap
[mln
€]
Year
Figure 4.15 Overall annual and cumulative cost gaps for the ‘Low’,’Medium’ and ‘High’ sce-
nario
4.3.2 Missing Revenues from Excise Duties The above analysis does not include the cost gap that arises from losing revenues from excise duties. Currently, fuel prices comprise a fixed amount of excise duty. To keep the same income from excise duties, an equivalent amount of excise duty based on energy content should be added to the cost of hydrogen. However, this will lead to a higher pump price of hydrogen than the hydrogen price equivalent to gasoline, if the levelised cost of hydrogen exceeds the cost of fuel without excise duty. This would violate the boundary condition of level playing field and would render hydrogen unattractive to the consumer. This means that if the levelised cost of hy-drogen lies between the cost of fuel without excise duty and the hydrogen price equivalent to conventinal fuel, it is not possible to impose the full amount of excise duty. This is illustrated by Figure 4.16.
Missing excise duties
2020 2030 2040 20500
5
10
15
20
25
Lev.
cos
t of d
ispe
nsed
H2
[€/k
g]
Year of first investment
High Scenario Price of H2 equivalent to 0.56 €/L gasoline (excl. VAT & excise duties )
Price of H2 equivalent to 1.34 €/L gasoline (excl. VAT, incl. excise duties )
Figure 4.16 Indication of missing revenues from excise duties
Calculations indicate that the cumulative loss of revenues from excise duties for the government up to 2050 could amount to some 1.0 to 3.2 billion euro for the ‘Low’ and ‘High’ scenario re-spectively. This is just an order of magnitude as, due to the large volumes of fuel involved, the exact figure is very sensitive to the exact value of the levelised cost of hydrogen (upper dashed line in Figure 4.16) and the hydrogen equivalent cost of fuel without any taxes (lower dashed
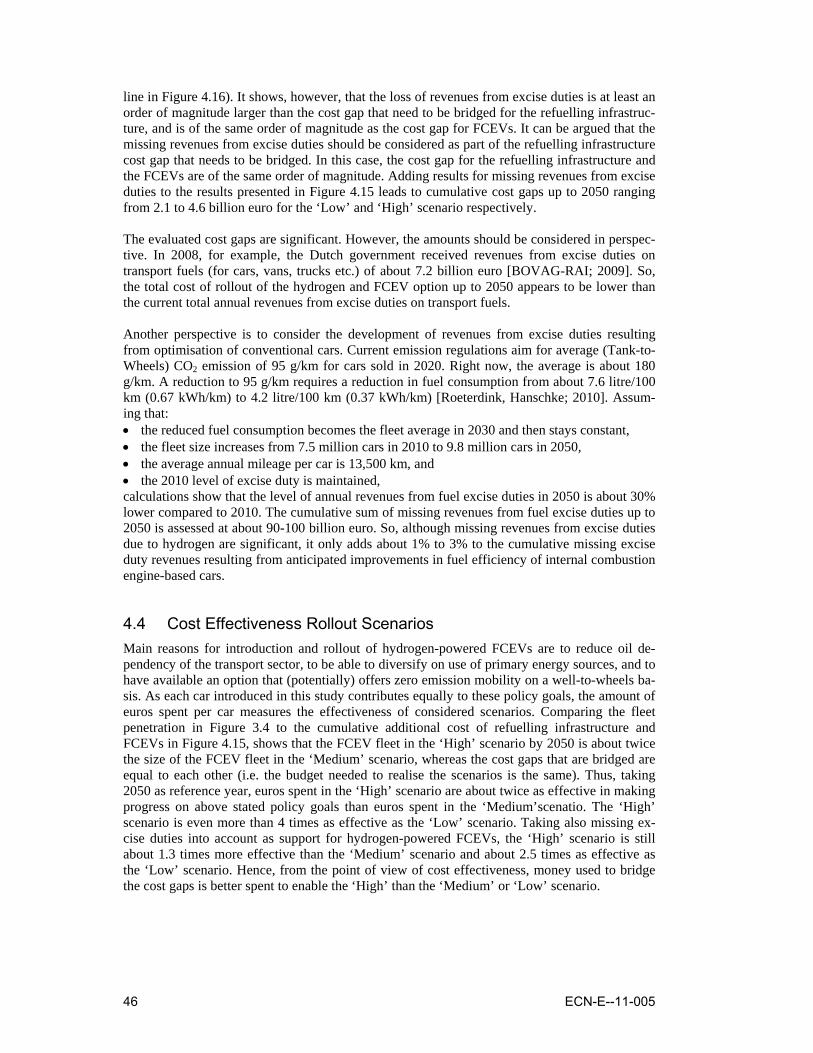
46 ECN-E--11-005
line in Figure 4.16). It shows, however, that the loss of revenues from excise duties is at least an order of magnitude larger than the cost gap that need to be bridged for the refuelling infrastruc-ture, and is of the same order of magnitude as the cost gap for FCEVs. It can be argued that the missing revenues from excise duties should be considered as part of the refuelling infrastructure cost gap that needs to be bridged. In this case, the cost gap for the refuelling infrastructure and the FCEVs are of the same order of magnitude. Adding results for missing revenues from excise duties to the results presented in Figure 4.15 leads to cumulative cost gaps up to 2050 ranging from 2.1 to 4.6 billion euro for the ‘Low’ and ‘High’ scenario respectively. The evaluated cost gaps are significant. However, the amounts should be considered in perspec-tive. In 2008, for example, the Dutch government received revenues from excise duties on transport fuels (for cars, vans, trucks etc.) of about 7.2 billion euro [BOVAG-RAI; 2009]. So, the total cost of rollout of the hydrogen and FCEV option up to 2050 appears to be lower than the current total annual revenues from excise duties on transport fuels. Another perspective is to consider the development of revenues from excise duties resulting from optimisation of conventional cars. Current emission regulations aim for average (Tank-to-Wheels) CO2 emission of 95 g/km for cars sold in 2020. Right now, the average is about 180 g/km. A reduction to 95 g/km requires a reduction in fuel consumption from about 7.6 litre/100 km (0.67 kWh/km) to 4.2 litre/100 km (0.37 kWh/km) [Roeterdink, Hanschke; 2010]. Assum-ing that: • the reduced fuel consumption becomes the fleet average in 2030 and then stays constant, • the fleet size increases from 7.5 million cars in 2010 to 9.8 million cars in 2050, • the average annual mileage per car is 13,500 km, and • the 2010 level of excise duty is maintained, calculations show that the level of annual revenues from fuel excise duties in 2050 is about 30% lower compared to 2010. The cumulative sum of missing revenues from fuel excise duties up to 2050 is assessed at about 90-100 billion euro. So, although missing revenues from excise duties due to hydrogen are significant, it only adds about 1% to 3% to the cumulative missing excise duty revenues resulting from anticipated improvements in fuel efficiency of internal combustion engine-based cars.
4.4 Cost Effectiveness Rollout Scenarios Main reasons for introduction and rollout of hydrogen-powered FCEVs are to reduce oil de-pendency of the transport sector, to be able to diversify on use of primary energy sources, and to have available an option that (potentially) offers zero emission mobility on a well-to-wheels ba-sis. As each car introduced in this study contributes equally to these policy goals, the amount of euros spent per car measures the effectiveness of considered scenarios. Comparing the fleet penetration in Figure 3.4 to the cumulative additional cost of refuelling infrastructure and FCEVs in Figure 4.15, shows that the FCEV fleet in the ‘High’ scenario by 2050 is about twice the size of the FCEV fleet in the ‘Medium’ scenario, whereas the cost gaps that are bridged are equal to each other (i.e. the budget needed to realise the scenarios is the same). Thus, taking 2050 as reference year, euros spent in the ‘High’ scenario are about twice as effective in making progress on above stated policy goals than euros spent in the ‘Medium’scenatio. The ‘High’ scenario is even more than 4 times as effective as the ‘Low’ scenario. Taking also missing ex-cise duties into account as support for hydrogen-powered FCEVs, the ‘High’ scenario is still about 1.3 times more effective than the ‘Medium’ scenario and about 2.5 times as effective as the ‘Low’ scenario. Hence, from the point of view of cost effectiveness, money used to bridge the cost gaps is better spent to enable the ‘High’ than the ‘Medium’ or ‘Low’ scenario.
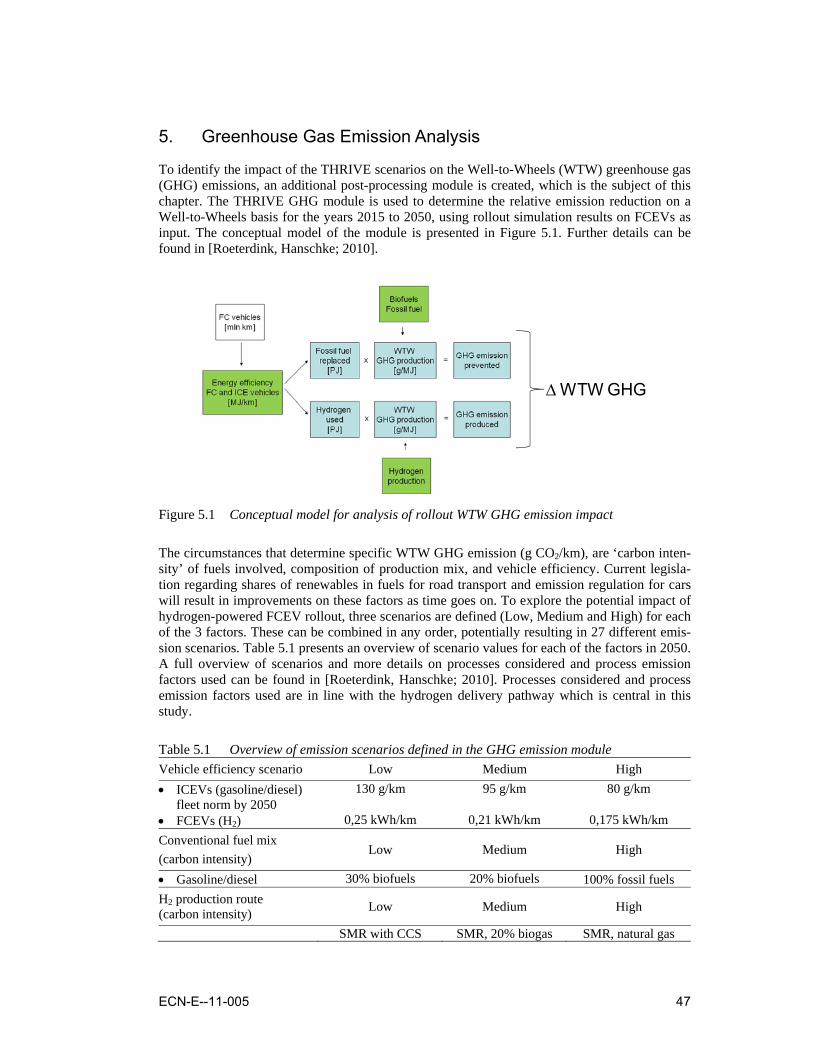
ECN-E--11-005 47
5. Greenhouse Gas Emission Analysis
To identify the impact of the THRIVE scenarios on the Well-to-Wheels (WTW) greenhouse gas (GHG) emissions, an additional post-processing module is created, which is the subject of this chapter. The THRIVE GHG module is used to determine the relative emission reduction on a Well-to-Wheels basis for the years 2015 to 2050, using rollout simulation results on FCEVs as input. The conceptual model of the module is presented in Figure 5.1. Further details can be found in [Roeterdink, Hanschke; 2010].
ΔWTW GHG
Figure 5.1 Conceptual model for analysis of rollout WTW GHG emission impact
The circumstances that determine specific WTW GHG emission (g CO2/km), are ‘carbon inten-sity’ of fuels involved, composition of production mix, and vehicle efficiency. Current legisla-tion regarding shares of renewables in fuels for road transport and emission regulation for cars will result in improvements on these factors as time goes on. To explore the potential impact of hydrogen-powered FCEV rollout, three scenarios are defined (Low, Medium and High) for each of the 3 factors. These can be combined in any order, potentially resulting in 27 different emis-sion scenarios. Table 5.1 presents an overview of scenario values for each of the factors in 2050. A full overview of scenarios and more details on processes considered and process emission factors used can be found in [Roeterdink, Hanschke; 2010]. Processes considered and process emission factors used are in line with the hydrogen delivery pathway which is central in this study.
Table 5.1 Overview of emission scenarios defined in the GHG emission module Vehicle efficiency scenario Low Medium High • ICEVs (gasoline/diesel)
fleet norm by 2050 130 g/km 95 g/km 80 g/km
• FCEVs (H2) 0,25 kWh/km 0,21 kWh/km 0,175 kWh/km Conventional fuel mix (carbon intensity)
Low Medium High
• Gasoline/diesel 30% biofuels 20% biofuels 100% fossil fuels H2 production route (carbon intensity) Low Medium High
SMR with CCS SMR, 20% biogas SMR, natural gas
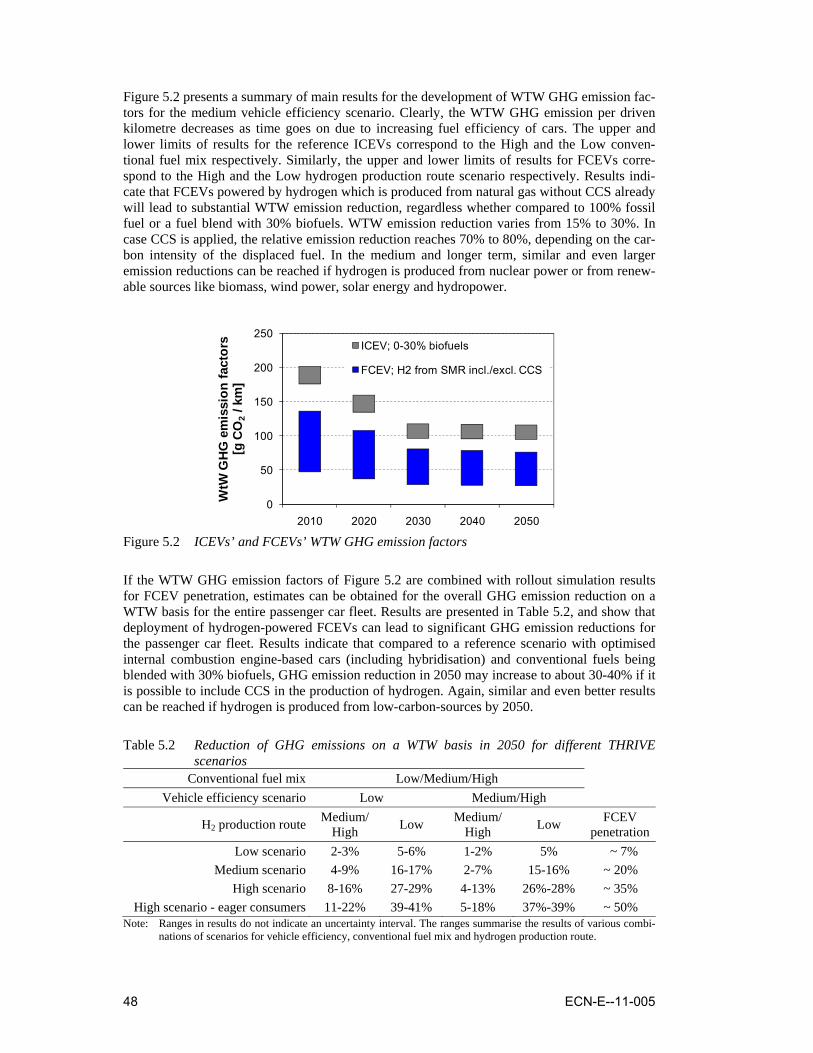
48 ECN-E--11-005
Figure 5.2 presents a summary of main results for the development of WTW GHG emission fac-tors for the medium vehicle efficiency scenario. Clearly, the WTW GHG emission per driven kilometre decreases as time goes on due to increasing fuel efficiency of cars. The upper and lower limits of results for the reference ICEVs correspond to the High and the Low conven-tional fuel mix respectively. Similarly, the upper and lower limits of results for FCEVs corre-spond to the High and the Low hydrogen production route scenario respectively. Results indi-cate that FCEVs powered by hydrogen which is produced from natural gas without CCS already will lead to substantial WTW emission reduction, regardless whether compared to 100% fossil fuel or a fuel blend with 30% biofuels. WTW emission reduction varies from 15% to 30%. In case CCS is applied, the relative emission reduction reaches 70% to 80%, depending on the car-bon intensity of the displaced fuel. In the medium and longer term, similar and even larger emission reductions can be reached if hydrogen is produced from nuclear power or from renew-able sources like biomass, wind power, solar energy and hydropower.
0
50
100
150
200
250
2010 2020 2030 2040 2050
WtW
GH
G e
mis
sion
fact
ors
[g C
O2
/ km
]
ICEV; 0-30% biofuels
FCEV; H2 from SMR incl./excl. CCS
Figure 5.2 ICEVs’ and FCEVs’ WTW GHG emission factors
If the WTW GHG emission factors of Figure 5.2 are combined with rollout simulation results for FCEV penetration, estimates can be obtained for the overall GHG emission reduction on a WTW basis for the entire passenger car fleet. Results are presented in Table 5.2, and show that deployment of hydrogen-powered FCEVs can lead to significant GHG emission reductions for the passenger car fleet. Results indicate that compared to a reference scenario with optimised internal combustion engine-based cars (including hybridisation) and conventional fuels being blended with 30% biofuels, GHG emission reduction in 2050 may increase to about 30-40% if it is possible to include CCS in the production of hydrogen. Again, similar and even better results can be reached if hydrogen is produced from low-carbon-sources by 2050.
Table 5.2 Reduction of GHG emissions on a WTW basis in 2050 for different THRIVE scenarios
Conventional fuel mix Low/Medium/High Vehicle efficiency scenario Low Medium/High
H2 production route Medium/ High Low Medium/
High Low FCEV penetration
Low scenario 2-3% 5-6% 1-2% 5% ~ 7% Medium scenario 4-9% 16-17% 2-7% 15-16% ~ 20%
High scenario 8-16% 27-29% 4-13% 26%-28% ~ 35% High scenario - eager consumers 11-22% 39-41% 5-18% 37%-39% ~ 50%
Note: Ranges in results do not indicate an uncertainty interval. The ranges summarise the results of various combi-nations of scenarios for vehicle efficiency, conventional fuel mix and hydrogen production route.
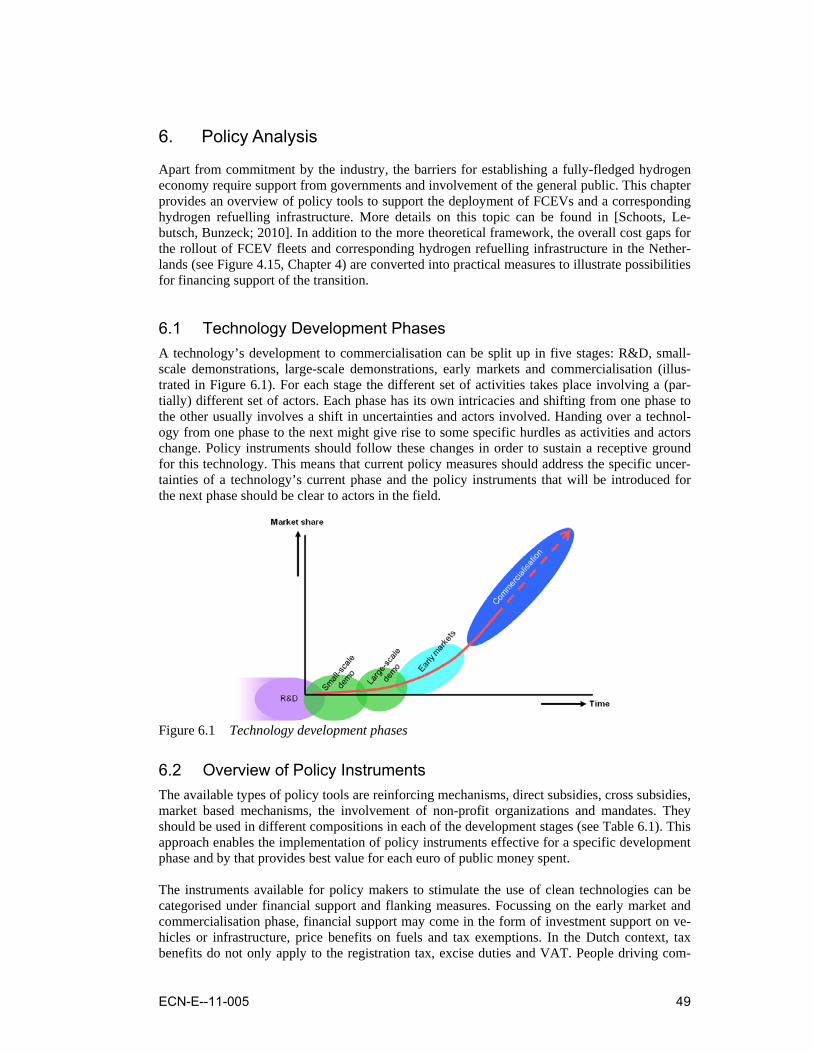
ECN-E--11-005 49
6. Policy Analysis
Apart from commitment by the industry, the barriers for establishing a fully-fledged hydrogen economy require support from governments and involvement of the general public. This chapter provides an overview of policy tools to support the deployment of FCEVs and a corresponding hydrogen refuelling infrastructure. More details on this topic can be found in [Schoots, Le-butsch, Bunzeck; 2010]. In addition to the more theoretical framework, the overall cost gaps for the rollout of FCEV fleets and corresponding hydrogen refuelling infrastructure in the Nether-lands (see Figure 4.15, Chapter 4) are converted into practical measures to illustrate possibilities for financing support of the transition.
6.1 Technology Development Phases A technology’s development to commercialisation can be split up in five stages: R&D, small-scale demonstrations, large-scale demonstrations, early markets and commercialisation (illus-trated in Figure 6.1). For each stage the different set of activities takes place involving a (par-tially) different set of actors. Each phase has its own intricacies and shifting from one phase to the other usually involves a shift in uncertainties and actors involved. Handing over a technol-ogy from one phase to the next might give rise to some specific hurdles as activities and actors change. Policy instruments should follow these changes in order to sustain a receptive ground for this technology. This means that current policy measures should address the specific uncer-tainties of a technology’s current phase and the policy instruments that will be introduced for the next phase should be clear to actors in the field.
Figure 6.1 Technology development phases
6.2 Overview of Policy Instruments The available types of policy tools are reinforcing mechanisms, direct subsidies, cross subsidies, market based mechanisms, the involvement of non-profit organizations and mandates. They should be used in different compositions in each of the development stages (see Table 6.1). This approach enables the implementation of policy instruments effective for a specific development phase and by that provides best value for each euro of public money spent. The instruments available for policy makers to stimulate the use of clean technologies can be categorised under financial support and flanking measures. Focussing on the early market and commercialisation phase, financial support may come in the form of investment support on ve-hicles or infrastructure, price benefits on fuels and tax exemptions. In the Dutch context, tax benefits do not only apply to the registration tax, excise duties and VAT. People driving com-
50 ECN-E--11-005
pany cars have to add a certain value to their income over which they have to pay income tax. Lowering the amount you have to add to your income for clean cars also leads to a tax benefit. Policy makers may address different target groups by installing support measures on different technology components (e.g. vehicles, fuel, and infrastructure). Table 6.2 gives an overview of which support measures may be used for stimulating the uptake of hydrogen technologies to ad-dress different target groups and technology components.
Table 6.1 Types of policy tools Phase Type of policy tool R&D • Reinforcing mechanisms e.g. awards and incentives contributing (but not
fully funding) to broader goal of accelerating development of H2 economy (public and private resources)
• Direct subsidies which are taxes/revenue sources for enabling programme (public resources)
Small scale demo • Reinforcing mechanisms e.g. awards and incentives contributing (but not fully funding) to broader goal of accelerating development of H2 economy (public and private resources)
• Direct subsidies which are taxes/revenue sources for enabling programme (public resources)
Large scale demo • Direct subsidies which are taxes/revenue sources for enabling programme (public resources)
• Cross subsidies transferring some benefit of current subsidy programme from existing recipients to new recipients (i.e. participating service providers for H2 infrastructure (public resources)
• Market based mechanisms influencing financial attractiveness of investments (private resources)
Early markets • Cross subsidies transferring some benefit of current subsidy programme from existing recipients to new recipients (i.e. participating service providers for H2 infrastructure (public resources)
• Market based mechanisms influencing financial attractiveness of investments (private resources)
• Involving Non-profit organisations with public service or embracing environmental/energy sustainability or economic development goals (private resources)
Commercialisation • Involving Non-profit organisations with public service or embracing environmental/energy sustainability or economic development goals(private resources)
• Mandates actively affecting behaviours of various private and public actors(private and public resources)
Flanking measures comprise activities aiming for uniform and effective regulations regarding the use of hydrogen as fuel, and testing and certification of FCEVs. Another policy issue related to flanking measures is the level of sustainability of hydrogen. Effective policy stimulates the use of innovative clean technologies over competing incumbent technologies which do not offer the perspective to reach (long-term) policy goals. However, this does not mean that all problems should be solved at the same time. This might be less feasible from an economic perspective, and might hinder development of the transition. Currently, cost of hydrogen are lowest for hy-drogen produced from natural gas40. Results indicate that use of hydrogen produced from natu-ral gas already leads to a reduction in emissions. Hydrogen produced from renewable sources is usually more expensive. Therefore, effective policy, could take hydrogen that is available from pathways today as a starting point, but should also include a strategy for the transition towards ‘clean and green’ hydrogen. 40 Another cost effective option for the initial phase may be the use of by-product hydrogen which is released in sig-
nificant amounts in the chloralkali industry.
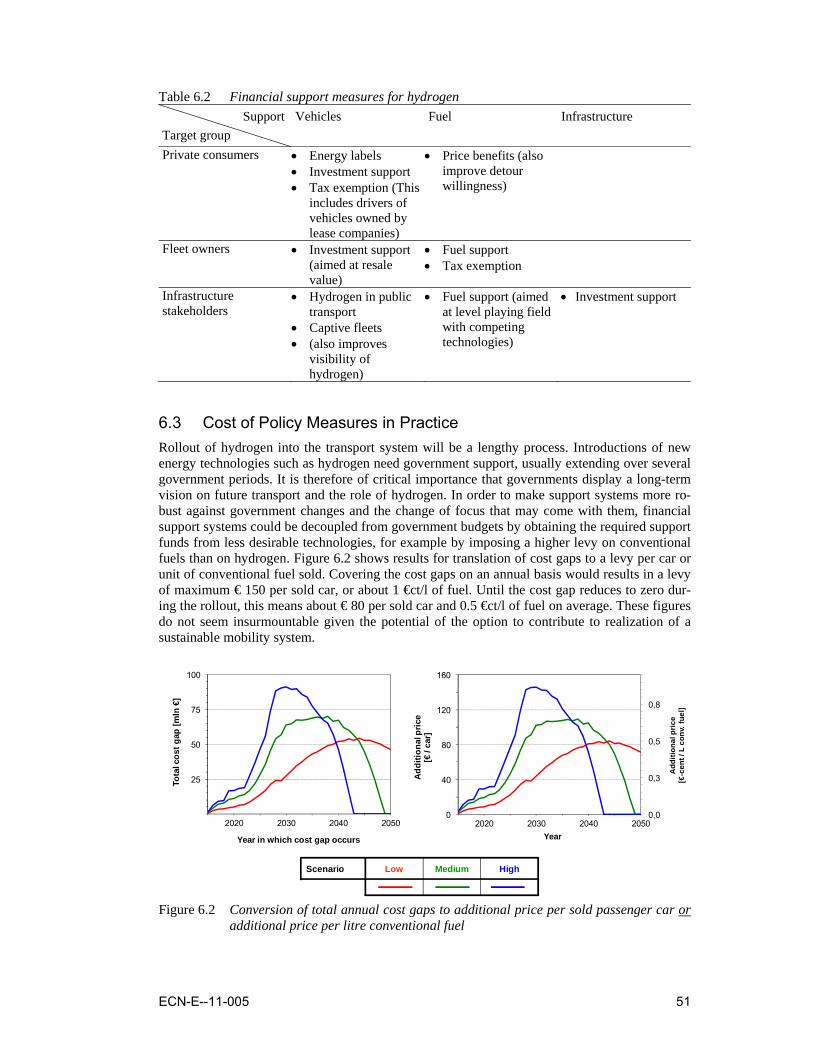
ECN-E--11-005 51
Table 6.2 Financial support measures for hydrogen Support
Target group Vehicles Fuel Infrastructure
Private consumers • Energy labels • Investment support • Tax exemption (This
includes drivers of vehicles owned by lease companies)
• Price benefits (also improve detour willingness)
Fleet owners • Investment support (aimed at resale value)
• Fuel support • Tax exemption
Infrastructure stakeholders
• Hydrogen in public transport
• Captive fleets • (also improves
visibility of hydrogen)
• Fuel support (aimed at level playing field with competing technologies)
• Investment support
6.3 Cost of Policy Measures in Practice Rollout of hydrogen into the transport system will be a lengthy process. Introductions of new energy technologies such as hydrogen need government support, usually extending over several government periods. It is therefore of critical importance that governments display a long-term vision on future transport and the role of hydrogen. In order to make support systems more ro-bust against government changes and the change of focus that may come with them, financial support systems could be decoupled from government budgets by obtaining the required support funds from less desirable technologies, for example by imposing a higher levy on conventional fuels than on hydrogen. Figure 6.2 shows results for translation of cost gaps to a levy per car or unit of conventional fuel sold. Covering the cost gaps on an annual basis would results in a levy of maximum € 150 per sold car, or about 1 €ct/l of fuel. Until the cost gap reduces to zero dur-ing the rollout, this means about € 80 per sold car and 0.5 €ct/l of fuel on average. These figures do not seem insurmountable given the potential of the option to contribute to realization of a sustainable mobility system.
Scenario Low Medium High
2020 2030 2040 2050
25
50
75
100
Tota
l cos
t gap
[mln
€]
Year in which cost gap occurs
2020 2030 2040 20500,0
0,3
0,5
0,8
0
40
80
120
160A
dditi
onal
pric
e[€
-cen
t / L
con
v. fu
el]
Add
ition
al p
rice
[€/ c
ar]
Year
Figure 6.2 Conversion of total annual cost gaps to additional price per sold passenger car or
additional price per litre conventional fuel
52 ECN-E--11-005
7. Conclusions
This report describes the result of the project ‘Towards a Hydrogen Refuelling Infrastructure for Vehicles (THRIVE)’, which has been carried out by the Energy research Centre of the Nether-lands (ECN) together with project partners Linde, Shell and the Dutch research institute TNO. The project deals with the rollout of hydrogen-powered fuel cell electric vehicle (FCEV) and a corresponding hydrogen refuelling infrastructure in the Netherlands. The focus is on the rollout in the period following the large-scale demonstration phase, when the new cars become com-mercially available and show up in the car dealers’ showrooms. Main objective of the project was to identify plausible scenarios for rollout of FCEVs and a cor-responding hydrogen refuelling infrastructure in the Netherlands, taking into account the inter-dependency of deployment of cars and the availability of hydrogen at refuelling stations. Central questions were: • How fast could rollout take place? • What are the additional costs involved compared to the reference cars and fuels? • What is the impact on greenhouse gas emissions of the light duty vehicles? To determine how fast rollout could take place a model has been developed that simulates de-ployment of FCEVs and refuelling infrastructure in spatial and temporal domains. The model simulates rollout as a result of consumers that buy the new cars based on availability of hydro-gen at refuelling station, the variety of FCEV models offered and the expectations of consumers regarding overall utility of the new cars. The model uses empirical data to represent refuelling behaviour of consumers and relevant deployment strategies for cars and refuelling infrastructure by car industry and fuel suppliers respectively. Coherent variation in parameter settings is used to model different policy scenarios. Financial and environmental impact of simulated scenarios have been assessed for a hydrogen delivery pathway based on central production of hydrogen from natural gas and transport of liq-uefied hydrogen to refuelling stations by trucks. Also the impact has been considered of low-carbon hydrogen options on greenhouse gas emissions from passenger cars. The main findings and conclusions are: Rollout of hydrogen and FCEVs takes time and requires perseverance. Three base case scenarios for rollout have been simulated which reflect ‘Low’, ‘Medium’ and ‘High’ policy ambition levels. Results of even the ‘High’ scenario indicate that it takes well over a decade before penetration becomes significant. The results of the ‘High’ scenario com-pare well with the development of the transition towards hybrid electric vehicles, like the Toy-ota Prius, so far. Model results thus appear realistic, also showing organic spatial growth in the simulations. As the simulation model uses potential customers as criterion for allocation of new refuelling infrastructure, initially rollout takes place in the Randstad and around the larger cities in the South (Noord-Brabant) and the central part of the Netherlands. With technical performance of FCEVs comparable to conventional cars and sufficient incentives in place, rollout simulations suggest that by 2050 up to more than 35% of all cars could be hydrogen powered FCEVs. The results for the three rollout scenarios indicate that by the year 2050, the penetration of FCEVs in the total passenger car fleet in the Netherlands could range from about 5% to more than 35% for the ‘Low’ and ‘High’ scenario respectively. In the ‘High’ scenario, penetration may decrease by about 10% if fuel suppliers aim at higher levels of infrastructure utilisation be-fore investing in new units. A similar decrease may result from a delay in deployment of addi-
ECN-E--11-005 53
tional FCEV models by the car industry. Higher penetration rates which may lead to levels even beyond 50% by 2050, can be expected under the following conditions: • An extension of the initial station network. • An increase of the replacement rate of cars through introducing FCEVs as company cars via
the car lease market, in addition to introduction via the private market. • Willingness of consumers to adapt their refuelling behaviour to initially limited hydrogen
availability. Hydrogen is viable. It offers good prospects for a sound business case … Discounted Cash Flow analysis shows that an average hydrogen price in the range of 4.5 to 5.9 €/kg (untaxed) is sufficient to cover all costs, and to break-even at the end of the lifetime of all investments done up to 2050. Here, the low figure is the cost at full utilisation of the refuelling infrastructure. The additional cost of up to 1.4 €/kg result from underutilisation of stations in the scenarios simulated. Further, the hydrogen price includes 2.2 €/kg for the production of hydro-gen by steam reforming of natural gas and 1 €/kg for liquefaction and transport of liquid hydro-gen by truck to the refuelling station. The remaining part are the minimum station forecourt cost, which in this study are calculated at 1.3 €/kg of hydrogen. The total average cost level of 4.5 to 5.9 €/kg (untaxed) is considerably lower than the current hydrogen price equivalent to gasoline41 which is assessed at about 10 €/kg based on a price of gasoline excluding VAT, but including excise duty. … however, to get started stimulation will be needed for first movers to overcome high initial cost levels and early investor disadvantages. Due to high underutilisation, the cost of hydrogen for stations in the initial period of rollout are up to 5 times higher than the cost of hydrogen resulting from the overall analysis. Initial cost well exceed the hydrogen price equivalent of gasoline, and passing on the high cost to the con-sumer would render hydrogen unattractive. In addition, early investors perceive much higher costs and higher risk factors than late investors, which benefit from decreasing cost of equip-ment and improvement of utilisation. So, while long-term prospects are good, the start-up period faces a serious hurdle that needs to be overcome through stimulation and coordinated action. Stimulation may take the form of financial support, but could also be non-financial measures. An example is to extend the licence period of stations for which a concession is needed. A longer period may persuade station owners to do investments which they may otherwise refrain from because of the risk factors involved. Hydrogen is affordable. The overall cost gap that needs to be bridged during rollout of FCEVs and matching refuelling infrastructure is significant, but relatively small com-pared to tax budgets related to road transport. The additional cost per FCEV and per unit of hydrogen compared to the reference technology has been translated into cost gaps that need to be bridged. Analysis of the cost gaps show the following: • The direct cost gap related to the refuelling infrastructure42 is small compared to the cost gap
related to vehicles, and amounts to about 5% of the combined cost gap. • Annual cost gaps that need to be bridged vary from year to year. For the ‘High’ scenario the
annual cost gap is assessed at 50 M€ on average for about 25-30 years. The maximum annual cost gap is 90 M€, 15 years after the start of the rollout. This is the moment in time when the cost decrease as a result of learning effects starts to dominate the development of overall ad-ditional costs of vehicles over the growing number of cars.
41 The price that results in equal specific fuel cost (€/km) for gasoline and hydrogen. 42 The direct cost gap results from cost of hydrogen exceeding the hydrogen price equivalent to the gasoline price
including excise duties. It does not include missed revenues from excise duties (indirect cost gap).
54 ECN-E--11-005
• The cumulative cost gap is of the order of 1 to 2 billion euro and needs to be bridged in a pe-riod of about 3 decades. This amount can decrease by up to 50% if consumers would be will-ing to pay 500 euro more for an FCEV compared to the reference car.
• One way to ensure a level playing field with regard to fuel cost per kilometre, is to provide an excise duty exemption for a certain period of time. This results in missed excise duty revenue for the government which can be considered as an ‘indirect’ refuelling infrastructure cost gap. Annual missed revenues from excise duties add up to 1.0 to 3.2 billion euro by 2050 for the rollout scenarios considered. Although significant, this appears to be considera-bly less than the current annual excise duties revenue from transport fuels. Also it appears to be only 1% to 3% of the cumulative amount of missed excise duty revenue from selling less fuel as a result of anticipated improvements in fuel efficiency of reference cars. The latter amount is assessed at about 90-100 M€.
• A way to finance support needed to bridge the cost gaps could be a levy on cars, fuels, or both. Covering cost gaps on an annual basis would result in a levy of maximum 150 €/car sold, or about 1 €ct/litre of fuel. This translates to about 80 €/car and 0.5 €ct/litre of fuel on average during the rollout until the cost gap reduces to zero.
Hydrogen and FCEVs show good prospects for substantial emission reduction FCEV are zero emission vehicles, which means that locally there are no emissions. Further-more, analysis shows that FCEVs offer significant potential for CO2 emission reduction on a well-to-wheels basis. This even holds if hydrogen is produced from natural gas and the option is compared to a reference case with a fuel blend including 30% biofuels. Specific emission reduc-tions vary from 15% up to 80%, depending on the carbon intensity of the fuel displaced, and whether or not hydrogen production is combined with CCS. For the rollout scenarios considered this translates to reductions up to 30-40% in 2050 compared to a scenario based on optimisation of incumbent technology. These higher figures apply to scenarios including capture and store CO2. If this is not possible, similar, and even better results can be obtained if hydrogen is pro-duced largely from renewable sources by 2050. Cost effectiveness of ambitious rollout scenarios compare favourably to scenarios with lower ambitions Relating cars on the road in 2050 to money spent to bridge the cost gaps arising from the base case rollout scenarios considered, indicate that the ‘High’ scenario is up to 2 times more cost effective than the ‘Medium’ scenario and up to 4 times more cost effective than the ‘Low’ sce-nario. Coordination is necessary to bring about the simultaneous rollout of FCEVs and refuel-ling infrastructure. This requires specific and consistent policy aimed at cars, refuelling infrastructure and fuel. These measures should convince all stakeholders involved to do the required long term investments. This study concludes that hydrogen is affordable, viable and offers good prospects for large emission reductions in road transport. Costs involved are significant, but do not seem insur-mountable. However, initial cost and risk factors are relatively high, and thus will require spe-cific incentives to invite the relevant stakeholders to start investing. Furthermore, as transition takes time, it is of critical importance that governments develop a long-term vision on the role of hydrogen in future transport, including a vision on low carbon hydrogen. Ideally, this vision is supported by an appropriate and robust policy framework.
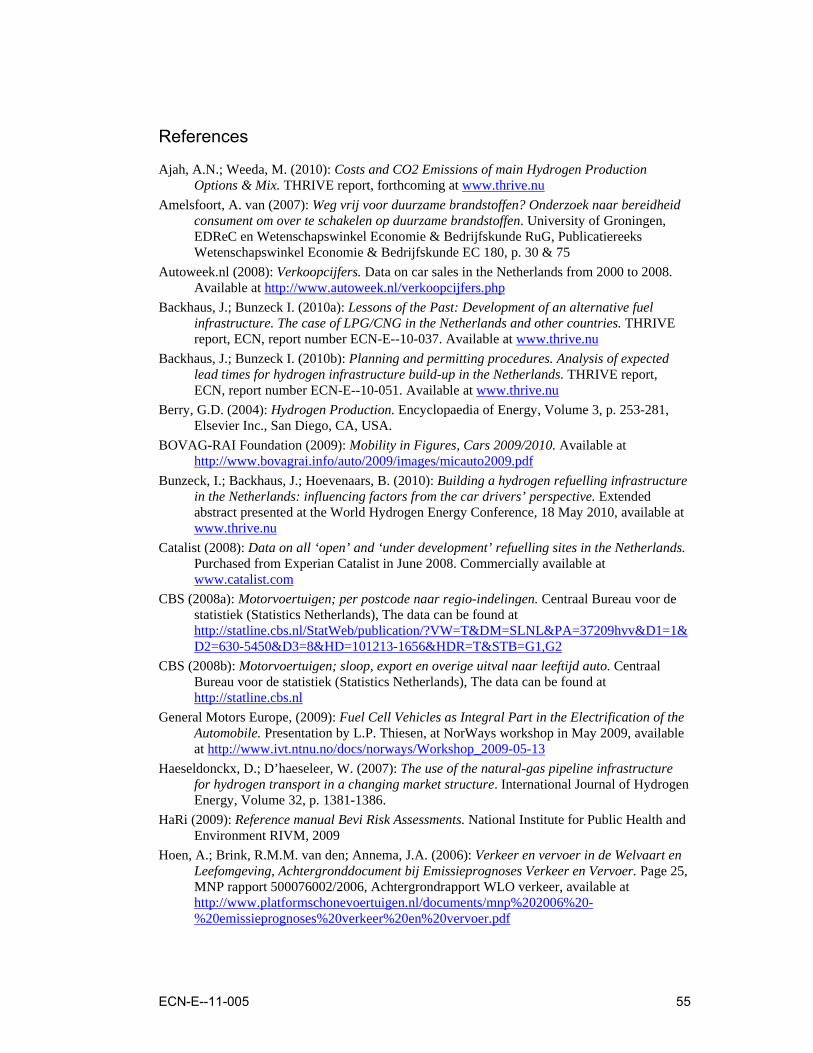
ECN-E--11-005 55
References
Ajah, A.N.; Weeda, M. (2010): Costs and CO2 Emissions of main Hydrogen Production Options & Mix. THRIVE report, forthcoming at www.thrive.nu
Amelsfoort, A. van (2007): Weg vrij voor duurzame brandstoffen? Onderzoek naar bereidheid consument om over te schakelen op duurzame brandstoffen. University of Groningen, EDReC en Wetenschapswinkel Economie & Bedrijfskunde RuG, Publicatiereeks Wetenschapswinkel Economie & Bedrijfskunde EC 180, p. 30 & 75
Autoweek.nl (2008): Verkoopcijfers. Data on car sales in the Netherlands from 2000 to 2008. Available at http://www.autoweek.nl/verkoopcijfers.php
Backhaus, J.; Bunzeck I. (2010a): Lessons of the Past: Development of an alternative fuel infrastructure. The case of LPG/CNG in the Netherlands and other countries. THRIVE report, ECN, report number ECN-E--10-037. Available at www.thrive.nu
Backhaus, J.; Bunzeck I. (2010b): Planning and permitting procedures. Analysis of expected lead times for hydrogen infrastructure build-up in the Netherlands. THRIVE report, ECN, report number ECN-E--10-051. Available at www.thrive.nu
Berry, G.D. (2004): Hydrogen Production. Encyclopaedia of Energy, Volume 3, p. 253-281, Elsevier Inc., San Diego, CA, USA.
BOVAG-RAI Foundation (2009): Mobility in Figures, Cars 2009/2010. Available at http://www.bovagrai.info/auto/2009/images/micauto2009.pdf
Bunzeck, I.; Backhaus, J.; Hoevenaars, B. (2010): Building a hydrogen refuelling infrastructure in the Netherlands: influencing factors from the car drivers’ perspective. Extended abstract presented at the World Hydrogen Energy Conference, 18 May 2010, available at www.thrive.nu
Catalist (2008): Data on all ‘open’ and ‘under development’ refuelling sites in the Netherlands. Purchased from Experian Catalist in June 2008. Commercially available at www.catalist.com
CBS (2008a): Motorvoertuigen; per postcode naar regio-indelingen. Centraal Bureau voor de statistiek (Statistics Netherlands), The data can be found at http://statline.cbs.nl/StatWeb/publication/?VW=T&DM=SLNL&PA=37209hvv&D1=1&D2=630-5450&D3=8&HD=101213-1656&HDR=T&STB=G1,G2
CBS (2008b): Motorvoertuigen; sloop, export en overige uitval naar leeftijd auto. Centraal Bureau voor de statistiek (Statistics Netherlands), The data can be found at http://statline.cbs.nl
General Motors Europe, (2009): Fuel Cell Vehicles as Integral Part in the Electrification of the Automobile. Presentation by L.P. Thiesen, at NorWays workshop in May 2009, available at http://www.ivt.ntnu.no/docs/norways/Workshop_2009-05-13
Haeseldonckx, D.; D’haeseleer, W. (2007): The use of the natural-gas pipeline infrastructure for hydrogen transport in a changing market structure. International Journal of Hydrogen Energy, Volume 32, p. 1381-1386.
HaRi (2009): Reference manual Bevi Risk Assessments. National Institute for Public Health and Environment RIVM, 2009
Hoen, A.; Brink, R.M.M. van den; Annema, J.A. (2006): Verkeer en vervoer in de Welvaart en Leefomgeving, Achtergronddocument bij Emissieprognoses Verkeer en Vervoer. Page 25, MNP rapport 500076002/2006, Achtergrondrapport WLO verkeer, available at http://www.platformschonevoertuigen.nl/documents/mnp%202006%20-%20emissieprognoses%20verkeer%20en%20vervoer.pdf
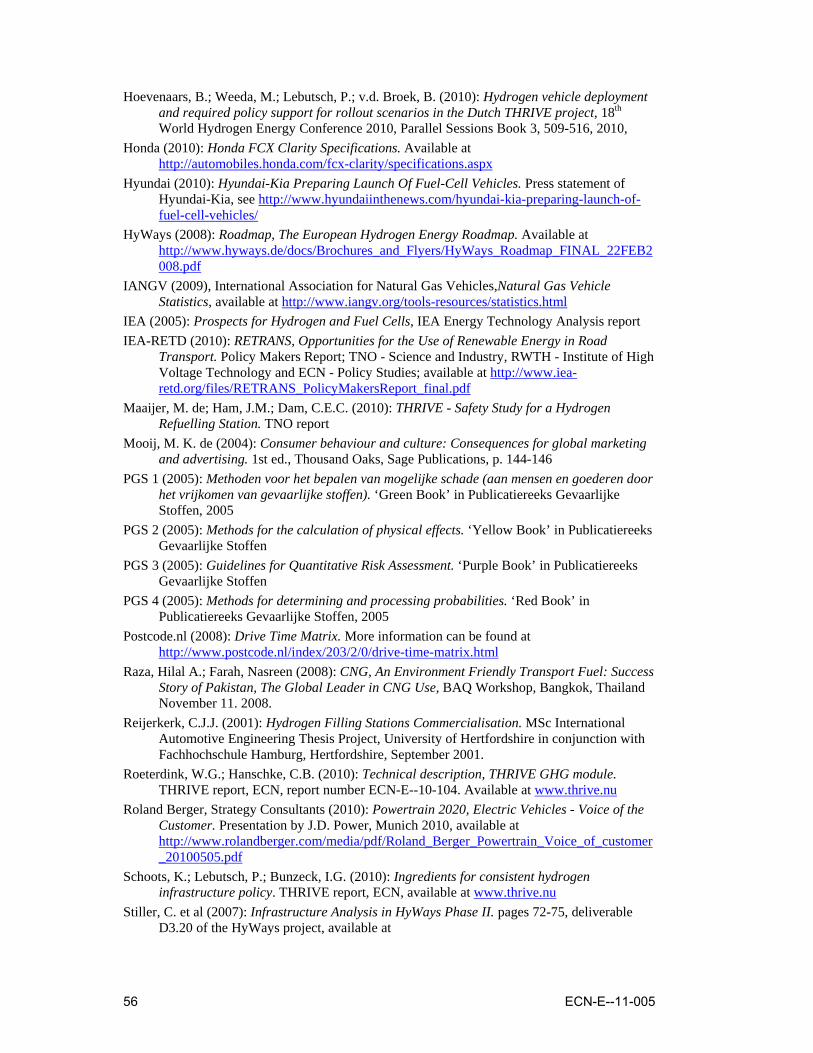
56 ECN-E--11-005
Hoevenaars, B.; Weeda, M.; Lebutsch, P.; v.d. Broek, B. (2010): Hydrogen vehicle deployment and required policy support for rollout scenarios in the Dutch THRIVE project, 18th World Hydrogen Energy Conference 2010, Parallel Sessions Book 3, 509-516, 2010,
Honda (2010): Honda FCX Clarity Specifications. Available at http://automobiles.honda.com/fcx-clarity/specifications.aspx
Hyundai (2010): Hyundai-Kia Preparing Launch Of Fuel-Cell Vehicles. Press statement of Hyundai-Kia, see http://www.hyundaiinthenews.com/hyundai-kia-preparing-launch-of-fuel-cell-vehicles/
HyWays (2008): Roadmap, The European Hydrogen Energy Roadmap. Available at http://www.hyways.de/docs/Brochures_and_Flyers/HyWays_Roadmap_FINAL_22FEB2008.pdf
IANGV (2009), International Association for Natural Gas Vehicles,Natural Gas Vehicle Statistics, available at http://www.iangv.org/tools-resources/statistics.html
IEA (2005): Prospects for Hydrogen and Fuel Cells, IEA Energy Technology Analysis report IEA-RETD (2010): RETRANS, Opportunities for the Use of Renewable Energy in Road
Transport. Policy Makers Report; TNO - Science and Industry, RWTH - Institute of High Voltage Technology and ECN - Policy Studies; available at http://www.iea-retd.org/files/RETRANS_PolicyMakersReport_final.pdf
Maaijer, M. de; Ham, J.M.; Dam, C.E.C. (2010): THRIVE - Safety Study for a Hydrogen Refuelling Station. TNO report
Mooij, M. K. de (2004): Consumer behaviour and culture: Consequences for global marketing and advertising. 1st ed., Thousand Oaks, Sage Publications, p. 144-146
PGS 1 (2005): Methoden voor het bepalen van mogelijke schade (aan mensen en goederen door het vrijkomen van gevaarlijke stoffen). ‘Green Book’ in Publicatiereeks Gevaarlijke Stoffen, 2005
PGS 2 (2005): Methods for the calculation of physical effects. ‘Yellow Book’ in Publicatiereeks Gevaarlijke Stoffen
PGS 3 (2005): Guidelines for Quantitative Risk Assessment. ‘Purple Book’ in Publicatiereeks Gevaarlijke Stoffen
PGS 4 (2005): Methods for determining and processing probabilities. ‘Red Book’ in Publicatiereeks Gevaarlijke Stoffen, 2005
Postcode.nl (2008): Drive Time Matrix. More information can be found at http://www.postcode.nl/index/203/2/0/drive-time-matrix.html
Raza, Hilal A.; Farah, Nasreen (2008): CNG, An Environment Friendly Transport Fuel: Success Story of Pakistan, The Global Leader in CNG Use, BAQ Workshop, Bangkok, Thailand November 11. 2008.
Reijerkerk, C.J.J. (2001): Hydrogen Filling Stations Commercialisation. MSc International Automotive Engineering Thesis Project, University of Hertfordshire in conjunction with Fachhochschule Hamburg, Hertfordshire, September 2001.
Roeterdink, W.G.; Hanschke, C.B. (2010): Technical description, THRIVE GHG module. THRIVE report, ECN, report number ECN-E--10-104. Available at www.thrive.nu
Roland Berger, Strategy Consultants (2010): Powertrain 2020, Electric Vehicles - Voice of the Customer. Presentation by J.D. Power, Munich 2010, available at http://www.rolandberger.com/media/pdf/Roland_Berger_Powertrain_Voice_of_customer_20100505.pdf
Schoots, K.; Lebutsch, P.; Bunzeck, I.G. (2010): Ingredients for consistent hydrogen infrastructure policy. THRIVE report, ECN, available at www.thrive.nu
Stiller, C. et al (2007): Infrastructure Analysis in HyWays Phase II. pages 72-75, deliverable D3.20 of the HyWays project, available at

ECN-E--11-005 57
http://www.hyways.de/docs/deliverables/WP3/HyWays_D3.20_Infrastructure_Analysis.pdf
Toyota (2010): Toyota Plans $50,000 Hydrogen Fuel-Cell Sedan by 2015. Press statement of Toyota, see http://www.bloomberg.com/news/2010-05-06/toyota-targets-50-000-range-for-hydrogen-powered-sedan-planned-by-2015.html
TÜV Süddeutschland Holding AG (2003): Energiewelt Wasserstoff. TÜV Süddeutschland Verlag; München, Germany, May 2003.
VNA (2008): VNA Autoleasemarkt Jaarcijfers 2008. Lease-car market statistics published by the Dutch association of lease-car companies. Available at http://www.vna-lease.nl/docs/VNA%20Jaarcijfers%202008.pdf?ctx=1346,1368,71381
Yeh, S. (2007): An empirical analysis on the adoption of alternative fuel vehicles: The case of natural gas vehicles, Energy Policy, 35 , 5865-5875, 2007.
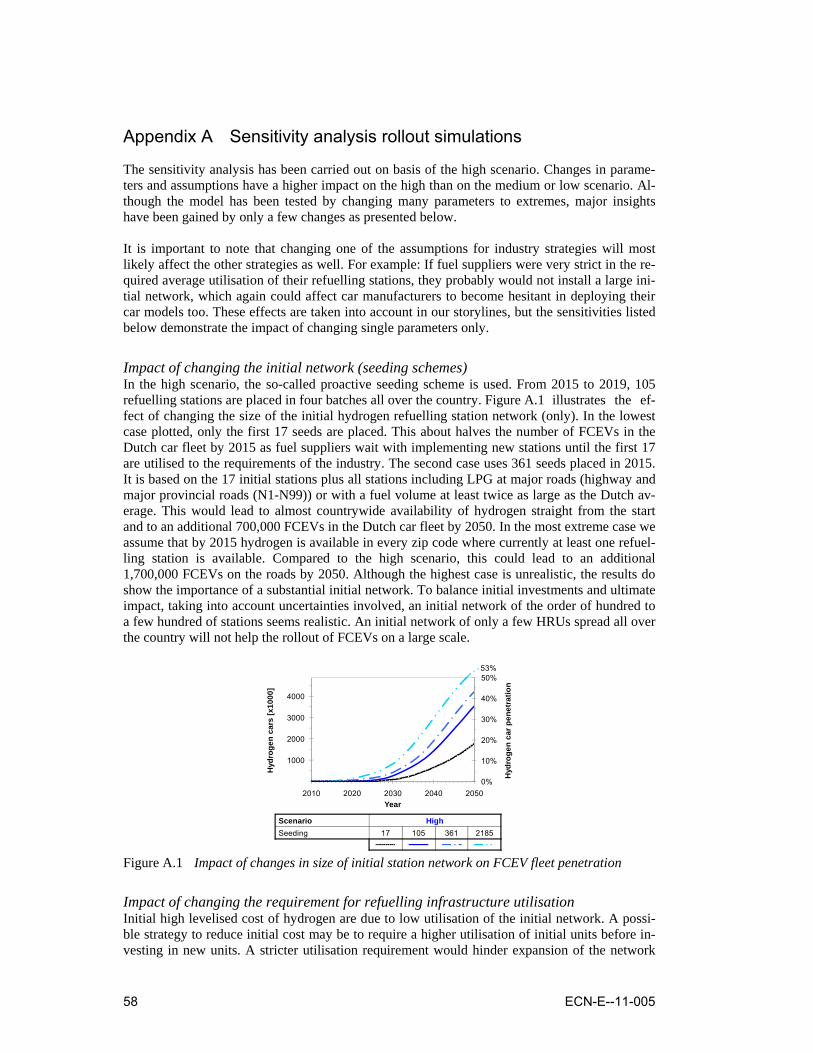
58 ECN-E--11-005
Appendix A Sensitivity analysis rollout simulations
The sensitivity analysis has been carried out on basis of the high scenario. Changes in parame-ters and assumptions have a higher impact on the high than on the medium or low scenario. Al-though the model has been tested by changing many parameters to extremes, major insights have been gained by only a few changes as presented below. It is important to note that changing one of the assumptions for industry strategies will most likely affect the other strategies as well. For example: If fuel suppliers were very strict in the re-quired average utilisation of their refuelling stations, they probably would not install a large ini-tial network, which again could affect car manufacturers to become hesitant in deploying their car models too. These effects are taken into account in our storylines, but the sensitivities listed below demonstrate the impact of changing single parameters only.
Impact of changing the initial network (seeding schemes) In the high scenario, the so-called proactive seeding scheme is used. From 2015 to 2019, 105 refuelling stations are placed in four batches all over the country. Figure A.1 illustrates the ef-fect of changing the size of the initial hydrogen refuelling station network (only). In the lowest case plotted, only the first 17 seeds are placed. This about halves the number of FCEVs in the Dutch car fleet by 2015 as fuel suppliers wait with implementing new stations until the first 17 are utilised to the requirements of the industry. The second case uses 361 seeds placed in 2015. It is based on the 17 initial stations plus all stations including LPG at major roads (highway and major provincial roads (N1-N99)) or with a fuel volume at least twice as large as the Dutch av-erage. This would lead to almost countrywide availability of hydrogen straight from the start and to an additional 700,000 FCEVs in the Dutch car fleet by 2050. In the most extreme case we assume that by 2015 hydrogen is available in every zip code where currently at least one refuel-ling station is available. Compared to the high scenario, this could lead to an additional 1,700,000 FCEVs on the roads by 2050. Although the highest case is unrealistic, the results do show the importance of a substantial initial network. To balance initial investments and ultimate impact, taking into account uncertainties involved, an initial network of the order of hundred to a few hundred of stations seems realistic. An initial network of only a few HRUs spread all over the country will not help the rollout of FCEVs on a large scale.
0%
10%
20%
30%
40%
50%
1000
2000
3000
4000
2010 2020 2030 2040 2050
Hyd
roge
n ca
r pen
etra
tion
Hyd
roge
n ca
rs [x
1000
]
Year
Scenario HighSeeding 17 105 361 2185
53%
Figure A.1 Impact of changes in size of initial station network on FCEV fleet penetration
Impact of changing the requirement for refuelling infrastructure utilisation Initial high levelised cost of hydrogen are due to low utilisation of the initial network. A possi-ble strategy to reduce initial cost may be to require a higher utilisation of initial units before in-vesting in new units. A stricter utilisation requirement would hinder expansion of the network
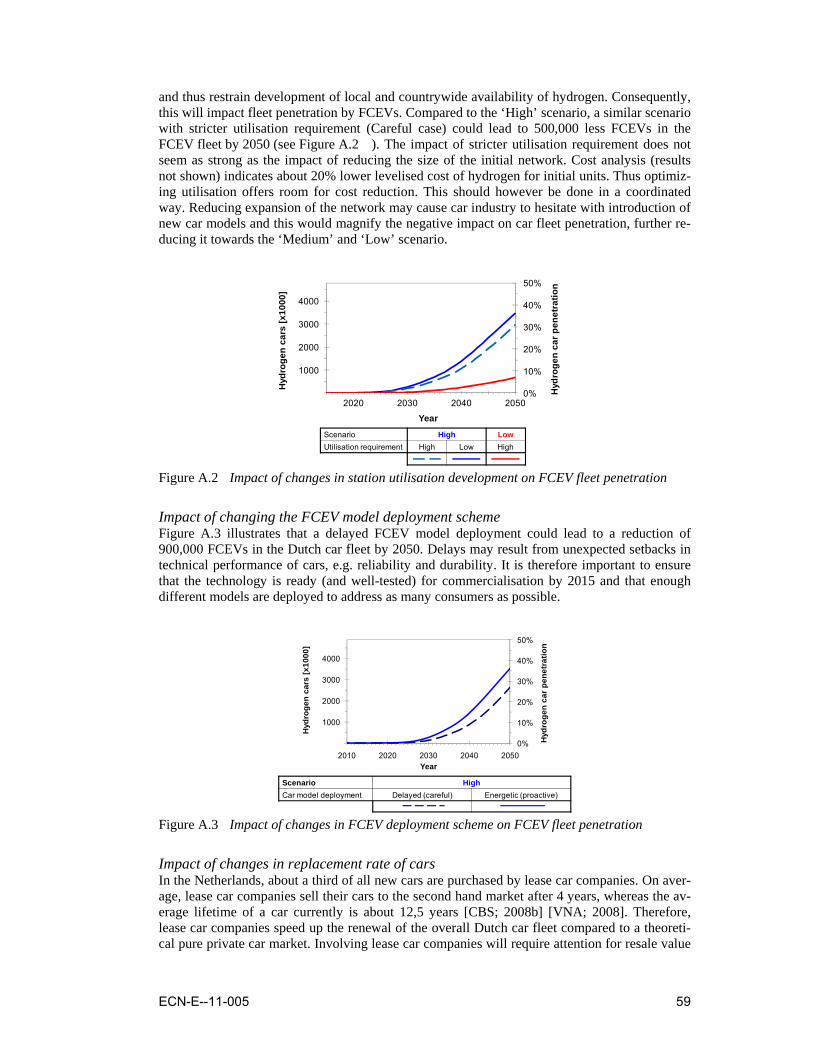
ECN-E--11-005 59
and thus restrain development of local and countrywide availability of hydrogen. Consequently, this will impact fleet penetration by FCEVs. Compared to the ‘High’ scenario, a similar scenario with stricter utilisation requirement (Careful case) could lead to 500,000 less FCEVs in the FCEV fleet by 2050 (see Figure A.2 ). The impact of stricter utilisation requirement does not seem as strong as the impact of reducing the size of the initial network. Cost analysis (results not shown) indicates about 20% lower levelised cost of hydrogen for initial units. Thus optimiz-ing utilisation offers room for cost reduction. This should however be done in a coordinated way. Reducing expansion of the network may cause car industry to hesitate with introduction of new car models and this would magnify the negative impact on car fleet penetration, further re-ducing it towards the ‘Medium’ and ‘Low’ scenario.
2020 2030 2040 20500%
10%
20%
30%
40%
50%
1000
2000
3000
4000
Hyd
roge
n ca
r pen
etra
tion
Hyd
roge
n ca
rs [x
1000
]
Year
Scenario High LowUtilisation requirement High Low High
Figure A.2 Impact of changes in station utilisation development on FCEV fleet penetration
Impact of changing the FCEV model deployment scheme Figure A.3 illustrates that a delayed FCEV model deployment could lead to a reduction of 900,000 FCEVs in the Dutch car fleet by 2050. Delays may result from unexpected setbacks in technical performance of cars, e.g. reliability and durability. It is therefore important to ensure that the technology is ready (and well-tested) for commercialisation by 2015 and that enough different models are deployed to address as many consumers as possible.
Scenario HighCar model deployment Delayed (careful) Energetic (proactive)
0%
10%
20%
30%
40%
50%
1000
2000
3000
4000
2010 2020 2030 2040 2050
Hyd
roge
n ca
r pen
etra
tion
Hyd
roge
n ca
rs [x
1000
]
Year
Figure A.3 Impact of changes in FCEV deployment scheme on FCEV fleet penetration
Impact of changes in replacement rate of cars In the Netherlands, about a third of all new cars are purchased by lease car companies. On aver-age, lease car companies sell their cars to the second hand market after 4 years, whereas the av-erage lifetime of a car currently is about 12,5 years [CBS; 2008b] [VNA; 2008]. Therefore, lease car companies speed up the renewal of the overall Dutch car fleet compared to a theoreti-cal pure private car market. Involving lease car companies will require attention for resale value
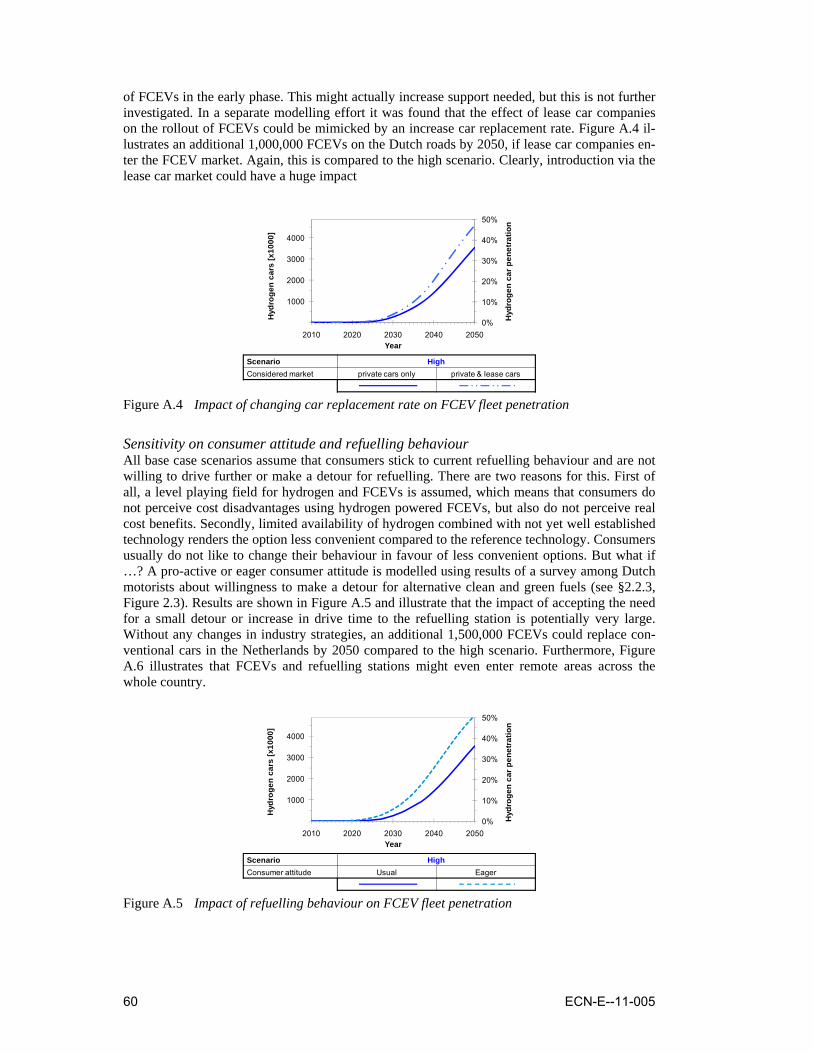
60 ECN-E--11-005
of FCEVs in the early phase. This might actually increase support needed, but this is not further investigated. In a separate modelling effort it was found that the effect of lease car companies on the rollout of FCEVs could be mimicked by an increase car replacement rate. Figure A.4 il-lustrates an additional 1,000,000 FCEVs on the Dutch roads by 2050, if lease car companies en-ter the FCEV market. Again, this is compared to the high scenario. Clearly, introduction via the lease car market could have a huge impact
0%
10%
20%
30%
40%
50%
1000
2000
3000
4000
2010 2020 2030 2040 2050
Hyd
roge
n ca
r pen
etra
tion
Hyd
roge
n ca
rs [x
1000
]
Year
Scenario HighConsidered market private cars only private & lease cars
Figure A.4 Impact of changing car replacement rate on FCEV fleet penetration
Sensitivity on consumer attitude and refuelling behaviour All base case scenarios assume that consumers stick to current refuelling behaviour and are not willing to drive further or make a detour for refuelling. There are two reasons for this. First of all, a level playing field for hydrogen and FCEVs is assumed, which means that consumers do not perceive cost disadvantages using hydrogen powered FCEVs, but also do not perceive real cost benefits. Secondly, limited availability of hydrogen combined with not yet well established technology renders the option less convenient compared to the reference technology. Consumers usually do not like to change their behaviour in favour of less convenient options. But what if …? A pro-active or eager consumer attitude is modelled using results of a survey among Dutch motorists about willingness to make a detour for alternative clean and green fuels (see §2.2.3, Figure 2.3). Results are shown in Figure A.5 and illustrate that the impact of accepting the need for a small detour or increase in drive time to the refuelling station is potentially very large. Without any changes in industry strategies, an additional 1,500,000 FCEVs could replace con-ventional cars in the Netherlands by 2050 compared to the high scenario. Furthermore, Figure A.6 illustrates that FCEVs and refuelling stations might even enter remote areas across the whole country.
0%
10%
20%
30%
40%
50%
1000
2000
3000
4000
2010 2020 2030 2040 2050
Hyd
roge
n ca
r pen
etra
tion
Hyd
roge
n ca
rs [x
1000
]
Year
Scenario HighConsumer attitude Usual Eager
Figure A.5 Impact of refuelling behaviour on FCEV fleet penetration
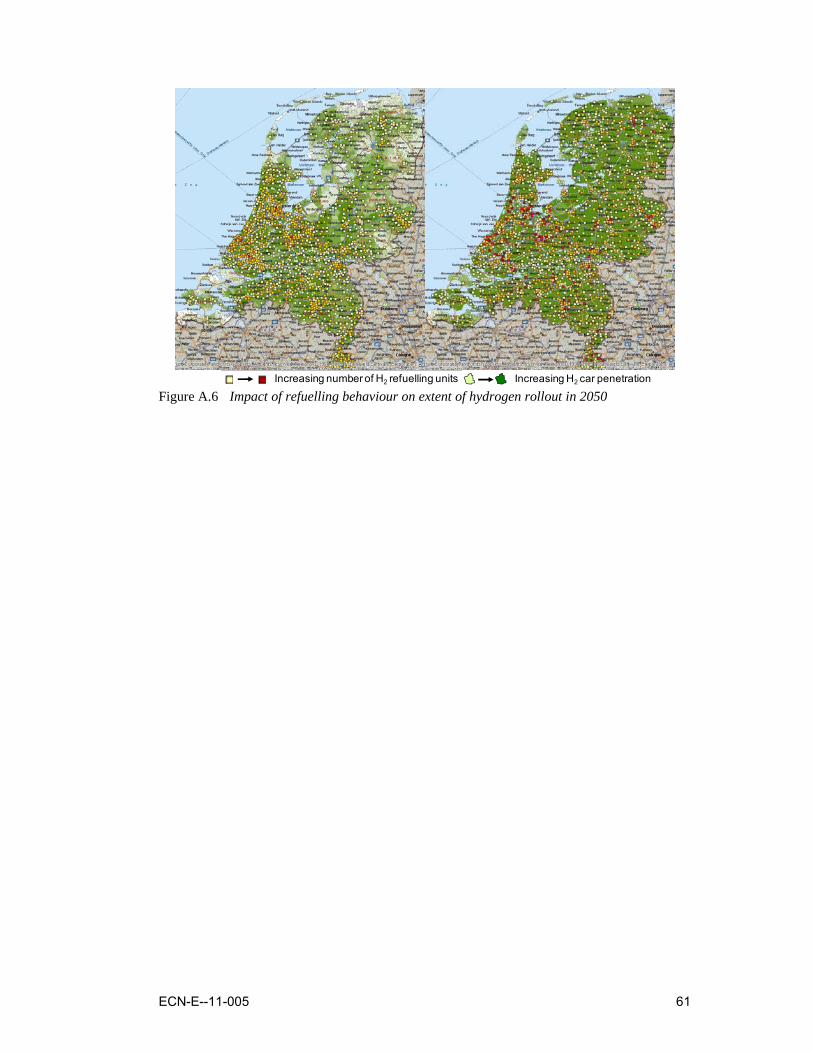
ECN-E--11-005 61
Increasing number of H2 refuelling units Increasing H2 car penetration
Figure A.6 Impact of refuelling behaviour on extent of hydrogen rollout in 2050
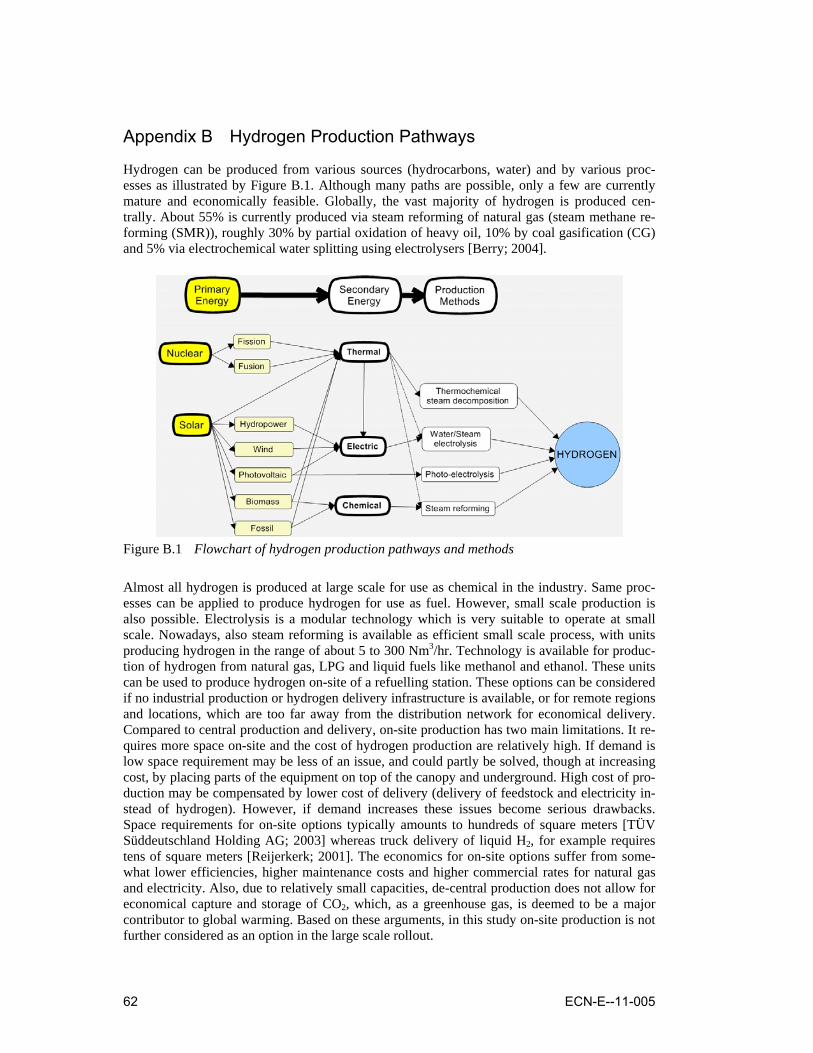
62 ECN-E--11-005
Appendix B Hydrogen Production Pathways
Hydrogen can be produced from various sources (hydrocarbons, water) and by various proc-esses as illustrated by Figure B.1. Although many paths are possible, only a few are currently mature and economically feasible. Globally, the vast majority of hydrogen is produced cen-trally. About 55% is currently produced via steam reforming of natural gas (steam methane re-forming (SMR)), roughly 30% by partial oxidation of heavy oil, 10% by coal gasification (CG) and 5% via electrochemical water splitting using electrolysers [Berry; 2004].
Figure B.1 Flowchart of hydrogen production pathways and methods
Almost all hydrogen is produced at large scale for use as chemical in the industry. Same proc-esses can be applied to produce hydrogen for use as fuel. However, small scale production is also possible. Electrolysis is a modular technology which is very suitable to operate at small scale. Nowadays, also steam reforming is available as efficient small scale process, with units producing hydrogen in the range of about 5 to 300 Nm3/hr. Technology is available for produc-tion of hydrogen from natural gas, LPG and liquid fuels like methanol and ethanol. These units can be used to produce hydrogen on-site of a refuelling station. These options can be considered if no industrial production or hydrogen delivery infrastructure is available, or for remote regions and locations, which are too far away from the distribution network for economical delivery. Compared to central production and delivery, on-site production has two main limitations. It re-quires more space on-site and the cost of hydrogen production are relatively high. If demand is low space requirement may be less of an issue, and could partly be solved, though at increasing cost, by placing parts of the equipment on top of the canopy and underground. High cost of pro-duction may be compensated by lower cost of delivery (delivery of feedstock and electricity in-stead of hydrogen). However, if demand increases these issues become serious drawbacks. Space requirements for on-site options typically amounts to hundreds of square meters [TÜV Süddeutschland Holding AG; 2003] whereas truck delivery of liquid H2, for example requires tens of square meters [Reijerkerk; 2001]. The economics for on-site options suffer from some-what lower efficiencies, higher maintenance costs and higher commercial rates for natural gas and electricity. Also, due to relatively small capacities, de-central production does not allow for economical capture and storage of CO2, which, as a greenhouse gas, is deemed to be a major contributor to global warming. Based on these arguments, in this study on-site production is not further considered as an option in the large scale rollout.
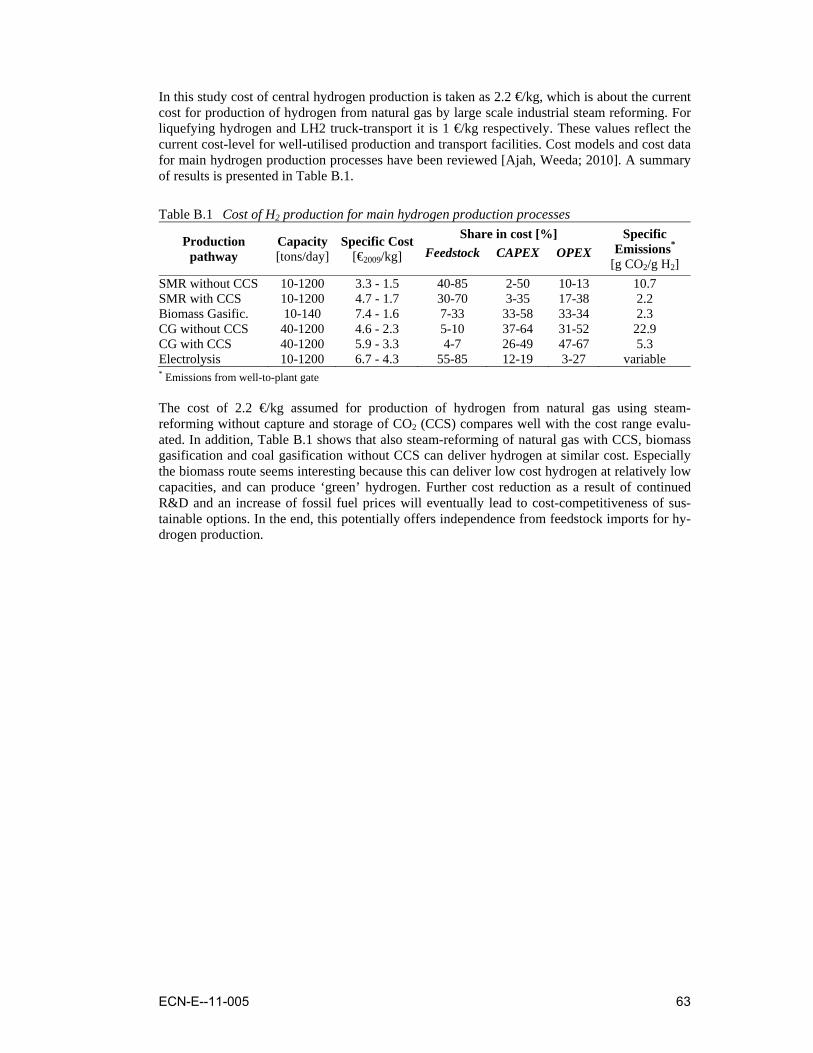
ECN-E--11-005 63
In this study cost of central hydrogen production is taken as 2.2 €/kg, which is about the current cost for production of hydrogen from natural gas by large scale industrial steam reforming. For liquefying hydrogen and LH2 truck-transport it is 1 €/kg respectively. These values reflect the current cost-level for well-utilised production and transport facilities. Cost models and cost data for main hydrogen production processes have been reviewed [Ajah, Weeda; 2010]. A summary of results is presented in Table B.1.
Table B.1 Cost of H2 production for main hydrogen production processes
Production pathway
Capacity[tons/day]
Specific Cost[€2009/kg]
Share in cost [%] Specific Emissions*
[g CO2/g H2] Feedstock CAPEX OPEX
SMR without CCS 10-1200 3.3 - 1.5 40-85 2-50 10-13 10.7 SMR with CCS 10-1200 4.7 - 1.7 30-70 3-35 17-38 2.2 Biomass Gasific. 10-140 7.4 - 1.6 7-33 33-58 33-34 2.3 CG without CCS 40-1200 4.6 - 2.3 5-10 37-64 31-52 22.9 CG with CCS 40-1200 5.9 - 3.3 4-7 26-49 47-67 5.3 Electrolysis 10-1200 6.7 - 4.3 55-85 12-19 3-27 variable * Emissions from well-to-plant gate The cost of 2.2 €/kg assumed for production of hydrogen from natural gas using steam-reforming without capture and storage of CO2 (CCS) compares well with the cost range evalu-ated. In addition, Table B.1 shows that also steam-reforming of natural gas with CCS, biomass gasification and coal gasification without CCS can deliver hydrogen at similar cost. Especially the biomass route seems interesting because this can deliver low cost hydrogen at relatively low capacities, and can produce ‘green’ hydrogen. Further cost reduction as a result of continued R&D and an increase of fossil fuel prices will eventually lead to cost-competitiveness of sus-tainable options. In the end, this potentially offers independence from feedstock imports for hy-drogen production.
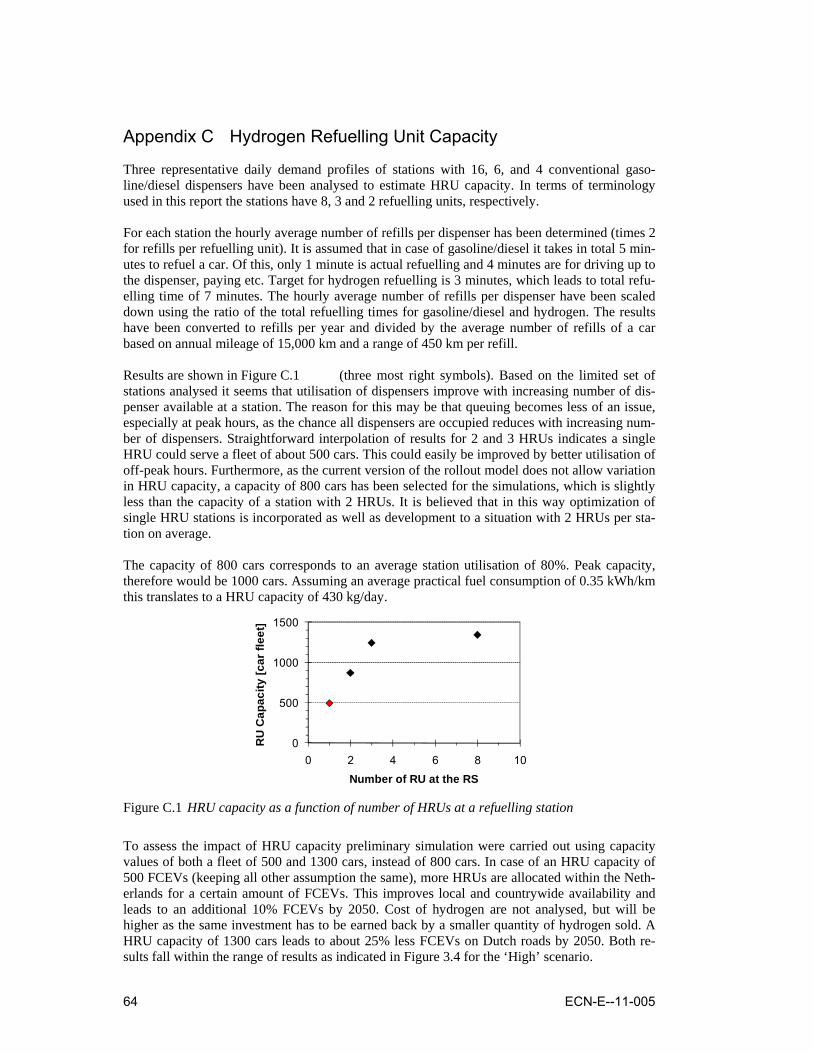
64 ECN-E--11-005
Appendix C Hydrogen Refuelling Unit Capacity
Three representative daily demand profiles of stations with 16, 6, and 4 conventional gaso-line/diesel dispensers have been analysed to estimate HRU capacity. In terms of terminology used in this report the stations have 8, 3 and 2 refuelling units, respectively. For each station the hourly average number of refills per dispenser has been determined (times 2 for refills per refuelling unit). It is assumed that in case of gasoline/diesel it takes in total 5 min-utes to refuel a car. Of this, only 1 minute is actual refuelling and 4 minutes are for driving up to the dispenser, paying etc. Target for hydrogen refuelling is 3 minutes, which leads to total refu-elling time of 7 minutes. The hourly average number of refills per dispenser have been scaled down using the ratio of the total refuelling times for gasoline/diesel and hydrogen. The results have been converted to refills per year and divided by the average number of refills of a car based on annual mileage of 15,000 km and a range of 450 km per refill. Results are shown in Figure C.1 (three most right symbols). Based on the limited set of stations analysed it seems that utilisation of dispensers improve with increasing number of dis-penser available at a station. The reason for this may be that queuing becomes less of an issue, especially at peak hours, as the chance all dispensers are occupied reduces with increasing num-ber of dispensers. Straightforward interpolation of results for 2 and 3 HRUs indicates a single HRU could serve a fleet of about 500 cars. This could easily be improved by better utilisation of off-peak hours. Furthermore, as the current version of the rollout model does not allow variation in HRU capacity, a capacity of 800 cars has been selected for the simulations, which is slightly less than the capacity of a station with 2 HRUs. It is believed that in this way optimization of single HRU stations is incorporated as well as development to a situation with 2 HRUs per sta-tion on average. The capacity of 800 cars corresponds to an average station utilisation of 80%. Peak capacity, therefore would be 1000 cars. Assuming an average practical fuel consumption of 0.35 kWh/km this translates to a HRU capacity of 430 kg/day.
0
500
1000
1500
0 2 4 6 8 10
RU
Cap
acity
[car
flee
t]
Number of RU at the RS
Figure C.1 HRU capacity as a function of number of HRUs at a refuelling station
To assess the impact of HRU capacity preliminary simulation were carried out using capacity values of both a fleet of 500 and 1300 cars, instead of 800 cars. In case of an HRU capacity of 500 FCEVs (keeping all other assumption the same), more HRUs are allocated within the Neth-erlands for a certain amount of FCEVs. This improves local and countrywide availability and leads to an additional 10% FCEVs by 2050. Cost of hydrogen are not analysed, but will be higher as the same investment has to be earned back by a smaller quantity of hydrogen sold. A HRU capacity of 1300 cars leads to about 25% less FCEVs on Dutch roads by 2050. Both re-sults fall within the range of results as indicated in Figure 3.4 for the ‘High’ scenario.
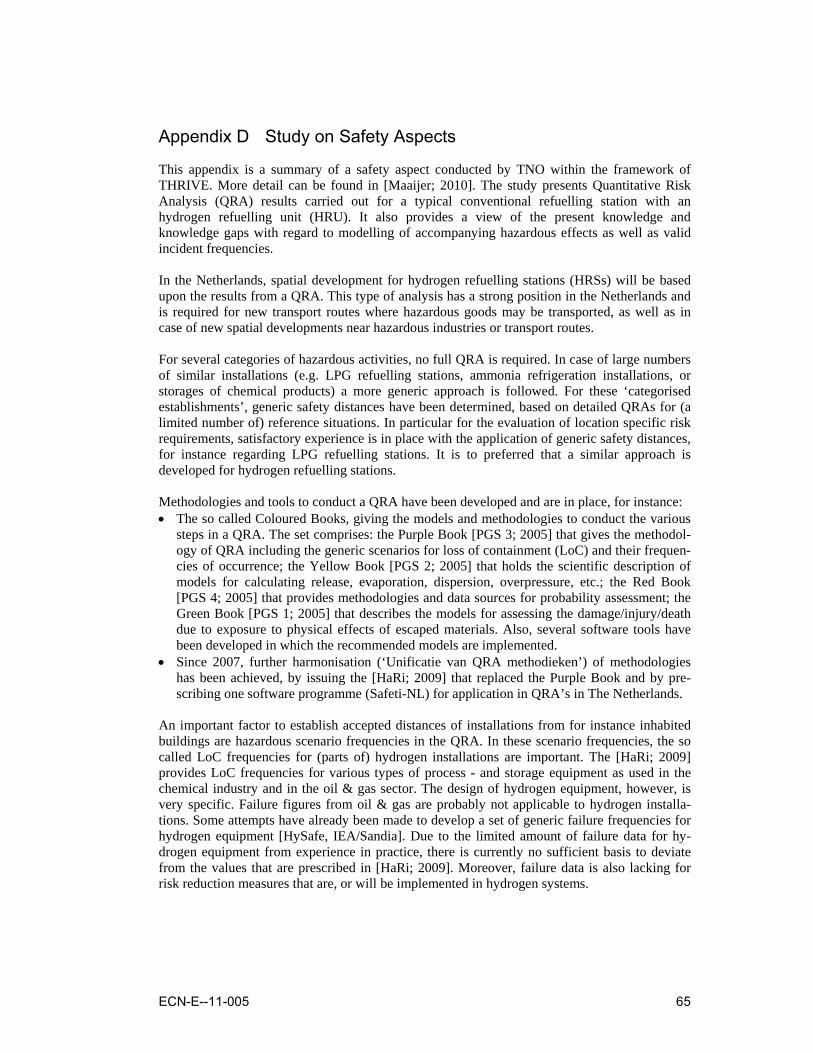
ECN-E--11-005 65
Appendix D Study on Safety Aspects
This appendix is a summary of a safety aspect conducted by TNO within the framework of THRIVE. More detail can be found in [Maaijer; 2010]. The study presents Quantitative Risk Analysis (QRA) results carried out for a typical conventional refuelling station with an hydrogen refuelling unit (HRU). It also provides a view of the present knowledge and knowledge gaps with regard to modelling of accompanying hazardous effects as well as valid incident frequencies. In the Netherlands, spatial development for hydrogen refuelling stations (HRSs) will be based upon the results from a QRA. This type of analysis has a strong position in the Netherlands and is required for new transport routes where hazardous goods may be transported, as well as in case of new spatial developments near hazardous industries or transport routes. For several categories of hazardous activities, no full QRA is required. In case of large numbers of similar installations (e.g. LPG refuelling stations, ammonia refrigeration installations, or storages of chemical products) a more generic approach is followed. For these ‘categorised establishments’, generic safety distances have been determined, based on detailed QRAs for (a limited number of) reference situations. In particular for the evaluation of location specific risk requirements, satisfactory experience is in place with the application of generic safety distances, for instance regarding LPG refuelling stations. It is to preferred that a similar approach is developed for hydrogen refuelling stations. Methodologies and tools to conduct a QRA have been developed and are in place, for instance: • The so called Coloured Books, giving the models and methodologies to conduct the various
steps in a QRA. The set comprises: the Purple Book [PGS 3; 2005] that gives the methodol-ogy of QRA including the generic scenarios for loss of containment (LoC) and their frequen-cies of occurrence; the Yellow Book [PGS 2; 2005] that holds the scientific description of models for calculating release, evaporation, dispersion, overpressure, etc.; the Red Book [PGS 4; 2005] that provides methodologies and data sources for probability assessment; the Green Book [PGS 1; 2005] that describes the models for assessing the damage/injury/death due to exposure to physical effects of escaped materials. Also, several software tools have been developed in which the recommended models are implemented.
• Since 2007, further harmonisation (‘Unificatie van QRA methodieken’) of methodologies has been achieved, by issuing the [HaRi; 2009] that replaced the Purple Book and by pre-scribing one software programme (Safeti-NL) for application in QRA’s in The Netherlands.
An important factor to establish accepted distances of installations from for instance inhabited buildings are hazardous scenario frequencies in the QRA. In these scenario frequencies, the so called LoC frequencies for (parts of) hydrogen installations are important. The [HaRi; 2009] provides LoC frequencies for various types of process - and storage equipment as used in the chemical industry and in the oil & gas sector. The design of hydrogen equipment, however, is very specific. Failure figures from oil & gas are probably not applicable to hydrogen installa-tions. Some attempts have already been made to develop a set of generic failure frequencies for hydrogen equipment [HySafe, IEA/Sandia]. Due to the limited amount of failure data for hy-drogen equipment from experience in practice, there is currently no sufficient basis to deviate from the values that are prescribed in [HaRi; 2009]. Moreover, failure data is also lacking for risk reduction measures that are, or will be implemented in hydrogen systems.
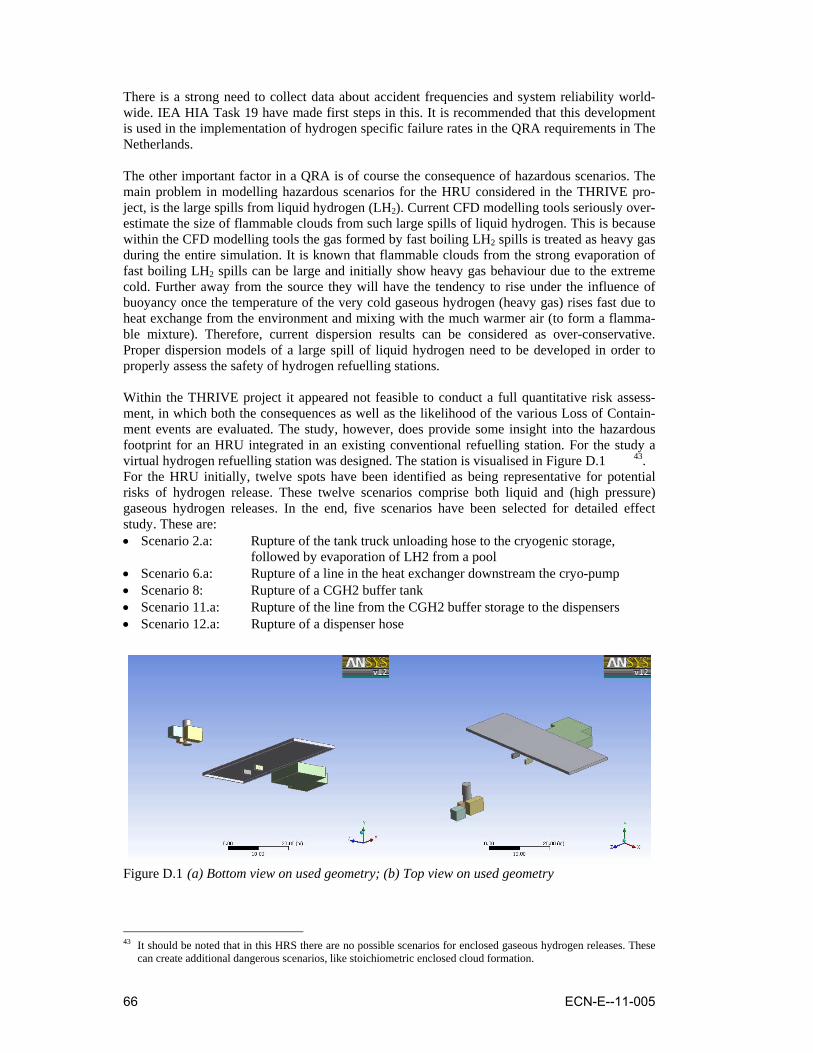
66 ECN-E--11-005
There is a strong need to collect data about accident frequencies and system reliability world-wide. IEA HIA Task 19 have made first steps in this. It is recommended that this development is used in the implementation of hydrogen specific failure rates in the QRA requirements in The Netherlands. The other important factor in a QRA is of course the consequence of hazardous scenarios. The main problem in modelling hazardous scenarios for the HRU considered in the THRIVE pro-ject, is the large spills from liquid hydrogen (LH2). Current CFD modelling tools seriously over-estimate the size of flammable clouds from such large spills of liquid hydrogen. This is because within the CFD modelling tools the gas formed by fast boiling LH2 spills is treated as heavy gas during the entire simulation. It is known that flammable clouds from the strong evaporation of fast boiling LH2 spills can be large and initially show heavy gas behaviour due to the extreme cold. Further away from the source they will have the tendency to rise under the influence of buoyancy once the temperature of the very cold gaseous hydrogen (heavy gas) rises fast due to heat exchange from the environment and mixing with the much warmer air (to form a flamma-ble mixture). Therefore, current dispersion results can be considered as over-conservative. Proper dispersion models of a large spill of liquid hydrogen need to be developed in order to properly assess the safety of hydrogen refuelling stations. Within the THRIVE project it appeared not feasible to conduct a full quantitative risk assess-ment, in which both the consequences as well as the likelihood of the various Loss of Contain-ment events are evaluated. The study, however, does provide some insight into the hazardous footprint for an HRU integrated in an existing conventional refuelling station. For the study a virtual hydrogen refuelling station was designed. The station is visualised in Figure D.1 43. For the HRU initially, twelve spots have been identified as being representative for potential risks of hydrogen release. These twelve scenarios comprise both liquid and (high pressure) gaseous hydrogen releases. In the end, five scenarios have been selected for detailed effect study. These are: • Scenario 2.a: Rupture of the tank truck unloading hose to the cryogenic storage,
followed by evaporation of LH2 from a pool • Scenario 6.a: Rupture of a line in the heat exchanger downstream the cryo-pump • Scenario 8: Rupture of a CGH2 buffer tank • Scenario 11.a: Rupture of the line from the CGH2 buffer storage to the dispensers • Scenario 12.a: Rupture of a dispenser hose
Figure D.1 (a) Bottom view on used geometry; (b) Top view on used geometry
43 It should be noted that in this HRS there are no possible scenarios for enclosed gaseous hydrogen releases. These
can create additional dangerous scenarios, like stoichiometric enclosed cloud formation.
ECN-E--11-005 67
It is expected that ignition of a flammable cloud from a large spill of liquid hydrogen (scenario 2a.) has the biggest impact on the surroundings of a hydrogen refuelling station. However, due to modelling limitations, results seriously overestimate the accompanying flammable clouds, and no final conclusion can be drawn. For the high pressure gaseous hydrogen releases studies (due to insufficiently detailed data available, finally also scenario 8 was left out), it was found that in most (worst case) scenarios the effects causing fatal injuries are only on the premises of the refuelling station. The only exception is for a jet explosion from an ignited turbulent gas cloud from a rupture of the line from the CGH2 buffer storage to the dispensers (scenario 11a, see Table D.1Error! Reference source not found., Table D.2 and Figure D.2). Important in the evaluation of the consequences of these scenarios is that the force of these jet explosions very much depend on the ignition source. Not only is it important whether there is or is not an effective ignition source on the time of the LoC, but also its exact location and timing in relation to the release. Many ignited releases will only cause jet flames with hardly any overpressure generation, if at all. This is due to the possible ‘imperfect’ location and timing of the ignition of the released cloud. Due to the fact that no full QRA is carried out, and numerous data gaps and uncertainties left, no final conclusions on risk levels and safety distances for hydrogen refuelling station are possible. Clearly, further research is needed in this field.
Table D.1 Far field distances for side-on overpressure levels from the blast wave of a jet explosion which occurs during rupture of a high pressure hydrogen pipeline (scenario 11a)
p (kPa) p (mbar) X5,1 (m) X5,8 (m) X9,5 (m) X10,9 (m) 30 (red) 300 25 26 30 32 10 (orange) 100 53 55 65 68 3 (green) 30 148 155 182 1911 (blue) 10 393 410 484 506
Figure D.2 Side-on overpressure levels of blast from a worst case exploding hydrogen jet
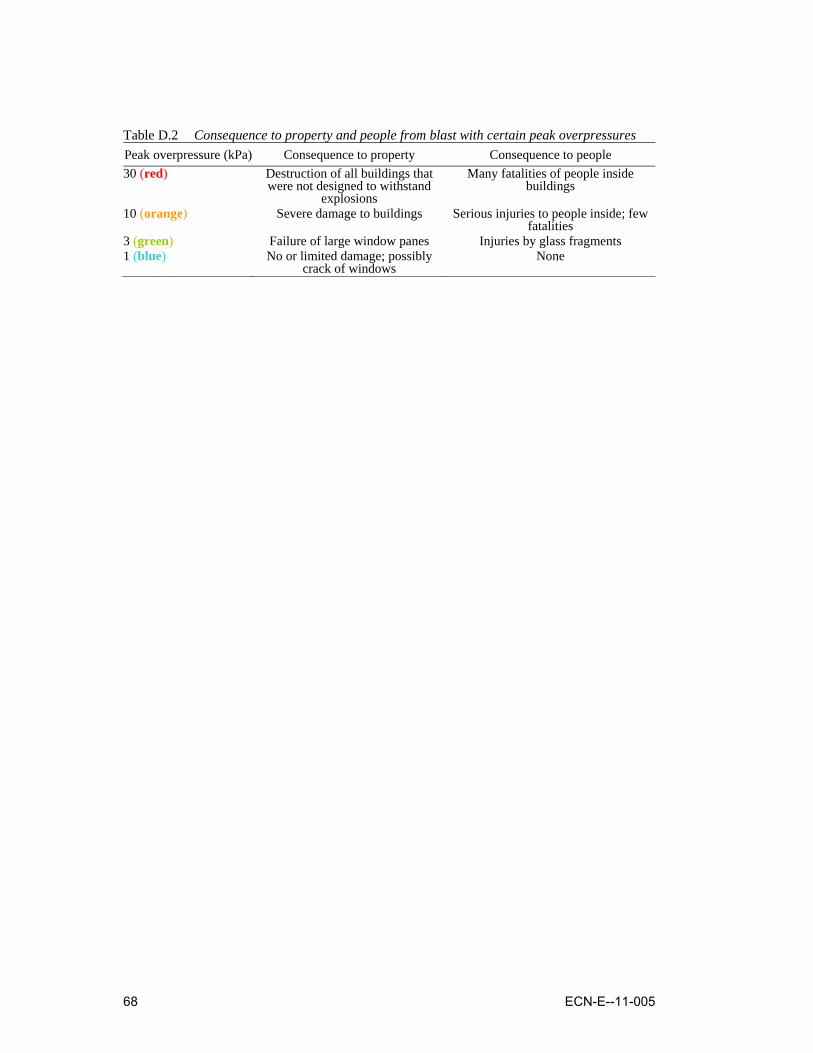
68 ECN-E--11-005
Table D.2 Consequence to property and people from blast with certain peak overpressures Peak overpressure (kPa) Consequence to property Consequence to people 30 (red) Destruction of all buildings that
were not designed to withstand explosions
Many fatalities of people inside buildings
10 (orange) Severe damage to buildings Serious injuries to people inside; few fatalities
3 (green) Failure of large window panes Injuries by glass fragments 1 (blue) No or limited damage; possibly
crack of windows None