Embed Size (px)
Citation preview

Animal Behavior Area, Department of Psychology, University of Washington,Seattle and Department of Psychology, University of Puget Sound, Tacoma
Thresholds of Response in Nest Thermoregulation by Worker Bumble
Bees, Bombus bifarius nearcticus (Hymenoptera: Apidae)
Sean O'Donnell & Robin L. Foster
O'Donnell, S. & Foster, R. L. 2001: Thresholds of response in nest thermoregulation by workerbumble bees, Bombus bifarius nearcticus (Hymenoptera: Apidae). Ethology 107, 387Ð399.
Abstract
Regulation of nest temperature is important to the ®tness of eusocial insectcolonies. To maintain appropriate conditions for the developing brood, workersmust exhibit thermoregulatory responses to ambient temperature. Because nest-mate workers di�er in task performance, thermoregulatory behavior provides anopportunity to test threshold of response models for the regulation of division oflabor. We found that worker bumble bees (Bombus bifarius nearcticus) respondedto changes in ambient temperature by altering their rates of performing two tasks± wing fanning and brood cell incubation. At the colony level, the rate ofincubating decreased, and the rate of fanning increased, with increasingtemperature. Changes in the number of workers performing these tasks weremore important to the colony response than changes in workers' task perform-ance rates. At the individual level, workers' lifetime rates of incubation andfanning were positively correlated, and most individuals did not specializeexclusively on either of these temperature-sensitive tasks. However, workersdi�ered in the maximum temperature at which they incubated and in theminimum temperature at which they fanned. More individuals fanned at high andincubated at low temperatures. Most of the workers that began incubating athigher temperatures continued performing this task at lower temperatures, whenadditional nest-mates became active. The converse was true for fanning behavior.These data are consistent with a threshold of response model for thermoregu-latory behavior of B. bifarius workers.
Corresponding author: Sean O'Donnell, Department of Psychology, Box351525, University of Washington, Seattle, WA 98195, USA. E-mail: [email protected]
Ethology 107, 387Ð399 (2001)
Ó 2001 Blackwell Wissenschafts-Verlag, Berlin
ISSN 0179±1613
U. S. Copyright Clearance Center Code Statement: 0179-1613/2001/1075±0387$15.00/0 www.blackwell.de/synergy

Introduction
Insect societies represent an important grade of biological organization,wherein the behavior of functional units (colonies) derives from the integrationof autonomous individuals (workers) (Seeley 1997). In many insect societies,members of the worker force are idiosyncratic in performing tasks. Nest-mateworkers are not equally likely to respond to a given set of stimulus conditions.However, if worker behavior is adaptive to the colony, the workers should adjusttheir behavior such that colony-wide work rates can track changes in demandfor di�erent tasks (Oster & Wilson 1978). Adaptive models of task performancegenerally predict that more workers will be active at a task when colony needs aregreater (Oster & Wilson 1978).
A reliable increase in the number of workers that respond to extremeconditions can be achieved in two ways. First, workers can di�er in theirthreshold of response to a stimulus (Robinson & Page 1989; Detrain & Pasteels1991; Moritz & Fuchs 1998). The threshold model posits that workers di�er inthe minimum level of stimulus to which they will respond by performing a task.Workers with low thresholds will become active at low stimulus levels, andcontinue to respond when the demand for performance increases. Low thresholdworkers will remain active as nest-mates with higher thresholds begin to performthe task. If this model is correct, then some proportion of workers will be found torespond to a wide range of stimulus levels, while others will respond only to highstimulus levels. This type of task regulation automatically leads to an increase inthe number of active workers as colony need increases. Furthermore, positivefeedback following repeated task performance could enhance the e�ciency orreliability of the low-threshold workers (Plowright & Plowright 1988; Theraulazet al. 1998).
Secondly, as an alternative to threshold models, we propose that workerscould di�er in their preferentia of performance. Under this model, individualworkers would respond to a narrow set of colony conditions ± for example, someworkers would perform a task only in response to the highest possible level ofcolony need, another set of workers would respond to the next lowest level ofneed, and so on. More workers would exhibit preferentia that matched conditionsof high colony need, but each individual would be active under a narrow set ofconditions. A possible selective advantage to this type of task regulation is thatworkers experience less wear or energy expenditure from continuous performanceof costly or risky tasks. Task regulation by performance preferentia would alsoguarantee that a set of workers would be available to perform other tasks at allstimulus intensities.
The goal of our study was to assess how thermoregulatory behavior isregulated in bumble bee (Bombus bifarius nearcticus) workers. Nest temperatureregulation by bumble bees provides an excellent opportunity to test threshold andpreferentia models for the regulation of worker task performance. Variation in asingle, easily quanti®ed environmental variable ± ambient temperature ± elicitsalternative, complementary behavioral acts that function to warm or cool the nest
388 S. O'Donnell & R. L. Foster
(Heinrich 1979; O'Donnell et al. 2000). As in many winged social insects, bumblebee workers fan the nest when temperatures rise, which serves to cool the nest(reviewed by Wilson 1971). Bumble bee workers respond to falling temperaturesby incubating, a behavioral act which involves the worker coiling her bodyaround brood cells and transferring heat produced by muscular contractions tothe nest (Heinrich 1979).
The simple architecture and small size of bumble bee nests aids in the studyof nest thermoregulation. Bombus nests typically comprise a single open chamber(Heinrich 1979). All workers on the nest are therefore exposed to similarinformation about their colony's need for thermoregulation. The responses ofindividuals to colony conditions at any given time can be compared directly,which is often not true for larger insect societies with more complex nests.
We quanti®ed colony-level and individual workers' responses to variation intemperature. First, we correlated colony-wide rates of brood incubation andfanning with temperature to con®rm that performance rates increased withstimulus intensity. We then examined the individual variation in performance ofthese tasks over a range of temperatures to test the predictions of the preferentiaand threshold models for the control of task performance. If workers exhibiteddi�erent preferentia of performance, we expected that individuals would be activeover a narrow range of temperatures, and that di�erent, exclusive sets of workerswould be active at di�erent temperature levels. Alternatively, di�erences inresponse thresholds would be supported if those individuals that became active atless extreme temperatures remained active under more extreme conditions.
Methods
Observation Colonies
We collected newly emerged B. bifarius nearcticus queens from Iron HorseState Park, Washington, USA in Apr. 1998. Queens were placed in cotton-supplied, insulated nest boxes in the laboratory and supplemented with pollen andsugar water (Plowright & Jay 1966; Foster 1992). After the ®rst brood of workersemerged in late May, we transferred the colonies into glass-topped observationhives. Two colonies (henceforth A and B) that had established worker populationsof at least 30 adults by late June were detached from their feeder boxes and movedto an observation shelter on the University of Washington campus in Seattle, WA(47°37¢ N, 122°21¢ W). We placed the observation hives in insulated containers(Styrofoam coolers) approximately 1 m above ground in a screened enclosure.Above-ground nesting sites are frequently chosen by B. bifarius in nature (Foster1992). We ran clear plastic (Tygon) tubes from the nests through the screen walls ofthe enclosure, allowing the bees free outdoor access for foraging. Colonies were notsupplemented with food after opening. Forager arrivals and departures, and theactivities of bees within the nests, were clearly visible through the tube and the glasslid of the observation boxes (O'Donnell et al. 2000).
389Bumble Bee Nest Thermoregulation

Marking Workers and Determining Worker Longevity
Beginning in mid-June we marked workers emerging in the observationcolonies for individual recognition. We marked the bees using a code combiningposition and color of dots of enamel paint on the thoracic dorsum. Workers weremarked every 1 to 3 days, such that their date of adult emergence was knownto within 2 d (callow adults less than 24-h-old can be distinguished from olderadults). We marked 110 workers in colony A and 86 workers in colony B.Workers were assumed to have died on the last day that they were observedduring foraging or scan data collection (below). Bombus bifarius gynes (futurequeens) are much larger than workers, and males have a distinct colorationpattern. Both sexes of reproductives are readily distinguished from workers inthis species. The presence of gynes and males was noted during observations, butthey were not marked or counted as they emerged.
Behavioral Observations and Variables
Behavioral data were collected by two observers. One observer collected alldata from each colony, thereby avoiding observer e�ects on within-colonybehavioral measures. We observed colony A between 20 July and 11 Aug. 1998,and colony B between 20 July and 6 Aug. 1998. Observation periods werecontinuous and lasted 40±60 min. Colony A was observed ®ve times per week,once in the morning (between 09:45 and 11:50 h) and once in the afternoon(between 13:00 and 16:35 h) on each day. With few exceptions, colony B wasobserved on the same day during the same time periods.
At 10-min intervals, each observer scanned the nest interior through theglass covers, and recorded the behavior and identity of all visible marked workersthat were performing tasks. We recorded the following nest maintenance tasks(ethogram modi®ed from Gamboa et al. 1987): antennating brood, mandibulat-ing wax, incubating, fanning, guarding the entrance, and pulling cotton insulationmaterial. Observers also recorded all foraging arrivals and departures duringobservation periods, noting the identity of the foraging worker and time to thenearest second. Because not all bees in the nest were recorded performing tasks,we combined the foraging arrival and departure data with the scan data todetermine which bees were on the nest during each scan. Total behavioralsampling e�ort was as follows: colony A, 28 observation periods, 192 scansamples, 27.5 h observation; colony B, 27 observation periods, 184 scan samples,27.3 h observation.
To calculate each worker's per-scan rate of behavior, we summed the numberof scans during which she performed a task and divided this by the total numberof scan samples during which she was present in the nest. We calculated colony-wide rates of task performance in two ways. First, we counted the number oftimes that we observed a given task during an observation session, then dividedthis by the number of scans; this yielded the colony per-scan rate of performance.Secondly, we counted the number of di�erent workers that were observed
390 S. O'Donnell & R. L. Foster
performing a given task at least once during an observation period, as well as theproportion of workers that were on the nest that performed the task during anobservation period.
Temperature Data
Ambient air temperatures were recorded hourly at the University ofWashington campus. We used the mean of two (if an observation period startedon the hour) or three (if an observation period started at half past the hour)temperature readings as an estimate of ambient temperature for each observationperiod. The observers were blind to temperature readings whilst they collected thedata. To ensure that ambient temperature was a good predictor of temperature inthe nest cavity air space, we exposed an active observation colony (nest boxsimilar in design to subject colonies) to temperatures ranging from 18 to 35°Cin the laboratory. This temperature range overlapped the ambient temperaturesexperienced by the free-¯ying subject colonies. We placed the laboratory colonyin a 30 ´ 50 ´ 30 cm3 enclosed space, warmed by an adjustable ceramic heatinglamp. One thermometer measured the ambient temperature and a secondthermometer simultaneously measured the temperature in the air space of thenest cavity. We collected 10 paired readings at eight di�erent temperature settingsseparated by 2±5°C. We allowed the two temperatures to equilibrate for 15 minafter the lamp's settings were changed (no further changes were seen after 15 minin initial readings).
Data Analysis
Correlations among continuous variables are parametric Pearson correla-tions unless otherwise noted. We used Spearman rank correlations to estimatecorrelations among continuous variables when the data violated parametric testassumptions (e.g. unequal variances). We used linear regression to quantifyrelationships among variables when the direction of causality of the relationshipcould be assumed (e.g. ambient temperature would a�ect variation in beebehavior). We used multiple regression to test and account for colony di�erences.Polynomial (quadratic) terms were included in regression models when theyexplained signi®cantly more variance (p < 0.05) than the simple linear model(SAS Institute 1985).
Results
Colony Level Patterns of Nest Thermoregulation
Temperature in the laboratory nest-cavity airspace was nearly identical toambient temperature, although at 35°C, the nest cavity was warmer than ambientby approximately 2°C. The correlation between ambient and nest cavity
391Bumble Bee Nest Thermoregulation

temperature in the laboratory was r � 0.99 (p < 0.001). Mean ambient tem-peratures during observation periods ranged from 16.4 to 31.9°C (total range15.5°C) for colony A, and from 16.4 to 32.5°C (total range 16.1°C) for colony B.The mean temperature variation within observation periods was 1.5°C for bothcolonies, with minimum within-period variations of 0°C for both colonies andmaximum within-period variations of 3.9°C for colony A and 3.3°C for colony B.The number of workers present on the nests during observation periods did notcorrelate signi®cantly with temperature (colony A, r � 0.32, p > 0.10; colony B:r � 0.02, p > 0.90).
Colony per-scan incubation and fanning rates were strongly negativelycorrelated within observation periods (Spearman correlation; colony A: r �)0.58, p < 0.005; colony B: r � )0.59, p < 0.005). Fanning and incubationco-occurred during some observation periods (colony A: 28.5% of observationperiods; colony B: 11.1% of observation periods). However, performance of thesetasks was nearly exclusive: high rates of fanning were only observed whenincubation rates were low or zero, and vice versa (Fig. 1).
Ambient temperature had strong e�ects on colony rates of fanning andincubation. Colony per-scan rates of incubation decreased linearly with tempera-ture (Fig. 2; colony A: r2 � )0.37, p < 0.001; colony B: r2 � )0.46, p < 0.001),while colony per-scan rates of fanning increased exponentially with temperature(Fig. 2; colony A: r2 � 0.82, p < 0.001; colony B: r2 � 0.83, p < 0.001).Colonies did not di�er signi®cantly in the relationships of incubation rates withtemperature (multiple regression, F2,52 � 0.02, p > 0.75) or of fanning rates withtemperature (multiple regression, F2,52 � 3.4, p > 0.05). Furthermore, when theywere observed simultaneously, the two colonies' rates of fanning (r � 0.95,p < 0.001) and of incubation (r � 0.64, p < 0.05) were correlated.
Fig. 1: Relationship between colony-wide worker fanning rates and worker incubation rates for twoBombus bifarius colonies. Each data point represents one observation period
392 S. O'Donnell & R. L. Foster

After accounting for colony e�ects, both the number of workers and theproportion of workers that incubated decreased with temperature (multipleregression; number of workers incubating: F2,52 � 28.4, p < 0.0001, proportionof workers incubating: F2,52 � 45.3, p < 0.0001), and both the number ofworkers and the proportion of workers that fanned increased with temperature(multiple regression; number of workers fanning: F2,52 � 58.6, p < 0.0001,proportion of workers fanning: F2,52 � 51.6, p < 0.0001).
Fig. 2: Relationship between colony-wide incubation and fanning rates and ambient temperature forworkers in two Bombus bifarius colonies. Each data point represents one observation period. Solid linesshow best ®t (linear regression) of incubation rate with temperature; dashed curves show best ®t
(polynomial regression) of fanning rate with temperature
393Bumble Bee Nest Thermoregulation
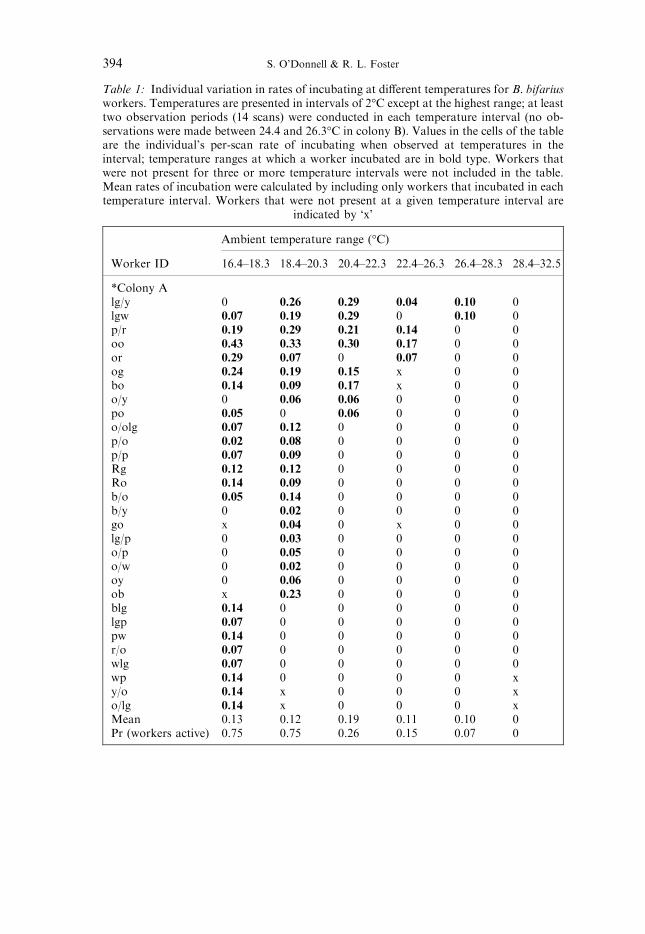
Table 1: Individual variation in rates of incubating at di�erent temperatures for B. bifariusworkers. Temperatures are presented in intervals of 2°C except at the highest range; at leasttwo observation periods (14 scans) were conducted in each temperature interval (no ob-servations were made between 24.4 and 26.3°C in colony B). Values in the cells of the tableare the individual's per-scan rate of incubating when observed at temperatures in theinterval; temperature ranges at which a worker incubated are in bold type. Workers thatwere not present for three or more temperature intervals were not included in the table.Mean rates of incubation were calculated by including only workers that incubated in eachtemperature interval. Workers that were not present at a given temperature interval are
indicated by `x'
Ambient temperature range (°C)
Worker ID 16.4±18.3 18.4±20.3 20.4±22.3 22.4±26.3 26.4±28.3 28.4±32.5
*Colony Alg/y 0 0.26 0.29 0.04 0.10 0lgw 0.07 0.19 0.29 0 0.10 0p/r 0.19 0.29 0.21 0.14 0 0oo 0.43 0.33 0.30 0.17 0 0or 0.29 0.07 0 0.07 0 0og 0.24 0.19 0.15 x 0 0bo 0.14 0.09 0.17 x 0 0o/y 0 0.06 0.06 0 0 0po 0.05 0 0.06 0 0 0o/olg 0.07 0.12 0 0 0 0p/o 0.02 0.08 0 0 0 0p/p 0.07 0.09 0 0 0 0Rg 0.12 0.12 0 0 0 0Ro 0.14 0.09 0 0 0 0b/o 0.05 0.14 0 0 0 0b/y 0 0.02 0 0 0 0go x 0.04 0 x 0 0lg/p 0 0.03 0 0 0 0o/p 0 0.05 0 0 0 0o/w 0 0.02 0 0 0 0oy 0 0.06 0 0 0 0ob x 0.23 0 0 0 0blg 0.14 0 0 0 0 0lgp 0.07 0 0 0 0 0pw 0.14 0 0 0 0 0r/o 0.07 0 0 0 0 0wlg 0.07 0 0 0 0 0wp 0.14 0 0 0 0 xy/o 0.14 x 0 0 0 xo/lg 0.14 x 0 0 0 xMean 0.13 0.12 0.19 0.11 0.10 0Pr (workers active) 0.75 0.75 0.26 0.15 0.07 0
394 S. O'Donnell & R. L. Foster

Individual Variation in Thermoregulatory Behavior
More workers performed incubation than fanning (colony A: 62% of 50workers incubated, 48% fanned, v2 � 1.98, df � 1, p > 0.10; colony B: 68% of31 workers incubated, 32% fanned, v2 � 7.81, df � 1, p < 0.005). Workers' totalper-scan rates of fanning and incubation were positively correlated (Spearmancorrelation, colony A: r � 0.42, p < 0.005; colony B: r � 0.42, p < 0.05). Mostof the workers that thermoregulated performed both fanning and incubation(colony A: 67% of workers performed both tasks; colony B: 55% of workersperformed both tasks). A few workers performed both fanning and incubationin the same observation period (colony A: once each by three workers; colony B:once each by two workers).1 Furthermore, on several occasions single workerseither fanned or incubated during a scan when two or more nest-mates wereperforming the other task (this occurred four times in colony A and three times incolony B).
Nest-mate workers varied in the range of temperatures at which they per-formed incubation (Table 1) and fanning (Table 2). More individuals incubated
Table 1: (Continued)
Ambient temperature range (°C)
Worker ID 16.4±18.3 18.4±20.3 20.4±22.3 22.4±26.3 26.4±28.3 28.4±32.5
Colony Bgb.b 0 0.14 0.07 0.29 0 0.14bp 0.19 0.57 0.23 0.10 0.06 0g/p 0.36 0.14 0.19 0.19 0.03 0lgr 0.29 0.14 0.24 0.09 0.03 0y/b 0.36 0.48 0.43 0.25 0.06 0yr 0.21 0.36 0.31 0.28 0 0w/w 0.07 0.07 0.21 0.03 0 0pg 0.33 0 0.11 0.10 0 0gw 0.29 0.29 0 0.07 0 0yy 0.07 0.43 0 0.21 0 0lg/r x 0.14 x 0.07 0 0lgb 0 0 0 0.07 0 0gp 0 0 0 0.07 0 0lgp 0 0 0 0.14 0 0wp 0.14 0.14 0 0 0 0lg/p.b 0.14 0.29 0 0 0 0lg/p 0 0.14 0 0 0 0g/g 0.57 0 0 0 0 0Mean 0.25 0.26 0.23 0.14 0.04 0.14Pr (workers active) 0.71 0.72 0.47 0.77 0.22 0.05
*An additional 15 workers were present at four or more temperature intervals but neverincubated. An additional four workers were present at four or more temperature intervals but neverincubated.
395Bumble Bee Nest Thermoregulation

Table 2: Individual variation in rates of fanning at di�erent temperatures for B. bifariusworkers. Format of table and criteria for including workers as in Table 1
Ambient temperature range (°C)
Worker ID 16.4±18.3 18.4±20.3 20.4±22.3 22.4±26.3 26.4±28.3 28.4±32.5
*Colony Ao/ol 0.14 0 0 0 0 0.42og 0 0.05 0.04 0 0.14 0.67p/r 0 0.05 0 0 0.14 0.58o/p 0 0 0.05 0.07 0.05 0blg 0 0 0.07 0 0 0lgw 0 0 0 0.43 0.14 0.42b/o 0 0 0 0.19 0.14 0go x 0 0 x 0.07 0.25lg/y 0 0 0 0 0.14 0.33ob x 0 0 0 0.14 0.17or 0 0 0 0 0.14 0.33po 0 0 0 0 0.10 0.25wo 0 0 0 x 0.14 0.43w/og 0 0 0 0 0.07 0bo 0 0 0 0 0.07 0y/o 0 x 0 0 0.29 xlgp 0 0 0 0 0.19 0o/olg 0 0 0 0 0.14 0o/w 0 0 0 0 0.14 0oo 0 0 0 0 0.05 0p/o 0 0 0 0 0.05 0r/r 0 0 0 0 0 0.07ro 0 0 0 0 0 0.36w/olg 0 0 0 0 0 0.57Mean 0.14 0.05 0.05 0.23 0.12 0.37Pr (workers active) 0.05 0.09 0.13 0.14 0.79 0.57
Colony Bw/w 0 0.07 0 0 0 0.05yr 0 0 0 0.03 0.06 0.21g/p 0 0 0 0 0.17 0.63lgr 0 0 0 0 0.06 0.47pg 0 0 0 0 0.06 0.05lgb 0 0 0 0 0.14 0bp 0 0 0 0 0 0.26lg/p.b 0 0 0 0 0 0.08lg/r x 0 x 0 0 0.14ylg x 0 x 0 0 0.14Mean 0.00 0.07 0.00 0.03 0.10 0.23Pr (workers active) 0 0.10 0 0.10 0.50 0.90
*An additional 21 workers were present at four or more temperature intervals but neverfanned. An additional 13 workers were present at four or more temperature intervals but neverfanned.
396 S. O'Donnell & R. L. Foster

at lower temperatures, and more fanned at higher temperatures (correlations ofproportion of workers performing tasks with temperature; fanning: colony A,r � 0.86, p < 0.05; colony B, r � 0.89, p < 0.05, incubating: colony A, r � )0.91,p < 0.05, colony B: r � )0.84, p < 0.05). Most workers that incubated at highertemperatures also performed this task at a range of lower temperatures; theconverse was true for fanning (Tables 1 and 2). Furthermore, workers' total per-scan incubation rates were correlated with the temperature range over which theyincubated (colony A: r � 0.81, n � 29, p < 0.001; colony B incubation: r � 0.83,n � 18, p < 0.001; only workers that were alive for at least 5 observation days or35 scans were included). Similar patterns held for fanning, but the correlation wasnot signi®cant in colony B (colony A fanning: r � 0.60, n � 23, p < 0.005; colonyB fanning: r � 0.25, n � 10, p > 0.25). Workers' mean per-scan rates of incuba-tion and fanning did not increase consistently at more extreme temperatures,although mean per-scan fanning rates were greatest at the highest range oftemperatures (Tables 1 and 2).
Discussion
Our data indicate that wing fanning and brood cell incubation by B. bifariusworkers were complementary and nearly exclusive responses to changes in nesttemperature. Ambient air temperature explained signi®cant variation in colony-wide rates of both fanning and incubation. Furthermore, daily variation in therates of performance of these tasks was highly correlated between the colonies(see also O'Donnell et al. 2000). Our data indicate a shift between fanning andincubation at ambient temperatures of approximately 25°C in colony A and 27°Cin colony B (Fig. 2).
Colony needs for compensatory thermoregulatory behavior increase atextreme temperatures. As bumble bee nest temperatures reach extreme levels(either high or low), development of the brood can be compromised orterminated. Heinrich (1979) suggested that developmental anomalies can resultin bumble bee broods below comb temperatures of approximately 30°C. In ourstudy, the primary behavioral response to extreme temperatures was a changein the number of workers thermoregulating. Individuals' rates of fanning andincubation did not vary consistently with temperature, although the highesttemperatures (above 28.4°C) elicited the highest mean fanning rates. We concludethat changes in workers' probabilities of fanning and incubating, and thereforein the number of bees performing these tasks, were important in regulatingB. bifarius nest temperature. Changes in individuals' work rates were lessimportant to the colonies' thermoregulatory responses.
Most workers did not specialize exclusively on one thermoregulatory task,but instead switched between fanning and incubation depending on colony con-ditions. However, individual workers varied in how they responded to di�erenttemperature levels within the nest. Few workers showed evidence of di�erenttemperature preferences for the performance of thermoregulatory tasks. Instead,workers varied in the range of temperatures at which they thermoregulated.
397Bumble Bee Nest Thermoregulation

These results suggest that workers di�ered in their thresholds of responseto colony need for temperature control. Most workers fanned only at highertemperatures and incubated only at lower temperatures, suggesting that relativelyfew individuals had low thresholds of response to temperature. The fact thatworkers occasionally fannedor incubated during observationperiodswhenmanyoftheir nest-mateswere performing the complementary task further demonstrates thatworkers did not respond identically to colony needs for temperature adjustment.The simultaneous performance of tasks with opposite e�ects is predicted by thethreshold of response models, especially at intermediate or transitional environ-mental conditions (Bonabeau et al. 1998).
Our data suggest that Bombus workers' thermoregulatory behavior wasprobabilistic, rather than deterministic, over their active temperature range.Responses to other colony needs, such as food storage, may prevent workers fromthermoregulating at every temperature within their response threshold. However,at the colony level, thermoregulatory behavior was a relatively predictableresponse to variation in ambient temperature. Predictable colony responses areoften derived from probabilistic worker behavior in insect societies (Oster &Wilson 1978; Jeanne 1986).
The threshold of response models are attractive to insect sociobiologistsbecause they can account for both worker idiosyncrasy and ¯exibility in behavior(Robinson & Page 1989; Theraulaz et al. 1998). Threshold e�ects on taskperformance have been documented in ants with morphological worker castes(Wilson 1985; Detrain & Pasteels 1991, 1992), and in species with monomorphicworker castes such as bumble bees, honey bees and social wasps (this study;Robinson 1987; Page et al. 1995; O'Donnell 1998a). However, little is knownabout the mechanisms which underlie individual di�erences in response thresh-olds. Repeatable individual di�erences in task performance based on genotypicvariation within colonies have been documented in a number of insect societies(reviewed in O'Donnell 1998b), but have not been tested in bumble bees. Queensmate with multiple males in some Bombus species, including B. bifarius. Multiplemating increases genotypic variation within colonies, and genotypic di�erencesmay be associated with workers' thresholds of response (Robinson & Page 1989).
Acknowledgements
We especially thank Tina Gray and Monica Reichardt for assistance with collecting behavioraldata. Jean-Guy Godin, Judith Korb, and an anonymous reviewer made helpful comments thatimproved the paper. Financial support was provided by a University of Puget Sound Enrichment FundGrant (RLF), the University of Washington Royalty Research Fund (SO'D), and the US NationalScience Foundation (SO'D).
Literature Cited
Bonabeau, E., Theraulaz, G. & Deneubourg, J.-L. 1998: Fixed response thresholds and the regulationof division of labor in insect societies. Bull. Math. Biol. 60, 753Ð807.
398 S. O'Donnell & R. L. Foster

Detrain, C. & Pasteels, J. M. 1991: Caste di�erences in behavioral thresholds as a basis for polyethismduring food recruitment in the ant, Pheidole pallidula (Nyl.) (Hymenoptera: Myrmicinae). J. InsectBehav. 4, 157Ð176.
Detrain, C. & Pasteels, J. M. 1992: Majors di�er from minors in thresholds of response to pheromoneand tactile invitations in defense. Behav. Ecol. Sociobiol. 29, 405Ð412.
Foster, R. L. 1992: Intraspeci®c recognition functions in bumble bees. PhD Dissertation, Univ. ofWashington, Seattle.
Gamboa, G. J., Foster, R. L. & Richards, K. W. 1987: Nest and brood recognition by the bumble bee,Bombus occidentalis (Hymenoptera: Apidae). Can. J. Zool. 65, 2893Ð2897.
Heinrich, B. 1979: Bumblebee Economics. Harvard Univ. Press, Cambridge.Jeanne, R. L. 1986: The evolution of the organization of work in social insects. Monit. Zool. Ital. (NS).
20, 119Ð133.Moritz, R. F. A. & Fuchs, S. 1998: Organization of honeybee colonies: characteristics and
consequences of a superorganism concept. Apidologie 29, 7Ð21.O'Donnell, S. 1998a: E�ects of experimental forager removals on division of labour in the primitively
eusocial wasp Polistes instabilis (Hymenoptera Vespidae). Behaviour 135, 173Ð193.O'Donnell, S. 1998b: Genetic e�ects on task performance, but not on age polyethism, in a swarm-
founding eusocial wasp. Anim. Behav. 55, 417Ð426.O'Donnell, S., Reichardt, M. & Foster, R. L. 2000: Individual and colony factors in bumble bee
division of labor (Bombus bifarius nearcticus Handl, Hymenoptera: Apidae). Insect Soc. 47,164Ð170.
Oster, G. F. & Wilson, E. O. 1978: Caste and Ecology in the Social Insects. Princeton Univ. Press,Princeton.
Page, R. E. Jr, Waddington, K. D., Hunt, G. J. & Fondrk, K. 1995: Genetic determinants of honey beeforaging behaviour. Anim. Behav. 50, 1617Ð1625.
Plowright, R. C. & Jay, S. C. 1966: Rearing bumble bee colonies in captivity. J. Apic. Res. 5, 155Ð165.Plowright, R. C. & Plowright, C. M. S. 1988: Elitism in social insects: a positive feedback model. In:
Interindividual Behavioral Variability in Social Insects (Jeanne, R. L., ed.). Westview Press,Boulder, pp. 419Ð431.
Robinson, G. E. 1987: Modulation of alarm pheromone perception in the honey bee: evidence fordivision of labor based on hormonally regulated response thresholds. J. Comp. Physiol. A. 160,613Ð619.
Robinson, G. E. & Page, R. E. Jr, 1989: Genetic basis for division of labor in an insect society. In: TheGenetics of Social Evolution (Breed, M. D. & Page, R. E. Jr, eds). Westview Press, Boulder,pp. 61Ð80.
SAS Institute. 1985: SAS Users Guide: Statistics, 5 edn. SAS Institute, Cary, NC.Seeley, T. D. 1997: Honey bee colonies are group-level adaptive units. Am. Nat. 150, S22ÐS41.Theraulaz, G., Bonabeau, E. & Deneubourg, J.-L. 1998: Response threshold reinforcement and
division of labour in insect societies. Proc. R. Soc. Lond. B. 265, 327Ð332.Wilson, E. O. 1971: The Insect Societies. Harvard Univ. Press, Cambridge.Wilson, E. O. 1985: Between-caste aversion as a basis for division of labour in the ant Pheidole
pubiventris (Hymenoptera: Formicidae). Behav. Ecol. Sociobiol. 17, 35Ð37.
Received: April 6, 2000
Initial acceptance: September 4, 2000
Final acceptance: November 14, 2000 (J.-G. Godin)
399Bumble Bee Nest Thermoregulation


![Neonatal Thermoregulation - University of · PDF fileNeonatal Thermoregulation Julia Petty. ... A care study. Journal of Neonatal Nursing. ... 5 Thermoregulation [Compatibility Mode]](https://img.pdfslide.us/doc/110x75/5aafe83f7f8b9a6b308de3c0/neonatal-thermoregulation-university-of-thermoregulation-julia-petty-a-care.jpg)