Embed Size (px)
Citation preview
Three essays on the socioeconomics of gambling
and pathological gambling
PhD thesis submitted to the Faculty of Economics
Institute for economic research
University of Neuchâtel
by
Dimitri Kohler
Supervisor:
Claude Jeanrenaud, Professor of Economics, University of Neuchâtel,
Switzerland
Members of the Committee:
Nils Soguel, Professor of Public Finance, Swiss Graduate School of
Public Administration, University of Lausanne, Switzerland
François Vaillancourt, Professor of Economics, University of Montreal,
Canada
Milad Zarin, Professor of Economics, University of Neuchâtel,
Switzerland
Defended in Lausanne, 7 May 2012
v
Executive summary
In Switzerland, approximately 1.5% of the population suffers from
disordered gambling behaviour. This rate has remained relatively stable
over the last decade. Thus, a significant number of individuals must
cope with the severe adverse consequences that are associated with this
disorder: most notably, depression, debt, divorce, violence and
criminality. The efforts to address this public health concern have
included several prevention measures that have been implemented at
gambling venues and mass media campaigns that have been designed
to inform the public about the addictive potential of this activity.
Although these efforts appear to have prevented the prevalence of
gambling from increasing despite the significant increase in
opportunities for gambling, such efforts have not led to a decrease in
gambling disorders. There may be several reasons for these results.
First, a lack of concern (and thus funding) in the public sector may
prevent efficient prevention measures from being implemented. Second,
a lack of knowledge regarding the characteristics of at-risk groups may
prevent these measures from targeting the appropriate individuals.
Finally, because gambling operators encounter an obvious conflict of
interest in enforcing measures that are intended to prevent problem
gambling, these operators may be less resolute than one would hope in
attempting to address the issue.
Through this dissertation, I aim to enhance the research on
gambling and its consequences. For this purpose, the dissertation is
divided into two main parts. The first part consists of a description of
vi
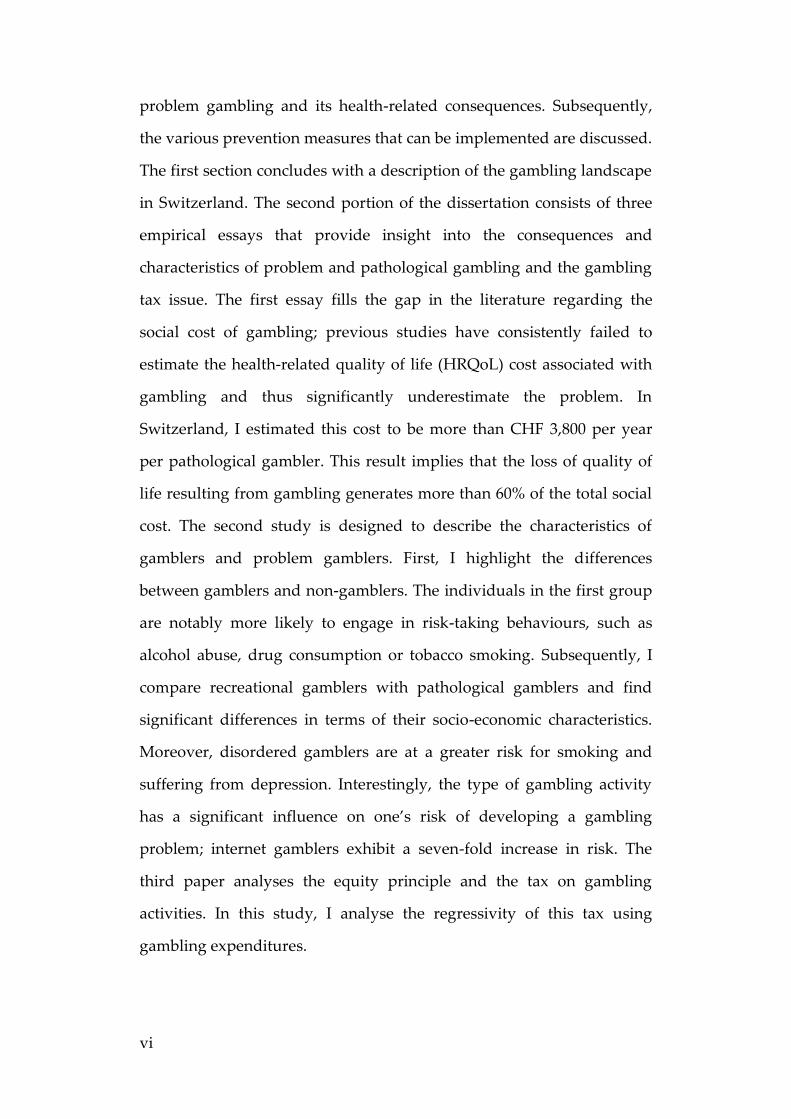
problem gambling and its health-related consequences. Subsequently,
the various prevention measures that can be implemented are discussed.
The first section concludes with a description of the gambling landscape
in Switzerland. The second portion of the dissertation consists of three
empirical essays that provide insight into the consequences and
characteristics of problem and pathological gambling and the gambling
tax issue. The first essay fills the gap in the literature regarding the
social cost of gambling; previous studies have consistently failed to
estimate the health-related quality of life (HRQoL) cost associated with
gambling and thus significantly underestimate the problem. In
Switzerland, I estimated this cost to be more than CHF 3,800 per year
per pathological gambler. This result implies that the loss of quality of
life resulting from gambling generates more than 60% of the total social
cost. The second study is designed to describe the characteristics of
gamblers and problem gamblers. First, I highlight the differences
between gamblers and non-gamblers. The individuals in the first group
are notably more likely to engage in risk-taking behaviours, such as
alcohol abuse, drug consumption or tobacco smoking. Subsequently, I
compare recreational gamblers with pathological gamblers and find
significant differences in terms of their socio-economic characteristics.
Moreover, disordered gamblers are at a greater risk for smoking and
suffering from depression. Interestingly, the type of gambling activity
has a significant influence on one’s risk of developing a gambling
problem; internet gamblers exhibit a seven-fold increase in risk. The
third paper analyses the equity principle and the tax on gambling
activities. In this study, I analyse the regressivity of this tax using
gambling expenditures.
vii
The results consistently show that lower-income individuals
devote a higher proportion of their revenues to gambling than do
higher-income individuals.
Keywords: gambling, pathological gambling, health-related quality of
life, health utility index, HRQoL, SF-6D, intangible cost, risk factors,
socio-economics, gambling tax, progressivity.
139
7 On the regressivity of gambling taxation in
Switzerland.
Abstract 7.1
In this study, the author assesses whether the gambling taxes in
Switzerland is regressive using a large, representative sample of the
population and the reported gambling expenditures of the Swiss Health
Survey 2007 (SHS 07). To analyse the tax incidence, the Suits index was
constructed. This result is corroborated by a regression analysis, which
highlights the income elasticity of gambling expenditures. The two
measures provide converging results and demonstrate the regressive
pattern of the gambling tax in Switzerland. As such, this taxation
structure contributes to increased income inequality in Switzerland.
Introduction 7.2
In Switzerland, a significant part of the revenues of gambling
providers is transferred to the state. A tax on the revenues of gambling
providers reflects the expenditures of gamblers, thus raising the
question of tax incidence. To analyse this pattern, this study investigates
how gambling expenditures change with respect to income. This study
examines whether lower income groups devote a higher part of their
revenue to gambling expenditures than do higher income groups. If this
140
assumption is valid, the gambling tax in Switzerland can be said to
contribute to increased income inequalities.
This assumption has been corroborated in international studies, in
which casino and lottery taxes have been found to be predominantly
regressive. Because lotteries are run by the state governments to finance
public expenditures in the United States, many of these analyses have
been conducted in this country to analyse the equity of this funding
channel. Two main methods have been used to assess the regressivity of
the gambling tax. The first type of measure is based on a concentration
index inspired by the Gini coefficient. The second type of analysis
estimates the income elasticity of gambling expenditures to describe the
latter based on variations in income.
In 1977, Suits developed a concentration index to analyse the tax
incidence (1977b). He used this construct to analyse the regressivity of
casino and lottery taxes (Suits, 1977a) in Nevada. In that study, Nevada
casino taxation was found to be progressive. However, when Suits
restricted his analysis to Nevada residents, the contribution to the casino
tax was found to be highly regressive. The author explained this pattern
as the result of the significant costs of traveling to Nevada. Mason et al.
(1989) highlighted the regressive pattern of the casino tax using income
elasticity, and they corroborated this result with the Suits index.
In line with these results, similar studies have found that the
lottery tax is also highly regressive. Clotfelter and Cook (1987) used
survey data to conclude that the lottery tax in the United States was
regressive. This early finding was corroborated by Mobilia (1992) with
county-level data from the state of Kansas. Furthermore, a longitudinal
study showed increasing regressivity from 1988 to 1992 (Pirog Good
141
and Mikesell, 1995). In fact, studies have consistently found the lottery
tax to be regressive using either income elasticity coefficients or
concentration measures (Price and Novak, 1999, Hansen et al., 2000).
Two national surveys conducted in Canada and New South Wales
(MacDonald et al., 2004, Worthington, 2001) concluded that lower
income households spent a higher proportion of their revenues on
gambling compared to higher income households. The international
literature provides results that support these findings by demonstrating
the overrepresentation of individuals with lower socioeconomic status
among gamblers, including problem gamblers (Volberg and Abbott,
1997, Gerstein et al., 1999, Productivity Commission, 1999, Abbott and
Volberg, 2000, Welte et al., 2002, Volberg and Steadman, 1989, Rönnberg
et al., 1999, Volberg, 1994b, Petry, 2005).
The landscape of casino gambling in Switzerland is unique because
the establishment and operation of casinos was banned from 1928 to
2000. A new law authorising gambling venues came into force on April
1, 2000. Currently, the casino industry in Switzerland consists of 19
gambling venues that generated CHF 936 million in gross revenues in
2009 (1.50 USD/CHF; PPP, 2011). This amount, which was obtained by
subtracting the winnings returned to players from the sums they
wagered, is the tax base used to levy the gambling tax, which totalled
CHF 479 million in 2009. This amount is allocated to financing the Old-
Age Insurance (OAI) and the expenditures of the different cantons that
host casinos. The tax schedule consists in a progressive tax between 40%
and 80% on the gross revenue. During 2009, CHF 406 million was
transferred to the OAI, and CHF 73 million was transferred to the
cantons.

142
According to the first article of the lottery law, lotteries are
forbidden in Switzerland. However, exceptions are made for lotteries
and raffles organized for recreational events that do not provide cash
rewards. Article 5 stipulates that lotteries are allowed if they are
designed to serve non-profit organisations or charities. In practice, two
firms are allowed to run the lottery and betting business, namely, the
Lotterie Suisse Romande (LoRo) in the western part of the country (i.e.,
the French-speaking part) and Swisslos in the eastern part (i.e., the
German- and Italian-speaking part). In the last decade, the number of
lottery games increased significantly with the establishment of a
transnational lottery and the launch of video lottery terminals. As a
result, the annual lottery sales from 2000 to 2009 rose from CHF 1,373 to
CHF 2,833 million. In accordance with article 5 of the lottery law, all
profit is transferred to cantonal commissions, which distribute this
amount to non-profit organizations or charities. In 2009, the gross
revenue of lotteries and betting rose to CHF 896 million, and the total
profit (CHF 534 million) was transferred to non-profit organisations and
charities. In this study, this amount is defined as the implicit tax on the
lottery.
Because a significant part of the revenues of gambling providers is
taxed by the government, the principle of tax equity must be respected.
This golden standard implies that people must contribute to the
government’s revenues according to their ability to pay. Therefore,
individuals with the same income should contribute the same amount to
government revenues (i.e., horizontal equity), and those with higher
incomes should contribute more (i.e., vertical equity). To test the
assumption that the gambling tax is regressive, I focus on the amount
transferred by lotteries and casinos to either the state or the cantonal

143
commissions. I analyse this pattern using two different measures: the
Suits index (Suits, 1977b) and the income elasticity of gambling
expenditures. The former shows how the tax burden is distributed
according to income repartition. The second estimates the variation in
gambling expenditures based on variation in income. The results
provide insight into the regressivity of the gambling tax in Switzerland.
To the best of my knowledge, a study of this type has never been
conducted in Switzerland. With this article, I aim to inform decision
makers about the impact of the gambling tax on income distribution.
Data and Method 7.3
7.3.1 Sample
To conduct the analyses, I used a representative survey of the
Swiss population, the Swiss Health Survey 2007 (SHS). The survey is
conducted every five years on a cross-sectional sample of the Swiss
population aged 15 years and older, based on a random stratified
sample. The cantons constitute the different strata. Two-step random
sampling is implemented for each stratum, where the households are
defined as the primary units and the individuals living in the
households are the secondary units. Using this method, 18,760
individuals were interviewed by phone. Respondents were also asked to
complete a written survey that included questions on gambling. Of
those who accepted, 14,393 returned the written questionnaires. Of these
respondents, 6,036 reported having gambled during the past twelve
months.

144
7.3.2 Measures of tax progressivity
Several methods can be applied to analyse the tax pattern. Point
estimations of progressivity are based on an analysis of the tax schedule
according to income. This is the case for measures such as marginal rate
progression, average rate progression, liability progression and residual
income progression (Mottu, 1997). However, these measures only
provide a point estimate; they do not consider the tax impact on the
entire population. To solve this problem, global measures based on the
Lorenz curve and the Gini index can be used to account for the
distribution of the tax burden. This is the case for the Suits index, which
is used in this study together with a second analysis to verify the
consistency of the Suits results. For this purpose, I use regression
analysis to estimate the income elasticity coefficients of gambling
expenditures.
The Suits index
The Suits index is the first measure used in this study to assess the
progressivity of the tax. This index has been one of the most widely
used instruments for this purpose since its development by Suits
(1977b). It is inspired by the well-known measure of inequality, the
Lorenz curve, and the resulting Gini ratio. The Suits index is obtained
by plotting the accumulated percentage of the tax burden on the
horizontal axis and the accumulated percentage of total income on the
vertical axis. We can conclude that the gambling tax is regressive if the
percentage of the total tax burden is always higher than the
corresponding percentage of total income, as indicated by the C’ curve
in figure 7.1. If the tax is progressive, the Lorenz curve will show the
145
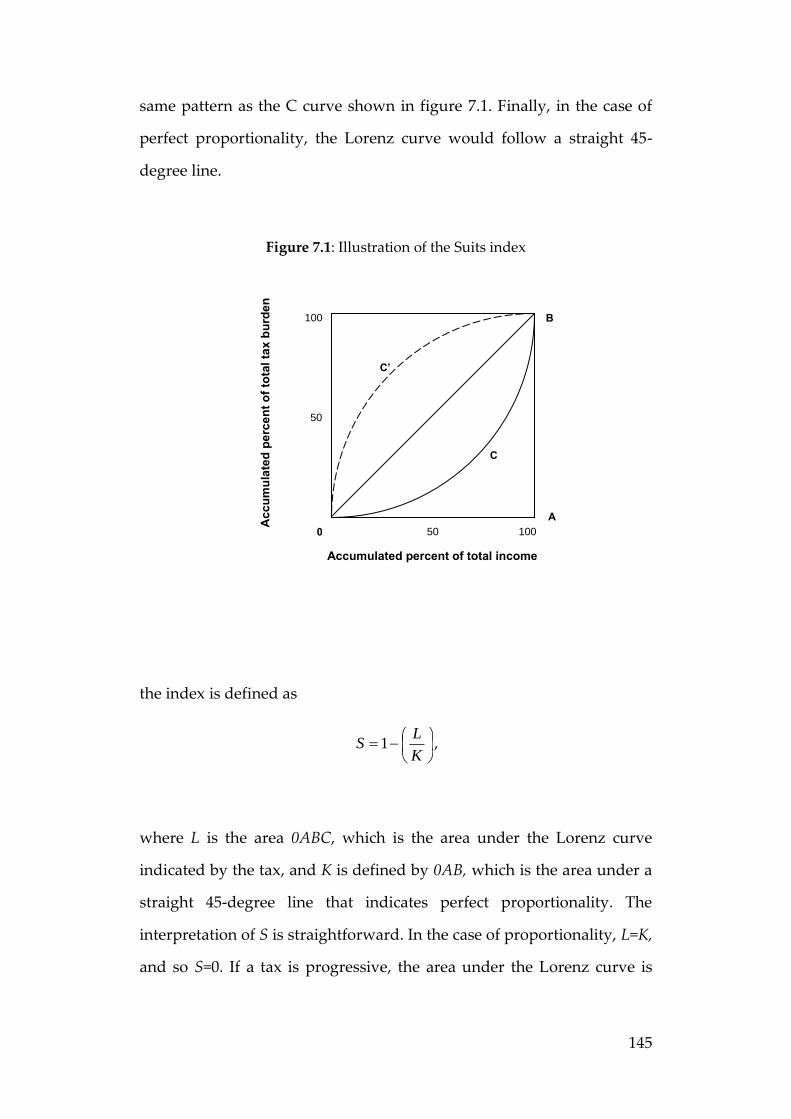
same pattern as the C curve shown in figure 7.1. Finally, in the case of
perfect proportionality, the Lorenz curve would follow a straight 45-
degree line.
Figure 7.1: Illustration of the Suits index
the index is defined as
K
LS 1 ,
where L is the area 0ABC, which is the area under the Lorenz curve
indicated by the tax, and K is defined by 0AB, which is the area under a
straight 45-degree line that indicates perfect proportionality. The
interpretation of S is straightforward. In the case of proportionality, L=K,
and so S=0. If a tax is progressive, the area under the Lorenz curve is
100 0
100
50
50
Acc
umul
ated
per
cent
of t
otal
tax
burd
en
Accumulated percent of total income
C’
C
A
B
146
smaller than the area under the 45-degree straight line; as a result, index
S is positive. Conversely, if the tax is regressive, a higher part of the tax
burden is paid by individuals with lower incomes. The Lorenz curve lies
above the straight line, and so S is negative. This measure has some
interesting properties. First, any transfer of the tax burden from lower to
higher income groups increases S. Second, the index value for several
taxes in combination is the weighted average of the index for the
individual taxes, and the weights are given by the proportion of the
total revenue collected by the taxes.
To construct the Suits index, I need to know the gambling net
expenditures to assess the tax burden on each individual. In the SHS,
the individual-level monthly gambling budgets are reported. This
amount gives the participation of each individual in the gross revenue
of casinos and lotteries. Using the average tax rate for gambling, I obtain
an estimation of the tax burden on each individual. It must be noted that
these data from the SHS are related to the total expenditures on games
of chance; I do not have desegregated information to assess the tax
incidence of casinos and lotteries separately.
In the survey, the total monthly gambling budget is defined in
intervals: less than CHF 10, between 10 and 99, between 100 and 999,
between 1,000 and 2,499, between 2,500 and 9,999, and 10,000 and over. I
use the middle of the interval to assess the total monthly gambling
budget of each respondent. I apply a mean rate burden to these
expenditures to obtain the tax burden on each individual. As supported
by Blaszczynski et al. (1997a), I assume that the gambling budget
reported by the respondents represents the net expenditures,
corresponding to the gross revenue of casinos and lotteries. The gross

147
revenue represents the amounts paid by the gamblers less their
winnings. This value is the tax base to levy the gambling tax among
casinos. To determine the mean rate burden, I calculate a weighted
average of the tax on the 19 casinos and the 2 lotteries in Switzerland.
The weights are derived from the gross revenue of each casino and
lottery. This calculation results in a mean tax rate of 56% on games of
chance in Switzerland. However, it must be noted that changing this
rate does not influence the value of the Suits index because the tax rate
is the same for all gamblers. That is, the distribution of the tax burden
does not change by changing the mean tax rate. The second variable
required to calculate this index is the household income. The SHS
collects the adjusted income of each individual. This variable represents
the sum of the different incomes of the household and is adjusted by
family size. This calculation considers the economy of scale of increasing
the size of the household. By combining the tax burden and the adjusted
household income, I estimate the Suits index.
Income elasticity
Another method of assessing the tax incidence is to analyse income
elasticity. As with private goods, I expect the demand for gambling to
rise with income because I assume that it is not an inferior good.
Nevertheless, I do not know whether this increase will be proportional.
To clarify this notion, suppose that all individuals have the same
structure of tastes. Thus, with the same income, they all equally value
their gambling expenditures and the social good provided by the
implicit tax. In this case, individuals with an income of USD 20,000 may
be willing to spend USD 2,000 gambling, of which USD 1,000 would
148
represent the implicit tax (assuming a tax rate of 50% on the gross
revenues of gambling). If 1,000 units of the social good are provided,
this implies that all individuals with an income of USD 20,000 value 1
unit of the social good at USD 1. If all other individuals with an income
of USD 40,000 value the social good at USD 2, a proportional tax rate
would apply based on the structure of tastes. If these individuals would
be willing to pay only USD 1.50, the appropriate tax pattern would be a
regressive schedule. This example shows us how the tax schedule
depends on preference patterns. Indeed, if we assume high income
elasticity, prices would increase rapidly with income. Nevertheless, if
price elasticity is high, this increase will be reduced (Musgrave and
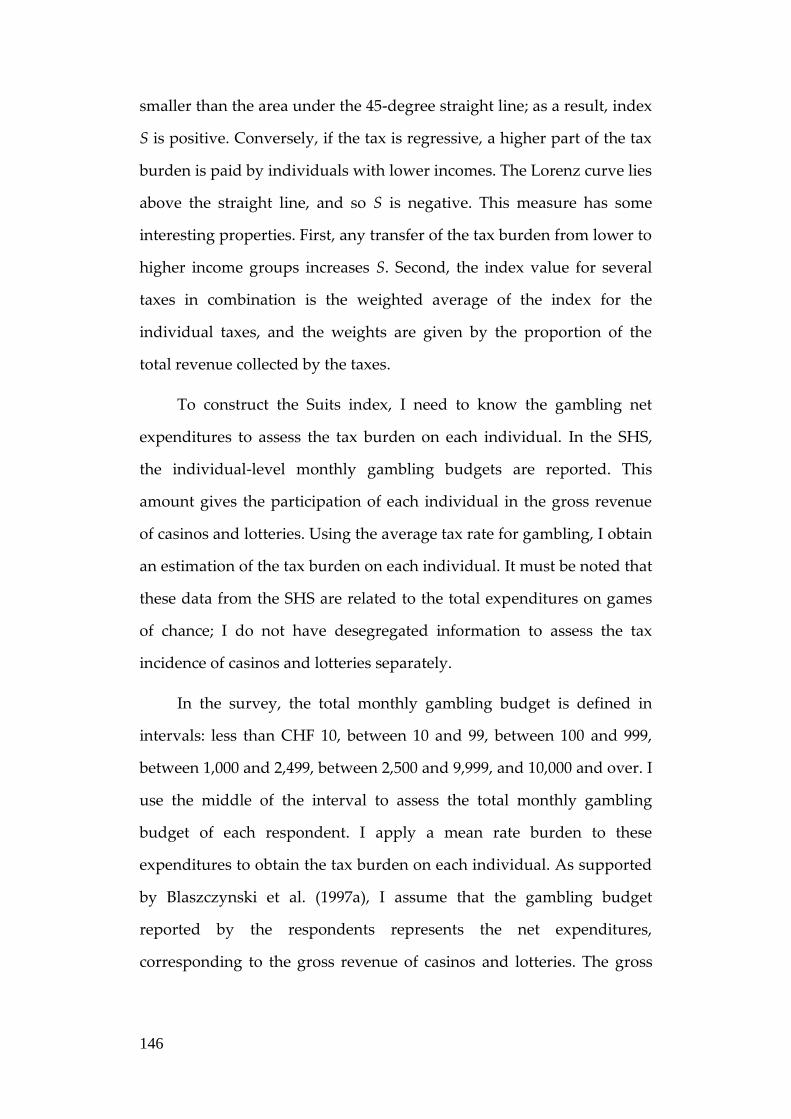
Musgrave, 1989). To express this as a formula, I write the income
elasticity as
Y
Y
Q
Q
r
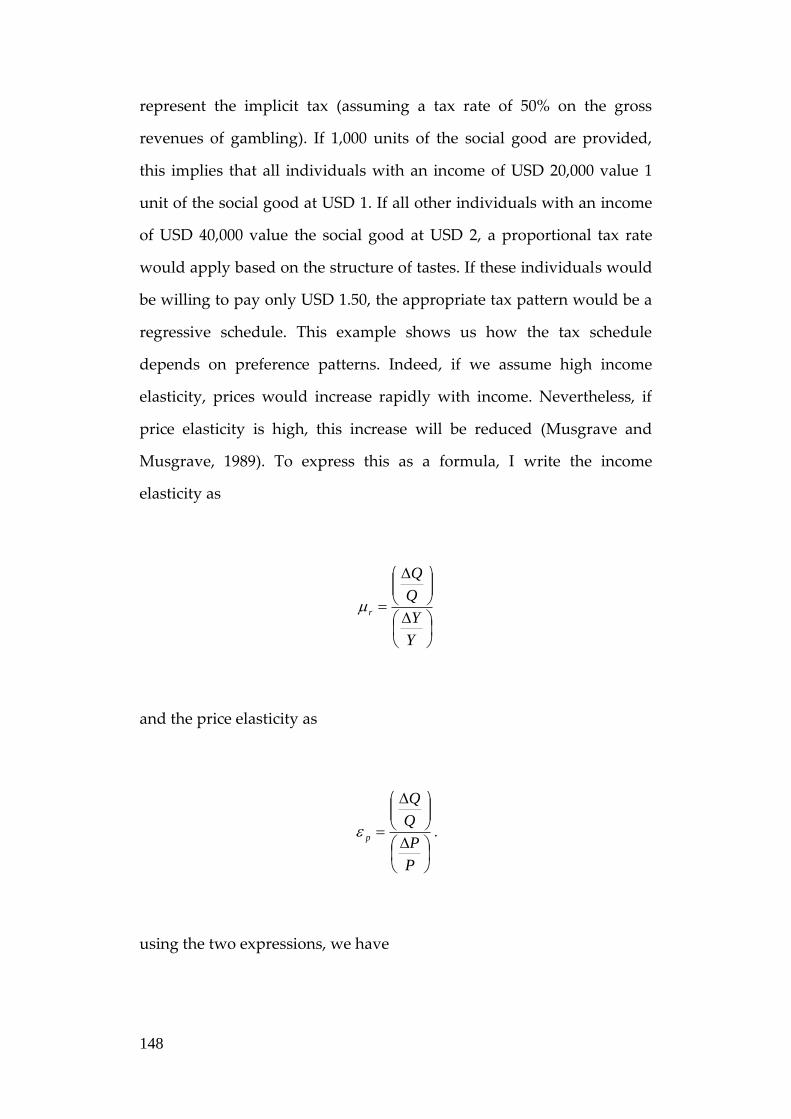
and the price elasticity as
P
P
Q
Q
p .
using the two expressions, we have
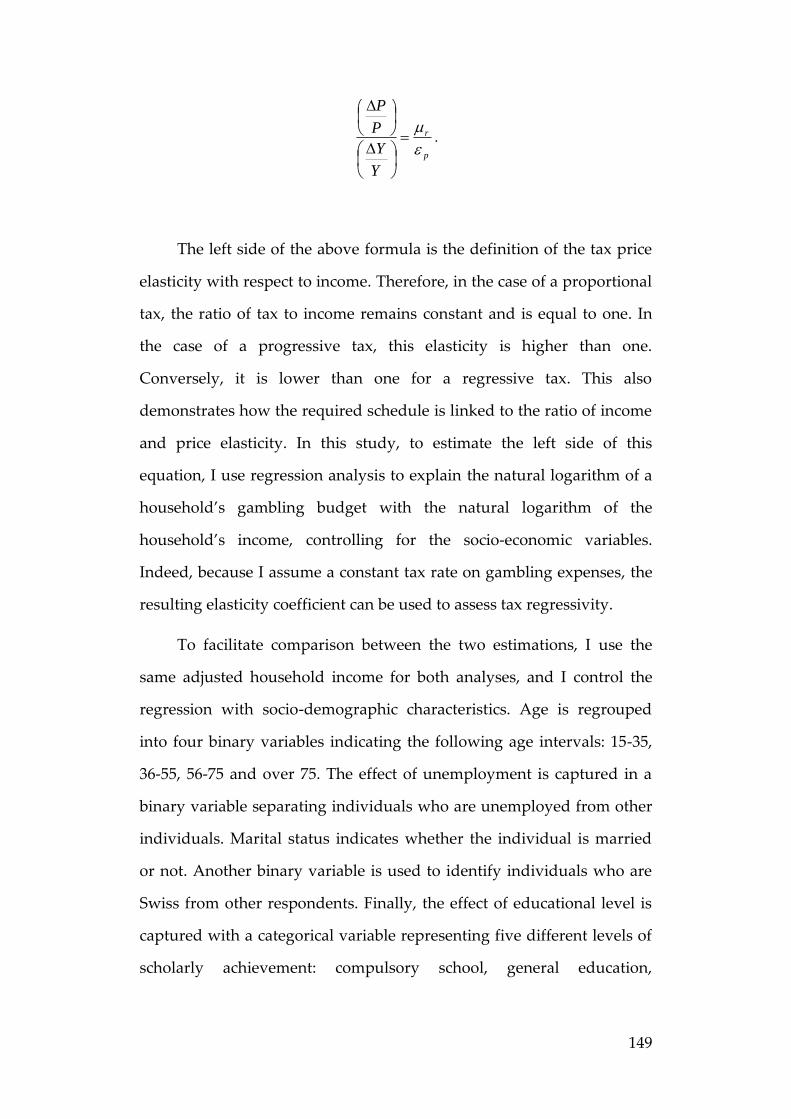
149
p
r
Y
Y
P
P
.
The left side of the above formula is the definition of the tax price
elasticity with respect to income. Therefore, in the case of a proportional
tax, the ratio of tax to income remains constant and is equal to one. In
the case of a progressive tax, this elasticity is higher than one.
Conversely, it is lower than one for a regressive tax. This also
demonstrates how the required schedule is linked to the ratio of income
and price elasticity. In this study, to estimate the left side of this
equation, I use regression analysis to explain the natural logarithm of a
household’s gambling budget with the natural logarithm of the
household’s income, controlling for the socio-economic variables.
Indeed, because I assume a constant tax rate on gambling expenses, the
resulting elasticity coefficient can be used to assess tax regressivity.
To facilitate comparison between the two estimations, I use the
same adjusted household income for both analyses, and I control the
regression with socio-demographic characteristics. Age is regrouped
into four binary variables indicating the following age intervals: 15-35,
36-55, 56-75 and over 75. The effect of unemployment is captured in a
binary variable separating individuals who are unemployed from other
individuals. Marital status indicates whether the individual is married
or not. Another binary variable is used to identify individuals who are
Swiss from other respondents. Finally, the effect of educational level is
captured with a categorical variable representing five different levels of
scholarly achievement: compulsory school, general education,
150
vocational education, higher vocational education, and tertiary
education.
Results 7.4
7.4.1 Suits index
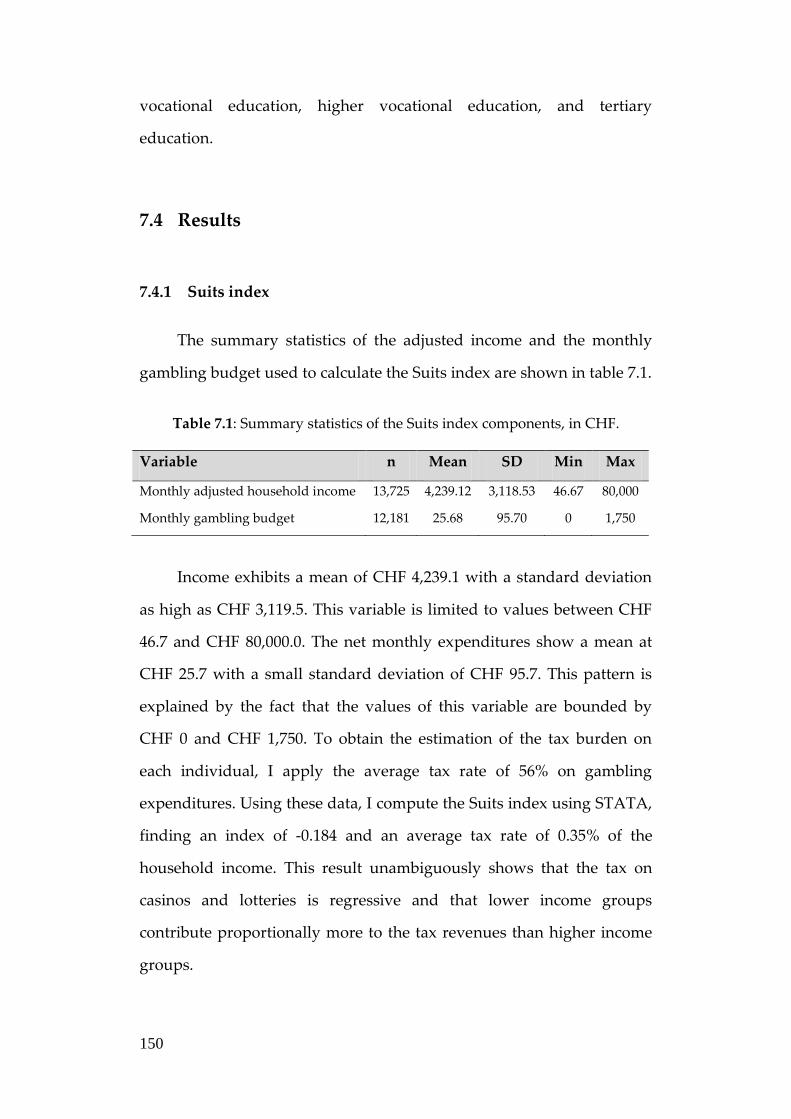
The summary statistics of the adjusted income and the monthly
gambling budget used to calculate the Suits index are shown in table 7.1.
Table 7.1: Summary statistics of the Suits index components, in CHF.
Variable n Mean SD Min Max
Monthly adjusted household income 13,725 4,239.12 3,118.53 46.67 80,000
Monthly gambling budget 12,181 25.68 95.70 0 1,750
Income exhibits a mean of CHF 4,239.1 with a standard deviation
as high as CHF 3,119.5. This variable is limited to values between CHF
46.7 and CHF 80,000.0. The net monthly expenditures show a mean at
CHF 25.7 with a small standard deviation of CHF 95.7. This pattern is
explained by the fact that the values of this variable are bounded by
CHF 0 and CHF 1,750. To obtain the estimation of the tax burden on
each individual, I apply the average tax rate of 56% on gambling
expenditures. Using these data, I compute the Suits index using STATA,
finding an index of -0.184 and an average tax rate of 0.35% of the
household income. This result unambiguously shows that the tax on
casinos and lotteries is regressive and that lower income groups
contribute proportionally more to the tax revenues than higher income
groups.
151
7.4.2 Income elasticity
The second analysis of this study assesses the tax incidence by
determining the income elasticity coefficient. It also analyses the ratio of
the percentage change in gambling expenditures to the percentage
change in a household’s income. To test whether this ratio increases,
decreases or remains constant, I perform an ordinary least squares
regression using the logarithm of gambling expenditures and income
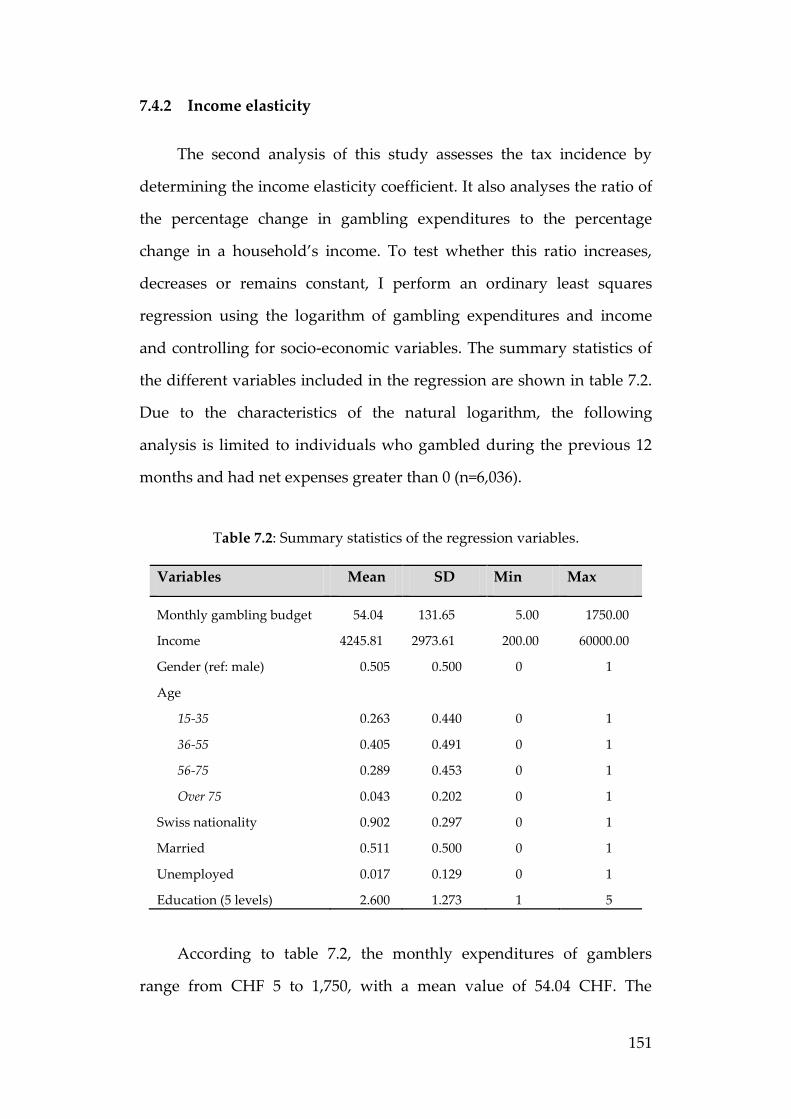
and controlling for socio-economic variables. The summary statistics of
the different variables included in the regression are shown in table 7.2.
Due to the characteristics of the natural logarithm, the following
analysis is limited to individuals who gambled during the previous 12
months and had net expenses greater than 0 (n=6,036).
Table 7.2: Summary statistics of the regression variables.
Variables Mean SD Min Max
Monthly gambling budget 54.04 131.65 5.00 1750.00
Income 4245.81 2973.61 200.00 60000.00
Gender (ref: male) 0.505 0.500 0 1
Age
15-35
36-55
56-75
Over 75
0.263
0.405
0.289
0.043
0.440
0.491
0.453
0.202
0
0
0
0
1
1
1
1
Swiss nationality 0.902 0.297 0 1
Married 0.511 0.500 0 1
Unemployed 0.017 0.129 0 1
Education (5 levels) 2.600 1.273 1 5
According to table 7.2, the monthly expenditures of gamblers
range from CHF 5 to 1,750, with a mean value of 54.04 CHF. The
152
minimum adjusted household income in our sample is CHF 200, and the
maximum is 60,000. Moreover, it has an average of CHF 4,246. With the
exception of educational status, all other variables are binary variables.
In this sample, 50.5% of the respondents are male, and two-thirds of the
gamblers are younger than 56 years old. More than half are married,
and only 9.8% do not have Swiss nationality. A fairly low
unemployment rate is observed in the sample. Finally, the educational
variable ranges from 1 to 5, with a mean value of 2.6.
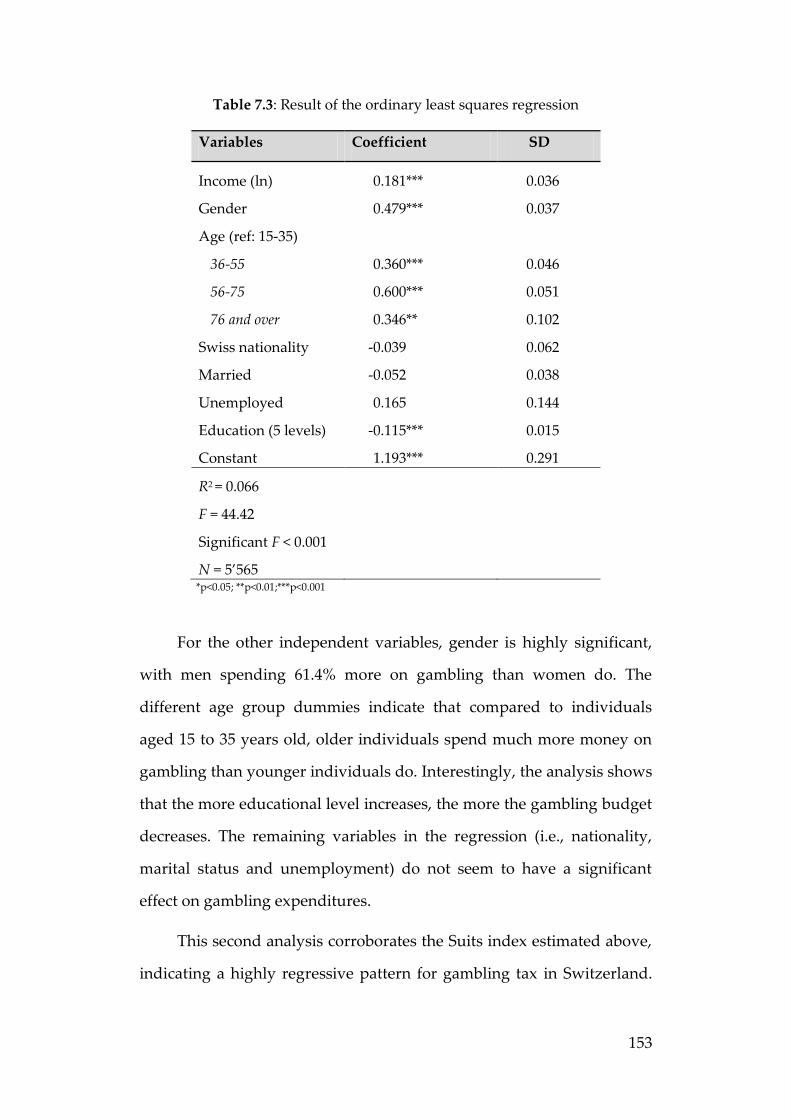
The result of the regression analysis is shown in table 7.3. The
adjusted R2 is slightly higher than 6.5%, indicating that an important
part of the variation in the dependent variable remains unexplained by
the explanatory variables. However, this result is not unusual in cross-
sectional gambling studies. The F-statistic demonstrates that the model
is statistically significant at the 5% level. This last result allows to
validate this model and to interpret its coefficients. In this study, the
coefficient of interest is that associated with the income variable. This
regression analysis reveals an income elasticity of 0.181 with a standard
deviation of 0.036. As suggested by the p-value, this coefficient is
statistically significant. This result is interpreted as follows: an increase
of 10% in income will increase gambling expenditures by 1.81%.
Conversely, a decrease in income will generate a decline in gambling
expenditures, but less than proportional compared to the reduction in
income. Thus, the tax on games of chance in Switzerland is highly
regressive.
153
Table 7.3: Result of the ordinary least squares regression
Variables Coefficient SD
Income (ln) 0.181*** 0.036
Gender 0.479*** 0.037
Age (ref: 15-35)
36-55
56-75
76 and over
0.360***
0.600***
0.346**
0.046
0.051
0.102
Swiss nationality -0.039 0.062
Married -0.052 0.038
Unemployed 0.165 0.144
Education (5 levels) -0.115*** 0.015
Constant 1.193*** 0.291
R2 = 0.066
F = 44.42
Significant F < 0.001
N = 5’565
*p<0.05; **p<0.01;***p<0.001
For the other independent variables, gender is highly significant,
with men spending 61.4% more on gambling than women do. The
different age group dummies indicate that compared to individuals
aged 15 to 35 years old, older individuals spend much more money on
gambling than younger individuals do. Interestingly, the analysis shows
that the more educational level increases, the more the gambling budget
decreases. The remaining variables in the regression (i.e., nationality,
marital status and unemployment) do not seem to have a significant
effect on gambling expenditures.
This second analysis corroborates the Suits index estimated above,
indicating a highly regressive pattern for gambling tax in Switzerland.
154
Changing the method did not change the conclusion. Therefore, I
consider the results of the present paper robust.
Discussion and conclusion 7.5
This study concludes unambiguously that the tax imposed on
gambling activities in Switzerland is highly regressive. Lower income
individuals contribute proportionally more to the state revenues than do
higher income groups. Indeed, the Suits index shows a negative value of
-0.184, indicating a clear regressive tax pattern. This result is
corroborated by regression analysis. The income elasticity of 0.181 is
clearly and statistically lower than one, providing further proof of a
regressive tax pattern. Decreasing income by 10% results in a decrease
of only 1.81% in the gambling budget. Therefore, the economic
incidence clearly shows that the final distribution of the tax burden is
proportionally larger for individuals with lower incomes. Thus, this tax
violates one of the main qualities of a fair tax in Switzerland, namely
vertical equity. Vertical equity suggests that individuals with higher
income should have a larger tax burden. However, this is obviously not
the case in the present study.
Analysing horizontal equity, I underline the differences resulting
from the gender, the age and the educational level. Thus, males,
younger individuals and less educated individual spend more money
on gambling. According to the present analysis, state gambling revenues
are expected to rise if the population that has access to gambling is
poorly educated. My results lead to the surprising conclusion that the
revenues to the state from games of chance will be higher if the

155
population is poor and not well educated. This finding is in line with the
findings of Abt et al. (1985).
Why this subpopulation may be encouraged to spend money on
gambling is addressed by Wisman (2006). He highlighted three reasons
why poor people may be more “vulnerable to the promise of getting
rich by ‘investing’ in gambling” (Wisman, 2006). The first reason is
related to human capital. Because they have less access to high-quality
schools, poor people have difficulty developing human capital, finding
well-paid jobs or accessing credit to start businesses. Second, due to
their poor human capital, low-income populations have a higher
discount rate, and so they are more oriented toward the present. Poor
people generally have a shorter life expectancy and live in a culture that
is more preoccupied with the present because of uncertainties about the
future. The third reason is that because poor people possess little control
over their everyday lives, work or financial means, choosing lucky
numbers provides them with a sense of control and participation. The
first reason highlighted by Wisman may not be applicable in
Switzerland because high-quality schools are accessible to all socio-
economic classes. However, the overrepresentation of lower income
groups in gambling expenditures may be a combination of a lower
discount rate and the quest for the artificial feeling of control provided
by gambling.
Several limitations to this study must be considered when
interpreting the results. First, I focus the analysis on the tax incidence for
gambling in Switzerland. However, I do not consider how the collected
tax is spent, thus the whole budgetary incidence (or tax benefit
incidence) is not assessed in the present study. This incidence is difficult
156
to compute for Switzerland because many expenses derived from
gambling tax are not earmarked. While part of the tax imposed on
casinos is transferred to the OAI, the other part is not earmarked and is
given to the cantons, which are free to use this money as they wish. Due
to this specific allocation, considering the benefits of casinos may
decrease the regressivity of the present study. However, this
observation does not hold for the tax lottery redistribution. Because an
important part of the revenues collected by this tax are redistributed for
cultural or leisure activities, the regressivity may increase. Therefore, if I
could properly account for the benefits of this tax, the budgetary
incidence may differ for casinos and lotteries. Another limitation of this
study is related to how individuals reported their gambling
expenditures. Rather than a continuous variable, the answers were
designed to be grouped into a categorical variable with six categories,
which reduces the precision of the answers. Moreover, the question
asked how much the respondent spent on gambling. As shown by
Blaszczynski et al. (2006), this question is biased and is subject to
ambiguity because the question “how much money do you spend
gambling?” may be interpreted in different ways and may lead to
misinterpretation. Generally, this question is asked to determine the
difference between the amount of money a person has at the beginning
of a gambling session and the amount of money he or she has at the end.
In other words, the information of interest is the net value of the money
spent. Blaszczynski et al. (1997a) concluded that in response to this
question, two-thirds of the respondents interpret this as their net
expenditures. The rest of the respondents relate their answer to turnover
or other alternative interpretations. In this study, I assume that the
answer to the question asked in the SHS reflected the net expenditures.
157
Finally, I was unable to distinguish between casino and lottery
expenditures. Because the incomes of these two categories of gamblers
may be different, grouping these two types of expenditures may have an
impact on the final results.
This study is in line with the international literature that finds that
the gambling tax on casinos and lotteries exhibit regressive patterns
(Mason et al., 1989). This conclusion was expected because several
international studies have shown that poor and uneducated individuals
tend to gamble more and to experience gambling problems more often.
Thus, it is not unexpected to find that these individuals spend a
proportionally larger part of their revenue on games of chance in
Switzerland and that this tax violates vertical equity.
A means of restoring this equity and protecting uneducated
individuals was proposed by Rivenbark (1998) and consists of
introducing a substantial charge for entering casinos. In Switzerland,
this is already the case in some, but not all, gambling venues. The aim of
such a preventive measure would be to deter poor and less educated
individuals from entering casinos. Moreover, this solution could also
increase the state’s revenues and thus balance the decline generated by
this preventive measure. Nevertheless, the fee has to discourage lower
income groups to enter to casinos. If it is not the case, this measure
would increase the regressivity. The results of this study should be of
interest to Swiss policy makers insofar as the tax incidence is an issue
that must be addressed whenever a new tax is considered. Finally, a
more precise study could be undertaken if the next SHS separated
casino and lottery expenditures to allow for separated estimations.
159
8 Concluding remarks
This chapter contains an overview of the various parts of this
dissertation. I will first provide a summary of the introduction’s review
of literature on the subject and address a few major, unanswered
questions. The second part will consist of analysing the content and
results of this dissertation’s three empirical essays. The main limitations
of the studies are likewise mentioned as well as some ideas worthy of
further investigation.
Part one: background 8.1
Tales of disordered gamblers have been told ever since Man began
playing for money. Gambling was originally deemed a vice before
eventually being recognised as an addiction. This shift to medicalization
of the condition was initiated by scientists and psychologists before it
was officially categorised as a disease in the third revision of the
Diagnostic and Statistical Manual of Mental Disorders (DSM). However,
the majority of gamblers do not experience any adverse consequences to
their gambling activities as they remain recreational gamblers.
Nevertheless, the limit between this category and disordered gamblers
needs to be defined. Therefore, a range of screening instruments has
been developed to identify problem or pathological gamblers. Most of
the instruments to screen for the disorder were designed and validated
in clinical settings and subsequently used in population based surveys.
As this kind of method may introduce a bias in a prevalence survey

160
among the general population, researchers developed instruments
specifically aimed at identifying the disorder in the general public. All
the instruments available have standardised, validated criteria to
identify problem or pathological gamblers among the various
populations studied.
Clarifying the definition of pathological gambling allowed
researchers to analyse the different concurrent behaviours and disorders
displayed by this specific population. The process revealed that problem
gambling is related to several other mental and physical disorders.
Indeed, these gamblers are more likely to show substance consumption
disorders such as smoking and alcohol abuse. Additionally, mood
disorders are overrepresented among this specific population,
particularly major depression. The results concerning anxiety disorders
are more ambivalent depending on the study. In fact, the association
between anxiety-related mental disorders and problem gambling needs
to be further investigated through general population surveys. Few
studies analysed the link between problem gamblers and physical
disorders. However, given common knowledge on the topic, subjects
with gambling issues are more likely to report poorer physical health
and a lower quality of life than non-problem gamblers or non-gamblers.
Nevertheless, if all the above correlations are uniformly admitted, the
causal path between comorbidities and problem gambling is as yet
unclear. Indeed, a substantial lack of longitudinal studies prevents one
from drawing unquestionable conclusions on the correlation between
problem gambling and health issues.
To prevent problem gambling and its resulting negative
consequences, prevention measures have recently been implemented.
161
The measures are divided into two groups - behavioural and structural
interventions. The first are designed to increase the individuals’
cognizance of gambling’s potential risks or inform the public about
possible treatments. Hence behavioural measures aim to change an
individual’s behaviour through mass media campaigns or by
implementing informative measures targeting more specific subgroups
of the population. Despite the relatively low effectiveness of behavioural
interventions, they are among the most regularly implemented to
prevent problem gambling. Structural interventions consist in
modifying the context in which gambling is made available, mainly
through restrictions. The most widely implemented measures are
notably age limitations, a limitation on the number of gambling venues
as well as restrictions on the most harmful types of gambling. These
restrictions were shown to have a relatively more substantial impact on
problem gambling. However, estimates of such prevention measures’
effectiveness focus on intermediate indicators, such as the change in a
gambler’s behaviour or beliefs rather than a change in the final
prevalence rate. As a matter of fact, the conclusions resulting from these
studies should not be used to infer potential final effects on the
prevalence rate.
In Switzerland, prevention measures were just recently
implemented as casinos have only been legalized since 2002. The
measures currently consist of a combination of behavioural and
structural interventions. Indeed, information about gambling’s potential
dangers is provided by mass media campaigns within gambling venues
as well as on lottery tickets. Swiss legislation imposes a gambling venue
cap and gambling activities are only legal in casinos. In addition to
banning gambling for individuals under 18 years of age, a self-exclusion
162
policy is enforced in the entire country. Despite these measures, no
significant change in the prevalence of problem gambling has been
identified. Thus, the potential increase in problem gamblers resulting
from the opening of 19 casinos may have been balanced by these
measures. Nevertheless, this assumption has yet to be validated and
further research should focus on the effectiveness of such prevention
measures.
Part two: empirical work 8.2
The three essays included in this dissertation are based on Swiss
data and attempt to fill some gaps in the existing literature on gambling
addiction. To that end, the first essay assesses the social cost of
pathological gambling resulting from the associated lowering of the
addict’s quality of life. The main objective of this study is to
demonstrate that this additional figure represents a significant part of
the total social cost and hence omitting its estimation results in a
significant underestimation of the overall burden on society. For this
ground-breaking study, I focused on pathological gamblers in Swiss
treatment centres and used a representative sample of the Swiss
population as the control group. To estimate the loss in quality of life, I
used the SF-6D to obtain a Health Related Quality of Life (HRQol) index
bordered between 0 and 1. I screened for several common co-
morbidities associated with pathological gambling such as tobacco
smoking, alcohol abuse, drug use, physical health issues and depression
to control regression. Using a tobit regression to take censored data into
account, I determined that pathological gamblers suffer from a loss in
163
quality of life as high as 0.076. Applying a conservative Value of a Life
Year (VOLY) found in the literature, the cost of HRQol loss in
pathological gamblers comes to CHF 3,830. Combining this estimate
with the direct and indirect costs of the addiction found in Swiss
literature, I demonstrated that over 60% of the total social outlay lies in
HRQol cost. Therefore, one must factor in these HRQol estimated
charges when evaluating pathological gambling’s overall social cost in
order to avoid substantially underestimating said cost.
This study represents the first estimation of pathological gamblers’
HRQol based on survey data. Due to the difficulty of identifying this
disorder in a population based survey, I focused on gamblers in
treatment centres. As a matter of fact, the disordered gamblers in this
study may not be representative of the average problem gambler. This
study actually succeeded in proving that the SF-6D is sensitive enough
for pathological gamblers. It may therefore be viewed as a pilot study
for including this standard questionnaire in a national survey such as
the Swiss Health Survey. This would enable estimating the HRQoL loss
of an entire range of diseases based on a wide, representative sample of
the Swiss population.
The second essay of this dissertation aims at identifying the
characteristics of non-gamblers, gamblers and problem gamblers as well
as what distinguishes these three types of individuals from each other.
By analysing the conclusions, the institutions in charge of pathological
gambling prevention have an interesting tool to develop more targeted
measures. Using a large and representative survey of the Swiss
population - the Swiss Health Survey 2007 (SHS 07) - I identified
problem gamblers by implementing a validated screening

164
questionnaire. The comparison between gamblers and non-gamblers
shows that gamblers demonstrate more harmful behaviours, notably in
that they are more likely to smoke and are prone to alcohol abuse. In
terms of socio-demographics, gamblers are more likely to be Swiss
males under age 56 who have only received the basic, compulsory
education required by Swiss law. Finally, they generally fall into an
upper middle class income bracket. Comparing problem gamblers with
recreational gamblers, I observed that problem gamblers are more likely
to suffer from major depression and to smoke. Moreover, they are less
likely to be Swiss and are usually fall within a lower income bracket. To
analyse whether or not gambling activities have an impact on the
probability of developing gambling problems, I identified three forms of
gambling - namely casino, lottery and internet gambling. If casino
gambling increases the risk of developing gambling problems by a
factor of two, internet gamblers have a seven-fold increase in the risk of
being likewise identified as problem gamblers. This last conclusion is
crucial as many governments have decided to move towards
liberalizing internet gambling. According to my results, such policies
will significantly increase the risk of a rise in gambling-related
behavioural disorders. The main limitation of this study lies in the
standard questionnaire used to screen for problem gambling. Indeed,
despite the fact that this particular screening questionnaire was
validated in Switzerland, it is not one of the existing gold standard
methods used to identify problem gamblers. Therefore one must accept
this limitation, which impedes comparisons with international studies.
As a matter of fact, including an internationally validated questionnaire
to screen for gambling disorders in the next SHS would allow for better
comparative studies on this topic.
165
The final essay focuses on tax equity. I used the SHS 07, which
assesses gamblers’ expenditures on the lottery and in casinos. As these
values represent the base line for levying taxes, a mean tax rate is
applied to each individual’s expense in order to estimate the amount of
tax each respondent disburses. By combining the reported income with
this value, two methods are used to assess the tax’s progression. The
first consists of a concentration measure, the Suits Index. The second
analysis uses elasticity coefficients to assess the impact on gambling
expenditures due to a change of income. The two methods presented
converging results and indicate that gambling tax presents a regressive
pattern. Thus, this tax violates the vertical equity principle which
stipulates that individuals with higher incomes should contribute
proportionally more to the tax burden than individuals with lower
incomes. This tax is hence a contributing factor when it comes to a rise
in income disparity. However, this conclusion must be considered with
two principal limitations in mind. Firstly, the analysis focuses on
gambling’s tax incidence and not on its budgetary incidence. As a
matter of fact, taking into account of the redistribution of tax revenue
may decrease the regressivity of the present study, particularly for
casinos. Secondly, it was impossible to distinguish casino spending from
lottery expenditures given the available data. As these two categories of
gamblers may have different income patterns, grouping these two types
of expenditure can impact on a study’s final results.
The three essays in this dissertation will give professionals in the
field better insight into significant issues and the social impact of
gambling addiction (as well as occasional gambling) activity in
Switzerland. I hope my results will provide policy makers with food for

166
thought in implementing effective policies to decrease this growing
public health issue.