Embed Size (px)
Citation preview

Mid-Region Council of Governments
Socioeconomics,
Transportation Trends, &
Scenario Planning in the
MRCOG Region
Albuquerque – Bernalillo County
Air Quality Control Board
September 11, 2013

Mid-Region Council of Governments
A Little Bit About MRCOG…
•Mid-Region Council of Governments
•Established in 1969 through State
Statute
•Regional Land Use, Water, Economic
Development & Transportation Planning
•Metropolitan Planning Organization
•Established in 1973 through the
Federal-Aid Highway Act
•Program Federal Metropolitan
Transportation $$ using the 3-C’s

Mid-Region Council of Governments
Historical Trends

Mid-Region Council of Governments Urbanized Areas
43%

Mid-Region Council of Governments
Slowed Pace of Growth
0.00
0.50
1.00
1.50
2.00
2.50
3.00
2000 -
2001
2001 -
2002
2002 -
2003
2003 -
2004
2004 -
2005
2005 -
2006
2006 -
2007
2007 -
2008
2008 -
2009
2009 -
2010
2010 -
2011
2011 -
2012
Average Annual Growth Rate Albuquerque, MSA
Mid-Region Council of Governments
Economic Influences
340,000
350,000
360,000
370,000
380,000
390,000
2005
2006
2007
2008
2009
2010
2011
2012
Employment Albuquerque, MSA
0
1000
2000
3000
4000
5000
6000
2005
2006
2007
2008
2009
2010
2011
2012
Residential Units Permitted City of Albuquerque

Mid-Region Council of Governments
Shifting Demographics
-10,000
-5,000
0
5,000
10,000
15,000
20,000
2004
2005
2006
2007
2008
2009
2010
2011
2012
NM Migration (net)
12.5
13.0
13.5
14.0
14.5
15.0
15.5
16.0
2004
2005
2006
2007
2008
2009
2010
Birth Rate (per 1,000)

Mid-Region Council of Governments
The Forecast

Mid-Region Council of Governments
The 2035 Population
Forecast
0
200,000
400,000
600,000
800,000
1,000,000
1,200,000
1,400,000
1,600,000
1,800,000
2035
2035 MTP
1.5 M
0
200,000
400,000
600,000
800,000
1,000,000
1,200,000
1,400,000
1,600,000
1,800,000
2035
2035 Revised Forecast
1.3 M

Mid-Region Council of Governments
The 2040 Population
Forecast
0
500,000
1,000,000
1,500,000
2010 2015 2020 2025 2030 2035 2040

Mid-Region Council of Governments
Growing Presence within the
State
31.4% 35.3%
37.8% 39.6% 40.1%
43.1% 45.2% 46.9% 48.2%
-10%
0%
10%
20%
30%
40%
50%
60%
1960 1970 1980 1990 2000 2010 2020 2030 2040
Albuquerque MSA,
Historical and Projected
Mid-Region Council of Governments
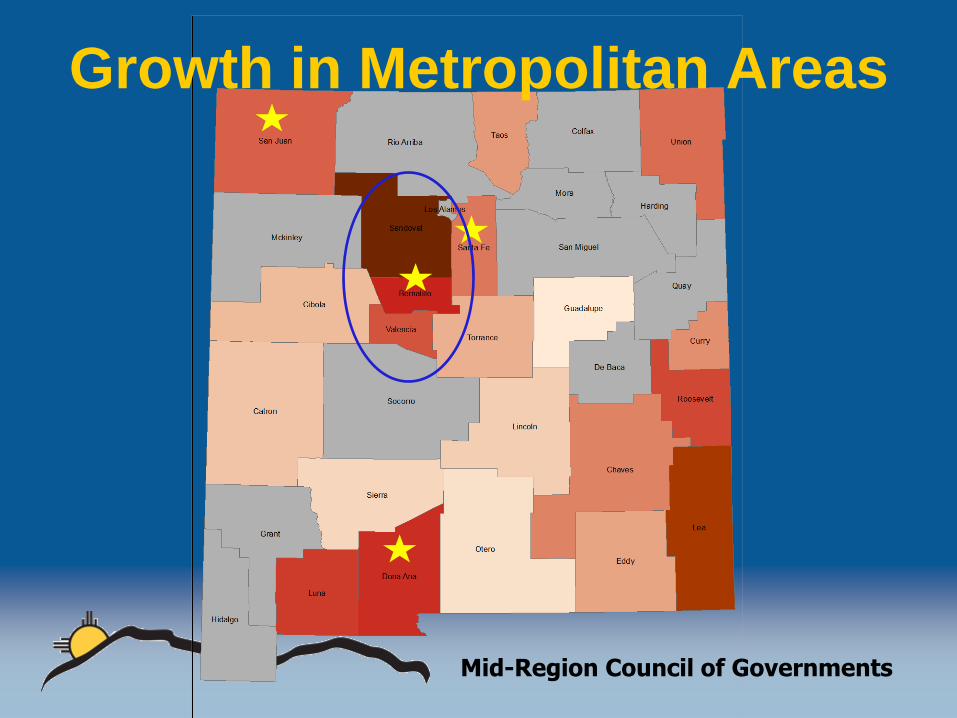
Growth in Metropolitan Areas

Mid-Region Council of Governments
Absolute Growth
30 Year Growth by County
Percentage Growth
-
25,000
50,000
75,000
100,000
125,000
150,000
175,000
200,000
225,000
250,000
275,000
300,000
325,000
Bernalillo Sandoval Torrance Valencia
0%
10%
20%
30%
40%
50%
60%
70%
80%
90%
100%
Bernalillo Sandoval Torrance Valencia

Mid-Region Council of Governments
Demographics &
Housing

Mid-Region Council of Governments
An Aging Population
0.0%
5.0%
10.0%
15.0%
20.0%
25.0%
2010 2011 2012 2013 2014 2015 2016 2017 2018 2019 2020 2021 2022 2023 2024 2025 2026 2027 2028 2029 2030 2031 2032 2033 2034 2035
Youth
Seniors
Demographically, the boomers are sure going to shake things up!

Mid-Region Council of Governments
Shrinking Workforce
0%
10%
20%
30%
40%
50%
60%
70%
80%
90%
100%
2010 2040
Seniors
Working Age
Youth

Mid-Region Council of Governments
Demographics
Very Similar
Very Different

Mid-Region Council of Governments
Generation Y
Born early 1980’s to early 2000’s
They are 3 times more likely to use transit
(18% compared with 6%)
63% are expected to move within the next 5
years
Preference for smaller home closer to work

Mid-Region Council of Governments
Age of Housing by Type
0%
10%
20%
30%
40%
50%
60%
70%
80%
90%
100%
SF MF
1940 - 1959
1960 - 1979
1980 - 1999
2000 +

Mid-Region Council of Governments
Multi-Family Construction
0.0%
1.0%
2.0%
3.0%
4.0%
5.0%
6.0%
7.0%
8.0%
2000 2001 2002 2003 2004 2005 2006 2007 2008 2009 2010 2011 2012
Share of MF permits in Albuquerque

Mid-Region Council of Governments
Residential Permits in the
“Urban Core”
0.0%
1.0%
2.0%
3.0%
4.0%
5.0%
6.0%
7.0%
8.0%
9.0%
10.0%
1990 1991 1992 1993 1994 1995 1996 1997 1998 1999 2000 2001 2002 2003 2004 2005 2006 2007 2008 2009 2010 2011 2012
Percentage within Albuquerque's 1960’s Boundary

Mid-Region Council of Governments

Mid-Region Council of Governments
Commercial Permits in the
“Urban Core”
0%
5%
10%
15%
20%
25%
30%
35%
1990 1991 1992 1993 1994 1995 1996 1997 1998 1999 2000 2001 2002 2003 2004 2005 2006 2007 2008 2009 2010 2011 2012
Percentage within Albuquerque's 1960's Boundary

Mid-Region Council of Governments
Projected Land Use Pattern

Mid-Region Council of Governments
Today Future Scenario

Mid-Region Council of Governments

Mid-Region Council of Governments
The River Crossing Dilemma
1 of 2 jobs will locate west of the Rio Grande
3 of every 4 persons will locate west of the Rio
Grande
Sustained jobs - housing imbalance
1.5 jobs for each home on the east side
0.56 of a job for each home on the west side.

Mid-Region Council of Governments
The 2035 Metropolitan
Transportation Plan

Mid-Region Council of Governments
What is an MTP?
Anticipate future growth over 20+ years
Consider impacts of growth on
infrastructure
Prioritize regional transportation needs
Requires air quality
conformity determination
Fiscally constrained project list
Collaborative, Comprehensive & Continuous
Mid-Region Council of Governments
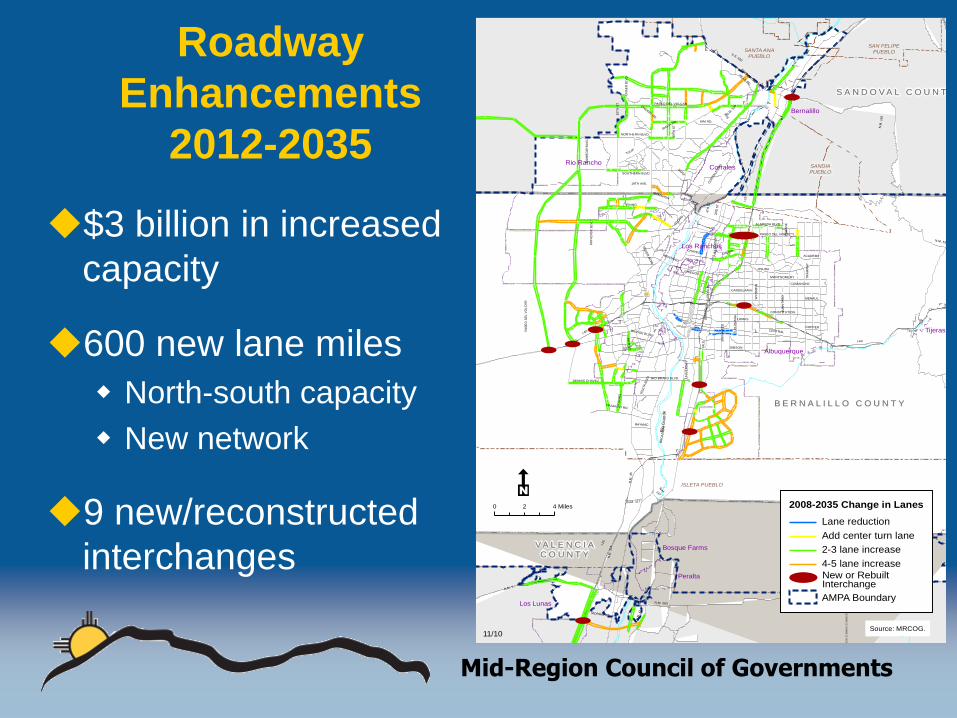
Roadway
Enhancements
2012-2035
$3 billion in increased
capacity
600 new lane miles
North-south capacity
New network
9 new/reconstructed
interchanges
ISLETA PUEBLO
SANTA ANAPUEBLO
ZIA PUEBLO
SAN FELIPEPUEBLO
SANDIAPUEBLO
S A N D O V A L C O U N T YS A N D O V A L C O U N T Y
T O R R A N C E C O U N T YT O R R A N C E C O U N T YV A L E N C I AV A L E N C I A
C O U N T YC O U N T Y
B E R N A L I L L O C O U N T YB E R N A L I L L O C O U N T Y
Peralta
Tijeras
Corrales
Los Lunas
Rio Rancho
Bernalillo
Albuquerque
Bosque Farms
Los Ranchos
Rio
Gra
nde
I-40
N.M. 6
N.M. 337
I-2
5
N.M. 1
4
N.M
. 31
3
CENTRAL
N.M
. 47
N.M
. 31
4
CO
OR
S
LOMAS
MENAUL
N.M
. 16
5
N.M
. 528
U.S. 550
EU
BA
NK
TR
AM
WA
Y
BR
OA
DW
AY
PASEO DEL NORTE
WY
OM
ING
N.M. 536
4T
H S
T
ISLE
TA
BLV
D.
COMANCHE
IRVING
MONTANO
CANDELARIA
JU
AN
TA
BO
IRIS
CA
RL
ISLE
ACADEMY
GIBSON
NORTHERN BLVD.
HA
GA
N R
D.
MONTGOMERY
GIR
AR
D
N.M
. 45
PA
SE
O D
EL V
OLC
AN
UN
SE
R B
LV
D
YA
LE
TULIP
SOUTHERN BLVD
OSUNA
UN
SE
R B
LVD
.
ALAMEDA BLVD.
BRIDGE BLVD.
N.M. 317
UN
IVE
RS
ITY
JE
FF
ER
SO
N
GRIEGOS
N.M. 263
KIM RD.
DENNIS CHAVEZ
SARA
RIO BRAVO BLVD.
IDALIA R
D.
CONSTITUTION
PASEO DEL VOLCAN
PAJARITO RD.
UN
IVE
RS
E B
LV
D.
19TH AVE.
RAYMAC
98T
H S
T
MCMAHON
CHAVEZ
ENCHANTE
D
HILLS
RD.
RA
INB
OW
BLV
D.
10T
H S
T.
CHER
RY RD.
N.M
.147
40T
H S
T
MORRIS RD.
CO
ORS
OSUNA
2N
D S
T
CO
RR
ALE
S R
D
LO
UIS
IAN
A
I-40
COPPER
I-25
SA
N M
AT
EO
0 42 Miles
11/10
L
Source: MRCOG.
2008-2035 Change in Lanes
Lane reduction
Add center turn lane
2-3 lane increase
4-5 lane increase
AMPA Boundary
New or RebuiltInterchange

ISLETA PUEBLO
SANTA ANA
PUEBLO
ZIA PUEBLO
SAN FELIPEPUEBLO
SANDIAPUEBLO
S A N D O V A L C O U N T YS A N D O V A L C O U N T Y
T O R R A N C E C O U N T YT O R R A N C E C O U N T YV A L E N C I AV A L E N C I A
C O U N T YC O U N T Y
B E R N A L I L L O C O U N T YB E R N A L I L L O C O U N T Y
Peralta
Tijeras
Corrales
Los Lunas
Rio Rancho
Bernalillo
Albuquerque
Bosque Farms
Los Ranchos
Rio
Gra
nd
e
0 42 Miles
3/11
2035 SE Data on 2035 Build Network
PM Peak Hour V/C
Acceptable V/C=0 - 0.89
Approaching Capacity V/C=0.9 - .99
Over Capacity V/C=1.0 - 1.09
Severely Congested 1 V/C=1.1 - 1.49
Severely Congested 2 V/C>1.5
AMPA Boundary
L
Source: MRCOG.
ISLETA PUEBLO
SANTA ANAPUEBLO
ZIA PUEBLO
SAN FELIPEPUEBLO
SANDIAPUEBLO
S A N D O V A L C O U N T YS A N D O V A L C O U N T Y
T O R R A N C E C O U N T YT O R R A N C E C O U N T YV A L E N C I AV A L E N C I A
C O U N T YC O U N T Y
B E R N A L I L L O C O U N T YB E R N A L I L L O C O U N T Y
Peralta
Tijeras
Corrales
Los Lunas
Rio Rancho
Bernalillo
Albuquerque
Bosque Farms
Los Ranchos
Rio
Gra
nde
0 42 Miles
10/10
2035 SE Data on 2015 No Build Network
PM Peak HourV/C
Acceptable V/C=0 - 0.89
Approaching Capacity V/C=0.9 - .99
Over Capacity V/C=1.0 - 1.09
Severely Congested 1 V/C=1.1 - 1.49
Severely Congested 2 V/C>1.5
AMPA Boundary
L
Source: MRCOG.
2035 No-Build 2035 Build

Mid-Region Council of Governments
2035 Summary
Miles on our roads: 16 million to 24 million (+ 50%)
Hours on our roads: 400,000 to 740,000 (+ 80%)
Average speeds: 40 mph to 33 mph (- 17%)
Trips across the river: 492,000 to 960,000 (+94%)
•These are draft figures that reflect the new population projections released by UNM-GPS.

Mid-Region Council of Governments
Key MTP Findings
River crossing congestion / No new bridges
Building our way out of congestion is not realistic
There is no silver bullet. A variety of strategies will
be necessary to tackle congestion.

Mid-Region Council of Governments
MTP Toolkit
New Roads and Interchanges
Operations & Systems Management
Transit / Bus Rapid Transit
Bicycle & Pedestrian Infrastructure
Integrating Land Use & Transportation

Mid-Region Council of Governments
Air Quality Control Board
Determine conformity
Compliance with EPA guidelines for
regulating mobile source emissions
Limited Maintenance Plan for CO
Recent years - Below National Ambient Air
Quality Standards

Mid-Region Council of Governments
Central New Mexico
Scenario Planning Project:
An Interagency Transportation, Land Use, and
Climate Change Initiative

Mid-Region Council of Governments
Only Metropolitan Planning Organization in the nation
selected to participate
Will focus on entire MRCOG region
Confront unique challenges to region
Air quality/emissions
Water resource availability
Vulnerability to drought and wildfires
Growth pressures – land consumption, transportation challenges
Climate Change
Scenario Planning Project

Mid-Region Council of Governments
>$500,000 in federal funds for technical support and
consulting services ($45,000 in staff support)
Timeline: 18 months
Climate Change Action Plan for Mid-Region (FHWA)
Guidebook for other regions across the country (FHWA)
Integrated in 2040 Metropolitan Transportation Plan
(MRCOG)
Project Highlights

Mid-Region Council of Governments
Long-range planning approach that uses growth scenarios to consider different outcomes for the region
Allows us to ask: Where are we now?
Where do we want to be?
How do we get there?
Help government agencies understand the costs and benefits of different development patterns
Integrate land use and transportation planning to manage growth through effective long-term policy decisions
What is Scenario Planning?

Mid-Region Council of Governments
Why Scenario Planning?
Proactive vs. reactive approach to long-range planning
No longer makes sense to predict one future and respond to it
Standard or “business as usual approach”
findings from one MTP to next do not change
Tools are improving – easier to measure and visualize
different outcomes

Mid-Region Council of Governments
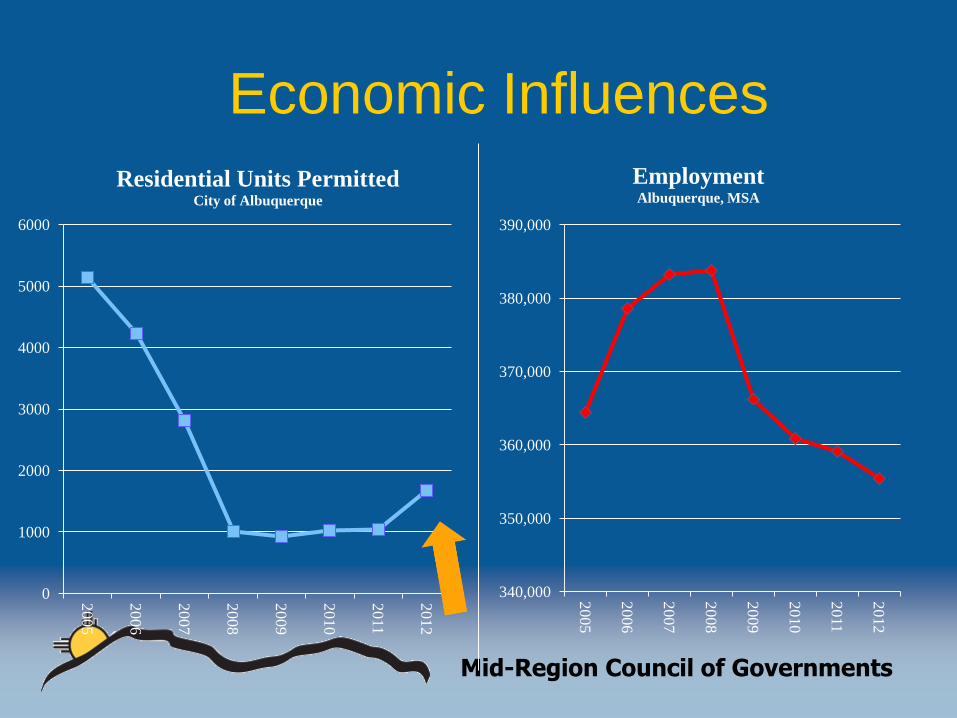
Scenario Planning –
Nashville, TN
TREND SCENARIO ALTERNATIVE SCENARIO

Mid-Region Council of Governments

Mid-Region Council of Governments
Advance climate analysis in scenario planning – Analyze ability for expanded public transportation, employment and housing locations, and development patterns to reduce carbon pollution
Impact decision-making – Incorporate results into local planning efforts
and the 2040 MTP, which guides investment of federal, state, and local transportation funding.
Develop a transferrable process – Be able to replicate the
process and apply strategies to other region.
Build partnerships –Strengthen relationships between federal, state, local
and tribal governments around common goals.
Project Goals

Mid-Region Council of Governments
Gather federal and local partners
Contract with planning consultant
Scenario development and analysis
Workshop – July 2014
Analyze benefits associated with various growth scenarios
Identify policy measures and action items
Integrate results into planning documents and policies across
region
Project Components

Mid-Region Council of Governments
Contact Information
Kendra Watkins
Socioeconomic Program Manager
Telephone –724-3601
Email – [email protected]
Aaron Sussman, AICP
Transportation Planner
Telephone – 724-3631
Email – [email protected]