Embed Size (px)
Citation preview
Western Michigan University Western Michigan University
ScholarWorks at WMU ScholarWorks at WMU
Dissertations Graduate College
8-2013
Three Essays on Social Health Insurance in Developing Countries: Three Essays on Social Health Insurance in Developing Countries:
The Case Study of Ghana The Case Study of Ghana
Stephen Ofori Abrokwah Western Michigan University, [email protected]
Follow this and additional works at: https://scholarworks.wmich.edu/dissertations
Part of the Economics Commons, and the Medicine and Health Commons
Recommended Citation Recommended Citation Abrokwah, Stephen Ofori, "Three Essays on Social Health Insurance in Developing Countries: The Case Study of Ghana" (2013). Dissertations. 176. https://scholarworks.wmich.edu/dissertations/176
This Dissertation-Open Access is brought to you for free and open access by the Graduate College at ScholarWorks at WMU. It has been accepted for inclusion in Dissertations by an authorized administrator of ScholarWorks at WMU. For more information, please contact [email protected].
THREE ESSAYS ON SOCIAL HEALTH INSURANCE IN DEVELOPING
COUNTRIES: THE CASE OF GHANA
by
Stephen Ofori Abrokwah
A dissertation submitted to the Graduate College
in partial fulfillment of the requirements
for the degree of Doctor of Philosophy
Economics
Western Michigan University
August 2013
Doctoral Committee:
Christine Moser, Ph.D., Chair
Donald Meyer, Ph.D.
Edward Norton, Ph.D.
THREE ESSAYS ON SOCIAL HEALTH INSURANCE IN DEVELOPING
COUNTRIES: THE CASE OF GHANA
Stephen Ofori Abrokwah, Ph.D.
Western Michigan University, 2013
More than 2 billion people live in developing countries with health systems
constrained by inequitable access and inadequate funding. The World Health
Organization estimates that more than 150 million of these people suffer financial
breakdown every year having to make unexpected out-of-pocket expenditures for
emergency care.
To improve health and reduce the financial burden on households, a number of
developing countries, including Ghana, Colombia, and Peru, have recently introduced
social health insurance programs which are heavily subsidized. The dissertation is a
collection of three essays looking at how individual health care choices changed as a
result of the availability of insurance coverage in Ghana.
The first essay evaluates health care choices and out-of-pocket expenditures
after the introduction of social health insurance covering modern health care services.
When ill, an individual decides between a set of alternatives; no care, alternative
(traditional) medicine, modern care and both alternative and modern care. My results
show that when health insurance becomes available, individuals either switch to modern
medical care or complement alternative care with modern care. I also find that out-of-
pocket expenditures decrease significantly across all the different types of care as a
result of health insurance.
The second essay studies the effect of health insurance on household fertility
decisions and examines whether the effect is due to women likely to become pregnant
seeking out insurance (adverse selection effect) or women with insurance changing
fertility decisions (moral hazard effect). To disentangle the effects of adverse selection
from moral hazard, I exploit district-level variation in the dates of implementation of the
national health insurance to instrument for insurance enrollment. My results suggest that
both adverse selection and moral hazard effects were present and fertility increased with
insurance.
The third essay examines the role of social health insurance on prenatal care and
expenditure using a two-part model. Results show that health insurance increases the
propensity of pregnant women to seek prenatal care relative to the uninsured. Insured
pregnant women are more likely to seek prenatal care, but conditional on any spending,
they spend less out-of-pocket compared to the uninsured.

Copyright by
Stephen Ofori Abrokwah
2013

ii
ACKNOWLEDGEMENTS
I would like to first of all thank the Almighty God for making what I see today
possible. I would also like to express my sincerest gratitude to those individuals that
have helped and encouraged me throughout my academic journey. I would especially
like to thank the faculty and staff of the Department of Economics.
In particular, I cannot thank enough Dr. Christine Moser, my dissertation chair
for her wisdom and support. Her presence in the course of my entire graduate career,
from teaching me, to guiding me throughout my dissertation, has been vital to my
success at Western Michigan. To Dr. Donald Meyer, Department chair and committee
member, words cannot describe how much I appreciate your contribution to the success
in my Ph.D. pursuit. You have been a father, a mentor, and a friend to me. All I have to
say to sum it all is a big thank you. This dissertation would also not have been what it is
today without the valuable comments and guidance of my external committee member,
Dr. Edward Norton. He went above and beyond to make my research of a better quality.
I would also like to the thank Dr. Susan Pozo and Dr. Jean Kimmel for their
open-door policy and serving as a great source of helpful advice. To the office staff,
Connie and Maggie, thank you for keeping me grounded and sane with your kind words
and desire to help me in any way possible. To my professors, thank you for your
willingness to share your knowledge and wisdom to help me grow and better
understand the world around me.

iii
Acknowledgements – Continued
I would not be where I am today without the loving support of my family and friends
throughout my academic endeavors. To my father, mother, and six siblings, I am
forever indebted to you for your prayers and support throughout my graduate career and
time away from home.
Lastly, I owe Ama Agyeiwaa, my rock and support line, my heartfelt gratitude
for sticking by me throughout the past four years while I pursued my dream.
Stephen Ofori Abrokwah
iv
TABLE OF CONTENTS
ACKNOWLEDGEMENTS ............................................................................................. ii
LIST OF TABLES ......................................................................................................... vii
LIST OF FIGURES ........................................................................................................ ix
CHAPTER
1. INTRODUCTION ………………………………………………………………1
2. THE EFFECT OF SOCIAL HEALTH INSURANCE ON CHOICE OF
CARE ……………………………………………………………………..…….. 8
2.1 Introduction ................................................................................................... 8
2.2 Health Care Financing and Health Insurance in Ghana............................... 11
2.3 Theoretical Framework………………………………....……………… . .14
2.3.1 Model Specification .……………………………………………...15
2.4 Data and Descriptive Statistics……..……….….……………………….21
2.4.1 Descriptive Statistics by Type of Care ………………………….…22
2.4.2 Descriptive Statistics by Survey Period …………………………...23
2.5 Empirical Methodology ………………………………………………... 24
2.5.1 Modeling Household Health Care Expenditures Using a Seven-
Part Model ..…………………………………………..……..…... 24
2.5.2 The Seven-Equation Model …………………………………….. 25
2.6 Empirical Results ………………………………………………………. 28
2.6.1 First Stage Results: Probability of spending on care types ……. 28
v
Table of Contents - Continued
CHAPTER
2.6.2 Second Stage Results: Out-of-pocket expenditures on care
types …………….…………………………………………... 31
2.7 Conclusion and Policy Implications ......................................................... 32
3. THE IMPACT OF SOCIAL HEALTH INSURANCE ON HOUSEHOLD
FERTILITY DECISIONS …………………….…………………………….... 41
3.1 Introduction .............................................................................................41
3.2 Health Care Financing and Health Insurance in Ghana ……………… 43
3.3 Enrollment into the Ghana National Health Insurance Program ………45
3.3.1 Registration Fees …...…………………………………………..46
3.3.2 Premium Payments ………………………………………….….47
3.3.3 Waiting Period for NHIS Benefits …..…………………………48
3.3.4 Other Factors …...………………………………………………49
3.4 Related Literature ..................................................................................... 50
3.5 Data and Descriptive Statistics ................................................................. 51
3.6 Empirical Methodology (Probit and IV-Probit) ...................................... 53
3.7 Empirical Results .................................................................................... 56
3.7.1 Distinguishing between Adverse Selection from Moral Hazard
in Fertility Decisions ………………………………………….56
3.7.2 Robustness Checks ……..……………………………………..58
3.8 Conclusion ………………………………………………………….... 59
vi
Table of Contents - Continued
CHAPTER
4. THE EFFECT OF SOCIAL HEALTH INSURANCE ON PRENATAL
CARE: THE CASE OF GHANA ..……………………………………........... 65
4.1 Introduction ..............................................................................................65
4.2 Health Care Financing and Health Insurance in Ghana …….………….68
4.3 Data and Descriptive Statistics ................................................................ 71
4.4 Empirical Methodology ......................................................................... 73
4.4.1 Prenatal Care Utilization and Health Expenditures ……………74
4.4.2 The Number of Prenatal Care Visits …………………………...76
4.5 Empirical Results . .................................................................................. 79
4.6 Conclusion and Policy Implications ........................................................ 82
5. CONCLUSION, POLICY IMPLICATIONS, AND FUTURE RESEARCH ..95
REFERENCES ...............................................................................................................99
APPENDIX ……………………………………………… ..........................................101
vii
LIST OF TABLES
2.1 Descriptive Statistics by type of care received ………………………………….. 35
2.2 Descriptive Statistics by survey period …………………………………………. 36
2.3 Probit regression and marginal effects for the probability that an individual will
receive any form of care …………………………………………........................
37
2.4 Probability of seeking alternative care only, modern care only, and both types
of care ……………………………………………………………………………
38
2.5 Ordinary least squares on the out-of-pocket expenditures on alternative care,
modern care, and both types of care …………………………………………….
39
2.6
Predictive margins: Delta method ………………………………………………
40
3.1 Total Fertility rate in Ghana per year (children born/woman) …………………. 60
3.2 Descriptive statistics by insurance status (bivariate comparison) ……………... 61
3.3 Baseline Regression - Effect of social health insurance on fertility choice:
Probit and IV-probit regressions …..…………………………………………….
62
3.4 Effect of social health insurance on household fertility choice: Probit and IV
probit regressions adding on village characteristics to baseline specification …..
63
3.5
Effect of social health insurance on household fertility choice: Probit and IV
probit regressions adding on village characteristics and regional dummies …….
64
4.1 Insurance enrollment trends per categories (Aggregated from 2005-2008) ……. 84
4.2 Descriptive statistics by insurance status (bivariate comparison) ……………... 85
4.3 Probit regression on the likelihood of spending at least ₵1 on prenatal care …... 86
viii
List of Tables - Continued
4.4 Ordinary least squares regression on the magnitude of out-of-pocket spending
on prenatal care ………………………………………………………………….
87
4.5 Probit regression on the likelihood of spending at least ₵1 on prenatal care
including an interaction between insurance and urban residency status ………...
88
4.6
Ordinary least squares regression on the magnitude of out-of-pocket spending
on prenatal care including an interaction between insurance and urban residency
status ……………………………………………………………………………..
89
4.7
Predictive margins for the insured ………………………………………………
90
4.8 Predictive margins for the uninsured …………………………………………… 90
4.9 Negative binomial regression for the effect of insurance on the number of
prenatal care visits ……………………………………………………………….
91
ix
LIST OF FIGURES
2.1 Distribution of people who sought health care in both survey periods …….. 40
4.1 Insurance enrollment trends by various categories over time (in thousands).. 92
4.2 Histogram for the distribution of costs by insurance status (in thousands of
cedis) …………………………………………………………………………
93
4.3 Histogram for the number of prenatal doctor care visit by insurance status....
94
1
CHAPTER 1
INTRODUCTION
Illness is a major risk for households in developing countries and can have
significant financial impact on affected households. It potentially reduces a household‟s
stream of income and results in additional medical expenditures. The World Health
Organization (WHO) estimates that more than 150 million of people in developing
countries suffer financial breakdown every year, having to make unexpected out-of-
pocket expenditures for hospital care (Aguilar-Rivera et al. 2007). Without access to
insurance, households use alternative cost-reducing strategies to care for themselves in
times of illness.
A number of developing countries including Ghana, Peru, Namibia, and
Colombia have recently introduced health care reforms, primarily through social health
insurance programs aimed at improving health care access at affordable prices and to
reduce the financial burden to households. Social health insurance was designed to
provide health coverage and to help balance financial risk between the healthy and the
sick (Eggleston 2000). This model of coverage is known as social insurance because
those more likely to use health care (such as the old and sick) do not pay substantially
more for coverage than the healthy and young. Through pooling financial contributions
from enterprises, households, and governments, social health insurance mechanisms
finance and manage health care (Nyman 2004). The social health insurance model
ensures that all people who make contributions receive a pre-defined right to health
care, regardless of their income or social status.
2
Social health insurance generally takes two forms, particularly in developing
countries. In one form, there is universal and mandatory membership for all people.
This ensures the inclusion of underserved groups who are often left out from the
voluntary private health insurance schemes. A typical example of this system is
Taiwan‟s National health insurance program. In the other form, people in the formal
sector are mandated to join, whereas the informal sector is allowed to enroll at will. The
second form is more common in developing countries where it is difficult to track
people in the informal sector, for example Ghana‟s social health insurance program.
Unlike market (private) insurance schemes, social insurance programs are
typically highly subsidized. The concept of market insurance follows an actuarial
model, where how much policyholders pay is in large part a function of their individual
situation and history. Also the providers of market insurance are driven by profit;
whereas social insurance has the goal of optimizing social welfare.
From independence in 1957 through 1970, the government of Ghana provided
free public health services to all citizens. In the 1970‟s, the government introduced a
nominal fee to improve financing of the public health services (Frempong 2009). In the
1980s, the country faced dire economic conditions. This led to the government
introducing user fees, a cost recovery scheme, also known as the „cash and carry‟
system which severely constrained access to health care. Under this system, an
individual was required to have money in order to access any health service. This was
part of the IMF and World Bank‟s structural adjustment program (Mensah et al., 2010).
3
During this period, many people resorted to alternative means of attending to
their health. Most people would postpone doctor visits due to inability to pay for health
care costs (Oppong, 2001; Shaw and Griffin, 1995). In the 1990s, private Community
health insurance schemes were introduced in some districts. These community schemes
however covered less than 3 percent of the population by 2002 (Schmidt, 2009; Sabi,
2005). It was not until year 2003, that the government of Ghana instituted the National
Health Insurance Scheme (NHIS). The goal of this scheme was to ensure equitable and
universal access to health care services for all Ghanaians and to reduce mortality
especially maternal and infant mortality. The program was financed through several
means: First, the National Health Insurance levy (2.5 percent of V.A.T.); payroll
deductions (2.5 percent of income) for formal sector employees, including people who
work in government institutions and the private (formal) and industrial sector, and
premiums for informal sector members. Other funds come from donations or loans.
Annual premiums are between 72,000 cedis and 480,000 cedis based on income
of the insured. To obtain a complete coverage of the population, the premium paid by
adults covers children and dependents under 18. Several other groups are exempted
from premium payments and these include pensioners, the elderly, and indigents;
pregnant women were exempted (as of 2008). (Mensah et al., 2010).
The introduction of social health insurance in Ghana in 2003 provides a unique
opportunity to study how health care choices change in developing countries once
people are given affordable access to care. This dissertation is a collection of three
essays that examines how individual health care choices change as a result of the
availability of social health insurance coverage in Ghana.
4
The first essay evaluates health care choices and out-of-pocket expenditures
after the introduction of Ghana‟s social health insurance program covering only modern
health care services. When ill, an individual decides between a set of alternatives; no
care, alternative medical care, modern care and both alternative and modern care. My
results show that when health insurance becomes available, individuals take advantage
of the insurance by either switching to modern medicine or complementing the use of
alternative care with modern care. Finally, I find that out-of-pocket health expenditures
decrease significantly across all the different types of care sought as a result of health
insurance. Overall, my results show mixed evidence of both substitution and
complementarity across the different health care choices. Even though theory predicts
the substitution result, the complementarity result is rather interesting and suggest that
alternative1 (i.e., traditional) medicine still plays a crucial role in the health care in
Ghana. This result can be partly attributed to the problems of access in regards to longer
distance to modern health facilities as well as perception of the efficacy of alternative
medicine over the years.
The introduction of social health insurance programs in a number of developing
countries is in part a response to two of the millennium development goals, namely
reducing infant mortality and improving maternal health outcomes. By making modern
health care more accessible and affordable, policy makers hope that more women will
seek prenatal care and thereby improve health outcomes. The second and third essays
look at how the insurance program affected fertility and prenatal care decisions,
1 Alternative medicine here broadly refers to non-western medicine and comprises of traditional healers,
herbalists, chemical sellers and pharmacists.
5
respectively. The second essay studies whether the availability of social health
insurance affects the fertility decisions of women and examines whether the effect is
due to women likely to become pregnant seeking out insurance (adverse selection
effect) or women changing fertility decisions once they have insurance (moral hazard
effect).
To disentangle the effects of adverse selection from moral hazard, I exploit an
exogenous event, the district-level variation in the dates of implementation of the
national health insurance, to instrument for insurance enrollment. I first run a standard
probit regression of insurance status on fertility decisions of women, controlling for
demographic, household, and community characteristics without controlling for
endogeneity. The result from this estimation shows that the relationship between
insurance and fertility could be either the result of adverse selection or moral hazard or
both. I then run an iv-probit estimation to account for the endogeneity problem.
Comparing the two sets of regression estimations helps us distinguish between adverse
selection and moral hazard.
My results suggest that women who expect to become pregnant may be more
likely to enroll in the insurance program but that insurance also seems to encourage
women to have more children.
The third essay addresses three issues related to prenatal care. I examine the role
of social health insurance on prenatal care utilization and expenditure using a two-part
model. Finally I evaluate the impact of social health insurance on the number of
prenatal care visits. Sub-Saharan Africa accounts for approximately half of global
maternal deaths (WHO, 2007). As a result of this alarming statistic, a prenatal care
6
model was developed by the World Health Organization (WHO) and recommends a
minimum of four medical care visits with detailed instructions on the basic components
of care for the four visits (WHO, 2001). Most developing countries have often failed in
the past to meet these standards due to lack of human resources, equipment and supplies
(Zanconato, Msolomba, Guarentil, and Franchi, 2006).
The social health insurance programs recently introduced in a number of
developing countries are designed to improve primary health care and help to reduce
thereby reduce infant and maternal mortality. My estimation results show that health
insurance increases the propensity of pregnant women to seek prenatal care relative to
the uninsured. I use a proxy variable for insurance status, called „intent to treat‟, which
is defined as whether a respondent was in a district which had the national health
insurance scheme already in operation at the time when she was surveyed. Using this
variable enables me to avoid the problem of endogeneity, since district-level availability
of the program is exogenous event similar to a natural experiment.
The results regarding prenatal care spending show that insured pregnant women
are more likely to seek and hence to spend at least 1 cedi on prenatal care, but
conditional on any spending they actually spend less out of pocket compared to the
uninsured pregnant women. As a robustness check to the second research question, I
added an interaction term between insurance status and urban residency status. People
in the urban insured group are more likely to have insurance compared to others, but,
even with the interaction term, insurance still has an independent and significant effect
on prenatal care choices.
7
Furthermore, the interaction term, insured pregnant women living in urban
areas, were more likely to seek and hence spend at least 1 cedi on prenatal care.
However conditional on spending any amount, they did not differ significantly from
other pregnant women on the magnitude of out-of-pocket spending. Finally, I find that
insurance increases the odds of having more prenatal care visits compared to not having
insurance, which implies that the insurance program is helping Ghana reach the WHO
target of four prenatal care visits per woman.
8
CHAPTER 2
THE EFFECT OF SOCIAL HEALTH INSURANCE ON CHOICE OF CARE
2.1 Introduction
In most developing countries, traditional healers and remedies made from indigenous
plants (alternative medicine) play a crucial role in the health of millions. According to
the WHO (2008), in some Asian and African countries, up to 80 percent of the
population relies on traditional medicine for their primary health care needs The relative
ratios of traditional practitioners and university trained doctors to the population in
some African countries may partly explain the use of traditional care. For example, in
Kwahu district of Ghana, for every traditional practitioner there are 224 people,
compared with one university trained doctor for nearly 21,000. The same study finds
that there is one healer for every 200 people in the Southern Africa region which is a
much greater doctor-to-patient ratio than is found in North America.
As a result of the challenges faced by households in developing countries with
regards to access to and out-of-pocket cost of modern health care, a number of
developing countries, including Ghana, Namibia, Colombia, and Peru, have recently
introduced social health insurance programs. These programs aim at improving health
care access at affordable prices and thus reducing the financial burden to households.
The government of Ghana instituted the National Health Insurance Scheme (NHIS) in
2003. The primary goal of this scheme was to ensure equitable and universal access to
9
health care services for all Ghanaians and to replace the “cash and carry”2 system which
required prompt payment for health services.
The primary purpose of insurance is to spread risk, which in this case, is the risk
of incurring substantial medical expenses. With risk-spreading, the insured is then
protected against variable financial loss due to medical expenses in the event of illness.
Social health insurance differs from market insurance in that social health insurance
programs are heavily subsidized and place emphasis on the social welfare of the entire
population. Market insurance places greater emphasis on actuarial fairness, with high
risk individuals being made to pay more compared to low risk individuals. Market
insurance model also includes risk reducing strategies like, co-payments, co-insurance,
deductibles, and policy limits. Social Health Insurance programs have been shown to
increase health-seeking behavior and reduce out-of-pocket expenditures for medical
care in developed countries (Waters, Anderson and Mays 2004).
The goal of this paper is to investigate individual decisions over choice of health
care as well as the magnitude of their out-of-pocket health care expenditures after the
introduction of the social health insurance system in Ghana. Specifically, I study
whether individuals or households substitute modern medical care for alternative
medical care, or if they make use of both types of care, suggesting complementarity in
the types of care.
When ill, individuals and households decide whether or not to seek health care
and where to get treatment. These household decisions are influenced by factors such as
2 Cash and carry is a sales policy or a method of purchase in which the customer must remit payment at
the point of service and must take the item with you. In the context of this paper, it can be seen as paying
for health care before you receive the necessary treatment.
10
the nature of the medical problem, the expected cost of treatment, individual‟s
perception about the type of care, accessibility of health care as well as other socio-
economic characteristics of the household in question. Based on these factors,
individuals, after deciding whether to seek care, must choose between seeking
alternative medicine, which includes traditional healers, spiritualists or visiting a
chemical seller3; and modern medical care.
The proportion of the population seeking some form of alternative medicine
cuts across all income groups, (Barnes et al., 2008; Eisenberg et al., 1998). This is
because alternative medicine has developed over generations within these societies
before the era of modern medicine. Another advantage that alternative medicine has
over modern medicine is that it is generally less expensive and often closer to home,
which implies that individuals without health insurance are more likely to use some
form of alternative medicine (i.e. herbalists, spiritualists) in these societies.
I apply models used in the health literature for informal care versus formal care
to analyze the relationship between alternative medicine and modern medicine. There
are two main competing models in the health literature on the trade-off between
informal and formal care, namely, the substitution model and the complementary
model. According to the substitution model, (Greene 1983), as the patient receives
formal care, the household decreases the amount of informal care received. The
3 In Ghana, a chemical seller is one who is licensed and legally authorized to sell only products that do
not require a medical prescription, thus mostly traditional medicine. Typically, the attendants have
minimal or no training on appropriate dispensing of medicines. Chemical sellers‟ shops are the principal
source of medicinal products for the Ghanaian rural population. Chemical sellers are also recognized as
the first-line or only source of consultation for 60 percent of people seeking health care in general. There
are over 8,000 licensed chemical sellers in Ghana and perhaps 2,000 more that are unlicensed, Ghana
Health Service (2009).
11
complementary model, (Blandford and Chappell 1991), on the other hand, hypothesizes
that households jointly use both informal care and formal care in their quest to receive
treatment. When the medical needs of the individual seeking care exceed informal care
resources, formal care provides the necessary support, (Bass and Noelker 1989;
Edelman and Hughes 1990; Denton 1997). There is little evidence in the literature
regarding whether the substitution model or the complementary model dominates
(Jiménez-Martín and Prieto 2008). Both types of care may happen simultaneously or
sequentially.
There are a number of papers which have discussed the issue of access to health
care and financial protection in developing countries (for example, Yip, et al. 2008; and
Trujillo et al. 2005), but there has been none to the best of my knowledge that has
focused on the role of a social health insurance scheme on health care decisions. This is
also the first paper to use an extension of the four part equation model by Duan et al.
(1982 and 1983), an extension of the two-part models, to model health care
expenditures and health care choices in developing countries. In the present application,
a seven-part equation model is needed due to the number of categories of care.
2.2 Health Care Financing and Health Insurance in Ghana
The health insurance program introduced in Ghana in 2003 is the most recent of several
major reforms of Ghana‟s health system since independence in 1957. After
independence, the government embarked on a welfare system which provided free
health care for all its citizens at public health facilities. Health care was primarily
financed by taxes and external donor support, user fees were removed and attention was
12
directed to developing a wide range of primary health care facilities across the country.
By the early 1970s, the country was facing stagnating economic growth and could
therefore not support its health financing with tax revenues alone.
In 1985, the government introduced health care reforms as part of the ongoing
structural adjustment programs aimed mainly at reducing government spending to
address budgetary deficits. The reforms included introducing cost recovery mechanisms
through user fees (known in Ghana as “cash and carry”) in order to discourage
unnecessary use of services and liberalize health services to allow private sector
involvement (The World Bank 2007). This system led to dramatic declines in health
care utilization, with outpatient visits to hospitals dropping from 4.6 million to 1.6
million in 1985 (Ghana health service 2009). Beginning in 1989, community-based
health insurance (CBHI) schemes, also known as mutual health organizations (MHOs),
were introduced in certain districts throughout the country in response to this plight.
However coverage rates were very low covering less than 5 percent of the population,
leaving many Ghanaians vulnerable in the event of a catastrophic illness (Ghana Health
Service 2009).
In response, the government of Ghana passed the National Health Insurance Act
(650) in 2003, whose primary goal was to reduce out-of-pocket expenditures and
improve access to, as well as the quality of, basic health care services through the
establishment of district-wide insurance schemes coordinated by the National Insurance
Authority. The funding sources come mainly from the National Health Insurance Levy
(2.5 percent of V.A.T.); secondary sources are payroll deductions (2.5 percent of
income) for formal sector employees, including people who work in government
13
institutions and the private (formal) and industrial sectors, and premiums for informal
sector members. Other funds come from donations or loans.
Membership in the National Health Insurance Scheme (NHIS) is mandatory for
formal sector workers, unless alternative private health insurance can be demonstrated.
Membership is optional for informal sector workers and those not in the labor force who
make up the majority of the population. For formal sector workers, a payroll deduction
of 2.5 percent is transferred to the NHI fund as part of their contribution to the Social
Security and National Insurance Trust fund. Premiums by those outside the formal
sector are supposed to be defined according to income such that the lowest-income
group pays an annual premium of 72,000 cedis, or roughly US$ 8, while those in the
highest income group pay a premium of 480,000 or US$53 per annum for each enrolled
individual. In practice, a flat premium payment of 72,000 per annum is charged in some
regions due to the difficulty of assessing and verifying income in the informal sector.
Once the premium is paid, there are no additional costs, such as co-payments or
deductibles, to members, provided the ailment falls within the defined benefits package.
The National Health Insurance Act (NHIA) mandates a pre-defined benefits
package that covers about 95 percent of the disease burden in Ghana. Services covered
include outpatient consultations, essential drugs, inpatient care and shared
accommodation, maternity care (normal and caesarean delivery), eye care, dental care
and emergency care. Excluded benefits include echocardiography, renal dialysis, heart
and brain surgery, organ transplantation as well as other drugs not listed in the approved
drugs list. Several groups are exempted from premium payments, and these include
pensioners, the elderly, children under age 18, indigents and pregnant women (pregnant
14
women were added as of 2008). However, those exempted from premiums still need to
be registered to receive the benefits. There is a six-month waiting period between
joining and being eligible for benefits (Government of Ghana 2004). By the end of
2008, Ghana‟s national insurance program covered 61 percent of the population, with
District Municipal Health Insurance Schemes (DMHIS) operating in all districts
(Asenso-Boadi 2009).
2.3 Theoretical Framework
Grossman‟s (1972) influential paper on demand for health has formed the foundation in
the field of health economics in understanding and formulating demand functions for
health In Grossman‟s human capital model, individuals demand health care or ”good
health.” Good health is a consumption good that provides both utility and production
benefits (healthy individuals have greater earning potential). Individuals inherit an
initial stock of health that declines over time and can be increased by investment
according to Grossman‟s model. They then maximize the life-cycle discounted sum of
utilities defined over consumption of health services and consumption of other
commodities subject to an inter-temporal budget constraint.
To achieve the desired level of health capital, individuals invest time and utilize
health care to generate health capital. The Grossman reduced form demand for health
care equation implied by the model takes the following form:
( ) ( ) * ( ) ( ) +⁄ (1)
15
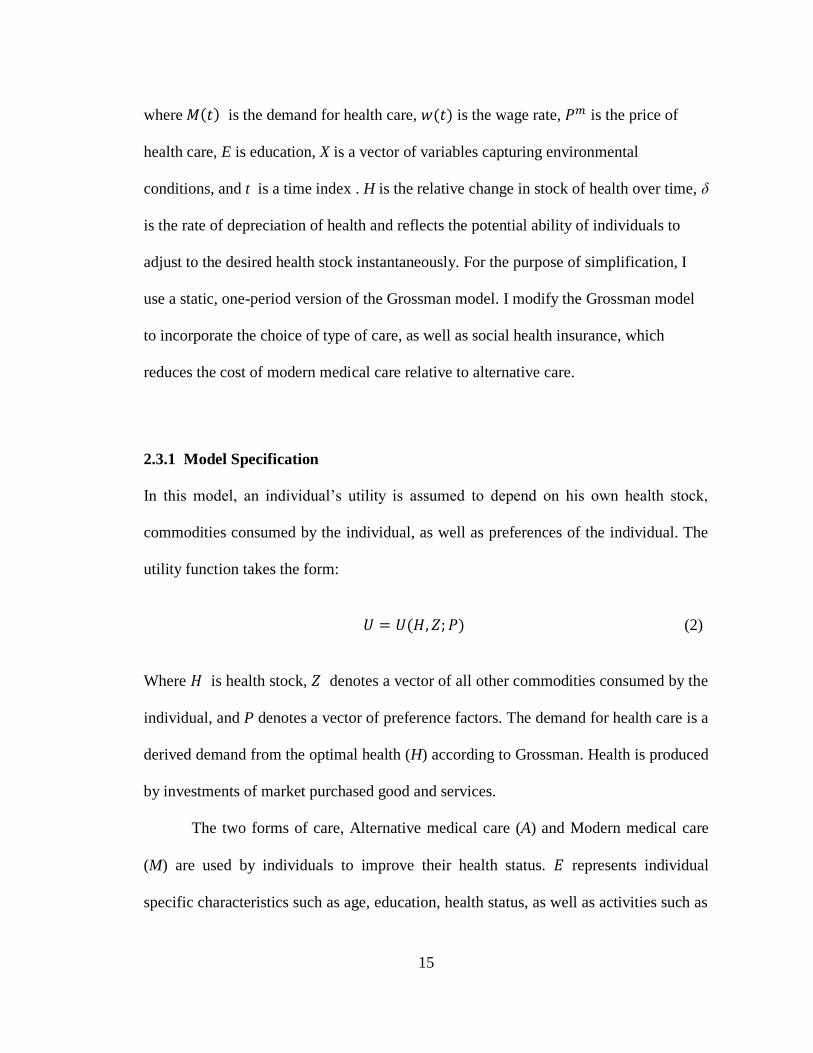
where ( ) is the demand for health care, ( ) is the wage rate, is the price of
health care, E is education, X is a vector of variables capturing environmental
conditions, and t is a time index . H is the relative change in stock of health over time, δ
is the rate of depreciation of health and reflects the potential ability of individuals to
adjust to the desired health stock instantaneously. For the purpose of simplification, I
use a static, one-period version of the Grossman model. I modify the Grossman model
to incorporate the choice of type of care, as well as social health insurance, which
reduces the cost of modern medical care relative to alternative care.
2.3.1 Model Specification
In this model, an individual‟s utility is assumed to depend on his own health stock,
commodities consumed by the individual, as well as preferences of the individual. The
utility function takes the form:
( ) (2)
Where is health stock, denotes a vector of all other commodities consumed by the
individual, and P denotes a vector of preference factors. The demand for health care is a
derived demand from the optimal health (H) according to Grossman. Health is produced
by investments of market purchased good and services.
The two forms of care, Alternative medical care (A) and Modern medical care
(M) are used by individuals to improve their health status. represents individual
specific characteristics such as age, education, health status, as well as activities such as
16
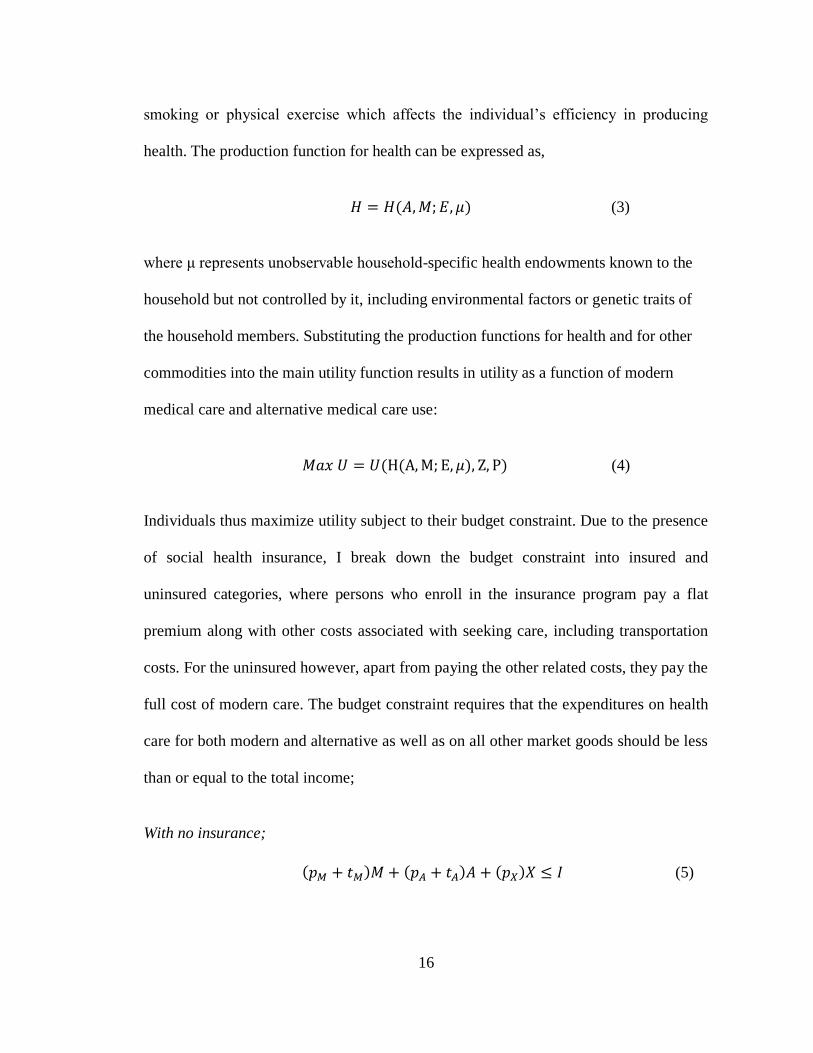
smoking or physical exercise which affects the individual‟s efficiency in producing
health. The production function for health can be expressed as,
( ) (3)
where μ represents unobservable household-specific health endowments known to the
household but not controlled by it, including environmental factors or genetic traits of
the household members. Substituting the production functions for health and for other
commodities into the main utility function results in utility as a function of modern
medical care and alternative medical care use:
( ( ) ) (4)
Individuals thus maximize utility subject to their budget constraint. Due to the presence
of social health insurance, I break down the budget constraint into insured and
uninsured categories, where persons who enroll in the insurance program pay a flat
premium along with other costs associated with seeking care, including transportation
costs. For the uninsured however, apart from paying the other related costs, they pay the
full cost of modern care. The budget constraint requires that the expenditures on health
care for both modern and alternative as well as on all other market goods should be less
than or equal to the total income;
With no insurance;
( ) ( ) ( ) (5)
17
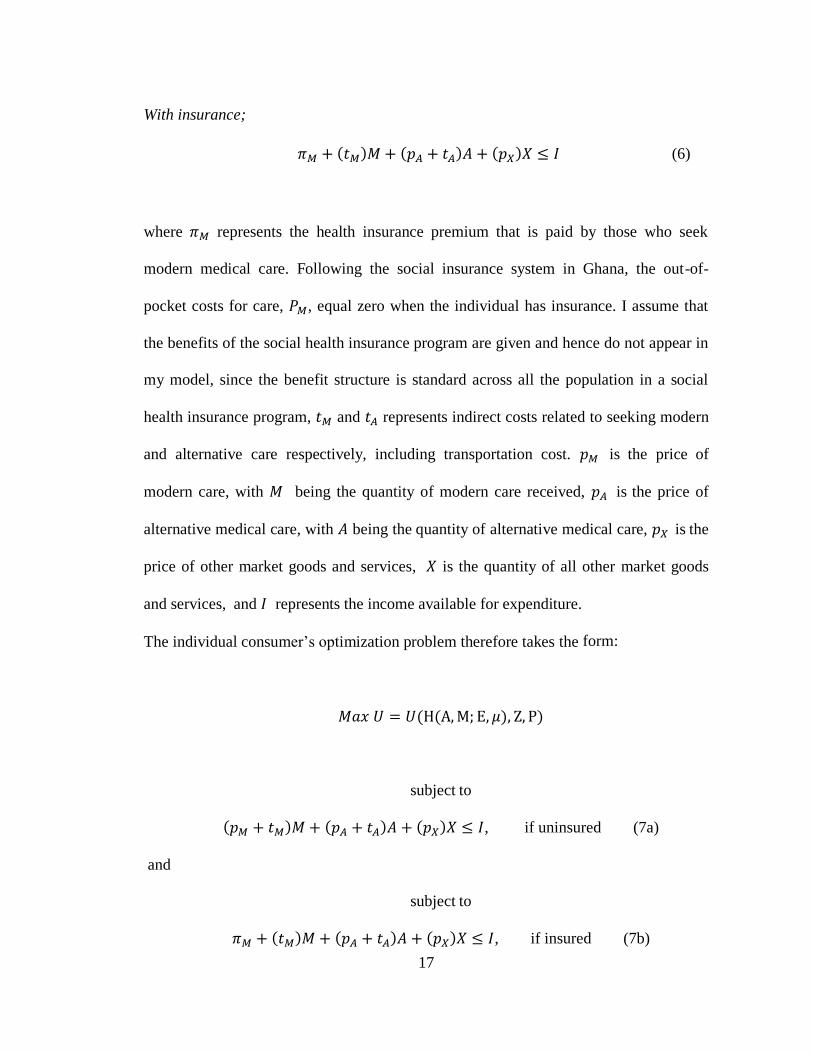
With insurance;
( ) ( ) ( ) (6)
where represents the health insurance premium that is paid by those who seek
modern medical care. Following the social insurance system in Ghana, the out-of-
pocket costs for care, , equal zero when the individual has insurance. I assume that
the benefits of the social health insurance program are given and hence do not appear in
my model, since the benefit structure is standard across all the population in a social
health insurance program, and represents indirect costs related to seeking modern
and alternative care respectively, including transportation cost. is the price of
modern care, with being the quantity of modern care received, is the price of
alternative medical care, with being the quantity of alternative medical care, is the
price of other market goods and services, is the quantity of all other market goods
and services, and represents the income available for expenditure.
The individual consumer‟s optimization problem therefore takes the form:
( ( ) )
subject to
( ) ( ) ( ) , if uninsured (7a)
and
subject to
( ) ( ) ( ) , if insured (7b)

18
Setting up the Lagrangian function first for no insurance gives us:
( ( ) ( ) ) * ( )
( ) ( ) + (8)
The first order conditions are as follows:
( ) (9a)
( ) (9b)
( ) (9c)
( ) ( ) ( ) (9d)
From (9a) and (9b), I have that
(10)
Setting up the Lagrangian function first for having insurance gives us:
( ( ) ( ) ) * ( )
( ) ( ) + (11)
The first order conditions are as follows:
( ) (12a)
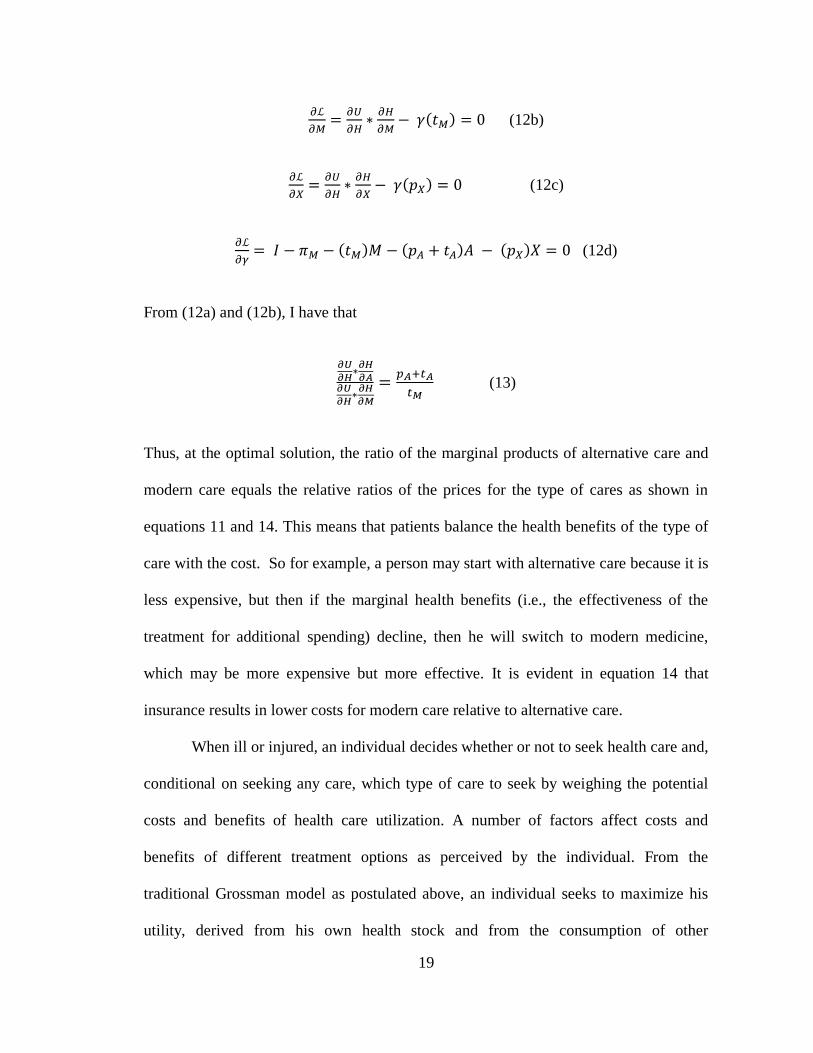
19
( ) (12b)
( ) (12c)
( ) ( ) ( ) (12d)
From (12a) and (12b), I have that
(13)
Thus, at the optimal solution, the ratio of the marginal products of alternative care and
modern care equals the relative ratios of the prices for the type of cares as shown in
equations 11 and 14. This means that patients balance the health benefits of the type of
care with the cost. So for example, a person may start with alternative care because it is
less expensive, but then if the marginal health benefits (i.e., the effectiveness of the
treatment for additional spending) decline, then he will switch to modern medicine,
which may be more expensive but more effective. It is evident in equation 14 that
insurance results in lower costs for modern care relative to alternative care.
When ill or injured, an individual decides whether or not to seek health care and,
conditional on seeking any care, which type of care to seek by weighing the potential
costs and benefits of health care utilization. A number of factors affect costs and
benefits of different treatment options as perceived by the individual. From the
traditional Grossman model as postulated above, an individual seeks to maximize his
utility, derived from his own health stock and from the consumption of other
20
commodities. For the purposes of my analysis, I will focus on the following
determinants of demand for health; insurance status, access to health care, health status,
income, age, education, occupation, type of illness, severity of illness and gender.
Social health insurance, which reduces the cost of modern health care, should
induce individuals to seek more modern medical care relative to alternative medicine,
thus supporting the substitution idea, assuming that modern medicine is a normal good,
thus exhibiting income effects of the price change. On the hand there could be
complementary as well as income effects. If the price of modern health care falls, there
will be an incentive for households to complement modern care with alternative care as
they consume more health care services overall. The cost of access to health care is
another important determinant of the demand for health (Carlson 1999). Access can be
proxied by distance or access to transportation. It constitutes out-of-pocket payments
and time costs, which depends on labor income and the opportunity cost of lost
household production due to sick time.
In general, conditional on health status, income should be positively associated
with health care utilization. The typical sources of income are either through the labor
market or from self-employment, especially agricultural work. According to the
Grossman demand for health model, it is assumed that health depreciates with time and
hence, one would expect age to affect the marginal utility of health.
This paper tests whether the introduction of social health insurance causes
individuals to complement modern care with alternative care, or to substitute modern
medical care for alternative medical care. Theory suggests that the results could go
either way, thus alternative care and modern care can be substitutes or complements.
21
2.4 Data and Descriptive Statistics
The data used for this study come from two rounds of a survey conducted in two
districts of Ghana, with different samples of households selected in each round. The
baseline survey was conducted September - October 2004, while the end-line survey
took place September – October 2007. The period of the baseline survey preceded the
roll-out of the National Health Insurance (NHIS) program, while the end-line survey
took place after the implementation of the NHIS. The survey was funded by the United
States Agency for International Development and conducted by the Health Systems
20/20 Project, led by Abt Associates Inc., in collaboration with the Research and
Development Division of the Ghana Health Services. The two districts in the study are
Nkoranza and Offinso, both predominantly agricultural and relatively poor. Nkoranza is
one of the few districts in the country where a municipal health organization operated
before the NHIS.
A two-stage cluster sampling design was used, first selecting a sample of
municipalities, then selecting a sample of households within the municipalities. The
baseline sample covered 1,805 households, and the end-line sample consisted of 2,520
households in the same communities visited at baseline. The number of individuals
reporting illness or injury within two weeks prior to the survey was 413 and 411 for
baseline and end line surveys respectively. The household survey collected information
on socio-demographic characteristics of households, health insurance membership, and
health care utilization and payments associated with: (1) injury or illness in the two
weeks preceding the survey, (2) hospitalization in the 12 months preceding the survey,
and (3) births in the household in the 12 months preceding the survey. The survey also
22
collected information related to the treatment-seeking behavior for recent illness or
injury for the past 15 days, whether the household sought an informal source of care or
a formal source of care. Additional information was collected on ownership of land,
assets (including television, refrigerator, telephone, bicycle, motorbike, and car), and
living conditions (whether there is electricity, floor type, type of water, fuel used for
cooking, having farmland, and number of rooms in the house). From this information, a
wealth quintile variable was constructed using principal component analysis.
2.4.1 Descriptive Statistics by Type of Care
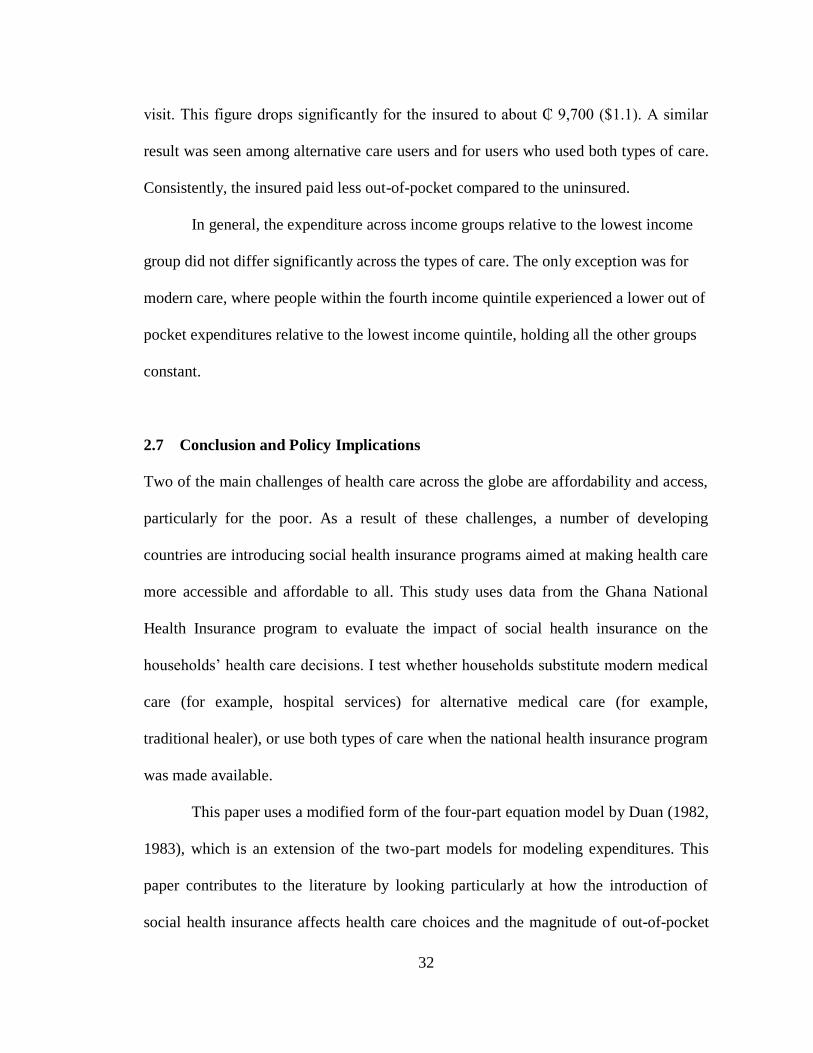
Figure 2.1 and table 2.1 provide descriptive statistics for the types of care sought by
households: no care, alternative care, modern medical care and those who jointly seek
alternative care and modern medical care. From figure 2.1, it is seen that the proportion
of people who sought both types of care increased in the end-line survey period relative
to the baseline survey period, which supports the theory that there is persistence in the
use of alternative medicine. Also, the proportion of people who sought only modern
medical care increased in the end-line survey relative to the baseline survey period,
while, the proportion of people who sought only alternative medical care fell in the end-
line survey compared to the baseline period. Since the National health insurance
program started between the two survey periods, it is reasonable to assume that at least
a portion of the changes in the distribution to the insurance program.
Consistent with expectations, a higher proportion of insured household members
seek modern medical care relative to the uninsured (table 2.1). The proportion of
insured individuals who sought modern care is greater than the insured who sought each
23
of the other sources of care. Approximately 70 percent of the people who sought
modern medical care had health insurance, while only 32 percent of persons who sought
alternative medicine were insured. This is not surprising, since the national health
insurance program supports the formal health centers and public hospitals. In my
sample, women account for a disproportionate share (74 percent) of people who
reported illness over the study period.
Across the different age groups who sought modern medical care, 41 percent of
them were children under age 18, while 32 percent of them were between ages 18 and
49. Since the communities surveyed were relatively rural, the predominant occupations
in these communities were farmers and fishermen. There were more people who
reported severe illness than less serious illness. Not surprisingly, a higher percentage of
people who self-medicated or did not seek any form of health care were people who
reported less severe illness.
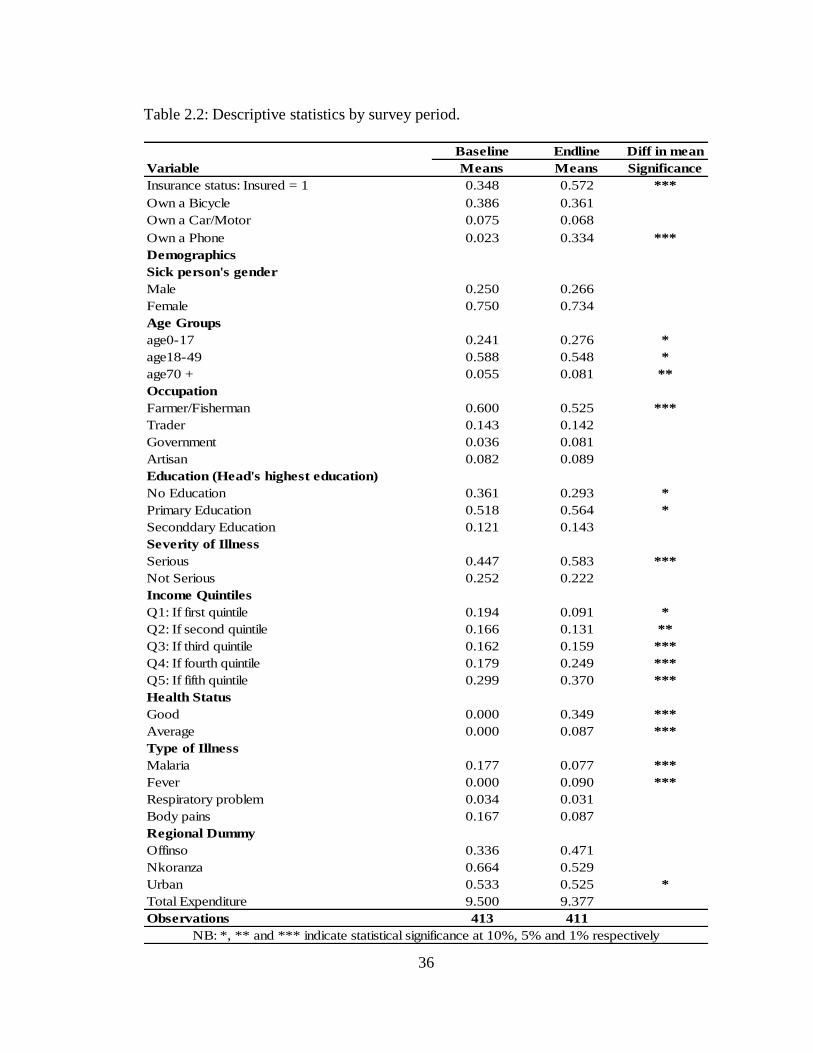
2.4.2 Descriptive Statistics by Survey Period
Table 2.2 shows the demographic characteristics by year. There were a higher
proportion of individuals with health insurance during the end-line survey relative to the
baseline survey period. Insurance enrollment almost doubled from 34 percent to 57
percent from the baseline to end line. The primary reason is that the national health
insurance program had not yet been rolled out in the entire country at the time of the
baseline survey. The Nkoranza district, however, did have a working community based
health insurance program at the time, whereas Offinso did not have any in place. Total
health expenditure decreased from the baseline to the end line and this includes total
24
health expenditure including transport costs. This was generally expected since the
health insurance program helped reduce the out-of-pocket health care expenditures.
2.5 Empirical Methodology
2.5.1 Modeling Household Health Care Expenditures Using a Seven-Part Model
In this paper, I present estimates based on an augmented form of the four-equation
model developed by Duan et al. (1982 and 1987); Duan (1983). This particular model
is well-suited to the characteristics of the distribution of health expenditure. First, in
health expenditures data, it is common to observe a high percentage of zeros. This
often results from the fact that a large proportion of respondents use no medical
services during the year. Second, the distribution of expenditures among users is highly
skewed to the right (visits, hospitalization, costs). Third, the distribution of medical
expenses may be different across types of care. There also exists nonlinearity in
response to covariates.
According to Deb et al. (2011), ordinary least squares may yield badly biased
and/or less precise estimates of means and marginal effects if these characteristics of
the data are ignored. Also the results will not be robust to tail problems and estimates
from one subsample may even forecast poorly to another subsample from same
population. As Duan et al. (1982 and 1983) and Manning et al. (1987) show, a four-
equation model that exploits the characteristics of the medical expense distribution
yields consistent estimates with lower mean square error than other methods.
25
2.5.2 The Seven-Equation Model
I partition the respondents into four groups: nonusers (those who were ill but sought no
care), users of only alternative medical care, users of only modern medical care, and
users of both alternative medical care and modern medical care. Thus the choice of care
variable is a categorical variable j which denotes the choice of the type of care among
the set of alternatives {1= nonusers, 2= Alternative medical care (A), 3 = Modern
medical care (M), 4 = Both Alternative medical care and Modern medical care (B)}.
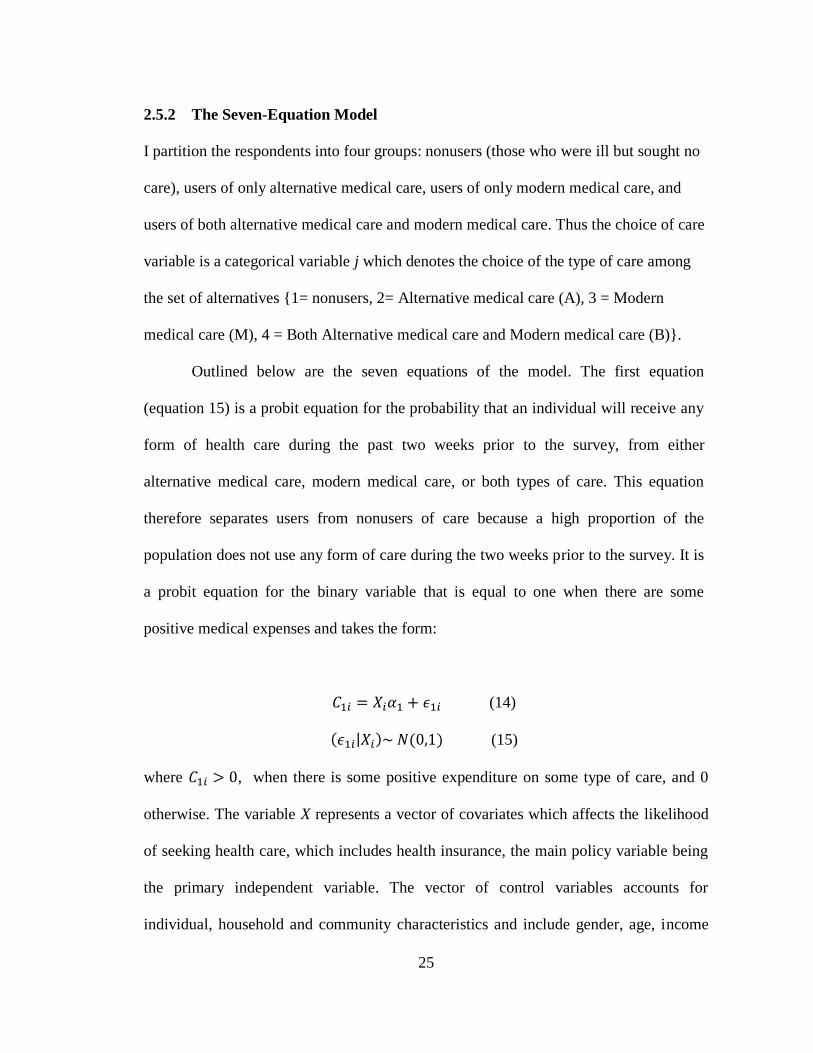
Outlined below are the seven equations of the model. The first equation
(equation 15) is a probit equation for the probability that an individual will receive any
form of health care during the past two weeks prior to the survey, from either
alternative medical care, modern medical care, or both types of care. This equation
therefore separates users from nonusers of care because a high proportion of the
population does not use any form of care during the two weeks prior to the survey. It is
a probit equation for the binary variable that is equal to one when there are some
positive medical expenses and takes the form:
(14)
( | ) ( ) (15)
where , when there is some positive expenditure on some type of care, and 0
otherwise. The variable X represents a vector of covariates which affects the likelihood
of seeking health care, which includes health insurance, the main policy variable being
the primary independent variable. The vector of control variables accounts for
individual, household and community characteristics and include gender, age, income
26
quintile of household, relationship to household head, occupation, education, marital
status, and regional dummies.
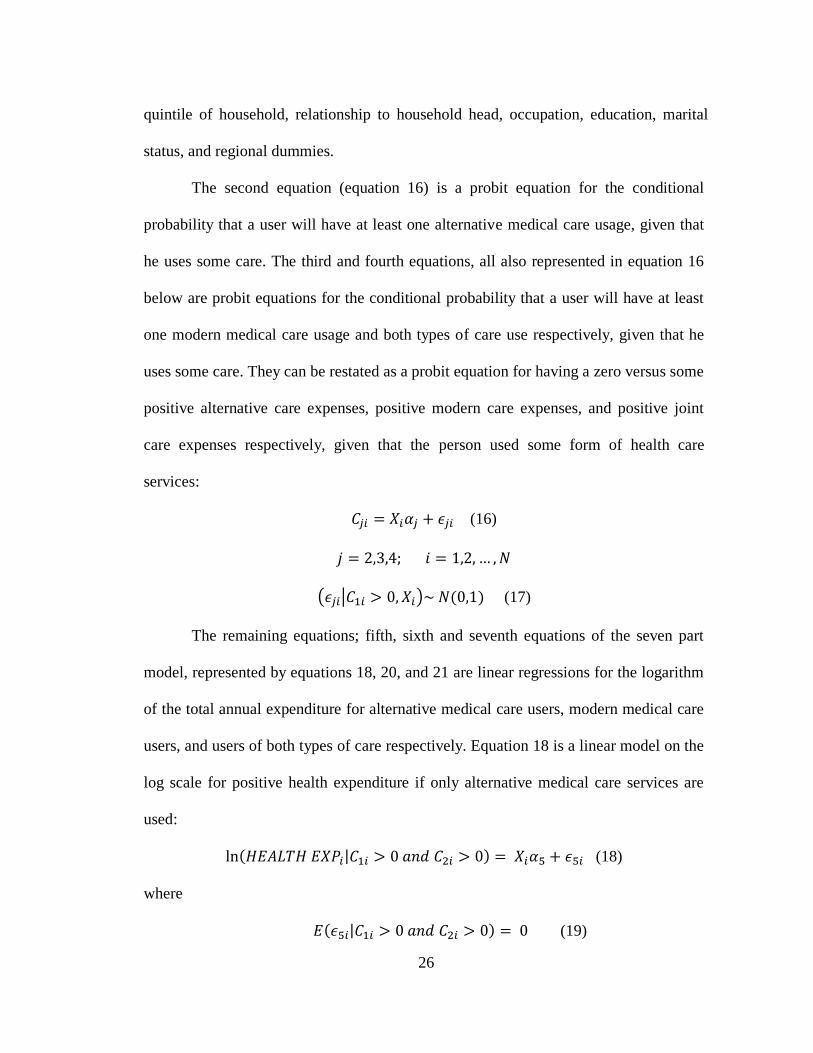
The second equation (equation 16) is a probit equation for the conditional
probability that a user will have at least one alternative medical care usage, given that
he uses some care. The third and fourth equations, all also represented in equation 16
below are probit equations for the conditional probability that a user will have at least
one modern medical care usage and both types of care use respectively, given that he
uses some care. They can be restated as a probit equation for having a zero versus some
positive alternative care expenses, positive modern care expenses, and positive joint
care expenses respectively, given that the person used some form of health care
services:
(16)
( | ) ( ) (17)
The remaining equations; fifth, sixth and seventh equations of the seven part
model, represented by equations 18, 20, and 21 are linear regressions for the logarithm
of the total annual expenditure for alternative medical care users, modern medical care
users, and users of both types of care respectively. Equation 18 is a linear model on the
log scale for positive health expenditure if only alternative medical care services are
used:
( | ) (18)
where
( | ) (19)
27
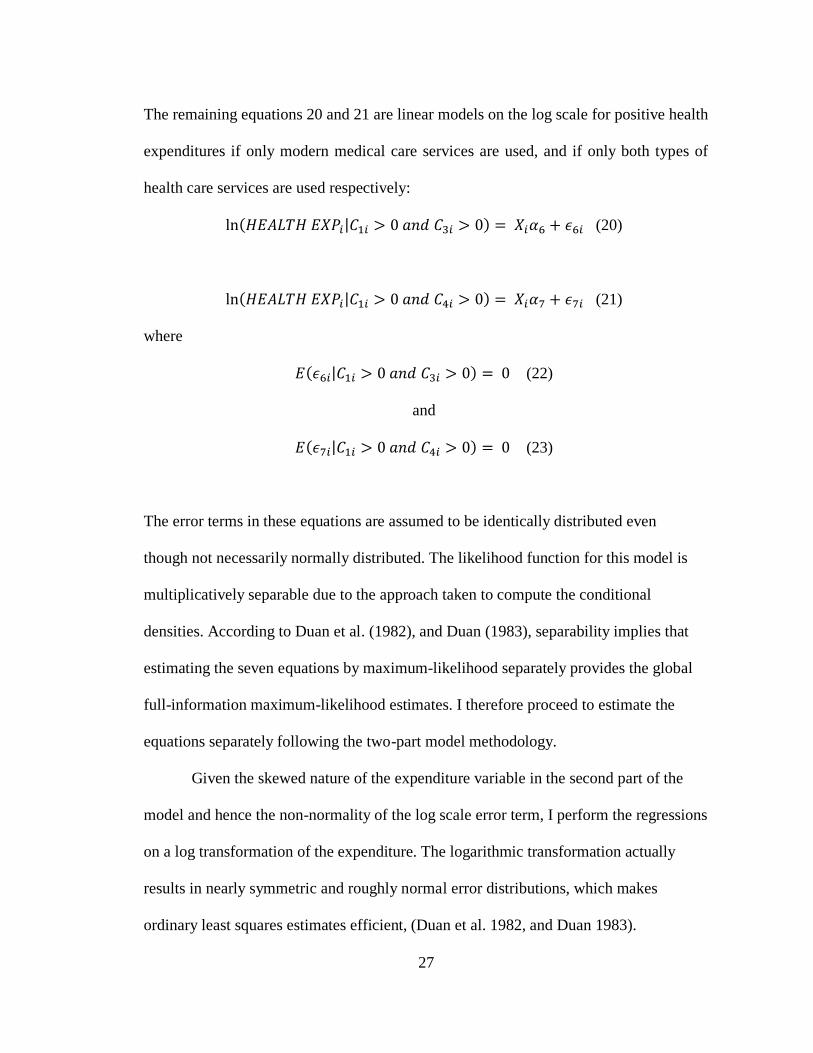
The remaining equations 20 and 21 are linear models on the log scale for positive health
expenditures if only modern medical care services are used, and if only both types of
health care services are used respectively:
( | ) (20)
( | ) (21)
where
( | ) (22)
and
( | ) (23)
The error terms in these equations are assumed to be identically distributed even
though not necessarily normally distributed. The likelihood function for this model is
multiplicatively separable due to the approach taken to compute the conditional
densities. According to Duan et al. (1982), and Duan (1983), separability implies that
estimating the seven equations by maximum-likelihood separately provides the global
full-information maximum-likelihood estimates. I therefore proceed to estimate the
equations separately following the two-part model methodology.
Given the skewed nature of the expenditure variable in the second part of the
model and hence the non-normality of the log scale error term, I perform the regressions
on a log transformation of the expenditure. The logarithmic transformation actually
results in nearly symmetric and roughly normal error distributions, which makes
ordinary least squares estimates efficient, (Duan et al. 1982, and Duan 1983).
28
However, in calculating expenditure predictions from the model, one runs into
the problem of retransformation back to raw-scale expenditures. A commonly used
retransformation technique is Duan‟s smearing transformation from the OLS model for
ln(expenditure).
In a typical cross-sectional survey data, insurance is endogenous when
enrollment is voluntary; those who expect to demand more services have a clear
incentive to obtain more insurance coverage. I acknowledge in this paper the presence
of a self-selection problem with respect to the insurance variable. Because people are
able to self-select into the insurance program, an appropriate endogeneity correction
may be needed. However, since my data set is from a small survey in only two districts
in Ghana, it makes it very difficult to be able to obtain a good instrument.
2.6 Empirical Results
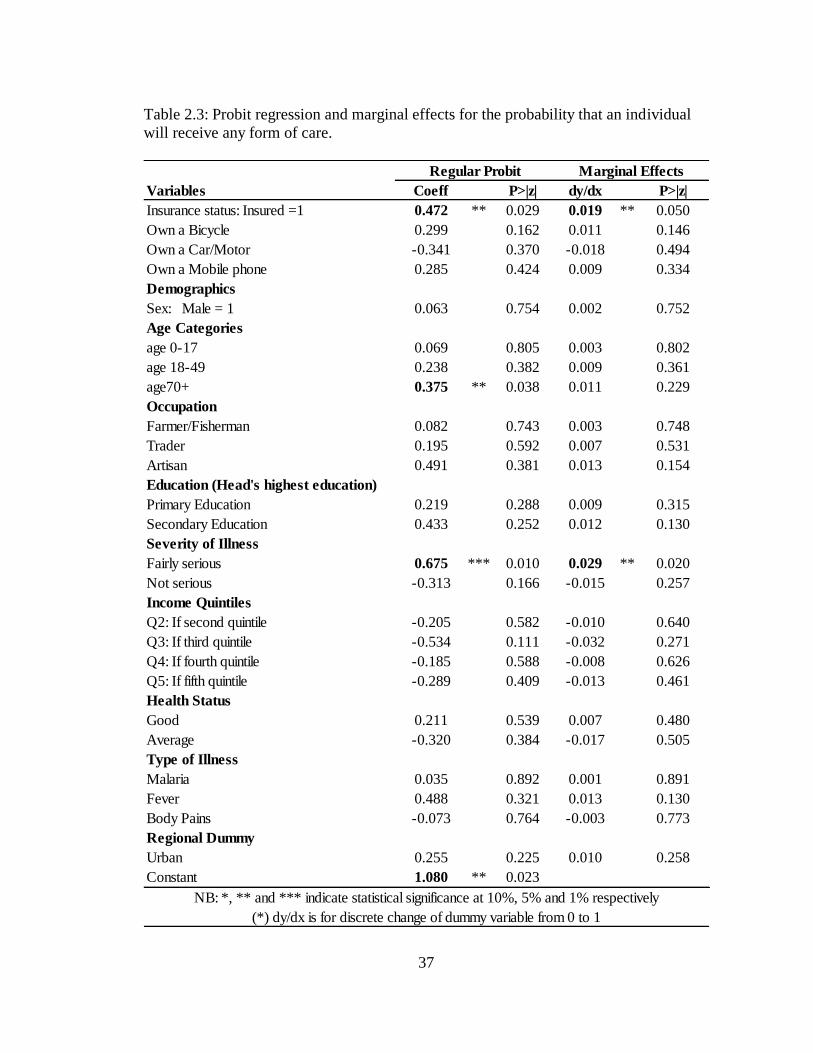
2.6.1 First Stage Results: Probability of spending on care types
The first part of the analysis looks at who is seeking some form of care. Following from
the seven-part equation model, the first equation whose results are shown in table 2.3 is
a probit regression along with its associated marginal effects for the probability that an
individual will receive some form of care within two weeks prior to the survey. It is
clear that having insurance does increase the predicted probability of seeking at least
some form of care and statistically significant at 5 percent level.
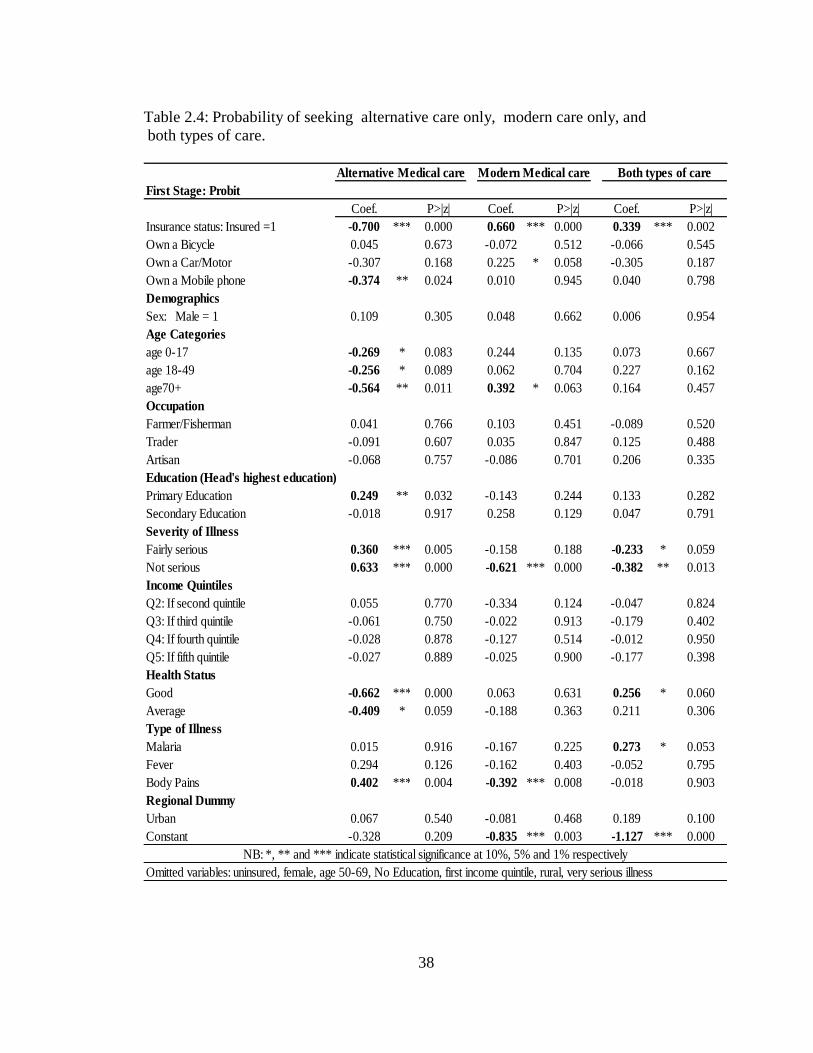
The results in table 2.4 show the probability of seeking the different types of
care, namely alternative medical care, modern medical care and the joint care category.
29
Table 2.5 shows the magnitude of out-of-pocket spending conditional on any spending
on the respective types of care.
Table 2.4 estimations show evidence of a trade-off between modern medical
care and alternative medical care as a result of the social health insurance. Having
insurance has a strong positive effect on the probability of seeking and hence spending
on modern medical care (see table 2.4). On the other hand, insurance has a strong
negative effect on the likelihood of seeking alternative medicine. Furthermore, having
insurance has a strong positive effect on the probability of spending on seeking both
types of care. This result supports the idea that there seems to be a trade-off between
alternative medical care and modern medical care or alternative medical care and joint
care when social health insurance becomes available. This therefore provides some
evidence for the substitution model put forward by Greene (1983). The tradeoff could
also be between alternative medicine and the joint care, where, as a result of insurance
being made available, people who exit the exclusive use of alternative medicine might
enter the category who seeks both types of care. Thus they might only add on modern
medicine which has become relatively cheaper instead of switching to seeking only
modern medical care.
Even though the substitution result is not very surprising, there is evidence for
complementarity in that there is an increase in the predicted probability of people
seeking both types of care. This result tends to support the evidence that alternative
medicine is still widely used across the globe especially in developing countries, even in
the presence of insurance in the modern health sector. Thus, people who use both types
of care may continue using both after obtaining insurance, as much as those who use
30
only modern medicine may seek modern medical care after insurance enrollment.
Consistent with the theoretical model, social insurance reduces the exclusive use of
alternative medicine. The above results supports the complementary model by
Blandford and Chappell (1991) in that people who use alternative medicine do not use it
exclusively and often complement it with modern medicine.
With regards to access to health care, I use three different proxies for access to
health care, namely whether a household own a bicycle, whether a household owns a
motor cycle or a car or whether the individual owns a mobile phone. Households who
own a car or a motor cycle are more likely to choose modern medicine care (hospital
care) compared to the other types of care. I recognize that these are imperfect measures
of access, as they do not reflect distance to a health facility and are also correlated with
income. With regards to health status, both individuals reporting good or average
health relative to a poor health reduced their likelihood of seeking alternative medicine,
while individuals with good health status were more likely to seek more of both types of
care.
I also find different care choices across age groups. The base category for the
age grouping was age 50-69. For alternative medical care, children (under 18 years), the
working class (age 18-49) and the very old (age 70+) relative to the omitted category
showed significant decreases in their probability of spending on alternative care. There
is however an associated increase in the likelihood of spending on modern care for the
elderly (age 70+).
31
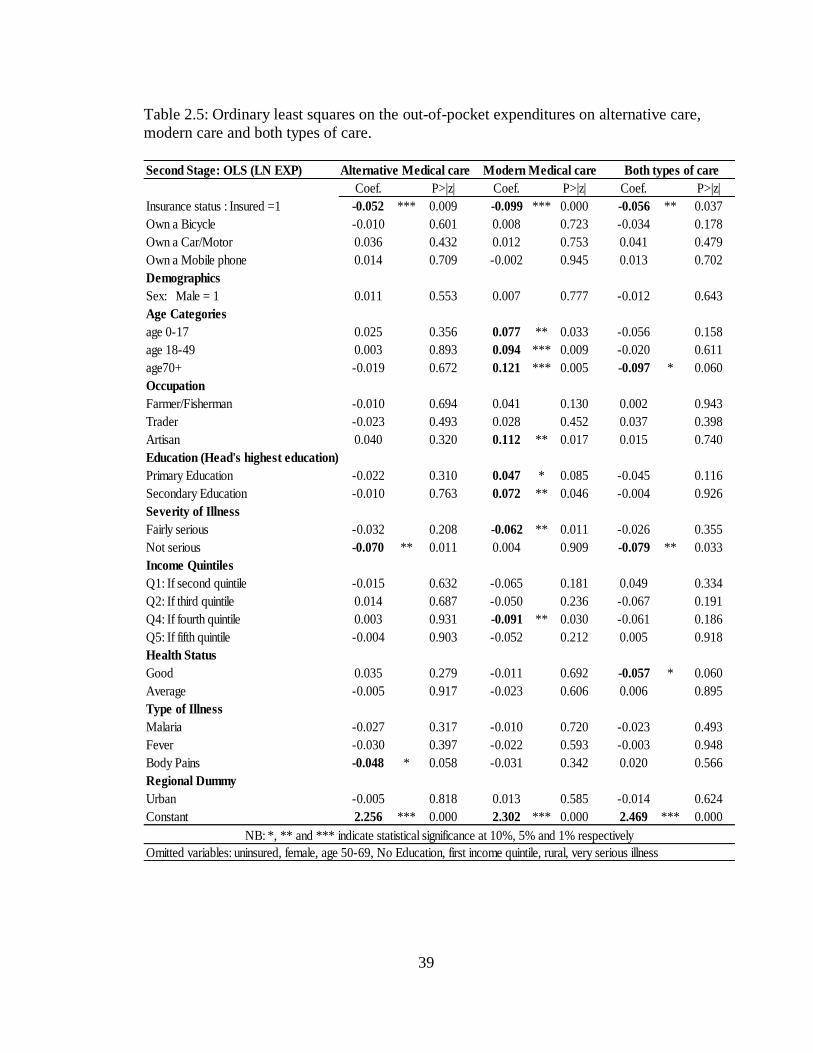
2.6.2 Second Stage Results: Out-of-pocket expenditures on care types
The table 2.5 results represent the magnitude of out-of-pocket expenditures on the
respective types of care, conditional on some spending. I use the log of total health
expenditures which helps eliminate the undesirable skewness in the distribution of
expenses among users. The results show that conditional on any spending on the
respective types of care, having health insurance reduces the actual magnitude of out-
of-pocket expenditure across all the different sources of care.
In terms of interpretation, the insured who seek modern care are more likely
than the uninsured to spend at least 0.66 cedis, but conditional on spending any amount,
they do actually spend less out-of-pocket. For people who seek alternative care
however, insured individuals are less likely to spend at least 0.70 cedis, and conditional
on any spending, they spend less compared to the uninsured in that category. This is
because, once insured, modern care is free and thus they are less likely to both seek and
spend on alternative care.
In table 2.6, I report the predicted total spending on the different types of care
for the insured and uninsured. Clearly, the uninsured spend much more compared to the
insured. The predicted total spending on modern medical care for the uninsured is about
₵ 17,000 ($2.004) per person for the two week recall period. The national average
monthly income in Ghana between the two survey periods was approximately
1,000,000 cedis. Hence a typical uninsured household is likely to spend on average
close to 2 percent of its income per person on modern health care for a particular doctor
4 I used the average Ghana cedi to USD rate between the survey periods at a rate of ₵9,000 = $1, which is
valued in the old Ghana cedi.
32
visit. This figure drops significantly for the insured to about ₵ 9,700 ($1.1). A similar
result was seen among alternative care users and for users who used both types of care.
Consistently, the insured paid less out-of-pocket compared to the uninsured.
In general, the expenditure across income groups relative to the lowest income
group did not differ significantly across the types of care. The only exception was for
modern care, where people within the fourth income quintile experienced a lower out of
pocket expenditures relative to the lowest income quintile, holding all the other groups
constant.
2.7 Conclusion and Policy Implications
Two of the main challenges of health care across the globe are affordability and access,
particularly for the poor. As a result of these challenges, a number of developing
countries are introducing social health insurance programs aimed at making health care
more accessible and affordable to all. This study uses data from the Ghana National
Health Insurance program to evaluate the impact of social health insurance on the
households‟ health care decisions. I test whether households substitute modern medical
care (for example, hospital services) for alternative medical care (for example,
traditional healer), or use both types of care when the national health insurance program
was made available.
This paper uses a modified form of the four-part equation model by Duan (1982,
1983), which is an extension of the two-part models for modeling expenditures. This
paper contributes to the literature by looking particularly at how the introduction of
social health insurance affects health care choices and the magnitude of out-of-pocket
33
health care expenditures. It uses a model that has been applied to only developed
countries to highlight the dynamics regarding the substitutability and complementarity
of household health care choices when health insurance is available. Other papers that
have analyzed health care choices have not looked at the effect of health insurance on
these choices.
In general, I find evidence of both substitutability and complementarity between
modern medical care and alternative medical care. I see a significant decrease in the
likelihood of households seeking alternative medical care after insurance, while there is
an increase in the likelihood of households seeking modern medical care as well as for
households who sought both types of care. Thus I find support for both the substitution
model by (Greene 1983), and the complementary model by (Blandford and Chappell
1991). The interesting result here is that people are still likely to use some form of
alternative medicine (traditional medicine) even after the introduction of insurance.
Out-of-pocket health care expenditures generally decreased significantly across all the
different types of care sought as a result of health insurance.
Despite the positive impact of western medicine in Africa, it has not been able to
integrate fully into the culture and society of these countries and traditional practitioners
continue to be a vital part of the health care system. The complementarity result is likely
due to the fact that most of the alternative sources of care (for example traditional
healer, spiritualists) are more easily accessible and more affordable. Most of the modern
care facilities (for example hospitals) are located in the larger towns and require some
traveling time to access them. Also, hospitals may have longer waiting time compared
to visiting a traditional healer.
34
One of the main challenges of social health insurance schemes is financing these
highly subsidized programs. The program in Ghana, with no co-payments and very low
premiums makes it a primarily tax-funded social health insurance system. According to
Ghana Health Service (2007), approximately 76 percent of the National Health
Insurance Fund revenue came from value added tax (V.A.T), 24 percent came from
Social Security and National Insurance Trust (SNNIT) contributions of formal sector
workers, and only 0.01 percent came from premiums received from people in the
informal sector in the year 2006. With the informal sector forming a higher proportion
of the population and with some individuals being in the premium exempt category, it
makes the financial sustainability of the program in the near future questionable.
As my result shows, insured households benefit from the significant drop in out-
of-pocket spending for care and are more likely to seek modern care once insured. With
the increasing pressure on the existing health facilities, the supply of modern health care
may not be able to keep pace with expanding demand resulting from health insurance
coverage. This is likely to lead to the continued reliance on traditional medicine.
35
Table 2.1: Descriptive statistics by type of care received.
No Care Alternative Modern Alternative &
medical care medical care Modern care
Variable Means Means Means Means
Insurance status: Insured = 1 0.333 0.316 0.699 0.645
Own a Bicycle 0.190 0.368 0.418 0.385
Own a Car/Motor cycle 0.143 0.049 0.098 0.053
Own a Phone 0.048 0.085 0.263 0.219
Demographics
Sex: Male = 1 0.476 0.420 0.380 0.373
Age Groups
age0-17 0.524 0.359 0.413 0.343
age18-49 0.238 0.398 0.317 0.420
age50-69 0.190 0.188 0.133 0.130
age70+ 0.048 0.056 0.137 0.107
Occupation
Unemployed 0.333 0.059 0.139 0.112
Farmer/Fisherman 0.571 0.629 0.547 0.491
Trader 0.048 0.130 0.127 0.154
Artisan 0.048 0.075 0.066 0.107
Government worker 0.000 0.049 0.082 0.065
Education (Head's highest education)
No Education 0.476 0.293 0.377 0.296
Primary Education 0.476 0.606 0.427 0.556
Secondary Education 0.048 0.098 0.190 0.148
Severity of Illness
Not serious 0.571 0.316 0.165 0.166
Serious 0.143 0.498 0.560 0.527
Income Quintiles
Q1: If first quintile 0.095 0.150 0.098 0.101
Q2: If second quintile 0.286 0.176 0.089 0.136
Q3: If third quintile 0.000 0.156 0.165 0.124
Q4: If fourth quintile 0.286 0.241 0.234 0.278
Q5: If fifth quintile 0.333 0.274 0.415 0.361
Health Status
Good 0.395 0.394 0.291 0.254
Average 0.248 0.236 0.282 0.383
Poor 0.348 0.207 0.309 0.218
Type of Illness
Malaria 0.333 0.257 0.244 0.320
Body Pains 0.286 0.358 0.184 0.231
Respiratory disease 0.000 0.078 0.070 0.053
Fever 0.048 0.091 0.108 0.089
Regional Dummy
Urban 0.476 0.534 0.551 0.615
Log(Total Expenditure) 0.000 8.798 9.839 10.032
Observations 29 307 318 170
NB: All figures are in proportions with the exception of the expenditure figures which are the average
expendiutre values
36
Table 2.2: Descriptive statistics by survey period.
Baseline Endline Diff in mean
Variable Means Means Significance
Insurance status: Insured = 1 0.348 0.572 ***
Own a Bicycle 0.386 0.361
Own a Car/Motor 0.075 0.068
Own a Phone 0.023 0.334 ***
Demographics
Sick person's gender
Male 0.250 0.266
Female 0.750 0.734
Age Groups
age0-17 0.241 0.276 *
age18-49 0.588 0.548 *
age70 + 0.055 0.081 **
Occupation
Farmer/Fisherman 0.600 0.525 ***
Trader 0.143 0.142
Government 0.036 0.081
Artisan 0.082 0.089
Education (Head's highest education)
No Education 0.361 0.293 *
Primary Education 0.518 0.564 *
Seconddary Education 0.121 0.143
Severity of Illness
Serious 0.447 0.583 ***
Not Serious 0.252 0.222
Income Quintiles
Q1: If first quintile 0.194 0.091 *
Q2: If second quintile 0.166 0.131 **
Q3: If third quintile 0.162 0.159 ***
Q4: If fourth quintile 0.179 0.249 ***
Q5: If fifth quintile 0.299 0.370 ***
Health Status
Good 0.000 0.349 ***
Average 0.000 0.087 ***
Type of Illness
Malaria 0.177 0.077 ***
Fever 0.000 0.090 ***
Respiratory problem 0.034 0.031
Body pains 0.167 0.087
Regional Dummy
Offinso 0.336 0.471
Nkoranza 0.664 0.529
Urban 0.533 0.525 *
Total Expenditure 9.500 9.377
Observations 413 411
NB: *, ** and *** indicate statistical significance at 10%, 5% and 1% respectively
37
Table 2.3: Probit regression and marginal effects for the probability that an individual
will receive any form of care.
Variables Coeff P>|z| dy/dx P>|z|
Insurance status: Insured =1 0.472 ** 0.029 0.019 ** 0.050
Own a Bicycle 0.299 0.162 0.011 0.146
Own a Car/Motor -0.341 0.370 -0.018 0.494
Own a Mobile phone 0.285 0.424 0.009 0.334
Demographics
Sex: Male = 1 0.063 0.754 0.002 0.752
Age Categories
age 0-17 0.069 0.805 0.003 0.802
age 18-49 0.238 0.382 0.009 0.361
age70+ 0.375 ** 0.038 0.011 0.229
Occupation
Farmer/Fisherman 0.082 0.743 0.003 0.748
Trader 0.195 0.592 0.007 0.531
Artisan 0.491 0.381 0.013 0.154
Education (Head's highest education)
Primary Education 0.219 0.288 0.009 0.315
Secondary Education 0.433 0.252 0.012 0.130
Severity of Illness
Fairly serious 0.675 *** 0.010 0.029 ** 0.020
Not serious -0.313 0.166 -0.015 0.257
Income Quintiles
Q2: If second quintile -0.205 0.582 -0.010 0.640
Q3: If third quintile -0.534 0.111 -0.032 0.271
Q4: If fourth quintile -0.185 0.588 -0.008 0.626
Q5: If fifth quintile -0.289 0.409 -0.013 0.461
Health Status
Good 0.211 0.539 0.007 0.480
Average -0.320 0.384 -0.017 0.505
Type of Illness
Malaria 0.035 0.892 0.001 0.891
Fever 0.488 0.321 0.013 0.130
Body Pains -0.073 0.764 -0.003 0.773
Regional Dummy
Urban 0.255 0.225 0.010 0.258
Constant 1.080 ** 0.023
Regular Probit Marginal Effects
NB: *, ** and *** indicate statistical significance at 10%, 5% and 1% respectively
(*) dy/dx is for discrete change of dummy variable from 0 to 1
38
Table 2.4: Probability of seeking alternative care only, modern care only, and
both types of care.
First Stage: Probit
Coef. P>|z| Coef. P>|z| Coef. P>|z|
Insurance status: Insured =1 -0.700 *** 0.000 0.660 *** 0.000 0.339 *** 0.002
Own a Bicycle 0.045 0.673 -0.072 0.512 -0.066 0.545
Own a Car/Motor -0.307 0.168 0.225 * 0.058 -0.305 0.187
Own a Mobile phone -0.374 ** 0.024 0.010 0.945 0.040 0.798
Demographics
Sex: Male = 1 0.109 0.305 0.048 0.662 0.006 0.954
Age Categories
age 0-17 -0.269 * 0.083 0.244 0.135 0.073 0.667
age 18-49 -0.256 * 0.089 0.062 0.704 0.227 0.162
age70+ -0.564 ** 0.011 0.392 * 0.063 0.164 0.457
Occupation
Farmer/Fisherman 0.041 0.766 0.103 0.451 -0.089 0.520
Trader -0.091 0.607 0.035 0.847 0.125 0.488
Artisan -0.068 0.757 -0.086 0.701 0.206 0.335
Education (Head's highest education)
Primary Education 0.249 ** 0.032 -0.143 0.244 0.133 0.282
Secondary Education -0.018 0.917 0.258 0.129 0.047 0.791
Severity of Illness
Fairly serious 0.360 *** 0.005 -0.158 0.188 -0.233 * 0.059
Not serious 0.633 *** 0.000 -0.621 *** 0.000 -0.382 ** 0.013
Income Quintiles
Q2: If second quintile 0.055 0.770 -0.334 0.124 -0.047 0.824
Q3: If third quintile -0.061 0.750 -0.022 0.913 -0.179 0.402
Q4: If fourth quintile -0.028 0.878 -0.127 0.514 -0.012 0.950
Q5: If fifth quintile -0.027 0.889 -0.025 0.900 -0.177 0.398
Health Status
Good -0.662 *** 0.000 0.063 0.631 0.256 * 0.060
Average -0.409 * 0.059 -0.188 0.363 0.211 0.306
Type of Illness
Malaria 0.015 0.916 -0.167 0.225 0.273 * 0.053
Fever 0.294 0.126 -0.162 0.403 -0.052 0.795
Body Pains 0.402 *** 0.004 -0.392 *** 0.008 -0.018 0.903
Regional Dummy
Urban 0.067 0.540 -0.081 0.468 0.189 0.100
Constant -0.328 0.209 -0.835 *** 0.003 -1.127 *** 0.000
Omitted variables: uninsured, female, age 50-69, No Education, first income quintile, rural, very serious illness
Alternative Medical care Modern Medical care Both types of care
NB: *, ** and *** indicate statistical significance at 10%, 5% and 1% respectively
39
Table 2.5: Ordinary least squares on the out-of-pocket expenditures on alternative care,
modern care and both types of care.
Second Stage: OLS (LN EXP)
Coef. P>|z| Coef. P>|z| Coef. P>|z|
Insurance status : Insured =1 -0.052 *** 0.009 -0.099 *** 0.000 -0.056 ** 0.037
Own a Bicycle -0.010 0.601 0.008 0.723 -0.034 0.178
Own a Car/Motor 0.036 0.432 0.012 0.753 0.041 0.479
Own a Mobile phone 0.014 0.709 -0.002 0.945 0.013 0.702
Demographics
Sex: Male = 1 0.011 0.553 0.007 0.777 -0.012 0.643
Age Categories
age 0-17 0.025 0.356 0.077 ** 0.033 -0.056 0.158
age 18-49 0.003 0.893 0.094 *** 0.009 -0.020 0.611
age70+ -0.019 0.672 0.121 *** 0.005 -0.097 * 0.060
Occupation
Farmer/Fisherman -0.010 0.694 0.041 0.130 0.002 0.943
Trader -0.023 0.493 0.028 0.452 0.037 0.398
Artisan 0.040 0.320 0.112 ** 0.017 0.015 0.740
Education (Head's highest education)
Primary Education -0.022 0.310 0.047 * 0.085 -0.045 0.116
Secondary Education -0.010 0.763 0.072 ** 0.046 -0.004 0.926
Severity of Illness
Fairly serious -0.032 0.208 -0.062 ** 0.011 -0.026 0.355
Not serious -0.070 ** 0.011 0.004 0.909 -0.079 ** 0.033
Income Quintiles
Q1: If second quintile -0.015 0.632 -0.065 0.181 0.049 0.334
Q2: If third quintile 0.014 0.687 -0.050 0.236 -0.067 0.191
Q4: If fourth quintile 0.003 0.931 -0.091 ** 0.030 -0.061 0.186
Q5: If fifth quintile -0.004 0.903 -0.052 0.212 0.005 0.918
Health Status
Good 0.035 0.279 -0.011 0.692 -0.057 * 0.060
Average -0.005 0.917 -0.023 0.606 0.006 0.895
Type of Illness
Malaria -0.027 0.317 -0.010 0.720 -0.023 0.493
Fever -0.030 0.397 -0.022 0.593 -0.003 0.948
Body Pains -0.048 * 0.058 -0.031 0.342 0.020 0.566
Regional Dummy
Urban -0.005 0.818 0.013 0.585 -0.014 0.624
Constant 2.256 *** 0.000 2.302 *** 0.000 2.469 *** 0.000
Omitted variables: uninsured, female, age 50-69, No Education, first income quintile, rural, very serious illness
NB: *, ** and *** indicate statistical significance at 10%, 5% and 1% respectively
Alternative Medical care Modern Medical care Both types of care
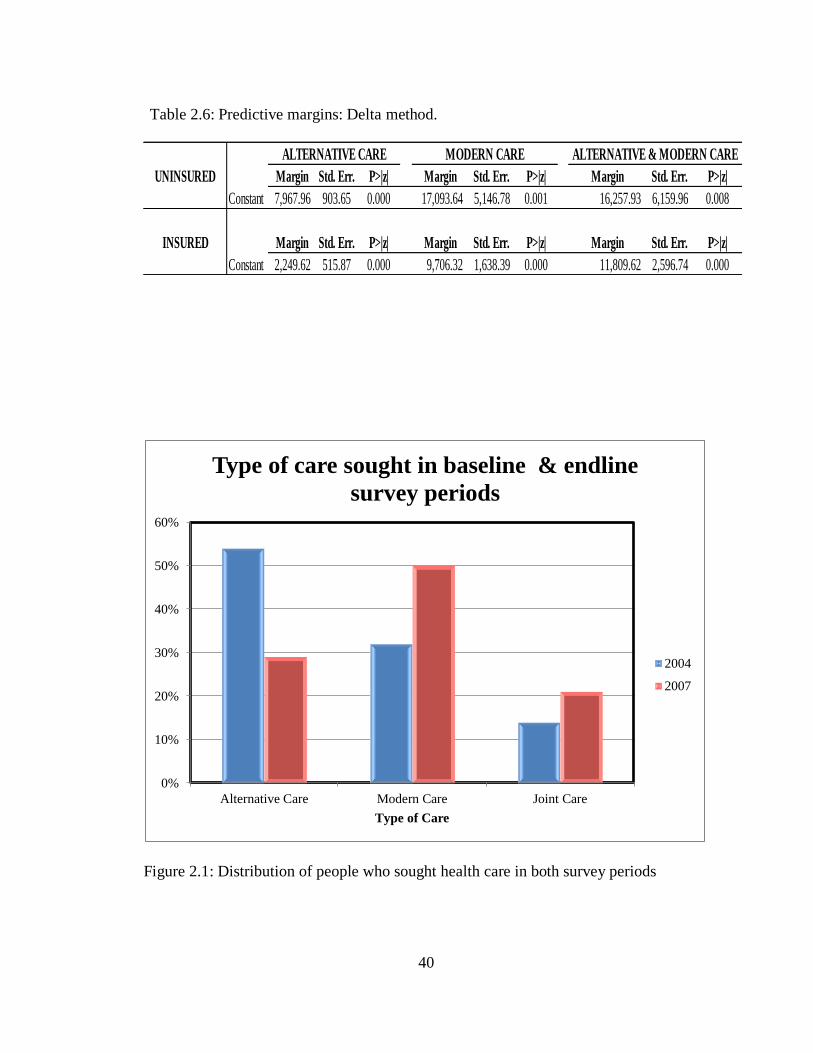
40
Table 2.6: Predictive margins: Delta method.
Figure 2.1: Distribution of people who sought health care in both survey periods
Margin Std. Err. P>|z| Margin Std. Err. P>|z| Margin Std. Err. P>|z|
Constant 7,967.96 903.65 0.000 17,093.64 5,146.78 0.001 16,257.93 6,159.96 0.008
Margin Std. Err. P>|z| Margin Std. Err. P>|z| Margin Std. Err. P>|z|
Constant 2,249.62 515.87 0.000 9,706.32 1,638.39 0.000 11,809.62 2,596.74 0.000
ALTERNATIVE CARE MODERN CARE ALTERNATIVE & MODERN CARE
UNINSURED
INSURED
0%
10%
20%
30%
40%
50%
60%
Alternative Care Modern Care Joint Care
Type of Care
Type of care sought in baseline & endline
survey periods
2004
2007
41
CHAPTER 3
THE IMPACT OF SOCIAL HEALTH INSURANCE ON HOUSEHOLD
FERTILITY DECISIONS
3.1 Introduction
According to the demographic transition model, as a country develops from a pre-
industrial to an industrialized economic system it tends to move from a state of high
birth and death rates to low birth and death rates (Thompson, 2003). Reasons for this
transition include increasing urbanization, better access to education, and less need for
large families as improved health care lowers death rates. With development therefore,
we expect fertility rates to fall, and, in fact this has been the general trend in Africa over
the last decade. However, fertility rates may not fall monotonically, as in the case of
Ghana, where there was an increase in fertility rates peaking around 2006 (see table
3.1). This essay provides evidence that the introduction of social health insurance in
Ghana may be, at least in part, responsible for this increase. In particular, I examine
how fertility patterns differ between insured and uninsured women, and whether this
difference is due to women likely to become pregnant seeking out insurance or women
with insurance changing fertility decisions.
Ghana is one of the few African countries that have successfully implemented a
social health insurance program. The government of Ghana instituted the National
Health Insurance Scheme (NHIS) in 2003. The primary goal of this scheme was to
ensure equitable and universal access to health care services for all Ghanaians and to
42
replace the “cash and carry”5 system which required prompt payment for health
services. The NHIS program allows voluntary enrollment from persons in the informal
sector, who form a large proportion of the population. As a result of the voluntary
enrollment, there is the potential problem in empirical analyses of self-selection, since
individuals have the choice to either enroll or not without any sanctions.
In this paper, I evaluate the relationship between the social health insurance
program and fertility decisions in Ghana. There are two main possible effects
corresponding to adverse selection and moral hazard6. First, women who plan to
become pregnant might enroll in greater numbers. This is the adverse selection effect,
although unlike the standard notion of adverse selection, this is arguably a positive
outcome by increasing prenatal care visits and having access to hospital care for
delivery. Second, the moral hazard effect occurs when having insurance encourages
higher fertility by reducing the cost and risk associated with pregnancy. To disentangle
the effects of adverse selection (which in this case is the unobserved heterogeneity in
insurance enrollment) from moral hazard, I exploit the district-level variation in the
dates of implementation of the national health insurance program to instrument for
insurance enrollment.
The paper is organized as follows; section 3.2 discusses health care financing
and health insurance in Ghana, while section 3.3 summarizes factors that affect
5 Cash and carry is a sales policy or a method of purchase in which the customer must remit payment at
the point of service and you must take it with you.
6 A third possibility is if contraception is covered under the insurance program, then fertility could go
down and vice versa. As at the time of the survey, contraception was not covered under the insurance
program.
43
insurance enrollment in Ghana. The literature review is discussed in section 3.4,
followed by data and descriptive statistics, empirical methodology and empirical results
in sections 3.5, 3.6 and 3.7 respectively. Conclusions follow in section 3.8.
3.2 Health Care Financing and Health Insurance in Ghana
The health insurance program introduced in Ghana in 2003 is the most recent of several
major reforms of Ghana‟s health system since the nation achieved independence in
1957. After independence, the government established a social welfare system which
provided free health care for all its citizens at public health facilities. Health care was
primarily financed by taxes and external donor support, user fees were removed and
attention was directed to developing a wide range of primary health care facilities
across the country. However, by the early 1970s, the country was facing stagnating
economic growth and could therefore not support its health financing with tax revenues
alone.
In 1985, the government introduced health care reforms as part of the ongoing
structural adjustment programs aimed mainly at reducing government spending to
address budgetary deficits. The reforms included introducing cost recovery mechanisms
through user fees (known in Ghana as “cash and carry”) in order to discourage
unnecessary use of services and liberalize health services to allow private sector
involvement (The World Bank 2007). This system led to dramatic declines in health
care utilization, with outpatient visits to hospitals dropping from 4.6 million to 1.6
million in 1985 (Ghana health service 2009). Beginning in 1989, community-based
health insurance schemes, also known as mutual health organizations, were introduced
44
in certain districts throughout the country in response to this plight. However coverage
rates were very low, covering less than 5 percent of the population, leaving many
Ghanaians vulnerable in the event of a catastrophic illness (Ghana health service 2009).
In response, the government of Ghana established the National Health Insurance
Act (650, 2003), whose primary goal was to reduce out-of-pocket expenditures and
improve access to, as well as the quality of, basic health care services through the
establishment of district-wide insurance schemes coordinated by the National Insurance
Authority. The primary funding source is the National Health Insurance Levy (2.5
percent of V.A.T.); secondary sources are payroll deductions (2.5 percent of income)
for formal sector employees and premia for informal sector members. Other funds come
from donations or loans.
Membership in the NHIS is mandatory for formal sector workers, unless
alternative private health insurance can be demonstrated. Membership is optional for
non-formal sector workers who make up the majority of the population. For formal
sector workers, a payroll deduction of 2.5 percent is transferred to the NHI fund as part
of their contribution to the Social Security and National Insurance Trust fund.
Premiums by those outside the formal sector was intended to vary by income such that
those in the lowest-income group pay an annual premium of 7.20 Ghanaian cedi (GH¢),
roughly US$ 8, while those in the highest income group pay a premium of GH¢ 48.00
(US$53) per annum for each enrolled individual. In practice, in some districts, a flat
premium payment of GH¢ 7.20 per annum is charged due to the difficulty of assessing
and verifying income in the informal sector. Once the premium is paid, the only
additional costs are the annual registration fee which serves as renewal costs to the
45
members. There are no co-payments or deductibles, provided the ailment falls within
the defined benefits package. The National Health Insurance Act (NHIA) mandates a
pre-defined benefits package that covers about 95 percent of the disease burden in
Ghana.
Services covered include outpatient consultations, essential drugs, inpatient care
and shared accommodation, maternity care (vaginal and caesarean delivery), eye care,
dental care and emergency care. Excluded benefits include echocardiography, renal
dialysis, heart and brain surgery, organ transplantation as well as other drugs not listed
in the approved drugs list. Several groups are exempted from premium payments, and
these include pensioners, the elderly, children under age 18, indigents and pregnant
women (as of 2008). There is a six-month gap between joining and being eligible for
benefits (Government of Ghana 2004). By the end of 2008, Ghana‟s national insurance
program covered 61 percent of the population, with District Mutual Health Insurance
Schemes operating in all districts (Asenso-Boadi 2009).
3.3 Enrollment into the Ghana National Health Insurance Program
In this section, I discuss sign-up or enrollment into the health insurance program. Part of
the information in this section is obtained from the Health Systems 20/20 project
(2009), which undertook an evaluation of the national health insurance scheme in
Ghana. As mentioned in section 2 above, the program is administered at the district
level, which is called the District Mutual Health Insurance Schemes (DMHIS).
Registration fees for the insurance program, premium payments, waiting time among
others are outlined under different sub-sections below. In general it is observed that,
46
regardless of the national guidelines, premiums paid, amounts paid for registration fees
as well as waiting time vary greatly between the different districts in Ghana.
3.3.1 Registration Fees
Registration in the DMHIS across the country is done both at the scheme offices as well
in the field through the assistance of the community premium collectors (or DMHIS
agents). For example, the Offinso district scheme has 70 agents operating throughout
the district. Most people in the district, however, tend to register at the DMHIS office in
order to avoid the delays that can accompany processing membership cards when
community members register with field agents. The delays are a result of agents waiting
until they collect a sizable number of registrants before they take the payments to the
DMHIS office. Annual registration fees (paid by all enrollees, including those exempt
from premiums) range between 7,000 and 50,000 cedis per annum depending on the
individual‟s income.
The registration process varies across the districts. There are generally two types
of registration: open registration or bi-annual registration. The open registration
operates throughout the year, whiles the bi-annual has only two registration periods in a
year. Examples of districts that use the open registration is the Ahanta West and the
Offinso districts, whiles the Kwahu West, and the Nkoranza districts operate the two
period registration type called the “minor” and “major” seasons. The major season
usually runs between October and January and the minor season between May and July
to coincide with agricultural cycles. The major season is usually during the harvesting
period, when farmers are in a better position to pay insurance premiums. Thus the bi-
47
annual registration type is normally used in rural and farming communities. There is
however minor registrations that take place outside the two seasons. All who choose to
enroll in the insurance scheme, regardless of whether they are exempt from premium
payments, must pay annual registration fees to receive insurance identification cards in
order to benefit from the insurance program.
3.3.2 Premium Payments
Premium payments from those employed in the formal sector are deducted at source
from their income. For individuals outside of the formal sector, their premiums are
defined according to their income such that the lowest-income group pays an annual
premium of 72,000 Ghanaian cedi (₵), roughly (US$ 8)7, while those in the highest
income group pay a premium of ₵480,000 (US$53) per annum for each enrolled
individual. At the time of the survey, birth control was not part of the benefit packages
given to insured members. For the purposes of this study, this implies that differences in
access to birth control between the insured and uninsured cannot explain changes in
fertility rates. At the end of the year 2008, pregnant women were added to the premium
exempt category.
While the premium is supposed to vary by income, in some districts, a flat
premium payment is charged due to the difficulty of assessing and verifying income in
the informal sector. For example, in the Nkoranza district, all non-exempt community
7 I used the average Ghana cedi to USD rate within the survey period at a rate of ₵9,500 = $1, which is
valued in the old Ghana cedi. Ghana‟s cedi currency was redenominated in July 2007 at a rate of ₵10,000
= GH₵ 1.
48
members pay a flat premium rate of 80,000 cedis. The absence of differentiation in
premium payment in this particular district was based on the argument that the
wealthier community members do not accept that they should pay higher rates, since
they end up paying the premiums of their poorer relations who are not able to afford it.
In some districts, the poor and are not able to pay the premium at the time of
registration or make upfront payment. For such reasons, some district mutual schemes
introduced installment plans, a manner of payment termed the “susu” system. Under
this system, records of the installment payments are kept until the full premium is paid,
at which point the enrollee is eligible for benefits. Those who can afford to make
upfront payments are encouraged to do so.
3.3.3 Waiting Period for NHIS Benefits
The waiting period for benefit eligibility is the official period between when an
individual signs up for insurance and when he finally obtains the insurance card and can
access health care benefits. The waiting period is designed to discourage only sick
people from enrolling in the insurance program. However it has posed potentially more
problems than it was intended due to longer delays than stated on paper. As a result of
this, in late 2007, there was a change in some districts to a three-month waiting period
before an enrollee could access health services from the initial waiting period of six
months, which existed at the inception of the NHIS. Managers mentioned that this
reduction in wait time has encouraged new members to join the scheme. The data set
49
used for this study is from a 2005/06 survey and hence the six-month waiting period
still applied.
Despite the official waiting period, observed waiting periods have been far
longer for many enrollees, due to various operational problems. One of the main
problems has been the inadequacy of staff and equipment (computers, printers, and
cameras) and the volumes of cards to be issued. The waiting period sometimes exceeds
six months. This waiting period also holds for pregnant women even though a case has
been put forward suggesting the reduction in the waiting period for pregnant women to
one month.
3.3.4 Other Factors
Other factors that determine enrollment into the insurance program include the
availability of some private insurance products, and transportation costs to designated
health centers that run the program. If the cost of traveling to the hospital is high,
individuals may not sign up since the additional cost is a barrier to using from health
insurance program. Another factor is that the lack of understanding of the need for
health insurance by some community members, mostly in the rural and poor
communities. Some residents feel the scheme is just a way to exploit them since, even
though they pay premiums, they still have to pay for certain drugs when they utilize the
health facilities. Other residents question why they should pay for health insurance in
advance when they might not fall sick.
Overall, there have been general concerns about the problem of adverse
selection in the program, due to the fact that, a social insurance program does not screen
50
between healthy and sick people. The recommended solution being an increase in the
enrollment in order to have a more balanced risk pool.
3.4 Related Literature
Adverse selection and moral hazard represent two key fundamental information
problems in insurance. The theoretical literature on health insurance predicts inefficient
outcomes as result of these asymmetric information problems (Arrow 1963; Akerlof
1970; Rothschild and Stiglitz 1976). The moral hazard problem in health insurance
results from the unintended behavioral changes due to the problem of perverse
incentives toward over usage of services, (Ma and Riodan 2001; Pauly 1968). One of
the earlier papers on moral hazard is by Zweifel and Manning (2000), who present a
comprehensive overview of this topic, making a distinction between ex-ante and ex-post
moral hazard in insurance outcomes.
While the former relates to a change in behavior prior to the outcome of a health
event, the latter deals with behaviors that happen after the outcome of a health event.
Similarly, a number of papers have identified the effect of adverse selection in health
insurance. Rothschild and Stiglitz (1976), in their seminal paper, develop a model in
which adverse selection is present because individuals have private information about
their risk status. They show in their paper that those with high risk and thus higher
expected expenditures self-select into insurance in order to cover their costs. Most of
the studies on the asymmetric information problems have focused on developed
countries relative to developing countries. In the context of developing countries,
studies on adverse selection and moral hazard in health insurance are scant.
51
The majority of the papers in the health insurance literature, especially in
developing countries, find evidence for adverse selection but not for moral hazard
(Lammers and Warmerdam 2010, Jowett, Deolalikar, and Martinsson 2004). The main
factor contributing to this result is the nature of most health insurance programs in
developing countries. Most of these programs are social insurance programs which have
the aim of achieving universal coverage at very subsidized prices. Since the
membership in the majority of the social health insurance programs in developing
countries is voluntary, it is easier for the high risk individuals to self-select into the
insurance program, resulting in adverse selection. For example Cutler and Zeckhauser
(2000) shows that voluntary schemes without medical screenings enable a relatively
unhealthy share of the population to enroll and endanger the sustainability of such
programs if unanticipated.
Moral hazard is more difficult to substantiate, especially in developing countries
where under-utilization of medical services is widespread, since it is not easy to
distinguish between over-usage of health services and the optimal use of these services.
Furthermore, one of the primary reasons for social health insurance programs is to
improve health outcomes through encouraging the use of health services.
3.5 Data and Descriptive Statistics
This study uses data from the current round of the Ghana Living Standards Survey
(GLSS), the GLSSV conducted by the Ghana Statistical Service (GSS) in 2005/06. The
GLSS is a nationally representative multi-purpose survey of households in Ghana. A
two-stage stratified random sampling design was adopted in the survey. Initially, a total
52
sample of 550 enumeration areas was considered at the first stage of sampling, followed
by a fixed take of 15 households per enumeration area. The distribution of the selected
enumeration areas into the ten regions or strata was based on proportionate allocation
using the population.
The GLSSV survey sampled 37,128 individuals from 8,867 households. I
limited the study to only the round five of the national survey because it included
information on the National Health Insurance program. For example, at the time of the
round four survey (1998/99), the National Health Insurance program in Ghana had not
yet been implemented. The sample used for this study includes only women of child
bearing age, ages 15 through 49 who did or did not get pregnant during the recall
period, which is within a year to the survey date. This reduces the sample to 5,641
observations.
The household survey collected information on socio-demographic
characteristics of the population, education, health, employment and time use,
migration, housing conditions and household agriculture. The third section of the survey
provides information on health including condition of illness, usage, expenditure,
insurance status among others.
Table 3.2 presents the descriptive statistics. The majority of the differences
between the insured and their uninsured are statistically significant. The average age of
women within the sample was approximately 19 years for the insured population and 18
years for the uninsured population, with the average household size of 4 and 5 persons
per household for the insured and uninsured samples respectively. Wealth is positively
correlated with insurance enrollment. About half of the individuals in the wealthiest
53
quintile were insured, compared to less than one-fifth of individuals in the poorest
quintile, and these differences are statistically significant.
Approximately 40 percent of the insured women were married, while about 43
percent of the uninsured were married. This was followed by single women who
represented 47 percent for the insured sample, and 41 percent for the uninsured group.
As typical of a developing country, agriculture dominated as the occupation of majority
of women in my sample, followed by trading, with the professional and clerical
occupations being the least common occupations in the sample.
3.6 Empirical Methodology (Probit and IV Probit)
The fertility rate between insured and uninsured women could differ for two principal
reasons. The difference in fertility could be due to women planning to become pregnant
seeking out insurance or to women with insurance changing fertility decisions. The
former depicts the situation of adverse selection while the latter captures the problem of
moral hazard. In this case, adverse selection can be thought of primarily as a problem of
endogeneity because we do not observe women‟s ex-ante fertility preferences and those
planning to become pregnant self-select into insurance.
To address endogeneity in this paper, I exploit the district-level variation in the
dates of implementation of the national health insurance relative to when the national
survey took place as an instrument for insurance enrollment. Put in different terms, I
define my instrument as the number of months a woman had access to insurance at the
time the woman was surveyed (month-year woman was surveyed minus month-year of
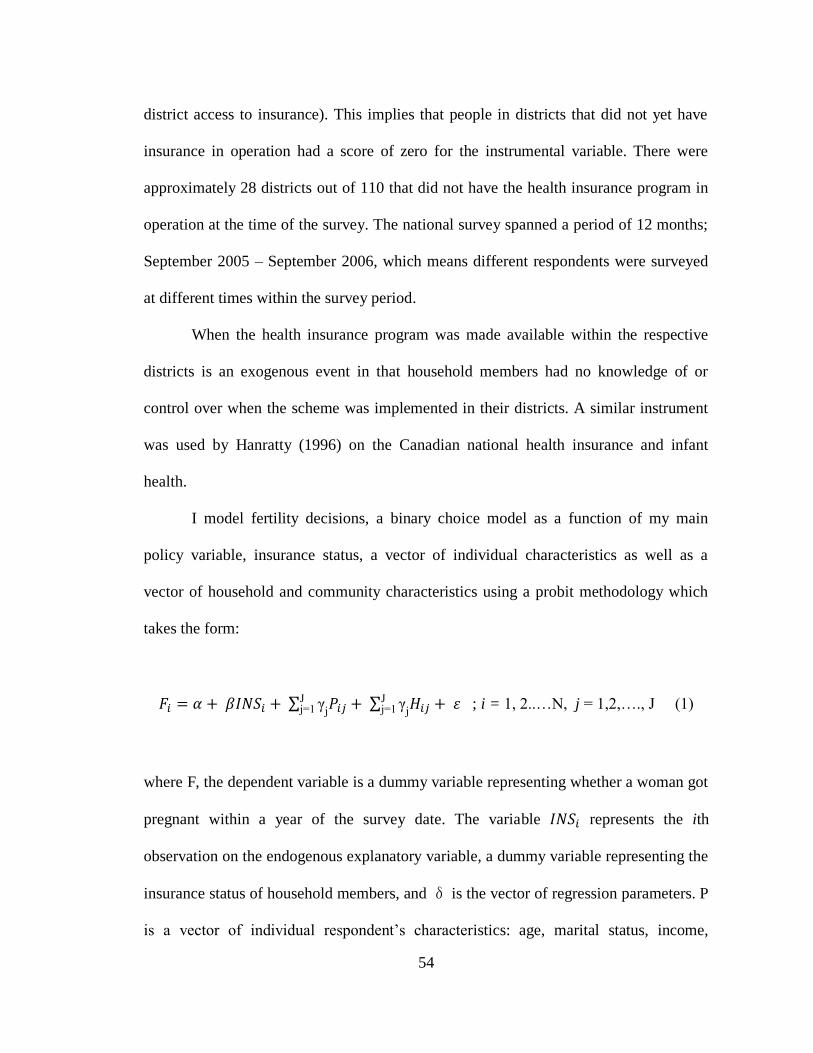
54
district access to insurance). This implies that people in districts that did not yet have
insurance in operation had a score of zero for the instrumental variable. There were
approximately 28 districts out of 110 that did not have the health insurance program in
operation at the time of the survey. The national survey spanned a period of 12 months;
September 2005 – September 2006, which means different respondents were surveyed
at different times within the survey period.
When the health insurance program was made available within the respective
districts is an exogenous event in that household members had no knowledge of or
control over when the scheme was implemented in their districts. A similar instrument
was used by Hanratty (1996) on the Canadian national health insurance and infant
health.
I model fertility decisions, a binary choice model as a function of my main
policy variable, insurance status, a vector of individual characteristics as well as a
vector of household and community characteristics using a probit methodology which
takes the form:
∑ j
Jj 1 ∑
j
Jj 1 ; i = 1, 2..…N, j 1,2,…., J (1)
where F, the dependent variable is a dummy variable representing whether a woman got
pregnant within a year of the survey date. The variable represents the ith
observation on the endogenous explanatory variable, a dummy variable representing the
insurance status of household members, and is the vector of regression parameters. P
is a vector of individual respondent‟s characteristics: age, marital status, income,
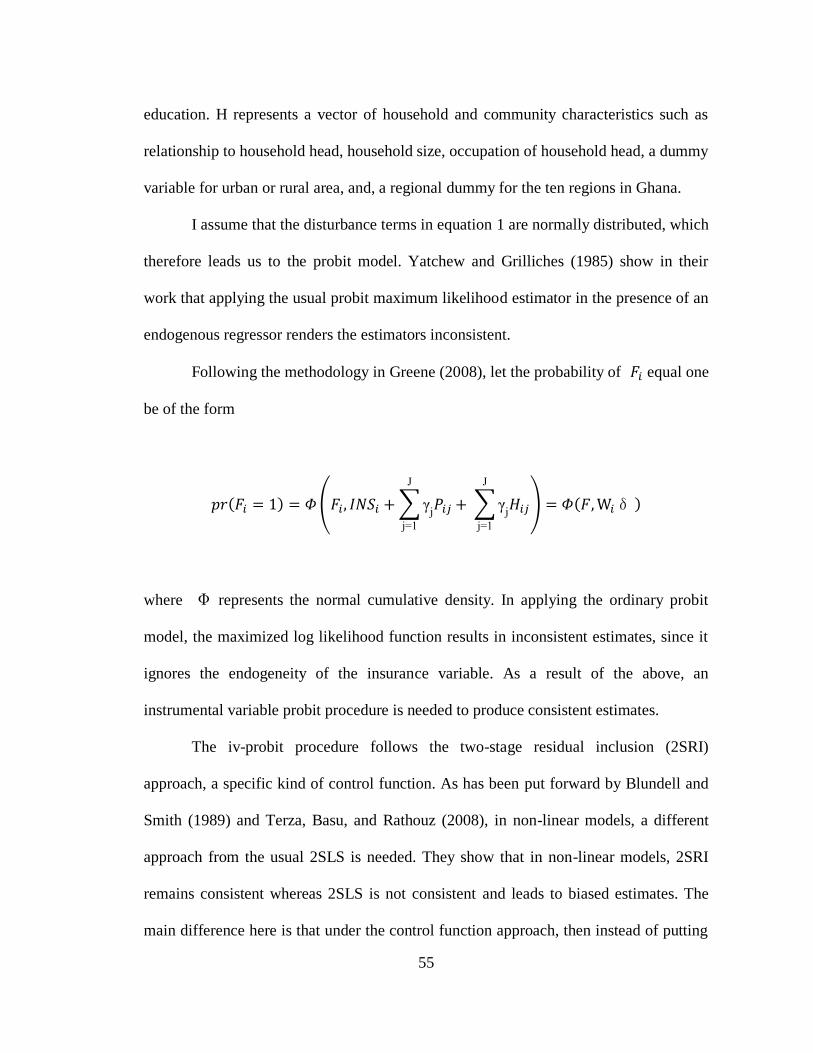
55
education. H represents a vector of household and community characteristics such as
relationship to household head, household size, occupation of household head, a dummy
variable for urban or rural area, and, a regional dummy for the ten regions in Ghana.
I assume that the disturbance terms in equation 1 are normally distributed, which
therefore leads us to the probit model. Yatchew and Grilliches (1985) show in their
work that applying the usual probit maximum likelihood estimator in the presence of an
endogenous regressor renders the estimators inconsistent.
Following the methodology in Greene (2008), let the probability of equal one
be of the form
( ) ( ∑ j
J
j 1
∑ j
J
j 1
) ( )
where represents the normal cumulative density. In applying the ordinary probit
model, the maximized log likelihood function results in inconsistent estimates, since it
ignores the endogeneity of the insurance variable. As a result of the above, an
instrumental variable probit procedure is needed to produce consistent estimates.
The iv-probit procedure follows the two-stage residual inclusion (2SRI)
approach, a specific kind of control function. As has been put forward by Blundell and
Smith (1989) and Terza, Basu, and Rathouz (2008), in non-linear models, a different
approach from the usual 2SLS is needed. They show that in non-linear models, 2SRI
remains consistent whereas 2SLS is not consistent and leads to biased estimates. The
main difference here is that under the control function approach, then instead of putting
56
the predicted value of the endogenous variable in the main equation, the predicted error
term is added to a model that still includes the original endogenous variable.
Maximizing the conditional likelihood function results in the iv-probit procedure results
in consistent estimates.
3.7 Empirical Results
3.7.1 Distinguishing between Adverse Selection from Moral Hazard in Fertility
Decisions
There are three possible sources of endogeneity in empirical studies, namely,
unobserved heterogeneity, measurement error and reverse causality. Among the three
sources of endogeneity in this study however, the most likely type to be present in this
study is that of unobserved heterogeneity/self-selection in the insurance program due to
the nature of the insurance program. The other sources of endogeneity are however also
mitigated with the use of instrumental variable regression in accounting for
endogeneity.
Without randomization of enrollment into insurance, it is difficult to establish
the causal effects of insurance because there can be heterogeneous self-selection into
insurance. Unobserved heterogeneity is one major source of endogeneity and describes
a situation where some unobserved characteristic (such as unobserved health status or
unobserved preference for children) is related to both the dependent variable (fertility
decisions) and one or more independent variables (insurance). The unobserved
preference for children could be correlated with both fertility decisions of households
and insurance choice. Hence, a simple regression of the fertility decision on insurance
57
status will not be a causal estimate of the effect of that fertility choice because it is
endogenously chosen.
Reverse causality is another possible source of endogeneity. In the present case,
a pregnant woman might enroll in the program as soon as she knows she is pregnant.
Thus the pregnancy is “causing” the insurance and the insurance had no effect on the
pregnancy. The third source of endogeneity occurs through measurement error of a
covariate. An observed variable with classical measurement error may be correlated
with the error term, causing bias in estimated coefficients. However for the
measurement error to be problematic, it has to be systematic rather than random.
Under the assumption that self-selection into the insurance program by women
more likely to become pregnant or already pregnant is the main source of endogeneity,
controlling for endogeneity is the equivalent of stripping away the adverse selection
effect. I first run a regular probit regression of insurance status on fertility decisions of
women, controlling for demographic, household, and community characteristics without
controlling for endogeneity as shown in the first panel (column) of table 3.3. Without
controlling for endogeneity, the relationship between insurance and fertility could be
either the result of adverse selection or moral hazard or both. On the right panel of table
3.3, I present an iv-probit estimation to account for the endogeneity problem.
In the second stage estimations, instrumenting for insurance helps us to wipe out
the effect of the unobserved characteristics and reverse causality, and thus the adverse
selection problem. Hence, if we find that insurance is statistically significant in the
instrumental variable regression, then there is an evidence of a moral hazard effect. This
is because instrumenting for insurance strips out the adverse selection effect. A moral
58
hazard effect in this case will imply that having health insurance encourages women to
become pregnant and hence have more children.
Results from the first stage regressions are shown in tables A1 through A3 in the
appendix. The instrument comes out strongly significant in all cases and hence provides
some support for its validity. Results from the left panel of table 3.3 show that the
impact of insurance on fertility is positive and significant. After instrumenting for
insurance status, the insurance variable remains significant, implying that moral hazard
was present. The moral hazard effect suggests that having health insurance encouraged
women to have more children. The effect of insurance on fertility may be short-run,
however. First, table 3.1 suggests that after a brief uptick in 2006 and 2007, the rates
began to decline. Second, the cost and/or risk of pregnancy may have led to pent up
demand for children. Finally, the demographic transition model suggest that fertility
rates will continue to decline as Ghana develops and many developed countries with
free or subsidized health care do not have higher fertility rates.
3.7.2 Robustness Checks
In tables 3.4 and 3.5, I run two additional estimations as augmented versions of the
baseline model. In my baseline regression model, I only include the key household
variables to start with. In table 3.4, the first version of the robustness checks, I include
village characteristics as an additional control variable. Table 3.5 shows the second
robustness check results where I add on regional dummies to account for the differences
in effect within the various regions in Ghana as additional control variables. Again, I
show the first stage iv-probit results in tables A2 and A3 of the appendix. The results
59
are consistent with the earlier findings that insurance access led to higher rates of
pregnancy.
3.8 Conclusion
Governments and policy makers in a number of developing countries have introduced
social health insurance programs, with the aim of increasing access to health care at
affordable prices, particularly for women and children. There is the expectation that
such generous insurance programs should help increase access to health care and hence
improve health outcomes. There is however a possibility that insurance will increase
fertility by lowering the cost and risk of pregnancy and delivery. My findings suggests
that women who expect to become pregnant may have been more likely to enroll in the
social health insurance program (adverse selection effect), which can be seen as a
positive outcome in terms of improving maternal and infant health. This will however
result in an increase in the cost to the system because young, healthy women more
likely to become pregnant are more likely to wait to seek insurance. The results also
suggest that having insurance encourages women to have more children (moral hazard
effect). Overall my results confirm the trend in Ghana, in that health insurance caused a
spike in the fertility rate around year 2006, which is also when the survey was
conducted.
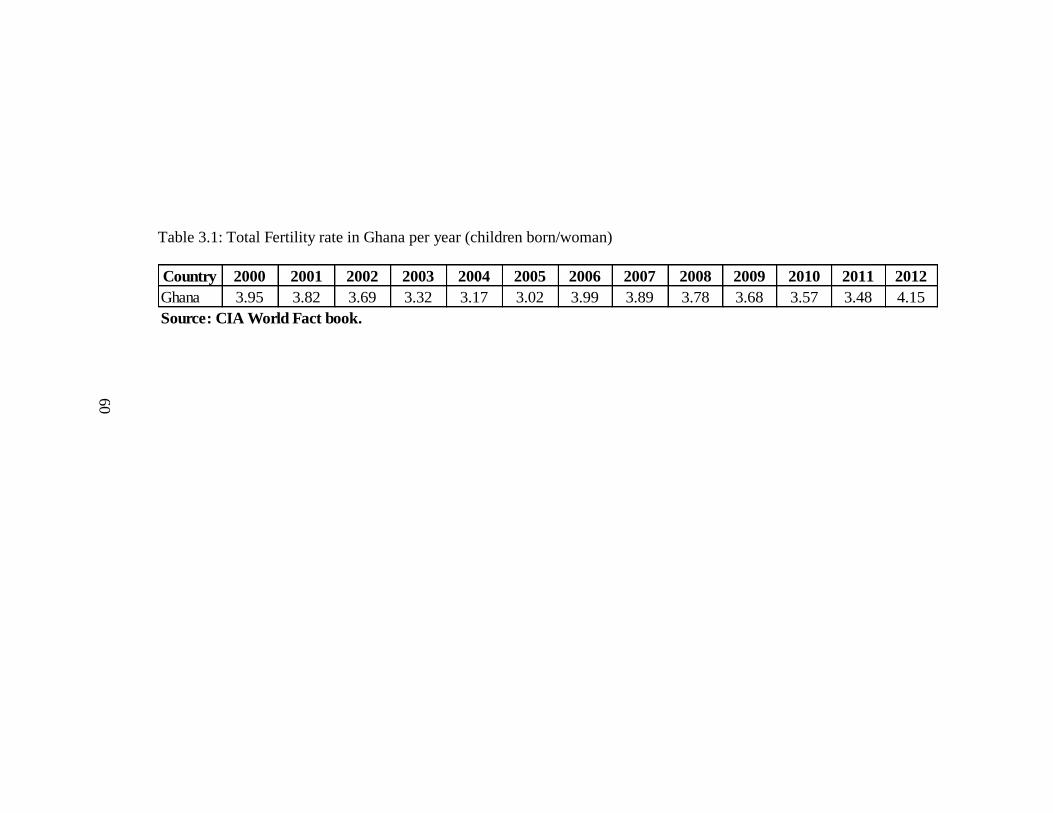
60
Table 3.1: Total Fertility rate in Ghana per year (children born/woman)
Country 2000 2001 2002 2003 2004 2005 2006 2007 2008 2009 2010 2011 2012
Ghana 3.95 3.82 3.69 3.32 3.17 3.02 3.99 3.89 3.78 3.68 3.57 3.48 4.15
Source: CIA World Fact book.
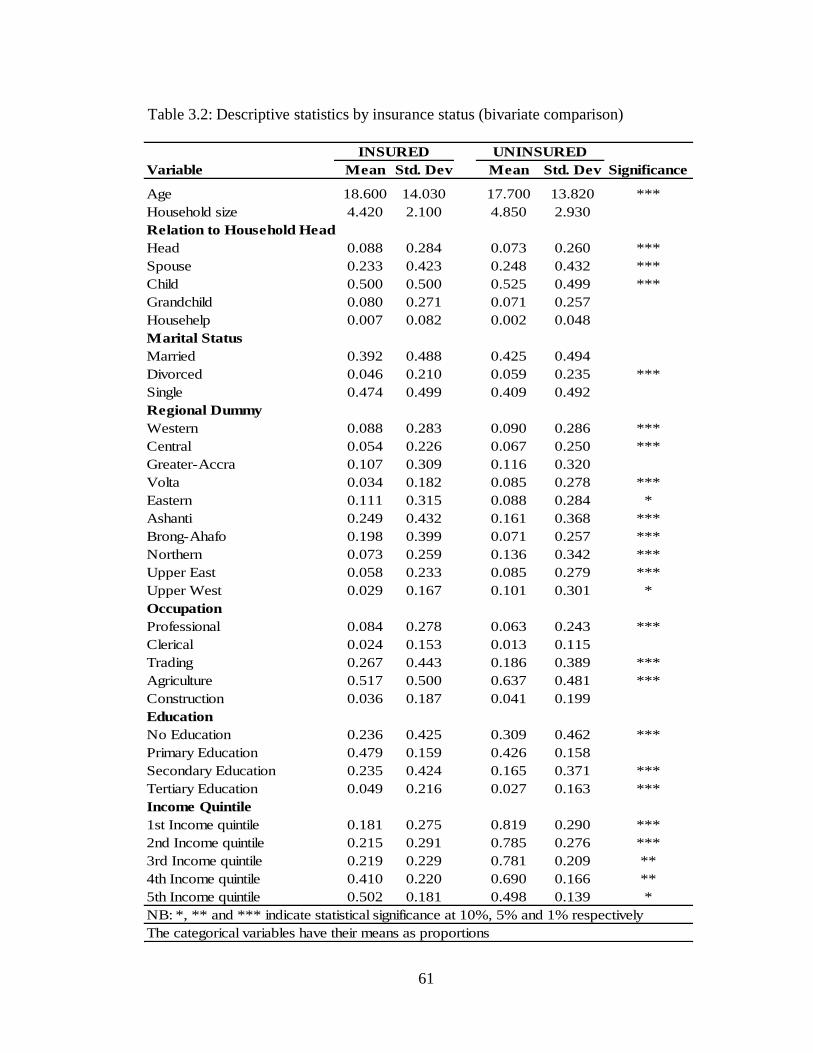
61
Table 3.2: Descriptive statistics by insurance status (bivariate comparison)
Variable Mean Std. Dev Mean Std. Dev Significance
Age 18.600 14.030 17.700 13.820 ***
Household size 4.420 2.100 4.850 2.930
Relation to Household Head
Head 0.088 0.284 0.073 0.260 ***
Spouse 0.233 0.423 0.248 0.432 ***
Child 0.500 0.500 0.525 0.499 ***
Grandchild 0.080 0.271 0.071 0.257
Househelp 0.007 0.082 0.002 0.048
Marital Status
Married 0.392 0.488 0.425 0.494
Divorced 0.046 0.210 0.059 0.235 ***
Single 0.474 0.499 0.409 0.492
Regional Dummy
Western 0.088 0.283 0.090 0.286 ***
Central 0.054 0.226 0.067 0.250 ***
Greater-Accra 0.107 0.309 0.116 0.320
Volta 0.034 0.182 0.085 0.278 ***
Eastern 0.111 0.315 0.088 0.284 *
Ashanti 0.249 0.432 0.161 0.368 ***
Brong-Ahafo 0.198 0.399 0.071 0.257 ***
Northern 0.073 0.259 0.136 0.342 ***
Upper East 0.058 0.233 0.085 0.279 ***
Upper West 0.029 0.167 0.101 0.301 *
Occupation
Professional 0.084 0.278 0.063 0.243 ***
Clerical 0.024 0.153 0.013 0.115
Trading 0.267 0.443 0.186 0.389 ***
Agriculture 0.517 0.500 0.637 0.481 ***
Construction 0.036 0.187 0.041 0.199
Education
No Education 0.236 0.425 0.309 0.462 ***
Primary Education 0.479 0.159 0.426 0.158
Secondary Education 0.235 0.424 0.165 0.371 ***
Tertiary Education 0.049 0.216 0.027 0.163 ***
Income Quintile
1st Income quintile 0.181 0.275 0.819 0.290 ***
2nd Income quintile 0.215 0.291 0.785 0.276 ***
3rd Income quintile 0.219 0.229 0.781 0.209 **
4th Income quintile 0.410 0.220 0.690 0.166 **
5th Income quintile 0.502 0.181 0.498 0.139 *
NB: *, ** and *** indicate statistical significance at 10%, 5% and 1% respectively
UNINSUREDINSURED
The categorical variables have their means as proportions
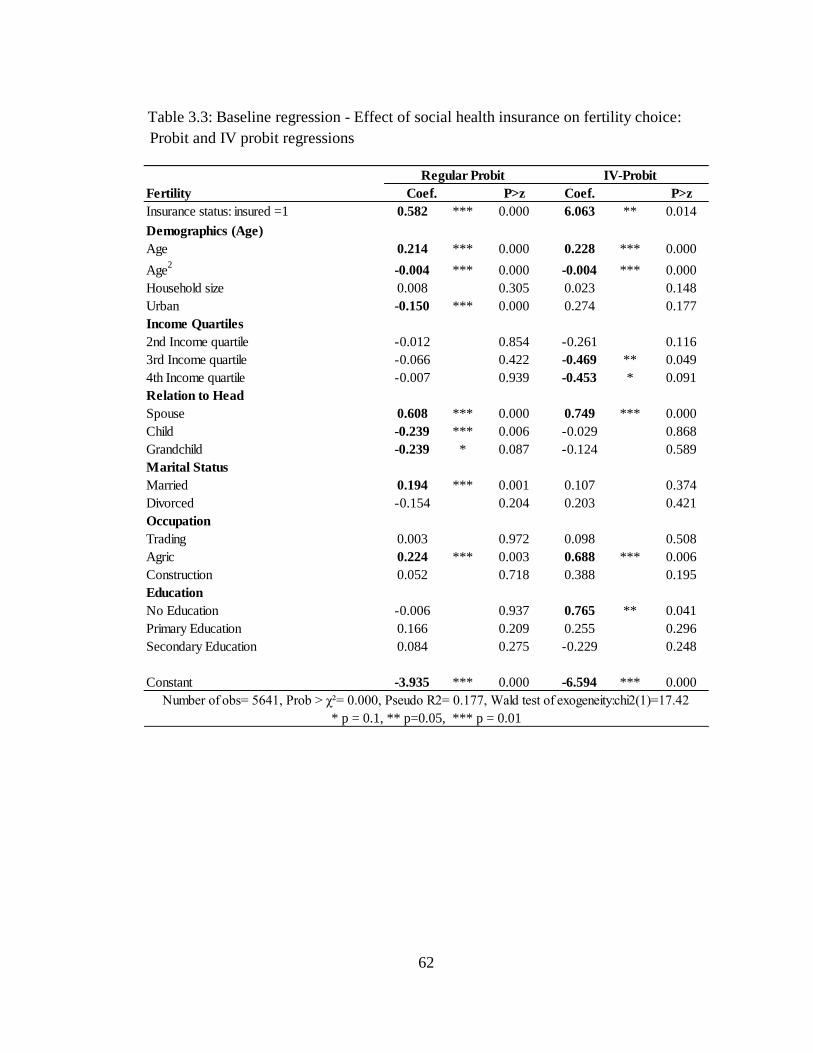
62
Table 3.3: Baseline regression - Effect of social health insurance on fertility choice:
Probit and IV probit regressions
Fertility Coef. P>z Coef. P>z
Insurance status: insured =1 0.582 *** 0.000 6.063 ** 0.014
Demographics (Age)
Age 0.214 *** 0.000 0.228 *** 0.000
Age2
-0.004 *** 0.000 -0.004 *** 0.000
Household size 0.008 0.305 0.023 0.148
Urban -0.150 *** 0.000 0.274 0.177
Income Quartiles
2nd Income quartile -0.012 0.854 -0.261 0.116
3rd Income quartile -0.066 0.422 -0.469 ** 0.049
4th Income quartile -0.007 0.939 -0.453 * 0.091
Relation to Head
Spouse 0.608 *** 0.000 0.749 *** 0.000
Child -0.239 *** 0.006 -0.029 0.868
Grandchild -0.239 * 0.087 -0.124 0.589
Marital Status
Married 0.194 *** 0.001 0.107 0.374
Divorced -0.154 0.204 0.203 0.421
Occupation
Trading 0.003 0.972 0.098 0.508
Agric 0.224 *** 0.003 0.688 *** 0.006
Construction 0.052 0.718 0.388 0.195
Education
No Education -0.006 0.937 0.765 ** 0.041
Primary Education 0.166 0.209 0.255 0.296
Secondary Education 0.084 0.275 -0.229 0.248
Constant -3.935 *** 0.000 -6.594 *** 0.000
Number of obs 5641, Prob > χ² 0.000, Pseudo R2 0.177, Wald test of exogeneity:chi2(1) 17.42
Regular Probit IV-Probit
* p = 0.1, ** p=0.05, *** p = 0.01
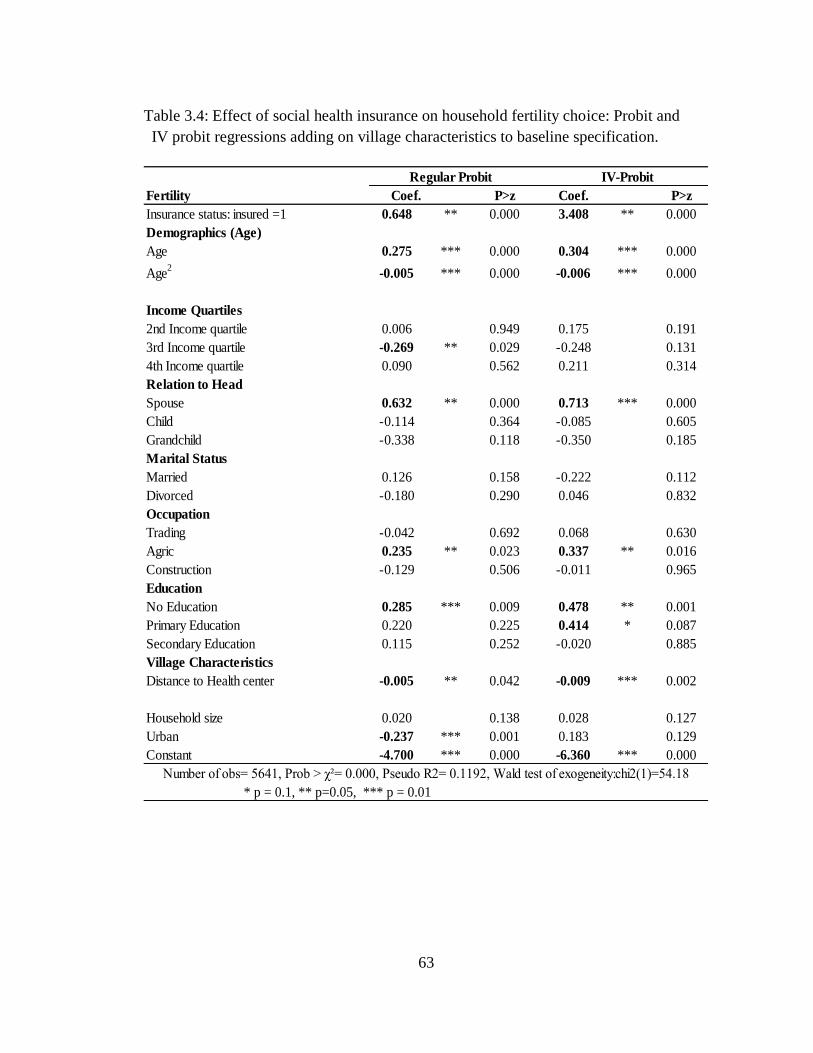
63
Table 3.4: Effect of social health insurance on household fertility choice: Probit and
IV probit regressions adding on village characteristics to baseline specification.
Fertility Coef. P>z Coef. P>z
Insurance status: insured =1 0.648 ** 0.000 3.408 ** 0.000
Demographics (Age)
Age 0.275 *** 0.000 0.304 *** 0.000
Age2
-0.005 *** 0.000 -0.006 *** 0.000
Income Quartiles
2nd Income quartile 0.006 0.949 0.175 0.191
3rd Income quartile -0.269 ** 0.029 -0.248 0.131
4th Income quartile 0.090 0.562 0.211 0.314
Relation to Head
Spouse 0.632 ** 0.000 0.713 *** 0.000
Child -0.114 0.364 -0.085 0.605
Grandchild -0.338 0.118 -0.350 0.185
Marital Status
Married 0.126 0.158 -0.222 0.112
Divorced -0.180 0.290 0.046 0.832
Occupation
Trading -0.042 0.692 0.068 0.630
Agric 0.235 ** 0.023 0.337 ** 0.016
Construction -0.129 0.506 -0.011 0.965
Education
No Education 0.285 *** 0.009 0.478 ** 0.001
Primary Education 0.220 0.225 0.414 * 0.087
Secondary Education 0.115 0.252 -0.020 0.885
Village Characteristics
Distance to Health center -0.005 ** 0.042 -0.009 *** 0.002
Household size 0.020 0.138 0.028 0.127
Urban -0.237 *** 0.001 0.183 0.129
Constant -4.700 *** 0.000 -6.360 *** 0.000
Regular Probit IV-Probit
* p = 0.1, ** p=0.05, *** p = 0.01
Number of obs 5641, Prob > χ² 0.000, Pseudo R2 0.1192, Wald test of exogeneity:chi2(1) 54.18
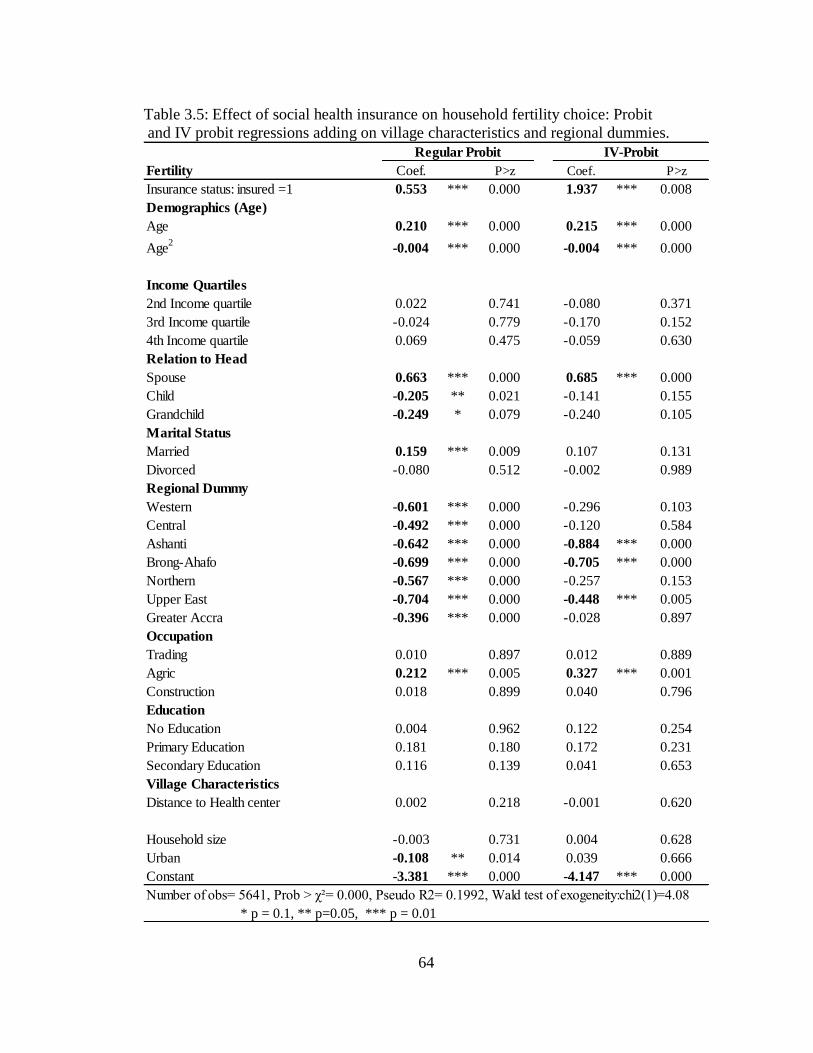
64
Table 3.5: Effect of social health insurance on household fertility choice: Probit
and IV probit regressions adding on village characteristics and regional dummies.
Fertility Coef. P>z Coef. P>z
Insurance status: insured =1 0.553 *** 0.000 1.937 *** 0.008
Demographics (Age)
Age 0.210 *** 0.000 0.215 *** 0.000
Age2
-0.004 *** 0.000 -0.004 *** 0.000
Income Quartiles
2nd Income quartile 0.022 0.741 -0.080 0.371
3rd Income quartile -0.024 0.779 -0.170 0.152
4th Income quartile 0.069 0.475 -0.059 0.630
Relation to Head
Spouse 0.663 *** 0.000 0.685 *** 0.000
Child -0.205 ** 0.021 -0.141 0.155
Grandchild -0.249 * 0.079 -0.240 0.105
Marital Status
Married 0.159 *** 0.009 0.107 0.131
Divorced -0.080 0.512 -0.002 0.989
Regional Dummy
Western -0.601 *** 0.000 -0.296 0.103
Central -0.492 *** 0.000 -0.120 0.584
Ashanti -0.642 *** 0.000 -0.884 *** 0.000
Brong-Ahafo -0.699 *** 0.000 -0.705 *** 0.000
Northern -0.567 *** 0.000 -0.257 0.153
Upper East -0.704 *** 0.000 -0.448 *** 0.005
Greater Accra -0.396 *** 0.000 -0.028 0.897
Occupation
Trading 0.010 0.897 0.012 0.889
Agric 0.212 *** 0.005 0.327 *** 0.001
Construction 0.018 0.899 0.040 0.796
Education
No Education 0.004 0.962 0.122 0.254
Primary Education 0.181 0.180 0.172 0.231
Secondary Education 0.116 0.139 0.041 0.653
Village Characteristics
Distance to Health center 0.002 0.218 -0.001 0.620
Household size -0.003 0.731 0.004 0.628
Urban -0.108 ** 0.014 0.039 0.666
Constant -3.381 *** 0.000 -4.147 *** 0.000
Number of obs 5641, Prob > χ² 0.000, Pseudo R2 0.1992, Wald test of exogeneity:chi2(1) 4.08
IV-Probit
* p = 0.1, ** p=0.05, *** p = 0.01
Regular Probit
65
CHAPTER 4
THE EFFECT OF SOCIAL HEALTH INSURANCE ON PRENATAL CARE:
THE CASE OF GHANA
4.1 Introduction
Slightly more than half of all maternal deaths occur in Sub-Saharan Africa. For
example, in Ghana, the maternal mortality ratio in 2005 was estimated at 560 maternal
deaths per 100,000 live births, compared to 12.7 maternal deaths per 100,000 live births
in the U.S. (WHO, 2007). A Ghanaian woman's risk of dying from treatable or
preventable complications of pregnancy and childbirth over the course of her lifetime is
about 1 in 45, compared to 1 in 7,300 in the developed countries. This is partly as a
result of lack of adequate prenatal care (Ghana Health Service, 2009).
A prenatal care model developed by the World Health Organization (WHO)
recommends a minimum of four medical care visits and provides detailed instructions
on the basic components of care for the four visits for both developed and developing
countries (WHO, 2001). However, prenatal care in most developing countries often fails
to meet these standards due to lack of human resources, equipment and supplies
(Zanconato, Msolomba, Guarentil, and Franchi, 2006). Costs of prenatal care include
travel costs, test fees and service costs and have been identified as a barrier in seeking
care mostly in developing countries, (Simkhada, Teijlingen, Porter, and Simkhada,
2008).
66
In order to help achieve the minimum requirements of prenatal care and to
improve health outcomes, a number of developing countries including Colombia,
Ghana, Namibia, and Peru have recently introduced social health insurance programs in
part to help improve primary health care. By making modern health care more
accessible and affordable, policy makers hope that more women will seek prenatal care
thereby reducing maternal and infant mortality. This paper looks at the role of social
health insurance on prenatal care utilization and expenditure using a two-part model for
modeling health expenditures as well as how social health insurance affects the number
of prenatal care visits. In particular, I answer three questions: (1) Does health insurance
increase the propensity of households to seek prenatal care? (2) How does the
responsiveness of prenatal care expenditures to the insured compare to the
responsiveness of prenatal care expenditures of the uninsured? Finally; (3) Does the
number of prenatal care visits increase for the insured relative to the uninsured?
In this study, I address the aforementioned questions with an analysis of the link
between social health insurance and prenatal health care utilization, out-of-pocket
expenditures, and prenatal care visits by Ghanaian households. Because insurance in
Ghana is voluntary, actual insurance status is likely endogenous. I therefore proxy for
health insurance using the variable intent to treat, an exogenous event which is defined
as whether a respondent is in a district in which the national health insurance scheme
was already in operation at the time the household was surveyed.
Ghana is one of the few African countries that have successfully implemented a
social health insurance program. The government of Ghana instituted the National
Health Insurance Scheme (NHIS) in 2003. The primary goal of this scheme was to
67
ensure equitable and universal access to health care services for all Ghanaians and to
replace the “cash and carry9” system which required prompt payment for health
services. The NHIS program requires voluntary enrollment for persons in the informal
sector, approximately 80 percent of the population. Voluntary enrollment is widely
recognized as problematic for insurance systems because sicker and older people, who
will cost the system more, enroll in greater numbers than the young and healthy.
There is scant economic literature in the area of prenatal care and health
insurance, and most of the papers published in this area address issues only from a
policy stand point with very few robust econometric strategies. Two earlier papers that
studied prenatal care and health insurance looked at Medicaid‟s effect on prenatal care
(Grossman and Jacobwitz, 1981; and Corman and Grossman, 1985). In a developing
country context, there have been several papers that have studied various issues
regarding prenatal care and health insurance Simkhada et al.(2008) evaluated the factors
affecting the utilization of antenatal care in developing countries. They found that
among the many predictors of antenatal care, maternal education, marital status, cost of
care, household income, and having a history of obstetric complications were the most
important factors of antenatal care. Smith and Sulzbach (2006) studied the Community-
Based Health Insurance (CBHI) and access to maternal health services focusing on the
evidence from three West African countries and found that CBHI is a potential demand-
side mechanism to increase maternal health care access. Complementary supply-side
9 Cash and carry is a sales policy or a method of purchase in which the customer must remit payment at
the point of service and must take the item with you. In the context of this paper, it can be seen as paying
for health care before you receive the necessary treatment.
68
interventions to improve quality of and geographic access to health care are however
also critical for improving health outcomes in this region. Finally, the work by Long et
al. (2010) examined the utilization, contents and costs of prenatal care under a rural
health insurance program.
This is the first paper to apply a two-part model to prenatal care health
expenditures to address this very important policy issue within the literature. The two-
part model has gains over the use of ordinary least squares when there are a lot of zeros
in the expenditure data. The zeros primarily arise from non-usage of services during the
recall period of the survey.
4.2 Health Care Financing and Health Insurance in Ghana
The health insurance program introduced in Ghana in 2003 is the most recent of several
major reforms of Ghana‟s health system since the nation achieved independence in
1957. After independence, the government embarked on the implementation of a social
welfare system which involved free health care for all its citizens at public health
facilities. Health care was primarily financed by taxes and external donor support, user
fees were removed and attention was directed to developing a wide range of primary
health care facilities across the country. However, by the early 1970s, the country was
facing stagnating economic growth and could therefore not support its health financing
with tax revenues alone.
In 1985, the government introduced health care reforms as part of the ongoing
structural adjustment programs aimed mainly at reducing government spending to
69
address budgetary deficits. The reforms included introducing cost recovery mechanisms
through user fees (known in Ghana as “cash and carry”) in order to discourage
unnecessary use of services and liberalize health services to allow private sector
involvement (The World Bank 2007). This system led to dramatic declines in health
care utilization, with outpatient visits to hospitals dropping from 4.6 million to 1.6
million in 1985 (Ghana health service 2009). Beginning in 1989, community-based
health insurance schemes, also known as mutual health organizations, were introduced
in certain districts throughout the country to encourage greater usage of health services.
However, coverage rates were very low, covering less than 5 percent of the population,
leaving many Ghanaians vulnerable in the event of a catastrophic illness (Ghana health
service 2009).
In response, the government of Ghana passed the National Health Insurance Act
(650, 2003), whose primary goal was to reduce out-of-pocket expenditures and improve
access to, as well as the quality of, basic health care services through the establishment
of district-wide insurance schemes coordinated by the National Insurance Authority.
The primary funding source is the National Health Insurance Levy (2.5 percent of
V.A.T.); secondary sources are payroll deductions (2.5 percent of income) for formal
sector employees and premiums for informal sector members. Other funds come from
donations or loans.
Membership in the NHIS is mandatory for formal sector workers, unless
alternative private health insurance can be demonstrated. Membership is optional for
non-formal sector workers who make up the majority of the population. For formal
sector workers, a payroll deduction of 2.5 percent is transferred to the NHI fund as part
70
of their contribution to the Social Security and National Insurance Trust fund.
Premiums by those outside the formal sector was intended to vary by income such that
the lowest-income group pays an annual premium of 72,000 cedis, roughly US$ 8,
while those in the highest income group pay a premium of 480,000 (US$53) per annum
for each enrolled individual. In reality, a flat premium payment of 72,000 cedis per
annum is charged due to the difficulty of assessing and verifying income in the informal
sector. Once the premium is paid, the only additional costs are the annual registration
fee which serves as renewal costs to the members. Annual registration fees (paid by all
enrollees, including those exempt from premiums) ranged between 7,000 and 50,000
cedis per annum. There are no co-payments or deductibles however, provided the
ailment falls within the defined benefits package.
The National Health Insurance Act (NHIA) mandates a pre-defined benefits
package that covers 95 percent of the disease burden in Ghana. Services covered
include outpatient consultations, essential drugs, inpatient care and shared
accommodation, maternity care (vaginal and caesarean delivery), eye care, dental care
and emergency care. Excluded benefits include echocardiography, renal dialysis, heart
and brain surgery, organ transplantation as well as drugs not listed in the approved
drugs list. Several groups are exempted from premium payments, and these include
pensioners, the elderly, children under age 18, indigents and pregnant women (as of
2008). There is a six-month gap between joining and being eligible for benefits
(Government of Ghana 2004). By the end of 2008, Ghana‟s national insurance program
covered 61 percent of the population, with District Mutual Health Insurance Schemes
operating in all districts (Asenso-Boadi, 2009).
71
Table 4.1 shows a breakdown of the insurance enrollment trends within different
categories over time, from 2005 to 2008. Figure 4.1 is an accompanying graph to table
4.1. Clearly, children below age 18 formed majority of persons who enrolled over the
entire period. This is because persons under age 18 automatically qualify under their
parents insurance. Of those who actually pay premiums, informal sector adults form the
biggest group. It can be seen that until year 2008, pregnant women were not a different
category and rather was distributed across the other categories. In the year 2008, the
government of Ghana issued a directive to add pregnant women to the exempt category.
The overall enrollment figures over the period 2005 to 2008 mirrors a step function,
since enrollment has progressively increased over time.
4.3 Data and Descriptive Statistics
This study uses data from the most recent round of the Ghana Living Standards Survey
(GLSS) round five (GLSSV) conducted by the Ghana Statistical Service (GSS) in
2005/06. The GLSS is a nationally representative multi-purpose survey of households in
Ghana.10
A two-stage stratified random sampling design was adopted in the survey. A
total of 550 enumeration areas were included at the first stage of sampling, followed by
a fixed take of 15 households per enumeration area. The distribution of the selected
enumeration areas into the ten regions or strata was based on proportionate allocation
using the population.
10 A household, according to the definition of GSS, consists of a person or group of related or unrelated
persons, who live together in the same housing unit, who acknowledge one adult male or female as the
head of the household, who share the same housekeeping and cooking arrangements.
72
The round five (GLSSV) survey sampled 37,128 individuals from 8,867
households. Since the focus of the paper is prenatal care, the sample used for this study
includes only women of child bearing age, ages 15 through 49 who were pregnant
within sometime in the recall period, which is within a year to the survey date. This
reduces the sample to 1012 observations for the analysis. The survey collected
information on socio-demographic characteristics of the population, education, health,
employment and time use, migration, housing conditions and household agriculture.
The third section of the survey includes information on health including condition of
illness, prenatal care usage, health expenditures, and insurance status.
Table 4.2 presents the descriptive statistics for the variables used in the analysis.
The majority of the differences in proportions and means between the insured and their
uninsured counterparts are statistically significant, with the exception of a few
characteristic like age of the woman, relation to household head as well as some of the
lower income quartiles.
The average age for the insured sample is approximately 19 years while the
average age for the uninsured sample is about 18 years. The average household size for
the insured household is 4 persons per household while uninsured households had an
average household size of 2 persons. Approximately 44 percent of the insured group
was married women, followed by 32 percent of the sample being single women. For the
uninsured group, 48 percent were married, while 37 percent were single. As typical of a
developing country, agriculture dominated as the occupation of women in my sample,
followed by trading, with the professional (formal sector) occupation being the least
common occupation among the sample. The income quartiles show insurance coverage
73
by different income groups. Wealth is seen to be positively correlated with insurance
enrollment, such that the proportion of people who are insured increases with wealth.
Figure 4.2 shows a histogram showing the distribution of prenatal care out-of-
pocket expenditures for a typical first doctor visit for the insured and uninsured,
excluding outliers for costs greater than GH ₵60,000. The figure clearly shows that the
uninsured spend more out-of-pocket on average for their first prenatal care consultation
than the insured.
4.4 Empirical Methodology
One concern in analyzing the relationship between insurance and prenatal care is self-
selection into the insurance program due to the voluntary nature of the insurance
program. Unobserved heterogeneity is a major source of endogeneity and describes a
situation where some unobserved characteristic (such as unobserved health status or
unobserved preference of seeking prenatal care) is related to both the dependent
variable (prenatal care decisions) and one or more independent variables (insurance).
To address the endogeneity of the insurance variable, I utilize an exogenous
variable called „intent to treat‟ to proxy for insurance status. I define „intent to treat‟ as
whether a respondent is in a district which has the national health insurance scheme
already in operation at the time when he is surveyed. Using this variable helps us avoid
the problem of endogeneity, since it represents an exogenous event similar to a natural
experiment.
74
4.4.1 Prenatal Care Utilization and Health Expenditures
An empirical challenge when analyzing health expenditures is the high percentage of
zeros often observed in the data. In the present application, this occurs when pregnant
women do not seek care and hence have no expenditure. In estimating the health care
costs during prenatal care visits, I examine the role of health insurance as well as other
covariates in affecting the cost of prenatal care. The functional form of the outcome
equation takes the form:
(1)
where the dependent variable, EXP represents expenditure on prenatal care, INS,
represents the main regressor, a binary variable for insurance status and Z, a vector of
control variables representing individual, household and community characteristics
which include gender, age, income quartile of household, relationship to household
head, occupation, education, marital status, and regional dummies.
In addition to the problem of high proportion of zeros, my dependent variable is
highly skewed and approximately log-normally distributed. A number of papers have
discussed the difficulties of modeling medical expenses appropriately including; Duan
et al. (1982); Duan (1983); Hay and Olsen (1984), among others.
Using the Tobit model to estimate equation (1) would be inappropriate since the
Tobit model assumes that a single mechanism determines both likelihood as well as the
amount spent on health care. An alternative to using a Tobit model is the self-selection
or Heckman model. However, as shown by a number of authors including Duan et al.
75
(1983), the Heckman model is rejected for various reasons, such as: assuming that the
functional form is known a priori and that it yields a bivariate normal error; displaying
poor numerical and statistical properties (in particular, the inability to separate selection
effects from heteroscedasticity and nonlinearity) and; estimating unconditional
(uncensored) expenditures when, in fact, the zeros in health care expenditures are true
zeros and not merely missing information.
As a result of these problems, a more appropriate model is the two-part model.
The two-part model provides an approach to account for the mass of zeros. In a two-part
model, a binary choice model is estimated for the probability of observing a zero versus
positive outcome. Then, conditional on a positive outcome, an appropriate regression
model is estimated for the positive outcome. The simple model for household health
care expenditures in a two-part model then takes the form:
( | ) ( | ) ( | ) (2)
The two parts of the expression forms the two-part equation model, with the first part
being
( | ) (3)
which represents the probability of having positive health care expenditures, with the
variable Z being a vector of explanatory variables including my main policy variable
insurance enrollment using the probit model.
76
In the second equation, I model health care expenditures using ordinary least
squares, conditional on having positive expenditure values and thus estimated using a
subset of the data. The second stage of the two-part model takes the form:
( | ) (4)
Given the skewed nature of the expenditure variable in the second part of the model and
hence the non-normality of the log scale error term, I perform the regressions on a log
transformation of cost. However, in calculating expenditure predictions from the model,
one runs into the problem of retransformation back to raw-scale expenditures. A
commonly used retransformation technique is Duan‟s smearing transformation from the
OLS model for ln(expenditure).
4.4.2 The Number of Prenatal Care Visits
The objective of the third research question is to evaluate the impact of social health
insurance on the number of prenatal care visits. To accomplish this, a count model is
used since the dependent variable (number of prenatal care visits) is a nonnegative
integer. Based on past research, the Poisson regression model is a natural first choice for
modeling such discrete and nonnegative data sets. However, a major limitation of the
Poisson regression model is that the variance of the dependent variable is constrained to
be equal to its mean. There is a fairly large body of literature (see, e.g., Cameron and
Trivedi (2007)) that suggests that most count data, particularly data on doctor visits, are
likely to be overdispersed (i.e., the variance will likely be significantly greater than the
mean).

77
In the situation when the mean and variance of the data are not approximately
equal, the variances of the estimated Poisson model coefficients tend to be
underestimated and the coefficients therefore become biased. The negative binomial
distribution is used in such instances to overcome the limitation. The negative binomial
model can be considered as a generalization of Poisson regression since it has the same
mean structure as Poisson regression, and it has an extra parameter to model the over-
dispersion.
To derive the negative binomial model I first start with the Poisson model and
follow the methodology by Farbmacher (2012). Let N be a random variable
representing the number of prenatal care visits. This variable is said to have a Poisson
distribution with parameter and takes on values n = 0, 1 2,..... with probability
( ) ( )
(5)
where ( ) represent the probability of a prenatal care visit, n times within the
recall period of the survey. For >0, the mean and variance of the distribution is shown
to be
( ) ( ) (6)
A Poisson regression is fitted to data by specifying the Poisson parameter to be a
function of the explanatory variables and takes the form
(7)
where is a vector of estimable coefficients and X, a vector of explanatory variables

78
The Poisson regression equations defined in (5) and (7) can be estimated using the
standard maximum likelihood methods with the likelihood function
( ) , ( )-, ( )-
(8)
As mentioned earlier, the Poisson regression model is inappropriate when the mean and
variance of the distribution is approximately not equal. If this equality does not hold,
corrective measures must be taken to prevent model specification errors. The typical
approach used is to apply the negative binomial model. The negative binomial model is
derived from the Poisson model by adding an independently distributed error term to
(7), such that
(9)
where exp( ) represent a gamma-distributed error term with mean one and variance .
This gives a conditional probability
( | ) , ( )-, ( )-
(10)
Integrating out of this expression produces the unconditional distribution of .
Simplifying the results leads to a negative binomial model that allows the mean to differ
from the variance in the form
( ) ( ) ( ) (11)
79
where , the variance of the gamma-distributed error term is the measure of dispersion
and can be derived using standard maximum likelihood techniques.
The appropriateness of the negative binomial relative to the Poisson model is
determined by the statistical significance of the estimated coefficient, . If is not
significantly different from zero (as measured by p-value), the negative binomial model
simply reduces to a Poisson regression with, ( ) ( ). If is significantly
different from zero, the negative binomial is the appropriate choice of model and the
Poisson model is inappropriate. The likelihood ratio test on the alpha variable as
presented at the bottom in table 4.9 shows that alpha is statistically significantly
different from zero. This result thus provides support for the negative binomial
regression model.
4.5 Empirical Results
Tables 4.3 through 4.6 present the results for the research questions 1 and 2, namely to
determine the propensity of households to seek prenatal care and the magnitude of out-
of-pocket spending when insurance is made available. These results come from the two-
part model described in the previous section. Tables 4.3 and 4.4 include estimation
results from the baseline model, while tables 4.5 and 4.6 serves as a robustness check by
adding an interaction term between insurance status and urban residency status. The
first stage of the two-part model shows the probability of spending at least ₵1 on
prenatal care (see tables 4.3 and 4.5), while the second stage shows the amount of
spending conditional on any spending (see table 4.4 and 4.6). From the first stage
estimations (table 4.3), insured pregnant women are more likely to seek (and hence
80
spend at least ₵1) on prenatal care compared to uninsured pregnant women. However,
as a result of the social insurance program, in the second stage results, insured women
actually spend less out-of-pocket conditional on any spending relative to the uninsured.
Insured pregnant women are more likely to spend at least 0.45 cedis, but, conditional on
spending any amount, they spend less out-of-pocket compared to their uninsured
counterparts.
Results from tables 4.5 and 4.6 presents robustness check estimation to the
baseline result from tables 4.3 and 4.4, by adding an interaction term between insurance
status and urban residency status. The interaction term equals one if an individual is
insured and also resides in an urban area. People in this group are ex-ante more likely to
have insurance compared to others. This addition does not change the significance of
the effect of insurance. For the interaction term, insured pregnant women living in
urban areas were more likely to seek and hence spend at least ₵1 on prenatal care.
However, conditional on spending any amount they did not differ significantly from
other pregnant women on the magnitude of out-of-pocket spending.
With the results from tables 4.7 and 4.8, I predict the total out-of-pocket
spending on prenatal care for the insured and uninsured pregnant women respectively.
Clearly, uninsured pregnant women spend much more compared to insured pregnant
women. The predicted total out-of-pocket spending on prenatal care for an insured
pregnant woman is about ₵ 3,600 ($0.40) for her first prenatal care visit, while the
predicted total spending for an uninsured pregnant woman stands at about ₵ 21,600
($2.40) for her first visit.
81
The national average monthly income in Ghana during the survey period was
about ₵1,000,000. Hence a typical uninsured pregnant woman is likely to spend on
average a little over to 2 percent of her household income on her first prenatal care visit
only. These results are clearly showing the gains in having health insurance compared
to being uninsured.
Results for the final research question, the effect of social health insurance on
the number of prenatal care visits is shown in table 4.9. As per the recommendations of
the World Health Organization, pregnant women are advised to have a minimum of four
medical care visits to help promote healthy health outcomes. The left panel of table 4.9
presents the baseline negative binomial regression results when insurance status is still
endogenous. The right panel shows the same estimation results but with the „intent to
treat‟ variable, which is a proxy for insurance status. Instead of reporting the regular
negative binomial regression coefficients which measures the difference between the
logs of expected counts, I report the incident rate ratio (IRR) estimates, which are the
exponentiated form of the negative binomial regression coefficients. The IRR in this
case, measures the change in prenatal care visits in terms of a percentage increase or
decrease, with the precise percentage determined by the amount the IRR is either above
or below 1.
Results from the left panel of table 4.9 suggests that having insurance increases
the number of prenatal care visits by 40% relative to being uninsured, holding all the
other controls constant. This result is robust to using the intent to treat variable as a
proxy for insurance status. In the right panel of table 4.9, the insured have
approximately 24% more visits compared to the uninsured. These results support the
82
finding shown in the histogram in figure 4.3. Consistent with the goal of the National
Health Insurance scheme in Ghana, insurance does increase the number of prenatal car
visits.
4.6 Conclusion and Policy Implications
Infant and maternal mortality rates across developing countries have remained very
high over the past two decades, despite the advances in medicine and medical care. For
example, there were 47.26 deaths per 1000 live births in Ghana in the year 2010 (WHO
2010). In the year of the survey (2005), Ghana recorded 560 maternal deaths per
100,000 live births. These alarming statistics underscore the importance of the United
Nation‟s pursuit to reduce infant mortality and improve maternal health outcomes by
the year 2020. Governments and policy makers in a number of developing countries in
response to this problem have introduced social health insurance programs, with the aim
of increasing access to health care at affordable prices.
This paper answers three research questions. (1) Does health insurance increase
the propensity of households to seek prenatal care? (2) How does the responsiveness of
health care expenditures to the insured compare to the responsiveness of health care
expenditures of the uninsured? Finally; (3) Does the number of prenatal care visits
increase for the insured relative to the uninsured? Results show that having insurance
increases a woman‟s likelihood of seeking prenatal care, and conditional on any
spending, they do spend less on prenatal care compared to the uninsured. Also, the
insured have more prenatal care visits compared to the uninsured.
83
One goal of the World Health Organization is to increase the number of
pregnant women who seek prenatal care services. Their new model requires pregnant
women to have a minimum of four medical care visits during pregnancy. This paper
shows that the Social Health Insurance program in Ghana is helping the country reach
this goal. Such insurance programs result in more women seeking prenatal care at a
more affordable prices compared to being uninsured. Other countries should therefore
be encouraged to introduce such social insurance programs, since it has been shown to
produce the desired result.
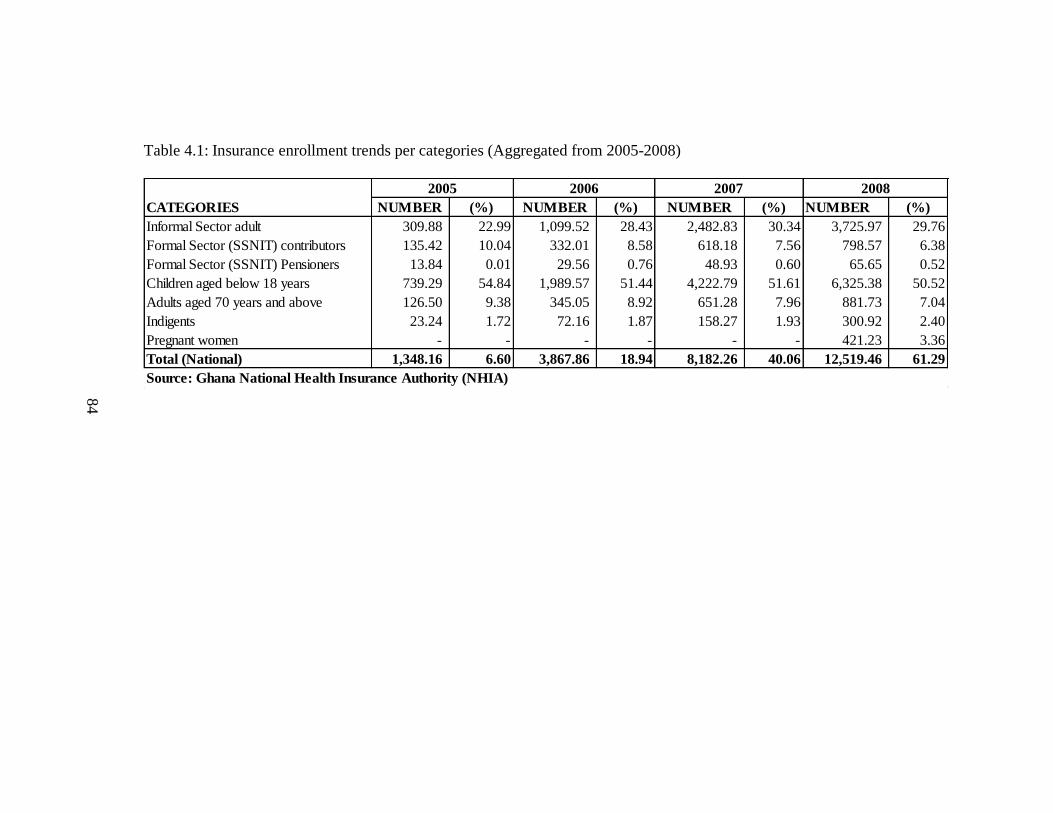
84
Table 4.1: Insurance enrollment trends per categories (Aggregated from 2005-2008)
NUMBER (%) NUMBER (%) NUMBER (%) NUMBER (%)
Informal Sector adult 309.88 22.99 1,099.52 28.43 2,482.83 30.34 3,725.97 29.76
Formal Sector (SSNIT) contributors 135.42 10.04 332.01 8.58 618.18 7.56 798.57 6.38
Formal Sector (SSNIT) Pensioners 13.84 0.01 29.56 0.76 48.93 0.60 65.65 0.52
Children aged below 18 years 739.29 54.84 1,989.57 51.44 4,222.79 51.61 6,325.38 50.52
Adults aged 70 years and above 126.50 9.38 345.05 8.92 651.28 7.96 881.73 7.04
Indigents 23.24 1.72 72.16 1.87 158.27 1.93 300.92 2.40
Pregnant women - - - - - - 421.23 3.36
Total (National) 1,348.16 6.60 3,867.86 18.94 8,182.26 40.06 12,519.46 61.29
Source: Ghana National Health Insurance Authority (NHIA)
CATEGORIES
2005 2006 2007 2008
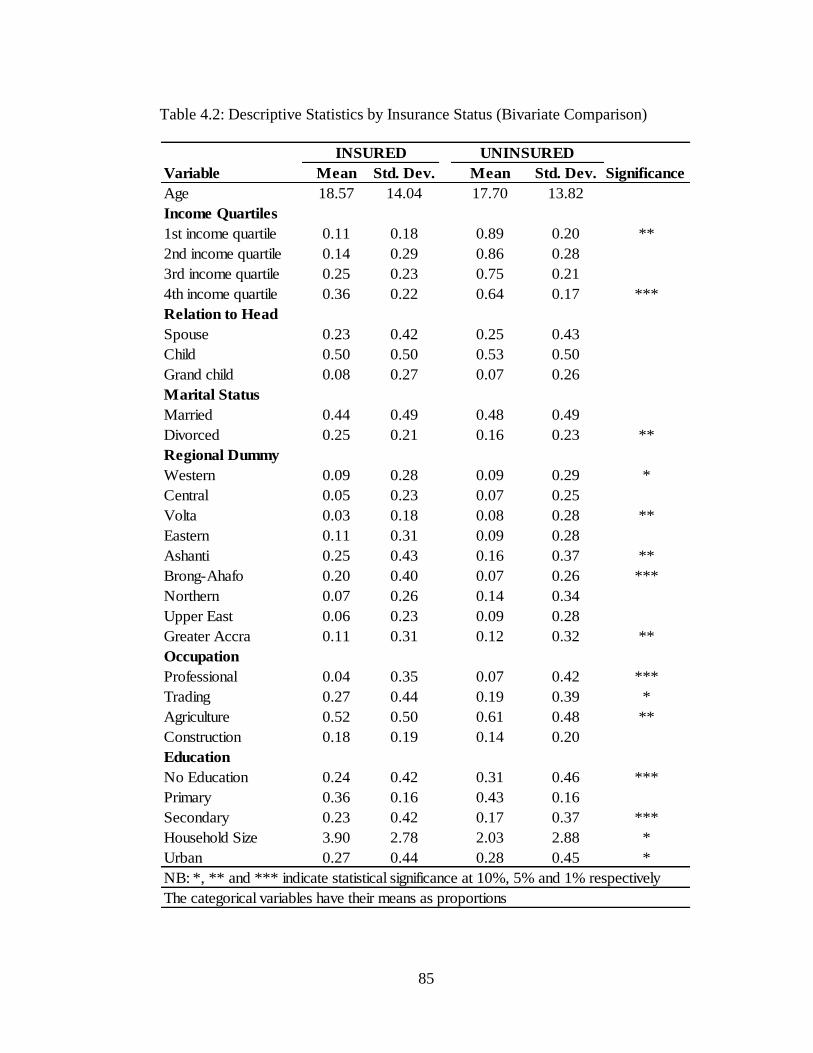
85
Table 4.2: Descriptive Statistics by Insurance Status (Bivariate Comparison)
Variable Mean Std. Dev. Mean Std. Dev. Significance
Age 18.57 14.04 17.70 13.82
Income Quartiles
1st income quartile 0.11 0.18 0.89 0.20 **
2nd income quartile 0.14 0.29 0.86 0.28
3rd income quartile 0.25 0.23 0.75 0.21
4th income quartile 0.36 0.22 0.64 0.17 ***
Relation to Head
Spouse 0.23 0.42 0.25 0.43
Child 0.50 0.50 0.53 0.50
Grand child 0.08 0.27 0.07 0.26
Marital Status
Married 0.44 0.49 0.48 0.49
Divorced 0.25 0.21 0.16 0.23 **
Regional Dummy
Western 0.09 0.28 0.09 0.29 *
Central 0.05 0.23 0.07 0.25
Volta 0.03 0.18 0.08 0.28 **
Eastern 0.11 0.31 0.09 0.28
Ashanti 0.25 0.43 0.16 0.37 **
Brong-Ahafo 0.20 0.40 0.07 0.26 ***
Northern 0.07 0.26 0.14 0.34
Upper East 0.06 0.23 0.09 0.28
Greater Accra 0.11 0.31 0.12 0.32 **
Occupation
Professional 0.04 0.35 0.07 0.42 ***
Trading 0.27 0.44 0.19 0.39 *
Agriculture 0.52 0.50 0.61 0.48 **
Construction 0.18 0.19 0.14 0.20
Education
No Education 0.24 0.42 0.31 0.46 ***
Primary 0.36 0.16 0.43 0.16
Secondary 0.23 0.42 0.17 0.37 ***
Household Size 3.90 2.78 2.03 2.88 *
Urban 0.27 0.44 0.28 0.45 *
NB: *, ** and *** indicate statistical significance at 10%, 5% and 1% respectively
INSURED UNINSURED
The categorical variables have their means as proportions
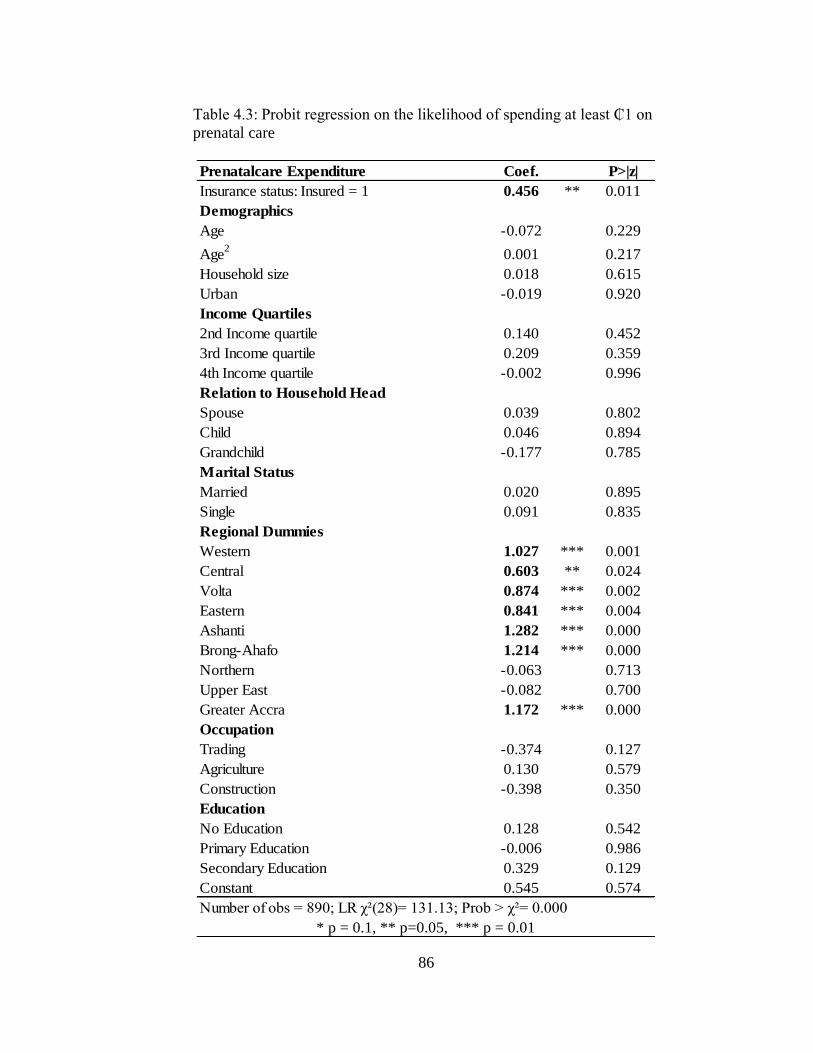
86
Table 4.3: Probit regression on the likelihood of spending at least ₵1 on
prenatal care
Prenatalcare Expenditure Coef. P>|z|
Insurance status: Insured = 1 0.456 ** 0.011
Demographics
Age -0.072 0.229
Age2
0.001 0.217
Household size 0.018 0.615
Urban -0.019 0.920
Income Quartiles
2nd Income quartile 0.140 0.452
3rd Income quartile 0.209 0.359
4th Income quartile -0.002 0.996
Relation to Household Head
Spouse 0.039 0.802
Child 0.046 0.894
Grandchild -0.177 0.785
Marital Status
Married 0.020 0.895
Single 0.091 0.835
Regional Dummies
Western 1.027 *** 0.001
Central 0.603 ** 0.024
Volta 0.874 *** 0.002
Eastern 0.841 *** 0.004
Ashanti 1.282 *** 0.000
Brong-Ahafo 1.214 *** 0.000
Northern -0.063 0.713
Upper East -0.082 0.700
Greater Accra 1.172 *** 0.000
Occupation
Trading -0.374 0.127
Agriculture 0.130 0.579
Construction -0.398 0.350
Education
No Education 0.128 0.542
Primary Education -0.006 0.986
Secondary Education 0.329 0.129
Constant 0.545 0.574
Number of obs 890; LR χ²(28) 131.13; Prob > χ² 0.000
* p = 0.1, ** p=0.05, *** p = 0.01
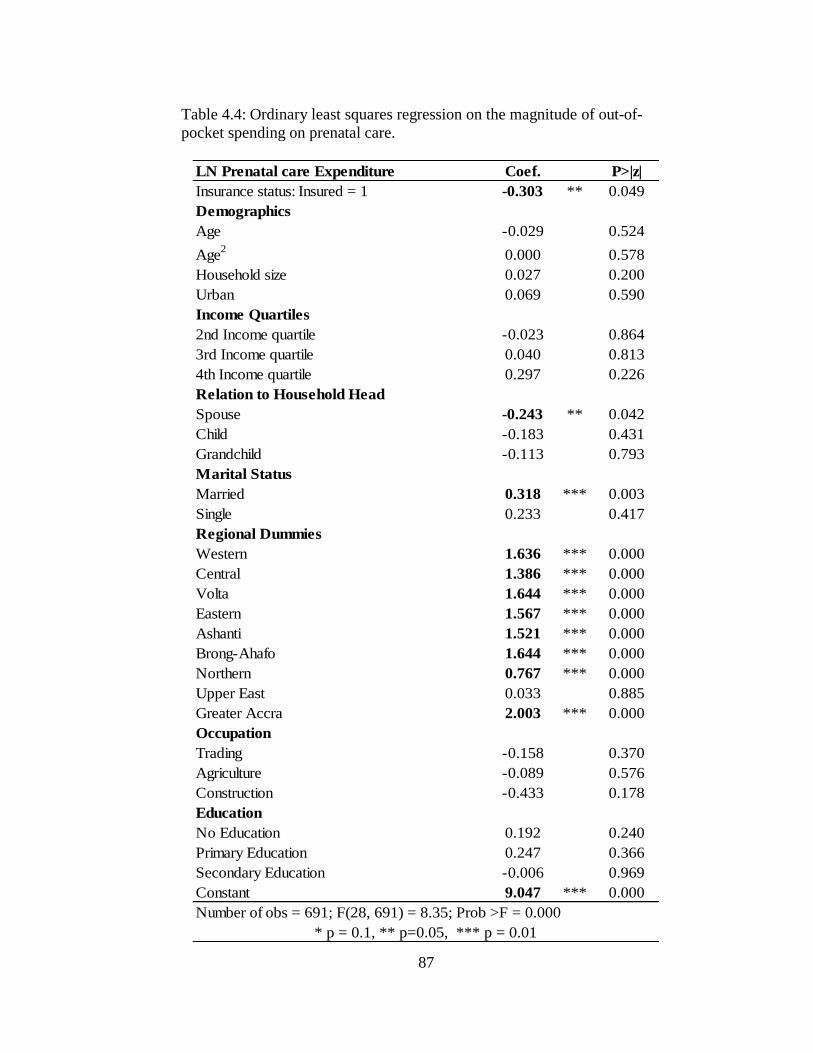
87
Table 4.4: Ordinary least squares regression on the magnitude of out-of-
pocket spending on prenatal care.
LN Prenatal care Expenditure Coef. P>|z|
Insurance status: Insured = 1 -0.303 ** 0.049
Demographics
Age -0.029 0.524
Age2
0.000 0.578
Household size 0.027 0.200
Urban 0.069 0.590
Income Quartiles
2nd Income quartile -0.023 0.864
3rd Income quartile 0.040 0.813
4th Income quartile 0.297 0.226
Relation to Household Head
Spouse -0.243 ** 0.042
Child -0.183 0.431
Grandchild -0.113 0.793
Marital Status
Married 0.318 *** 0.003
Single 0.233 0.417
Regional Dummies
Western 1.636 *** 0.000
Central 1.386 *** 0.000
Volta 1.644 *** 0.000
Eastern 1.567 *** 0.000
Ashanti 1.521 *** 0.000
Brong-Ahafo 1.644 *** 0.000
Northern 0.767 *** 0.000
Upper East 0.033 0.885
Greater Accra 2.003 *** 0.000
Occupation
Trading -0.158 0.370
Agriculture -0.089 0.576
Construction -0.433 0.178
Education
No Education 0.192 0.240
Primary Education 0.247 0.366
Secondary Education -0.006 0.969
Constant 9.047 *** 0.000
Number of obs = 691; F(28, 691) = 8.35; Prob >F = 0.000
* p = 0.1, ** p=0.05, *** p = 0.01
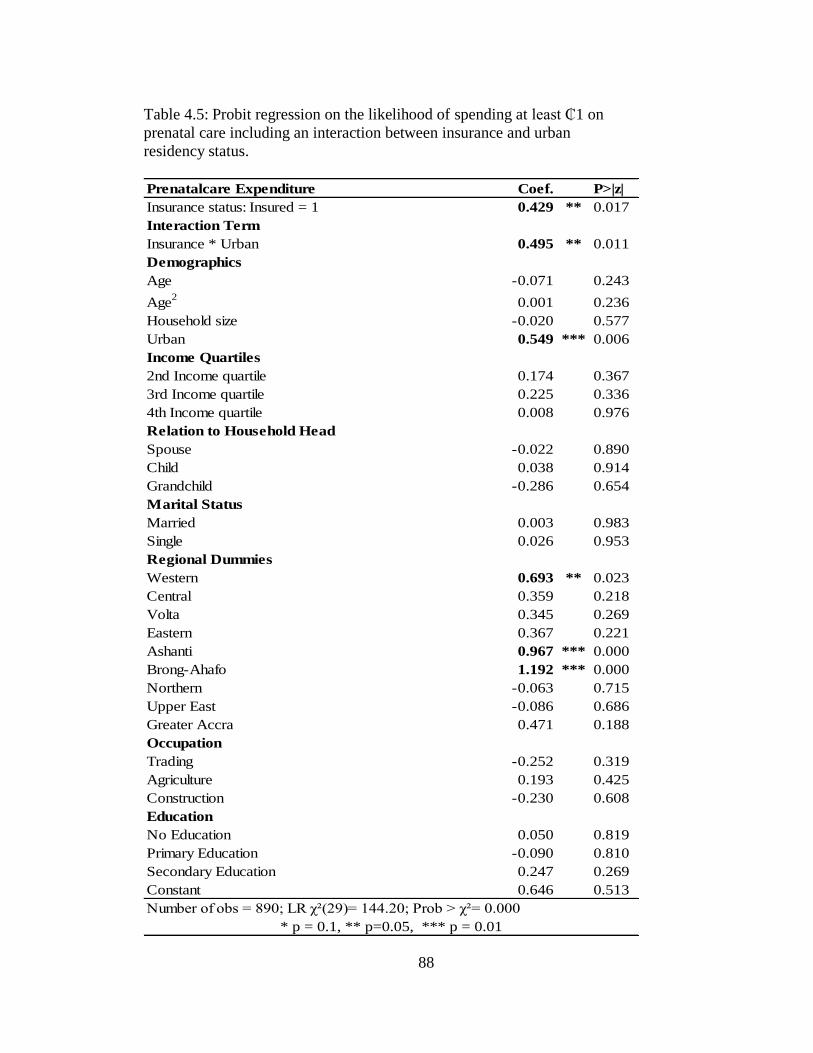
88
Table 4.5: Probit regression on the likelihood of spending at least ₵1 on
prenatal care including an interaction between insurance and urban
residency status.
Prenatalcare Expenditure Coef. P>|z|
Insurance status: Insured = 1 0.429 ** 0.017
Interaction Term
Insurance * Urban 0.495 ** 0.011
Demographics
Age -0.071 0.243
Age2
0.001 0.236
Household size -0.020 0.577
Urban 0.549 *** 0.006
Income Quartiles
2nd Income quartile 0.174 0.367
3rd Income quartile 0.225 0.336
4th Income quartile 0.008 0.976
Relation to Household Head
Spouse -0.022 0.890
Child 0.038 0.914
Grandchild -0.286 0.654
Marital Status
Married 0.003 0.983
Single 0.026 0.953
Regional Dummies
Western 0.693 ** 0.023
Central 0.359 0.218
Volta 0.345 0.269
Eastern 0.367 0.221
Ashanti 0.967 *** 0.000
Brong-Ahafo 1.192 *** 0.000
Northern -0.063 0.715
Upper East -0.086 0.686
Greater Accra 0.471 0.188
Occupation
Trading -0.252 0.319
Agriculture 0.193 0.425
Construction -0.230 0.608
Education
No Education 0.050 0.819
Primary Education -0.090 0.810
Secondary Education 0.247 0.269
Constant 0.646 0.513
Number of obs 890; LR χ²(29) 144.20; Prob > χ² 0.000
* p = 0.1, ** p=0.05, *** p = 0.01
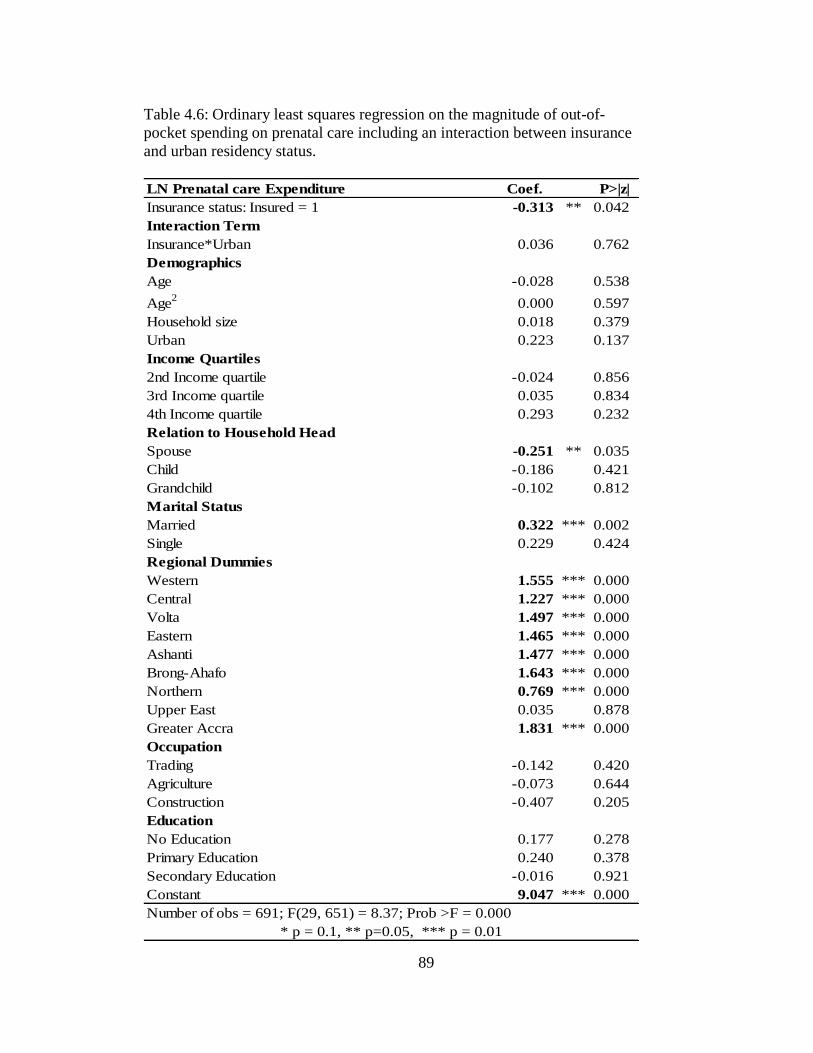
89
Table 4.6: Ordinary least squares regression on the magnitude of out-of-
pocket spending on prenatal care including an interaction between insurance
and urban residency status.
LN Prenatal care Expenditure Coef. P>|z|
Insurance status: Insured = 1 -0.313 ** 0.042
Interaction Term
Insurance*Urban 0.036 0.762
Demographics
Age -0.028 0.538
Age2
0.000 0.597
Household size 0.018 0.379
Urban 0.223 0.137
Income Quartiles
2nd Income quartile -0.024 0.856
3rd Income quartile 0.035 0.834
4th Income quartile 0.293 0.232
Relation to Household Head
Spouse -0.251 ** 0.035
Child -0.186 0.421
Grandchild -0.102 0.812
Marital Status
Married 0.322 *** 0.002
Single 0.229 0.424
Regional Dummies
Western 1.555 *** 0.000
Central 1.227 *** 0.000
Volta 1.497 *** 0.000
Eastern 1.465 *** 0.000
Ashanti 1.477 *** 0.000
Brong-Ahafo 1.643 *** 0.000
Northern 0.769 *** 0.000
Upper East 0.035 0.878
Greater Accra 1.831 *** 0.000
Occupation
Trading -0.142 0.420
Agriculture -0.073 0.644
Construction -0.407 0.205
Education
No Education 0.177 0.278
Primary Education 0.240 0.378
Secondary Education -0.016 0.921
Constant 9.047 *** 0.000
Number of obs = 691; F(29, 651) = 8.37; Prob >F = 0.000
* p = 0.1, ** p=0.05, *** p = 0.01
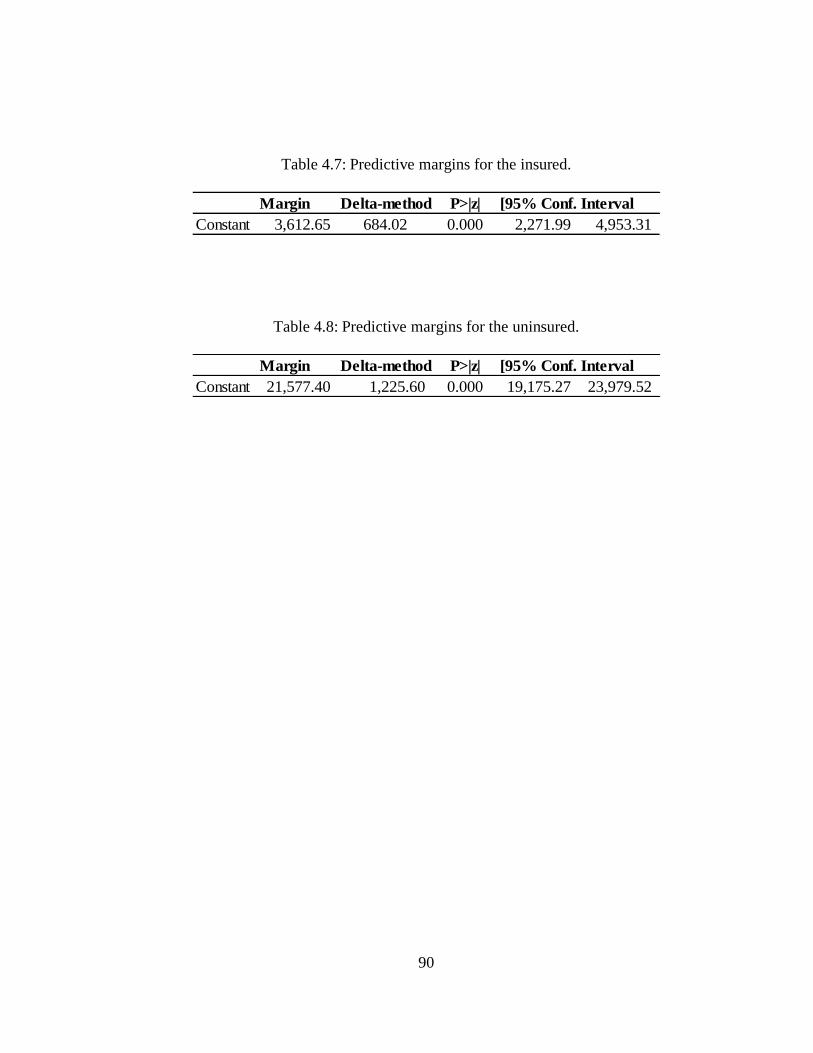
90
Table 4.7: Predictive margins for the insured.
Table 4.8: Predictive margins for the uninsured.
Margin Delta-method Std. ErrorP>|z| [95% Conf. Interval
Constant 3,612.65 684.02 0.000 2,271.99 4,953.31
Margin Delta-method Std. ErrorP>|z| [95% Conf. Interval
Constant 21,577.40 1,225.60 0.000 19,175.27 23,979.52
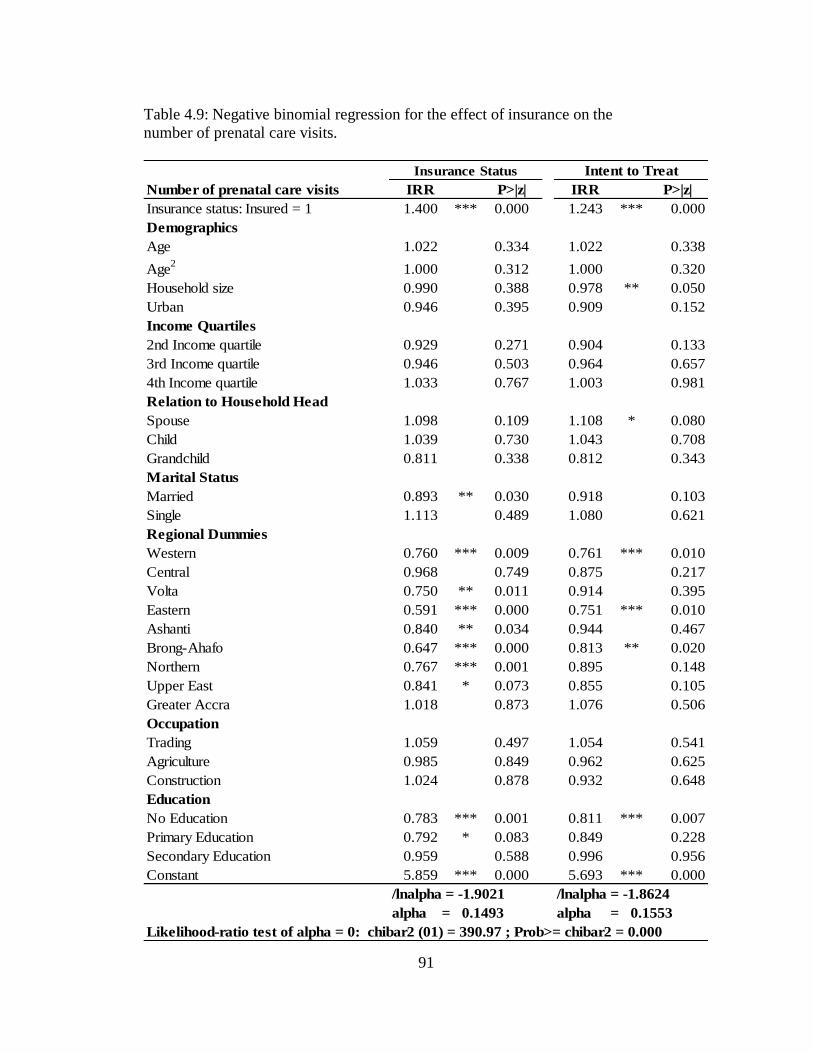
91
Table 4.9: Negative binomial regression for the effect of insurance on the
number of prenatal care visits.
Number of prenatal care visits IRR P>|z| IRR P>|z|
Insurance status: Insured = 1 1.400 *** 0.000 1.243 *** 0.000
Demographics
Age 1.022 0.334 1.022 0.338
Age2
1.000 0.312 1.000 0.320
Household size 0.990 0.388 0.978 ** 0.050
Urban 0.946 0.395 0.909 0.152
Income Quartiles
2nd Income quartile 0.929 0.271 0.904 0.133
3rd Income quartile 0.946 0.503 0.964 0.657
4th Income quartile 1.033 0.767 1.003 0.981
Relation to Household Head
Spouse 1.098 0.109 1.108 * 0.080
Child 1.039 0.730 1.043 0.708
Grandchild 0.811 0.338 0.812 0.343
Marital Status
Married 0.893 ** 0.030 0.918 0.103
Single 1.113 0.489 1.080 0.621
Regional Dummies
Western 0.760 *** 0.009 0.761 *** 0.010
Central 0.968 0.749 0.875 0.217
Volta 0.750 ** 0.011 0.914 0.395
Eastern 0.591 *** 0.000 0.751 *** 0.010
Ashanti 0.840 ** 0.034 0.944 0.467
Brong-Ahafo 0.647 *** 0.000 0.813 ** 0.020
Northern 0.767 *** 0.001 0.895 0.148
Upper East 0.841 * 0.073 0.855 0.105
Greater Accra 1.018 0.873 1.076 0.506
Occupation
Trading 1.059 0.497 1.054 0.541
Agriculture 0.985 0.849 0.962 0.625
Construction 1.024 0.878 0.932 0.648
Education
No Education 0.783 *** 0.001 0.811 *** 0.007
Primary Education 0.792 * 0.083 0.849 0.228
Secondary Education 0.959 0.588 0.996 0.956
Constant 5.859 *** 0.000 5.693 *** 0.000
/lnalpha = -1.9021 /lnalpha = -1.8624
alpha = 0.1493 alpha = 0.1553
Likelihood-ratio test of alpha = 0: chibar2 (01) = 390.97 ; Prob>= chibar2 = 0.000
Insurance Status Intent to Treat
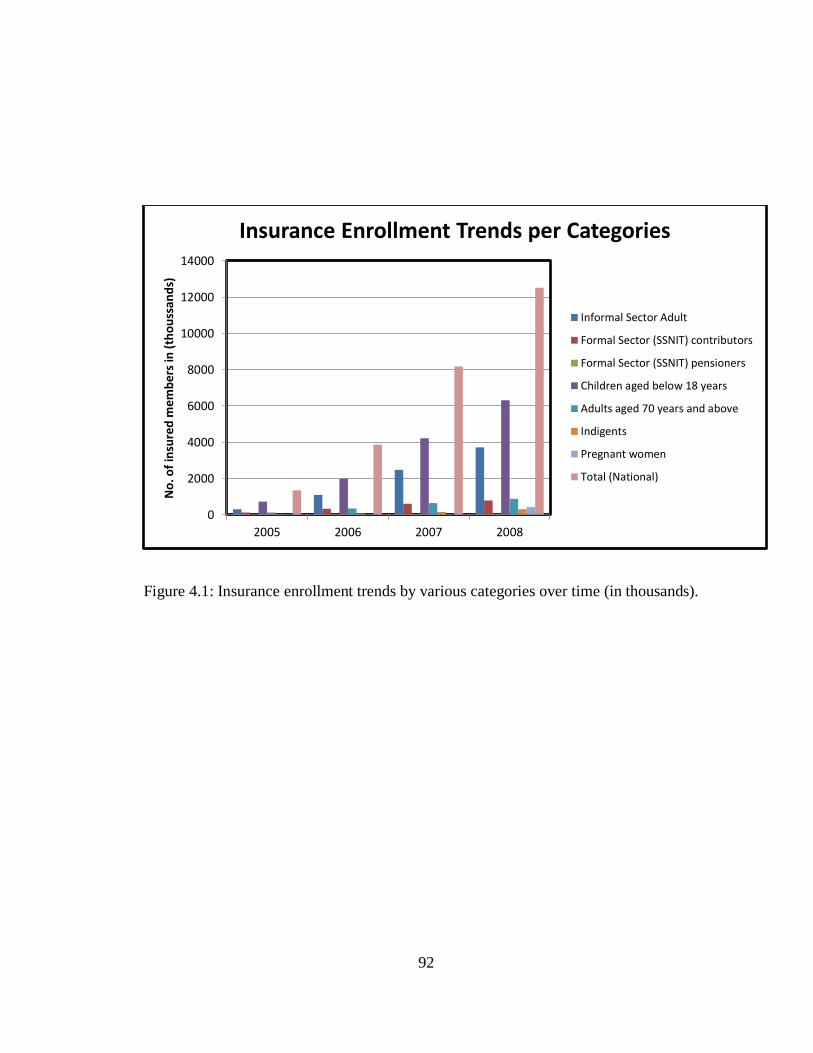
92
Figure 4.1: Insurance enrollment trends by various categories over time (in thousands).
0
2000
4000
6000
8000
10000
12000
14000
2005 2006 2007 2008
No
. of
insu
red
mem
ber
s in
(th
ou
ssa
nd
s)
Insurance Enrollment Trends per Categories
Informal Sector Adult
Formal Sector (SSNIT) contributors
Formal Sector (SSNIT) pensioners
Children aged below 18 years
Adults aged 70 years and above
Indigents
Pregnant women
Total (National)
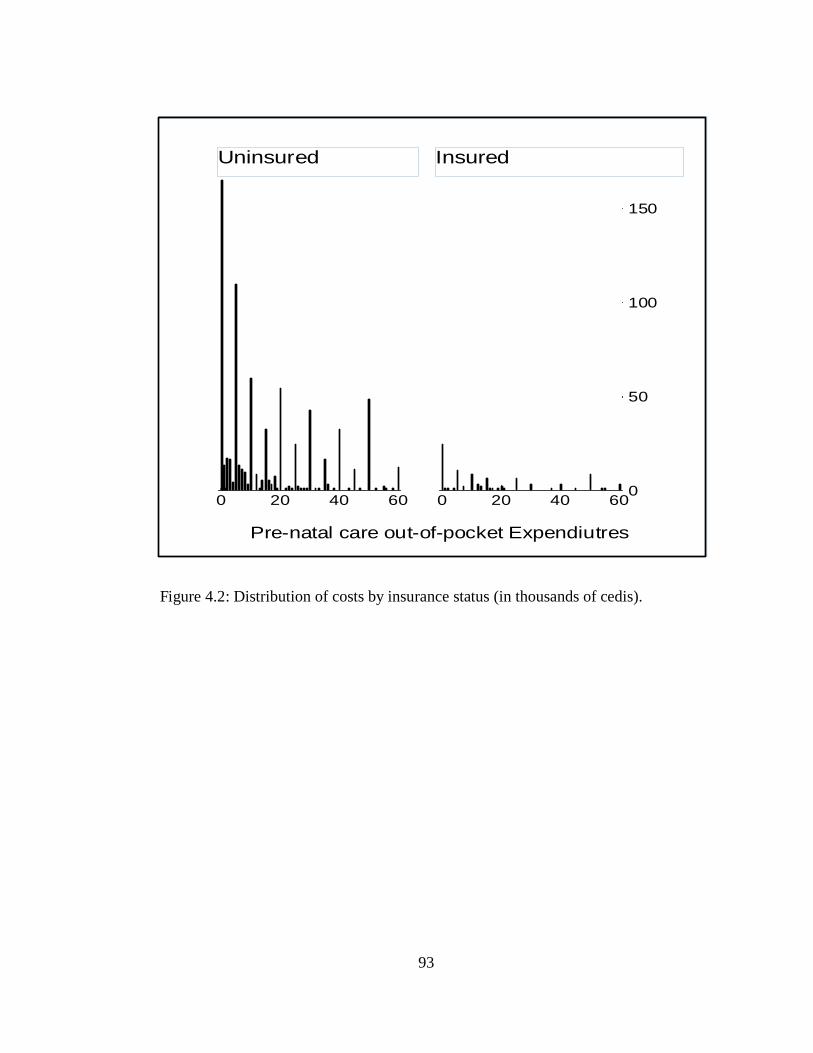
93
Figure 4.2: Distribution of costs by insurance status (in thousands of cedis).
0
50
100
150
0 20 40 60 0 20 40 60
Uninsured Insured
Fre
que
ncy
Pre-natal care out-of-pocket Expendiutres
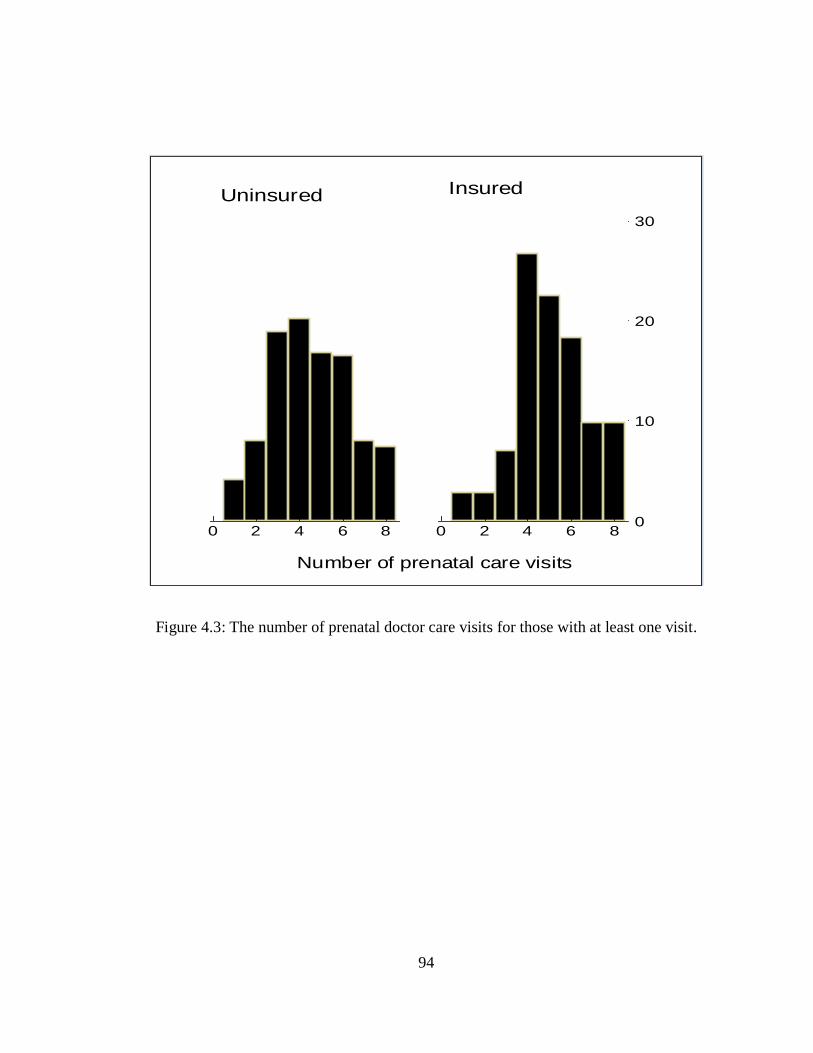
94
Figure 4.3: The number of prenatal doctor care visits for those with at least one visit.
0
10
20
30
0 2 4 6 8 0 2 4 6 8
Uninsured Insured
Per
cent
Number of prenatal care visits
95
CHAPTER 5
CONCLUSION, POLICY IMPLICATIONS, AND FUTURE RESEARCH
Most health care systems in developing countries have been faced with the
problems of high cost to patients and inequitable access. Households in these countries
can be forced to make huge unexpected out-of-pocket expenditures for emergency care,
which results in financial strain. As a result of this concern and to improve health
outcomes, over the past twenty years many developing countries, including Ghana,
Peru, Colombia have pursued some health insurance options. Most of these insurance
plans have been social health insurance programs aimed at making health care services
more affordable through the use of public subsidies.
The dissertation is a collection of three essays looking at how individual health
care choices changed as a result of the availability of insurance coverage in Ghana. The
first essay evaluates health care choices and out-of-pocket expenditures after the
introduction of Ghana‟s social health insurance program covering only modern health
care services. When ill, an individual decides between a set of alternatives; no care,
alternative medical care, modern care and both alternative and modern care. My results
show that when health insurance becomes available, individuals take advantage of the
insurance by either switching to modern medicine or complementing the use of
alternative care with modern care. Finally, I find that out-of-pocket health expenditures
decrease significantly across all the different types of care sought as a result of health
insurance. Overall, my results show mixed evidence of both substitution and
complementarity across the different health care choices. Even though theory predicts
96
the substitution result, the complementarity result is rather interesting and suggest that
alternative11
(i.e., traditional) medicine still plays a crucial role in the health of millions
in developing countries.
Despite the positive impact of western medicine in Africa, it has not been able to
integrate fully into the culture and society of these countries and traditional practitioners
continue to be a vital part of the health care system. The complementarity result is likely
due to the fact that most of the alternative sources of care (for example traditional
healer, spiritualists) are more easily accessible and more affordable. Most of the modern
care facilities (for example hospitals) are located in the larger towns and require some
traveling time to access them. Also, hospitals may require appointments schedule well
in advance or have longer waiting time compared to visiting a traditional healer.
One of the main challenges of social health insurance schemes is financing these
highly subsidized programs. The program in Ghana, with no co-payments and very low
premiums makes it a primarily tax-funded social health insurance system. According to
Ghana Health Service (2007), approximately 76 percent of the National Health
Insurance Fund revenue came from value added tax (V.A.T), 24 percent came from
Social Security and National Insurance Trust (SNNIT) contributions of formal sector
workers, and only 0.01 percent came from premiums received from people in the
informal sector in the year 2006. With the informal sector forming a higher proportion
of the population and with some individuals being in the premium exempt category, it
makes the financial sustainability of the program in the near future questionable.
11
Alternative medicine here broadly refers to non-western medicine and comprises of traditional healers,
herbalists, chemical sellers and pharmacists.
97
As my result shows, insured households benefit from the significant drop in out-
of-pocket spending for care and are more likely to seek modern care once insured. With
the increasing pressure on the existing health facilities, the supply of modern health care
may not be able to keep pace with expanding demand resulting from health insurance
coverage. This is likely to lead to the continued reliance on traditional medicine.
The introduction of social health insurance programs in a number of developing
countries is in part a response to two of the millennium development goals, namely
reducing infant mortality and improving maternal health outcomes. By making modern
health care more accessible and affordable, policy makers hope that more women will
seek prenatal care and thereby improve health outcomes. The second and third essays
look at how the insurance program affected fertility and prenatal care decisions,
respectively. The second essay studies whether the availability of social health
insurance affects the fertility decisions of women and examines whether the effect is
due to women likely to become pregnant seeking out insurance (adverse selection
effect) or women changing fertility decisions because they have insurance (moral
hazard effect).
To disentangle the effects of adverse selection from moral hazard, I exploit an
exogenous event, the district-level variation in the dates of implementation of the
national health insurance, to instrument for insurance enrollment. I first run a standard
probit regression of insurance status on fertility decisions of women, controlling for
demographic, household, and community characteristics without controlling for
endogeneity. The result from this estimation shows that the relationship between
98
insurance and fertility could be either the result of adverse selection or moral hazard or
both. I then run an iv-probit estimation to account for the endogeneity problem.
My results suggest fertility actually did increase as a response to insurance.
While some women who expected to become pregnant did enroll in the insurance
program, the insurance also seems to have encouraged women to have more children, at
least in the short run, likely by reducing the cost and risk of childbirth.
The third essay examines the effect of insurance on prenatal health care choices.
First, I look at the role of social health insurance on prenatal care utilization and
expenditure using a two-part model. Finally I evaluate the impact of social health
insurance on the number of prenatal care visits. Sub-Saharan Africa accounts for
approximately half of global maternal deaths (WHO, 2007). As a result of this alarming
statistic, a prenatal care model was developed by the World Health Organization
(WHO) and recommends a minimum of four medical care visits with detailed
instructions on the basic components of care for the four visits (WHO, 2001). Most
developing countries have often failed in the past to meet these standards due to lack of
human resources, equipment and supplies (Zanconato, Msolomba, Guarentil, and
Franchi, 2006).
A number of developing countries including Colombia, Ghana, Namibia, and
Peru have recently introduced social health insurance programs in part to help improve
primary health care and help attain WHO‟s prenatal care visit recommendations. My
estimation results show that health insurance increases the propensity of pregnant
women to seek prenatal care relative to the uninsured. I use a proxy variable for
insurance status, called „intent to treat‟, which is defined as whether a respondent is in a
99
district which had the national health insurance scheme already in operation at the time
when he is surveyed. Using this variable enables me to avoid the problem of
endogeneity of actual insurance status since it is an exogenous event similar to a natural
experiment.
The results also show that insured pregnant women are more likely to seek and
hence to spend at least 1 cedi on prenatal care, but conditional on any spending they
actually do spend less out of pocket compared to the uninsured pregnant women. As a
robustness check to the second research question, I added an interaction term between
insurance status and urban residency status. People in this urban insured group are more
likely to have insurance compared to others. However, even with the inclusion of this
variable, insurance still has a significant effect on prenatal care choices.
Furthermore, the interaction term, insured pregnant women living in urban
areas, were more likely to seek and hence spend at least 1 cedi on prenatal care.
However conditional on spending any amount, they did not differ significantly from
other pregnant women on the magnitude of out-of-pocket spending. Finally, I find that
insurance increases the odds of having more prenatal care visits compared to not having
insurance.
One goal of the World Health Organization is to increase the number of
pregnant women who seek prenatal care services. Their new model recommends
pregnant women to have a minimum of four medical care visits during pregnancy. This
paper shows that the Social Health Insurance program in Ghana is helping the country
reach this goal. Such insurance programs result in more women seeking prenatal care at
more affordable prices compared to being uninsured.
100
There are some knowledge gaps in this area of research that needs to be further
exploited. For example, this dissertation focused on the effect of insurance on health
care choices and spending, but more detailed data is needed to demonstrate the effect of
insurance on health outcomes. Other potential areas of research include the
distributional impact of health insurance, and the impact of health insurance on
household consumption smoothing patterns.
101
REFERENCES
Acton J., (1975). “Nonmonetary factors in the demand for medical services: some
empirical evidence”. Journal of Political Economy 1975; 83: 595–614.
Aguilar-Rivera, A., Carrin, G., Evans, D., Evans, T., Musgrove, P., Xu, K., (2007).
“Protecting households from catastrophic health spending.” Health Affairs,
2007,26:972-983. doi:10.1377/hlthaff.26.4.972 PMID:17630440.
Akerlof, G., (1970). “The Market for Lemons: Quality Uncertainty and the Market
Mechanism.” Quarterly Journal Economics, 84(3): 488–500.
Arrow, K., (1963). “Uncertainty and the Welfare Economics of Medical Care.”
American Economic Review, 53(5): 941–973.
Asenso-Boadi, F., (2009). “Ghana‟s National Health Insurance System: Design,
Implementation Perspectives.” Presentation on behalf the CEO of NHIA, at the
African Health Economics and Policy Association Conference, 10th
March,
Accra.
Barnes, M., Bloom, B., Nahin, R., (2008). “Complementary and Alternative Medicine
Use Among Adults and Children”: United States, 2007. National Health
Statistics Reports (12) December 2008.
Bass, M., Noelker S., (1989). The influence of family caregivers on elder's use of in-
home services: and expanded conceptual framework. Journal of Health and
Social Behavior 28, 184-196.
Blandford, A., Chappell, N., (1991). “Informal and Formal Care: Exploring the
Complementarity.” Journal of Ageing & Society, Volume 11, Issue 03,
September 1991, pp 299-317.
Blundell, R., Smith, R., (1989). “Estimation in a Class of Simulataneous Equation
Limited dependent Variable Models.” Review of Economic Studies, 56, 37-58.
102
Cameron, A., Trivedi, P., (2007). “Essentials of Count Data Regression, in A
Companion to Theoretical Econometrics” (ed B. H. Baltagi), Blackwell
Publishing Ltd, Malden, MA, USA. doi: 10.1002/9780470996249.ch16
Carlson, S., (1999). “Equality of Access in Health Care” Department of Economics,
Lund University, Sweden,
Corman, H., Grossman, M., (1985). “Determinants of Neonatal Mortality Rates in the
U.S.” Journal of Health Economics 4: 213-236.
Cutler, M., Zeckhauser, R., (2000): “The Anatomy of Health Insurance.” In Handbook
of Health Economics, Vol. 1a.
Deb, P., Manning, W., Norton, E., (2011). Modeling health care costs and counts
ASHEcon – Minneapolis Conference, 2012
Denton, M., (1997). “The linkages between informal and formal care in the elderly.”
Canadian Journal on Aging 16, 30-50.
Duan, N., Manning, W., Morris, N., and Newhouse, P., (1982). “A comparison of
alternative models for the Demand for Medical care.” Journal of Business &
Economic Statistics, 1(2), 115–126.
Duan, N., (1983). “Smearing Estimate: A Nonparametric Retransformation method.”
Journal of the American Statistical Association, Vol. 78, (September, 1983), pp.
605-610.
Duan, N., Keeler, E., Leibowitz, A., Manning, W., Newhouse, J., (1987). “Health
insurance and demand for medical care: Evidence from a randomized
experiment.” The American Economic Review, Vol. 77, (Jun., 1987), pp. 251-
277
Edelman, P., Hughes, S., (1990). “The impact of community care on provision of
informal care to homebound elderly persons”. Journal of Gerontology 45, 74-
84.
103
Eggleston, K., (2000). “Risk Selection and Optimal Health Insurance-Provider Payment
Systems.” The Journal of Risk and Insurance: 173-186.
Eisenberg, M., Davis, R., Ettner, S., Appel, S., Wilkey, S., Van-Rompay, M.,
Kessler, R., (1998). “Trends in Alternative Medicine Use in the United States,
1990-1997: Results of a Follow-up National Survey”. Journal of the American
Medical Association 280 (18):1569-1575.
Farbmacher, H., (2012). “Extensions of hurdle models for overdispersed count data”.
Health Economics. Vol 22 (7)
Frempong, G., (2009). “An Evaluation of the National Health Insurance Program in
Ghana.” The Global Development Network (GDN), Pretoria, South Africa.
Ghana Health Service (2009). “Evaluation of the Ghana National Health Insurance
Scheme.” Bethesda, MD: Health Systems 20/20 Project and Abt Associates Inc.
Ghana Health Service, (2009). “Annual Report 2009.” Accra: Ghana Health Service
Ghana, Republic of. (2004). “National Health Insurance Regulations”, 2004 (L.I.1809).
Accra.
Ghana Statistical Service (2011). Annual Report 2011. Accra: Ghana Statistical Service.
Greene W.H. (2008). Econometric analysis (6th international edition). Pearson
Education, New Jersey (US).
Greene, V., (1983). Substitution between formally and informally provided care for the
impaired elderly in the community. Medical Care 21, 609-619.
Grossman, M., (1972). “The demand for health: A theoretical and empirical
investigation.” NBER Occasional Paper 119, New York.
104
Grossman, M., Jacobowitz, S., (1981). “Variations in Infant Mortality rates among
Counties of the United States: The Role of Public Policies and Programs.”
Demography 18: 695-713.
Gruber, J., Levitt, L., (2000). “Tax Subsidies for Health Insurance: Costs and Benefits”
Health Affairs, 19(1), January/February 2000, p. 72-85.
Hanratty, M., (1996): “Canadian National Health Insurance and Infant Health.” The
American Economic Review, Vol. 86, No. 1 (Mar., 1996), pp. 276-284
Hay, W., Olsen, J., (1984). “Let them eat cake: A note comparing alternative models of
the demand for medical care.” Journal of Business & Economic Statistics, 2(3),
279–282.
Jiménez-Martín, S., Prieto, C., (2008). “Trade-off between formal and informal care in
Spain” European Journal of Health Economics.
Jowett, M., Deolalikar, A., Martinsson, P., (2004). “Health insurance and treatment
seeking behavior: evidence from a low-income country,” Health Economics, John
Wiley & Sons, Ltd., vol. 13(9), pages 845-857.
Lammers, J., Warmerdam, S., (2010). “Adverse selection in voluntary micro health
insurance in Nigeria.” Amsterdam Institute for International Development
Research series 10-06
Long, Q., Zhang, T., Hemminki, I., Tang, X., Huang, K., Tolhurst, R., (2010).
“Utilisation, contents and costs of prenatal care under a rural health insurance
(New Co-operative Medical System) in rural China: lessons from
implementation.” BMC Health Services Research 2010, 10:301
Ma, C., Riordan, M., (2001). “Health Insurance, Moral Hazard, and Managed Care.”
Journal of Economics & Management Strategy, Volume 11, Number 1, Spring
2002, 81–107.
105
Manning, W., Zweifel, P., (2000). “Moral Hazard and Consumer incentives in Health
care.” Handbook of Health Economics, Volume 1, Edited by A.J. Culyer and J.P
Newhouse.
Mensah, J., Oppong, J., and Schmidt, C., (2010). “Ghana‟s National Health Insurance
Scheme in the Context of the Health MDGs - An empirical evaluation using
Propensity Score Matching.” Health Economics.19:95-106 (2010).
Nyman, J., (2004). “Is „Moral Hazard‟ Inefficient? The Policy Implications of a New
Theory.” Health Affairs.
Pauly, M., (1968). “The Economics of Moral Hazard.” American Economic Review,
58(3): 531–537.
Rothschild, M., Stiglitz, J., (1976). “Equilibrium in Competitive Insurance Markets: An
Essay on the Economics of Imperfect Information.” Quarterly Journal of
Economics, 90(4): 629–649.
Sabi, W., (2005). “Ghana National Health Insurance Scheme”. MA Thesis, Department
of Public Health, University of Cape Town, South Africa.”
Simkhada, B., Teijlingen, R., Porter M., Simkhada, P., (2008). “Factors affecting the
utilization of antenatal care in developing countries: systematic review of the
literature.” Journal of Advanced Nursing, 61(3):244-60.
Smith, V., Sulzbach S., (2006). “Community-based health insurance and access to
maternal health services: Evidence from three West African countries”. Social
Science and Medicine Journal 2006, 66:2460-73.
Terza, J., Basu, A., and Rathouz, P., (2008). “Two-Stage Residual Inclusion
Estimation: Addressing Endogeneity in Health Econometric Modeling,” Journal
of Health Economics 27, 531-543.
106
Trujillo, A., Portillo, J., Vernon, J., (2005). “The impact of subsidized health insurance
for the poor: Evaluating the Colombian experience using propensity score
matching.” International Journal of Health Care Finance and Economics 26
(1): 82-100.
Waters, R., Anderson, G., and Mays, J., (2004). “Measuring financial protection in
health in the United States.” Health Policy 69:3.
World Bank (2007). “Project Appraisal Document on a proposed credit to the Republic
of Ghana for a Health Insurance project.” World Bank, Washington, DC.
World Health Organization (2001). “WHO antenatal care randomized trial”- Manual for
the implementation of the new model. Geneva, Switzerland.
World Health Organization (2007). “Maternal mortality in 2005”- estimates developed
by WHO, UNICEF, UNFPA, and the World Bank, Geneva.
World Health Organization (2010). “Country Cooperation strategy: At a Glance.”
World Health Organization, Geneva.
World Health Organization (2008). “Country Cooperation strategy: At a Glance.”
World Health Organization, Geneva.
Yatchew, A., Griliches, G., (1985). “Specification error in probit models”, The Review
of Economics and Statistics 67(1), 134-139.
Yip, W., Wang, H., Hsiao, W., (2008). “The impact of rural mutual health care on
access to care: Evaluation of social experiment in rural China.” Havard school
of public health, [www.hsph.harvard.edu/phcf/publications/Yip.Wang.Hsaio]
Zanconato, G., Msolomba, R., Guarentil, L., and Franchi, M., (2006). “Antenatal care in
developing countries: the need for a tailored model.” Semin Fetal Neonatal Med
2006, 11(1):15-20.
107
APPENDIX
SUPPLEMENT TABLES TO
CHAPTER3:
THE IMPACT OF SOCIAL HEALTH INSURANCE ON HOUSEHOLD
FERTILITY DECISIONS
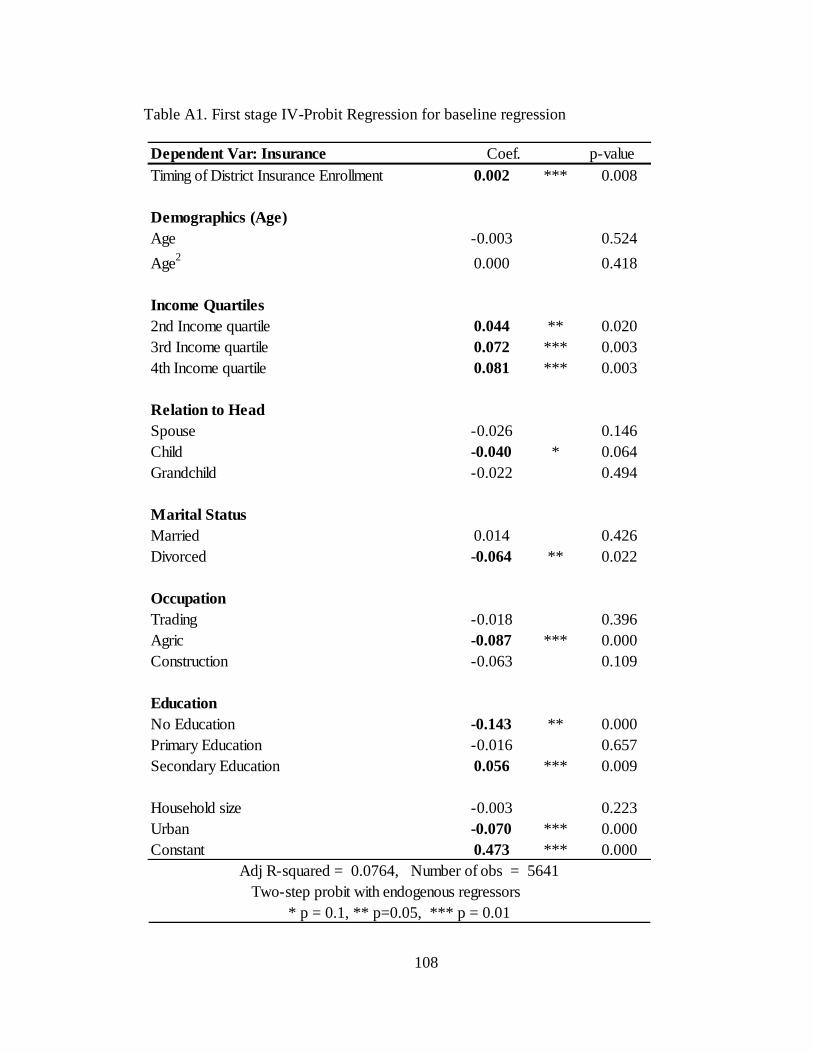
108
Table A1. First stage IV-Probit Regression for baseline regression
Dependent Var: Insurance Coef. p-value
Timing of District Insurance Enrollment 0.002 *** 0.008
Demographics (Age)
Age -0.003 0.524
Age2
0.000 0.418
Income Quartiles
2nd Income quartile 0.044 ** 0.020
3rd Income quartile 0.072 *** 0.003
4th Income quartile 0.081 *** 0.003
Relation to Head
Spouse -0.026 0.146
Child -0.040 * 0.064
Grandchild -0.022 0.494
Marital Status
Married 0.014 0.426
Divorced -0.064 ** 0.022
Occupation
Trading -0.018 0.396
Agric -0.087 *** 0.000
Construction -0.063 0.109
Education
No Education -0.143 ** 0.000
Primary Education -0.016 0.657
Secondary Education 0.056 *** 0.009
Household size -0.003 0.223
Urban -0.070 *** 0.000
Constant 0.473 *** 0.000
Adj R-squared = 0.0764, Number of obs = 5641
Two-step probit with endogenous regressors
* p = 0.1, ** p=0.05, *** p = 0.01
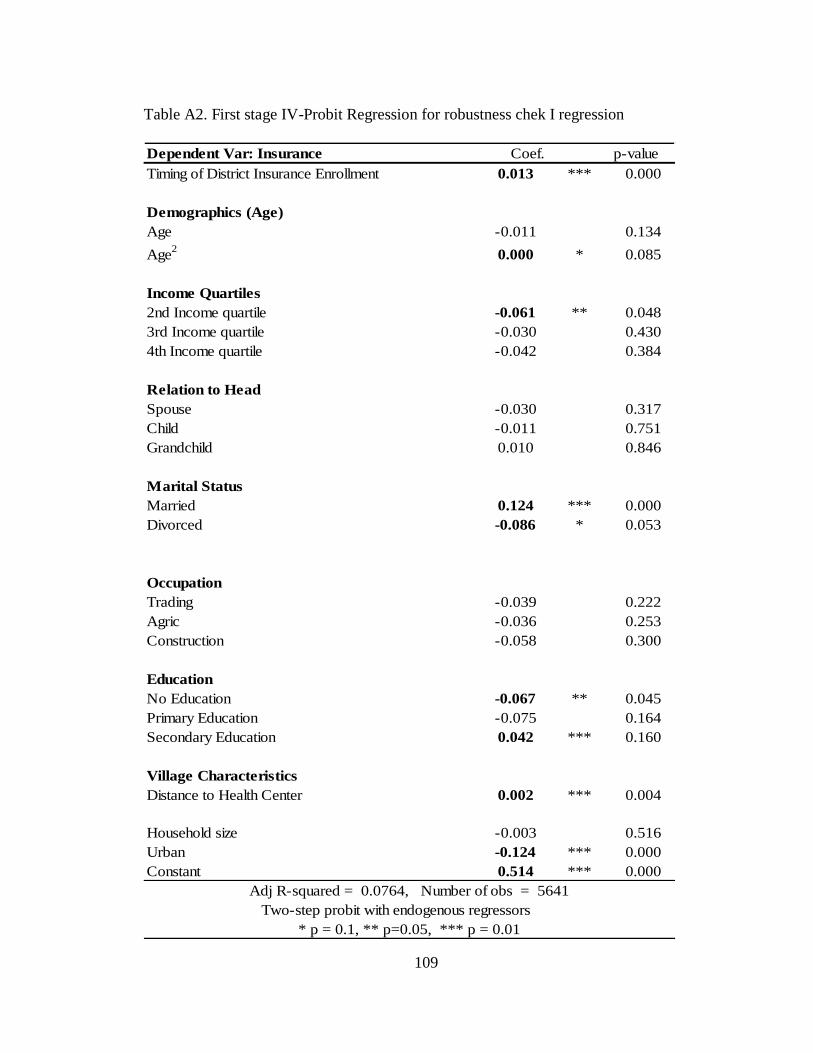
109
Table A2. First stage IV-Probit Regression for robustness chek I regression
Dependent Var: Insurance Coef. p-value
Timing of District Insurance Enrollment 0.013 *** 0.000
Demographics (Age)
Age -0.011 0.134
Age2
0.000 * 0.085
Income Quartiles
2nd Income quartile -0.061 ** 0.048
3rd Income quartile -0.030 0.430
4th Income quartile -0.042 0.384
Relation to Head
Spouse -0.030 0.317
Child -0.011 0.751
Grandchild 0.010 0.846
Marital Status
Married 0.124 *** 0.000
Divorced -0.086 * 0.053
Occupation
Trading -0.039 0.222
Agric -0.036 0.253
Construction -0.058 0.300
Education
No Education -0.067 ** 0.045
Primary Education -0.075 0.164
Secondary Education 0.042 *** 0.160
Village Characteristics
Distance to Health Center 0.002 *** 0.004
Household size -0.003 0.516
Urban -0.124 *** 0.000
Constant 0.514 *** 0.000
Adj R-squared = 0.0764, Number of obs = 5641
Two-step probit with endogenous regressors
* p = 0.1, ** p=0.05, *** p = 0.01
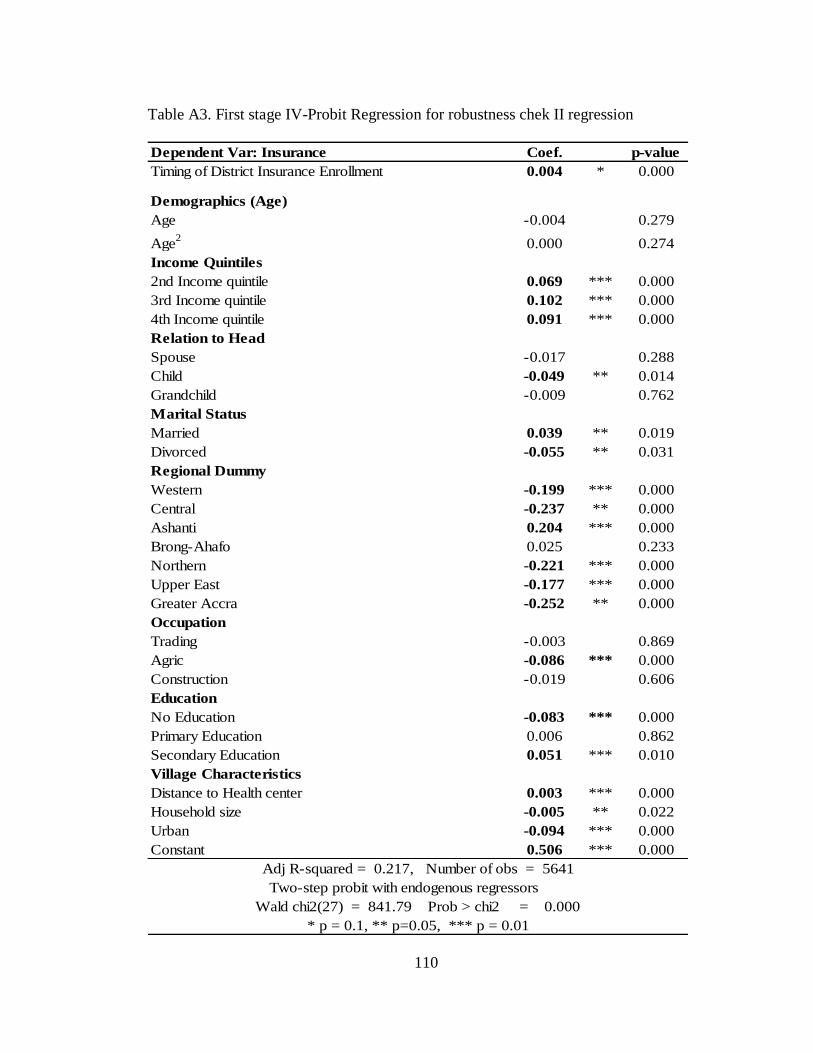
110
Table A3. First stage IV-Probit Regression for robustness chek II regression
Dependent Var: Insurance Coef. p-value
Timing of District Insurance Enrollment 0.004 * 0.000
Demographics (Age)
Age -0.004 0.279
Age2
0.000 0.274
Income Quintiles
2nd Income quintile 0.069 *** 0.000
3rd Income quintile 0.102 *** 0.000
4th Income quintile 0.091 *** 0.000
Relation to Head
Spouse -0.017 0.288
Child -0.049 ** 0.014
Grandchild -0.009 0.762
Marital Status
Married 0.039 ** 0.019
Divorced -0.055 ** 0.031
Regional Dummy
Western -0.199 *** 0.000
Central -0.237 ** 0.000
Ashanti 0.204 *** 0.000
Brong-Ahafo 0.025 0.233
Northern -0.221 *** 0.000
Upper East -0.177 *** 0.000
Greater Accra -0.252 ** 0.000
Occupation
Trading -0.003 0.869
Agric -0.086 *** 0.000
Construction -0.019 0.606
Education
No Education -0.083 *** 0.000
Primary Education 0.006 0.862
Secondary Education 0.051 *** 0.010
Village Characteristics
Distance to Health center 0.003 *** 0.000
Household size -0.005 ** 0.022
Urban -0.094 *** 0.000
Constant 0.506 *** 0.000
Adj R-squared = 0.217, Number of obs = 5641
Two-step probit with endogenous regressors
Wald chi2(27) = 841.79 Prob > chi2 = 0.000
* p = 0.1, ** p=0.05, *** p = 0.01