Embed Size (px)
Citation preview
Geophys. J. Int. (2005) 161, 283–294 doi: 10.1111/j.1365-246X.2005.02508.x
GJI
Sei
smol
ogy
Three-dimensional structure of the African superplumefrom waveform modelling
Sidao Ni,1,2 Don V. Helmberger2 and Jeroen Tromp2
1School of Earth and Space Sciences, University of Science and Technology of China 96 Jinzhai Road, Hefei, Anhui, 230026, China2Seismological Laboratory 252-21, California Institute of Technology, Pasadena, CA 91125
Accepted 2004 October 15. Received 2004 September 27; in original form 2004 February 25
S U M M A R YPrevious 2-D modelling of seismic waveforms and traveltimes has revealed a large-scaleridge-like velocity anomaly beneath Africa, which is usually referred to as the African su-perplume. The structure starts from the southern Indian Ocean and extends northwestwardsinto the Atlantic Ocean, with its base on the core–mantle boundary. The structure has rela-tively sharp lateral boundaries with the shear velocity inside 3 per cent lower than the am-bient mantle, while the compressional velocity is almost normal. The 3-D structure is bestillustrated by seismic waveforms recorded by the South Africa Array generated by earth-quakes in the western Pacific Ocean. The diffracted S phase travels along the axis of thestructure for over 60◦, with the northern- and southernmost paths sampling its edges. TheS waveforms are simple but delayed by up to 20 s for paths sampling the middle of thestructure, whereas they display two arrivals for paths along the boundaries. These complexwaveforms can be explained by 3-D multipathing due to rapid lateral variations in shear-wavevelocity along the edges of the structure. These sharp features are confirmed by modellingbroadband records associated with the proposed ridge structure with two independent meth-ods: the spectral element method and a ray-based 3-D code (DWKM).
Key words: DWKM, low-velocity zone, lower mantle, superplume.
I N T RO D U C T I O N
In the upper mantle there is clear evidence for sharp lateral vari-ations in velocity associated with subduction zones (Zhao et al.1994; Widiyantoro et al. 1999). As for the lower mantle, varioustomographic models have revealed large-scale 3-D structures (Suet al. 1994; Masters et al. 1996; Ritsema et al. 1999), but the resolu-tion of these models, typically a few thousand kilometres, is not highenough to resolve sharp lateral variations. Studies based on rapidvariations in traveltimes and anomalous seismic waveforms indicatethe existence of small-scale lateral variations near the core–mantleboundary (CMB) (Garnero & Helmberger 1998; Russell et al. 1999;Wen & Helmberger 1998; Wysession et al. 2001; Luo et al. 2001; Ni& Helmberger 2001; Tkalcic & Romanowicz 2002). The sharpnessof large-scale lower mantle structures has been addressed by stud-ies of the African superplume (Ritsema et al. 1998; Ni et al. 2002;Ni & Helmberger 2003a,b), which we will refer to as the Africanlow-velocity structure (ALVS). The ALVS has a ridge-like structurewith dimensions of approximately 7000 km long, 1000 km high and1200 km across (Fig. 1). The shear velocity in the ALVS is re-duced relative to PREM (Dziewonski & Anderson 1981) by about3 per cent, whereas the compressional velocity is quite normal (i.e.PREM-like). The edges of the structure are very sharp in someplaces, with a width of less than 50 km. This model of the ALVSexplains the rapid variations of S, SKS, Sdiff and ScS traveltimes, as
well as the complexity of SKS waveforms caused by multipathingeffects due to the sharp boundaries.
Waveform modelling has been restricted to paths roughly per-pendicular to the strike of the ALVS, thus justifying 2-D simula-tions in cross-sections. For along-strike paths, e.g. for earthquakesin the western Pacific Ocean recorded by the South Africa Array,3-D effects are expected to be significant. Fortunately, advances incomputational and theoretical seismology have facilitated fully 3-Dwaveform modelling (Komatitsch et al. 2002). Additionally, ray-based techniques involving a combination of analytical approxima-tions (DWKM) lead to much faster but less accurate 3-D algorithms(Helmberger & Ni 2005). Such approximate algorithms provide in-tuition about how seismic waveforms behave for different structures,and the added speed makes it possible to investigate a wide varietyof structures before performing a more costly spectral-element cal-culation. In this paper we use both the spectral element method(SEM) and the hybrid DWKM algorithm to compute 3-D syn-thetic seismograms for the ALVS, which we compare with observedS waveforms.
DATA A N D A N A LY S I S
The density of seismic stations in Africa used to be quite low,with about five WWSSN stations. Nevertheless, even with analoguerecords from these few WWSSN stations, Ni et al. (1999) were
C© 2005 RAS 283

284 S. Ni, D. V. Helmberger and J. Tromp
able to detect a large-scale low-velocity structure beneath Africa byanalysing the change in SKS–S crossover distances along variousprofiles. Ni et al. (1999) also found basal layer with a 3 per centreduction in S velocity beneath the Atlantic Ocean. More recently,IRIS and GEOFON installed several broadband seismic stationswhich were used to determine the slope and height of the ALVSbased upon modelling waveforms of SKS, ScS and S, taking ad-
-40 -20 0 20 40 60 80 100
-60-40
-200
2040
-60-40
-200
2040
-60-40
-200
2040
2890km
2350km
1900km
1300km
750km
250km
??
??
??
Figure 1. Tomographic model by Grand (2002) (left) and the African Low Velocity Structure (ALVS) (right) displaying different depth slices as indicated bythe numbers, with red colours (up to 3 per cent) representing slow anomalies and blue colours denoting fast anomalies. The ALVS starts from the mid-AtlanticOcean and ends into the western Indian Ocean, with a crescent shape extending about 1000 km above the core–mantle (CMB). The question marks denote theuncertain northwestern boundary.
vantage of the abundance of earthquakes in South America (Ni &Helmberger 2003a). However, more detailed studies are only feasi-ble with dense broadband seismic arrays. S, SKS and ScS traveltimesmeasured at the Tanzania Array (about a dozen stations) were usedto map a 2-D cross-section of the ALVS, which appears to be 1000–1200 km high, with a 3–4 per cent reduction in S velocity. The edgeof this structure was estimated to be less than 300 km in width
C© 2005 RAS, GJI, 161, 283–294

Structure of the African superplume 285
330˚
330˚
0˚
0˚
30˚
30˚
60˚
60˚
90˚
90˚
120˚
120˚
150˚
150˚
180˚
180˚
-60˚ -60˚
-30˚ -30˚
0˚ 0˚971222
990206
970904
990405
Figure 2. Map view of great circle paths connecting the four events in the western Pacific (Table 1) to stations in the South African Array. Events 971222 and990405 sample the northern boundary of the ALVS, while event 990206 samples the mid-section and event 970904 samples the southern boundary.
Table 1. Earthquakes used in this study.
Event ID Time Latitude Longitude Depth(deg.) (deg.) (km)
970904 04:23:37 −26.57 178.34 624971222 02:05:50 −5.49 147.87 179990206 21:47:59 −12.85 166.70 90990405 11:08:04 −5.59 149.57 150
based upon the observed rapid changes in traveltimes (Ritsemaet al. 1998). Broadband waveform modelling of SKS yields bet-ter estimates of the sharpness, favouring a 3 per cent variation overless than 50 km (Ni et al. 2002).
The deployment of the South Africa Array (more than 50 broad-band stations) provides much stronger constraints on the ALVS.Over a thousand measured SKS, ScS and SKKS traveltimes wereused to model the ridge-like structure (Ni & Helmberger 2003b).The boundaries of this structure can be easily detected from rapidvariations in traveltimes. The northwest-to-southeast oriented struc-ture provides an ideal geometry for observing 3-D effects, sincethe great circle paths connecting earthquakes in the western PacificOcean to the South Africa Array are almost parallel to the strikeof the ALVS (Fig. 2). We chose four earthquakes with a magnitudeof about 7.0 and a depth greater than 100 km (Table 1) to ensurehigh-quality Sdiff waveforms and to avoid complications due to theearthquake source and surface reflections.
We used Harvard Centroid Moment Tensor (CMT) solutions forthe locations and source mechanisms of the four earthquakes. TheBHN and BHE channels of the broadband seismic records were ro-tated to the great circle path and deconvolved with the instrumentresponse to obtain ground displacement. We only modelled the tan-gential component of S since signals on the radial component areweak. In Fig. 3 the S waveforms are displayed in two different ways:in the top panel the waveforms are organized by increasing epicen-tral distance using a reduced traveltime, i.e. each trace is alignedon the predicted S arrival time for PREM (Dziewonski & Anderson1981); in the lower panel the seismograms are organized by increas-ing azimuth, again with each seismogram aligned on the theoretical Sarrival time predicted by PREM. For the seismograms organized byepicentral distance in the top panel the traces seem quite complex forsome epicentral distance ranges, e.g. for event 971222 between dis-
tances of 115◦ and 117◦, for event 990206 between distances of 123◦
and 126◦, and for event 970904 between distances of 121◦ and 125◦.The apparent misalignment suggests that, at the same distance, sta-tions show variable delay times for slightly different azimuths. Seis-mograms organized azimuthally in the bottom panel indeed showmuch higher coherence, confirming that the delay in traveltime de-pends more on azimuth than epicentral distance. Note that in explo-ration seismology it is common to look for vertical structures (e.g.salt domes) by conducting ‘fan shots’. Similarly, the South AfricaArray data displayed above are more strongly controlled by verticalthan horizontal structure, a rather unexpected result for the deepmantle.
There are other consistent features among the three events(971222, 990206 and 970904) which have epicentres located in anorth-to-south trend in the western Pacific Ocean. For event 971222,the northern stations (at larger azimuths) in the South Africa Arrayshow early yet complicated waveforms, whereas the southern sta-tions exhibit late but simple waveforms (delayed by up to 12 s). Itseems that the secondary arrivals for the northern stations are ofthe same origin as the single arrivals for the southern stations (indi-cated by the thick line), thus suggesting multipathing. The waveformcomplexity for the northern stations may be caused by the interfer-ence of two arrivals: one is early, propagating in the normal mantle,and the other is late, propagating in the low-velocity ALVS. Sinceeach arrival carries part of the energy, the amplitude of the com-plicated seismograms is expected to be smaller, as observed for thenorthern stations. For event 970206, the traces are delayed by asmuch as 16 s, with the southern stations showing some waveformbroadening. For event 970904, the pattern is reversed as comparedwith event 971222, with the southern stations showing small delaysand the northern stations showing large delays of up to 16 s, andcomplicated waveforms (at azimuths from 211◦ to 216◦). Again, thecomplexity in waveforms seems to be caused by the interference oftwo arrivals, indicated by the two thick lines, indicative of multi-pathing. For this event it is quite clear that the first arrivals denotedby the first thick line diminish in amplitude for larger azimuths (from214◦ to 216◦), which is typical of diffraction effects (Helmberger &Ni 2005; Ni et al. 2002).
The complexity in waveforms is probably not caused by com-plicated sources such as double events, which could produce az-imuthal variations of traveltimes and waveforms. One reason is that
C© 2005 RAS, GJI, 161, 283–294

286 S. Ni, D. V. Helmberger and J. Tromp
229
230
231
232
233
234
235
236
237
238
239
240
241
242
243
244
245
246
247
248
249
Azi
mut
h (d
egre
e)
-10 0 10 20 30 40 50 60
Time (sec)
213
214
215
216
217
218
219
220
221
222
223
224
225
226
227
228
229
230
231
232
233
-10 0 10 20 30 40 50 60
Time (sec)
199
200
201
202
203
204
205
206
207
208
209
210
211
212
213
214
215
216
217
218
219
-10 0 10 20 30 40 50 60
Time (sec)
112
113
114
115
116
117
118
119
Dis
tanc
e (d
egre
e)
-10 0 10 20 30 40 50 60
971222
122
123
124
125
126
127
128-10 0 10 20 30 40 50 60
990206116
117
118
119
120
121
122
123
124
125
126
-10 0 10 20 30 40 50 60
970904
Figure 3. Observed Sdiff waveforms organized by epicentral distance (top) and azimuth (bottom) for the three events (971222, 990206, 970904). Tracesof seismograms cross each other when they are organized by distances whereas they appear to be more coherent when organized in azimuth. The thick linesindicate the postulated double arrivals caused by the sharp boundaries of the ALVS.
C© 2005 RAS, GJI, 161, 283–294

Structure of the African superplume 287
224225226227228229230231232233234235236237238239240241242243244245246247248249250
Aziu
mth
(d
eg
ree
)
213214215216217218219220221222223224225226227228229230231232233
199200201202203204205206207208209210211212213214215216217218219
224225226227228229230231232233234235236237238239240241242243244245246247248249250
Azim
uth
(d
eg
ree
)
-10 0 10 20 30 40 50 60 70 80
Time (sec) Time (sec) Time (sec)
971222
Synthetic
Data990206 970904
213214215216217218219220221222223224225226227228229230231232233
-20-10 0 10 20 30 40 50 60 70 80199200201202203204205206207208209210211212213214215216217218219
-20 -10 0 10 20 30 40 50 60 70 80
Figure 4. Comparison of low-pass filtered observed Sdiff waveforms and SEM synthetics. Both data and synthetics are low-pass filtered at 15 s. The syntheticsreproduce the observed azimuthal dependence in the traveltimes: for event 971222 the northern stations show early arrivals whereas the southern stations havearrivals that are delayed up to 12 s; for event 990206 most of the arrivals are delayed more than 12 s, and for event 970904 the northern arrivals are delayed whilethe southern ones are early. The second negative arrival occurring for event 990206 is the sS phase, which apparently arrives too late in the SEM synthetics,indicating some depth discrepancy in the CMT solution or that S velocities beneath the source and the surface are too slow.
C© 2005 RAS, GJI, 161, 283–294

288 S. Ni, D. V. Helmberger and J. Tromp
224225226227228229230231232233234235236237238239240241242243244245
213214215216217218219220221222223224225226227228229
199200201202203204205206207208209210211212213214215
224225226227228229230231232233234235236237238239240241242243244245246247248249250
-10 0 10 20 30 40 50 60 70 80
Time (sec) Time (sec) Time (sec)
Synthetic
213214215216217218219220221222223224225226227228229230231232233
-20-10 0 10 20 30 40 50 60 70 80199200201202203204205206207208209210211212213214215216217218219
-20 -10 0 10 20 30 40 50 60 70 80
229
230
231
232
233
234
235
236
237
238
239
240
241
242
243
244
245
246
247
248
249
Azi
mut
h (d
egre
e)
-10 0 10 20 30 40 50 60
971222
Data
Synthetic
213
214
215
216
217
218
219
220
221
222
223
224
225
226
227
228
229
230
231
232
233
-10 0 10 20 30 40 50 60
990206
199
200
201
202
203
204
205
206
207
208
209
210
211
212
213
214
215
216
217
218
219
-10 0 10 20 30 40 50 60
970904
229
230
231
232
233
234
235
236
237
238
239
240
241
242
243
244
245
246
247
248
249
Azi
mut
h (d
egre
e)
-10 0 10 20 30 40 50 60
Time (sec)
213
214
215
216
217
218
219
220
221
222
223
224
225
226
227
228
229
230
231
232
233
-10 0 10 20 30 40 50 60
Time (sec)
199
200
201
202
203
204
205
206
207
208
209
210
211
212
213
214
215
216
217
218
219
-10 0 10 20 30 40 50 60
Time (sec)
Figure 5. Comparison of broadband observations and hybrid 3-D synthetics (DWKM). DWKM synthetics reproduce the azimuthal variations in traveltime aswell as the broadening effects due to the sharp boundaries for certain ranges of azimuths (241–246◦ for event 971222, 211–215◦ for event 970904).
the azimuth range involved is too small, only 20◦, to cause substan-tial variations in traveltime. Moreover, the source time functions forthese events, as revealed from teleseismic records at IRIS broadbandstations in other azimuths, are fairly simple. To convince ourselves
that the complexity in waveforms is caused by structure, we investi-gated another event (990405) which is fairly close to event 971222(Fig. 2). The waveforms from event 990405 is very similar to thoseof 971222 , with the southern stations showing delays of up to 12 s
C© 2005 RAS, GJI, 161, 283–294
Structure of the African superplume 289
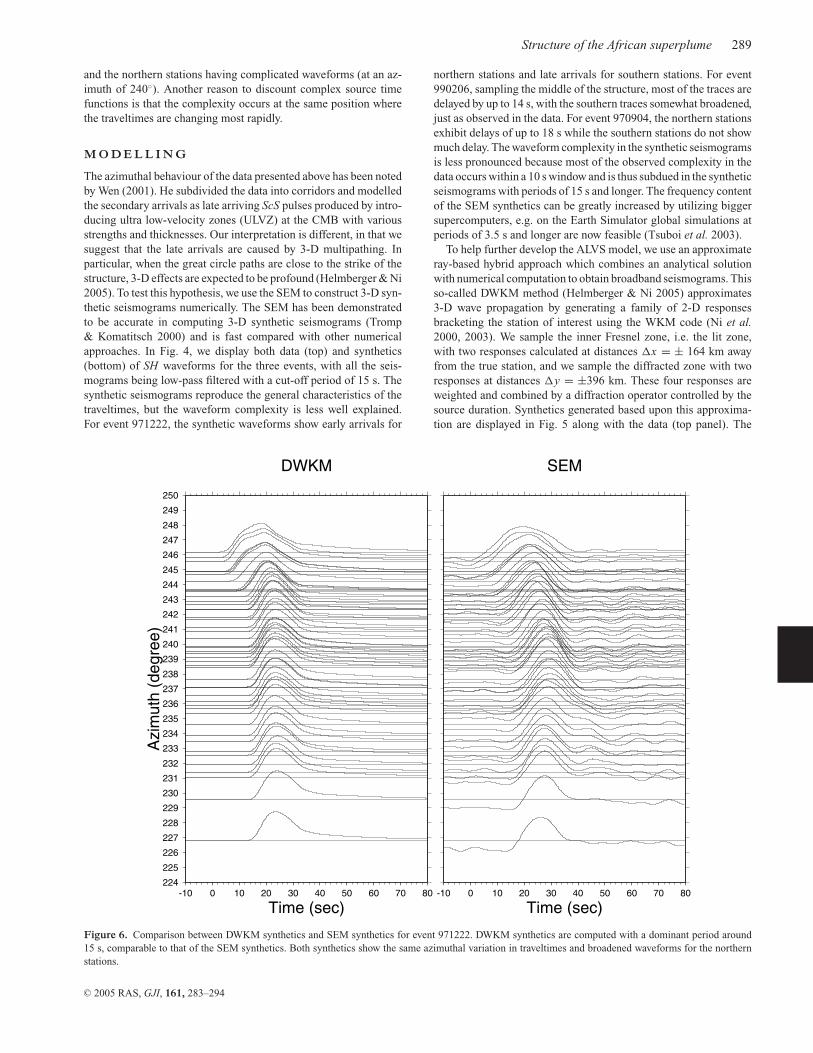
and the northern stations having complicated waveforms (at an az-imuth of 240◦). Another reason to discount complex source timefunctions is that the complexity occurs at the same position wherethe traveltimes are changing most rapidly.
M O D E L L I N G
The azimuthal behaviour of the data presented above has been notedby Wen (2001). He subdivided the data into corridors and modelledthe secondary arrivals as late arriving ScS pulses produced by intro-ducing ultra low-velocity zones (ULVZ) at the CMB with variousstrengths and thicknesses. Our interpretation is different, in that wesuggest that the late arrivals are caused by 3-D multipathing. Inparticular, when the great circle paths are close to the strike of thestructure, 3-D effects are expected to be profound (Helmberger & Ni2005). To test this hypothesis, we use the SEM to construct 3-D syn-thetic seismograms numerically. The SEM has been demonstratedto be accurate in computing 3-D synthetic seismograms (Tromp& Komatitsch 2000) and is fast compared with other numericalapproaches. In Fig. 4, we display both data (top) and synthetics(bottom) of SH waveforms for the three events, with all the seis-mograms being low-pass filtered with a cut-off period of 15 s. Thesynthetic seismograms reproduce the general characteristics of thetraveltimes, but the waveform complexity is less well explained.For event 971222, the synthetic waveforms show early arrivals for
224
225
226
227
228
229
230
231
232
233
234
235
236
237
238
239
240
241
242
243
244
245
246
247
248
249
250
Azi
mut
h (d
egre
e)
-10 0 10 20 30 40 50 60 70 80
Time (sec) Time (sec)
DWKM
-10 0 10 20 30 40 50 60 70 80
SEM
Figure 6. Comparison between DWKM synthetics and SEM synthetics for event 971222. DWKM synthetics are computed with a dominant period around15 s, comparable to that of the SEM synthetics. Both synthetics show the same azimuthal variation in traveltimes and broadened waveforms for the northernstations.
northern stations and late arrivals for southern stations. For event990206, sampling the middle of the structure, most of the traces aredelayed by up to 14 s, with the southern traces somewhat broadened,just as observed in the data. For event 970904, the northern stationsexhibit delays of up to 18 s while the southern stations do not showmuch delay. The waveform complexity in the synthetic seismogramsis less pronounced because most of the observed complexity in thedata occurs within a 10 s window and is thus subdued in the syntheticseismograms with periods of 15 s and longer. The frequency contentof the SEM synthetics can be greatly increased by utilizing biggersupercomputers, e.g. on the Earth Simulator global simulations atperiods of 3.5 s and longer are now feasible (Tsuboi et al. 2003).
To help further develop the ALVS model, we use an approximateray-based hybrid approach which combines an analytical solutionwith numerical computation to obtain broadband seismograms. Thisso-called DWKM method (Helmberger & Ni 2005) approximates3-D wave propagation by generating a family of 2-D responsesbracketing the station of interest using the WKM code (Ni et al.2000, 2003). We sample the inner Fresnel zone, i.e. the lit zone,with two responses calculated at distances �x = ± 164 km awayfrom the true station, and we sample the diffracted zone with tworesponses at distances �y = ±396 km. These four responses areweighted and combined by a diffraction operator controlled by thesource duration. Synthetics generated based upon this approxima-tion are displayed in Fig. 5 along with the data (top panel). The
C© 2005 RAS, GJI, 161, 283–294

290 S. Ni, D. V. Helmberger and J. Tromp
multipathing is more obvious at these shorter periods, as expected.For event 971222, the northern stations show two arrivals with thefirst arrival near the PREM prediction, whereas the southern sta-tions display late arrivals. The amplitude for the northern stations isonly about half of that for the southern stations, as predicted by thesynthetics. For event 990206, most of the synthetics are delayed byup to 14 s, with the southern ones slightly early yet complicated, asobserved in the data. This occurs at an azimuth of 219◦ and probablymeans that either there is a ULVZ at the CMB which delays ScS, asproposed by Wen (2001), or the southern ridge boundary has somefine structure. For event 970904, the synthetics are gradually de-layed from south to north, with some complexity in the waveformsappearing around 214◦, but not strong enough to match the data.The boundaries are currently sharp in the ALVS model, so that themultipathing as approximated by the hybrid method cannot be en-hanced. More waveform complexity could be generated by addinga very anomalous structure such as ULVZ along the boundaries, asproposed by Wen (2001).
To validate the hybrid 3-D algorithm, we constructed seismo-grams using a source with a dominant period of 16 s and comparedthose with synthetics generated by the SEM, as displayed in Fig. 6 forthe ALVS model and in Fig. 7 for the tomographic model proposedby Ritsema et al. (1999). The synthetics agree quite well, except fora difference in shape probably caused by the 1-D part of the cal-culation (WKM). Note that the DWKM synthetics were generatedfrom an earth-flattened model which underestimates the decay rate
224
225
226
227
228
229
230
231
232
233
234
235
236
237
238
239
240
241
242
243
244
245
246
247
248
249
250
Azi
mut
h (d
egre
e)
-10 0 10 20 30 40 50 60 70 80
Time (sec) Time (sec)
DWKM
-10 0 10 20 30 40 50 60 70 80
SEM
Figure 7. Comparison of SEM and DWKM synthetics for Ritsema’s tomographic model. Most tomographic models do not have sharp variations due todamping in the inversion and thus do not explain the rapid variations in traveltimes and waveforms as shown in Fig. 8.
of diffracted core arrivals (Gilbert & Helmberger 1972). However,the differential shape change across the array is expected to be smalland can be absorbed into an effective source time function.
D I S C U S S I O N A N D C O N C L U S I O N
We have demonstrated that a ridge-like African low-velocity struc-ture (ALVS) explains the rapid azimuthal variations of observed SHwaveforms for earthquakes in the western Pacific Ocean recorded bythe South Africa Array. The double SH pulses observed for events971222 and 970904 are interpreted as multipathing effects, with the3-D wavefield split along the relatively sharp boundaries. To demon-strate the effects of multipathing, we plotted the great circle pathsalong with a map view of the ALVS for different depths (Fig. 8). Thecoloured segments of the paths denote the actual paths traversed inthe each layer. It is obvious that for the northernmost stations thegreat circle paths are very close to the boundary of the ALVS. There-fore, for the northernmost stations the wavefield is split, with onepart travelling in the normal mantle and the other part travelling inthe ALVS. For the southern stations the rays are well confined tothe bulk of the low-velocity region, and only one delayed pulse isproduced.
Although this model shows promise, one can wonder about itsuniqueness. If we consider only the data displayed in Fig. 3, wecan easily trade off the low-velocity distribution with thickness.That is, we could change the velocities in the patches (Fig. 8) while
C© 2005 RAS, GJI, 161, 283–294

Structure of the African superplume 291
330˚ 0˚ 30˚ 60˚ 90˚
-60˚
-30˚
0˚
30˚
Figure 8. Great circle paths for event 971222 sampling the ALVS modelbroken down into three panels, with green lines representing segments ofSdiff ray paths within various depth ranges. The upper plot shows the delayedS path sampling from depths of 1900 to 2200 km, the middle panel from 2200to 2500 km, and the bottom panel from 2500 to 2890 km. The large thicknessof the ALVS model accommodates the large delays in Sdiff without strongvelocity reductions in D′′.
conserving the required traveltimes. If we force the entire anomalyinto D′′ (the lowermost patch), we would need to drop the shear-wave velocity by about 6 per cent relative to PREM. To avoid in-troducing waveform distortions for the profile associated with themiddle of the ALVS (990206), one needs to taper the velocity de-crease from about 2 per cent at the top to about 9 per cent at theCMB, as proposed by Wen (2001). With an average velocity re-duction of only 6 per cent in D′′, it takes about 25◦ of epicentraldistance to produce the observed delays of 15 s at the South Africa
Array (see the bottom of Fig. 8). However, the vertical traveltimeanomaly for this D′′ structure is only 2 s, which is too small to ex-plain about 1000 observations of an SKS traveltime jump associatedwith crossing the boundary, with average delays of 6 s (Ni & Helm-berger 2003b). Thus, the combination of near vertical delays of 6 sand the diffracted paths of 0.6 s per degree require a large-scalestructure. However, the LVZ structure beneath the Indian Ocean ispoorly known and there are some uncertainties about its shape andlateral velocity distribution. Such uncertainties could affect SKSdelays which are currently limited to the tip of South Africa. Butthe data presented here are consistent with a tall structure which ismore in agreement with modern tomographic models (Ritsema et al.1999).
An S velocity reduction of up to 9 per cent confined in D′′ greatlydelays ScS even to large epicentral distances (Wen 2001). Indeed,Wen (2001) explains the second pulses in the data set for event971222 as ScS caused by a ULVZ. However, this model would alsopredict a strong ScS on the radial component, and would have astrong effect on SVdiff . Note that for PREM-like models, the S andScS are asymptotic in timing beyond 93◦, and because they havesimilar amplitude but opposite signs, the SVdiff amplitude dampsout very rapidly with distances beyond the shadow zone in mostdata sets. Although SKS is apparent for all the events listed in Table1, none displayed clear SVdiff arrivals, even after stacking (Fig. 9).In other global regions of relatively slow D′′ such as the mid-PacificSVdiff is apparent even to those distances (112–120◦) as comparedwith SKS (Ritsema et al. 1997). Thus, we suggest that the secondpulses in the SH component for events 971222 and 970904 are notScS and a ULVZ is not needed to explain the data.
To further enhance the evidence for a tall ALVS, we analysedSS traveltimes for event 990206, sampling the mid-section of theALVS, employing a cross-correlation method (Ni & Helmberger2003b). We found that SS traveltimes exhibit systematic azimuthalvariations (solid circles in the bottom panel of Fig. 10) with arrivalsat the northern stations (larger azimuth) delayed up to 5 s. Next,we measured the traveltime variation with the same method for theSEM synthetics for the Ritsema et al. (1999) model and found thatSEM synthetics (open triangles) show a similar trend. Since SS raypaths for event 990206 only sample a depth of around 1700 km (toppanel, Fig. 10), any thin model (<300 km) with a very slow basallayer cannot explain the observed SS traveltime variations.
Lastly, the issue of multipathing caused by source structure couldbe a problem; in particular slabs are expected to produce sucheffects, and P-waveform multipathing due to slab structure hasbeen modelled (Kendal & Thomson 1993). However, the diffractedP waves observed by the South Africa Array typically do not showmuch complexity (Wen 2001). Fig. 11 displays a comparison of ob-served and predicted P and S waveforms for event 970904 with ourpreferred model. The simplicity of the P waveform would seem toeliminate this explanation, since the ray paths for P and S are verysimilar in the source region.
In conclusion, the ALVS must have relatively sharp shear-velocityvariations across nearly vertical walls to produce the strong az-imuthal patterns discussed above, while the P waves show very littlevariation (Fig. 11). Both the sharp boundary and the anomalous P/Sratio support arguments for a thermochemical structure with broaddimensions, as suggested by Anderson (2002). The top of the ALVScould be quite complicated, with some small-scale upwellings caus-ing the scattered SS traveltime observations (Fig. 11) and the small-scale SKS scatter presented in the work of Ni & Helmberger (2003b).Such features would be consistent with chemical heterogeneity ingeodynamic modelling (Tackley 2000) and broad superplume-like
C© 2005 RAS, GJI, 161, 283–294

292 S. Ni, D. V. Helmberger and J. Tromp
-140 -120
SKS SKKS
SHdiff
SVdiff
-100 -80 -60 -40 -20 0 20 40
Time (sec)Figure 9. Stacked SHdiff , SKS and SVdiff waveforms for event 971222 (heavy dashed, solid and light dashed lines, respectively). Only stations withmultipathed SHdiff are stacked. The two SHdiff pulses are modelled as 3-D multipathing effects. SVdiff is very weak as compared with SKS, arguing that thereis no substantial low-velocity gradient in the lowermost mantle (Ritsema et al. 1997). Consequently, a ULVZ as proposed by Wen (2001) seems to be absent inthis region, because it would produce strong SVdiff .
Figure 10. Top: SS ray paths for epicentral distances of 126◦. At thesedistances the rays sample the structure about 1200 km above the CMB.Bottom: observed SS traveltime variations (event 990206, solid circles) andSEM predictions (open triangles). The 5 s delay in the SS traveltime requiresthat the ALVS must exceed 1000 km in height.
upwelling in laboratory stimulations (Davaille 1999; Gonnermannet al. 2002).
A C K N O W L E D G M E N T S
The data used in this study were provided by the IRIS DMS. Specialthanks go to the Kaapvaal project scientists for producing this ex-traordinary data set (http://www.ciw.edu/kaapvaal). This project issupported by NSF under grants EAR-0229885 and EAR-0309576.Contribution number 9038, Seismological laboratory, Divisionof Geological and Planetary Science, California Institute ofTechnology.
R E F E R E N C E S
Anderson, D.L., 2002. The case for irreversible chemical stratification of themantle, Int. Geol. Rev., 44(2), 97–176.
Davaille, A., 1999. Simultaneous generation of hotspots and superswellsby convection in a heterogenous planetary mantle, Nature, 402(6763),756–760.
Dziewonski, A.M. & Anderson, D.L., 1981. Preliminary Reference EarthModel, Phys Earth planet. Inter., 25(4), 297–356.
Garnero, E.J. & Helmberger, D.V., 1998. Further structural constraints anduncertainties of a thin laterally varying ultralow-velocity layer at the baseof the mantle, J. geophys. Res. Solid Earth, 103(B6), 12 495–12 509.
Gilbert, F. & Helmberger, D.V., 1972. Generalized ray theory for a layeredsphere, Geophys. J. R. astr. Soc., 27, 57–80.
Gonnermann, H.M., Manga, M. & Jellinek, A.M., 2002. Dynamics andlongevity of an initially stratified mantle, Geophys. Res. Lett., 29(10)doi:10.1029/2002GL014851.
Grand, S.P., 2002. Mantle shear-wave tomography and the fate of subductedslabs, Phil. Trans. R. Soc. Lond., A, 360(1800), 2475–2491.
Helmberger, D. & Ni, S., 2005. Approximate 3D Body-Wave syntheticsfor Tomographic Models, Bull. seism. Soc. Am., 95, 1, 212–224, doi:10.1785/0120040004.
Kendal, J.M. & Thomson, C.J., 1993. Seismic modeling of subduction zoneswith inhomogeneity and anisotropy, 1. Teleseismic P-wave-front tracking,Geophys. J. Int., 112(1), 39–66.
C© 2005 RAS, GJI, 161, 283–294

Structure of the African superplume 293
199
200
201
202
203
204
205
206
207
208
209
210
211
212
213
214
215
216
217
218
219
Azi
mut
h (d
egre
e)
-20 -10 0 10 20Time (sec) Time (sec)
SEM (----P),S Data (----P),S
30 40 50 60 70 80 -10 0 10 20 30 40 50 60 70 80
Figure 11. Comparison of SEM P-wave (dotted) and S-wave (solid) synthetics for event 970904 with observations. The P and S waves are aligned relativeto PREM predictions for both data and synthetics. The data range in distance from 113 to 118◦ and are plotted in a fan profile as a function of azimuth. Thedata have been low-pass filtered at 15 s to match the synthetics. The ALVS model has PREM compressional velocities, which agrees with the observations.However, the S waves exhibit a strong delay when crossing the boundary.
Komatitsch, D., Ritsema, J. & Tromp, J., 2002. The spectral-element method,Beowulf computing, and global seismology, Science, 298(5599), 1737–1742.
Luo, S.N., Ni, S.D. & Helmberger, D.V., 2001. Evidence for a sharp lat-eral variation of velocity at the core- mantle boundary from multipathedPKPab, Earth planet. Sci. Lett., 189(3–4), 155–164.
Masters, G., Johnson, S., Laske, G. & Bolton, H., 1996. A shear-velocitymodel of the mantle, Phil. Trans. R. Soc. Lond., A, 354(1711), 1385–1410.
Ni, S. & Helmberger, D.V., 2001. Probing an ultra-low velocity zone at thecore mantle boundary with P and S waves, Geophys. Res. Lett., 28(12),2345–2348.
Ni, S.D. & Helmberger, D.V., 2003a. Ridge-like lower mantle struc-ture beneath South Africa, J. geophys. Res. Solid Earth, 108(B2)doi:10.1029/2001JB001545.
Ni, S.D. & Helmberger, D.V., 2003b. Seismological constraints on the SouthAfrican superplume; could be the oldest distinct structure on Earth, Earthplanet. Sci. Lett., 206(1–2), 119–131.
Ni, S.D., Ding, X.M., Helmberger, D.V. & Gurnis, M., 1999. Low-velocitystructure beneath Africa from forward modeling, Earth planet. Sci. Lett.,170(4), 497–507.
Ni, S.D., Ding, X. & Helmberger, D.V., 2000. Constructing synthet-ics from deep earth tomographic models, Geophys. J. Int., 140, 71–82.
Ni, S.D., Tan, E., Gurnis, M. & Helmberger, D., 2002. Sharp sides to theAfrican superplume, Science, 296(5574), 1850–1852.
Ni, S, Cormier, V.F. & Helmberger, D.V., 2003. Construction of syntheticsfor 2D structures: analytical vs. numerical, Bull. seism. Soc. Am., 93(6),2752–2757.
Ritsema, J., Garnero, E. & Lay, T., 1997. A strongly negative shear velocitygradient and lateral variability in the lowermost mantle beneath the Pacific,J. geophys. Res., 102, 20 395–20 411.
Ritsema, J., Ni, S., Helmberger, D.V. & Crotwell, H.P., 1998. Evidence forstrong shear velocity reductions and velocity gradients in the lower mantlebeneath Africa, Geophys. Res. Lett., 25(23), 4245–4248.
Ritsema, J., van Heijst, H.J. & Woodhouse, J.H., 1999. Complex shear wavevelocity structure imaged beneath Africa and Iceland, Science, 286(5446),1925–1928.
Russell, S.A., Lay, T. & Garnero, E.J., 1999. Small-scale lateral shear veloc-ity and anisotropy heterogeneity near the core-mantle boundary beneaththe central Pacific imaged using broadband ScS waves, J. geophys. Res.Solid Earth, 104(B6), 13 183–13 199.
Su, W.J., Woodward, R.L. & Dziewonski, A.M., 1994. Degree-12 model ofshear velocity heterogeneity in the mantle, J. Geophys. Res. Solid Earth,99(B4), 6945–6980.
Tackley, P., 2000. Mantle convection and plate tectonics: toward an integratedphysical and chemical theory, Science, 288, 2002–2007.
Tkalcic, H. & Romanowicz, B., 2002. Short scale heterogeneity in the low-ermost mantle: insights from PcP–P and ScS–S data, Earth planet. Sci.Lett, 201(1), 57–68.
Tromp, J. & Komatitsch, D., 2000. Spectral-element simulations of wavepropagation in a laterally homogeneous Earth model, in Proceedings of
C© 2005 RAS, GJI, 161, 283–294
294 S. Ni, D. V. Helmberger and J. Tromp
the Erice 1999 School of Geophysics, eds Boschi, E., Ekstrom, G. &Morelli, A., pp. 351–372.
Tsuboi, S., Komatitsch, D., Ji, C. & Tromp, J., 2003. Broadband modelingof the 2002 Denali fault earthquake on the Earth Simulator, Phys. Earthplanet. Inter., 139(3–4), 305–312.
Wen, L.X., 2001. Seismic evidence for a rapidly varying compositionalanomaly at the base of the Earth’s mantle beneath the Indian Ocean, Earthplanet. Sci. Lett., 194(1–2), 83–95.
Wen, L.X. & Helmberger, D.V., 1998. Ultra-low velocity zones near the core–mantle boundary from broadband PKP precursors, Science, 279(5357),1701–1703.
Widiyantoro, S., Kennett, B.L.N. & van der Hilst, R.D., 1999. Seis-mic tomography with P and S data reveals lateral variations inthe rigidity of deep slabs, Earth planet. Sci. Lett., 173(1–2), 91–100.
Wysession, M.E., Fischer, K.M., Al-eqabi, G.I., Shore, P.J. & Gurari, I.,2001. Using MOMA broadband array ScS–S data to image smaller-scalestructures at the base of the mantle, Geophys. Res. Lett., 28(5), 867–870.
Zhao, D.P., Hasegawa, A. & Kanamori, H., 1994. Deep-structure of Japansubduction zone as derived from local, regional, and teleseismic events,J. Geophys. Res. Solid Earth, 99(B11), 22 313–22 329.
C© 2005 RAS, GJI, 161, 283–294