Embed Size (px)
Citation preview

©20
12 N
atu
re A
mer
ica,
Inc.
All
rig
hts
res
erve
d.
protocol
nature protocols | VOL.7 NO.11 | 2012 | 1983
IntroDuctIonIn a typical histology study, it is necessary to make thin sections of blocks of frozen or fixed tissue for microscopy. This process has major limitations for obtaining a 3D picture of structural com-ponents and the distribution of cells within tissues. For example, in axon regeneration studies, after labeling the injured axons, it is common that the tissue of interest (e.g., spinal cord, optic nerve) is sectioned. Subsequently, when tissue sections are analyzed under the microscope, only short fragments of axons are observed within each section; hence, the 3D information of axonal structures is lost. Because of this confusion, these fragmented axonal profiles might be interpreted as regenerated axons even though they could be spared axons1. In addition, the growth trajectories and target regions of the regenerating axons cannot be identified by visualiza-tion of axonal fragments. Similar problems could occur in cancer and immunology studies when only small fractions of target cells are observed within large organs.
To avoid these limitations and problems, tissues ideally should be imaged at high spatial resolution without sectioning. However, optical imaging of thick tissues is limited mostly because of scat-tering of imaging light through the thick tissues, which contain various cellular and extracellular structures with different refractive indices. The imaging light traveling through different structures scatters and loses its excitation and emission efficiency, resulting in a lower resolution and imaging depth2,3.
Optical clearing of tissues by organic solvents, which make the biological tissue transparent by matching the refractory indexes of different tissue layers to the solvent, has become a prominent method for imaging thick tissues2,4. In cleared tissues, the imag-ing light does not scatter and travels unobstructed throughout the different tissue layers. For this purpose, the first tissue clearing method was developed about a century ago by Spalteholz, who used a mixture of benzyl alcohol and methyl salicylate to clear large organs such as the heart5,6. In general, the first step of tissue clearing
is tissue dehydration, owing to the low refractive index of water compared with cellular structures containing proteins and lipids4. Subsequently, dehydrated tissue is impregnated with an optical clearing agent, such as glucose7, glycerol8, benzyl alcohol–benzyl benzoate (BABB, also known as Murray’s clear)4,9–13 or dibenzyl ether (DBE)13,14, which have approximately the same refractive index as the impregnated tissue. At the end of the clearing proce-dure, the cleared tissue hardens and turns transparent, and thus resembles glass.
Development of 3DISCOIn recent decades, development of fluorescent proteins and laser scanning microscopy techniques that can achieve deep tissue imag-ing of the fluorescently labeled tissues opened new venues for the application of tissue clearing. To achieve high-resolution imaging of unsectioned brain and spinal cord, we developed a technique (3DISCO) by optical clearing and light-sheet laser-scanning ultra-microscopy. To this end, we used transgenic mice expressing GFP only in a subset of neurons15 and used light-sheet laser-scanning ultramicroscopy11,16, which can image organs with dimensions as large as 1.5–2 cm (refs. 11,17–19). During the development of the technique, we initially used alcohol and BABB for tissue clearing, which worked especially well for smaller preparations such as embryonic hippocampi. However, the use of alcohol degraded the fluorescent signal quickly, and hence limited its application to small tissues with strong fluorescence expression10. In addition, alcohol and BABB in combination could not clear myelinated tissues and thus did not work on adult central nervous system (CNS) tissue. Therefore, we screened for new clearing chemicals and found that tetrahydrofuran (THF)—instead of alcohol—use, in combination with BABB, could both fully clear the adult spinal cord and preserve its fluorescent signal11. However, THF- and BABB-based clearing had limited success on the adult brain. Recently, we developed a
Three-dimensional imaging of solvent-cleared organs using 3DISCOAli Ertürk1, Klaus Becker2,3, Nina Jährling2–4, Christoph P Mauch5, Caroline D Hojer6, Jackson G Egen6, Farida Hellal7, Frank Bradke7, Morgan Sheng1 & Hans-Ulrich Dodt2,3
1Department of Neuroscience, Genentech, South San Francisco, California, USA. 2Department of Bioelectronics, Institute of Solid State Electronics, Vienna University of Technology, Vienna, Austria. 3Center for Brain Research, Medical University of Vienna, Section of Bioelectronics, Vienna, Austria. 4Department of Neurobiology, University of Oldenburg, Oldenburg, Germany. 5Max Planck Institute of Psychiatry, Neuronal Plasticity Research Group, Munich, Germany. 6Department of Discovery Immunology, Genentech, South San Francisco, California, USA. 7Deutsches Zentrum für neurodegenerative Erkrankungen (DZNE), Axonal Growth and Regeneration, Bonn, Germany. Correspondence should be addressed to A.E. ([email protected]).
Published online 11 October 2012; doi:10.1038/nprot.2012.119
the examination of tissue histology by light microscopy is a fundamental tool for investigating the structure and function of organs under normal and disease states. Many current techniques for tissue sectioning, imaging and analysis are time-consuming, and they present major limitations for 3D tissue reconstruction. the introduction of methods to achieve the optical clearing and subsequent light-sheet laser scanning of entire transparent organs without sectioning represents a major advance in the field. We recently developed a highly reproducible and versatile clearing procedure called 3D imaging of solvent-cleared organs, or 3DIsco, which is applicable to diverse tissues including brain, spinal cord, immune organs and tumors. Here we describe a detailed protocol for performing 3DIsco and present its application to various microscopy techniques, including example results from various mouse tissues. the tissue clearing takes as little as 3 h, and imaging can be completed in ~45 min. 3DIsco is a powerful technique that offers 3D histological views of tissues in a fraction of the time and labor required to complete standard histology studies.

©20
12 N
atu
re A
mer
ica,
Inc.
All
rig
hts
res
erve
d.
protocol
1984 | VOL.7 NO.11 | 2012 | nature protocols
new clearing protocol using DBE—instead of BABB—in combina-tion with THF that resulted in decent clearing of every tissue that we tested, including adult brains14.
Applications and advantages of the methodThe 3DISCO technique provides the ability to accurately and quickly acquire complete histological information about labeled cells/molecules in large tissues, including their spatial density and distribution. We have used this method to follow the trajectories of regenerating axons and the spatial distribution of reactive glia in unsectioned spinal cord, which otherwise was impossible to obtain11. Hence, this method is particularly useful to study the histo-logy of large cells/tissues within entire organs in relation to their environment, e.g., neurons extending throughout the entire spinal cord or blood vessels covering entire organs.
3DISCO is very fast to perform compared with imaging of tissue sections. It takes only a few hours for small organs (a few milli-meters) such as spinal cords, mammary glands or lymph nodes, and a day for large organs such as the brain (Table 1). To acquire simi-lar data using serial sectioning, imaging and ‘stitching’ of the data would take several weeks. Moreover, these reconstructed images would most likely be incomplete compared with 3D imaging of the entire intact tissue because of possible mechanical distortions during sectioning and subsequent image alignment problems.
3DISCO consists of sequential solution incubation steps (as described below), which require only a few minutes of actual work interspersed between incubation times. Therefore, one can easily use 3DISCO on several organs at the same time to perform large screens.
3DISCO is compatible with diverse labeling methods includ-ing transgenic expression of fluorophores (CFP, GFP, YFP, RFP, mCherry and so on), synthetic dyes11 and antibody labeling11,20. It is also possible to differentially label multiple target cells/molecules within a tissue. We have successfully labeled and imaged astrocytes, microglia and neurons in the same cleared and unsectioned spinal cord11, allowing us to study neuronal degeneration and regenera-tion along with the spatial distribution of activated astrocytes and microglia in the same spinal cord11. Furthermore, 3DISCO has worked on every tissue that we have tested, including lung, spleen, lymph nodes, mammary glands and tumor tissues; therefore, it can be a universal histology procedure in many fields of biomedi-cal research.
Finally, cleared tissues can be imaged using various microscopy techniques such as wide-field epifluorescence and confocal and two-photon microscopy.
LimitationsThere are technical and practical limitations of 3DISCO. Essentially, because clearing alters the chemical composition of the tissues, it can only be used on fixed tissues. Because optical clearing dis-solves the lipid structures in the tissue such as cell membrane and myelin, the cleared tissue cannot be further studied with electron microscopy, nor is it amenable to any lipophilic dyes such as those used for tracing. In addition, cleared tissues cannot be stored for prolonged periods, because the final clearing solution degrades the fluorescent signal over time; for example, we observed that the half-life of GFP signal in cleared brains (from the GFP-M line15) is approximately 1–2 d. For this reason, the tissue should be imaged as soon as possible after optical clearing. In addition, some fluorescent proteins (particularly YFP) are less stable than others in clearing solutions. To achieve best results with 3DISCO, labeling should be done with a strong fluorophore. Because of limited antibody penetration, immunolabeling of large tissues is a big challenge, especially in adult tissues, which require long incubation times and special protocols.
Experimental designChoice of tissue. Ideally, the tissue being analyzed should be labeled with a strong fluorophore that is readily detectable by fluorescent microscopy before clearing. The best way to achieve high signal-to-noise ratio is with a transgenic mouse model that expresses high levels of a fluorescent protein that labels the desired molecules or cells, e.g., Thy1-GFP mice expressing GFP in a sub-set of neurons15 (Fig. 1), a GFAP-GFP line labeling astrocytes21 or a CX3CR1-GFP line labeling microglia22. Alternatively, use viral expression or transfection of fluorescent proteins23,24, or labeling of cells or structures with synthetic dyes25. Antibody labeling can also be a good alternative when embryos22 or soft tissues, such as mam-mary glands, from adult mice are imaged. However, it is impor-tant to note that if antibody labeling is used, the clearing should be applied after the completion of the immunostaining, because rehydration of the cleared tissues disrupts their transparency. In addition, bear in mind that labeling the entire depth of the tissue
table 1 | Clearing protocols for different tissues.
reagentsMammary gland,
lymph nodespinal cord, lung, spleen brain stem brain brain (long protocol)
50% (vol/vol) THF 20 min 30 min 1 h 1 h 12 h
70% (vol/vol) THF 20 mina 30 mina 1 ha 1 h 12 h
80% (vol/vol) THF 20 min 30 min 1 h 1 h 12 h
100% (vol/vol) THF 3 × 20 min 3 × 30 min 2 × 1 h 1 h, overnight, 1h 3 × 12 h
DCM 15 min 20 min 45 min — —
DBE ≥15 min ≥15 min ≥30 min ≥3 h 1–2 daFor small tissues, the 70% (vol/vol) THF step can be skipped to save time. Changing the clearing solutions about two or three times during the total incubation times of 100% THF and DBE helps to get better results. For example, for spinal cord and brain clearing, refresh DBE every 10 min and 12 h, respectively. To optimize the clearing for different tissues, follow the protocol for the tissue having similar size and composition presented above and further optimize it if needed by changing incubation times by about 50% (50% increase if the clearing is insufficient or 50% decrease if the clearing is too much).

©20
12 N
atu
re A
mer
ica,
Inc.
All
rig
hts
res
erve
d.
protocol
nature protocols | VOL.7 NO.11 | 2012 | 1985
with immunostaining may require special immunohistochemistry techniques and long incubation times, because of the limited pen-etration of the antibodies within the tissues. In addition, not all antibodies yield good labeling in paraformaldehyde (PFA)-fixed tissues. Therefore, most of the time, immunostaining is not the preferred way of tissue labeling.
Tissue clearing. Tissue clearing is a straightforward procedure, which only requires sequential changes of solutions in glass vials using a Pasteur pipette. In general, the duration of each step is somewhat flexible. The 100% THF steps can be done overnight or for a few hours. The final clearing step in DBE can be extended to a few hours or overnight when large tissues are being cleared. In general, the optimum incubation times are based on the thick-ness and the sturdy nature of the tissue. Whereas a large tissue that has a sturdy composition with myelin (e.g., brain) requires longer incubation times (12–24 h), especially for 100% THF and DBE, a smaller tissue (spinal cord) requires shorter incubation times (1–2 h). As such small tissues can be cleared relatively fast and easy, the 70% (vol/vol) THF step can be skipped (change from 50% (vol/vol) THF to 80% (vol/vol) THF directly) to save time. However, bear in mind that reducing gradual dehydration steps (reducing incubation times of diluted THF steps) might increase
the tissue shrinkage and distortion due to the fast removal of water. Changing the clearing solutions about two or three times during the total incubation times of 100% THF and DBE helps obtain bet-ter results. Hence, we suggest users to first follow the protocol for a tissue having similar size and composition to the one we present in Table 1. The protocol can then be further optimized if needed by changing incubation times by about 50% (50% increase if the clearing is insufficient or 50% decrease if the clearing is too much). Dichloromethane is a good lipid-solving agent, but it also decreases fluorescent signal. Hence, we use it only for small tissues with short incubation times. DBE is a superior optical clearing agent com-pared with BABB14, but BABB can be used as an alternative to DBE for the clearing of particularly small tissues.
Many of the reagents used for clearing are toxic, and it is therefore important that they be handled and disposed of appropriately (see Box 1 and Table 2 for further information).
3D imaging of cleared tissues. After the tissues are cleared, the next step is the imaging procedure. To image large organs such as the adult rodent brain, we use a light-sheet laser-scanning ultramicro-scope10. The ultramicroscope has recently been made commercially available and costs about half the price of a confocal microscope. There are other light-sheet scanning techniques that can be used:
a
b
c
d
1 mm
b c d
g
g
f
f
e
1 mm
200 µm
Figure 1 | Typical results obtained from 3DISCO of neurons in the brain and hippocampus. We imaged entire cleared brains and hippocampi from GFP-M line mice using ultramicroscopy. (a) 3D reconstruction of an entire mouse brain with a corner-cut view (z-step: 3 µm, the number of optical sections: 2,518, zoom: ×1.6 to ×0.8 magnification on ×2.0 lens, scan duration: ~1 h 30 min). (b–d) The horizontal projections (~100 µm) from the cleared brain at different depths marked in a. (e) 3D reconstruction of a cleared hippocampus with a corner-cut view showing some of the neurons that reside in the tissue (z-step: 2 µm, the number of optical sections: 1,051, zoom: ×5.0, scan duration: ~1 h). (f) The horizontal projection from the cleared hippocampus at the indicated plane in e. (g) Higher magnification of the region indicated in f. The fixed mouse brains and hippocampi were collected in accordance with governmental and institutional guidelines for the use of laboratory animals. The Genentech Institutional Animal Care and Use Committee approved all mouse protocols.
Box 1 | Waste handling Collect all of the clearing solutions into separate waste bottles (made of glass) and store the waste in a fume hood. Different dilutions of THF solutions can be collected into one bottle. Label the waste clearly with the date, content, producer and lab location, and indicate whether the chemical is toxic or not. Find the hazards and handling information of all the chemicals used in this protocol in table 2. Follow the relevant institutional rules for using and discarding waste material and chemicals.

©20
12 N
atu
re A
mer
ica,
Inc.
All
rig
hts
res
erve
d.
protocol
1986 | VOL.7 NO.11 | 2012 | nature protocols
digital scanned laser light-sheet fluorescence microscopy26 and selective plane illumination microscopy17. Another commercial alternative is the true confocal scanning–large scale imaging (TCS-LCI) microscope, which can image tissues as large as the rodent brain, but it delivers three or four times lower resolution and is slower compared with an ultramicroscope because it is a point-scanning confocal microscope with photomultiplier tubes.
Cleared tissues can also be imaged by two-photon or confocal microscopy to obtain extremely high resolution11. Indeed, in prac-tice, optimal resolutions reported by objective manufacturers can only be reached when a cleared tissue is imaged. However, because of the relatively high magnification and small working distance of high–numerical aperture (NA) objectives that are used for confocal and two-photon microscopy techniques, the maximum imaging area and depth will be small compared with light-sheet microscopy (imaging area: 0.5–1 versus 10–20 mm; imaging depth: 0.2–2.2 versus 10–20 mm). For all types of microscopy using 3DISCO, we prefer acquiring images with a pixel intensity range of 12 or 16 bits to obtain the maximum possible illumination information for subsequent data analysis and quantification.
Data analysis. Analysis of 3DISCO data can be achieved with free software such as ImageJ or with commercially available 3D imaging software. We use Amira for visualization, segmenta-tion and quantification. Alternatively, Imaris or Neurolucida can be used.
Analyzing the data is the most time-consuming step of 3DISCO, and it may require powerful computing systems if very large tis-sues are imaged. Improving the data sets with image filters is pos-sible, but considering the enormous file size that can be obtained it may take several hours to days to perform advanced algorithms such as deconvolution. For example, when we acquire 3DISCO of adult mouse brain, it produces ~40 GB of data (4,000 optical sections), on which it could take 1–2 d to run a robust deconvolu-tion algorithm.
Our typical workflow in data analysis is to load the data into Amira, convert the data from 12- or 16-bit images into 8-bit images, examine the samples in the multiplanar view of Amira and select the good scans to be analyzed. If 8-bit resolution is not sufficient, we use the 12- or 16-bit data for quantification.
Image collection, storing and backing up. 3DISCO, especially when ultramicroscopy or two-photon microscopy is used, will produce large data sets. For example, each adult GFP brain scan (from the GFP-M mouse line) by ultramicroscopy produces approximately a 30- to 40-GB data set at 2–3 µm z-resolution, which yields about 3,000–4,000 optical images (16-bit images with a 5.5-megapixel Edge camera). The data can grow to a few terabytes in a short time. Therefore, image collection, storage and data backup should be done carefully and systematically.
Important points to keep in mind are as follows:
(i) Never collect the data to a network drive during image ac-quisition. If the network connection fails for any reason, such as maintenance service or power shortage, the scan will be disrupted.
(ii) When the data are successfully collected to a local drive, make two copies, one to an external storage and one to a safe network drive. Whereas the external drive copy can be used to analyze the data quickly (computers load the data from external drive much quicker than network drives), the network drive data is the safest way to protect the data from being lost.
(iii) Delete the data from the imaging computer only when at least two copies of the data are created as mentioned above.
(iv) Use external storages with the possible fastest connections to transfer and analyze the data, such as through an eSATA connection.
(v) If any of the storage media carrying the data fail, immedi-ately create another full copy.
Computing power, data analysis. To reduce the processing time, it is best to optimize the experimental steps, including labeling, clear-ing time and imaging rather than postprocessing. The computing power required is correlated with the size of the data collected from the imaging. For analyzing data sets around 1–3 GB, we used an HP workstation with a dual processor and equipped with 16 GB of RAM. For analyzing data sets as large as 30–40 GB, we used a HP Quad-core workstation, equipped with a powerful graphics card (Nvidia Quadro 5000) and 196 GB of RAM.
table 2 | Reagent safety information.
chemical name Flammable corrosive toxic oxidizer Form peroxides reactive
Tetrahydrofuran Yes No Yes No Yes No
Dichloromethane No No Yes No No No
Dibenzyl ether Yes No Yes No Yes No
Benzyl alcohol Yes No Yes No Yes No
Benzyl benzoate Yes No Yes No No No
Paraformaldehyde No No Yes No No NoFor handling organic solvents, use a lab coat, nitrile gloves (8 mil, double glove), splash goggles and perform all the experiments under a chemical hood except the imaging step. Usage of proper respiratory protection is recommended to minimize the inhalation of clearing reagents. All storage containers including the waste containers should be glass and stored in the dark.

©20
12 N
atu
re A
mer
ica,
Inc.
All
rig
hts
res
erve
d.
protocol
nature protocols | VOL.7 NO.11 | 2012 | 1987
MaterIalsREAGENTSTissue
Animal with strong fluorescence expression in the desired tissue Alternatively, the tissues can be labeled with viral expression, synthetic dyes or antibody labeling. The following mice are examples of suitable animals to use: Thy-1 GFP (GFP-M) line (Washington University in St. Louis); Thy-1 GFP (line founder 1, Genentech); KrasLSLG12D mice (Jacks lab at MIT); MHCII-GFP (MIT and Harvard Univer-sity); CD11c YFP-Venus (Rockefeller University); CX3CR1-GFP (Littman lab at NYU); and C57BL/6 (Charles River) ! cautIon The experimental animals must be handled in accordance with the relevant governmental and insti-tutional regulations regarding the use of animals for research purposes. All animal experiments in this article were approved by and conformed to the guidelines and principles set by the Genentech Institutional Animal Care and Use Committee and were carried out in an Association for the Assessment and Accreditation of Laboratory Animal Care (AAALAC)-accredited facility.
Fixative and perfusion reagentsNa2HPO4 (Mallinckrodt, cat. no. 7917-16)NaH2PO4 (Mallinckrodt, cat. no. 7892-04)PFA (Sigma-Aldrich, cat. no. P6148)2-2-2 Tribromoethanol (Avertin, Sigma-Aldrich, cat. no. T48402)2-Methyl-2-butanol (tert-Amyl alcohol, Sigma-Aldrich, cat. no. 152463)Saline (Braun, cat. no. S4011-S)HCl (Fisher Scientific, cat. no. A144-500)NaOH (Mallinckrodt, cat. no. 7708-10)PBS (Sigma-Aldrich, cat. no. P3813-10PAK)
Clearing reagentsTHF (Sigma-Aldrich, cat. no. 186562-12X100ML)Dichloromethane (DCM; Sigma-Aldrich, cat. no. 270997-12X100ML)DBE (Sigma-Aldrich, cat. no. 108014-1KG)Benzyl alcohol (Sigma-Aldrich, cat. no. 305197-100ML)Benzyl benzoate (Sigma-Aldrich, cat. no. B6630-250ML)
Tracing and antibody staining reagentsLectin FITC (Sigma-Aldrich, cat. no. L0401-1MG)Rat anti-mouse CD24 (BD Pharmingen, cat. no. 553146)Mouse anti–smooth muscle actin antibody conjugated to cy3 (Sigma, cat. no. C6198)Alexa Fluor 488 goat anti-rat IgG (Molecular Probes, cat. no. A-11006)
EQUIPMENTGlass vials (VWR, cat. no. 548-0554)Forceps (FST, cat. no. 11251-10)Mini rotator (VWR, cat. no. 100498-878)Aluminum foil (Fisherbrand, cat. no. 01-213-104)Kimax media storage bottles (100 ml; Cole Parmer, cat. no. EW-34523-00)Minipuls evolution perfusion pump (Gilson, cat. no. F110701) with MF4 medium flow pump head (Gilson, cat. no. F117606)Microscopy slide (VWR, cat. no. 48311-703)FastWell (Grace Bio-Labs, cat. no. FW20)Coverslip (Corning, cat. no. 2940-245)Glass Petri dish (Corning Pyrex, cat. no. 3160-101)Dental cement (Lang Dental, cat. no. 1223PNK)Quantofix peroxide test strips (Sigma-Aldrich, cat. no. 37206)Fume hood
Imaging microscopesIn this study, for the imaging of large tissues (size bigger than 0.5 mm), we used an ultramicroscope from Lavision Biotech or the Leica TCS-LSI
•
•••••••••
•••••
•••
•
••••••
•••••••
•
confocal microscope, but other microscopes with light-sheet illumination can be used as well. For imaging tissues at high resolution (with an imaging view of up to 0.5 mm), we used an Olympus multiphoton system or Leica SP5 confocal system, but any confocal or multiphoton system from other manufacturers can be used.
Ultramicroscope (Lavision Biotech) equipped withOlympus binocular body (MVX10)Olympus MVPLAPO ×2 lensLens cap (black delrin plastic) resistant to clearing chemicals (LaVision Biotech)Imaging reservoir (100% quartz) resistant to clearing chemicals (LaVision Biotech)Coherent sapphire laser 488Coherent sapphire laser 568PCO Edge SCMOS CCDFITC and rhodamine filters
Leica LSI system equipped withPLANAPO 2.0× / WD 39 mmPLANAPO 5.0× / 0.5 LWDFilters for DAPI, FITC and rhodamineExcitation lasers (405, 477, 532 and 635 nm)
Image analyzing toolsAmira with ResolveRT microscopy module (Visage Imaging)ImageJ (freeware from the US National Institutes of Health (NIH))
REAGENT SETUPPhosphate buffer (PB; 0.2 and 0.1 M) Prepare 0.2 M PB by mixing Na2HPO4 (21.8 g) and NaH2PO4 (6.4 g) in 1 liter of distilled water. Adjust the pH to 7.4. For 0.1 M PB, dilute 0.2 M PB 1:1 in distilled water. This solution can be stored at room temperature (18–25 °C) for up to 6 months.Avertin To prepare 100% Avertin solution, dissolve 10 g of Avertin in 10 ml of (total) tert-amyl alcohol by shaking it at 37 °C overnight. To pre-pare a 2.5% (vol/vol) working solution, dilute 100% Avertin 1:40 in sterile saline or ×1 PBS. The 100% stock solution can be stored at 4 °C for up to 1 year, and 2.5% (vol/vol) working solution can be stored at 4 °C for up to 2–3 months. crItIcal Avertin precipitates out when it is stored at 4 °C, but this will not harm the solution. The Avertin has to be re- dissolved at room temperature before use. The dosage is ~0.5 mg per gram of body weight of mouse.PFA (4%, vol/vol) To prepare 4% (wt/vol) PFA, dissolve 40 g of PFA in 1 liter (total) of 0.1 M PB. Heating the 0.1 M PM solution to 50–60 °C and addition
•••
•
••••
••••
••
a b
dc
e f
Figure 2 | Clearing reagents and steps. (a) Prepare the clearing reagents in visibly labeled glass bottles. (b) Perform tissue clearing in small glass vials (2–3 ml), which are easy to open and close. Transfer the postfixed organs into glass vials and immediately fill with the first clearing solution. (c,d) Place the glass vials with the tissue and clearing solution on to a rotating wheel (c) and keep the samples in the dark (d). Rotate the samples until the end of incubation time. (e) Next, remove the clearing solution with a Pasteur pipette and add the next clearing solution. (f) At the end of clearing, the tissues should look transparent. The fixed mouse brains shown in this figure were collected in accordance with governmental and institutional guidelines for the use of laboratory animals. The Genentech Institutional Animal Care and Use Committee approved all mouse protocols.

©20
12 N
atu
re A
mer
ica,
Inc.
All
rig
hts
res
erve
d.
protocol
1988 | VOL.7 NO.11 | 2012 | nature protocols
of a few NaOH pellets help dissolve PFA faster. If NaOH is added, readjust the pH to 7.4 using HCl. Finally, filter the solution in a chemical hood. PFA for use as a fixative can be stored at 4 °C for up to 1–2 months. ! cautIon PFA is a very toxic reagent. Avoid inhalation or contact with skin and eyes. Use proper gloves and a mask to handle PFA and NaOH (Table 2). ! cautIon Follow the relevant institutional rules for using and discarding waste material and chemicals.THF (99–100%) Transfer 100 ml of stock chemical into a small glass bottle (100 ml) to avoid repetitive opening of stock bottles. Label the bottles clearly. Store the solution in the dark, tightly sealed. To obtain the best results, do not use the same working solutions for more than 2 weeks. ! cautIon Prepare THF in a fume hood and in a glass bottle with a compatible lid. THF is toxic; avoid inhalation or contact with skin and eyes. Use proper gloves and a mask when handling THF (Table 2). ! cautIon When THF is stored over months to years, it may form peroxides, which can be explosive. Check the peroxide levels with peroxide test strips before using the old stocks. Follow the guide-lines for peroxide-forming compounds carefully (http://www.sigmaaldrich.com/chemistry/solvents/learning-center/peroxide-formation.html). In addi-tion, if the large THF bottles (e.g., 0.5–1 liter) are stocked for longer times, the bottles can be covered with an inert gas such as argon to prevent access of oxygen. crItIcal Use the highest purity of THF (99–100%). Order the stock solution as small-volume units (e.g., 100-ml bottles) to be able to open a fresh stock every time the working solutions are prepared. If larger stock volumes are used (e.g., 0.5–1 liter), use a syringe through the lid to remove the desired volume from the bottle.THF working solutions (50, 70 and 80% (vol/vol)) Prepare 50, 70 and 80% (vol/vol) THF working solutions in distilled water. For example, for 50% THF working solution, add 50 ml of THF and 50 ml of distilled water in a 100-ml glass bottle and mix by shaking it for a few minutes. Prepare each THF working solution in a different glass bottle and label them clearly (Fig. 2a). Store the solution in the dark, tightly sealed, at room tempera-ture. Do not use the same working solutions for more than 2 weeks. ! cautIon Prepare THF working solutions in a fume hood and in a glass bottle with a compatible lid. THF working solution is toxic; avoid
inhalation or contact with skin and eyes. Use proper gloves and a mask when handling THF (Table 2).DCM (99–100%) Transfer 100 ml of stock chemical into a small glass bot-tle (100 ml) to avoid repetitive opening of stock bottles. Label the bottles clearly. ! cautIon Prepare DCM in a fume hood and in a glass bottle with a compatible lid. DCM is toxic; avoid inhalation or contact with skin and eyes. Use proper gloves and a mask when handling it (Table 2). Store the solutions in the dark, tightly sealed, at room temperature. For best results, do not use working solutions that are older than 2 weeks. DBE (99–100%) Transfer 100 ml of stock chemical into a small glass bot-tle (100 ml) to avoid repetitive opening of stock bottles. Label the bottles clearly. Store the solutions in the dark, tightly sealed, at room temperature. To obtain the best results, do not use working solutions that are older than 2 weeks. ! cautIon Prepare DBE in a fume hood and in a glass bottle with a compatible lid. DBE is toxic; avoid inhalation or contact with skin and eyes. Use proper gloves and a mask when handling it (Table 2). ! cautIon When DBE is stored over months to years, it may form perox-ides, which can be explosive. Check the peroxide levels with peroxide test strips before using the old stock. Follow the guidelines for peroxide-form-ing compounds carefully: (http://www.sigmaaldrich.com/chemistry/sol-vents/learning-center/peroxide-formation.html). In addition, if the large DBE bottles (e.g., 0.5–1 liter) are stocked for longer times, the bottles can be covered with an inert gas such as argon to prevent access of oxygen. crItIcal Use the highest purity of DBE (99–100%). Order the stock solution as small volume units (e.g., 100-ml bottles) to be able to open a fresh stock every time the working solutions are prepared. If larger stock volumes are being used (e.g., 0.5–1 liter), use a syringe through the lid to remove the desired volume from the bottle.BABB Add 1 volume of benzyl alcohol (50 ml) and 2 volumes of benzyl benzoate (100 ml) into a 250-ml bottle and mix on a shaker (or stirrer) for 5 min. To obtain the best results, do not use working solutions for more than 2 weeks. ! cautIon Prepare BABB in a fume hood and in a glass bottle with compatible lids. BABB is toxic; avoid inhalation or contact with skin and eyes. Use proper gloves and a mask when handling it (Table 2).
proceDuretissue preparation ● tIMInG 1 h to 1 d1| Anesthetize the animal using 2.5% (vol/vol) Avertin (0.5 ml per 25 g body weight intraperitoneally) and perfuse it using 0.1 M PB (PB, pH 7.4) for 5–10 min followed by 30–40 min of 4% (wt/vol) PFA in 0.1 M PB at a rate of 3 ml min − 1. Alternatively, ×1 PBS solution can be used instead of 0.1 M PB. The perfusion time can be shortened as long as the blood is completely removed from the tissue.! cautIon The experimental animals must be handled in accordance with the relevant governmental and institutional regulations regarding the use of animals for research purposes.? troublesHootInG
2| Dissect the organs of interest and postfix them by immersion in 4% (wt/vol) PFA overnight. This step can be skipped or shortened to a few hours, especially for small tissues such as spinal cords or mammary glands. crItIcal step Avoid overfixation if possible, as the PFA increases the autofluorescence background (especially if the organs are taken from aged animals).
3| Remove the extra tissues (connective tissue, meninges or dura mater) surrounding the organ. This can be done by placing the tissues in a Petri dish filled with PBS and removing the extra tissues with forceps under a binocular stereoscope.
tissue clearing ● tIMInG 3 h to 3 d4| Transfer the organs from the postfixation solution (4% (wt/vol) PFA) directly into the glass vial, and immediately add the first clearing solution (order is as listed in table 1; i.e., the first clearing solution is 50% (vol/vol) THF) using a Pasteur pipette (Fig. 2b).
5| Close the lid of the glass vial and place it onto a turning wheel (Fig. 2c). crItIcal step All the clearing steps should be performed in a fume hood at room temperature.

©20
12 N
atu
re A
mer
ica,
Inc.
All
rig
hts
res
erve
d.
protocol
nature protocols | VOL.7 NO.11 | 2012 | 1989
6| Cover the samples with aluminum foil (Fig. 2d) to keep the samples in the dark. Rotate the samples using the wheel at constant speed (20–40 r.p.m.) for the indicated time points (table 1). This step is the same for all the clearing steps. The only differences are the clearing solution in the glass vial and the respec-tive incubation times.
7| When the time for the current clearing step has passed, stop the wheel and discard the clearing solution into appro-priate waste containers (kept in a hood). Immediately add the next clearing solution (see order in table 1) using a fresh Pasteur pipette and restart the wheel (Fig. 2e). You do not need to remove the glass vial from the wheel, but pay attention not to spill solutions if there are many samples on the wheel at different angles.
8| Repeat Step 7 until the last clearing solution (DBE) is added. To achieve a good transparency, DBE incubation time should be optimized according to the thickness and type of the tissue. Whereas 15–20 min DBE incubation is sufficient for spinal cord tissue, which is relatively thin (1–2 mm), larger organs may require longer DBE incubation (e.g., 6 h to overnight incubation for adult mouse brain) (Fig. 2f).? troublesHootInG
9| Proceed to imaging as soon as clearing is sufficient. The cleared tissues will be transparent and hard (an example of uncleared versus cleared brain is shown in Fig. 3a,b, respectively). Note that even though the cleared tissue may shrink in size11, the proportion and general anatomy of the structures are preserved in cleared tissue (see Fig. 3c compared with uncleared tissue in Fig. 3d). pause poInt The DBE solution degrades the fluorescent signal over time. Therefore, the best result is obtained by imaging immediately after proper clearing is achieved. The sample can still be imaged the next day, but the signal will be weaker.
Imaging the cleared tissues ● tIMInG 1–2 h10| Image tissues. For imaging large tissues, we use an ultramicroscope (Fig. 3e; option A). The steps for using an ultra-microscope below can readily be modified if another light-sheet illumination microscope with a large scan area is used. The cleared tissues can also be imaged using confocal or two-photon microscopy to obtain high-resolution scans (option B), although the scan field will be relatively small compared with ultramicroscopy. To be able to image the tissue using confocal or two-photon microscopy, the tissue should be mounted on a glass slide with a coverslip as described in option B. Mounted samples can be imaged with confocal or two-photon microscopy as in any other sample imaging. Cleared tissue can also be imaged using fluorescent wide-field or binocular microscopy (option C). This allows a quick exploration of the cleared tissue. Because the fluorescence excitation light will stimulate the entire sample from top to bottom, these imaging methods cannot collect high-resolution images, particularly in thick tissues. The steps described below (option C) can also be used in laser-scanning wide-field microscopes such as the Leica LSI, which can collect high-resolution image stacks.
a
Unc
lear
edC
lear
ed
b
f g
ec
d
1 mm
h
ji k
Figure 3 | Ultramicroscopy setup. (a,b) A mouse brain before (a) and after clearing (b). (c,d) A coronal tissue section from uncleared brain imaged by wide-field fluorescence (c) compared with optical projection of a cleared brain in coronal view imaged by ultramicroscopy (d) demonstrating that the overall structures and proportions of the tissue are preserved after clearing. Scale bar, 1 mm. (e) The ultramicroscopy setup. (f) The reservoir of sample holder on the ultramicroscope is filled with the final clearing solution, DBE (white arrow). (g,h) Mount the cleared tissues onto the sample holder using the screw (g,h; red arrows). (i) The laser will travel perpendicularly to the screw (red arrows). (j) Adjust the focus using the binocular view. (k) Subsequently, switch the view to the camera and adjust the fine focus using the imaging software. The fixed mouse brains shown in this figure were collected in accordance with governmental and institutional guidelines for the use of laboratory animals. The Genentech Institutional Animal Care and Use Committee approved all mouse protocols.

©20
12 N
atu
re A
mer
ica,
Inc.
All
rig
hts
res
erve
d.
protocol
1990 | VOL.7 NO.11 | 2012 | nature protocols
? troublesHootInG(a) ultramicroscopy imaging (i) Fill the imaging reservoir with the final clearing solution, DBE (Fig. 3f). (ii) Gently mount the sample using the screw on the sample holder (Fig. 3g,h).
crItIcal step Pay attention to the direction of the laser scan and align the tissue accordingly on the sample holder (Fig. 3g–i).
(iii) Place the sample holder with the tissue into the imaging reservoir with the DBE solution (Fig. 3i). (iv) From the imaging software, choose the ‘no filter’ option and start the laser scan in view mode.
crItIcal step Use low laser power at this point in order to avoid bleaching the sample before the real scan. In addition, change the z-position from time to time (about every 30 s) if focusing takes time.
(v) Move the tissue using the x-, y- and z-stage controller of the microscope until the laser sheet goes through the sample (Fig. 3i). (vi) Dip the lens into the imaging reservoir slowly.
! cautIon Do not dip the objectives directly into DBE. Use a lens cap, which is resistant to DBE solution. (vii) Lower the lens until you see a clear focus through the eyepiece of the microscope (Fig. 3j). (viii) Stop the scan and switch the view to the microscope by pulling out the controller. (ix) Adjust the optimum scan settings. We used the following parameters for imaging cleared adult mouse brains: laser
power, 100%; attenuation, 100%; camera, 200–400 Hz; autosaving directly to the hard drive. (x) To adjust the fine focusing, start the scan in view mode and find the best focus using the fine focus handle on the
microscope (Fig. 3k). crItIcal step Before adjusting the focus, choose the desired magnification. The fine focus will be different for different magnifications.
(xi) Stop the scan. (xii) If an ultramicroscope system with both-side laser illumination is used, align the left and right laser as follows.
First, choose only one side, left or right, and then start the scan in view mode. Drag the focus slider of the chosen side until the image looks clean and focused. Next, stop the scan and choose the other side and do the same adjustments until you see a complementary image. Stop the scan after the adjustments. Activate the scan on both sides and start the view scan. In addition to two separate images coming from right and left scans, a merge image should appear. If the left and right sides of the sample are not evenly illuminated on the merge image, adjust the focus again using the sliders. crItIcal step Left and right sides should have complementary scan views.
(xiii) After focus and laser adjustments, define the scan field. In the view mode, change the z-position using the z-controller of the stage to find the start position of the scan. Mark the position as start.
(xiv) Move the z-controller to the opposite direction to find the end of the scan. Mark the position as final. (xv) Stop the scan and define the z-steps of the scan. (xvi) Name the scan. For convenience during image analysis, include the following in the title: zoom factor, z-steps, laser
line used and date of the scan if the software does not automatically keep this information. For example, sample1_2×_2µm_488_2012.01.11.
(xvii) Start the actual scan.(b) Imaging the tissues with confocal or two-photon microscopy ● tIMInG 1 h (i) Use dental cement or glass paint (natural color) to create a pool at least as thick as the tissue (Fig. 4a,b).
Alternatively, FastWell glass slides can be used. crItIcal step Dental cement is preferable to glass paint, because DBE dissolves most glass paints.
(ii) Place the tissue in the middle of the pool by directing the surface to be imaged upward (Fig. 4b, white arrowheads). (iii) When the dental cement has hardened enough but not completely, fill the pool with DBE and cover it with a coverslip
(Fig. 4a,b). (iv) Gently apply pressure on the coverslip to push it close to the tissue until the coverslip touches the tissue. Ideally, the
gap between the coverslip and tissue should be minimal in order to be able to image the tissue deeper, because the maximum possible imaging depth is equal to the working distance of the used objective (the distance from the objective tip and focus point on the tissue). ! cautIon Place the coverslip slightly away from the edges of the glass slide (Fig. 4a, away from the ‘ + ’ signs) so that when the slide is placed on the sample holder of the microscope, it directly grasps the slide and not the coverslip.
(v) Place the slide with the sample under the two-photon or confocal microscope. Use the mounting medium required for the objective being used (Fig. 4c): oil (refractive index ~1.515) or water (refractive index ~1.33). We recommend using an oil-immersion objective, as the refractive index is closer to that of DBE (refractive index ~1.56).
(vi) Set the z-dimension of the scan by moving the z-controller in both directions and defining the start and end point of the scan. Note that the maximum z-thickness of the scan is limited by the working distance of the objective. Hence,

©20
12 N
atu
re A
mer
ica,
Inc.
All
rig
hts
res
erve
d.
protocol
nature protocols | VOL.7 NO.11 | 2012 | 1991
for convenience, prepare tissue samples with dental cement mounting only as thick as the working distance of the lens that is used. Typically, we used ×20 (0.95–NA, Olympus) or ×25 (1.05–NA, Olympus) water-immersion objectives for two-photon microscopy with a working distance of 2.2 mm, and ×10 (0.25–NA, Leica) or ×40 (1.25–NA, Leica) for con-focal microscopy with a working distance of 4 mm and 100 µm, respectively. The air objectives have a longer range of working distance. However, as they do not touch the samples, sample mounting is not required. They can be imaged in a glass Petri dish filled with DBE as described above.
(vii) Adjust the laser power to as low as possible. Imaging of cleared tissues requires considerably less laser power com-pared with uncleared tissues; hence, sample bleaching is not a common issue. In case of bleaching, follow the guidelines listed in troubleshooting. If a thick tissue (e.g., 2 mm) is imaged by a two-photon microscope, the laser might be increased as the scan goes deeper and deeper. The Olympus software (Fluoview) that we used allows defining different acquisition parameters (laser power and gain) at different imaging depth, which helps compensate for the signal reduction in deeper regions. Check whether there is such a function of the software that you use.
(viii) Define the z-step size on the software. Use the optimum resolution of the objective, which is the best resolution that can be produced by the objective that is used.
(ix) Start the scan. (x) If needed, scan overlapping regions (at least 10% overlap) of the sample with confocal or two-photon microscopy to
be able to image a larger area. This is called tiling or stitching, and many commercially available confocal microscopes are equipped with this function. A motorized stage might be needed to perform tiling automatically by the software. crItIcal step Note that cleared samples, which are imaged by ultramicroscopy, can be further imaged with con-focal or two-photon microscopy by mounting them on a glass slide as described above. If the sample is too big to mount, or if the region of interest is deeper than the possible imaging depth, simply chop the sample using a blade and mount the pieces as described. As DBE degrades the fluorescence signal over time, it is best to prepare the samples for imaging as soon as possible.
(c) Imaging the tissue with wide-field fluorescence or binocular microscopes ● tIMInG 15 min (i) Fill a glass Petri dish with DBE solution (Fig. 4d). (ii) Place the cleared tissue in the middle of the Petri dish (Fig. 4d).
crItIcal step DBE solution should be slightly above the cleared tissue; if this is not the case, add more DBE solution. To avoid spilling the DBE solution when the dish is moved around, do not fully fill the Petri dish with DBE.
(iii) Place the glass Petri dish with the tissue under the microscope (Fig. 4d). (iv) Turn on the shutter of the arc lamp and observe the tissue with a low-magnification air objective.
crItIcal step Use only air objectives. The objective should not touch the DBE, which can harm it. (v) Make snapshots at different focal points. The focus range should be improved when cleared tissues are observed.
? troublesHootInGTroubleshooting advice can be found in table 3.
a b
cd
Figure 4 | 3DISCO with wide-field fluorescence, confocal and two-photon microscopy. To obtain high-resolution images, the cleared tissues can be imaged using confocal and two-photon microscopy. (a) To this end, the tissue should be mounted on a glass slide. (b) First, create a thick border using glass paint or dental cement, place the cleared tissues in the middle of the pool (white arrowheads) and then fill the pool with the final clearing solution (DBE) and cover with a glass coverslip. (c) Image the slide preferentially with an upright confocal or two-photon microscope using proper immersion for the lens. (d) Alternatively, cleared tissues can be observed with a wide-field fluorescence microscope using a glass Petri dish filled with DBE. The fixed mouse tissues shown in this figure were collected in accordance with governmental and institutional guidelines for the use of laboratory animals. The Genentech Institutional Animal Care and Use Committee approved all mouse protocols.
©20
12 N
atu
re A
mer
ica,
Inc.
All
rig
hts
res
erve
d.
protocol
1992 | VOL.7 NO.11 | 2012 | nature protocols
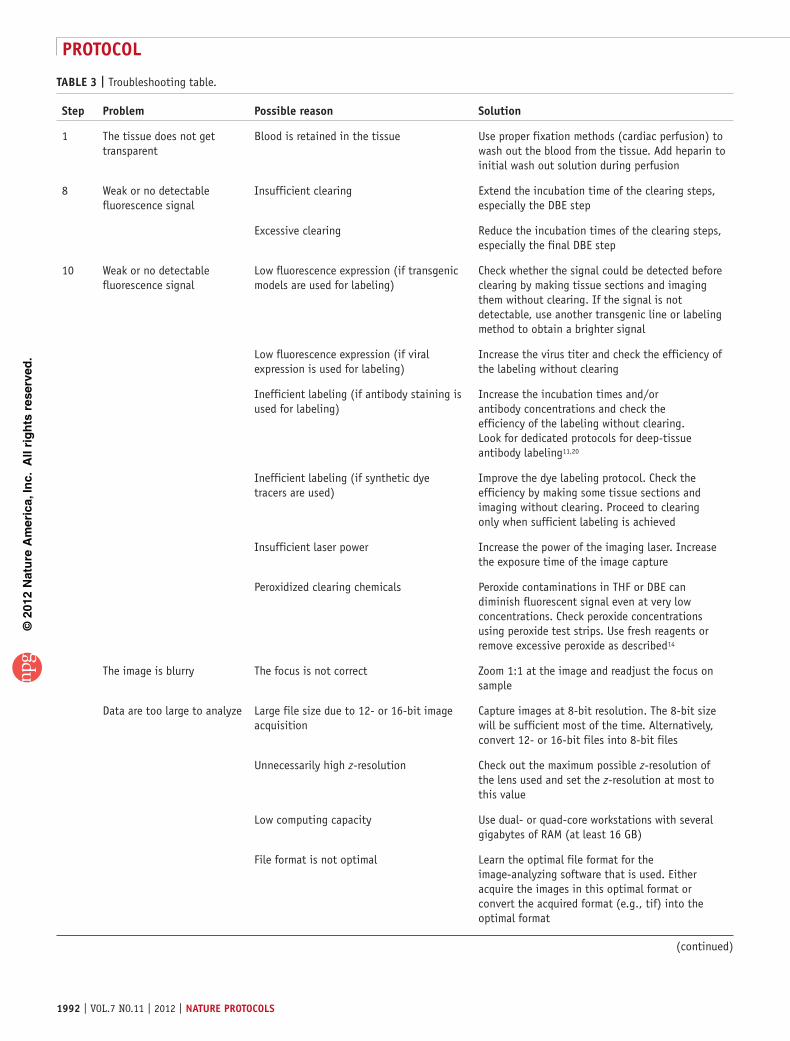
table 3 | Troubleshooting table.
step problem possible reason solution
1 The tissue does not get transparent
Blood is retained in the tissue Use proper fixation methods (cardiac perfusion) to wash out the blood from the tissue. Add heparin to initial wash out solution during perfusion
8 Weak or no detectable fluorescence signal
Insufficient clearing Extend the incubation time of the clearing steps, especially the DBE step
Excessive clearing Reduce the incubation times of the clearing steps, especially the final DBE step
10 Weak or no detectable fluorescence signal
Low fluorescence expression (if transgenic models are used for labeling)
Check whether the signal could be detected before clearing by making tissue sections and imaging them without clearing. If the signal is not detectable, use another transgenic line or labeling method to obtain a brighter signal
Low fluorescence expression (if viral expression is used for labeling)
Increase the virus titer and check the efficiency of the labeling without clearing
Inefficient labeling (if antibody staining is used for labeling)
Increase the incubation times and/or antibody concentrations and check the efficiency of the labeling without clearing. Look for dedicated protocols for deep-tissue antibody labeling11,20
Inefficient labeling (if synthetic dye tracers are used)
Improve the dye labeling protocol. Check the efficiency by making some tissue sections and imaging without clearing. Proceed to clearing only when sufficient labeling is achieved
Insufficient laser power Increase the power of the imaging laser. Increase the exposure time of the image capture
Peroxidized clearing chemicals Peroxide contaminations in THF or DBE can diminish fluorescent signal even at very low concentrations. Check peroxide concentrations using peroxide test strips. Use fresh reagents or remove excessive peroxide as described14
The image is blurry The focus is not correct Zoom 1:1 at the image and readjust the focus on sample
Data are too large to analyze Large file size due to 12- or 16-bit image acquisition
Capture images at 8-bit resolution. The 8-bit size will be sufficient most of the time. Alternatively, convert 12- or 16-bit files into 8-bit files
Unnecessarily high z-resolution Check out the maximum possible z-resolution of the lens used and set the z-resolution at most to this value
Low computing capacity Use dual- or quad-core workstations with several gigabytes of RAM (at least 16 GB)
File format is not optimal Learn the optimal file format for the image-analyzing software that is used. Either acquire the images in this optimal format or convert the acquired format (e.g., tif) into the optimal format
(continued)

©20
12 N
atu
re A
mer
ica,
Inc.
All
rig
hts
res
erve
d.
protocol
nature protocols | VOL.7 NO.11 | 2012 | 1993
● tIMInGSteps 1–3, tissue preparation: 1 h to 1 dSteps 4–9, tissue clearing: 3 h to 3 dStep 10, imaging the cleared tissues: 1–2 h
antIcIpateD results3DISCO is based on optical clearing of tissues to match the refractive indices throughout the tissue. When cleared tissues are imaged in the final clearing solution, which has the same refractive index as the cleared tissue, the imaging light does not scatter and can penetrate through the entire tissue. This allows acquisition of fluorescent signals at the highest resolution that can be achieved by the various microscope systems.
We have used 3DISCO to study neuronal degeneration and regeneration, as well as glia cell reactions after spinal cord injury11 and traumatic brain injury (TBI) (A.E. and M.S., unpublished data). We quantified the length of the regenerating axons over 5 mm11. For tracing of axons in the spinal cord, we mostly used the semiautomated filament-tracing tool in Amira (supplementary Video 1). 3DISCO also allowed us to assess the density and distribution of glia cells after the lesion. We developed algorithms to automatically detect and quantify glia cell bodies and map their distribution in the tissue11. Notably, 3DISCO allowed us to scan the entire mouse brain and hippocampus at a resolution of a few micrometers (Fig. 1 and supplementary Videos 2 and 3). By using these scans, we could analyze the patterns of neurodegeneration in the brain after TBI (A.E. and M.S., unpublished data). This method also allows visualization of blood capillaries at high resolu-tion in the entire organs27 (Fig. 5), permitting details of vasculature in the brain (Fig. 5a–c) and spinal cord (Fig. 5d,e and supplementary Video 4) to be assessed.
3DISCO is a versatile method that can be applied to any tissue. For example, integration of transplanted
table 3 | Troubleshooting table (continued).
step problem possible reason solution
Sample bleaching Laser power is too strong Decrease the laser power and increase the gain of the acquisition to compensate
Weak sample labeling Troubleshoot to increase the labeling of the samples as described above (see Step 10, ‘weak or no detectable fluorescence signal’)
Repetitive imaging Avoid imaging the same location on the samples repetitively. If needed, optimize the acquisition set-tings on the tissue away from the region of interest
a
2 mm
b
250 µm
d
c f
e
Figure 5 | Typical results obtained from 3DISCO of vasculature in the brain and spinal cord. The vasculature was labeled in vivo with lectin FITC and imaged by ultramicroscopy. (a–c) 3D reconstruction of the brain vasculature shown in color-code map (a), transparent grayscale (b) and volume rendering (c) (z-step: 3 µm, the number of optical sections: 1,851, zoom: ×1.6 to ×0.8 magnification on ×2.0 lens, scan duration: ~1 h). (d–f) 3D reconstruction of the spinal cord vasculature shown in color-code map (d), transparent grayscale (e) and volume rendering (f) (z-step: 2 µm, the number of optical sections: 616, zoom: ×6.4 to ×3.2 magnification on ×2.0 lens, scan duration: ~30 min). The fixed mouse brains and spinal cords were collected in accordance with governmental and institutional guidelines for the use of laboratory animals. The Genentech Institutional Animal Care and Use Committee approved all mouse protocols.

©20
12 N
atu
re A
mer
ica,
Inc.
All
rig
hts
res
erve
d.
protocol
1994 | VOL.7 NO.11 | 2012 | nature protocols
tissues such as induced pluripotent stem cell grafts or the distribution and volume of tumors in large organs such as lungs can easily be assessed in a very short time (Fig. 6a–d; clearing and imaging in total 3–4 h). Similarly, information about the vasculature of tumor tissues can be obtained within hours. Assessment of such crucial information should allow easy and quick screening of molecules that modulate tumor size and location, as well as vasculature, in tumor tissues. As further examples of the versatility of 3DISCO, Figure 6e–h shows results from cleared and imaged antibody-labeled whole-mount mammary glands, and Figure 7 shows imaging of immune cells within the spleen (Fig. 7a–f) and lymph nodes (Fig. 7g–l). Moreover, 3DISCO has applications in clinical pathology, such as in cancer staging. Thus, 3DISCO is an extremely straightfor-ward and reproducible protocol that can be applied to various organs to obtain histological data in a short time compared with traditional tissue sectioning methods.
Figure 6 | Typical results obtained from 3DISCO of lung tumors and mammary glands. (a–d) In KrasLSLG12D mice, the G12D oncogenic allele of Kras was induced specifically in bronchiolar epithelial cells. The lung tumors were initiated using a lentiviral Cre vector expressing doxycycline-inducible GFP28. Mice were treated with or without 2 mg ml − 1 doxycycline weekly to initiate GFP expression, and the lungs were collected 16 weeks after infection. (a,b) The control lungs without tumor (a) and the infected lungs with the tumor were cleared and imaged using Leica LSI (b). (c,d) 3D reconstruction of the entire lung (gray) with the tumors (red) in horizontal (c) and sagittal view (d) (z-step: 203 µm, the number of optical sections: 25, zoom: ×2, scan duration: ~3 min). (e–h) The epithelial and smooth muscle cells of an entire mammary gland of a wild-type (C57BL/6) mouse were immunostained as follows: rat anti-mouse CD24 primary (1:100) and Alexa Fluor 488 secondary antibodies used to label epithelial cells (e) and mouse anti–smooth muscle actin antibody directly conjugated to Cy3 (1:500) were used to label smooth muscle cells (f). The tissues were incubated with the primary antibody for 60 h at 4 °C (a total of 4 d staining protocol). (g,h) The merge is shown in g and as 3D view in h. The mouse lungs and mammary glands were collected in accordance with governmental and institutional guidelines for the use of laboratory animals. The Genentech Institutional Animal Care and Use Committee approved all mouse protocols.
Mam
mar
y gl
and
Epithelial cells(CD24 Ab staining)
Smooth muscle(actin Ab staining) Merge
Merge3D (cross view)
500 µm
e f g h
Control (no tumor)
Lung
1 mm
With tumors With tumors 3DWith tumors
3D (cross view)
a b c d
Figure 7 | Typical results obtained from 3DISCO of immune organs. We cleared and imaged immune cells in the spleen and lymph nodes from the following transgenic lines: a major histocompatibility complex II (MHCII)-GFP line expressing GFP as a fusion to endogenous MHCII primarily in dendritic cells, macrophages, B cells and monocytes; a CD11c-Venus line expressing the YFP variant, Venus, primarily in dendritic cells; and a CX3CR1-GFP line expressing GFP primarily in monocyte, macrophage and dendritic cell subsets. (a–c) 3D reconstruction of spleens from MHCII-GFP (a), CD11c-Venus (b) or CX3CR1-GFP (c) mice imaged using ultramicroscopy and color coded (blue, low cell density; red, high cell density; z-step: 2 µm, the number of optical sections: 850, zoom: ×2, scan duration: ~30 min). Scale bars (a–c), 500 µm. (d–f) Optical projections from the indicated regions in a–c, respectively. Scale bars (d–f), 25 µm. (g–i) 3D reconstruction of lymph nodes from MHCII-GFP (g), CD11c-Venus (h) or CX3CR1-GFP (i) mice imaged by two-photon microscopy and color coded (z-step: 2 µm, the number of optical sections: 377, zoom: ×25, scan duration: ~15 min). Scale bars (g–i), 200 µm. (j–l) Optical projections from the indicated regions in g–i, respectively. Scale bars (j–l), 100 µm. The fixed mouse lymph nodes and spleens were collected in accordance with governmental and institutional guidelines for the use of laboratory animals. The Genentech Institutional Animal Care and Use Committee approved all mouse protocols.
Spleen
500 µm 200 µm25 µm 100 µm
j
k
l
a
b
c
MH
CII-
GF
PC
D11
c-V
enus
CX
3CR
1-G
FP
Lymph node
d
e
f
g
h
i
j
k
l

©20
12 N
atu
re A
mer
ica,
Inc.
All
rig
hts
res
erve
d.
protocol
nature protocols | VOL.7 NO.11 | 2012 | 1995
Note: Supplementary information is available in the online version of the paper.
acknoWleDGMents We thank M. Chang and F. Yeh for critically reading the manuscript, and C. Chalouni, H. Ngu and L. Komuves for assistance with large-scale imaging microscopy and macros. We thank J. Sanes (Washington University in St. Louis) for the Thy-1 GFP (GFP-M) line, T. Jacks (Massachusetts Institute of Technology) for KrasLSLG12D mice, H. Ploegh (Massachusetts Institute of Technology) for MHCII-GFP mice, M. Nussenzweig (Rockefeller University) for CD11c YFP-Venus mice, and D.R. Littman (New York University) for CX3CR1-GFP mice. We thank C. Murriel (Genentech) for providing the lung tissues and C. Sakanaka (Genentech) for providing mammary gland tissues. The work is supported by Genentech and the Hertie foundation. N. Jährling was supported by the Theodor Körner Fonds.
autHor contrIbutIons A.E. initiated the current project, designed and performed all the experiments, analyzed the data, and made all the figures and videos. A.E. and M.S. wrote the paper. C.D.H. prepared the immune organs and J.G.E. provided transgenic mice. K.B. and N.J. developed and performed various clearing protocols. A.E., K.B., N.J., C.P.M., F.H., F.B., M.S. and H.-U.D. contributed to the development of the clearing protocol at various stages. H.-U.D. led the development of the ultramicroscopy and clearing technology. All authors edited the paper.
coMpetInG FInancIal Interests The authors declare competing financial interests (see the HTML version of this article for details).
Published online at http://www.nature.com/doifinder/10.1038/nprot.2012.119. Reprints and permissions information is available online at http://www.nature.com/reprints/index.html.
1. Steward, O., Zheng, B. & Tessier-Lavigne, M. False resurrections: distinguishing regenerated from spared axons in the injured central nervous system. J. Comp. Neurol. 459, 1–8 (2003).
2. Tuchin, V. Tissue Optics: Light Scattering Methods and Instruments for Medical Diagnosis (SPIE Press, 2007).
3. Boas, D. A fundamental limitation of linearized algorithms for diffuse optical tomography. Opt. Express 1, 404–413 (1997).
4. Genina, E.A., Bashkatov, A.N. & Tuchin, V.V. Tissue optical immersion clearing. Expert Rev. Med. Devices 7, 825–842 (2010).
5. Spalteholz, W. Über das Durchsichtigmachen von menschlichen und tierischen Präparaten (S. Hierzel, 1914).
6. Keller, P.J. & Dodt, H.U. Light sheet microscopy of living or cleared specimens. Curr. Opin. Neurobiol. 22, 138–143 (2012).
7. Zhao, Q.L. et al. [In vivo reflectance spectroscopy study of different clearing agents on human skin optical clearing]. Guang Pu Xue Yu Guang Pu Fen Xi 31, 302–307 (2011).
8. Bucher, D., Scholz, M., Stetter, M., Obermayer, K. & Pfluger, H.J. Correction methods for three-dimensional reconstructions from confocal images: I. Tissue shrinking and axial scaling. J. Neurosci. Methods 100, 135–143 (2000).
9. Gerger, A. et al. Diagnostic applicability of in vivo confocal laser scanning microscopy in melanocytic skin tumors. J. Invest. Dermatol. 124, 493–498 (2005).
10. Dodt, H.U. et al. Ultramicroscopy: three-dimensional visualization of neuronal networks in the whole mouse brain. Nat. Methods 4, 331–336 (2007).
11. Erturk, A. et al. Three-dimensional imaging of the unsectioned adult spinal cord to assess axon regeneration and glial responses after injury. Nat. Med. 18, 166–171 (2012).
12. Becker, K., Jährling, N., Kramer, E.R., Schnorrer, F. & Dodt, H.U. Ultramicroscopy: 3D reconstruction of large microscopical specimens. J. Biophotonics 1, 36–42 (2008).
13. Jährling, N. Applications of Ultramicroscopy to Neurobiology and Methodological Improvements. Ph.D. thesis, Universität Oldenburg, 2011. (Springer, 2012, in press).
14. Becker, K., Jährling, N., Saghafi, S., Weiler, R. & Dodt, H.U. Chemical clearing and dehydration of GFP expressing mouse brains. PLoS ONE 7, e33916 (2012).
15. Feng, G. et al. Imaging neuronal subsets in transgenic mice expressing multiple spectral variants of GFP. Neuron 28, 41–51 (2000).
16. Jährling, N., Becker, K., Schonbauer, C., Schnorrer, F. & Dodt, H.U. Three-dimensional reconstruction and segmentation of intact Drosophila by ultramicroscopy. Front. Syst. Neurosci. 4, 1 (2010).
17. Huisken, J., Swoger, J., Del Bene, F., Wittbrodt, J. & Stelzer, E.H. Optical sectioning deep inside live embryos by selective plane illumination microscopy. Science 305, 1007–1009 (2004).
18. Fuchs, E., Jaffe, J., Long, R. & Azam, F. Thin laser light sheet microscope for microbial oceanography. Opt. Express 10, 145–154 (2002).
19. Saghafi, S. et al. Image enhancement in ultramicroscopy by improved laser light sheets. J. Biophotonics 3, 686–695 (2010).
20. Yokomizo, T. et al. Whole-mount three-dimensional imaging of internally localized immunostained cells within mouse embryos. Nat. Protoc. 7, 421–431 (2012).
21. Nolte, C. et al. GFAP promoter-controlled EGFP-expressing transgenic mice: a tool to visualize astrocytes and astrogliosis in living brain tissue. Glia 33, 72–86 (2001).
22. Jung, S. et al. Analysis of fractalkine receptor CX(3)CR1 function by targeted deletion and green fluorescent protein reporter gene insertion. Mol. Cell. Biol. 20, 4106–4114 (2000).
23. Borrell, V., Yoshimura, Y. & Callaway, E.M. Targeted gene delivery to telencephalic inhibitory neurons by directional in utero electroporation. J. Neurosci. Methods 143, 151–158 (2005).
24. Miyamichi, K. et al. Cortical representations of olfactory input by trans-synaptic tracing. Nature 472, 191–196 (2011).
25. Conte, W.L., Kamishina, H. & Reep, R.L. Multiple neuroanatomical tract-tracing using fluorescent Alexa Fluor conjugates of cholera toxin subunit B in rats. Nat. Protoc. 4, 1157–1166 (2009).
26. Keller, P.J. & Stelzer, E.H. Quantitative in vivo imaging of entire embryos with digital scanned laser light sheet fluorescence microscopy. Curr. Opin. Neurobiol. 18, 624–632 (2008).
27. Jährling, N., Becker, K. & Dodt, H.U. 3D-reconstruction of blood vessels by ultramicroscopy. Organogenesis 5, 227–230 (2009).
28. Gray, D.C. et al. pHUSH: a single vector system for conditional gene expression. BMC Biotechnol. 7, 61 (2007).