Embed Size (px)
Citation preview
35-sWELDING JOURNAL
Introduction
Welding is a complex multiphysicsproblem related to plasma physics, elec-tro magnetism, and fluid dynamics in-cluding metallurgy. In addition, it is im-possible to observe the welding processdirectly because the pool and arc plasmaare very bright, and their temperaturesare exceedingly high. Therefore, varioustypes of research have been reported tomonitor the welding process. A represen-tative method is the checking of the cur-rent or voltage of gas tungsten arc (GTA)or gas metal arc (GMA) welding (Refs.1–3). There were more sophisticatedmethods that directly record the pool im-ages using a CCD camera or that use sucha camera combined with optical filtersand various light sources such as specificlaser or halogen lamps (Refs. 4, 5). How-ever, all of the aforementioned tech-niques are indirect techniques; specifi-cally, they do not provide any informationconcerning the phenomena occurring in-side the weld pool. In other words, theymerely present the predictability of beadshapes, resulting in a lack of scientific in-formation regarding the flow and relatedphenomena.
An impressive method that enablesthe pool to be observed directly is a real-time X-ray imaging system (Refs. 6, 7). X-rays transmitted through the workpiecein a laser keyhole welding process are fo-cused on a CCD camera and are then re-constructed as gray-scaled images in real
time. It is very useful to see the keyholeand pores instantaneously in the weld-ment during the process, as it is possibleto monitor the bead formation process.In spite of these advantages, it is difficultto construct the system in the actual pro-duction area, as it is expensive comparedto conventional monitoring methods. Ad-ditionally, there are concerns regardinghealth problems related to radiation. Fur-thermore, the information availablethrough this system remains insufficientif one wishes to comprehend the physicalmeanings of the welding process. Theachieved images are two-dimensional,gray-scaled, and comparatively rough,making it difficult to understand the de-tails of the flow in the X-ray images.
In this area, computer simulations cangreatly facilitate the comprehension ofmolten pool dynamics. Although theanalysis of a molten pool based on com-putational fluid dynamics is not a com-plete answer to the questions regardingheat and mass transfer problems in thewelding process, it provides a passableanswer. Simulation results show the flowof the molten pool and the formation ofthe weldment as well as its historical tem-perature profile. Hence, a number ofstudies regarding weld pool analysis havebeen reported since the 1980s.
In early simulations of arc welding, itwas impossible to accomplish a flowanalysis of molten metal that includedfree-surface tracking (Refs. 8, 9). How-ever, due to advances in computer andnumerical techniques, knowledge of thetotal flow patterns of the molten poolhave been achieved that include the ex-pression of the free surface (Refs. 10, 11),as well as the inclusion of droplets via afeeding wire (Refs. 12, 13).
For keyhole dynamics in the laserwelding process, a geometrically assumedkeyhole such as a cylindrical hole in aplate was typically used to analyze the ef-fects in early studies that did not incor-porate the expression of the free surfaceof molten material, as mentioned above
KEYWORDS
Gas Metal Arc Welding(GMAW)
LaserHybrid WeldingVolume of Fluid (VOF)KeyholeFresnel
J.-H. CHO and S.-J. NA ([email protected]) arewith Department of Mechanical Engineering,Korea Advance Institute of Science and Tech-nology, Yuseong-gu, Daejeon, Republic of Korea.
Three-Dimensional Analysis of Molten Pool in GMA-Laser Hybrid Welding
Analytical models of GMAW and laser keyhole welding are merged to achieve the simulation of hybrid welding considering the multiple
reflections of laser and the Fresnel absorption theory
BY J.-H. CHO AND S.-J. NA
ABSTRACT
A computational analysis of a moltenpool in laser-GMA hybrid welding isachieved including free-surface track-ing using the well-known volume offluid (VOF) method. The suggestedthree-dimensional transient numeri-cal model includes all the known ana-lytical key features of arc welding in-cluding electromagnetic force,buoyancy, and arc pressure. In addi-tion to the basic GTA model, moltendroplets are artificially generated andare allowed to fall down to the pool tocover the GMAW process. A keyholeanalysis model is merged to a GMAWsimulation model with the assumptionthat the interaction between the laserand the arc is negligible for conve-nience. The keyhole model is estab-lished on a unique phenomena that in-cludes multiple reflections, Fresnelabsorption model, and the recoil pres-sure in laser welding apart from the in-verse Bremsstrahlung absorption. Theresult shows the flow patterns of themolten pool in GMA-laser hybridwelding, and they are compared topreviously reported observation re-sults. The molten flow at the bottom ofthe keyhole rises up slowly, and there-fore a vortex can be observed through-out the molten pool. However, theflow pattern became increasinglycomplicated. The flow of the keyholeroot is split into three main streams,and one stream is continuously main-tained in the vortex.
WE
LD
ING
RE
SE
AR
CH
FEBRUARY 2009, VOL. 8836-s
(Ref. 14). Currently, keyhole dynamics in-cluding the evolutionary free-surfaceshape achieved by VOF (Ref. 15) or thelevel-set method are typically reported(Refs. 16, 17). One of the most importantfeatures of keyhole simulation is the mul-tiple reflection effect. If the laser beam isconsidered as a bundle of rays, it can beeasily understood that each of the raystravels inside the keyhole through multi-ple reflections at the keyhole wall until itescapes out of it. Therefore, the ray trac-ing profile inside the keyhole is entirelydependent on the external shape of thekeyhole, which means the keyhole surfaceexposed to laser rays (Ref. 18). Conse-quently, the exact keyhole profile and aray tracing algorithm are needed for everysingle time step in a simulation in order toobtain a precise energy distribution mapof the keyhole surface.
In this paper, the analysis of a three-dimensional molten pool analysis isachieved for a laser-GMA hybrid weldingprocess. Analytical models for GMAWand laser keyhole welding are merged torealize the hybrid welding process in acomputer simulation. A real-time ray trac-ing technique (Ref. 23) that takes into ac-count a discrete grid cell in the VOFmethod is adopted to realize a multiple re-flection effect for every time step accord-ing to the present keyhole profile. Thereare several assumptions and simplifica-tions used in the analysis. First, it is as-sumed that the arc plasma and the laser donot interact; consequently, they are onlymathematically superposed in the simula-tion. Secondly, both the arc and the laserare considered as surface heat flux with aGaussian distribution. Lastly, the effect ofshielding gas is not considered in theanalysis. The simulation was conductedusing the commercial package Flow3D.Suggested analytical model is already val-idated by comparing the simulation resultto the experiment (Refs. 23, 24).
Molten Pool Dynamics
To execute the molten pool analysis,
three governingequations are es-sential, as withother normal flu-idic problems.They are the conti-nuity equation, themomentum equa-tion, which here isreferred to as theNavier-Stokes equation, and the energyequation. The metallic fluid in this simu-lation is assumed as incompressible, lami-nar, and Newtonian.
Based on these assumptions, the gov-erning equations are expressed as follows.First, the continuity equation (Ref. 19),implies that the conservation of the mate-rial has the form shown in Equation 1.
In Equation 1, u, v, and w denote thevelocity component according to each axisin the Cartesian coordinates. Ax, Ay, andAz denote the fractional area open to theflow in each direction. t is the time, and ρ,P, μ, and Gz denote the density, pressure,viscosity, and gravitational acceleration inthe momentum equation, respectively.They can be expressed as follows:
Here, VF denotes the volume fractionin the cell in the VOF method (Ref. 20)and fx, fy, and fz indicate the viscous accel-eration rates as in Equations 5–7.
Where
fV
xA
yA
zA
zF
x xz y yz
z zz
= −
∂∂
( ) + ∂∂ ( )
+ ∂∂
( )
⎧
⎨⎪
1
ρ
τ τ
τ
⎪⎪
⎩⎪⎪
⎫
⎬⎪⎪
⎭⎪⎪
(7)
fV
xA
yA
zA
yF
x xy y yy
z yz
= −
∂∂ ( ) + ∂
∂ ( )+ ∂∂ ( )
⎧
⎨⎪
1
ρ
τ τ
τ
⎪⎪
⎩⎪⎪
⎫
⎬⎪⎪
⎭⎪⎪
(6)
fV
xA
yA
zA
xF
x xx y xy
z xz
= −
∂∂
( ) + ∂∂ ( )
+ ∂∂
( )
⎧
⎨⎪
1
ρ
τ τ
τ
⎪⎪
⎩⎪⎪
⎫
⎬⎪⎪
⎭⎪⎪
(5)
∂∂
+ ∂∂
+ ∂∂
+ ∂∂
⎧⎨⎪
⎩⎪
⎫⎬⎪
⎭⎪
= −
w
t VuA
w
xvA
w
ywA
w
zF
x y z
1
11(4)
ρ∂∂
+ +p
zf Gz z
∂∂
+ ∂∂
+ ∂∂
+ ∂∂
⎧⎨⎪
⎩⎪
⎫⎬⎪
⎭⎪
= −
v
t VuA
v
xvA
v
ywA
v
zF
x y z
1
11(3)
ρ∂∂
+p
yfy
∂∂
+ ∂∂
+ ∂∂
+ ∂∂
⎧⎨⎪
⎩⎪
⎫⎬⎪
⎭⎪
= −
u
t VuA
u
xvA
u
ywA
u
zF
x y z
1
11(2)
ρ∂∂
+p
xfx
∂∂
( ) + ∂∂ ( ) + ∂
∂( ) =
xuA
yvA
zwA
x y z0 (1)
∂∂
( ) + ∂∂ ( ) + ∂
∂( ) =
xuA
yvA
zwA
x y z0 (1)
WE
LD
ING
RE
SE
AR
CH
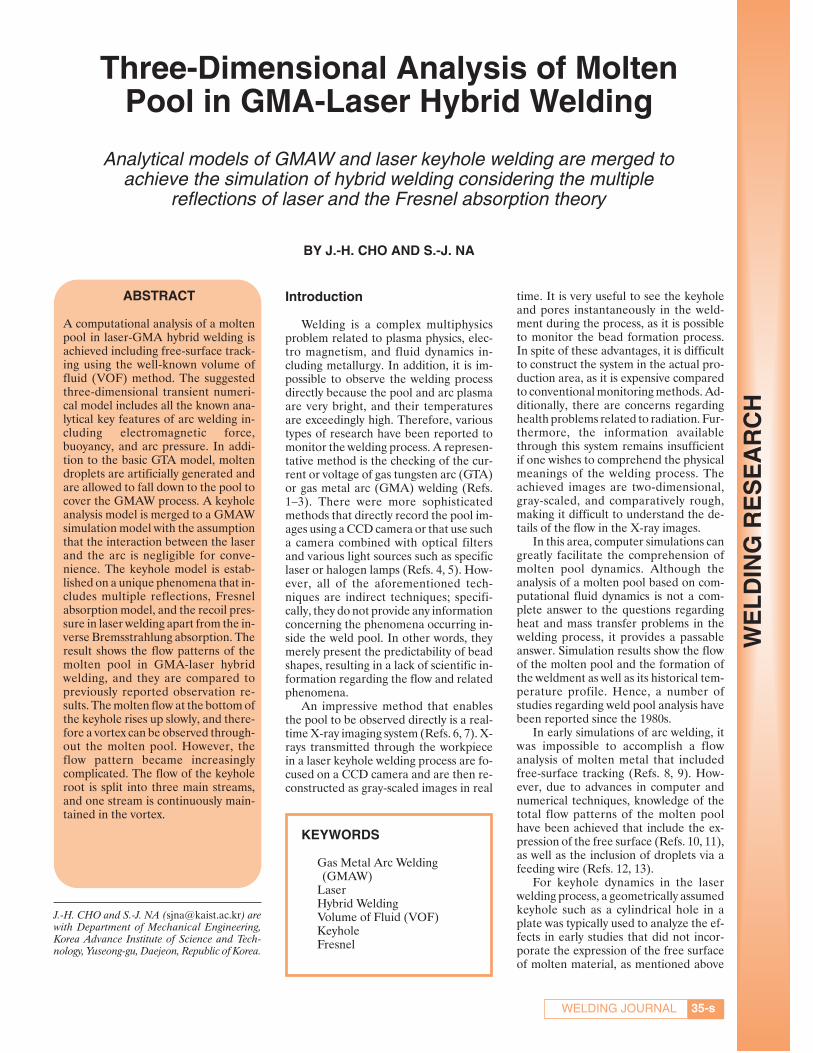
Fig. 1 — Schematic diagram of laser-GMA hybrid welding simulation.
Fig. 2 — 3-D perspective views of simulation results. A — t=0.45 s; B — t=1.8 s.
A
B
Additionally, the energy equation based onthe enthalpy method and the continuumformulation is described below.
Where f denotes
f T
if T T
T T
T Tif T T T
if T
S
L
L SS L( ) =
≤
−
−< <
0
1
,
,
, ≥≥
⎧
⎨
⎪⎪⎪
⎩
⎪⎪⎪ T
L
(11)
h C T f Lp f
= ⋅ + ⋅ (10)
∂∂
+ ⋅∇( ) = ∇ ⋅ ∇( )h
tV h K T�
ρ (9)
τ μxx
u
x
u
x
v
y
w
z= − ∂
∂− ∂
∂+ ∂
∂+ ∂
∂
⎛
⎝⎜
⎞
⎠⎟
⎧⎨⎪
⎩⎪
⎫⎬⎪
⎭2
1
3 ⎪⎪
= − ∂∂
− ∂∂
+ ∂∂
+ ∂∂
⎛
⎝⎜
⎞
⎠⎟
⎧⎨⎪
⎩⎪
⎫
,
τ μyy
v
y
u
x
v
y
w
z2
1
3⎬⎬⎪
⎭⎪
= − ∂∂
− ∂∂
+ ∂∂
+ ∂∂
⎛
⎝⎜
⎞
⎠⎟
⎧⎨⎪
,
τ μzz
w
z
u
x
v
y
w
z2
1
3⎩⎩⎪
⎫⎬⎪
⎭⎪
= − ∂∂
+ ∂∂
⎧⎨⎪
⎩⎪
⎫⎬⎪
⎭⎪= − ∂
,
,τ μ τ μxy xz
v
x
u
y
uu
z
w
x
v
z
w
yyz
∂+ ∂
∂
⎧⎨⎪
⎩⎪
⎫⎬⎪
⎭⎪
= − ∂∂
+ ∂∂
⎧⎨⎪
⎩⎪
⎫⎬⎪
,
τ μ⎭⎭⎪
(8)
WE
LD
ING
RE
SE
AR
CH
37-sWELDING JOURNAL
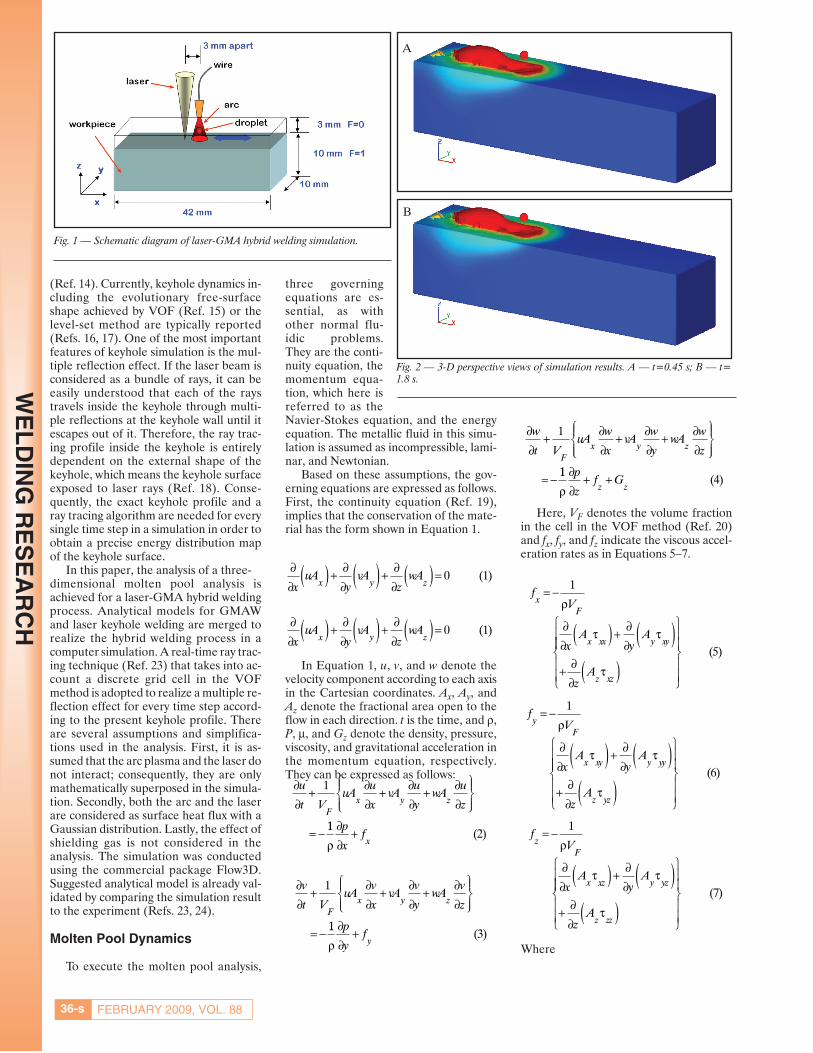
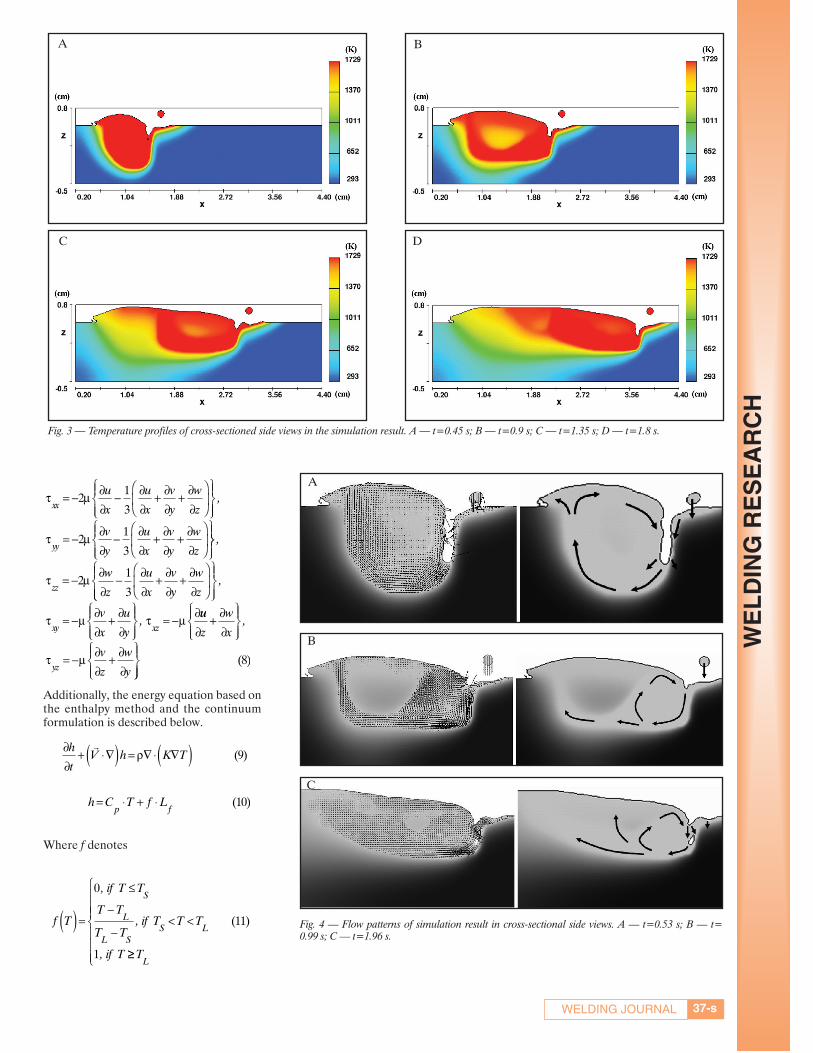
Fig. 3 — Temperature profiles of cross-sectioned side views in the simulation result. A — t=0.45 s; B — t=0.9 s; C — t=1.35 s; D — t=1.8 s.
Fig. 4 — Flow patterns of simulation result in cross-sectional side views. A — t=0.53 s; B — t=0.99 s; C — t=1.96 s.
A
A
B
C
B
C D
FEBRUARY 2009, VOL. 8838-s
WE
LD
ING
RE
SE
AR
CH
In this equation, h and K indicate theenthalpy and the thermal conductivity, re-spectively, and T, TL, and TS, correspond-ingly, denote the temperature, liquidustemperature, and solidus temperature.
In terms of the energy transfer, thelaser beam is a type of complex heatsource model that interacts with variousmaterials. However, it is generally treatedas a surface heat flux boundary conditionin an analysis, and there is a widely ac-cepted simple expression in the form of aGaussian function related to the TEM00
mode in laser activity with a mathematicalform as in the following equation (Ref.21):
In Equation 12, Q indicates the nomi-nal laser power and the coefficient 3 indi-cates that 95% of the total power exists in-side the area of the effective radius rL.Particularly, the laser beam is modeled tohave a diverging property along the trav-eling path in this research. This is more re-alistic than earlier models of a collimatedbeam. Therefore, the beam model be-comes a three-dimensional function by ap-pending Equation 13 to Equation 12. Thebeam radius is set so as to increase linearlyalong the path, with a focal radius r0 at thez0 position in the z axis.
The electric arc is modeled as a type ofsurface heat flux with a Gaussian distribu-tion shape. Its mathematical form is,therefore, similar to that of Equation 12exclusive of the diverging effective radius,which is changed to a fixed radius as in thefollowing:
Here, V and I are the voltage and cur-rent of the arc, respectively, and rA is thefixed effective radius of the arc. It is equalto 3 mm. In contrast to the equation of thelaser heat source, this equation is a two-dimensional function. Thus, its shape re-mains unchanged along the z axis.
After achieving the heat source mod-els, the pressure boundary conditionsmust be confirmed. In an arc weldingprocess, the pool experiences a small de-formation along its top surface due to thearc pressure caused by the massive flow ofarc plasma; this has the form of a Gauss-ian distribution as in the following equa-tion (Ref. 15):
For a laser beam welding case, thepressure boundary condition is entirely
different from Equation 15. Deformationof the surface mainly depends on the evap-oration of material in a process referred toas the recoil pressure, which is the maindriving force in the creation of a keyhole.A precise mathematical model for thisphenomenon does not exist, but the Equa-tion 16 reported in 2002 is simple and can
PI
r
r
rA
A A
≅ −⎛
⎝
⎜⎜
⎞
⎠
⎟⎟
μ
π0
2
2 2
2
24exp (15)
2
r r a z zL
= + −0 0
(13)
q x y zQ
r
x y
rL
L
, ,( ) = − +⎛
⎝
⎜⎜
⎞
⎠
⎟⎟
3exp (12)
2
2 2
L2π
3
q x yVI
r
x y
rA
A A
,( ) = − +⎛
⎝
⎜⎜
⎞
⎠
⎟⎟2
exp2
(14)2 2
2π 2
Table 1 — Material Properties and Coefficients Used in Analysis
Properties Value
Density 7490 kg/m3
Thermal conductivity 35 W/mKSpecific heat 606 J/kgKLatent heat of vaporization 6084 kJ/kgLatent heat of fusion 260 kJ/kgLiquidus temperature 1787.5 KSolidus temperature 1729.2 KLiquid-vapor equlibrium temperature 3130 KMagnetic permeability 1.26e-6 H/mViscosity 0.006 kg/msThermal expansion rate 4.2 × 10⁻⁵/KSurface tension 1.2 N/mSurface tension gradient –0.2 × 10⁻³ N/mKFocal radius, r0 0.25 mmBeam divergence in Equation 13, a 0.2Universal gas constant 8.314 J/molK
A B
C D
39-sWELDING JOURNAL
be used in this simulation (Ref. 22).
In Equation 15, μ0 is the permeabilityin a vacuum. P0 denotes the atmosphericpressure and ΔHLV is the latent heat of va-porization. T, TLV, and R indicate the sur-face temperature, liquid-vapor equilib-rium temperature, and universal gasconstant, respectively. The value 0.54 inEquation 15 is a factor that depends onthe environmental pressure. This was alsoadopted in this research.
Heat source models and pressuremodels are prepared for application asboundary conditions. For the top surface,which is directly exposed to the heatsources of the arc and the laser, and forthe arc and recoil pressure, the mathe-matical expressions are as follows:
In Equation 17, n denotes the normalcomponent, K is the thermal conductivity,and T is the surface temperature. η de-notes the heat input efficiency, i.e., theheat absorption rate, and the subscriptsand L and A indicate the laser and arc, re-spectively. The efficiency for the laserheat source is determined by the Fresnelreflection model and multiple reflectionsin the keyhole, which are discussed inlater paragraphs. On the other hand, theefficiency of the arc is predetermined as0.56. The heat input efficiency of the
droplets was found to be 0.24 in this sim-ulation; therefore, the total GMAW effi-ciency was set at 80%, which refers to Ref.28. The third and fourth terms on the rightside in this equation denote the heatlosses caused by ambient air convectionand heat radiation. Accordingly, hA is theconvection coefficient, which is 40 W/m2
K here, and T∞ is the temperature of theambient air, set here as 293 K. σs, εr, andqvap indicate the Stefan-Boltzmann con-stant, the emissivity, and the heat losscaused by vaporization, respectively.Equation 18 calculates the pressureboundary condition for the top surface in-cluding the surface tension in a flow. μ de-notes the dynamic viscosity, γ and Rc indi-cate the surface tension coefficient andthe radius of the surface curvature, re-spectively.
All of the other boundaries, such as therear, front, and side, are set as continuoussurfaces. This implies that the material ex-ists continuously so the normal deriva-tives of all the properties at the boundaryare equal to zero. The zero derivative con-dition is intended to represent a smoothcontinuation of the flow through theboundary.
In addition to the high power densityof the laser, the main driving force thatmakes the keyhole deeper is the multiplereflections of the laser beam in the key-hole. If the laser is regarded as a bundleof ray beams, all of the rays coming intothe keyhole experience multiple reflec-tions on the wall and finally reach the bot-tom of the keyhole. These superposedrays inside the keyhole raise the total en-ergy absorption and obtain a deeper pen-etration. In this research, the ray tracingtechnique is triggered on for every timestep following to the self-evolved three-dimensional keyhole profile. Detailed de-scriptions can be found in an earlier pub-lished report by the author (Ref. 23).
The molten surface of the metal is re-garded as specular in this paper; thus, itwas deemed reasonable to adopt the Fres-nel reflection model (Ref. 25), which iswidely accepted for the calculation oflaser absorption rate. Reflectivity Rf at themolten surface is mainly dependent onthe angle between the incident ray andsurface normal φ as follows, and the ab-sorption rate ηf is then 1– Rf.
− +∂
∂= − − +P
V
nP P
Rn
R Ac
2 (18)μ γ
KT
nq q h T T
T T q
L L A A A
s r va
∂∂
= + − − ∞( )− −⎛
⎝⎞⎠ −
∞
η η
σ ε 4 4pp
(17)P P HT T
RTTR LVLV
LV
≅ Δ−⎛
⎝⎜⎜
⎞
⎠⎟⎟
0.54 exp (16)0
Rf=
+ −( )+ +( )
+ − +
1
2
1 1 cos
1 1 cos
2 cos 2co
2
2
2
ε φ
ε φ
ε ε φ ss
2 cos 2cos
(19)2
2 2
φ
ε ε φ φ+ +
⎛
⎝
⎜⎜⎜⎜⎜⎜⎜
⎞
⎠
⎟⎟⎟⎟⎟⎟⎟
WE
LD
ING
RE
SE
AR
CH
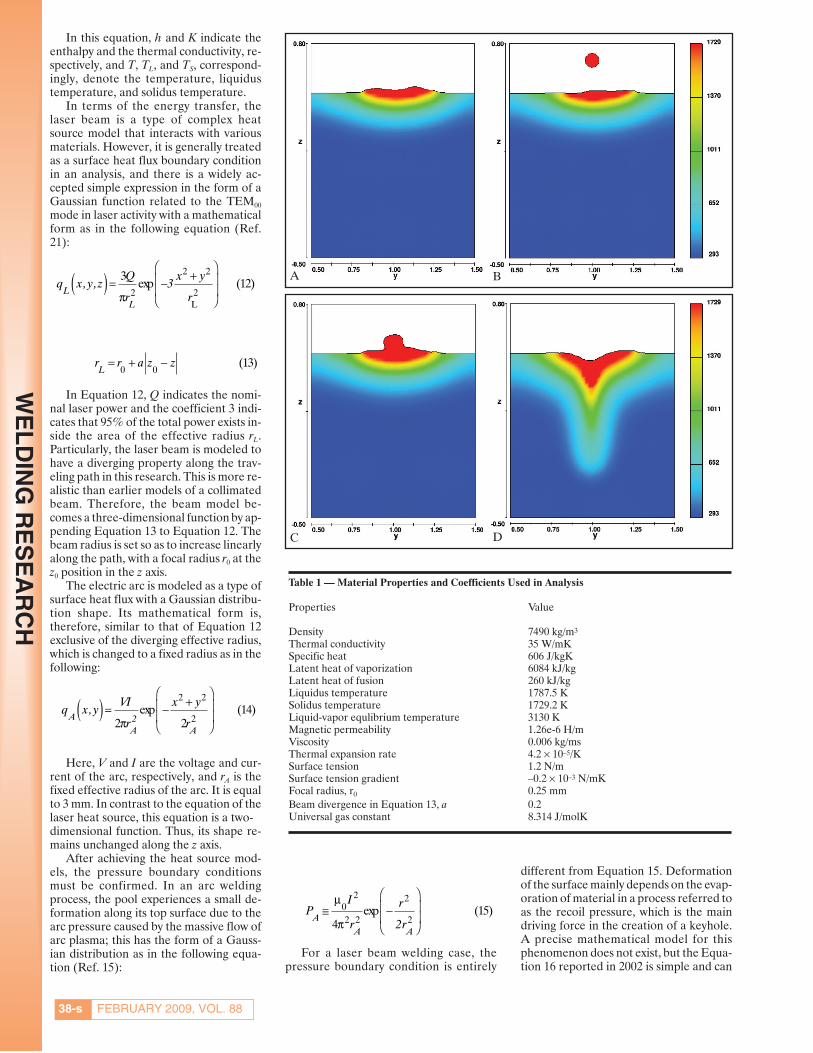
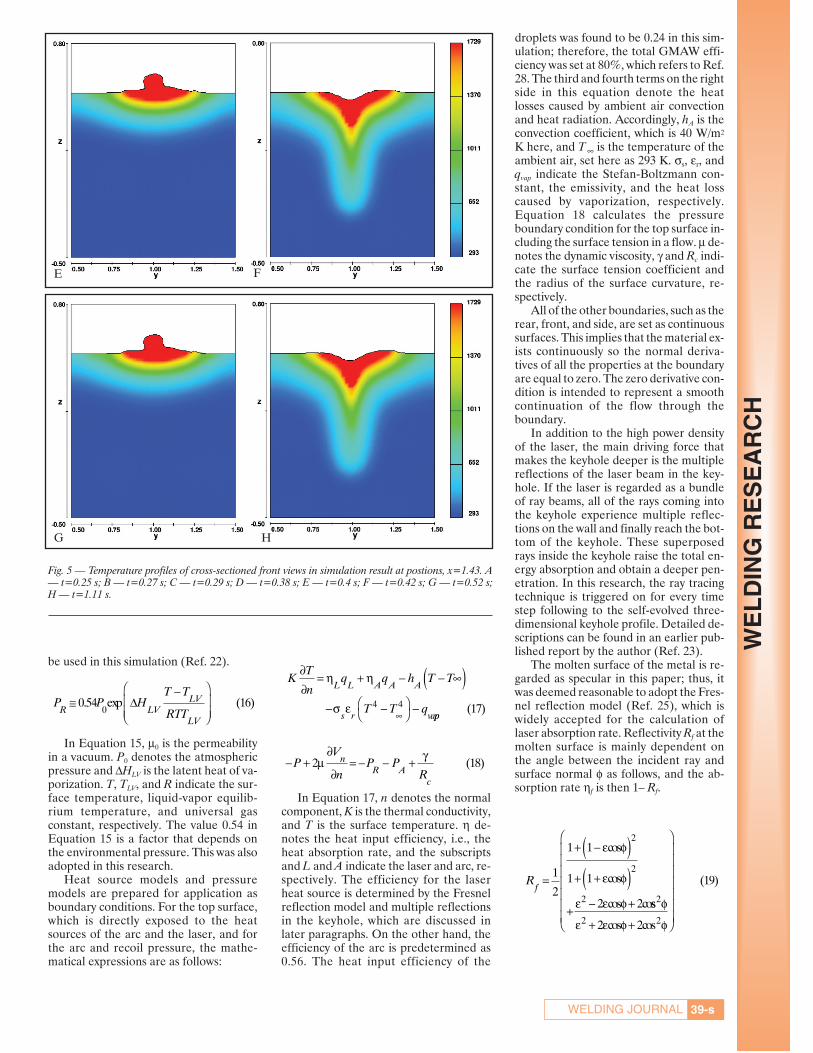
Fig. 5 — Temperature profiles of cross-sectioned front views in simulation result at postions, x=1.43. A— t=0.25 s; B — t=0.27 s; C — t=0.29 s; D — t=0.38 s; E — t=0.4 s; F — t=0.42 s; G — t=0.52 s;H — t=1.11 s.
E F
G H
FEBRUARY 2009, VOL. 8840-s
The value of ε is related to the electri-cal conductance per unit depth of metalσst, and ε1 and ε2 denote the real part of thedielectric constants of metal and plasma,respectively. Additionally, ε0 indicates thepermittivity of a vacuum, and ω is one ofthe laser properties representing the an-gular frequency. The value ε is determinedfrom the material properties and the lasertype. For a CO2 laser and a steel work-piece, this value is 0.08. However, it is alsomodifiable for several reasons. First, the
temperature of the keyhole wall is at theboiling point, which could affect the Fres-nel absorption. Moreover, the methodused to calculate the Fresnel absorption isapproximated, and the use of a large valueof ε could offset the approximations (Ref.25). Therefore, the value of ε can be de-termined by trial and error to fit the simu-lation result to the experimental result.The aim of this research is not to deter-mine the proper coefficient; rather, thepaper is purely focused on observing thefluidic phenomena achieved using a nu-merical method.
In addition to the gravitational force,another body force in the flow is the elec-tromagnetic force induced by the arc cur-rent inside the workpiece. Simplified elec-tromagnetic force in the pool is explained
by the following equation set (Refs. 9, 26).
In these equations, μm is the magneticpermeability of the material, I is the arccurrent, and c is the thickness of the work-piece. For the coordinate value, x and ydenote the distance from the arc positionaccording to each axis, and z indicates thedistance from the top of the workpiecealong the z axis.
Results and Discussion
The material adopted for the simula-tions was ASTM A131 steel with a thick-ness of 10 mm. The analytic domain wasset as 42 mm in length, 10 mm in width,and 13 mm in height including the void re-gion of the top 3 mm for free-surfacetracking. In the Cartesian coordinate sys-tem, the ranges of the domain are (2 mm,44 mm) in the x axis, (5 mm, 1.5 mm) in they axis, and (–0.5 mm, 0.8 mm) in the z axisrespectively. The inter-grid distance isequal to 0.1 mm along the three axes; con-sequently, there are a total of 2,860,000 el-ement cells. The physical properties of thematerial and coefficients used in the sim-ulation are shown in Table 1. It took 328hours to complete the simulation.
Figure 1 shows a schematic diagram ofthe solution domain of the simulations. Inthis figure, the F value denotes the filledportion of the fluid (material) in a cellusing the VOF method; i.e., F=1 indicatesthat the cell is fully filled with fluid, F=0indicates that it is empty, and 0<F<1 sig-nifies that it is partially filled. While thegas metal arc leads the welding process 3mm ahead of the laser, the arc and laserpower in this case is 2.5 kW (current 150A and voltage 16.7 V) and 3.7 kW, respec-
εε
ε ε σ ωε
2 2
1 12 2
1/2
2(20)=
+ + ( )⎡
⎣⎢⎢
⎤
⎦⎥⎥st
/0
FI
r c
r
r
zm
A
=
− −⎛
⎝
⎜⎜
⎞
⎠
⎟⎟
⎡
⎣
⎢⎢⎢
⎤
⎦
⎥⎥⎥
μ
π
2
2
2
2
4
1 exp2
2
22
1 (23)−⎛
⎝⎜
⎞
⎠⎟
z
c
FI
r r
r
r
r
ym
A A
= − −⎛
⎝
⎜⎜
⎞
⎠
⎟⎟
× − −
μ
π
2
2 2
2
2
2
4exp
2
1 exp2rr
z
c
y
rA2
2
1 (22)⎛
⎝
⎜⎜
⎞
⎠
⎟⎟
⎡
⎣
⎢⎢⎢
⎤
⎦
⎥⎥⎥
−⎛
⎝⎜
⎞
⎠⎟
FI
r r
r
r
r
xm
A A
= − −⎛
⎝
⎜⎜
⎞
⎠
⎟⎟
× − −
μ
π
2
2 2
2
2
2
4exp
2
1 exp2rr
z
c
x
rA2
2
1 (21)⎛
⎝
⎜⎜
⎞
⎠
⎟⎟
⎡
⎣
⎢⎢⎢
⎤
⎦
⎥⎥⎥
−⎛
⎝⎜
⎞
⎠⎟
WE
LD
ING
RE
SE
AR
CH
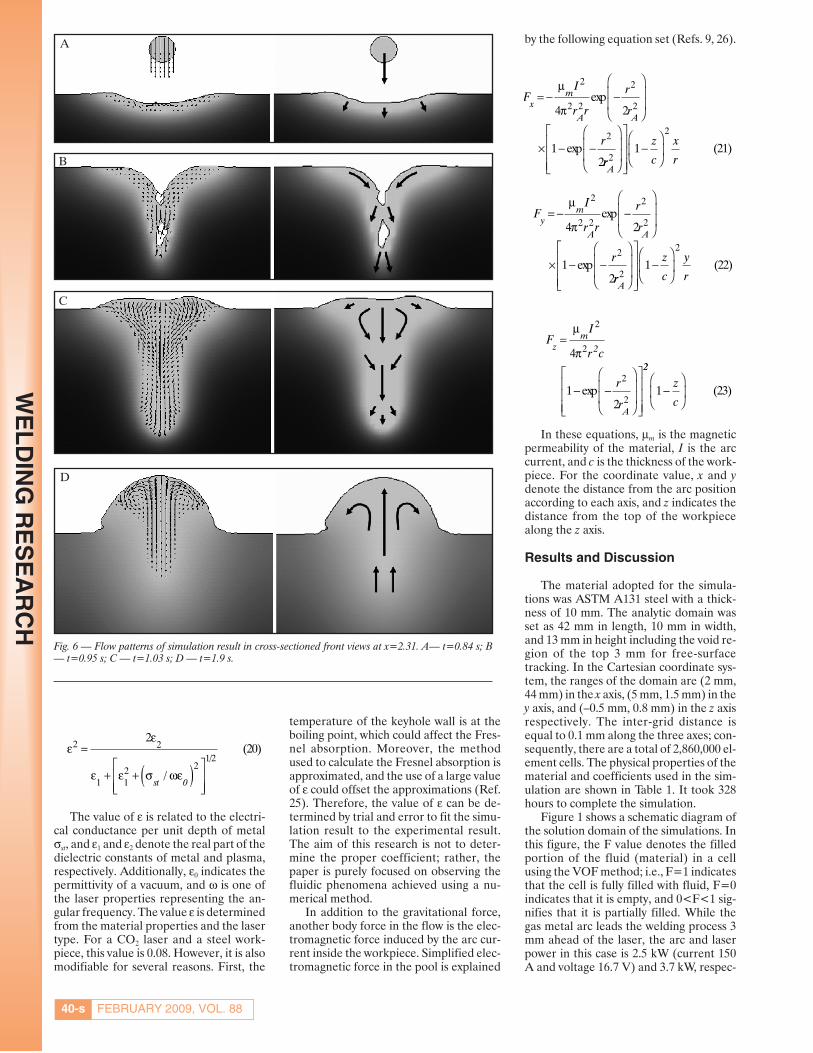
Fig. 6 — Flow patterns of simulation result in cross-sectioned front views at x=2.31. A— t=0.84 s; B— t=0.95 s; C — t=1.03 s; D — t=1.9 s.
A
B
C
D
tively, and the welding speed is set at 1m/min. The instance of a 2-s GMA-laserhybrid welding process is simulated andanalyzed.
In addition to the arc heat sourcemodel, it is necessary to determine the ef-fect of droplets as a heat source in GMAW.Conventionally, droplets are treated as anadditional surface heat flux with a Gauss-ian distribution when the free-surfacetracking is not readily available. In thisstudy, the droplets are assumed to be at atemperature 2400° K and are essentiallygenerated to have the mass and momen-tum and to have fallen into the pool by thegravity and electromagnetic force. The di-ameter of the droplets is assumed to beequal to that of the electrode wire; conse-quently, the generation frequency 167 Hzis determined according to the wire feedrate of 8 m/min. The initial velocity of thedroplet is assumed to have only the verti-cal (z-axis) component and its magnitudeis 50 cm/s (Ref. 13).
Figure 2 shows three-dimensional per-spective scenes of the simulation result.Droplets of welding wire are continuouslygenerated in the void region and fall intothe pool. It is observable that the surfaceof the molten pool is slightly dimpled dueto the arc pressure in the figures. Directlybehind the dimpled arc region, the key-hole opening is shown, resembling a cav-ity. Given that the distance between thearc and the laser is only 3 mm, the keyholeopening is located in the dimpled shape.Therefore, the keyhole and dimple aremerged and can be observed as one largehole in a lateral cross-section plane nearthe top surface level of the workpiece. It isimportant to note that the shape of thefree surface is maintained in a macro-scopic view while the heat sources aremoving forward. However, an unstablekeyhole continuously repeats the genera-tion and collapse process. Additionally,the inertia of the falling droplets causesthe pool to oscillate. This is discussed indetail in the following paragraphs.
The solid and liquid regions and theirboundaries are displayed in Fig. 3, whichalso shows the temperature profiles. In theseries of figures, it is possible to observe thedroplets generated above the workpiece aswell as the dimpled shape at the arc posi-tion. Moreover, it is easy to compare thepenetration depths of the GMA and laserwelding processes. The difference is clearlydistinct as the penetration depth of theGMA process does not exceed 1.5 mmwhile the depth of the keyhole is more than6 mm. It is important that the free surfaceof the keyhole does not appear in these fig-ures, not because the model is incorrect,but because the output file is not saved in asufficient number of shot intervals. The re-sults are saved every 10 ms. The keyhole iscontinuously repeating the generation andcollapse process with a time interval
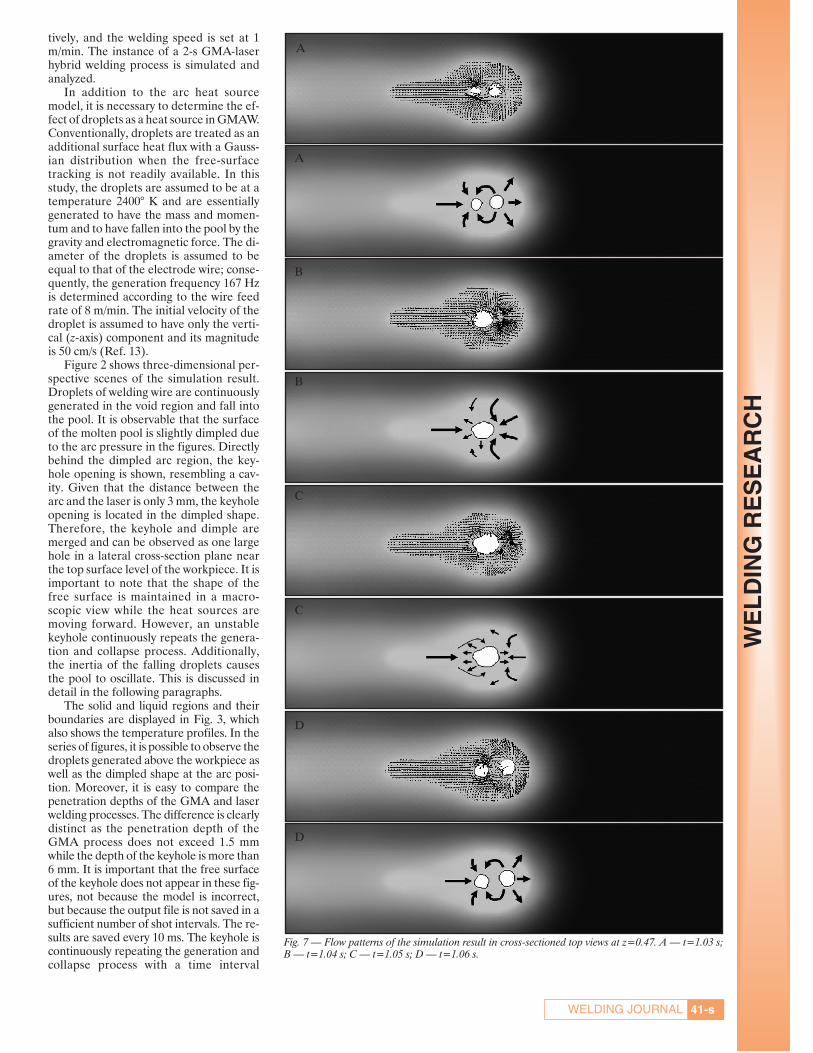
Fig. 7 — Flow patterns of the simulation result in cross-sectioned top views at z=0.47. A — t=1.03 s;B — t=1.04 s; C — t=1.05 s; D — t=1.06 s.
WE
LD
ING
RE
SE
AR
CH
41-sWELDING JOURNAL
A
A
B
B
C
C
D
D
shorter than 10 ms; therefore, the free sur-face of the keyhole is not observed duringevery time step.
Nonetheless, the generation of thekeyhole was fortuitously captured at 0.53s, as seen in Fig. 4. These figures show theflow patterns of the molten pool. Figure4A shows the moment of keyhole gener-ation. There is a small amount of liquidmetal in the front keyhole wall and thefree surface of the keyhole is slightly in-clined, as was shown in a previous report(Refs. 27, 29), as the laser is a moving heatsource. Near the bottom of the keyhole,flow is downward due to the repulsiveforce caused by the recoil pressure. Themolten flow reached the bottom at thesolid/liquid boundary and is directedbackward and is finally lifted up owing tothe buoyancy. This circular patterncauses a vortex, as seen in the figures. Thevortex serves to stir the pool to form analloy. There is only one circular vortex atthe beginning of the process as seen inFig. 4A; however, while the heat sourcesare marching forward, the flow patternbecomes more complex as the root flowat the bottom is split into two mainstreams as shown in Fig. 4B. It ultimatelybranches out to three streams, as seen inFig. 4C, but the circular vortex at the be-ginning is maintained and continues tomove forward. The collapse of the key-hole begins from the middle of the walls,
which can be de-duced by analyzingFig. 4A and C. InFig. 4A, the flow vec-tors are directed tothe center at themiddle of the key-hole walls. With thistendency, a trappedbubble in the middleof the pool is ob-served for an instantin Fig. 4C due to thecollapse of the key-hole.
Figure 5 shows aseries of cross-sec-tioned front views.The sectioned planeis located at the posi-
tion x=1.43, which is in the transversemiddle range of the workpiece. This loca-tion was chosen to observe the entirewelding process from melting to resolidi-fication. As seen in the figures, the work-piece is melted by the pure arc first andthe droplets are then added to the pooland cause the penetration to becomesomewhat deeper. Directly after thedroplets transfer, the front keyhole wallsbegins to appear. In this section, it is ob-servable that the penetration graduallydeepens in the figures from 5D to 5F,which coincides with the fact the keyholeis slightly inclined, as mentioned in theprevious paragraph. Trapped bubbles arealso seen in the figures due to the col-lapse. After the simulation, there are nopores in the weldment, which can be ex-pected owing to the trapped bubbles inthe pool. It was believed that all of thebubbles escaped through the keyhole be-cause the welding speed was not rapidenough to leave a bubble behind the key-hole. In Fig. 5G, all of the void regions arefilled with liquid metal and the weld poolbegins to solidify with upper streams,which finally form the top bead shape, asshown in Fig. 5H.
Flows in the front section are dis-played in Fig. 6. A droplet is falling intothe dimpled shape of the pool caused bythe arc pressure with downward flow vec-
tors — Fig. 6A. Directly after this action,a keyhole is generated with the downwardflows at the liquid metal. A bubble is seenin Fig. 6B, which is not in the process ofescaping, but is only pushed downward bythe recoil pressure. However, it escapesfrom the pool, and that void region isfilled with liquid metal and the cross-sec-tion bead shape is then determined, asseen in Fig. 6C. Flows at this moment areall downward as the circular returnedflow from the bottom of the keyhole thatwas caused by the vortex reaches this po-sition and forms the pool. All of the flowsgradually disappear from the bottom dueto the solidification, and finally the re-maining flows that are pushed up shapethe top bead, as in Fig. 6D.
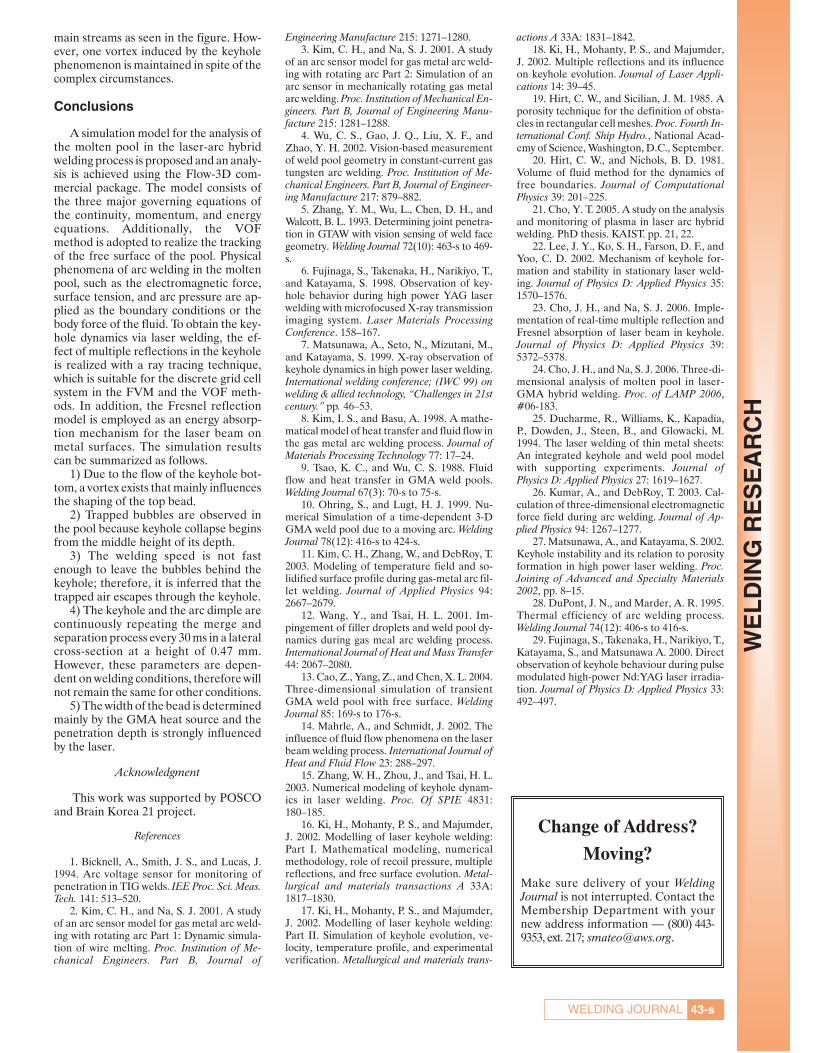
Complexities of the flow patterns areshown in the cross-section top views —Fig. 7. The position of the section planewas selected as z=0.47 mm, which is only3 mm below the top surface of the work-piece in order to observe both the key-hole and the arc dimple simultaneously.As shown in the figures, the keyhole andthe arc dimple are continuously repeatingthe merge and separation action. It is im-portant to note that when they are sepa-rated, flows around the arc dimple movetoward the keyhole opening. However,the flows near the arc are outward and be-came more complex when they weremerged. In the case of the separation,flow patterns toward the keyhole finallycreate a single hole and the outward pat-terns of the merged hole tend to separatethe keyhole and the arc dimple. Due tothis mechanism of flow patterns, the key-hole and arc dimple are repeatedlymerged and separated. It can be derivedthat this phenomenon is repeated every30 ms by analyzing the figures.
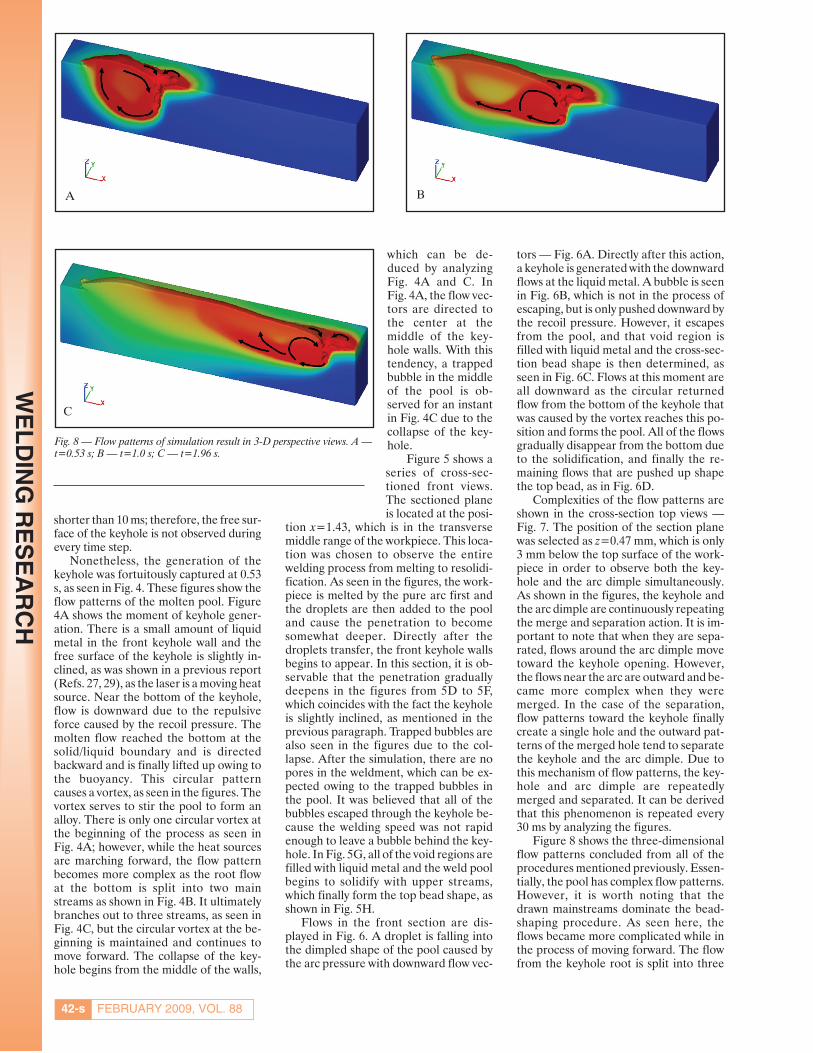
Figure 8 shows the three-dimensionalflow patterns concluded from all of theprocedures mentioned previously. Essen-tially, the pool has complex flow patterns.However, it is worth noting that thedrawn mainstreams dominate the bead-shaping procedure. As seen here, theflows became more complicated while inthe process of moving forward. The flowfrom the keyhole root is split into three
Fig. 8 — Flow patterns of simulation result in 3-D perspective views. A —t=0.53 s; B — t=1.0 s; C — t=1.96 s.
WE
LD
ING
RE
SE
AR
CH
FEBRUARY 2009, VOL. 8842-s
A B
C
main streams as seen in the figure. How-ever, one vortex induced by the keyholephenomenon is maintained in spite of thecomplex circumstances.
Conclusions
A simulation model for the analysis ofthe molten pool in the laser-arc hybridwelding process is proposed and an analy-sis is achieved using the Flow-3D com-mercial package. The model consists ofthe three major governing equations ofthe continuity, momentum, and energyequations. Additionally, the VOFmethod is adopted to realize the trackingof the free surface of the pool. Physicalphenomena of arc welding in the moltenpool, such as the electromagnetic force,surface tension, and arc pressure are ap-plied as the boundary conditions or thebody force of the fluid. To obtain the key-hole dynamics via laser welding, the ef-fect of multiple reflections in the keyholeis realized with a ray tracing technique,which is suitable for the discrete grid cellsystem in the FVM and the VOF meth-ods. In addition, the Fresnel reflectionmodel is employed as an energy absorp-tion mechanism for the laser beam onmetal surfaces. The simulation resultscan be summarized as follows.
1) Due to the flow of the keyhole bot-tom, a vortex exists that mainly influencesthe shaping of the top bead.
2) Trapped bubbles are observed inthe pool because keyhole collapse beginsfrom the middle height of its depth.
3) The welding speed is not fastenough to leave the bubbles behind thekeyhole; therefore, it is inferred that thetrapped air escapes through the keyhole.
4) The keyhole and the arc dimple arecontinuously repeating the merge andseparation process every 30 ms in a lateralcross-section at a height of 0.47 mm.However, these parameters are depen-dent on welding conditions, therefore willnot remain the same for other conditions.
5) The width of the bead is determinedmainly by the GMA heat source and thepenetration depth is strongly influencedby the laser.
Acknowledgment
This work was supported by POSCOand Brain Korea 21 project.
References
1. Bicknell, A., Smith, J. S., and Lucas, J.1994. Arc voltage sensor for monitoring ofpenetration in TIG welds. IEE Proc. Sci. Meas.Tech. 141: 513–520.
2. Kim, C. H., and Na, S. J. 2001. A studyof an arc sensor model for gas metal arc weld-ing with rotating arc Part 1: Dynamic simula-tion of wire melting. Proc. Institution of Me-chanical Engineers. Part B, Journal of
Engineering Manufacture 215: 1271–1280.3. Kim, C. H., and Na, S. J. 2001. A study
of an arc sensor model for gas metal arc weld-ing with rotating arc Part 2: Simulation of anarc sensor in mechanically rotating gas metalarc welding. Proc. Institution of Mechanical En-gineers. Part B, Journal of Engineering Manu-facture 215: 1281–1288.
4. Wu, C. S., Gao, J. Q., Liu, X. F., andZhao, Y. H. 2002. Vision-based measurementof weld pool geometry in constant-current gastungsten arc welding. Proc. Institution of Me-chanical Engineers. Part B, Journal of Engineer-ing Manufacture 217: 879–882.
5. Zhang, Y. M., Wu, L., Chen, D. H., andWalcott, B. L. 1993. Determining joint penetra-tion in GTAW with vision sensing of weld facegeometry. Welding Journal 72(10): 463-s to 469-s.
6. Fujinaga, S., Takenaka, H., Narikiyo, T.,and Katayama, S. 1998. Observation of key-hole behavior during high power YAG laserwelding with microfocused X-ray transmissionimaging system. Laser Materials ProcessingConference. 158–167.
7. Matsunawa, A., Seto, N., Mizutani, M.,and Katayama, S. 1999. X-ray observation ofkeyhole dynamics in high power laser welding.International welding conference; (IWC 99) onwelding & allied technology, “Challenges in 21stcentury.” pp. 46–53.
8. Kim, I. S., and Basu, A. 1998. A mathe-matical model of heat transfer and fluid flow inthe gas metal arc welding process. Journal ofMaterials Processing Technology 77: 17–24.
9. Tsao, K. C., and Wu, C. S. 1988. Fluidflow and heat transfer in GMA weld pools.Welding Journal 67(3): 70-s to 75-s.
10. Ohring, S., and Lugt, H. J. 1999. Nu-merical Simulation of a time-dependent 3-DGMA weld pool due to a moving arc. WeldingJournal 78(12): 416-s to 424-s.
11. Kim, C. H., Zhang, W., and DebRoy, T.2003. Modeling of temperature field and so-lidified surface profile during gas-metal arc fil-let welding. Journal of Applied Physics 94:2667–2679.
12. Wang, Y., and Tsai, H. L. 2001. Im-pingement of filler droplets and weld pool dy-namics during gas meal arc welding process.International Journal of Heat and Mass Transfer44: 2067–2080.
13. Cao, Z., Yang, Z., and Chen, X. L. 2004.Three-dimensional simulation of transientGMA weld pool with free surface. WeldingJournal 85: 169-s to 176-s.
14. Mahrle, A., and Schmidt, J. 2002. Theinfluence of fluid flow phenomena on the laserbeam welding process. International Journal ofHeat and Fluid Flow 23: 288–297.
15. Zhang, W. H., Zhou, J., and Tsai, H. L.2003. Numerical modeling of keyhole dynam-ics in laser welding. Proc. Of SPIE 4831:180–185.
16. Ki, H., Mohanty, P. S., and Majumder,J. 2002. Modelling of laser keyhole welding:Part I. Mathematical modeling, numericalmethodology, role of recoil pressure, multiplereflections, and free surface evolution. Metal-lurgical and materials transactions A 33A:1817–1830.
17. Ki, H., Mohanty, P. S., and Majumder,J. 2002. Modelling of laser keyhole welding:Part II. Simulation of keyhole evolution, ve-locity, temperature profile, and experimentalverification. Metallurgical and materials trans-
actions A 33A: 1831–1842.18. Ki, H., Mohanty, P. S., and Majumder,
J. 2002. Multiple reflections and its influenceon keyhole evolution. Journal of Laser Appli-cations 14: 39–45.
19. Hirt, C. W., and Sicilian, J. M. 1985. Aporosity technique for the definition of obsta-cles in rectangular cell meshes. Proc. Fourth In-ternational Conf. Ship Hydro., National Acad-emy of Science, Washington, D.C., September.
20. Hirt, C. W., and Nichols, B. D. 1981.Volume of fluid method for the dynamics offree boundaries. Journal of ComputationalPhysics 39: 201–225.
21. Cho, Y. T. 2005. A study on the analysisand monitoring of plasma in laser arc hybridwelding. PhD thesis. KAIST. pp. 21, 22.
22. Lee, J. Y., Ko, S. H., Farson, D. F., andYoo, C. D. 2002. Mechanism of keyhole for-mation and stability in stationary laser weld-ing. Journal of Physics D: Applied Physics 35:1570–1576.
23. Cho, J. H., and Na, S. J. 2006. Imple-mentation of real-time multiple reflection andFresnel absorption of laser beam in keyhole.Journal of Physics D: Applied Physics 39:5372–5378.
24. Cho, J. H., and Na, S. J. 2006. Three-di-mensional analysis of molten pool in laser-GMA hybrid welding. Proc. of LAMP 2006,#06-183.
25. Ducharme, R., Williams, K., Kapadia,P., Dowden, J., Steen, B., and Glowacki, M.1994. The laser welding of thin metal sheets:An integrated keyhole and weld pool modelwith supporting experiments. Journal ofPhysics D: Applied Physics 27: 1619–1627.
26. Kumar, A., and DebRoy, T. 2003. Cal-culation of three-dimensional electromagneticforce field during arc welding. Journal of Ap-plied Physics 94: 1267–1277.
27. Matsunawa, A., and Katayama, S. 2002.Keyhole instability and its relation to porosityformation in high power laser welding. Proc.Joining of Advanced and Specialty Materials2002, pp. 8–15.
28. DuPont, J. N., and Marder, A. R. 1995.Thermal efficiency of arc welding process.Welding Journal 74(12): 406-s to 416-s.
29. Fujinaga, S., Takenaka, H., Narikiyo, T.,Katayama, S., and Matsunawa A. 2000. Directobservation of keyhole behaviour during pulsemodulated high-power Nd:YAG laser irradia-tion. Journal of Physics D: Applied Physics 33:492–497.
WE
LD
ING
RE
SE
AR
CH
43-sWELDING JOURNAL
Change of Address?Moving?
Make sure delivery of your WeldingJournal is not interrupted. Contact theMembership Department with yournew address information — (800) 443-9353, ext. 217; [email protected].