Embed Size (px)
Citation preview
NATURAL EXPERIMENTS IN MOBILE PHONE REGULATION: ESTIMATED
EFFECTS OF PROHIBITING HANDSET BUNDLING IN FINLAND AND BELGIUM
Thomas W. Hazlett, George Mason University School of Law
Sarah Oh, George Mason University School of Law
Brent Skorup, George Mason University, Mercatus Center
George Mason University Law and Economics Research Paper Series
14-17
This paper is available on the Social Science Research Network at http://ssrn.com/abstract=2440854
1
Natural Experiments in Mobile Phone Regulation: Estimated Effects of Prohibiting Handset Bundling in Finland and Belgium
Thomas W. Hazlett,1 Sarah Oh,2 and Brent Skorup3
March 17, 2014
Vertical restrictions have theoretically ambiguous efficiency effects. Marketplace evidence is therefore required to reveal the presence of anti-competitive foreclosure. The bundling of mobile phones with cellular network service offers one such market test. Two European nations—Finland and Belgium—prohibited tying arrangements for mobile service and mobile devices (handsets) in wireless broadband (3G) markets. These rules were abandoned in 2006 and 2010, respectively, creating natural experiments.
This article compares 3G subscribership in European countries from 2003 through 2012. Finland and Belgium, while banning bundles, exhibited 3G penetration levels only about a third of the EU 15 average. Following their respective regime switches, relative 3G penetration levels improved markedly in these countries—Finland, in fact, became an EU leader. Regressions adjusting for market specific factors quantify the effects. The data are consistent with the view that carrier handset subsidies, which are strongly supported by bundling services with hardware, help internalize network effects that, if unsupported by the network carriers, may go unrealized. Vertical integration here appears to assist in productive ecosystem creation, not anti-competitive foreclosure.
Keywords: Mobile Phone Regulation, 3G Networks, Bundling, Foreclosure JEL Codes: K23, L14, L50, L96
1 H.H. Macaulay Professor of Economics, Clemson University. Contact: [email protected]. 2 Research Fellow, Information Economy Project @ George Mason University School of Law and
Doctoral Student, George Mason University Department of Economics. 3 Research Fellow, Mercatus Center, George Mason University.
2
I. Introduction
The efficiency benefits of vertical restraints are frequently questioned in the mobile phone sector. In particular, the practice of tying mobile phone subscriptions with handsets—often with large carrier subsidies lowering the price of the phone with the signing of a two-year service contract—has attracted critical scrutiny. The primary concern is that such contract bundles foreclose competition between mobile operators, original equipment manufacturers (OEMs), and vendors of content and applications in ways that harm consumers (Frieden 2007; Wu 2007; Crawford 2012). Such views led to the Federal Communications Commission’s decision to add “open access” requirements to the 700 MHz C Block auction, which occurred in March 2008 (FCC 2007).
The foreclosure explanation of bundling contrasts with findings by economists who find vertical integration in mobile markets to support efficiencies (Faulhaber & Farber 2010; Heatley & Howell 2009; Liebowitz & Margolis 2008; Ford et al. 2009; Hahn et al. 2007; Schwartz & Mini 2007). Some note gains from better coordination of upstream and downstream inputs (Mayo & Wallsten 2010), while those conducting laboratory experiments have found that bundling increases consumer welfare (Caliskan et al. 2007). In other industries, empirical studies have measured efficiencies from non-price vertical conduct as well (Cooper et al. 2005).
Importantly, there now exist natural experiments allowing us to observe the effects of mobile handset bundling between 2003 and 2012. In both Finland and Belgium, national governments prohibited mobile carriers from bundling handsets with services and later reversed the policies. The Finns abolished the prohibition in 2006 due to widespread dissatisfaction with 3G (third generation) mobile broadband adoption (Repo 2006). The Belgians prohibited handset bundling through a general, economy-wide prohibition on tie-ins; they were forced to end this rule in 2010 after the European Commission found these tying prohibitions invalid. The use, and then removal, of these regulations yield valuable evidence from European markets. In short, we find that consumers reacted positively to bundled offers relative to unbundled offers, strongly suggesting that the bundles and attendant handset subsidies are powerful tools for ecosystem creation, not vertical foreclosure.
II. Anti-Bundling Regulation in Finland and Belgium
Third generation mobile technologies (3G) offer not only voice and texting services, but high-speed mobile broadband access to the Internet. In 2000 and 2001, 3G licenses were distributed by most European Union countries. The standard manner in which mobile carriers market these services involves the sale of a bundled contract: the customer is offered a 3G handset and a service agreement, usually for one or two years. Typically, the carrier subsidizes the handsets sold in this manner quite heavily, lowering the customer’s upfront payment, sometimes to zero, and recoups the subsidy over the term of the contract.
3
Telecommunications regulators in Finland and Belgium forbade this business practice, however. Mobile carriers in those countries, therefore, could not subsidize the purchase of a handset with a wireless subscription. As described below, these regulations faced popular opposition and legal challenges, and both countries eventually reversed their policies. Finland was first, in 2006, followed by Belgium in 2010. A. Finland’s Prohibition of Bundled Handsets, 1997-2006
A Finnish law prohibiting handset-service bundles, dating to 1997, was reiterated in the Communications Market Act of 2003. This ensured that the major Finnish carriers, Elisa, Sonera, and DNA, were unable to sell handsets with mobile service, allowing independent vendors to retail handsets directly to customers. Regulators viewed these anti-bundling mandates as consumer protection measures that provided pricing transparency (Gimeno et al. 2007, p. 7).
Splitting mobile devices from mobile service contracts pre-empted carrier handset subsidies. Demand for mobile service was reportedly diminished (Saarikoski 2006, p. 64). In addition to relatively high upfront prices, coordination issues arose. In many instances, subscribers had difficulty accessing the wireless network with their devices. When consumers did have issues, the OEMs instructed consumers to contact the carriers, and the carriers would often blame the OEMs (Id.).
In 2005, regulators reversed course and agreed that carrier-subsidized handsets—a complement to wireless networks—would increase investment in the networks and help create useful ecosystems for data services, benefiting consumers. Allowing carrier bundling of handsets and monthly service, which would allow operators to recoup subsidies via service contracts, was the chosen policy reform. The Finnish communications regulatory agency asked the Finnish parliament to enact the change. Deregulation went into effect in April 2006 (Tallberg et al. 2007, p. 652).
B. Belgium’s Prohibition on Combined Offers, 1991-2010
A more complex story of deregulation and re-regulation has transpired in Belgium. Traditionally, bundled products were prohibited throughout the Belgian economy. Tying prohibitions dating to the 1930s were renewed by the 1991 Trade Practices Act, establishing Belgium’s anti-bundling (koppelverkoop) law (De Wit 2010). Hence, tying a mobile handset with a subscription was illegal. The law was ostensibly intended to promote competition and protect consumers from being improperly lured into purchasing below-cost products like subsidized phones (Blenkinsop 2008).
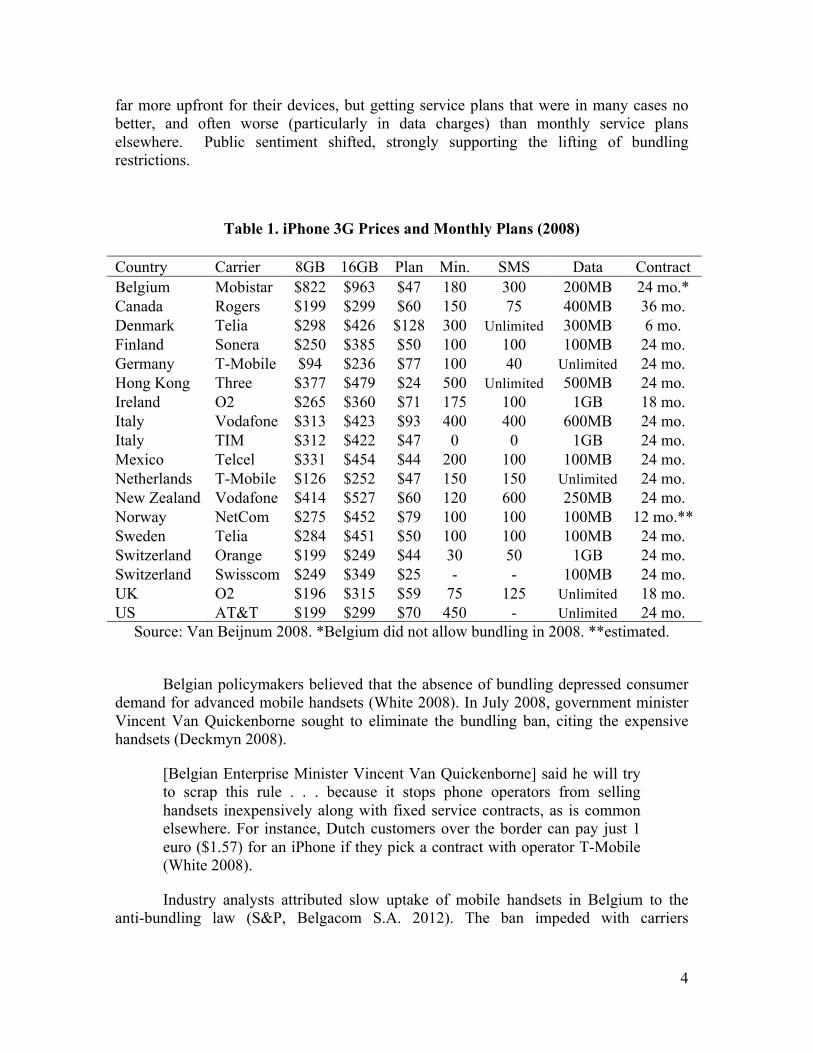
With the release of the iPhone 3G in Belgium in 2008, Belgians saw their European neighbors purchasing the iconic devices at far lower prices. Headlines declared Belgium home to “The World’s Most Expensive iPhone” (Flanders News.be 2008). Table 1 displays the prices of 3G iPhones. iPhone users in Belgium were paying
4
far more upfront for their devices, but getting service plans that were in many cases no better, and often worse (particularly in data charges) than monthly service plans elsewhere. Public sentiment shifted, strongly supporting the lifting of bundling restrictions.
Table 1. iPhone 3G Prices and Monthly Plans (2008)
Country Carrier 8GB 16GB Plan Min. SMS Data Contract Belgium Mobistar $822 $963 $47 180 300 200MB 24 mo.* Canada Rogers $199 $299 $60 150 75 400MB 36 mo. Denmark Telia $298 $426 $128 300 Unlimited 300MB 6 mo. Finland Sonera $250 $385 $50 100 100 100MB 24 mo. Germany T-Mobile $94 $236 $77 100 40 Unlimited 24 mo. Hong Kong Three $377 $479 $24 500 Unlimited 500MB 24 mo. Ireland O2 $265 $360 $71 175 100 1GB 18 mo. Italy Vodafone $313 $423 $93 400 400 600MB 24 mo. Italy TIM $312 $422 $47 0 0 1GB 24 mo. Mexico Telcel $331 $454 $44 200 100 100MB 24 mo. Netherlands T-Mobile $126 $252 $47 150 150 Unlimited 24 mo. New Zealand Vodafone $414 $527 $60 120 600 250MB 24 mo. Norway NetCom $275 $452 $79 100 100 100MB 12 mo.** Sweden Telia $284 $451 $50 100 100 100MB 24 mo. Switzerland Orange $199 $249 $44 30 50 1GB 24 mo. Switzerland Swisscom $249 $349 $25 - - 100MB 24 mo. UK O2 $196 $315 $59 75 125 Unlimited 18 mo. US AT&T $199 $299 $70 450 - Unlimited 24 mo.
Source: Van Beijnum 2008. *Belgium did not allow bundling in 2008. **estimated.
Belgian policymakers believed that the absence of bundling depressed consumer demand for advanced mobile handsets (White 2008). In July 2008, government minister Vincent Van Quickenborne sought to eliminate the bundling ban, citing the expensive handsets (Deckmyn 2008).
[Belgian Enterprise Minister Vincent Van Quickenborne] said he will try to scrap this rule . . . because it stops phone operators from selling handsets inexpensively along with fixed service contracts, as is common elsewhere. For instance, Dutch customers over the border can pay just 1 euro ($1.57) for an iPhone if they pick a contract with operator T-Mobile (White 2008).
Industry analysts attributed slow uptake of mobile handsets in Belgium to the anti-bundling law (S&P, Belgacom S.A. 2012). The ban impeded with carriers
5
experimenting with profitable bundles of services (amounts of voice, SMS, data) and effectively blocked handset subsidies to increase take-up rates (Van Beijnum 2008).
On April 23, 2009, the Court of Justice of the European Union ruled that the EU’s Unfair Commercial Practices Directive 2005/29/EC preempted the Belgian law that prohibited combined offers to consumers (Van de Velde 2009; European Commission 2013). On March 18, 2010, the Belgian Senate repealed the Fair Trade Practices Act and formally approved a New Consumer Protection Act (NautaDutilh 2010), removing legal obstacles to handset bundling.
III. Empirical Approach A. Inferences from Consumer Adoption
Increased output of 3G subscriptions can provide evidence of efficiencies from non-price vertical conduct when consumers adopt greater quantities of services. Here, we investigate whether increased output is observed at a statistically significant level following deregulation of anti-bundling rules. If so, the implication is that bundling has increased social welfare. Anti-competitive foreclosure would suggest the reverse, a restriction in output, and hence, welfare.
We consider penetration levels as a standard measure of output, where consumers are more likely to adopt services when competition in bundles offered across carriers generate lower prices. As seen in Table 1 above, prices and quantity for voice minutes, texting, data plans, contract length, and handset models vary in composition. Over time, bundles also change with consumer preferences, where demand for each service varies with respect to user applications and behavior (FCC 2013). Our model does not define or track these changes within bundles.
B. Simple Time Series Data
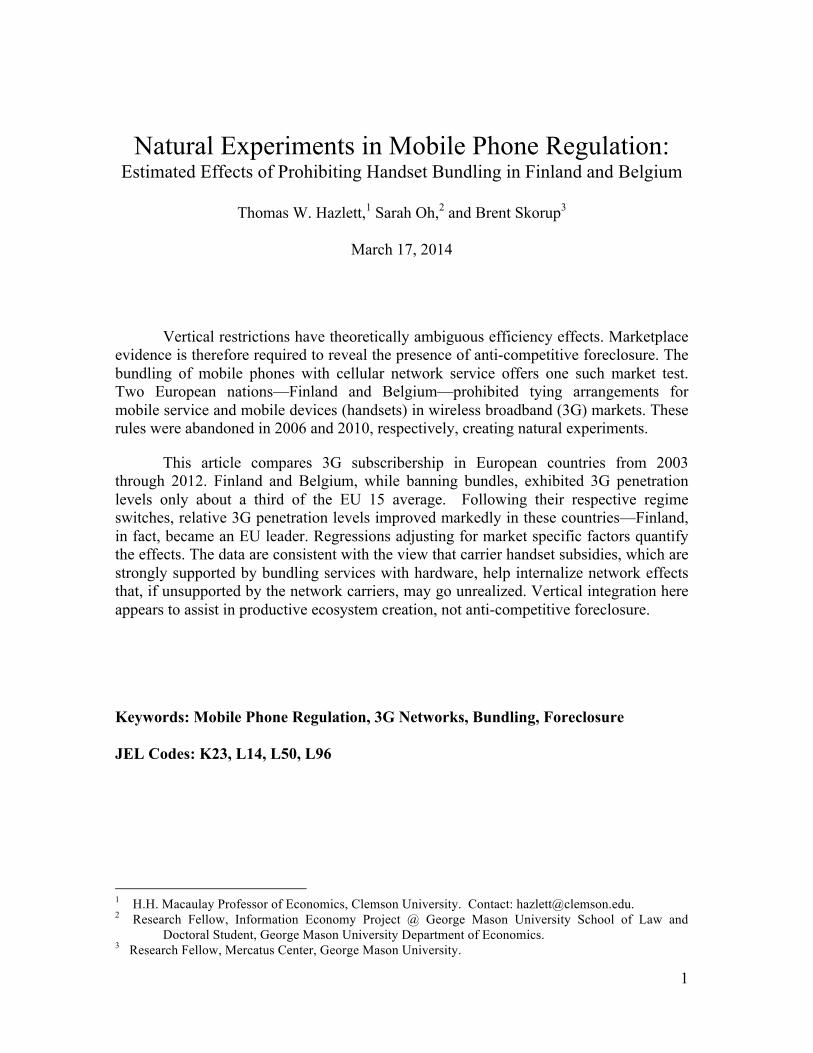
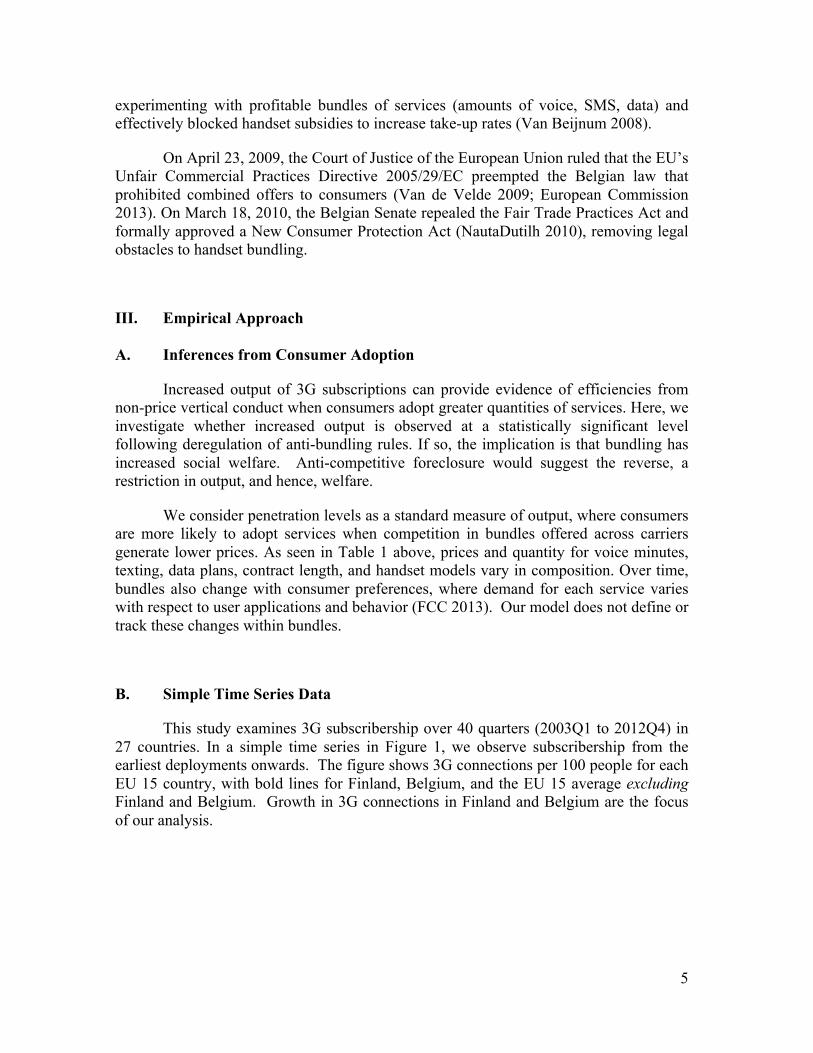
This study examines 3G subscribership over 40 quarters (2003Q1 to 2012Q4) in 27 countries. In a simple time series in Figure 1, we observe subscribership from the earliest deployments onwards. The figure shows 3G connections per 100 people for each EU 15 country, with bold lines for Finland, Belgium, and the EU 15 average excluding Finland and Belgium. Growth in 3G connections in Finland and Belgium are the focus of our analysis.
6
Figure 1. Quarterly 3G Connections in the EU 15 from 2003Q1 – 2012Q4
C. Finland
Almost immediately after reforms allowed handset bundling in April 2006, Finnish mobile operators began offering substantially subsidized handsets tied to subscriptions (Tallberg et al. 2007, pp. 653-54). 3G penetration in Finland rapidly expanded (Id., pp. 655-58). With the ability to subsidize and market 3G phones, mobile carriers saw a 32% increase in phone sales over previous year sales after the change in law (Poropudas 2006). One scholar wrote:
The Finnish Parliament allowed bundling . . . starting April 2006. In practice this has led to consumers buying subsidised 3G handsets. In Finland 3G has taken off because of bundling. There is a clear cause and effect relationship between allowing bundling and 3G becoming popular in Finland (Saarikoski 2006, p. 7 n. 22).
After the policy change, consumers began acquiring more advanced handsets and
consuming more data (Repo 2006). In turn, operators built out their 3G networks. Greater speeds and more network coverage led to even more demand for 3G handsets (Tallberg et al. 2007; Kivi 2007; Okholm 2008; Howell & Sangekar 2008). A virtual circle formed. By 2006Q3, bundled 3G subscriptions represented 35% of all subscriptions and 3G penetration in Finland went from 3.4% in 2006Q2 to 46.6% in 2009Q2 and to
Sweden
Finland Austria Portugal Denmark Italy United Kingdom
EU 15* Germany, Greece Spain, Netherlands Ireland, France Poland
Belgium
7
86.78% in 2011Q2 (Wireless Intelligence 2013). Studies report quantity demanded (for mobile traffic) increased by 300% to 400% from August 2005 to September 2006 (Okholm 2008, p. 19).
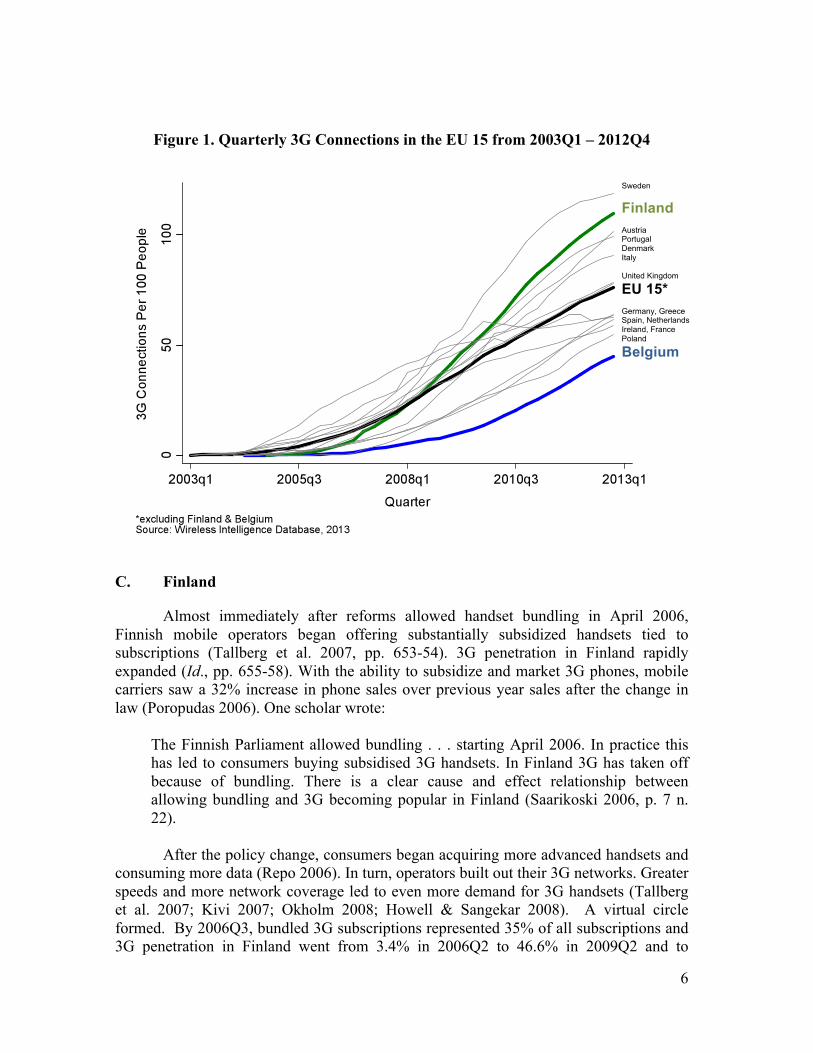
By 2012Q4, Finland had regained its reputation as a European mobile tech leader with 109.9% 3G penetration, trailing only Sweden in per capita connections (Wireless Intelligence 2013). As displayed in Table 2, the quarter that its rules were reversed, Finland exhibited 3G penetration at 44% of the EU 15 average (3.42 / 7.77). By 2008Q2, two years after the policy reversal in 2006Q2, Finland exhibited 3G penetration at 117% of the EU 15 average (26.78 / 22.97). In 2012Q4, 3G penetration increased to 161% of the EU 15 average (109.9 / 68.25).
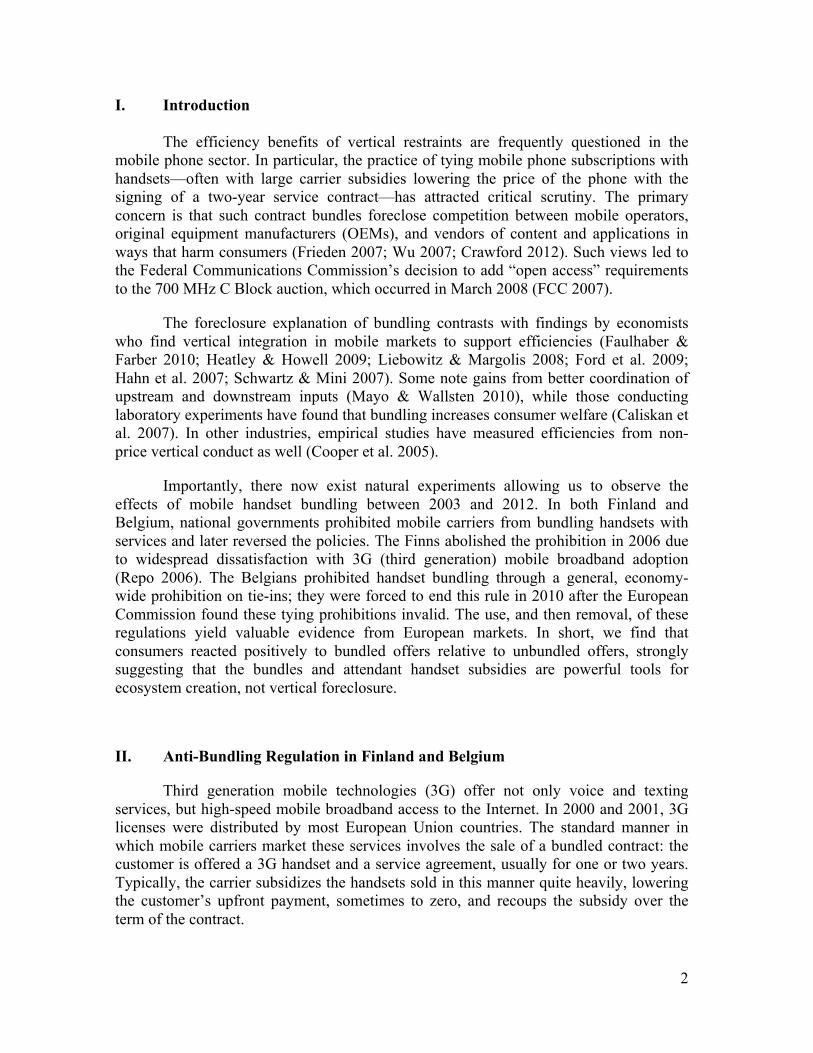
Figure 2. Finland’s 3G Connections & EU 15 Average
Table 2. Finland’s 3G Subscribership & EU 15 Average 2004Q2 2005Q2 2006Q2 2007Q2 2008Q2 2012Q4 Finland 0.00 0.35 3.42 13.06 26.78 109.89 EU 15* 0.53 3.10 7.77 14.21 22.97 68.25 % EU 15* 0% 11% 44% 92% 117% 161%
*excluding Finland. Source: Wireless Intelligence Database, 2013.
Finnish law permitting handset bundling effective 2006Q2
Finland
EU 15*
8
D. Belgium
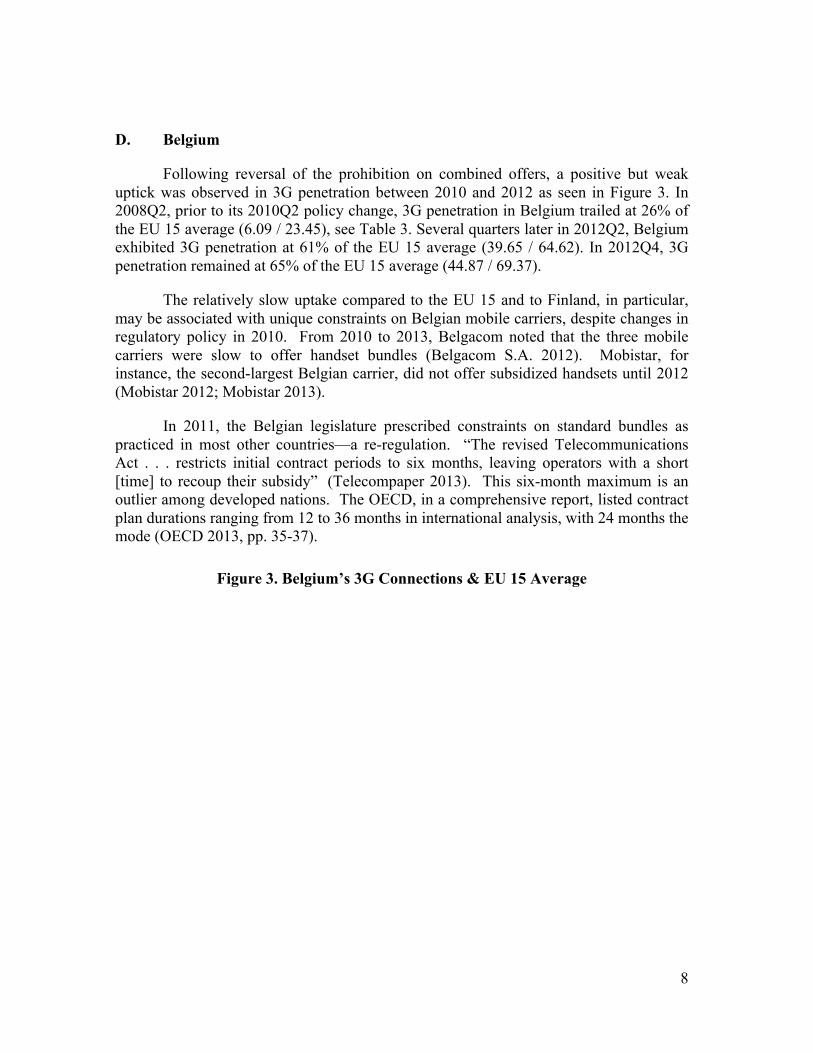
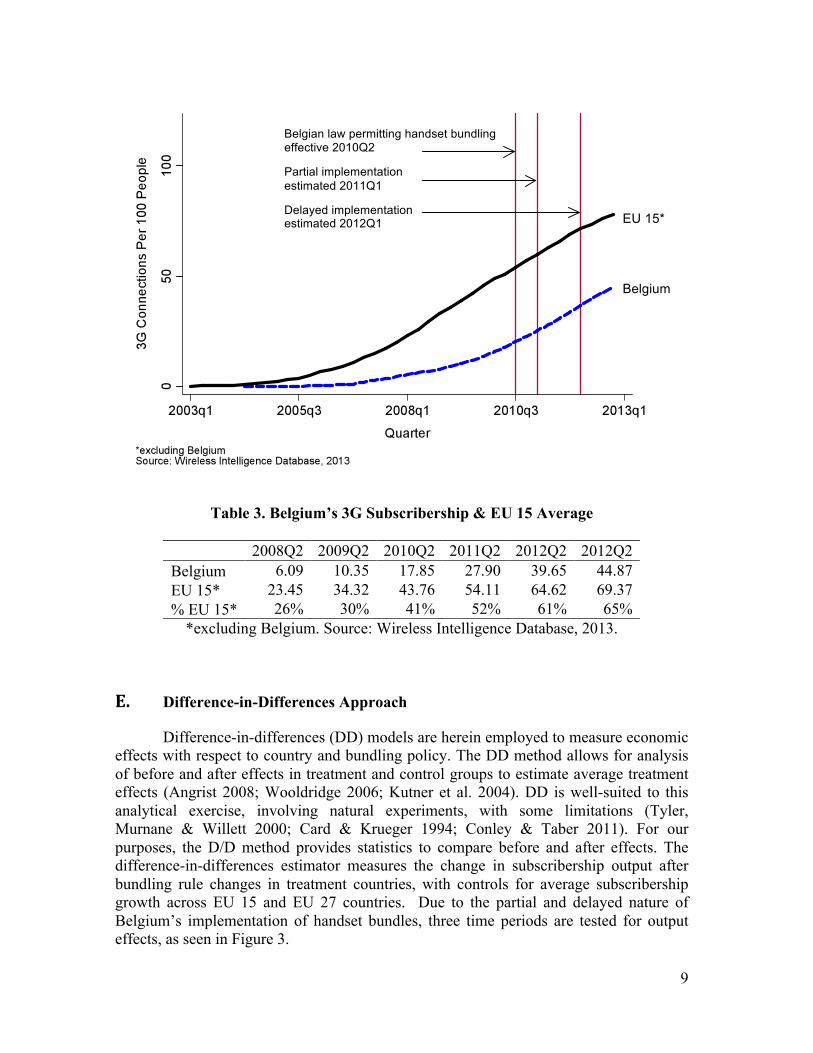
Following reversal of the prohibition on combined offers, a positive but weak uptick was observed in 3G penetration between 2010 and 2012 as seen in Figure 3. In 2008Q2, prior to its 2010Q2 policy change, 3G penetration in Belgium trailed at 26% of the EU 15 average (6.09 / 23.45), see Table 3. Several quarters later in 2012Q2, Belgium exhibited 3G penetration at 61% of the EU 15 average (39.65 / 64.62). In 2012Q4, 3G penetration remained at 65% of the EU 15 average (44.87 / 69.37).
The relatively slow uptake compared to the EU 15 and to Finland, in particular, may be associated with unique constraints on Belgian mobile carriers, despite changes in regulatory policy in 2010. From 2010 to 2013, Belgacom noted that the three mobile carriers were slow to offer handset bundles (Belgacom S.A. 2012). Mobistar, for instance, the second-largest Belgian carrier, did not offer subsidized handsets until 2012 (Mobistar 2012; Mobistar 2013).
In 2011, the Belgian legislature prescribed constraints on standard bundles as practiced in most other countries—a re-regulation. “The revised Telecommunications Act . . . restricts initial contract periods to six months, leaving operators with a short [time] to recoup their subsidy” (Telecompaper 2013). This six-month maximum is an outlier among developed nations. The OECD, in a comprehensive report, listed contract plan durations ranging from 12 to 36 months in international analysis, with 24 months the mode (OECD 2013, pp. 35-37).
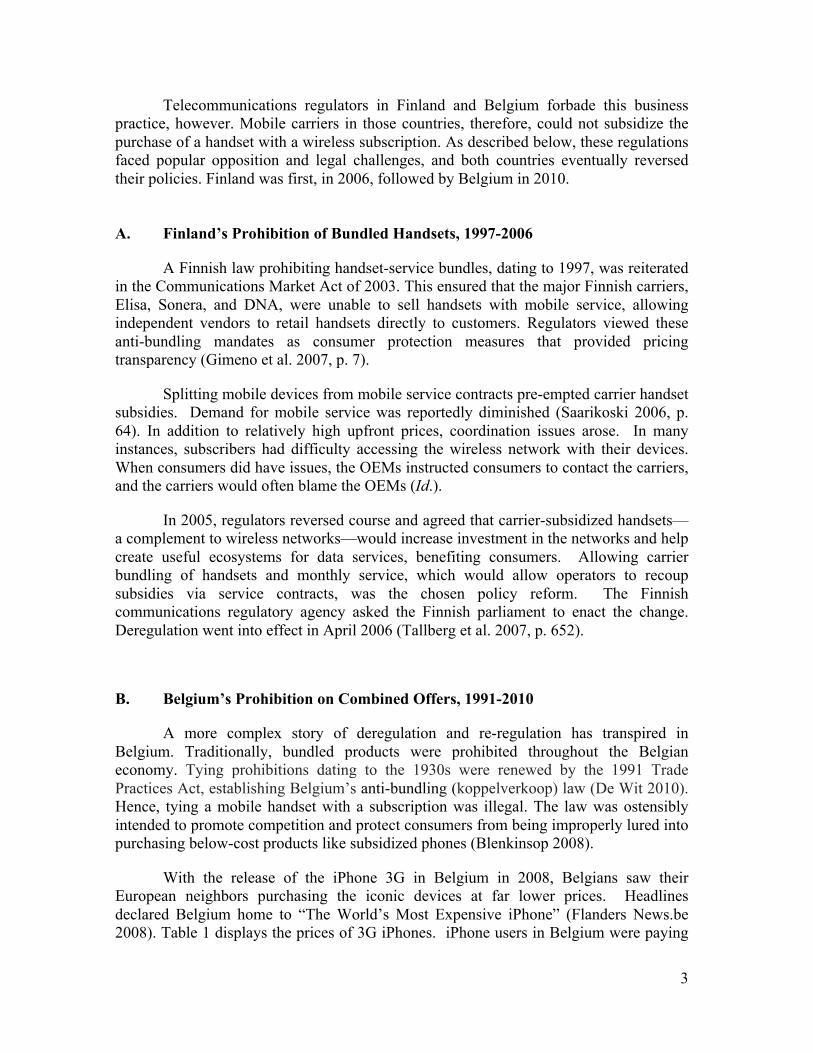
Figure 3. Belgium’s 3G Connections & EU 15 Average
9
Table 3. Belgium’s 3G Subscribership & EU 15 Average
2008Q2 2009Q2 2010Q2 2011Q2 2012Q2 2012Q2 Belgium 6.09 10.35 17.85 27.90 39.65 44.87 EU 15* 23.45 34.32 43.76 54.11 64.62 69.37 % EU 15* 26% 30% 41% 52% 61% 65%
*excluding Belgium. Source: Wireless Intelligence Database, 2013.
E. Difference-in-Differences Approach
Difference-in-differences (DD) models are herein employed to measure economic effects with respect to country and bundling policy. The DD method allows for analysis of before and after effects in treatment and control groups to estimate average treatment effects (Angrist 2008; Wooldridge 2006; Kutner et al. 2004). DD is well-suited to this analytical exercise, involving natural experiments, with some limitations (Tyler, Murnane & Willett 2000; Card & Krueger 1994; Conley & Taber 2011). For our purposes, the D/D method provides statistics to compare before and after effects. The difference-in-differences estimator measures the change in subscribership output after bundling rule changes in treatment countries, with controls for average subscribership growth across EU 15 and EU 27 countries. Due to the partial and delayed nature of Belgium’s implementation of handset bundles, three time periods are tested for output effects, as seen in Figure 3.
Belgian law permitting handset bundling effective 2010Q2 Partial implementation estimated 2011Q1 Delayed implementation estimated 2012Q1
EU 15* Belgium
10
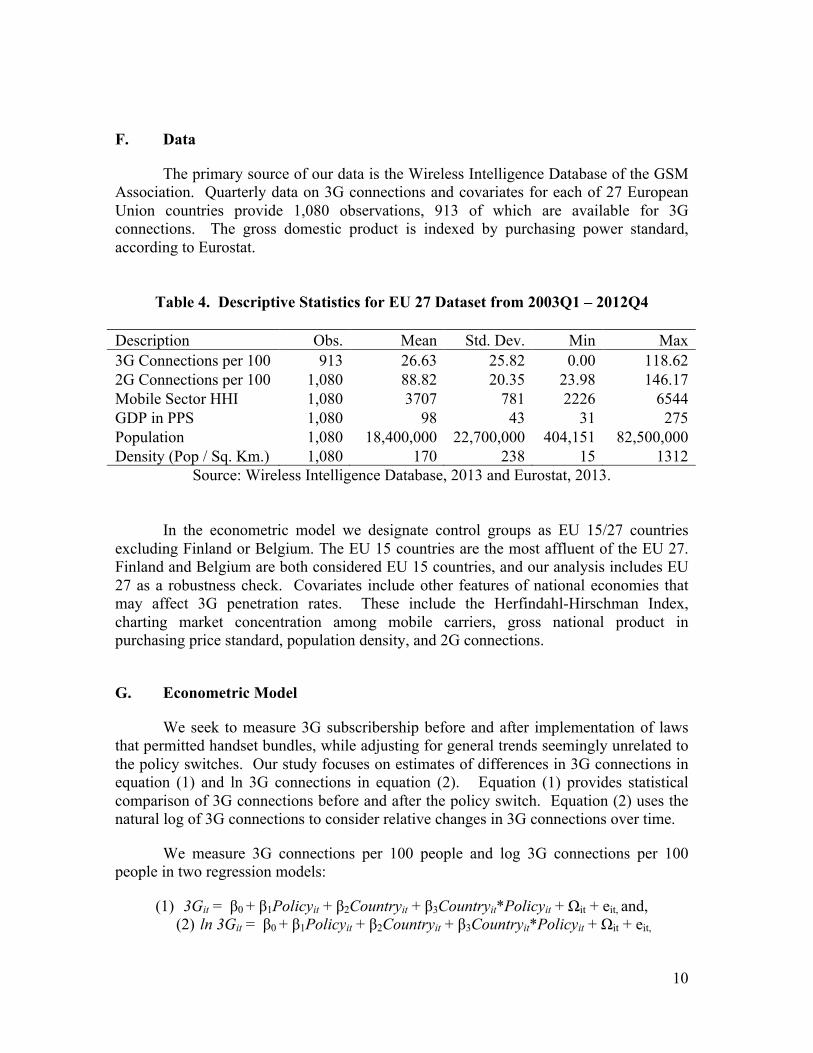
F. Data
The primary source of our data is the Wireless Intelligence Database of the GSM Association. Quarterly data on 3G connections and covariates for each of 27 European Union countries provide 1,080 observations, 913 of which are available for 3G connections. The gross domestic product is indexed by purchasing power standard, according to Eurostat.
Table 4. Descriptive Statistics for EU 27 Dataset from 2003Q1 – 2012Q4
Description Obs. Mean Std. Dev. Min Max 3G Connections per 100 913 26.63 25.82 0.00 118.62 2G Connections per 100 1,080 88.82 20.35 23.98 146.17 Mobile Sector HHI 1,080 3707 781 2226 6544 GDP in PPS 1,080 98 43 31 275 Population 1,080 18,400,000 22,700,000 404,151 82,500,000 Density (Pop / Sq. Km.) 1,080 170 238 15 1312
Source: Wireless Intelligence Database, 2013 and Eurostat, 2013.
In the econometric model we designate control groups as EU 15/27 countries excluding Finland or Belgium. The EU 15 countries are the most affluent of the EU 27. Finland and Belgium are both considered EU 15 countries, and our analysis includes EU 27 as a robustness check. Covariates include other features of national economies that may affect 3G penetration rates. These include the Herfindahl-Hirschman Index, charting market concentration among mobile carriers, gross national product in purchasing price standard, population density, and 2G connections.
G. Econometric Model
We seek to measure 3G subscribership before and after implementation of laws that permitted handset bundles, while adjusting for general trends seemingly unrelated to the policy switches. Our study focuses on estimates of differences in 3G connections in equation (1) and ln 3G connections in equation (2). Equation (1) provides statistical comparison of 3G connections before and after the policy switch. Equation (2) uses the natural log of 3G connections to consider relative changes in 3G connections over time.
We measure 3G connections per 100 people and log 3G connections per 100 people in two regression models:
(1) 3Git = β0 + β1Policyit + β2Countryit + β3Countryit*Policyit + Ωit + eit, and, (2) ln 3Git = β0 + β1Policyit + β2Countryit + β3Countryit*Policyit + Ωit + eit,
11
for all i = 1 to 27 countries and t = 1 to 40 quarters, where Countryit = 1 for Finland / Belgium, 0 for EU 15/27 excluding Finland / Belgium, Policyit = 1 for after bundling, 0 for before bundling, with an interaction term, Countryit*Policyit = 1 for Finland / Belgium after bundling. Vector Ωit of covariates includes ln(HHI) = HHI concentration per quarter, ln(GDP) = GDP in PPS per year, ln(Density) = population density per quarter, 2G = 2G Connections and ln(2G) = ln(2G Connections) per quarter. Mean 3G connections or ln 3G connections, Ῡ, are estimated for the before and after periods for the treatment and control groups in a standard difference-in-differences format, α = E[Yit | Countryit=1 , Policyit=1] – E[Yit | Countryit=1 , Policyit=0] – (E[Yit | Countryit=0, Policyit=1] – E[Yit | Countryit=0 , Policyit=0]) = (Ῡ11 – Ῡ10) – (Ῡ01 – Ῡ00).
Mean level effects are generated from the coefficients as follows, Ῡ11 = β0 + β1Policyit + β2Countryit+ β3Countryit*Policyit which represents the treatment country effect after the policy change, Ῡ10 = β0 + β2Countryit, which represents the treatment country effect before the policy change, Ῡ01 = β0 + β1Policyit which represents the EU control effect after the policy change, and Ῡ00 = β0 which represents the EU control effect before the policy change. We estimate â, and consider the effects of policy on 3G connections and ln 3G connections with respect to the EU15/27 control. The difference-in-differences estimator reduces to the coefficient on the interaction variable, β3Countryit*Policyit. Estimated means are described by the coefficients, β3Countryit*Policyit, which is the difference-in-differences of the country minus EU average, β1Policyit + β3Countryit*Policyit which is the difference for the treatment country from after effects minus before effects, and β1Policyit which describes the EU average difference from after minus before effects.
We present the null hypothesis as follows. If handset bundling is part of a vertical scheme to foreclose competition, the implication is that bundling will be correlated with lower output. Conversely, the intent of prohibition, as stated by regulators and scholarly advocates of the policy, is to increase output. We therefore set the null hypothesis, H0, as predicting that the prohibition of bundles is positively related to higher output and the legality of bundles as negatively related to higher output, H0: β3 < 0. Alternatively, H1 implies a negative correlation with bundling prohibitions and a positive correlation with legal bundling, H1: β3 > 0. A positive difference-in-differences estimator, β3, will indicate a rejection of the null hypothesis, H0. Three time periods are tested for the Belgian case to account for Belgium’s staged legalization of handset bundling. The first period is 2010Q3-2012Q4, the second period (partial deregulation) is 2011Q1-2012Q4, and the third period (delayed implementation) is 2012Q1-2012Q4.
IV. Results
DD regressions compared 3G subscribership in each treatment country with EU averages in time periods following policy switches. In Finland, the DD estimator in 3G connections was highly positive, whereas the DD estimator in ln 3G connections had a smaller effect. In Belgium, the DD in 3G connections showed that Belgium adopted fewer 3G connections than the EU average, indicated by a negative coefficient. The three
12
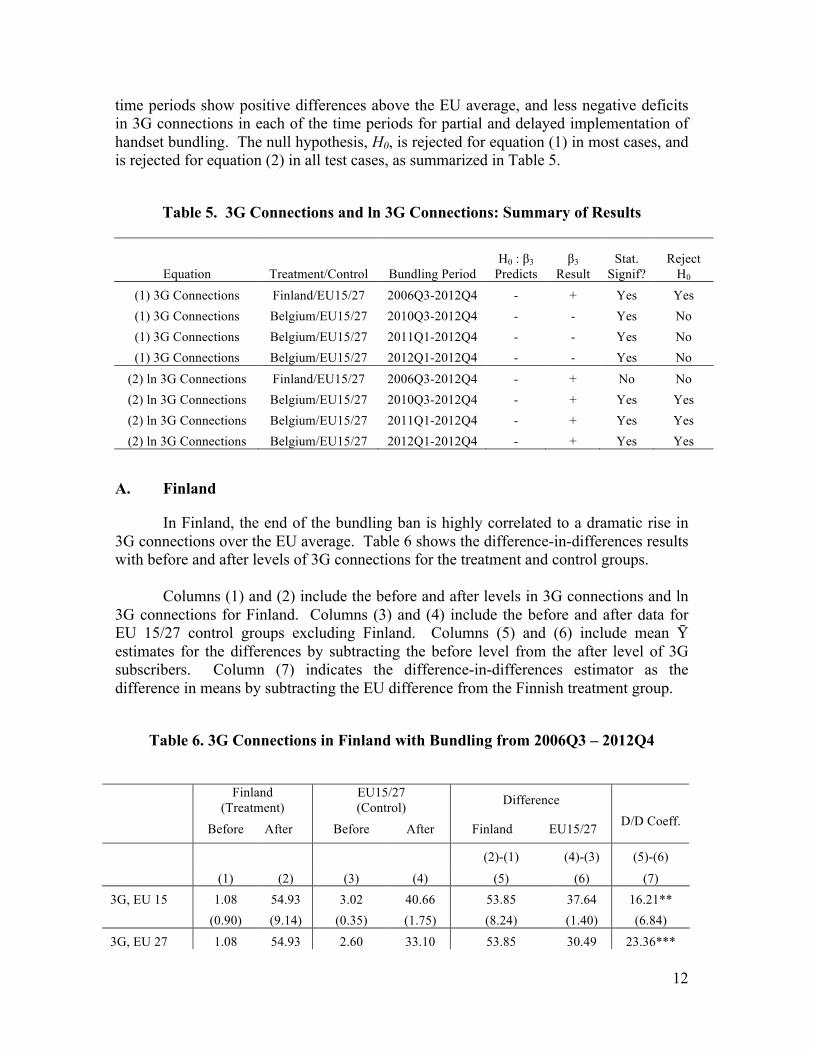
time periods show positive differences above the EU average, and less negative deficits in 3G connections in each of the time periods for partial and delayed implementation of handset bundling. The null hypothesis, H0, is rejected for equation (1) in most cases, and is rejected for equation (2) in all test cases, as summarized in Table 5.
Table 5. 3G Connections and ln 3G Connections: Summary of Results
Equation Treatment/Control Bundling Period H0 : β3
Predicts β3
Result Stat.
Signif? Reject
H0 (1) 3G Connections Finland/EU15/27 2006Q3-2012Q4 - + Yes Yes (1) 3G Connections Belgium/EU15/27 2010Q3-2012Q4 - - Yes No (1) 3G Connections Belgium/EU15/27 2011Q1-2012Q4 - - Yes No (1) 3G Connections Belgium/EU15/27 2012Q1-2012Q4 - - Yes No
(2) ln 3G Connections Finland/EU15/27 2006Q3-2012Q4 - + No No (2) ln 3G Connections Belgium/EU15/27 2010Q3-2012Q4 - + Yes Yes (2) ln 3G Connections Belgium/EU15/27 2011Q1-2012Q4 - + Yes Yes (2) ln 3G Connections Belgium/EU15/27 2012Q1-2012Q4 - + Yes Yes
A. Finland
In Finland, the end of the bundling ban is highly correlated to a dramatic rise in 3G connections over the EU average. Table 6 shows the difference-in-differences results with before and after levels of 3G connections for the treatment and control groups.
Columns (1) and (2) include the before and after levels in 3G connections and ln
3G connections for Finland. Columns (3) and (4) include the before and after data for EU 15/27 control groups excluding Finland. Columns (5) and (6) include mean Ῡ estimates for the differences by subtracting the before level from the after level of 3G subscribers. Column (7) indicates the difference-in-differences estimator as the difference in means by subtracting the EU difference from the Finnish treatment group.
Table 6. 3G Connections in Finland with Bundling from 2006Q3 – 2012Q4
Finland
(Treatment) EU15/27 (Control) Difference
Before After Before After Finland EU15/27
D/D Coeff.
(2)-(1) (4)-(3) (5)-(6)
(1) (2) (3) (4) (5) (6) (7) 3G, EU 15 1.08 54.93 3.02 40.66 53.85 37.64 16.21** (0.90) (9.14) (0.35) (1.75) (8.24) (1.40) (6.84) 3G, EU 27 1.08 54.93 2.60 33.10 53.85 30.49 23.36***
13
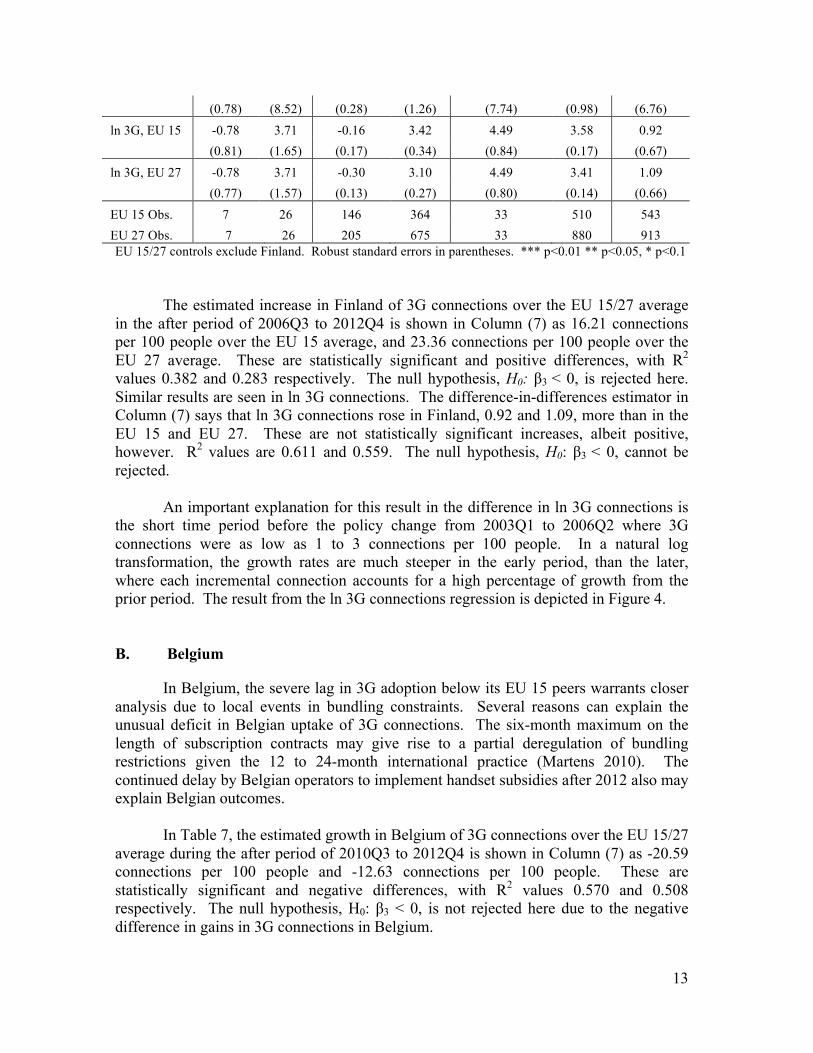
(0.78) (8.52) (0.28) (1.26) (7.74) (0.98) (6.76) ln 3G, EU 15 -0.78 3.71 -0.16 3.42 4.49 3.58 0.92 (0.81) (1.65) (0.17) (0.34) (0.84) (0.17) (0.67) ln 3G, EU 27 -0.78 3.71 -0.30 3.10 4.49 3.41 1.09 (0.77) (1.57) (0.13) (0.27) (0.80) (0.14) (0.66) EU 15 Obs. 7 26 146 364 33 510 543 EU 27 Obs. 7 26 205 675 33 880 913 EU 15/27 controls exclude Finland. Robust standard errors in parentheses. *** p<0.01 ** p<0.05, * p<0.1
The estimated increase in Finland of 3G connections over the EU 15/27 average
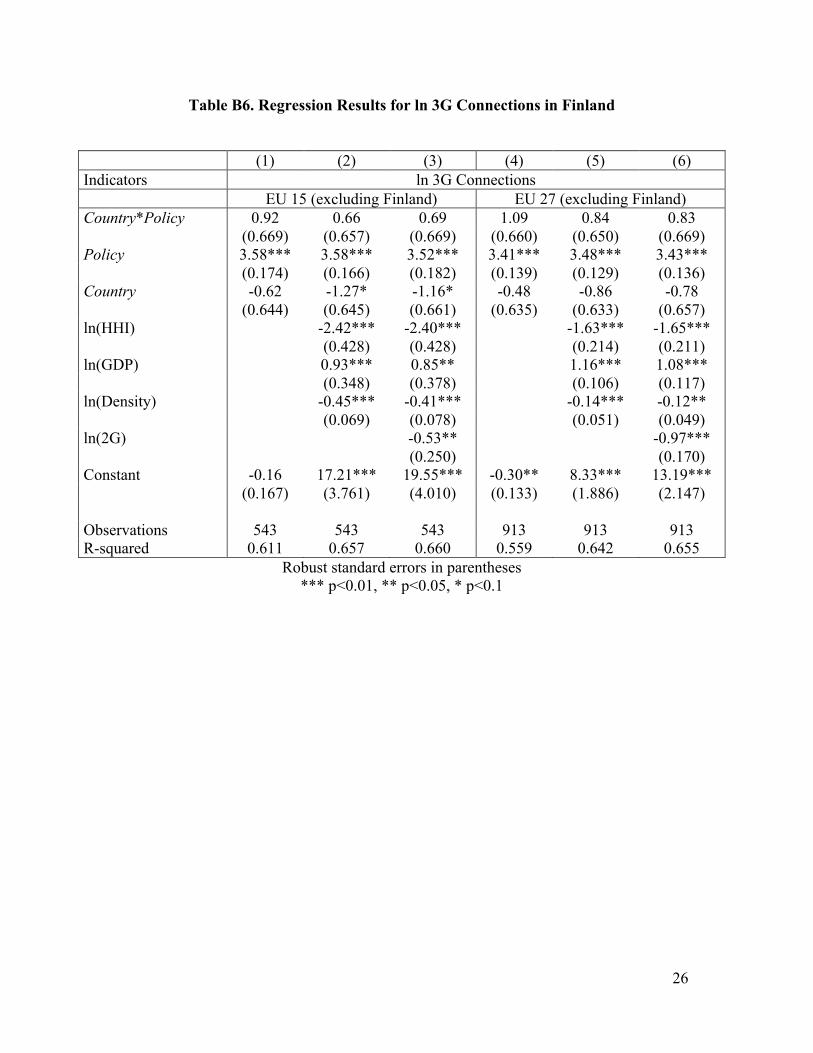
in the after period of 2006Q3 to 2012Q4 is shown in Column (7) as 16.21 connections per 100 people over the EU 15 average, and 23.36 connections per 100 people over the EU 27 average. These are statistically significant and positive differences, with R2 values 0.382 and 0.283 respectively. The null hypothesis, H0: β3 < 0, is rejected here. Similar results are seen in ln 3G connections. The difference-in-differences estimator in Column (7) says that ln 3G connections rose in Finland, 0.92 and 1.09, more than in the EU 15 and EU 27. These are not statistically significant increases, albeit positive, however. R2 values are 0.611 and 0.559. The null hypothesis, H0: β3 < 0, cannot be rejected.
An important explanation for this result in the difference in ln 3G connections is the short time period before the policy change from 2003Q1 to 2006Q2 where 3G connections were as low as 1 to 3 connections per 100 people. In a natural log transformation, the growth rates are much steeper in the early period, than the later, where each incremental connection accounts for a high percentage of growth from the prior period. The result from the ln 3G connections regression is depicted in Figure 4.
B. Belgium
In Belgium, the severe lag in 3G adoption below its EU 15 peers warrants closer analysis due to local events in bundling constraints. Several reasons can explain the unusual deficit in Belgian uptake of 3G connections. The six-month maximum on the length of subscription contracts may give rise to a partial deregulation of bundling restrictions given the 12 to 24-month international practice (Martens 2010). The continued delay by Belgian operators to implement handset subsidies after 2012 also may explain Belgian outcomes.
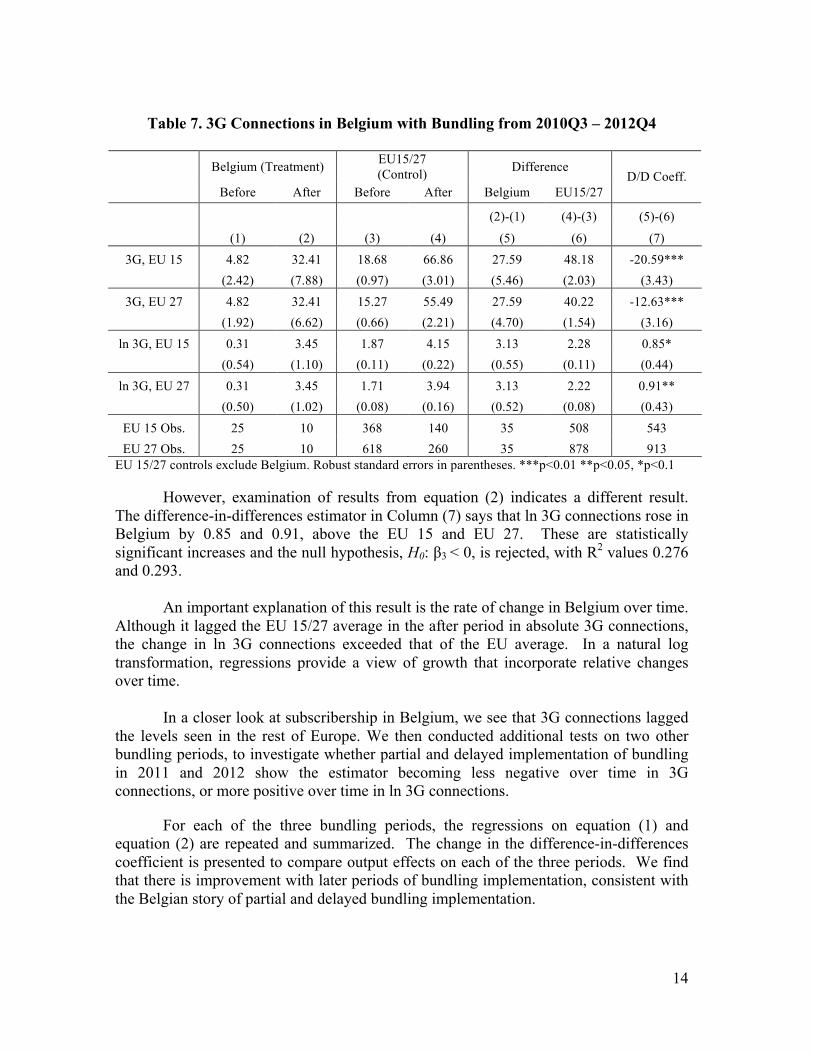
In Table 7, the estimated growth in Belgium of 3G connections over the EU 15/27
average during the after period of 2010Q3 to 2012Q4 is shown in Column (7) as -20.59 connections per 100 people and -12.63 connections per 100 people. These are statistically significant and negative differences, with R2 values 0.570 and 0.508 respectively. The null hypothesis, H0: β3 < 0, is not rejected here due to the negative difference in gains in 3G connections in Belgium.
14
Table 7. 3G Connections in Belgium with Bundling from 2010Q3 – 2012Q4
Belgium (Treatment) EU15/27
(Control) Difference
Before After Before After Belgium EU15/27 D/D Coeff.
(2)-(1) (4)-(3) (5)-(6)
(1) (2) (3) (4) (5) (6) (7) 3G, EU 15 4.82 32.41 18.68 66.86 27.59 48.18 -20.59***
(2.42) (7.88) (0.97) (3.01) (5.46) (2.03) (3.43) 3G, EU 27 4.82 32.41 15.27 55.49 27.59 40.22 -12.63***
(1.92) (6.62) (0.66) (2.21) (4.70) (1.54) (3.16) ln 3G, EU 15 0.31 3.45 1.87 4.15 3.13 2.28 0.85*
(0.54) (1.10) (0.11) (0.22) (0.55) (0.11) (0.44) ln 3G, EU 27 0.31 3.45 1.71 3.94 3.13 2.22 0.91**
(0.50) (1.02) (0.08) (0.16) (0.52) (0.08) (0.43) EU 15 Obs. 25 10 368 140 35 508 543 EU 27 Obs. 25 10 618 260 35 878 913
EU 15/27 controls exclude Belgium. Robust standard errors in parentheses. ***p<0.01 **p<0.05, *p<0.1
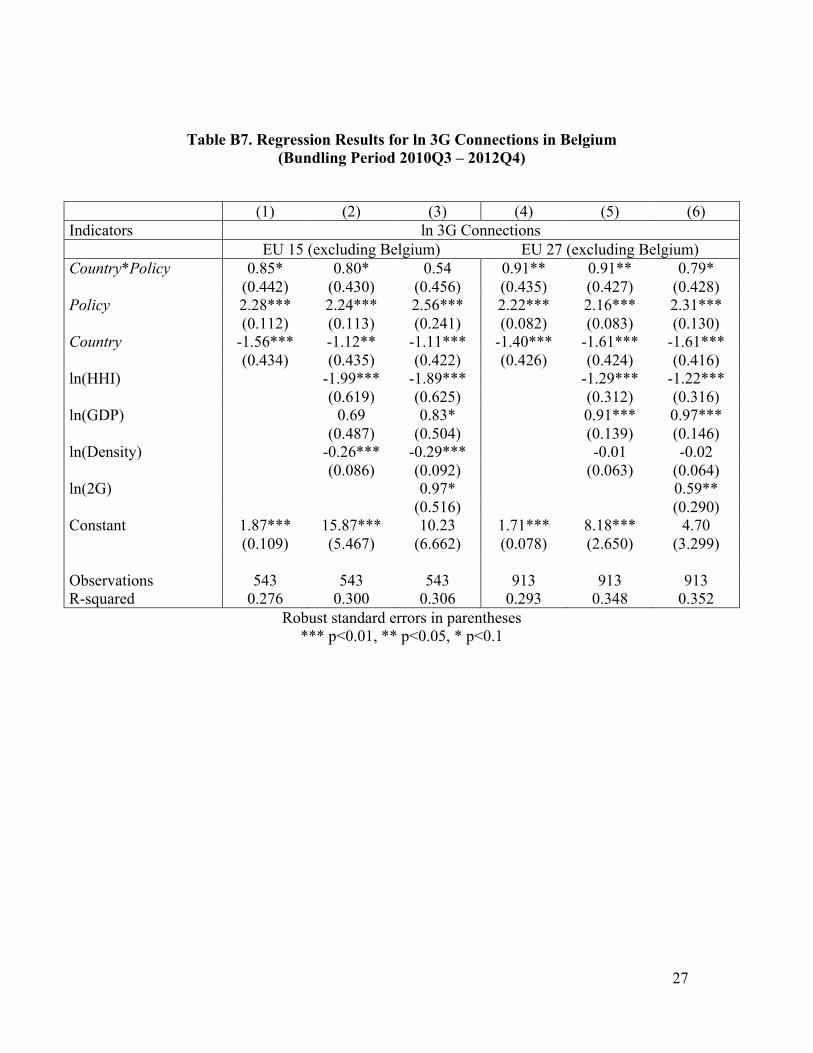
However, examination of results from equation (2) indicates a different result. The difference-in-differences estimator in Column (7) says that ln 3G connections rose in Belgium by 0.85 and 0.91, above the EU 15 and EU 27. These are statistically significant increases and the null hypothesis, H0: β3 < 0, is rejected, with R2 values 0.276 and 0.293.
An important explanation of this result is the rate of change in Belgium over time.
Although it lagged the EU 15/27 average in the after period in absolute 3G connections, the change in ln 3G connections exceeded that of the EU average. In a natural log transformation, regressions provide a view of growth that incorporate relative changes over time.
In a closer look at subscribership in Belgium, we see that 3G connections lagged
the levels seen in the rest of Europe. We then conducted additional tests on two other bundling periods, to investigate whether partial and delayed implementation of bundling in 2011 and 2012 show the estimator becoming less negative over time in 3G connections, or more positive over time in ln 3G connections.
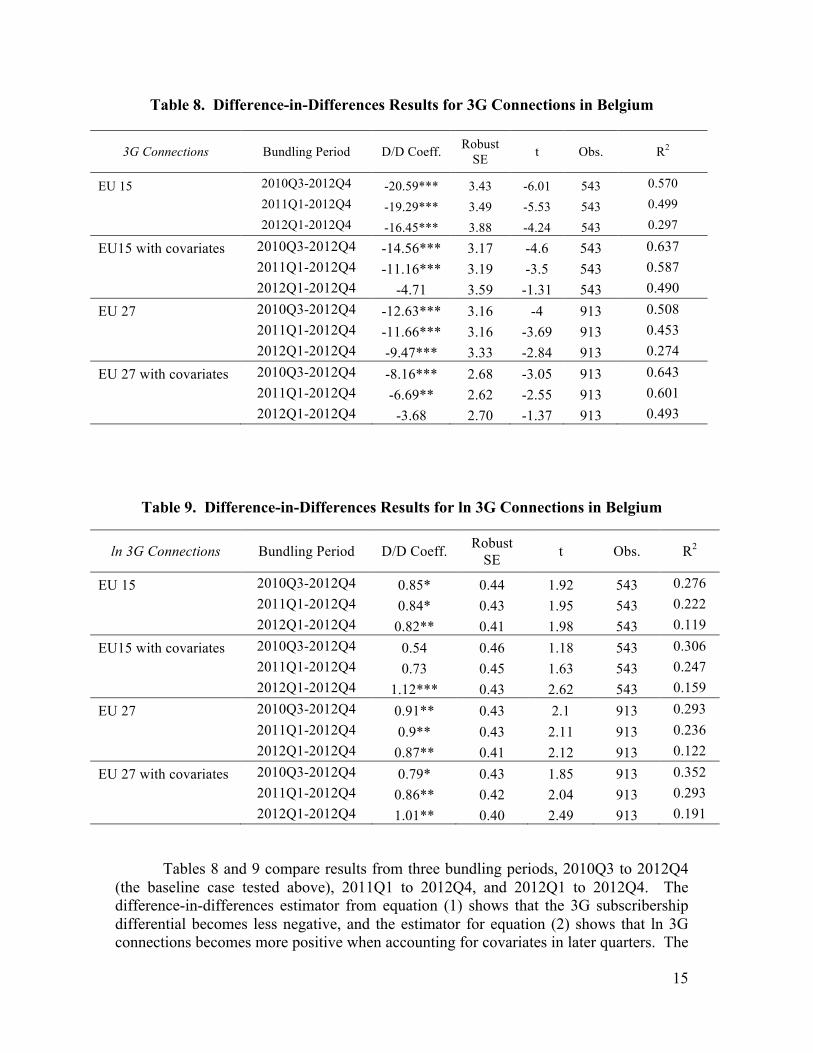
For each of the three bundling periods, the regressions on equation (1) and equation (2) are repeated and summarized. The change in the difference-in-differences coefficient is presented to compare output effects on each of the three periods. We find that there is improvement with later periods of bundling implementation, consistent with the Belgian story of partial and delayed bundling implementation.
15
Table 8. Difference-in-Differences Results for 3G Connections in Belgium
3G Connections Bundling Period D/D Coeff. Robust SE t Obs. R2
EU 15 2010Q3-2012Q4 -20.59*** 3.43 -6.01 543 0.570
2011Q1-2012Q4 -19.29*** 3.49 -5.53 543 0.499
2012Q1-2012Q4 -16.45*** 3.88 -4.24 543 0.297
EU15 with covariates 2010Q3-2012Q4 -14.56*** 3.17 -4.6 543 0.637 2011Q1-2012Q4 -11.16*** 3.19 -3.5 543 0.587 2012Q1-2012Q4 -4.71 3.59 -1.31 543 0.490 EU 27 2010Q3-2012Q4 -12.63*** 3.16 -4 913 0.508 2011Q1-2012Q4 -11.66*** 3.16 -3.69 913 0.453 2012Q1-2012Q4 -9.47*** 3.33 -2.84 913 0.274 EU 27 with covariates 2010Q3-2012Q4 -8.16*** 2.68 -3.05 913 0.643 2011Q1-2012Q4 -6.69** 2.62 -2.55 913 0.601 2012Q1-2012Q4 -3.68 2.70 -1.37 913 0.493
Table 9. Difference-in-Differences Results for ln 3G Connections in Belgium
ln 3G Connections Bundling Period D/D Coeff. Robust SE t Obs. R2
EU 15 2010Q3-2012Q4 0.85* 0.44 1.92 543 0.276 2011Q1-2012Q4 0.84* 0.43 1.95 543 0.222 2012Q1-2012Q4 0.82** 0.41 1.98 543 0.119 EU15 with covariates 2010Q3-2012Q4 0.54 0.46 1.18 543 0.306 2011Q1-2012Q4 0.73 0.45 1.63 543 0.247 2012Q1-2012Q4 1.12*** 0.43 2.62 543 0.159 EU 27 2010Q3-2012Q4 0.91** 0.43 2.1 913 0.293 2011Q1-2012Q4 0.9** 0.43 2.11 913 0.236 2012Q1-2012Q4 0.87** 0.41 2.12 913 0.122 EU 27 with covariates 2010Q3-2012Q4 0.79* 0.43 1.85 913 0.352 2011Q1-2012Q4 0.86** 0.42 2.04 913 0.293 2012Q1-2012Q4 1.01** 0.40 2.49 913 0.191
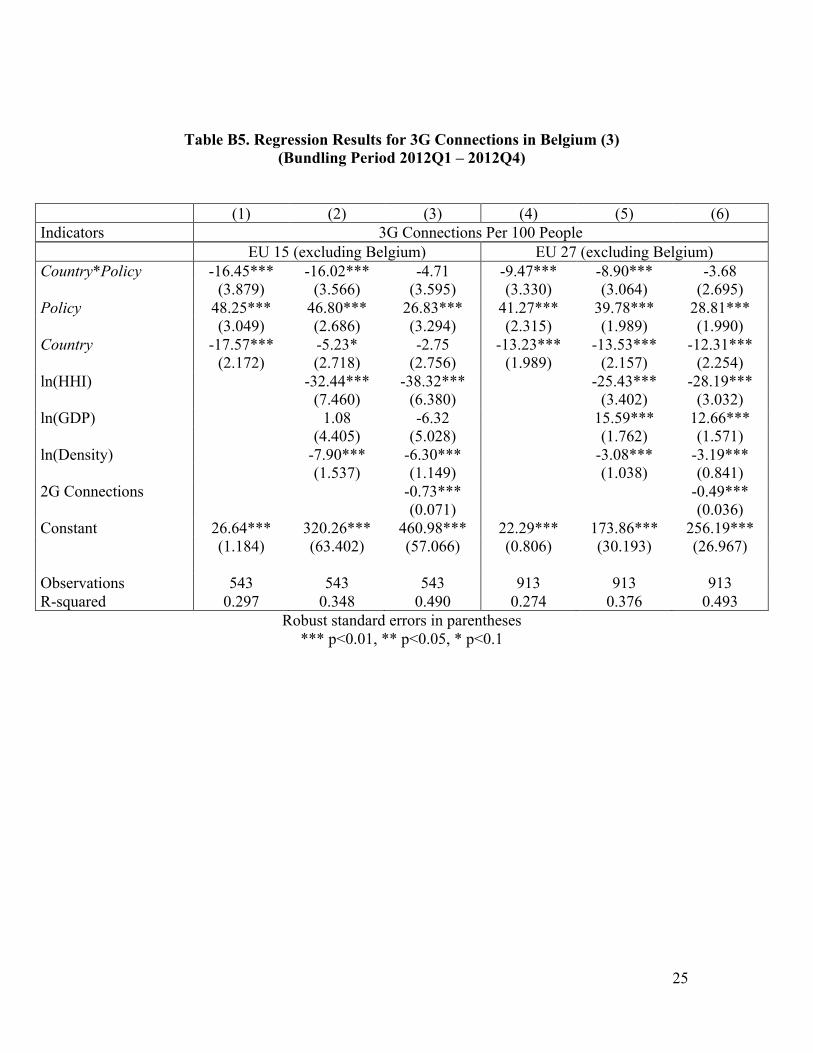
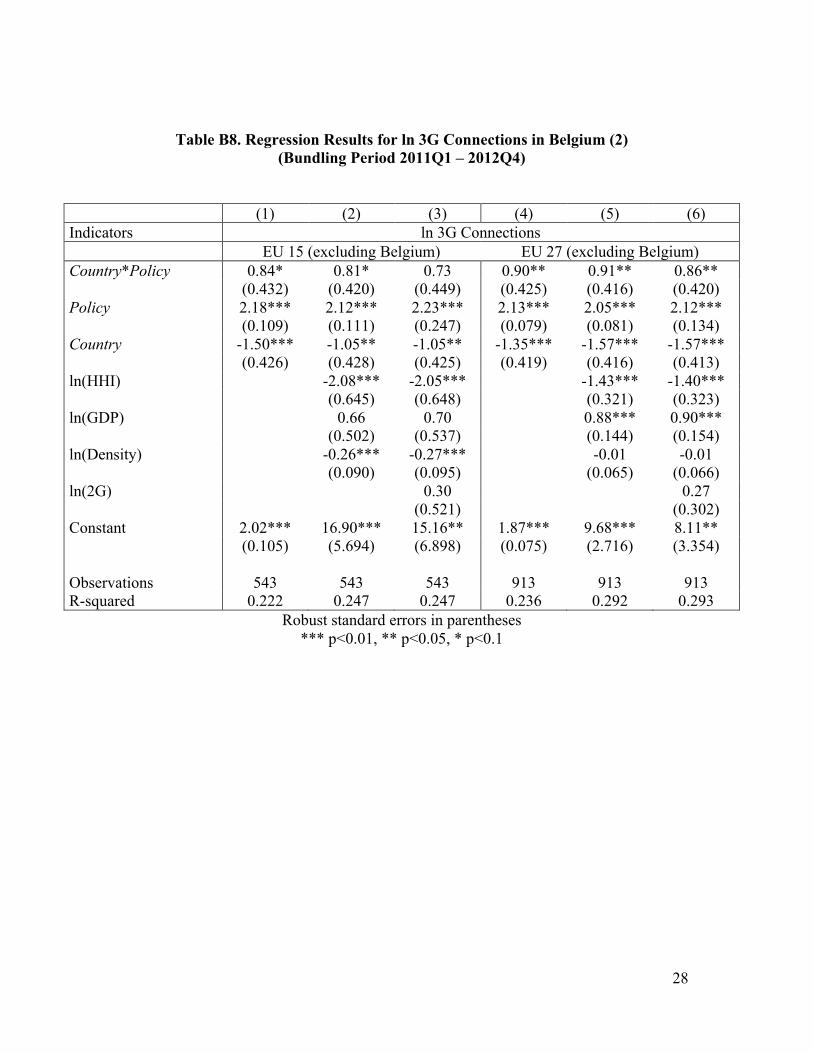
Tables 8 and 9 compare results from three bundling periods, 2010Q3 to 2012Q4 (the baseline case tested above), 2011Q1 to 2012Q4, and 2012Q1 to 2012Q4. The difference-in-differences estimator from equation (1) shows that the 3G subscribership differential becomes less negative, and the estimator for equation (2) shows that ln 3G connections becomes more positive when accounting for covariates in later quarters. The
16
difference-in-differences level of 3G connections with covariates, for instance, is estimated as -14.56 in the earliest period, where the deficit shrinks in later periods, to -11.16 to -4.71. The estimator for ln 3G connections with covariates follows similar behavior, where ln 3G connections increase from 0.54, 0.73, to 1.12. Without covariates, the difference-in-differences for ln 3G connections appears to decline with small increments with a low R2. This ambiguous result can be tested with more data to increase the sample size for comparison of additional quarters of 3G connections.
Consistent with the baseline case in Belgium, the null hypothesis, H0: β3 < 0, is rejected for later periods of partial and delayed implementation of handset bundling. Handset bundling, albeit in limited forms in 2011 and 2012, is correlated with positive differences in ln 3G connections for all three time periods. The three time periods also provide estimates of changes in 3G subscribership through various bundling policy changes. The negative coefficient remains for 3G connections, but the estimates become less negative. The positive coefficient grows for ln 3G connections over time when including covariates, with ambiguous effects without covariates. Overall, the exercise to investigate later time segments allows for robustness checks on the result.
Other robustness checks confirm this analysis. Regressions with covariates include and exclude 2G connections, as seen in the Appendix. The negative coefficient on ln(HHI) in regression results is expected, where higher levels of concentration indicate less competition, higher prices, and lower output in 3G connections. The positive coefficient on ln(GDP in PPS) is expected, where higher gross domestic product in purchasing price standard indicates more income to purchase consumer goods and services such as 3G connections. The negative coefficient on ln(Density) is explained by an investigation of mean values of country level data, where some countries have large land area with small concentrated populations, lowering the level of population density without accounting for the distribution of urban centers. While density may explain economies of scale from mobile network deployment, this metric measures populated land areas and total land area with uniform treatment. The coefficients on 2G connections in equation (1) and ln 2G connections in equation (2) are negative. This negative correlation to 3G connections may be explained by the replacement of 2G connections with 3G connections. To account for the transition to 3G services, we include regressions excluding the 2G connections covariate as well. Results, as listed in the Appendix, are robust with respect to 2G connections. Heteroskedastic-consistent standard errors are checked through application of robust standard errors in ordinary least squares analysis.
V. Mobile Handsets and Service Adoption
Empirical examples of anti-competitive foreclosure are limited in the literature; studies generally find that vertical integration, and its contractual cousin—bundling—are efficient and pro-consumer (Cooper et al. 2005; Lafontaine & Slade 2007; Riordan 2008; Owen 2011). Since 2007, vertical restraints, which were often struck down in antitrust law under a per se rule against price-fixing in the past, are now evaluated under the rule of reason standard (Leegin 2007). While the antitrust bar accepts this view of non-price vertical conduct, Liebowitz and Margolis (2008, p. 42) note, telecom policy scholars
17
have often remained skeptical: “Arguably it is now telecommunications law that is the arena that is most hostile to bundles and tie-in sales.” Tim Wu, Rob Frieden, and others allege consumers are harmed by carrier control over handsets. The output expansions in Finland, particularly, and in Belgium after deregulation undermine that view.
Consistent with the data, it is likely that mobile handset subsidies enable efficiencies. Vertical integration assists coordinating investments in developing ecosystems. Network effects in handset adoption impact the development of content and applications that complement 3G devices. By subsidizing new, costly, and more functional phones for customers, the mobile carrier helps to “seed” network growth. So long as the network can reasonably recoup subsidies via long-term service contracts, the result is a positive-sum game: a valuable ecosystem is created, delivering net benefits to consumers and suppliers. In effect, the wireless operator internalizes externalities by contracting with handset manufacturers (Liebowitz & Margolis 1994; Barnett 2011).
Technology platforms have substantial network effects. 3G technology ushered in new opportunities for mobile data usage, but the creation of applications – exploiting these opportunities – required an “installed based” in order to attract investments in such complements. Carriers and hanset makers confront a chicken-egg problem: (a) at first, potential 3G customers will find almost no apps and no social networks, and hence evince little demand for expensive new 3G phones; and (b) at first, software developers will not write apps for a nonexistent market. Technology companies have devised ways to get around these coordination problems, including giving away (or subsidiz9ing) software or hardware to gain a critical mass of users (Barnett 2011, pp. 1875-89). Subsidizing handsets also encourages adoption by revealing carriers’ commitments to supporting the technology. In this way, the carriers encourage platform development, increasing demand for the wireless services they supply.
Retail product bundles can provide other efficiencies. Consumers may benefit from a reduction in search costs and transaction costs (Tallberg et al. 2007, p. 649). Because consumers, as a practical matter, use their phones with a particular carrier, one-stop shopping benefits the consumer as two transactions become one. As demonstrated in Finland, bundling restrictions increased search costs for consumers who frequently could not figure out how to access the network with their devices. Information was fragmented when retail interfaces were separated between handset manufacturer and mobile operator (Saarikoski 2006, p. 65). This depressed demand for devices and advanced networks.
VI. Conclusion
Two natural experiments in bundling policy have demonstrated significant output effects. The evidence does not support the view that bundling 3G handsets with 3G network service contracts restricts consumer welfare; indeed, the positive effect of deregulation in both Finland and Belgium, albeit in differing doses and under distinct conditions, supports the view that the integrated offerings common in the marketing of
18
mobile services allow firms and consumers to realize, and share, efficiency gains. It bears noting that this is the conclusion not only of the observed empirical results, but of regulators in both Finland and Belgium, who moved to relax the prohibition on bundling in order to stimulate growth in the sector.
19
Appendix A: Data Sources
Wireless Intelligence Database: Our main source of data was the Wireless Intelligence database of the GSM Association, London, United Kingdom. This data includes 1,080 observations of quarterly data for 3G mobile connections in 27 European Union countries, between 2003Q1 and 2012Q4. The sample includes the following 27 countries: Austria, Belgium, Bulgaria, Cyprus, Czech Republic, Denmark, Estonia, Finland, France, Germany, Greece, Hungary, Ireland, Italy, Latvia, Lithuania, Luxembourg, Malta, Netherlands, Poland, Portugal, Romania, Slovakia, Slovenia, Spain, Sweden, United Kingdom. EU 15 countries with greater mean quarterly GDP between 2003 and 2012 include: Austria, Belgium, Denmark, Finland, France, Germany, Greece, Ireland, Italy, United Kingdom, Netherlands, Poland, Portugal, Spain, Sweden, United Kingdom, with quarterly GDP in millions of euro (from 1.1.1999), code namq_gdp_c, not seasonally adjusted data, at current prices, from Eurostat, 2013, http://epp.eurostat.ec.europa.eu/ portal/page/portal/national_accounts/data/database. A note is warranted on other data sources for mobile 3G penetration rates. International Telecommunications Union mobile broadband indicator definitions have changed several times during the same period, and were not included in this study, notably, 271mb (2007); 271mb_use (2010); 911mb_active (2011); 271mw (2011); i271mw (2011); or 911mw (2012). The European Commission Digital Scorecard/COCOM dataset also has discontinuities and were not included here, notably, mbb_penet (2012); or i_iu3g (2012).
3G Connections: The Wireless Intelligence Database considers third-generation (3G) network technologies, CDMA2000 1xEV-DO, CDMA2000 1xEV-DO Rev. A, CDMA2000 1xEV-DO Rev. B, WCDMA, WCDMA HSPA, and TD-SCDMA. Wireless Intelligence classifies a connection as registered on a mobile network at the end of the period for 3G unique SIM cards (or phone numbers, where SIM cards are not used).
2G Connections: The Wireless Intelligence Database considers second-generation (2G) network technologies, cdmaOne, CDMA2000 1X, GSM, PDC, PHS, iDEN, and TDMA.
Herfindahl-Hirschman Index: The Wireless Intelligence Database includes a quarterly measure of market concentration from 0 (even competition) to 10,000 (no competition).
Population: The Wireless Intelligence Database includes quarterly population data, sourced from United Nations, Population Division World Population Prospects, which counts all residents at the end of each period.
GDP in PPS: Eurostat provides GDP per capita in Purchasing Power Standards (PPS), code tec00114, from 2003 to 2012, indexed by EU28=100 and EU27=100, http://epp.eurostat.ec.europa.eu/portal/page/portal/purchasing_power_parities/data/main_tables.
Population Density: Calculated from quarterly population data and country area in square kilometers from the World Bank World Development Indicators (WDI) database, 2013.
20
Appendix B: Data Summary and Regression Results
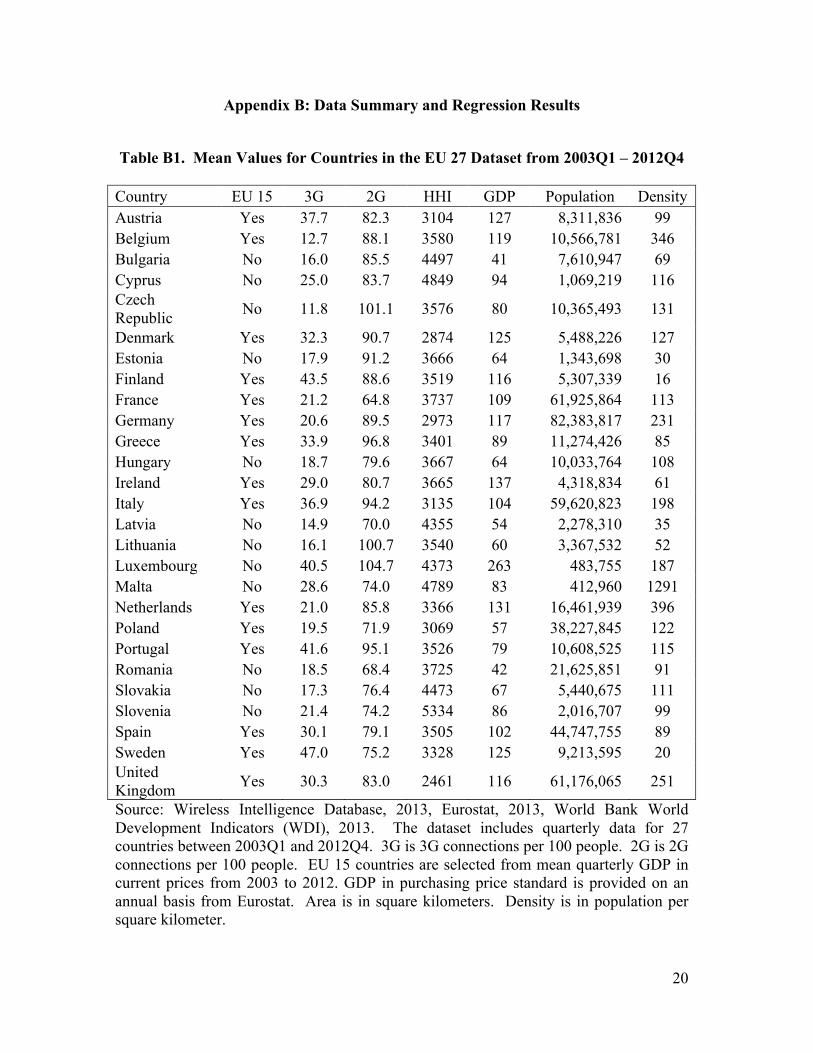
Table B1. Mean Values for Countries in the EU 27 Dataset from 2003Q1 – 2012Q4
Country EU 15 3G 2G HHI GDP Population Density Austria Yes 37.7 82.3 3104 127 8,311,836 99 Belgium Yes 12.7 88.1 3580 119 10,566,781 346 Bulgaria No 16.0 85.5 4497 41 7,610,947 69 Cyprus No 25.0 83.7 4849 94 1,069,219 116 Czech Republic No 11.8 101.1 3576 80 10,365,493 131
Denmark Yes 32.3 90.7 2874 125 5,488,226 127 Estonia No 17.9 91.2 3666 64 1,343,698 30 Finland Yes 43.5 88.6 3519 116 5,307,339 16 France Yes 21.2 64.8 3737 109 61,925,864 113 Germany Yes 20.6 89.5 2973 117 82,383,817 231 Greece Yes 33.9 96.8 3401 89 11,274,426 85 Hungary No 18.7 79.6 3667 64 10,033,764 108 Ireland Yes 29.0 80.7 3665 137 4,318,834 61 Italy Yes 36.9 94.2 3135 104 59,620,823 198 Latvia No 14.9 70.0 4355 54 2,278,310 35 Lithuania No 16.1 100.7 3540 60 3,367,532 52 Luxembourg No 40.5 104.7 4373 263 483,755 187 Malta No 28.6 74.0 4789 83 412,960 1291 Netherlands Yes 21.0 85.8 3366 131 16,461,939 396 Poland Yes 19.5 71.9 3069 57 38,227,845 122 Portugal Yes 41.6 95.1 3526 79 10,608,525 115 Romania No 18.5 68.4 3725 42 21,625,851 91 Slovakia No 17.3 76.4 4473 67 5,440,675 111 Slovenia No 21.4 74.2 5334 86 2,016,707 99 Spain Yes 30.1 79.1 3505 102 44,747,755 89 Sweden Yes 47.0 75.2 3328 125 9,213,595 20 United Kingdom Yes 30.3 83.0 2461 116 61,176,065 251
Source: Wireless Intelligence Database, 2013, Eurostat, 2013, World Bank World Development Indicators (WDI), 2013. The dataset includes quarterly data for 27 countries between 2003Q1 and 2012Q4. 3G is 3G connections per 100 people. 2G is 2G connections per 100 people. EU 15 countries are selected from mean quarterly GDP in current prices from 2003 to 2012. GDP in purchasing price standard is provided on an annual basis from Eurostat. Area is in square kilometers. Density is in population per square kilometer.

21
22
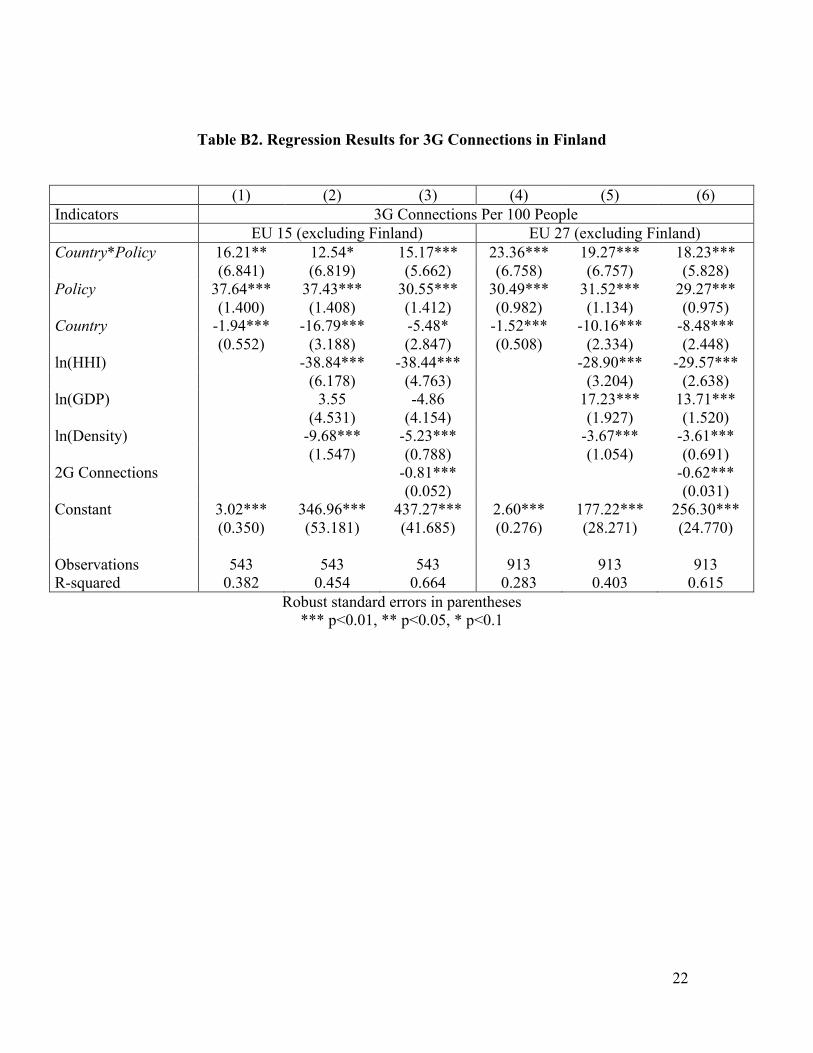
Table B2. Regression Results for 3G Connections in Finland
(1) (2) (3) (4) (5) (6) Indicators 3G Connections Per 100 People EU 15 (excluding Finland) EU 27 (excluding Finland) Country*Policy 16.21** 12.54* 15.17*** 23.36*** 19.27*** 18.23*** (6.841) (6.819) (5.662) (6.758) (6.757) (5.828) Policy 37.64*** 37.43*** 30.55*** 30.49*** 31.52*** 29.27*** (1.400) (1.408) (1.412) (0.982) (1.134) (0.975) Country -1.94*** -16.79*** -5.48* -1.52*** -10.16*** -8.48*** (0.552) (3.188) (2.847) (0.508) (2.334) (2.448) ln(HHI) -38.84*** -38.44*** -28.90*** -29.57*** (6.178) (4.763) (3.204) (2.638) ln(GDP) 3.55 -4.86 17.23*** 13.71*** (4.531) (4.154) (1.927) (1.520) ln(Density) -9.68*** -5.23*** -3.67*** -3.61*** (1.547) (0.788) (1.054) (0.691) 2G Connections -0.81*** -0.62*** (0.052) (0.031) Constant 3.02*** 346.96*** 437.27*** 2.60*** 177.22*** 256.30*** (0.350) (53.181) (41.685) (0.276) (28.271) (24.770) Observations 543 543 543 913 913 913 R-squared 0.382 0.454 0.664 0.283 0.403 0.615
Robust standard errors in parentheses *** p<0.01, ** p<0.05, * p<0.1
23
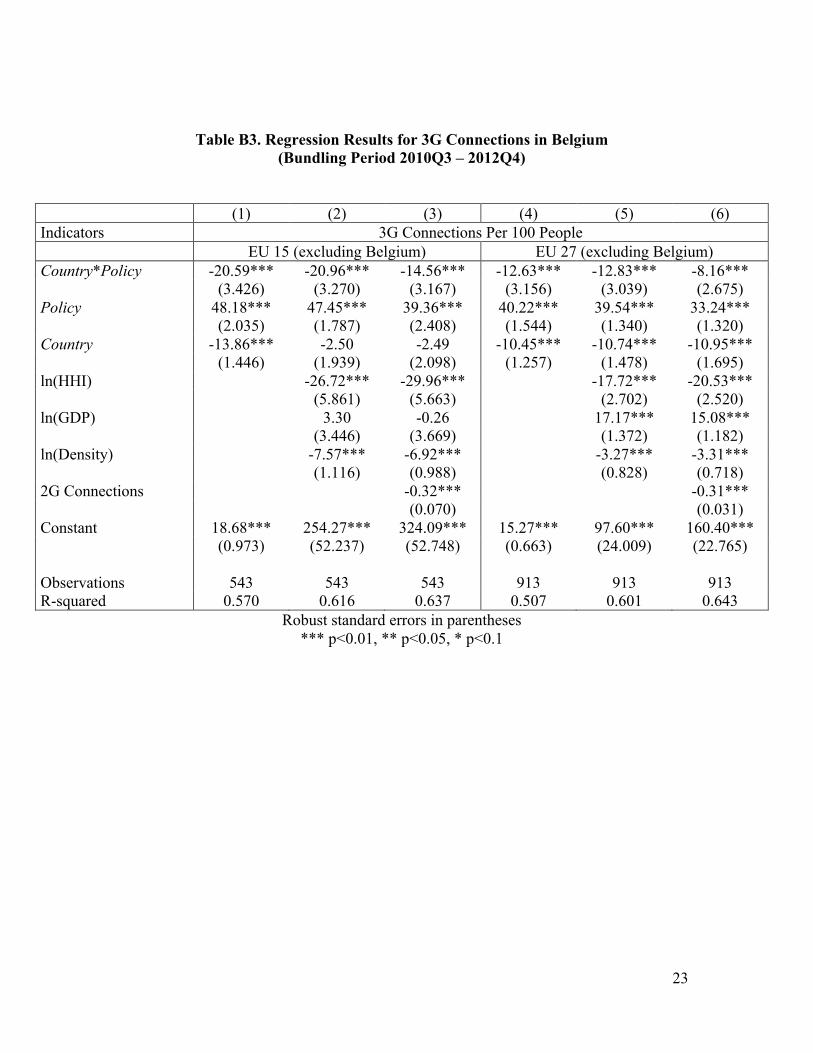
Table B3. Regression Results for 3G Connections in Belgium (Bundling Period 2010Q3 – 2012Q4)
(1) (2) (3) (4) (5) (6) Indicators 3G Connections Per 100 People EU 15 (excluding Belgium) EU 27 (excluding Belgium) Country*Policy -20.59*** -20.96*** -14.56*** -12.63*** -12.83*** -8.16*** (3.426) (3.270) (3.167) (3.156) (3.039) (2.675) Policy 48.18*** 47.45*** 39.36*** 40.22*** 39.54*** 33.24*** (2.035) (1.787) (2.408) (1.544) (1.340) (1.320) Country -13.86*** -2.50 -2.49 -10.45*** -10.74*** -10.95*** (1.446) (1.939) (2.098) (1.257) (1.478) (1.695) ln(HHI) -26.72*** -29.96*** -17.72*** -20.53*** (5.861) (5.663) (2.702) (2.520) ln(GDP) 3.30 -0.26 17.17*** 15.08*** (3.446) (3.669) (1.372) (1.182) ln(Density) -7.57*** -6.92*** -3.27*** -3.31*** (1.116) (0.988) (0.828) (0.718) 2G Connections -0.32*** -0.31*** (0.070) (0.031) Constant 18.68*** 254.27*** 324.09*** 15.27*** 97.60*** 160.40*** (0.973) (52.237) (52.748) (0.663) (24.009) (22.765) Observations 543 543 543 913 913 913 R-squared 0.570 0.616 0.637 0.507 0.601 0.643
Robust standard errors in parentheses *** p<0.01, ** p<0.05, * p<0.1
24
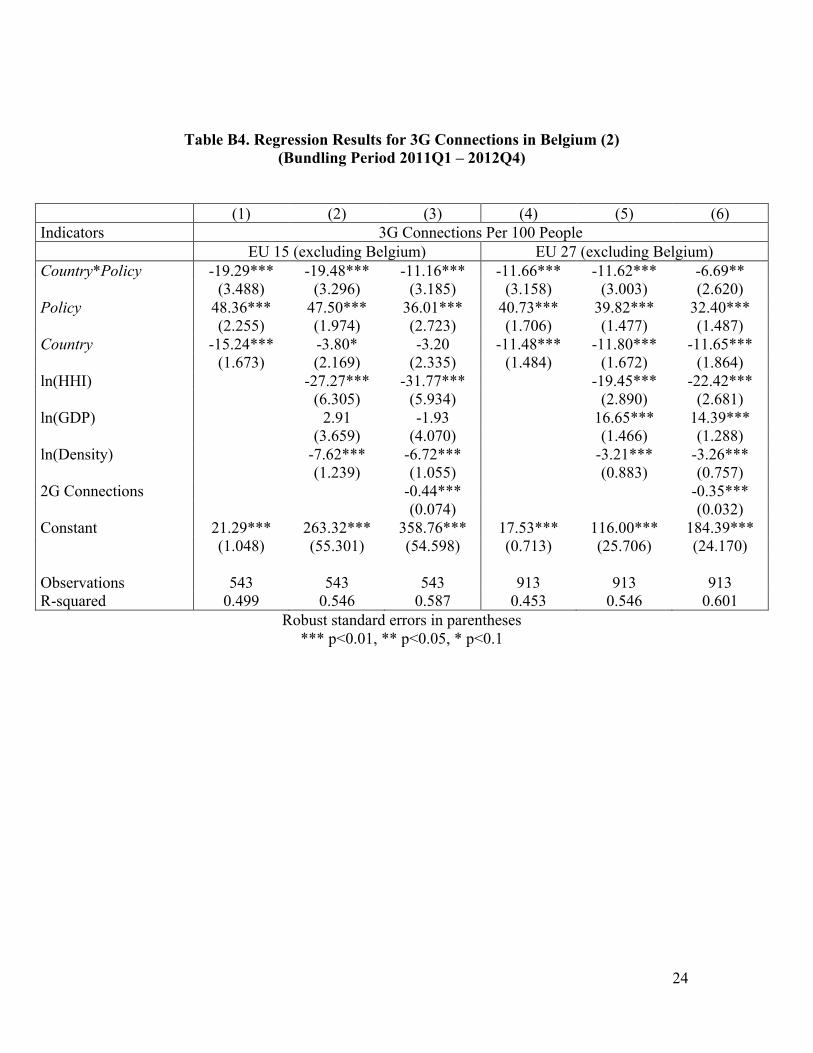
Table B4. Regression Results for 3G Connections in Belgium (2) (Bundling Period 2011Q1 – 2012Q4)
(1) (2) (3) (4) (5) (6) Indicators 3G Connections Per 100 People EU 15 (excluding Belgium) EU 27 (excluding Belgium) Country*Policy -19.29*** -19.48*** -11.16*** -11.66*** -11.62*** -6.69** (3.488) (3.296) (3.185) (3.158) (3.003) (2.620) Policy 48.36*** 47.50*** 36.01*** 40.73*** 39.82*** 32.40*** (2.255) (1.974) (2.723) (1.706) (1.477) (1.487) Country -15.24*** -3.80* -3.20 -11.48*** -11.80*** -11.65*** (1.673) (2.169) (2.335) (1.484) (1.672) (1.864) ln(HHI) -27.27*** -31.77*** -19.45*** -22.42*** (6.305) (5.934) (2.890) (2.681) ln(GDP) 2.91 -1.93 16.65*** 14.39*** (3.659) (4.070) (1.466) (1.288) ln(Density) -7.62*** -6.72*** -3.21*** -3.26*** (1.239) (1.055) (0.883) (0.757) 2G Connections -0.44*** -0.35*** (0.074) (0.032) Constant 21.29*** 263.32*** 358.76*** 17.53*** 116.00*** 184.39*** (1.048) (55.301) (54.598) (0.713) (25.706) (24.170) Observations 543 543 543 913 913 913 R-squared 0.499 0.546 0.587 0.453 0.546 0.601
Robust standard errors in parentheses *** p<0.01, ** p<0.05, * p<0.1
25
Table B5. Regression Results for 3G Connections in Belgium (3) (Bundling Period 2012Q1 – 2012Q4)
(1) (2) (3) (4) (5) (6) Indicators 3G Connections Per 100 People EU 15 (excluding Belgium) EU 27 (excluding Belgium) Country*Policy -16.45*** -16.02*** -4.71 -9.47*** -8.90*** -3.68 (3.879) (3.566) (3.595) (3.330) (3.064) (2.695) Policy 48.25*** 46.80*** 26.83*** 41.27*** 39.78*** 28.81*** (3.049) (2.686) (3.294) (2.315) (1.989) (1.990) Country -17.57*** -5.23* -2.75 -13.23*** -13.53*** -12.31*** (2.172) (2.718) (2.756) (1.989) (2.157) (2.254) ln(HHI) -32.44*** -38.32*** -25.43*** -28.19*** (7.460) (6.380) (3.402) (3.032) ln(GDP) 1.08 -6.32 15.59*** 12.66*** (4.405) (5.028) (1.762) (1.571) ln(Density) -7.90*** -6.30*** -3.08*** -3.19*** (1.537) (1.149) (1.038) (0.841) 2G Connections -0.73*** -0.49*** (0.071) (0.036) Constant 26.64*** 320.26*** 460.98*** 22.29*** 173.86*** 256.19*** (1.184) (63.402) (57.066) (0.806) (30.193) (26.967) Observations 543 543 543 913 913 913 R-squared 0.297 0.348 0.490 0.274 0.376 0.493
Robust standard errors in parentheses *** p<0.01, ** p<0.05, * p<0.1
26
Table B6. Regression Results for ln 3G Connections in Finland
(1) (2) (3) (4) (5) (6) Indicators ln 3G Connections EU 15 (excluding Finland) EU 27 (excluding Finland) Country*Policy 0.92 0.66 0.69 1.09 0.84 0.83 (0.669) (0.657) (0.669) (0.660) (0.650) (0.669) Policy 3.58*** 3.58*** 3.52*** 3.41*** 3.48*** 3.43*** (0.174) (0.166) (0.182) (0.139) (0.129) (0.136) Country -0.62 -1.27* -1.16* -0.48 -0.86 -0.78 (0.644) (0.645) (0.661) (0.635) (0.633) (0.657) ln(HHI) -2.42*** -2.40*** -1.63*** -1.65*** (0.428) (0.428) (0.214) (0.211) ln(GDP) 0.93*** 0.85** 1.16*** 1.08*** (0.348) (0.378) (0.106) (0.117) ln(Density) -0.45*** -0.41*** -0.14*** -0.12** (0.069) (0.078) (0.051) (0.049) ln(2G) -0.53** -0.97*** (0.250) (0.170) Constant -0.16 17.21*** 19.55*** -0.30** 8.33*** 13.19*** (0.167) (3.761) (4.010) (0.133) (1.886) (2.147) Observations 543 543 543 913 913 913 R-squared 0.611 0.657 0.660 0.559 0.642 0.655
Robust standard errors in parentheses *** p<0.01, ** p<0.05, * p<0.1
27
Table B7. Regression Results for ln 3G Connections in Belgium (Bundling Period 2010Q3 – 2012Q4)
(1) (2) (3) (4) (5) (6) Indicators ln 3G Connections EU 15 (excluding Belgium) EU 27 (excluding Belgium) Country*Policy 0.85* 0.80* 0.54 0.91** 0.91** 0.79* (0.442) (0.430) (0.456) (0.435) (0.427) (0.428) Policy 2.28*** 2.24*** 2.56*** 2.22*** 2.16*** 2.31*** (0.112) (0.113) (0.241) (0.082) (0.083) (0.130) Country -1.56*** -1.12** -1.11*** -1.40*** -1.61*** -1.61*** (0.434) (0.435) (0.422) (0.426) (0.424) (0.416) ln(HHI) -1.99*** -1.89*** -1.29*** -1.22*** (0.619) (0.625) (0.312) (0.316) ln(GDP) 0.69 0.83* 0.91*** 0.97*** (0.487) (0.504) (0.139) (0.146) ln(Density) -0.26*** -0.29*** -0.01 -0.02 (0.086) (0.092) (0.063) (0.064) ln(2G) 0.97* 0.59** (0.516) (0.290) Constant 1.87*** 15.87*** 10.23 1.71*** 8.18*** 4.70 (0.109) (5.467) (6.662) (0.078) (2.650) (3.299) Observations 543 543 543 913 913 913 R-squared 0.276 0.300 0.306 0.293 0.348 0.352
Robust standard errors in parentheses *** p<0.01, ** p<0.05, * p<0.1
28
Table B8. Regression Results for ln 3G Connections in Belgium (2) (Bundling Period 2011Q1 – 2012Q4)
(1) (2) (3) (4) (5) (6) Indicators ln 3G Connections EU 15 (excluding Belgium) EU 27 (excluding Belgium) Country*Policy 0.84* 0.81* 0.73 0.90** 0.91** 0.86** (0.432) (0.420) (0.449) (0.425) (0.416) (0.420) Policy 2.18*** 2.12*** 2.23*** 2.13*** 2.05*** 2.12*** (0.109) (0.111) (0.247) (0.079) (0.081) (0.134) Country -1.50*** -1.05** -1.05** -1.35*** -1.57*** -1.57*** (0.426) (0.428) (0.425) (0.419) (0.416) (0.413) ln(HHI) -2.08*** -2.05*** -1.43*** -1.40*** (0.645) (0.648) (0.321) (0.323) ln(GDP) 0.66 0.70 0.88*** 0.90*** (0.502) (0.537) (0.144) (0.154) ln(Density) -0.26*** -0.27*** -0.01 -0.01 (0.090) (0.095) (0.065) (0.066) ln(2G) 0.30 0.27 (0.521) (0.302) Constant 2.02*** 16.90*** 15.16** 1.87*** 9.68*** 8.11** (0.105) (5.694) (6.898) (0.075) (2.716) (3.354) Observations 543 543 543 913 913 913 R-squared 0.222 0.247 0.247 0.236 0.292 0.293
Robust standard errors in parentheses *** p<0.01, ** p<0.05, * p<0.1
29
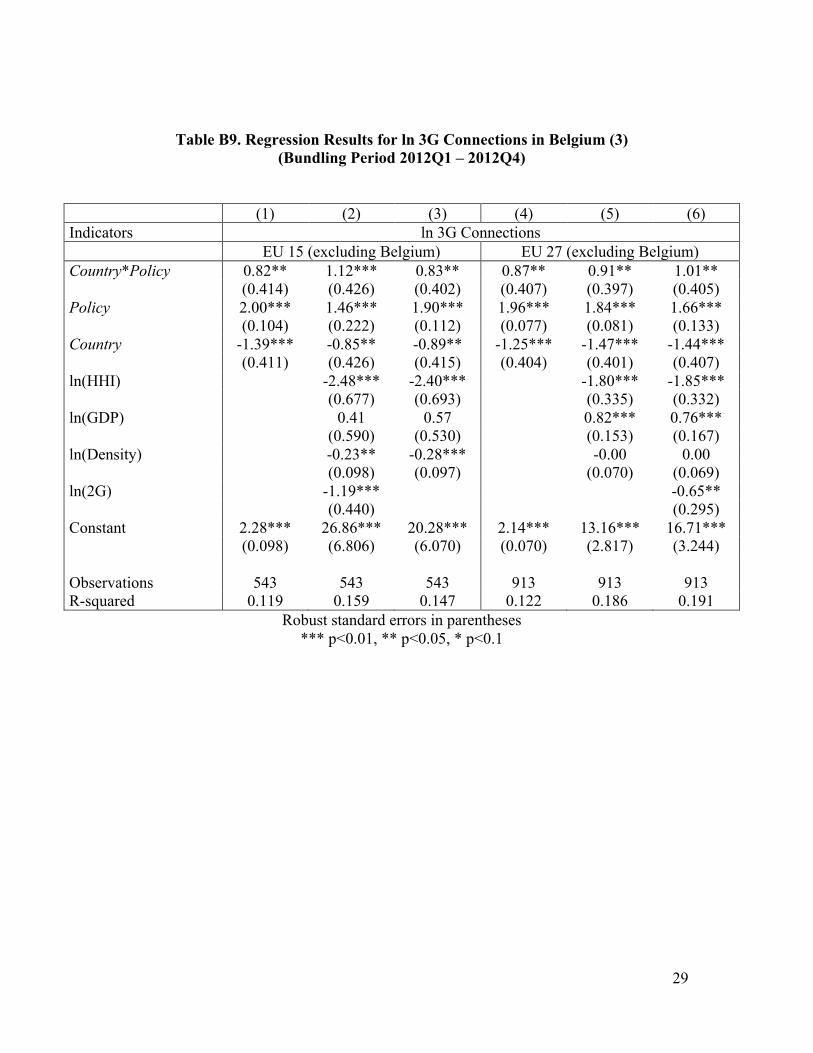
Table B9. Regression Results for ln 3G Connections in Belgium (3) (Bundling Period 2012Q1 – 2012Q4)
(1) (2) (3) (4) (5) (6) Indicators ln 3G Connections EU 15 (excluding Belgium) EU 27 (excluding Belgium) Country*Policy 0.82** 1.12*** 0.83** 0.87** 0.91** 1.01** (0.414) (0.426) (0.402) (0.407) (0.397) (0.405) Policy 2.00*** 1.46*** 1.90*** 1.96*** 1.84*** 1.66*** (0.104) (0.222) (0.112) (0.077) (0.081) (0.133) Country -1.39*** -0.85** -0.89** -1.25*** -1.47*** -1.44*** (0.411) (0.426) (0.415) (0.404) (0.401) (0.407) ln(HHI) -2.48*** -2.40*** -1.80*** -1.85*** (0.677) (0.693) (0.335) (0.332) ln(GDP) 0.41 0.57 0.82*** 0.76*** (0.590) (0.530) (0.153) (0.167) ln(Density) -0.23** -0.28*** -0.00 0.00 (0.098) (0.097) (0.070) (0.069) ln(2G) -1.19*** -0.65** (0.440) (0.295) Constant 2.28*** 26.86*** 20.28*** 2.14*** 13.16*** 16.71*** (0.098) (6.806) (6.070) (0.070) (2.817) (3.244) Observations 543 543 543 913 913 913 R-squared 0.119 0.159 0.147 0.122 0.186 0.191
Robust standard errors in parentheses *** p<0.01, ** p<0.05, * p<0.1
30
References
2008. Belgium Has the World’s Most Expensive iPhone. Flanders News.be, 11 July. http://www.deredactie.be/cm/vrtnieuws.english/news/1.339616.
2012. Belgium’s Telecom Law Goes Into Effect. Telecompaper, 1 October. http://www.telecompaper.com/news/belgiums-telecom-law-goes-into-effect--899053.
2012. S&P Summary: Belgacom S.A., Reuters, 6 December. http://www.reuters.com/article/2012/12/06/idUSWLB188620121206.
2013. T-Mobile USA Reports First Quarter 2013 Results, 8 May. http://newsroom.t-mobile.com/phoenix.zhtml?c=251624&p=irol-newsArticle&ID=1816790.
2013. Telenet Stops Handset Subsidies. Telecompaper, 4 March. http://www.telecompaper.com/news/telenet-stops-handset-subsidies--928797.
Angrist, Joshua D. & Jorn-Steffen Pischke. 2008. Mostly Harmless Econometrics. Princeton: Princeton University Press.
Barnett, Jonathan M. 2011. The Host’s Dilemma: Strategic Forfeiture in Platform Markets for Informational Goods, Harvard Law Review 124: 1861-1938.
Belgacom Group. 2013. Investors FAQ. http://www.belgacom.com/be-en/annex_investors/Inv_FAQ.page.
Blenkinsop, Phillip. 2008. Mobistar to Sell Unlocked iPhone. Reuters, 8 July. http://www.reuters.com/article/2008/07/08/us-mobistar-iphone-idUSL0859270920080708.
Brunswick Corp. 1977. Brunswick Corp. v. Pueblo Bowl-O-Mat, 429 U.S. 477.
Caliskan, Anil, David Porter, Stephen Rassenti, Vernon L. Smith and Bart J. Wilson. 2007. Exclusionary Bundling and the Effects of a Competitive Fringe. Journal of Institutional and Theoretical Economics 163, 1: 109-132.
Card, David & Alan B. Krueger. 1994. Minimum Wages and Employment: A Case Study of the Fast-Food Industry in New Jersey and Pennsylvania. American Economic Review 84, 4: 772-793.
Cooper, James, Luke M. Froeb, Dan O’Brien, and Michael G. Vita. 2003. Vertical Antitrust Policy as a Problem of Inference. International Journal of Industrial Organization 23, 7-8: 639-64.
31
Conley, Timothy G. and Christopher R. Taber. 2011. Inference with Difference in Differences with a Small Number of Policy Changes. Review of Economics and Statistics 93, 1: 113-125.
Deckmyn, Dominique. 2008. Van Quickenborne: Verbod Koppelverkoop Zorgt Voor Dure iPhone (trans., Google Translate). ZDNet.be, 8 July. http://www.zdnet.be/iphone/87894/van-quickenborne-verbod-koppelverkoop-zorgt-voor-dure-iphone/.
DeGraba, Patrick. 2007. Why Lever into a Zero-Profit Industry: Tying, Foreclosure, and Exclusion. Journal of Economics and Management Strategy 5, 3: 433-447.
De Wit, John. 2010. Senaat Stemt Nieuwe Wet Op Consumentenbescherming (trans., Google Translate). Gazet Van Antwerpen, 29 March.
European Commission. 2010. Regulatory Framework for Electronic Communications in the European Union. https://ec.europa.eu/digital-agenda/sites/digital-agenda/files/regframeforec_dec2009.pdf.
European Commission. 2013. Report from the Commission to the European Parliament, the Council and the European Economic and Social Committee, First Report on the Application of Directive 2005/29/EC of the European Parliament. http://ec.europa.eu/justice/consumer-marketing/files/ucpd_report_en.pdf.
Faulhaber, Gerald and David Farber. 2010. Innovation in the Wireless Ecosystem: A Customer-Centric Framework. International Journal of Communication 4: 73-112.
Federal Communications Commission. 2013. Annual Report and Analysis of Competitive Market Conditions With Respect to Mobile Wireless, Including Commercial Mobile Services. Sixteenth Mobile Competition Report. FCC Record.
Federal Communications Commission. 2007. Service Rules for the 698-746, 747-762 and 777-792 MHz Bands. Second Report & Order. FCC Record.
Ford, George, Thomas M. Koutsky, and Lawrence J. Spiwak. 2009. A Policy and Economic Exploration of Wireless Carterfone Regulation. Santa Clara Computer & High Technology Law Journal 25, 3: 649-675.
Frieden, Rob. 2007. Hold the Phone: Assessing the Rights of Wireless Handset Owners and Carriers. University of Pittsburgh Law Review 69, 4: 675-725.
Gimeno, Javier et al. 2007. Launching 3G Mobile Services in Finland: War or Peace? Insead 10, 7: 1-25.
GSMA. 2013. Brussels’ Mobile Base Station Restrictions Hurting the Economy. http://www.gsma.com/publicpolicy/brussels-mobile-base-station-restrictions-hurting-the-economy.
32
Hahn, Robert W., Robert E. Litan, and Hal J. Singer. 2007. The Economics of “Wireless Net Neutrality.” Journal of Competition Law and Economics 3: 1-51.
Heatley, Dave and Bronwyn Howell. 2009. The Brand is the Bundle: Strategies for the Mobile Ecosystem. Communications & Strategies 75, 3: 79-102.
Howell, Bronwyn and Manisha Sangekar. 2008. Telecommunications Market Evolution in Finland and New Zealand: Unbundling the Differences. Wellington: New Zealand Institute for the Study of Competition and Regulation Inc. and Victoria Management School, Victoria University of Wellington.
ITU. 2012. World Telecommunication/ICT Indications Database, 16th Edition.
Jacobson, Jonathan. 2002. Exclusive Dealing, “Foreclosure,” and Consumer Harm. Antitrust Law Journal 70: 311-369.
Kivi, Antero. 2007. Mobile Data Adoption in Finland, 2005-2006, in Proceedings of the Sixth Conference on Telecommunication Techno-Economics.
KPN/BASE Facts. 2011. Why 3G Was Put on Hold, Corporate Affairs Department, 3 May. http://www.kpnbasefacts.be/network/why-3g-was-put-on-hold/.
Kutner, Michael et al. 2004. Applied Linear Regression Models. New York: McGraw Hill.
Lafontaine, Francine and Margaret Slade. 2007. Vertical Integration and Firm Boundaries: The Evidence. Journal of Economic Literature 45, 3: 629-685.
2007. Leegin Creative Leather Products v. PSKS, Inc., 551 U.S. 877.
Liebowitz, Stanley and Stephen E. Margolis. 1994. Network Externality: An Uncommon Tragedy. Journal of Economic Perspectives 8, 2: 133-150.
Liebowitz, Stanley and Stephen E. Margolis. 2008. Bundles of Joy: The Ubiquity and Efficiency of Bundles in New Technology Markets. Journal of Competition Law & Economics 5, 1: 1-47. Martens, John. 2010. Mobistar Won’t Start Handset Subsidies Before Law is Enacted. Bloomberg, 22 April.
Mayo, John W. and Scott Wallsten. 2010. Enabling Efficient Wireless Communications: The Role of Secondary Spectrum Markets. Information Economics & Policy 22, 1: 61-72.
Mobistar. 2012. Annual Report 2011. http://corporate.mobistar.be/en/pdf/annual_report_2011a_en.pdf.
33
Mobistar. 2013. iPhone 4S – 16GB wit. http://www.mobistar.be/nl/aanbod/shop/smartphone/iphone-4s-16gb-wit.
NautaDutilh. 2010. New Commercial Practices and Consumer Protection Act, 29 March. http://www.newsletter-nautadutilh.com/EN/xzine/intellectual_property/new_commercial_practices_and_consumer_protection_act.html?cid=4&xzine_id=4401.
OECD. 2013. Mobile Handset Acquisition Models. Digital Economy Papers No. 244. OECD Publishing. http://dx.doi.org/10.1787/5k43n203mlbr-en.
OECD. 2010. Wireless Broadband Indicator Methodology.
Okholm, Henrik Ballebye et al. 2008. How Does Handset Subsidies Effect Incentives to Innovate? Economic Theory and Empirical Evidence. Copenhagen Economics 19.
Opinion of the Advocate General, Jaaskinen. 2012. Case C-375/11: Belgacom SA, Mobistar SA, KPN Group Belgium SA v. Etat Belge. http://eur-lex.europa.eu/LexUriServ/LexUriServ.do?uri=CELEX:62011CC0375:EN:HTML.
Poropudas, Timo. 2006. 3G-kännykät vetävät myyntiä (trans., Google Translate). Digitoday, 16 November. http://www.digitoday.fi/mobiili/2006/11/16/3g-kannykat-vetavat-myyntia/200620745/66.
Repo, Marko. 2006. Regulation of Wireless Stakeholders. Helsinki: Helsinki University of Technology.
Riordan, Michael H. 2008. “Competitive Effects of Vertical Integration,” in B. Paolo, Handbook of Antitrust Economics. Cambridge: MIT Press.
Saarikoski, Ville. 2006. The Odyssey of the Mobile Internet. Helsinki: The Finnish Information Society Development Centre Publication Series.
Schwartz, Marius & Federico Mini. 2007. Hanging Up on Carterfone: The Economic Case Against Access Regulation in Mobile Wireless. Working Paper.
Tallberg, Matthias, Heikki Hämmäinen, Juuso Töyli, Sauli Kamppari, and Antero Kivi. 2007. Impacts of Handset Bundling on Mobile Data Usage: The Case of Finland. Telecommunications Policy 31, 10-11: 648-659.
Tyler, John, Richard J. Murnane, and John B. Willett. 2000. Estimating the Labor Market Signaling Value of the GED. Quarterly Journal of Economics, 115, 2: 431-468.
U.S. Department of Justice and the Federal Trade Commission. 2007. Antitrust Enforcement and Intellectual Property Rights: Promoting Innovation and Competition.
34
Van Beijnum, Iljitsch. 2008. Unlocked iPhones in Belgium Make Locking Look Good. Ars Technica, 8 July. http://arstechnica.com/apple/2008/07/unlocked-iphones-in-belgium-make-locking-look-good/.
Van de Velde, Antonia. 2009. EU Court Orders Belgium to Allow Retail Bundling. Reuters, 23 April. http://in.reuters.com/article/2009/04/23/belgium-sales-court-idINL2627016820090423.
White, Aoife. 2008. Quirk in Belgian Law Drives iPhones near $1,000. USA Today, 9 July. http://usatoday30.usatoday.com/tech/products/2008-07-09-75332351_x.htm.
Wooldridge, Jeffrey M. 2006. Introductory Econometrics (3d ed.). Thomson South-Western.
Wu, Tim. 2007. Wireless Carterfone. International Journal of Communication 1, 1: 389-426.