Embed Size (px)
Citation preview
1
REFINEMENT OF PROCEDURES
FOR DETERMINING FLOODWAY EXTENT C R Thomas1, R Golaszewski2
1 Manager, Environment & Water Resources, WorleyParsons 2 Water Resources Engineer, WorleyParsons Abstract: Floodways are defined as those areas where a significant discharge of water occurs during floods. However, there are no specific procedures for identifying floodways or for defining their extent. The methodology for defining floodway extent is left to practitioners and flood risk management committees to determine. As a result, the outcomes are often subjective and can lead to conjecture due to the legal implications of land being classified as a floodway. Over the last decade, there has been considerable advancement in the tools used to simulate flooding. Accessibility to improved and more detailed topographic data has also occurred, as has the capacity to more rigorously interrogate flood characteristics derived from computer modelling using this data. In particular, the increasing use of this data in 2D hydrodynamic models has allowed more meaningful representation of flood flow across floodplains. A range of data-sets such as depth, velocity, velocity-depth product, distribution of flow and unit stream power, can now be readily exported from flood models. This data can be combined with reliable topographic data to facilitate the hydraulic categorization of floodplains, including the identification of floodways. At the same time, the modelling tools can be more easily adapted to test the impact of floodplain encroachment and confirm initial estimates of floodway corridors. This paper expands upon the issues discussed in a paper presented by the same authors for the 50th FMA Conference. It outlines a more rigorous methodology that has been developed for application to all river and floodplain systems. It also documents examples of major and minor river systems where this methodology has been applied and considers the impact that increased rainfall intensity due to climate change could have on floodway extent. Keywords: hydraulic categorization, floodway, flood storage, afflux, geomorphology 1. INTRODUCTION
Floodways are those areas of a floodplain where a significant discharge of water occurs during floods [2]. They are often aligned with naturally defined channels and are areas that if only partially blocked, would cause a significant redistribution of flood flow, or a significant increase in flood level. By definition floodways are areas of high flow conveyance and can often be identified by areas of high flow velocity. The blocking of floodways typically results in significant impacts on flood characteristics such as increases in predicted peak flood level and changes in flow velocities. Therefore, it is important to define floodways in floodplain risk management so that areas where development is undesirable can be identified. Although no formal criteria are currently available, some “rules of thumb” have been presented as procedures for the delineation of floodway areas. For example, quantitative approaches were outlined in the 1986 version of the Floodplain Development Manual. These quantitative approaches suggested that the floodway zone can be defined by:
determining the extent of encroachment that will cause a maximum change in water surface elevation of no more than 100 mm;
determining areas where the velocity / depth product is greater than 1; and/or
by the extent of the 20 year recurrence flood. These approaches are all relevant but potentially ignore the significance of discharge and the impact of hydraulic controls and geomorphic features on floodwater movement.
2
In 2004 Howells et al [4] established that no “one size fits all” approach could be applied to define floodways for all types of floodplains. In 2007, Rigby [5] also raised this issue, highlighting that there is no known and universally agreed modelling procedure for the determination of the floodway and flood fringe boundaries. Rigby rightly emphasised that there is a clear need to establish a procedure for delineation of floodways. This procedure does not necessarily need to be a strict mathematically derived outcome or a direct output from a flood model, but it does need to be more rigorous in order to avoid different interpretations between practitioners and different outcomes for similar types of floodplains. In 2010, the authors of this paper (Thomas et al [9]) determined that although a one size fits all approach is not apparent, a more rigorous approach can be employed to define floodway corridors. The aim of this paper is to present the results of work that has been carried out since 2010 where efforts have been made to develop a more uniform approach to floodway delineation. 2. DETERMINATION OF FLOODWAY CORRIDORS – WORKING TOWARDS A UNIVERSAL
APPROACH
2.1 Background
Although there remains no definitive flood modelling procedure that can be applied to automate the process of generating floodway extents, access to improved data-sets and better analytical tools provides the opportunity for a more uniform and rigorous methodology for floodway delineation.
Thomas et al [9] noted that this methodology should typically involve an iterative assessment that considers:
section averaged velocity in the planning level flood at both the peak and on the rising limb of the hydrograph;
maximum velocity-depth product for the planning level flood;
topographic and geomorphic features along the floodplain;
hydraulic controls such as structures that cause backwater effects; and,
the results of hydraulic analysis and / or flood modelling that incorporates simulation of a blockage scenario or encroachment testing.
Thomas et al [9] acknowledged that this iterative process required further investigation to better define the steps. It was also recognised that application of such an iterative process would remain the domain of experienced practitioners with the skills to holistically evaluate the physical features of the floodplain and all available hydraulic / flood modelling outputs [9]. Since publication of the 2010 paper further investigations have been undertaken to determine floodway corridors throughout New South Wales. These investigations have been undertaken for a variety of river and creek systems including the larger coastal rivers and stream and channels in inland NSW. The contrasting characteristics of these streams and their floodplains led to the application of a modified methodology for floodway delineation which considered the variation in floodplain type. The modified approach led to the refinement of the iterative process outlined in 2010 by Thomas et al [9]. The refinement involved the inclusion of an additional step that places greater emphasis on conveyance; more specifically consideration of the extent of floodplain that conveys 80% of the peak flow during the planning level flood.
3
2.2 A Practical Application of the Iterative Procedure
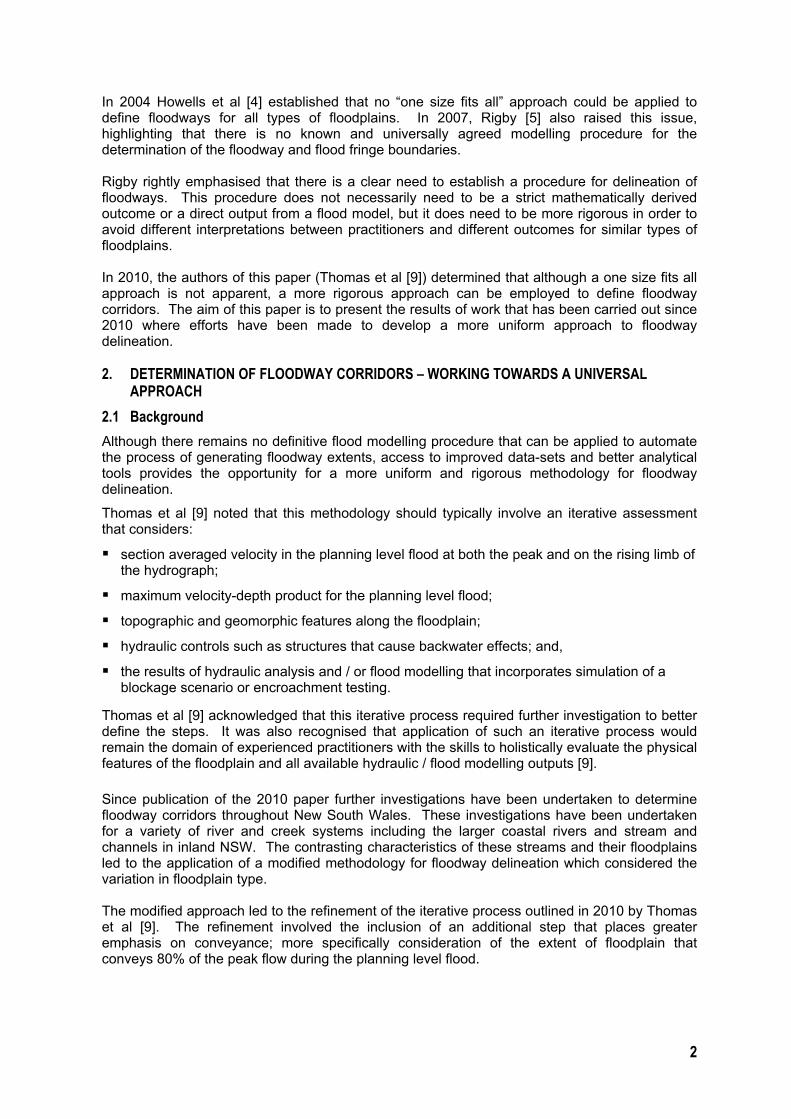
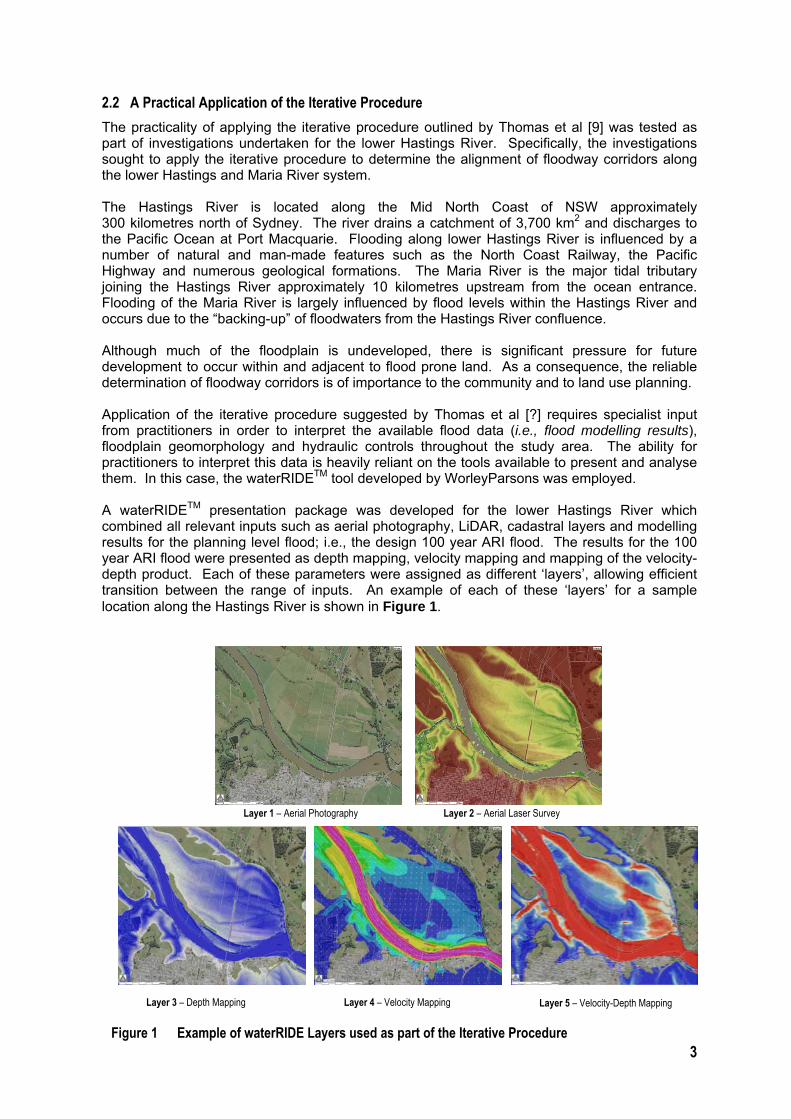
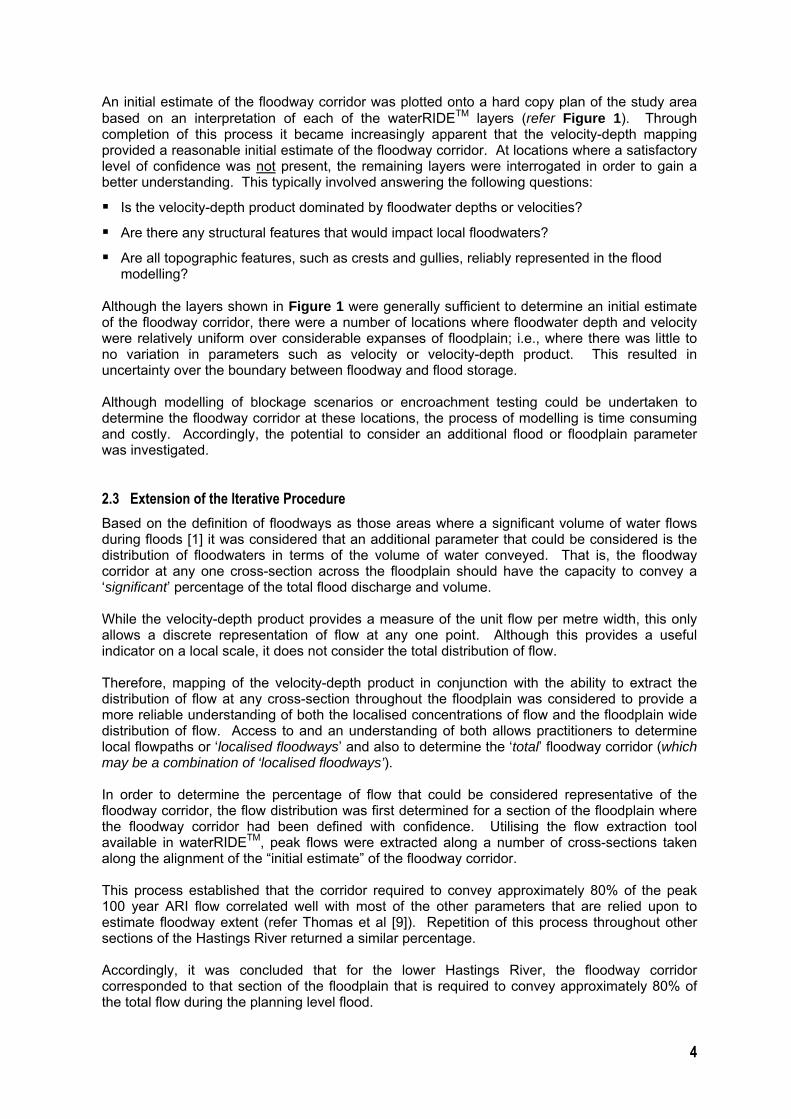
The practicality of applying the iterative procedure outlined by Thomas et al [9] was tested as part of investigations undertaken for the lower Hastings River. Specifically, the investigations sought to apply the iterative procedure to determine the alignment of floodway corridors along the lower Hastings and Maria River system. The Hastings River is located along the Mid North Coast of NSW approximately 300 kilometres north of Sydney. The river drains a catchment of 3,700 km2 and discharges to the Pacific Ocean at Port Macquarie. Flooding along lower Hastings River is influenced by a number of natural and man-made features such as the North Coast Railway, the Pacific Highway and numerous geological formations. The Maria River is the major tidal tributary joining the Hastings River approximately 10 kilometres upstream from the ocean entrance. Flooding of the Maria River is largely influenced by flood levels within the Hastings River and occurs due to the “backing-up” of floodwaters from the Hastings River confluence. Although much of the floodplain is undeveloped, there is significant pressure for future development to occur within and adjacent to flood prone land. As a consequence, the reliable determination of floodway corridors is of importance to the community and to land use planning. Application of the iterative procedure suggested by Thomas et al [?] requires specialist input from practitioners in order to interpret the available flood data (i.e., flood modelling results), floodplain geomorphology and hydraulic controls throughout the study area. The ability for practitioners to interpret this data is heavily reliant on the tools available to present and analyse them. In this case, the waterRIDETM tool developed by WorleyParsons was employed. A waterRIDETM presentation package was developed for the lower Hastings River which combined all relevant inputs such as aerial photography, LiDAR, cadastral layers and modelling results for the planning level flood; i.e., the design 100 year ARI flood. The results for the 100 year ARI flood were presented as depth mapping, velocity mapping and mapping of the velocity-depth product. Each of these parameters were assigned as different ‘layers’, allowing efficient transition between the range of inputs. An example of each of these ‘layers’ for a sample location along the Hastings River is shown in Figure 1.
Figure 1 Example of waterRIDE Layers used as part of the Iterative Procedure
Layer 5 – Velocity-Depth Mapping Layer 4 – Velocity Mapping Layer 3 – Depth Mapping
Layer 2 – Aerial Laser Survey Layer 1 – Aerial Photography
4
An initial estimate of the floodway corridor was plotted onto a hard copy plan of the study area based on an interpretation of each of the waterRIDETM layers (refer Figure 1). Through completion of this process it became increasingly apparent that the velocity-depth mapping provided a reasonable initial estimate of the floodway corridor. At locations where a satisfactory level of confidence was not present, the remaining layers were interrogated in order to gain a better understanding. This typically involved answering the following questions:
Is the velocity-depth product dominated by floodwater depths or velocities?
Are there any structural features that would impact local floodwaters?
Are all topographic features, such as crests and gullies, reliably represented in the flood modelling?
Although the layers shown in Figure 1 were generally sufficient to determine an initial estimate of the floodway corridor, there were a number of locations where floodwater depth and velocity were relatively uniform over considerable expanses of floodplain; i.e., where there was little to no variation in parameters such as velocity or velocity-depth product. This resulted in uncertainty over the boundary between floodway and flood storage. Although modelling of blockage scenarios or encroachment testing could be undertaken to determine the floodway corridor at these locations, the process of modelling is time consuming and costly. Accordingly, the potential to consider an additional flood or floodplain parameter was investigated. 2.3 Extension of the Iterative Procedure
Based on the definition of floodways as those areas where a significant volume of water flows during floods [1] it was considered that an additional parameter that could be considered is the distribution of floodwaters in terms of the volume of water conveyed. That is, the floodway corridor at any one cross-section across the floodplain should have the capacity to convey a ‘significant’ percentage of the total flood discharge and volume. While the velocity-depth product provides a measure of the unit flow per metre width, this only allows a discrete representation of flow at any one point. Although this provides a useful indicator on a local scale, it does not consider the total distribution of flow. Therefore, mapping of the velocity-depth product in conjunction with the ability to extract the distribution of flow at any cross-section throughout the floodplain was considered to provide a more reliable understanding of both the localised concentrations of flow and the floodplain wide distribution of flow. Access to and an understanding of both allows practitioners to determine local flowpaths or ‘localised floodways’ and also to determine the ‘total’ floodway corridor (which may be a combination of ‘localised floodways’). In order to determine the percentage of flow that could be considered representative of the floodway corridor, the flow distribution was first determined for a section of the floodplain where the floodway corridor had been defined with confidence. Utilising the flow extraction tool available in waterRIDETM, peak flows were extracted along a number of cross-sections taken along the alignment of the “initial estimate” of the floodway corridor. This process established that the corridor required to convey approximately 80% of the peak 100 year ARI flow correlated well with most of the other parameters that are relied upon to estimate floodway extent (refer Thomas et al [9]). Repetition of this process throughout other sections of the Hastings River returned a similar percentage. Accordingly, it was concluded that for the lower Hastings River, the floodway corridor corresponded to that section of the floodplain that is required to convey approximately 80% of the total flow during the planning level flood.
5
With this in mind, those locations of the floodplain where uncertainty existed were re-visited and re-assessed based on a detailed investigation of the flow distribution. This involved extraction of the peak flows at a number of cross-sections across the floodplain, focusing particularly on determining the variation in peak flows across:
Locations of distinct changes in velocity-depth product i.e., to determine flows across areas of high and low velocity-depth product; and
Locations immediately upstream and downstream of hydraulic controls such as levees and bridges.
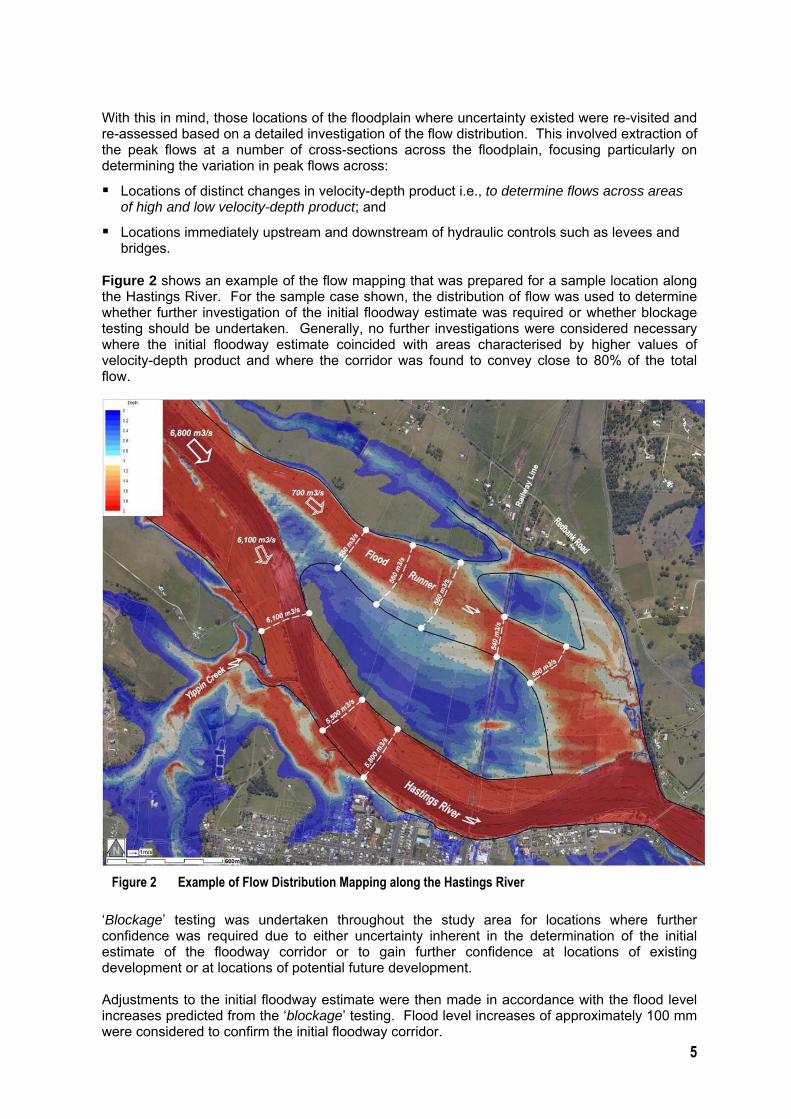
Figure 2 shows an example of the flow mapping that was prepared for a sample location along the Hastings River. For the sample case shown, the distribution of flow was used to determine whether further investigation of the initial floodway estimate was required or whether blockage testing should be undertaken. Generally, no further investigations were considered necessary where the initial floodway estimate coincided with areas characterised by higher values of velocity-depth product and where the corridor was found to convey close to 80% of the total flow.
‘Blockage’ testing was undertaken throughout the study area for locations where further confidence was required due to either uncertainty inherent in the determination of the initial estimate of the floodway corridor or to gain further confidence at locations of existing development or at locations of potential future development. Adjustments to the initial floodway estimate were then made in accordance with the flood level increases predicted from the ‘blockage’ testing. Flood level increases of approximately 100 mm were considered to confirm the initial floodway corridor.
Figure 2 Example of Flow Distribution Mapping along the Hastings River
6
2.4 Conclusion
Application of the iterative procedure suggested in 2010 by Thomas et al [9] to determine floodway corridors along the Hastings and Maria Rivers was found to result in the determination of a reliable floodway corridor for much of the study area. This conclusion was made through rigorous testing of the floodway corridor which involved simulations to test numerous partial blockage scenarios. The flood level increases determined as a result of each blockage scenario were generally less than the upper bound value of 100 mm and thereby supported the proposed floodway alignment and the procedure adopted to determine it. It is also important to note that identification of the extent of the floodplain required to convey 80% of the total flow served to refine the floodway extent and improve the confidence in the results of the analysis. It also allowed for a more reliable determination of floodway extent where floodwater depths and velocities are relatively uniform over considerable expanses of floodplain. Analysis of the flow distribution and determination of the floodplain extent required to convey 80% of the total flow is considered to be a reliable procedure for assisting practitioners in determining floodway extents in complex areas of the floodplain. Furthermore, this criterion was found to be practical for ‘testing’ purposes where previously determined floodway corridors could be checked in terms of their potential flow conveyance. 3. APPLICATION OF THE 80% FLOW CRITERIA – SUCCESSFUL TEST CASES
In order to test the 80% flow “parameter” and determine whether it is a reliable criterion for floodway definition, the extended iterative approach described above was applied to a small creek system and to a low gradient inland river system. Each of these cases is discussed in the following sections. 3.1 Small Coastal Creek System
As a means of further testing the extended iterative approach described above, it was applied to a test section of Browns Creek at South Nowra. Two methodologies were adopted for this investigation, each considering a different set of parameters to characterise the floodway extent. The two methodologies are:
Method 1 - Determination of a preliminary floodway corridor based on analysis of velocities and velocity-depth product as key parameters.
Method 2 - Determination of a preliminary floodway corridor based on mapping of the 80% flow corridor.
Method 1 – Preliminary Floodway Corridor Based on Velocities and Velocity-Depth Product
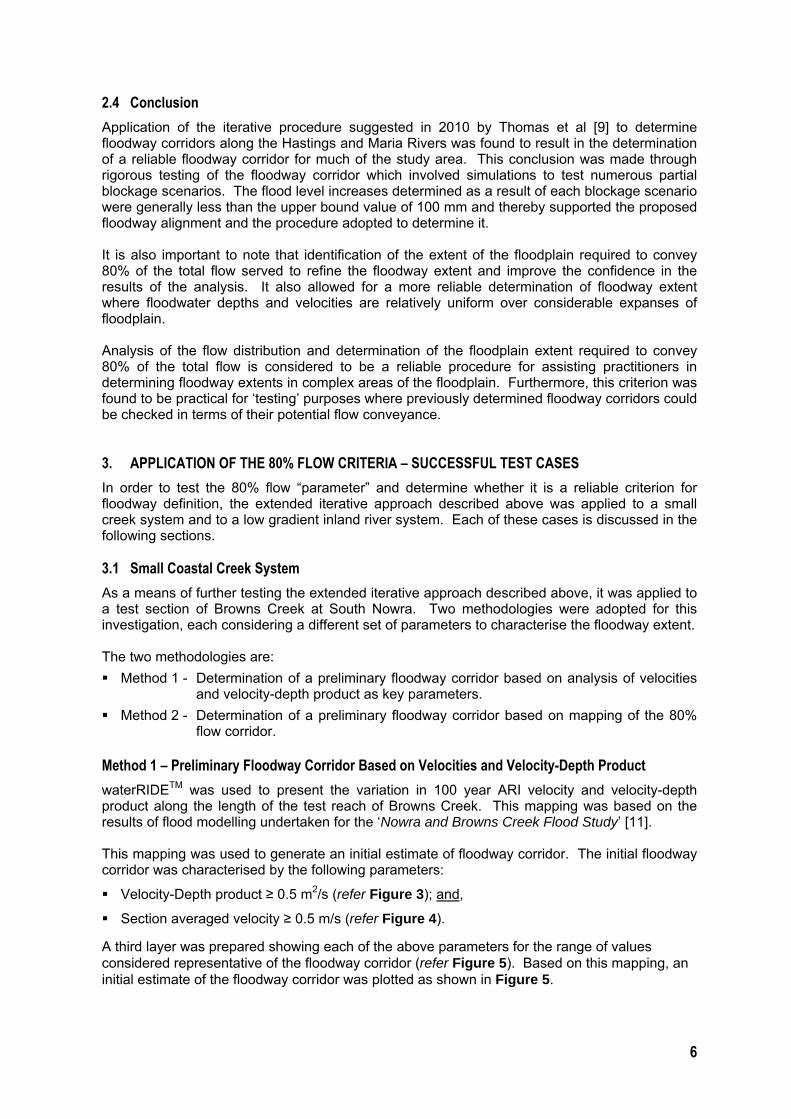
waterRIDETM was used to present the variation in 100 year ARI velocity and velocity-depth product along the length of the test reach of Browns Creek. This mapping was based on the results of flood modelling undertaken for the ‘Nowra and Browns Creek Flood Study’ [11]. This mapping was used to generate an initial estimate of floodway corridor. The initial floodway corridor was characterised by the following parameters:
Velocity-Depth product ≥ 0.5 m2/s (refer Figure 3); and,
Section averaged velocity ≥ 0.5 m/s (refer Figure 4).
A third layer was prepared showing each of the above parameters for the range of values considered representative of the floodway corridor (refer Figure 5). Based on this mapping, an initial estimate of the floodway corridor was plotted as shown in Figure 5.
7
Figure 4 Variation in Velocity Figure 3 Variation in Velocity-Depth Product
Figure 5 Initial estimate of floodway corridor based on the floodplain extent characterised by Velocities ≥ 0.5 m/s and VxD ≥ 0.5 m2/s
Extent of
100 year ARI flood
VxD ≥ 0.5 m2/s
Initial estimate of floodway corridor
based on application of Method 1
8
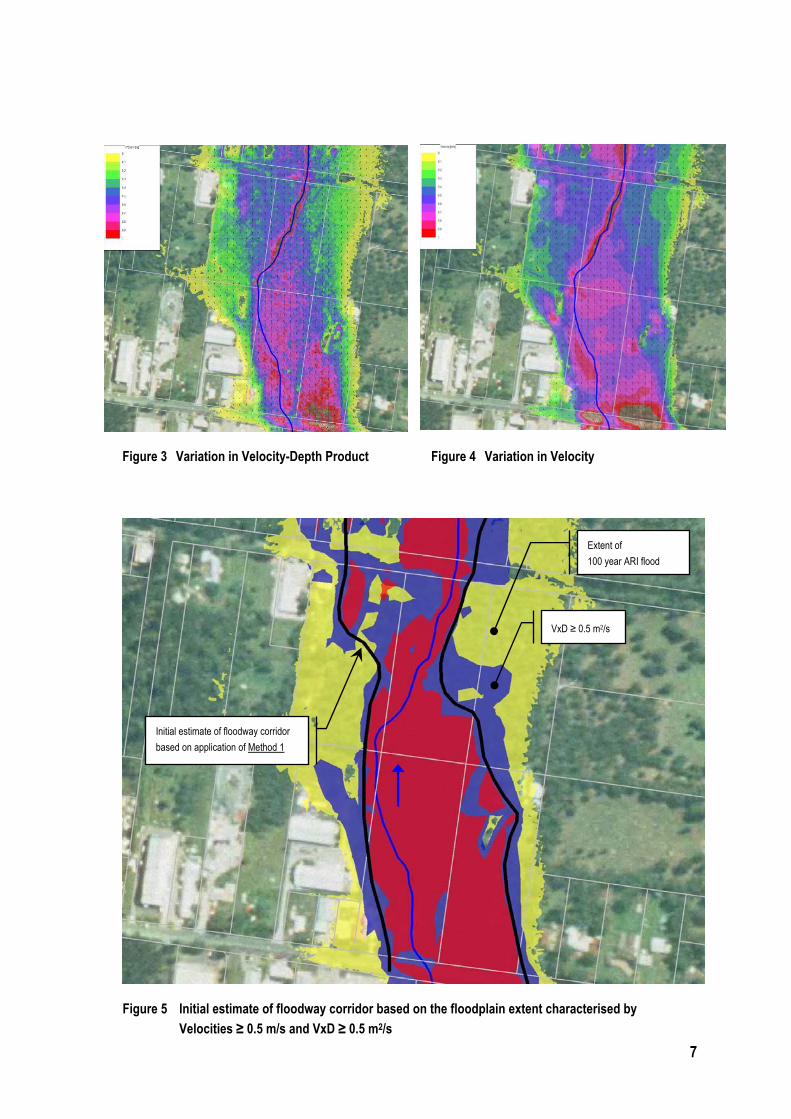
Figure 6 Initial Estimate of Floodway Corridor based application of Method 2
Method 2 – Preliminary Floodway Corridor Based on Mapping of the 80% Flow Corridor
The flow extraction tool available in waterRIDETM was used to extract flows from the 100 year ARI flood modelling results at each of a series of cross-sections positioned along the test reach of Browns Creek. As well as extracting the total flow along each cross-section, flows were also extracted along discrete sections of each cross-section. This allowed the distribution of floodwaters along each cross-section to be determined and in turn the determination of the floodplain extent predicted to convey 80% of the total flow. The alignments of the cross-sections selected along the test reach of Browns Creek are shown in Figure 6. The initial estimate of the floodway corridor based on application of Method 2 is also shown in Figure 6. The floodway corridor determined through application of Method 1 is superimposed for comparative purposes.
As shown in Figure 6, there is a substantial difference between the extents of floodway corridors towards the centre of the test reach. The wider floodway corridor predicted through application of Method 2 implies that consideration of velocities and velocity-depth alone does not provide a reliable indication of the flow conveyed or does not ensure a consistent percentage of the floodwaters are conveyed within the floodway corridor. This disparity would normally be detected during encroachment or blockage testing, which as discussed previously, can be time consuming and costly. Therefore, the application of the 80% of flow criterion can result in a less costly delineation of the floodway.
Initial estimate of floodway corridor
based on application of Method 1
Initial estimate of floodway corridor
based on application of Method 2
Extent of 100 year
ARI flood
9
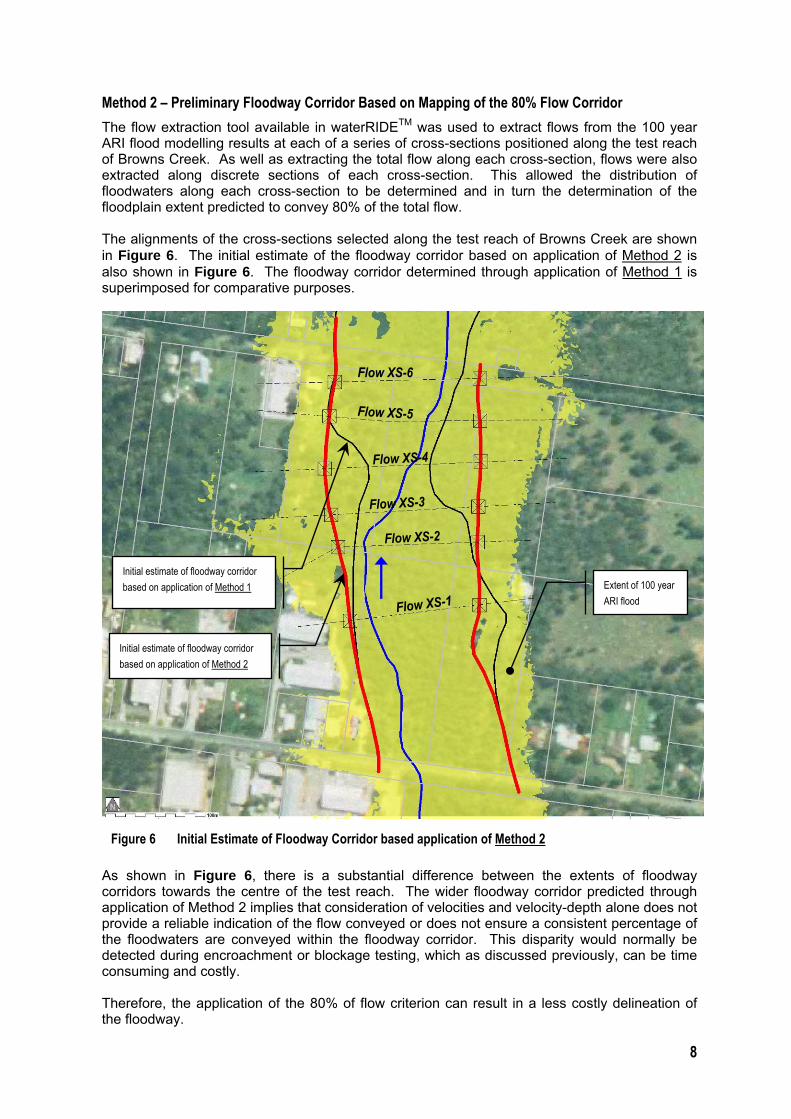
Figure 7 Results of Encroachment Testing undertaken for Floodway Corridor determined through application of Method 1
Encroachment Testing of Method 1 and Method 2 Floodway Corridors
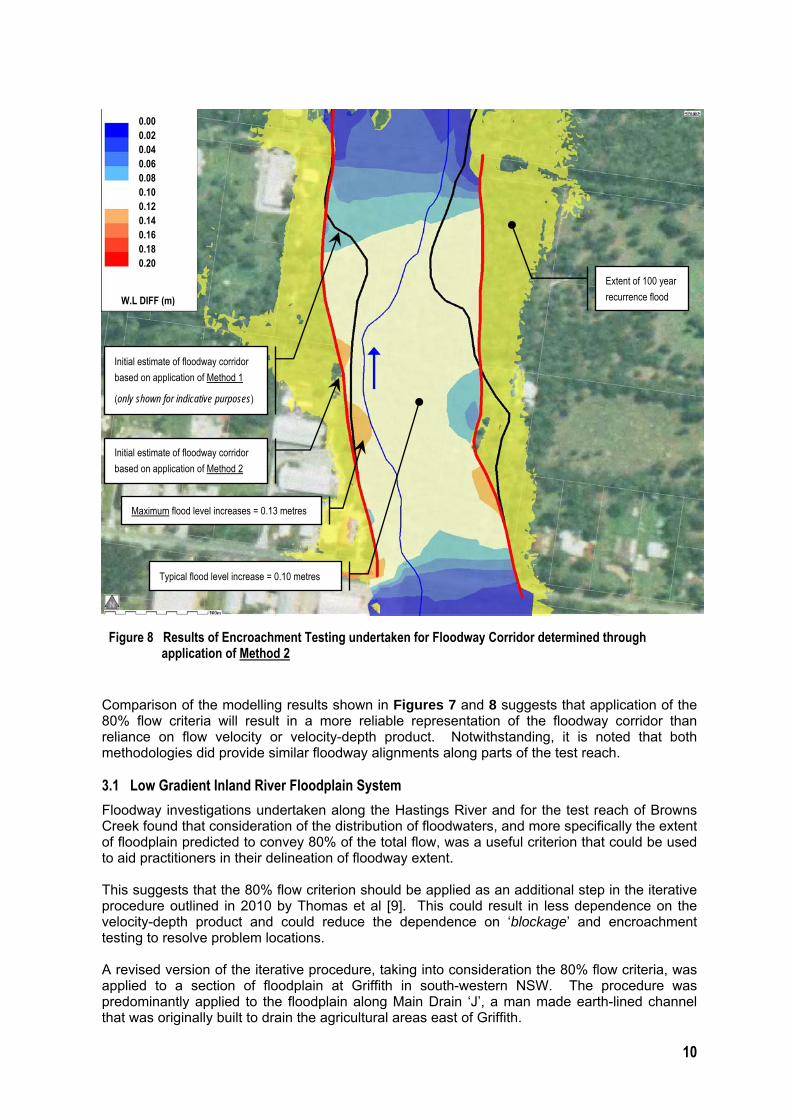
Encroachment testing was undertaken for both of the floodway corridors determined through application of Method 1 and Method 2. The encroachment testing was undertaken by raising the terrain elevations along areas outside of the extent of the floodway corridor to a height above the peak 100 year ARI flood level. Therefore, under the encroachment scenarios no flow would travel through areas of the floodplain outside of the floodway corridors. The predicted flood level increases for each of these encroachment scenarios are shown in Figure 7 and Figure 8, for Method 1 and Method 2, respectively.
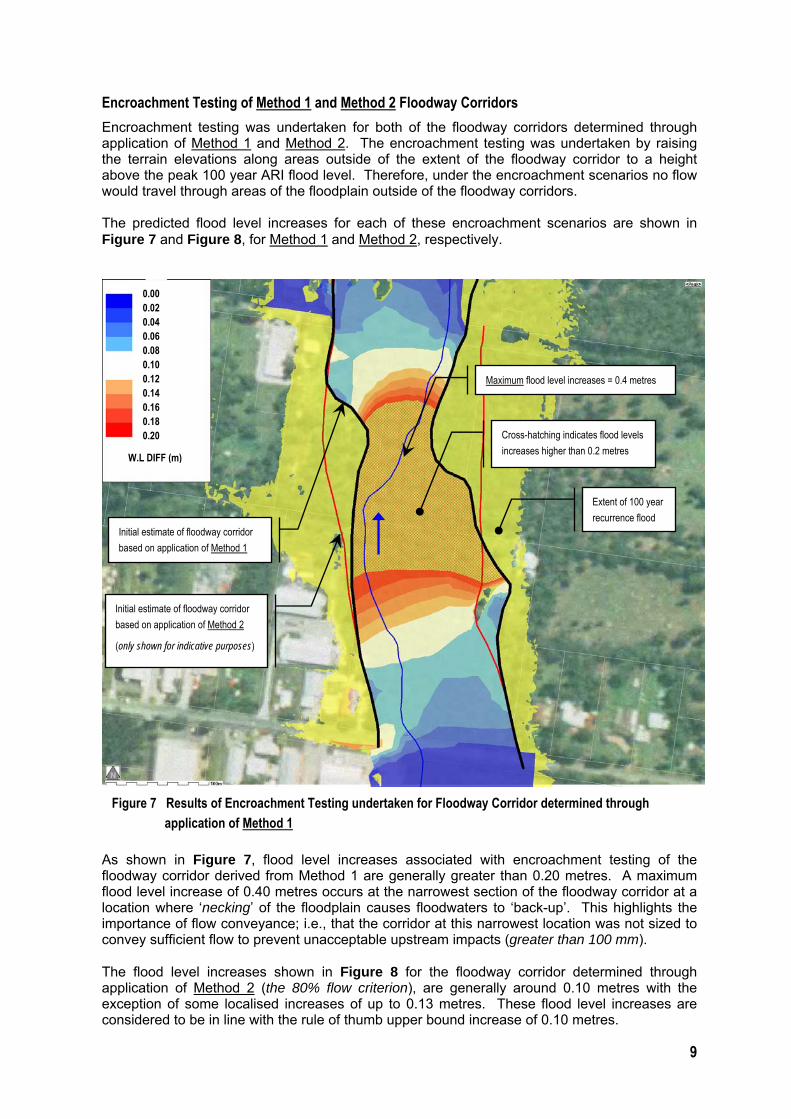
As shown in Figure 7, flood level increases associated with encroachment testing of the floodway corridor derived from Method 1 are generally greater than 0.20 metres. A maximum flood level increase of 0.40 metres occurs at the narrowest section of the floodway corridor at a location where ‘necking’ of the floodplain causes floodwaters to ‘back-up’. This highlights the importance of flow conveyance; i.e., that the corridor at this narrowest location was not sized to convey sufficient flow to prevent unacceptable upstream impacts (greater than 100 mm). The flood level increases shown in Figure 8 for the floodway corridor determined through application of Method 2 (the 80% flow criterion), are generally around 0.10 metres with the exception of some localised increases of up to 0.13 metres. These flood level increases are considered to be in line with the rule of thumb upper bound increase of 0.10 metres.
0.00 0.02 0.04 0.06 0.08 0.10 0.12 0.14 0.16 0.18 0.20
W.L DIFF (m)
Initial estimate of floodway corridor
based on application of Method 1
Initial estimate of floodway corridor
based on application of Method 2
(only shown for indicative purposes)
Maximum flood level increases = 0.4 metres
Cross-hatching indicates flood levels
increases higher than 0.2 metres
Extent of 100 year
recurrence flood
10
Figure 8 Results of Encroachment Testing undertaken for Floodway Corridor determined through application of Method 2
Comparison of the modelling results shown in Figures 7 and 8 suggests that application of the 80% flow criteria will result in a more reliable representation of the floodway corridor than reliance on flow velocity or velocity-depth product. Notwithstanding, it is noted that both methodologies did provide similar floodway alignments along parts of the test reach. 3.1 Low Gradient Inland River Floodplain System
Floodway investigations undertaken along the Hastings River and for the test reach of Browns Creek found that consideration of the distribution of floodwaters, and more specifically the extent of floodplain predicted to convey 80% of the total flow, was a useful criterion that could be used to aid practitioners in their delineation of floodway extent. This suggests that the 80% flow criterion should be applied as an additional step in the iterative procedure outlined in 2010 by Thomas et al [9]. This could result in less dependence on the velocity-depth product and could reduce the dependence on ‘blockage’ and encroachment testing to resolve problem locations. A revised version of the iterative procedure, taking into consideration the 80% flow criteria, was applied to a section of floodplain at Griffith in south-western NSW. The procedure was predominantly applied to the floodplain along Main Drain ‘J’, a man made earth-lined channel that was originally built to drain the agricultural areas east of Griffith.
0.00 0.02 0.04 0.06 0.08 0.10 0.12 0.14 0.16 0.18 0.20
W.L DIFF (m)
Initial estimate of floodway corridor
based on application of Method 1
(only shown for indicative purposes)
Initial estimate of floodway corridor
based on application of Method 2
Maximum flood level increases = 0.13 metres
Extent of 100 year
recurrence flood
Typical flood level increase = 0.10 metres
11
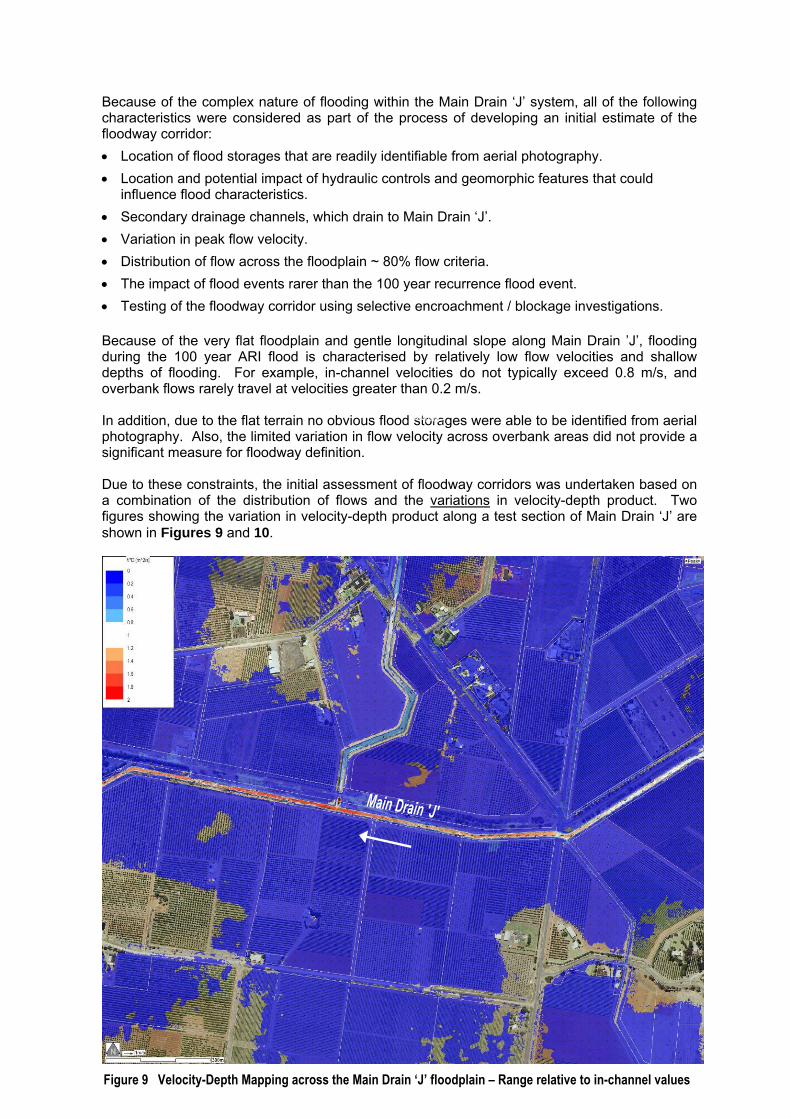
Figure 9 Velocity-Depth Mapping across the Main Drain ‘J’ floodplain – Range relative to in-channel values
Because of the complex nature of flooding within the Main Drain ‘J’ system, all of the following characteristics were considered as part of the process of developing an initial estimate of the floodway corridor:
Location of flood storages that are readily identifiable from aerial photography.
Location and potential impact of hydraulic controls and geomorphic features that could influence flood characteristics.
Secondary drainage channels, which drain to Main Drain ‘J’.
Variation in peak flow velocity.
Distribution of flow across the floodplain ~ 80% flow criteria.
The impact of flood events rarer than the 100 year recurrence flood event.
Testing of the floodway corridor using selective encroachment / blockage investigations. Because of the very flat floodplain and gentle longitudinal slope along Main Drain ’J’, flooding during the 100 year ARI flood is characterised by relatively low flow velocities and shallow depths of flooding. For example, in-channel velocities do not typically exceed 0.8 m/s, and overbank flows rarely travel at velocities greater than 0.2 m/s. In addition, due to the flat terrain no obvious flood storages were able to be identified from aerial photography. Also, the limited variation in flow velocity across overbank areas did not provide a significant measure for floodway definition. Due to these constraints, the initial assessment of floodway corridors was undertaken based on a combination of the distribution of flows and the variations in velocity-depth product. Two figures showing the variation in velocity-depth product along a test section of Main Drain ‘J’ are shown in Figures 9 and 10.
12
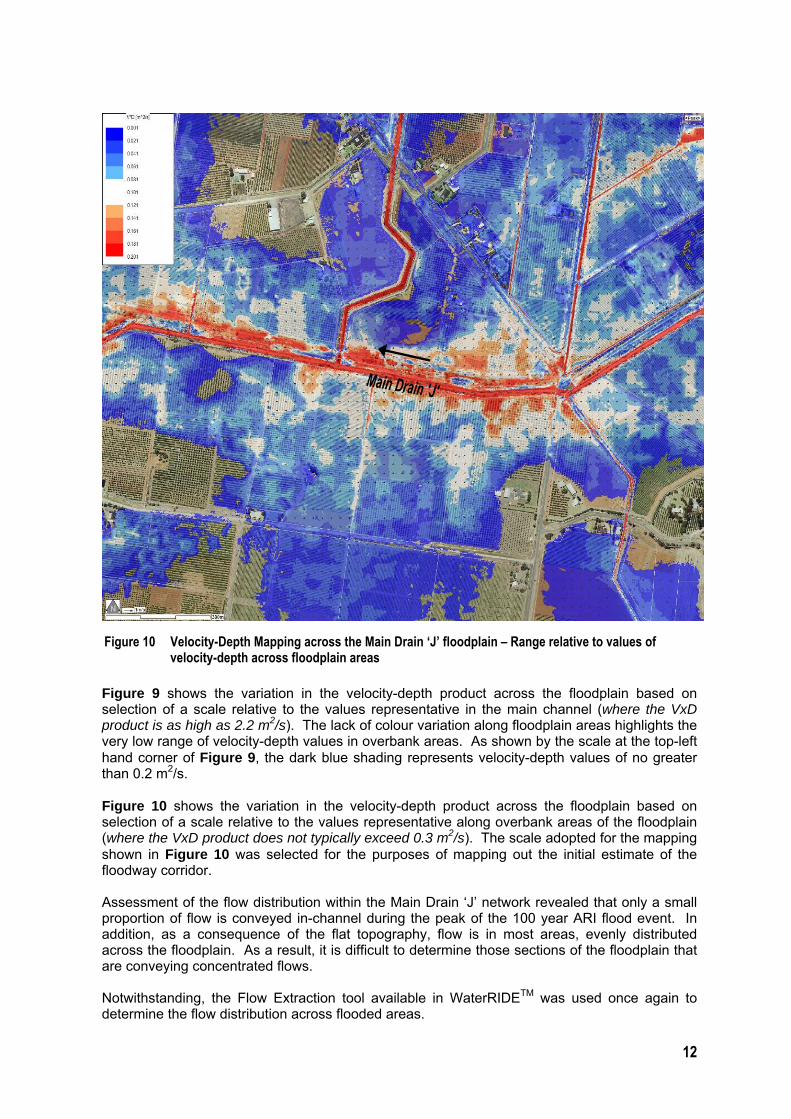
Figure 10 Velocity-Depth Mapping across the Main Drain ‘J’ floodplain – Range relative to values of velocity-depth across floodplain areas
Figure 9 shows the variation in the velocity-depth product across the floodplain based on selection of a scale relative to the values representative in the main channel (where the VxD product is as high as 2.2 m2/s). The lack of colour variation along floodplain areas highlights the very low range of velocity-depth values in overbank areas. As shown by the scale at the top-left hand corner of Figure 9, the dark blue shading represents velocity-depth values of no greater than 0.2 m2/s. Figure 10 shows the variation in the velocity-depth product across the floodplain based on selection of a scale relative to the values representative along overbank areas of the floodplain (where the VxD product does not typically exceed 0.3 m2/s). The scale adopted for the mapping shown in Figure 10 was selected for the purposes of mapping out the initial estimate of the floodway corridor. Assessment of the flow distribution within the Main Drain ‘J’ network revealed that only a small proportion of flow is conveyed in-channel during the peak of the 100 year ARI flood event. In addition, as a consequence of the flat topography, flow is in most areas, evenly distributed across the floodplain. As a result, it is difficult to determine those sections of the floodplain that are conveying concentrated flows. Notwithstanding, the Flow Extraction tool available in WaterRIDETM was used once again to determine the flow distribution across flooded areas.
13
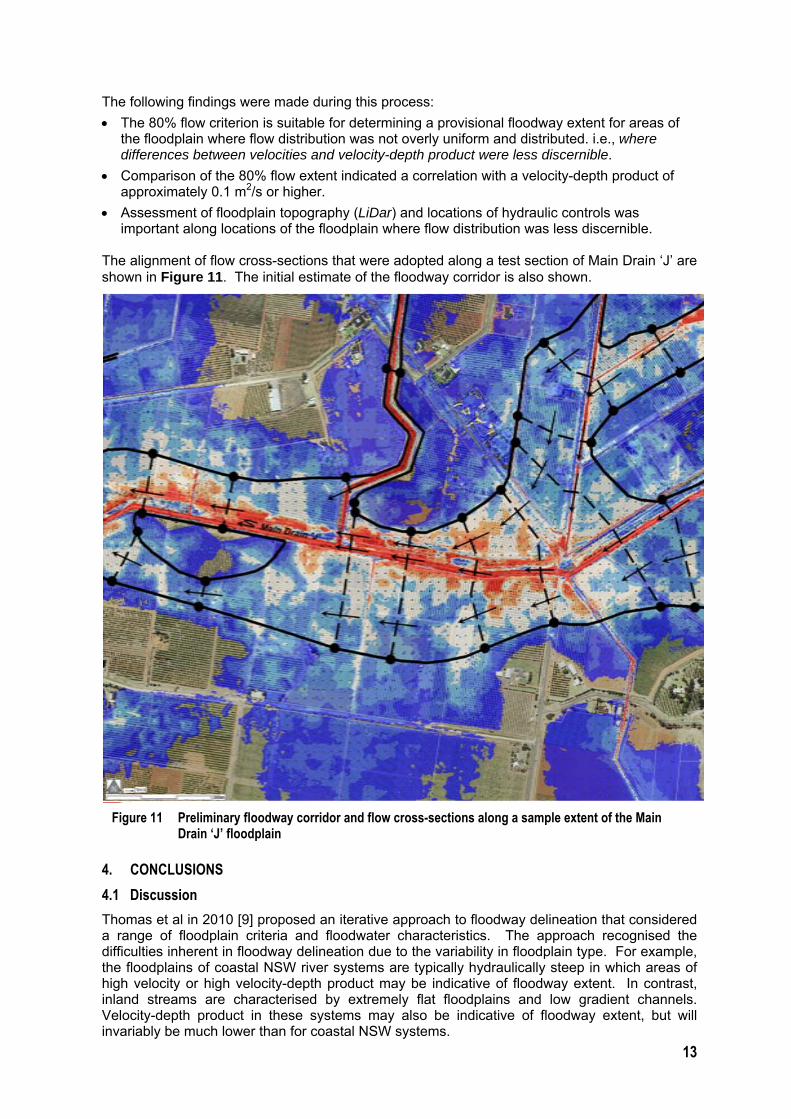
Figure 11 Preliminary floodway corridor and flow cross-sections along a sample extent of the Main Drain ‘J’ floodplain
The following findings were made during this process:
The 80% flow criterion is suitable for determining a provisional floodway extent for areas of the floodplain where flow distribution was not overly uniform and distributed. i.e., where differences between velocities and velocity-depth product were less discernible.
Comparison of the 80% flow extent indicated a correlation with a velocity-depth product of approximately 0.1 m2/s or higher.
Assessment of floodplain topography (LiDar) and locations of hydraulic controls was important along locations of the floodplain where flow distribution was less discernible.
The alignment of flow cross-sections that were adopted along a test section of Main Drain ‘J’ are shown in Figure 11. The initial estimate of the floodway corridor is also shown.
4. CONCLUSIONS
4.1 Discussion
Thomas et al in 2010 [9] proposed an iterative approach to floodway delineation that considered a range of floodplain criteria and floodwater characteristics. The approach recognised the difficulties inherent in floodway delineation due to the variability in floodplain type. For example, the floodplains of coastal NSW river systems are typically hydraulically steep in which areas of high velocity or high velocity-depth product may be indicative of floodway extent. In contrast, inland streams are characterised by extremely flat floodplains and low gradient channels. Velocity-depth product in these systems may also be indicative of floodway extent, but will invariably be much lower than for coastal NSW systems.
14
This issue can be overcome by validating initial estimates of floodway extent by modelling encroachment scenarios to test the impact of floodway blockage. The principle here is to partially block the floodway corridor and establish whether the associated blockage causes an unacceptable increase in upstream flood levels. The rule of thumb has been to assume that the maximum acceptable encroachment and therefore floodway extent, should be such that upstream flood level increases in the 100 year ARI event are no greater than 100 mm. This is relatively straightforward in streams where the floodwaters exhibit relatively one-dimensional characteristics, but is more problematic for major river systems or flat floodplains where off-channel storages exist. The floodplains of the larger coastal rivers typically have well defined estuarine backwater areas which serve as significant flood storages. Similar could be said of many of the rivers of western NSW, which are often characterised by effluents that connect the main channel to enormous off-channel storages. Hence, it is difficult to apply the encroachment approach referred to above in these much larger systems. In such systems, modellers are also presented with the dilemma of determining how to simulate blockage without effectively removing the flood storage and skewing the impact. These issues mean that encroachment scenarios modelling can be expensive and time consuming. Similarly, the application of a velocity-depth product approach has limitations in the larger floodplains where the velocity-depth product is dominated by depth. A rudimentary application of the velocity-depth approach where large storage areas exist could lead to these areas being identified as floodways when in fact they are not. This of course can be overcome by considering flow velocity in tandem with velocity-depth product, but this serves to introduce another parameter in the process which can complicate such an assessment. The outcomes of recent investigations (as documented in this paper) indicate that the iterative process previously proposed should be refined to include a step that involves the identification of the proportion of the floodplain that carries approximately 80% of the 100 year ARI flow. In some situations the identification of this “extent” and its combination with other floodplain characteristics and flood data will negate the need for encroachment scenario testing. 3.2 Preferred Approach
The analysis discussed in the preceding sections highlights the difficulties associated with selecting an appropriate methodology for determining floodway extent. It also highlights the importance of different floodplain types. The examples presented involve reaches of river and creek systems that range between large coastal systems (see Section 3.1) to relatively one-dimensional systems (see Section 3.2). An example was also presented for a man-made agricultural channel located at south-west NSW (see Section 3.3). While the assessment of floodways remains the domain of experienced practitioners with the skills to holistically evaluate the physical features of the floodplain and all available hydraulic / flood modelling outputs, there appears to be a more rigorous methodology that can be employed to ensure reliable outcomes for floodway delineation. This methodology involves an iterative approach that considers:
section averaged velocity in the planning level flood at both the peak and on the rising limb of the hydrograph
the variation in velocity-depth product for the planning level flood
topographic and geomorphic features along the floodplain
hydraulic controls such as structures that cause backwater effects
flow conveyance and the distribution of flow – specifically the extent of floodplain required to carry approximately 80% of the total flow
the results of hydraulic analysis and / or flood modelling that incorporates encroachment or blockage scenarios similar to that outlined above for Method 2.
15
5. TAKE HOME MESSAGE
Floodway definition is a complex and iterative process that requires specialist input from practitioners with skills in interpreting flood data and floodplain geomorphology, and in understanding the importance of hydraulic controls and conveyance. Flood modelling data can also assist in the delineation of floodways, but needs to be suitably processed for reliable interpretation. A range of outputs such as velocity-depth product can be used to establish an initial estimate of floodway extent, but these outputs require testing and subsequent interpretation in order to define a reliable floodway extent. This interpretation must rely on consideration of both hydraulic characteristics and physical features that influence the way floodwaters move through a floodplain. Tools such as waterRIDETM are ideal for processing this data and facilitating interpretation. Recent investigations for a range of floodplains show that the amount of encroachment scenario testing can be reduced in many cases by placing greater emphasis on understanding flow conveyance. The analysis shows that there is good correlation between the extent of the floodplain required to carry approximately 80% of the 100 year ARI flow and other floodway extent indicators. The 80% flow criterion should therefore be included in the iterative process required to determine floodway extent. 6. REFERENCES
[1] NSW Government (2005), ‘Floodplain Development Manual: the management of flood liable land’; ISBN 0 7347 5476 0.
[2] NSW Government (2007), ‘Floodplain Risk Management Guideline – Floodway Definition’; prepared by NSW Department of Environment & Climate Change (October 2007)
[3] NSW Government (1986), ‘Floodplain Development Manual’; PWD 86010
[4] Howells L, McLuckie D., Collings G., Lawson N. (2004), ‘Defining the Floodway – Can One Size Fit All?’; FMA NSW Annual Conference, Coffs Harbour, February 2004
[5] Rigby, T. (2007), ‘Floodplain Development Manual (NSW) A Document in Need of Review’; FMA NSW Annual Conference, Gunnedah, February 2007.
[6] Griffith City Council (2011), ‘Griffith Floodplain Risk Management Study; prepared by WorleyParsons.
[7] Port Macquarie-Hastings Council (2006), ‘Hastings River Flood Study’; prepared by Patterson Britton & Partners.
[8] Port Macquarie-Hastings Council (2011), ‘Hastings Floodplain Risk Management Study’; prepared by WorleyParsons.
[9] Thomas CR, Honour W, Golasweski, R (2010), “Procedures for Floodway Definition – Is there a Uniform Approach”. Proceedings of 50th Annual Floodplain Management Authorities Conference, Gosford, February 2010.
[10] SCARM (2000) ‘Floodplain Management in Australia – Best Practice Principles and Guidelines’; SCARM Report 73, CSIRO Publishing, Victoria.
[11] Shoalhaven City Council (2006), ‘Nowra and Browns Creeks Flood Study’; prepared by Patterson Britton & Partners.
[12] Penrith City Council (2012, in draft), ‘South Creek Flood Study’; prepared by WorleyParsons.
------------------------