Embed Size (px)
Citation preview

Thomas Idzorek, CFA Head of Investment Methodology and
Economic Research,
Investment Management group, Morningstar
#MICEU @MorningstarInc

©2015 Morningstar, Inc. All rights reserved.
Tom Idzorek, CFA Head of Investment Methodologies and Investment Research, Investment Management group, Morningstar
For professional use only.
Not for use with the public.
New Dimensions of Popularity

3 For financial professional use only. Not for public distribution.
.
Classic Efficient Market CAPM
More Risk Equals More Return
Dimensions of Popularity ROGER G. IBBOTSON AND THOMAS M. IDZOREK

4
Understanding Returns – the Role of Popularity Popularity
In the short run, the market is a voting machine but in the long run, it is a weighing machine. –Benjamin Graham
“The Essays of Warren Buffett” (2003).

5
Which Investment would you prefer to purchase? Investment A – Speculative
Investment B – Safe

6
Which company/stock would you prefer to purchase? Company A – Fast Growth (Revenue, Earnings, etc.) Company B – Slow Growth (Revenue, Earnings, etc.)

7
Which company/stock would you prefer to purchase? Company A – Powerful Brand Company B – Weak Brand

8
Which company/stock would you prefer to purchase? Company A – Outstanding Reputation Company B – Bad Reputation

9
Which company/stock would you prefer to purchase? Company A – High Investment Capacity Company B – Low Investment Capacity

No answers yet.
What does efficient market theory
tell us (about the answers)…

Efficient Market Theory
Investors are…
gPerfect Decision Makers (Optimizers)
gFree of Biases (or Feelings)
Sheldon Cooper
“Big Bang Theory”

MVO Optimizer
Inputs
Ex
pected R
eturn
MVO Efficient Frontier
Individual Assets
Standard Deviation
Classic Modern Portfolio Theory
Mean-Variance Optimization
►Capital Market Assumption
►Expected Returns
►Standard Deviations (Risks)
►Correlations

Ex
pected R
etu
rn
Emerging Markets
International Developed
Bonds
TIPS
Cash
Standard Deviation
Private Equity
Commodities
Small Cap
Large Cap
This is a graphical representation; plot points are not necessarily meaningful.
Classic Modern Portfolio Theory
More Risk Equals More Return
For Illustration Only

Ex
pected R
etu
rn
Beta
This is a graphical representation; plot points are not necessarily meaningful.
Classic Efficient Market CAPM
More Risk Equals More Return
For Illustration Only
E[Ri]=𝑟𝑓+βi,mkt(MarketPremium)

…and what does history tell us about
the return of major asset classes…

17
Stocks, Bonds, Bills, and Inflation 1926–2015 Ibbotson® SBBI®
0.10
1
10
100
1K
$100k
1926 1936 1946 1956 1966 1976 1986 1996 2006
Source: Morningstar
$26,641
$4,677
$21
$13
$109
Returns shown are hypothetical; indices are unmanaged and not available for direct investment. Assumes
reinvestment of all capital gains and dividends and does not account for transactions costs or taxes. Past
performance is not indicative of future results.
Small stocks
Large stocks
Government bonds
Treasury bills
Inflation
12.0
10.0
5.6
3.4
2.9
Compound annual return %
10K

Com
pou
nd A
nn
ual R
etu
rn
Standard Deviation
US – Major Asset Classes
Risk (Standard Deviation) and Return – 1926 to 2015
For Illustration Only
5%
10%
10% 20% 30% 5% 15% 25%
R-square=98%
T-Bills
Long-Term Gov. Bonds
Large Cap Stocks
Small Cap Stocks
Source: Author calculations using data from Morningstar Direct

Com
pou
nd A
nn
ual R
etu
rn
Beta
US – Major Asset Classes
Risk (Beta) and Return – 1926 to 2015
For Illustration Only
5%
10%
1.0 2.0 2.5 0.5 1.5
R-square=99%
T-Bills
Long-Term Gov. Bonds
Large Cap Stocks
Small Cap Stocks
Source: Author calculations using data from Morningstar Direct

Com
pou
nd A
nn
ual R
etu
rn
Standard Deviation
United Kingdom – Major Asset Classes
Risk (Standard Deviation) and Return – 1900 to 2015
For Illustration Only
5%
10%
10% 20% 30% 5% 15% 25%
R-square=92%
Bills Bonds
UK Stocks
Source: Author calculations using Dimson, Marsh, Stanton data from Morningstar Direct

Com
pou
nd A
nn
ual R
etu
rn
Standard Deviation
Netherlands – Major Asset Classes
Risk (Standard Deviation) and Return – 1900 to 2015
For Illustration Only
5%
10%
10% 20% 30% 5% 15% 25%
R-square=99%
Bills
Bonds
Netherlands Stocks
Source: Author calculations using Dimson, Marsh, Stanton data from Morningstar Direct

Com
pou
nd A
nn
ual R
etu
rn
Standard Deviation
18 Countries (Bills, Bonds, and Stocks) from
Dimson, Marsh, and Stanton
Risk (Standard Deviation) and Return – 1900 to 2015
For Illustration Only
5%
10%
10% 20% 30% 5% 15% 25%
R-square=85%
Source: Author calculations using Dimson, Marsh, Stanton data from Morningstar Direct

The risk and return paradigm is working
pretty well for asset classes.
Now let’s look at different
characteristics within equities…

Com
pou
nd A
nn
ual R
etu
rn
Standard Deviation
US – Fama-French Size and Value Indexes
Risk (Standard Deviation) and Return – 1926 to 2013
For Illustration Only
5%
10%
10% 20% 30% 5% 15% 25%
R-square=27%
FF Large Growth FF Small Growth
FF Large Value
FF Small Value
Source: Author calculations using data from Ken French’s web site.
Com
pou
nd A
nn
ual R
etu
rn
Standard Deviation
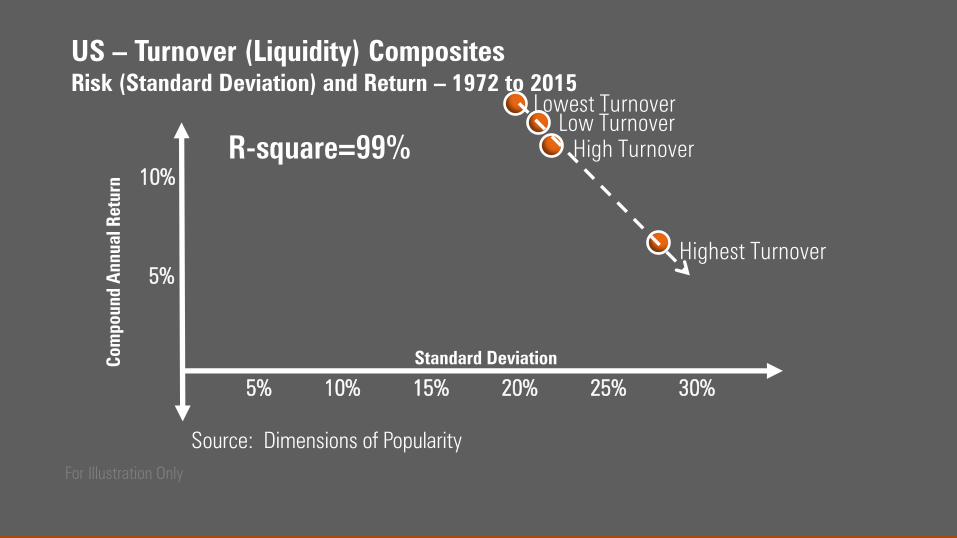
US – Turnover (Liquidity) Composites
Risk (Standard Deviation) and Return – 1972 to 2015
For Illustration Only
5%
10%
10% 20% 30% 5% 15% 25%
R-square=99%
Lowest Turnover
Highest Turnover
Low Turnover
High Turnover
Source: Dimensions of Popularity

26
Traditional Risk-Return Relationship is Broken Beta, volatility, size, value, liquidity, and momentum quartiles Ibbotson and Kim [2015]
For illustrative purposes only.

…a new theory is needed.
Introducing the Theory of Popularity…
28
The Theory of Popularity Popularity
Assets represent bundles of recognized and unrecognized characteristics that investors like and dislike. These characteristics form the different dimensions of popularity. Those that invest in the popular characteristic provide a premium to investors willing to hold the undesirable or unpopular. – Thomas Idzorek, Roger Ibbotson, and James Xiong
“Popularity.” Working Paper

29
The Precursor to the Theory of Popularity Popularity

30
Popularity is a Naturally Occurring Phenomenon Popularity
We believe that most of the best-known market premiums and anomalies can be explained by an intuitive and naturally occurring (social or behavioral) phenomenon observed in countless settings: popularity. – Roger Ibbotson and Thomas Idzorek
“The Dimension of Popularity,” Journal of Portfolio Management, 40th Anniversary Edition

31
Example: High School Students Popularity

32
Example: High School Students Popularity
Popularity can decrease… …or increase…

33
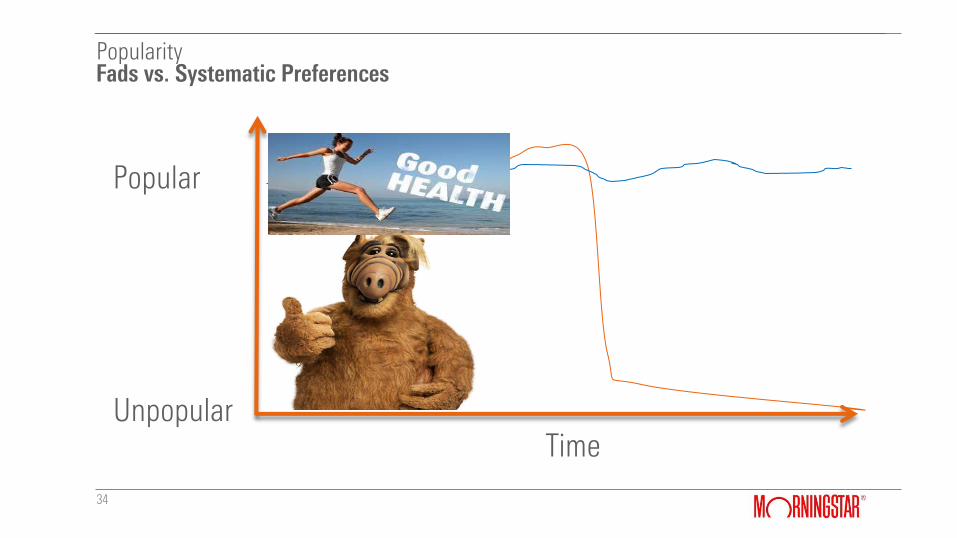
Fads vs. Systematic Preferences Popularity
Some aspects of popularity are systematic, or more or less permanent (for example, modern society seems to prefer thin to fat or tall to short). Other aspects of popularity may be transitory or exist only as fads (for example, mullets, or Mohawk hairstyles).
– Roger Ibbotson and Thomas Idzorek
“The Dimension of Popularity,” Journal of Portfolio Management, 40th Anniversary Edition
34
Fads vs. Systematic Preferences Popularity
Popular
Unpopular Time

35
Natural Re-ordering of Relative Popularity Popularity
…within any given category there is a natural ordering in which some constituents are more popular and others are less popular.
– Roger Ibbotson and Thomas Idzorek
“The Dimension of Popularity,” Journal of Portfolio Management, 40th Anniversary Edition

36
Re-Ordering of Relative Popularity Popularity

37
Theory and Returns Popularity
Traditional Efficient Market View… More Risk = More Return Popularity View… Unpopular characteristics = More Return

Well-Know Premiums and Anomalies
38
Popularity
gEquity Premium (Williams [1938], Ibbotson and Sinquefield [1976])
gLow Volatility / Low Beta (Haugen and Haines [1972])
gValue premium (Graham and Dodd [1934], Basu [1977])
gSize premium (Banz [1981])
gMomentum (Jegedesh, Narasimham, and Titman [1993], Carhart [1997]
gFixed Income Liquidity (Amihud and Mendelson [1991]
gStock Liquidity (Amihud and Mendelson [1986], Ibbotson et al. [2013])
gLiquidity in Funds (Idzorek, Xiong, and Ibbotson [2012])

Popularity Based Explanations for well-known Premiums
39
Popularity
g Equity Premium – Stocks are riskier than safe assets. The outsized equity premium puzzle could be explained by the
democratization of equity investing (creation of mutual funds & ETFs, lower trading costs, online trading, etc.) causing
more and more investors to diversify away from safe assets.
g Low Volatility / Low Beta – Within equities related to the theory of leverage aversion and / or active managers hoping
to outperform market cap benchmarks makes high volatility / high beta stocks too popular relative low vol / low beta
stocks. Migration within dimension creates premium.
gValue premium – Value stocks are often out of favor (unpopular), less well known, and / or operating in less
glamorous, slower growth industries. Migration within dimension creates premium.
g Size premium – By definition small capitalization stocks are less popular and have lower “capacity” than large
capitalization stocks. Migration within dimension creates premium.
gMomentum – Rapid, short-term increases and decreases along one or more dimensions of popularity.
g Fixed Income Liquidity – Investors prefer higher liquidity creating visible discount and thus return premium.
g Stock Liquidity – Investor prefer higher liquidity. Migration within dimension creates premium.

A Better Theory
40
Popularity
Premium Consistent With Traditional Risk-Return Trade-off
Consistent With Theory of Popularity
Equity Premium
Low Vol / Low Beta
Value Premium
Size Premium
Momentum
Fixed Income Liquidity
Equity Liquidity (Turnover)
Equity Liquidity (Amihud)
‘Sin’ Stocks
?

41
New Evidence Supporting the Theory of Popularity

New Evidence Supporting the Theory of Popularity
42
Popularity: Alternative Dimensions of Popularity
gBrand Power
/Theory: High Reputation = High Popularity
gCompetitive Sustainable Advantage
/Theory: Competitive Sustainable Advantage = High Popularity
gFirm Reputation
/Theory: Larger Population = High Popularity

43
Alternative Dimensions of Popularity Brand Power/Value: Interbrand’s Annual Best Global Brands Report Jan. 2001 – April 2015
For illustrative purposes only. Source: Idzorek, Thomas, James Xiong, and Roger Ibbotson. “Popularity.” Working Paper.
Q1 - Lowest Brand Value
Q4-Highest Brand Value
Geo. Mean 12.39% 7.30%
Std. Dev. 17.97% 18.14%
Sharpe 0.52 0.24
Historically, buying the unpopular dimension outperformed.
$5.44 Q1
$2.78 Q4
$1.00
2001 2004 2007 2010 2013 2016

44
Morningstar Economic Moat

45
Alternative Dimensions of Popularity Sustainable Competitive Advantage: Morningstar MOAT® June 2004 – July 2015
For illustrative purposes only. Source: Idzorek, Thomas, James Xiong, and Roger Ibbotson. “Alternative Dimensions of Popularity.” Working Paper. August 2015.
Q1-Lowest Moat Q4-Highest Moat
Geo. Mean 16.1% 11.6%
Std. Dev. 24.6% 15.9%
Sharpe 0.53 0.54
$7.01 Q1
$4.19 Q4
$1.00
2004 2006 2008 2010 2012 2014
Historically, buying the unpopular dimension outperformed.

46
Company Reputation: Harris Poll Reputation Quotient®
March 2001 – July 2015
Alternative Dimensions of Popularity
For illustrative purposes only. Source: Idzorek, Thomas, James Xiong, and Roger Ibbotson. “Popularity.” Working Paper.
Q1-Lowest Reputation
Q4-Highest Reputation
Geo. Mean 14.5% 7.5%
Std. Dev. 21.2% 16.4%
Sharpe 0.54 0.27
2001 2004 2007 2010 2013 2016
$8.01 Q1
$3.03 Q4
$1.00 Historically, buying the unpopular dimension outperformed.

A Better Theory—New Evidence
47
Popularity
Premium Consistent With Traditional Risk-Return Trade-off
Consistent With Theory of Popularity
Brand Power
Competitive Advantage
Company Reputation

48
Great Companies may not be Great Investments Popularity at Work
1. We tend to over pay for great companies (characteristics) and are penalized with lower relative returns.
2. We tend underpay for bad companies (characteristics) and
are rewarded with high relative return

49
Efficient Market Theory, Behavior Theory, or a Unifying Theory?

Classical Finance vs. Behavioral Finance
50
Popularity
Classical Finance Behavioral Finance
Rational Irrational
Efficient Capital Markets (Fair Pricing) Mispricing
Premiums Anomalies

51
A Unifying Theory Popularity
The natural movement along a popularity dimension is the fundamental factor driving many of the most common market premiums and anomalies. This movement along the different dimension of popularity serves as a unifying explanation that elegantly links size, valuation, liquidity, low volatility, and momentum.

Is Theory of Popularity an Efficient Markets or Behavioral Finance Theory?
52
Popularity
gAs an Efficient Markets Theory…
/Investors not only care about risk/volatility as in the classical efficient markets theory
/Also care about liquidity, taxes, information costs, management, distress, etc.
/In equilibrium, investor who are averse to stocks with undesirable characteristics provide premiums to those who are willing to hold those unpopular stocks .

Is Theory of Popularity an Efficient Markets or Behavioral Finance Theory?
53
Popularity
gAs a Behavioral Theory…
/Investors who are overly confident may go after the most popular stocks and end up driving the price too high.
/This provides premiums for investors who hold unpopular stocks.
gIn both theories…
/Those who hold popular stocks are willing losers.
/The winners hold the unpopular stocks.

54
Conclusions Popularity
1. “Good” companies aren't as good as we think and “Bad” companies aren’t as bad as we think – price matters!
2. Unpopular characteristics = More Return
3. Theory of Popularity seems to explain all of the premiums & anomalies

55
Disclosure
©2016 Morningstar Investment Management LLC. All rights reserved. For information and/or illustrative purposes only. Not for public distribution. Morningstar Investment Management LLC is a registered investment adviser and subsidiary of Morningstar, Inc. The information contained in this presentation is the proprietary material of Morningstar Investment Management LLC. Reproduction, transcription or other use by any means, in whole or in part, without the prior written consent of Morningstar Investment Management LLC, is prohibited. The Morningstar name and logo are registered trademarks of Morningstar, Inc. Opinions expressed are as of the current date; such opinions are subject to change without notice. Morningstar Investment Management shall not be responsible for any trading decisions, damages, or other losses resulting from, or related to, the information, data, analyses or opinions or their use. This commentary is for informational purposes only. The information, data, analyses, and opinions presented herein do not constitute investment advice, are provided solely for informational purposes and therefore are not an offer to buy or sell a security. This commentary contains certain forward-looking statements. We use words such as “expects”, “anticipates”, “believes”, “estimates”, “forecasts”, and similar expressions to identify forward-looking statements. Such forward-looking statements involve known and unknown risks, uncertainties and other factors which may cause the actual results to differ materially and/or substantially from any future results, performance or achievements expressed or implied by those projected in the forward-looking statements for any reason. Past performance does not guarantee future results.


References – Page 1
57
Popularity
g Asness, C.S., A. Frazzini, and L.H. Pedersen. “Leverage Aversion and Risk Parity.” Financial Analysts Journal, Vol. 58, No. 1 (2012), pp. 47-59.
g Amihud, Yakov. 2002. “Illiquidity and Stock Returns: Cross-Section and Time-Series Effects,” Journal of Financial Markets, vol. 5, no.1 (January): 31-56.
g Baker, Nardin L. and Robert A. Haugen. 2012. “Low Risk Stocks Outperform within all Observable Markets of the World,” www.lowvolatilitystocks.com, April.
g Baker, M., B. Bradley, and J. Wurgler. 2011. “Benchmarks as Limits to Arbitrage: Understanding the Low-Volatility Anomaly.” Financial Analysts Journal, 67, pp. 40-54.
g Basu, Sanjoy. 1977. “Investment Performance of Common Stocks in Relation to their Price-Earnings Ratios: A Test of the Efficient Market Hypothesis” Journal of Finance (September).
g Bawa, V., and E. Lindenberg. 1977. “Capital Market Equilibrium in a Mean-Lower Partial Moment Framework.” Journal of Financial Economics, 5, pp. 189-200.
g Carhart, M. M. (1997). “On Persistence in Mutual Fund Performance.” Journal of Finance 52: 57–82.
g Fama, Eugene F. 1970. “Efficient Capital Markets: A Review of Theory and Empirical Work." Journal of Finance, May, 25:383-417.
g Fama, Eugene F. and Kenneth R French. 1992. “The Cross-Section of Expected Stock Returns,” Journal of Finance 47 (June): 427–465.
g Fama, Eugene F. and Kenneth French. 1996. “Multifactor Explanations of Asset Pricing Anomalies.” Journal of Finance 51: 55–84.
g Fama, Eugene F. and Kenneth R French. “Migration.” Financial Analysts Journal, Vol. 37, No. 3 (2007), pp. 48-57.
g Harris Poll 2015. “The Harris Poll RQ® 2015 Summary Report.” http://www.harrisinteractive.com/vault/2015%20RQ%20Media%20Release%20Report_020415.pdf Dated February 2015 and downloaded on June 4, 2015.
g Haugen, Robert A. and A. James Heins. 1972 “On the Evidence Supporting the Existence of Risk Premiums in the Capital Market.”Unpublished Working Paper
g
References – Page 2
58
Popularity
g Haugen, Robert A. and A. James Heins. “Risk and the Rate of Return on Financial Assets: Some Old Wine in New Bottles.” Journal of Financial and Quantitative Analysis. 1975
g Haugen, Robert and Nardin Baker (1991), “The Efficient Market Inefficiency of Capitalization-Weighted Stock Portfolios”, Journal of Portfolio Management, vol. 17, No.1, pp. 35–40
g Ibbotson, Roger G., and Thomas M. Idzorek. “Dimensions of Popularity.” Journal of Portfolio Management, Special 40th Anniversary Edition, 2014, pp. 68-74.
g Ibbotson, Roger G., Larry B. Siegel., and J.J. Diermeier. “The Demand for Capital Market Returns: A New Equilibrium Theory.” Financial Analysts Journal, January/February 1984.
g Idzorek, Thomas M. “Popularity Drives Returns.” Morningstar Magazine, 2015, pp. XX – XX.
g Idzorek, Thomas M., James X. Xiong, and Roger G. Ibbotson. “The Liquidity Style of Mutual Funds.” Financial Analysts Journal, November/December 2012, pp. 38-53.
g Kraus, A., and R. Litzenberger.1976. “Skewness Preference and the Valuation of Risk Assets.” Journal of Finance, 31, pp. 1085-1100.
g Lakonishok, Josef, Andrea Shleifer, and Robert W. Vishny. 1994. “Contrarian Investment, Extrapolation, and Risk.” Journal of Finance, December 1994.

Join the conversation: #MICEU