Embed Size (px)
Citation preview
ED 229 614
AUTHORTITLE
INSTITUTION
REPORT NOPUB DATENOTEPUB TYPE
EDRS PitICEDESCRIPTORS
DOCUMENT RESUME
CE-035 974
Thomas, GeorgeFeasibility of Modelling the/Supply of Older AgeAccessions..Navy Personnel Research and Development Center, SanDiego, Calif.NPRDC-72-83-3.7May 8333p.Reports - Evaluative/Feasibility (142)
MF01/PCO2 Plus Postage. ,
.Adult Educationl Feasibility Studies; Human;Resources; *Labor Supply; *Military Personnel;*Military Service; *Models;. *Recruitmpnt; YoungAdults'
ABSTRACTThe feasibility of modelling the supply of 22- to
29-year-old enlistees was assessed. Key issues concerned theavailability of data and the development of an appropriatemethodology for making enlistment supply projections for 22-.to29.7.year-olds. The current status.of Supply modelling was reviewed,
'with particular attention being gitren to-the decision cOntext of theenlistment choice. It was found that ample data are available formodelling the supply of 20- to 29-year-old enlistees. Military,civilian, and civilian/military 4ata sets were identified that wouldbe useful for better understanding the enlistment decision. It wait
determined that it is feasible to model the supply of older-agedenlistees, and procpdures for undertaking such supply modelling weresuggested; (YLB.)
4
***,k*******************************************************************Reproductions supplied by EDRS are the best that can be madg *
from the oeiginal document.5
*
****-1-**44**4******/***************************************4************
I
r
;, .r
NPRDC TR 83-17 i. May 1983,
4-:i., .,
r-4 .:.0 ,
-i,,Cr /. -,CN1
FEASIBILITY OF MODELLING THE SUPPLY OF OLDER AGE ACCESSIONSCV ...
4.1 .,,
George ThomasNaval Postgraduate SchoolMonterey, California 93940
4 Reviewed byJu Jes I. Borack
.4*
Released byJames F. Kelly, Jr. .
ill / Commanding Officer
4.,U.S. DEPARTMENT OF EDUCATION
NATIONAL INSTITUTE OF EDUCATION ...
E UCATIONAL RESOURCES INFORMATION
1CENTER (ERIC)
. This document has been reproduced asreceived from the person or organization
,
S originating rtMinor changes have been made to improve
.,
0% \reproduction quality,
rt Points of view or opinions stated in this docu-
kr)
ment do not necessarily represent offiCtil NIE
pcosition or policy
Navy Personnel Research and DevelopInt CenterSan Diegot California 92152
MP'
4
L:,
UNCLASSIFIED
REPORT DOCUMENTATION.PAGE=AD IXITRUCTIONS
WO= COMPLSTING FORM1. REPORT NUMS2R
NPRDC TR 83-172. GOVT ACCESSION NO...1 RICIP112211.11 CATALOG MINIMA
..
4. TITLE (end Weis)FEASIBILITY OF MODELLING T.HE SUPPLYOF OLDER AGE ACCESSIONS
S. TYPE OP RIPORT & PERIOD COVICREDFinal ReportJul 1982-Sep 1982
S. PERRIM11/10 O. IMPORT NUMBER15-83-2
7. AG THOR(o).
George Thomas
L aGOITRACT OR G-RANT NUMILRFI)
/.
.
10. Mrt&10g14194JMNPUTIVir' "4".
MIPR 172-4j
PERFORMING ORGANIZATION NAME AND ADDRESS
Naval P2stgraduate SchoolMonterlY, California 93940 .
I I. CONTROLLING OFFICE NAME AND ADDRESS
Navy Personnel Research end Development CenterSan Diego, California %2152.
12. REPORT DAYSMay 1983 ..
is. HUMBER OP PAGCS
33 %
14. MONITORING AGENCY NAME & ADORESS(lIdliterent frost Centro/1W Wiles)J'
,
.
V1 '0,
-
IL IFURITY CLASS. (41 Ms ARNIM
.UNCLASSIFIEDIlld. warpCATIONIDOWNISRANNS
It OISTRISUTION STATEMENT (el this Report) . .
..
1
Approved for public release; distribution unlimited..
.
. ,
,
.
17. QISTRIBUTION STATEMENT (el the alietroet mitered in Loa 20, il tilifsseat boo Ropert) .-
, .
IS. SUPPLEMENTARY NOTES%.
.
111. KEY WORDS (CaNinuo on ht. if my ss4 Wenn& ST bleak nosier) .
4
./Econometric modelling .
Manpower supPly ,
Accession ,.. ,
20. ASSTRACT (Continuo oe revers side U esceeses, and Identify lir ok ausaist)
1This report presents th°,e results of an analysis to determine the feasibility ofconducting accession supply modelling for elder-age individuals. Current recruiting anddemographic trends indicate a needs for such modelling. The Methodology of supplymodels is discussed and the availability of data is assessed. The report concludes that it isfeasible to model the siipply of older-age enlistees and discussps procedures forundertaking such supply modelling. .
. .. ..
DO I F.1=47.2 W3 cornett pr Nov Ss 111 011101.11 a
Sh4 0102-1A 014,44013. siteunitecumarimmap pr TN,* ASS, Man Dant lwienosp
UNCLASSIFIED
4

ogg'
'FOREWORD '
The work described in this report was conducted within program area 9900N, OMNunder military interdepartmental purchase request 82-41 (The Feasibility of Modelling theSuppty of 23-24 year olds) and was funded by the Office of the Secretary Of Defense(Manpower, Reserve Affairs, and Logistics). This effort relates to the Office ofAccession Policy. .
This report assesses the feasibility of modelling enlistmenis of individuals 22 to .29years old and describes data sources that,may be used for such an effort. .The contractingoffice's technical representative was Dr. Jules 1. Bórack.
Appreciation is. extended to Dr; G. Thomas Sicilia, Director of Accession Policy,Office of the Assistant Seoretary of Defense ,(Manpower Reserve Affairs and Logistics),for his support of this and other innovative efforts in the manpower supply research arena.
JAMES F. KELLY, R.Conimanding Officer
or
4
JAMES W. TWEEDDALETethnicaiDirector
'Zs I

Problem
Currently, there are no models for the supply of older-age enlistees. Consequently,manpoiker planners can -neither accurately forecast the supply of these individuals, norevaluate alternative policies to achieve the desired level of accessions.
Ob'ective .
SUMMARY
The objective of this pffort was to assess the feasibility of modelling the supply ofolder-age accessions.
approach
The current status of supply modelling was reviewed, with*particular attention beinggiven to the decision context of the enlistment choice. The availability of data forconducting supply modelling was evaluated.
btResults/
Ample data are available for modelling the supply of 20-29 year-old enlistees, andappropriate methodologies can be developed for estimating a variety of models of thesupply of these enlistees. Age-specific supply modelling should improve The accuracy ofthe younger-age supply models.
Recommendations
The supply of Older-age individuals should beApodelled. Data on the labor forceexperience, both of those who have enlisted and th Alk. who have not,e, should be used toexpand knowledge of the enlistment decision.
of a
vii

CONTENTS
INTRODUCTIONProblem and BackgroundObjective
METHOD
Decision ContextSupply Model Evaluation ,
Supply Modelling,Issues
DATA AVAILABILITY t
......."Military Dafa Sets
1979 DoD Survey of Officers and Enlisted.Personnel, 1979 DoD Survey of Personnel Entering Military Service.
1979 Reserve Force Sufveys .Civilian Data Sets
1981 Youth Attitude Tracking Sfudy, ..
1981 Special Survey of Military Employment Inierests. ofOlder Men , .
Civilian/Military Data Sets ..Current Population Sutveys .
, 197,9 Youth'Cohort of the National Longiiudinal Survey qfLabor Force Behavior .:ii-
Profile of American YouthHigh School Class Of 1972 Study RepoitHigh-School and Beyond 190 Cohort Data C
CONCLUSIONS .
RECOMMENDATIONS \ (
REFERENCES
BIBLIOGRAPHY .
.4.DISTRIBUTION LIST.
;
.
t.
.
.
s
e--16
r ,
.
Page
1
1
4
4
.456
9
.10 :101011
1313
.131414
15
1155 L'17
19
20
21
25
27
t
,
6

..
L
r
1.-
2.
3.
4.
5:
6.
7.
8.
9.
10.
_ LIST OF TABLES,
IF
Age Distribtition ,(%) of Male Military Personnel on Active Duty ForSelected A'ears .).
. ,1'
Median Age Of Male NPS Accessions FY74-82 (Odt 81--3un 84 '.
Percent of 1980 Male NPS Accession in Mental Groups I and II
Decision Context By Age .
Nu rt ber of Male NPS Accessions (in thousands) Over Age 21i-
Pernt of DoD NPS Accessions Over 21 by FYe .
Junior Reserve Force Survey Areas of Interest to Supply-, Modelling
.
Content Areas of Survey of 23-29-year-old Men-
NLS Data for Youth Cohort ..
,High School and Beyond Survey Information .
Ny
6
Page
1 ,
3
3
5
6
7
12
Iii
16
18
1
4
v
,
\.
.1
i
4
,
,
c-
,
.71
,
1
INTRODUCTION
Probjem and Background
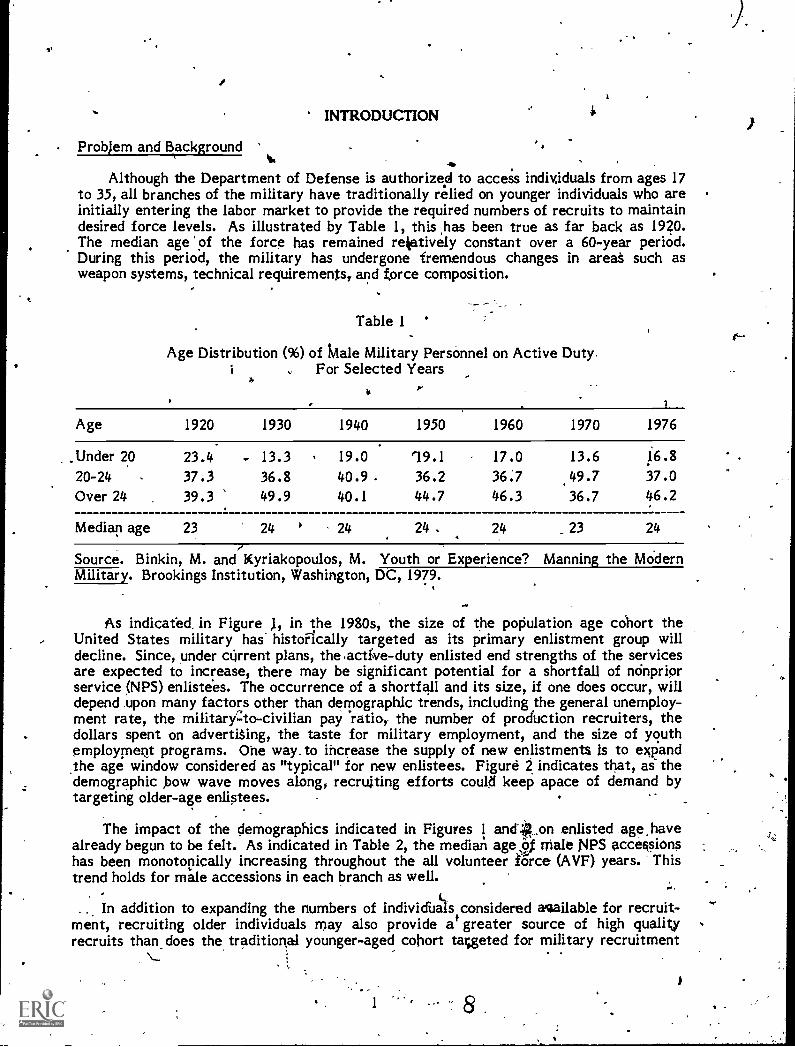
Although the Department of Defense is authorized to access individuals from ages 17to 35, all branches of the military have traditionally relied on younger individuals who areinitially entering the labor market to provide the required numbers of recruits to maintaindesired force levels. As illustrated by Table 1, this has been true as far back as 1920.The median age 'of the force has remained relatively constant over a 60-year period.During this period, the military has undergone tremendous changes in areat such asweapon systems, technical requiremems, and force composition.
Table 1
Age Distribution (%) of Male Military Personnel on Active DutyFor Selected Years
p.
1
Age 1920 1930 1940 1950 1960 1970 1976
, Under 20 23.4 .. 13.3 . 19.0 19.1 17.0 13.6 16.820-24 , 37 3 36.8 40.9 . 36.2 36.7 49.7 37.0Over 24 39.3 49.9 40.1 44.7 46.3 36.7 46.2
Median age 23 24 ' 24 24 . 24 23 24
Source. Binkin, M. and Kyriakopoulos, M. Youth or Experience? Manning the ModernMilitary. Brookings Institution, Washington, DC, 1979.
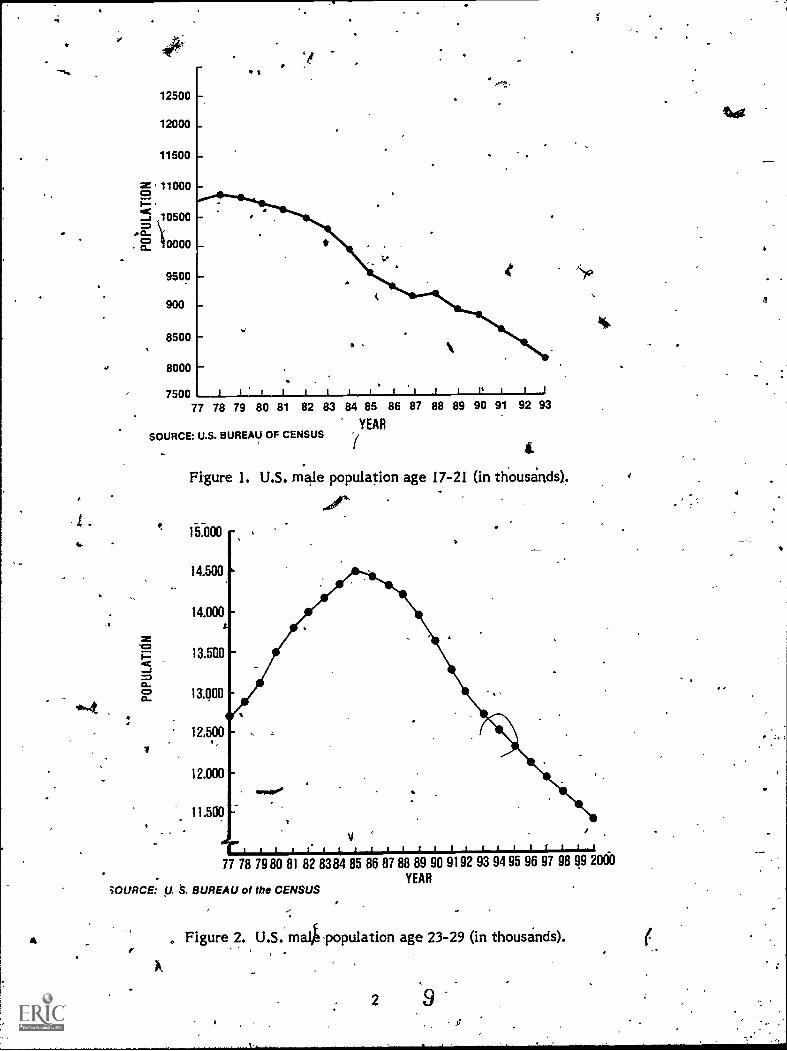
As indicated, in Figure 1, in the 1980s, the size of the population age cohort theUnited States military has- histofically targeted as its primary enlistment group willdecline. Since, under airrent plans, the actiCve-duty enlisted end strengths of the servicesare expected to increase, there may be significant potential for a shortfall of minpriorservice (NIPS) enlistees. The occurrence of a shortfall and its size, if one does occur, willdepend upon many factors other than demographic trends, including the general unemploy-ment rate, the militarY:to-civilian pay ratio-, the number of production recruiters, thedollars spent on advertiting, the taste for military employment, and the size of youthemployment programs. One way. to increase the supply of new enlistments Is to expand_the age window considered as "typical" for new enlistees. Figure 2 indicates that, as thedemographic ipow wave moves along, recruiting efforts coul0 keep apace of demand bytargeting older-age enlistees.
The impact of the demographics indicated in Figures 1 and4,,on enlisted age ,havealready begun to be felt. As indicated in Table 2, the mediaA age,Of Male NPS accessionshas been monotopically increasing throughout the all volunteer i;:irce (AVF) years. Thistrend holds for male accessions in each branch as well.
In addition to expanding the numbers of indivicfuls considered asailable for recruit-ment, recruiting older individuals may also provide at greater source of high qualityrecruits than does the tradition* younger-aged cohort tggeted for military recruitment
8
*V'
12500
12000
11500
11000
10500
0000a.
9500
900
8500
8000
7500 I I I I I tit I
77 78 79 80 81 82 83 84 85 86 87 88 89 90 91 92 93
YEARSOURCE: U.S. BUREAU OF CENSUS
Figure 1. U.S. male population age 17-21 (in thousands).
p' 15.00040.
14.500
14.000
13.500
a.13,000
12,500
1
12.000
11.500
v
77 78 79 80 81 82 8384 85 86 87 88 89 90 9192 93 94 95 96 97 98 99 2060
WURCE: U. S. BUREAU of the CENSUSYEAR
4 Figure 2. U.S. malkpopulation age 23-29 (in thousands).
2
I
thisg

,
..
,
Table 2v e
) 4.
Median Age of Male NPS Accessions FY7442 '(Oct 81--3un 82)
FY DoD Army Navy Air Force Marine
82 19.5 19.781 19.2 , 19.280 19.0 19.179 1$.9 19.178 18.9 1:177 18.9 18.976 18.9 18.975 18.9 18.974 18.8 18.8
Note. , Data provided by the Defense Manp
19.5. 19.1
19.0 ,18.918.8,18.918.918.8
19.7 19.019.5 18.8
18.8--- 19.2 18.7
19.2 18.719.2 18.719.2 18.619.3 18.619.1 18.5
17
a Center (DMDC).
Programs. Analysis of results of the Armed orces Vocational Aptitude Battery (ASVAB)administered in 1980 to a cross-section of Am :can Youth aged 18 to 23 (OASD(MRA&L),1982), indicates that Armed Forces Qualificati Test (AFQT) scores of the 1980 youthpopulation increased as age increased. Also, a U ited States Army recruiting _command.memorandum (Coleman & Toomepuu, 1981) reports that NPS individuals over the age 'of2,1 who join the Army are of substantially higher mental aptitude than are 17-through-21arged entrants. Table 3 presents the percent of 1980 male NPS accessions from two age .
groups in mental groups (MGs) I and LI As shown, almost 35 *cent of the D..oD 22-and-over age group accessions were MG I and Hs, compared to only 25 percent of the usuallyrecruited 17-21-year-old age group. These data indicate theft recruiting older-age,recruits may provide a way to meet DoD's increasingly technical Manpower requirement.
. Obviously, however, supply demand and job performance data must also be examined.Enlistment screening procedures may have yielded the "rich" mental group mixture foundamong older recruits. .
,
Table 3
Percent of 1980 Male NPS Accession in Mental Groups I and II
.Age Group DoD Army Navy , Air Force Marine
17-21 25.1 13.9 35.1 38.3 24.722 and over 34.9 25.4 47.6 41.8 35.3
Note. Data provided by DMDC:
'Mental groups are defined by AFQT scores: I, 93-99; II, 65-92; 17IA, 50-64; IIIB, 31-49; IV, 10-30; and V, 1-9.
4 . 3 1 0
/

In spite of the above statement, no models currently exist to assess the supply ofolder-age enlistees. Consequently, manpower planners can neither accurately forecastthe supply of these individuals nor evalaute alternative policies to achieve a desired level
.of accessions.
Ob'ective
The objective of this effort was to assess the feasibility of modelling the supply of22-29-year-old enlistees. The key (and interrelated) issues concern the availability ofdata and the development of an appropriate methodology for making enlistment supplyprojections for 22-29-year-olds.
METHOD
Decision Context
Most supply analyses use data from people who have already enlisted. Even ifmanagers become very good 'at predicting the supply of similar future enlistees, suchenlistees may not be the most preferred recruits. Rather, the most desired group maywell be among those who are not currently enlisting. Supply modellers and the users ofsupply models need to be very knowledgeable about the supply pool that is not choosingmilitary employment. A number of data sets discussed later in this report can be used togain improved insights into the enlistment decision and thereby used to improve thetarteting of preferred recruitS.
To model the enlistment supply of older-age individuals effectively, it is necessary tounderstand the context on which they would base a decision to enlist. For example, asshown in Table 4, 17-20-year-olds may include a disproportionate number who have part-or. full-time jobs or who are unemployed. Survey data on entering personnel_ can be usedto test this hypothesis.
The -25-year-old group is much more heterogeneous than the younger age group,"containing both veterahs and 4-year college-educated subgroups. Since these subgroupsare already specific targets for prior-service accession programs and officer programs,they probably should be subtracted from the older-age population to size the relevantolder-age enlistment pool.
The 17-20 and 21-25 year groups contain trade school and 2-year college graduates,who are prime targets for NPS lateral entry programs. NPS lateral entry programs mustbe carefully integrated with NPS programs for E-1 level entry.
Age group supply modelling must carefully Consider thz,impacts of complementaryand competitive policies on NPS accession, prior-ser-vide accession, and, most par-ticularly, lateral entry. Modellers in accession supply should use a perspective of labor-labor substitution for different age enlistees, lateral entrants, and reenlistees. Enlistmentsupply models should yield_information on response rates to policy variables and exogenousdemographic and economic factors. Information on relative performance of individualsentering via different accession paths is also needed. With cost information from supplymodels and benefit information from performanCe analyses, more efficient and effectivemanpower policies can be undertaken.
411
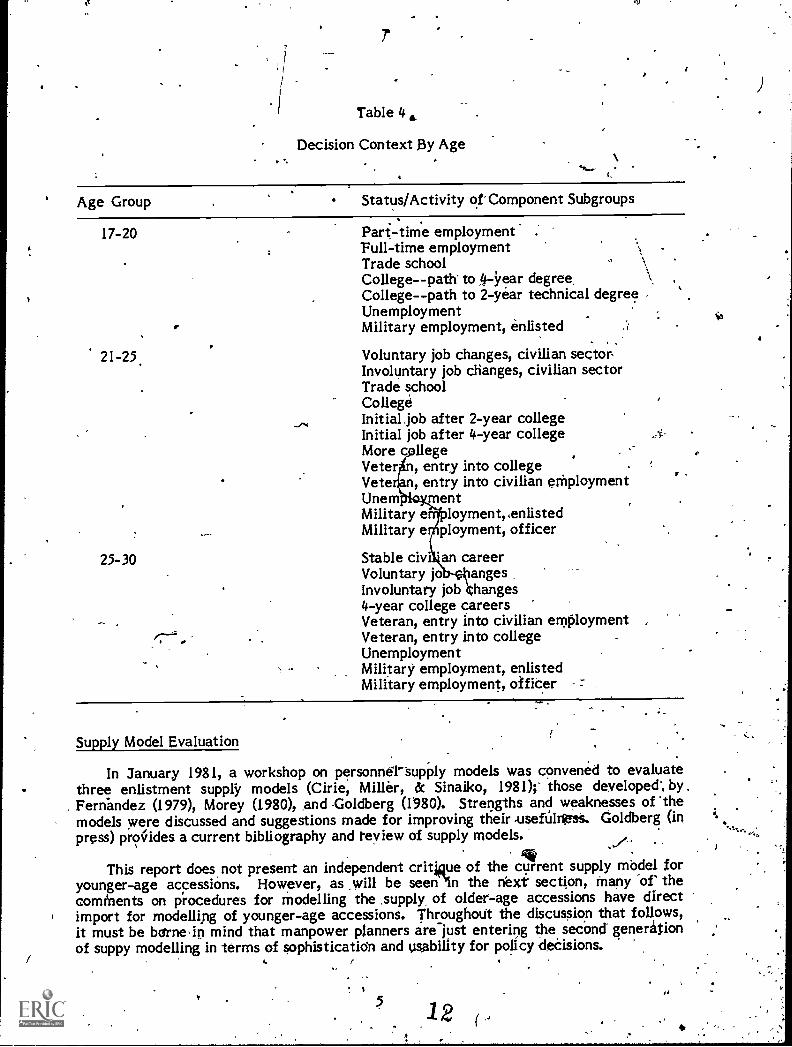
Table 4 .Decision Context )3y Age
.
Age Group Status/Activity of'Component Subgroups
17-20
21-25.
25-30
,
Part-time employmentFull-time employmentTrade school >.
Co llege--path to A-Year degreeCollege--path to 2-year technical degree ,UnemploymentMilitary employment, enlisted
,
Voluntary job changes, civilian sectorInvoluntary job changes, civilian sectorTrade schoolCollegeInitial,job after 2-year collegeInitial job after 4-year collegeMore c llegeVeter n, entry into collegeVetern, entry into civilian eMploymentUnemiømentMilitary e loyment, enlistedMilitary e ployment, officer
Stable civi an careerVoluntary jo angesInvoluntary job hanges4-year college careersVeteran, entry into civilian employment ,
Veteran, entry into collegeUnemploymentMilitary employment, enlistedMilitary employment, officer
Supply Model Evaluation
In January 1981, a workshop on personnenupply models was convened to evaluatethree enlistment supply models (Cirie, Miller, & Sinaiko, 1981)r those developed', by .
Fern*andez (1979), Morey (1980), and Goldberg (1980). Strengths and weaknesses of 'themodels were discussed and suggestions made for improving their -useftilMss. Goldberg (inpress) prOides a current bibliography and review of supply models.
This report does not present an independent critiQue of the current supply model foryounger-age accessions. However, as will be seen'In the next section, Many 'of' thecomenents on Procedures for modelling the supply of older-age accessions have directimport for modelling of younger-age accessions. Throughotit the discussion that follows,it must be barne,in mind that manpower planners are just entering the secOnd generitionof suppy modelling in terms of sophisticatidn and usability for policy deasions.
51 2 (

.
Supply Modelling Iisues
As 'indiCated in Table 5, it' appears that sufficient quantities.' of NPS plder-ageindividcials have been4nlisting during the AVF .era to measure supply, effects in allbranches, with the possible exceptiorr of the' Marine Corps. 714 is a prime considerationfor supply modelling: Other issues in tupply 'modelling are addressed in the followingparagraphs.
-Ar. ., .
... . Table 5 -. 1. .
Number of Male NPS Accessions (in thousands) Over 4ge 21
FY Army 'Navy- Air Force Marine
81 15.6 11.1 10.0 2.880 '' 19.0 9.2 8,5 2.879 14.6 7.2 7.6 2.2
78 .:, 14.0 7.8 ,
.
7.5 2.4
77'. 19.7 9.9 7.6 2.9
76 " 20.4 8;3 7.7". 2.7
75 - 18.8 7.1 7.7.
.3.2 '
74, 14.7 4:3 6.3 .' 2.2
1. Basic Geographic Unit of Activity.' Models have been developed tising geographidareas varying in size from nationWide (e.g., Fernandez, 1979) to recruiting substations(e.g., , Crawley, 1979): The preferred geographic unit of activity Is one that capturesvariation in the explanatory varjables, particularly the policy variables. The preferredbasic unit for measuring activity it,prbkaply the recruiting district, since recruiting goalsare generally executed at the district leXel. Also, local unemployment is &lore importantth state onational. It may be worthwhile to explore the use of the youth attitudetradking study (YATS) tracking area (Market Facts, Inc., 198-2) as a basic unit of activity,
, particularly yhei-V attempting to incorporate YATS measures of tastes for militaryempl'oyment.
.2. Functional Form. Functional forins consided have included linear (e.g.,Fernandez 1979), logistkc (e.g., Fechter, 1978), constant elasticity (e.g., Gressmer, 1978),and hybrid,(e.g.,_,Goldbe?g, 1980): iJi1& isttie is unimportant when there is little variationin the "explanatory variables. However,4tince 1980, there, has been more variation inMilitary compensation and ,unemployinent than 'in t.he, 5 years prior to 1980. 'Most"currents' mq51,e1s were estimated using data gathered prior to 1981..., The. question offunetional form becomes especially critical when using model forecastS from values of the.wlanatory variables outside the range used for estimation. The queftion of preferrediUnctional form-isinot Fesolved. 4
4 ,
?. 4t
. N
. 3., Time Basis of Observations. Three general :time relatiOns have'been used:' cross-sectional (e.g., ehn & Shughart, 1976)," ihonthly (eog., Fernandez, 1979), or quarteily (e.g,Fechter, 19'78) 'time Aeries and pooled cross-section time series (e.g., Goldberg, in press):Pooled, cross-section tirnOries data present some problems in error estrnation forstatistica,l, reliability. Time series analysis raises the question and opportunity tcwtest for
.. P. ,. ... .
i ....,, 13 ,

distributed lags on the explanatory variables. Goldberg (in press) has a good discussion onthe effects of the iime bases of data on supply modelling..
4. Dependen;-Variable. A major supply modelling issue is- the choice of the,dependent variable. Supply arid not merely enlistments must be measured (see Siegel &
,
Borack, 1981, for a discussion of this point). 4' part of this issue is whether to measurecontracts signed or people shipped in a time period. Signed contracts is probably thepreferred measure, since a person can le in a delayed enlistment pool for up to a year.More important for our purposes is%the age distribution of the supply. Current modelsseem siMply to use NPS accessions, of. all ages, with the age distribution assumed to bestable. As Table 6 indicates, however, this assumption is false: From the beginning of the
1'AVF to the end of R*4981, the percentage on NPS accasions over age 21 almost doubled.
'
Table 6
Percent of DoD NPS AccessionsOver 21 by FY
FY
81 15.280 14.3
79 13.478 13.1
77 12.476 11.875 11.074 8.8
Note. Data obtained from DMDC.
The dependent variable can and should be measuredg
in narroWer age cohorts,such as ages 17-20, 21-25, and 25+. The precise age 'cohort -determination is both an,empirical and a theoretical question. One would expect age 21 and age' 25 to indicatebreakoff points for different enlistment behavior's. An approach more sophisticated thancurrent efforts, could attempt to model supply .on an occupational basis. Perhaps adifferent supply exists for different occuaptions, pirticularly in the case of older-ageindividuals having substantially mdre labor market experience than younger-age acces-sions.
5. Explanatory Variables. Measures of explanatory variables used in. supply modelsshould include military wages, civilian wages, recruiting effort, advertising, unemploy-ment population,, tests for military employment, gdvernmental employment programs forcivilians, educational financial assistance, and post-service educational benefits. Thesemeasu es are discussed in the following paragraphs.
a. Military wages. These wages are generally measured as regular militarycompensation (RMC) during the first year of. service. PerhapS pay-table values are a more

J
valid measure of military wage attractiveness. Various weighting and discountingmethods for first-term pay have been used. Occupation-specific models could useoccupational bonuses and different weight!. The beit measure for military wage is still anopen question.
. b. Civilian wages. There is even lessSgreement on the proper .civilian wage.Often a simple national wage has been ,used and this is one of the weAknesses Of ctirrentmodels. The wage series should match as tlosely as possible the prevailing wage structurein the basic -unit of activity. Just as importantly, when separate equations are estimated
. by age group, appropriate civilian wages for each age group must be used: Regional age-sspecific deta are difficult to obtain and may require extensive data processing. Goldberg(in press) discusses some biases from using the average earnings of all production Workers.Occupation-specific, models should use matching civilian occupational wages.
c. Recruiting effort. This is usually measured by the number of productionrecruiters. Several methodological, issues are involved here. Siegel and Borack .(1981)have argued that goals must be used as an. exRlanatory. v.iriable. Goldberg (in press) hascountered that the correlation of goals and recruiters is,so fiigh that theietfects of goalsare captured by the number of recruiters. Since the questioh of motivation, and operationof rechiting effort is an extremely important one for the efficacy 9f econometricmodels, this issue must be ftirther analyzed in any current supply modelling effort. Anadditional recruiting atrea concern is the cross effect of different branch recruiters.Goldberg (1980) has rather successfully argued that some cross-recruiter effects arenonzero and must be included in any branch-specific supply modelling. Of just assignificant import for age cohort Modelling is the problem of distribution of recruitereffort. By refocusing the effOrt of recruiters from high schools to older-age sources, thenumbers, of older-age ,accessions might be increased without any apparent increase inrecruiting effort. Hence, some measure other than number of recruiters may need to be'devised to capture the distribution' of recruiter effort.'
d. Advertising. 'This variable is neither well understood nor properly measured.The lack of independence of advertising and recruiting effort has led a number ofresearchers to ignore advertising and assume the effects are captured by countingproduction recruiters. Morey's (1982) work is a nOtable exception. Also, recent evidencefrom the Wharton Navy enlistment field marketing experiment (Carroll & aao, 1981) maybe helpful. In any case, differential advertising efforts in recruiting districts 'need to becaptured,.
e. Unemployment. Supply models use sorile measures of the civilian adult un-employment rate as an explanatory variable. This procedure may be satifactory forforecasting purposes if youth unemployment or, more precisely, 17-20 year-old unemploy-ment, has a stable functional relationship with adult unemployment. During the 1980s, itis unlikely that a stable relationship Will exist among the unemployment rates for 17-20,21-25, and oVer-25 year-olds. Shifts in-the relative size of these age cohorts over thenext 2 decades Will cause changes in the demand/supply relations in the age-specificsemployment markets.. Age-group-sPeCific unemployment rates by sex and race must beused. Additionally, the rates must capture changes in _unemployment at the recruitingdistrict level of. measurement. It may be that change in local unemployment rates is moreimportant as an explanatory variable than the absolute level of local unemployment.Cowin, O'Connor, Sage, and Johnson (1980) discuss the effects of _local econSmicconditions on enlistments. Survey data on entering personnel may provide a basis fortesting a number of hypotheses on the relationship of enlistment to employment history.
8
15
A
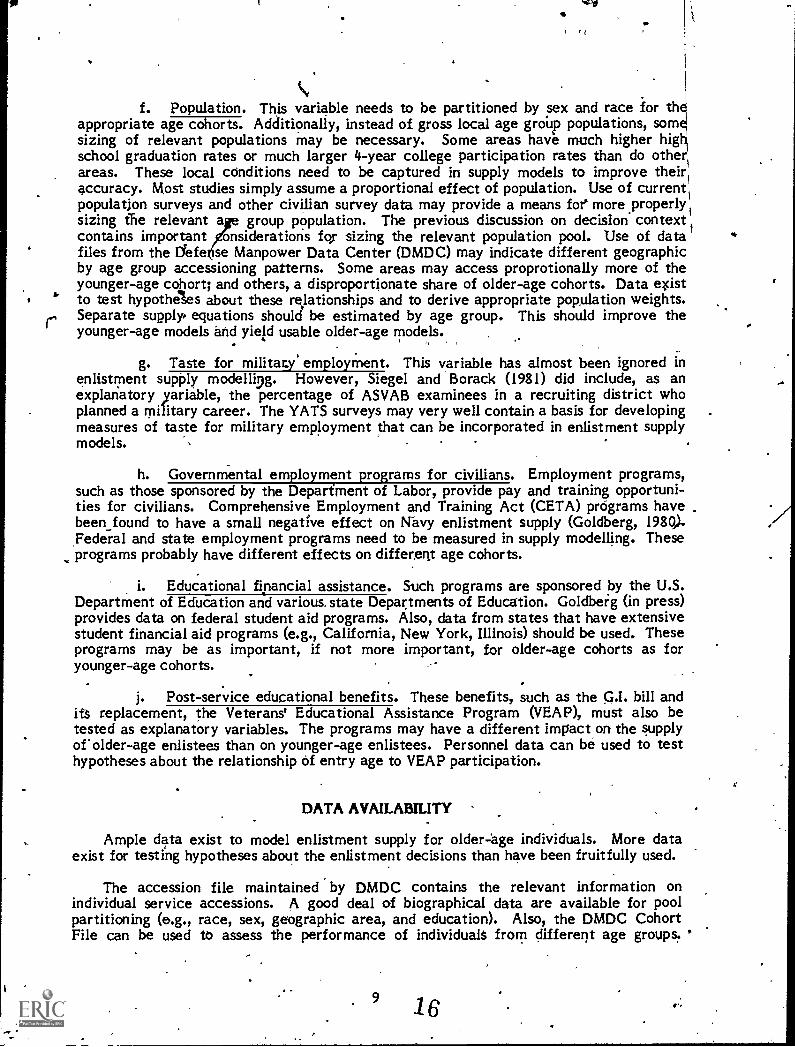
f. Population. This variable needs to be partitioned by sex and race for thappropriate age cohorts. Additionally, instead of gross local age group populations, somsizing of relevant populations may be necessary. Some areas have much higher higt-school graduation rates or much larger 4-year college participation rates than do othersareas. These local conditions need to be captured in supply models to improve theirsaccuracy. Most studies simply assume a proportional effect of population. Use of currentspopulation surveys and other civilian survey data may provide a means foe more .properlysizing fhe relevant a r group population. The previous discussion on decision context
ancontains important onsiderations fqr sizing the relevt population pool. Use of datafiles from the defe see Manpower Data Center (DMDC) may indicate different geographicby age group accessioning patterns. Some areas may access proprotionally more of theyounger-age cohort; and others, a disproportionate share of older-age cohorts. Data e*istto test hypotheles about these relationships and to derive appropriate population weights.Separate supply# equations should be estimated by age group. This should improve theyounger-age models and yield usable older-age models. ..'
g. Taste for militacy employment. This variable has almost been ignored inenlistment supply modellipg. However, Siegel and Borack (1981) did include, as anexplanatory ,yariable, the percentage of ASVAB examinees in a recruiting district whoplanned a military career. The YATS surveys may very well contain a basis for developingmeasures of taste for military employment that can be incorporated in enlistment supplymodels.
h. Governmental employment programs for civilians. Employment programs,such as those sponsored by the Deparfment of Labor, provide pay and training opportuni-ties for civilians. Comprehensive Employment and Training Act (CETA) programs have .been_found to have a small negative effect on Navy enlistment supply (Goldberg, 1980..Federal and state employment programs need to be measured in supply modelling. Theseprograms probably have different effects on different age cohorts.
i. Educational financial assistance. Such programs are sponsored by the U.S.Department of Education and various, state Departments of Education. Goldbeig (in press)provides data on federal student aid programs. Also, data from states that have extensivestudent financial aid programs (e.g., California, New York, Illinois) should be used. Theseprograms may be as important, if not more important, for older-age cohorts as foryounger-age cohorts. .`
j. Post-service educational benefits. These benefits, such as the G.I. bill andits replacement, the Veterans' Educational Assistance Program (VEAP), must also betested as explanatory variables. The programs may have a different impacton the supplyof older-age enlistees than on younger-age enlistees. Personnel data can be used to testhypotheses about the relationship of entry age to VEAP participation.
DATA AVAILABILITY
Ample data exist to model enlistment supply for older-age individuals. More dataexist for testing hypotheses about the enlistment decisions than have been fruitfully used.
The accession file maintained by DMDC contains the relevant information onindividual service accessions. A good deal of biographical data are available for poolpartitioning (e.g., race, sex, geographic area, and education). Also, the DMDC CohortFile can be used to assess the performance of individualS from different age groups. "
11,
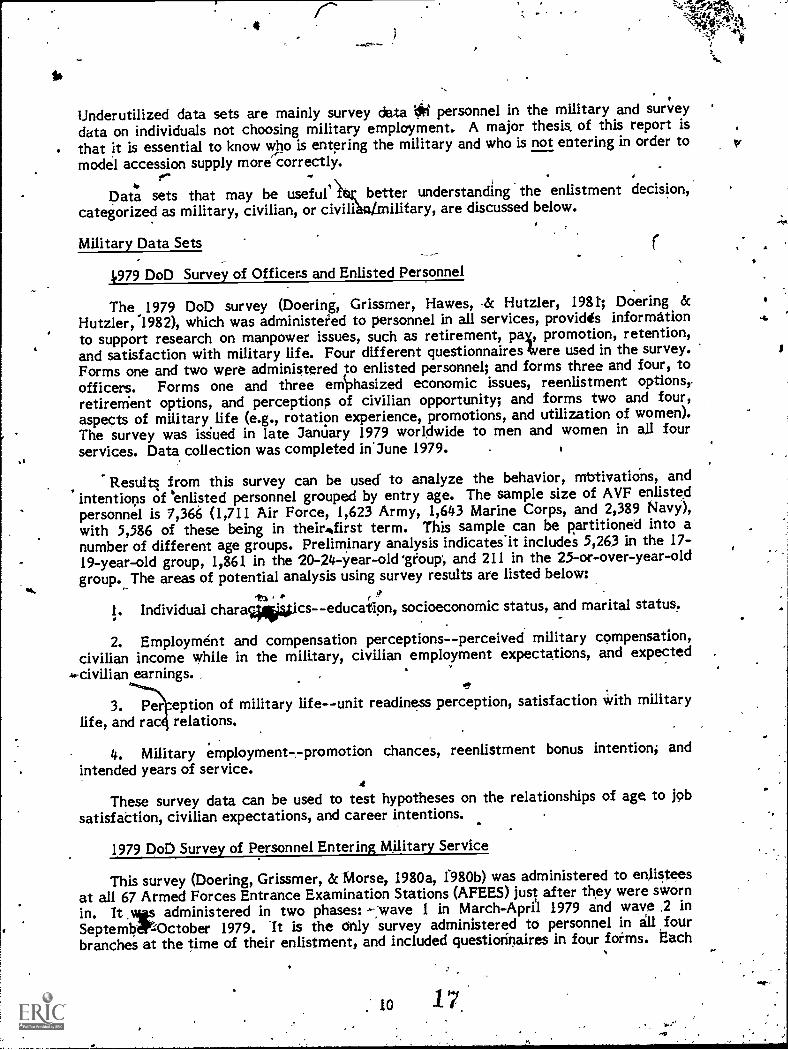
Underutilized data sets are mainly survey data *I personnel in the military and surveydata on individuals not choosing military employment. A major thesis, of this report isthat it is essential to know vpo is entering the military and who is not entering in order tomodel accession supply more correctly.
Data sets that may be useful better understanding the enlistment decision,categorized as military, civilian, or civili1military, are discussed below.
Military Data Sets
1,979 DoD Survey of Officers and Enlisted Personnel
The 1979 DoD survey (Doering, Grissmer, Hawes & Hutzler, 1981; DoeringHutzler,"1982), which was administered to personnel in all services, provid4s informationto support research on manpower issues, such as retirement, par, promotion, retention,and satisfaction with military life. Four different questionnaires kere used in the survey.Forms one and two were administered to enlisted personnel; and forms three and four, toofficers. Forms one and three em:hasized economic issues, reenlistment options,.retirerrient options, and perceptions of civilian opportunity; and forms two and four,aspects of military, life (e.g., rotation experience, promotions, and utilization of women).The survey was issued in late Jantiary 1979 worldwide to men and women in all fourservices. Data collection was completed inJune 1979.
Results from this survey can be used to analyze the behavior, mbtivations, andintentions of 'enlisted personnel grouped by entry age. The sample size of AVF enlistedpersonnel is 7,366 (1,711 Air Force, 1,623 Army, 1,643 Marine Corps, and 2,389 Navy),with 5,586 of these being in their*first term. This sample can be partitioned into anumber of different age groups. Preliminary analysis indicates'it includes 5,263 in the 17-19-year-old group, 1,861 in the 20-24-year-old 'gfoup, and 211 in the 25-or-over-year-oldgroup._ The areas of potential analysis using survey results are listed below:
I. Individual chara244tics--education, socioeconomic status, and marital status,
2. Employment and compensation perceptions--perceived military compensation,civilian income while in the military, civilian employment expectations, and expectedciviian earnings. ,
3. Per eption of military lifeunit readiness perception, satisfaction With militarylife, and rac4 relations.
4. Military employment--promotion chances, reenlistment bonus intention, andintended years of service.
These survey data can be used to test hypotheses on the relationships of age to jobsatisfaOtion, civilian expectations, and career intentions.
1979 DoD Survey of Personnel Entering Military Service
This survey (Doering, Grissmer, & Morse, 1980a, f980b) was administered to enlisteesat all 67 Armed Forces Entrance Examination Stations (AFEES) just after they were swornin. It ,vits administered in two phases: -:wave 1 in March-Apra 1979 and wave 2 inSeptembIrlOctober 1979. It is the only survey administered to personnel in ill fourbranchei at the time of their enlistment, and included questionnaires in four foems. Each

wave had a form emphasizing enlistment and a form emphasizing attrition and issuesrelated to women. The sample design was established spch that the enlistee populationcould be compared with individuals not entering the military. There were over 2.5,000individual responses to waves I and 2.
The survey of entering .personnel included questions falling under the followingcategories (not all categories were included on all forms):
I. Individual and family background.2. Marital history Ind fertility.3. Educational background.4. Labor force status and experience.5. Assets and expenses.6. Enlisfment characteristics.7. Enligiment decision.8. Enlistment process.9. Attitude of women enlistees.
Of particular interest to supply modelling Is the information on labor force experiences.By analyzing earnings, occupational, and unemployment distributions for different agecohorts, hypotheses about employment-effects by age Can be tested.
1979 Reserve Force Surveys .
Reserve force surveys (Doering, Grissmer, & Hawes, 1981a, 1981b) were used to studya sample of 441 company-sized units, 224 in the Army National Guard and 217 in theArmy Reserve. Four separate questionnaires were used:
1. Reserve Force Personnel Survey-7. For Enlisted Grades E-1-E-4.2. Reserve Force Personnel Survey--For Enlisted Grades E-5,-E-9.3. Reserve Force Commander Survey. - .
4. Reserve Force Unit Survey.
The thrust of Form 1, which was administered to all junior' enlisted personnel members ofthe sample units, was to gain information on the first-term enlistment decision processand on the background and experiences of the individual prior to gnlistment. It includedquestions on the following areas:
1. Individual background.2. Educational background.3. Marital history and fertility.4. Family background.S. Civilian labOr force expedence.6. Pamily resources.7. Military background.S. Military training and work.9. Enlistment decision process.
10. Military compensation and benefits.11. Military attitudes/opinions.12. Leisure time activities.
For supply modelling, there is special interest in the areas of civilian labor forceexperience, military background, and enlistment decision/process. These areas areexpanded in Table 7. 4
1118

Tible 7
Junior Rqserye Force Survey Areas of Interest tor),Supply Modelling 7
Area Question
Civilian Labor ForceExperience
Military Background
Enlistment Decision/Process
Respondent's labor force status, currentSpouse's labor force status, currentTyp'eand size of employer-Hours usually worked in 1979Wage type and current earningsOvertime hours and weeks workedin 1979
f Overtime wage rateEmployer's leave policy for annual trainingEmployer's attitude toward Guard/ReservePaid vacation daysCivilian earnings during annual training, 1979Contact with federal job programs -
Months Worked, 1979Months unemployed/looking for a job, 1979,Unemployment compensation received, 1979Difficulty finding part-time civilian jobAnticipated earning from part-time job
Reserve/Guara experience, current:Reserve componentUnit locationPay grade, currentDate of last promotionDate of next promotionTerm oflerviceETS dateYears of service (YOS)
Past military experience (active and reserve).Entry year in any branchService, at entry (active or ;reserve) .
Services served in (active or reserve)Years of active service, active MOS, pay grade
Reasons for enlistment .
Information sources about Reserve/GuardFirst person contacted regarding Reserve/GuardRecruiters seenKnowledge of unit merribers prior to entryAttempts to enlist in active 1Attempts to enlist in other Reserve/Guard unitReasons for selecting Reserves/Guard instead of activeperceptions of attrition difficulty
;IP
,
.
Hypotheses. on differential age group participation in the Army Reser;les and NationalGuard can be tested by analyzing relationships by entry age grouping. The competition
. with the active duty force may vary with entry age.
Civilian Data Sets
1981 Youth Attitude Tracking Study
The YATS, begun in 1975, is a cross-sectional national tracking of 16 to 21 year-olds'attitudes, perceptions, and behivior with respect to future military employment: The`twelfth wave of YATS was completed in the fall of 1981 (Market Facts, Inc., 1982). TheYATS survey includes content areas on individual background, schooling, employment,future plans, job characteristics preferences, registration opinion, and potential in-fluences. The following-military, relevant items are of particular interest to supplyModelling:
1, Likelihood of military employment.2. Branch preference.3. Active duty/Reserves/National Guard.4. Time preference for joining.5. Problems with joining.6. Recruiter contact.7.. Military pay awareness.8. Enlistment bonus preferences.
If YATS were expanded. to include 22-to-25-year-olds, the survey would provideinsights, into ithe preferences of older males and how ,those preferences relate toemployment. By comparing relationships of the younger and/older age eoups, tests couldbe made of hypotheses on the age stability of such things as unemployment as a motivatorfor intentions to join the military. Additional analyses of interest would include recruitercontact as a function of age.
1981 Special Survey of-j/lilitary Employment Interests of Older Men
A special telephone survey of men 23-29-year-olds on their intention to join themilitary was conducted (Borack, 1982) to provide,specific information concerning:
1. The background and present circumstances of 23-29-year-olds who expressV'positive interest in joining the military. 1
A
2. The demographic ánd attitudinal characteristics of such individuals.
.3. The proportion of the age group _having a-positive interest in 'military employ:.ment, by branch of mililtary.
4. The relative attractiveness of pay, bonuses, and militar'y benefits.
5. Comparisons between younger (17-21-year-olds) and older (23-29-year-olds) menin terms of the factors important in their decision to join the military.
Phone interviews were conducted with 4,000 respondents drawn from a nationalprobability sample of hogseholds. The content areas included in survey are listed inTable 8. Questions such as those concerning propensity to enlist, and important factors in
:Th132 0

Table 8
Content Areas of Survey of 23-29-year-old Men
. Area Item-1
Background AgeMarital statusDependents'High school, gradesEducationRaqTotal personal incomeTotal household income and sourcesErnployment statusJob tenureOccupationJob satisfactionSatisfaction with job trainjngSources of job trainingFuture work plans
Military-specific Military intentionsas r 1 t
etne Pss
Past military txperience (active and reserve)',
-Reasons.for leaving militaryReenlistment intentionsReeplistment pay and bonus incentivesEnlistment pay and bonus incentivesEnlistment educational support incentives
Civilian Labor Force Experience
the decision, to enlist were the same as in the YATS study of 16-21 year olds (MarketFacts, Inc., 1982). Hence, the special survey provides unique information on intention'S ofolder-age men as well as a basis for testing relationships of age to factors affectingmilitary intentions.
Civilian/Military Datets
Current Population Surveys
The current population survey (CPS) (Bureau of the Census, 1978), which has beenconducted monthly since, the 1940s, provides ,records for persons 14 and over liVing insampled _units. It is the only source of rnonthli estimates of total employment andunemployment and is a comprehensive source 'of information on the following' personalcharacteristicS of the total populations age, sex, race, marital 'status, location, familystatus, educational backgrobrid, current school status, employment status, reasons for notworking, earnings, occupation, hours worked, and veteran status. Since the CPS provides
sv
, detail not otherwise available on the economic status and aciivities of the population, itcan be very -useful for testing hypotheses concerning the size of the relevant pool forenlistmentsupply.
1979 Youth Cohort of the National Lobgitudinal Survey_of Labor Force Behavior
The target population for this survey, which provides one of the best data sets fOi usein Cmderstanding the occupational choice paths of military-aged individuals, is betweenthe ages of 14 and 21 (Center for Human Resource Research, 1981; Kim, Nestel, Phillips,
Borus, 1980; Fredland dc Little, 1982). Blacks, Hispanics, economically ilisadvantagedwhites, and those serving in the military were oversampled to achieve useful sample sizesfor. selected "subgioups. A sample of 1,281 persons wi.thin the age group who wereemployed in the military on September 30, 1978 were included in the longitudinal sample.Weights are available in the data set to correct for the oversampling. By November of,1982, 3 years of data should be available: 1979, 1980, 1981. Currently, the Center forHuman Resource Research plans to conduct 3 additional years of interviews: 1982, 1983.,and 1084.
p.
. The national longifudinal survey (NLS) data set has important advantages relative tomost dther data sets available for the occupational"choice paths of young men and women.Only b'y studying data containing both civilians and military persongel can enlistmentinclinations and relative quality be analyzed. A civilian sample is necessary_ to assess,fully the alternatives available to those who do not join the military.
The NLS set has some of 'the yichest- 'data on labor"force experience over time,providing over 2,000 items of information on each respondent. Table 9 gives a brief list ofavailable data:.
The NLS data set allows:one to discern what portion of the age-specific employmentand quality distribution enters military employment. In addition, once in the military,career orientation can also be analyzed. The military-specific variables available areincluded in Table 9.
Although the NLS set provides a greatideal of data on each person, there are areduced number of cases. If the sample were large enough and applied over a long enoughtime, few other data sources would be needed. However, this data set is best utilized inconjunction with other data sets described in this report.
Profile of American Youth
This data set restilted from a project assessing the vocational aptitudes of anationally representative sample of youth to 'develop new national norms for the ASVAB(OASD(MRA&L), 1982). Since the individuals used for the profile were conjoint with theN,LS youth cohort, these two data sources can be merged to create a data set matchingoccupational histories with aptitude measures.,
AdditionallY, the profile data sets provide &basis for partitioning NPS pool intoaptitude profiles by age cohort. Preliminary analysis "demonstrates that mean AFQTpercentile stores increased directly with age for age groups 18-19, 20-21, and 22-23,
High School Class of 1972 Study RepOrt
The NLS of the high school class of 1972 (Taylor, Stafford, dic Place, 1981) focused onthe educational, vocational, and fiersonal development of high school graduates. The
15 . 22,

Table 9
NLS Data for Youth Cohort
Type of Variable
Labor market experience .
AIM yariables
Current labor force and employment statusCharacteristics of current jobWork experienceCharacteristics of job
Human capital and other socio-economics
0
.1..
Early formative irtfluenceMigrationEducationVocational training outside regular schoolGovernment jobs and training programHealth and physical conditionMarital and family characteristicsFinancial characteristicsMilitary serviceWork attitudesEducational and occupational aspirations and
expectationsOther social/psychological variablesRetrospective evaluation of labor market
experienceSignificant others
Environmental Place of birthLocationStandard metropolitan statistical area
Military-specific .0 BranchLength of serviceMilitary occupationRojc or officer trainingReserve or guard activitiesPay grade and incomeType and amount of military trainingFormal education while in serviceFuture military plansReasons for entering militaryReasons for leaving militaryContact with military recruiters.Type of dischargeCivilian job offer at time of disch rgeReturn to same employer after acItive du
reservessiguard
16
23
With

study began in 1972 with-a national probability sample of gver 19;000 high school seniors.Follow-up surveys were taken in 1973, 1974,1976, and 1980. The data file for the-base-year and all follow-ups have been merged.
The NLS-72 data base includes the following content areas:
1. Constitutional factors.2. Ability.3. Socioeconomic status.4. Home background.5. Community environment.6. Ethnicity.7. Significant others.8. Activity status.9. Educational attainment.
10. School characteristics.11. School experience.12. School performance.13. Work status.14. Work performance and satisfaction.15. Noncognitive traits.16. Goal orientations.17. Marriage and family.18. Opinions.19. Military.
The current review and annotation of reports using NLS-72 lists only four studiesutilizing the data set. One of these concerned educational benefits (Eisenman, Eitelberg,Purcell, Richmond, Wagner, & Hunter, 1975); and the other three (Eitelberg, 1976, 1979;Purcell, Eisenman, Eitelberg, .1c Hicks, 1976), on represeqtativeness. The data set appearsto have substantial applicability to the need for analyzing the occupational career pathsof military participants. It provides the following information on work status, perfor-mance, and satisfaction:
1. Type of work.2. Hours of work.3. Work plans.4. Job hunt resources.5. Reasons for not working.6. Income.7. Work conditions.8. Satisfaction.9. Application of job training.
10. Supervision.11. Application of schooling.
Also, it lists the following information on military experience: plans for military,type of "military training, length of service, satisfaction,.and plans.
High School and Beyond 1980 Cohort Data'
The high school and beyond (HS&B) study, which Is similar to, the NLS-72 study, is anationally representative sample survey of 1980 high school sophomores and seniors (Peng,Fetters, Sc Kolstad, 1981). The base-year (1980) cohort contained over 30,000 sophomores

and 28,000 seniors. Each student in the survey was administered cognitive' tests inaddition to the questionnaires. The data set may be one of the best for information on theNPS pool during the 1980s.
Table 10 lists categories of information on the first survey. Of particular interestare the questions on attitudes about military employrhent. Preliminary analysis indicatesa substantially larger interest in military employment as compared to the 1972 high schoolclass. Of even greater interest, however, are the planned survey followups in 1982 and1984. These. data should provide a basis to confirm or disconfirm hyp,otheses developedand tested from more limited data sets such as NLS-youth and also from older data setssuch as NLSL72.
Table 10
High School and Beyond-Survey Information
Gategory Information
High school experiences
Activities outside of school
Values and attitude
Plans of high school seniors
Plans for college
Curriculum placementMathematics and science courses takenGrades and homeworkParticipation in federally-funded programs
(including CETA)Basic skills remedial instructionVocational trainingProper school behaviorMinimum competency testStudent opinions of their school
Working for payOrganized group activitiesOther leisure activities
Life goalsFactors in occupationl choiceNational service
Short-range plans (including military employment)Long-range plans (postsecondary education, occupa-
tional goals, and farhily formation)
Criteria for choosing a collegePlans to use financial aidType of college choSenExpected field of study
18
_
25
4
s.
CONCLUSIONS
It is feasible to model the supply of 22-29-year-old enlistees. Arnple.data areavailable _ for supply modelling and appropriates methodologies can be developed forestirnating a variety of models of the supply of older enlistees. More data exist for'modelling the enlistment decision thaNhave been fruitfully used. Survey, economiC aiidaccession data can be jointly.-used to estimate the supply of older-age enlistments. Withexisting sources of data, modelling could range from the aggregate 'and rather- ndivy, tooccupation-specific and policy robust. The R&D investment required increases as' theusability for policy appraisal increases.
There are several Costly areas of research and analysis. One costly area would be theuse of surveys, such as those discussed herein to help understand the enlistment decisionprocess:- A second costly area would be to place the economic and intentional data on arecruiting district-specific-basis.
A naive and aggregate supply model mightsubtract college enrollments, veterans,military members institutionalized, mentally unqualified, and physically unqualified fromcensui poPulation estimates of 22-29-year-olds to obtain ari estimate of eligible sugply.This approach would leave unknown the amount enlisting from this coarse measure ofqualified military available (QMA) poOl Or the relationship of enlistments to military payand other explanatory variables.
A less-naive aggregate supply model.might use census data iNconjunction with surveydata discussed in the previous section to estimate the supply of enlistees. The proportionenlisting from different "intentions to enlist" groups can be used to estimate numbers Ofenlistees. This procedure would also not yield response rates for changes in policyvariables'such as Tecruiting targets.
A more sophisticated approach Would use econometric models for enlistments ingrotiim, such as MG I-IIIA, which most likely have not been demand-constrained. The
iollowing is an illustrative example of a method for utilizing survey, economic, andaccession data for econometric supply modelling. Accession data for MG I-MA high,school graduates by_ sex, race, and geographic area (e.g., SMSA or county) over time (e.g.,quarterly) can be obtained from DMDC. Accession and survey data cari be used to.partition the qualified military available pool by race, sex, age, and geographic area overtime. The NLS-72, HS&B,-and profile of American youth data can be Used to obtainquality measures (e.g., high school graduation' rites or AFQT distribution) by geographicarea over time.. Data fr/m the survey of personnel entering military service, reserve
.>fc force survey, profile of American youth, NLS youth cohort, special survey of militaryemployment interests of older men, and YATS can be used to obtain measures of taste formilitary employment by age by geographie area over time.
Recruit commands can be used to obtain measures of raifinting and advertisingefforts by geographic region over time. CPS and Bureau of Labor Statistics (KS) datacan be used to obtain emploYment measures by, age by geographic area over time. CPSand BLS wage data can be used along with military wage rates to obtain relative Militarywage measures by age, race, sex, and geographic region.
The accession data can be 'used together with the explanatory variable -dato in apooled cross-sectional time series for econometric estimation of an enlistment sUpplY,model for older-age accessions. This procedure will yield estimates of accession restonserates for changes in policy variables such as military compensation and recruiting eff rts.
0,4
. k RECONINIENDATIgt8 ,b
Important considerations for snpply modelling arelisted below:.-
I. 'Iniormatiecii about the supply pool that is not chi:losing military employmentshould be analyzed:
2. The decision, context of p9tential enlistees should be better uncler,stoOCI--pa?=ticulariy the age-specific factors invdlved in 1,he decAsion context.- ..-.cel e , .e
..,;.,1: The interaction oianCh-specific policies, go;.1s,. rtluiters, and enlistmentsshoilld be considered.in supply moldelt. .
4. Age-specific supply radelling should improve the accuracy of the.yott "er-agesuppfy models. ,'''. .
. . ,
., .
.5: Age-specific wage and employment series should be developed for the baiicgeographic unit of activity.
6. Age-specific...tastes for military employment .should be measured and included insupply models. . ..
.:
I
,
r
mr
4
27
4
M1
3,*
I
1 A,
. . _

REFERENCES .
Bureau 'of the Cens Us. Current population survey: Technical Documentation.Washington', DC, 1978.
Binkjn, Kyriakopoulos, M. Youth or experience? Manning*the modern military.Brookings Institution, 1979'. 4?
Borack, J. I. The intentions of men 23-to-29-years-oId to join the military: Results of anational survey (NPRDC7ech. Rep. 82-62). San. Diego: Navy Personnel Research andDevelopment Center, September 1982. (AD-A119 611)
Carroll, V., of( Rao, A. The enlistment field marketing experiment, Volume 1:Excutive overview and stimm y. Philadelphia, PA: University Of Pennsylvania,December 1981.
Center for Human Resource Researai. The national longitudinal sur,veys *handbook.Columbus, 014: Ohio State University, Authdr, February
Cirie, J., Miller, J., & Sinaiko, H. (Eds.). Department of Defense and Navy personnel'supply models: Report of a workshop. Washington, DC: Office of Naval Research, May1981.
Colerhan, F., & Toomepuu, J. Age group 22 and over: A good source of high mental'ability recruits. Fort Sheridan, IL: U.S. Army Recruiting Command; June 1981.
-Cowin, M., Q'Connor, F., Sage, L., & Johnson, C. The effects of lodal economicconditions on Navy enlistment. Information Spectrum, March 1980, p.'163.
Cralley, W. The tupply of Marine Cori;s recruits: A,micrts apprbach. Alexanaria, VA:Center for Naval Analysis, September 1979.
Doering, Z., Grissmer, D., & Morse, J. 1979 DoD survey of .pergonnel entering militaryservice: Wave 1 user's manual and codebook. Santa Monica, CA: Rand, November1980. (a)
4
Doering, Z., Grissmer, D;, & Morse, J. 1979,DoD survey of personnel entering militaryservice: Wave 2 'useris manual'and codeboOk. Santa Monica, CA: Rand, December1980. (b)
Doering, Z., Grissmer, D., dc Hawes, J. 1979 Reserte Force studies surveys: Survey.designt sample design, and administrative procedures. Santa Monica, CA: Rand, August1981. (a)
,,,. ,
Doering, Z., Grissmer, b., dc Hawes, J. 1 79 Reserve Forceltddies surveys: User'smanual and codebookt: Santa Monica, CA:, Rand, September 1981."'03)- .
-,
Doering, Z., Gritsmer, D., Hawes J., & Hutzler, W. 1978 DoD survey of officers andenlisted personnel: User's man4.1 and Codebook. Santa Monica, CA: Rand, January1981.
Doering, Z., Sc Hutzler, W. bescription of officers and enlisted personnel in tile U:S.armed forces: A reference for military manpower analysis. Santa MOnical CA: Rand,"March 1982.

o***
Eisenman, R., titelberg, M., Purcell, A., Richmond, B., Wagner, C., at Hunter, R.Educational benefit analysis: An examination of the effects of G.I. bill educationalbenefits on service accessions. Alexandria, VA: Hurrian Resources Research Organita`tionr November 1975.
Eitelberig, M. Evaluation of Army representation. Alexandria, VA: _Human ResourcesResearch Organiaation, November 1976.
Eitelberg, M. Military representation: The theoretical and prictical iniplications ofpopulation representations in the American armed forces (Dissertation). New York:New York,University, 1979.
Fechter, A. the supply of enlisted N;olunteers in the post-draft environment: Anevaluation based on pre-1972 experience. Santa Monica, CA: Rand, December 1978.
Fernandez, R. Forecasting enlisted supply: Projections for 1979-1990. Santa Monica,CA: Rand, September 1979.
'. . . .Fredland, J., 4 'Little, R. Socioeconomic characteriStics of the all-volunteer force:
Evidence from the national longitudinal survey. Annapolis, MD: Economics Depart-ment, U.S. Naval Academy, February 1982.,
.. ,
Goldberg, L, An econometric model of the supply of enlistment estimaies and applica-tions. McLean, VA: General Research,Corporation, June 1975.
1 .Goldberg, L. The supply of Navy enlistments. Alexandria, VA: Center -for Naval
(Analyses, December-1980.11
Goldberg, L. Enlisted ,supply: Past, present, and future. Alexandria, VA: Center forNaval Analyses, in press.
Grissmer, D. The supply of enlisted volunteers in the post-draft environment: An analysisbased On monthly data, 1970-1975. Santa Monica, CA: Rand, December 1978.
Jehn, C., & Shughart, W. Recruiters, quotas, and the number of enlistments. Alexandria,VA: Center for Naval Analyses, DecPmber 1976.
. .
Kim, C.,- Nestel, G., Phillips, R. & Borus, M. The alhvolunteer. force: An analysis ofyouth participation, attrition, ;Id reenlistment. Columbus; OH:. Ohio State UniverSity,Center for Human Resource Research, May 1930.
,
Market Fact's, Inc. Youth Attitude tracking Study, fall 1981. 'Arlingfon, VA: Author,Public Sector Research Group, April 1982.
Morey, R. The-"'impacts of various fypes of advertising media, demographics, andxecruiters on quality enlistments: Results from simultaneous and heteroscedasticmodels. Durham, NC: The Center for Applied Business Research, Duke UniverSity; .
37171080. -
Office of the Assi,stant Secretary of D.efense (Manpower, Reserve- Affairs, arid Logistics).Profile of American youth, 1980 natibnwide administration,of the Armed ServicesVocational Aptitude Battery,, Washingtori, DC: Author, Mardi 1982.
,
le
;22 .
;
,

Peng, S., Fetters W., dc'Kolstad, A. Hi&h school and beyond: A natiopal longitudinalstudy for the 1980's,., a capsule descriptidn of high school-students. Washington, DC:National Center -for Educational Statistics, April 1981.
Purcell,. A. .Eisenman, R., Eitelberg; M., ec Hecks, J. Army representativeness: The'national fongitudinal study. Alexandria, VA: Human Resources Research Organization,January 1976.
_Siegel, B., lc Borack, J. An econometric model of 'Navy enlistment behavior*(NPRDCTech.' Note 81-16). San Diego: Navy Personnel Research and Development Center,June 1981. (AD-A1101 365)
Taylor, E., Stafford, C., bc Place, C. National longitudinal study of the high school class .
of 1972 study reports update: Review, and annotation. Washington, DC: NationalCenter for Educational Statistics, June 1981.
4
M1
30
f'

BIBLIOGRAPHY
Altman, `s. Earnings, unemployment, and the supply of enlisted volunteers. Journal ofHuman Resources, 1969, IV-1, 38-59.
Baker, M. Untitled brief on lateral entry. San Diego: Navy Personnel Research andDevelopment Center, 1981. .
Cook, A. Supply of Air Force volunteers, The report of the Presiciential Commission on anall-volunteer force. Washington, DC: U.S. Government Pfinting Office,. November
.1970. A
Cooper, R. Military manpbwer and the all-volunteer force. Santa Monica, CA: Rand,September 1977.
Cr" (ley, W. The impact of youth unemployment rate and the expiration of the G.1. bill onMarine Corps enlistments. Alexandria, VA: Center for Naval Analyses, Ottober 1981.
Doering, Z. Rand-Department o`f Defense survey research program: Fiscal vears 1978-,
1979. Santa Monica, CA: Rand, December 1979.
Doering, Z., Grissmer, D., Hawes, J., eic Hutzler, W. 1978 DoD survey of officers andenlisted personnel: Survey design and administrativeprocedures. Santa Monica, CA:Rand, April 1980.
Doering, Z. Organizing survey research to support military manpower policies. SantaMonica, CA: Rand, March 1982.
Fechter, A. Impact of pay and draft policies in Army enlistment- behavior. The report ofthe Presidential Commission on an all-volunteer farce: Washington, C: U.S.Government Printing.Office, November 1970.
Fernandez, R. Enlisted supply in the 1980s. Santa, konica, CA: Rand, February 1980.
Fisher, A. The cost of the draft and the cost of ending the draft. American EconomicReview, 1969, LIX, 239-254.
.
Goldberg, L. Recruiters, advertising, and Navy enlistments. Alexandria, VA: Center forNival Analyses; March 1980.
Goldberg, L. CNA and Rand forecasts of Navy enlistments. Alexandria, VA: Center -forNaval Analyses, April 1980.
Goldberg, L. Long-range planning of requirements for Navy recruiters and advertising.Alexandria, VA: -Center for Naval Analyses, MaY 1980. ,
Gray, B. Suppli of first-term military enlistees. The report of the PresidentialCommission on an all-volunteer force (11-2-1). 'Washington, DC:', U.S. GovernmentPrinting Office,.November 1970.
Hawes, J. 1979 reserve force studies surveys: Description and evaluation of surveyprocedures. Santa Monica, CA: Rand, September 1981.
2531

Hutzler, W., & Doering, Z. 1978 DoD survey of officers and enlisted personnel: Sampledesign and selection. Santa Monica, CA: Rand, February 1980..
\ . ..
Lockman, R. Success chances of recruits entering the Navy (CNS,1086). Alexandria, VA;Center for Naval Analyses, February 1977.
Looper, L. Recruiting resource and goal allocation decision model. Brooks Air ForceBase: Air Force Human Resources Laboratory, January 1980.
Morey, R. Bud et allocation and enlistment prediction models for the Nay s recruitincommand: Testing and validation. Durham, NC: The Center for Applied BusinessResearch, Duke University, October 1979.
Muller,. W. Feasibility and benefits of lateral placement to meet the technical personnelshortfall of the U.S. Navy. Washington, DC: George Washington University, June 1981.
Sims, W., ec Truss, -A. A reexamination of the normalization of the Armed ServicesVocational Aptitude Battery (ASVAB) forms 6, 7, 6E, -and 7E (CNS 1152). Alexandria,VA: Center for Naval Analyses, April 1980.
32'
26
DISTRIBUTION UST
Assistant Secretary of Defense (Manpower, Reserve Affairs & Logistics)Aiiistant Secretary .of the Navy (Manpower & Reserve Affairs).Deputy Assistant Secretary of the Navy (Manpower) (OASN(MecRA))Principal Deputy Assistant Secretary .of the Navy (Manpowe and Reserve Affairs)
(OASN(M &RA))Director of Manpower Analysis (dDASN(M))Deputy Assisatant Setretary of the Navy (CPP/EEO)Chief of Naval Operations (0P-01.), (OP-11), (OP-12) (2), (OP-13), (OP-14), (OP-15), (OP-
110);(0P-115) (2), (OP-140F2), (0P-964D), (OP-987H)Chief of Naval Material (NMAT 05)Chief of Naval Research (Code 200), (Code 440)(3), (Code 442), (Code 448)Chief of Information (0I-213)Chief of Naval Education and Training (02), (N-2), (N-5)'Commandant of the Marine Corps (MPI=20)Commander. Navy Recruiting CommandDirector, Naval Civilian Personnel CommandPresident, Naval War Ctillege (Code E114)Superintendent, Naval Postgraduate SchoolSecretary Treasurer, U.S. Naval InstituteCommander, Army Research Institute for the Behavioral and Social Sciences, Alexandria
(PERI-ASL)Commander, Army Research Institute for the Behavioral and Social Sciences, Alexandria
(PERI-ZT)Directdr, Systems Research Laboratory, Army Research Institute for the Behavioral and
Social Sciences, Alexandria (PERI-SZ)Chief, Army Research Institute Field-Unit, Fort HarrisonCommander, Air Force. Human Resources Laboratory, Brooks Air Force Base (Manpower
and Personnel Division)Commander, Air Force Human Resources Labor,atory, Brooks Air Force Base (Scientific
and Technical Information Office)Commander, Air Force Human Resources Laboratory, Williams Air Force Base
(AFH12L/OT)Commander, Air Force Human Resources Laboratory, Wright-Patterson Air 'Force Base
(AFHRL/LR)Commandant Coast Guard HeadquartersSuperintendeht, U.S. Coast Guard AtademyDefense Technical Information Center (DDA) (12)Comnfander, Army Recruiting Command, Fort Sheridan, IllinoisCommander, Air Force Recruiting Command, Randolph Air Force Base, TexasDirector, Office of Accession Policy, Office of the Secretary of Defense, Manpower,
Reserve Affairs, and Logistics, Pentagon
4-1
33
27
_Ar