Embed Size (px)
Citation preview
This version of the article has been accepted for publication by Taylor and Francis in
EECERJ Volume 26 Issue 1, 2018
1
Is Cognitive Development at 3 Years of Age Associated with ECEC Quality in Norway?
Erik Eliassen1
Oslo and Akershus University College of Applied Sciences
Email: [email protected]
Phone: +47 92806172
ORCID: orcid.org/0000-0002-0290-9010
Henrik Daae Zachrisson
The Norwegian Center for Child Behavioral Development & Center for Educational
Measurement, University of Oslo
Email: [email protected]
Phone: +47 40048017
Edward Melhuish
University of Oxford, & Birkbeck, University of London
Email: [email protected]
1 This study is a part of the Better Provision for Norway’s Children in ECEC (BePro 220570) project with the following Key Investigators:
Elisabeth Bjørnestad, Jan Erik Johansson and Lars Gulbrandsen (Oslo and Akershus University College); Marit Alvestad and Eva Johansson (University of Stavanger); Liv Gjems and Thomas Moser (University of Southeast Norway); Edward Melhuish (Oxford University) and
Jacqueline Barnes (Birkbeck University of London).
This version of the article has been accepted for publication by Taylor and Francis in
EECERJ Volume 26 Issue 1, 2018
2
Abstract
In countries with universal access to early childhood education and care (ECEC), child
participation is high across a range of socioeconomic groups. However, ECEC quality is often
varying, and many children spend much time in ECEC settings that are not necessarily high
quality. In this observational study, we therefore examined the relationship between observed
ECEC quality and children's cognitive development at age three years in Norway - a country that
provides universal access to ECEC from age one. The sample comprised 800 children, enrolled
in 83 ECEC centers, who were assessed in verbal and non-verbal cognitive ability. ECEC quality
was measured with the Infant/Toddler Environment Rating Scale (ITERS-R), and cognitive
outcomes were measured with the Naming Vocabulary and Picture Similarities subtests of the
British Ability Scales III (BAS III). The results showed that children's cognitive development at
age three was not associated with ECEC quality; irrespective of socioeconomic background.
Keywords: early childhood education and care; cognitive development; ECEC quality;
socioeconomic differences; GoBaN;
This version of the article has been accepted for publication by Taylor and Francis in
EECERJ Volume 26 Issue 1, 2018
3
Because children's cognitive developmental trajectories cannot be explained by heritability alone
(Haworth et al., 2010), childhood experiences play an important role. In developed countries,
many of these early-years experiences stem from early childhood education and care (ECEC)
(OECD, 2015). The shift from parental care to institutional center-based care therefore gives rise
to questions about how children are affected cognitively. Since cognitive abilities early in life
predict future development and life chances (e.g., Knudsen, Heckman, Cameron, & Shonkoff,
2006; Shonkoff & Phillips, 2000), providing high quality care and stimulating ECEC
environments has frequently been proposed as a way of reducing social disparities in children's
development (e.g., Burchinal, Zaslow, & Tarullo, 2016; Heckman, 2006; OECD, 2012).
However, much of the current evidence on the effect of ECEC quality on children's cognitive
development comes from the U.S. - a sociopolitical context where children either attend targeted
programs for disadvantaged children, or market-based programs chosen by parents. Yet, in many
developed countries, ECEC is increasingly being used by a wide range of socioeconomic groups,
exposing children with diverse backgrounds to ECEC settings that vary in quality. In this study,
we therefore examine the relationship between ECEC quality and early cognitive development in
a context of universal access to ECEC from age one (Norway). Furthermore, we examine
whether disadvantaged children gain more from ECEC quality at all levels than their more
advantaged peers.
Does ECEC Quality Predict Improved Cognitive Development?
In U.S. studies, the efficacy of high quality ECEC programs in improving disadvantaged
children's cognitive development has been shown to be relatively consistent across studies (see
Camilli, Vargas, Ryan, & Barnett, 2010), albeit with more recent studies reporting somewhat
This version of the article has been accepted for publication by Taylor and Francis in
EECERJ Volume 26 Issue 1, 2018
4
lower effect sizes (see Duncan & Magnuson, 2013), and with effects sometimes diminishing
over time (e.g., Barnett, 2011). Targeted programs that are specifically tailored to the needs of at-
risk children and their families have generally proved relatively effective at compensating for
inadequate home environments (as reviewed by Camilli, Vargas, Ryan, & Barnett, 2010) - at
least in the short-term. These studies, however, have tended to measure the impact of high
quality ECEC as contrasted with no center-based child care, rather than measuring the
effectiveness of observed ECEC quality at different levels. Today, in many countries there is
increasing ECEC availability - often at heavily subsidized prices - and ECEC is becoming a
viable option for many families with children between 0-6 years, irrespective of family
background. For these families, the question is not so much whether to use ECEC or not, but
which ECEC center to use.
Previous studies examining relationship between variability in ECEC quality and
cognitive outcomes have typically found relatively weak associations (Burchinal, Kainz, & Cai,
2011) - indicating that quality itself may be less important than simply attending ECEC at all
(NICHD & Duncan, 2003). In contrast, a large-scale European study (EPPE / EPPSE) found
substantial benefits of quality on long-term cognitive outcomes for high and medium quality
ECEC, whereas low quality ECEC fared little better than home care (Sylva, Melhuish,
Sammons, Siraj-Blatchford, & Taggart, 2011). It has also ben suggested that the magnitude of
associations found in many studies may potentially have been underestimated due to model
misspecifications, as proposed by Hatfield, Burchinal, Piantac, and Sideris (2016) who found
indication that the relationship between observed quality and developmental outcomes may be
non-linear rather than linear; linear being the most frequently modeled functional. Since Hatfield
et al. found associations to be mostly evident in the upper part of the quality range, this could
This version of the article has been accepted for publication by Taylor and Francis in
EECERJ Volume 26 Issue 1, 2018
5
indicate that a minimum quality threshold level may be necessary for children to benefit
substantially.
Does High Quality ECEC Reduce Social Discrepancies in Cognitive Outcomes?
The link between socioeconomic status (SES), a concept relating to a family's social and
economic position, and children's development has been well-established, and studies have
shown SES to be predictive of a variety of outcomes such as health, socioemotional development
and cognitive development (Bradly & Corwyn, 2002; Hackman & Farah, 2009). The idea that a
stimulating and enriched learning environment can promote development in children from
disadvantaged (low SES) families has therefore been argued by many (e.g., Leseman & Slot,
2014; Magnuson & Shager, 2010; Sylva, Melhuish, Siraj-Blatchford, & Taggart, 2004); a claim
that has largely been substantiated by evidence from targeted programs and interventions (see
Camilli et al., 2010; Duncan & Magnuson, 2013). However, the extent to which high quality
ECEC is more strongly associated with cognitive outcomes for disadvantaged children as
compared with more advantaged children is less clear. For instance, Dearing and McCartney
(2009) found that the more children from low income families had attended above average
quality care prior to school entry, the smaller was the difference in middle school achievement
compared to their more affluent peers - regardless of these peers' experiences of quality of care.
Several meta-analyses have however failed to find stronger effects for disadvantaged children
(e.g., Burchinal et al., 2011; Keys et al., 2013). Despite the theoretical underpinnings of
compensatory effects of higher quality ECEC on cognitive development for disadvantaged
children (Ceci & Papierno, 2005), it is uncertain whether observed ECEC quality is, in fact, the
critical ingredient.
This version of the article has been accepted for publication by Taylor and Francis in
EECERJ Volume 26 Issue 1, 2018
6
Parental self-selection is a notable issue potentially affecting results in most studies
assessing the effect of ECEC quality on cognitive outcomes (e.g., NICHD & Duncan, 2003).
Parents make active choices when choosing which ECEC centers to use, and researchers mostly
rely on controlling statistically for possible confounders (e.g., family income & education) to
attempt to reduce the chances of selection bias from contaminating the results. Studies that have
used experimental or quasi-experimental designs to counteract this potential source of bias,
however, have found effect sizes mostly on par with previous meta-analyses (e.g., Auger, Farkas,
& Burchinal, 2014). Nevertheless, it is unclear how self-selection manifests itself in a context of
universal access, such as in Norway. Although parents have freedom of choice to select ECEC
centers based on their own preferences, they may nonetheless be unable to discern high quality
centers from low quality centers without adequate information, expertise or insight. Previous
studies have shown some socio-demographic selection in timing of ECEC entry in Norway, with
more advantaged parents tending to enroll their children earlier (e.g., Sibley, Dearing,
Toppelberg, Mykletun, & Zachrisson, 2015; Zachrisson, Janson, & Nærde, 2013), but whether
parents systematically differ in their ability to select ECEC centers based on objective quality
criteria, depending on their socioeconomic background, is uncertain.
ECEC in Norway
Over the last few decades, Norway has expanded its ECEC sector considerably in order
to provide universal access. Today, ECEC is heavily subsidized by the government, with a price-
cap on family deductibles set to 2,703 NOK per month (equivalent to 305 Euros), with further
This version of the article has been accepted for publication by Taylor and Francis in
EECERJ Volume 26 Issue 1, 2018
7
reduced rates for low-income families (with a combined annual salary of less than 486,750 NOK
– equivalent to 54 847 Euros) having to pay no more than 6% of their total income on full-time
ECEC (ca. 7-9 hours per day). The most financially disadvantaged families (with a combined
annual income of less than 417,000 NOK – equivalent to 46,988 Euros) are offered part-time
ECEC (20 hours per week) for all children 3-5 years of age free of charge (The Norwegian
Directorate for Education and Training, 2016b). ECEC is available from age one (for all children
who have turned one-year-old within 1. September of the current year) (Norwegian Ministry of
Education and Research, 2005). Uptakes are annual, and availability is guaranteed for all
children with a statutory right; additional admissions are provided in accordance with local
capacity, thus leaving the possibility for infants younger than 1 year old, or children without a
statutory right to be admitted on regular terms. ECEC is also a widely popular welfare benefit, as
the vast majority (> 90%) of children between 1 and 5 years attend either public or private ECEC
centers in Norway. Most of them (> 80%) are enrolled as infants or toddlers (1-2 years), and
attend full-time (Statistics Norway, 2016). Although some children are enrolled before the age of
1 year, these represent only 3.7% of the demographic (The Norwegian Directorate for Education
and Training, 2016a).
Both private and public centers have equal status, are subject to the same governmental
regulations, and receive equal financial support (Norwegian Ministry of Education and Research,
2016a). As such, private and public centers are unlikely to differ substantially in terms of quality.
To ensure quality, all ECEC centers are required to implement guidelines from a national
framework plan (Norwegian Ministry of Education and Research, 2011) into their curriculum,
and conduct annual self-reports to their respective municipalities (local governments). The
municipalities (and recently the County Governors) oversee all ECEC centers, and also conduct
This version of the article has been accepted for publication by Taylor and Francis in
EECERJ Volume 26 Issue 1, 2018
8
site inspections (Norwegian Ministry of Education and Research, 2005, 2016b) – albeit relatively
infrequently (Gulbrandsen & Eliassen, 2013). However, it is worth noting the double role of
municipalities as both supervisory authority and center owner. Given that municipalities run
many of the centers which they are set to inspect, the expediency of such a quality control
mechanism can be called into question - as conflicts of interest may occur.
The Present Study
In the present study, we investigated the relationship between ECEC quality and
cognitive development at age three years in Norway. Because Norway provides universal access
to ECEC, we were able to examine this relationship across a range of quality levels for different
socioeconomic groups. We hypothesized that higher levels of quality are associated with higher
cognitive performance at age 3, and that this association is moderated by socioeconomic
background (i.e. parental income level and education).
Methods
Sample and Procedure
We used data from the first wave of Better Provision for Norway's Children in Early
Childhood Education (BePro / GoBaN), a study of the use of ECEC and child outcomes in
Norway. The study was approved by the Norwegian Center for Research Data (NSD) and the
Norwegian Data Protection Authority. The sample consisted of 800 children (49.5% girls, age at
cognitive assessment: M = 35.2 months, SD = 2.3 months) from 83 public and private ECEC
centers located in proximity to major universities or university colleges, across 7 municipalities
(Akershus, Nordland, Oslo, Rogaland, Telemark, Troms, Vestfold) - constituting a
This version of the article has been accepted for publication by Taylor and Francis in
EECERJ Volume 26 Issue 1, 2018
9
geographically diverse sample. Participants were selected through cluster randomization; a
process in which ECEC centers are randomly drawn from a pool, and eligible attending children
are subsequently recruited to the study. All parents with children born in 2011 or 2012, who
attended a selected center, received an offer of participation - of which an estimated 60-70%
accepted. Informed written consent was provided by parents on behalf of their children.
Data collection included an assessment session with the children, interviews with parents,
and observations of quality within each unit ('classroom') in the ECEC centers. Prior to child
assessments, fieldworkers spent time playing and getting to know the children by visiting their
classrooms. Child assessment took place in a vacant room in the ECEC center, accompanied by a
caregiver familiar to the child. The caregivers were instructed not to assist the children in solving
the tasks, but to make sure the children felt relaxed and secure. Resource limitations necessitated
that multiple children were assessed per visit, inducing some variance in children's test age -
ranging from 31 months to 43 months (M = 35.2, SD = 2.3). Children's exact ages were recorded
at assessment. Background information was collected through structured interviews with
participants’ mothers, fathers or both - by trained research assistants in the ECEC centers during
a weekday. Information on which parent was present during the interview was not recorded.
Measures
Cognitive outcomes. Cognitive ability was measured with two subtests from the British
Ability Scales 3 (BAS 3) (Elliot & Smith, 2011) test battery, one verbal and one non-verbal.
Verbal ability was measured with the 'naming vocabulary' subtest, where participants were
shown a selection of picture cards, one at a time, and asked to name the depicted objects. Non-
verbal cognitive ability was measured with the 'picture similarities' subtest, where participants
This version of the article has been accepted for publication by Taylor and Francis in
EECERJ Volume 26 Issue 1, 2018
10
were shown a series of picture cards and asked to place their respective cards on top of one out
four possible alternative slots on a board. Only one slot shared a relationship with the
participant's card, and the subtest measured the children's abilities to make logical inferences.
The two tests were given in random order to avoid systematic bias related to limited
concentration spans or mild fatigue over time. On both subtests, correct answers gave one point,
while incorrect answers or no answer were scored as zero. Subsequently, raw scores were
converted to standardized scores (called ability scores) in accordance with the scoring rules of
BAS 3. These ability scores served as our two cognitive outcomes.
ECEC quality. Quality ratings were conducted observationally and measured with the
Infant/Toddler Environment Rating Scale-Revised (ITERS-R) tool (Harms, Cryer, & Clifford,
2003). In its entirety, the scale comprises 39 items that are grouped into the following subscales:
1) Space and furnishings, 2) Personal care routines, 3) Listening and talking, 4) Activities, 5)
Interaction, 6) Program structure, and 7) Parents and staff. The seven subscales are intended to
represent different dimensions of quality for infants and toddlers in ECEC. The dimensionality of
the instrument, however, has been contested, as factor analyses have indicated that ITERS-R
better describes one global quality dimension instead of seven distinct dimensions (Bisceglia,
Perlmana, Schaackb, & Jenkinsa, 2009). As a consequence, we collapsed the subscales into a
total ECEC quality index by computing the mean of the individual items. The calculation was
performed on a subset of the ITERS-R scale, consisting of the first 32 items from subscales 1-6,
with items from the seventh (7. Parents and staff) omitted (information on subscale 7 was not
collected by the BePro / GoBaN projected, as it does not measure facilities for children).
Possible values spanned from 1 (lowest quality) to 7 (highest quality). All raters received
This version of the article has been accepted for publication by Taylor and Francis in
EECERJ Volume 26 Issue 1, 2018
11
training from ITERS-R-certified researchers. Inter-rater reliability was high (≥ 80%), and
ratings were conducted in accordance with Harms et al. (2003).
Socioeconomic background and covariates. Information about socioeconomic
background factors and covariates came mostly from the parent interview. Income was defined
as the gross annual income of the household, and reported in Norwegian currency (NOK; 1 NOK
= 0.11 Euro). Thirty-two families reported an annual income above the 95th percentile, while 38
families reported income levels below the 5th percentile - these were treated as outliers. Parents’
educational levels were reported in the categories: 1) up to minimum compulsory education, 2)
post-secondary vocational school, 3) post-secondary education, 4) bachelor's degree or lower
university degree, 5) master's degree or higher university degree, and 6) other; the 'other'
category (52 cases) was omitted from analysis because of its non-linear relationship with the
preceding categories. From the provided information on maternal and paternal educational
attainment, we created the composite measure ‘highest attained education in the family’. Parents
also provided information on weekly work hours, ethnicity (subsequently dichotomized as
whether or not they were Norwegian), children’s age at entry into ECEC, number of siblings,
birth weight, and how often they read and played numbers games with their children. Center
locations (municipalities) are referred to as ‘sites’ in the tables and listed in random order to
preserve region anonymity.
Two additional variables were obtained through a combination of sources: gender was
derived from the provided national identification number of the participating child, and
children’s age at cognitive assessment was calculated from birth date information and reported
date of assessment.
This version of the article has been accepted for publication by Taylor and Francis in
EECERJ Volume 26 Issue 1, 2018
12
Statistical Approach
Prior to conducting the statistical analyses, we made several adjustments to the data.
First, we standardized the cognitive outcome variables to z-scores in order to ease interpretability
and comparability of the estimated regression coefficients (B). As a result, the reported
regression coefficients represent the predicted standard deviation difference in cognitive
performance given a one unit increase in the independent variable of interest. Second, we limited
the influence of outliers by winsorization - replacing extreme values with more probable values
relative to the sample distribution (see Ghosh & Vogt, 2012). Values above the 95th percentile
were therefore replaced with the 95th percentile, and similarly, values below the 5th percentile
were replaced with the 5th percentile. Last, we dealt with the issue of missing data. Although
most of the collected data were complete, information on income was a notable exception - with
12.5% missing values. To try to correct for this, we used regression imputation to estimate the
most likely income levels for the missing cases based on other information provided, such as
maternal and paternal education.
Following these data adjustments, we tested our research hypotheses by performing a
series of ordinary least squares (OLS) multiple regression models. To account for the possibility
of within-cluster correlated errors, resulting from children being grouped together in ECEC
centers and thus producing too narrow confidence intervals (see Cameron & Miller, 2015), we
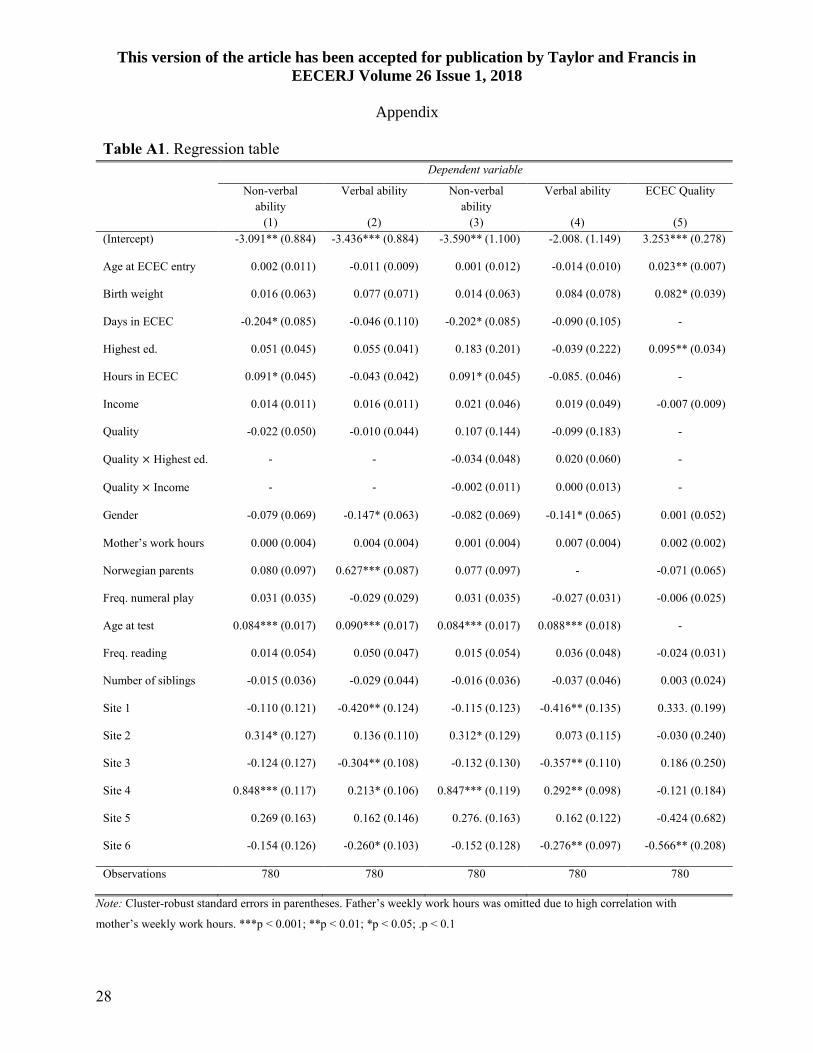
reported cluster-robust standard errors - on center level. In total, we estimated four regression
models. The first model (Table A1: model 1) tested the hypothesis that children's non-verbal
ability at age 3 years varied as a function of center quality. The model was fitted by regressing
non-verbal ability scores on ECEC center quality ratings (ITERS-R score), while controlling for
family background factors; age at time of test; and other covariates (listed under Measures).
This version of the article has been accepted for publication by Taylor and Francis in
EECERJ Volume 26 Issue 1, 2018
13
Similarly, the second model (Table A1: model 2) tested the hypothesis that verbal cognitive
ability at age 3 years varied as a function of ECEC center quality, and was fitted by regressing
verbal performance scores on ECEC quality rating and the aforementioned covariates. Thus, both
models differed only in outcome measure, while containing the same set of independent
variables.
Further, we assessed whether the association between ECEC quality and cognitive ability
at age three was moderated by family income and education, by including two-way interaction
terms (𝐸𝐶𝐸𝐶 𝑞𝑢𝑎𝑙𝑖𝑡𝑦 × 𝑖𝑛𝑐𝑜𝑚𝑒, & 𝐸𝐶𝐸𝐶 𝑞𝑢𝑎𝑙𝑖𝑡𝑦 × ℎ𝑖𝑔ℎ𝑒𝑠𝑡 𝑒𝑑𝑢𝑐𝑎𝑡𝑖𝑜𝑛𝑎𝑙 𝑎𝑡𝑡𝑎𝑖𝑛𝑚𝑒𝑛𝑡) in
the regression models (Table A1: model 3 & 4). These interactions were also inspected visually
from Figure 1A-B and Fig. 2A-B, which show the estimated associations between ECEC quality
and cognitive performance at age three (y-axis) across children from different family
backgrounds pertaining to income level and educational attainment (x-axis).
Finally, we considered the potential influence of selection bias. Systematic differences in
parental preferences for ECEC centers based on specific characteristics could result in some
children gaining access to higher quality care than other children as a result of their family
background. We therefore addressed this issue in our last model (Table A1: model 5) by
regressing ECEC quality on variables that might be related to either parental choices,
background or child characteristics. The model predictors included: family income; highest
attained education in the family; parental ethnicity; number of children in the family; maternal
work hours; reading frequency; child gender; child enrollment age; and child birth weight.
Results
This version of the article has been accepted for publication by Taylor and Francis in
EECERJ Volume 26 Issue 1, 2018
14
A substantial proportion of the children in the study came from families with an annual income
level close to the population median for families with 0-6 year olds (𝑀𝑒𝑑𝑖𝑎𝑛 =
1,000,000 𝑁𝑂𝐾 [𝑔𝑟𝑜𝑠𝑠] − 𝑒𝑞𝑢𝑖𝑣𝑎𝑙𝑒𝑛𝑡 𝑡𝑜 111,039 𝐸𝑢𝑟𝑜𝑠, 𝑆𝐷 = 370,306 𝑁𝑂𝐾 −
𝑒𝑞𝑢𝑖𝑣𝑎𝑙𝑒𝑛𝑡 𝑡𝑜 41,118 𝐸𝑢𝑟𝑜𝑠) (Statistics Norway, 2014). Yet, educational levels among parents
were high, with a majority (84.2%) coming from families with at least one parent having attained
university level education. Nearly all children (92.1%) attended ECEC full-time (𝑀 =
7.3 ℎ𝑜𝑢𝑟𝑠/𝑑𝑎𝑦, 𝑚𝑖𝑛 = 4 ℎ𝑜𝑢𝑟𝑠, 𝑚𝑎𝑥 = 9 ℎ𝑜𝑢𝑟𝑠, 𝑆𝐷 = 0.85 ℎ𝑜𝑢𝑟𝑠) and were enrolled in
centers of varying quality - ranging mostly between 'minimal' and 'good' (𝑀 = 3.98, 𝑆𝐷 =
0.76, 𝑚𝑖𝑛 = 1.65, 𝑚𝑎𝑥 = 5.9). During ECEC, the children were assessed on two cognitive
outcomes - one verbal (𝑀 = 93.8, 𝑆𝐷 = 20.87), and one non-verbal (𝑀 = 78.55, 𝑆𝐷 =
11.43). Performance on these assessments indicated that the outcomes were only modestly
correlated (𝑟 = 0.33, 𝑝 < 0.001), reflecting the different aspects of cognitive development
they are intended to measure. (A full list of descriptive statistics for all variables are displayed in
Table 1).
Table 1. Descriptive statistics of all model variables.
Variables N Min Max Mean SD
Cognitive Outcomes:
Non-verbal ability score 798 25 133 78.52 11.48
Verbal ability score 789 10 140 93.83 21.09
Observed ECEC Quality Rating:
ITERS-R score 800 1.65 5.9 3.98 0.76
Parent-reported SES Variables:
Highest attained ed. in the family 787 0 5 3.18 0.93
Income (in 100K NOK) 795* 3.2 18 10 3.63
Mother’s weekly work hrs. 800 0 55 30.99 13.27
This version of the article has been accepted for publication by Taylor and Francis in
EECERJ Volume 26 Issue 1, 2018
15
Father’s weekly work hrs. 800 0 75 36.45 11.93
Parent-reported Child Variables:
Freq. letter play 800 0 5 1.80 1.54
Freq. numeral play 800 0 5 3.22 1.12
Freq. reading 800 0 5 2.9 0.79
Number of siblings 800 0 5 1.07 0.90
Days in ECEC pr. week 798 3 5 4.91 0.33
Hours in ECEC pr. day 798 4 9 7.30 0.85
Birth weight (in kg.) 800 1.25 4.9 3.5 0.54
Age at ECEC entry 800 6 36 14.78 3.86
Additional Covariates:
Child’s age at assessment 800 31.08 42.84 35.26 2.29
Child’s gender (male = 1) 800 0.506 0.5 0 1
* = 12.5% of the cases in income were imputed.
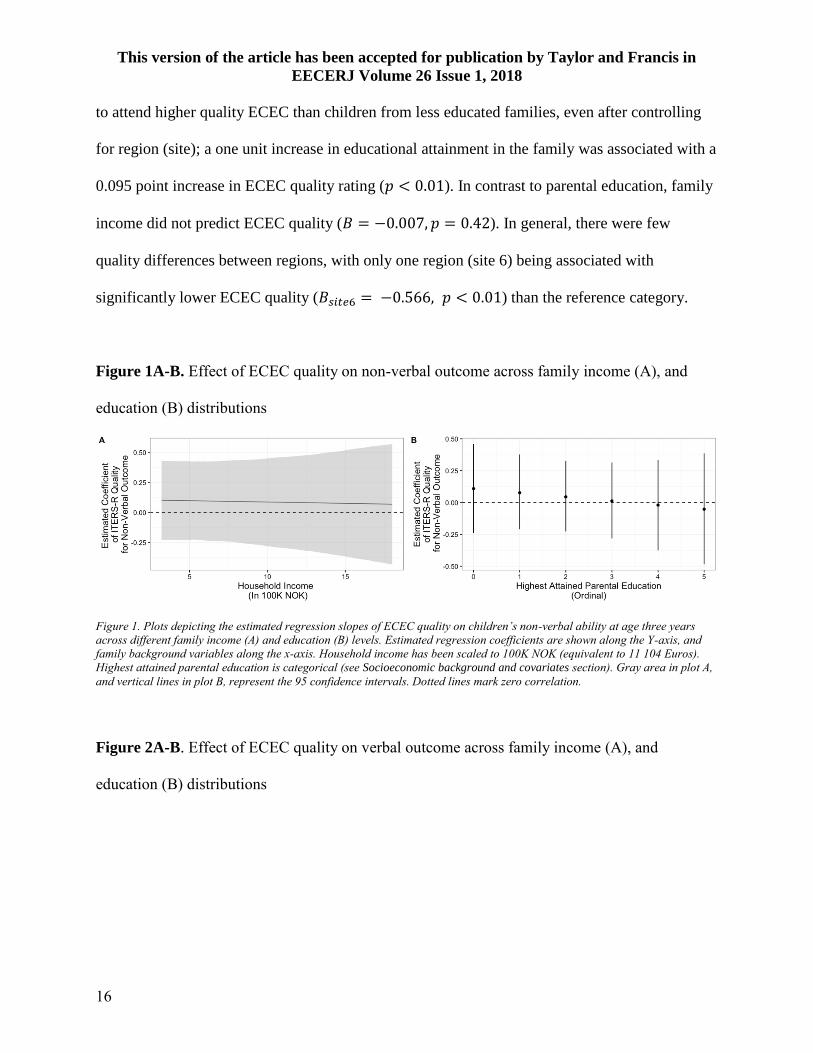
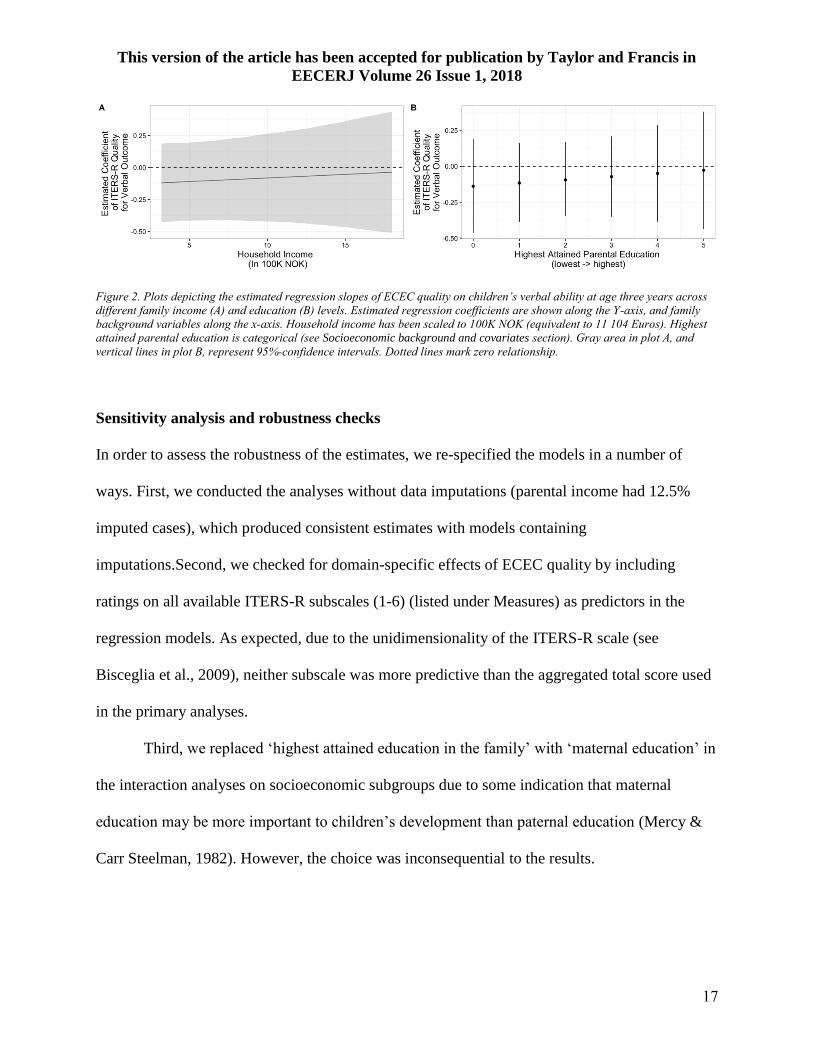
Examining the relationship between ECEC quality and children's cognitive development
at age three, we found that cognitive performance did not vary as a function of ECEC quality
after adjusting for covariates in the regression models (Table A1: model 1 & 2). This was true for
both cognitive outcomes, as ECEC quality did not predict either verbal performance (𝐵 =
−0.01 𝑝 = 0.814) or non-verbal performance (𝐵 = −0.022, 𝑝 = 0.657) at age three. The
same pattern was found consistently between different socioeconomic subgroups, since the
relationship between ECEC quality and cognitive development did not vary significantly across
parental income (Figure 1A & Figure 2A) or education (Figure 1B & Figure 2B) distributions.
Consequently, both the hypothesis that cognitive performance at age three was associated with
ECEC center quality, and that this association was moderated by parental income and education,
were therefore rejected.
To assess the possibility of the results being affected by selection bias, we also examined
the relationship between family background factors, region and ECEC center quality ratings
(Table A1: model 5). The results show that children with well-educated parents were more likely
This version of the article has been accepted for publication by Taylor and Francis in
EECERJ Volume 26 Issue 1, 2018
16
to attend higher quality ECEC than children from less educated families, even after controlling
for region (site); a one unit increase in educational attainment in the family was associated with a
0.095 point increase in ECEC quality rating (𝑝 < 0.01). In contrast to parental education, family
income did not predict ECEC quality (𝐵 = −0.007, 𝑝 = 0.42). In general, there were few
quality differences between regions, with only one region (site 6) being associated with
significantly lower ECEC quality (𝐵𝑠𝑖𝑡𝑒6 = −0.566, 𝑝 < 0.01) than the reference category.
Figure 1A-B. Effect of ECEC quality on non-verbal outcome across family income (A), and
education (B) distributions
Figure 1. Plots depicting the estimated regression slopes of ECEC quality on children’s non-verbal ability at age three years
across different family income (A) and education (B) levels. Estimated regression coefficients are shown along the Y-axis, and
family background variables along the x-axis. Household income has been scaled to 100K NOK (equivalent to 11 104 Euros).
Highest attained parental education is categorical (see Socioeconomic background and covariates section). Gray area in plot A,
and vertical lines in plot B, represent the 95 confidence intervals. Dotted lines mark zero correlation.
Figure 2A-B. Effect of ECEC quality on verbal outcome across family income (A), and
education (B) distributions
This version of the article has been accepted for publication by Taylor and Francis in
EECERJ Volume 26 Issue 1, 2018
17
Figure 2. Plots depicting the estimated regression slopes of ECEC quality on children’s verbal ability at age three years across
different family income (A) and education (B) levels. Estimated regression coefficients are shown along the Y-axis, and family
background variables along the x-axis. Household income has been scaled to 100K NOK (equivalent to 11 104 Euros). Highest
attained parental education is categorical (see Socioeconomic background and covariates section). Gray area in plot A, and
vertical lines in plot B, represent 95%-confidence intervals. Dotted lines mark zero relationship.
Sensitivity analysis and robustness checks
In order to assess the robustness of the estimates, we re-specified the models in a number of
ways. First, we conducted the analyses without data imputations (parental income had 12.5%
imputed cases), which produced consistent estimates with models containing
imputations.Second, we checked for domain-specific effects of ECEC quality by including
ratings on all available ITERS-R subscales (1-6) (listed under Measures) as predictors in the
regression models. As expected, due to the unidimensionality of the ITERS-R scale (see
Bisceglia et al., 2009), neither subscale was more predictive than the aggregated total score used
in the primary analyses.
Third, we replaced ‘highest attained education in the family’ with ‘maternal education’ in
the interaction analyses on socioeconomic subgroups due to some indication that maternal
education may be more important to children’s development than paternal education (Mercy &
Carr Steelman, 1982). However, the choice was inconsequential to the results.
This version of the article has been accepted for publication by Taylor and Francis in
EECERJ Volume 26 Issue 1, 2018
18
Fourth, we assessed whether the relationship between ECEC quality and cognitive ability
was dose-dependent (𝑄𝑢𝑎𝑙𝑖𝑡𝑦 × 𝐻𝑜𝑢𝑟𝑠 𝑖𝑛 𝐸𝐶𝐸𝐶 𝑝𝑒𝑟 𝑑𝑎𝑦), but the effect of quality was absent
regardless of how many hours the children spent in ECEC (in the range 4-9 hours).
Last, we took into account that there was some – albeit limited - indication of regional
differences in level of ECEC quality provided for the children. As a final robustness check, we
therefore tested whether the effect of quality on verbal and non-verbal ability differed depending
on region (𝑄𝑢𝑎𝑙𝑖𝑡𝑦 × 𝑆𝑖𝑡𝑒𝑠), but it did not.
Discussion
In this study of ECEC quality and cognitive development, we found no evidence that verbal
or non-verbal abilities at age three are associated with ECEC quality. Nor did we find that
socioeconomic background moderates the relationship, as there was no association between
ECEC quality and the cognitive outcomes for either advantaged (high SES) or disadvantaged
(low SES) children. Because previous studies in other countries have typically reported small but
significant associations between ECEC quality and cognitive development (see Burchinal et al.,
2011), the current null findings may reflect contextual differences between the present and
previous research.
One explanation for the discrepancy may be that the children in this study were sufficiently
stimulated at home, and that ECEC quality did little to further advance their development. Many
of the parents were highly educated, middle class workers, with access to substantial welfare
benefits - all of which are factors that may contribute positively to children's home-
environments. As such, their children may have been particularly robust. However, 7% of the
sample also consisted of children coming from disadvantaged (low income) families, which were
hypothesized to be more strongly associated with effects of ECEC quality. This hypothesis was
This version of the article has been accepted for publication by Taylor and Francis in
EECERJ Volume 26 Issue 1, 2018
19
partly based on earlier studies indicating that most of the positive effect of attending Norwegian
ECEC can be attributed to children of uneducated mothers (Havnes & Mogstad, 2011) -
suggesting that disadvantaged children do not have equally stimulating home environments as
their advantaged peers. The lack of association between ECEC quality and cognitive
development across socioeconomic subgroups in the sample is therefore hard to explain.
Possibly, the range of ECEC quality in the study centers may have been too narrow, in the
sense that the centers did not offer something substantially different from each other. As noted
by Hatfield et al. (2016), much of the effect of ECEC quality may stem from exposure to the
upper range of the quality spectrum, suggesting that the association between ECEC quality and
cognitive outcomes may best be modeled non-linearly. However, we were unable to reproduce
this in our study, as no signs of nonlinearities were present – although this may also be a
reflection of the relatively modest number of high quality centers in the sample.
Another explanation for why we could not find an effect of ECEC quality relates to the
quality measure itself - ITERS-R. ITERS-R is primarily a measure of structural quality, and
while structural quality may be easier to measure, process quality may be more likely to be
predictive of cognitive outcomes. Furthermore, there has not been conducted any validation
studies of the scale in Norway, where the pedagogical approach to early education is somewhat
different from the context in which it originated. For example, free and uninterrupted play (i.e.
low levels of adult engagement during free play), and high levels of child involvement are often
considered to be hallmarks of Norwegian ECEC (Norwegian Ministry of Research and
Education, 2013). Thus, it may very well be the case that aspects of the Norwegian ECEC
pedagogy that potentially relates most strongly to cognitive development are not measured
appropriately by ITERS-R. Consequently, although the participating children were exposed to a
This version of the article has been accepted for publication by Taylor and Francis in
EECERJ Volume 26 Issue 1, 2018
20
range of different ECEC settings according to ITERS-R, these ECEC settings may nevertheless
not have differed substantially in ways that were important to the children's cognitive
development.
The present study’s failure to find an effect of ECEC quality emphasizes the difficulty of
modeling complex relationships between cognitive development and ECEC settings based on
observed quality measures. Nevertheless, it is our hope that the insights gained from this study
may help steer future studies towards research designs that are increasingly able to further assess
this important topic.
A notable limitation of the study is that it is based on observational (non-experimental)
data. Although steps were taken to account for some plausible sources of bias, conditioning on
covariates is unlikely to fully satisfy the ignorability assumption (Morgan & Winship, 2007).
Furthermore, the data were also cross-sectional - leaving out the possibility of tracking cognitive
abilities over time. Accordingly, children’s cognitive development had to be deduced from their
abilities at age 3 years. As such, in the absence of pre-test measures, developmental trajectories
between time of ECEC entry and age three years could not be isolated. Obtaining such pre-test
measures, however, would ultimately be infeasible, as most of the participating children were
enrolled around infancy
Finally, it is worth considering the external validity (generalizability) of the study.
Although educational levels in Norway are relatively high, the proportion of parents with
university level education in the sample was twice the Norwegian average (Statistics Norway,
2015). This may in part be because sampling was restricted to centers located in close proximity
to universities (mostly residing in urban areas), where educational levels are expectedly higher.
However, it could also be an artefact of the parental recruitment process, given that highly
This version of the article has been accepted for publication by Taylor and Francis in
EECERJ Volume 26 Issue 1, 2018
21
educated parents may be more likely to accept the offer to participate in the study. Whatever the
cause, generalizability to other populations may be limited.
Conclusion
In summary, we found ECEC quality - as measured by ITERS-R - not to be associated
with children's cognitive development at age three years in a context of near universal access to
ECEC. Furthermore, we found no evidence supporting the hypothesis that children from low
SES backgrounds gain more from ECEC quality than their comparatively advantaged peers.
This version of the article has been accepted for publication by Taylor and Francis in
EECERJ Volume 26 Issue 1, 2018
22
References
Auger, A., Farkas, G., & Burchinal, M. R. (2014). Preschool Center Care Quality Effects on
Academic Achievement: An Instrumental Variables Analysis. Developmental
Psychology, 50(12), 2559-2571. http://doi.org/10.1037/a0037995
Barnett, W. S. (2011). Effectiveness of Early Educational Intervention. Science, 333(6045), 975-
978. http://doi.org/10.1126/science.1204534
Bisceglia, R., Perlmana, M., Schaackb, D., & Jenkinsa, J. (2009). Examining the psychometric
properties of the Infant-Toddler Environment Rating Scale-Revised Edition in a high-
stakes context. Early Childhood Research Quarterly, 24(2), 121-132.
http://doi.org/10.1016/j.ecresq.2009.02.001
Bradly, R. H., & Corwyn, R. F. (2002). Socioeconomic Status and Child Development. Annual
Review of Psychology, 53, 371-399.
http://doi.org/10.1146/annurev.psych.53.100901.135233
Burchinal, M. R., Kainz, K., & Cai, Y. (2011). How well do our measures of quality predict
child outcomes? A meta-analysis and coordinated analysis of data from large-scale
studies of early childhood settings. Quality measurement in early childhood settings, 11.
Burchinal, M. R., Zaslow, M., & Tarullo, L. (2016). Quality Thresholds, Features, and Dosage
in Early Care and Education: Secondary Data Analyses of Child Outcomes (Vol. 81).
Wiley-Blackwell.
Cameron, A. C., & Miller, D. L. (2015). A Practitioner's Guide to Cluster-Robust Inference.
Journal of Human Resources, 50(2), 317-372. http://doi.org/10.3368/jhr.50.2.317
This version of the article has been accepted for publication by Taylor and Francis in
EECERJ Volume 26 Issue 1, 2018
23
Camilli, G., Vargas, S., Ryan, S., & Barnett, W. S. (2010). Meta-Analysis of the Effects of Early
Education Interventions on Cognitive and Social Development. Teachers College
Record, 112(3), 579-620.
Ceci, S. J., & Papierno, P. B. (2005). The Rhetoric and Reality of Gap Closing: When the "Have-
Nots" Gain but the "Haves" Gain Even More. American Psychologist, 60(2), 149-160.
http://doi.org/10.1037/0003-066X.60.2.149
Dearing, E., & McCartney, K. (2009). Does Higher Quality Early Child Care Promote Low-
Income Children's Math and Reading Achievement in Middle Childhood? Child
Development, 80(5), 1329-1349. http://doi.org/10.1111/j.1467-8624.2009.01336.x
Duncan, G. J., & Magnuson, K. (2013). Investing in Preschool Programs. The Journal of
Economic Perspectives, 27(2), 109-132. http://doi.org/10.1257/jep.27.2.109
Elliot, C. D., & Smith, P. (2011). British Ability Scales - Third Edition (BAS-3): London: GL
Assessment Limited.
Ghosh, D., & Vogt, A. (2012, 2012). Outliers: An evaluation of methodologies. Paper presented
at the Joint Statistical Meetings, San Diego, CA.
Gulbrandsen, L., & Eliassen, E. (2013). Kvalitet i barnehager - rapport av strukturell kvalitet
høsten 2012.
Hackman, D. A., & Farah, M. J. (2009). Socioeconomic status and the developing brain. Trends
in Cognitive Sciences, 13(2), 65-73. http://doi.org/10.1016/j.tics.2008.11.003
Harms, T., Cryer, D., & Clifford, R. M. (2003). Infant/Toddler Environment Rating Scale -
Revised: New York: Teachers College Press.
Hatfield, B. E., Burchinal, M. R., Piantac, R. C., & Sideris, J. (2016). Thresholds in the
association between quality of teacher--child interactions and preschool children's school
This version of the article has been accepted for publication by Taylor and Francis in
EECERJ Volume 26 Issue 1, 2018
24
readiness skills. Early Childhood Research Quarterly, 36, 561-571.
http://doi.org/10.1016/j.ecresq.2015.09.005
Havnes, T., & Mogstad, M. (2011). No Child Left Behind -- Subsidized Child Care and
Children's Long-Run Outcomes. American Economic Journal: Economic Policy, 3(2),
97-129. http://doi.org/10.1257/pol.3.2.97
Haworth, C. M. A., Wright, M. J., Luciano, M., Martin, N. G., de Geus, E. J. C., van
Beijsterveldt, C. E. M., . . . Plomin, R. (2010). The heritability of general cognitive ability
increases linearly from childhood to young adulthood. Molecular Psychiatry, 15, 1112-
1120. http://doi.org/10.1038/mp.2009.55
Heckman, J. J. (2006). Skill formation and the economics of investing in disadvantaged children.
Science, 312(5782), 1900-1902. http://doi.org/10.1126/science.1128898
Keys, T. D., Farkas, G. F., Burchinal, M. R., Duncan, G. J., Vandell, D. L., Li, W., . . . Howees,
C. (2013). Preschool Center Quality and School Readiness: Quality Effects and Variation
by Demographic and Child Characteristics. Child Development, 84(4), 1171-1190.
http://doi.org/10.1111/cdev.12048
Knudsen, E. I., Heckman, J. J., Cameron, J. L., & Shonkoff, J. P. (2006). Economic,
Neurobiological and Behavioral Perspectives on Building America's Future Workforce.
Proceedings of the National Academy of Sciences, 103(27), 10155-10162.
http://doi.org/10.1073/pnas.0600888103
Leseman, P. P., & Slot, P., L. (2014). Breaking the cycle of poverty: challenges for European
early childhood education and care. European Early Childhood Education Research
Journal, 22(3), 314-326. http://doi.org/10.1080/1350293X.2014.912894
This version of the article has been accepted for publication by Taylor and Francis in
EECERJ Volume 26 Issue 1, 2018
25
Magnuson, K. A., & Shager, H. (2010). Early education: Progress and promise for children from
low-income families. Children and Youth Services Review, 32(9), 1186-1198.
http://doi.org/10.1016/j.childyouth.2010.03.006
Mercy, J. A., & Carr Steelman, L. (1982). Familial Influence on the Intellectual Attainment of
Children. American Sociological Review, 47(4), 532-542.
Morgan, S. L., & Winship, C. (2007). Counterfactuals and Causal Inference. New York:
Cambridge University Press.
NICHD, & Duncan, G. J. (2003). Modeling the Impacts of Child Care Quality on Children's
Preschool Cognitive Development. Child Development, 74(5), 1454-1475.
http://doi.org/10.1111/1467-8624.00617
Norwegian Ministry of Education and Research. (2005). Act no. 64 of June 2005 relating to
Kindergartens (the Kindergarten Act).
Norwegian Ministry of Education and Research. (2011). Framework Plan for the Content and
Tasks of Kindergartens.
Norwegian Ministry of Education and Research. (2016a). Finansiering av barnehager.
Retrieved from https://www.regjeringen.no/no/tema/familie-og-
barn/barnehager/innsikt/finansiering-av-barnehager/id2344788/
Norwegian Ministry of Education and Research. (2016b). Fylkesmannen kan føre tilsyn med
barnehager.
Norwegian Ministry of Research and Education. (2013). Meld. St. 24 (2012–2013) - Framtidens
barnehage. Retrieved from
https://www.regjeringen.no/contentassets/2e8ad98938b74226bc7ff395839434be/no/pdfs/
stm201220130024000dddpdfs.pdf
This version of the article has been accepted for publication by Taylor and Francis in
EECERJ Volume 26 Issue 1, 2018
26
OECD. (2012). Starting Strong III: A Quality Toolbox for Early Childhood Education and Care.
OECD Publishing.
OECD. (2015). PF3.2: Enrolment in childcare and pre-school.
Shonkoff, J. P., & Phillips, D. A. (2000). From neurons to neighborhoods: The science of early
childhood development. National Academies Press.
Sibley, E., Dearing, E., Toppelberg, C. O., Mykletun, A., & Zachrisson, H. D. (2015). Do
increased availability and reduced cost of early childhood care and education narrow
social inequality gaps in utilization? Evidence from Norway. International Journal of
Child Care and Education Policy, 9(1). http://doi.org/10.1007/s40723-014-0004-5
Statistics Norway. (2014). Inntekts- og formuesstatistikk for husholdninger, 2014. Retrieved
from http://www.ssb.no/inntekt-og-forbruk/statistikker/ifhus/aar/2015-12-16
Statistics Norway. (2015). Befolkningens utdanningsnivå, 1. oktober 2015.
Statistics Norway. (2016). Barnehager, 2015, endelige tall. Retrieved from
http://www.ssb.no/utdanning/statistikker/barnehager/aar-endelige/2016-04-20
Sylva, K., Melhuish, E., Sammons, P., Siraj-Blatchford, I., & Taggart, B. (2011). Pre-school
quality and educational outcomes at age 11: Low quality has little benefit. Journal of
Early Childhood Research, 9(2), 109–124. https://doi.org/10.1177/1476718X10387900
Sylva, K., Melhuish, E. C., Siraj-Blatchford, P. S. I., & Taggart, B. (2004). The Effective
Provision of Pre-School Education (EPPE) Project Technical Paper 12: The Final
Report-Effective Pre-School Education: Institute of Education, University of
London/Department for Education and Skills.
The Norwegian Directorate for Education and Training. (2016a). Facts and analyses of
kindergartens, primary and secondary education in Norway. Retrieved from
This version of the article has been accepted for publication by Taylor and Francis in
EECERJ Volume 26 Issue 1, 2018
27
http://utdanningsspeilet.udir.no/2016/wp-
content/uploads/2016/10/Utdanningsspeilet_2016_en.pdf
The Norwegian Directorate for Education and Training. (2016b). Foreldrebetaling. Retrieved
from https://www.udir.no/regelverk-og-tilsyn/barnehage/foreldrebetaling/
Zachrisson, H. D., Janson, H., & Nærde, A. (2013). Predicting early center care utilization in a
context of universal access. Early Childhood Research Quarterly, 28(1), 74-82.
http://doi.org/10.1016/j.ecresq.2012.06.004
This version of the article has been accepted for publication by Taylor and Francis in
EECERJ Volume 26 Issue 1, 2018
28
Appendix
Table A1. Regression table
Dependent variable
Non-verbal
ability
Verbal ability Non-verbal
ability
Verbal ability ECEC Quality
(1) (2) (3) (4) (5)
(Intercept) -3.091** (0.884) -3.436*** (0.884) -3.590** (1.100) -2.008. (1.149) 3.253*** (0.278)
Age at ECEC entry 0.002 (0.011) -0.011 (0.009) 0.001 (0.012) -0.014 (0.010) 0.023** (0.007)
Birth weight 0.016 (0.063) 0.077 (0.071) 0.014 (0.063) 0.084 (0.078) 0.082* (0.039)
Days in ECEC -0.204* (0.085) -0.046 (0.110) -0.202* (0.085) -0.090 (0.105) -
Highest ed. 0.051 (0.045) 0.055 (0.041) 0.183 (0.201) -0.039 (0.222) 0.095** (0.034)
Hours in ECEC 0.091* (0.045) -0.043 (0.042) 0.091* (0.045) -0.085. (0.046) -
Income 0.014 (0.011) 0.016 (0.011) 0.021 (0.046) 0.019 (0.049) -0.007 (0.009)
Quality -0.022 (0.050) -0.010 (0.044) 0.107 (0.144) -0.099 (0.183) -
Quality × Highest ed. - - -0.034 (0.048) 0.020 (0.060) -
Quality × Income - - -0.002 (0.011) 0.000 (0.013) -
Gender -0.079 (0.069) -0.147* (0.063) -0.082 (0.069) -0.141* (0.065) 0.001 (0.052)
Mother’s work hours 0.000 (0.004) 0.004 (0.004) 0.001 (0.004) 0.007 (0.004) 0.002 (0.002)
Norwegian parents 0.080 (0.097) 0.627*** (0.087) 0.077 (0.097) - -0.071 (0.065)
Freq. numeral play 0.031 (0.035) -0.029 (0.029) 0.031 (0.035) -0.027 (0.031) -0.006 (0.025)
Age at test 0.084*** (0.017) 0.090*** (0.017) 0.084*** (0.017) 0.088*** (0.018) -
Freq. reading 0.014 (0.054) 0.050 (0.047) 0.015 (0.054) 0.036 (0.048) -0.024 (0.031)
Number of siblings -0.015 (0.036) -0.029 (0.044) -0.016 (0.036) -0.037 (0.046) 0.003 (0.024)
Site 1 -0.110 (0.121) -0.420** (0.124) -0.115 (0.123) -0.416** (0.135) 0.333. (0.199)
Site 2 0.314* (0.127) 0.136 (0.110) 0.312* (0.129) 0.073 (0.115) -0.030 (0.240)
Site 3 -0.124 (0.127) -0.304** (0.108) -0.132 (0.130) -0.357** (0.110) 0.186 (0.250)
Site 4 0.848*** (0.117) 0.213* (0.106) 0.847*** (0.119) 0.292** (0.098) -0.121 (0.184)
Site 5 0.269 (0.163) 0.162 (0.146) 0.276. (0.163) 0.162 (0.122) -0.424 (0.682)
Site 6 -0.154 (0.126) -0.260* (0.103) -0.152 (0.128) -0.276** (0.097) -0.566** (0.208)
Observations 780 780 780 780 780
Note: Cluster-robust standard errors in parentheses. Father’s weekly work hours was omitted due to high correlation with
mother’s weekly work hours. ***p < 0.001; **p < 0.01; *p < 0.05; .p < 0.1


![Gulbrandsen v. Summit Acres, Inc. · [Cite as Gulbrandsen v. Summit Acres, Inc., 2016-Ohio-1550.] IN THE COURT OF APPEALS OF OHIO FOURTH APPELLATE DISTRICT WASHINGTON COUNTY EVELINE](https://img.pdfslide.us/doc/110x75/5b30f9017f8b9ab5728bdf1c/gulbrandsen-v-summit-acres-inc-cite-as-gulbrandsen-v-summit-acres-inc.jpg)


![Eliassen-Palm Fluxes of the Diurnal Tides from the Whole ...[10] Calculating the Eliassen-Palm Flux (EP Flux), which computes zonal mean flow-wave interaction, allowed us to better](https://img.pdfslide.us/doc/110x75/5ea08c97a84be2525b4425e8/eliassen-palm-fluxes-of-the-diurnal-tides-from-the-whole-10-calculating-the.jpg)