Embed Size (px)
Citation preview
The Relationship between Prison Length of Stay and Recidivism -- This report was prepared by Abt Associates using Federal funding provided by the Bureau of Justice Statistics (BJS) Opinions andor points of view expressed are those of the author(s) and do not necessarily reflect the official position or policies of the US Department of Justice
This report was prepared by Abt Associates using Federal funding provided by the Bureau of Justice Statistics (BJS)
Document Title
Authors
Document Number
Date Received
Award Number
The Relationship between Prison Length of Stay and Recidivism A Study using Regression Discontinuity with Multiple Break Points
William Rhodes Consultant Gerald Gaes Florida State University Ryan Kling Abt Associates and Christopher Cutler Abt Associates
Ryan Kling is Principal Investigator and Christopher Cutler is the Project Director for this grant
251410
December 4 2017
2016-BJ-CX-K044
This BJS grant-funded report evaluates the relationship between prison length of stay and recidivism post-release It examines Federal sentencing structure to determine if increasing the length of prison terms increases or decreases recidivism and seeks to measure if the effect of increasing the length of prison differs across individuals
Opinions andor points of view expressed in this report are those of the author(s) and do not necessarily reflect the official position or policies of the US Department of Justice
1
The Relationship between Prison Length of Stay and Recidivism -- This report was prepared by Abt Associates using Federal funding provided by the Bureau of Justice Statistics (BJS) Opinions andor points of view expressed are those of the author(s) and do not necessarily reflect the official position or policies of the US Department of Justice
The Relationship between Prison Length of Stay and Recidivism A Study using Regression Discontinuity with Multiple Break Points
Imprisonment is an expensive sanction Justifying its use often rests partly on its presumed
utility to reduce post-release reoffending Most scholarship separates the research on imprisonment
effects into two subsets imprisonment in contrast to an alternative sanction and prison length of
stay (Nagin Cullen Jonson 2009 Smith Goggin and Gendreau 2002) If prison is expected to deter
offenders from future reoffending then how does it compare to a sentence of probation home
confinement or other alternative sanction Likewise if prison is chosen as a preferred sanction can a
deterrent effect of imprisonment be achieved with a shorter sentence
This paper capitalizes on federal sentencing structure to evaluate this latter question Does
increasing the length of prison increase or decrease recidivism Few studies of how prison length
affects recidivism meet rigorous experimental or quasi-experimental requirements (Nagin Cullen
and Jonson 2009) As of 2009 Nagin et al had identified two experiments and three matching
studies There have only been a few studies of length of stay using strong quasi-experimental designs
since the Nagin et al 2009 review We cover these in our literature review
A second goal of this study is to measure length of stay treatment heterogeneity Does the
effect of increasing the length of prison differ across individuals The federal sentencing structure
once again provides this opportunity Scholars have argued the effect of prison may depend on a
host of factors (Mears Cochran and Cullen 2014 Nagin Cullen and Jonson 2009 National Research
Council 2014) Nagin Cullen and Jonson (2009) propose that imprisonment effects may depend on
characteristics of the offender institution and sentence The National Academy of Sciences
reporting on the causes and consequences of mass incarceration (NRC 2014) discusses potential
variations in punishment effects that depend on characteristics of individuals social context and
units of analysis As an example the NAS report cites the research on the stigma of a criminal record
2
The Relationship between Prison Length of Stay and Recidivism -- This report was prepared by Abt Associates using Federal funding provided by the Bureau of Justice Statistics (BJS) Opinions andor points of view expressed are those of the author(s) and do not necessarily reflect the official position or policies of the US Department of Justice
on job seeking (Pager 2007 Pager and Quillian 2005) affecting black more than white applicants
Incarceration treatment heterogeneity is important because as the NRC report indicates unpacking
treatment effect dependence may lead to an explanation of why we observe outcome variations
across imprisonment studies found in all the systematic reviews (Nagin Cullen Jonson 2009 Smith
Goggin and Gendreau 2002 Villettaz Killias and Zoder 2006)
Identifying the Causal Relationship between Prison Length of Stay and Reoffending
As researchers have pointed out (Berube and Green 2007 Green and Winik 2010 Loeffler
2013 Loughran et al 2009 Nagin Cullen and Jonson 2009) estimating the causal relationship
between length of stay and reoffending raises validity challenges It seems plausible if not probable
that offenders receive long prison terms in part because they are likely to reoffend potentially
inducing a spurious positive correlation between prison length of stay and recidivism For example
prior criminal record is a good predictor of future offending and sentencing guidelines (when they
are used) When guidelines are absent judges typically take criminal records into account
sentencing offenders with criminal histories to serve longer terms than those with no or minimal
prior criminal justice contact Consequently even if estimated in a regression framework attempting
to control for confounders a partial correlation of time-served and recidivism may be uninformative
The research provided in this paper addresses this methodological concern about identification by
employing the logic of a regression discontinuity design (hereafter RDD) to rigorously identify the
causal relationship between time-served and recidivism The identification strategy rests on the
structure of guideline sentencing In the Nagin et al review these scholars anticipated the utility of
this approach ldquoDeterminant sentencing gridshellip may provide a quasi-experiment for constructing
the dose-response relationship between sentence length and reoffending (Nagin et al 2009 184)rdquo
Using a regression discontinuity design we find that lengthening a prison term does not increase
3
The Relationship between Prison Length of Stay and Recidivism -- This report was prepared by Abt Associates using Federal funding provided by the Bureau of Justice Statistics (BJS) Opinions andor points of view expressed are those of the author(s) and do not necessarily reflect the official position or policies of the US Department of Justice
recidivism In fact increasing the length of a prison term may reduce recidivism but if so the effect
is small
As we explain the US Sentencing Guidelines provide a structure for an RDD because
holding constant factors believed to affect recidivism the guidelines recommend longer or shorter
sentences for similar offenders based on offense factors that likely have nothing to do with an
offenderrsquos risk of recidivism Many methodologists consider RDD to be a close second-best
alternative to random assignment (Cook 2008 DiNardo amp Lee 2010 US Department of Education)
so this study provides a rigorous approach to answering the research question However while we
study whether longer prison terms affect recidivism more than do shorter terms except for criminal
history our data and design provide limited information about heterogeneity
THE PAROLE EFFECT
Roodman (2016) identifies a potential source of bias of imprisonment studies because of the
inextricable dependency of time served and parole supervision Parole agencies ldquocarve uprdquo a
sentence of imprisonment into that portion to be served in prison and the remainder to be served
under community supervision Even though parole terms can be shortened because of good
behavior the length of community supervision will depend on the prison term To the extent the
prison release date is delayed the period of supervision will be curtailed The opposite is also true
shorter prison terms lead to longer parole supervision terms Roodman argues that this means there
are two simultaneous treatments that cannot be disentangled Many studies find supervision
increases returns because of the closer surveillance and the added conditions of supervision (see for
example Gaes Bales and Skaggs 2016 comparing close community supervision monitoring to regular
probation) People with longer terms of community supervision have more time and therefore more
opportunity to be revoked and irrespective of any other imprisonment impact this artifact would
4
The Relationship between Prison Length of Stay and Recidivism -- This report was prepared by Abt Associates using Federal funding provided by the Bureau of Justice Statistics (BJS) Opinions andor points of view expressed are those of the author(s) and do not necessarily reflect the official position or policies of the US Department of Justice
bias shorter prison terms toward higher levels of recidivism and longer terms toward lower
recidivism This potential bias does not affect our study because everyone in the federal system is
given a post-release term of supervision separate from the prison term One term is independent of
the other Furthermore we censor observations when a term of supervision ends This removes the
potential artifact but it also means the recidivism results might be different if federal offenders were
released without supervision as is often the case in many state jurisdictions
THEORIES ON THE EFFECT OF IMPRISONMENT
Scholars have proposed alternative theories explaining the impact of imprisonment as having
either a criminogenic or a preventativedeterrent effect The criminogenic theories include a variant
of life course research highlighting the interruption of the normal stages of adult development a
prison induced strain theory a recognition that prison is a total institution and may socialize
offenders into an anti-normative lifestyle the possibility that prison are schools for crime and the
stigma attached to incarceration once the prisoner is released Preventative theories of
imprisonment cite mechanisms involving rehabilitation and specific deterrence We discuss both
below
CRIMINOGENIC THEORIES
Loeffler (2013) cites the life course literature (Horney Osgood Marshall 1995 Sampson and
Laub 1993 Western 2002) and discusses how prison delays the normal development of adults and
interrupts many of the stabilizing events such as marriage employment and education that might
otherwise promote prosocial development Prison strain has been studied by Listwan Sullivan
Agnew Cullen and Colvin (2013) Using survey methods they examined prison deprivations and
victimization aspects of prison strain on recidivism finding evidence of a relationship between strain
variables and recidivism in the predicted direction Early ethnographers emphasize strain by
5
The Relationship between Prison Length of Stay and Recidivism -- This report was prepared by Abt Associates using Federal funding provided by the Bureau of Justice Statistics (BJS) Opinions andor points of view expressed are those of the author(s) and do not necessarily reflect the official position or policies of the US Department of Justice
recounting the pains of imprisonment However these same ethnographers also emphasize prison
socialization This scholarship includes classic ethnographies of prison life such as Sykesrsquo Society of
Captives A Study of a Maximum Security Prison (1958) and Clemmerrsquos The Prison Community (1940)
Clemmer and Sykes provided a framework for studying inmate society and culture emphasizing the
nature of prison as a total institution in which separation from the community and the relationship
between inmates and guards redefine roles rules and personal identities Later ethnographies by
Carroll (1988) Jacobs (1977) Goffman (1961) Irwin (2009) Owen (1998) and Fleisher (1989) all
emphasize the strains deriving from both prison conditions and the antagonism pitting inmates
against guards None of these ethnographers provide strong empirical support for the relationship
between acculturation strain and recidivism
A line of research employing experimental and regression discontinuity designs (Chen and
Shapiro 2007 Gaes and Camp 2009 Lerman 2009 a b) evaluate the impact of security level
placement on in-prison and post-release outcomes Under the assumption that higher security levels
produce more strain Chen and Shapiro using an RDD and Gaes and Camp using an experiment found
higher security level placement led to higher levels of post-release recidivism Lerman employing an
RDD found that inmates placed in higher security levels had friends who were more likely to be
gang-involved and who were more likely to have had prior arrests and commitments Using other
data Lerman shows how these personal networks of friends are likely to be acquired in prison
Although these studies identify security level placement as a cause of in-prison socialization and
post-prison increases in recidivism supporting strain and socialization hypotheses they cannot rule
out other mediating mechanisms such as labeling though self-identification
Other criminologists argue that prisons are schools for crime where prisoners learn from
other inmates how to become more knowledgeable offenders (Cullen Jonson and Nagin 2011
6
The Relationship between Prison Length of Stay and Recidivism -- This report was prepared by Abt Associates using Federal funding provided by the Bureau of Justice Statistics (BJS) Opinions andor points of view expressed are those of the author(s) and do not necessarily reflect the official position or policies of the US Department of Justice
Letkemann 1973 Nguyen Loughran Paternoster Fagan amp Piquero 2017) Other research
suggests that prisons reinforce cultural values conforming to criminal activity that is offenders
import these values from their community and deviant values are reinforced by the structure and
organization of prison (Carroll 1988 Irwin 1980 2005 Jacobs 1977 Wacquant 2001)
Even if an offenderrsquos orientation toward reoffending is unaltered by prison labeling
(Braithwaite 1989) may affect recidivism Ex-offenders may be denied employment or prohibited
from accessing social benefits programs after release Whether these events are internalized
limiting the offenderrsquos subjective expectations or simply reduce legitimate avenues for community
integration they may increase the propensity to reoffend By manipulating job applications (Boshier
amp Johnson 1974) or by using actors posing as prior offenders (Pager et al 2009) research has
demonstrated a stigmatizing effect of a criminal record on employment reducing legitimate
opportunities for ex-offenders especially in a low wage job market Of course the stigma may come
from any term of imprisonment and long terms may be no more disadvantageous than short terms
PREVENTATIVE THEORIES
Preventative theories of imprisonment rest on a prisonerrsquos rational expectation of future
punishment or on theories of rehabilitation that envision prison as an opportunity to reform and
retrain Specific deterrence theorists (Becker 1968) assert that offenders are rational actors
weighing the costs and benefits of crime Experiencing prison reinforces its noxiousness and
provides a disincentive to future criminal behavior Reentry programming and other rehabilitative
training adopting evidence-based practices may reduce recidivism (Andrews amp Bonta 2006 Andrews
et al 1990 Gaes et al 1999 Gendreau et al 1999 Gendreau et al 2008 MacKenzie 2006 Smith
2006) so that prison can be used to change the trajectory of criminality Longer prison terms might
allow for more intensive reentry training and longer prison terms should reinforce the expectation of
7
The Relationship between Prison Length of Stay and Recidivism -- This report was prepared by Abt Associates using Federal funding provided by the Bureau of Justice Statistics (BJS) Opinions andor points of view expressed are those of the author(s) and do not necessarily reflect the official position or policies of the US Department of Justice
future punishment However because of the strong association between age and crime longer
prison terms produce inmates who are older at the time of release so that merely incapacitating
offenders for longer periods will reduce the likelihood of crime absent any other intervention or
causal mechanism As noted in Snodgras et al (2015) length of stay and aging are inseparable causal
factors even if one controls for age at release or age at sentence
Prison experiences may unleash forces that both push offenders away from crime and pull
them toward reoffending However as Loefler (2013) argues prison may simply collect people who
are predisposed toward criminality because of pre-existing life experiences and deficits He calls this
social selection crediting Manski and Nagin (1998) Nagin Cullen and Jonson (2009) and Smith and
Paternoster (1990) Loeffler argues that imprisonment itself is a highly selective process Only a small
proportion of people are imprisoned even people who are committed for the first time usually have
an extensive history of criminal justice contacts From this point of view prison has no causal
impact it is where offenders are housed much as hospitals are places where people predisposed to
illness are treated Loefflerrsquos argument is more relevant to an analysis of imprisonment than to
length of stay The relevant question we address is Even if there is a selection process does length
of stay have an impact on future reoffending
PRIOR STUDIES OF PRISON LENGTH OF STAY
Relying on criminological theory then provides no clear expectation of whether
incarceration will decrease or increase reoffending Nagin et al (2009) review empirical studies
addressing the question of whether on balance imprisonment pushes ex-offenders away or pulls ex-
offenders towards new crime They conclude that imprisonment per se seems to have a
criminogenic effect although they recognize studies that contradict that conclusion Nagin et al also
state there is little convincing evidence that length of stay ndash in their parlance prison dosage ndash
8
The Relationship between Prison Length of Stay and Recidivism -- This report was prepared by Abt Associates using Federal funding provided by the Bureau of Justice Statistics (BJS) Opinions andor points of view expressed are those of the author(s) and do not necessarily reflect the official position or policies of the US Department of Justice
increases recidivism They are skeptical of observational studies that use regression procedures to
uncover the causal impact of prison length of stay because identification requires an exacting
standard -- selection on observables (Rosenbaum 2002) -- in which covariates completely adjust for
any spurious relationship between time-served and recidivism
Nagin Cullen and Jonson (2009) identify 14 regression studies two experiments and three
matching studies evaluating the effect of length of stay in their 2009 review Because we are also
skeptical of the regression studies we do not review them1 The experimental studies of length of
stay by Berecochea and Jaman (1981) and Deschenes Turner and Petersilia (1995) manipulated
sentence reductions for offenders who had already served time in prison Part of the study design
for the Deschenes et al experiment diverted offenders from prison and would qualify as an
imprisonment but not a length of stay study However a subset of offenders was randomly assigned
to early release to be placed on intensive community supervision Analysis of the 17 dependent
variables showed only one that was significantly affected by prison length The Berecochea and
Jaman experiment randomly assigned offenders to a six-month reduction which was on average a
16 percent sentence reduction Inmates receiving a sentence reduction had higher parole failure
rates at one and two years after the release from prison but these differences were not statistically
significant Thus rigorous random design studies do not find that increasing prison length either
increases or decreases future criminality
Of the three matching studies identified by Nagin Cullen and Jonson (2009) two evaluate
length of stay on juveniles (Kraus 1981 and Loughran et al 2009) The third study by Jaman
Dickover and Bennett (1972) found recidivism to be higher for adult male burglars receiving 25
months or longer versus those serving 24 or fewer months but the difference was only significant at
1 The 14 regression studies mostly find null effects with specific deterrent and criminogenic effects about equal 9
The Relationship between Prison Length of Stay and Recidivism -- This report was prepared by Abt Associates using Federal funding provided by the Bureau of Justice Statistics (BJS) Opinions andor points of view expressed are those of the author(s) and do not necessarily reflect the official position or policies of the US Department of Justice
the 24-month horizon Kraus (1981) evaluated length of stay contrasts for juveniles that depended
on the juvenilersquos age group For example Kraus contrasted a term of 8 to 20 months versus a term up
to 7 months for 14 and 15-year oldrsquos however for juveniles who were 13 the contrast was between
9 to 16 months and 8 months or less None of the contrasts were statistically significant Loughran et
al (2009) employ propensity score methods The authors categorized the continuous length of stay
into discrete ordinal categories and used ordinal logit to estimate propensity scores The variation in
length of stay extended from 0-3 months up to greater than 12 months Whether using arrest or
self-reported reoffending Loughran et al found no marginal effect of length of stay on either
outcome
Meade Steiner Makarios and Travis (2012) also used ordinal logit to estimate the propensity
score creating ordered subsamples stratified by the estimated log odds of being in a category of
length of stay They stratified their sample into dosage categories and compared people within a
ldquodosagerdquo stratum to those with ldquosimilarrdquo propensity scores who had longer or shorter sentences
Meade et al found that beyond 16 months higher doses of imprisonment lowered recidivism (felony
arrest) however only the highest dose (gt= 78 months) was statistically significant
Snodgrass Blokland Haviland Nieuwbeerta and Nagin (2011) also conducted a dosage
study of time served among prisoners in the Netherlands and restricted their sample to first time
commitments convicted of violent property or drug offenses who were between age 12-40 and who
had sufficient time post-release to assess recidivism The discrete categories of time served were 1
month or less 1-2 months 2-3 months 3-6 months 6-12 months and 12+ months Consistent with
the other propensity score studies they estimated the propensity score using ordinal logit with many
covariates to predict the ordinal level of prison length of stay Rather than use only the propensity
scores to match offenders they used exact matches on sex age (+- two years) and one of four
10
The Relationship between Prison Length of Stay and Recidivism -- This report was prepared by Abt Associates using Federal funding provided by the Bureau of Justice Statistics (BJS) Opinions andor points of view expressed are those of the author(s) and do not necessarily reflect the official position or policies of the US Department of Justice
trajectory group memberships as well as a propensity score matching caliper of 15 The matched
pairings produced sets of offenders who served different sentence lengths The matched pairs
allowed Snodgrass et al to examine measures of recidivism comparing any given ordinal category of
length of stay to the other categories where a matched pair could be found The results showed no
relationship between length of stay and recidivism The Snodgrass et al study takes great care in
constructing counterfactuals for the offenders within a given length of stay class But as they note
the average levels of time served are much shorter than one would observe in most United States
adult prison samples
Roach and Schanzenbach (2015) use randomization of judges assigned to sentencing
convicted offenders to map the relationship between length of stay (median of 4 months) and one
two and three-year rates of recidivism Using reduced form and two-stage regression they find that
each additional month of sentence length decreases recidivism by about 1 percent When they
stratify on criminal history Roach and Schanzenbach find a strong effect of sentence length for
offenders with minimal criminal history and a weak or insignificant effect for offenders with more
extensive criminal histories They also found that relative to the base hazard rate the impact
occurred almost entirely within the first year of release Roach and Schanzenbach argue the impact
of length of stay is a combination of severity of punishment and rehabilitation The researchers argue
that offenders with longer sentences can participate in more rehabilitative prison programs Roach
and Schanzenbachrsquos Table 2 (page 19) does indicate possible sources of bias in the relationship
between length of stay and recidivism The judge dummy variables not only demonstrate a strong
relationship to sentence length essential to the study design but they also predict the offenderrsquos
offense severity level and number of prior non-violent convictions These offender characteristics
could be associated with the sentence length and the level of recidivism qualifying as backdoor
variables (Morgan and Winship 2015) Roodmanrsquos (2016) review of this study offers the possibility
11
The Relationship between Prison Length of Stay and Recidivism -- This report was prepared by Abt Associates using Federal funding provided by the Bureau of Justice Statistics (BJS) Opinions andor points of view expressed are those of the author(s) and do not necessarily reflect the official position or policies of the US Department of Justice
the longer sentences in this study would lead to longer parole supervision elevating recidivism
because of technical parole violations
Kuziemko (2012) uses the Georgia parole guideline grid as a means of identifying the causal
effect of length of stay She restricts her analysis to offenders with less severe offenses and whose
criminal history category is in the average to high range She uses the discontinuity in the grid
recommendation (separating high from average risk) as an instrument for time served with the
instrumented time served in stage one and recidivism regressed on the instrument in stage two
along with other covariates One of her estimates restricts the sample to people whose points are
just above or just below the discontinuity threshold (8 versus 9 points) which should yield the best
approximation to an exogenous variation She finds each additional month of time served lowers the
three-year recidivism rate by 15 percent It is not clear why Kuziemko restricted her analysis to this
threshold limiting the analysis to a narrow range of the guideline grid Most offenders have lower
criminal history scores and restricting the analysis to the higher thresholds limits the generalizability
of the study In fact Roodmanrsquos (2016) reanalysis of these data evaluates other discontinuity cut
points and finds either insignificant length of stay coefficients or coefficients with the opposite sign
indicating increased length of stay increases the probability of recidivism
Mears et al (2016) used the generalized propensity score to balance covariates across levels
of length of stay They balanced within four subgroups of time served categories using
demographics categories of commitment offense offense severity scores prior record scores
dummy coded year of release and dummy coded judicial district While they achieved balance on
this set of covariates they did not conduct a sensitivity test to evaluate the potential impact of an
omitted variable (Rosenbaum 2002) Mears et al (2016) found the effect of time served on
recidivism depended on the level of length of stay Short terms produced increased recidivism up to
12
The Relationship between Prison Length of Stay and Recidivism -- This report was prepared by Abt Associates using Federal funding provided by the Bureau of Justice Statistics (BJS) Opinions andor points of view expressed are those of the author(s) and do not necessarily reflect the official position or policies of the US Department of Justice
one year From one to two years time served decreases recidivism and thereafter has no effect
Long terms (more than 6 years) could not be evaluated due to large error terms
An RDD design employed by Hjalmarsson (2009) was also based on a guideline system
however the study applied to a juvenile population in the state of Washington and the discontinuity
was based on a sanction to a state run juvenile facility versus a local sanction This latter punishment
included sanctions involving much shorter sentences served in a local facility a term of community
supervision fines or community service Hjalmarsson found a deterrent effect of state-run
confinement for juveniles compared to the local sanctions This study was not a test of length of
stay but a test of state-run juvenile confinement as opposed to a bevy of alternate juvenile
punishments To control for the fact the running variable was correlated with recidivism across
levels of criminal history the study used a quadratic regression of the running variable
Furthermore the author used all the data without regard for bandwidth This puts tremendous
pressure on his quadratic expression being correct Secondly rather than using an intent-to-treat
estimator and perhaps converting that into LATE the author drops cross-overs from the
analysis There is no justification for doing so and we are unaware of other RDDrsquos that takes such a
step Finally the author made no attempt to justify an implicit assumption that right-hand-censoring
is independent In fact given data construction and what we know about juvenile justice right-
hand-censoring is unlikely to be independent Specifically offenders with longer terms are more
likely to be censored This relationship alone may explain the findings that incarceration reduced
recidivism
One last study of note was conducted by Drago Galbiati and Vertova (2009) in which the
authors examined the effect of a Clemency Bill in Italy that shortened the sentence of offenders
anywhere from 1 to 36 months This could be described as an exogenous treatment since the
13
The Relationship between Prison Length of Stay and Recidivism -- This report was prepared by Abt Associates using Federal funding provided by the Bureau of Justice Statistics (BJS) Opinions andor points of view expressed are those of the author(s) and do not necessarily reflect the official position or policies of the US Department of Justice
application of clemency was applied irrespective of criminal history offense age and other factors
affecting the outcome However the early release came with a caveat The remaining time to serve
would be reinstated if the offender was convicted of another crime within five years So this was a
reduction in length of stay with an added disincentive to commit a new offense People who had
spent more time in prison were less likely to reoffend and each month of remaining time to serve
was associated with a 124 percent reduction to commit a new crime2
Even with these additional studies the literature on length of stay using strong
counterfactual designs is still sparse and presents a mixed picture of effects Most studies show no
effect or that increased prison length reduces recidivism slightly Several are imbalanced in ways
that could bias the length of stay effects The studies also span different populations juveniles
adults and cover different international jurisdictions (Italy the Netherlands and United Sates) The
present study uses a very large sample of federal offenders sentenced to prison with varying lengths
of stay
INCARCERATION TREATMENT HETEROGENEITY
Scholars have argued that prison dosage (length of stay) may have different effects
conditional on factors associated with the individual with the social context with sentencing
structure and with potentially many other factors The National Academy of Sciences study on mass
incarceration finds evidence for the heterogeneity of incarceration effects (NRC 2014 427) But we
need a template to systematically examine incarceration heterogeneity
Mears Cochran and Cullen (2014) provide one such template They propose three types of
sources of heterogeneity prior sanctioning experience in-prison experiences and the level of post-
2 Kuziemko (2012) also capitalizes on early release in Georgia because jail overcrowding allowed her to compare offenders with different amounts of time served having the same prior risk levels She finds people with longer time served have lower recidivism rates These results are challenged by Roodman as possible evidence of parole bias in Kuziemkorsquos analysis
14
The Relationship between Prison Length of Stay and Recidivism -- This report was prepared by Abt Associates using Federal funding provided by the Bureau of Justice Statistics (BJS) Opinions andor points of view expressed are those of the author(s) and do not necessarily reflect the official position or policies of the US Department of Justice
release supervision ndash a pre- within- post-custody framework The National Academy of Sciences
report takes an even broader perspective by suggesting that there may be incarceration effects for
different units ndash the effect on people may be substantially different than the effect on families or
neighborhoods Based on the Mears et al hypothesized framework it seems sentencing jurisdictions
will vary on many of the important pre within and post dimensions We may be reluctant to accept
that results from Florida apply to Massachusetts unless we have a framework that tells us how to
compare jurisdictions within this pre within and post sentencing framework
For the current application we use the structure of the U S Sentencing Guidelines
sanctioning grid in our RDD design to test whether criminal history or offense seriousness moderates
the effect of length of stay increments We find that increments in length of stay have about the
same effect regardless of either of these dimensions We also separately evaluate criminal history
sex race education and marital status all showing homogeneous effects of length of stay
PRESENT METHODOLOGY DATA STATISTICS AND INFERENCE
This methodology section has three parts The first part identifies the source of the data ndash
the Federal Justice Statistics Program To provide necessary background before discussing the
regression discontinuity design the second part summarizes the US Sentencing Guidelines The
third part discusses statistical methods and the RDD identification strategy3 This application of RDD
is unconventional There are multiple break-points and hence multiple effects the effects are
summarized using a meta-regression borrowed from meta-analysis Furthermore for each effect
the bandwidth is exactly two units so search for an optimal bandwidth is not a concern Several
3 Some readers may prefer to characterize our approach as using instrumental variables The US Sentencing Guidelines are the instrument that moves offenders who otherwise have the same propensity to recidivate between two guidelines cells the first of which prescribes a shorter prison term on average than does the second Because there are many guideline cells there are many estimates based on contiguous cells The multiple estimates are averaged using inverse variance weights
15
The Relationship between Prison Length of Stay and Recidivism -- This report was prepared by Abt Associates using Federal funding provided by the Bureau of Justice Statistics (BJS) Opinions andor points of view expressed are those of the author(s) and do not necessarily reflect the official position or policies of the US Department of Justice
conventional tests used in RDD are inapplicable in this setting For example we need not test how
expanding the bandwidth affects estimates
Although the parallel is disputed (Imbens amp Lemieux 2007) some see RDD as an
instrumental variable estimator and it is practical to employ IV as the estimator This alternative
estimator is also used in this study Results show the RDD estimator and the IV estimator yield
essentially the same results
Data Source
Data for this study come from the Federal Justice Statistics Program (FJSP) a Bureau of
Justice Statistics (BJS) sponsored project to assemble federal justice records To be included in the
analysis an offender must have been sentenced under the guidelines between 1999 and 2014
Practically the period studied is shorter because to be included in the analysis an offender must have
entered community supervision but many offenders sentenced between 1999 and 2014 were still
incarcerated at the end of 2014
The FJSP has a thirty-five-year history however recent refinements link federal offenders
from investigation through corrections This paper uses a subset of the linked data running from
sentencing through a single cycle of release to community supervision and possible recidivism The
US Sentencing Commission (USSC) provides data on offenses and offenders at the time of
sentencing the Administrative Office of the US Courts (AOUSC) provides data on offenders under
community supervision and the Bureau of Prisons (BOP) provides data on offenders during periods
of incarceration Details regarding construction of the FJSP data appear elsewhere (Kling et al
2016) this paper summarizes
16
The Relationship between Prison Length of Stay and Recidivism -- This report was prepared by Abt Associates using Federal funding provided by the Bureau of Justice Statistics (BJS) Opinions andor points of view expressed are those of the author(s) and do not necessarily reflect the official position or policies of the US Department of Justice
Since 1987 federal offenders have been sentenced using sentencing guidelines and data
about guideline application have been assembled (and contributed to the FJSP) by the USSC
Guidelines data provide detailed accounts of the offenderrsquos criminal history the offense of
conviction the sentence imposed and expected prison time Expected prison time differs from
actual prison time but the two are close because sentencing in the federal system uses determinate
or real-time sentencing and as explained below actual time-served is observed with systematic
error
When an offender is sentenced to prison he or she serves time in a facility run by the
Federal Bureau of Prisons (BOP) which reports data from its inmate tracking system (SENTRY) to the
FJSP Most offender prison terms are recorded in SENTRY but some are not because (1) some
offenders are sentenced to time-served prior to trial (2) some offenders spend part of their terms in
state detention and (3) terms of thirty days or fewer are inconsistently recorded in SENTRY Because
of these limitations we use expected time-served reported by the USSC as a measure of prison time
However we use admission into a BOP facility during the period of community corrections as one
measure of recidivism
When an offender is sentenced to probation or when an offender leaves prison to serve a
statutorily required term of supervised release (a judge-imposed sentence to post-incarceration
supervision) his or her term of community supervision is recorded in Probation and Pretrial Services
Automated Case Tracking System (PACTS) an information system maintained by the Administrative
Office of the U S Courts specifically by the Probation and Pretrial Services Office (PPSO) After
some manipulation4 the PACTS data record periods of community supervision and outcomes Being
4 Federal probation officers frequently open terms of probation before the offender is sentenced and terms of supervised release before the offender is released from prison For probation the probation officer may be responsible for pretrial supervision continued into post-conviction supervision and this appears as a continuous period of community supervision
17
The Relationship between Prison Length of Stay and Recidivism -- This report was prepared by Abt Associates using Federal funding provided by the Bureau of Justice Statistics (BJS) Opinions andor points of view expressed are those of the author(s) and do not necessarily reflect the official position or policies of the US Department of Justice
revoked from community supervision is another measure of recidivism Every federal offender in our
sample received a term of community supervision eliminating one source of variability and
heterogeneity
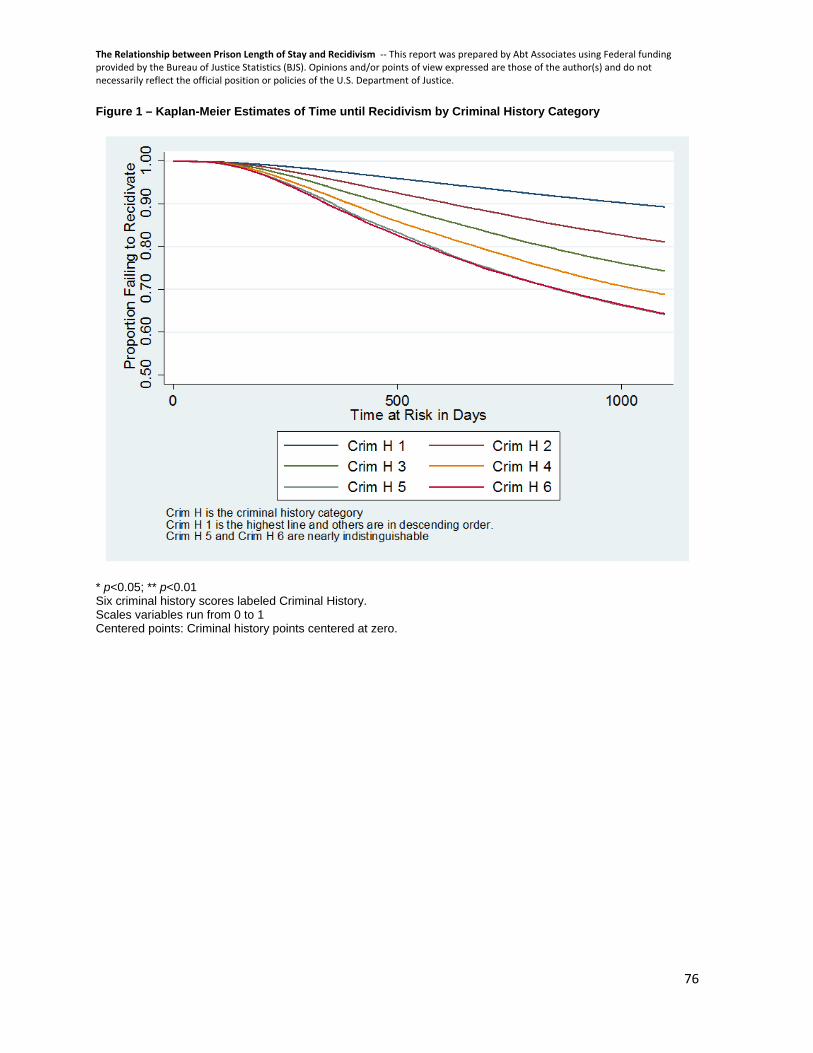
For the recidivism analysis time-at-risk starts with the beginning of a term of supervised
release for offenders sentenced to prison The time-at-risk ends with recidivism or with the first
occurrence of one of the following censoring events completion of the community supervision term
three years or with the end of data collection Using the measures described above recidivism is
defined by the occurrence of a recognized failure event If the offender reappears in the federal BOP
data he or she is deemed to have recidivated If the offender does not reappear in the BOP data but
we observe the offender is revoked from community supervision he or she is deemed to have
recidivated Although there are several explanations for being revoked from supervision but not
entering federal prison one common reason is the offender is arrested for a state-level crime and
detained in state custody pending trial The date when an offender reenters prison is the date of
recidivism if the offender does not reenter prison but is revoked from supervision the date of the
revocation is the date of recidivism Based on years of working with the PPSO checking algorithms
with PPSO administrative staff and field staff we have confirmed that this approach ndash providing
primacy to returning to prison according to the BOP ndash is the best way to identify recidivism5
Many federal offenders are arrested for new crimes without returning to prison or having
their community supervision status revoked Using the FJSP data we estimate three-year recidivism
in the FJSP Also for probation an officer may open a supervision record when preparing a presentence report The correction is to change the beginning of supervision to the date of sentencing For a term of supervised release the probation officer might open the term in preparation for post-release planning To correct this we changed the beginning of supervision to coincide with the end of prison 5 An offenderrsquos community supervision must be revoked before he or she is committed to prison so the date of revocation would seem to be the better date for the failure event In fact probation officers often fail or are unable to record the date of revocation until weeks or months after it occurs Consequently the date of entering prison (when it occurs) is a more accurate indicator for a study of recidivism
18
The Relationship between Prison Length of Stay and Recidivism -- This report was prepared by Abt Associates using Federal funding provided by the Bureau of Justice Statistics (BJS) Opinions andor points of view expressed are those of the author(s) and do not necessarily reflect the official position or policies of the US Department of Justice
rates of about 20 percent for federal offenders placed on community supervision If new arrests
were included in the analysis the recidivism rate would be closer to 30 percent6 The FJSP does not
include arrest data so we could not define recidivism as being arrested but an arrest that does not
result in revocation is typically for a minor or unfounded crime so the outcome measures used in
this study are for events that are sufficiently serious to provoke a return to custody
To be included in the analysis the offender must have been convicted and sentenced under
the US Sentencing Guidelines since 1999 This is the period covered by the data linkage Only
offenders convicted of felonies and serious misdemeanors are sentenced routinely under the
guidelines so this study is limited to those serious offenders Others rarely serve prison terms so
the omission is inconsequential To be included in the study the offender must have entered
community supervision else we could not identify a recidivism follow-up period Because of this
requirement some offenders sentenced under the guidelines are excluded from the analysis
Several reasons explain why offenders do not enter community supervision First before entering
community supervision offenders sentenced to prison must have been released from prison
Second many federal offenders are foreign nationals in the country legally or illegally they are often
deported upon prison release so they are not candidates for a recidivism study and consequently
this study is based on US citizens7 Some other offenders are released from prison to detainers
exercised by state authorities Because offenders who never enter community supervision provide
no information for analysis they are excluded from the analysis file
6 The authors have worked with PPSO for six years to match community supervision records with criminal history records (eg criminal record histories held by state authorities and linked using an FBI index) Data use agreements preclude including criminal history records in the FJSP so they are unavailable for this analysis Based on our work with PPSO we know that recidivism rates based on arrests are near 30 percent 7 Non-citizens are sentenced to community supervision but they are deported and never enter active community supervision If they reenter the county illegally their supervision status can be revoked However this form of recidivism is very different from the form of recidivism studied in this paper so we chose to exclude non-citizens We might have retained non-citizens who entered active community supervision but they are difficult to distinguish reliably in the OBTS so we chose to exclude all non-citizens
19
The Relationship between Prison Length of Stay and Recidivism -- This report was prepared by Abt Associates using Federal funding provided by the Bureau of Justice Statistics (BJS) Opinions andor points of view expressed are those of the author(s) and do not necessarily reflect the official position or policies of the US Department of Justice
Data limitations discussed in this section seem to raise concerns about bias when measuring
recidivism but these concerns are not serious for this study Essentially a RDD study compares
offenders from group A with offenders from group B where group A and group B are closely
matched Due to matching whatever biases arise regarding the measurement of recidivism are likely
the same in groups A and B Therefore a comparison of recidivism for groups A and B is valid even if
estimates of recidivism are systematically biased
SENTENCING GUIDELINES
Explaining the RDD requires a short description of federal sentencing guidelines Under the
guidelines offense seriousness is determined by a complex set of rules that take the offense of
conviction and real offense behavior into account to classify sentencing factors into one of 43 offense
seriousness levels with j=1 being the least serious and j=43 being the most serious and six criminal
history categories with k=1 being the least serious (least likely to recidivate) and k=6 being the most
serious (most likely to recidivate) By design the offense seriousness levels reflect the USSCrsquos
assessment of offense seriousness and do not consider an offenderrsquos threat to recidivate Likewise
by design the offenderrsquos criminal history category reflects the USSCrsquos assessment of the likelihood
that an offender will recidivate Important to note subtle differences in offense conduct cause an
offenderrsquos crime to be associated with offense level j rather than offense level j-1 or j+1 For
example unarmed bank robbers armed bank robbers who do not display their weapons armed
bank robbers who display but do not threaten with their weapons and bank robbers who explicitly
threaten with their weapons all appear in different seriousness levels Furthermore offenders
convicted of violent crimes drug-law violations and property crimes can all appear in the same
offense seriousness level Based on this subtlety we expect that offenders in offense seriousness
level j will not be inherently more likely to recidivate than will offenders in seriousness levels j-1 and
20
The Relationship between Prison Length of Stay and Recidivism -- This report was prepared by Abt Associates using Federal funding provided by the Bureau of Justice Statistics (BJS) Opinions andor points of view expressed are those of the author(s) and do not necessarily reflect the official position or policies of the US Department of Justice
j+1 provided criminal history is held constant8 In fact holding criminal history constant it seems
likely that offenders in offense seriousness category j are not inherently more or less likely to
recidivate than are offenders in offense seriousness categories j-k and j+k where k is a small number
This assumption provides the identification logic for the RDD and for the instrumental variable
alternative
Under the guidelines another complex set of rules determine criminal history points which
are collapsed into six criminal history categories for the guidelines application with category 1 being
the least serious criminal record and category 6 being the most serious record Based on the offense
seriousness level and the criminal history category the federal sentencing guidelines are a 43x6 grid
comprising 43 offense seriousness rows and 6 criminal history columns Holding the criminal history
category constant moving down the grid from least serious offense level to most serious offense
level the recommended prison term increases Holding the offense seriousness level constant
moving from left to right across the grid from least serious criminal history category to most serious
criminal history category the recommended prison term increases For the least serious offenses
and for the least dangerous offenders the guidelines recommend probation or alternative sanctions
although prison terms are allowed and sometimes imposed
Every year the Commission can recommend changes to the guidelines for Congressional
approval and in fact the guidelines have changed over time These changes have little consequence
for the analysis reported in this paper Even if the composition of offenders within specific guideline
cells has changed over time recommended sentence terms have always increased with offense
8 Possibly some factors entering the determination of the offense seriousness level might predict recidivism However crimes committed in the federal system are so diverse and factors entering the guidelines are so detailed it seems unlikely that increases in the offense seriousness levels would be systematically associated with recidivism holding criminal history constant Possibly for some cell jj+1 comparisons factors that enter the offense seriousness determination may cause recidivism to increase or decrease but provided these factors are not systematic ndash meaning that they do not always increase recidivism as the comparison moves from cell j to j+1 ndash the treatment effect is still identified
21
The Relationship between Prison Length of Stay and Recidivism -- This report was prepared by Abt Associates using Federal funding provided by the Bureau of Justice Statistics (BJS) Opinions andor points of view expressed are those of the author(s) and do not necessarily reflect the official position or policies of the US Department of Justice
seriousness level As explained in this next section that regularity is sufficient to support the RDD
estimation procedure
THE RDD AND STATISTICAL METHODOLOGY
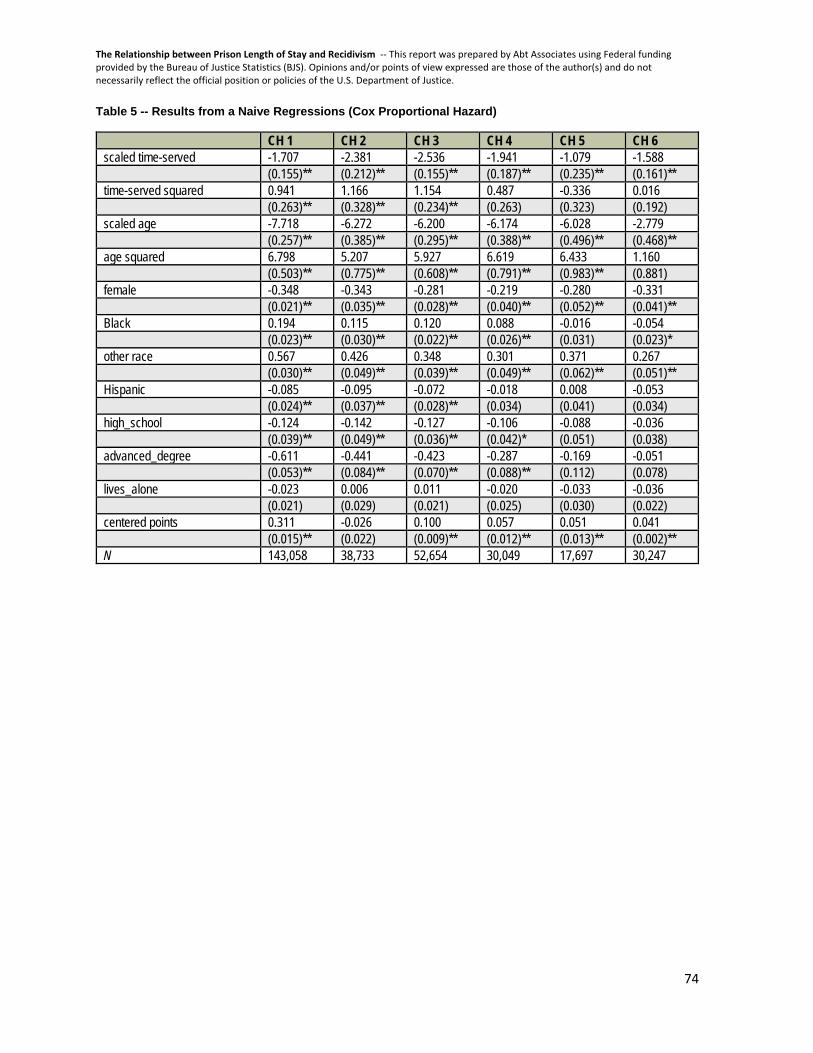
During the last decade methods for inferring causality have gone well beyond naive
regression models criticized by Nagin and his colleagues (Morgan amp Winship 2015 Imbens amp Rubin
2015) A regression discontinuity design (Hahn Todd amp van der Klauuw 2001 van der Klaauw 2002
Imbens amp Lemieux 2007 Lee amp Lemieux 2010 Bloom 2012) is a rigorous approach often applied in
non-criminal justice research and sometimes applied in criminal justice studies (Berk amp Rauma 1983
Berk amp DeLeeuw 1999 Berk 2010 Rhodes amp Jalbert Regression Discontiuity Design in Criminal
Justice Evaluation An Introduction and Illustration 2013) Commonly the RDD is applied in a setting
where a decision rule based on factors (such as offense seriousness level holding criminal history
constant) can be used to define a ldquocut-pointrdquo that places study subjects (such as offenders) into one
group that does and another group that does not receive treatment Very near that rule-imposed
cut-point study subjects who do and do not receive treatment are so similar that a comparison of
outcomes for the two groups is deemed valid This section explains that our application of the RDD
identification strategy differs from the conventional application
One difference between our application and the standard application is that for us treatment
is a dose (eg the length of a prison term) while in standard applications treatment is a binary
condition On average the dose received by offenders in cell j+1 is higher than the dose received by
offenders in cell j Because offenders in cells j and j+1 are otherwise the same regarding the threat to
recidivate we can ask whether offenders in cell j+1 have higher or lower recidivism rates than
offenders in cell j and if so we have justification for attributing causation As a stylized example
22
The Relationship between Prison Length of Stay and Recidivism -- This report was prepared by Abt Associates using Federal funding provided by the Bureau of Justice Statistics (BJS) Opinions andor points of view expressed are those of the author(s) and do not necessarily reflect the official position or policies of the US Department of Justice
suppose first-time offenders who steal $100000 are sentenced according to offense seriousness
level j while first-time offenders who steal $125000 are sentenced according to offense seriousness
level j+1 In deference to the more serious crime the guidelines call for a term between 20 and 23
months for first-time offenders sentenced within guideline cell j and between 22 and 26 months for
first-time offenders sentenced within guidelines cell j+1 Given judicial discretion sentences imposed
on offenders within guideline cell j overlap with sentences imposed on offenders within guideline cell
j+1 but on average prison sentences within guideline cell j+1 are longer than those imposed within
guideline cell j This average difference drives the identification strategy Specifically holding the
criminal history category constant offenders sentenced within guideline cell j+1 are not inherently
more recidivistic than are offenders sentenced within guideline cell j but offenders sentenced within
guideline cell j+1 receive longer prison terms on average and we can test for whether those longer
prison terms account for higher or lower recidivism
Usually when applying RDD researchers consider a variable X (called a running variable in
the RDD context) and a critical value Xo that assigns study subjects to a comparison group when X lt
Xo and to a treatment group otherwise A sharp design occurs when the assignment is exact a fuzzy
design occurs when the assignment is inexact Although both sharp and fuzzy designs both estimate
the treatment effect sharp designs are preferred because (from a statistical estimation standpoint)
they are more efficient and interpreting the effect is clear
When treatment is binary as it is in standard applications the distinction between sharp and
fuzzy is straightforward Let PL be the probability of treatment when X lt Xo and let PR be the
probability of treatment otherwise If PL = 0 and PR = 1 then the design is sharp Let YL be the mean
outcome when X lt Xo and let YR be the mean outcome otherwise An estimator for the treatment
effect is YR-YL or just the difference in the mean outcomes But suppose that PL ge 0 or PR le 1 or both
23
The Relationship between Prison Length of Stay and Recidivism -- This report was prepared by Abt Associates using Federal funding provided by the Bureau of Justice Statistics (BJS) Opinions andor points of view expressed are those of the author(s) and do not necessarily reflect the official position or policies of the US Department of Justice
then the design is fuzzy Given a fuzzy RDD an often-used estimator is (YR-YL)(PR-PL) This
alternative estimator is sometimes called a local average treatment effect (LATE) Note the
numerator is an intent-to-treat estimator and in fact statistical testing is based on the numerator
because dividing by a constant will not change the properties of the basic test of whether treatment
is effective
For our application treatment is a dose and doses are distributed about a mean that
depends on whether X lt Xo or X ge Xo A necessary condition is that a shift in the offender from
guideline cell j to guideline cell j+1 will always (a sharp design) or sometime (a fuzzy design) cause an
offender to receive a longer prison term The monotonicity assumption is that this shift will never
cause an offender to receive a shorter prison term We presume the monotonicity assumption holds
and see no reason to assume otherwise
A test of the null hypothesis of no treatment effect is based on YR-YL Let TL be the average
prison term for X lt Xo let TR be the average prison term for X ge Xo Then the counterpart to the LATE
estimator for the binary treatment effect is (YR-YL)(TR-TL) or the change in recidivism per unit of
additional prison This too is a local average treatment effect Its interpretation is the average
increasedecrease in recidivism resulting from an average increase in prison length
In both these illustrations the estimator is LATE LATE is not necessarily the average
treatment effect or in this case the average increasedecrease in recidivism from increasing time-
served by one unit However LATE is almost always used as a substitute for that average which is
unidentified (Imbens 2009)
Returning to the standard application the ideal identification strategy requires that
estimation be limited to study subjects whose X values are just slightly less than Xo or equal to or
24
The Relationship between Prison Length of Stay and Recidivism -- This report was prepared by Abt Associates using Federal funding provided by the Bureau of Justice Statistics (BJS) Opinions andor points of view expressed are those of the author(s) and do not necessarily reflect the official position or policies of the US Department of Justice
slightly more than Xo9 Because very few observations meet these demanding conditions evaluators
usually expand the bandwidth to be broader than ldquoslightly lessrdquo and ldquoslightly morerdquo Because this
expansion of the bandwidth violates the asymptotic identification assumptions evaluators typically
assume that a local linear regression of the outcome variable Y on X will capture the relationship
between Y and X absent any intervention Given the intervention any departure from the local linear
regression around Xo is deemed the treatment effect A standard application would test the
credibility of this local linear regression and a standard application would test the sensitivity of
findings to the size of the bandwidth
Our application differs from the standard application in important ways Typically when
researchers apply the RDD strategy there is a single cut-point so there is a single estimate of the
treatment effect Less commonly there are multiple cut-points and a researcher can estimate
multiple treatment effects (Cattaneo Keele Tituinik amp Vazquez-Bare 2016) Given the structure of
the sentencing guidelines our study is based on a multiple cut-point RDD That is we estimate
multiple effects then combine them to generalize conclusions
Rather than increasing efficacy by expanding the bandwidth we always make comparison
across adjacent cells so that cell j is deemed ldquoslightly lessrdquo than the offense seriousness level that
determines cell j+1 Employing multiple cut-points achieves small standard errors by combining the
multiple estimates that arise from comparing outcomes for cells jj+1 j+1j+2 j+2j+3 and so on It is
unnecessary to expand the bandwidth beyond two units
9 ldquoSlightly lessrdquo and ldquoslightly morerdquo mean than X falls within a region X+δ and X-δ as δ approaches zero Expanding the bandwidth means that δ is allowed to get bigger
25
The Relationship between Prison Length of Stay and Recidivism -- This report was prepared by Abt Associates using Federal funding provided by the Bureau of Justice Statistics (BJS) Opinions andor points of view expressed are those of the author(s) and do not necessarily reflect the official position or policies of the US Department of Justice
In the conventional application a researcher would assure the relationship between the
outcome variable and the running variable is linear to the left and right of the breakpoint10 Because
our approach employs just two points j and j+1 this test is unavailable to us Arguably it is also
inapplicable because when estimating an effect we do not expand the bandwidth beyond j and j+1
In the conventional application the researcher will assure there is a discontinuity in treatment so
that treatment is more likely for those to the right of the cut-point than it is for those to the left We
do apply this conventional test showing that it holds
In conventional RDD analysis researchers worry about ldquogamingrdquo In the present context
defense attorneys have incentives to move their clients to lower guideline cells and prosecuting
attorneys have countervailing incentives to move offenders to higher guideline cells Gaming is
possible by manipulating guideline elements such as the amount of money stolen Defense
attorneys would argue the amount is lower than alleged prosecutors would argue the opposite In
conventional RDD analysis researchers use imperfect devices to test for gaming but those tests are
not necessary in the present context
To explain suppose a variable Z is associated with recidivism and is subject to gaming such
that defense attorneys are generally able to shift offenders from cell j+1 to cell j based on the value
of Z In our study we would expect a general shift in Z from j+2 to j+1 from j+1 to j from j to j-1
from j-1 to j-2 and so on In general this shift would have no effect on the contrasts because it
occurs across all adjacent cells Thus gaming is less relevant for a multiple-effect RDD than for a
conventional single-effect RDD Furthermore we are only concerned with gaming about variables
10 Postulating a linear relationship is frequent but some researchers expand their models to allow power functions of the running variable Hjalmarsson (2009) in a study of guidelines and juvenile justice discussed earlier used a quadratic This is a dangerous practice because the validity of the quadratic is difficult to assess and findings based on a RDD are sensitive to getting the model specification correct There are other elaborate alternatives to using local linear regressions but they are not applicable to our study
26
The Relationship between Prison Length of Stay and Recidivism -- This report was prepared by Abt Associates using Federal funding provided by the Bureau of Justice Statistics (BJS) Opinions andor points of view expressed are those of the author(s) and do not necessarily reflect the official position or policies of the US Department of Justice
that affect recidivism Because criminal history is held constant by construction of the guideline cells
the avenue for gaming is restricted Nevertheless we introduce some test for whether variable
associated with recidivism vary systematically across cells so that for example we ask whether
offenders in cell j+1 tend to be older than offenders in cell j We introduce these potential
confounders into the local linear regression Although we do not need a local linear regression for
identification we increase the efficiency of estimates by using a regression to include covariates in
the analysis Given the nature of the outcome variable when comparing outcomes in cells j and j+1
our study uses a Cox survival model sometimes called a Cox proportional hazard model but it is
ldquolocalrdquo only in the sense that (absent the intervention) the baseline survival model is invariant
around the cut-point and we estimate the treatment effect from a unit shift There exists an
extensive methodological literature on survival models (Lancaster 1990 Kalbfleisch amp Prentice
2002 Hosmer Lemeshow amp May 2008) which are frequently applied in studies of criminal
recidivism where time-at-risk is often censored A separate study justifies using the proportional
hazard model (rather than a parametric alternative) to study recidivism in the federal system
(Rhodes et al 2012) Although the approach seems uncommon others have used survival models as
the estimator in a RDD context (Rhodes amp Jalbert 2013 Bor Moscoe Mutevedzi Newell amp
Barnighausem 2014) We use the RDD identification strategy and the survival model estimation
strategy to identify and estimate the change in the hazard of recidivism across paired guideline cells
The most defensible approach consistent with the intuition of the RDD would seem to be to
compare the relative hazards for cell j and j+1 (holding criminal history category constant) because
offenders in cells j and j+1 are more alike than in any other comparison Both the previous discussion
and descriptive statistics discussed subsequently points toward a problem Cells j and j+1 are so
27
The Relationship between Prison Length of Stay and Recidivism -- This report was prepared by Abt Associates using Federal funding provided by the Bureau of Justice Statistics (BJS) Opinions andor points of view expressed are those of the author(s) and do not necessarily reflect the official position or policies of the US Department of Justice
alike the average time-served is not guaranteed to increase when comparing cell j to cell j+111 Even
when it increases the size of the increase may be so small that it is not informative As an extreme
example there is not much use in comparing recidivism for offenders who serve two years on
average when sentenced within cell j and two years plus one day on average when sentenced within
cell j+1 From experimentation to assure that average time served will increase between contrasted
cells we have found it better to compare the outcome from cell j and cell j+212 Notwithstanding
what was written above most of the analysis is based on that jj+2 comparison but we do offer
sensitivity tests that employ the original jj+1 comparison An alternative approach is to combine
cells j and j-1 and compare that with the combined cells j+1 and j+2 (This is equivalent to expanding
the bandwidth) However this alternative approach seems to offer no advantages and introduces
some difficult estimation problems (serial correlation and general model specification issues) when
combining multiple effects so we avoid its application
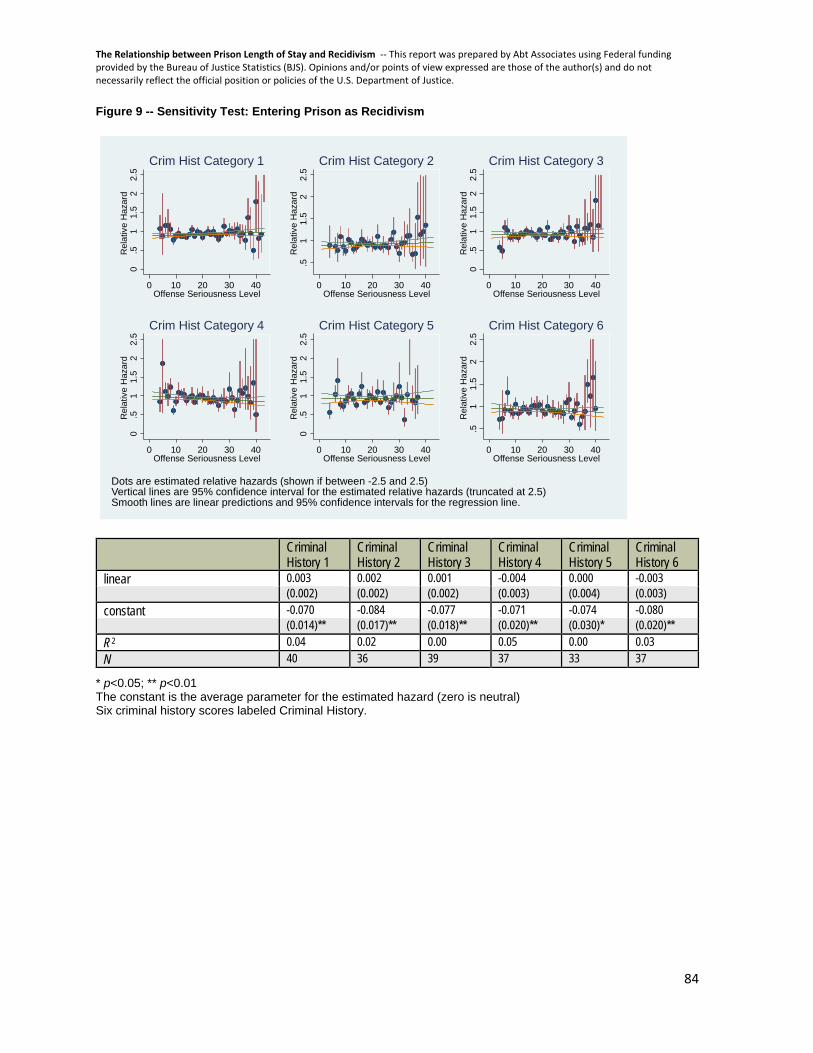
Because this identificationestimation strategy results in many hazard estimates (potentially
41x6) we use techniques familiar from meta-analysis to combine estimates (effects) into summary
statistics A useful explanation of a fixed-effect meta-regression is Rhodes (2012) For example for
the first criminal history category there are potentially 41 effects We estimate a weighted least-
squares linear regression to estimate the average of the 41 effects Because there are 6 criminal
history categories we repeat the meta-regression across the 6 criminal history categories and then
average the 6 meta-regression averages to derive a single inverse variance weighted estimate and
11 Especially for drug-law violations and weapons offenses federal statutes require application of mandatory minimum sentences Regardless of guideline recommendations judges cannot sentence below the mandatory minimums Because mandatory minimums are not evenly distributed across the offense seriousness levels it is possible for the average terms in cell j to be larger than the average terms in cell j+1
12 Across the six criminal history categories the average percent change in time-served between cells j and j+1 ranges from 9 to 18 with the change being largest for criminal history category 1 In comparison across the six criminal history categories the average percent change in time-served between cells j and j+1 ranges from 20 to 38 with the change being largest for criminal history category 1
28
The Relationship between Prison Length of Stay and Recidivism -- This report was prepared by Abt Associates using Federal funding provided by the Bureau of Justice Statistics (BJS) Opinions andor points of view expressed are those of the author(s) and do not necessarily reflect the official position or policies of the US Department of Justice
test statistic Thus although there are many estimates there is only one test statistics and hence no
multiple comparison problem
For reasons explained below when applying the meta-regression we must deal with error
terms that may be auto-correlated and heteroscedastic We will show that heteroscedasticity is a
major problem and to deal with it we used weighted least squares Because we compare cells j with
j+2 j+1 with j+3 j+2 with j+4 and so on we potentially introduce autocorrelation across the
estimates The jj+2 and j+2j+4 comparisons are not independent because they have j+2 in common
This problem has corrections (Prais-Winston estimators for example) but they are suspect in small
samples where ignoring the problem is likely better than attempting to introduce a feasible
generalized least squares solution (Greene 2008 p 648) This follows because small samples provide
inaccurate estimates for the autocorrelation coefficient We concentrate on the heteroscedasticity
problem however we provide a sensitivity test suggesting that autocorrelation can safely be
ignored
The meta-regression provides the average effect of moving from guidelines cell j to cell j+2
This is an intent-to-treat estimator If this movement were not statistically significant we would
conclude that increasing prison terms has no effect on criminal recidivism If the average effect is
statistically significant by itself it does not provide LATE the size of the effect resulting from a unit
increase in prison time Our approach is to report the size of the average effect when moving from
cell j to j+2 the average increase in the length of the prison term when moving from cell j to j+2 and
the ratio of the two The ratio is essentially the LATE
A more direct approach which requires the same assumptions as were applied above is to
apply an instrumental variable (IV) estimator where the shift from guideline cell j to j+2 is the
instrument That is offenders in cell j+2 are not inherently more or less recidivistic than are
29
The Relationship between Prison Length of Stay and Recidivism -- This report was prepared by Abt Associates using Federal funding provided by the Bureau of Justice Statistics (BJS) Opinions andor points of view expressed are those of the author(s) and do not necessarily reflect the official position or policies of the US Department of Justice
offenders in cell j but the longer average sentences served by offenders in cell j+2 cause those
offenders to recidivate at a greater or lesser rate than offenders in cell j Instead of a dummy
variable representing membership in cell j or j+2 the important right-hand-side variables is the
average time-served by offenders in cell j and j+213 That is the treatment variable takes one of two
values the average time-served by offenders in cell j (when the observation belongs to cell j) or the
average time-served by offenders in cell j+2 (when the observation belongs to cell j+2) The
advantage of this approach is that parameter estimates have the interpretation of ldquochange in the
relative hazard per additional month of time servedrdquo The disadvantage is that IV estimators lack
desirable asymptotic properties (that is they are biased even in large samples) when applied to a
non-linear model and the Cox regression is a non-linear model (Rhodes 2010) Nevertheless we
expect estimates to be approximate and worth comparing with the RDD estimates
RESULTS
This section has two parts The first part provides descriptive statistics and justification for
deleting cases from the analyses The second section provides estimates of the effect of increasing
time-served on recidivism using the RDD and IV approaches it also provides sensitivity tests for case
deletion and other analytic decisions
DESCRIPTIVE STATISTICS AND RULES FOR DELETING CASES
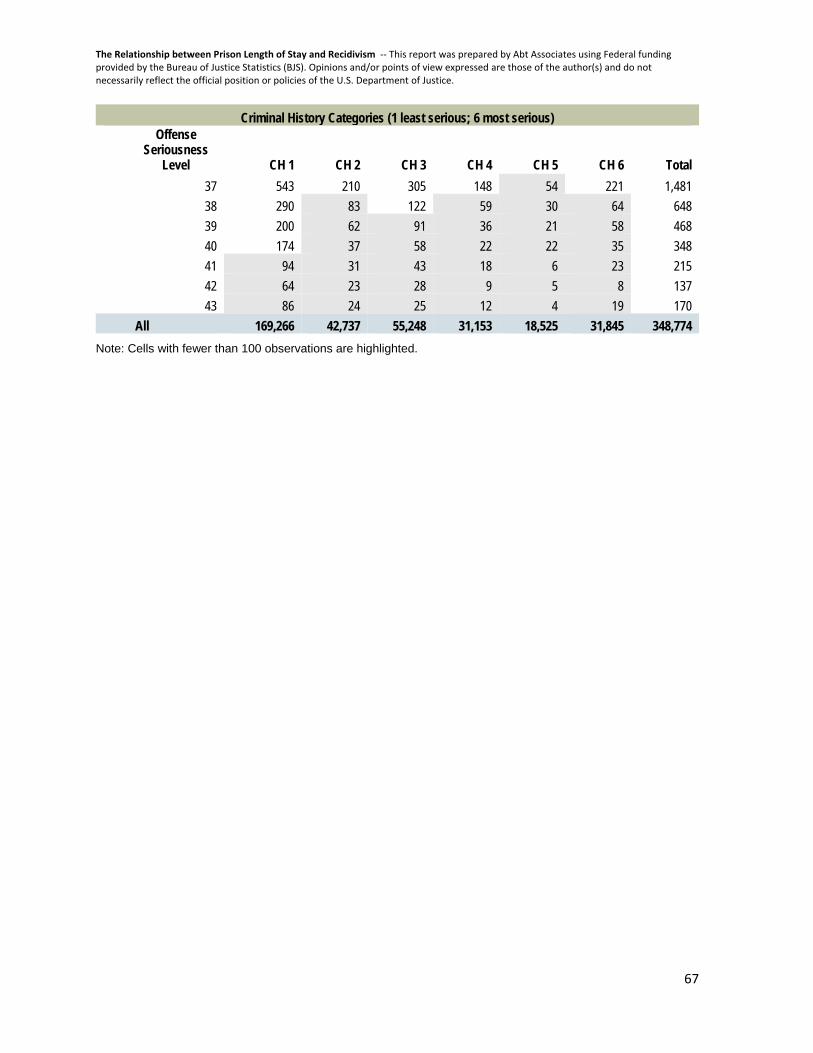
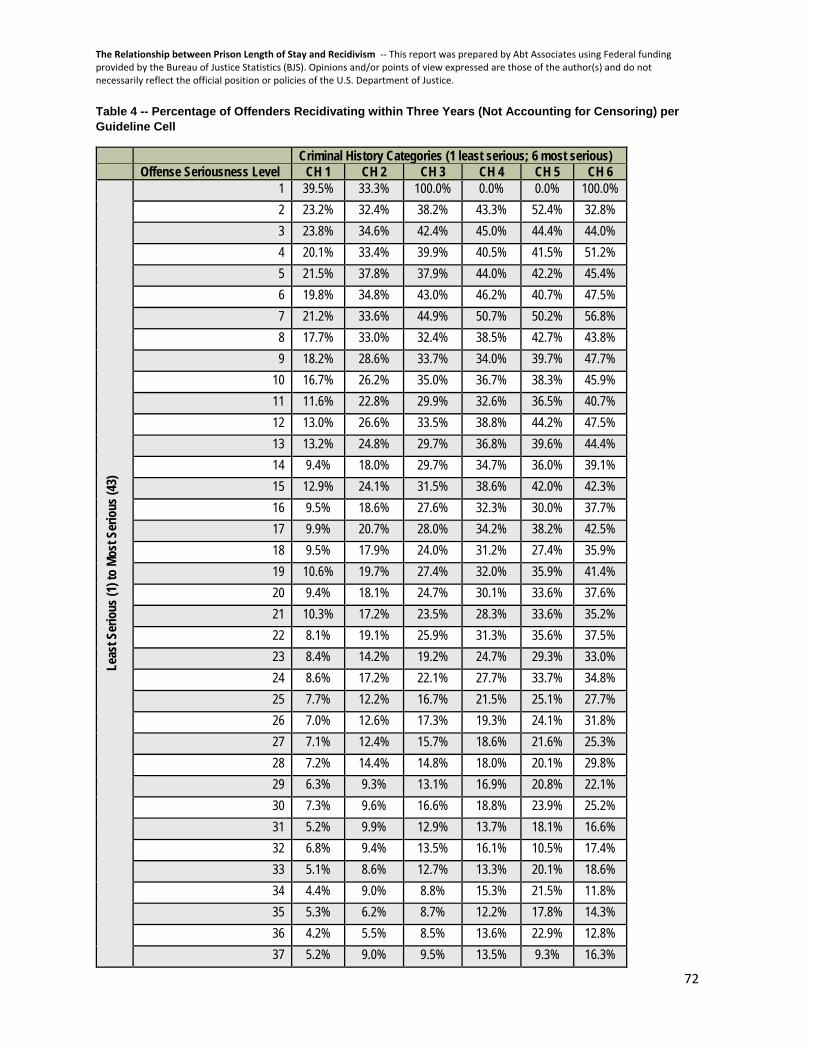
Table 1 reports the number of offenders available for the analysis before we add restrictions
To be included in this table an offender must meet three criteria First he or she must have been
sentenced under the guidelines because guidelines calculations are used in the analysis Second he
13 This is a two-stage estimation model The first-stage involves a regression of time-served on dummy variables representing the adjacent guideline cells But this regression will simply provide the mean time-served in each cell so we do not actually perform the regression
30
The Relationship between Prison Length of Stay and Recidivism -- This report was prepared by Abt Associates using Federal funding provided by the Bureau of Justice Statistics (BJS) Opinions andor points of view expressed are those of the author(s) and do not necessarily reflect the official position or policies of the US Department of Justice
or she must be a US citizen We cannot follow recidivism by deported offenders And third he or
she must have entered active community supervision following sentencing ndash either probation or a
term of supervised release ndash because active supervision initiates the time at risk of recidivism This
third criterion has two implications If an offender never entered active community supervision that
offender would not appear in the analysis Specifically if an offender was sentenced to prison and
remained in prison as of September 30 2014 that offender would not appear in the analysis Thus
offenders sentenced to long prison terms and especially offenders sentenced toward the end of the
data collection window are more likely to be excluded than are other offenders This systematic
selection will not bias the RDD estimates because any selection bias will be equally applicable to cell j
and cell j+2 That is the RDD implicitly adjusts for the selection bias
Insert Table 1 about here
Shading identifies cells with fewer than 100 observations Although data for the most and
least serious offense levels are sparse the sample sizes for the other cells are ample an important
point because the RDD approach holds criminal history category constant and compares outcomes
for offense serious levels j and j+2 Notice that about half the offenders fall into criminal history
category 1 and given that these are relatively inexperienced offenders a reader might put more
subjective weight on the analysis of offenders in this criminal history category To be included in the
principal analysis a cell must have 100 or more offenders Stripped of some other statistical issues
basically the RDD approach requires a comparison of the mean recidivism rates for cells j and j+2
Because the sampling variance for estimated difference in outcomes between offense seriousness
levels j and j+2 is inversely proportional to the number of offenders in cells j and j+2 setting a
minimum number of observations increases the average precision of estimated effects for those cells
31
The Relationship between Prison Length of Stay and Recidivism -- This report was prepared by Abt Associates using Federal funding provided by the Bureau of Justice Statistics (BJS) Opinions andor points of view expressed are those of the author(s) and do not necessarily reflect the official position or policies of the US Department of Justice
retained in the analysis but we will present sensitivity analyses of the 100-offender criterion
showing the analysis appears insensitive to this criterion
Using the same data applied to produce Table 1 Table 2 reports the percentage of offenders
who receive prison terms by guidelines cell Shading denotes that fewer than 50 of offenders
within a cell are sentenced to prison Prison is often imposed for federal crimes but sentencing
guidelines (and hence this table) are only mandatory for felonies and serious misdemeanors
Additionally many federal crimes are dual jurisdiction offenses and generally the most serious
crimes are prosecuted in federal court while the least serious crimes are prosecuted in state courts
These factors explain why prison terms are so frequent in these data Still prison is infrequent for
offenders convicted of the least serious crimes provided they lack serious criminal records For a cell
to be included in the principal analysis at least 50 of offenders in that cell must have received
prison terms Justification is that for estimating effects the effective sample size is proportional to
the number in the cell multiplied by the percentage sentenced to prison because probation
sentences count as zero for these calculations (Offenders sentenced to straight probation are
assigned prison terms of length zero) However we will provide sensitivity testing of this selection
criterion showing that findings are insensitive to the criterion
Insert Table 2 about here
Inspection of Table 2 shows some irregularities in the progression of sentence severity
especially for the least serious offense levels but the general pattern is that prison terms become
increasingly certain as we look down the table (from least to most serious crimes) and across the
table (from least to most serious offenders) Inspection of Table 3 which reports average time-
served (counting probation as zero) also shows some irregularities but the general pattern is that
32
The Relationship between Prison Length of Stay and Recidivism -- This report was prepared by Abt Associates using Federal funding provided by the Bureau of Justice Statistics (BJS) Opinions andor points of view expressed are those of the author(s) and do not necessarily reflect the official position or policies of the US Department of Justice
average time-served in prison increases as we look down the table (from least to most serious
crimes) and across the table (from least to most serious offenders)
The irregularities cause a problem for the RDD If the RDD compared cells j with j+1 for a
RDD strategy to work we must observe a substantial increase in the average time in prison as we
compare cell j with cell j+1 Logically small changes fail to create a credible contrast Looking
especially at Table 3 several cell j and j+1 contrasts fail to meet this criterion The problem is that
moving from cell j to cell j+1 is a subtle shift and we find a better comparison to be between cell j
and j+2 This is the reason for using a jj+2 comparison instead of a jj+1 comparison Although
comparing cells j and j+2 may raise validity issues whatever bias is introduced is likely to be small
and from a mean-squared-error perspective comparing jj+2 instead of jj+1 seems justified
However as a sensitivity test we also report estimates based on a comparison of cells j and j+1 and
qualitative results prove insensitive to whether the comparison is between jj+1 or jj+2
Insert Table 3 about here
One more table is useful for summarizing the recidivism measure Table 4 reports the
percentage of offenders who recidivate during their periods of community supervision These
statistics are right-hand-censored by the length of the time-at-risk and capped at three years They
do not account for censoring due to supervision terms less than three years Although most
offenders avoid returning to prison returning to prison is not an infrequent occurrence At this
descriptive stage of the analysis patterns may seem peculiar Looking down each column recidivism
rates are lower for offenders incarcerated for the most serious crimes and higher for offenders
incarcerated for the least serious crimes Although as description this pattern is correct the effect is
probably not causal It seems likely that offenders who serve the longest terms are older when
released from prison than are offenders who serve the shortest terms and given that age is
33
The Relationship between Prison Length of Stay and Recidivism -- This report was prepared by Abt Associates using Federal funding provided by the Bureau of Justice Statistics (BJS) Opinions andor points of view expressed are those of the author(s) and do not necessarily reflect the official position or policies of the US Department of Justice
predictive of recidivism the patterns may be partly a result of age Reading across the table
recidivism tends to increase with criminal history but small sample sizes for the most serious
criminal history scores may be responsible for imprecise estimates
Insert Table 4 about here
Intended as a summary of the patterns shown by Table 4 Figure 1 presents survival curves
based on Kaplan-Meier estimates stratified by criminal history categories To be included in this
analysis an offender had to be sentenced within a guideline cell with 100 or more offenders and at
least 50 percent of offenders within that cell must have received prison terms Those restrictions are
consistent with the restrictions imposed for the principal analysis presented later However the
figure changes very little when the restrictions are removed In general as the criminal history
category increases so too does the rate of recidivism although the difference between criminal
history categories 5 and 6 is barely perceptible
Insert Figure 1 about here
Table 5 extends the descriptive analysis appearing in Figure 1 to include covariates (The
table reports parameters from a Cox model not relative hazards) The regression is naiumlve in the
sense that it does not account for potential confounding variables that might ndash if known ndash explain
why recidivism falls as the offense severity level (and hence time-served) increases This regression
uses variables that will reappear in the local linear regressions that we use for the RDD analyses
Separate Cox regressions are reported for each criminal history category
Scaled time-served This is estimated time-served rescaled by dividing the original time-served by
the maximum time-served Time-served is capped at 180 months The cap is
inclusive of more than 99 percent of terms
34
The Relationship between Prison Length of Stay and Recidivism -- This report was prepared by Abt Associates using Federal funding provided by the Bureau of Justice Statistics (BJS) Opinions andor points of view expressed are those of the author(s) and do not necessarily reflect the official position or policies of the US Department of Justice
Time-served squared This is the square of scaled time-served
Scaled age This is the offender age at the time that he or she entered community
supervision rescaled to run from 0 to 1
Age squared This is scaled age squared
Female This is a dummy variable for female
Black This is a dummy variable for Black
Other race This is a dummy variable for race other than White or Black
Hispanic This is a dummy variable for Hispanic ethnicity It is not collinear with the
race variables
High school This is a dummy variable indicating the offender has a high school degree or
equivalent
Advanced degree This is a dummy variable indicating the offender has a degree beyond high
school
Lives alone This is a dummy variable indicating the offender is neither married nor living
in a common law relationship at the time of sentencing
Centered CH points The guidelines assign criminal history points based on criminal records that
are collapsed into the six criminal history categories The criminal history
points are centered to have a mean of zero for each guideline cell
District This is the judicial district where the sentence was imposed There are 94
federal districts including those in territories District enters the analysis
35
The Relationship between Prison Length of Stay and Recidivism -- This report was prepared by Abt Associates using Federal funding provided by the Bureau of Justice Statistics (BJS) Opinions andor points of view expressed are those of the author(s) and do not necessarily reflect the official position or policies of the US Department of Justice
when estimating the frailty parameter that is as a random effect associated
with the Cox model
Because they run from zero to one scaled variables are useful for interpreting quadratics
The centered criminal history points provide a more refined measure of criminal record beyond the
broader criminal history category Centering this score is unimportant for the results presented in
Table 5 but centering is useful for later analyses
Insert Table 5 about here
As description the estimates appearing in Table 5 tell a simple story As best as a quadratic
can capture the pattern recidivism falls as time-served increases after accounting for the criminal
history category The declines are substantial and tend to be greater (but not consistently) for those
with minor criminal records (category 1) than for those with serious criminal records (categories 2-6
exclusive of 5) As an illustration when time-served changes from 30 months to 60 months the
relative hazards from criminal history 1 to criminal history 6 are 081 074 072 075 081 and 077
respectively14
Except regarding age other parameters are less interesting for this current study because
they tell us nothing about how recidivism changes with time-served (Women are less recidivistic
than men Blacks and other races are more recidivistic than Whites Hispanics tend to be less
recidivistic than non-Hispanics The educated are less recidivistic than the under-educated Marital
association appears to have no predictive effect The relative importance of these covariates
appears to decrease as criminal history increases) The inverse relationship between recidivism and
2
180
3060
180180 180
60 3014 For example the relative hazard for criminal history category 1 equals exp 1707
0941
minus+minusminus
2
36
The Relationship between Prison Length of Stay and Recidivism -- This report was prepared by Abt Associates using Federal funding provided by the Bureau of Justice Statistics (BJS) Opinions andor points of view expressed are those of the author(s) and do not necessarily reflect the official position or policies of the US Department of Justice
time-served cannot be explained by age If we were to accept results from this naiumlve regression we
would conclude that longer prison terms cause recidivism to fall dramatically (up to 28 percent for a
30-month increase) but we are reluctant to attach causality to these regression results because we
cannot be sure that all confounding factors have been considered Hence we turn to the RDD
The results reported in Table 5 suggest that marital status does not predict recidivism
Because this variable is frequently missing we drop it from the following analysis The ethnic status
Hispanic sometimes predicts recidivism but the effect is not large and this variable is often missing
Consequently we also drop the ethnic category Hispanic from the following analysis
ESTIMATES OF THE EFFECT THAT INCREASING TIME-SERVED HAS ON
RECIDIVISM
The previous section described data sources and gross patterns in those data This section
presents evidence based on a regression discontinuity design For every jj+2 contrast we compute
a unique effect as a log-relative hazard Potentially this leads to 6x41 effects because there are 41
possible contrasts within each criminal history category and there are 6 criminal history categories
In fact we produce fewer estimates because data selection rules exclude some of the contrasts The
number entering the analysis depends on the sensitivity tests but 175 contrasts appear in the
principal analysis
For each contrast between cells j and j+2 we estimate a Cox survival model15 The effect size
is the parameter associated with a dummy variable coded 1 for cell j+2 and coded zero for cell j The
15 By default we estimated a Cox model with covariates and shared frailty the covariates and criterion for the shared frailty are described in the text Sometimes to estimate the model we removed the shared frailty parameter in which case we estimated the relative hazard using the covariates but not the shared frailty given the RDD the relative hazard is still
37
The Relationship between Prison Length of Stay and Recidivism -- This report was prepared by Abt Associates using Federal funding provided by the Bureau of Justice Statistics (BJS) Opinions andor points of view expressed are those of the author(s) and do not necessarily reflect the official position or policies of the US Department of Justice
outcome measure is returning to prison following placement on community supervision or being
revoked from supervision (When an offender enters community supervision multiple times we only
include the first period of supervision in the analysis) Time at risk is censored by the end of the
study period or by the end of community supervision or at three years if supervision is ongoing after
three years Censoring by the end of community supervision is important because thereafter an
offender cannot return to federal prison unless he or she is convicted of a new federal crime
Fundamentally once an offender successfully completes his term of community supervision the FJSP
no longer tracks his criminality so the study cannot extend beyond the end of community
supervision Occasionally an offender may serve his entire sentence and then commit a new federal
crime Although he or she would reappear in the FJSP we only consider the first conviction
When applying a RDD identification strategy researchers are careful to justify that two
conditions hold Translated into the current setting where we compare outcomes in cell j and j+2
the two conditions are (1) on average time-served in cell j+2 must be greater than time-served in
cell j (2) There must be no other differences between offenders in cells j and j+2 that could account
for differences in recidivism In practice this second condition is difficult to establish By
construction of the guidelines and given the fact that we compare cells j and j+2 along the offense
seriousness dimension and never along the criminal history dimension we are confident this
condition holds Nevertheless an indirect empirical test is whether the guidelines cause offenders in
cell j+2 to look systematically different than offenders in cell j This is testable
By the design of the guidelines we anticipate that variables sometimes associated with
recidivism will have about the same mean values in cell j as in cell j+2 Of course we expect time-
consistent Sometimes to estimate the model we removed both shared frailty and the covariates in which case we estimated the relative hazard with just an indication the data came from cell j rather than j+2 Again given the RDD the estimate of relative hazard is consistent but not efficient If we could not estimate the relative hazard the estimate is reported as missing
38
The Relationship between Prison Length of Stay and Recidivism -- This report was prepared by Abt Associates using Federal funding provided by the Bureau of Justice Statistics (BJS) Opinions andor points of view expressed are those of the author(s) and do not necessarily reflect the official position or policies of the US Department of Justice
served to differ between cell j and cell j+2 and it does by 54 months on average (Plt001) If this
difference were not large there would be little point to the analysis
On average other variables do not change significantly between cell j and j+2 16 We tested
the following variables date of birth educational attainment sex race Hispanic status marital
status date when sentenced and criminal history point score The differences were small and none
approached statistical significance The results for criminal history point score seem especially
important because we consider this variable to be highly correlated with recidivism The fact that
the criminal history point score does not change systematically from cell j to j+2 suggests that
offenders in cell j+2 are not inherently more or less recidivistic than are offenders in cell j Therefore
the data pass this diagnostic test
While the inclusion of covariates may be unnecessary for identification including covariates
in the Cox regression is expected to reduce residual variance and improve the precision of the
estimates As noted the principal variable is a dummy variable coded one if the observation is from
cell j+2 and coded zero if from cell j Other covariates with the noted exceptions are the same as
were used in the naiumlve regression Obviously we have also excluded the scaled time-served variable
and its square Because there are 41x6 possible regressions (175 in this main application) we do not
show the regression results from this stage of the analysis Instead we report the single parameter of
interest (the average effect) for each regression in graphical form
Within each criminal history category the Cox model estimates the hazard of recidivism for
offenders in category j+2 relative to offenders in category j holding covariates constant Using the
16 The change is computed for every jj+2 pair The statistics reported in the texts are a weighted average of those pair comparisons Weights equal the inverse of the sampling variances Because of the distribution of offenses within the guidelines the least serious criminal history categories and the middle of the offense seriousness range dominate the calculations Arguably the estimates are not independent so standard errors are suspect Nevertheless the estimates of differences between cells j and j+2 are not biased and these average differences are small
39
The Relationship between Prison Length of Stay and Recidivism -- This report was prepared by Abt Associates using Federal funding provided by the Bureau of Justice Statistics (BJS) Opinions andor points of view expressed are those of the author(s) and do not necessarily reflect the official position or policies of the US Department of Justice
log-relative hazard (eg the parameter that is exponentiated to get the relative hazard) the next step
is to estimate a regression where the estimated log-relative hazard is the dependent variable and the
independent variable is the centered offense seriousness level This is the meta-regression It is
specific to a criminal history category so there are six meta-regressions This specification allows us
to examine how the log-relative hazard varies over the offense seriousness levels That is the
regressions allow us to combine effects (our main motivation) and test for heterogeneity (a
secondary motivation)
Effects may be heterogeneous across offense seriousness levels for two reasons For one
offenders convicted of the most serious crimes who serve the longest prison terms may respond
differently to incremental increases in the lengths of their terms than do offenders convicted of the
least serious crimes who serve the shortest prison terms For another for offenders convicted of
the most serious crimes the incremental change in the length of a prison term from cell j to j+2 is
much larger than the incremental change for offenders convicted of the least serious crimes (See
Table 3) Heterogeneity in treatment effects seems likely but how that heterogeneity varies with
offense severity level is uncertain Examining Tables 1-3 recalling the selection rules and recalling
that we are using weighted least squares regression to estimate the heterogeneity information used
by the regression comes mostly from the middle offense seriousness levels so incremental changes
to time-served are fairly constant Quite possibly there is heterogeneity but we will have insufficient
power to detect it
As before the analysis is stratified on the criminal history category so for each regression
there are potentially 41 data points but many fewer (29 to 37 in the main analysis) enter the meta-
regression because of selection criteria identified earlier Referring to Tables 1 and 2 almost all the
lost contrasts come from having too few cases per cell or from having a low proportion of prison
40
The Relationship between Prison Length of Stay and Recidivism -- This report was prepared by Abt Associates using Federal funding provided by the Bureau of Justice Statistics (BJS) Opinions andor points of view expressed are those of the author(s) and do not necessarily reflect the official position or policies of the US Department of Justice
terms per cell referring to Table 3 few cells (and hence contrasts) are lost because average prison
terms do not increase from cell j to j+2 Because the RDD identifies the effect the right-hand-side
variables are not control variables rather the meta-regression is a descriptive device (with statistical
implications) helping us to detect possible patterns
Estimation has multiple steps We summarize with an algorithm
1 Select all offenders from criminal history category k = 1
a Select all offenders with offense seriousness levels j = 1 and j = 3 If the jj+2 contrast
does not meet selection criteria increase j by 1 and try again
b It the jj+2 contrast meets the selection criteria estimate a Cox regression where a
dummy variable is coded 1 for offenders in offense seriousness level j+2 and coded 0
for offenders in offense seriousness level j The parameter associated with this
dummy variable is the log-relative hazard for the jj+2 contrast Save this estimate
c Increase j by 1 and repeat steps a-c until j = 41
d Estimate a meta-regression where the dependent variable is the log-relative hazards
from steps a-c The independent variables are a constant and the centered offense
seriousness level equal to j+2 for the jj+2 contrast Save the estimated constant and
its standard error for use in step 3
2 Repeat steps 1a-d for criminal history categories 1-6 This leads to six estimated constants
and six estimated standard errors for step 3
3 For step 3 create weights proportional to the inverse of the squares of the six standard
errors The final estimate is the weighted average of the six estimated constants This is
interpreted as the average log-relative hazard Results are discussed below
41
The Relationship between Prison Length of Stay and Recidivism -- This report was prepared by Abt Associates using Federal funding provided by the Bureau of Justice Statistics (BJS) Opinions andor points of view expressed are those of the author(s) and do not necessarily reflect the official position or policies of the US Department of Justice
MAIN RESULTS
The main model adopts the following selection criteria
bull For a guideline cell to be included in the analysis 100 or more offenders must appear within that cell
bull For a guideline cell to be included in the analysis 50 or more of offenders must have received prison terms
Comparisons are of outcomes in cell j+2 and cell j
The main results are shown in Figure 2 The figure shows patterns in the relative hazards and
associated statistics The figure has six panels one for each of the criminal history categories
Within each panel the vertical axis is the scale for the relative hazard as estimated by the Cox model
A hazard equal to 1 implies that increasing prison time has a neutral effect on recidivism A hazard
greater than 1 implies that increasing prison time increases recidivism a hazard less than 1 implies
that increasing prison time decreases recidivism The horizontal axis corresponds to the contrast
The offense seriousness level of 3 is the contrast between offense seriousness levels 1 and 3 the
offense seriousness level of 4 is the contrast between levels 2 and 4 and so on until level 43 Within
each panel the dots report the relative hazards as estimated using the Cox model When we could
not estimate the relative hazard because of the cell exclusion criteria the point is missing The
vertical lines surrounding the dots are 95 confidence intervals for the relative hazards They are
non-symmetric and when the confidence interval extends above 25 it is truncated at 25 for
improved resolution of the figures The three lines running left to right come from the regression
the straight line shows the prediction and the curved lines represent a 95 confidence interval for
the regression line ndash not to be confused with a 95 confidence interval for a predicted point
explaining why many points fall outside the confidence interval for the regression
Insert Figure 2 about here
42
The Relationship between Prison Length of Stay and Recidivism -- This report was prepared by Abt Associates using Federal funding provided by the Bureau of Justice Statistics (BJS) Opinions andor points of view expressed are those of the author(s) and do not necessarily reflect the official position or policies of the US Department of Justice
The table below the figure shows associated statistics from the meta-regression Recall the
dependent variable is the parameter associated with the log-relative hazard ndash that is the natural
logarithm of the relative hazard The row specified as ldquolinearrdquo identifies the centered offense
severity level variable entering the weighted least squares meta-regression The simple regression
specification has a constant and a term that is linear in the centered offense severity level Because
the estimator is weighted least squares and given the offense severity level is centered the constant
is the weighted average effect across the contrasts It is our principal interest R2 has its usual
interpretation but note that any ldquoexplained variancerdquo is attributable to the linear trend because we
are most interested in the constant R2 is not an especially important statistic and certainly has no
interpretation as the ldquogoodness of fitrdquo for our purposes because the constant does not contribute to
R2 At a maximum the regression would be based on 41 observations (N in the table) but fewer data
points enter the analysis because (as already discussed) we discarded contrasts that failed to meet
predetermined criteria
The table below the figure requires some additional explanation Recall the right-hand-side
variable was centered so the constant can be interpreted as an average A constant of zero is
neutral implying that on average additional prison time neither increases nor decreases recidivism
A positive constant implies that additional prison time increases recidivism a negative constant
implies that additional prison time decreases recidivism Converting these constants into a hazard
metric just requires exponentiation Letting α be the constant exp(α) is the relative hazard Letting
σ2 represent the constantrsquos estimated sampling variance by the delta rule the estimated sampling
variance for the hazard is exp(α)2 σ2 These transformations are employed when drawing Figure 2
Examining the table below Figure 2 the constant is negative and statistically significant in all
six regressions On average the estimated constant equals -0073 and is statistically significant with a
43
The Relationship between Prison Length of Stay and Recidivism -- This report was prepared by Abt Associates using Federal funding provided by the Bureau of Justice Statistics (BJS) Opinions andor points of view expressed are those of the author(s) and do not necessarily reflect the official position or policies of the US Department of Justice
standard error of 0007 The implied hazard is 0930 These are the inverse-variance weighted
estimates across the six criminal history categories The linear slopes have mixed signs and are never
statistically significant so we detect no heterogeneity
We must be caution about this interpretation Suppose as suggested by the evidence the
relative hazards are the same for all criminal history categories Looking at table 3 the average
increase in time-served for a move from cell j to j+2 is about 7 months for criminal history category 1
and about 10 months for criminal history category 6 Thus a somewhat larger increase in time-
served for more serious criminal history categories achieves about the same effect as a somewhat
smaller increase in time-served for less serious criminal history categories This might be taken as
some evidence of criminal history heterogeneity but if so the evidence is not especially compelling
Outliers are a potential concern in Figure 2 However when an outlier appears it is
associated with a high standard error and plays a small role in the weighted least squares regression
Therefore we conclude that outliers are not a practical concern
On average the estimated relative hazard that results from moving from cell j to cell j+2 is
0930 Qualitatively a relative hazard less than 1 implies that a longer prison term decreases
recidivism but translating this relative hazard into a quantitative decrease in the probability of
recidivism is complicated because the decrease in the probability of recidivism varies across the jj+2
comparisons A descriptive summary provides some intuition
First continue to consider the relative hazard as a metric On average across the severity
levels and the criminal history categories moving from cell j to cell j+2 increases time-served by
about 27 (On average this 27 change equals about 54 months) This is to say that a 27
increase in the length of incarceration appears to reduce the instantaneous probability of recidivism
(eg the hazard) by less than 10 percent For readers who are familiar with interpreting hazards a
44
The Relationship between Prison Length of Stay and Recidivism -- This report was prepared by Abt Associates using Federal funding provided by the Bureau of Justice Statistics (BJS) Opinions andor points of view expressed are those of the author(s) and do not necessarily reflect the official position or policies of the US Department of Justice
sizable increase in prison time (namely a 27 increase on average) has a fairly small decrease in the
relative hazard (by a multiple of 0930) Admittedly the descriptive term fairly small is subjective
and a reader can make his or her own subjective assessment
A change in the instantaneous probability of recidivism ndash the relative hazard ndash is not the
same as a change in the probability of recidivism Second then consider the probability of
recidivism as a metric We can get a sense of how a change in the relative hazard affects the
probability of recidivism Because we are using the Cox model the probability of recidivism equals
one minus the baseline survival rate to the power of the relative hazard (Hosmer Lemeshow amp May
2008 p 72) For our data the probability of recidivism is about 02 within three years (See figure
1) The relative hazard is about 0930 So a 27 increase in the length of incarceration would
decrease the probability of recidivism by about 02 ndash (1-080930) That is from a base rate of
recidivism of about 20 a 27 increase in prison time would cause recidivism to fall to about 187
Readers can draw their own conclusions but our sense is the effect is not large and that prison
length of stay has a largely neutral effect on recidivism
Once again some caution is merited If we again accept the relative hazards are about the
same across the six criminal history categories figure 1 shows the baseline rates of recidivism are
progressively higher as the criminal history category increases from k=1 to k=6 so the percentage
change in recidivism is larger for more serious criminal history categories than for the lesser criminal
history categories This might be deemed heterogeneity ndash that increasing time-served has a larger
effect on the most serious offenders We are reluctant to accept such a conclusion because it comes
from accepting the null hypothesis of constant relative hazards across the criminal history categories
More likely if such heterogeneity exists we have too little power to detect its effect
45
The Relationship between Prison Length of Stay and Recidivism -- This report was prepared by Abt Associates using Federal funding provided by the Bureau of Justice Statistics (BJS) Opinions andor points of view expressed are those of the author(s) and do not necessarily reflect the official position or policies of the US Department of Justice
It is possible to stratify the analysis by sex by race and by education ndash variables described
earlier Cell sizes get small so we restrict the analysis to offenders in criminal history category 1 and
we require a minimum of 50 offenders per cell rather than 100 For men the relative hazard is
0935 and for women it is 0931 but these differences are not statistically significant so we fail to
reject the null that prison length has the same effect on men and on women For white offenders
the relative hazard is 0936 and for black offenders the relative hazard is 0932 and the difference is
not statistically significant so we fail to reject the null that prison length has the same effect on
white and black offenders For offenders who lack high school degrees the relative hazard is 0930
and for offenders who have high school degrees the relative hazard is 0933 The difference is not
statistically significance This test based on education is not as sensitive as desired because most
offenders have high school degrees or the equivalent Overall we do not find strong evidence the
effect of time-served on recidivism is sensitive to sex race or education
We observed that an IV estimator should lead to estimates that are like the RDD estimates
We demonstrate that here The only difference between the IV and RDD approaches is that for the
IV approach the treatment variable is the mean time-served in cell j+2 or j and for the RDD
approach the treatment variable is a dummy variable denoting sentencing in cell j+2 rather than cell
j17 Interpretations differ For the IV approach the treatment effect is the change in recidivism per
month of additional time-served for the RDD approach the treatment effect is the change in
recidivism from being sentenced in cell j+2 rather than cell j These differences are scale effects we
do not expect then to change substantive interpretations
17 Instrumental variable estimation often uses a two-step approach In the first step the treatment variable (here the time served) is regressed on the instrument (and perhaps some additional variables) to predict the treatment (or in our case the average time-served) In the second step the average time-served replaces the observed time-served We compute average time-served without using the first-step regression
46
The Relationship between Prison Length of Stay and Recidivism -- This report was prepared by Abt Associates using Federal funding provided by the Bureau of Justice Statistics (BJS) Opinions andor points of view expressed are those of the author(s) and do not necessarily reflect the official position or policies of the US Department of Justice
Figure 3 reports results from the IV estimation Across the six criminal history categories the
weighted average effect size is -00122 which is statistically significant at P lt 001 While this effect
seems much smaller than the effect based on the RDD when we multiple by the average increase in
time-served between cell j and j+2 the rescaled effect is -0066 and relative hazard of a 54 month
increase in the sentence is 0936 There is no material difference between the RDD estimator and
the RDD estimator
Insert Figure 3 about here
SENSITIVITY TESTING
We conducted sensitivity tests evaluating whether the effect of length of stay on recidivism
depends on constraints we applied to produce the results shown in Figure 2 and its associated table
Minimum Cell Size of 50 instead of 100 - Figure 4 A first step in sensitivity testing is to learn
whether requiring a minimum of 50 cases instead of 100 cases per cell changes findings The
advantage to relaxing this assumption is that we gain a few data points The disadvantage is that
some of those new data points have extreme values As before the constant is always negative and
statistically significant The weighted average is -0073 with a standard error of 0007 and the
implied relative hazard is 0930 Because we use weighted least squares results do not change much
from those reported for the main model despite the expansion of sample size estimates with large
standard errors do not contribute much to the regression
Insert Figure 4 about here
Minimum cell size of 150 instead of 100 ndash Figure 5 If we set a criterion of 150 cases per cell instead
of 100 we lose a few data points The constant remains negative and statistically significant across
the six criminal history categories Overall the average constant is -0071 (with a standard error
47
The Relationship between Prison Length of Stay and Recidivism -- This report was prepared by Abt Associates using Federal funding provided by the Bureau of Justice Statistics (BJS) Opinions andor points of view expressed are those of the author(s) and do not necessarily reflect the official position or policies of the US Department of Justice
0008) and the corresponding relative hazard is 0931 Apparently the findings are insensitive to the
criterion for cases per cell because the weighted least squares analysis is dominated by calculations
that are based on large cell sizes For the remaining sensitivity tests we set the minimum cell size to
100
Insert Figure 5 about here
Minimum percentage of prison terms 75 instead of 50 - Figure 6 The next sensitivity test
changes the criterion for minimum percentage of prison terms to be 75 within a cell rather than
50 within a cell As expected some cells are excluded from the analysis but as before the
substantive findings do not much change The average affect is -0077 with standard error of 0009
The increased standard error is understandable Given the RDD basically calls for a difference in
mean estimates between cells j and j+2 (conditional on covariates) the effective sample size for
computing variances is the number of offenders within a cell multiplied by the proportion who are
sentenced to prison Cells with high proportions of offenders serving probation terms have high
sampling variances for two reasons (1) The effective sample size is smaller than the apparent sample
size based on the number of offenders within a cell (2) The average difference in time-served
between cells j and j+2 tends to be small (so the effect is small and has high sampling variance) for
those cells where probation is especially likely Consequently given the regressions use weights that
are inversely proportional to the sampling variance the estimates are insensitive to the criterion
establishing a minimum proportion of offenders sentenced to prison
Insert Figure 6 about here
Contrasts that are j and j+1 instead of j and j+2 ndash Figure 7 We believe that contrasts observed by
comparing cells j and j+2 are more appropriate for this analysis than contrasts observed by
comparing cells j and j+1 because the contrast between j and j+2 provides assurance that average
48
The Relationship between Prison Length of Stay and Recidivism -- This report was prepared by Abt Associates using Federal funding provided by the Bureau of Justice Statistics (BJS) Opinions andor points of view expressed are those of the author(s) and do not necessarily reflect the official position or policies of the US Department of Justice
prison terms increase by a substantial amount This assurance is not forthcoming when comparing
cells j and j+1 Nevertheless increasing the distance between compared cells raises validity
challenges because the RDD rests on an assumption that offenders within both compared cells are
alike in ways that affect recidivism The closer the cells the more justified the assumption For this
sensitivity test we maintain the original criteria for selecting cells but contrast cell j with cell j+1
(We discard contrasts where the average sentence in cell j+1 is less than the average sentence in cell
j) Averaged across the six estimates the estimated constant is -0030 with a standard error of 0013
This is statistically significant at P lt 005 The relative hazard is 0970 While results from the jj+1
contrasts are smaller than those from the jj+2 contrasts this is expected because the jj+2 contrast
results in a larger increase in time-served and consequently a larger effect
Insert Figure 7 about here
Contrasts testing for auto-correlation using the Prais-Winston estimator ndash Figure 8 The analysis
immediately above which changed the comparison from cells jj+2 to cells jj+1 suggests another
sensitivity test Earlier we commented that by construction we may have induced autocorrelation in
the data used for the final step regression For example consider the estimated hazard for cells j and
j+1 and the estimated hazard for cells j+1 and j+2 The estimates have j+1 in common and this may
introduce first-order autocorrelation into the analysis Following recommendations from Greene we
have elected to ignore this complication because commonly used corrections have uncertain small
sample properties However we can test how much the autocorrelation affects the results using a
Prais-Winston estimator a feasible generalized least squares estimator that corrects for first-order
autocorrelation
Insert Figure 8 about here
49
The Relationship between Prison Length of Stay and Recidivism -- This report was prepared by Abt Associates using Federal funding provided by the Bureau of Justice Statistics (BJS) Opinions andor points of view expressed are those of the author(s) and do not necessarily reflect the official position or policies of the US Department of Justice
A problem when using the Prais-Winston estimator is that we cannot simultaneously adjust
for autocorrelation and heteroscedasticity To correct estimated standard errors we can employ a
robust covariance estimator but this is problematic in two ways First without adjusting for
heteroscedasticity during parameter estimation the solution is inefficient because the data points
with large standard errors receive the same weight as the data points with low standard errors
Figure 2 suggests the inefficiency can be large Second the Prais-Winston estimator assumes
homoscedasticity but we know that our data are heteroscedastic To deal with this problem we
adopt restrictions (1) There must be 150 observations per cell and (2) at least 75 of offenders
within any cell must receive prison terms The idea is to minimize heteroscedasticity and we have
already seen that imposing these restrictions has little effect on results Allowing the contrast to be
jj+1 which may cause a one-lag autocorrelation we use a Prais-Winston estimator to estimate the
effects
The sensitivity test is encouraging The estimates for ρ the autocorrelation efficient have
mixed signs We take this wide variation in the estimates of ρ to mean the estimates are imprecise
Apparently provided we restrict estimates to cells with enough offenders we induce modest
autocorrelation and our decision to ignore autocorrelation seems justified Second basing the
results on the Prais-Winston estimator does not make a big difference in the findings The average
value for the constant is -0042 with a standard error of 0008
Separating contrasts into independent sets ndash Tables 6 and 7 Another approach to dealing with
autocorrelation is straightforward and can be performed with the jj+2 contrasts and both the 100
observations per cell criterion and the 050 prison sentence criterion To explain consider the
contrasts based on cells 13 24 35 46 57 and so on The contrasts 13 and 24 are
independent and the contrast 35 and 46 are independent but the contrasts 13 and 35 are not
50
The Relationship between Prison Length of Stay and Recidivism -- This report was prepared by Abt Associates using Federal funding provided by the Bureau of Justice Statistics (BJS) Opinions andor points of view expressed are those of the author(s) and do not necessarily reflect the official position or policies of the US Department of Justice
independent because they both rely on cell 3 A solution is to break the analysis into two parts In
the first part we use the contrasts 13 24 57 68 and so on in the second part we use the
contrasts 35 46 79 810 and so on For each analysis the effects can be averaged across the
criminal history categories and then across the two analyses For the first analysis the effect is -
0034 with a standard error of 0018 For the second analysis the effect is -0106 with a standard
error of 0030 significant at p lt 001 The average effect is -0067 with a standard error of 0018
Recalling the effect from the main analysis was -0073 with a standard error of 0007 these new
results are very close even though they are based on a different weighting scheme (a result of
running two regressions instead of one) As with the previous test we take this sensitivity test as
evidence that provided we restrict the effective number of observations per cell results are
insensitive to autocorrelation
Insert Table 6 and Table 7 about here
Entering prison as recidivism ndash Figure 9 An additional sensitivity test returns to the original model
specification whose results were presented in Figure 2 and changes the definition of recidivism from
ldquoentering prison or being revoked from community supervisionrdquo to ldquoentering prisonrdquo We are unsure
of the best definition of recidivism but it appears the definition does not much matter The
estimated effects are about the same The log-relative hazard is -0076 with a standard error of
0007 the relative hazard is 0927 The rate of recidivism is about 20 percent using the
comprehensive definition of returning to prison or being revoked and slightly less than 19 percent
when using the more restrictive definition of returning to prison so consistency between the main
results and results from this sensitivity test is not surprising
Insert Figure 9 about here
51
The Relationship between Prison Length of Stay and Recidivism -- This report was prepared by Abt Associates using Federal funding provided by the Bureau of Justice Statistics (BJS) Opinions andor points of view expressed are those of the author(s) and do not necessarily reflect the official position or policies of the US Department of Justice
Eliminating drug law offenders from the analysis ndash Figure 10 A final analysis recognizes that drug
law violations are somewhat peculiar to the federal system High-level drug dealing is often dealt
with in the federal system because cross-border drug dealing is a federal law enforcement
responsibility the federal government has more resources for dealing with high-level drug dealing
than do state governments and even when state and federal authorities collaborate federal
prosecution is typical because federal sentences are more severe18 Judges frequently sentence
high-level drug dealers to Congressionally-mandated mandatory minimums so for high-level drug
dealers the guidelines operate differently than described earlier Another sensitivity test results
from removing drug-law violators from the analysis
Insert Figure 10 about here
With the removal of drug-law violations fewer cells enter the analysis but the parameter estimates
do not change much so qualitative conclusions do not change The average effect is -0060 with a
standard error of 0008 This is statistically significant at plt001 Dropping drug law violators does
not alter conclusions
Eliminating covariates from the analysis ndash Figure 11 Reviewers of an earlier version of this study
wondered if findings based on Cox regressions with no covariates would be the same as findings
based on Cox regressions with covariates After eliminating covariates the weighted average effect
is -0073 with a standard error of 0008 Removing covariates has caused the standard error to
increase by about 10 but has not altered substantive conclusions This is sensible The covariates
were unnecessary for identification but they have the potential to reduce standard errors
18 This assertion is based on the authorsrsquo extensive experience performing program reviews for High Intensity Drug Trafficking Areas multijurisdictional drug task forces with federal state and local participation Our team has visited all 28 HIDTAs over a five-year period The assertion made in the text is based on those visits
52
The Relationship between Prison Length of Stay and Recidivism -- This report was prepared by Abt Associates using Federal funding provided by the Bureau of Justice Statistics (BJS) Opinions andor points of view expressed are those of the author(s) and do not necessarily reflect the official position or policies of the US Department of Justice
Figure 11 about here
Using the Earlier Guidelines ndash Figure 12 Reviewers of an earlier version of this study also observed
that guidelines have changed over the period of this study and expressed concern that these changes
may affect conclusions We doubt these changes matter because cell j+2 has always had longer
terms than cell j Nevertheless in response to reviewersrsquo concerns we identify the mean date for
guidelines entering the analysis and we perform the analysis on just those offenders sentenced
under the guidelines prior to that mean date The effect is ndash 0088 with a standard error of 0009
The relative hazard is 0916 It seems unlikely that changes to the guidelines account for findings
Figure 12 about here
Examining offenders sentenced during the earlier years provides another implicit diagnostic test
Because the analysis is based on offenders who completed their prison terms and were released to
community supervision offenders with high offense seriousness scores or high criminal history
scores and therefore long prison terms are unlikely to enter they analysis when sentenced close to
the data collection period Any resulting bias is lessened by restricting the analysis to offenders
sentenced during the early part of the data collection period If there is a selection bias it does not
appear to be serious
Summarizing the sensitivity testing From the principal analysis the estimated average effect across
the six criminal history categories was -0073 with a standard error of 0007 Provided we contrast
outcomes in cells j and j+2 results do not much change over sensitivity tests and even when we
contrast outcomes in cells j and j+1 results conform with expectations
53
The Relationship between Prison Length of Stay and Recidivism -- This report was prepared by Abt Associates using Federal funding provided by the Bureau of Justice Statistics (BJS) Opinions andor points of view expressed are those of the author(s) and do not necessarily reflect the official position or policies of the US Department of Justice
DISCUSSION
The effect of prison length of stay on recidivism has implications for both theory and policy
From a theoretical perspective incarceration is a potentially transformative event experienced
during an offenderrsquos life course This study provides no evidence that an offenderrsquos criminal
trajectory is negatively affected ndash that is that criminal behavior is accelerated ndash by the length of an
offenderrsquos prison term If anything longer prison terms modestly reduce rates of recidivism beyond
what is attributable to incapacitation This ldquotreatment effectrdquo of a longer period of incarceration is
small The three-year base rate of 20 recidivism is reduced to 187 when prison length of stay
increases by an average of 54 months We are inclined to characterize this as a benign close to
neutral effect on recidivism From a policy perspective prison length of stay can be reduced without
incurring a large increase in recidivism
All observational studies come with validity challenges Still a regression discontinuity
design is a strong quasi-experimental design and we have argued the guidelinesrsquo structure satisfies
the assumptions of an RDD We conducted many sensitivity tests to assess the robustness of the
results The findings require qualification Because of limitations in the bandwidth of an RDD design
we are unable to examine how long prison terms (say five years) affect recidivism relative to
relatively short terms (say two years) The logic of the RDD forces us to compare prison terms of
length L relative to prison terms that are about 27 longer While this is a limitation in the
application of the RDD design it seems unlikely that Congress or the US Sentencing Commission
would reduce terms by a large percentage but not inconceivable that they might reduce prison
terms by a small percentage Thus these findings ndash limited to small changes in prison terms ndash have
implications for sentencing reform
54
The Relationship between Prison Length of Stay and Recidivism -- This report was prepared by Abt Associates using Federal funding provided by the Bureau of Justice Statistics (BJS) Opinions andor points of view expressed are those of the author(s) and do not necessarily reflect the official position or policies of the US Department of Justice
A secondary goal of this research was to examine potential heterogeneity in the effects of
prison length of stay To evaluate heterogeneity we examine whether exogenous covariates
moderate the effect of length of stay Neither offense seriousness nor criminal history moderate the
effect of prison length of stay In the context of federal sentencing these would be two of the most
important potential moderators of prison length of stay The Sentencing Reform Act of 1984
precludes federal judges from using demographic factors in assigning sentences even if these are
empirical moderators of the effect of prison length of stay We also found the effect of time-served
on recidivism was invariant with respect to sex race and education
One class of moderators suggested by Mears Cochran and Cullen (2014) is the level of post-
release supervision In many state jurisdictions a sizable number of offenders are released without
supervision For those released to supervision the level of community control and surveillance is
usually commensurate to risk This source of heterogeneity is limited in the federal context because
everyone receives a term of post-release supervision We censored anyone whose supervision ended
prior to the end of the three-year follow-up period Post-release supervision is also a potential source
of bias as suggested by Roodman but we could eliminate this potential artifact because everyone in
our sample received a term of post-release supervision and they were censored when that term
ended
Some additional caveats are applicable First the results apply to adults Rarely appearing in
federal court juveniles are excluded from the analysis Second we offer no comparison between
adult offenders sentenced to prison rather than probation Third although there is considerable
overlap between federal and state crimes jurisdictional differences cause federal crimes to differ
from state crime counterparts so the relationship between prison terms and recidivism at the state
level may differ from the relationship at the federal level These are important inter-jurisdictional
55
The Relationship between Prison Length of Stay and Recidivism -- This report was prepared by Abt Associates using Federal funding provided by the Bureau of Justice Statistics (BJS) Opinions andor points of view expressed are those of the author(s) and do not necessarily reflect the official position or policies of the US Department of Justice
differences but by removing offenders who were deported or transferred to other authorities we
have made the federal offenders look more like state offenders and when we exclude high-level
drug traffickers results do not much change Furthermore federal jurisdiction is national while
state jurisdictions are local so a study based on national data has a stronger claim to generalizability
It is difficult to see how federal and state crimes are so different that criminologist can disregard
these findings A further limitation of our findings is that they apply only to offenders who receive a
term of community supervision after their release May states have offenders who receive no such
post-release supervision
While some scholars might consider the federal system unique and our results limited to
federal offenders there are many structural differences among states that often preclude
generalizations beyond a specific state as well Even if these findings are not generalizable to state
jurisdictions the federal prison population is about 12 percent of all incarcerated offenders and
represents a significant public policy concern
As we mentioned the RDD framework only allows us to examine relatively small increments
in time-served ndash about 54 months on average Although these are small relative changes these are
not small absolute changes Five additional months in prison is a serious disruption of an offenderrsquos
life and the associated cost savings of a five-month reduction in federal prison length of stay would
save substantial capital and operational costs We make a back-of-the-envelope estimate of potential
savings in prison beds The current average federal prison length of stay for federally sentenced
prisoners is about 35 months A reduction of 5 months in a steady state system would reduce the
prison population over time by 15 percent Given the current Bureau of Prisons inmate population of
195000 a 15 percent reduction would save 29000 beds Under this scenario the BOP could close
prisons rather than simply reduce the prison population in each of its facilities saving both
56
The Relationship between Prison Length of Stay and Recidivism -- This report was prepared by Abt Associates using Federal funding provided by the Bureau of Justice Statistics (BJS) Opinions andor points of view expressed are those of the author(s) and do not necessarily reflect the official position or policies of the US Department of Justice
operational and maintenance costs This back-of-the-envelope calculation shows that small
decrements in length of stay can have large impacts when they are not confined to select subgroups
of offenders
Amplifying this latter point one of the advantages to evaluating prison length of stay is that
any change will have a broad impact on the entire incarcerated population Most contemporary
reforms such as those found in states which implemented the Justice Reinvestment Initiative (JRI)
seek to move the least serious offenders convicted of the least serious crimes from prison to
community corrections (La Vigne et al 2014) Low-level offenders are a very small proportion of
federal prison stocks and based on tabulations from the National Corrections Reporting Program
they are also a small proportion of state prison stocks A policy shift that reduces the length of all
federal prison terms by 27 percent would reduce the federal prison stock by about 29000 inmates
without unduly harming public safety This policy change would have a bigger impact on the federal
prison population than diverting offenders with low offense seriousness and minor or no criminal
history
Prisons are expensive and reducing prison stays has the potential to save public expenditures
(La Vigne et al 2014) Nevertheless advocates of general deterrence and incapacitation might
argue that maintaining or even increasing the length of prison stays is worth the additional expense
and at least increasing prison stays will not make offenders any more criminogenic Nagin et al
(2009) propose a theoretical model that frames these questions distinguishing between high and low
sanction regimes Higher sanction regimes have a higher probability of imprisonment and longer
length of stay than low sanction regimes This model specifies relationships between these relative
regimes the size of the prison populations sizes of the populations with and without a prison record
and the underlying crime rate The model provides a framework for addressing the interrelationship
57
The Relationship between Prison Length of Stay and Recidivism -- This report was prepared by Abt Associates using Federal funding provided by the Bureau of Justice Statistics (BJS) Opinions andor points of view expressed are those of the author(s) and do not necessarily reflect the official position or policies of the US Department of Justice
among these factors without precisely specifying how the outputs change under the low and high
sanction regimes It is straightforward to postulate that high sanction regimes will produce more
people with criminal records however the impact of a high sanction regime on the crime rate is
uncertain High sanction regimes may preclude more crime through general deterrence but may
increase crime if imprisonment is criminogenic not just for the individual but for the prisonerrsquos
family and the community (NRC 2014) The marginal effects and the sizes of the subpopulations
affected will determine the impact on crime rates If we could analyze all the system dynamics of this
model simultaneously we could optimize the level of sanctions to minimize the crime rate In the
absence of such a comprehensive model policy goals should be circumscribed If length of stays
were reduced incrementally it is hard to see how this would have more than a minor effect on crime
through any general deterrent mediated impact and from our results through any criminogenic
impact on the offender
Savings from reduced prison usage can be diverted into evidence-based programs that
reduce offending but such diversion is unlikely as most JRI states have put savings into other non-
justice programs (La Vigne et al 2014) Even if these funds are diverted to other social welfare
programs higher education or other state and local needs we would expect a net social welfare
benefit
58
The Relationship between Prison Length of Stay and Recidivism -- This report was prepared by Abt Associates using Federal funding provided by the Bureau of Justice Statistics (BJS) Opinions andor points of view expressed are those of the author(s) and do not necessarily reflect the official position or policies of the US Department of Justice
REFERENCES
Andrews D A and James Bonta 2006 The Psychology of Criminal Conduct 4th ed Cincinnati Anderson Pub
Andrews D A Ivan Zinger Robert D Hoge James Bonta Paul Gendreau and Francis T Cullen 1990 Does Correctional Treatment Work A Clinically Relevant and Psychologically Informed Meta-Analysis Criminology 28 (3) 369ndash404 doi101111j1745-91251990tb01330x
Angrist Joshua D 2006 Instrumental Variables Methods in Experimental Criminological Research What Why and How Journal of Experimental Criminology 2 (1) 23ndash44 doi101007s11292-005-5126-x
Becker Gary S 1968 Crime and Punishment An Economic Approach Journal of Political Economy 76 (2) 169ndash217 doi101086259394
Berecochea John E and Dorothy R Jaman and Welton A Jones 1981 Time Served in Prison and Parole Outcome - An Experimental Study Report Number 2 Sacramento
Berk Richard 2010 Recent Perspectives on the Regression Discontinuity Design Essay In Handbook of Quantitative Criminology eds Alexis Russell Piquero and David Weisburd New York Springer
Berk Richard A and David Rauma 1983 Capitalizing on Nonrandom Assignment to Treatments A Regression-Discontinuity Evaluation of a Crime-Control Program Journal of the American Statistical Association 78 (381) 21ndash27 doi10108001621459198310477917
Berk Richard A and Jan De Leeuw 1999 An Evaluation of Californias Inmate Classification System Using a Generalized Regression Discontinuity Design Journal of the American Statistical Association 94 (448) 1045ndash52 doi10108001621459199910473857
Berk Richard Geoffrey Barnes Lindsay Ahlman and Ellen Kurtz 2010 When Second Best Is Good Enough A Comparison between a True Experiment and a Regression Discontinuity Quasi-Experiment Journal of Experimental Criminology 6 (2) 191ndash208 doi101007s11292-010-9095-3
Berube Danton and Donald P Green 2007 The Effects of Sentencing on Recidivism Results from a Natural Experiment Ms The Effects of Sentencing on Recidivism Results from a Natural Experiment New Haven
Bloom Howard S 2012 Modern Regression Discontinuity Analysis Journal of Research on Educational Effectiveness 5 (1) 43ndash82 doi101080193457472011578707
Bor J Moscoe E Mutevedzi P Newell M amp Barnighausem T (2014) Regression Discontinuity Designs in Epidemiology Epidemiology 25(5) 729-737
59
The Relationship between Prison Length of Stay and Recidivism -- This report was prepared by Abt Associates using Federal funding provided by the Bureau of Justice Statistics (BJS) Opinions andor points of view expressed are those of the author(s) and do not necessarily reflect the official position or policies of the US Department of Justice
Boshier R and D Johnson 1974 Does Conviction Affect Employment Opportunities British Journal of Criminology 14 264ndash68
Braithwaite John 1989 Crime Shame and Reintegration Cambridge Cambridge University Press
Cameron Adrian Colin and P K Trivedi 2005 Microeconometrics Methods and Applications Cambridge Cambridge University Press
Carroll Leo 1988 Hacks Blacks and Cons Race Relations in a Maximum Security Prison Prospect Heights IL Waveland Press
Cattaneo Matias D Rociacuteo Titiunik Gonzalo Vazquez-Bare and Luke Keele 2016 Interpreting Regression Discontinuity Designs with Multiple Cutoffs The Journal of Politics 78 (3) doi101086686802
Chen M Keith and Jesse M Shapiro 2007 Do Harsher Prison Conditions Reduce Recidivism A Discontinuity-Based Approach American Law and Economics Review 9 (1) 1ndash29 doi101093alerahm006
Clemmer Donald 1940 The Prison Community Boston The Christopher Publishing House
Cook Thomas D 2008 lsquoWaiting for Life to Arriversquo A History of the Regression-Discontinuity Design in Psychology Statistics and Economics Journal of Econometrics 142 (2) 636ndash54 doi101016jjeconom200705002
Cullen Francis T Cheryl Lero Jonson and Daniel S Nagin 2011 Prisons Do Not Reduce Recidivism The High Cost of Ignoring Science The Prison Journal 91 (3 Suppl) doi1011770032885511415224
Deschenes Elizabeth Piper Susan Piper and Joan Petersilia 1995 Intensive Community Supervision in Minnesota A Dual Experiment in Prison Diversion and Enhanced Supervised Release Santa Monica CA RAND Corporation
DiNardo John and David S Lee 2010 Program Evaluation and Research Designs Essay In Handbook of Labor Economics eds Orley Ashenfelter and David Card Vol 4A Elsevier
Drago Francesco Roberto Galbiati and Pietro Vertova 2009 The Deterrent Effects of Prison Evidence from a Natural Experiment Journal of Political Economy 117 (2) 257ndash80 doi101086599286
Fleisher Mark S 1989 Warehousing Violence Newbury Park CA Sage Publications
Gaes Gerald G William D Bales and Samuel J A Scaggs 2016 The Effect of Imprisonment on Recommitment An Analysis Using Exact Coarsened Exact and Radius Matching with the Propensity Score Journal of Experimental Criminology 12 (1) 143ndash58 doi101007s11292-015-9251-x
Gaes Gerald G and Scott D Camp 2009 Unintended Consequences Experimental Evidence for the Criminogenic Effect of Prison Security Level Placement on Post-Release Recidivism Journal of Experimental Criminology 5 (2) 139ndash62 doi101007s11292-009-9070-z
60
The Relationship between Prison Length of Stay and Recidivism -- This report was prepared by Abt Associates using Federal funding provided by the Bureau of Justice Statistics (BJS) Opinions andor points of view expressed are those of the author(s) and do not necessarily reflect the official position or policies of the US Department of Justice
Gaes Gerald G Timothy J Flanagan Laurence L Motiuk and Lynn Stewart 1999 Adult Correctional Treatment Essay In Crime and Justice a Review of Research Prisons eds Michael Tonry and Joan Petersilia 76361ndash426 Chicago University of Chicago Press
Gendreau Paul Paula Smith and Sheila French 2008 The Theory of Effective Correctional Intervention Empirical Status and Future Directions Essay In Taking Stock The Status of Criminological Theory Advances in Criminological Theory eds T Francis FT Cullen JP Wright and KR Blevins Vol 15 New Brunswick NJ Transaction
Gendreau Paul Claire Goggin and Francis T Cullen 1999 The Effects of Prison Sentences on Recidivism 1999-3 The Effects of Prison Sentences on Recidivism 1999-3 Ottawa Canada Solicitor General
Goffman Erving 1961 Asylums Essays on the Social Situation of Mental Patients and Other Inmates Chicago Aldine
Green Donald P and Daniel Winik 2010 Using Random Judge Assignments to Estimate the Effects of Incarceration and Probation on Recidivism Among Drug Offenders Criminology 48 (2) 357ndash87 doi101111j1745-9125201000189x
Greene William H 2008 Econometric Analysis Upper Saddle River NJ Prentice Hall
Hahn Jinyong Petra Todd and Wilbert Klaauw 2001 Identification and Estimation of Treatment Effects with a Regression-Discontinuity Design Econometrica 69 (1) 201ndash9 doi1011111468-026200183
Hjalmarsson Randi (2009) Juvenile Jails A path to the straight and narrow or to hardened criminality Journal of Law and Economics 52 779-809
Horney Julie D Wayne Osgood and Ineke Haen Marshall 1995 Criminal Careers in the Short-Term Intra-Individual Variability in Crime and Its Relation to Local Life Circumstances American Sociological Review 60 (5) 655 doi1023072096316
Hosmer David W Stanley Lemeshow and Susanne May 2008 Applied Survival Analysis Regression Modeling of Time-to-Event Data Hoboken NJ Wiley-Interscience
Imbens G (2009) Better LATE Than Nothing Some Comments on Deaton (2009) and Heckman and Urzua (2009) Unpublished paper downloaded from httpwwweconomicsharvardedufacultyimbensfilesbltn_09apr10pdf on December 2 2009
Imbens Guido W and Joshua D Angrist 1994 Identification and Estimation of Local Average Treatment Effects Econometrica 62 (2) 467 doi1023072951620
Imbens Guido W and Thomas Lemieux 2007 Regression Discontinuity Designs A Guide to Practice National Bureau of Economic Research Working Paper
61
The Relationship between Prison Length of Stay and Recidivism -- This report was prepared by Abt Associates using Federal funding provided by the Bureau of Justice Statistics (BJS) Opinions andor points of view expressed are those of the author(s) and do not necessarily reflect the official position or policies of the US Department of Justice
Imbens Guido W and Donald B Rubin 2015 Causal Inference for Statistics Social and Biomedical Sciences an Introduction Cambridge Cambridge University Press
Irwin John 1980 Prisons in Turmoil Boston Little Brown
Irwin John 2005 The Warehouse Prison Disposal of the New Dangerous Class Los Angeles CA Roxbury Pub Co
Irwin John (2009) Lifers Seeking redemption in prison (Criminology and justice studies) New York Routledge
Jacobs James B 1977 Statesville The Penitentiary in Mass Society Chicago IL Chicago University Press
Jaman Dorothy R Robert M Dickover and Lawrence A Bennett 1972 Parole Outcome as a Function of Time Served British Journal of Criminology 12 (1) 5ndash34
Kalbfleisch J D and Ross L Prentice 2002 The Statistical Analysis of Failure Time Data Hoboken NJ J Wiley
Kling R W Rhodes D Izrael C Cutler K Shah and C Dyous 2016 Creating an Offender-Based Tracking System Using the FJSP Draft Final for BJS Review Cambridge MA Abt Associates
Kraus J 1981 The Effects of Committal to a Special School for Truants International Journal of Offender Therapy and Comparative Criminology 25 (2) 130ndash38 doi1011770306624x8102500205
Kuziemko I 2012 How Should Inmates Be Released from Prison An Assessment of Parole versus Fixed-Sentence Regimes The Quarterly Journal of Economics 128 (1) 371ndash424 doi101093qjeqjs052
La Vigne Nancy Samuel Bieler Lindsey Cramer Helen Ho Cybele Kotonias Deborah Mayer David McClure Laura Pacifici Erika Parks Bryce Peterson and Julie Samuels 2014 Justice Reinvestment Initiative State Assessment Report Washington DC The Urban Institute
Lancaster Tony 1990 The Econometric Analysis of Transition Data Cambridge Cambridge University Press
Lee David S and Thomas Lemieux 2010 Regression Discontinuity Designs in Economics Journal of Economic Literature 48 (2) 281ndash355 doi101257jel482281
Lee S and Card D 2006 Regression Discontinuity Inference with Specification Error Technical Working paper 322 National Bureau of Economic Research
What Works Clearinghouse Procedures and Standards Handbook Version 30 US Department of Education httpsiesedgovnceewwcDocsreferenceresourceswwc_procedures_v3_0_standards_handboo kpdf
62
The Relationship between Prison Length of Stay and Recidivism -- This report was prepared by Abt Associates using Federal funding provided by the Bureau of Justice Statistics (BJS) Opinions andor points of view expressed are those of the author(s) and do not necessarily reflect the official position or policies of the US Department of Justice
Lerman Amy 2009a The People Prisons Make Effects of Incarceration on Criminal Psychology In Do Prisons make Us Safer The Benefits and Costs of the Prison Boom eds Steven Raphael and Michael A Stoll New York Russel Sage
Lerman Amy 2009b Bowling Alone (With My Own Ball and Chain) Effects of Incarceration and the Dark Side of Social Capital Lecture
Letkemann Peter 1973 Crime as Work Englewood Cliffs NJ Prentice-Hall
Listwan Shelley Johnson Christopher J Sullivan Robert Agnew Francis T Cullen and Mark Colvin 2013 The Pains of Imprisonment Revisited The Impact of Strain on Inmate Recidivism Justice Quarterly 30 (1) 144ndash68 doi101080074188252011597772
Loeffler Charles E 2013 Does Imprisonment Alter the Life Course Evidence on Crime and Employment from A Natural Experiment Criminology 51 (1) 137ndash66 doi1011111745-912512000
Loughran Thomas A Edward P Mulvey Carol A Schubert Jeffrey Fagan Alex R Piquero and Sandra H Losoya 2009 Estimating A Dose-Response Relationship Between Length of Stay and Future Recidivism in Serious Juvenile Offenders Criminology 47 (3) 699ndash740 doi101111j1745-9125200900165x
MacKenzie Doris L 2006 What Works in Corrections Reducing the Criminal Activities of Offenders and Delinquents New York Cambridge University Press
Manski Charles F and Daniel S Nagin 1998 Bounding Disagreements About Treatment Effects A Case Study of Sentencing and Recidivism Sociological Methodology 28 (1) 99ndash137 doi1011110081-175000043
Meade Benjamin Benjamin Steiner Matthew Makarios and Lawrence Travis 2012 Estimating a Dose-Response Relationship Between Time Served in Prison and Recidivism Journal of Research in Crime and Delinquency 50 (4) 525ndash50 doi1011770022427812458928
Mears Daniel P Joshua C Cochran and Francis T Cullen 2014 Incarceration Heterogeneity and Its Implications for Assessing the Effectiveness of Imprisonment on Recidivism Criminal Justice Policy Review 26 (7) 691ndash712 doi1011770887403414528950
Mears Daniel P Joshua C Cochran William D Bales and Avinash S Bhati (2016) Recidivism and time served in prison Journal of Criminal Law and Criminology 106(1) 82-122
Morgan Stephen and Christopher Winship 2015 Counterfactuals and Causal Inference Methods and Principals for Social Research 2nd ed Cambridge MA Cambridge University Press
Nagin Daniel S Francis T Cullen and Cheryl Lero Jonson 2009 Imprisonment and Reoffending Essay In Crime and Justice A Review of Research eds Michael Tonry 38115ndash200 Chicago University of Chicago Press
63
The Relationship between Prison Length of Stay and Recidivism -- This report was prepared by Abt Associates using Federal funding provided by the Bureau of Justice Statistics (BJS) Opinions andor points of view expressed are those of the author(s) and do not necessarily reflect the official position or policies of the US Department of Justice
Nguyen H Loughran T A Paternoster R Fagan J amp Piquero A R (2017) Institutional placement and illegal earnings Examining the crime school hypothesis Journal of Quantitative Criminology 33(2) 207-235
Owen B A (1998) In the Mix Struggle and Survival in a Womens Prison SUNY Press
Pager Devah and Lincoln Quillian 2005 Walking the Talk What Employers Say Versus What They Do American Sociological Review 70 (3) 355ndash80 doi101177000312240507000301
Pager Devah Bart Bonikowski and Bruce Western 2009 Discrimination in a Low-Wage Labor Market A Field Experiment American Sociological Review 74 (5) 777ndash99 doi101177000312240907400505
Pager Devah 2007 Marked Race Crime and Finding Work in an Era of Mass Incarceration Chicago University of Chicago Press
Rhodes William and Sarah K Jalbert 2013 Regression Discontinuity Design in Criminal Justice Evaluation An Introduction and Illustration Evaluation Review 37 (3-4) 239ndash73 doi1011770193841x14523004
Rhodes W Dyous C Kling R Hunt D and Luallen J (2012) Recidivism of Offenders on Federal Community Supervision Bureau of Justice Statistics award 2010-BJ-CX-K069 NCRJS document number 241018
Rhodes W (2010) Estimating treatment effects and predicting recidivism for community supervision using survival analysis with instrumental variables Journal of Quantitative Criminology 26(3) 391-413
Rhodes W (2012) Meta-analysis An introduction using regression models Evaluation review 36(1) 24-71
Roach Michael A and Max M Schanzenbach 2015 The Effect of Prison Sentence Length on Recidivism Evidence from Random Judicial Assignment Northwestern Law ampAmp Econ Research Paper doi102139ssrn2701549
Roodman David 2016 The impacts of incarceration on crime Open Philanthropy Project
Rosenbaum Paul R 2002 Observational Studies 2nd ed New York Springer
Smith Douglas A and Raymond Paternoster 1990 Formal Processing and Future Delinquency Deviance Amplification as Selection Artifact Law ampAmp Society Review 24 (5) 1109 doi1023073053663
Sampson Robert J and John H Laub 1993 Crime in the Making Pathways and Turning Points Through Life Cambridge MA Harvard University Press
64
The Relationship between Prison Length of Stay and Recidivism -- This report was prepared by Abt Associates using Federal funding provided by the Bureau of Justice Statistics (BJS) Opinions andor points of view expressed are those of the author(s) and do not necessarily reflect the official position or policies of the US Department of Justice
Smith Paula 2006 The Effects of Incarceration on Recidivism A Longitudinal Examination of Program Participation and Institutional Adjustment in Federally Sentenced Adult Male Offenders Dissertation University of New Brunswick Dept of Psychology
Smith Paula Paul Gendreau and Claire Goggin 2002 The Effects of Prison Sentences and Intermediate Sanctions on Recidivism General Effects and Individual Differences Ottawa Solicitor General Canada
Snodgrass G Matthew Arjan A J Blokland Amelia Haviland Paul Nieuwbeerta and Daniel S Nagin 2011 Does the Time Cause the Crime An Examination of the Relationship Between Time Served and Reoffending in The Netherlands Criminology 49 (4) 1149ndash94 doi101111j1745-9125201100254x
Sykes Gresham M 1958 The Society of Captives A Study of a Maximum Security Prison Princeton NJ Princeton University Press
National Research Council Jeremy Travis Bruce Western Steve Redburn 2014 The Growth of Incarceration in the United States Exploring Causes and Consequences eds Committee on Causes and Consequences of High Rates of Incarceration Committee on Law and Justice and Division of Behavioral and Social Sciences and Education Washington DC The National Academies Press
van der Klaauw Wilbert 2002 Estimating the Effect of Financial Aid Offers on College Enrollment A Regression-Discontinuity Approach International Economic Review 43 (4) 1249ndash87 doi1011111468-2354t01-1-00055
Villettaz P M Killias and I Zoder 2006 The Effects of Custodial vs Non-Custodial Sentences on Re-Offending A Systematic Review of the State of Knowledge Campbell Collaboration Crime and Justice Group doi104073csr200613
Wacquant Loiumlc 2001 Deadly Symbiosis When Ghetto and Prison Meet and Mesh Mass Imprisonment Social Causes and Consequences 82ndash120 doi1041359781446221228n8
Western Bruce 2002 The Impact of Incarceration on Wage Mobility and Inequality American Sociological Review 67 (4) 526 doi1023073088944
65
The Relationship between Prison Length of Stay and Recidivism -- This report was prepared by Abt Associates using Federal funding provided by the Bureau of Justice Statistics (BJS) Opinions andor points of view expressed are those of the author(s) and do not necessarily reflect the official position or policies of the US Department of Justice
Tables and Figures
Table 1 - Number of Offenders Meeting Study Requirements per Guidelines Cell
Criminal History Categories (1 least serious 6 most serious) Offense
Seriousness Level CH 1 CH 2 CH 3 CH 4 CH 5 CH 6 Total
1 38 6 1 1 1 1 48 2 909 176 178 90 42 61 1456 3 143 26 33 20 9 25 256 4 3244 818 981 523 371 613 6550 5 442 119 132 84 64 119 960 6 3005 641 752 429 300 505 5632 7 1511 381 653 576 440 680 4241 8 4497 882 1023 543 361 552 7858 9 1969 465 566 321 229 363 3913
10 8511 1873 2342 1119 765 1109 15719 11 2824 558 728 472 304 521 5407 12 9748 2368 3330 1968 1204 1667 20285 13 13159 2961 3668 2009 1226 1777 24800 14 4219 746 854 430 275 788 7312 15 10534 2680 3131 1599 951 1257 20152 16 4394 760 831 396 227 318 6926 17 8743 2598 4189 2919 1690 1981 22120 18 4876 745 758 388 212 306 7285 19 9053 2116 2902 1720 1095 1301 18187 20 3761 779 930 532 262 319 6583 21 13674 2293 3341 2511 1706 2421 25946 22 3674 654 850 480 289 392 6339 23 10627 4101 5642 2996 1742 1904 27012 24 3706 719 788 487 282 445 6427 25 7748 2816 3460 1835 1036 1137 18032 26 2946 728 856 420 228 355 5533 27 9418 1797 2221 1126 630 647 15839 28 2509 506 554 306 144 178 4197 29 6180 2614 3442 1736 870 3174 18016 30 1819 344 367 384 218 654 3786 31 3868 1800 2308 1157 554 2945 12632 32 1144 307 377 161 86 213 2288 33 2570 873 1155 566 259 365 5788 34 776 244 260 111 79 1831 3301 35 1145 645 820 368 197 446 3621 36 431 128 153 66 35 47 860
Leas
t Ser
ious
(1) t
o Mo
st S
erio
us (4
3)
66
The Relationship between Prison Length of Stay and Recidivism -- This report was prepared by Abt Associates using Federal funding provided by the Bureau of Justice Statistics (BJS) Opinions andor points of view expressed are those of the author(s) and do not necessarily reflect the official position or policies of the US Department of Justice
Criminal History Categories (1 least serious 6 most serious) Offense
Seriousness Level CH 1 CH 2 CH 3 CH 4 CH 5 CH 6 Total
37 543 210 305 148 54 221 1481 38 290 83 122 59 30 64 648 39 200 62 91 36 21 58 468 40 174 37 58 22 22 35 348 41 94 31 43 18 6 23 215 42 64 23 28 9 5 8 137 43 86 24 25 12 4 19 170
All 169266 42737 55248 31153 18525 31845 348774 Note Cells with fewer than 100 observations are highlighted
67
The Relationship between Prison Length of Stay and Recidivism -- This report was prepared by Abt Associates using Federal funding provided by the Bureau of Justice Statistics (BJS) Opinions andor points of view expressed are those of the author(s) and do not necessarily reflect the official position or policies of the US Department of Justice
Table 2 -- Percentage of Offenders Sentenced to Prison per Guideline Cell
Criminal History Categories (1 least serious 6 most serious) Offense
Seriousness Level CH 1 CH 2 CH 3 CH 4 CH 5 CH 6 Total
1 11 0 0 0 100 100 13 2 15 20 42 52 69 72 25 3 11 31 42 50 78 76 29 4 14 27 45 68 74 82 34 5 14 34 54 83 84 93 42 6 17 40 59 73 89 94 40 7 16 43 69 91 95 96 58 8 17 43 58 86 91 96 39 9 27 53 79 90 90 97 53
10 33 75 86 94 96 96 58 11 63 85 91 95 99 98 77 12 69 84 92 96 97 98 81 13 74 89 94 97 98 98 83 14 79 90 94 97 99 98 86 15 82 93 96 97 99 99 89 16 84 92 95 98 98 98 88 17 85 93 97 98 99 99 92 18 90 95 97 99 98 99 92 19 89 93 97 99 99 99 93 20 92 96 99 98 99 99 94 21 92 96 98 99 99 99 95 22 93 96 98 99 99 99 95 23 93 97 98 99 99 99 96 24 95 98 99 100 99 100 96 25 95 98 98 99 99 99 97 26 97 98 98 99 100 100 98 27 96 99 99 100 99 100 97 28 96 98 99 99 100 99 97 29 96 98 99 99 99 99 98 30 97 100 100 98 99 100 98 31 97 98 99 99 99 99 98 32 98 98 99 99 100 100 99 33 96 98 99 99 100 99 97 34 97 100 99 100 100 99 99 35 97 98 99 98 99 99 98 36 98 99 99 97 100 100 98 37 97 98 99 100 96 98 98 38 98 99 98 100 100 98 98
68
The Relationship between Prison Length of Stay and Recidivism -- This report was prepared by Abt Associates using Federal funding provided by the Bureau of Justice Statistics (BJS) Opinions andor points of view expressed are those of the author(s) and do not necessarily reflect the official position or policies of the US Department of Justice
Criminal History Categories (1 least serious 6 most serious) Offense
Seriousness Level CH 1 CH 2 CH 3 CH 4 CH 5 CH 6 Total
39 98 98 99 100 100 98 99 40 98 97 100 100 100 100 99 41 98 100 100 100 100 100 99 42 97 100 100 100 100 100 99 43 98 100 96 100 100 95 98 All 78 89 93 97 98 98 87
Note Cells with less than 50 prison terms are highlighted
69
The Relationship between Prison Length of Stay and Recidivism -- This report was prepared by Abt Associates using Federal funding provided by the Bureau of Justice Statistics (BJS) Opinions andor points of view expressed are those of the author(s) and do not necessarily reflect the official position or policies of the US Department of Justice
Table 3 -- Average Time Served (Months) per Guideline Cell
Criminal History Categories (1 least serious 6 most serious) Offense Seriousness Level
CH 1 CH 2 CH 3 CH 4 CH 5 CH 6
Leas
t Ser
ious
(1) t
o Mo
st S
erio
us (4
3)
1 04 00 00 00 209 65 2 10 13 25 36 41 73 3 08 17 27 47 47 73 4 13 22 35 57 67 85 5 13 21 42 87 90 138 6 13 41 49 84 115 140 7 11 29 50 81 117 146 8 14 38 59 96 137 175 9 21 50 71 119 168 208
10 30 72 94 150 191 230 11 43 82 119 161 217 251 12 60 103 137 189 237 279 13 81 124 157 212 260 300 14 106 160 187 256 298 324 15 120 170 204 256 320 355 16 147 198 233 303 359 408 17 164 222 260 326 392 446 18 196 257 297 362 454 515 19 216 282 326 407 498 547 20 262 343 401 481 573 637 21 255 342 394 481 570 636 22 313 409 483 582 689 721 23 336 429 484 577 670 728 24 369 493 543 685 786 853 25 418 495 562 671 785 842 26 480 571 676 783 902 964 27 474 597 659 783 868 909 28 552 706 784 902 961 1048 29 584 722 813 878 976 981 30 685 845 938 1063 1120 1213 31 695 823 916 1039 1129 1117 32 850 991 1116 1241 1417 1312 33 779 935 1056 1203 1338 1401 34 969 1166 1220 1365 1396 1326 35 900 1033 1182 1335 1385 1403 36 1176 1265 1456 1510 1551 1461
70
The Relationship between Prison Length of Stay and Recidivism -- This report was prepared by Abt Associates using Federal funding provided by the Bureau of Justice Statistics (BJS) Opinions andor points of view expressed are those of the author(s) and do not necessarily reflect the official position or policies of the US Department of Justice
Criminal History Categories (1 least serious 6 most serious) Offense Seriousness Level
CH 1 CH 2 CH 3 CH 4 CH 5 CH 6
37 1028 1289 1356 1604 1382 1849 38 1279 1434 1625 1726 1399 1769 39 1072 1468 1540 1567 1544 1656 40 1414 1520 1648 1482 1490 1658 41 1315 1562 1788 2045 2124 1899 42 1263 1878 1468 1974 1422 1974 43 1497 1685 2078 2909 1280 2243
71
The Relationship between Prison Length of Stay and Recidivism -- This report was prepared by Abt Associates using Federal funding provided by the Bureau of Justice Statistics (BJS) Opinions andor points of view expressed are those of the author(s) and do not necessarily reflect the official position or policies of the US Department of Justice
Table 4 -- Percentage of Offenders Recidivating within Three Years (Not Accounting for Censoring) per Guideline Cell
Criminal History Categories (1 least serious 6 most serious) Offense Seriousness Level CH 1 CH 2 CH 3 CH 4 CH 5 CH 6
Leas
t Ser
ious
(1) t
o Mo
st S
erio
us (4
3)
1 395 333 1000 00 00 1000 2 232 324 382 433 524 328 3 238 346 424 450 444 440 4 201 334 399 405 415 512 5 215 378 379 440 422 454 6 198 348 430 462 407 475 7 212 336 449 507 502 568 8 177 330 324 385 427 438 9 182 286 337 340 397 477
10 167 262 350 367 383 459 11 116 228 299 326 365 407 12 130 266 335 388 442 475 13 132 248 297 368 396 444 14 94 180 297 347 360 391 15 129 241 315 386 420 423 16 95 186 276 323 300 377 17 99 207 280 342 382 425 18 95 179 240 312 274 359 19 106 197 274 320 359 414 20 94 181 247 301 336 376 21 103 172 235 283 336 352 22 81 191 259 313 356 375 23 84 142 192 247 293 330 24 86 172 221 277 337 348 25 77 122 167 215 251 277 26 70 126 173 193 241 318 27 71 124 157 186 216 253 28 72 144 148 180 201 298 29 63 93 131 169 208 221 30 73 96 166 188 239 252 31 52 99 129 137 181 166 32 68 94 135 161 105 174 33 51 86 127 133 201 186 34 44 90 88 153 215 118 35 53 62 87 122 178 143 36 42 55 85 136 229 128 37 52 90 95 135 93 163
72
The Relationship between Prison Length of Stay and Recidivism -- This report was prepared by Abt Associates using Federal funding provided by the Bureau of Justice Statistics (BJS) Opinions andor points of view expressed are those of the author(s) and do not necessarily reflect the official position or policies of the US Department of Justice
Criminal History Categories (1 least serious 6 most serious) Offense Seriousness Level CH 1 CH 2 CH 3 CH 4 CH 5 CH 6
38 24 24 57 68 233 156 39 20 48 99 139 190 52 40 40 108 103 182 136 114 41 32 32 47 111 333 130 42 63 00 143 222 200 125 43 81 00 200 167 250 158
73
The Relationship between Prison Length of Stay and Recidivism -- This report was prepared by Abt Associates using Federal funding provided by the Bureau of Justice Statistics (BJS) Opinions andor points of view expressed are those of the author(s) and do not necessarily reflect the official position or policies of the US Department of Justice
Table 5 -- Results from a Naive Regressions (Cox Proportional Hazard)
CH 1 CH 2 CH 3 CH 4 CH 5 CH 6 scaled time-served -1707 -2381 -2536 -1941 -1079 -1588
(0155) (0212) (0155) (0187) (0235) (0161) time-served squared 0941 1166 1154 0487 -0336 0016
(0263) (0328) (0234) (0263) (0323) (0192) scaled age -7718 -6272 -6200 -6174 -6028 -2779
(0257) (0385) (0295) (0388) (0496) (0468) age squared 6798 5207 5927 6619 6433 1160
(0503) (0775) (0608) (0791) (0983) (0881) female -0348 -0343 -0281 -0219 -0280 -0331
(0021) (0035) (0028) (0040) (0052) (0041) Black 0194 0115 0120 0088 -0016 -0054
(0023) (0030) (0022) (0026) (0031) (0023) other race 0567 0426 0348 0301 0371 0267
(0030) (0049) (0039) (0049) (0062) (0051) Hispanic -0085 -0095 -0072 -0018 0008 -0053
(0024) (0037) (0028) (0034) (0041) (0034) high_school -0124 -0142 -0127 -0106 -0088 -0036
(0039) (0049) (0036) (0042) (0051) (0038) advanced_degree -0611 -0441 -0423 -0287 -0169 -0051
(0053) (0084) (0070) (0088) (0112) (0078) lives_alone -0023 0006 0011 -0020 -0033 -0036
(0021) (0029) (0021) (0025) (0030) (0022) centered points 0311 -0026 0100 0057 0051 0041
(0015) (0022) (0009) (0012) (0013) (0002) N 143058 38733 52654 30049 17697 30247
74
The Relationship between Prison Length of Stay and Recidivism -- This report was prepared by Abt Associates using Federal funding provided by the Bureau of Justice Statistics (BJS) Opinions andor points of view expressed are those of the author(s) and do not necessarily reflect the official position or policies of the US Department of Justice
Table 6 ndash Results when Contrasts are Cells 13 24 57 68 911 1012 and so on
Criminal History 1
Criminal History 2
Criminal History 3
Criminal History 4
Criminal History 5
Criminal History 6
linear 0002 0004
-0002 0003
-0002 0004
-0003 0003
-0008 0005
-0005 0003
constant -0074 0048
-0034 0041
-0050 0041
-0012 0037
0054 0062
-0054 0041
R2 0010 0040 0020 0060 0150 0110 N 15 15 18 19 17 19 plt005 plt001 The constant is the average parameter for the estimated hazard (zero is neutral) Six criminal history scores labeled Criminal History The contrasts are cells 13 24 57 68 911 1012 and so on All the contrasts are independent
Table 7 ndash Results when Contrasts are Cells 24 35 68 79 1012 1113 and so on
Criminal History 1
Criminal History 2
Criminal History 3
Criminal History 4
Criminal History 5
Criminal History 6
linear 0003 -0003
0004 -0005
0003 -0003
-0002 -0004
0007 -0005
0000 -0004
constant -0103 (0032)
-0153 -0071
-0109 (0033)
-0097 -0050
-0188 (0064)
-0049 -0048
R2 0060 0070 0060 0010 0120 0000 N 16 14 18 17 17 18
plt005 plt001 The constant is the average parameter for the estimated hazard (zero is neutral) Six criminal history scores labeled Criminal History The contrasts are cells 24 35 69 710 1012 1113 etc
75
0 Q) bull ~ middot - 0
20gt () agto
0 00 co 0)0 C = a ctl lshyu c o 0 middot- o t ltD 0 aO 0 _ Q0
I()
ci 0 500
Time at Risk in Days
Crim H 1
Crim H 3
Crim H 5
Crim H is the criminal history category
Crim H 2
Crim H 4
Crim H 6
Crim H 1 is the highest l ine and others a re in descending order Crim H 5 and Crim H 6 are nearly indistinguishable
1000
The Relationship between Prison Length of Stay and Recidivism -- This report was prepared by Abt Associates using Federal funding provided by the Bureau of Justice Statistics (BJS) Opinions andor points of view expressed are those of the author(s) and do not necessarily reflect the official position or policies of the US Department of Justice
Figure 1 ndash Kaplan-Meier Estimates of Time until Recidivism by Criminal History Category
plt005 plt001 Six criminal history scores labeled Criminal History Scales variables run from 0 to 1 Centered points Criminal history points centered at zero
76
The Relationship between Prison Length of Stay and Recidivism -- This report was prepared by Abt Associates using Federal funding provided by the Bureau of Justice Statistics (BJS) Opinions andor points of view expressed are those of the author(s) and do not necessarily reflect the official position or policies of the US Department of Justice
Figure 2 ndash Relationship between Time-Served and Recidivism Principal Specification (Return and Revocation)
0 5 1
15
2 25
Relative Hazard
0 10 20 30 40 Offense Seriousness Level
Crim Hist Category 1
5
1 15
2 25
Relative Hazard
0 10 20 30 40 Offense Seriousness Level
Crim Hist Category 2
5
1 15
2 25
Relative Hazard
0 10 20 30 40 Offense Seriousness Level
Crim Hist Category 3 0
5 1
15
2 25
Relative Hazard
0 10 20 30 40 Offense Seriousness Level
Crim Hist Category 4 0
5 1
15
2 25
Relative Hazard
0 10 20 30 40 Offense Seriousness Level
Crim Hist Category 5
5
1 15
2 25
Relative Hazard
0 10 20 30 40 Offense Seriousness Level
Crim Hist Category 6
Dots are estimated relative hazards (shown if between -25 and 25)Vertical lines are 95 confidence interval for the estimated relative hazards (truncated at 25)Smooth lines are linear predictions and 95 confidence intervals for the regression line
Criminal History 1
Criminal History 2
Criminal History 3
Criminal History 4
Criminal History 5
Criminal History 6
linear 0002 (0002)
0000 (0003)
0000 (0002)
-0003 (0003)
0000 (0004)
-0003 (0003)
constant -0068 (0013)
-0075 (0019)
-0075 (0017)
-0076 (0019)
-0068 (0028)
-0077 (0020)
R2 003 000 000 003 000 003 N 31 29 36 36 34 37
plt005 plt001 The constant is the average parameter for the estimated hazard (zero is neutral) Six criminal history scores labeled Criminal History
77
The Relationship between Prison Length of Stay and Recidivism -- This report was prepared by Abt Associates using Federal funding provided by the Bureau of Justice Statistics (BJS) Opinions andor points of view expressed are those of the author(s) and do not necessarily reflect the official position or policies of the US Department of Justice
Figure 3 ndash Relationship between Time-Served and Recidivism Principal Specification (Return and Revocation) using an Instrumental Variable Estimator
7
8
9
1 11
Relative Hazard
0 10 20 30 40 Offense Seriousness Level
Crim Hist Category 1
9 95
1 105 11 115
Relative Hazard
0 10 20 30 40 Offense Seriousness Level
Crim Hist Category 2
6
8
1 12
14
Relative Hazard
0 10 20 30 40 Offense Seriousness Level
Crim Hist Category 3 5
1 15
2 25
Relative Hazard
0 10 20 30 40 Offense Seriousness Level
Crim Hist Category 4 8
9
1 11
12
Relative Hazard
0 10 20 30 40 Offense Seriousness Level
Crim Hist Category 5
5
1 15
2 25
Relative Hazard
0 10 20 30 40 Offense Seriousness Level
Crim Hist Category 6
Dots are estimated relative hazards (shown if between -25 and 25)Vertical lines are 95 confidence interval for the estimated relative hazards (truncated at 25)Smooth lines are linear predictions and 95 confidence intervals for the regression line
Criminal History 1
Criminal History 2
Criminal History 3
Criminal History 4
Criminal History 5
Criminal History 6
linear 0001 (0000)
0001 (0000)
0001 (0000)
0000 0000
0000 0000
0000 0000
constant -0014 (0002)
-0015 (0003)
-0011 (0003)
-0011 (0003)
-0009 0005
-0009 (0003)
R2 043 022 012 003 001 010 N 31 29 36 36 34 37
plt005 plt001 The constant is the average parameter for the estimated hazard (zero is neutral) Six criminal history scores labeled Criminal History
78
The Relationship between Prison Length of Stay and Recidivism -- This report was prepared by Abt Associates using Federal funding provided by the Bureau of Justice Statistics (BJS) Opinions andor points of view expressed are those of the author(s) and do not necessarily reflect the official position or policies of the US Department of Justice
Figure 4 ndash Sensitivity Test Minimum Cell Size 50 instead of 100
0 5 1
15
2 25
Relative Hazard
0 10 20 30 40 Offense Seriousness Level
Crim Hist Category 1
0 5 1
15
2 25
Relative Hazard
0 10 20 30 40 Offense Seriousness Level
Crim Hist Category 2
5
1 15
2 25
Relative Hazard
0 10 20 30 40 Offense Seriousness Level
Crim Hist Category 3 0
5 1
15
2 25
Relative Hazard
0 10 20 30 40 Offense Seriousness Level
Crim Hist Category 4 0
5 1
15
2 25
Relative Hazard
0 10 20 30 40 Offense Seriousness Level
Crim Hist Category 5
0 5 1
15
2 25
Relative Hazard
0 10 20 30 40 Offense Seriousness Level
Crim Hist Category 6
Dots are estimated relative hazards (shown if between -25 and 25)Vertical lines are 95 confidence interval for the estimated relative hazards (truncated at 25)Smooth lines are linear predictions and 95 confidence intervals for the regression line
Criminal History 1
Criminal History 2
Criminal History 3
Criminal History 4
Criminal History 5
Criminal History 6
linear 0002 (0002)
0000 (0003)
0000 (0002)
-0002 (0003)
0000 (0004)
-0003 (0002)
constant -0068 (0013)
-0075 (0018)
-0073 (0018)
-0078 (0019)
-0068 (0027)
-0084 (0021)
R2 003 000 000 002 000 003 N 31 32 37 37 37 40
Six criminal history scores labeled Criminal History plt005 plt001 The constant is the average parameter for the estimated hazard (zero is neutral)
79
The Relationship between Prison Length of Stay and Recidivism -- This report was prepared by Abt Associates using Federal funding provided by the Bureau of Justice Statistics (BJS) Opinions andor points of view expressed are those of the author(s) and do not necessarily reflect the official position or policies of the US Department of Justice
Figure 5 ndash Sensitivity Test Minimum Cell Size 150 instead of 100
0 5 1
15
2 25
Relative Hazard
0 10 20 30 40 Offense Seriousness Level
Crim Hist Category 1
5
1 15
2 25
Relative Hazard
0 10 20 30 40 Offense Seriousness Level
Crim Hist Category 2
5
1 15
2 25
Relative Hazard
0 10 20 30 40 Offense Seriousness Level
Crim Hist Category 3
5
1 15
2 25
Relative Hazard
0 10 20 30 40 Offense Seriousness Level
Crim Hist Category 4
0 5 1
15
2 25
Relative Hazard
0 10 20 30 40 Offense Seriousness Level
Crim Hist Category 5
5
1 15
2 25
Relative Hazard
0 10 20 30 40 Offense Seriousness Level
Crim Hist Category 6
Dots are estimated relative hazards (shown if between -25 and 25)Vertical lines are 95 confidence interval for the estimated relative hazards (truncated at 25)Smooth lines are linear predictions and 95 confidence intervals for the regression line
Criminal History 1
Criminal History 2
Criminal History 3
Criminal History 4
Criminal History 5
Criminal History 6
linear 0002
(0002)
0000
(0003)
0000
(0002)
-0003
(0003)
-0001
(0004)
-0003
(0003) constant -0068
(0013) -0075 (0021)
-0076 (0017)
-0071 (0020)
-0066 (0031)
-0071 (0021)
R2 003 000 000 003 000 004 N 31 28 34 34 32 35
plt005 plt001 The constant is the average parameter for the estimated hazard (zero is neutral) Six criminal history scores labeled Criminal History
80
The Relationship between Prison Length of Stay and Recidivism -- This report was prepared by Abt Associates using Federal funding provided by the Bureau of Justice Statistics (BJS) Opinions andor points of view expressed are those of the author(s) and do not necessarily reflect the official position or policies of the US Department of Justice
Figure 6 -- Sensitivity Test Minimum Percentage of Prison Terms 75 instead of 50
0 5 1
15
2 25
Relative Hazard
0 10 20 30 40 Offense Seriousness Level
Crim Hist Category 1
5
1 15
2 25
Relative Hazard
0 10 20 30 40 Offense Seriousness Level
Crim Hist Category 2
5
1 15
2 25
Relative Hazard
0 10 20 30 40 Offense Seriousness Level
Crim Hist Category 3
0 5 1
15
2 25
Relative Hazard
0 10 20 30 40 Offense Seriousness Level
Crim Hist Category 4
0 5 1
15
2 25
Relative Hazard
0 10 20 30 40 Offense Seriousness Level
Crim Hist Category 5
5
1 15
2 25
Relative Hazard
0 10 20 30 40 Offense Seriousness Level
Crim Hist Category 6
Dots are estimated relative hazards (shown if between -25 and 25)Vertical lines are 95 confidence interval for the estimated relative hazards (truncated at 25)Smooth lines are linear predictions and 95 confidence intervals for the regression line
Criminal History 1
Criminal History 2
Criminal History 3
Criminal History 4
Criminal History 5
Criminal History 6
linear 0004 (0003)
0002 (0003)
-0001 (0003)
-0002 (0003)
0000 (0004)
-0003 (0003)
constant -0086 (0021)
-0091 (0023)
-0070 (0017)
-0074 (0020)
-0069 (0031)
-0076 (0020)
R2 007 002 001 002 000 004 N 27 28 32 33 31 36
plt005 plt001 The constant is the average parameter for the estimated hazard (zero is neutral) Six criminal history scores labeled Criminal History
81
The Relationship between Prison Length of Stay and Recidivism -- This report was prepared by Abt Associates using Federal funding provided by the Bureau of Justice Statistics (BJS) Opinions andor points of view expressed are those of the author(s) and do not necessarily reflect the official position or policies of the US Department of Justice
Figure 7 ndash Sensitivity Test Contrasts that are J and J+1 instead of J and J+2 5
1 15
2 25
Relative Hazard
0 10 20 30 40 Offense Seriousness Level
Crim Hist Category 1
0 5 1
15
2 25
Relative Hazard
0 10 20 30 40 Offense Seriousness Level
Crim Hist Category 2
5
1 15
2 25
Relative Hazard
0 10 20 30 40 Offense Seriousness Level
Crim Hist Category 3
5
1 15
2 25
Relative Hazard
0 10 20 30 40 Offense Seriousness Level
Crim Hist Category 4
5
1 15
2 25
Relative Hazard
0 10 20 30 40 Offense Seriousness Level
Crim Hist Category 5
5
1 15
2 25
Relative Hazard
0 10 20 30 40 Offense Seriousness Level
Crim Hist Category 6
Dots are estimated relative hazards (shown if between -25 and 25)Vertical lines are 95 confidence interval for the estimated relative hazards (truncated at 25)Smooth lines are linear predictions and 95 confidence intervals for the regression line
Criminal History 1
Criminal History 2
Criminal History 3
Criminal History 4
Criminal History 5
Criminal History 6
linear 0002 (0004)
-0002 (0005)
0005 (0004)
0006 (0004)
0003 (0006)
0006 (0004)
constant -0030 (0029)
-0017 (0040)
-0037 (0032)
-0039 (0028)
-0031 (0046)
-0023 (0028)
R2 0010 000 004 010 001 009 N 25 25 27 26 29 29
plt005 plt001 The constant is the average parameter for the estimated hazard (zero is neutral) Six criminal history scores labeled Criminal History
82
The Relationship between Prison Length of Stay and Recidivism -- This report was prepared by Abt Associates using Federal funding provided by the Bureau of Justice Statistics (BJS) Opinions andor points of view expressed are those of the author(s) and do not necessarily reflect the official position or policies of the US Department of Justice
Figure 8 -- Sensitivity Test Using the Prais-Winston Estimator
5
1 15
2 25
Relative Hazard
0 10 20 30 40 Offense Seriousness Level
Crim Hist Category 1
0 5 1
15
2 25
Relative Hazard
0 10 20 30 40 Offense Seriousness Level
Crim Hist Category 2
5
1 15
2 25
Relative Hazard
0 10 20 30 40 Offense Seriousness Level
Crim Hist Category 3
5
1 15
2 25
Relative Hazard
0 10 20 30 40 Offense Seriousness Level
Crim Hist Category 4
5
1 15
2 25
Relative Hazard
0 10 20 30 40 Offense Seriousness Level
Crim Hist Category 5
5
1 15
2 25
Relative Hazard
0 10 20 30 40 Offense Seriousness Level
Crim Hist Category 6
Dots are estimated relative hazards (shown if between -25 and 25)Vertical lines are 95 confidence interval for the estimated relative hazards (truncated at 25)Smooth lines are linear predictions and 95 confidence intervals for the regression line
Criminal History 1
Criminal History 2
Criminal History 3
Criminal History 4
Criminal History 5
Criminal History 6
linear 0019 -0010
0005 -0003
0003 -0003
0007 (0003)
0002 -0006
0006 (0003)
constant -0133 0065
-0060 0020
-0035 0016
-0030 0031
-0032 0029
-0040 0013
Rho 0100 -0940 -0790 0010 -0260 -0730 R2 0240 0210 0110 0210 0020 0330 N 25 25 27 26 29 29
plt005 plt001 The constant is the average parameter for the estimated hazard Six criminal history scores labeled Criminal History
83
The Relationship between Prison Length of Stay and Recidivism -- This report was prepared by Abt Associates using Federal funding provided by the Bureau of Justice Statistics (BJS) Opinions andor points of view expressed are those of the author(s) and do not necessarily reflect the official position or policies of the US Department of Justice
Figure 9 -- Sensitivity Test Entering Prison as Recidivism
0 5 1
15
2 25
Relative Hazard
0 10 20 30 40 Offense Seriousness Level
Crim Hist Category 1
5
1 15
2 25
Relative Hazard
0 10 20 30 40 Offense Seriousness Level
Crim Hist Category 2
0 5 1
15
2 25
Relative Hazard
0 10 20 30 40 Offense Seriousness Level
Crim Hist Category 3
0 5 1
15
2 25
Relative Hazard
0 10 20 30 40 Offense Seriousness Level
Crim Hist Category 4
0 5 1
15
2 25
Relative Hazard
0 10 20 30 40 Offense Seriousness Level
Crim Hist Category 5
5
1 15
2 25
Relative Hazard
0 10 20 30 40 Offense Seriousness Level
Crim Hist Category 6
Dots are estimated relative hazards (shown if between -25 and 25)Vertical lines are 95 confidence interval for the estimated relative hazards (truncated at 25)Smooth lines are linear predictions and 95 confidence intervals for the regression line
Criminal History 1
Criminal History 2
Criminal History 3
Criminal History 4
Criminal History 5
Criminal History 6
linear 0003 (0002)
0002 (0002)
0001 (0002)
-0004 (0003)
0000 (0004)
-0003 (0003)
constant -0070 (0014)
-0084 (0017)
-0077 (0018)
-0071 (0020)
-0074 (0030)
-0080 (0020)
R2 004 002 000 005 000 003 N 40 36 39 37 33 37
plt005 plt001 The constant is the average parameter for the estimated hazard (zero is neutral) Six criminal history scores labeled Criminal History
84
The Relationship between Prison Length of Stay and Recidivism -- This report was prepared by Abt Associates using Federal funding provided by the Bureau of Justice Statistics (BJS) Opinions andor points of view expressed are those of the author(s) and do not necessarily reflect the official position or policies of the US Department of Justice
Figure 10 -- Sensitivity Testing Eliminating Drug-Law Offenders from the Analysis
0 5 1
15
2 25
Relative Hazard
0 10 20 30 40 Offense Seriousness Level
Crim Hist Category 1
0 5 1
15
2 25
Relative Hazard
0 10 20 30 40 Offense Seriousness Level
Crim Hist Category 2
5
1 15
2 25
Relative Hazard
0 10 20 30 40 Offense Seriousness Level
Crim Hist Category 3
5
1 15
2 25
Relative Hazard
0 10 20 30 40 Offense Seriousness Level
Crim Hist Category 4
0 5 1
15
2 25
Relative Hazard
0 10 20 30 40 Offense Seriousness Level
Crim Hist Category 5
5
1 15
2 25
Relative Hazard
0 10 20 30 40 Offense Seriousness Level
Crim Hist Category 6
Dots are estimated relative hazards (shown if between -25 and 25)Vertical lines are 95 confidence interval for the estimated relative hazards (truncated at 25)Smooth lines are linear predictions and 95 confidence intervals for the regression line
Criminal History 1
Criminal History 2
Criminal History 3
Criminal History 4
Criminal History 5
Criminal History 6
linear 0001 (0003)
-0001 (0004)
-0001 (0003)
-0002 (0003)
0001 (0005)
-0003 (0003)
constant -0055 (0014)
-0065 (0022)
-0066 (0019)
-0057 (0022)
-0059 -0031
-0062 (0022)
R2 000 000 000 001 000 003 N 31 27 34 32 32 35
plt005 plt001 The constant is the average parameter for the estimated hazard (zero is neutral) Six criminal history scores labeled Criminal History
85
The Relationship between Prison Length of Stay and Recidivism -- This report was prepared by Abt Associates using Federal funding provided by the Bureau of Justice Statistics (BJS) Opinions andor points of view expressed are those of the author(s) and do not necessarily reflect the official position or policies of the US Department of Justice
Figure 11 -- Sensitivity Testing No Covariates
0 5 1
15
2 25
Relative Hazard
0 10 20 30 40 Offense Seriousness Level
Crim Hist Category 1
5
1 15
2 25
Relative Hazard
0 10 20 30 40 Offense Seriousness Level
Crim Hist Category 2
5
1 15
2 25
Relative Hazard
0 10 20 30 40 Offense Seriousness Level
Crim Hist Category 3
0 5 1
15
2 25
Relative Hazard
0 10 20 30 40 Offense Seriousness Level
Crim Hist Category 4
0 5 1
15
2 25
Relative Hazard
0 10 20 30 40 Offense Seriousness Level
Crim Hist Category 5
5
1 15
2 25
Relative Hazard
0 10 20 30 40 Offense Seriousness Level
Crim Hist Category 6
Dots are estimated relative hazards (shown if between -25 and 25)Vertical lines are 95 confidence interval for the estimated relative hazards (truncated at 25)Smooth lines are linear predictions and 95 confidence intervals for the regression line
Criminal History 1
Criminal History 2
Criminal History 3
Criminal History 4
Criminal History 5
Criminal History 6
linear 0001 (0003)
-0003 (0003)
-0002 (0003)
-0004 (0003)
-0002 (0004)
-0004 (0003)
constant -0062 (0015)
-0067 (0020)
-0081 (0018)
-0082 (0022)
-0071 (0028)
-0084 (0022)
R2 000 003 002 005 001 007 N 31 29 36 36 34 37
plt005 plt001 The constant is the average parameter for the estimated hazard (zero is neutral) Six criminal history scores labeled Criminal History
86
The Relationship between Prison Length of Stay and Recidivism -- This report was prepared by Abt Associates using Federal funding provided by the Bureau of Justice Statistics (BJS) Opinions andor points of view expressed are those of the author(s) and do not necessarily reflect the official position or policies of the US Department of Justice
Figure 12 -- Sensitivity Testing Using the Earlier Guidelines
0 1
2 3
4 5
Relative Hazard
0 10 20 30 40 Offense Seriousness Level
Crim Hist Category 1
0 5 1
15
2 25
Relative Hazard
0 10 20 30 40 Offense Seriousness Level
Crim Hist Category 2
5
1 15
2 25
Relative Hazard
0 10 20 30 40 Offense Seriousness Level
Crim Hist Category 3
0 5 1
15
2 25
Relative Hazard
0 10 20 30 40 Offense Seriousness Level
Crim Hist Category 4
0 5 1
15
2 25
Relative Hazard
0 10 20 30 40 Offense Seriousness Level
Crim Hist Category 5
5
1 15
2 25
Relative Hazard
0 10 20 30 40 Offense Seriousness Level
Crim Hist Category 6
Dots are estimated relative hazards (shown if between -25 and 25)Vertical lines are 95 confidence interval for the estimated relative hazards (truncated at 25)Smooth lines are linear predictions and 95 confidence intervals for the regression line
Criminal History 1
Criminal History 2
Criminal History 3
Criminal History 4
Criminal History 5
Criminal History 6
linear 0000 (0003)
0001 (0004)
0000 (0003)
-0004 (0002)
-0002 (0004)
-0004 (0003)
constant -0085 (0017)
-0097 (0025)
-0096 (0019)
-0085 (0018)
-0076 (0030)
-0081 (0028)
R2 000 000 000 007 001 004 N 31 29 34 35 33 34
plt005 plt001 The constant is the average parameter for the estimated hazard (zero is neutral) Six criminal history scores labeled Criminal History
87

The Relationship between Prison Length of Stay and Recidivism -- This report was prepared by Abt Associates using Federal funding provided by the Bureau of Justice Statistics (BJS) Opinions andor points of view expressed are those of the author(s) and do not necessarily reflect the official position or policies of the US Department of Justice
The Relationship between Prison Length of Stay and Recidivism A Study using Regression Discontinuity with Multiple Break Points
Imprisonment is an expensive sanction Justifying its use often rests partly on its presumed
utility to reduce post-release reoffending Most scholarship separates the research on imprisonment
effects into two subsets imprisonment in contrast to an alternative sanction and prison length of
stay (Nagin Cullen Jonson 2009 Smith Goggin and Gendreau 2002) If prison is expected to deter
offenders from future reoffending then how does it compare to a sentence of probation home
confinement or other alternative sanction Likewise if prison is chosen as a preferred sanction can a
deterrent effect of imprisonment be achieved with a shorter sentence
This paper capitalizes on federal sentencing structure to evaluate this latter question Does
increasing the length of prison increase or decrease recidivism Few studies of how prison length
affects recidivism meet rigorous experimental or quasi-experimental requirements (Nagin Cullen
and Jonson 2009) As of 2009 Nagin et al had identified two experiments and three matching
studies There have only been a few studies of length of stay using strong quasi-experimental designs
since the Nagin et al 2009 review We cover these in our literature review
A second goal of this study is to measure length of stay treatment heterogeneity Does the
effect of increasing the length of prison differ across individuals The federal sentencing structure
once again provides this opportunity Scholars have argued the effect of prison may depend on a
host of factors (Mears Cochran and Cullen 2014 Nagin Cullen and Jonson 2009 National Research
Council 2014) Nagin Cullen and Jonson (2009) propose that imprisonment effects may depend on
characteristics of the offender institution and sentence The National Academy of Sciences
reporting on the causes and consequences of mass incarceration (NRC 2014) discusses potential
variations in punishment effects that depend on characteristics of individuals social context and
units of analysis As an example the NAS report cites the research on the stigma of a criminal record
2
The Relationship between Prison Length of Stay and Recidivism -- This report was prepared by Abt Associates using Federal funding provided by the Bureau of Justice Statistics (BJS) Opinions andor points of view expressed are those of the author(s) and do not necessarily reflect the official position or policies of the US Department of Justice
on job seeking (Pager 2007 Pager and Quillian 2005) affecting black more than white applicants
Incarceration treatment heterogeneity is important because as the NRC report indicates unpacking
treatment effect dependence may lead to an explanation of why we observe outcome variations
across imprisonment studies found in all the systematic reviews (Nagin Cullen Jonson 2009 Smith
Goggin and Gendreau 2002 Villettaz Killias and Zoder 2006)
Identifying the Causal Relationship between Prison Length of Stay and Reoffending
As researchers have pointed out (Berube and Green 2007 Green and Winik 2010 Loeffler
2013 Loughran et al 2009 Nagin Cullen and Jonson 2009) estimating the causal relationship
between length of stay and reoffending raises validity challenges It seems plausible if not probable
that offenders receive long prison terms in part because they are likely to reoffend potentially
inducing a spurious positive correlation between prison length of stay and recidivism For example
prior criminal record is a good predictor of future offending and sentencing guidelines (when they
are used) When guidelines are absent judges typically take criminal records into account
sentencing offenders with criminal histories to serve longer terms than those with no or minimal
prior criminal justice contact Consequently even if estimated in a regression framework attempting
to control for confounders a partial correlation of time-served and recidivism may be uninformative
The research provided in this paper addresses this methodological concern about identification by
employing the logic of a regression discontinuity design (hereafter RDD) to rigorously identify the
causal relationship between time-served and recidivism The identification strategy rests on the
structure of guideline sentencing In the Nagin et al review these scholars anticipated the utility of
this approach ldquoDeterminant sentencing gridshellip may provide a quasi-experiment for constructing
the dose-response relationship between sentence length and reoffending (Nagin et al 2009 184)rdquo
Using a regression discontinuity design we find that lengthening a prison term does not increase
3
The Relationship between Prison Length of Stay and Recidivism -- This report was prepared by Abt Associates using Federal funding provided by the Bureau of Justice Statistics (BJS) Opinions andor points of view expressed are those of the author(s) and do not necessarily reflect the official position or policies of the US Department of Justice
recidivism In fact increasing the length of a prison term may reduce recidivism but if so the effect
is small
As we explain the US Sentencing Guidelines provide a structure for an RDD because
holding constant factors believed to affect recidivism the guidelines recommend longer or shorter
sentences for similar offenders based on offense factors that likely have nothing to do with an
offenderrsquos risk of recidivism Many methodologists consider RDD to be a close second-best
alternative to random assignment (Cook 2008 DiNardo amp Lee 2010 US Department of Education)
so this study provides a rigorous approach to answering the research question However while we
study whether longer prison terms affect recidivism more than do shorter terms except for criminal
history our data and design provide limited information about heterogeneity
THE PAROLE EFFECT
Roodman (2016) identifies a potential source of bias of imprisonment studies because of the
inextricable dependency of time served and parole supervision Parole agencies ldquocarve uprdquo a
sentence of imprisonment into that portion to be served in prison and the remainder to be served
under community supervision Even though parole terms can be shortened because of good
behavior the length of community supervision will depend on the prison term To the extent the
prison release date is delayed the period of supervision will be curtailed The opposite is also true
shorter prison terms lead to longer parole supervision terms Roodman argues that this means there
are two simultaneous treatments that cannot be disentangled Many studies find supervision
increases returns because of the closer surveillance and the added conditions of supervision (see for
example Gaes Bales and Skaggs 2016 comparing close community supervision monitoring to regular
probation) People with longer terms of community supervision have more time and therefore more
opportunity to be revoked and irrespective of any other imprisonment impact this artifact would
4
The Relationship between Prison Length of Stay and Recidivism -- This report was prepared by Abt Associates using Federal funding provided by the Bureau of Justice Statistics (BJS) Opinions andor points of view expressed are those of the author(s) and do not necessarily reflect the official position or policies of the US Department of Justice
bias shorter prison terms toward higher levels of recidivism and longer terms toward lower
recidivism This potential bias does not affect our study because everyone in the federal system is
given a post-release term of supervision separate from the prison term One term is independent of
the other Furthermore we censor observations when a term of supervision ends This removes the
potential artifact but it also means the recidivism results might be different if federal offenders were
released without supervision as is often the case in many state jurisdictions
THEORIES ON THE EFFECT OF IMPRISONMENT
Scholars have proposed alternative theories explaining the impact of imprisonment as having
either a criminogenic or a preventativedeterrent effect The criminogenic theories include a variant
of life course research highlighting the interruption of the normal stages of adult development a
prison induced strain theory a recognition that prison is a total institution and may socialize
offenders into an anti-normative lifestyle the possibility that prison are schools for crime and the
stigma attached to incarceration once the prisoner is released Preventative theories of
imprisonment cite mechanisms involving rehabilitation and specific deterrence We discuss both
below
CRIMINOGENIC THEORIES
Loeffler (2013) cites the life course literature (Horney Osgood Marshall 1995 Sampson and
Laub 1993 Western 2002) and discusses how prison delays the normal development of adults and
interrupts many of the stabilizing events such as marriage employment and education that might
otherwise promote prosocial development Prison strain has been studied by Listwan Sullivan
Agnew Cullen and Colvin (2013) Using survey methods they examined prison deprivations and
victimization aspects of prison strain on recidivism finding evidence of a relationship between strain
variables and recidivism in the predicted direction Early ethnographers emphasize strain by
5
The Relationship between Prison Length of Stay and Recidivism -- This report was prepared by Abt Associates using Federal funding provided by the Bureau of Justice Statistics (BJS) Opinions andor points of view expressed are those of the author(s) and do not necessarily reflect the official position or policies of the US Department of Justice
recounting the pains of imprisonment However these same ethnographers also emphasize prison
socialization This scholarship includes classic ethnographies of prison life such as Sykesrsquo Society of
Captives A Study of a Maximum Security Prison (1958) and Clemmerrsquos The Prison Community (1940)
Clemmer and Sykes provided a framework for studying inmate society and culture emphasizing the
nature of prison as a total institution in which separation from the community and the relationship
between inmates and guards redefine roles rules and personal identities Later ethnographies by
Carroll (1988) Jacobs (1977) Goffman (1961) Irwin (2009) Owen (1998) and Fleisher (1989) all
emphasize the strains deriving from both prison conditions and the antagonism pitting inmates
against guards None of these ethnographers provide strong empirical support for the relationship
between acculturation strain and recidivism
A line of research employing experimental and regression discontinuity designs (Chen and
Shapiro 2007 Gaes and Camp 2009 Lerman 2009 a b) evaluate the impact of security level
placement on in-prison and post-release outcomes Under the assumption that higher security levels
produce more strain Chen and Shapiro using an RDD and Gaes and Camp using an experiment found
higher security level placement led to higher levels of post-release recidivism Lerman employing an
RDD found that inmates placed in higher security levels had friends who were more likely to be
gang-involved and who were more likely to have had prior arrests and commitments Using other
data Lerman shows how these personal networks of friends are likely to be acquired in prison
Although these studies identify security level placement as a cause of in-prison socialization and
post-prison increases in recidivism supporting strain and socialization hypotheses they cannot rule
out other mediating mechanisms such as labeling though self-identification
Other criminologists argue that prisons are schools for crime where prisoners learn from
other inmates how to become more knowledgeable offenders (Cullen Jonson and Nagin 2011
6
The Relationship between Prison Length of Stay and Recidivism -- This report was prepared by Abt Associates using Federal funding provided by the Bureau of Justice Statistics (BJS) Opinions andor points of view expressed are those of the author(s) and do not necessarily reflect the official position or policies of the US Department of Justice
Letkemann 1973 Nguyen Loughran Paternoster Fagan amp Piquero 2017) Other research
suggests that prisons reinforce cultural values conforming to criminal activity that is offenders
import these values from their community and deviant values are reinforced by the structure and
organization of prison (Carroll 1988 Irwin 1980 2005 Jacobs 1977 Wacquant 2001)
Even if an offenderrsquos orientation toward reoffending is unaltered by prison labeling
(Braithwaite 1989) may affect recidivism Ex-offenders may be denied employment or prohibited
from accessing social benefits programs after release Whether these events are internalized
limiting the offenderrsquos subjective expectations or simply reduce legitimate avenues for community
integration they may increase the propensity to reoffend By manipulating job applications (Boshier
amp Johnson 1974) or by using actors posing as prior offenders (Pager et al 2009) research has
demonstrated a stigmatizing effect of a criminal record on employment reducing legitimate
opportunities for ex-offenders especially in a low wage job market Of course the stigma may come
from any term of imprisonment and long terms may be no more disadvantageous than short terms
PREVENTATIVE THEORIES
Preventative theories of imprisonment rest on a prisonerrsquos rational expectation of future
punishment or on theories of rehabilitation that envision prison as an opportunity to reform and
retrain Specific deterrence theorists (Becker 1968) assert that offenders are rational actors
weighing the costs and benefits of crime Experiencing prison reinforces its noxiousness and
provides a disincentive to future criminal behavior Reentry programming and other rehabilitative
training adopting evidence-based practices may reduce recidivism (Andrews amp Bonta 2006 Andrews
et al 1990 Gaes et al 1999 Gendreau et al 1999 Gendreau et al 2008 MacKenzie 2006 Smith
2006) so that prison can be used to change the trajectory of criminality Longer prison terms might
allow for more intensive reentry training and longer prison terms should reinforce the expectation of
7
The Relationship between Prison Length of Stay and Recidivism -- This report was prepared by Abt Associates using Federal funding provided by the Bureau of Justice Statistics (BJS) Opinions andor points of view expressed are those of the author(s) and do not necessarily reflect the official position or policies of the US Department of Justice
future punishment However because of the strong association between age and crime longer
prison terms produce inmates who are older at the time of release so that merely incapacitating
offenders for longer periods will reduce the likelihood of crime absent any other intervention or
causal mechanism As noted in Snodgras et al (2015) length of stay and aging are inseparable causal
factors even if one controls for age at release or age at sentence
Prison experiences may unleash forces that both push offenders away from crime and pull
them toward reoffending However as Loefler (2013) argues prison may simply collect people who
are predisposed toward criminality because of pre-existing life experiences and deficits He calls this
social selection crediting Manski and Nagin (1998) Nagin Cullen and Jonson (2009) and Smith and
Paternoster (1990) Loeffler argues that imprisonment itself is a highly selective process Only a small
proportion of people are imprisoned even people who are committed for the first time usually have
an extensive history of criminal justice contacts From this point of view prison has no causal
impact it is where offenders are housed much as hospitals are places where people predisposed to
illness are treated Loefflerrsquos argument is more relevant to an analysis of imprisonment than to
length of stay The relevant question we address is Even if there is a selection process does length
of stay have an impact on future reoffending
PRIOR STUDIES OF PRISON LENGTH OF STAY
Relying on criminological theory then provides no clear expectation of whether
incarceration will decrease or increase reoffending Nagin et al (2009) review empirical studies
addressing the question of whether on balance imprisonment pushes ex-offenders away or pulls ex-
offenders towards new crime They conclude that imprisonment per se seems to have a
criminogenic effect although they recognize studies that contradict that conclusion Nagin et al also
state there is little convincing evidence that length of stay ndash in their parlance prison dosage ndash
8
The Relationship between Prison Length of Stay and Recidivism -- This report was prepared by Abt Associates using Federal funding provided by the Bureau of Justice Statistics (BJS) Opinions andor points of view expressed are those of the author(s) and do not necessarily reflect the official position or policies of the US Department of Justice
increases recidivism They are skeptical of observational studies that use regression procedures to
uncover the causal impact of prison length of stay because identification requires an exacting
standard -- selection on observables (Rosenbaum 2002) -- in which covariates completely adjust for
any spurious relationship between time-served and recidivism
Nagin Cullen and Jonson (2009) identify 14 regression studies two experiments and three
matching studies evaluating the effect of length of stay in their 2009 review Because we are also
skeptical of the regression studies we do not review them1 The experimental studies of length of
stay by Berecochea and Jaman (1981) and Deschenes Turner and Petersilia (1995) manipulated
sentence reductions for offenders who had already served time in prison Part of the study design
for the Deschenes et al experiment diverted offenders from prison and would qualify as an
imprisonment but not a length of stay study However a subset of offenders was randomly assigned
to early release to be placed on intensive community supervision Analysis of the 17 dependent
variables showed only one that was significantly affected by prison length The Berecochea and
Jaman experiment randomly assigned offenders to a six-month reduction which was on average a
16 percent sentence reduction Inmates receiving a sentence reduction had higher parole failure
rates at one and two years after the release from prison but these differences were not statistically
significant Thus rigorous random design studies do not find that increasing prison length either
increases or decreases future criminality
Of the three matching studies identified by Nagin Cullen and Jonson (2009) two evaluate
length of stay on juveniles (Kraus 1981 and Loughran et al 2009) The third study by Jaman
Dickover and Bennett (1972) found recidivism to be higher for adult male burglars receiving 25
months or longer versus those serving 24 or fewer months but the difference was only significant at
1 The 14 regression studies mostly find null effects with specific deterrent and criminogenic effects about equal 9
The Relationship between Prison Length of Stay and Recidivism -- This report was prepared by Abt Associates using Federal funding provided by the Bureau of Justice Statistics (BJS) Opinions andor points of view expressed are those of the author(s) and do not necessarily reflect the official position or policies of the US Department of Justice
the 24-month horizon Kraus (1981) evaluated length of stay contrasts for juveniles that depended
on the juvenilersquos age group For example Kraus contrasted a term of 8 to 20 months versus a term up
to 7 months for 14 and 15-year oldrsquos however for juveniles who were 13 the contrast was between
9 to 16 months and 8 months or less None of the contrasts were statistically significant Loughran et
al (2009) employ propensity score methods The authors categorized the continuous length of stay
into discrete ordinal categories and used ordinal logit to estimate propensity scores The variation in
length of stay extended from 0-3 months up to greater than 12 months Whether using arrest or
self-reported reoffending Loughran et al found no marginal effect of length of stay on either
outcome
Meade Steiner Makarios and Travis (2012) also used ordinal logit to estimate the propensity
score creating ordered subsamples stratified by the estimated log odds of being in a category of
length of stay They stratified their sample into dosage categories and compared people within a
ldquodosagerdquo stratum to those with ldquosimilarrdquo propensity scores who had longer or shorter sentences
Meade et al found that beyond 16 months higher doses of imprisonment lowered recidivism (felony
arrest) however only the highest dose (gt= 78 months) was statistically significant
Snodgrass Blokland Haviland Nieuwbeerta and Nagin (2011) also conducted a dosage
study of time served among prisoners in the Netherlands and restricted their sample to first time
commitments convicted of violent property or drug offenses who were between age 12-40 and who
had sufficient time post-release to assess recidivism The discrete categories of time served were 1
month or less 1-2 months 2-3 months 3-6 months 6-12 months and 12+ months Consistent with
the other propensity score studies they estimated the propensity score using ordinal logit with many
covariates to predict the ordinal level of prison length of stay Rather than use only the propensity
scores to match offenders they used exact matches on sex age (+- two years) and one of four
10
The Relationship between Prison Length of Stay and Recidivism -- This report was prepared by Abt Associates using Federal funding provided by the Bureau of Justice Statistics (BJS) Opinions andor points of view expressed are those of the author(s) and do not necessarily reflect the official position or policies of the US Department of Justice
trajectory group memberships as well as a propensity score matching caliper of 15 The matched
pairings produced sets of offenders who served different sentence lengths The matched pairs
allowed Snodgrass et al to examine measures of recidivism comparing any given ordinal category of
length of stay to the other categories where a matched pair could be found The results showed no
relationship between length of stay and recidivism The Snodgrass et al study takes great care in
constructing counterfactuals for the offenders within a given length of stay class But as they note
the average levels of time served are much shorter than one would observe in most United States
adult prison samples
Roach and Schanzenbach (2015) use randomization of judges assigned to sentencing
convicted offenders to map the relationship between length of stay (median of 4 months) and one
two and three-year rates of recidivism Using reduced form and two-stage regression they find that
each additional month of sentence length decreases recidivism by about 1 percent When they
stratify on criminal history Roach and Schanzenbach find a strong effect of sentence length for
offenders with minimal criminal history and a weak or insignificant effect for offenders with more
extensive criminal histories They also found that relative to the base hazard rate the impact
occurred almost entirely within the first year of release Roach and Schanzenbach argue the impact
of length of stay is a combination of severity of punishment and rehabilitation The researchers argue
that offenders with longer sentences can participate in more rehabilitative prison programs Roach
and Schanzenbachrsquos Table 2 (page 19) does indicate possible sources of bias in the relationship
between length of stay and recidivism The judge dummy variables not only demonstrate a strong
relationship to sentence length essential to the study design but they also predict the offenderrsquos
offense severity level and number of prior non-violent convictions These offender characteristics
could be associated with the sentence length and the level of recidivism qualifying as backdoor
variables (Morgan and Winship 2015) Roodmanrsquos (2016) review of this study offers the possibility
11
The Relationship between Prison Length of Stay and Recidivism -- This report was prepared by Abt Associates using Federal funding provided by the Bureau of Justice Statistics (BJS) Opinions andor points of view expressed are those of the author(s) and do not necessarily reflect the official position or policies of the US Department of Justice
the longer sentences in this study would lead to longer parole supervision elevating recidivism
because of technical parole violations
Kuziemko (2012) uses the Georgia parole guideline grid as a means of identifying the causal
effect of length of stay She restricts her analysis to offenders with less severe offenses and whose
criminal history category is in the average to high range She uses the discontinuity in the grid
recommendation (separating high from average risk) as an instrument for time served with the
instrumented time served in stage one and recidivism regressed on the instrument in stage two
along with other covariates One of her estimates restricts the sample to people whose points are
just above or just below the discontinuity threshold (8 versus 9 points) which should yield the best
approximation to an exogenous variation She finds each additional month of time served lowers the
three-year recidivism rate by 15 percent It is not clear why Kuziemko restricted her analysis to this
threshold limiting the analysis to a narrow range of the guideline grid Most offenders have lower
criminal history scores and restricting the analysis to the higher thresholds limits the generalizability
of the study In fact Roodmanrsquos (2016) reanalysis of these data evaluates other discontinuity cut
points and finds either insignificant length of stay coefficients or coefficients with the opposite sign
indicating increased length of stay increases the probability of recidivism
Mears et al (2016) used the generalized propensity score to balance covariates across levels
of length of stay They balanced within four subgroups of time served categories using
demographics categories of commitment offense offense severity scores prior record scores
dummy coded year of release and dummy coded judicial district While they achieved balance on
this set of covariates they did not conduct a sensitivity test to evaluate the potential impact of an
omitted variable (Rosenbaum 2002) Mears et al (2016) found the effect of time served on
recidivism depended on the level of length of stay Short terms produced increased recidivism up to
12
The Relationship between Prison Length of Stay and Recidivism -- This report was prepared by Abt Associates using Federal funding provided by the Bureau of Justice Statistics (BJS) Opinions andor points of view expressed are those of the author(s) and do not necessarily reflect the official position or policies of the US Department of Justice
one year From one to two years time served decreases recidivism and thereafter has no effect
Long terms (more than 6 years) could not be evaluated due to large error terms
An RDD design employed by Hjalmarsson (2009) was also based on a guideline system
however the study applied to a juvenile population in the state of Washington and the discontinuity
was based on a sanction to a state run juvenile facility versus a local sanction This latter punishment
included sanctions involving much shorter sentences served in a local facility a term of community
supervision fines or community service Hjalmarsson found a deterrent effect of state-run
confinement for juveniles compared to the local sanctions This study was not a test of length of
stay but a test of state-run juvenile confinement as opposed to a bevy of alternate juvenile
punishments To control for the fact the running variable was correlated with recidivism across
levels of criminal history the study used a quadratic regression of the running variable
Furthermore the author used all the data without regard for bandwidth This puts tremendous
pressure on his quadratic expression being correct Secondly rather than using an intent-to-treat
estimator and perhaps converting that into LATE the author drops cross-overs from the
analysis There is no justification for doing so and we are unaware of other RDDrsquos that takes such a
step Finally the author made no attempt to justify an implicit assumption that right-hand-censoring
is independent In fact given data construction and what we know about juvenile justice right-
hand-censoring is unlikely to be independent Specifically offenders with longer terms are more
likely to be censored This relationship alone may explain the findings that incarceration reduced
recidivism
One last study of note was conducted by Drago Galbiati and Vertova (2009) in which the
authors examined the effect of a Clemency Bill in Italy that shortened the sentence of offenders
anywhere from 1 to 36 months This could be described as an exogenous treatment since the
13
The Relationship between Prison Length of Stay and Recidivism -- This report was prepared by Abt Associates using Federal funding provided by the Bureau of Justice Statistics (BJS) Opinions andor points of view expressed are those of the author(s) and do not necessarily reflect the official position or policies of the US Department of Justice
application of clemency was applied irrespective of criminal history offense age and other factors
affecting the outcome However the early release came with a caveat The remaining time to serve
would be reinstated if the offender was convicted of another crime within five years So this was a
reduction in length of stay with an added disincentive to commit a new offense People who had
spent more time in prison were less likely to reoffend and each month of remaining time to serve
was associated with a 124 percent reduction to commit a new crime2
Even with these additional studies the literature on length of stay using strong
counterfactual designs is still sparse and presents a mixed picture of effects Most studies show no
effect or that increased prison length reduces recidivism slightly Several are imbalanced in ways
that could bias the length of stay effects The studies also span different populations juveniles
adults and cover different international jurisdictions (Italy the Netherlands and United Sates) The
present study uses a very large sample of federal offenders sentenced to prison with varying lengths
of stay
INCARCERATION TREATMENT HETEROGENEITY
Scholars have argued that prison dosage (length of stay) may have different effects
conditional on factors associated with the individual with the social context with sentencing
structure and with potentially many other factors The National Academy of Sciences study on mass
incarceration finds evidence for the heterogeneity of incarceration effects (NRC 2014 427) But we
need a template to systematically examine incarceration heterogeneity
Mears Cochran and Cullen (2014) provide one such template They propose three types of
sources of heterogeneity prior sanctioning experience in-prison experiences and the level of post-
2 Kuziemko (2012) also capitalizes on early release in Georgia because jail overcrowding allowed her to compare offenders with different amounts of time served having the same prior risk levels She finds people with longer time served have lower recidivism rates These results are challenged by Roodman as possible evidence of parole bias in Kuziemkorsquos analysis
14
The Relationship between Prison Length of Stay and Recidivism -- This report was prepared by Abt Associates using Federal funding provided by the Bureau of Justice Statistics (BJS) Opinions andor points of view expressed are those of the author(s) and do not necessarily reflect the official position or policies of the US Department of Justice
release supervision ndash a pre- within- post-custody framework The National Academy of Sciences
report takes an even broader perspective by suggesting that there may be incarceration effects for
different units ndash the effect on people may be substantially different than the effect on families or
neighborhoods Based on the Mears et al hypothesized framework it seems sentencing jurisdictions
will vary on many of the important pre within and post dimensions We may be reluctant to accept
that results from Florida apply to Massachusetts unless we have a framework that tells us how to
compare jurisdictions within this pre within and post sentencing framework
For the current application we use the structure of the U S Sentencing Guidelines
sanctioning grid in our RDD design to test whether criminal history or offense seriousness moderates
the effect of length of stay increments We find that increments in length of stay have about the
same effect regardless of either of these dimensions We also separately evaluate criminal history
sex race education and marital status all showing homogeneous effects of length of stay
PRESENT METHODOLOGY DATA STATISTICS AND INFERENCE
This methodology section has three parts The first part identifies the source of the data ndash
the Federal Justice Statistics Program To provide necessary background before discussing the
regression discontinuity design the second part summarizes the US Sentencing Guidelines The
third part discusses statistical methods and the RDD identification strategy3 This application of RDD
is unconventional There are multiple break-points and hence multiple effects the effects are
summarized using a meta-regression borrowed from meta-analysis Furthermore for each effect
the bandwidth is exactly two units so search for an optimal bandwidth is not a concern Several
3 Some readers may prefer to characterize our approach as using instrumental variables The US Sentencing Guidelines are the instrument that moves offenders who otherwise have the same propensity to recidivate between two guidelines cells the first of which prescribes a shorter prison term on average than does the second Because there are many guideline cells there are many estimates based on contiguous cells The multiple estimates are averaged using inverse variance weights
15
The Relationship between Prison Length of Stay and Recidivism -- This report was prepared by Abt Associates using Federal funding provided by the Bureau of Justice Statistics (BJS) Opinions andor points of view expressed are those of the author(s) and do not necessarily reflect the official position or policies of the US Department of Justice
conventional tests used in RDD are inapplicable in this setting For example we need not test how
expanding the bandwidth affects estimates
Although the parallel is disputed (Imbens amp Lemieux 2007) some see RDD as an
instrumental variable estimator and it is practical to employ IV as the estimator This alternative
estimator is also used in this study Results show the RDD estimator and the IV estimator yield
essentially the same results
Data Source
Data for this study come from the Federal Justice Statistics Program (FJSP) a Bureau of
Justice Statistics (BJS) sponsored project to assemble federal justice records To be included in the
analysis an offender must have been sentenced under the guidelines between 1999 and 2014
Practically the period studied is shorter because to be included in the analysis an offender must have
entered community supervision but many offenders sentenced between 1999 and 2014 were still
incarcerated at the end of 2014
The FJSP has a thirty-five-year history however recent refinements link federal offenders
from investigation through corrections This paper uses a subset of the linked data running from
sentencing through a single cycle of release to community supervision and possible recidivism The
US Sentencing Commission (USSC) provides data on offenses and offenders at the time of
sentencing the Administrative Office of the US Courts (AOUSC) provides data on offenders under
community supervision and the Bureau of Prisons (BOP) provides data on offenders during periods
of incarceration Details regarding construction of the FJSP data appear elsewhere (Kling et al
2016) this paper summarizes
16
The Relationship between Prison Length of Stay and Recidivism -- This report was prepared by Abt Associates using Federal funding provided by the Bureau of Justice Statistics (BJS) Opinions andor points of view expressed are those of the author(s) and do not necessarily reflect the official position or policies of the US Department of Justice
Since 1987 federal offenders have been sentenced using sentencing guidelines and data
about guideline application have been assembled (and contributed to the FJSP) by the USSC
Guidelines data provide detailed accounts of the offenderrsquos criminal history the offense of
conviction the sentence imposed and expected prison time Expected prison time differs from
actual prison time but the two are close because sentencing in the federal system uses determinate
or real-time sentencing and as explained below actual time-served is observed with systematic
error
When an offender is sentenced to prison he or she serves time in a facility run by the
Federal Bureau of Prisons (BOP) which reports data from its inmate tracking system (SENTRY) to the
FJSP Most offender prison terms are recorded in SENTRY but some are not because (1) some
offenders are sentenced to time-served prior to trial (2) some offenders spend part of their terms in
state detention and (3) terms of thirty days or fewer are inconsistently recorded in SENTRY Because
of these limitations we use expected time-served reported by the USSC as a measure of prison time
However we use admission into a BOP facility during the period of community corrections as one
measure of recidivism
When an offender is sentenced to probation or when an offender leaves prison to serve a
statutorily required term of supervised release (a judge-imposed sentence to post-incarceration
supervision) his or her term of community supervision is recorded in Probation and Pretrial Services
Automated Case Tracking System (PACTS) an information system maintained by the Administrative
Office of the U S Courts specifically by the Probation and Pretrial Services Office (PPSO) After
some manipulation4 the PACTS data record periods of community supervision and outcomes Being
4 Federal probation officers frequently open terms of probation before the offender is sentenced and terms of supervised release before the offender is released from prison For probation the probation officer may be responsible for pretrial supervision continued into post-conviction supervision and this appears as a continuous period of community supervision
17
The Relationship between Prison Length of Stay and Recidivism -- This report was prepared by Abt Associates using Federal funding provided by the Bureau of Justice Statistics (BJS) Opinions andor points of view expressed are those of the author(s) and do not necessarily reflect the official position or policies of the US Department of Justice
revoked from community supervision is another measure of recidivism Every federal offender in our
sample received a term of community supervision eliminating one source of variability and
heterogeneity
For the recidivism analysis time-at-risk starts with the beginning of a term of supervised
release for offenders sentenced to prison The time-at-risk ends with recidivism or with the first
occurrence of one of the following censoring events completion of the community supervision term
three years or with the end of data collection Using the measures described above recidivism is
defined by the occurrence of a recognized failure event If the offender reappears in the federal BOP
data he or she is deemed to have recidivated If the offender does not reappear in the BOP data but
we observe the offender is revoked from community supervision he or she is deemed to have
recidivated Although there are several explanations for being revoked from supervision but not
entering federal prison one common reason is the offender is arrested for a state-level crime and
detained in state custody pending trial The date when an offender reenters prison is the date of
recidivism if the offender does not reenter prison but is revoked from supervision the date of the
revocation is the date of recidivism Based on years of working with the PPSO checking algorithms
with PPSO administrative staff and field staff we have confirmed that this approach ndash providing
primacy to returning to prison according to the BOP ndash is the best way to identify recidivism5
Many federal offenders are arrested for new crimes without returning to prison or having
their community supervision status revoked Using the FJSP data we estimate three-year recidivism
in the FJSP Also for probation an officer may open a supervision record when preparing a presentence report The correction is to change the beginning of supervision to the date of sentencing For a term of supervised release the probation officer might open the term in preparation for post-release planning To correct this we changed the beginning of supervision to coincide with the end of prison 5 An offenderrsquos community supervision must be revoked before he or she is committed to prison so the date of revocation would seem to be the better date for the failure event In fact probation officers often fail or are unable to record the date of revocation until weeks or months after it occurs Consequently the date of entering prison (when it occurs) is a more accurate indicator for a study of recidivism
18
The Relationship between Prison Length of Stay and Recidivism -- This report was prepared by Abt Associates using Federal funding provided by the Bureau of Justice Statistics (BJS) Opinions andor points of view expressed are those of the author(s) and do not necessarily reflect the official position or policies of the US Department of Justice
rates of about 20 percent for federal offenders placed on community supervision If new arrests
were included in the analysis the recidivism rate would be closer to 30 percent6 The FJSP does not
include arrest data so we could not define recidivism as being arrested but an arrest that does not
result in revocation is typically for a minor or unfounded crime so the outcome measures used in
this study are for events that are sufficiently serious to provoke a return to custody
To be included in the analysis the offender must have been convicted and sentenced under
the US Sentencing Guidelines since 1999 This is the period covered by the data linkage Only
offenders convicted of felonies and serious misdemeanors are sentenced routinely under the
guidelines so this study is limited to those serious offenders Others rarely serve prison terms so
the omission is inconsequential To be included in the study the offender must have entered
community supervision else we could not identify a recidivism follow-up period Because of this
requirement some offenders sentenced under the guidelines are excluded from the analysis
Several reasons explain why offenders do not enter community supervision First before entering
community supervision offenders sentenced to prison must have been released from prison
Second many federal offenders are foreign nationals in the country legally or illegally they are often
deported upon prison release so they are not candidates for a recidivism study and consequently
this study is based on US citizens7 Some other offenders are released from prison to detainers
exercised by state authorities Because offenders who never enter community supervision provide
no information for analysis they are excluded from the analysis file
6 The authors have worked with PPSO for six years to match community supervision records with criminal history records (eg criminal record histories held by state authorities and linked using an FBI index) Data use agreements preclude including criminal history records in the FJSP so they are unavailable for this analysis Based on our work with PPSO we know that recidivism rates based on arrests are near 30 percent 7 Non-citizens are sentenced to community supervision but they are deported and never enter active community supervision If they reenter the county illegally their supervision status can be revoked However this form of recidivism is very different from the form of recidivism studied in this paper so we chose to exclude non-citizens We might have retained non-citizens who entered active community supervision but they are difficult to distinguish reliably in the OBTS so we chose to exclude all non-citizens
19
The Relationship between Prison Length of Stay and Recidivism -- This report was prepared by Abt Associates using Federal funding provided by the Bureau of Justice Statistics (BJS) Opinions andor points of view expressed are those of the author(s) and do not necessarily reflect the official position or policies of the US Department of Justice
Data limitations discussed in this section seem to raise concerns about bias when measuring
recidivism but these concerns are not serious for this study Essentially a RDD study compares
offenders from group A with offenders from group B where group A and group B are closely
matched Due to matching whatever biases arise regarding the measurement of recidivism are likely
the same in groups A and B Therefore a comparison of recidivism for groups A and B is valid even if
estimates of recidivism are systematically biased
SENTENCING GUIDELINES
Explaining the RDD requires a short description of federal sentencing guidelines Under the
guidelines offense seriousness is determined by a complex set of rules that take the offense of
conviction and real offense behavior into account to classify sentencing factors into one of 43 offense
seriousness levels with j=1 being the least serious and j=43 being the most serious and six criminal
history categories with k=1 being the least serious (least likely to recidivate) and k=6 being the most
serious (most likely to recidivate) By design the offense seriousness levels reflect the USSCrsquos
assessment of offense seriousness and do not consider an offenderrsquos threat to recidivate Likewise
by design the offenderrsquos criminal history category reflects the USSCrsquos assessment of the likelihood
that an offender will recidivate Important to note subtle differences in offense conduct cause an
offenderrsquos crime to be associated with offense level j rather than offense level j-1 or j+1 For
example unarmed bank robbers armed bank robbers who do not display their weapons armed
bank robbers who display but do not threaten with their weapons and bank robbers who explicitly
threaten with their weapons all appear in different seriousness levels Furthermore offenders
convicted of violent crimes drug-law violations and property crimes can all appear in the same
offense seriousness level Based on this subtlety we expect that offenders in offense seriousness
level j will not be inherently more likely to recidivate than will offenders in seriousness levels j-1 and
20
The Relationship between Prison Length of Stay and Recidivism -- This report was prepared by Abt Associates using Federal funding provided by the Bureau of Justice Statistics (BJS) Opinions andor points of view expressed are those of the author(s) and do not necessarily reflect the official position or policies of the US Department of Justice
j+1 provided criminal history is held constant8 In fact holding criminal history constant it seems
likely that offenders in offense seriousness category j are not inherently more or less likely to
recidivate than are offenders in offense seriousness categories j-k and j+k where k is a small number
This assumption provides the identification logic for the RDD and for the instrumental variable
alternative
Under the guidelines another complex set of rules determine criminal history points which
are collapsed into six criminal history categories for the guidelines application with category 1 being
the least serious criminal record and category 6 being the most serious record Based on the offense
seriousness level and the criminal history category the federal sentencing guidelines are a 43x6 grid
comprising 43 offense seriousness rows and 6 criminal history columns Holding the criminal history
category constant moving down the grid from least serious offense level to most serious offense
level the recommended prison term increases Holding the offense seriousness level constant
moving from left to right across the grid from least serious criminal history category to most serious
criminal history category the recommended prison term increases For the least serious offenses
and for the least dangerous offenders the guidelines recommend probation or alternative sanctions
although prison terms are allowed and sometimes imposed
Every year the Commission can recommend changes to the guidelines for Congressional
approval and in fact the guidelines have changed over time These changes have little consequence
for the analysis reported in this paper Even if the composition of offenders within specific guideline
cells has changed over time recommended sentence terms have always increased with offense
8 Possibly some factors entering the determination of the offense seriousness level might predict recidivism However crimes committed in the federal system are so diverse and factors entering the guidelines are so detailed it seems unlikely that increases in the offense seriousness levels would be systematically associated with recidivism holding criminal history constant Possibly for some cell jj+1 comparisons factors that enter the offense seriousness determination may cause recidivism to increase or decrease but provided these factors are not systematic ndash meaning that they do not always increase recidivism as the comparison moves from cell j to j+1 ndash the treatment effect is still identified
21
The Relationship between Prison Length of Stay and Recidivism -- This report was prepared by Abt Associates using Federal funding provided by the Bureau of Justice Statistics (BJS) Opinions andor points of view expressed are those of the author(s) and do not necessarily reflect the official position or policies of the US Department of Justice
seriousness level As explained in this next section that regularity is sufficient to support the RDD
estimation procedure
THE RDD AND STATISTICAL METHODOLOGY
During the last decade methods for inferring causality have gone well beyond naive
regression models criticized by Nagin and his colleagues (Morgan amp Winship 2015 Imbens amp Rubin
2015) A regression discontinuity design (Hahn Todd amp van der Klauuw 2001 van der Klaauw 2002
Imbens amp Lemieux 2007 Lee amp Lemieux 2010 Bloom 2012) is a rigorous approach often applied in
non-criminal justice research and sometimes applied in criminal justice studies (Berk amp Rauma 1983
Berk amp DeLeeuw 1999 Berk 2010 Rhodes amp Jalbert Regression Discontiuity Design in Criminal
Justice Evaluation An Introduction and Illustration 2013) Commonly the RDD is applied in a setting
where a decision rule based on factors (such as offense seriousness level holding criminal history
constant) can be used to define a ldquocut-pointrdquo that places study subjects (such as offenders) into one
group that does and another group that does not receive treatment Very near that rule-imposed
cut-point study subjects who do and do not receive treatment are so similar that a comparison of
outcomes for the two groups is deemed valid This section explains that our application of the RDD
identification strategy differs from the conventional application
One difference between our application and the standard application is that for us treatment
is a dose (eg the length of a prison term) while in standard applications treatment is a binary
condition On average the dose received by offenders in cell j+1 is higher than the dose received by
offenders in cell j Because offenders in cells j and j+1 are otherwise the same regarding the threat to
recidivate we can ask whether offenders in cell j+1 have higher or lower recidivism rates than
offenders in cell j and if so we have justification for attributing causation As a stylized example
22
The Relationship between Prison Length of Stay and Recidivism -- This report was prepared by Abt Associates using Federal funding provided by the Bureau of Justice Statistics (BJS) Opinions andor points of view expressed are those of the author(s) and do not necessarily reflect the official position or policies of the US Department of Justice
suppose first-time offenders who steal $100000 are sentenced according to offense seriousness
level j while first-time offenders who steal $125000 are sentenced according to offense seriousness
level j+1 In deference to the more serious crime the guidelines call for a term between 20 and 23
months for first-time offenders sentenced within guideline cell j and between 22 and 26 months for
first-time offenders sentenced within guidelines cell j+1 Given judicial discretion sentences imposed
on offenders within guideline cell j overlap with sentences imposed on offenders within guideline cell
j+1 but on average prison sentences within guideline cell j+1 are longer than those imposed within
guideline cell j This average difference drives the identification strategy Specifically holding the
criminal history category constant offenders sentenced within guideline cell j+1 are not inherently
more recidivistic than are offenders sentenced within guideline cell j but offenders sentenced within
guideline cell j+1 receive longer prison terms on average and we can test for whether those longer
prison terms account for higher or lower recidivism
Usually when applying RDD researchers consider a variable X (called a running variable in
the RDD context) and a critical value Xo that assigns study subjects to a comparison group when X lt
Xo and to a treatment group otherwise A sharp design occurs when the assignment is exact a fuzzy
design occurs when the assignment is inexact Although both sharp and fuzzy designs both estimate
the treatment effect sharp designs are preferred because (from a statistical estimation standpoint)
they are more efficient and interpreting the effect is clear
When treatment is binary as it is in standard applications the distinction between sharp and
fuzzy is straightforward Let PL be the probability of treatment when X lt Xo and let PR be the
probability of treatment otherwise If PL = 0 and PR = 1 then the design is sharp Let YL be the mean
outcome when X lt Xo and let YR be the mean outcome otherwise An estimator for the treatment
effect is YR-YL or just the difference in the mean outcomes But suppose that PL ge 0 or PR le 1 or both
23
The Relationship between Prison Length of Stay and Recidivism -- This report was prepared by Abt Associates using Federal funding provided by the Bureau of Justice Statistics (BJS) Opinions andor points of view expressed are those of the author(s) and do not necessarily reflect the official position or policies of the US Department of Justice
then the design is fuzzy Given a fuzzy RDD an often-used estimator is (YR-YL)(PR-PL) This
alternative estimator is sometimes called a local average treatment effect (LATE) Note the
numerator is an intent-to-treat estimator and in fact statistical testing is based on the numerator
because dividing by a constant will not change the properties of the basic test of whether treatment
is effective
For our application treatment is a dose and doses are distributed about a mean that
depends on whether X lt Xo or X ge Xo A necessary condition is that a shift in the offender from
guideline cell j to guideline cell j+1 will always (a sharp design) or sometime (a fuzzy design) cause an
offender to receive a longer prison term The monotonicity assumption is that this shift will never
cause an offender to receive a shorter prison term We presume the monotonicity assumption holds
and see no reason to assume otherwise
A test of the null hypothesis of no treatment effect is based on YR-YL Let TL be the average
prison term for X lt Xo let TR be the average prison term for X ge Xo Then the counterpart to the LATE
estimator for the binary treatment effect is (YR-YL)(TR-TL) or the change in recidivism per unit of
additional prison This too is a local average treatment effect Its interpretation is the average
increasedecrease in recidivism resulting from an average increase in prison length
In both these illustrations the estimator is LATE LATE is not necessarily the average
treatment effect or in this case the average increasedecrease in recidivism from increasing time-
served by one unit However LATE is almost always used as a substitute for that average which is
unidentified (Imbens 2009)
Returning to the standard application the ideal identification strategy requires that
estimation be limited to study subjects whose X values are just slightly less than Xo or equal to or
24
The Relationship between Prison Length of Stay and Recidivism -- This report was prepared by Abt Associates using Federal funding provided by the Bureau of Justice Statistics (BJS) Opinions andor points of view expressed are those of the author(s) and do not necessarily reflect the official position or policies of the US Department of Justice
slightly more than Xo9 Because very few observations meet these demanding conditions evaluators
usually expand the bandwidth to be broader than ldquoslightly lessrdquo and ldquoslightly morerdquo Because this
expansion of the bandwidth violates the asymptotic identification assumptions evaluators typically
assume that a local linear regression of the outcome variable Y on X will capture the relationship
between Y and X absent any intervention Given the intervention any departure from the local linear
regression around Xo is deemed the treatment effect A standard application would test the
credibility of this local linear regression and a standard application would test the sensitivity of
findings to the size of the bandwidth
Our application differs from the standard application in important ways Typically when
researchers apply the RDD strategy there is a single cut-point so there is a single estimate of the
treatment effect Less commonly there are multiple cut-points and a researcher can estimate
multiple treatment effects (Cattaneo Keele Tituinik amp Vazquez-Bare 2016) Given the structure of
the sentencing guidelines our study is based on a multiple cut-point RDD That is we estimate
multiple effects then combine them to generalize conclusions
Rather than increasing efficacy by expanding the bandwidth we always make comparison
across adjacent cells so that cell j is deemed ldquoslightly lessrdquo than the offense seriousness level that
determines cell j+1 Employing multiple cut-points achieves small standard errors by combining the
multiple estimates that arise from comparing outcomes for cells jj+1 j+1j+2 j+2j+3 and so on It is
unnecessary to expand the bandwidth beyond two units
9 ldquoSlightly lessrdquo and ldquoslightly morerdquo mean than X falls within a region X+δ and X-δ as δ approaches zero Expanding the bandwidth means that δ is allowed to get bigger
25
The Relationship between Prison Length of Stay and Recidivism -- This report was prepared by Abt Associates using Federal funding provided by the Bureau of Justice Statistics (BJS) Opinions andor points of view expressed are those of the author(s) and do not necessarily reflect the official position or policies of the US Department of Justice
In the conventional application a researcher would assure the relationship between the
outcome variable and the running variable is linear to the left and right of the breakpoint10 Because
our approach employs just two points j and j+1 this test is unavailable to us Arguably it is also
inapplicable because when estimating an effect we do not expand the bandwidth beyond j and j+1
In the conventional application the researcher will assure there is a discontinuity in treatment so
that treatment is more likely for those to the right of the cut-point than it is for those to the left We
do apply this conventional test showing that it holds
In conventional RDD analysis researchers worry about ldquogamingrdquo In the present context
defense attorneys have incentives to move their clients to lower guideline cells and prosecuting
attorneys have countervailing incentives to move offenders to higher guideline cells Gaming is
possible by manipulating guideline elements such as the amount of money stolen Defense
attorneys would argue the amount is lower than alleged prosecutors would argue the opposite In
conventional RDD analysis researchers use imperfect devices to test for gaming but those tests are
not necessary in the present context
To explain suppose a variable Z is associated with recidivism and is subject to gaming such
that defense attorneys are generally able to shift offenders from cell j+1 to cell j based on the value
of Z In our study we would expect a general shift in Z from j+2 to j+1 from j+1 to j from j to j-1
from j-1 to j-2 and so on In general this shift would have no effect on the contrasts because it
occurs across all adjacent cells Thus gaming is less relevant for a multiple-effect RDD than for a
conventional single-effect RDD Furthermore we are only concerned with gaming about variables
10 Postulating a linear relationship is frequent but some researchers expand their models to allow power functions of the running variable Hjalmarsson (2009) in a study of guidelines and juvenile justice discussed earlier used a quadratic This is a dangerous practice because the validity of the quadratic is difficult to assess and findings based on a RDD are sensitive to getting the model specification correct There are other elaborate alternatives to using local linear regressions but they are not applicable to our study
26
The Relationship between Prison Length of Stay and Recidivism -- This report was prepared by Abt Associates using Federal funding provided by the Bureau of Justice Statistics (BJS) Opinions andor points of view expressed are those of the author(s) and do not necessarily reflect the official position or policies of the US Department of Justice
that affect recidivism Because criminal history is held constant by construction of the guideline cells
the avenue for gaming is restricted Nevertheless we introduce some test for whether variable
associated with recidivism vary systematically across cells so that for example we ask whether
offenders in cell j+1 tend to be older than offenders in cell j We introduce these potential
confounders into the local linear regression Although we do not need a local linear regression for
identification we increase the efficiency of estimates by using a regression to include covariates in
the analysis Given the nature of the outcome variable when comparing outcomes in cells j and j+1
our study uses a Cox survival model sometimes called a Cox proportional hazard model but it is
ldquolocalrdquo only in the sense that (absent the intervention) the baseline survival model is invariant
around the cut-point and we estimate the treatment effect from a unit shift There exists an
extensive methodological literature on survival models (Lancaster 1990 Kalbfleisch amp Prentice
2002 Hosmer Lemeshow amp May 2008) which are frequently applied in studies of criminal
recidivism where time-at-risk is often censored A separate study justifies using the proportional
hazard model (rather than a parametric alternative) to study recidivism in the federal system
(Rhodes et al 2012) Although the approach seems uncommon others have used survival models as
the estimator in a RDD context (Rhodes amp Jalbert 2013 Bor Moscoe Mutevedzi Newell amp
Barnighausem 2014) We use the RDD identification strategy and the survival model estimation
strategy to identify and estimate the change in the hazard of recidivism across paired guideline cells
The most defensible approach consistent with the intuition of the RDD would seem to be to
compare the relative hazards for cell j and j+1 (holding criminal history category constant) because
offenders in cells j and j+1 are more alike than in any other comparison Both the previous discussion
and descriptive statistics discussed subsequently points toward a problem Cells j and j+1 are so
27
The Relationship between Prison Length of Stay and Recidivism -- This report was prepared by Abt Associates using Federal funding provided by the Bureau of Justice Statistics (BJS) Opinions andor points of view expressed are those of the author(s) and do not necessarily reflect the official position or policies of the US Department of Justice
alike the average time-served is not guaranteed to increase when comparing cell j to cell j+111 Even
when it increases the size of the increase may be so small that it is not informative As an extreme
example there is not much use in comparing recidivism for offenders who serve two years on
average when sentenced within cell j and two years plus one day on average when sentenced within
cell j+1 From experimentation to assure that average time served will increase between contrasted
cells we have found it better to compare the outcome from cell j and cell j+212 Notwithstanding
what was written above most of the analysis is based on that jj+2 comparison but we do offer
sensitivity tests that employ the original jj+1 comparison An alternative approach is to combine
cells j and j-1 and compare that with the combined cells j+1 and j+2 (This is equivalent to expanding
the bandwidth) However this alternative approach seems to offer no advantages and introduces
some difficult estimation problems (serial correlation and general model specification issues) when
combining multiple effects so we avoid its application
Because this identificationestimation strategy results in many hazard estimates (potentially
41x6) we use techniques familiar from meta-analysis to combine estimates (effects) into summary
statistics A useful explanation of a fixed-effect meta-regression is Rhodes (2012) For example for
the first criminal history category there are potentially 41 effects We estimate a weighted least-
squares linear regression to estimate the average of the 41 effects Because there are 6 criminal
history categories we repeat the meta-regression across the 6 criminal history categories and then
average the 6 meta-regression averages to derive a single inverse variance weighted estimate and
11 Especially for drug-law violations and weapons offenses federal statutes require application of mandatory minimum sentences Regardless of guideline recommendations judges cannot sentence below the mandatory minimums Because mandatory minimums are not evenly distributed across the offense seriousness levels it is possible for the average terms in cell j to be larger than the average terms in cell j+1
12 Across the six criminal history categories the average percent change in time-served between cells j and j+1 ranges from 9 to 18 with the change being largest for criminal history category 1 In comparison across the six criminal history categories the average percent change in time-served between cells j and j+1 ranges from 20 to 38 with the change being largest for criminal history category 1
28
The Relationship between Prison Length of Stay and Recidivism -- This report was prepared by Abt Associates using Federal funding provided by the Bureau of Justice Statistics (BJS) Opinions andor points of view expressed are those of the author(s) and do not necessarily reflect the official position or policies of the US Department of Justice
test statistic Thus although there are many estimates there is only one test statistics and hence no
multiple comparison problem
For reasons explained below when applying the meta-regression we must deal with error
terms that may be auto-correlated and heteroscedastic We will show that heteroscedasticity is a
major problem and to deal with it we used weighted least squares Because we compare cells j with
j+2 j+1 with j+3 j+2 with j+4 and so on we potentially introduce autocorrelation across the
estimates The jj+2 and j+2j+4 comparisons are not independent because they have j+2 in common
This problem has corrections (Prais-Winston estimators for example) but they are suspect in small
samples where ignoring the problem is likely better than attempting to introduce a feasible
generalized least squares solution (Greene 2008 p 648) This follows because small samples provide
inaccurate estimates for the autocorrelation coefficient We concentrate on the heteroscedasticity
problem however we provide a sensitivity test suggesting that autocorrelation can safely be
ignored
The meta-regression provides the average effect of moving from guidelines cell j to cell j+2
This is an intent-to-treat estimator If this movement were not statistically significant we would
conclude that increasing prison terms has no effect on criminal recidivism If the average effect is
statistically significant by itself it does not provide LATE the size of the effect resulting from a unit
increase in prison time Our approach is to report the size of the average effect when moving from
cell j to j+2 the average increase in the length of the prison term when moving from cell j to j+2 and
the ratio of the two The ratio is essentially the LATE
A more direct approach which requires the same assumptions as were applied above is to
apply an instrumental variable (IV) estimator where the shift from guideline cell j to j+2 is the
instrument That is offenders in cell j+2 are not inherently more or less recidivistic than are
29
The Relationship between Prison Length of Stay and Recidivism -- This report was prepared by Abt Associates using Federal funding provided by the Bureau of Justice Statistics (BJS) Opinions andor points of view expressed are those of the author(s) and do not necessarily reflect the official position or policies of the US Department of Justice
offenders in cell j but the longer average sentences served by offenders in cell j+2 cause those
offenders to recidivate at a greater or lesser rate than offenders in cell j Instead of a dummy
variable representing membership in cell j or j+2 the important right-hand-side variables is the
average time-served by offenders in cell j and j+213 That is the treatment variable takes one of two
values the average time-served by offenders in cell j (when the observation belongs to cell j) or the
average time-served by offenders in cell j+2 (when the observation belongs to cell j+2) The
advantage of this approach is that parameter estimates have the interpretation of ldquochange in the
relative hazard per additional month of time servedrdquo The disadvantage is that IV estimators lack
desirable asymptotic properties (that is they are biased even in large samples) when applied to a
non-linear model and the Cox regression is a non-linear model (Rhodes 2010) Nevertheless we
expect estimates to be approximate and worth comparing with the RDD estimates
RESULTS
This section has two parts The first part provides descriptive statistics and justification for
deleting cases from the analyses The second section provides estimates of the effect of increasing
time-served on recidivism using the RDD and IV approaches it also provides sensitivity tests for case
deletion and other analytic decisions
DESCRIPTIVE STATISTICS AND RULES FOR DELETING CASES
Table 1 reports the number of offenders available for the analysis before we add restrictions
To be included in this table an offender must meet three criteria First he or she must have been
sentenced under the guidelines because guidelines calculations are used in the analysis Second he
13 This is a two-stage estimation model The first-stage involves a regression of time-served on dummy variables representing the adjacent guideline cells But this regression will simply provide the mean time-served in each cell so we do not actually perform the regression
30
The Relationship between Prison Length of Stay and Recidivism -- This report was prepared by Abt Associates using Federal funding provided by the Bureau of Justice Statistics (BJS) Opinions andor points of view expressed are those of the author(s) and do not necessarily reflect the official position or policies of the US Department of Justice
or she must be a US citizen We cannot follow recidivism by deported offenders And third he or
she must have entered active community supervision following sentencing ndash either probation or a
term of supervised release ndash because active supervision initiates the time at risk of recidivism This
third criterion has two implications If an offender never entered active community supervision that
offender would not appear in the analysis Specifically if an offender was sentenced to prison and
remained in prison as of September 30 2014 that offender would not appear in the analysis Thus
offenders sentenced to long prison terms and especially offenders sentenced toward the end of the
data collection window are more likely to be excluded than are other offenders This systematic
selection will not bias the RDD estimates because any selection bias will be equally applicable to cell j
and cell j+2 That is the RDD implicitly adjusts for the selection bias
Insert Table 1 about here
Shading identifies cells with fewer than 100 observations Although data for the most and
least serious offense levels are sparse the sample sizes for the other cells are ample an important
point because the RDD approach holds criminal history category constant and compares outcomes
for offense serious levels j and j+2 Notice that about half the offenders fall into criminal history
category 1 and given that these are relatively inexperienced offenders a reader might put more
subjective weight on the analysis of offenders in this criminal history category To be included in the
principal analysis a cell must have 100 or more offenders Stripped of some other statistical issues
basically the RDD approach requires a comparison of the mean recidivism rates for cells j and j+2
Because the sampling variance for estimated difference in outcomes between offense seriousness
levels j and j+2 is inversely proportional to the number of offenders in cells j and j+2 setting a
minimum number of observations increases the average precision of estimated effects for those cells
31
The Relationship between Prison Length of Stay and Recidivism -- This report was prepared by Abt Associates using Federal funding provided by the Bureau of Justice Statistics (BJS) Opinions andor points of view expressed are those of the author(s) and do not necessarily reflect the official position or policies of the US Department of Justice
retained in the analysis but we will present sensitivity analyses of the 100-offender criterion
showing the analysis appears insensitive to this criterion
Using the same data applied to produce Table 1 Table 2 reports the percentage of offenders
who receive prison terms by guidelines cell Shading denotes that fewer than 50 of offenders
within a cell are sentenced to prison Prison is often imposed for federal crimes but sentencing
guidelines (and hence this table) are only mandatory for felonies and serious misdemeanors
Additionally many federal crimes are dual jurisdiction offenses and generally the most serious
crimes are prosecuted in federal court while the least serious crimes are prosecuted in state courts
These factors explain why prison terms are so frequent in these data Still prison is infrequent for
offenders convicted of the least serious crimes provided they lack serious criminal records For a cell
to be included in the principal analysis at least 50 of offenders in that cell must have received
prison terms Justification is that for estimating effects the effective sample size is proportional to
the number in the cell multiplied by the percentage sentenced to prison because probation
sentences count as zero for these calculations (Offenders sentenced to straight probation are
assigned prison terms of length zero) However we will provide sensitivity testing of this selection
criterion showing that findings are insensitive to the criterion
Insert Table 2 about here
Inspection of Table 2 shows some irregularities in the progression of sentence severity
especially for the least serious offense levels but the general pattern is that prison terms become
increasingly certain as we look down the table (from least to most serious crimes) and across the
table (from least to most serious offenders) Inspection of Table 3 which reports average time-
served (counting probation as zero) also shows some irregularities but the general pattern is that
32
The Relationship between Prison Length of Stay and Recidivism -- This report was prepared by Abt Associates using Federal funding provided by the Bureau of Justice Statistics (BJS) Opinions andor points of view expressed are those of the author(s) and do not necessarily reflect the official position or policies of the US Department of Justice
average time-served in prison increases as we look down the table (from least to most serious
crimes) and across the table (from least to most serious offenders)
The irregularities cause a problem for the RDD If the RDD compared cells j with j+1 for a
RDD strategy to work we must observe a substantial increase in the average time in prison as we
compare cell j with cell j+1 Logically small changes fail to create a credible contrast Looking
especially at Table 3 several cell j and j+1 contrasts fail to meet this criterion The problem is that
moving from cell j to cell j+1 is a subtle shift and we find a better comparison to be between cell j
and j+2 This is the reason for using a jj+2 comparison instead of a jj+1 comparison Although
comparing cells j and j+2 may raise validity issues whatever bias is introduced is likely to be small
and from a mean-squared-error perspective comparing jj+2 instead of jj+1 seems justified
However as a sensitivity test we also report estimates based on a comparison of cells j and j+1 and
qualitative results prove insensitive to whether the comparison is between jj+1 or jj+2
Insert Table 3 about here
One more table is useful for summarizing the recidivism measure Table 4 reports the
percentage of offenders who recidivate during their periods of community supervision These
statistics are right-hand-censored by the length of the time-at-risk and capped at three years They
do not account for censoring due to supervision terms less than three years Although most
offenders avoid returning to prison returning to prison is not an infrequent occurrence At this
descriptive stage of the analysis patterns may seem peculiar Looking down each column recidivism
rates are lower for offenders incarcerated for the most serious crimes and higher for offenders
incarcerated for the least serious crimes Although as description this pattern is correct the effect is
probably not causal It seems likely that offenders who serve the longest terms are older when
released from prison than are offenders who serve the shortest terms and given that age is
33
The Relationship between Prison Length of Stay and Recidivism -- This report was prepared by Abt Associates using Federal funding provided by the Bureau of Justice Statistics (BJS) Opinions andor points of view expressed are those of the author(s) and do not necessarily reflect the official position or policies of the US Department of Justice
predictive of recidivism the patterns may be partly a result of age Reading across the table
recidivism tends to increase with criminal history but small sample sizes for the most serious
criminal history scores may be responsible for imprecise estimates
Insert Table 4 about here
Intended as a summary of the patterns shown by Table 4 Figure 1 presents survival curves
based on Kaplan-Meier estimates stratified by criminal history categories To be included in this
analysis an offender had to be sentenced within a guideline cell with 100 or more offenders and at
least 50 percent of offenders within that cell must have received prison terms Those restrictions are
consistent with the restrictions imposed for the principal analysis presented later However the
figure changes very little when the restrictions are removed In general as the criminal history
category increases so too does the rate of recidivism although the difference between criminal
history categories 5 and 6 is barely perceptible
Insert Figure 1 about here
Table 5 extends the descriptive analysis appearing in Figure 1 to include covariates (The
table reports parameters from a Cox model not relative hazards) The regression is naiumlve in the
sense that it does not account for potential confounding variables that might ndash if known ndash explain
why recidivism falls as the offense severity level (and hence time-served) increases This regression
uses variables that will reappear in the local linear regressions that we use for the RDD analyses
Separate Cox regressions are reported for each criminal history category
Scaled time-served This is estimated time-served rescaled by dividing the original time-served by
the maximum time-served Time-served is capped at 180 months The cap is
inclusive of more than 99 percent of terms
34
The Relationship between Prison Length of Stay and Recidivism -- This report was prepared by Abt Associates using Federal funding provided by the Bureau of Justice Statistics (BJS) Opinions andor points of view expressed are those of the author(s) and do not necessarily reflect the official position or policies of the US Department of Justice
Time-served squared This is the square of scaled time-served
Scaled age This is the offender age at the time that he or she entered community
supervision rescaled to run from 0 to 1
Age squared This is scaled age squared
Female This is a dummy variable for female
Black This is a dummy variable for Black
Other race This is a dummy variable for race other than White or Black
Hispanic This is a dummy variable for Hispanic ethnicity It is not collinear with the
race variables
High school This is a dummy variable indicating the offender has a high school degree or
equivalent
Advanced degree This is a dummy variable indicating the offender has a degree beyond high
school
Lives alone This is a dummy variable indicating the offender is neither married nor living
in a common law relationship at the time of sentencing
Centered CH points The guidelines assign criminal history points based on criminal records that
are collapsed into the six criminal history categories The criminal history
points are centered to have a mean of zero for each guideline cell
District This is the judicial district where the sentence was imposed There are 94
federal districts including those in territories District enters the analysis
35
The Relationship between Prison Length of Stay and Recidivism -- This report was prepared by Abt Associates using Federal funding provided by the Bureau of Justice Statistics (BJS) Opinions andor points of view expressed are those of the author(s) and do not necessarily reflect the official position or policies of the US Department of Justice
when estimating the frailty parameter that is as a random effect associated
with the Cox model
Because they run from zero to one scaled variables are useful for interpreting quadratics
The centered criminal history points provide a more refined measure of criminal record beyond the
broader criminal history category Centering this score is unimportant for the results presented in
Table 5 but centering is useful for later analyses
Insert Table 5 about here
As description the estimates appearing in Table 5 tell a simple story As best as a quadratic
can capture the pattern recidivism falls as time-served increases after accounting for the criminal
history category The declines are substantial and tend to be greater (but not consistently) for those
with minor criminal records (category 1) than for those with serious criminal records (categories 2-6
exclusive of 5) As an illustration when time-served changes from 30 months to 60 months the
relative hazards from criminal history 1 to criminal history 6 are 081 074 072 075 081 and 077
respectively14
Except regarding age other parameters are less interesting for this current study because
they tell us nothing about how recidivism changes with time-served (Women are less recidivistic
than men Blacks and other races are more recidivistic than Whites Hispanics tend to be less
recidivistic than non-Hispanics The educated are less recidivistic than the under-educated Marital
association appears to have no predictive effect The relative importance of these covariates
appears to decrease as criminal history increases) The inverse relationship between recidivism and
2
180
3060
180180 180
60 3014 For example the relative hazard for criminal history category 1 equals exp 1707
0941
minus+minusminus
2
36
The Relationship between Prison Length of Stay and Recidivism -- This report was prepared by Abt Associates using Federal funding provided by the Bureau of Justice Statistics (BJS) Opinions andor points of view expressed are those of the author(s) and do not necessarily reflect the official position or policies of the US Department of Justice
time-served cannot be explained by age If we were to accept results from this naiumlve regression we
would conclude that longer prison terms cause recidivism to fall dramatically (up to 28 percent for a
30-month increase) but we are reluctant to attach causality to these regression results because we
cannot be sure that all confounding factors have been considered Hence we turn to the RDD
The results reported in Table 5 suggest that marital status does not predict recidivism
Because this variable is frequently missing we drop it from the following analysis The ethnic status
Hispanic sometimes predicts recidivism but the effect is not large and this variable is often missing
Consequently we also drop the ethnic category Hispanic from the following analysis
ESTIMATES OF THE EFFECT THAT INCREASING TIME-SERVED HAS ON
RECIDIVISM
The previous section described data sources and gross patterns in those data This section
presents evidence based on a regression discontinuity design For every jj+2 contrast we compute
a unique effect as a log-relative hazard Potentially this leads to 6x41 effects because there are 41
possible contrasts within each criminal history category and there are 6 criminal history categories
In fact we produce fewer estimates because data selection rules exclude some of the contrasts The
number entering the analysis depends on the sensitivity tests but 175 contrasts appear in the
principal analysis
For each contrast between cells j and j+2 we estimate a Cox survival model15 The effect size
is the parameter associated with a dummy variable coded 1 for cell j+2 and coded zero for cell j The
15 By default we estimated a Cox model with covariates and shared frailty the covariates and criterion for the shared frailty are described in the text Sometimes to estimate the model we removed the shared frailty parameter in which case we estimated the relative hazard using the covariates but not the shared frailty given the RDD the relative hazard is still
37
The Relationship between Prison Length of Stay and Recidivism -- This report was prepared by Abt Associates using Federal funding provided by the Bureau of Justice Statistics (BJS) Opinions andor points of view expressed are those of the author(s) and do not necessarily reflect the official position or policies of the US Department of Justice
outcome measure is returning to prison following placement on community supervision or being
revoked from supervision (When an offender enters community supervision multiple times we only
include the first period of supervision in the analysis) Time at risk is censored by the end of the
study period or by the end of community supervision or at three years if supervision is ongoing after
three years Censoring by the end of community supervision is important because thereafter an
offender cannot return to federal prison unless he or she is convicted of a new federal crime
Fundamentally once an offender successfully completes his term of community supervision the FJSP
no longer tracks his criminality so the study cannot extend beyond the end of community
supervision Occasionally an offender may serve his entire sentence and then commit a new federal
crime Although he or she would reappear in the FJSP we only consider the first conviction
When applying a RDD identification strategy researchers are careful to justify that two
conditions hold Translated into the current setting where we compare outcomes in cell j and j+2
the two conditions are (1) on average time-served in cell j+2 must be greater than time-served in
cell j (2) There must be no other differences between offenders in cells j and j+2 that could account
for differences in recidivism In practice this second condition is difficult to establish By
construction of the guidelines and given the fact that we compare cells j and j+2 along the offense
seriousness dimension and never along the criminal history dimension we are confident this
condition holds Nevertheless an indirect empirical test is whether the guidelines cause offenders in
cell j+2 to look systematically different than offenders in cell j This is testable
By the design of the guidelines we anticipate that variables sometimes associated with
recidivism will have about the same mean values in cell j as in cell j+2 Of course we expect time-
consistent Sometimes to estimate the model we removed both shared frailty and the covariates in which case we estimated the relative hazard with just an indication the data came from cell j rather than j+2 Again given the RDD the estimate of relative hazard is consistent but not efficient If we could not estimate the relative hazard the estimate is reported as missing
38
The Relationship between Prison Length of Stay and Recidivism -- This report was prepared by Abt Associates using Federal funding provided by the Bureau of Justice Statistics (BJS) Opinions andor points of view expressed are those of the author(s) and do not necessarily reflect the official position or policies of the US Department of Justice
served to differ between cell j and cell j+2 and it does by 54 months on average (Plt001) If this
difference were not large there would be little point to the analysis
On average other variables do not change significantly between cell j and j+2 16 We tested
the following variables date of birth educational attainment sex race Hispanic status marital
status date when sentenced and criminal history point score The differences were small and none
approached statistical significance The results for criminal history point score seem especially
important because we consider this variable to be highly correlated with recidivism The fact that
the criminal history point score does not change systematically from cell j to j+2 suggests that
offenders in cell j+2 are not inherently more or less recidivistic than are offenders in cell j Therefore
the data pass this diagnostic test
While the inclusion of covariates may be unnecessary for identification including covariates
in the Cox regression is expected to reduce residual variance and improve the precision of the
estimates As noted the principal variable is a dummy variable coded one if the observation is from
cell j+2 and coded zero if from cell j Other covariates with the noted exceptions are the same as
were used in the naiumlve regression Obviously we have also excluded the scaled time-served variable
and its square Because there are 41x6 possible regressions (175 in this main application) we do not
show the regression results from this stage of the analysis Instead we report the single parameter of
interest (the average effect) for each regression in graphical form
Within each criminal history category the Cox model estimates the hazard of recidivism for
offenders in category j+2 relative to offenders in category j holding covariates constant Using the
16 The change is computed for every jj+2 pair The statistics reported in the texts are a weighted average of those pair comparisons Weights equal the inverse of the sampling variances Because of the distribution of offenses within the guidelines the least serious criminal history categories and the middle of the offense seriousness range dominate the calculations Arguably the estimates are not independent so standard errors are suspect Nevertheless the estimates of differences between cells j and j+2 are not biased and these average differences are small
39
The Relationship between Prison Length of Stay and Recidivism -- This report was prepared by Abt Associates using Federal funding provided by the Bureau of Justice Statistics (BJS) Opinions andor points of view expressed are those of the author(s) and do not necessarily reflect the official position or policies of the US Department of Justice
log-relative hazard (eg the parameter that is exponentiated to get the relative hazard) the next step
is to estimate a regression where the estimated log-relative hazard is the dependent variable and the
independent variable is the centered offense seriousness level This is the meta-regression It is
specific to a criminal history category so there are six meta-regressions This specification allows us
to examine how the log-relative hazard varies over the offense seriousness levels That is the
regressions allow us to combine effects (our main motivation) and test for heterogeneity (a
secondary motivation)
Effects may be heterogeneous across offense seriousness levels for two reasons For one
offenders convicted of the most serious crimes who serve the longest prison terms may respond
differently to incremental increases in the lengths of their terms than do offenders convicted of the
least serious crimes who serve the shortest prison terms For another for offenders convicted of
the most serious crimes the incremental change in the length of a prison term from cell j to j+2 is
much larger than the incremental change for offenders convicted of the least serious crimes (See
Table 3) Heterogeneity in treatment effects seems likely but how that heterogeneity varies with
offense severity level is uncertain Examining Tables 1-3 recalling the selection rules and recalling
that we are using weighted least squares regression to estimate the heterogeneity information used
by the regression comes mostly from the middle offense seriousness levels so incremental changes
to time-served are fairly constant Quite possibly there is heterogeneity but we will have insufficient
power to detect it
As before the analysis is stratified on the criminal history category so for each regression
there are potentially 41 data points but many fewer (29 to 37 in the main analysis) enter the meta-
regression because of selection criteria identified earlier Referring to Tables 1 and 2 almost all the
lost contrasts come from having too few cases per cell or from having a low proportion of prison
40
The Relationship between Prison Length of Stay and Recidivism -- This report was prepared by Abt Associates using Federal funding provided by the Bureau of Justice Statistics (BJS) Opinions andor points of view expressed are those of the author(s) and do not necessarily reflect the official position or policies of the US Department of Justice
terms per cell referring to Table 3 few cells (and hence contrasts) are lost because average prison
terms do not increase from cell j to j+2 Because the RDD identifies the effect the right-hand-side
variables are not control variables rather the meta-regression is a descriptive device (with statistical
implications) helping us to detect possible patterns
Estimation has multiple steps We summarize with an algorithm
1 Select all offenders from criminal history category k = 1
a Select all offenders with offense seriousness levels j = 1 and j = 3 If the jj+2 contrast
does not meet selection criteria increase j by 1 and try again
b It the jj+2 contrast meets the selection criteria estimate a Cox regression where a
dummy variable is coded 1 for offenders in offense seriousness level j+2 and coded 0
for offenders in offense seriousness level j The parameter associated with this
dummy variable is the log-relative hazard for the jj+2 contrast Save this estimate
c Increase j by 1 and repeat steps a-c until j = 41
d Estimate a meta-regression where the dependent variable is the log-relative hazards
from steps a-c The independent variables are a constant and the centered offense
seriousness level equal to j+2 for the jj+2 contrast Save the estimated constant and
its standard error for use in step 3
2 Repeat steps 1a-d for criminal history categories 1-6 This leads to six estimated constants
and six estimated standard errors for step 3
3 For step 3 create weights proportional to the inverse of the squares of the six standard
errors The final estimate is the weighted average of the six estimated constants This is
interpreted as the average log-relative hazard Results are discussed below
41
The Relationship between Prison Length of Stay and Recidivism -- This report was prepared by Abt Associates using Federal funding provided by the Bureau of Justice Statistics (BJS) Opinions andor points of view expressed are those of the author(s) and do not necessarily reflect the official position or policies of the US Department of Justice
MAIN RESULTS
The main model adopts the following selection criteria
bull For a guideline cell to be included in the analysis 100 or more offenders must appear within that cell
bull For a guideline cell to be included in the analysis 50 or more of offenders must have received prison terms
Comparisons are of outcomes in cell j+2 and cell j
The main results are shown in Figure 2 The figure shows patterns in the relative hazards and
associated statistics The figure has six panels one for each of the criminal history categories
Within each panel the vertical axis is the scale for the relative hazard as estimated by the Cox model
A hazard equal to 1 implies that increasing prison time has a neutral effect on recidivism A hazard
greater than 1 implies that increasing prison time increases recidivism a hazard less than 1 implies
that increasing prison time decreases recidivism The horizontal axis corresponds to the contrast
The offense seriousness level of 3 is the contrast between offense seriousness levels 1 and 3 the
offense seriousness level of 4 is the contrast between levels 2 and 4 and so on until level 43 Within
each panel the dots report the relative hazards as estimated using the Cox model When we could
not estimate the relative hazard because of the cell exclusion criteria the point is missing The
vertical lines surrounding the dots are 95 confidence intervals for the relative hazards They are
non-symmetric and when the confidence interval extends above 25 it is truncated at 25 for
improved resolution of the figures The three lines running left to right come from the regression
the straight line shows the prediction and the curved lines represent a 95 confidence interval for
the regression line ndash not to be confused with a 95 confidence interval for a predicted point
explaining why many points fall outside the confidence interval for the regression
Insert Figure 2 about here
42
The Relationship between Prison Length of Stay and Recidivism -- This report was prepared by Abt Associates using Federal funding provided by the Bureau of Justice Statistics (BJS) Opinions andor points of view expressed are those of the author(s) and do not necessarily reflect the official position or policies of the US Department of Justice
The table below the figure shows associated statistics from the meta-regression Recall the
dependent variable is the parameter associated with the log-relative hazard ndash that is the natural
logarithm of the relative hazard The row specified as ldquolinearrdquo identifies the centered offense
severity level variable entering the weighted least squares meta-regression The simple regression
specification has a constant and a term that is linear in the centered offense severity level Because
the estimator is weighted least squares and given the offense severity level is centered the constant
is the weighted average effect across the contrasts It is our principal interest R2 has its usual
interpretation but note that any ldquoexplained variancerdquo is attributable to the linear trend because we
are most interested in the constant R2 is not an especially important statistic and certainly has no
interpretation as the ldquogoodness of fitrdquo for our purposes because the constant does not contribute to
R2 At a maximum the regression would be based on 41 observations (N in the table) but fewer data
points enter the analysis because (as already discussed) we discarded contrasts that failed to meet
predetermined criteria
The table below the figure requires some additional explanation Recall the right-hand-side
variable was centered so the constant can be interpreted as an average A constant of zero is
neutral implying that on average additional prison time neither increases nor decreases recidivism
A positive constant implies that additional prison time increases recidivism a negative constant
implies that additional prison time decreases recidivism Converting these constants into a hazard
metric just requires exponentiation Letting α be the constant exp(α) is the relative hazard Letting
σ2 represent the constantrsquos estimated sampling variance by the delta rule the estimated sampling
variance for the hazard is exp(α)2 σ2 These transformations are employed when drawing Figure 2
Examining the table below Figure 2 the constant is negative and statistically significant in all
six regressions On average the estimated constant equals -0073 and is statistically significant with a
43
The Relationship between Prison Length of Stay and Recidivism -- This report was prepared by Abt Associates using Federal funding provided by the Bureau of Justice Statistics (BJS) Opinions andor points of view expressed are those of the author(s) and do not necessarily reflect the official position or policies of the US Department of Justice
standard error of 0007 The implied hazard is 0930 These are the inverse-variance weighted
estimates across the six criminal history categories The linear slopes have mixed signs and are never
statistically significant so we detect no heterogeneity
We must be caution about this interpretation Suppose as suggested by the evidence the
relative hazards are the same for all criminal history categories Looking at table 3 the average
increase in time-served for a move from cell j to j+2 is about 7 months for criminal history category 1
and about 10 months for criminal history category 6 Thus a somewhat larger increase in time-
served for more serious criminal history categories achieves about the same effect as a somewhat
smaller increase in time-served for less serious criminal history categories This might be taken as
some evidence of criminal history heterogeneity but if so the evidence is not especially compelling
Outliers are a potential concern in Figure 2 However when an outlier appears it is
associated with a high standard error and plays a small role in the weighted least squares regression
Therefore we conclude that outliers are not a practical concern
On average the estimated relative hazard that results from moving from cell j to cell j+2 is
0930 Qualitatively a relative hazard less than 1 implies that a longer prison term decreases
recidivism but translating this relative hazard into a quantitative decrease in the probability of
recidivism is complicated because the decrease in the probability of recidivism varies across the jj+2
comparisons A descriptive summary provides some intuition
First continue to consider the relative hazard as a metric On average across the severity
levels and the criminal history categories moving from cell j to cell j+2 increases time-served by
about 27 (On average this 27 change equals about 54 months) This is to say that a 27
increase in the length of incarceration appears to reduce the instantaneous probability of recidivism
(eg the hazard) by less than 10 percent For readers who are familiar with interpreting hazards a
44
The Relationship between Prison Length of Stay and Recidivism -- This report was prepared by Abt Associates using Federal funding provided by the Bureau of Justice Statistics (BJS) Opinions andor points of view expressed are those of the author(s) and do not necessarily reflect the official position or policies of the US Department of Justice
sizable increase in prison time (namely a 27 increase on average) has a fairly small decrease in the
relative hazard (by a multiple of 0930) Admittedly the descriptive term fairly small is subjective
and a reader can make his or her own subjective assessment
A change in the instantaneous probability of recidivism ndash the relative hazard ndash is not the
same as a change in the probability of recidivism Second then consider the probability of
recidivism as a metric We can get a sense of how a change in the relative hazard affects the
probability of recidivism Because we are using the Cox model the probability of recidivism equals
one minus the baseline survival rate to the power of the relative hazard (Hosmer Lemeshow amp May
2008 p 72) For our data the probability of recidivism is about 02 within three years (See figure
1) The relative hazard is about 0930 So a 27 increase in the length of incarceration would
decrease the probability of recidivism by about 02 ndash (1-080930) That is from a base rate of
recidivism of about 20 a 27 increase in prison time would cause recidivism to fall to about 187
Readers can draw their own conclusions but our sense is the effect is not large and that prison
length of stay has a largely neutral effect on recidivism
Once again some caution is merited If we again accept the relative hazards are about the
same across the six criminal history categories figure 1 shows the baseline rates of recidivism are
progressively higher as the criminal history category increases from k=1 to k=6 so the percentage
change in recidivism is larger for more serious criminal history categories than for the lesser criminal
history categories This might be deemed heterogeneity ndash that increasing time-served has a larger
effect on the most serious offenders We are reluctant to accept such a conclusion because it comes
from accepting the null hypothesis of constant relative hazards across the criminal history categories
More likely if such heterogeneity exists we have too little power to detect its effect
45
The Relationship between Prison Length of Stay and Recidivism -- This report was prepared by Abt Associates using Federal funding provided by the Bureau of Justice Statistics (BJS) Opinions andor points of view expressed are those of the author(s) and do not necessarily reflect the official position or policies of the US Department of Justice
It is possible to stratify the analysis by sex by race and by education ndash variables described
earlier Cell sizes get small so we restrict the analysis to offenders in criminal history category 1 and
we require a minimum of 50 offenders per cell rather than 100 For men the relative hazard is
0935 and for women it is 0931 but these differences are not statistically significant so we fail to
reject the null that prison length has the same effect on men and on women For white offenders
the relative hazard is 0936 and for black offenders the relative hazard is 0932 and the difference is
not statistically significant so we fail to reject the null that prison length has the same effect on
white and black offenders For offenders who lack high school degrees the relative hazard is 0930
and for offenders who have high school degrees the relative hazard is 0933 The difference is not
statistically significance This test based on education is not as sensitive as desired because most
offenders have high school degrees or the equivalent Overall we do not find strong evidence the
effect of time-served on recidivism is sensitive to sex race or education
We observed that an IV estimator should lead to estimates that are like the RDD estimates
We demonstrate that here The only difference between the IV and RDD approaches is that for the
IV approach the treatment variable is the mean time-served in cell j+2 or j and for the RDD
approach the treatment variable is a dummy variable denoting sentencing in cell j+2 rather than cell
j17 Interpretations differ For the IV approach the treatment effect is the change in recidivism per
month of additional time-served for the RDD approach the treatment effect is the change in
recidivism from being sentenced in cell j+2 rather than cell j These differences are scale effects we
do not expect then to change substantive interpretations
17 Instrumental variable estimation often uses a two-step approach In the first step the treatment variable (here the time served) is regressed on the instrument (and perhaps some additional variables) to predict the treatment (or in our case the average time-served) In the second step the average time-served replaces the observed time-served We compute average time-served without using the first-step regression
46
The Relationship between Prison Length of Stay and Recidivism -- This report was prepared by Abt Associates using Federal funding provided by the Bureau of Justice Statistics (BJS) Opinions andor points of view expressed are those of the author(s) and do not necessarily reflect the official position or policies of the US Department of Justice
Figure 3 reports results from the IV estimation Across the six criminal history categories the
weighted average effect size is -00122 which is statistically significant at P lt 001 While this effect
seems much smaller than the effect based on the RDD when we multiple by the average increase in
time-served between cell j and j+2 the rescaled effect is -0066 and relative hazard of a 54 month
increase in the sentence is 0936 There is no material difference between the RDD estimator and
the RDD estimator
Insert Figure 3 about here
SENSITIVITY TESTING
We conducted sensitivity tests evaluating whether the effect of length of stay on recidivism
depends on constraints we applied to produce the results shown in Figure 2 and its associated table
Minimum Cell Size of 50 instead of 100 - Figure 4 A first step in sensitivity testing is to learn
whether requiring a minimum of 50 cases instead of 100 cases per cell changes findings The
advantage to relaxing this assumption is that we gain a few data points The disadvantage is that
some of those new data points have extreme values As before the constant is always negative and
statistically significant The weighted average is -0073 with a standard error of 0007 and the
implied relative hazard is 0930 Because we use weighted least squares results do not change much
from those reported for the main model despite the expansion of sample size estimates with large
standard errors do not contribute much to the regression
Insert Figure 4 about here
Minimum cell size of 150 instead of 100 ndash Figure 5 If we set a criterion of 150 cases per cell instead
of 100 we lose a few data points The constant remains negative and statistically significant across
the six criminal history categories Overall the average constant is -0071 (with a standard error
47
The Relationship between Prison Length of Stay and Recidivism -- This report was prepared by Abt Associates using Federal funding provided by the Bureau of Justice Statistics (BJS) Opinions andor points of view expressed are those of the author(s) and do not necessarily reflect the official position or policies of the US Department of Justice
0008) and the corresponding relative hazard is 0931 Apparently the findings are insensitive to the
criterion for cases per cell because the weighted least squares analysis is dominated by calculations
that are based on large cell sizes For the remaining sensitivity tests we set the minimum cell size to
100
Insert Figure 5 about here
Minimum percentage of prison terms 75 instead of 50 - Figure 6 The next sensitivity test
changes the criterion for minimum percentage of prison terms to be 75 within a cell rather than
50 within a cell As expected some cells are excluded from the analysis but as before the
substantive findings do not much change The average affect is -0077 with standard error of 0009
The increased standard error is understandable Given the RDD basically calls for a difference in
mean estimates between cells j and j+2 (conditional on covariates) the effective sample size for
computing variances is the number of offenders within a cell multiplied by the proportion who are
sentenced to prison Cells with high proportions of offenders serving probation terms have high
sampling variances for two reasons (1) The effective sample size is smaller than the apparent sample
size based on the number of offenders within a cell (2) The average difference in time-served
between cells j and j+2 tends to be small (so the effect is small and has high sampling variance) for
those cells where probation is especially likely Consequently given the regressions use weights that
are inversely proportional to the sampling variance the estimates are insensitive to the criterion
establishing a minimum proportion of offenders sentenced to prison
Insert Figure 6 about here
Contrasts that are j and j+1 instead of j and j+2 ndash Figure 7 We believe that contrasts observed by
comparing cells j and j+2 are more appropriate for this analysis than contrasts observed by
comparing cells j and j+1 because the contrast between j and j+2 provides assurance that average
48
The Relationship between Prison Length of Stay and Recidivism -- This report was prepared by Abt Associates using Federal funding provided by the Bureau of Justice Statistics (BJS) Opinions andor points of view expressed are those of the author(s) and do not necessarily reflect the official position or policies of the US Department of Justice
prison terms increase by a substantial amount This assurance is not forthcoming when comparing
cells j and j+1 Nevertheless increasing the distance between compared cells raises validity
challenges because the RDD rests on an assumption that offenders within both compared cells are
alike in ways that affect recidivism The closer the cells the more justified the assumption For this
sensitivity test we maintain the original criteria for selecting cells but contrast cell j with cell j+1
(We discard contrasts where the average sentence in cell j+1 is less than the average sentence in cell
j) Averaged across the six estimates the estimated constant is -0030 with a standard error of 0013
This is statistically significant at P lt 005 The relative hazard is 0970 While results from the jj+1
contrasts are smaller than those from the jj+2 contrasts this is expected because the jj+2 contrast
results in a larger increase in time-served and consequently a larger effect
Insert Figure 7 about here
Contrasts testing for auto-correlation using the Prais-Winston estimator ndash Figure 8 The analysis
immediately above which changed the comparison from cells jj+2 to cells jj+1 suggests another
sensitivity test Earlier we commented that by construction we may have induced autocorrelation in
the data used for the final step regression For example consider the estimated hazard for cells j and
j+1 and the estimated hazard for cells j+1 and j+2 The estimates have j+1 in common and this may
introduce first-order autocorrelation into the analysis Following recommendations from Greene we
have elected to ignore this complication because commonly used corrections have uncertain small
sample properties However we can test how much the autocorrelation affects the results using a
Prais-Winston estimator a feasible generalized least squares estimator that corrects for first-order
autocorrelation
Insert Figure 8 about here
49
The Relationship between Prison Length of Stay and Recidivism -- This report was prepared by Abt Associates using Federal funding provided by the Bureau of Justice Statistics (BJS) Opinions andor points of view expressed are those of the author(s) and do not necessarily reflect the official position or policies of the US Department of Justice
A problem when using the Prais-Winston estimator is that we cannot simultaneously adjust
for autocorrelation and heteroscedasticity To correct estimated standard errors we can employ a
robust covariance estimator but this is problematic in two ways First without adjusting for
heteroscedasticity during parameter estimation the solution is inefficient because the data points
with large standard errors receive the same weight as the data points with low standard errors
Figure 2 suggests the inefficiency can be large Second the Prais-Winston estimator assumes
homoscedasticity but we know that our data are heteroscedastic To deal with this problem we
adopt restrictions (1) There must be 150 observations per cell and (2) at least 75 of offenders
within any cell must receive prison terms The idea is to minimize heteroscedasticity and we have
already seen that imposing these restrictions has little effect on results Allowing the contrast to be
jj+1 which may cause a one-lag autocorrelation we use a Prais-Winston estimator to estimate the
effects
The sensitivity test is encouraging The estimates for ρ the autocorrelation efficient have
mixed signs We take this wide variation in the estimates of ρ to mean the estimates are imprecise
Apparently provided we restrict estimates to cells with enough offenders we induce modest
autocorrelation and our decision to ignore autocorrelation seems justified Second basing the
results on the Prais-Winston estimator does not make a big difference in the findings The average
value for the constant is -0042 with a standard error of 0008
Separating contrasts into independent sets ndash Tables 6 and 7 Another approach to dealing with
autocorrelation is straightforward and can be performed with the jj+2 contrasts and both the 100
observations per cell criterion and the 050 prison sentence criterion To explain consider the
contrasts based on cells 13 24 35 46 57 and so on The contrasts 13 and 24 are
independent and the contrast 35 and 46 are independent but the contrasts 13 and 35 are not
50
The Relationship between Prison Length of Stay and Recidivism -- This report was prepared by Abt Associates using Federal funding provided by the Bureau of Justice Statistics (BJS) Opinions andor points of view expressed are those of the author(s) and do not necessarily reflect the official position or policies of the US Department of Justice
independent because they both rely on cell 3 A solution is to break the analysis into two parts In
the first part we use the contrasts 13 24 57 68 and so on in the second part we use the
contrasts 35 46 79 810 and so on For each analysis the effects can be averaged across the
criminal history categories and then across the two analyses For the first analysis the effect is -
0034 with a standard error of 0018 For the second analysis the effect is -0106 with a standard
error of 0030 significant at p lt 001 The average effect is -0067 with a standard error of 0018
Recalling the effect from the main analysis was -0073 with a standard error of 0007 these new
results are very close even though they are based on a different weighting scheme (a result of
running two regressions instead of one) As with the previous test we take this sensitivity test as
evidence that provided we restrict the effective number of observations per cell results are
insensitive to autocorrelation
Insert Table 6 and Table 7 about here
Entering prison as recidivism ndash Figure 9 An additional sensitivity test returns to the original model
specification whose results were presented in Figure 2 and changes the definition of recidivism from
ldquoentering prison or being revoked from community supervisionrdquo to ldquoentering prisonrdquo We are unsure
of the best definition of recidivism but it appears the definition does not much matter The
estimated effects are about the same The log-relative hazard is -0076 with a standard error of
0007 the relative hazard is 0927 The rate of recidivism is about 20 percent using the
comprehensive definition of returning to prison or being revoked and slightly less than 19 percent
when using the more restrictive definition of returning to prison so consistency between the main
results and results from this sensitivity test is not surprising
Insert Figure 9 about here
51
The Relationship between Prison Length of Stay and Recidivism -- This report was prepared by Abt Associates using Federal funding provided by the Bureau of Justice Statistics (BJS) Opinions andor points of view expressed are those of the author(s) and do not necessarily reflect the official position or policies of the US Department of Justice
Eliminating drug law offenders from the analysis ndash Figure 10 A final analysis recognizes that drug
law violations are somewhat peculiar to the federal system High-level drug dealing is often dealt
with in the federal system because cross-border drug dealing is a federal law enforcement
responsibility the federal government has more resources for dealing with high-level drug dealing
than do state governments and even when state and federal authorities collaborate federal
prosecution is typical because federal sentences are more severe18 Judges frequently sentence
high-level drug dealers to Congressionally-mandated mandatory minimums so for high-level drug
dealers the guidelines operate differently than described earlier Another sensitivity test results
from removing drug-law violators from the analysis
Insert Figure 10 about here
With the removal of drug-law violations fewer cells enter the analysis but the parameter estimates
do not change much so qualitative conclusions do not change The average effect is -0060 with a
standard error of 0008 This is statistically significant at plt001 Dropping drug law violators does
not alter conclusions
Eliminating covariates from the analysis ndash Figure 11 Reviewers of an earlier version of this study
wondered if findings based on Cox regressions with no covariates would be the same as findings
based on Cox regressions with covariates After eliminating covariates the weighted average effect
is -0073 with a standard error of 0008 Removing covariates has caused the standard error to
increase by about 10 but has not altered substantive conclusions This is sensible The covariates
were unnecessary for identification but they have the potential to reduce standard errors
18 This assertion is based on the authorsrsquo extensive experience performing program reviews for High Intensity Drug Trafficking Areas multijurisdictional drug task forces with federal state and local participation Our team has visited all 28 HIDTAs over a five-year period The assertion made in the text is based on those visits
52
The Relationship between Prison Length of Stay and Recidivism -- This report was prepared by Abt Associates using Federal funding provided by the Bureau of Justice Statistics (BJS) Opinions andor points of view expressed are those of the author(s) and do not necessarily reflect the official position or policies of the US Department of Justice
Figure 11 about here
Using the Earlier Guidelines ndash Figure 12 Reviewers of an earlier version of this study also observed
that guidelines have changed over the period of this study and expressed concern that these changes
may affect conclusions We doubt these changes matter because cell j+2 has always had longer
terms than cell j Nevertheless in response to reviewersrsquo concerns we identify the mean date for
guidelines entering the analysis and we perform the analysis on just those offenders sentenced
under the guidelines prior to that mean date The effect is ndash 0088 with a standard error of 0009
The relative hazard is 0916 It seems unlikely that changes to the guidelines account for findings
Figure 12 about here
Examining offenders sentenced during the earlier years provides another implicit diagnostic test
Because the analysis is based on offenders who completed their prison terms and were released to
community supervision offenders with high offense seriousness scores or high criminal history
scores and therefore long prison terms are unlikely to enter they analysis when sentenced close to
the data collection period Any resulting bias is lessened by restricting the analysis to offenders
sentenced during the early part of the data collection period If there is a selection bias it does not
appear to be serious
Summarizing the sensitivity testing From the principal analysis the estimated average effect across
the six criminal history categories was -0073 with a standard error of 0007 Provided we contrast
outcomes in cells j and j+2 results do not much change over sensitivity tests and even when we
contrast outcomes in cells j and j+1 results conform with expectations
53
The Relationship between Prison Length of Stay and Recidivism -- This report was prepared by Abt Associates using Federal funding provided by the Bureau of Justice Statistics (BJS) Opinions andor points of view expressed are those of the author(s) and do not necessarily reflect the official position or policies of the US Department of Justice
DISCUSSION
The effect of prison length of stay on recidivism has implications for both theory and policy
From a theoretical perspective incarceration is a potentially transformative event experienced
during an offenderrsquos life course This study provides no evidence that an offenderrsquos criminal
trajectory is negatively affected ndash that is that criminal behavior is accelerated ndash by the length of an
offenderrsquos prison term If anything longer prison terms modestly reduce rates of recidivism beyond
what is attributable to incapacitation This ldquotreatment effectrdquo of a longer period of incarceration is
small The three-year base rate of 20 recidivism is reduced to 187 when prison length of stay
increases by an average of 54 months We are inclined to characterize this as a benign close to
neutral effect on recidivism From a policy perspective prison length of stay can be reduced without
incurring a large increase in recidivism
All observational studies come with validity challenges Still a regression discontinuity
design is a strong quasi-experimental design and we have argued the guidelinesrsquo structure satisfies
the assumptions of an RDD We conducted many sensitivity tests to assess the robustness of the
results The findings require qualification Because of limitations in the bandwidth of an RDD design
we are unable to examine how long prison terms (say five years) affect recidivism relative to
relatively short terms (say two years) The logic of the RDD forces us to compare prison terms of
length L relative to prison terms that are about 27 longer While this is a limitation in the
application of the RDD design it seems unlikely that Congress or the US Sentencing Commission
would reduce terms by a large percentage but not inconceivable that they might reduce prison
terms by a small percentage Thus these findings ndash limited to small changes in prison terms ndash have
implications for sentencing reform
54
The Relationship between Prison Length of Stay and Recidivism -- This report was prepared by Abt Associates using Federal funding provided by the Bureau of Justice Statistics (BJS) Opinions andor points of view expressed are those of the author(s) and do not necessarily reflect the official position or policies of the US Department of Justice
A secondary goal of this research was to examine potential heterogeneity in the effects of
prison length of stay To evaluate heterogeneity we examine whether exogenous covariates
moderate the effect of length of stay Neither offense seriousness nor criminal history moderate the
effect of prison length of stay In the context of federal sentencing these would be two of the most
important potential moderators of prison length of stay The Sentencing Reform Act of 1984
precludes federal judges from using demographic factors in assigning sentences even if these are
empirical moderators of the effect of prison length of stay We also found the effect of time-served
on recidivism was invariant with respect to sex race and education
One class of moderators suggested by Mears Cochran and Cullen (2014) is the level of post-
release supervision In many state jurisdictions a sizable number of offenders are released without
supervision For those released to supervision the level of community control and surveillance is
usually commensurate to risk This source of heterogeneity is limited in the federal context because
everyone receives a term of post-release supervision We censored anyone whose supervision ended
prior to the end of the three-year follow-up period Post-release supervision is also a potential source
of bias as suggested by Roodman but we could eliminate this potential artifact because everyone in
our sample received a term of post-release supervision and they were censored when that term
ended
Some additional caveats are applicable First the results apply to adults Rarely appearing in
federal court juveniles are excluded from the analysis Second we offer no comparison between
adult offenders sentenced to prison rather than probation Third although there is considerable
overlap between federal and state crimes jurisdictional differences cause federal crimes to differ
from state crime counterparts so the relationship between prison terms and recidivism at the state
level may differ from the relationship at the federal level These are important inter-jurisdictional
55
The Relationship between Prison Length of Stay and Recidivism -- This report was prepared by Abt Associates using Federal funding provided by the Bureau of Justice Statistics (BJS) Opinions andor points of view expressed are those of the author(s) and do not necessarily reflect the official position or policies of the US Department of Justice
differences but by removing offenders who were deported or transferred to other authorities we
have made the federal offenders look more like state offenders and when we exclude high-level
drug traffickers results do not much change Furthermore federal jurisdiction is national while
state jurisdictions are local so a study based on national data has a stronger claim to generalizability
It is difficult to see how federal and state crimes are so different that criminologist can disregard
these findings A further limitation of our findings is that they apply only to offenders who receive a
term of community supervision after their release May states have offenders who receive no such
post-release supervision
While some scholars might consider the federal system unique and our results limited to
federal offenders there are many structural differences among states that often preclude
generalizations beyond a specific state as well Even if these findings are not generalizable to state
jurisdictions the federal prison population is about 12 percent of all incarcerated offenders and
represents a significant public policy concern
As we mentioned the RDD framework only allows us to examine relatively small increments
in time-served ndash about 54 months on average Although these are small relative changes these are
not small absolute changes Five additional months in prison is a serious disruption of an offenderrsquos
life and the associated cost savings of a five-month reduction in federal prison length of stay would
save substantial capital and operational costs We make a back-of-the-envelope estimate of potential
savings in prison beds The current average federal prison length of stay for federally sentenced
prisoners is about 35 months A reduction of 5 months in a steady state system would reduce the
prison population over time by 15 percent Given the current Bureau of Prisons inmate population of
195000 a 15 percent reduction would save 29000 beds Under this scenario the BOP could close
prisons rather than simply reduce the prison population in each of its facilities saving both
56
The Relationship between Prison Length of Stay and Recidivism -- This report was prepared by Abt Associates using Federal funding provided by the Bureau of Justice Statistics (BJS) Opinions andor points of view expressed are those of the author(s) and do not necessarily reflect the official position or policies of the US Department of Justice
operational and maintenance costs This back-of-the-envelope calculation shows that small
decrements in length of stay can have large impacts when they are not confined to select subgroups
of offenders
Amplifying this latter point one of the advantages to evaluating prison length of stay is that
any change will have a broad impact on the entire incarcerated population Most contemporary
reforms such as those found in states which implemented the Justice Reinvestment Initiative (JRI)
seek to move the least serious offenders convicted of the least serious crimes from prison to
community corrections (La Vigne et al 2014) Low-level offenders are a very small proportion of
federal prison stocks and based on tabulations from the National Corrections Reporting Program
they are also a small proportion of state prison stocks A policy shift that reduces the length of all
federal prison terms by 27 percent would reduce the federal prison stock by about 29000 inmates
without unduly harming public safety This policy change would have a bigger impact on the federal
prison population than diverting offenders with low offense seriousness and minor or no criminal
history
Prisons are expensive and reducing prison stays has the potential to save public expenditures
(La Vigne et al 2014) Nevertheless advocates of general deterrence and incapacitation might
argue that maintaining or even increasing the length of prison stays is worth the additional expense
and at least increasing prison stays will not make offenders any more criminogenic Nagin et al
(2009) propose a theoretical model that frames these questions distinguishing between high and low
sanction regimes Higher sanction regimes have a higher probability of imprisonment and longer
length of stay than low sanction regimes This model specifies relationships between these relative
regimes the size of the prison populations sizes of the populations with and without a prison record
and the underlying crime rate The model provides a framework for addressing the interrelationship
57
The Relationship between Prison Length of Stay and Recidivism -- This report was prepared by Abt Associates using Federal funding provided by the Bureau of Justice Statistics (BJS) Opinions andor points of view expressed are those of the author(s) and do not necessarily reflect the official position or policies of the US Department of Justice
among these factors without precisely specifying how the outputs change under the low and high
sanction regimes It is straightforward to postulate that high sanction regimes will produce more
people with criminal records however the impact of a high sanction regime on the crime rate is
uncertain High sanction regimes may preclude more crime through general deterrence but may
increase crime if imprisonment is criminogenic not just for the individual but for the prisonerrsquos
family and the community (NRC 2014) The marginal effects and the sizes of the subpopulations
affected will determine the impact on crime rates If we could analyze all the system dynamics of this
model simultaneously we could optimize the level of sanctions to minimize the crime rate In the
absence of such a comprehensive model policy goals should be circumscribed If length of stays
were reduced incrementally it is hard to see how this would have more than a minor effect on crime
through any general deterrent mediated impact and from our results through any criminogenic
impact on the offender
Savings from reduced prison usage can be diverted into evidence-based programs that
reduce offending but such diversion is unlikely as most JRI states have put savings into other non-
justice programs (La Vigne et al 2014) Even if these funds are diverted to other social welfare
programs higher education or other state and local needs we would expect a net social welfare
benefit
58
The Relationship between Prison Length of Stay and Recidivism -- This report was prepared by Abt Associates using Federal funding provided by the Bureau of Justice Statistics (BJS) Opinions andor points of view expressed are those of the author(s) and do not necessarily reflect the official position or policies of the US Department of Justice
REFERENCES
Andrews D A and James Bonta 2006 The Psychology of Criminal Conduct 4th ed Cincinnati Anderson Pub
Andrews D A Ivan Zinger Robert D Hoge James Bonta Paul Gendreau and Francis T Cullen 1990 Does Correctional Treatment Work A Clinically Relevant and Psychologically Informed Meta-Analysis Criminology 28 (3) 369ndash404 doi101111j1745-91251990tb01330x
Angrist Joshua D 2006 Instrumental Variables Methods in Experimental Criminological Research What Why and How Journal of Experimental Criminology 2 (1) 23ndash44 doi101007s11292-005-5126-x
Becker Gary S 1968 Crime and Punishment An Economic Approach Journal of Political Economy 76 (2) 169ndash217 doi101086259394
Berecochea John E and Dorothy R Jaman and Welton A Jones 1981 Time Served in Prison and Parole Outcome - An Experimental Study Report Number 2 Sacramento
Berk Richard 2010 Recent Perspectives on the Regression Discontinuity Design Essay In Handbook of Quantitative Criminology eds Alexis Russell Piquero and David Weisburd New York Springer
Berk Richard A and David Rauma 1983 Capitalizing on Nonrandom Assignment to Treatments A Regression-Discontinuity Evaluation of a Crime-Control Program Journal of the American Statistical Association 78 (381) 21ndash27 doi10108001621459198310477917
Berk Richard A and Jan De Leeuw 1999 An Evaluation of Californias Inmate Classification System Using a Generalized Regression Discontinuity Design Journal of the American Statistical Association 94 (448) 1045ndash52 doi10108001621459199910473857
Berk Richard Geoffrey Barnes Lindsay Ahlman and Ellen Kurtz 2010 When Second Best Is Good Enough A Comparison between a True Experiment and a Regression Discontinuity Quasi-Experiment Journal of Experimental Criminology 6 (2) 191ndash208 doi101007s11292-010-9095-3
Berube Danton and Donald P Green 2007 The Effects of Sentencing on Recidivism Results from a Natural Experiment Ms The Effects of Sentencing on Recidivism Results from a Natural Experiment New Haven
Bloom Howard S 2012 Modern Regression Discontinuity Analysis Journal of Research on Educational Effectiveness 5 (1) 43ndash82 doi101080193457472011578707
Bor J Moscoe E Mutevedzi P Newell M amp Barnighausem T (2014) Regression Discontinuity Designs in Epidemiology Epidemiology 25(5) 729-737
59
The Relationship between Prison Length of Stay and Recidivism -- This report was prepared by Abt Associates using Federal funding provided by the Bureau of Justice Statistics (BJS) Opinions andor points of view expressed are those of the author(s) and do not necessarily reflect the official position or policies of the US Department of Justice
Boshier R and D Johnson 1974 Does Conviction Affect Employment Opportunities British Journal of Criminology 14 264ndash68
Braithwaite John 1989 Crime Shame and Reintegration Cambridge Cambridge University Press
Cameron Adrian Colin and P K Trivedi 2005 Microeconometrics Methods and Applications Cambridge Cambridge University Press
Carroll Leo 1988 Hacks Blacks and Cons Race Relations in a Maximum Security Prison Prospect Heights IL Waveland Press
Cattaneo Matias D Rociacuteo Titiunik Gonzalo Vazquez-Bare and Luke Keele 2016 Interpreting Regression Discontinuity Designs with Multiple Cutoffs The Journal of Politics 78 (3) doi101086686802
Chen M Keith and Jesse M Shapiro 2007 Do Harsher Prison Conditions Reduce Recidivism A Discontinuity-Based Approach American Law and Economics Review 9 (1) 1ndash29 doi101093alerahm006
Clemmer Donald 1940 The Prison Community Boston The Christopher Publishing House
Cook Thomas D 2008 lsquoWaiting for Life to Arriversquo A History of the Regression-Discontinuity Design in Psychology Statistics and Economics Journal of Econometrics 142 (2) 636ndash54 doi101016jjeconom200705002
Cullen Francis T Cheryl Lero Jonson and Daniel S Nagin 2011 Prisons Do Not Reduce Recidivism The High Cost of Ignoring Science The Prison Journal 91 (3 Suppl) doi1011770032885511415224
Deschenes Elizabeth Piper Susan Piper and Joan Petersilia 1995 Intensive Community Supervision in Minnesota A Dual Experiment in Prison Diversion and Enhanced Supervised Release Santa Monica CA RAND Corporation
DiNardo John and David S Lee 2010 Program Evaluation and Research Designs Essay In Handbook of Labor Economics eds Orley Ashenfelter and David Card Vol 4A Elsevier
Drago Francesco Roberto Galbiati and Pietro Vertova 2009 The Deterrent Effects of Prison Evidence from a Natural Experiment Journal of Political Economy 117 (2) 257ndash80 doi101086599286
Fleisher Mark S 1989 Warehousing Violence Newbury Park CA Sage Publications
Gaes Gerald G William D Bales and Samuel J A Scaggs 2016 The Effect of Imprisonment on Recommitment An Analysis Using Exact Coarsened Exact and Radius Matching with the Propensity Score Journal of Experimental Criminology 12 (1) 143ndash58 doi101007s11292-015-9251-x
Gaes Gerald G and Scott D Camp 2009 Unintended Consequences Experimental Evidence for the Criminogenic Effect of Prison Security Level Placement on Post-Release Recidivism Journal of Experimental Criminology 5 (2) 139ndash62 doi101007s11292-009-9070-z
60
The Relationship between Prison Length of Stay and Recidivism -- This report was prepared by Abt Associates using Federal funding provided by the Bureau of Justice Statistics (BJS) Opinions andor points of view expressed are those of the author(s) and do not necessarily reflect the official position or policies of the US Department of Justice
Gaes Gerald G Timothy J Flanagan Laurence L Motiuk and Lynn Stewart 1999 Adult Correctional Treatment Essay In Crime and Justice a Review of Research Prisons eds Michael Tonry and Joan Petersilia 76361ndash426 Chicago University of Chicago Press
Gendreau Paul Paula Smith and Sheila French 2008 The Theory of Effective Correctional Intervention Empirical Status and Future Directions Essay In Taking Stock The Status of Criminological Theory Advances in Criminological Theory eds T Francis FT Cullen JP Wright and KR Blevins Vol 15 New Brunswick NJ Transaction
Gendreau Paul Claire Goggin and Francis T Cullen 1999 The Effects of Prison Sentences on Recidivism 1999-3 The Effects of Prison Sentences on Recidivism 1999-3 Ottawa Canada Solicitor General
Goffman Erving 1961 Asylums Essays on the Social Situation of Mental Patients and Other Inmates Chicago Aldine
Green Donald P and Daniel Winik 2010 Using Random Judge Assignments to Estimate the Effects of Incarceration and Probation on Recidivism Among Drug Offenders Criminology 48 (2) 357ndash87 doi101111j1745-9125201000189x
Greene William H 2008 Econometric Analysis Upper Saddle River NJ Prentice Hall
Hahn Jinyong Petra Todd and Wilbert Klaauw 2001 Identification and Estimation of Treatment Effects with a Regression-Discontinuity Design Econometrica 69 (1) 201ndash9 doi1011111468-026200183
Hjalmarsson Randi (2009) Juvenile Jails A path to the straight and narrow or to hardened criminality Journal of Law and Economics 52 779-809
Horney Julie D Wayne Osgood and Ineke Haen Marshall 1995 Criminal Careers in the Short-Term Intra-Individual Variability in Crime and Its Relation to Local Life Circumstances American Sociological Review 60 (5) 655 doi1023072096316
Hosmer David W Stanley Lemeshow and Susanne May 2008 Applied Survival Analysis Regression Modeling of Time-to-Event Data Hoboken NJ Wiley-Interscience
Imbens G (2009) Better LATE Than Nothing Some Comments on Deaton (2009) and Heckman and Urzua (2009) Unpublished paper downloaded from httpwwweconomicsharvardedufacultyimbensfilesbltn_09apr10pdf on December 2 2009
Imbens Guido W and Joshua D Angrist 1994 Identification and Estimation of Local Average Treatment Effects Econometrica 62 (2) 467 doi1023072951620
Imbens Guido W and Thomas Lemieux 2007 Regression Discontinuity Designs A Guide to Practice National Bureau of Economic Research Working Paper
61
The Relationship between Prison Length of Stay and Recidivism -- This report was prepared by Abt Associates using Federal funding provided by the Bureau of Justice Statistics (BJS) Opinions andor points of view expressed are those of the author(s) and do not necessarily reflect the official position or policies of the US Department of Justice
Imbens Guido W and Donald B Rubin 2015 Causal Inference for Statistics Social and Biomedical Sciences an Introduction Cambridge Cambridge University Press
Irwin John 1980 Prisons in Turmoil Boston Little Brown
Irwin John 2005 The Warehouse Prison Disposal of the New Dangerous Class Los Angeles CA Roxbury Pub Co
Irwin John (2009) Lifers Seeking redemption in prison (Criminology and justice studies) New York Routledge
Jacobs James B 1977 Statesville The Penitentiary in Mass Society Chicago IL Chicago University Press
Jaman Dorothy R Robert M Dickover and Lawrence A Bennett 1972 Parole Outcome as a Function of Time Served British Journal of Criminology 12 (1) 5ndash34
Kalbfleisch J D and Ross L Prentice 2002 The Statistical Analysis of Failure Time Data Hoboken NJ J Wiley
Kling R W Rhodes D Izrael C Cutler K Shah and C Dyous 2016 Creating an Offender-Based Tracking System Using the FJSP Draft Final for BJS Review Cambridge MA Abt Associates
Kraus J 1981 The Effects of Committal to a Special School for Truants International Journal of Offender Therapy and Comparative Criminology 25 (2) 130ndash38 doi1011770306624x8102500205
Kuziemko I 2012 How Should Inmates Be Released from Prison An Assessment of Parole versus Fixed-Sentence Regimes The Quarterly Journal of Economics 128 (1) 371ndash424 doi101093qjeqjs052
La Vigne Nancy Samuel Bieler Lindsey Cramer Helen Ho Cybele Kotonias Deborah Mayer David McClure Laura Pacifici Erika Parks Bryce Peterson and Julie Samuels 2014 Justice Reinvestment Initiative State Assessment Report Washington DC The Urban Institute
Lancaster Tony 1990 The Econometric Analysis of Transition Data Cambridge Cambridge University Press
Lee David S and Thomas Lemieux 2010 Regression Discontinuity Designs in Economics Journal of Economic Literature 48 (2) 281ndash355 doi101257jel482281
Lee S and Card D 2006 Regression Discontinuity Inference with Specification Error Technical Working paper 322 National Bureau of Economic Research
What Works Clearinghouse Procedures and Standards Handbook Version 30 US Department of Education httpsiesedgovnceewwcDocsreferenceresourceswwc_procedures_v3_0_standards_handboo kpdf
62
The Relationship between Prison Length of Stay and Recidivism -- This report was prepared by Abt Associates using Federal funding provided by the Bureau of Justice Statistics (BJS) Opinions andor points of view expressed are those of the author(s) and do not necessarily reflect the official position or policies of the US Department of Justice
Lerman Amy 2009a The People Prisons Make Effects of Incarceration on Criminal Psychology In Do Prisons make Us Safer The Benefits and Costs of the Prison Boom eds Steven Raphael and Michael A Stoll New York Russel Sage
Lerman Amy 2009b Bowling Alone (With My Own Ball and Chain) Effects of Incarceration and the Dark Side of Social Capital Lecture
Letkemann Peter 1973 Crime as Work Englewood Cliffs NJ Prentice-Hall
Listwan Shelley Johnson Christopher J Sullivan Robert Agnew Francis T Cullen and Mark Colvin 2013 The Pains of Imprisonment Revisited The Impact of Strain on Inmate Recidivism Justice Quarterly 30 (1) 144ndash68 doi101080074188252011597772
Loeffler Charles E 2013 Does Imprisonment Alter the Life Course Evidence on Crime and Employment from A Natural Experiment Criminology 51 (1) 137ndash66 doi1011111745-912512000
Loughran Thomas A Edward P Mulvey Carol A Schubert Jeffrey Fagan Alex R Piquero and Sandra H Losoya 2009 Estimating A Dose-Response Relationship Between Length of Stay and Future Recidivism in Serious Juvenile Offenders Criminology 47 (3) 699ndash740 doi101111j1745-9125200900165x
MacKenzie Doris L 2006 What Works in Corrections Reducing the Criminal Activities of Offenders and Delinquents New York Cambridge University Press
Manski Charles F and Daniel S Nagin 1998 Bounding Disagreements About Treatment Effects A Case Study of Sentencing and Recidivism Sociological Methodology 28 (1) 99ndash137 doi1011110081-175000043
Meade Benjamin Benjamin Steiner Matthew Makarios and Lawrence Travis 2012 Estimating a Dose-Response Relationship Between Time Served in Prison and Recidivism Journal of Research in Crime and Delinquency 50 (4) 525ndash50 doi1011770022427812458928
Mears Daniel P Joshua C Cochran and Francis T Cullen 2014 Incarceration Heterogeneity and Its Implications for Assessing the Effectiveness of Imprisonment on Recidivism Criminal Justice Policy Review 26 (7) 691ndash712 doi1011770887403414528950
Mears Daniel P Joshua C Cochran William D Bales and Avinash S Bhati (2016) Recidivism and time served in prison Journal of Criminal Law and Criminology 106(1) 82-122
Morgan Stephen and Christopher Winship 2015 Counterfactuals and Causal Inference Methods and Principals for Social Research 2nd ed Cambridge MA Cambridge University Press
Nagin Daniel S Francis T Cullen and Cheryl Lero Jonson 2009 Imprisonment and Reoffending Essay In Crime and Justice A Review of Research eds Michael Tonry 38115ndash200 Chicago University of Chicago Press
63
The Relationship between Prison Length of Stay and Recidivism -- This report was prepared by Abt Associates using Federal funding provided by the Bureau of Justice Statistics (BJS) Opinions andor points of view expressed are those of the author(s) and do not necessarily reflect the official position or policies of the US Department of Justice
Nguyen H Loughran T A Paternoster R Fagan J amp Piquero A R (2017) Institutional placement and illegal earnings Examining the crime school hypothesis Journal of Quantitative Criminology 33(2) 207-235
Owen B A (1998) In the Mix Struggle and Survival in a Womens Prison SUNY Press
Pager Devah and Lincoln Quillian 2005 Walking the Talk What Employers Say Versus What They Do American Sociological Review 70 (3) 355ndash80 doi101177000312240507000301
Pager Devah Bart Bonikowski and Bruce Western 2009 Discrimination in a Low-Wage Labor Market A Field Experiment American Sociological Review 74 (5) 777ndash99 doi101177000312240907400505
Pager Devah 2007 Marked Race Crime and Finding Work in an Era of Mass Incarceration Chicago University of Chicago Press
Rhodes William and Sarah K Jalbert 2013 Regression Discontinuity Design in Criminal Justice Evaluation An Introduction and Illustration Evaluation Review 37 (3-4) 239ndash73 doi1011770193841x14523004
Rhodes W Dyous C Kling R Hunt D and Luallen J (2012) Recidivism of Offenders on Federal Community Supervision Bureau of Justice Statistics award 2010-BJ-CX-K069 NCRJS document number 241018
Rhodes W (2010) Estimating treatment effects and predicting recidivism for community supervision using survival analysis with instrumental variables Journal of Quantitative Criminology 26(3) 391-413
Rhodes W (2012) Meta-analysis An introduction using regression models Evaluation review 36(1) 24-71
Roach Michael A and Max M Schanzenbach 2015 The Effect of Prison Sentence Length on Recidivism Evidence from Random Judicial Assignment Northwestern Law ampAmp Econ Research Paper doi102139ssrn2701549
Roodman David 2016 The impacts of incarceration on crime Open Philanthropy Project
Rosenbaum Paul R 2002 Observational Studies 2nd ed New York Springer
Smith Douglas A and Raymond Paternoster 1990 Formal Processing and Future Delinquency Deviance Amplification as Selection Artifact Law ampAmp Society Review 24 (5) 1109 doi1023073053663
Sampson Robert J and John H Laub 1993 Crime in the Making Pathways and Turning Points Through Life Cambridge MA Harvard University Press
64
The Relationship between Prison Length of Stay and Recidivism -- This report was prepared by Abt Associates using Federal funding provided by the Bureau of Justice Statistics (BJS) Opinions andor points of view expressed are those of the author(s) and do not necessarily reflect the official position or policies of the US Department of Justice
Smith Paula 2006 The Effects of Incarceration on Recidivism A Longitudinal Examination of Program Participation and Institutional Adjustment in Federally Sentenced Adult Male Offenders Dissertation University of New Brunswick Dept of Psychology
Smith Paula Paul Gendreau and Claire Goggin 2002 The Effects of Prison Sentences and Intermediate Sanctions on Recidivism General Effects and Individual Differences Ottawa Solicitor General Canada
Snodgrass G Matthew Arjan A J Blokland Amelia Haviland Paul Nieuwbeerta and Daniel S Nagin 2011 Does the Time Cause the Crime An Examination of the Relationship Between Time Served and Reoffending in The Netherlands Criminology 49 (4) 1149ndash94 doi101111j1745-9125201100254x
Sykes Gresham M 1958 The Society of Captives A Study of a Maximum Security Prison Princeton NJ Princeton University Press
National Research Council Jeremy Travis Bruce Western Steve Redburn 2014 The Growth of Incarceration in the United States Exploring Causes and Consequences eds Committee on Causes and Consequences of High Rates of Incarceration Committee on Law and Justice and Division of Behavioral and Social Sciences and Education Washington DC The National Academies Press
van der Klaauw Wilbert 2002 Estimating the Effect of Financial Aid Offers on College Enrollment A Regression-Discontinuity Approach International Economic Review 43 (4) 1249ndash87 doi1011111468-2354t01-1-00055
Villettaz P M Killias and I Zoder 2006 The Effects of Custodial vs Non-Custodial Sentences on Re-Offending A Systematic Review of the State of Knowledge Campbell Collaboration Crime and Justice Group doi104073csr200613
Wacquant Loiumlc 2001 Deadly Symbiosis When Ghetto and Prison Meet and Mesh Mass Imprisonment Social Causes and Consequences 82ndash120 doi1041359781446221228n8
Western Bruce 2002 The Impact of Incarceration on Wage Mobility and Inequality American Sociological Review 67 (4) 526 doi1023073088944
65
The Relationship between Prison Length of Stay and Recidivism -- This report was prepared by Abt Associates using Federal funding provided by the Bureau of Justice Statistics (BJS) Opinions andor points of view expressed are those of the author(s) and do not necessarily reflect the official position or policies of the US Department of Justice
Tables and Figures
Table 1 - Number of Offenders Meeting Study Requirements per Guidelines Cell
Criminal History Categories (1 least serious 6 most serious) Offense
Seriousness Level CH 1 CH 2 CH 3 CH 4 CH 5 CH 6 Total
1 38 6 1 1 1 1 48 2 909 176 178 90 42 61 1456 3 143 26 33 20 9 25 256 4 3244 818 981 523 371 613 6550 5 442 119 132 84 64 119 960 6 3005 641 752 429 300 505 5632 7 1511 381 653 576 440 680 4241 8 4497 882 1023 543 361 552 7858 9 1969 465 566 321 229 363 3913
10 8511 1873 2342 1119 765 1109 15719 11 2824 558 728 472 304 521 5407 12 9748 2368 3330 1968 1204 1667 20285 13 13159 2961 3668 2009 1226 1777 24800 14 4219 746 854 430 275 788 7312 15 10534 2680 3131 1599 951 1257 20152 16 4394 760 831 396 227 318 6926 17 8743 2598 4189 2919 1690 1981 22120 18 4876 745 758 388 212 306 7285 19 9053 2116 2902 1720 1095 1301 18187 20 3761 779 930 532 262 319 6583 21 13674 2293 3341 2511 1706 2421 25946 22 3674 654 850 480 289 392 6339 23 10627 4101 5642 2996 1742 1904 27012 24 3706 719 788 487 282 445 6427 25 7748 2816 3460 1835 1036 1137 18032 26 2946 728 856 420 228 355 5533 27 9418 1797 2221 1126 630 647 15839 28 2509 506 554 306 144 178 4197 29 6180 2614 3442 1736 870 3174 18016 30 1819 344 367 384 218 654 3786 31 3868 1800 2308 1157 554 2945 12632 32 1144 307 377 161 86 213 2288 33 2570 873 1155 566 259 365 5788 34 776 244 260 111 79 1831 3301 35 1145 645 820 368 197 446 3621 36 431 128 153 66 35 47 860
Leas
t Ser
ious
(1) t
o Mo
st S
erio
us (4
3)
66
The Relationship between Prison Length of Stay and Recidivism -- This report was prepared by Abt Associates using Federal funding provided by the Bureau of Justice Statistics (BJS) Opinions andor points of view expressed are those of the author(s) and do not necessarily reflect the official position or policies of the US Department of Justice
Criminal History Categories (1 least serious 6 most serious) Offense
Seriousness Level CH 1 CH 2 CH 3 CH 4 CH 5 CH 6 Total
37 543 210 305 148 54 221 1481 38 290 83 122 59 30 64 648 39 200 62 91 36 21 58 468 40 174 37 58 22 22 35 348 41 94 31 43 18 6 23 215 42 64 23 28 9 5 8 137 43 86 24 25 12 4 19 170
All 169266 42737 55248 31153 18525 31845 348774 Note Cells with fewer than 100 observations are highlighted
67
The Relationship between Prison Length of Stay and Recidivism -- This report was prepared by Abt Associates using Federal funding provided by the Bureau of Justice Statistics (BJS) Opinions andor points of view expressed are those of the author(s) and do not necessarily reflect the official position or policies of the US Department of Justice
Table 2 -- Percentage of Offenders Sentenced to Prison per Guideline Cell
Criminal History Categories (1 least serious 6 most serious) Offense
Seriousness Level CH 1 CH 2 CH 3 CH 4 CH 5 CH 6 Total
1 11 0 0 0 100 100 13 2 15 20 42 52 69 72 25 3 11 31 42 50 78 76 29 4 14 27 45 68 74 82 34 5 14 34 54 83 84 93 42 6 17 40 59 73 89 94 40 7 16 43 69 91 95 96 58 8 17 43 58 86 91 96 39 9 27 53 79 90 90 97 53
10 33 75 86 94 96 96 58 11 63 85 91 95 99 98 77 12 69 84 92 96 97 98 81 13 74 89 94 97 98 98 83 14 79 90 94 97 99 98 86 15 82 93 96 97 99 99 89 16 84 92 95 98 98 98 88 17 85 93 97 98 99 99 92 18 90 95 97 99 98 99 92 19 89 93 97 99 99 99 93 20 92 96 99 98 99 99 94 21 92 96 98 99 99 99 95 22 93 96 98 99 99 99 95 23 93 97 98 99 99 99 96 24 95 98 99 100 99 100 96 25 95 98 98 99 99 99 97 26 97 98 98 99 100 100 98 27 96 99 99 100 99 100 97 28 96 98 99 99 100 99 97 29 96 98 99 99 99 99 98 30 97 100 100 98 99 100 98 31 97 98 99 99 99 99 98 32 98 98 99 99 100 100 99 33 96 98 99 99 100 99 97 34 97 100 99 100 100 99 99 35 97 98 99 98 99 99 98 36 98 99 99 97 100 100 98 37 97 98 99 100 96 98 98 38 98 99 98 100 100 98 98
68
The Relationship between Prison Length of Stay and Recidivism -- This report was prepared by Abt Associates using Federal funding provided by the Bureau of Justice Statistics (BJS) Opinions andor points of view expressed are those of the author(s) and do not necessarily reflect the official position or policies of the US Department of Justice
Criminal History Categories (1 least serious 6 most serious) Offense
Seriousness Level CH 1 CH 2 CH 3 CH 4 CH 5 CH 6 Total
39 98 98 99 100 100 98 99 40 98 97 100 100 100 100 99 41 98 100 100 100 100 100 99 42 97 100 100 100 100 100 99 43 98 100 96 100 100 95 98 All 78 89 93 97 98 98 87
Note Cells with less than 50 prison terms are highlighted
69
The Relationship between Prison Length of Stay and Recidivism -- This report was prepared by Abt Associates using Federal funding provided by the Bureau of Justice Statistics (BJS) Opinions andor points of view expressed are those of the author(s) and do not necessarily reflect the official position or policies of the US Department of Justice
Table 3 -- Average Time Served (Months) per Guideline Cell
Criminal History Categories (1 least serious 6 most serious) Offense Seriousness Level
CH 1 CH 2 CH 3 CH 4 CH 5 CH 6
Leas
t Ser
ious
(1) t
o Mo
st S
erio
us (4
3)
1 04 00 00 00 209 65 2 10 13 25 36 41 73 3 08 17 27 47 47 73 4 13 22 35 57 67 85 5 13 21 42 87 90 138 6 13 41 49 84 115 140 7 11 29 50 81 117 146 8 14 38 59 96 137 175 9 21 50 71 119 168 208
10 30 72 94 150 191 230 11 43 82 119 161 217 251 12 60 103 137 189 237 279 13 81 124 157 212 260 300 14 106 160 187 256 298 324 15 120 170 204 256 320 355 16 147 198 233 303 359 408 17 164 222 260 326 392 446 18 196 257 297 362 454 515 19 216 282 326 407 498 547 20 262 343 401 481 573 637 21 255 342 394 481 570 636 22 313 409 483 582 689 721 23 336 429 484 577 670 728 24 369 493 543 685 786 853 25 418 495 562 671 785 842 26 480 571 676 783 902 964 27 474 597 659 783 868 909 28 552 706 784 902 961 1048 29 584 722 813 878 976 981 30 685 845 938 1063 1120 1213 31 695 823 916 1039 1129 1117 32 850 991 1116 1241 1417 1312 33 779 935 1056 1203 1338 1401 34 969 1166 1220 1365 1396 1326 35 900 1033 1182 1335 1385 1403 36 1176 1265 1456 1510 1551 1461
70
The Relationship between Prison Length of Stay and Recidivism -- This report was prepared by Abt Associates using Federal funding provided by the Bureau of Justice Statistics (BJS) Opinions andor points of view expressed are those of the author(s) and do not necessarily reflect the official position or policies of the US Department of Justice
Criminal History Categories (1 least serious 6 most serious) Offense Seriousness Level
CH 1 CH 2 CH 3 CH 4 CH 5 CH 6
37 1028 1289 1356 1604 1382 1849 38 1279 1434 1625 1726 1399 1769 39 1072 1468 1540 1567 1544 1656 40 1414 1520 1648 1482 1490 1658 41 1315 1562 1788 2045 2124 1899 42 1263 1878 1468 1974 1422 1974 43 1497 1685 2078 2909 1280 2243
71
The Relationship between Prison Length of Stay and Recidivism -- This report was prepared by Abt Associates using Federal funding provided by the Bureau of Justice Statistics (BJS) Opinions andor points of view expressed are those of the author(s) and do not necessarily reflect the official position or policies of the US Department of Justice
Table 4 -- Percentage of Offenders Recidivating within Three Years (Not Accounting for Censoring) per Guideline Cell
Criminal History Categories (1 least serious 6 most serious) Offense Seriousness Level CH 1 CH 2 CH 3 CH 4 CH 5 CH 6
Leas
t Ser
ious
(1) t
o Mo
st S
erio
us (4
3)
1 395 333 1000 00 00 1000 2 232 324 382 433 524 328 3 238 346 424 450 444 440 4 201 334 399 405 415 512 5 215 378 379 440 422 454 6 198 348 430 462 407 475 7 212 336 449 507 502 568 8 177 330 324 385 427 438 9 182 286 337 340 397 477
10 167 262 350 367 383 459 11 116 228 299 326 365 407 12 130 266 335 388 442 475 13 132 248 297 368 396 444 14 94 180 297 347 360 391 15 129 241 315 386 420 423 16 95 186 276 323 300 377 17 99 207 280 342 382 425 18 95 179 240 312 274 359 19 106 197 274 320 359 414 20 94 181 247 301 336 376 21 103 172 235 283 336 352 22 81 191 259 313 356 375 23 84 142 192 247 293 330 24 86 172 221 277 337 348 25 77 122 167 215 251 277 26 70 126 173 193 241 318 27 71 124 157 186 216 253 28 72 144 148 180 201 298 29 63 93 131 169 208 221 30 73 96 166 188 239 252 31 52 99 129 137 181 166 32 68 94 135 161 105 174 33 51 86 127 133 201 186 34 44 90 88 153 215 118 35 53 62 87 122 178 143 36 42 55 85 136 229 128 37 52 90 95 135 93 163
72
The Relationship between Prison Length of Stay and Recidivism -- This report was prepared by Abt Associates using Federal funding provided by the Bureau of Justice Statistics (BJS) Opinions andor points of view expressed are those of the author(s) and do not necessarily reflect the official position or policies of the US Department of Justice
Criminal History Categories (1 least serious 6 most serious) Offense Seriousness Level CH 1 CH 2 CH 3 CH 4 CH 5 CH 6
38 24 24 57 68 233 156 39 20 48 99 139 190 52 40 40 108 103 182 136 114 41 32 32 47 111 333 130 42 63 00 143 222 200 125 43 81 00 200 167 250 158
73
The Relationship between Prison Length of Stay and Recidivism -- This report was prepared by Abt Associates using Federal funding provided by the Bureau of Justice Statistics (BJS) Opinions andor points of view expressed are those of the author(s) and do not necessarily reflect the official position or policies of the US Department of Justice
Table 5 -- Results from a Naive Regressions (Cox Proportional Hazard)
CH 1 CH 2 CH 3 CH 4 CH 5 CH 6 scaled time-served -1707 -2381 -2536 -1941 -1079 -1588
(0155) (0212) (0155) (0187) (0235) (0161) time-served squared 0941 1166 1154 0487 -0336 0016
(0263) (0328) (0234) (0263) (0323) (0192) scaled age -7718 -6272 -6200 -6174 -6028 -2779
(0257) (0385) (0295) (0388) (0496) (0468) age squared 6798 5207 5927 6619 6433 1160
(0503) (0775) (0608) (0791) (0983) (0881) female -0348 -0343 -0281 -0219 -0280 -0331
(0021) (0035) (0028) (0040) (0052) (0041) Black 0194 0115 0120 0088 -0016 -0054
(0023) (0030) (0022) (0026) (0031) (0023) other race 0567 0426 0348 0301 0371 0267
(0030) (0049) (0039) (0049) (0062) (0051) Hispanic -0085 -0095 -0072 -0018 0008 -0053
(0024) (0037) (0028) (0034) (0041) (0034) high_school -0124 -0142 -0127 -0106 -0088 -0036
(0039) (0049) (0036) (0042) (0051) (0038) advanced_degree -0611 -0441 -0423 -0287 -0169 -0051
(0053) (0084) (0070) (0088) (0112) (0078) lives_alone -0023 0006 0011 -0020 -0033 -0036
(0021) (0029) (0021) (0025) (0030) (0022) centered points 0311 -0026 0100 0057 0051 0041
(0015) (0022) (0009) (0012) (0013) (0002) N 143058 38733 52654 30049 17697 30247
74
The Relationship between Prison Length of Stay and Recidivism -- This report was prepared by Abt Associates using Federal funding provided by the Bureau of Justice Statistics (BJS) Opinions andor points of view expressed are those of the author(s) and do not necessarily reflect the official position or policies of the US Department of Justice
Table 6 ndash Results when Contrasts are Cells 13 24 57 68 911 1012 and so on
Criminal History 1
Criminal History 2
Criminal History 3
Criminal History 4
Criminal History 5
Criminal History 6
linear 0002 0004
-0002 0003
-0002 0004
-0003 0003
-0008 0005
-0005 0003
constant -0074 0048
-0034 0041
-0050 0041
-0012 0037
0054 0062
-0054 0041
R2 0010 0040 0020 0060 0150 0110 N 15 15 18 19 17 19 plt005 plt001 The constant is the average parameter for the estimated hazard (zero is neutral) Six criminal history scores labeled Criminal History The contrasts are cells 13 24 57 68 911 1012 and so on All the contrasts are independent
Table 7 ndash Results when Contrasts are Cells 24 35 68 79 1012 1113 and so on
Criminal History 1
Criminal History 2
Criminal History 3
Criminal History 4
Criminal History 5
Criminal History 6
linear 0003 -0003
0004 -0005
0003 -0003
-0002 -0004
0007 -0005
0000 -0004
constant -0103 (0032)
-0153 -0071
-0109 (0033)
-0097 -0050
-0188 (0064)
-0049 -0048
R2 0060 0070 0060 0010 0120 0000 N 16 14 18 17 17 18
plt005 plt001 The constant is the average parameter for the estimated hazard (zero is neutral) Six criminal history scores labeled Criminal History The contrasts are cells 24 35 69 710 1012 1113 etc
75
0 Q) bull ~ middot - 0
20gt () agto
0 00 co 0)0 C = a ctl lshyu c o 0 middot- o t ltD 0 aO 0 _ Q0
I()
ci 0 500
Time at Risk in Days
Crim H 1
Crim H 3
Crim H 5
Crim H is the criminal history category
Crim H 2
Crim H 4
Crim H 6
Crim H 1 is the highest l ine and others a re in descending order Crim H 5 and Crim H 6 are nearly indistinguishable
1000
The Relationship between Prison Length of Stay and Recidivism -- This report was prepared by Abt Associates using Federal funding provided by the Bureau of Justice Statistics (BJS) Opinions andor points of view expressed are those of the author(s) and do not necessarily reflect the official position or policies of the US Department of Justice
Figure 1 ndash Kaplan-Meier Estimates of Time until Recidivism by Criminal History Category
plt005 plt001 Six criminal history scores labeled Criminal History Scales variables run from 0 to 1 Centered points Criminal history points centered at zero
76
The Relationship between Prison Length of Stay and Recidivism -- This report was prepared by Abt Associates using Federal funding provided by the Bureau of Justice Statistics (BJS) Opinions andor points of view expressed are those of the author(s) and do not necessarily reflect the official position or policies of the US Department of Justice
Figure 2 ndash Relationship between Time-Served and Recidivism Principal Specification (Return and Revocation)
0 5 1
15
2 25
Relative Hazard
0 10 20 30 40 Offense Seriousness Level
Crim Hist Category 1
5
1 15
2 25
Relative Hazard
0 10 20 30 40 Offense Seriousness Level
Crim Hist Category 2
5
1 15
2 25
Relative Hazard
0 10 20 30 40 Offense Seriousness Level
Crim Hist Category 3 0
5 1
15
2 25
Relative Hazard
0 10 20 30 40 Offense Seriousness Level
Crim Hist Category 4 0
5 1
15
2 25
Relative Hazard
0 10 20 30 40 Offense Seriousness Level
Crim Hist Category 5
5
1 15
2 25
Relative Hazard
0 10 20 30 40 Offense Seriousness Level
Crim Hist Category 6
Dots are estimated relative hazards (shown if between -25 and 25)Vertical lines are 95 confidence interval for the estimated relative hazards (truncated at 25)Smooth lines are linear predictions and 95 confidence intervals for the regression line
Criminal History 1
Criminal History 2
Criminal History 3
Criminal History 4
Criminal History 5
Criminal History 6
linear 0002 (0002)
0000 (0003)
0000 (0002)
-0003 (0003)
0000 (0004)
-0003 (0003)
constant -0068 (0013)
-0075 (0019)
-0075 (0017)
-0076 (0019)
-0068 (0028)
-0077 (0020)
R2 003 000 000 003 000 003 N 31 29 36 36 34 37
plt005 plt001 The constant is the average parameter for the estimated hazard (zero is neutral) Six criminal history scores labeled Criminal History
77
The Relationship between Prison Length of Stay and Recidivism -- This report was prepared by Abt Associates using Federal funding provided by the Bureau of Justice Statistics (BJS) Opinions andor points of view expressed are those of the author(s) and do not necessarily reflect the official position or policies of the US Department of Justice
Figure 3 ndash Relationship between Time-Served and Recidivism Principal Specification (Return and Revocation) using an Instrumental Variable Estimator
7
8
9
1 11
Relative Hazard
0 10 20 30 40 Offense Seriousness Level
Crim Hist Category 1
9 95
1 105 11 115
Relative Hazard
0 10 20 30 40 Offense Seriousness Level
Crim Hist Category 2
6
8
1 12
14
Relative Hazard
0 10 20 30 40 Offense Seriousness Level
Crim Hist Category 3 5
1 15
2 25
Relative Hazard
0 10 20 30 40 Offense Seriousness Level
Crim Hist Category 4 8
9
1 11
12
Relative Hazard
0 10 20 30 40 Offense Seriousness Level
Crim Hist Category 5
5
1 15
2 25
Relative Hazard
0 10 20 30 40 Offense Seriousness Level
Crim Hist Category 6
Dots are estimated relative hazards (shown if between -25 and 25)Vertical lines are 95 confidence interval for the estimated relative hazards (truncated at 25)Smooth lines are linear predictions and 95 confidence intervals for the regression line
Criminal History 1
Criminal History 2
Criminal History 3
Criminal History 4
Criminal History 5
Criminal History 6
linear 0001 (0000)
0001 (0000)
0001 (0000)
0000 0000
0000 0000
0000 0000
constant -0014 (0002)
-0015 (0003)
-0011 (0003)
-0011 (0003)
-0009 0005
-0009 (0003)
R2 043 022 012 003 001 010 N 31 29 36 36 34 37
plt005 plt001 The constant is the average parameter for the estimated hazard (zero is neutral) Six criminal history scores labeled Criminal History
78
The Relationship between Prison Length of Stay and Recidivism -- This report was prepared by Abt Associates using Federal funding provided by the Bureau of Justice Statistics (BJS) Opinions andor points of view expressed are those of the author(s) and do not necessarily reflect the official position or policies of the US Department of Justice
Figure 4 ndash Sensitivity Test Minimum Cell Size 50 instead of 100
0 5 1
15
2 25
Relative Hazard
0 10 20 30 40 Offense Seriousness Level
Crim Hist Category 1
0 5 1
15
2 25
Relative Hazard
0 10 20 30 40 Offense Seriousness Level
Crim Hist Category 2
5
1 15
2 25
Relative Hazard
0 10 20 30 40 Offense Seriousness Level
Crim Hist Category 3 0
5 1
15
2 25
Relative Hazard
0 10 20 30 40 Offense Seriousness Level
Crim Hist Category 4 0
5 1
15
2 25
Relative Hazard
0 10 20 30 40 Offense Seriousness Level
Crim Hist Category 5
0 5 1
15
2 25
Relative Hazard
0 10 20 30 40 Offense Seriousness Level
Crim Hist Category 6
Dots are estimated relative hazards (shown if between -25 and 25)Vertical lines are 95 confidence interval for the estimated relative hazards (truncated at 25)Smooth lines are linear predictions and 95 confidence intervals for the regression line
Criminal History 1
Criminal History 2
Criminal History 3
Criminal History 4
Criminal History 5
Criminal History 6
linear 0002 (0002)
0000 (0003)
0000 (0002)
-0002 (0003)
0000 (0004)
-0003 (0002)
constant -0068 (0013)
-0075 (0018)
-0073 (0018)
-0078 (0019)
-0068 (0027)
-0084 (0021)
R2 003 000 000 002 000 003 N 31 32 37 37 37 40
Six criminal history scores labeled Criminal History plt005 plt001 The constant is the average parameter for the estimated hazard (zero is neutral)
79
The Relationship between Prison Length of Stay and Recidivism -- This report was prepared by Abt Associates using Federal funding provided by the Bureau of Justice Statistics (BJS) Opinions andor points of view expressed are those of the author(s) and do not necessarily reflect the official position or policies of the US Department of Justice
Figure 5 ndash Sensitivity Test Minimum Cell Size 150 instead of 100
0 5 1
15
2 25
Relative Hazard
0 10 20 30 40 Offense Seriousness Level
Crim Hist Category 1
5
1 15
2 25
Relative Hazard
0 10 20 30 40 Offense Seriousness Level
Crim Hist Category 2
5
1 15
2 25
Relative Hazard
0 10 20 30 40 Offense Seriousness Level
Crim Hist Category 3
5
1 15
2 25
Relative Hazard
0 10 20 30 40 Offense Seriousness Level
Crim Hist Category 4
0 5 1
15
2 25
Relative Hazard
0 10 20 30 40 Offense Seriousness Level
Crim Hist Category 5
5
1 15
2 25
Relative Hazard
0 10 20 30 40 Offense Seriousness Level
Crim Hist Category 6
Dots are estimated relative hazards (shown if between -25 and 25)Vertical lines are 95 confidence interval for the estimated relative hazards (truncated at 25)Smooth lines are linear predictions and 95 confidence intervals for the regression line
Criminal History 1
Criminal History 2
Criminal History 3
Criminal History 4
Criminal History 5
Criminal History 6
linear 0002
(0002)
0000
(0003)
0000
(0002)
-0003
(0003)
-0001
(0004)
-0003
(0003) constant -0068
(0013) -0075 (0021)
-0076 (0017)
-0071 (0020)
-0066 (0031)
-0071 (0021)
R2 003 000 000 003 000 004 N 31 28 34 34 32 35
plt005 plt001 The constant is the average parameter for the estimated hazard (zero is neutral) Six criminal history scores labeled Criminal History
80
The Relationship between Prison Length of Stay and Recidivism -- This report was prepared by Abt Associates using Federal funding provided by the Bureau of Justice Statistics (BJS) Opinions andor points of view expressed are those of the author(s) and do not necessarily reflect the official position or policies of the US Department of Justice
Figure 6 -- Sensitivity Test Minimum Percentage of Prison Terms 75 instead of 50
0 5 1
15
2 25
Relative Hazard
0 10 20 30 40 Offense Seriousness Level
Crim Hist Category 1
5
1 15
2 25
Relative Hazard
0 10 20 30 40 Offense Seriousness Level
Crim Hist Category 2
5
1 15
2 25
Relative Hazard
0 10 20 30 40 Offense Seriousness Level
Crim Hist Category 3
0 5 1
15
2 25
Relative Hazard
0 10 20 30 40 Offense Seriousness Level
Crim Hist Category 4
0 5 1
15
2 25
Relative Hazard
0 10 20 30 40 Offense Seriousness Level
Crim Hist Category 5
5
1 15
2 25
Relative Hazard
0 10 20 30 40 Offense Seriousness Level
Crim Hist Category 6
Dots are estimated relative hazards (shown if between -25 and 25)Vertical lines are 95 confidence interval for the estimated relative hazards (truncated at 25)Smooth lines are linear predictions and 95 confidence intervals for the regression line
Criminal History 1
Criminal History 2
Criminal History 3
Criminal History 4
Criminal History 5
Criminal History 6
linear 0004 (0003)
0002 (0003)
-0001 (0003)
-0002 (0003)
0000 (0004)
-0003 (0003)
constant -0086 (0021)
-0091 (0023)
-0070 (0017)
-0074 (0020)
-0069 (0031)
-0076 (0020)
R2 007 002 001 002 000 004 N 27 28 32 33 31 36
plt005 plt001 The constant is the average parameter for the estimated hazard (zero is neutral) Six criminal history scores labeled Criminal History
81
The Relationship between Prison Length of Stay and Recidivism -- This report was prepared by Abt Associates using Federal funding provided by the Bureau of Justice Statistics (BJS) Opinions andor points of view expressed are those of the author(s) and do not necessarily reflect the official position or policies of the US Department of Justice
Figure 7 ndash Sensitivity Test Contrasts that are J and J+1 instead of J and J+2 5
1 15
2 25
Relative Hazard
0 10 20 30 40 Offense Seriousness Level
Crim Hist Category 1
0 5 1
15
2 25
Relative Hazard
0 10 20 30 40 Offense Seriousness Level
Crim Hist Category 2
5
1 15
2 25
Relative Hazard
0 10 20 30 40 Offense Seriousness Level
Crim Hist Category 3
5
1 15
2 25
Relative Hazard
0 10 20 30 40 Offense Seriousness Level
Crim Hist Category 4
5
1 15
2 25
Relative Hazard
0 10 20 30 40 Offense Seriousness Level
Crim Hist Category 5
5
1 15
2 25
Relative Hazard
0 10 20 30 40 Offense Seriousness Level
Crim Hist Category 6
Dots are estimated relative hazards (shown if between -25 and 25)Vertical lines are 95 confidence interval for the estimated relative hazards (truncated at 25)Smooth lines are linear predictions and 95 confidence intervals for the regression line
Criminal History 1
Criminal History 2
Criminal History 3
Criminal History 4
Criminal History 5
Criminal History 6
linear 0002 (0004)
-0002 (0005)
0005 (0004)
0006 (0004)
0003 (0006)
0006 (0004)
constant -0030 (0029)
-0017 (0040)
-0037 (0032)
-0039 (0028)
-0031 (0046)
-0023 (0028)
R2 0010 000 004 010 001 009 N 25 25 27 26 29 29
plt005 plt001 The constant is the average parameter for the estimated hazard (zero is neutral) Six criminal history scores labeled Criminal History
82
The Relationship between Prison Length of Stay and Recidivism -- This report was prepared by Abt Associates using Federal funding provided by the Bureau of Justice Statistics (BJS) Opinions andor points of view expressed are those of the author(s) and do not necessarily reflect the official position or policies of the US Department of Justice
Figure 8 -- Sensitivity Test Using the Prais-Winston Estimator
5
1 15
2 25
Relative Hazard
0 10 20 30 40 Offense Seriousness Level
Crim Hist Category 1
0 5 1
15
2 25
Relative Hazard
0 10 20 30 40 Offense Seriousness Level
Crim Hist Category 2
5
1 15
2 25
Relative Hazard
0 10 20 30 40 Offense Seriousness Level
Crim Hist Category 3
5
1 15
2 25
Relative Hazard
0 10 20 30 40 Offense Seriousness Level
Crim Hist Category 4
5
1 15
2 25
Relative Hazard
0 10 20 30 40 Offense Seriousness Level
Crim Hist Category 5
5
1 15
2 25
Relative Hazard
0 10 20 30 40 Offense Seriousness Level
Crim Hist Category 6
Dots are estimated relative hazards (shown if between -25 and 25)Vertical lines are 95 confidence interval for the estimated relative hazards (truncated at 25)Smooth lines are linear predictions and 95 confidence intervals for the regression line
Criminal History 1
Criminal History 2
Criminal History 3
Criminal History 4
Criminal History 5
Criminal History 6
linear 0019 -0010
0005 -0003
0003 -0003
0007 (0003)
0002 -0006
0006 (0003)
constant -0133 0065
-0060 0020
-0035 0016
-0030 0031
-0032 0029
-0040 0013
Rho 0100 -0940 -0790 0010 -0260 -0730 R2 0240 0210 0110 0210 0020 0330 N 25 25 27 26 29 29
plt005 plt001 The constant is the average parameter for the estimated hazard Six criminal history scores labeled Criminal History
83
The Relationship between Prison Length of Stay and Recidivism -- This report was prepared by Abt Associates using Federal funding provided by the Bureau of Justice Statistics (BJS) Opinions andor points of view expressed are those of the author(s) and do not necessarily reflect the official position or policies of the US Department of Justice
Figure 9 -- Sensitivity Test Entering Prison as Recidivism
0 5 1
15
2 25
Relative Hazard
0 10 20 30 40 Offense Seriousness Level
Crim Hist Category 1
5
1 15
2 25
Relative Hazard
0 10 20 30 40 Offense Seriousness Level
Crim Hist Category 2
0 5 1
15
2 25
Relative Hazard
0 10 20 30 40 Offense Seriousness Level
Crim Hist Category 3
0 5 1
15
2 25
Relative Hazard
0 10 20 30 40 Offense Seriousness Level
Crim Hist Category 4
0 5 1
15
2 25
Relative Hazard
0 10 20 30 40 Offense Seriousness Level
Crim Hist Category 5
5
1 15
2 25
Relative Hazard
0 10 20 30 40 Offense Seriousness Level
Crim Hist Category 6
Dots are estimated relative hazards (shown if between -25 and 25)Vertical lines are 95 confidence interval for the estimated relative hazards (truncated at 25)Smooth lines are linear predictions and 95 confidence intervals for the regression line
Criminal History 1
Criminal History 2
Criminal History 3
Criminal History 4
Criminal History 5
Criminal History 6
linear 0003 (0002)
0002 (0002)
0001 (0002)
-0004 (0003)
0000 (0004)
-0003 (0003)
constant -0070 (0014)
-0084 (0017)
-0077 (0018)
-0071 (0020)
-0074 (0030)
-0080 (0020)
R2 004 002 000 005 000 003 N 40 36 39 37 33 37
plt005 plt001 The constant is the average parameter for the estimated hazard (zero is neutral) Six criminal history scores labeled Criminal History
84
The Relationship between Prison Length of Stay and Recidivism -- This report was prepared by Abt Associates using Federal funding provided by the Bureau of Justice Statistics (BJS) Opinions andor points of view expressed are those of the author(s) and do not necessarily reflect the official position or policies of the US Department of Justice
Figure 10 -- Sensitivity Testing Eliminating Drug-Law Offenders from the Analysis
0 5 1
15
2 25
Relative Hazard
0 10 20 30 40 Offense Seriousness Level
Crim Hist Category 1
0 5 1
15
2 25
Relative Hazard
0 10 20 30 40 Offense Seriousness Level
Crim Hist Category 2
5
1 15
2 25
Relative Hazard
0 10 20 30 40 Offense Seriousness Level
Crim Hist Category 3
5
1 15
2 25
Relative Hazard
0 10 20 30 40 Offense Seriousness Level
Crim Hist Category 4
0 5 1
15
2 25
Relative Hazard
0 10 20 30 40 Offense Seriousness Level
Crim Hist Category 5
5
1 15
2 25
Relative Hazard
0 10 20 30 40 Offense Seriousness Level
Crim Hist Category 6
Dots are estimated relative hazards (shown if between -25 and 25)Vertical lines are 95 confidence interval for the estimated relative hazards (truncated at 25)Smooth lines are linear predictions and 95 confidence intervals for the regression line
Criminal History 1
Criminal History 2
Criminal History 3
Criminal History 4
Criminal History 5
Criminal History 6
linear 0001 (0003)
-0001 (0004)
-0001 (0003)
-0002 (0003)
0001 (0005)
-0003 (0003)
constant -0055 (0014)
-0065 (0022)
-0066 (0019)
-0057 (0022)
-0059 -0031
-0062 (0022)
R2 000 000 000 001 000 003 N 31 27 34 32 32 35
plt005 plt001 The constant is the average parameter for the estimated hazard (zero is neutral) Six criminal history scores labeled Criminal History
85
The Relationship between Prison Length of Stay and Recidivism -- This report was prepared by Abt Associates using Federal funding provided by the Bureau of Justice Statistics (BJS) Opinions andor points of view expressed are those of the author(s) and do not necessarily reflect the official position or policies of the US Department of Justice
Figure 11 -- Sensitivity Testing No Covariates
0 5 1
15
2 25
Relative Hazard
0 10 20 30 40 Offense Seriousness Level
Crim Hist Category 1
5
1 15
2 25
Relative Hazard
0 10 20 30 40 Offense Seriousness Level
Crim Hist Category 2
5
1 15
2 25
Relative Hazard
0 10 20 30 40 Offense Seriousness Level
Crim Hist Category 3
0 5 1
15
2 25
Relative Hazard
0 10 20 30 40 Offense Seriousness Level
Crim Hist Category 4
0 5 1
15
2 25
Relative Hazard
0 10 20 30 40 Offense Seriousness Level
Crim Hist Category 5
5
1 15
2 25
Relative Hazard
0 10 20 30 40 Offense Seriousness Level
Crim Hist Category 6
Dots are estimated relative hazards (shown if between -25 and 25)Vertical lines are 95 confidence interval for the estimated relative hazards (truncated at 25)Smooth lines are linear predictions and 95 confidence intervals for the regression line
Criminal History 1
Criminal History 2
Criminal History 3
Criminal History 4
Criminal History 5
Criminal History 6
linear 0001 (0003)
-0003 (0003)
-0002 (0003)
-0004 (0003)
-0002 (0004)
-0004 (0003)
constant -0062 (0015)
-0067 (0020)
-0081 (0018)
-0082 (0022)
-0071 (0028)
-0084 (0022)
R2 000 003 002 005 001 007 N 31 29 36 36 34 37
plt005 plt001 The constant is the average parameter for the estimated hazard (zero is neutral) Six criminal history scores labeled Criminal History
86
The Relationship between Prison Length of Stay and Recidivism -- This report was prepared by Abt Associates using Federal funding provided by the Bureau of Justice Statistics (BJS) Opinions andor points of view expressed are those of the author(s) and do not necessarily reflect the official position or policies of the US Department of Justice
Figure 12 -- Sensitivity Testing Using the Earlier Guidelines
0 1
2 3
4 5
Relative Hazard
0 10 20 30 40 Offense Seriousness Level
Crim Hist Category 1
0 5 1
15
2 25
Relative Hazard
0 10 20 30 40 Offense Seriousness Level
Crim Hist Category 2
5
1 15
2 25
Relative Hazard
0 10 20 30 40 Offense Seriousness Level
Crim Hist Category 3
0 5 1
15
2 25
Relative Hazard
0 10 20 30 40 Offense Seriousness Level
Crim Hist Category 4
0 5 1
15
2 25
Relative Hazard
0 10 20 30 40 Offense Seriousness Level
Crim Hist Category 5
5
1 15
2 25
Relative Hazard
0 10 20 30 40 Offense Seriousness Level
Crim Hist Category 6
Dots are estimated relative hazards (shown if between -25 and 25)Vertical lines are 95 confidence interval for the estimated relative hazards (truncated at 25)Smooth lines are linear predictions and 95 confidence intervals for the regression line
Criminal History 1
Criminal History 2
Criminal History 3
Criminal History 4
Criminal History 5
Criminal History 6
linear 0000 (0003)
0001 (0004)
0000 (0003)
-0004 (0002)
-0002 (0004)
-0004 (0003)
constant -0085 (0017)
-0097 (0025)
-0096 (0019)
-0085 (0018)
-0076 (0030)
-0081 (0028)
R2 000 000 000 007 001 004 N 31 29 34 35 33 34
plt005 plt001 The constant is the average parameter for the estimated hazard (zero is neutral) Six criminal history scores labeled Criminal History
87

The Relationship between Prison Length of Stay and Recidivism -- This report was prepared by Abt Associates using Federal funding provided by the Bureau of Justice Statistics (BJS) Opinions andor points of view expressed are those of the author(s) and do not necessarily reflect the official position or policies of the US Department of Justice
on job seeking (Pager 2007 Pager and Quillian 2005) affecting black more than white applicants
Incarceration treatment heterogeneity is important because as the NRC report indicates unpacking
treatment effect dependence may lead to an explanation of why we observe outcome variations
across imprisonment studies found in all the systematic reviews (Nagin Cullen Jonson 2009 Smith
Goggin and Gendreau 2002 Villettaz Killias and Zoder 2006)
Identifying the Causal Relationship between Prison Length of Stay and Reoffending
As researchers have pointed out (Berube and Green 2007 Green and Winik 2010 Loeffler
2013 Loughran et al 2009 Nagin Cullen and Jonson 2009) estimating the causal relationship
between length of stay and reoffending raises validity challenges It seems plausible if not probable
that offenders receive long prison terms in part because they are likely to reoffend potentially
inducing a spurious positive correlation between prison length of stay and recidivism For example
prior criminal record is a good predictor of future offending and sentencing guidelines (when they
are used) When guidelines are absent judges typically take criminal records into account
sentencing offenders with criminal histories to serve longer terms than those with no or minimal
prior criminal justice contact Consequently even if estimated in a regression framework attempting
to control for confounders a partial correlation of time-served and recidivism may be uninformative
The research provided in this paper addresses this methodological concern about identification by
employing the logic of a regression discontinuity design (hereafter RDD) to rigorously identify the
causal relationship between time-served and recidivism The identification strategy rests on the
structure of guideline sentencing In the Nagin et al review these scholars anticipated the utility of
this approach ldquoDeterminant sentencing gridshellip may provide a quasi-experiment for constructing
the dose-response relationship between sentence length and reoffending (Nagin et al 2009 184)rdquo
Using a regression discontinuity design we find that lengthening a prison term does not increase
3
The Relationship between Prison Length of Stay and Recidivism -- This report was prepared by Abt Associates using Federal funding provided by the Bureau of Justice Statistics (BJS) Opinions andor points of view expressed are those of the author(s) and do not necessarily reflect the official position or policies of the US Department of Justice
recidivism In fact increasing the length of a prison term may reduce recidivism but if so the effect
is small
As we explain the US Sentencing Guidelines provide a structure for an RDD because
holding constant factors believed to affect recidivism the guidelines recommend longer or shorter
sentences for similar offenders based on offense factors that likely have nothing to do with an
offenderrsquos risk of recidivism Many methodologists consider RDD to be a close second-best
alternative to random assignment (Cook 2008 DiNardo amp Lee 2010 US Department of Education)
so this study provides a rigorous approach to answering the research question However while we
study whether longer prison terms affect recidivism more than do shorter terms except for criminal
history our data and design provide limited information about heterogeneity
THE PAROLE EFFECT
Roodman (2016) identifies a potential source of bias of imprisonment studies because of the
inextricable dependency of time served and parole supervision Parole agencies ldquocarve uprdquo a
sentence of imprisonment into that portion to be served in prison and the remainder to be served
under community supervision Even though parole terms can be shortened because of good
behavior the length of community supervision will depend on the prison term To the extent the
prison release date is delayed the period of supervision will be curtailed The opposite is also true
shorter prison terms lead to longer parole supervision terms Roodman argues that this means there
are two simultaneous treatments that cannot be disentangled Many studies find supervision
increases returns because of the closer surveillance and the added conditions of supervision (see for
example Gaes Bales and Skaggs 2016 comparing close community supervision monitoring to regular
probation) People with longer terms of community supervision have more time and therefore more
opportunity to be revoked and irrespective of any other imprisonment impact this artifact would
4
The Relationship between Prison Length of Stay and Recidivism -- This report was prepared by Abt Associates using Federal funding provided by the Bureau of Justice Statistics (BJS) Opinions andor points of view expressed are those of the author(s) and do not necessarily reflect the official position or policies of the US Department of Justice
bias shorter prison terms toward higher levels of recidivism and longer terms toward lower
recidivism This potential bias does not affect our study because everyone in the federal system is
given a post-release term of supervision separate from the prison term One term is independent of
the other Furthermore we censor observations when a term of supervision ends This removes the
potential artifact but it also means the recidivism results might be different if federal offenders were
released without supervision as is often the case in many state jurisdictions
THEORIES ON THE EFFECT OF IMPRISONMENT
Scholars have proposed alternative theories explaining the impact of imprisonment as having
either a criminogenic or a preventativedeterrent effect The criminogenic theories include a variant
of life course research highlighting the interruption of the normal stages of adult development a
prison induced strain theory a recognition that prison is a total institution and may socialize
offenders into an anti-normative lifestyle the possibility that prison are schools for crime and the
stigma attached to incarceration once the prisoner is released Preventative theories of
imprisonment cite mechanisms involving rehabilitation and specific deterrence We discuss both
below
CRIMINOGENIC THEORIES
Loeffler (2013) cites the life course literature (Horney Osgood Marshall 1995 Sampson and
Laub 1993 Western 2002) and discusses how prison delays the normal development of adults and
interrupts many of the stabilizing events such as marriage employment and education that might
otherwise promote prosocial development Prison strain has been studied by Listwan Sullivan
Agnew Cullen and Colvin (2013) Using survey methods they examined prison deprivations and
victimization aspects of prison strain on recidivism finding evidence of a relationship between strain
variables and recidivism in the predicted direction Early ethnographers emphasize strain by
5
The Relationship between Prison Length of Stay and Recidivism -- This report was prepared by Abt Associates using Federal funding provided by the Bureau of Justice Statistics (BJS) Opinions andor points of view expressed are those of the author(s) and do not necessarily reflect the official position or policies of the US Department of Justice
recounting the pains of imprisonment However these same ethnographers also emphasize prison
socialization This scholarship includes classic ethnographies of prison life such as Sykesrsquo Society of
Captives A Study of a Maximum Security Prison (1958) and Clemmerrsquos The Prison Community (1940)
Clemmer and Sykes provided a framework for studying inmate society and culture emphasizing the
nature of prison as a total institution in which separation from the community and the relationship
between inmates and guards redefine roles rules and personal identities Later ethnographies by
Carroll (1988) Jacobs (1977) Goffman (1961) Irwin (2009) Owen (1998) and Fleisher (1989) all
emphasize the strains deriving from both prison conditions and the antagonism pitting inmates
against guards None of these ethnographers provide strong empirical support for the relationship
between acculturation strain and recidivism
A line of research employing experimental and regression discontinuity designs (Chen and
Shapiro 2007 Gaes and Camp 2009 Lerman 2009 a b) evaluate the impact of security level
placement on in-prison and post-release outcomes Under the assumption that higher security levels
produce more strain Chen and Shapiro using an RDD and Gaes and Camp using an experiment found
higher security level placement led to higher levels of post-release recidivism Lerman employing an
RDD found that inmates placed in higher security levels had friends who were more likely to be
gang-involved and who were more likely to have had prior arrests and commitments Using other
data Lerman shows how these personal networks of friends are likely to be acquired in prison
Although these studies identify security level placement as a cause of in-prison socialization and
post-prison increases in recidivism supporting strain and socialization hypotheses they cannot rule
out other mediating mechanisms such as labeling though self-identification
Other criminologists argue that prisons are schools for crime where prisoners learn from
other inmates how to become more knowledgeable offenders (Cullen Jonson and Nagin 2011
6
The Relationship between Prison Length of Stay and Recidivism -- This report was prepared by Abt Associates using Federal funding provided by the Bureau of Justice Statistics (BJS) Opinions andor points of view expressed are those of the author(s) and do not necessarily reflect the official position or policies of the US Department of Justice
Letkemann 1973 Nguyen Loughran Paternoster Fagan amp Piquero 2017) Other research
suggests that prisons reinforce cultural values conforming to criminal activity that is offenders
import these values from their community and deviant values are reinforced by the structure and
organization of prison (Carroll 1988 Irwin 1980 2005 Jacobs 1977 Wacquant 2001)
Even if an offenderrsquos orientation toward reoffending is unaltered by prison labeling
(Braithwaite 1989) may affect recidivism Ex-offenders may be denied employment or prohibited
from accessing social benefits programs after release Whether these events are internalized
limiting the offenderrsquos subjective expectations or simply reduce legitimate avenues for community
integration they may increase the propensity to reoffend By manipulating job applications (Boshier
amp Johnson 1974) or by using actors posing as prior offenders (Pager et al 2009) research has
demonstrated a stigmatizing effect of a criminal record on employment reducing legitimate
opportunities for ex-offenders especially in a low wage job market Of course the stigma may come
from any term of imprisonment and long terms may be no more disadvantageous than short terms
PREVENTATIVE THEORIES
Preventative theories of imprisonment rest on a prisonerrsquos rational expectation of future
punishment or on theories of rehabilitation that envision prison as an opportunity to reform and
retrain Specific deterrence theorists (Becker 1968) assert that offenders are rational actors
weighing the costs and benefits of crime Experiencing prison reinforces its noxiousness and
provides a disincentive to future criminal behavior Reentry programming and other rehabilitative
training adopting evidence-based practices may reduce recidivism (Andrews amp Bonta 2006 Andrews
et al 1990 Gaes et al 1999 Gendreau et al 1999 Gendreau et al 2008 MacKenzie 2006 Smith
2006) so that prison can be used to change the trajectory of criminality Longer prison terms might
allow for more intensive reentry training and longer prison terms should reinforce the expectation of
7
The Relationship between Prison Length of Stay and Recidivism -- This report was prepared by Abt Associates using Federal funding provided by the Bureau of Justice Statistics (BJS) Opinions andor points of view expressed are those of the author(s) and do not necessarily reflect the official position or policies of the US Department of Justice
future punishment However because of the strong association between age and crime longer
prison terms produce inmates who are older at the time of release so that merely incapacitating
offenders for longer periods will reduce the likelihood of crime absent any other intervention or
causal mechanism As noted in Snodgras et al (2015) length of stay and aging are inseparable causal
factors even if one controls for age at release or age at sentence
Prison experiences may unleash forces that both push offenders away from crime and pull
them toward reoffending However as Loefler (2013) argues prison may simply collect people who
are predisposed toward criminality because of pre-existing life experiences and deficits He calls this
social selection crediting Manski and Nagin (1998) Nagin Cullen and Jonson (2009) and Smith and
Paternoster (1990) Loeffler argues that imprisonment itself is a highly selective process Only a small
proportion of people are imprisoned even people who are committed for the first time usually have
an extensive history of criminal justice contacts From this point of view prison has no causal
impact it is where offenders are housed much as hospitals are places where people predisposed to
illness are treated Loefflerrsquos argument is more relevant to an analysis of imprisonment than to
length of stay The relevant question we address is Even if there is a selection process does length
of stay have an impact on future reoffending
PRIOR STUDIES OF PRISON LENGTH OF STAY
Relying on criminological theory then provides no clear expectation of whether
incarceration will decrease or increase reoffending Nagin et al (2009) review empirical studies
addressing the question of whether on balance imprisonment pushes ex-offenders away or pulls ex-
offenders towards new crime They conclude that imprisonment per se seems to have a
criminogenic effect although they recognize studies that contradict that conclusion Nagin et al also
state there is little convincing evidence that length of stay ndash in their parlance prison dosage ndash
8
The Relationship between Prison Length of Stay and Recidivism -- This report was prepared by Abt Associates using Federal funding provided by the Bureau of Justice Statistics (BJS) Opinions andor points of view expressed are those of the author(s) and do not necessarily reflect the official position or policies of the US Department of Justice
increases recidivism They are skeptical of observational studies that use regression procedures to
uncover the causal impact of prison length of stay because identification requires an exacting
standard -- selection on observables (Rosenbaum 2002) -- in which covariates completely adjust for
any spurious relationship between time-served and recidivism
Nagin Cullen and Jonson (2009) identify 14 regression studies two experiments and three
matching studies evaluating the effect of length of stay in their 2009 review Because we are also
skeptical of the regression studies we do not review them1 The experimental studies of length of
stay by Berecochea and Jaman (1981) and Deschenes Turner and Petersilia (1995) manipulated
sentence reductions for offenders who had already served time in prison Part of the study design
for the Deschenes et al experiment diverted offenders from prison and would qualify as an
imprisonment but not a length of stay study However a subset of offenders was randomly assigned
to early release to be placed on intensive community supervision Analysis of the 17 dependent
variables showed only one that was significantly affected by prison length The Berecochea and
Jaman experiment randomly assigned offenders to a six-month reduction which was on average a
16 percent sentence reduction Inmates receiving a sentence reduction had higher parole failure
rates at one and two years after the release from prison but these differences were not statistically
significant Thus rigorous random design studies do not find that increasing prison length either
increases or decreases future criminality
Of the three matching studies identified by Nagin Cullen and Jonson (2009) two evaluate
length of stay on juveniles (Kraus 1981 and Loughran et al 2009) The third study by Jaman
Dickover and Bennett (1972) found recidivism to be higher for adult male burglars receiving 25
months or longer versus those serving 24 or fewer months but the difference was only significant at
1 The 14 regression studies mostly find null effects with specific deterrent and criminogenic effects about equal 9
The Relationship between Prison Length of Stay and Recidivism -- This report was prepared by Abt Associates using Federal funding provided by the Bureau of Justice Statistics (BJS) Opinions andor points of view expressed are those of the author(s) and do not necessarily reflect the official position or policies of the US Department of Justice
the 24-month horizon Kraus (1981) evaluated length of stay contrasts for juveniles that depended
on the juvenilersquos age group For example Kraus contrasted a term of 8 to 20 months versus a term up
to 7 months for 14 and 15-year oldrsquos however for juveniles who were 13 the contrast was between
9 to 16 months and 8 months or less None of the contrasts were statistically significant Loughran et
al (2009) employ propensity score methods The authors categorized the continuous length of stay
into discrete ordinal categories and used ordinal logit to estimate propensity scores The variation in
length of stay extended from 0-3 months up to greater than 12 months Whether using arrest or
self-reported reoffending Loughran et al found no marginal effect of length of stay on either
outcome
Meade Steiner Makarios and Travis (2012) also used ordinal logit to estimate the propensity
score creating ordered subsamples stratified by the estimated log odds of being in a category of
length of stay They stratified their sample into dosage categories and compared people within a
ldquodosagerdquo stratum to those with ldquosimilarrdquo propensity scores who had longer or shorter sentences
Meade et al found that beyond 16 months higher doses of imprisonment lowered recidivism (felony
arrest) however only the highest dose (gt= 78 months) was statistically significant
Snodgrass Blokland Haviland Nieuwbeerta and Nagin (2011) also conducted a dosage
study of time served among prisoners in the Netherlands and restricted their sample to first time
commitments convicted of violent property or drug offenses who were between age 12-40 and who
had sufficient time post-release to assess recidivism The discrete categories of time served were 1
month or less 1-2 months 2-3 months 3-6 months 6-12 months and 12+ months Consistent with
the other propensity score studies they estimated the propensity score using ordinal logit with many
covariates to predict the ordinal level of prison length of stay Rather than use only the propensity
scores to match offenders they used exact matches on sex age (+- two years) and one of four
10
The Relationship between Prison Length of Stay and Recidivism -- This report was prepared by Abt Associates using Federal funding provided by the Bureau of Justice Statistics (BJS) Opinions andor points of view expressed are those of the author(s) and do not necessarily reflect the official position or policies of the US Department of Justice
trajectory group memberships as well as a propensity score matching caliper of 15 The matched
pairings produced sets of offenders who served different sentence lengths The matched pairs
allowed Snodgrass et al to examine measures of recidivism comparing any given ordinal category of
length of stay to the other categories where a matched pair could be found The results showed no
relationship between length of stay and recidivism The Snodgrass et al study takes great care in
constructing counterfactuals for the offenders within a given length of stay class But as they note
the average levels of time served are much shorter than one would observe in most United States
adult prison samples
Roach and Schanzenbach (2015) use randomization of judges assigned to sentencing
convicted offenders to map the relationship between length of stay (median of 4 months) and one
two and three-year rates of recidivism Using reduced form and two-stage regression they find that
each additional month of sentence length decreases recidivism by about 1 percent When they
stratify on criminal history Roach and Schanzenbach find a strong effect of sentence length for
offenders with minimal criminal history and a weak or insignificant effect for offenders with more
extensive criminal histories They also found that relative to the base hazard rate the impact
occurred almost entirely within the first year of release Roach and Schanzenbach argue the impact
of length of stay is a combination of severity of punishment and rehabilitation The researchers argue
that offenders with longer sentences can participate in more rehabilitative prison programs Roach
and Schanzenbachrsquos Table 2 (page 19) does indicate possible sources of bias in the relationship
between length of stay and recidivism The judge dummy variables not only demonstrate a strong
relationship to sentence length essential to the study design but they also predict the offenderrsquos
offense severity level and number of prior non-violent convictions These offender characteristics
could be associated with the sentence length and the level of recidivism qualifying as backdoor
variables (Morgan and Winship 2015) Roodmanrsquos (2016) review of this study offers the possibility
11
The Relationship between Prison Length of Stay and Recidivism -- This report was prepared by Abt Associates using Federal funding provided by the Bureau of Justice Statistics (BJS) Opinions andor points of view expressed are those of the author(s) and do not necessarily reflect the official position or policies of the US Department of Justice
the longer sentences in this study would lead to longer parole supervision elevating recidivism
because of technical parole violations
Kuziemko (2012) uses the Georgia parole guideline grid as a means of identifying the causal
effect of length of stay She restricts her analysis to offenders with less severe offenses and whose
criminal history category is in the average to high range She uses the discontinuity in the grid
recommendation (separating high from average risk) as an instrument for time served with the
instrumented time served in stage one and recidivism regressed on the instrument in stage two
along with other covariates One of her estimates restricts the sample to people whose points are
just above or just below the discontinuity threshold (8 versus 9 points) which should yield the best
approximation to an exogenous variation She finds each additional month of time served lowers the
three-year recidivism rate by 15 percent It is not clear why Kuziemko restricted her analysis to this
threshold limiting the analysis to a narrow range of the guideline grid Most offenders have lower
criminal history scores and restricting the analysis to the higher thresholds limits the generalizability
of the study In fact Roodmanrsquos (2016) reanalysis of these data evaluates other discontinuity cut
points and finds either insignificant length of stay coefficients or coefficients with the opposite sign
indicating increased length of stay increases the probability of recidivism
Mears et al (2016) used the generalized propensity score to balance covariates across levels
of length of stay They balanced within four subgroups of time served categories using
demographics categories of commitment offense offense severity scores prior record scores
dummy coded year of release and dummy coded judicial district While they achieved balance on
this set of covariates they did not conduct a sensitivity test to evaluate the potential impact of an
omitted variable (Rosenbaum 2002) Mears et al (2016) found the effect of time served on
recidivism depended on the level of length of stay Short terms produced increased recidivism up to
12
The Relationship between Prison Length of Stay and Recidivism -- This report was prepared by Abt Associates using Federal funding provided by the Bureau of Justice Statistics (BJS) Opinions andor points of view expressed are those of the author(s) and do not necessarily reflect the official position or policies of the US Department of Justice
one year From one to two years time served decreases recidivism and thereafter has no effect
Long terms (more than 6 years) could not be evaluated due to large error terms
An RDD design employed by Hjalmarsson (2009) was also based on a guideline system
however the study applied to a juvenile population in the state of Washington and the discontinuity
was based on a sanction to a state run juvenile facility versus a local sanction This latter punishment
included sanctions involving much shorter sentences served in a local facility a term of community
supervision fines or community service Hjalmarsson found a deterrent effect of state-run
confinement for juveniles compared to the local sanctions This study was not a test of length of
stay but a test of state-run juvenile confinement as opposed to a bevy of alternate juvenile
punishments To control for the fact the running variable was correlated with recidivism across
levels of criminal history the study used a quadratic regression of the running variable
Furthermore the author used all the data without regard for bandwidth This puts tremendous
pressure on his quadratic expression being correct Secondly rather than using an intent-to-treat
estimator and perhaps converting that into LATE the author drops cross-overs from the
analysis There is no justification for doing so and we are unaware of other RDDrsquos that takes such a
step Finally the author made no attempt to justify an implicit assumption that right-hand-censoring
is independent In fact given data construction and what we know about juvenile justice right-
hand-censoring is unlikely to be independent Specifically offenders with longer terms are more
likely to be censored This relationship alone may explain the findings that incarceration reduced
recidivism
One last study of note was conducted by Drago Galbiati and Vertova (2009) in which the
authors examined the effect of a Clemency Bill in Italy that shortened the sentence of offenders
anywhere from 1 to 36 months This could be described as an exogenous treatment since the
13
The Relationship between Prison Length of Stay and Recidivism -- This report was prepared by Abt Associates using Federal funding provided by the Bureau of Justice Statistics (BJS) Opinions andor points of view expressed are those of the author(s) and do not necessarily reflect the official position or policies of the US Department of Justice
application of clemency was applied irrespective of criminal history offense age and other factors
affecting the outcome However the early release came with a caveat The remaining time to serve
would be reinstated if the offender was convicted of another crime within five years So this was a
reduction in length of stay with an added disincentive to commit a new offense People who had
spent more time in prison were less likely to reoffend and each month of remaining time to serve
was associated with a 124 percent reduction to commit a new crime2
Even with these additional studies the literature on length of stay using strong
counterfactual designs is still sparse and presents a mixed picture of effects Most studies show no
effect or that increased prison length reduces recidivism slightly Several are imbalanced in ways
that could bias the length of stay effects The studies also span different populations juveniles
adults and cover different international jurisdictions (Italy the Netherlands and United Sates) The
present study uses a very large sample of federal offenders sentenced to prison with varying lengths
of stay
INCARCERATION TREATMENT HETEROGENEITY
Scholars have argued that prison dosage (length of stay) may have different effects
conditional on factors associated with the individual with the social context with sentencing
structure and with potentially many other factors The National Academy of Sciences study on mass
incarceration finds evidence for the heterogeneity of incarceration effects (NRC 2014 427) But we
need a template to systematically examine incarceration heterogeneity
Mears Cochran and Cullen (2014) provide one such template They propose three types of
sources of heterogeneity prior sanctioning experience in-prison experiences and the level of post-
2 Kuziemko (2012) also capitalizes on early release in Georgia because jail overcrowding allowed her to compare offenders with different amounts of time served having the same prior risk levels She finds people with longer time served have lower recidivism rates These results are challenged by Roodman as possible evidence of parole bias in Kuziemkorsquos analysis
14
The Relationship between Prison Length of Stay and Recidivism -- This report was prepared by Abt Associates using Federal funding provided by the Bureau of Justice Statistics (BJS) Opinions andor points of view expressed are those of the author(s) and do not necessarily reflect the official position or policies of the US Department of Justice
release supervision ndash a pre- within- post-custody framework The National Academy of Sciences
report takes an even broader perspective by suggesting that there may be incarceration effects for
different units ndash the effect on people may be substantially different than the effect on families or
neighborhoods Based on the Mears et al hypothesized framework it seems sentencing jurisdictions
will vary on many of the important pre within and post dimensions We may be reluctant to accept
that results from Florida apply to Massachusetts unless we have a framework that tells us how to
compare jurisdictions within this pre within and post sentencing framework
For the current application we use the structure of the U S Sentencing Guidelines
sanctioning grid in our RDD design to test whether criminal history or offense seriousness moderates
the effect of length of stay increments We find that increments in length of stay have about the
same effect regardless of either of these dimensions We also separately evaluate criminal history
sex race education and marital status all showing homogeneous effects of length of stay
PRESENT METHODOLOGY DATA STATISTICS AND INFERENCE
This methodology section has three parts The first part identifies the source of the data ndash
the Federal Justice Statistics Program To provide necessary background before discussing the
regression discontinuity design the second part summarizes the US Sentencing Guidelines The
third part discusses statistical methods and the RDD identification strategy3 This application of RDD
is unconventional There are multiple break-points and hence multiple effects the effects are
summarized using a meta-regression borrowed from meta-analysis Furthermore for each effect
the bandwidth is exactly two units so search for an optimal bandwidth is not a concern Several
3 Some readers may prefer to characterize our approach as using instrumental variables The US Sentencing Guidelines are the instrument that moves offenders who otherwise have the same propensity to recidivate between two guidelines cells the first of which prescribes a shorter prison term on average than does the second Because there are many guideline cells there are many estimates based on contiguous cells The multiple estimates are averaged using inverse variance weights
15
The Relationship between Prison Length of Stay and Recidivism -- This report was prepared by Abt Associates using Federal funding provided by the Bureau of Justice Statistics (BJS) Opinions andor points of view expressed are those of the author(s) and do not necessarily reflect the official position or policies of the US Department of Justice
conventional tests used in RDD are inapplicable in this setting For example we need not test how
expanding the bandwidth affects estimates
Although the parallel is disputed (Imbens amp Lemieux 2007) some see RDD as an
instrumental variable estimator and it is practical to employ IV as the estimator This alternative
estimator is also used in this study Results show the RDD estimator and the IV estimator yield
essentially the same results
Data Source
Data for this study come from the Federal Justice Statistics Program (FJSP) a Bureau of
Justice Statistics (BJS) sponsored project to assemble federal justice records To be included in the
analysis an offender must have been sentenced under the guidelines between 1999 and 2014
Practically the period studied is shorter because to be included in the analysis an offender must have
entered community supervision but many offenders sentenced between 1999 and 2014 were still
incarcerated at the end of 2014
The FJSP has a thirty-five-year history however recent refinements link federal offenders
from investigation through corrections This paper uses a subset of the linked data running from
sentencing through a single cycle of release to community supervision and possible recidivism The
US Sentencing Commission (USSC) provides data on offenses and offenders at the time of
sentencing the Administrative Office of the US Courts (AOUSC) provides data on offenders under
community supervision and the Bureau of Prisons (BOP) provides data on offenders during periods
of incarceration Details regarding construction of the FJSP data appear elsewhere (Kling et al
2016) this paper summarizes
16
The Relationship between Prison Length of Stay and Recidivism -- This report was prepared by Abt Associates using Federal funding provided by the Bureau of Justice Statistics (BJS) Opinions andor points of view expressed are those of the author(s) and do not necessarily reflect the official position or policies of the US Department of Justice
Since 1987 federal offenders have been sentenced using sentencing guidelines and data
about guideline application have been assembled (and contributed to the FJSP) by the USSC
Guidelines data provide detailed accounts of the offenderrsquos criminal history the offense of
conviction the sentence imposed and expected prison time Expected prison time differs from
actual prison time but the two are close because sentencing in the federal system uses determinate
or real-time sentencing and as explained below actual time-served is observed with systematic
error
When an offender is sentenced to prison he or she serves time in a facility run by the
Federal Bureau of Prisons (BOP) which reports data from its inmate tracking system (SENTRY) to the
FJSP Most offender prison terms are recorded in SENTRY but some are not because (1) some
offenders are sentenced to time-served prior to trial (2) some offenders spend part of their terms in
state detention and (3) terms of thirty days or fewer are inconsistently recorded in SENTRY Because
of these limitations we use expected time-served reported by the USSC as a measure of prison time
However we use admission into a BOP facility during the period of community corrections as one
measure of recidivism
When an offender is sentenced to probation or when an offender leaves prison to serve a
statutorily required term of supervised release (a judge-imposed sentence to post-incarceration
supervision) his or her term of community supervision is recorded in Probation and Pretrial Services
Automated Case Tracking System (PACTS) an information system maintained by the Administrative
Office of the U S Courts specifically by the Probation and Pretrial Services Office (PPSO) After
some manipulation4 the PACTS data record periods of community supervision and outcomes Being
4 Federal probation officers frequently open terms of probation before the offender is sentenced and terms of supervised release before the offender is released from prison For probation the probation officer may be responsible for pretrial supervision continued into post-conviction supervision and this appears as a continuous period of community supervision
17
The Relationship between Prison Length of Stay and Recidivism -- This report was prepared by Abt Associates using Federal funding provided by the Bureau of Justice Statistics (BJS) Opinions andor points of view expressed are those of the author(s) and do not necessarily reflect the official position or policies of the US Department of Justice
revoked from community supervision is another measure of recidivism Every federal offender in our
sample received a term of community supervision eliminating one source of variability and
heterogeneity
For the recidivism analysis time-at-risk starts with the beginning of a term of supervised
release for offenders sentenced to prison The time-at-risk ends with recidivism or with the first
occurrence of one of the following censoring events completion of the community supervision term
three years or with the end of data collection Using the measures described above recidivism is
defined by the occurrence of a recognized failure event If the offender reappears in the federal BOP
data he or she is deemed to have recidivated If the offender does not reappear in the BOP data but
we observe the offender is revoked from community supervision he or she is deemed to have
recidivated Although there are several explanations for being revoked from supervision but not
entering federal prison one common reason is the offender is arrested for a state-level crime and
detained in state custody pending trial The date when an offender reenters prison is the date of
recidivism if the offender does not reenter prison but is revoked from supervision the date of the
revocation is the date of recidivism Based on years of working with the PPSO checking algorithms
with PPSO administrative staff and field staff we have confirmed that this approach ndash providing
primacy to returning to prison according to the BOP ndash is the best way to identify recidivism5
Many federal offenders are arrested for new crimes without returning to prison or having
their community supervision status revoked Using the FJSP data we estimate three-year recidivism
in the FJSP Also for probation an officer may open a supervision record when preparing a presentence report The correction is to change the beginning of supervision to the date of sentencing For a term of supervised release the probation officer might open the term in preparation for post-release planning To correct this we changed the beginning of supervision to coincide with the end of prison 5 An offenderrsquos community supervision must be revoked before he or she is committed to prison so the date of revocation would seem to be the better date for the failure event In fact probation officers often fail or are unable to record the date of revocation until weeks or months after it occurs Consequently the date of entering prison (when it occurs) is a more accurate indicator for a study of recidivism
18
The Relationship between Prison Length of Stay and Recidivism -- This report was prepared by Abt Associates using Federal funding provided by the Bureau of Justice Statistics (BJS) Opinions andor points of view expressed are those of the author(s) and do not necessarily reflect the official position or policies of the US Department of Justice
rates of about 20 percent for federal offenders placed on community supervision If new arrests
were included in the analysis the recidivism rate would be closer to 30 percent6 The FJSP does not
include arrest data so we could not define recidivism as being arrested but an arrest that does not
result in revocation is typically for a minor or unfounded crime so the outcome measures used in
this study are for events that are sufficiently serious to provoke a return to custody
To be included in the analysis the offender must have been convicted and sentenced under
the US Sentencing Guidelines since 1999 This is the period covered by the data linkage Only
offenders convicted of felonies and serious misdemeanors are sentenced routinely under the
guidelines so this study is limited to those serious offenders Others rarely serve prison terms so
the omission is inconsequential To be included in the study the offender must have entered
community supervision else we could not identify a recidivism follow-up period Because of this
requirement some offenders sentenced under the guidelines are excluded from the analysis
Several reasons explain why offenders do not enter community supervision First before entering
community supervision offenders sentenced to prison must have been released from prison
Second many federal offenders are foreign nationals in the country legally or illegally they are often
deported upon prison release so they are not candidates for a recidivism study and consequently
this study is based on US citizens7 Some other offenders are released from prison to detainers
exercised by state authorities Because offenders who never enter community supervision provide
no information for analysis they are excluded from the analysis file
6 The authors have worked with PPSO for six years to match community supervision records with criminal history records (eg criminal record histories held by state authorities and linked using an FBI index) Data use agreements preclude including criminal history records in the FJSP so they are unavailable for this analysis Based on our work with PPSO we know that recidivism rates based on arrests are near 30 percent 7 Non-citizens are sentenced to community supervision but they are deported and never enter active community supervision If they reenter the county illegally their supervision status can be revoked However this form of recidivism is very different from the form of recidivism studied in this paper so we chose to exclude non-citizens We might have retained non-citizens who entered active community supervision but they are difficult to distinguish reliably in the OBTS so we chose to exclude all non-citizens
19
The Relationship between Prison Length of Stay and Recidivism -- This report was prepared by Abt Associates using Federal funding provided by the Bureau of Justice Statistics (BJS) Opinions andor points of view expressed are those of the author(s) and do not necessarily reflect the official position or policies of the US Department of Justice
Data limitations discussed in this section seem to raise concerns about bias when measuring
recidivism but these concerns are not serious for this study Essentially a RDD study compares
offenders from group A with offenders from group B where group A and group B are closely
matched Due to matching whatever biases arise regarding the measurement of recidivism are likely
the same in groups A and B Therefore a comparison of recidivism for groups A and B is valid even if
estimates of recidivism are systematically biased
SENTENCING GUIDELINES
Explaining the RDD requires a short description of federal sentencing guidelines Under the
guidelines offense seriousness is determined by a complex set of rules that take the offense of
conviction and real offense behavior into account to classify sentencing factors into one of 43 offense
seriousness levels with j=1 being the least serious and j=43 being the most serious and six criminal
history categories with k=1 being the least serious (least likely to recidivate) and k=6 being the most
serious (most likely to recidivate) By design the offense seriousness levels reflect the USSCrsquos
assessment of offense seriousness and do not consider an offenderrsquos threat to recidivate Likewise
by design the offenderrsquos criminal history category reflects the USSCrsquos assessment of the likelihood
that an offender will recidivate Important to note subtle differences in offense conduct cause an
offenderrsquos crime to be associated with offense level j rather than offense level j-1 or j+1 For
example unarmed bank robbers armed bank robbers who do not display their weapons armed
bank robbers who display but do not threaten with their weapons and bank robbers who explicitly
threaten with their weapons all appear in different seriousness levels Furthermore offenders
convicted of violent crimes drug-law violations and property crimes can all appear in the same
offense seriousness level Based on this subtlety we expect that offenders in offense seriousness
level j will not be inherently more likely to recidivate than will offenders in seriousness levels j-1 and
20
The Relationship between Prison Length of Stay and Recidivism -- This report was prepared by Abt Associates using Federal funding provided by the Bureau of Justice Statistics (BJS) Opinions andor points of view expressed are those of the author(s) and do not necessarily reflect the official position or policies of the US Department of Justice
j+1 provided criminal history is held constant8 In fact holding criminal history constant it seems
likely that offenders in offense seriousness category j are not inherently more or less likely to
recidivate than are offenders in offense seriousness categories j-k and j+k where k is a small number
This assumption provides the identification logic for the RDD and for the instrumental variable
alternative
Under the guidelines another complex set of rules determine criminal history points which
are collapsed into six criminal history categories for the guidelines application with category 1 being
the least serious criminal record and category 6 being the most serious record Based on the offense
seriousness level and the criminal history category the federal sentencing guidelines are a 43x6 grid
comprising 43 offense seriousness rows and 6 criminal history columns Holding the criminal history
category constant moving down the grid from least serious offense level to most serious offense
level the recommended prison term increases Holding the offense seriousness level constant
moving from left to right across the grid from least serious criminal history category to most serious
criminal history category the recommended prison term increases For the least serious offenses
and for the least dangerous offenders the guidelines recommend probation or alternative sanctions
although prison terms are allowed and sometimes imposed
Every year the Commission can recommend changes to the guidelines for Congressional
approval and in fact the guidelines have changed over time These changes have little consequence
for the analysis reported in this paper Even if the composition of offenders within specific guideline
cells has changed over time recommended sentence terms have always increased with offense
8 Possibly some factors entering the determination of the offense seriousness level might predict recidivism However crimes committed in the federal system are so diverse and factors entering the guidelines are so detailed it seems unlikely that increases in the offense seriousness levels would be systematically associated with recidivism holding criminal history constant Possibly for some cell jj+1 comparisons factors that enter the offense seriousness determination may cause recidivism to increase or decrease but provided these factors are not systematic ndash meaning that they do not always increase recidivism as the comparison moves from cell j to j+1 ndash the treatment effect is still identified
21
The Relationship between Prison Length of Stay and Recidivism -- This report was prepared by Abt Associates using Federal funding provided by the Bureau of Justice Statistics (BJS) Opinions andor points of view expressed are those of the author(s) and do not necessarily reflect the official position or policies of the US Department of Justice
seriousness level As explained in this next section that regularity is sufficient to support the RDD
estimation procedure
THE RDD AND STATISTICAL METHODOLOGY
During the last decade methods for inferring causality have gone well beyond naive
regression models criticized by Nagin and his colleagues (Morgan amp Winship 2015 Imbens amp Rubin
2015) A regression discontinuity design (Hahn Todd amp van der Klauuw 2001 van der Klaauw 2002
Imbens amp Lemieux 2007 Lee amp Lemieux 2010 Bloom 2012) is a rigorous approach often applied in
non-criminal justice research and sometimes applied in criminal justice studies (Berk amp Rauma 1983
Berk amp DeLeeuw 1999 Berk 2010 Rhodes amp Jalbert Regression Discontiuity Design in Criminal
Justice Evaluation An Introduction and Illustration 2013) Commonly the RDD is applied in a setting
where a decision rule based on factors (such as offense seriousness level holding criminal history
constant) can be used to define a ldquocut-pointrdquo that places study subjects (such as offenders) into one
group that does and another group that does not receive treatment Very near that rule-imposed
cut-point study subjects who do and do not receive treatment are so similar that a comparison of
outcomes for the two groups is deemed valid This section explains that our application of the RDD
identification strategy differs from the conventional application
One difference between our application and the standard application is that for us treatment
is a dose (eg the length of a prison term) while in standard applications treatment is a binary
condition On average the dose received by offenders in cell j+1 is higher than the dose received by
offenders in cell j Because offenders in cells j and j+1 are otherwise the same regarding the threat to
recidivate we can ask whether offenders in cell j+1 have higher or lower recidivism rates than
offenders in cell j and if so we have justification for attributing causation As a stylized example
22
The Relationship between Prison Length of Stay and Recidivism -- This report was prepared by Abt Associates using Federal funding provided by the Bureau of Justice Statistics (BJS) Opinions andor points of view expressed are those of the author(s) and do not necessarily reflect the official position or policies of the US Department of Justice
suppose first-time offenders who steal $100000 are sentenced according to offense seriousness
level j while first-time offenders who steal $125000 are sentenced according to offense seriousness
level j+1 In deference to the more serious crime the guidelines call for a term between 20 and 23
months for first-time offenders sentenced within guideline cell j and between 22 and 26 months for
first-time offenders sentenced within guidelines cell j+1 Given judicial discretion sentences imposed
on offenders within guideline cell j overlap with sentences imposed on offenders within guideline cell
j+1 but on average prison sentences within guideline cell j+1 are longer than those imposed within
guideline cell j This average difference drives the identification strategy Specifically holding the
criminal history category constant offenders sentenced within guideline cell j+1 are not inherently
more recidivistic than are offenders sentenced within guideline cell j but offenders sentenced within
guideline cell j+1 receive longer prison terms on average and we can test for whether those longer
prison terms account for higher or lower recidivism
Usually when applying RDD researchers consider a variable X (called a running variable in
the RDD context) and a critical value Xo that assigns study subjects to a comparison group when X lt
Xo and to a treatment group otherwise A sharp design occurs when the assignment is exact a fuzzy
design occurs when the assignment is inexact Although both sharp and fuzzy designs both estimate
the treatment effect sharp designs are preferred because (from a statistical estimation standpoint)
they are more efficient and interpreting the effect is clear
When treatment is binary as it is in standard applications the distinction between sharp and
fuzzy is straightforward Let PL be the probability of treatment when X lt Xo and let PR be the
probability of treatment otherwise If PL = 0 and PR = 1 then the design is sharp Let YL be the mean
outcome when X lt Xo and let YR be the mean outcome otherwise An estimator for the treatment
effect is YR-YL or just the difference in the mean outcomes But suppose that PL ge 0 or PR le 1 or both
23
The Relationship between Prison Length of Stay and Recidivism -- This report was prepared by Abt Associates using Federal funding provided by the Bureau of Justice Statistics (BJS) Opinions andor points of view expressed are those of the author(s) and do not necessarily reflect the official position or policies of the US Department of Justice
then the design is fuzzy Given a fuzzy RDD an often-used estimator is (YR-YL)(PR-PL) This
alternative estimator is sometimes called a local average treatment effect (LATE) Note the
numerator is an intent-to-treat estimator and in fact statistical testing is based on the numerator
because dividing by a constant will not change the properties of the basic test of whether treatment
is effective
For our application treatment is a dose and doses are distributed about a mean that
depends on whether X lt Xo or X ge Xo A necessary condition is that a shift in the offender from
guideline cell j to guideline cell j+1 will always (a sharp design) or sometime (a fuzzy design) cause an
offender to receive a longer prison term The monotonicity assumption is that this shift will never
cause an offender to receive a shorter prison term We presume the monotonicity assumption holds
and see no reason to assume otherwise
A test of the null hypothesis of no treatment effect is based on YR-YL Let TL be the average
prison term for X lt Xo let TR be the average prison term for X ge Xo Then the counterpart to the LATE
estimator for the binary treatment effect is (YR-YL)(TR-TL) or the change in recidivism per unit of
additional prison This too is a local average treatment effect Its interpretation is the average
increasedecrease in recidivism resulting from an average increase in prison length
In both these illustrations the estimator is LATE LATE is not necessarily the average
treatment effect or in this case the average increasedecrease in recidivism from increasing time-
served by one unit However LATE is almost always used as a substitute for that average which is
unidentified (Imbens 2009)
Returning to the standard application the ideal identification strategy requires that
estimation be limited to study subjects whose X values are just slightly less than Xo or equal to or
24
The Relationship between Prison Length of Stay and Recidivism -- This report was prepared by Abt Associates using Federal funding provided by the Bureau of Justice Statistics (BJS) Opinions andor points of view expressed are those of the author(s) and do not necessarily reflect the official position or policies of the US Department of Justice
slightly more than Xo9 Because very few observations meet these demanding conditions evaluators
usually expand the bandwidth to be broader than ldquoslightly lessrdquo and ldquoslightly morerdquo Because this
expansion of the bandwidth violates the asymptotic identification assumptions evaluators typically
assume that a local linear regression of the outcome variable Y on X will capture the relationship
between Y and X absent any intervention Given the intervention any departure from the local linear
regression around Xo is deemed the treatment effect A standard application would test the
credibility of this local linear regression and a standard application would test the sensitivity of
findings to the size of the bandwidth
Our application differs from the standard application in important ways Typically when
researchers apply the RDD strategy there is a single cut-point so there is a single estimate of the
treatment effect Less commonly there are multiple cut-points and a researcher can estimate
multiple treatment effects (Cattaneo Keele Tituinik amp Vazquez-Bare 2016) Given the structure of
the sentencing guidelines our study is based on a multiple cut-point RDD That is we estimate
multiple effects then combine them to generalize conclusions
Rather than increasing efficacy by expanding the bandwidth we always make comparison
across adjacent cells so that cell j is deemed ldquoslightly lessrdquo than the offense seriousness level that
determines cell j+1 Employing multiple cut-points achieves small standard errors by combining the
multiple estimates that arise from comparing outcomes for cells jj+1 j+1j+2 j+2j+3 and so on It is
unnecessary to expand the bandwidth beyond two units
9 ldquoSlightly lessrdquo and ldquoslightly morerdquo mean than X falls within a region X+δ and X-δ as δ approaches zero Expanding the bandwidth means that δ is allowed to get bigger
25
The Relationship between Prison Length of Stay and Recidivism -- This report was prepared by Abt Associates using Federal funding provided by the Bureau of Justice Statistics (BJS) Opinions andor points of view expressed are those of the author(s) and do not necessarily reflect the official position or policies of the US Department of Justice
In the conventional application a researcher would assure the relationship between the
outcome variable and the running variable is linear to the left and right of the breakpoint10 Because
our approach employs just two points j and j+1 this test is unavailable to us Arguably it is also
inapplicable because when estimating an effect we do not expand the bandwidth beyond j and j+1
In the conventional application the researcher will assure there is a discontinuity in treatment so
that treatment is more likely for those to the right of the cut-point than it is for those to the left We
do apply this conventional test showing that it holds
In conventional RDD analysis researchers worry about ldquogamingrdquo In the present context
defense attorneys have incentives to move their clients to lower guideline cells and prosecuting
attorneys have countervailing incentives to move offenders to higher guideline cells Gaming is
possible by manipulating guideline elements such as the amount of money stolen Defense
attorneys would argue the amount is lower than alleged prosecutors would argue the opposite In
conventional RDD analysis researchers use imperfect devices to test for gaming but those tests are
not necessary in the present context
To explain suppose a variable Z is associated with recidivism and is subject to gaming such
that defense attorneys are generally able to shift offenders from cell j+1 to cell j based on the value
of Z In our study we would expect a general shift in Z from j+2 to j+1 from j+1 to j from j to j-1
from j-1 to j-2 and so on In general this shift would have no effect on the contrasts because it
occurs across all adjacent cells Thus gaming is less relevant for a multiple-effect RDD than for a
conventional single-effect RDD Furthermore we are only concerned with gaming about variables
10 Postulating a linear relationship is frequent but some researchers expand their models to allow power functions of the running variable Hjalmarsson (2009) in a study of guidelines and juvenile justice discussed earlier used a quadratic This is a dangerous practice because the validity of the quadratic is difficult to assess and findings based on a RDD are sensitive to getting the model specification correct There are other elaborate alternatives to using local linear regressions but they are not applicable to our study
26
The Relationship between Prison Length of Stay and Recidivism -- This report was prepared by Abt Associates using Federal funding provided by the Bureau of Justice Statistics (BJS) Opinions andor points of view expressed are those of the author(s) and do not necessarily reflect the official position or policies of the US Department of Justice
that affect recidivism Because criminal history is held constant by construction of the guideline cells
the avenue for gaming is restricted Nevertheless we introduce some test for whether variable
associated with recidivism vary systematically across cells so that for example we ask whether
offenders in cell j+1 tend to be older than offenders in cell j We introduce these potential
confounders into the local linear regression Although we do not need a local linear regression for
identification we increase the efficiency of estimates by using a regression to include covariates in
the analysis Given the nature of the outcome variable when comparing outcomes in cells j and j+1
our study uses a Cox survival model sometimes called a Cox proportional hazard model but it is
ldquolocalrdquo only in the sense that (absent the intervention) the baseline survival model is invariant
around the cut-point and we estimate the treatment effect from a unit shift There exists an
extensive methodological literature on survival models (Lancaster 1990 Kalbfleisch amp Prentice
2002 Hosmer Lemeshow amp May 2008) which are frequently applied in studies of criminal
recidivism where time-at-risk is often censored A separate study justifies using the proportional
hazard model (rather than a parametric alternative) to study recidivism in the federal system
(Rhodes et al 2012) Although the approach seems uncommon others have used survival models as
the estimator in a RDD context (Rhodes amp Jalbert 2013 Bor Moscoe Mutevedzi Newell amp
Barnighausem 2014) We use the RDD identification strategy and the survival model estimation
strategy to identify and estimate the change in the hazard of recidivism across paired guideline cells
The most defensible approach consistent with the intuition of the RDD would seem to be to
compare the relative hazards for cell j and j+1 (holding criminal history category constant) because
offenders in cells j and j+1 are more alike than in any other comparison Both the previous discussion
and descriptive statistics discussed subsequently points toward a problem Cells j and j+1 are so
27
The Relationship between Prison Length of Stay and Recidivism -- This report was prepared by Abt Associates using Federal funding provided by the Bureau of Justice Statistics (BJS) Opinions andor points of view expressed are those of the author(s) and do not necessarily reflect the official position or policies of the US Department of Justice
alike the average time-served is not guaranteed to increase when comparing cell j to cell j+111 Even
when it increases the size of the increase may be so small that it is not informative As an extreme
example there is not much use in comparing recidivism for offenders who serve two years on
average when sentenced within cell j and two years plus one day on average when sentenced within
cell j+1 From experimentation to assure that average time served will increase between contrasted
cells we have found it better to compare the outcome from cell j and cell j+212 Notwithstanding
what was written above most of the analysis is based on that jj+2 comparison but we do offer
sensitivity tests that employ the original jj+1 comparison An alternative approach is to combine
cells j and j-1 and compare that with the combined cells j+1 and j+2 (This is equivalent to expanding
the bandwidth) However this alternative approach seems to offer no advantages and introduces
some difficult estimation problems (serial correlation and general model specification issues) when
combining multiple effects so we avoid its application
Because this identificationestimation strategy results in many hazard estimates (potentially
41x6) we use techniques familiar from meta-analysis to combine estimates (effects) into summary
statistics A useful explanation of a fixed-effect meta-regression is Rhodes (2012) For example for
the first criminal history category there are potentially 41 effects We estimate a weighted least-
squares linear regression to estimate the average of the 41 effects Because there are 6 criminal
history categories we repeat the meta-regression across the 6 criminal history categories and then
average the 6 meta-regression averages to derive a single inverse variance weighted estimate and
11 Especially for drug-law violations and weapons offenses federal statutes require application of mandatory minimum sentences Regardless of guideline recommendations judges cannot sentence below the mandatory minimums Because mandatory minimums are not evenly distributed across the offense seriousness levels it is possible for the average terms in cell j to be larger than the average terms in cell j+1
12 Across the six criminal history categories the average percent change in time-served between cells j and j+1 ranges from 9 to 18 with the change being largest for criminal history category 1 In comparison across the six criminal history categories the average percent change in time-served between cells j and j+1 ranges from 20 to 38 with the change being largest for criminal history category 1
28
The Relationship between Prison Length of Stay and Recidivism -- This report was prepared by Abt Associates using Federal funding provided by the Bureau of Justice Statistics (BJS) Opinions andor points of view expressed are those of the author(s) and do not necessarily reflect the official position or policies of the US Department of Justice
test statistic Thus although there are many estimates there is only one test statistics and hence no
multiple comparison problem
For reasons explained below when applying the meta-regression we must deal with error
terms that may be auto-correlated and heteroscedastic We will show that heteroscedasticity is a
major problem and to deal with it we used weighted least squares Because we compare cells j with
j+2 j+1 with j+3 j+2 with j+4 and so on we potentially introduce autocorrelation across the
estimates The jj+2 and j+2j+4 comparisons are not independent because they have j+2 in common
This problem has corrections (Prais-Winston estimators for example) but they are suspect in small
samples where ignoring the problem is likely better than attempting to introduce a feasible
generalized least squares solution (Greene 2008 p 648) This follows because small samples provide
inaccurate estimates for the autocorrelation coefficient We concentrate on the heteroscedasticity
problem however we provide a sensitivity test suggesting that autocorrelation can safely be
ignored
The meta-regression provides the average effect of moving from guidelines cell j to cell j+2
This is an intent-to-treat estimator If this movement were not statistically significant we would
conclude that increasing prison terms has no effect on criminal recidivism If the average effect is
statistically significant by itself it does not provide LATE the size of the effect resulting from a unit
increase in prison time Our approach is to report the size of the average effect when moving from
cell j to j+2 the average increase in the length of the prison term when moving from cell j to j+2 and
the ratio of the two The ratio is essentially the LATE
A more direct approach which requires the same assumptions as were applied above is to
apply an instrumental variable (IV) estimator where the shift from guideline cell j to j+2 is the
instrument That is offenders in cell j+2 are not inherently more or less recidivistic than are
29
The Relationship between Prison Length of Stay and Recidivism -- This report was prepared by Abt Associates using Federal funding provided by the Bureau of Justice Statistics (BJS) Opinions andor points of view expressed are those of the author(s) and do not necessarily reflect the official position or policies of the US Department of Justice
offenders in cell j but the longer average sentences served by offenders in cell j+2 cause those
offenders to recidivate at a greater or lesser rate than offenders in cell j Instead of a dummy
variable representing membership in cell j or j+2 the important right-hand-side variables is the
average time-served by offenders in cell j and j+213 That is the treatment variable takes one of two
values the average time-served by offenders in cell j (when the observation belongs to cell j) or the
average time-served by offenders in cell j+2 (when the observation belongs to cell j+2) The
advantage of this approach is that parameter estimates have the interpretation of ldquochange in the
relative hazard per additional month of time servedrdquo The disadvantage is that IV estimators lack
desirable asymptotic properties (that is they are biased even in large samples) when applied to a
non-linear model and the Cox regression is a non-linear model (Rhodes 2010) Nevertheless we
expect estimates to be approximate and worth comparing with the RDD estimates
RESULTS
This section has two parts The first part provides descriptive statistics and justification for
deleting cases from the analyses The second section provides estimates of the effect of increasing
time-served on recidivism using the RDD and IV approaches it also provides sensitivity tests for case
deletion and other analytic decisions
DESCRIPTIVE STATISTICS AND RULES FOR DELETING CASES
Table 1 reports the number of offenders available for the analysis before we add restrictions
To be included in this table an offender must meet three criteria First he or she must have been
sentenced under the guidelines because guidelines calculations are used in the analysis Second he
13 This is a two-stage estimation model The first-stage involves a regression of time-served on dummy variables representing the adjacent guideline cells But this regression will simply provide the mean time-served in each cell so we do not actually perform the regression
30
The Relationship between Prison Length of Stay and Recidivism -- This report was prepared by Abt Associates using Federal funding provided by the Bureau of Justice Statistics (BJS) Opinions andor points of view expressed are those of the author(s) and do not necessarily reflect the official position or policies of the US Department of Justice
or she must be a US citizen We cannot follow recidivism by deported offenders And third he or
she must have entered active community supervision following sentencing ndash either probation or a
term of supervised release ndash because active supervision initiates the time at risk of recidivism This
third criterion has two implications If an offender never entered active community supervision that
offender would not appear in the analysis Specifically if an offender was sentenced to prison and
remained in prison as of September 30 2014 that offender would not appear in the analysis Thus
offenders sentenced to long prison terms and especially offenders sentenced toward the end of the
data collection window are more likely to be excluded than are other offenders This systematic
selection will not bias the RDD estimates because any selection bias will be equally applicable to cell j
and cell j+2 That is the RDD implicitly adjusts for the selection bias
Insert Table 1 about here
Shading identifies cells with fewer than 100 observations Although data for the most and
least serious offense levels are sparse the sample sizes for the other cells are ample an important
point because the RDD approach holds criminal history category constant and compares outcomes
for offense serious levels j and j+2 Notice that about half the offenders fall into criminal history
category 1 and given that these are relatively inexperienced offenders a reader might put more
subjective weight on the analysis of offenders in this criminal history category To be included in the
principal analysis a cell must have 100 or more offenders Stripped of some other statistical issues
basically the RDD approach requires a comparison of the mean recidivism rates for cells j and j+2
Because the sampling variance for estimated difference in outcomes between offense seriousness
levels j and j+2 is inversely proportional to the number of offenders in cells j and j+2 setting a
minimum number of observations increases the average precision of estimated effects for those cells
31
The Relationship between Prison Length of Stay and Recidivism -- This report was prepared by Abt Associates using Federal funding provided by the Bureau of Justice Statistics (BJS) Opinions andor points of view expressed are those of the author(s) and do not necessarily reflect the official position or policies of the US Department of Justice
retained in the analysis but we will present sensitivity analyses of the 100-offender criterion
showing the analysis appears insensitive to this criterion
Using the same data applied to produce Table 1 Table 2 reports the percentage of offenders
who receive prison terms by guidelines cell Shading denotes that fewer than 50 of offenders
within a cell are sentenced to prison Prison is often imposed for federal crimes but sentencing
guidelines (and hence this table) are only mandatory for felonies and serious misdemeanors
Additionally many federal crimes are dual jurisdiction offenses and generally the most serious
crimes are prosecuted in federal court while the least serious crimes are prosecuted in state courts
These factors explain why prison terms are so frequent in these data Still prison is infrequent for
offenders convicted of the least serious crimes provided they lack serious criminal records For a cell
to be included in the principal analysis at least 50 of offenders in that cell must have received
prison terms Justification is that for estimating effects the effective sample size is proportional to
the number in the cell multiplied by the percentage sentenced to prison because probation
sentences count as zero for these calculations (Offenders sentenced to straight probation are
assigned prison terms of length zero) However we will provide sensitivity testing of this selection
criterion showing that findings are insensitive to the criterion
Insert Table 2 about here
Inspection of Table 2 shows some irregularities in the progression of sentence severity
especially for the least serious offense levels but the general pattern is that prison terms become
increasingly certain as we look down the table (from least to most serious crimes) and across the
table (from least to most serious offenders) Inspection of Table 3 which reports average time-
served (counting probation as zero) also shows some irregularities but the general pattern is that
32
The Relationship between Prison Length of Stay and Recidivism -- This report was prepared by Abt Associates using Federal funding provided by the Bureau of Justice Statistics (BJS) Opinions andor points of view expressed are those of the author(s) and do not necessarily reflect the official position or policies of the US Department of Justice
average time-served in prison increases as we look down the table (from least to most serious
crimes) and across the table (from least to most serious offenders)
The irregularities cause a problem for the RDD If the RDD compared cells j with j+1 for a
RDD strategy to work we must observe a substantial increase in the average time in prison as we
compare cell j with cell j+1 Logically small changes fail to create a credible contrast Looking
especially at Table 3 several cell j and j+1 contrasts fail to meet this criterion The problem is that
moving from cell j to cell j+1 is a subtle shift and we find a better comparison to be between cell j
and j+2 This is the reason for using a jj+2 comparison instead of a jj+1 comparison Although
comparing cells j and j+2 may raise validity issues whatever bias is introduced is likely to be small
and from a mean-squared-error perspective comparing jj+2 instead of jj+1 seems justified
However as a sensitivity test we also report estimates based on a comparison of cells j and j+1 and
qualitative results prove insensitive to whether the comparison is between jj+1 or jj+2
Insert Table 3 about here
One more table is useful for summarizing the recidivism measure Table 4 reports the
percentage of offenders who recidivate during their periods of community supervision These
statistics are right-hand-censored by the length of the time-at-risk and capped at three years They
do not account for censoring due to supervision terms less than three years Although most
offenders avoid returning to prison returning to prison is not an infrequent occurrence At this
descriptive stage of the analysis patterns may seem peculiar Looking down each column recidivism
rates are lower for offenders incarcerated for the most serious crimes and higher for offenders
incarcerated for the least serious crimes Although as description this pattern is correct the effect is
probably not causal It seems likely that offenders who serve the longest terms are older when
released from prison than are offenders who serve the shortest terms and given that age is
33
The Relationship between Prison Length of Stay and Recidivism -- This report was prepared by Abt Associates using Federal funding provided by the Bureau of Justice Statistics (BJS) Opinions andor points of view expressed are those of the author(s) and do not necessarily reflect the official position or policies of the US Department of Justice
predictive of recidivism the patterns may be partly a result of age Reading across the table
recidivism tends to increase with criminal history but small sample sizes for the most serious
criminal history scores may be responsible for imprecise estimates
Insert Table 4 about here
Intended as a summary of the patterns shown by Table 4 Figure 1 presents survival curves
based on Kaplan-Meier estimates stratified by criminal history categories To be included in this
analysis an offender had to be sentenced within a guideline cell with 100 or more offenders and at
least 50 percent of offenders within that cell must have received prison terms Those restrictions are
consistent with the restrictions imposed for the principal analysis presented later However the
figure changes very little when the restrictions are removed In general as the criminal history
category increases so too does the rate of recidivism although the difference between criminal
history categories 5 and 6 is barely perceptible
Insert Figure 1 about here
Table 5 extends the descriptive analysis appearing in Figure 1 to include covariates (The
table reports parameters from a Cox model not relative hazards) The regression is naiumlve in the
sense that it does not account for potential confounding variables that might ndash if known ndash explain
why recidivism falls as the offense severity level (and hence time-served) increases This regression
uses variables that will reappear in the local linear regressions that we use for the RDD analyses
Separate Cox regressions are reported for each criminal history category
Scaled time-served This is estimated time-served rescaled by dividing the original time-served by
the maximum time-served Time-served is capped at 180 months The cap is
inclusive of more than 99 percent of terms
34
The Relationship between Prison Length of Stay and Recidivism -- This report was prepared by Abt Associates using Federal funding provided by the Bureau of Justice Statistics (BJS) Opinions andor points of view expressed are those of the author(s) and do not necessarily reflect the official position or policies of the US Department of Justice
Time-served squared This is the square of scaled time-served
Scaled age This is the offender age at the time that he or she entered community
supervision rescaled to run from 0 to 1
Age squared This is scaled age squared
Female This is a dummy variable for female
Black This is a dummy variable for Black
Other race This is a dummy variable for race other than White or Black
Hispanic This is a dummy variable for Hispanic ethnicity It is not collinear with the
race variables
High school This is a dummy variable indicating the offender has a high school degree or
equivalent
Advanced degree This is a dummy variable indicating the offender has a degree beyond high
school
Lives alone This is a dummy variable indicating the offender is neither married nor living
in a common law relationship at the time of sentencing
Centered CH points The guidelines assign criminal history points based on criminal records that
are collapsed into the six criminal history categories The criminal history
points are centered to have a mean of zero for each guideline cell
District This is the judicial district where the sentence was imposed There are 94
federal districts including those in territories District enters the analysis
35
The Relationship between Prison Length of Stay and Recidivism -- This report was prepared by Abt Associates using Federal funding provided by the Bureau of Justice Statistics (BJS) Opinions andor points of view expressed are those of the author(s) and do not necessarily reflect the official position or policies of the US Department of Justice
when estimating the frailty parameter that is as a random effect associated
with the Cox model
Because they run from zero to one scaled variables are useful for interpreting quadratics
The centered criminal history points provide a more refined measure of criminal record beyond the
broader criminal history category Centering this score is unimportant for the results presented in
Table 5 but centering is useful for later analyses
Insert Table 5 about here
As description the estimates appearing in Table 5 tell a simple story As best as a quadratic
can capture the pattern recidivism falls as time-served increases after accounting for the criminal
history category The declines are substantial and tend to be greater (but not consistently) for those
with minor criminal records (category 1) than for those with serious criminal records (categories 2-6
exclusive of 5) As an illustration when time-served changes from 30 months to 60 months the
relative hazards from criminal history 1 to criminal history 6 are 081 074 072 075 081 and 077
respectively14
Except regarding age other parameters are less interesting for this current study because
they tell us nothing about how recidivism changes with time-served (Women are less recidivistic
than men Blacks and other races are more recidivistic than Whites Hispanics tend to be less
recidivistic than non-Hispanics The educated are less recidivistic than the under-educated Marital
association appears to have no predictive effect The relative importance of these covariates
appears to decrease as criminal history increases) The inverse relationship between recidivism and
2
180
3060
180180 180
60 3014 For example the relative hazard for criminal history category 1 equals exp 1707
0941
minus+minusminus
2
36
The Relationship between Prison Length of Stay and Recidivism -- This report was prepared by Abt Associates using Federal funding provided by the Bureau of Justice Statistics (BJS) Opinions andor points of view expressed are those of the author(s) and do not necessarily reflect the official position or policies of the US Department of Justice
time-served cannot be explained by age If we were to accept results from this naiumlve regression we
would conclude that longer prison terms cause recidivism to fall dramatically (up to 28 percent for a
30-month increase) but we are reluctant to attach causality to these regression results because we
cannot be sure that all confounding factors have been considered Hence we turn to the RDD
The results reported in Table 5 suggest that marital status does not predict recidivism
Because this variable is frequently missing we drop it from the following analysis The ethnic status
Hispanic sometimes predicts recidivism but the effect is not large and this variable is often missing
Consequently we also drop the ethnic category Hispanic from the following analysis
ESTIMATES OF THE EFFECT THAT INCREASING TIME-SERVED HAS ON
RECIDIVISM
The previous section described data sources and gross patterns in those data This section
presents evidence based on a regression discontinuity design For every jj+2 contrast we compute
a unique effect as a log-relative hazard Potentially this leads to 6x41 effects because there are 41
possible contrasts within each criminal history category and there are 6 criminal history categories
In fact we produce fewer estimates because data selection rules exclude some of the contrasts The
number entering the analysis depends on the sensitivity tests but 175 contrasts appear in the
principal analysis
For each contrast between cells j and j+2 we estimate a Cox survival model15 The effect size
is the parameter associated with a dummy variable coded 1 for cell j+2 and coded zero for cell j The
15 By default we estimated a Cox model with covariates and shared frailty the covariates and criterion for the shared frailty are described in the text Sometimes to estimate the model we removed the shared frailty parameter in which case we estimated the relative hazard using the covariates but not the shared frailty given the RDD the relative hazard is still
37
The Relationship between Prison Length of Stay and Recidivism -- This report was prepared by Abt Associates using Federal funding provided by the Bureau of Justice Statistics (BJS) Opinions andor points of view expressed are those of the author(s) and do not necessarily reflect the official position or policies of the US Department of Justice
outcome measure is returning to prison following placement on community supervision or being
revoked from supervision (When an offender enters community supervision multiple times we only
include the first period of supervision in the analysis) Time at risk is censored by the end of the
study period or by the end of community supervision or at three years if supervision is ongoing after
three years Censoring by the end of community supervision is important because thereafter an
offender cannot return to federal prison unless he or she is convicted of a new federal crime
Fundamentally once an offender successfully completes his term of community supervision the FJSP
no longer tracks his criminality so the study cannot extend beyond the end of community
supervision Occasionally an offender may serve his entire sentence and then commit a new federal
crime Although he or she would reappear in the FJSP we only consider the first conviction
When applying a RDD identification strategy researchers are careful to justify that two
conditions hold Translated into the current setting where we compare outcomes in cell j and j+2
the two conditions are (1) on average time-served in cell j+2 must be greater than time-served in
cell j (2) There must be no other differences between offenders in cells j and j+2 that could account
for differences in recidivism In practice this second condition is difficult to establish By
construction of the guidelines and given the fact that we compare cells j and j+2 along the offense
seriousness dimension and never along the criminal history dimension we are confident this
condition holds Nevertheless an indirect empirical test is whether the guidelines cause offenders in
cell j+2 to look systematically different than offenders in cell j This is testable
By the design of the guidelines we anticipate that variables sometimes associated with
recidivism will have about the same mean values in cell j as in cell j+2 Of course we expect time-
consistent Sometimes to estimate the model we removed both shared frailty and the covariates in which case we estimated the relative hazard with just an indication the data came from cell j rather than j+2 Again given the RDD the estimate of relative hazard is consistent but not efficient If we could not estimate the relative hazard the estimate is reported as missing
38
The Relationship between Prison Length of Stay and Recidivism -- This report was prepared by Abt Associates using Federal funding provided by the Bureau of Justice Statistics (BJS) Opinions andor points of view expressed are those of the author(s) and do not necessarily reflect the official position or policies of the US Department of Justice
served to differ between cell j and cell j+2 and it does by 54 months on average (Plt001) If this
difference were not large there would be little point to the analysis
On average other variables do not change significantly between cell j and j+2 16 We tested
the following variables date of birth educational attainment sex race Hispanic status marital
status date when sentenced and criminal history point score The differences were small and none
approached statistical significance The results for criminal history point score seem especially
important because we consider this variable to be highly correlated with recidivism The fact that
the criminal history point score does not change systematically from cell j to j+2 suggests that
offenders in cell j+2 are not inherently more or less recidivistic than are offenders in cell j Therefore
the data pass this diagnostic test
While the inclusion of covariates may be unnecessary for identification including covariates
in the Cox regression is expected to reduce residual variance and improve the precision of the
estimates As noted the principal variable is a dummy variable coded one if the observation is from
cell j+2 and coded zero if from cell j Other covariates with the noted exceptions are the same as
were used in the naiumlve regression Obviously we have also excluded the scaled time-served variable
and its square Because there are 41x6 possible regressions (175 in this main application) we do not
show the regression results from this stage of the analysis Instead we report the single parameter of
interest (the average effect) for each regression in graphical form
Within each criminal history category the Cox model estimates the hazard of recidivism for
offenders in category j+2 relative to offenders in category j holding covariates constant Using the
16 The change is computed for every jj+2 pair The statistics reported in the texts are a weighted average of those pair comparisons Weights equal the inverse of the sampling variances Because of the distribution of offenses within the guidelines the least serious criminal history categories and the middle of the offense seriousness range dominate the calculations Arguably the estimates are not independent so standard errors are suspect Nevertheless the estimates of differences between cells j and j+2 are not biased and these average differences are small
39
The Relationship between Prison Length of Stay and Recidivism -- This report was prepared by Abt Associates using Federal funding provided by the Bureau of Justice Statistics (BJS) Opinions andor points of view expressed are those of the author(s) and do not necessarily reflect the official position or policies of the US Department of Justice
log-relative hazard (eg the parameter that is exponentiated to get the relative hazard) the next step
is to estimate a regression where the estimated log-relative hazard is the dependent variable and the
independent variable is the centered offense seriousness level This is the meta-regression It is
specific to a criminal history category so there are six meta-regressions This specification allows us
to examine how the log-relative hazard varies over the offense seriousness levels That is the
regressions allow us to combine effects (our main motivation) and test for heterogeneity (a
secondary motivation)
Effects may be heterogeneous across offense seriousness levels for two reasons For one
offenders convicted of the most serious crimes who serve the longest prison terms may respond
differently to incremental increases in the lengths of their terms than do offenders convicted of the
least serious crimes who serve the shortest prison terms For another for offenders convicted of
the most serious crimes the incremental change in the length of a prison term from cell j to j+2 is
much larger than the incremental change for offenders convicted of the least serious crimes (See
Table 3) Heterogeneity in treatment effects seems likely but how that heterogeneity varies with
offense severity level is uncertain Examining Tables 1-3 recalling the selection rules and recalling
that we are using weighted least squares regression to estimate the heterogeneity information used
by the regression comes mostly from the middle offense seriousness levels so incremental changes
to time-served are fairly constant Quite possibly there is heterogeneity but we will have insufficient
power to detect it
As before the analysis is stratified on the criminal history category so for each regression
there are potentially 41 data points but many fewer (29 to 37 in the main analysis) enter the meta-
regression because of selection criteria identified earlier Referring to Tables 1 and 2 almost all the
lost contrasts come from having too few cases per cell or from having a low proportion of prison
40
The Relationship between Prison Length of Stay and Recidivism -- This report was prepared by Abt Associates using Federal funding provided by the Bureau of Justice Statistics (BJS) Opinions andor points of view expressed are those of the author(s) and do not necessarily reflect the official position or policies of the US Department of Justice
terms per cell referring to Table 3 few cells (and hence contrasts) are lost because average prison
terms do not increase from cell j to j+2 Because the RDD identifies the effect the right-hand-side
variables are not control variables rather the meta-regression is a descriptive device (with statistical
implications) helping us to detect possible patterns
Estimation has multiple steps We summarize with an algorithm
1 Select all offenders from criminal history category k = 1
a Select all offenders with offense seriousness levels j = 1 and j = 3 If the jj+2 contrast
does not meet selection criteria increase j by 1 and try again
b It the jj+2 contrast meets the selection criteria estimate a Cox regression where a
dummy variable is coded 1 for offenders in offense seriousness level j+2 and coded 0
for offenders in offense seriousness level j The parameter associated with this
dummy variable is the log-relative hazard for the jj+2 contrast Save this estimate
c Increase j by 1 and repeat steps a-c until j = 41
d Estimate a meta-regression where the dependent variable is the log-relative hazards
from steps a-c The independent variables are a constant and the centered offense
seriousness level equal to j+2 for the jj+2 contrast Save the estimated constant and
its standard error for use in step 3
2 Repeat steps 1a-d for criminal history categories 1-6 This leads to six estimated constants
and six estimated standard errors for step 3
3 For step 3 create weights proportional to the inverse of the squares of the six standard
errors The final estimate is the weighted average of the six estimated constants This is
interpreted as the average log-relative hazard Results are discussed below
41
The Relationship between Prison Length of Stay and Recidivism -- This report was prepared by Abt Associates using Federal funding provided by the Bureau of Justice Statistics (BJS) Opinions andor points of view expressed are those of the author(s) and do not necessarily reflect the official position or policies of the US Department of Justice
MAIN RESULTS
The main model adopts the following selection criteria
bull For a guideline cell to be included in the analysis 100 or more offenders must appear within that cell
bull For a guideline cell to be included in the analysis 50 or more of offenders must have received prison terms
Comparisons are of outcomes in cell j+2 and cell j
The main results are shown in Figure 2 The figure shows patterns in the relative hazards and
associated statistics The figure has six panels one for each of the criminal history categories
Within each panel the vertical axis is the scale for the relative hazard as estimated by the Cox model
A hazard equal to 1 implies that increasing prison time has a neutral effect on recidivism A hazard
greater than 1 implies that increasing prison time increases recidivism a hazard less than 1 implies
that increasing prison time decreases recidivism The horizontal axis corresponds to the contrast
The offense seriousness level of 3 is the contrast between offense seriousness levels 1 and 3 the
offense seriousness level of 4 is the contrast between levels 2 and 4 and so on until level 43 Within
each panel the dots report the relative hazards as estimated using the Cox model When we could
not estimate the relative hazard because of the cell exclusion criteria the point is missing The
vertical lines surrounding the dots are 95 confidence intervals for the relative hazards They are
non-symmetric and when the confidence interval extends above 25 it is truncated at 25 for
improved resolution of the figures The three lines running left to right come from the regression
the straight line shows the prediction and the curved lines represent a 95 confidence interval for
the regression line ndash not to be confused with a 95 confidence interval for a predicted point
explaining why many points fall outside the confidence interval for the regression
Insert Figure 2 about here
42
The Relationship between Prison Length of Stay and Recidivism -- This report was prepared by Abt Associates using Federal funding provided by the Bureau of Justice Statistics (BJS) Opinions andor points of view expressed are those of the author(s) and do not necessarily reflect the official position or policies of the US Department of Justice
The table below the figure shows associated statistics from the meta-regression Recall the
dependent variable is the parameter associated with the log-relative hazard ndash that is the natural
logarithm of the relative hazard The row specified as ldquolinearrdquo identifies the centered offense
severity level variable entering the weighted least squares meta-regression The simple regression
specification has a constant and a term that is linear in the centered offense severity level Because
the estimator is weighted least squares and given the offense severity level is centered the constant
is the weighted average effect across the contrasts It is our principal interest R2 has its usual
interpretation but note that any ldquoexplained variancerdquo is attributable to the linear trend because we
are most interested in the constant R2 is not an especially important statistic and certainly has no
interpretation as the ldquogoodness of fitrdquo for our purposes because the constant does not contribute to
R2 At a maximum the regression would be based on 41 observations (N in the table) but fewer data
points enter the analysis because (as already discussed) we discarded contrasts that failed to meet
predetermined criteria
The table below the figure requires some additional explanation Recall the right-hand-side
variable was centered so the constant can be interpreted as an average A constant of zero is
neutral implying that on average additional prison time neither increases nor decreases recidivism
A positive constant implies that additional prison time increases recidivism a negative constant
implies that additional prison time decreases recidivism Converting these constants into a hazard
metric just requires exponentiation Letting α be the constant exp(α) is the relative hazard Letting
σ2 represent the constantrsquos estimated sampling variance by the delta rule the estimated sampling
variance for the hazard is exp(α)2 σ2 These transformations are employed when drawing Figure 2
Examining the table below Figure 2 the constant is negative and statistically significant in all
six regressions On average the estimated constant equals -0073 and is statistically significant with a
43
The Relationship between Prison Length of Stay and Recidivism -- This report was prepared by Abt Associates using Federal funding provided by the Bureau of Justice Statistics (BJS) Opinions andor points of view expressed are those of the author(s) and do not necessarily reflect the official position or policies of the US Department of Justice
standard error of 0007 The implied hazard is 0930 These are the inverse-variance weighted
estimates across the six criminal history categories The linear slopes have mixed signs and are never
statistically significant so we detect no heterogeneity
We must be caution about this interpretation Suppose as suggested by the evidence the
relative hazards are the same for all criminal history categories Looking at table 3 the average
increase in time-served for a move from cell j to j+2 is about 7 months for criminal history category 1
and about 10 months for criminal history category 6 Thus a somewhat larger increase in time-
served for more serious criminal history categories achieves about the same effect as a somewhat
smaller increase in time-served for less serious criminal history categories This might be taken as
some evidence of criminal history heterogeneity but if so the evidence is not especially compelling
Outliers are a potential concern in Figure 2 However when an outlier appears it is
associated with a high standard error and plays a small role in the weighted least squares regression
Therefore we conclude that outliers are not a practical concern
On average the estimated relative hazard that results from moving from cell j to cell j+2 is
0930 Qualitatively a relative hazard less than 1 implies that a longer prison term decreases
recidivism but translating this relative hazard into a quantitative decrease in the probability of
recidivism is complicated because the decrease in the probability of recidivism varies across the jj+2
comparisons A descriptive summary provides some intuition
First continue to consider the relative hazard as a metric On average across the severity
levels and the criminal history categories moving from cell j to cell j+2 increases time-served by
about 27 (On average this 27 change equals about 54 months) This is to say that a 27
increase in the length of incarceration appears to reduce the instantaneous probability of recidivism
(eg the hazard) by less than 10 percent For readers who are familiar with interpreting hazards a
44
The Relationship between Prison Length of Stay and Recidivism -- This report was prepared by Abt Associates using Federal funding provided by the Bureau of Justice Statistics (BJS) Opinions andor points of view expressed are those of the author(s) and do not necessarily reflect the official position or policies of the US Department of Justice
sizable increase in prison time (namely a 27 increase on average) has a fairly small decrease in the
relative hazard (by a multiple of 0930) Admittedly the descriptive term fairly small is subjective
and a reader can make his or her own subjective assessment
A change in the instantaneous probability of recidivism ndash the relative hazard ndash is not the
same as a change in the probability of recidivism Second then consider the probability of
recidivism as a metric We can get a sense of how a change in the relative hazard affects the
probability of recidivism Because we are using the Cox model the probability of recidivism equals
one minus the baseline survival rate to the power of the relative hazard (Hosmer Lemeshow amp May
2008 p 72) For our data the probability of recidivism is about 02 within three years (See figure
1) The relative hazard is about 0930 So a 27 increase in the length of incarceration would
decrease the probability of recidivism by about 02 ndash (1-080930) That is from a base rate of
recidivism of about 20 a 27 increase in prison time would cause recidivism to fall to about 187
Readers can draw their own conclusions but our sense is the effect is not large and that prison
length of stay has a largely neutral effect on recidivism
Once again some caution is merited If we again accept the relative hazards are about the
same across the six criminal history categories figure 1 shows the baseline rates of recidivism are
progressively higher as the criminal history category increases from k=1 to k=6 so the percentage
change in recidivism is larger for more serious criminal history categories than for the lesser criminal
history categories This might be deemed heterogeneity ndash that increasing time-served has a larger
effect on the most serious offenders We are reluctant to accept such a conclusion because it comes
from accepting the null hypothesis of constant relative hazards across the criminal history categories
More likely if such heterogeneity exists we have too little power to detect its effect
45
The Relationship between Prison Length of Stay and Recidivism -- This report was prepared by Abt Associates using Federal funding provided by the Bureau of Justice Statistics (BJS) Opinions andor points of view expressed are those of the author(s) and do not necessarily reflect the official position or policies of the US Department of Justice
It is possible to stratify the analysis by sex by race and by education ndash variables described
earlier Cell sizes get small so we restrict the analysis to offenders in criminal history category 1 and
we require a minimum of 50 offenders per cell rather than 100 For men the relative hazard is
0935 and for women it is 0931 but these differences are not statistically significant so we fail to
reject the null that prison length has the same effect on men and on women For white offenders
the relative hazard is 0936 and for black offenders the relative hazard is 0932 and the difference is
not statistically significant so we fail to reject the null that prison length has the same effect on
white and black offenders For offenders who lack high school degrees the relative hazard is 0930
and for offenders who have high school degrees the relative hazard is 0933 The difference is not
statistically significance This test based on education is not as sensitive as desired because most
offenders have high school degrees or the equivalent Overall we do not find strong evidence the
effect of time-served on recidivism is sensitive to sex race or education
We observed that an IV estimator should lead to estimates that are like the RDD estimates
We demonstrate that here The only difference between the IV and RDD approaches is that for the
IV approach the treatment variable is the mean time-served in cell j+2 or j and for the RDD
approach the treatment variable is a dummy variable denoting sentencing in cell j+2 rather than cell
j17 Interpretations differ For the IV approach the treatment effect is the change in recidivism per
month of additional time-served for the RDD approach the treatment effect is the change in
recidivism from being sentenced in cell j+2 rather than cell j These differences are scale effects we
do not expect then to change substantive interpretations
17 Instrumental variable estimation often uses a two-step approach In the first step the treatment variable (here the time served) is regressed on the instrument (and perhaps some additional variables) to predict the treatment (or in our case the average time-served) In the second step the average time-served replaces the observed time-served We compute average time-served without using the first-step regression
46
The Relationship between Prison Length of Stay and Recidivism -- This report was prepared by Abt Associates using Federal funding provided by the Bureau of Justice Statistics (BJS) Opinions andor points of view expressed are those of the author(s) and do not necessarily reflect the official position or policies of the US Department of Justice
Figure 3 reports results from the IV estimation Across the six criminal history categories the
weighted average effect size is -00122 which is statistically significant at P lt 001 While this effect
seems much smaller than the effect based on the RDD when we multiple by the average increase in
time-served between cell j and j+2 the rescaled effect is -0066 and relative hazard of a 54 month
increase in the sentence is 0936 There is no material difference between the RDD estimator and
the RDD estimator
Insert Figure 3 about here
SENSITIVITY TESTING
We conducted sensitivity tests evaluating whether the effect of length of stay on recidivism
depends on constraints we applied to produce the results shown in Figure 2 and its associated table
Minimum Cell Size of 50 instead of 100 - Figure 4 A first step in sensitivity testing is to learn
whether requiring a minimum of 50 cases instead of 100 cases per cell changes findings The
advantage to relaxing this assumption is that we gain a few data points The disadvantage is that
some of those new data points have extreme values As before the constant is always negative and
statistically significant The weighted average is -0073 with a standard error of 0007 and the
implied relative hazard is 0930 Because we use weighted least squares results do not change much
from those reported for the main model despite the expansion of sample size estimates with large
standard errors do not contribute much to the regression
Insert Figure 4 about here
Minimum cell size of 150 instead of 100 ndash Figure 5 If we set a criterion of 150 cases per cell instead
of 100 we lose a few data points The constant remains negative and statistically significant across
the six criminal history categories Overall the average constant is -0071 (with a standard error
47
The Relationship between Prison Length of Stay and Recidivism -- This report was prepared by Abt Associates using Federal funding provided by the Bureau of Justice Statistics (BJS) Opinions andor points of view expressed are those of the author(s) and do not necessarily reflect the official position or policies of the US Department of Justice
0008) and the corresponding relative hazard is 0931 Apparently the findings are insensitive to the
criterion for cases per cell because the weighted least squares analysis is dominated by calculations
that are based on large cell sizes For the remaining sensitivity tests we set the minimum cell size to
100
Insert Figure 5 about here
Minimum percentage of prison terms 75 instead of 50 - Figure 6 The next sensitivity test
changes the criterion for minimum percentage of prison terms to be 75 within a cell rather than
50 within a cell As expected some cells are excluded from the analysis but as before the
substantive findings do not much change The average affect is -0077 with standard error of 0009
The increased standard error is understandable Given the RDD basically calls for a difference in
mean estimates between cells j and j+2 (conditional on covariates) the effective sample size for
computing variances is the number of offenders within a cell multiplied by the proportion who are
sentenced to prison Cells with high proportions of offenders serving probation terms have high
sampling variances for two reasons (1) The effective sample size is smaller than the apparent sample
size based on the number of offenders within a cell (2) The average difference in time-served
between cells j and j+2 tends to be small (so the effect is small and has high sampling variance) for
those cells where probation is especially likely Consequently given the regressions use weights that
are inversely proportional to the sampling variance the estimates are insensitive to the criterion
establishing a minimum proportion of offenders sentenced to prison
Insert Figure 6 about here
Contrasts that are j and j+1 instead of j and j+2 ndash Figure 7 We believe that contrasts observed by
comparing cells j and j+2 are more appropriate for this analysis than contrasts observed by
comparing cells j and j+1 because the contrast between j and j+2 provides assurance that average
48
The Relationship between Prison Length of Stay and Recidivism -- This report was prepared by Abt Associates using Federal funding provided by the Bureau of Justice Statistics (BJS) Opinions andor points of view expressed are those of the author(s) and do not necessarily reflect the official position or policies of the US Department of Justice
prison terms increase by a substantial amount This assurance is not forthcoming when comparing
cells j and j+1 Nevertheless increasing the distance between compared cells raises validity
challenges because the RDD rests on an assumption that offenders within both compared cells are
alike in ways that affect recidivism The closer the cells the more justified the assumption For this
sensitivity test we maintain the original criteria for selecting cells but contrast cell j with cell j+1
(We discard contrasts where the average sentence in cell j+1 is less than the average sentence in cell
j) Averaged across the six estimates the estimated constant is -0030 with a standard error of 0013
This is statistically significant at P lt 005 The relative hazard is 0970 While results from the jj+1
contrasts are smaller than those from the jj+2 contrasts this is expected because the jj+2 contrast
results in a larger increase in time-served and consequently a larger effect
Insert Figure 7 about here
Contrasts testing for auto-correlation using the Prais-Winston estimator ndash Figure 8 The analysis
immediately above which changed the comparison from cells jj+2 to cells jj+1 suggests another
sensitivity test Earlier we commented that by construction we may have induced autocorrelation in
the data used for the final step regression For example consider the estimated hazard for cells j and
j+1 and the estimated hazard for cells j+1 and j+2 The estimates have j+1 in common and this may
introduce first-order autocorrelation into the analysis Following recommendations from Greene we
have elected to ignore this complication because commonly used corrections have uncertain small
sample properties However we can test how much the autocorrelation affects the results using a
Prais-Winston estimator a feasible generalized least squares estimator that corrects for first-order
autocorrelation
Insert Figure 8 about here
49
The Relationship between Prison Length of Stay and Recidivism -- This report was prepared by Abt Associates using Federal funding provided by the Bureau of Justice Statistics (BJS) Opinions andor points of view expressed are those of the author(s) and do not necessarily reflect the official position or policies of the US Department of Justice
A problem when using the Prais-Winston estimator is that we cannot simultaneously adjust
for autocorrelation and heteroscedasticity To correct estimated standard errors we can employ a
robust covariance estimator but this is problematic in two ways First without adjusting for
heteroscedasticity during parameter estimation the solution is inefficient because the data points
with large standard errors receive the same weight as the data points with low standard errors
Figure 2 suggests the inefficiency can be large Second the Prais-Winston estimator assumes
homoscedasticity but we know that our data are heteroscedastic To deal with this problem we
adopt restrictions (1) There must be 150 observations per cell and (2) at least 75 of offenders
within any cell must receive prison terms The idea is to minimize heteroscedasticity and we have
already seen that imposing these restrictions has little effect on results Allowing the contrast to be
jj+1 which may cause a one-lag autocorrelation we use a Prais-Winston estimator to estimate the
effects
The sensitivity test is encouraging The estimates for ρ the autocorrelation efficient have
mixed signs We take this wide variation in the estimates of ρ to mean the estimates are imprecise
Apparently provided we restrict estimates to cells with enough offenders we induce modest
autocorrelation and our decision to ignore autocorrelation seems justified Second basing the
results on the Prais-Winston estimator does not make a big difference in the findings The average
value for the constant is -0042 with a standard error of 0008
Separating contrasts into independent sets ndash Tables 6 and 7 Another approach to dealing with
autocorrelation is straightforward and can be performed with the jj+2 contrasts and both the 100
observations per cell criterion and the 050 prison sentence criterion To explain consider the
contrasts based on cells 13 24 35 46 57 and so on The contrasts 13 and 24 are
independent and the contrast 35 and 46 are independent but the contrasts 13 and 35 are not
50
The Relationship between Prison Length of Stay and Recidivism -- This report was prepared by Abt Associates using Federal funding provided by the Bureau of Justice Statistics (BJS) Opinions andor points of view expressed are those of the author(s) and do not necessarily reflect the official position or policies of the US Department of Justice
independent because they both rely on cell 3 A solution is to break the analysis into two parts In
the first part we use the contrasts 13 24 57 68 and so on in the second part we use the
contrasts 35 46 79 810 and so on For each analysis the effects can be averaged across the
criminal history categories and then across the two analyses For the first analysis the effect is -
0034 with a standard error of 0018 For the second analysis the effect is -0106 with a standard
error of 0030 significant at p lt 001 The average effect is -0067 with a standard error of 0018
Recalling the effect from the main analysis was -0073 with a standard error of 0007 these new
results are very close even though they are based on a different weighting scheme (a result of
running two regressions instead of one) As with the previous test we take this sensitivity test as
evidence that provided we restrict the effective number of observations per cell results are
insensitive to autocorrelation
Insert Table 6 and Table 7 about here
Entering prison as recidivism ndash Figure 9 An additional sensitivity test returns to the original model
specification whose results were presented in Figure 2 and changes the definition of recidivism from
ldquoentering prison or being revoked from community supervisionrdquo to ldquoentering prisonrdquo We are unsure
of the best definition of recidivism but it appears the definition does not much matter The
estimated effects are about the same The log-relative hazard is -0076 with a standard error of
0007 the relative hazard is 0927 The rate of recidivism is about 20 percent using the
comprehensive definition of returning to prison or being revoked and slightly less than 19 percent
when using the more restrictive definition of returning to prison so consistency between the main
results and results from this sensitivity test is not surprising
Insert Figure 9 about here
51
The Relationship between Prison Length of Stay and Recidivism -- This report was prepared by Abt Associates using Federal funding provided by the Bureau of Justice Statistics (BJS) Opinions andor points of view expressed are those of the author(s) and do not necessarily reflect the official position or policies of the US Department of Justice
Eliminating drug law offenders from the analysis ndash Figure 10 A final analysis recognizes that drug
law violations are somewhat peculiar to the federal system High-level drug dealing is often dealt
with in the federal system because cross-border drug dealing is a federal law enforcement
responsibility the federal government has more resources for dealing with high-level drug dealing
than do state governments and even when state and federal authorities collaborate federal
prosecution is typical because federal sentences are more severe18 Judges frequently sentence
high-level drug dealers to Congressionally-mandated mandatory minimums so for high-level drug
dealers the guidelines operate differently than described earlier Another sensitivity test results
from removing drug-law violators from the analysis
Insert Figure 10 about here
With the removal of drug-law violations fewer cells enter the analysis but the parameter estimates
do not change much so qualitative conclusions do not change The average effect is -0060 with a
standard error of 0008 This is statistically significant at plt001 Dropping drug law violators does
not alter conclusions
Eliminating covariates from the analysis ndash Figure 11 Reviewers of an earlier version of this study
wondered if findings based on Cox regressions with no covariates would be the same as findings
based on Cox regressions with covariates After eliminating covariates the weighted average effect
is -0073 with a standard error of 0008 Removing covariates has caused the standard error to
increase by about 10 but has not altered substantive conclusions This is sensible The covariates
were unnecessary for identification but they have the potential to reduce standard errors
18 This assertion is based on the authorsrsquo extensive experience performing program reviews for High Intensity Drug Trafficking Areas multijurisdictional drug task forces with federal state and local participation Our team has visited all 28 HIDTAs over a five-year period The assertion made in the text is based on those visits
52
The Relationship between Prison Length of Stay and Recidivism -- This report was prepared by Abt Associates using Federal funding provided by the Bureau of Justice Statistics (BJS) Opinions andor points of view expressed are those of the author(s) and do not necessarily reflect the official position or policies of the US Department of Justice
Figure 11 about here
Using the Earlier Guidelines ndash Figure 12 Reviewers of an earlier version of this study also observed
that guidelines have changed over the period of this study and expressed concern that these changes
may affect conclusions We doubt these changes matter because cell j+2 has always had longer
terms than cell j Nevertheless in response to reviewersrsquo concerns we identify the mean date for
guidelines entering the analysis and we perform the analysis on just those offenders sentenced
under the guidelines prior to that mean date The effect is ndash 0088 with a standard error of 0009
The relative hazard is 0916 It seems unlikely that changes to the guidelines account for findings
Figure 12 about here
Examining offenders sentenced during the earlier years provides another implicit diagnostic test
Because the analysis is based on offenders who completed their prison terms and were released to
community supervision offenders with high offense seriousness scores or high criminal history
scores and therefore long prison terms are unlikely to enter they analysis when sentenced close to
the data collection period Any resulting bias is lessened by restricting the analysis to offenders
sentenced during the early part of the data collection period If there is a selection bias it does not
appear to be serious
Summarizing the sensitivity testing From the principal analysis the estimated average effect across
the six criminal history categories was -0073 with a standard error of 0007 Provided we contrast
outcomes in cells j and j+2 results do not much change over sensitivity tests and even when we
contrast outcomes in cells j and j+1 results conform with expectations
53
The Relationship between Prison Length of Stay and Recidivism -- This report was prepared by Abt Associates using Federal funding provided by the Bureau of Justice Statistics (BJS) Opinions andor points of view expressed are those of the author(s) and do not necessarily reflect the official position or policies of the US Department of Justice
DISCUSSION
The effect of prison length of stay on recidivism has implications for both theory and policy
From a theoretical perspective incarceration is a potentially transformative event experienced
during an offenderrsquos life course This study provides no evidence that an offenderrsquos criminal
trajectory is negatively affected ndash that is that criminal behavior is accelerated ndash by the length of an
offenderrsquos prison term If anything longer prison terms modestly reduce rates of recidivism beyond
what is attributable to incapacitation This ldquotreatment effectrdquo of a longer period of incarceration is
small The three-year base rate of 20 recidivism is reduced to 187 when prison length of stay
increases by an average of 54 months We are inclined to characterize this as a benign close to
neutral effect on recidivism From a policy perspective prison length of stay can be reduced without
incurring a large increase in recidivism
All observational studies come with validity challenges Still a regression discontinuity
design is a strong quasi-experimental design and we have argued the guidelinesrsquo structure satisfies
the assumptions of an RDD We conducted many sensitivity tests to assess the robustness of the
results The findings require qualification Because of limitations in the bandwidth of an RDD design
we are unable to examine how long prison terms (say five years) affect recidivism relative to
relatively short terms (say two years) The logic of the RDD forces us to compare prison terms of
length L relative to prison terms that are about 27 longer While this is a limitation in the
application of the RDD design it seems unlikely that Congress or the US Sentencing Commission
would reduce terms by a large percentage but not inconceivable that they might reduce prison
terms by a small percentage Thus these findings ndash limited to small changes in prison terms ndash have
implications for sentencing reform
54
The Relationship between Prison Length of Stay and Recidivism -- This report was prepared by Abt Associates using Federal funding provided by the Bureau of Justice Statistics (BJS) Opinions andor points of view expressed are those of the author(s) and do not necessarily reflect the official position or policies of the US Department of Justice
A secondary goal of this research was to examine potential heterogeneity in the effects of
prison length of stay To evaluate heterogeneity we examine whether exogenous covariates
moderate the effect of length of stay Neither offense seriousness nor criminal history moderate the
effect of prison length of stay In the context of federal sentencing these would be two of the most
important potential moderators of prison length of stay The Sentencing Reform Act of 1984
precludes federal judges from using demographic factors in assigning sentences even if these are
empirical moderators of the effect of prison length of stay We also found the effect of time-served
on recidivism was invariant with respect to sex race and education
One class of moderators suggested by Mears Cochran and Cullen (2014) is the level of post-
release supervision In many state jurisdictions a sizable number of offenders are released without
supervision For those released to supervision the level of community control and surveillance is
usually commensurate to risk This source of heterogeneity is limited in the federal context because
everyone receives a term of post-release supervision We censored anyone whose supervision ended
prior to the end of the three-year follow-up period Post-release supervision is also a potential source
of bias as suggested by Roodman but we could eliminate this potential artifact because everyone in
our sample received a term of post-release supervision and they were censored when that term
ended
Some additional caveats are applicable First the results apply to adults Rarely appearing in
federal court juveniles are excluded from the analysis Second we offer no comparison between
adult offenders sentenced to prison rather than probation Third although there is considerable
overlap between federal and state crimes jurisdictional differences cause federal crimes to differ
from state crime counterparts so the relationship between prison terms and recidivism at the state
level may differ from the relationship at the federal level These are important inter-jurisdictional
55
The Relationship between Prison Length of Stay and Recidivism -- This report was prepared by Abt Associates using Federal funding provided by the Bureau of Justice Statistics (BJS) Opinions andor points of view expressed are those of the author(s) and do not necessarily reflect the official position or policies of the US Department of Justice
differences but by removing offenders who were deported or transferred to other authorities we
have made the federal offenders look more like state offenders and when we exclude high-level
drug traffickers results do not much change Furthermore federal jurisdiction is national while
state jurisdictions are local so a study based on national data has a stronger claim to generalizability
It is difficult to see how federal and state crimes are so different that criminologist can disregard
these findings A further limitation of our findings is that they apply only to offenders who receive a
term of community supervision after their release May states have offenders who receive no such
post-release supervision
While some scholars might consider the federal system unique and our results limited to
federal offenders there are many structural differences among states that often preclude
generalizations beyond a specific state as well Even if these findings are not generalizable to state
jurisdictions the federal prison population is about 12 percent of all incarcerated offenders and
represents a significant public policy concern
As we mentioned the RDD framework only allows us to examine relatively small increments
in time-served ndash about 54 months on average Although these are small relative changes these are
not small absolute changes Five additional months in prison is a serious disruption of an offenderrsquos
life and the associated cost savings of a five-month reduction in federal prison length of stay would
save substantial capital and operational costs We make a back-of-the-envelope estimate of potential
savings in prison beds The current average federal prison length of stay for federally sentenced
prisoners is about 35 months A reduction of 5 months in a steady state system would reduce the
prison population over time by 15 percent Given the current Bureau of Prisons inmate population of
195000 a 15 percent reduction would save 29000 beds Under this scenario the BOP could close
prisons rather than simply reduce the prison population in each of its facilities saving both
56
The Relationship between Prison Length of Stay and Recidivism -- This report was prepared by Abt Associates using Federal funding provided by the Bureau of Justice Statistics (BJS) Opinions andor points of view expressed are those of the author(s) and do not necessarily reflect the official position or policies of the US Department of Justice
operational and maintenance costs This back-of-the-envelope calculation shows that small
decrements in length of stay can have large impacts when they are not confined to select subgroups
of offenders
Amplifying this latter point one of the advantages to evaluating prison length of stay is that
any change will have a broad impact on the entire incarcerated population Most contemporary
reforms such as those found in states which implemented the Justice Reinvestment Initiative (JRI)
seek to move the least serious offenders convicted of the least serious crimes from prison to
community corrections (La Vigne et al 2014) Low-level offenders are a very small proportion of
federal prison stocks and based on tabulations from the National Corrections Reporting Program
they are also a small proportion of state prison stocks A policy shift that reduces the length of all
federal prison terms by 27 percent would reduce the federal prison stock by about 29000 inmates
without unduly harming public safety This policy change would have a bigger impact on the federal
prison population than diverting offenders with low offense seriousness and minor or no criminal
history
Prisons are expensive and reducing prison stays has the potential to save public expenditures
(La Vigne et al 2014) Nevertheless advocates of general deterrence and incapacitation might
argue that maintaining or even increasing the length of prison stays is worth the additional expense
and at least increasing prison stays will not make offenders any more criminogenic Nagin et al
(2009) propose a theoretical model that frames these questions distinguishing between high and low
sanction regimes Higher sanction regimes have a higher probability of imprisonment and longer
length of stay than low sanction regimes This model specifies relationships between these relative
regimes the size of the prison populations sizes of the populations with and without a prison record
and the underlying crime rate The model provides a framework for addressing the interrelationship
57
The Relationship between Prison Length of Stay and Recidivism -- This report was prepared by Abt Associates using Federal funding provided by the Bureau of Justice Statistics (BJS) Opinions andor points of view expressed are those of the author(s) and do not necessarily reflect the official position or policies of the US Department of Justice
among these factors without precisely specifying how the outputs change under the low and high
sanction regimes It is straightforward to postulate that high sanction regimes will produce more
people with criminal records however the impact of a high sanction regime on the crime rate is
uncertain High sanction regimes may preclude more crime through general deterrence but may
increase crime if imprisonment is criminogenic not just for the individual but for the prisonerrsquos
family and the community (NRC 2014) The marginal effects and the sizes of the subpopulations
affected will determine the impact on crime rates If we could analyze all the system dynamics of this
model simultaneously we could optimize the level of sanctions to minimize the crime rate In the
absence of such a comprehensive model policy goals should be circumscribed If length of stays
were reduced incrementally it is hard to see how this would have more than a minor effect on crime
through any general deterrent mediated impact and from our results through any criminogenic
impact on the offender
Savings from reduced prison usage can be diverted into evidence-based programs that
reduce offending but such diversion is unlikely as most JRI states have put savings into other non-
justice programs (La Vigne et al 2014) Even if these funds are diverted to other social welfare
programs higher education or other state and local needs we would expect a net social welfare
benefit
58
The Relationship between Prison Length of Stay and Recidivism -- This report was prepared by Abt Associates using Federal funding provided by the Bureau of Justice Statistics (BJS) Opinions andor points of view expressed are those of the author(s) and do not necessarily reflect the official position or policies of the US Department of Justice
REFERENCES
Andrews D A and James Bonta 2006 The Psychology of Criminal Conduct 4th ed Cincinnati Anderson Pub
Andrews D A Ivan Zinger Robert D Hoge James Bonta Paul Gendreau and Francis T Cullen 1990 Does Correctional Treatment Work A Clinically Relevant and Psychologically Informed Meta-Analysis Criminology 28 (3) 369ndash404 doi101111j1745-91251990tb01330x
Angrist Joshua D 2006 Instrumental Variables Methods in Experimental Criminological Research What Why and How Journal of Experimental Criminology 2 (1) 23ndash44 doi101007s11292-005-5126-x
Becker Gary S 1968 Crime and Punishment An Economic Approach Journal of Political Economy 76 (2) 169ndash217 doi101086259394
Berecochea John E and Dorothy R Jaman and Welton A Jones 1981 Time Served in Prison and Parole Outcome - An Experimental Study Report Number 2 Sacramento
Berk Richard 2010 Recent Perspectives on the Regression Discontinuity Design Essay In Handbook of Quantitative Criminology eds Alexis Russell Piquero and David Weisburd New York Springer
Berk Richard A and David Rauma 1983 Capitalizing on Nonrandom Assignment to Treatments A Regression-Discontinuity Evaluation of a Crime-Control Program Journal of the American Statistical Association 78 (381) 21ndash27 doi10108001621459198310477917
Berk Richard A and Jan De Leeuw 1999 An Evaluation of Californias Inmate Classification System Using a Generalized Regression Discontinuity Design Journal of the American Statistical Association 94 (448) 1045ndash52 doi10108001621459199910473857
Berk Richard Geoffrey Barnes Lindsay Ahlman and Ellen Kurtz 2010 When Second Best Is Good Enough A Comparison between a True Experiment and a Regression Discontinuity Quasi-Experiment Journal of Experimental Criminology 6 (2) 191ndash208 doi101007s11292-010-9095-3
Berube Danton and Donald P Green 2007 The Effects of Sentencing on Recidivism Results from a Natural Experiment Ms The Effects of Sentencing on Recidivism Results from a Natural Experiment New Haven
Bloom Howard S 2012 Modern Regression Discontinuity Analysis Journal of Research on Educational Effectiveness 5 (1) 43ndash82 doi101080193457472011578707
Bor J Moscoe E Mutevedzi P Newell M amp Barnighausem T (2014) Regression Discontinuity Designs in Epidemiology Epidemiology 25(5) 729-737
59
The Relationship between Prison Length of Stay and Recidivism -- This report was prepared by Abt Associates using Federal funding provided by the Bureau of Justice Statistics (BJS) Opinions andor points of view expressed are those of the author(s) and do not necessarily reflect the official position or policies of the US Department of Justice
Boshier R and D Johnson 1974 Does Conviction Affect Employment Opportunities British Journal of Criminology 14 264ndash68
Braithwaite John 1989 Crime Shame and Reintegration Cambridge Cambridge University Press
Cameron Adrian Colin and P K Trivedi 2005 Microeconometrics Methods and Applications Cambridge Cambridge University Press
Carroll Leo 1988 Hacks Blacks and Cons Race Relations in a Maximum Security Prison Prospect Heights IL Waveland Press
Cattaneo Matias D Rociacuteo Titiunik Gonzalo Vazquez-Bare and Luke Keele 2016 Interpreting Regression Discontinuity Designs with Multiple Cutoffs The Journal of Politics 78 (3) doi101086686802
Chen M Keith and Jesse M Shapiro 2007 Do Harsher Prison Conditions Reduce Recidivism A Discontinuity-Based Approach American Law and Economics Review 9 (1) 1ndash29 doi101093alerahm006
Clemmer Donald 1940 The Prison Community Boston The Christopher Publishing House
Cook Thomas D 2008 lsquoWaiting for Life to Arriversquo A History of the Regression-Discontinuity Design in Psychology Statistics and Economics Journal of Econometrics 142 (2) 636ndash54 doi101016jjeconom200705002
Cullen Francis T Cheryl Lero Jonson and Daniel S Nagin 2011 Prisons Do Not Reduce Recidivism The High Cost of Ignoring Science The Prison Journal 91 (3 Suppl) doi1011770032885511415224
Deschenes Elizabeth Piper Susan Piper and Joan Petersilia 1995 Intensive Community Supervision in Minnesota A Dual Experiment in Prison Diversion and Enhanced Supervised Release Santa Monica CA RAND Corporation
DiNardo John and David S Lee 2010 Program Evaluation and Research Designs Essay In Handbook of Labor Economics eds Orley Ashenfelter and David Card Vol 4A Elsevier
Drago Francesco Roberto Galbiati and Pietro Vertova 2009 The Deterrent Effects of Prison Evidence from a Natural Experiment Journal of Political Economy 117 (2) 257ndash80 doi101086599286
Fleisher Mark S 1989 Warehousing Violence Newbury Park CA Sage Publications
Gaes Gerald G William D Bales and Samuel J A Scaggs 2016 The Effect of Imprisonment on Recommitment An Analysis Using Exact Coarsened Exact and Radius Matching with the Propensity Score Journal of Experimental Criminology 12 (1) 143ndash58 doi101007s11292-015-9251-x
Gaes Gerald G and Scott D Camp 2009 Unintended Consequences Experimental Evidence for the Criminogenic Effect of Prison Security Level Placement on Post-Release Recidivism Journal of Experimental Criminology 5 (2) 139ndash62 doi101007s11292-009-9070-z
60
The Relationship between Prison Length of Stay and Recidivism -- This report was prepared by Abt Associates using Federal funding provided by the Bureau of Justice Statistics (BJS) Opinions andor points of view expressed are those of the author(s) and do not necessarily reflect the official position or policies of the US Department of Justice
Gaes Gerald G Timothy J Flanagan Laurence L Motiuk and Lynn Stewart 1999 Adult Correctional Treatment Essay In Crime and Justice a Review of Research Prisons eds Michael Tonry and Joan Petersilia 76361ndash426 Chicago University of Chicago Press
Gendreau Paul Paula Smith and Sheila French 2008 The Theory of Effective Correctional Intervention Empirical Status and Future Directions Essay In Taking Stock The Status of Criminological Theory Advances in Criminological Theory eds T Francis FT Cullen JP Wright and KR Blevins Vol 15 New Brunswick NJ Transaction
Gendreau Paul Claire Goggin and Francis T Cullen 1999 The Effects of Prison Sentences on Recidivism 1999-3 The Effects of Prison Sentences on Recidivism 1999-3 Ottawa Canada Solicitor General
Goffman Erving 1961 Asylums Essays on the Social Situation of Mental Patients and Other Inmates Chicago Aldine
Green Donald P and Daniel Winik 2010 Using Random Judge Assignments to Estimate the Effects of Incarceration and Probation on Recidivism Among Drug Offenders Criminology 48 (2) 357ndash87 doi101111j1745-9125201000189x
Greene William H 2008 Econometric Analysis Upper Saddle River NJ Prentice Hall
Hahn Jinyong Petra Todd and Wilbert Klaauw 2001 Identification and Estimation of Treatment Effects with a Regression-Discontinuity Design Econometrica 69 (1) 201ndash9 doi1011111468-026200183
Hjalmarsson Randi (2009) Juvenile Jails A path to the straight and narrow or to hardened criminality Journal of Law and Economics 52 779-809
Horney Julie D Wayne Osgood and Ineke Haen Marshall 1995 Criminal Careers in the Short-Term Intra-Individual Variability in Crime and Its Relation to Local Life Circumstances American Sociological Review 60 (5) 655 doi1023072096316
Hosmer David W Stanley Lemeshow and Susanne May 2008 Applied Survival Analysis Regression Modeling of Time-to-Event Data Hoboken NJ Wiley-Interscience
Imbens G (2009) Better LATE Than Nothing Some Comments on Deaton (2009) and Heckman and Urzua (2009) Unpublished paper downloaded from httpwwweconomicsharvardedufacultyimbensfilesbltn_09apr10pdf on December 2 2009
Imbens Guido W and Joshua D Angrist 1994 Identification and Estimation of Local Average Treatment Effects Econometrica 62 (2) 467 doi1023072951620
Imbens Guido W and Thomas Lemieux 2007 Regression Discontinuity Designs A Guide to Practice National Bureau of Economic Research Working Paper
61
The Relationship between Prison Length of Stay and Recidivism -- This report was prepared by Abt Associates using Federal funding provided by the Bureau of Justice Statistics (BJS) Opinions andor points of view expressed are those of the author(s) and do not necessarily reflect the official position or policies of the US Department of Justice
Imbens Guido W and Donald B Rubin 2015 Causal Inference for Statistics Social and Biomedical Sciences an Introduction Cambridge Cambridge University Press
Irwin John 1980 Prisons in Turmoil Boston Little Brown
Irwin John 2005 The Warehouse Prison Disposal of the New Dangerous Class Los Angeles CA Roxbury Pub Co
Irwin John (2009) Lifers Seeking redemption in prison (Criminology and justice studies) New York Routledge
Jacobs James B 1977 Statesville The Penitentiary in Mass Society Chicago IL Chicago University Press
Jaman Dorothy R Robert M Dickover and Lawrence A Bennett 1972 Parole Outcome as a Function of Time Served British Journal of Criminology 12 (1) 5ndash34
Kalbfleisch J D and Ross L Prentice 2002 The Statistical Analysis of Failure Time Data Hoboken NJ J Wiley
Kling R W Rhodes D Izrael C Cutler K Shah and C Dyous 2016 Creating an Offender-Based Tracking System Using the FJSP Draft Final for BJS Review Cambridge MA Abt Associates
Kraus J 1981 The Effects of Committal to a Special School for Truants International Journal of Offender Therapy and Comparative Criminology 25 (2) 130ndash38 doi1011770306624x8102500205
Kuziemko I 2012 How Should Inmates Be Released from Prison An Assessment of Parole versus Fixed-Sentence Regimes The Quarterly Journal of Economics 128 (1) 371ndash424 doi101093qjeqjs052
La Vigne Nancy Samuel Bieler Lindsey Cramer Helen Ho Cybele Kotonias Deborah Mayer David McClure Laura Pacifici Erika Parks Bryce Peterson and Julie Samuels 2014 Justice Reinvestment Initiative State Assessment Report Washington DC The Urban Institute
Lancaster Tony 1990 The Econometric Analysis of Transition Data Cambridge Cambridge University Press
Lee David S and Thomas Lemieux 2010 Regression Discontinuity Designs in Economics Journal of Economic Literature 48 (2) 281ndash355 doi101257jel482281
Lee S and Card D 2006 Regression Discontinuity Inference with Specification Error Technical Working paper 322 National Bureau of Economic Research
What Works Clearinghouse Procedures and Standards Handbook Version 30 US Department of Education httpsiesedgovnceewwcDocsreferenceresourceswwc_procedures_v3_0_standards_handboo kpdf
62
The Relationship between Prison Length of Stay and Recidivism -- This report was prepared by Abt Associates using Federal funding provided by the Bureau of Justice Statistics (BJS) Opinions andor points of view expressed are those of the author(s) and do not necessarily reflect the official position or policies of the US Department of Justice
Lerman Amy 2009a The People Prisons Make Effects of Incarceration on Criminal Psychology In Do Prisons make Us Safer The Benefits and Costs of the Prison Boom eds Steven Raphael and Michael A Stoll New York Russel Sage
Lerman Amy 2009b Bowling Alone (With My Own Ball and Chain) Effects of Incarceration and the Dark Side of Social Capital Lecture
Letkemann Peter 1973 Crime as Work Englewood Cliffs NJ Prentice-Hall
Listwan Shelley Johnson Christopher J Sullivan Robert Agnew Francis T Cullen and Mark Colvin 2013 The Pains of Imprisonment Revisited The Impact of Strain on Inmate Recidivism Justice Quarterly 30 (1) 144ndash68 doi101080074188252011597772
Loeffler Charles E 2013 Does Imprisonment Alter the Life Course Evidence on Crime and Employment from A Natural Experiment Criminology 51 (1) 137ndash66 doi1011111745-912512000
Loughran Thomas A Edward P Mulvey Carol A Schubert Jeffrey Fagan Alex R Piquero and Sandra H Losoya 2009 Estimating A Dose-Response Relationship Between Length of Stay and Future Recidivism in Serious Juvenile Offenders Criminology 47 (3) 699ndash740 doi101111j1745-9125200900165x
MacKenzie Doris L 2006 What Works in Corrections Reducing the Criminal Activities of Offenders and Delinquents New York Cambridge University Press
Manski Charles F and Daniel S Nagin 1998 Bounding Disagreements About Treatment Effects A Case Study of Sentencing and Recidivism Sociological Methodology 28 (1) 99ndash137 doi1011110081-175000043
Meade Benjamin Benjamin Steiner Matthew Makarios and Lawrence Travis 2012 Estimating a Dose-Response Relationship Between Time Served in Prison and Recidivism Journal of Research in Crime and Delinquency 50 (4) 525ndash50 doi1011770022427812458928
Mears Daniel P Joshua C Cochran and Francis T Cullen 2014 Incarceration Heterogeneity and Its Implications for Assessing the Effectiveness of Imprisonment on Recidivism Criminal Justice Policy Review 26 (7) 691ndash712 doi1011770887403414528950
Mears Daniel P Joshua C Cochran William D Bales and Avinash S Bhati (2016) Recidivism and time served in prison Journal of Criminal Law and Criminology 106(1) 82-122
Morgan Stephen and Christopher Winship 2015 Counterfactuals and Causal Inference Methods and Principals for Social Research 2nd ed Cambridge MA Cambridge University Press
Nagin Daniel S Francis T Cullen and Cheryl Lero Jonson 2009 Imprisonment and Reoffending Essay In Crime and Justice A Review of Research eds Michael Tonry 38115ndash200 Chicago University of Chicago Press
63
The Relationship between Prison Length of Stay and Recidivism -- This report was prepared by Abt Associates using Federal funding provided by the Bureau of Justice Statistics (BJS) Opinions andor points of view expressed are those of the author(s) and do not necessarily reflect the official position or policies of the US Department of Justice
Nguyen H Loughran T A Paternoster R Fagan J amp Piquero A R (2017) Institutional placement and illegal earnings Examining the crime school hypothesis Journal of Quantitative Criminology 33(2) 207-235
Owen B A (1998) In the Mix Struggle and Survival in a Womens Prison SUNY Press
Pager Devah and Lincoln Quillian 2005 Walking the Talk What Employers Say Versus What They Do American Sociological Review 70 (3) 355ndash80 doi101177000312240507000301
Pager Devah Bart Bonikowski and Bruce Western 2009 Discrimination in a Low-Wage Labor Market A Field Experiment American Sociological Review 74 (5) 777ndash99 doi101177000312240907400505
Pager Devah 2007 Marked Race Crime and Finding Work in an Era of Mass Incarceration Chicago University of Chicago Press
Rhodes William and Sarah K Jalbert 2013 Regression Discontinuity Design in Criminal Justice Evaluation An Introduction and Illustration Evaluation Review 37 (3-4) 239ndash73 doi1011770193841x14523004
Rhodes W Dyous C Kling R Hunt D and Luallen J (2012) Recidivism of Offenders on Federal Community Supervision Bureau of Justice Statistics award 2010-BJ-CX-K069 NCRJS document number 241018
Rhodes W (2010) Estimating treatment effects and predicting recidivism for community supervision using survival analysis with instrumental variables Journal of Quantitative Criminology 26(3) 391-413
Rhodes W (2012) Meta-analysis An introduction using regression models Evaluation review 36(1) 24-71
Roach Michael A and Max M Schanzenbach 2015 The Effect of Prison Sentence Length on Recidivism Evidence from Random Judicial Assignment Northwestern Law ampAmp Econ Research Paper doi102139ssrn2701549
Roodman David 2016 The impacts of incarceration on crime Open Philanthropy Project
Rosenbaum Paul R 2002 Observational Studies 2nd ed New York Springer
Smith Douglas A and Raymond Paternoster 1990 Formal Processing and Future Delinquency Deviance Amplification as Selection Artifact Law ampAmp Society Review 24 (5) 1109 doi1023073053663
Sampson Robert J and John H Laub 1993 Crime in the Making Pathways and Turning Points Through Life Cambridge MA Harvard University Press
64
The Relationship between Prison Length of Stay and Recidivism -- This report was prepared by Abt Associates using Federal funding provided by the Bureau of Justice Statistics (BJS) Opinions andor points of view expressed are those of the author(s) and do not necessarily reflect the official position or policies of the US Department of Justice
Smith Paula 2006 The Effects of Incarceration on Recidivism A Longitudinal Examination of Program Participation and Institutional Adjustment in Federally Sentenced Adult Male Offenders Dissertation University of New Brunswick Dept of Psychology
Smith Paula Paul Gendreau and Claire Goggin 2002 The Effects of Prison Sentences and Intermediate Sanctions on Recidivism General Effects and Individual Differences Ottawa Solicitor General Canada
Snodgrass G Matthew Arjan A J Blokland Amelia Haviland Paul Nieuwbeerta and Daniel S Nagin 2011 Does the Time Cause the Crime An Examination of the Relationship Between Time Served and Reoffending in The Netherlands Criminology 49 (4) 1149ndash94 doi101111j1745-9125201100254x
Sykes Gresham M 1958 The Society of Captives A Study of a Maximum Security Prison Princeton NJ Princeton University Press
National Research Council Jeremy Travis Bruce Western Steve Redburn 2014 The Growth of Incarceration in the United States Exploring Causes and Consequences eds Committee on Causes and Consequences of High Rates of Incarceration Committee on Law and Justice and Division of Behavioral and Social Sciences and Education Washington DC The National Academies Press
van der Klaauw Wilbert 2002 Estimating the Effect of Financial Aid Offers on College Enrollment A Regression-Discontinuity Approach International Economic Review 43 (4) 1249ndash87 doi1011111468-2354t01-1-00055
Villettaz P M Killias and I Zoder 2006 The Effects of Custodial vs Non-Custodial Sentences on Re-Offending A Systematic Review of the State of Knowledge Campbell Collaboration Crime and Justice Group doi104073csr200613
Wacquant Loiumlc 2001 Deadly Symbiosis When Ghetto and Prison Meet and Mesh Mass Imprisonment Social Causes and Consequences 82ndash120 doi1041359781446221228n8
Western Bruce 2002 The Impact of Incarceration on Wage Mobility and Inequality American Sociological Review 67 (4) 526 doi1023073088944
65
The Relationship between Prison Length of Stay and Recidivism -- This report was prepared by Abt Associates using Federal funding provided by the Bureau of Justice Statistics (BJS) Opinions andor points of view expressed are those of the author(s) and do not necessarily reflect the official position or policies of the US Department of Justice
Tables and Figures
Table 1 - Number of Offenders Meeting Study Requirements per Guidelines Cell
Criminal History Categories (1 least serious 6 most serious) Offense
Seriousness Level CH 1 CH 2 CH 3 CH 4 CH 5 CH 6 Total
1 38 6 1 1 1 1 48 2 909 176 178 90 42 61 1456 3 143 26 33 20 9 25 256 4 3244 818 981 523 371 613 6550 5 442 119 132 84 64 119 960 6 3005 641 752 429 300 505 5632 7 1511 381 653 576 440 680 4241 8 4497 882 1023 543 361 552 7858 9 1969 465 566 321 229 363 3913
10 8511 1873 2342 1119 765 1109 15719 11 2824 558 728 472 304 521 5407 12 9748 2368 3330 1968 1204 1667 20285 13 13159 2961 3668 2009 1226 1777 24800 14 4219 746 854 430 275 788 7312 15 10534 2680 3131 1599 951 1257 20152 16 4394 760 831 396 227 318 6926 17 8743 2598 4189 2919 1690 1981 22120 18 4876 745 758 388 212 306 7285 19 9053 2116 2902 1720 1095 1301 18187 20 3761 779 930 532 262 319 6583 21 13674 2293 3341 2511 1706 2421 25946 22 3674 654 850 480 289 392 6339 23 10627 4101 5642 2996 1742 1904 27012 24 3706 719 788 487 282 445 6427 25 7748 2816 3460 1835 1036 1137 18032 26 2946 728 856 420 228 355 5533 27 9418 1797 2221 1126 630 647 15839 28 2509 506 554 306 144 178 4197 29 6180 2614 3442 1736 870 3174 18016 30 1819 344 367 384 218 654 3786 31 3868 1800 2308 1157 554 2945 12632 32 1144 307 377 161 86 213 2288 33 2570 873 1155 566 259 365 5788 34 776 244 260 111 79 1831 3301 35 1145 645 820 368 197 446 3621 36 431 128 153 66 35 47 860
Leas
t Ser
ious
(1) t
o Mo
st S
erio
us (4
3)
66
The Relationship between Prison Length of Stay and Recidivism -- This report was prepared by Abt Associates using Federal funding provided by the Bureau of Justice Statistics (BJS) Opinions andor points of view expressed are those of the author(s) and do not necessarily reflect the official position or policies of the US Department of Justice
Criminal History Categories (1 least serious 6 most serious) Offense
Seriousness Level CH 1 CH 2 CH 3 CH 4 CH 5 CH 6 Total
37 543 210 305 148 54 221 1481 38 290 83 122 59 30 64 648 39 200 62 91 36 21 58 468 40 174 37 58 22 22 35 348 41 94 31 43 18 6 23 215 42 64 23 28 9 5 8 137 43 86 24 25 12 4 19 170
All 169266 42737 55248 31153 18525 31845 348774 Note Cells with fewer than 100 observations are highlighted
67
The Relationship between Prison Length of Stay and Recidivism -- This report was prepared by Abt Associates using Federal funding provided by the Bureau of Justice Statistics (BJS) Opinions andor points of view expressed are those of the author(s) and do not necessarily reflect the official position or policies of the US Department of Justice
Table 2 -- Percentage of Offenders Sentenced to Prison per Guideline Cell
Criminal History Categories (1 least serious 6 most serious) Offense
Seriousness Level CH 1 CH 2 CH 3 CH 4 CH 5 CH 6 Total
1 11 0 0 0 100 100 13 2 15 20 42 52 69 72 25 3 11 31 42 50 78 76 29 4 14 27 45 68 74 82 34 5 14 34 54 83 84 93 42 6 17 40 59 73 89 94 40 7 16 43 69 91 95 96 58 8 17 43 58 86 91 96 39 9 27 53 79 90 90 97 53
10 33 75 86 94 96 96 58 11 63 85 91 95 99 98 77 12 69 84 92 96 97 98 81 13 74 89 94 97 98 98 83 14 79 90 94 97 99 98 86 15 82 93 96 97 99 99 89 16 84 92 95 98 98 98 88 17 85 93 97 98 99 99 92 18 90 95 97 99 98 99 92 19 89 93 97 99 99 99 93 20 92 96 99 98 99 99 94 21 92 96 98 99 99 99 95 22 93 96 98 99 99 99 95 23 93 97 98 99 99 99 96 24 95 98 99 100 99 100 96 25 95 98 98 99 99 99 97 26 97 98 98 99 100 100 98 27 96 99 99 100 99 100 97 28 96 98 99 99 100 99 97 29 96 98 99 99 99 99 98 30 97 100 100 98 99 100 98 31 97 98 99 99 99 99 98 32 98 98 99 99 100 100 99 33 96 98 99 99 100 99 97 34 97 100 99 100 100 99 99 35 97 98 99 98 99 99 98 36 98 99 99 97 100 100 98 37 97 98 99 100 96 98 98 38 98 99 98 100 100 98 98
68
The Relationship between Prison Length of Stay and Recidivism -- This report was prepared by Abt Associates using Federal funding provided by the Bureau of Justice Statistics (BJS) Opinions andor points of view expressed are those of the author(s) and do not necessarily reflect the official position or policies of the US Department of Justice
Criminal History Categories (1 least serious 6 most serious) Offense
Seriousness Level CH 1 CH 2 CH 3 CH 4 CH 5 CH 6 Total
39 98 98 99 100 100 98 99 40 98 97 100 100 100 100 99 41 98 100 100 100 100 100 99 42 97 100 100 100 100 100 99 43 98 100 96 100 100 95 98 All 78 89 93 97 98 98 87
Note Cells with less than 50 prison terms are highlighted
69
The Relationship between Prison Length of Stay and Recidivism -- This report was prepared by Abt Associates using Federal funding provided by the Bureau of Justice Statistics (BJS) Opinions andor points of view expressed are those of the author(s) and do not necessarily reflect the official position or policies of the US Department of Justice
Table 3 -- Average Time Served (Months) per Guideline Cell
Criminal History Categories (1 least serious 6 most serious) Offense Seriousness Level
CH 1 CH 2 CH 3 CH 4 CH 5 CH 6
Leas
t Ser
ious
(1) t
o Mo
st S
erio
us (4
3)
1 04 00 00 00 209 65 2 10 13 25 36 41 73 3 08 17 27 47 47 73 4 13 22 35 57 67 85 5 13 21 42 87 90 138 6 13 41 49 84 115 140 7 11 29 50 81 117 146 8 14 38 59 96 137 175 9 21 50 71 119 168 208
10 30 72 94 150 191 230 11 43 82 119 161 217 251 12 60 103 137 189 237 279 13 81 124 157 212 260 300 14 106 160 187 256 298 324 15 120 170 204 256 320 355 16 147 198 233 303 359 408 17 164 222 260 326 392 446 18 196 257 297 362 454 515 19 216 282 326 407 498 547 20 262 343 401 481 573 637 21 255 342 394 481 570 636 22 313 409 483 582 689 721 23 336 429 484 577 670 728 24 369 493 543 685 786 853 25 418 495 562 671 785 842 26 480 571 676 783 902 964 27 474 597 659 783 868 909 28 552 706 784 902 961 1048 29 584 722 813 878 976 981 30 685 845 938 1063 1120 1213 31 695 823 916 1039 1129 1117 32 850 991 1116 1241 1417 1312 33 779 935 1056 1203 1338 1401 34 969 1166 1220 1365 1396 1326 35 900 1033 1182 1335 1385 1403 36 1176 1265 1456 1510 1551 1461
70
The Relationship between Prison Length of Stay and Recidivism -- This report was prepared by Abt Associates using Federal funding provided by the Bureau of Justice Statistics (BJS) Opinions andor points of view expressed are those of the author(s) and do not necessarily reflect the official position or policies of the US Department of Justice
Criminal History Categories (1 least serious 6 most serious) Offense Seriousness Level
CH 1 CH 2 CH 3 CH 4 CH 5 CH 6
37 1028 1289 1356 1604 1382 1849 38 1279 1434 1625 1726 1399 1769 39 1072 1468 1540 1567 1544 1656 40 1414 1520 1648 1482 1490 1658 41 1315 1562 1788 2045 2124 1899 42 1263 1878 1468 1974 1422 1974 43 1497 1685 2078 2909 1280 2243
71
The Relationship between Prison Length of Stay and Recidivism -- This report was prepared by Abt Associates using Federal funding provided by the Bureau of Justice Statistics (BJS) Opinions andor points of view expressed are those of the author(s) and do not necessarily reflect the official position or policies of the US Department of Justice
Table 4 -- Percentage of Offenders Recidivating within Three Years (Not Accounting for Censoring) per Guideline Cell
Criminal History Categories (1 least serious 6 most serious) Offense Seriousness Level CH 1 CH 2 CH 3 CH 4 CH 5 CH 6
Leas
t Ser
ious
(1) t
o Mo
st S
erio
us (4
3)
1 395 333 1000 00 00 1000 2 232 324 382 433 524 328 3 238 346 424 450 444 440 4 201 334 399 405 415 512 5 215 378 379 440 422 454 6 198 348 430 462 407 475 7 212 336 449 507 502 568 8 177 330 324 385 427 438 9 182 286 337 340 397 477
10 167 262 350 367 383 459 11 116 228 299 326 365 407 12 130 266 335 388 442 475 13 132 248 297 368 396 444 14 94 180 297 347 360 391 15 129 241 315 386 420 423 16 95 186 276 323 300 377 17 99 207 280 342 382 425 18 95 179 240 312 274 359 19 106 197 274 320 359 414 20 94 181 247 301 336 376 21 103 172 235 283 336 352 22 81 191 259 313 356 375 23 84 142 192 247 293 330 24 86 172 221 277 337 348 25 77 122 167 215 251 277 26 70 126 173 193 241 318 27 71 124 157 186 216 253 28 72 144 148 180 201 298 29 63 93 131 169 208 221 30 73 96 166 188 239 252 31 52 99 129 137 181 166 32 68 94 135 161 105 174 33 51 86 127 133 201 186 34 44 90 88 153 215 118 35 53 62 87 122 178 143 36 42 55 85 136 229 128 37 52 90 95 135 93 163
72
The Relationship between Prison Length of Stay and Recidivism -- This report was prepared by Abt Associates using Federal funding provided by the Bureau of Justice Statistics (BJS) Opinions andor points of view expressed are those of the author(s) and do not necessarily reflect the official position or policies of the US Department of Justice
Criminal History Categories (1 least serious 6 most serious) Offense Seriousness Level CH 1 CH 2 CH 3 CH 4 CH 5 CH 6
38 24 24 57 68 233 156 39 20 48 99 139 190 52 40 40 108 103 182 136 114 41 32 32 47 111 333 130 42 63 00 143 222 200 125 43 81 00 200 167 250 158
73
The Relationship between Prison Length of Stay and Recidivism -- This report was prepared by Abt Associates using Federal funding provided by the Bureau of Justice Statistics (BJS) Opinions andor points of view expressed are those of the author(s) and do not necessarily reflect the official position or policies of the US Department of Justice
Table 5 -- Results from a Naive Regressions (Cox Proportional Hazard)
CH 1 CH 2 CH 3 CH 4 CH 5 CH 6 scaled time-served -1707 -2381 -2536 -1941 -1079 -1588
(0155) (0212) (0155) (0187) (0235) (0161) time-served squared 0941 1166 1154 0487 -0336 0016
(0263) (0328) (0234) (0263) (0323) (0192) scaled age -7718 -6272 -6200 -6174 -6028 -2779
(0257) (0385) (0295) (0388) (0496) (0468) age squared 6798 5207 5927 6619 6433 1160
(0503) (0775) (0608) (0791) (0983) (0881) female -0348 -0343 -0281 -0219 -0280 -0331
(0021) (0035) (0028) (0040) (0052) (0041) Black 0194 0115 0120 0088 -0016 -0054
(0023) (0030) (0022) (0026) (0031) (0023) other race 0567 0426 0348 0301 0371 0267
(0030) (0049) (0039) (0049) (0062) (0051) Hispanic -0085 -0095 -0072 -0018 0008 -0053
(0024) (0037) (0028) (0034) (0041) (0034) high_school -0124 -0142 -0127 -0106 -0088 -0036
(0039) (0049) (0036) (0042) (0051) (0038) advanced_degree -0611 -0441 -0423 -0287 -0169 -0051
(0053) (0084) (0070) (0088) (0112) (0078) lives_alone -0023 0006 0011 -0020 -0033 -0036
(0021) (0029) (0021) (0025) (0030) (0022) centered points 0311 -0026 0100 0057 0051 0041
(0015) (0022) (0009) (0012) (0013) (0002) N 143058 38733 52654 30049 17697 30247
74
The Relationship between Prison Length of Stay and Recidivism -- This report was prepared by Abt Associates using Federal funding provided by the Bureau of Justice Statistics (BJS) Opinions andor points of view expressed are those of the author(s) and do not necessarily reflect the official position or policies of the US Department of Justice
Table 6 ndash Results when Contrasts are Cells 13 24 57 68 911 1012 and so on
Criminal History 1
Criminal History 2
Criminal History 3
Criminal History 4
Criminal History 5
Criminal History 6
linear 0002 0004
-0002 0003
-0002 0004
-0003 0003
-0008 0005
-0005 0003
constant -0074 0048
-0034 0041
-0050 0041
-0012 0037
0054 0062
-0054 0041
R2 0010 0040 0020 0060 0150 0110 N 15 15 18 19 17 19 plt005 plt001 The constant is the average parameter for the estimated hazard (zero is neutral) Six criminal history scores labeled Criminal History The contrasts are cells 13 24 57 68 911 1012 and so on All the contrasts are independent
Table 7 ndash Results when Contrasts are Cells 24 35 68 79 1012 1113 and so on
Criminal History 1
Criminal History 2
Criminal History 3
Criminal History 4
Criminal History 5
Criminal History 6
linear 0003 -0003
0004 -0005
0003 -0003
-0002 -0004
0007 -0005
0000 -0004
constant -0103 (0032)
-0153 -0071
-0109 (0033)
-0097 -0050
-0188 (0064)
-0049 -0048
R2 0060 0070 0060 0010 0120 0000 N 16 14 18 17 17 18
plt005 plt001 The constant is the average parameter for the estimated hazard (zero is neutral) Six criminal history scores labeled Criminal History The contrasts are cells 24 35 69 710 1012 1113 etc
75
0 Q) bull ~ middot - 0
20gt () agto
0 00 co 0)0 C = a ctl lshyu c o 0 middot- o t ltD 0 aO 0 _ Q0
I()
ci 0 500
Time at Risk in Days
Crim H 1
Crim H 3
Crim H 5
Crim H is the criminal history category
Crim H 2
Crim H 4
Crim H 6
Crim H 1 is the highest l ine and others a re in descending order Crim H 5 and Crim H 6 are nearly indistinguishable
1000
The Relationship between Prison Length of Stay and Recidivism -- This report was prepared by Abt Associates using Federal funding provided by the Bureau of Justice Statistics (BJS) Opinions andor points of view expressed are those of the author(s) and do not necessarily reflect the official position or policies of the US Department of Justice
Figure 1 ndash Kaplan-Meier Estimates of Time until Recidivism by Criminal History Category
plt005 plt001 Six criminal history scores labeled Criminal History Scales variables run from 0 to 1 Centered points Criminal history points centered at zero
76
The Relationship between Prison Length of Stay and Recidivism -- This report was prepared by Abt Associates using Federal funding provided by the Bureau of Justice Statistics (BJS) Opinions andor points of view expressed are those of the author(s) and do not necessarily reflect the official position or policies of the US Department of Justice
Figure 2 ndash Relationship between Time-Served and Recidivism Principal Specification (Return and Revocation)
0 5 1
15
2 25
Relative Hazard
0 10 20 30 40 Offense Seriousness Level
Crim Hist Category 1
5
1 15
2 25
Relative Hazard
0 10 20 30 40 Offense Seriousness Level
Crim Hist Category 2
5
1 15
2 25
Relative Hazard
0 10 20 30 40 Offense Seriousness Level
Crim Hist Category 3 0
5 1
15
2 25
Relative Hazard
0 10 20 30 40 Offense Seriousness Level
Crim Hist Category 4 0
5 1
15
2 25
Relative Hazard
0 10 20 30 40 Offense Seriousness Level
Crim Hist Category 5
5
1 15
2 25
Relative Hazard
0 10 20 30 40 Offense Seriousness Level
Crim Hist Category 6
Dots are estimated relative hazards (shown if between -25 and 25)Vertical lines are 95 confidence interval for the estimated relative hazards (truncated at 25)Smooth lines are linear predictions and 95 confidence intervals for the regression line
Criminal History 1
Criminal History 2
Criminal History 3
Criminal History 4
Criminal History 5
Criminal History 6
linear 0002 (0002)
0000 (0003)
0000 (0002)
-0003 (0003)
0000 (0004)
-0003 (0003)
constant -0068 (0013)
-0075 (0019)
-0075 (0017)
-0076 (0019)
-0068 (0028)
-0077 (0020)
R2 003 000 000 003 000 003 N 31 29 36 36 34 37
plt005 plt001 The constant is the average parameter for the estimated hazard (zero is neutral) Six criminal history scores labeled Criminal History
77
The Relationship between Prison Length of Stay and Recidivism -- This report was prepared by Abt Associates using Federal funding provided by the Bureau of Justice Statistics (BJS) Opinions andor points of view expressed are those of the author(s) and do not necessarily reflect the official position or policies of the US Department of Justice
Figure 3 ndash Relationship between Time-Served and Recidivism Principal Specification (Return and Revocation) using an Instrumental Variable Estimator
7
8
9
1 11
Relative Hazard
0 10 20 30 40 Offense Seriousness Level
Crim Hist Category 1
9 95
1 105 11 115
Relative Hazard
0 10 20 30 40 Offense Seriousness Level
Crim Hist Category 2
6
8
1 12
14
Relative Hazard
0 10 20 30 40 Offense Seriousness Level
Crim Hist Category 3 5
1 15
2 25
Relative Hazard
0 10 20 30 40 Offense Seriousness Level
Crim Hist Category 4 8
9
1 11
12
Relative Hazard
0 10 20 30 40 Offense Seriousness Level
Crim Hist Category 5
5
1 15
2 25
Relative Hazard
0 10 20 30 40 Offense Seriousness Level
Crim Hist Category 6
Dots are estimated relative hazards (shown if between -25 and 25)Vertical lines are 95 confidence interval for the estimated relative hazards (truncated at 25)Smooth lines are linear predictions and 95 confidence intervals for the regression line
Criminal History 1
Criminal History 2
Criminal History 3
Criminal History 4
Criminal History 5
Criminal History 6
linear 0001 (0000)
0001 (0000)
0001 (0000)
0000 0000
0000 0000
0000 0000
constant -0014 (0002)
-0015 (0003)
-0011 (0003)
-0011 (0003)
-0009 0005
-0009 (0003)
R2 043 022 012 003 001 010 N 31 29 36 36 34 37
plt005 plt001 The constant is the average parameter for the estimated hazard (zero is neutral) Six criminal history scores labeled Criminal History
78
The Relationship between Prison Length of Stay and Recidivism -- This report was prepared by Abt Associates using Federal funding provided by the Bureau of Justice Statistics (BJS) Opinions andor points of view expressed are those of the author(s) and do not necessarily reflect the official position or policies of the US Department of Justice
Figure 4 ndash Sensitivity Test Minimum Cell Size 50 instead of 100
0 5 1
15
2 25
Relative Hazard
0 10 20 30 40 Offense Seriousness Level
Crim Hist Category 1
0 5 1
15
2 25
Relative Hazard
0 10 20 30 40 Offense Seriousness Level
Crim Hist Category 2
5
1 15
2 25
Relative Hazard
0 10 20 30 40 Offense Seriousness Level
Crim Hist Category 3 0
5 1
15
2 25
Relative Hazard
0 10 20 30 40 Offense Seriousness Level
Crim Hist Category 4 0
5 1
15
2 25
Relative Hazard
0 10 20 30 40 Offense Seriousness Level
Crim Hist Category 5
0 5 1
15
2 25
Relative Hazard
0 10 20 30 40 Offense Seriousness Level
Crim Hist Category 6
Dots are estimated relative hazards (shown if between -25 and 25)Vertical lines are 95 confidence interval for the estimated relative hazards (truncated at 25)Smooth lines are linear predictions and 95 confidence intervals for the regression line
Criminal History 1
Criminal History 2
Criminal History 3
Criminal History 4
Criminal History 5
Criminal History 6
linear 0002 (0002)
0000 (0003)
0000 (0002)
-0002 (0003)
0000 (0004)
-0003 (0002)
constant -0068 (0013)
-0075 (0018)
-0073 (0018)
-0078 (0019)
-0068 (0027)
-0084 (0021)
R2 003 000 000 002 000 003 N 31 32 37 37 37 40
Six criminal history scores labeled Criminal History plt005 plt001 The constant is the average parameter for the estimated hazard (zero is neutral)
79
The Relationship between Prison Length of Stay and Recidivism -- This report was prepared by Abt Associates using Federal funding provided by the Bureau of Justice Statistics (BJS) Opinions andor points of view expressed are those of the author(s) and do not necessarily reflect the official position or policies of the US Department of Justice
Figure 5 ndash Sensitivity Test Minimum Cell Size 150 instead of 100
0 5 1
15
2 25
Relative Hazard
0 10 20 30 40 Offense Seriousness Level
Crim Hist Category 1
5
1 15
2 25
Relative Hazard
0 10 20 30 40 Offense Seriousness Level
Crim Hist Category 2
5
1 15
2 25
Relative Hazard
0 10 20 30 40 Offense Seriousness Level
Crim Hist Category 3
5
1 15
2 25
Relative Hazard
0 10 20 30 40 Offense Seriousness Level
Crim Hist Category 4
0 5 1
15
2 25
Relative Hazard
0 10 20 30 40 Offense Seriousness Level
Crim Hist Category 5
5
1 15
2 25
Relative Hazard
0 10 20 30 40 Offense Seriousness Level
Crim Hist Category 6
Dots are estimated relative hazards (shown if between -25 and 25)Vertical lines are 95 confidence interval for the estimated relative hazards (truncated at 25)Smooth lines are linear predictions and 95 confidence intervals for the regression line
Criminal History 1
Criminal History 2
Criminal History 3
Criminal History 4
Criminal History 5
Criminal History 6
linear 0002
(0002)
0000
(0003)
0000
(0002)
-0003
(0003)
-0001
(0004)
-0003
(0003) constant -0068
(0013) -0075 (0021)
-0076 (0017)
-0071 (0020)
-0066 (0031)
-0071 (0021)
R2 003 000 000 003 000 004 N 31 28 34 34 32 35
plt005 plt001 The constant is the average parameter for the estimated hazard (zero is neutral) Six criminal history scores labeled Criminal History
80
The Relationship between Prison Length of Stay and Recidivism -- This report was prepared by Abt Associates using Federal funding provided by the Bureau of Justice Statistics (BJS) Opinions andor points of view expressed are those of the author(s) and do not necessarily reflect the official position or policies of the US Department of Justice
Figure 6 -- Sensitivity Test Minimum Percentage of Prison Terms 75 instead of 50
0 5 1
15
2 25
Relative Hazard
0 10 20 30 40 Offense Seriousness Level
Crim Hist Category 1
5
1 15
2 25
Relative Hazard
0 10 20 30 40 Offense Seriousness Level
Crim Hist Category 2
5
1 15
2 25
Relative Hazard
0 10 20 30 40 Offense Seriousness Level
Crim Hist Category 3
0 5 1
15
2 25
Relative Hazard
0 10 20 30 40 Offense Seriousness Level
Crim Hist Category 4
0 5 1
15
2 25
Relative Hazard
0 10 20 30 40 Offense Seriousness Level
Crim Hist Category 5
5
1 15
2 25
Relative Hazard
0 10 20 30 40 Offense Seriousness Level
Crim Hist Category 6
Dots are estimated relative hazards (shown if between -25 and 25)Vertical lines are 95 confidence interval for the estimated relative hazards (truncated at 25)Smooth lines are linear predictions and 95 confidence intervals for the regression line
Criminal History 1
Criminal History 2
Criminal History 3
Criminal History 4
Criminal History 5
Criminal History 6
linear 0004 (0003)
0002 (0003)
-0001 (0003)
-0002 (0003)
0000 (0004)
-0003 (0003)
constant -0086 (0021)
-0091 (0023)
-0070 (0017)
-0074 (0020)
-0069 (0031)
-0076 (0020)
R2 007 002 001 002 000 004 N 27 28 32 33 31 36
plt005 plt001 The constant is the average parameter for the estimated hazard (zero is neutral) Six criminal history scores labeled Criminal History
81
The Relationship between Prison Length of Stay and Recidivism -- This report was prepared by Abt Associates using Federal funding provided by the Bureau of Justice Statistics (BJS) Opinions andor points of view expressed are those of the author(s) and do not necessarily reflect the official position or policies of the US Department of Justice
Figure 7 ndash Sensitivity Test Contrasts that are J and J+1 instead of J and J+2 5
1 15
2 25
Relative Hazard
0 10 20 30 40 Offense Seriousness Level
Crim Hist Category 1
0 5 1
15
2 25
Relative Hazard
0 10 20 30 40 Offense Seriousness Level
Crim Hist Category 2
5
1 15
2 25
Relative Hazard
0 10 20 30 40 Offense Seriousness Level
Crim Hist Category 3
5
1 15
2 25
Relative Hazard
0 10 20 30 40 Offense Seriousness Level
Crim Hist Category 4
5
1 15
2 25
Relative Hazard
0 10 20 30 40 Offense Seriousness Level
Crim Hist Category 5
5
1 15
2 25
Relative Hazard
0 10 20 30 40 Offense Seriousness Level
Crim Hist Category 6
Dots are estimated relative hazards (shown if between -25 and 25)Vertical lines are 95 confidence interval for the estimated relative hazards (truncated at 25)Smooth lines are linear predictions and 95 confidence intervals for the regression line
Criminal History 1
Criminal History 2
Criminal History 3
Criminal History 4
Criminal History 5
Criminal History 6
linear 0002 (0004)
-0002 (0005)
0005 (0004)
0006 (0004)
0003 (0006)
0006 (0004)
constant -0030 (0029)
-0017 (0040)
-0037 (0032)
-0039 (0028)
-0031 (0046)
-0023 (0028)
R2 0010 000 004 010 001 009 N 25 25 27 26 29 29
plt005 plt001 The constant is the average parameter for the estimated hazard (zero is neutral) Six criminal history scores labeled Criminal History
82
The Relationship between Prison Length of Stay and Recidivism -- This report was prepared by Abt Associates using Federal funding provided by the Bureau of Justice Statistics (BJS) Opinions andor points of view expressed are those of the author(s) and do not necessarily reflect the official position or policies of the US Department of Justice
Figure 8 -- Sensitivity Test Using the Prais-Winston Estimator
5
1 15
2 25
Relative Hazard
0 10 20 30 40 Offense Seriousness Level
Crim Hist Category 1
0 5 1
15
2 25
Relative Hazard
0 10 20 30 40 Offense Seriousness Level
Crim Hist Category 2
5
1 15
2 25
Relative Hazard
0 10 20 30 40 Offense Seriousness Level
Crim Hist Category 3
5
1 15
2 25
Relative Hazard
0 10 20 30 40 Offense Seriousness Level
Crim Hist Category 4
5
1 15
2 25
Relative Hazard
0 10 20 30 40 Offense Seriousness Level
Crim Hist Category 5
5
1 15
2 25
Relative Hazard
0 10 20 30 40 Offense Seriousness Level
Crim Hist Category 6
Dots are estimated relative hazards (shown if between -25 and 25)Vertical lines are 95 confidence interval for the estimated relative hazards (truncated at 25)Smooth lines are linear predictions and 95 confidence intervals for the regression line
Criminal History 1
Criminal History 2
Criminal History 3
Criminal History 4
Criminal History 5
Criminal History 6
linear 0019 -0010
0005 -0003
0003 -0003
0007 (0003)
0002 -0006
0006 (0003)
constant -0133 0065
-0060 0020
-0035 0016
-0030 0031
-0032 0029
-0040 0013
Rho 0100 -0940 -0790 0010 -0260 -0730 R2 0240 0210 0110 0210 0020 0330 N 25 25 27 26 29 29
plt005 plt001 The constant is the average parameter for the estimated hazard Six criminal history scores labeled Criminal History
83
The Relationship between Prison Length of Stay and Recidivism -- This report was prepared by Abt Associates using Federal funding provided by the Bureau of Justice Statistics (BJS) Opinions andor points of view expressed are those of the author(s) and do not necessarily reflect the official position or policies of the US Department of Justice
Figure 9 -- Sensitivity Test Entering Prison as Recidivism
0 5 1
15
2 25
Relative Hazard
0 10 20 30 40 Offense Seriousness Level
Crim Hist Category 1
5
1 15
2 25
Relative Hazard
0 10 20 30 40 Offense Seriousness Level
Crim Hist Category 2
0 5 1
15
2 25
Relative Hazard
0 10 20 30 40 Offense Seriousness Level
Crim Hist Category 3
0 5 1
15
2 25
Relative Hazard
0 10 20 30 40 Offense Seriousness Level
Crim Hist Category 4
0 5 1
15
2 25
Relative Hazard
0 10 20 30 40 Offense Seriousness Level
Crim Hist Category 5
5
1 15
2 25
Relative Hazard
0 10 20 30 40 Offense Seriousness Level
Crim Hist Category 6
Dots are estimated relative hazards (shown if between -25 and 25)Vertical lines are 95 confidence interval for the estimated relative hazards (truncated at 25)Smooth lines are linear predictions and 95 confidence intervals for the regression line
Criminal History 1
Criminal History 2
Criminal History 3
Criminal History 4
Criminal History 5
Criminal History 6
linear 0003 (0002)
0002 (0002)
0001 (0002)
-0004 (0003)
0000 (0004)
-0003 (0003)
constant -0070 (0014)
-0084 (0017)
-0077 (0018)
-0071 (0020)
-0074 (0030)
-0080 (0020)
R2 004 002 000 005 000 003 N 40 36 39 37 33 37
plt005 plt001 The constant is the average parameter for the estimated hazard (zero is neutral) Six criminal history scores labeled Criminal History
84
The Relationship between Prison Length of Stay and Recidivism -- This report was prepared by Abt Associates using Federal funding provided by the Bureau of Justice Statistics (BJS) Opinions andor points of view expressed are those of the author(s) and do not necessarily reflect the official position or policies of the US Department of Justice
Figure 10 -- Sensitivity Testing Eliminating Drug-Law Offenders from the Analysis
0 5 1
15
2 25
Relative Hazard
0 10 20 30 40 Offense Seriousness Level
Crim Hist Category 1
0 5 1
15
2 25
Relative Hazard
0 10 20 30 40 Offense Seriousness Level
Crim Hist Category 2
5
1 15
2 25
Relative Hazard
0 10 20 30 40 Offense Seriousness Level
Crim Hist Category 3
5
1 15
2 25
Relative Hazard
0 10 20 30 40 Offense Seriousness Level
Crim Hist Category 4
0 5 1
15
2 25
Relative Hazard
0 10 20 30 40 Offense Seriousness Level
Crim Hist Category 5
5
1 15
2 25
Relative Hazard
0 10 20 30 40 Offense Seriousness Level
Crim Hist Category 6
Dots are estimated relative hazards (shown if between -25 and 25)Vertical lines are 95 confidence interval for the estimated relative hazards (truncated at 25)Smooth lines are linear predictions and 95 confidence intervals for the regression line
Criminal History 1
Criminal History 2
Criminal History 3
Criminal History 4
Criminal History 5
Criminal History 6
linear 0001 (0003)
-0001 (0004)
-0001 (0003)
-0002 (0003)
0001 (0005)
-0003 (0003)
constant -0055 (0014)
-0065 (0022)
-0066 (0019)
-0057 (0022)
-0059 -0031
-0062 (0022)
R2 000 000 000 001 000 003 N 31 27 34 32 32 35
plt005 plt001 The constant is the average parameter for the estimated hazard (zero is neutral) Six criminal history scores labeled Criminal History
85
The Relationship between Prison Length of Stay and Recidivism -- This report was prepared by Abt Associates using Federal funding provided by the Bureau of Justice Statistics (BJS) Opinions andor points of view expressed are those of the author(s) and do not necessarily reflect the official position or policies of the US Department of Justice
Figure 11 -- Sensitivity Testing No Covariates
0 5 1
15
2 25
Relative Hazard
0 10 20 30 40 Offense Seriousness Level
Crim Hist Category 1
5
1 15
2 25
Relative Hazard
0 10 20 30 40 Offense Seriousness Level
Crim Hist Category 2
5
1 15
2 25
Relative Hazard
0 10 20 30 40 Offense Seriousness Level
Crim Hist Category 3
0 5 1
15
2 25
Relative Hazard
0 10 20 30 40 Offense Seriousness Level
Crim Hist Category 4
0 5 1
15
2 25
Relative Hazard
0 10 20 30 40 Offense Seriousness Level
Crim Hist Category 5
5
1 15
2 25
Relative Hazard
0 10 20 30 40 Offense Seriousness Level
Crim Hist Category 6
Dots are estimated relative hazards (shown if between -25 and 25)Vertical lines are 95 confidence interval for the estimated relative hazards (truncated at 25)Smooth lines are linear predictions and 95 confidence intervals for the regression line
Criminal History 1
Criminal History 2
Criminal History 3
Criminal History 4
Criminal History 5
Criminal History 6
linear 0001 (0003)
-0003 (0003)
-0002 (0003)
-0004 (0003)
-0002 (0004)
-0004 (0003)
constant -0062 (0015)
-0067 (0020)
-0081 (0018)
-0082 (0022)
-0071 (0028)
-0084 (0022)
R2 000 003 002 005 001 007 N 31 29 36 36 34 37
plt005 plt001 The constant is the average parameter for the estimated hazard (zero is neutral) Six criminal history scores labeled Criminal History
86
The Relationship between Prison Length of Stay and Recidivism -- This report was prepared by Abt Associates using Federal funding provided by the Bureau of Justice Statistics (BJS) Opinions andor points of view expressed are those of the author(s) and do not necessarily reflect the official position or policies of the US Department of Justice
Figure 12 -- Sensitivity Testing Using the Earlier Guidelines
0 1
2 3
4 5
Relative Hazard
0 10 20 30 40 Offense Seriousness Level
Crim Hist Category 1
0 5 1
15
2 25
Relative Hazard
0 10 20 30 40 Offense Seriousness Level
Crim Hist Category 2
5
1 15
2 25
Relative Hazard
0 10 20 30 40 Offense Seriousness Level
Crim Hist Category 3
0 5 1
15
2 25
Relative Hazard
0 10 20 30 40 Offense Seriousness Level
Crim Hist Category 4
0 5 1
15
2 25
Relative Hazard
0 10 20 30 40 Offense Seriousness Level
Crim Hist Category 5
5
1 15
2 25
Relative Hazard
0 10 20 30 40 Offense Seriousness Level
Crim Hist Category 6
Dots are estimated relative hazards (shown if between -25 and 25)Vertical lines are 95 confidence interval for the estimated relative hazards (truncated at 25)Smooth lines are linear predictions and 95 confidence intervals for the regression line
Criminal History 1
Criminal History 2
Criminal History 3
Criminal History 4
Criminal History 5
Criminal History 6
linear 0000 (0003)
0001 (0004)
0000 (0003)
-0004 (0002)
-0002 (0004)
-0004 (0003)
constant -0085 (0017)
-0097 (0025)
-0096 (0019)
-0085 (0018)
-0076 (0030)
-0081 (0028)
R2 000 000 000 007 001 004 N 31 29 34 35 33 34
plt005 plt001 The constant is the average parameter for the estimated hazard (zero is neutral) Six criminal history scores labeled Criminal History
87
The Relationship between Prison Length of Stay and Recidivism -- This report was prepared by Abt Associates using Federal funding provided by the Bureau of Justice Statistics (BJS) Opinions andor points of view expressed are those of the author(s) and do not necessarily reflect the official position or policies of the US Department of Justice
recidivism In fact increasing the length of a prison term may reduce recidivism but if so the effect
is small
As we explain the US Sentencing Guidelines provide a structure for an RDD because
holding constant factors believed to affect recidivism the guidelines recommend longer or shorter
sentences for similar offenders based on offense factors that likely have nothing to do with an
offenderrsquos risk of recidivism Many methodologists consider RDD to be a close second-best
alternative to random assignment (Cook 2008 DiNardo amp Lee 2010 US Department of Education)
so this study provides a rigorous approach to answering the research question However while we
study whether longer prison terms affect recidivism more than do shorter terms except for criminal
history our data and design provide limited information about heterogeneity
THE PAROLE EFFECT
Roodman (2016) identifies a potential source of bias of imprisonment studies because of the
inextricable dependency of time served and parole supervision Parole agencies ldquocarve uprdquo a
sentence of imprisonment into that portion to be served in prison and the remainder to be served
under community supervision Even though parole terms can be shortened because of good
behavior the length of community supervision will depend on the prison term To the extent the
prison release date is delayed the period of supervision will be curtailed The opposite is also true
shorter prison terms lead to longer parole supervision terms Roodman argues that this means there
are two simultaneous treatments that cannot be disentangled Many studies find supervision
increases returns because of the closer surveillance and the added conditions of supervision (see for
example Gaes Bales and Skaggs 2016 comparing close community supervision monitoring to regular
probation) People with longer terms of community supervision have more time and therefore more
opportunity to be revoked and irrespective of any other imprisonment impact this artifact would
4
The Relationship between Prison Length of Stay and Recidivism -- This report was prepared by Abt Associates using Federal funding provided by the Bureau of Justice Statistics (BJS) Opinions andor points of view expressed are those of the author(s) and do not necessarily reflect the official position or policies of the US Department of Justice
bias shorter prison terms toward higher levels of recidivism and longer terms toward lower
recidivism This potential bias does not affect our study because everyone in the federal system is
given a post-release term of supervision separate from the prison term One term is independent of
the other Furthermore we censor observations when a term of supervision ends This removes the
potential artifact but it also means the recidivism results might be different if federal offenders were
released without supervision as is often the case in many state jurisdictions
THEORIES ON THE EFFECT OF IMPRISONMENT
Scholars have proposed alternative theories explaining the impact of imprisonment as having
either a criminogenic or a preventativedeterrent effect The criminogenic theories include a variant
of life course research highlighting the interruption of the normal stages of adult development a
prison induced strain theory a recognition that prison is a total institution and may socialize
offenders into an anti-normative lifestyle the possibility that prison are schools for crime and the
stigma attached to incarceration once the prisoner is released Preventative theories of
imprisonment cite mechanisms involving rehabilitation and specific deterrence We discuss both
below
CRIMINOGENIC THEORIES
Loeffler (2013) cites the life course literature (Horney Osgood Marshall 1995 Sampson and
Laub 1993 Western 2002) and discusses how prison delays the normal development of adults and
interrupts many of the stabilizing events such as marriage employment and education that might
otherwise promote prosocial development Prison strain has been studied by Listwan Sullivan
Agnew Cullen and Colvin (2013) Using survey methods they examined prison deprivations and
victimization aspects of prison strain on recidivism finding evidence of a relationship between strain
variables and recidivism in the predicted direction Early ethnographers emphasize strain by
5
The Relationship between Prison Length of Stay and Recidivism -- This report was prepared by Abt Associates using Federal funding provided by the Bureau of Justice Statistics (BJS) Opinions andor points of view expressed are those of the author(s) and do not necessarily reflect the official position or policies of the US Department of Justice
recounting the pains of imprisonment However these same ethnographers also emphasize prison
socialization This scholarship includes classic ethnographies of prison life such as Sykesrsquo Society of
Captives A Study of a Maximum Security Prison (1958) and Clemmerrsquos The Prison Community (1940)
Clemmer and Sykes provided a framework for studying inmate society and culture emphasizing the
nature of prison as a total institution in which separation from the community and the relationship
between inmates and guards redefine roles rules and personal identities Later ethnographies by
Carroll (1988) Jacobs (1977) Goffman (1961) Irwin (2009) Owen (1998) and Fleisher (1989) all
emphasize the strains deriving from both prison conditions and the antagonism pitting inmates
against guards None of these ethnographers provide strong empirical support for the relationship
between acculturation strain and recidivism
A line of research employing experimental and regression discontinuity designs (Chen and
Shapiro 2007 Gaes and Camp 2009 Lerman 2009 a b) evaluate the impact of security level
placement on in-prison and post-release outcomes Under the assumption that higher security levels
produce more strain Chen and Shapiro using an RDD and Gaes and Camp using an experiment found
higher security level placement led to higher levels of post-release recidivism Lerman employing an
RDD found that inmates placed in higher security levels had friends who were more likely to be
gang-involved and who were more likely to have had prior arrests and commitments Using other
data Lerman shows how these personal networks of friends are likely to be acquired in prison
Although these studies identify security level placement as a cause of in-prison socialization and
post-prison increases in recidivism supporting strain and socialization hypotheses they cannot rule
out other mediating mechanisms such as labeling though self-identification
Other criminologists argue that prisons are schools for crime where prisoners learn from
other inmates how to become more knowledgeable offenders (Cullen Jonson and Nagin 2011
6
The Relationship between Prison Length of Stay and Recidivism -- This report was prepared by Abt Associates using Federal funding provided by the Bureau of Justice Statistics (BJS) Opinions andor points of view expressed are those of the author(s) and do not necessarily reflect the official position or policies of the US Department of Justice
Letkemann 1973 Nguyen Loughran Paternoster Fagan amp Piquero 2017) Other research
suggests that prisons reinforce cultural values conforming to criminal activity that is offenders
import these values from their community and deviant values are reinforced by the structure and
organization of prison (Carroll 1988 Irwin 1980 2005 Jacobs 1977 Wacquant 2001)
Even if an offenderrsquos orientation toward reoffending is unaltered by prison labeling
(Braithwaite 1989) may affect recidivism Ex-offenders may be denied employment or prohibited
from accessing social benefits programs after release Whether these events are internalized
limiting the offenderrsquos subjective expectations or simply reduce legitimate avenues for community
integration they may increase the propensity to reoffend By manipulating job applications (Boshier
amp Johnson 1974) or by using actors posing as prior offenders (Pager et al 2009) research has
demonstrated a stigmatizing effect of a criminal record on employment reducing legitimate
opportunities for ex-offenders especially in a low wage job market Of course the stigma may come
from any term of imprisonment and long terms may be no more disadvantageous than short terms
PREVENTATIVE THEORIES
Preventative theories of imprisonment rest on a prisonerrsquos rational expectation of future
punishment or on theories of rehabilitation that envision prison as an opportunity to reform and
retrain Specific deterrence theorists (Becker 1968) assert that offenders are rational actors
weighing the costs and benefits of crime Experiencing prison reinforces its noxiousness and
provides a disincentive to future criminal behavior Reentry programming and other rehabilitative
training adopting evidence-based practices may reduce recidivism (Andrews amp Bonta 2006 Andrews
et al 1990 Gaes et al 1999 Gendreau et al 1999 Gendreau et al 2008 MacKenzie 2006 Smith
2006) so that prison can be used to change the trajectory of criminality Longer prison terms might
allow for more intensive reentry training and longer prison terms should reinforce the expectation of
7
The Relationship between Prison Length of Stay and Recidivism -- This report was prepared by Abt Associates using Federal funding provided by the Bureau of Justice Statistics (BJS) Opinions andor points of view expressed are those of the author(s) and do not necessarily reflect the official position or policies of the US Department of Justice
future punishment However because of the strong association between age and crime longer
prison terms produce inmates who are older at the time of release so that merely incapacitating
offenders for longer periods will reduce the likelihood of crime absent any other intervention or
causal mechanism As noted in Snodgras et al (2015) length of stay and aging are inseparable causal
factors even if one controls for age at release or age at sentence
Prison experiences may unleash forces that both push offenders away from crime and pull
them toward reoffending However as Loefler (2013) argues prison may simply collect people who
are predisposed toward criminality because of pre-existing life experiences and deficits He calls this
social selection crediting Manski and Nagin (1998) Nagin Cullen and Jonson (2009) and Smith and
Paternoster (1990) Loeffler argues that imprisonment itself is a highly selective process Only a small
proportion of people are imprisoned even people who are committed for the first time usually have
an extensive history of criminal justice contacts From this point of view prison has no causal
impact it is where offenders are housed much as hospitals are places where people predisposed to
illness are treated Loefflerrsquos argument is more relevant to an analysis of imprisonment than to
length of stay The relevant question we address is Even if there is a selection process does length
of stay have an impact on future reoffending
PRIOR STUDIES OF PRISON LENGTH OF STAY
Relying on criminological theory then provides no clear expectation of whether
incarceration will decrease or increase reoffending Nagin et al (2009) review empirical studies
addressing the question of whether on balance imprisonment pushes ex-offenders away or pulls ex-
offenders towards new crime They conclude that imprisonment per se seems to have a
criminogenic effect although they recognize studies that contradict that conclusion Nagin et al also
state there is little convincing evidence that length of stay ndash in their parlance prison dosage ndash
8
The Relationship between Prison Length of Stay and Recidivism -- This report was prepared by Abt Associates using Federal funding provided by the Bureau of Justice Statistics (BJS) Opinions andor points of view expressed are those of the author(s) and do not necessarily reflect the official position or policies of the US Department of Justice
increases recidivism They are skeptical of observational studies that use regression procedures to
uncover the causal impact of prison length of stay because identification requires an exacting
standard -- selection on observables (Rosenbaum 2002) -- in which covariates completely adjust for
any spurious relationship between time-served and recidivism
Nagin Cullen and Jonson (2009) identify 14 regression studies two experiments and three
matching studies evaluating the effect of length of stay in their 2009 review Because we are also
skeptical of the regression studies we do not review them1 The experimental studies of length of
stay by Berecochea and Jaman (1981) and Deschenes Turner and Petersilia (1995) manipulated
sentence reductions for offenders who had already served time in prison Part of the study design
for the Deschenes et al experiment diverted offenders from prison and would qualify as an
imprisonment but not a length of stay study However a subset of offenders was randomly assigned
to early release to be placed on intensive community supervision Analysis of the 17 dependent
variables showed only one that was significantly affected by prison length The Berecochea and
Jaman experiment randomly assigned offenders to a six-month reduction which was on average a
16 percent sentence reduction Inmates receiving a sentence reduction had higher parole failure
rates at one and two years after the release from prison but these differences were not statistically
significant Thus rigorous random design studies do not find that increasing prison length either
increases or decreases future criminality
Of the three matching studies identified by Nagin Cullen and Jonson (2009) two evaluate
length of stay on juveniles (Kraus 1981 and Loughran et al 2009) The third study by Jaman
Dickover and Bennett (1972) found recidivism to be higher for adult male burglars receiving 25
months or longer versus those serving 24 or fewer months but the difference was only significant at
1 The 14 regression studies mostly find null effects with specific deterrent and criminogenic effects about equal 9
The Relationship between Prison Length of Stay and Recidivism -- This report was prepared by Abt Associates using Federal funding provided by the Bureau of Justice Statistics (BJS) Opinions andor points of view expressed are those of the author(s) and do not necessarily reflect the official position or policies of the US Department of Justice
the 24-month horizon Kraus (1981) evaluated length of stay contrasts for juveniles that depended
on the juvenilersquos age group For example Kraus contrasted a term of 8 to 20 months versus a term up
to 7 months for 14 and 15-year oldrsquos however for juveniles who were 13 the contrast was between
9 to 16 months and 8 months or less None of the contrasts were statistically significant Loughran et
al (2009) employ propensity score methods The authors categorized the continuous length of stay
into discrete ordinal categories and used ordinal logit to estimate propensity scores The variation in
length of stay extended from 0-3 months up to greater than 12 months Whether using arrest or
self-reported reoffending Loughran et al found no marginal effect of length of stay on either
outcome
Meade Steiner Makarios and Travis (2012) also used ordinal logit to estimate the propensity
score creating ordered subsamples stratified by the estimated log odds of being in a category of
length of stay They stratified their sample into dosage categories and compared people within a
ldquodosagerdquo stratum to those with ldquosimilarrdquo propensity scores who had longer or shorter sentences
Meade et al found that beyond 16 months higher doses of imprisonment lowered recidivism (felony
arrest) however only the highest dose (gt= 78 months) was statistically significant
Snodgrass Blokland Haviland Nieuwbeerta and Nagin (2011) also conducted a dosage
study of time served among prisoners in the Netherlands and restricted their sample to first time
commitments convicted of violent property or drug offenses who were between age 12-40 and who
had sufficient time post-release to assess recidivism The discrete categories of time served were 1
month or less 1-2 months 2-3 months 3-6 months 6-12 months and 12+ months Consistent with
the other propensity score studies they estimated the propensity score using ordinal logit with many
covariates to predict the ordinal level of prison length of stay Rather than use only the propensity
scores to match offenders they used exact matches on sex age (+- two years) and one of four
10
The Relationship between Prison Length of Stay and Recidivism -- This report was prepared by Abt Associates using Federal funding provided by the Bureau of Justice Statistics (BJS) Opinions andor points of view expressed are those of the author(s) and do not necessarily reflect the official position or policies of the US Department of Justice
trajectory group memberships as well as a propensity score matching caliper of 15 The matched
pairings produced sets of offenders who served different sentence lengths The matched pairs
allowed Snodgrass et al to examine measures of recidivism comparing any given ordinal category of
length of stay to the other categories where a matched pair could be found The results showed no
relationship between length of stay and recidivism The Snodgrass et al study takes great care in
constructing counterfactuals for the offenders within a given length of stay class But as they note
the average levels of time served are much shorter than one would observe in most United States
adult prison samples
Roach and Schanzenbach (2015) use randomization of judges assigned to sentencing
convicted offenders to map the relationship between length of stay (median of 4 months) and one
two and three-year rates of recidivism Using reduced form and two-stage regression they find that
each additional month of sentence length decreases recidivism by about 1 percent When they
stratify on criminal history Roach and Schanzenbach find a strong effect of sentence length for
offenders with minimal criminal history and a weak or insignificant effect for offenders with more
extensive criminal histories They also found that relative to the base hazard rate the impact
occurred almost entirely within the first year of release Roach and Schanzenbach argue the impact
of length of stay is a combination of severity of punishment and rehabilitation The researchers argue
that offenders with longer sentences can participate in more rehabilitative prison programs Roach
and Schanzenbachrsquos Table 2 (page 19) does indicate possible sources of bias in the relationship
between length of stay and recidivism The judge dummy variables not only demonstrate a strong
relationship to sentence length essential to the study design but they also predict the offenderrsquos
offense severity level and number of prior non-violent convictions These offender characteristics
could be associated with the sentence length and the level of recidivism qualifying as backdoor
variables (Morgan and Winship 2015) Roodmanrsquos (2016) review of this study offers the possibility
11
The Relationship between Prison Length of Stay and Recidivism -- This report was prepared by Abt Associates using Federal funding provided by the Bureau of Justice Statistics (BJS) Opinions andor points of view expressed are those of the author(s) and do not necessarily reflect the official position or policies of the US Department of Justice
the longer sentences in this study would lead to longer parole supervision elevating recidivism
because of technical parole violations
Kuziemko (2012) uses the Georgia parole guideline grid as a means of identifying the causal
effect of length of stay She restricts her analysis to offenders with less severe offenses and whose
criminal history category is in the average to high range She uses the discontinuity in the grid
recommendation (separating high from average risk) as an instrument for time served with the
instrumented time served in stage one and recidivism regressed on the instrument in stage two
along with other covariates One of her estimates restricts the sample to people whose points are
just above or just below the discontinuity threshold (8 versus 9 points) which should yield the best
approximation to an exogenous variation She finds each additional month of time served lowers the
three-year recidivism rate by 15 percent It is not clear why Kuziemko restricted her analysis to this
threshold limiting the analysis to a narrow range of the guideline grid Most offenders have lower
criminal history scores and restricting the analysis to the higher thresholds limits the generalizability
of the study In fact Roodmanrsquos (2016) reanalysis of these data evaluates other discontinuity cut
points and finds either insignificant length of stay coefficients or coefficients with the opposite sign
indicating increased length of stay increases the probability of recidivism
Mears et al (2016) used the generalized propensity score to balance covariates across levels
of length of stay They balanced within four subgroups of time served categories using
demographics categories of commitment offense offense severity scores prior record scores
dummy coded year of release and dummy coded judicial district While they achieved balance on
this set of covariates they did not conduct a sensitivity test to evaluate the potential impact of an
omitted variable (Rosenbaum 2002) Mears et al (2016) found the effect of time served on
recidivism depended on the level of length of stay Short terms produced increased recidivism up to
12
The Relationship between Prison Length of Stay and Recidivism -- This report was prepared by Abt Associates using Federal funding provided by the Bureau of Justice Statistics (BJS) Opinions andor points of view expressed are those of the author(s) and do not necessarily reflect the official position or policies of the US Department of Justice
one year From one to two years time served decreases recidivism and thereafter has no effect
Long terms (more than 6 years) could not be evaluated due to large error terms
An RDD design employed by Hjalmarsson (2009) was also based on a guideline system
however the study applied to a juvenile population in the state of Washington and the discontinuity
was based on a sanction to a state run juvenile facility versus a local sanction This latter punishment
included sanctions involving much shorter sentences served in a local facility a term of community
supervision fines or community service Hjalmarsson found a deterrent effect of state-run
confinement for juveniles compared to the local sanctions This study was not a test of length of
stay but a test of state-run juvenile confinement as opposed to a bevy of alternate juvenile
punishments To control for the fact the running variable was correlated with recidivism across
levels of criminal history the study used a quadratic regression of the running variable
Furthermore the author used all the data without regard for bandwidth This puts tremendous
pressure on his quadratic expression being correct Secondly rather than using an intent-to-treat
estimator and perhaps converting that into LATE the author drops cross-overs from the
analysis There is no justification for doing so and we are unaware of other RDDrsquos that takes such a
step Finally the author made no attempt to justify an implicit assumption that right-hand-censoring
is independent In fact given data construction and what we know about juvenile justice right-
hand-censoring is unlikely to be independent Specifically offenders with longer terms are more
likely to be censored This relationship alone may explain the findings that incarceration reduced
recidivism
One last study of note was conducted by Drago Galbiati and Vertova (2009) in which the
authors examined the effect of a Clemency Bill in Italy that shortened the sentence of offenders
anywhere from 1 to 36 months This could be described as an exogenous treatment since the
13
The Relationship between Prison Length of Stay and Recidivism -- This report was prepared by Abt Associates using Federal funding provided by the Bureau of Justice Statistics (BJS) Opinions andor points of view expressed are those of the author(s) and do not necessarily reflect the official position or policies of the US Department of Justice
application of clemency was applied irrespective of criminal history offense age and other factors
affecting the outcome However the early release came with a caveat The remaining time to serve
would be reinstated if the offender was convicted of another crime within five years So this was a
reduction in length of stay with an added disincentive to commit a new offense People who had
spent more time in prison were less likely to reoffend and each month of remaining time to serve
was associated with a 124 percent reduction to commit a new crime2
Even with these additional studies the literature on length of stay using strong
counterfactual designs is still sparse and presents a mixed picture of effects Most studies show no
effect or that increased prison length reduces recidivism slightly Several are imbalanced in ways
that could bias the length of stay effects The studies also span different populations juveniles
adults and cover different international jurisdictions (Italy the Netherlands and United Sates) The
present study uses a very large sample of federal offenders sentenced to prison with varying lengths
of stay
INCARCERATION TREATMENT HETEROGENEITY
Scholars have argued that prison dosage (length of stay) may have different effects
conditional on factors associated with the individual with the social context with sentencing
structure and with potentially many other factors The National Academy of Sciences study on mass
incarceration finds evidence for the heterogeneity of incarceration effects (NRC 2014 427) But we
need a template to systematically examine incarceration heterogeneity
Mears Cochran and Cullen (2014) provide one such template They propose three types of
sources of heterogeneity prior sanctioning experience in-prison experiences and the level of post-
2 Kuziemko (2012) also capitalizes on early release in Georgia because jail overcrowding allowed her to compare offenders with different amounts of time served having the same prior risk levels She finds people with longer time served have lower recidivism rates These results are challenged by Roodman as possible evidence of parole bias in Kuziemkorsquos analysis
14
The Relationship between Prison Length of Stay and Recidivism -- This report was prepared by Abt Associates using Federal funding provided by the Bureau of Justice Statistics (BJS) Opinions andor points of view expressed are those of the author(s) and do not necessarily reflect the official position or policies of the US Department of Justice
release supervision ndash a pre- within- post-custody framework The National Academy of Sciences
report takes an even broader perspective by suggesting that there may be incarceration effects for
different units ndash the effect on people may be substantially different than the effect on families or
neighborhoods Based on the Mears et al hypothesized framework it seems sentencing jurisdictions
will vary on many of the important pre within and post dimensions We may be reluctant to accept
that results from Florida apply to Massachusetts unless we have a framework that tells us how to
compare jurisdictions within this pre within and post sentencing framework
For the current application we use the structure of the U S Sentencing Guidelines
sanctioning grid in our RDD design to test whether criminal history or offense seriousness moderates
the effect of length of stay increments We find that increments in length of stay have about the
same effect regardless of either of these dimensions We also separately evaluate criminal history
sex race education and marital status all showing homogeneous effects of length of stay
PRESENT METHODOLOGY DATA STATISTICS AND INFERENCE
This methodology section has three parts The first part identifies the source of the data ndash
the Federal Justice Statistics Program To provide necessary background before discussing the
regression discontinuity design the second part summarizes the US Sentencing Guidelines The
third part discusses statistical methods and the RDD identification strategy3 This application of RDD
is unconventional There are multiple break-points and hence multiple effects the effects are
summarized using a meta-regression borrowed from meta-analysis Furthermore for each effect
the bandwidth is exactly two units so search for an optimal bandwidth is not a concern Several
3 Some readers may prefer to characterize our approach as using instrumental variables The US Sentencing Guidelines are the instrument that moves offenders who otherwise have the same propensity to recidivate between two guidelines cells the first of which prescribes a shorter prison term on average than does the second Because there are many guideline cells there are many estimates based on contiguous cells The multiple estimates are averaged using inverse variance weights
15
The Relationship between Prison Length of Stay and Recidivism -- This report was prepared by Abt Associates using Federal funding provided by the Bureau of Justice Statistics (BJS) Opinions andor points of view expressed are those of the author(s) and do not necessarily reflect the official position or policies of the US Department of Justice
conventional tests used in RDD are inapplicable in this setting For example we need not test how
expanding the bandwidth affects estimates
Although the parallel is disputed (Imbens amp Lemieux 2007) some see RDD as an
instrumental variable estimator and it is practical to employ IV as the estimator This alternative
estimator is also used in this study Results show the RDD estimator and the IV estimator yield
essentially the same results
Data Source
Data for this study come from the Federal Justice Statistics Program (FJSP) a Bureau of
Justice Statistics (BJS) sponsored project to assemble federal justice records To be included in the
analysis an offender must have been sentenced under the guidelines between 1999 and 2014
Practically the period studied is shorter because to be included in the analysis an offender must have
entered community supervision but many offenders sentenced between 1999 and 2014 were still
incarcerated at the end of 2014
The FJSP has a thirty-five-year history however recent refinements link federal offenders
from investigation through corrections This paper uses a subset of the linked data running from
sentencing through a single cycle of release to community supervision and possible recidivism The
US Sentencing Commission (USSC) provides data on offenses and offenders at the time of
sentencing the Administrative Office of the US Courts (AOUSC) provides data on offenders under
community supervision and the Bureau of Prisons (BOP) provides data on offenders during periods
of incarceration Details regarding construction of the FJSP data appear elsewhere (Kling et al
2016) this paper summarizes
16
The Relationship between Prison Length of Stay and Recidivism -- This report was prepared by Abt Associates using Federal funding provided by the Bureau of Justice Statistics (BJS) Opinions andor points of view expressed are those of the author(s) and do not necessarily reflect the official position or policies of the US Department of Justice
Since 1987 federal offenders have been sentenced using sentencing guidelines and data
about guideline application have been assembled (and contributed to the FJSP) by the USSC
Guidelines data provide detailed accounts of the offenderrsquos criminal history the offense of
conviction the sentence imposed and expected prison time Expected prison time differs from
actual prison time but the two are close because sentencing in the federal system uses determinate
or real-time sentencing and as explained below actual time-served is observed with systematic
error
When an offender is sentenced to prison he or she serves time in a facility run by the
Federal Bureau of Prisons (BOP) which reports data from its inmate tracking system (SENTRY) to the
FJSP Most offender prison terms are recorded in SENTRY but some are not because (1) some
offenders are sentenced to time-served prior to trial (2) some offenders spend part of their terms in
state detention and (3) terms of thirty days or fewer are inconsistently recorded in SENTRY Because
of these limitations we use expected time-served reported by the USSC as a measure of prison time
However we use admission into a BOP facility during the period of community corrections as one
measure of recidivism
When an offender is sentenced to probation or when an offender leaves prison to serve a
statutorily required term of supervised release (a judge-imposed sentence to post-incarceration
supervision) his or her term of community supervision is recorded in Probation and Pretrial Services
Automated Case Tracking System (PACTS) an information system maintained by the Administrative
Office of the U S Courts specifically by the Probation and Pretrial Services Office (PPSO) After
some manipulation4 the PACTS data record periods of community supervision and outcomes Being
4 Federal probation officers frequently open terms of probation before the offender is sentenced and terms of supervised release before the offender is released from prison For probation the probation officer may be responsible for pretrial supervision continued into post-conviction supervision and this appears as a continuous period of community supervision
17
The Relationship between Prison Length of Stay and Recidivism -- This report was prepared by Abt Associates using Federal funding provided by the Bureau of Justice Statistics (BJS) Opinions andor points of view expressed are those of the author(s) and do not necessarily reflect the official position or policies of the US Department of Justice
revoked from community supervision is another measure of recidivism Every federal offender in our
sample received a term of community supervision eliminating one source of variability and
heterogeneity
For the recidivism analysis time-at-risk starts with the beginning of a term of supervised
release for offenders sentenced to prison The time-at-risk ends with recidivism or with the first
occurrence of one of the following censoring events completion of the community supervision term
three years or with the end of data collection Using the measures described above recidivism is
defined by the occurrence of a recognized failure event If the offender reappears in the federal BOP
data he or she is deemed to have recidivated If the offender does not reappear in the BOP data but
we observe the offender is revoked from community supervision he or she is deemed to have
recidivated Although there are several explanations for being revoked from supervision but not
entering federal prison one common reason is the offender is arrested for a state-level crime and
detained in state custody pending trial The date when an offender reenters prison is the date of
recidivism if the offender does not reenter prison but is revoked from supervision the date of the
revocation is the date of recidivism Based on years of working with the PPSO checking algorithms
with PPSO administrative staff and field staff we have confirmed that this approach ndash providing
primacy to returning to prison according to the BOP ndash is the best way to identify recidivism5
Many federal offenders are arrested for new crimes without returning to prison or having
their community supervision status revoked Using the FJSP data we estimate three-year recidivism
in the FJSP Also for probation an officer may open a supervision record when preparing a presentence report The correction is to change the beginning of supervision to the date of sentencing For a term of supervised release the probation officer might open the term in preparation for post-release planning To correct this we changed the beginning of supervision to coincide with the end of prison 5 An offenderrsquos community supervision must be revoked before he or she is committed to prison so the date of revocation would seem to be the better date for the failure event In fact probation officers often fail or are unable to record the date of revocation until weeks or months after it occurs Consequently the date of entering prison (when it occurs) is a more accurate indicator for a study of recidivism
18
The Relationship between Prison Length of Stay and Recidivism -- This report was prepared by Abt Associates using Federal funding provided by the Bureau of Justice Statistics (BJS) Opinions andor points of view expressed are those of the author(s) and do not necessarily reflect the official position or policies of the US Department of Justice
rates of about 20 percent for federal offenders placed on community supervision If new arrests
were included in the analysis the recidivism rate would be closer to 30 percent6 The FJSP does not
include arrest data so we could not define recidivism as being arrested but an arrest that does not
result in revocation is typically for a minor or unfounded crime so the outcome measures used in
this study are for events that are sufficiently serious to provoke a return to custody
To be included in the analysis the offender must have been convicted and sentenced under
the US Sentencing Guidelines since 1999 This is the period covered by the data linkage Only
offenders convicted of felonies and serious misdemeanors are sentenced routinely under the
guidelines so this study is limited to those serious offenders Others rarely serve prison terms so
the omission is inconsequential To be included in the study the offender must have entered
community supervision else we could not identify a recidivism follow-up period Because of this
requirement some offenders sentenced under the guidelines are excluded from the analysis
Several reasons explain why offenders do not enter community supervision First before entering
community supervision offenders sentenced to prison must have been released from prison
Second many federal offenders are foreign nationals in the country legally or illegally they are often
deported upon prison release so they are not candidates for a recidivism study and consequently
this study is based on US citizens7 Some other offenders are released from prison to detainers
exercised by state authorities Because offenders who never enter community supervision provide
no information for analysis they are excluded from the analysis file
6 The authors have worked with PPSO for six years to match community supervision records with criminal history records (eg criminal record histories held by state authorities and linked using an FBI index) Data use agreements preclude including criminal history records in the FJSP so they are unavailable for this analysis Based on our work with PPSO we know that recidivism rates based on arrests are near 30 percent 7 Non-citizens are sentenced to community supervision but they are deported and never enter active community supervision If they reenter the county illegally their supervision status can be revoked However this form of recidivism is very different from the form of recidivism studied in this paper so we chose to exclude non-citizens We might have retained non-citizens who entered active community supervision but they are difficult to distinguish reliably in the OBTS so we chose to exclude all non-citizens
19
The Relationship between Prison Length of Stay and Recidivism -- This report was prepared by Abt Associates using Federal funding provided by the Bureau of Justice Statistics (BJS) Opinions andor points of view expressed are those of the author(s) and do not necessarily reflect the official position or policies of the US Department of Justice
Data limitations discussed in this section seem to raise concerns about bias when measuring
recidivism but these concerns are not serious for this study Essentially a RDD study compares
offenders from group A with offenders from group B where group A and group B are closely
matched Due to matching whatever biases arise regarding the measurement of recidivism are likely
the same in groups A and B Therefore a comparison of recidivism for groups A and B is valid even if
estimates of recidivism are systematically biased
SENTENCING GUIDELINES
Explaining the RDD requires a short description of federal sentencing guidelines Under the
guidelines offense seriousness is determined by a complex set of rules that take the offense of
conviction and real offense behavior into account to classify sentencing factors into one of 43 offense
seriousness levels with j=1 being the least serious and j=43 being the most serious and six criminal
history categories with k=1 being the least serious (least likely to recidivate) and k=6 being the most
serious (most likely to recidivate) By design the offense seriousness levels reflect the USSCrsquos
assessment of offense seriousness and do not consider an offenderrsquos threat to recidivate Likewise
by design the offenderrsquos criminal history category reflects the USSCrsquos assessment of the likelihood
that an offender will recidivate Important to note subtle differences in offense conduct cause an
offenderrsquos crime to be associated with offense level j rather than offense level j-1 or j+1 For
example unarmed bank robbers armed bank robbers who do not display their weapons armed
bank robbers who display but do not threaten with their weapons and bank robbers who explicitly
threaten with their weapons all appear in different seriousness levels Furthermore offenders
convicted of violent crimes drug-law violations and property crimes can all appear in the same
offense seriousness level Based on this subtlety we expect that offenders in offense seriousness
level j will not be inherently more likely to recidivate than will offenders in seriousness levels j-1 and
20
The Relationship between Prison Length of Stay and Recidivism -- This report was prepared by Abt Associates using Federal funding provided by the Bureau of Justice Statistics (BJS) Opinions andor points of view expressed are those of the author(s) and do not necessarily reflect the official position or policies of the US Department of Justice
j+1 provided criminal history is held constant8 In fact holding criminal history constant it seems
likely that offenders in offense seriousness category j are not inherently more or less likely to
recidivate than are offenders in offense seriousness categories j-k and j+k where k is a small number
This assumption provides the identification logic for the RDD and for the instrumental variable
alternative
Under the guidelines another complex set of rules determine criminal history points which
are collapsed into six criminal history categories for the guidelines application with category 1 being
the least serious criminal record and category 6 being the most serious record Based on the offense
seriousness level and the criminal history category the federal sentencing guidelines are a 43x6 grid
comprising 43 offense seriousness rows and 6 criminal history columns Holding the criminal history
category constant moving down the grid from least serious offense level to most serious offense
level the recommended prison term increases Holding the offense seriousness level constant
moving from left to right across the grid from least serious criminal history category to most serious
criminal history category the recommended prison term increases For the least serious offenses
and for the least dangerous offenders the guidelines recommend probation or alternative sanctions
although prison terms are allowed and sometimes imposed
Every year the Commission can recommend changes to the guidelines for Congressional
approval and in fact the guidelines have changed over time These changes have little consequence
for the analysis reported in this paper Even if the composition of offenders within specific guideline
cells has changed over time recommended sentence terms have always increased with offense
8 Possibly some factors entering the determination of the offense seriousness level might predict recidivism However crimes committed in the federal system are so diverse and factors entering the guidelines are so detailed it seems unlikely that increases in the offense seriousness levels would be systematically associated with recidivism holding criminal history constant Possibly for some cell jj+1 comparisons factors that enter the offense seriousness determination may cause recidivism to increase or decrease but provided these factors are not systematic ndash meaning that they do not always increase recidivism as the comparison moves from cell j to j+1 ndash the treatment effect is still identified
21
The Relationship between Prison Length of Stay and Recidivism -- This report was prepared by Abt Associates using Federal funding provided by the Bureau of Justice Statistics (BJS) Opinions andor points of view expressed are those of the author(s) and do not necessarily reflect the official position or policies of the US Department of Justice
seriousness level As explained in this next section that regularity is sufficient to support the RDD
estimation procedure
THE RDD AND STATISTICAL METHODOLOGY
During the last decade methods for inferring causality have gone well beyond naive
regression models criticized by Nagin and his colleagues (Morgan amp Winship 2015 Imbens amp Rubin
2015) A regression discontinuity design (Hahn Todd amp van der Klauuw 2001 van der Klaauw 2002
Imbens amp Lemieux 2007 Lee amp Lemieux 2010 Bloom 2012) is a rigorous approach often applied in
non-criminal justice research and sometimes applied in criminal justice studies (Berk amp Rauma 1983
Berk amp DeLeeuw 1999 Berk 2010 Rhodes amp Jalbert Regression Discontiuity Design in Criminal
Justice Evaluation An Introduction and Illustration 2013) Commonly the RDD is applied in a setting
where a decision rule based on factors (such as offense seriousness level holding criminal history
constant) can be used to define a ldquocut-pointrdquo that places study subjects (such as offenders) into one
group that does and another group that does not receive treatment Very near that rule-imposed
cut-point study subjects who do and do not receive treatment are so similar that a comparison of
outcomes for the two groups is deemed valid This section explains that our application of the RDD
identification strategy differs from the conventional application
One difference between our application and the standard application is that for us treatment
is a dose (eg the length of a prison term) while in standard applications treatment is a binary
condition On average the dose received by offenders in cell j+1 is higher than the dose received by
offenders in cell j Because offenders in cells j and j+1 are otherwise the same regarding the threat to
recidivate we can ask whether offenders in cell j+1 have higher or lower recidivism rates than
offenders in cell j and if so we have justification for attributing causation As a stylized example
22
The Relationship between Prison Length of Stay and Recidivism -- This report was prepared by Abt Associates using Federal funding provided by the Bureau of Justice Statistics (BJS) Opinions andor points of view expressed are those of the author(s) and do not necessarily reflect the official position or policies of the US Department of Justice
suppose first-time offenders who steal $100000 are sentenced according to offense seriousness
level j while first-time offenders who steal $125000 are sentenced according to offense seriousness
level j+1 In deference to the more serious crime the guidelines call for a term between 20 and 23
months for first-time offenders sentenced within guideline cell j and between 22 and 26 months for
first-time offenders sentenced within guidelines cell j+1 Given judicial discretion sentences imposed
on offenders within guideline cell j overlap with sentences imposed on offenders within guideline cell
j+1 but on average prison sentences within guideline cell j+1 are longer than those imposed within
guideline cell j This average difference drives the identification strategy Specifically holding the
criminal history category constant offenders sentenced within guideline cell j+1 are not inherently
more recidivistic than are offenders sentenced within guideline cell j but offenders sentenced within
guideline cell j+1 receive longer prison terms on average and we can test for whether those longer
prison terms account for higher or lower recidivism
Usually when applying RDD researchers consider a variable X (called a running variable in
the RDD context) and a critical value Xo that assigns study subjects to a comparison group when X lt
Xo and to a treatment group otherwise A sharp design occurs when the assignment is exact a fuzzy
design occurs when the assignment is inexact Although both sharp and fuzzy designs both estimate
the treatment effect sharp designs are preferred because (from a statistical estimation standpoint)
they are more efficient and interpreting the effect is clear
When treatment is binary as it is in standard applications the distinction between sharp and
fuzzy is straightforward Let PL be the probability of treatment when X lt Xo and let PR be the
probability of treatment otherwise If PL = 0 and PR = 1 then the design is sharp Let YL be the mean
outcome when X lt Xo and let YR be the mean outcome otherwise An estimator for the treatment
effect is YR-YL or just the difference in the mean outcomes But suppose that PL ge 0 or PR le 1 or both
23
The Relationship between Prison Length of Stay and Recidivism -- This report was prepared by Abt Associates using Federal funding provided by the Bureau of Justice Statistics (BJS) Opinions andor points of view expressed are those of the author(s) and do not necessarily reflect the official position or policies of the US Department of Justice
then the design is fuzzy Given a fuzzy RDD an often-used estimator is (YR-YL)(PR-PL) This
alternative estimator is sometimes called a local average treatment effect (LATE) Note the
numerator is an intent-to-treat estimator and in fact statistical testing is based on the numerator
because dividing by a constant will not change the properties of the basic test of whether treatment
is effective
For our application treatment is a dose and doses are distributed about a mean that
depends on whether X lt Xo or X ge Xo A necessary condition is that a shift in the offender from
guideline cell j to guideline cell j+1 will always (a sharp design) or sometime (a fuzzy design) cause an
offender to receive a longer prison term The monotonicity assumption is that this shift will never
cause an offender to receive a shorter prison term We presume the monotonicity assumption holds
and see no reason to assume otherwise
A test of the null hypothesis of no treatment effect is based on YR-YL Let TL be the average
prison term for X lt Xo let TR be the average prison term for X ge Xo Then the counterpart to the LATE
estimator for the binary treatment effect is (YR-YL)(TR-TL) or the change in recidivism per unit of
additional prison This too is a local average treatment effect Its interpretation is the average
increasedecrease in recidivism resulting from an average increase in prison length
In both these illustrations the estimator is LATE LATE is not necessarily the average
treatment effect or in this case the average increasedecrease in recidivism from increasing time-
served by one unit However LATE is almost always used as a substitute for that average which is
unidentified (Imbens 2009)
Returning to the standard application the ideal identification strategy requires that
estimation be limited to study subjects whose X values are just slightly less than Xo or equal to or
24
The Relationship between Prison Length of Stay and Recidivism -- This report was prepared by Abt Associates using Federal funding provided by the Bureau of Justice Statistics (BJS) Opinions andor points of view expressed are those of the author(s) and do not necessarily reflect the official position or policies of the US Department of Justice
slightly more than Xo9 Because very few observations meet these demanding conditions evaluators
usually expand the bandwidth to be broader than ldquoslightly lessrdquo and ldquoslightly morerdquo Because this
expansion of the bandwidth violates the asymptotic identification assumptions evaluators typically
assume that a local linear regression of the outcome variable Y on X will capture the relationship
between Y and X absent any intervention Given the intervention any departure from the local linear
regression around Xo is deemed the treatment effect A standard application would test the
credibility of this local linear regression and a standard application would test the sensitivity of
findings to the size of the bandwidth
Our application differs from the standard application in important ways Typically when
researchers apply the RDD strategy there is a single cut-point so there is a single estimate of the
treatment effect Less commonly there are multiple cut-points and a researcher can estimate
multiple treatment effects (Cattaneo Keele Tituinik amp Vazquez-Bare 2016) Given the structure of
the sentencing guidelines our study is based on a multiple cut-point RDD That is we estimate
multiple effects then combine them to generalize conclusions
Rather than increasing efficacy by expanding the bandwidth we always make comparison
across adjacent cells so that cell j is deemed ldquoslightly lessrdquo than the offense seriousness level that
determines cell j+1 Employing multiple cut-points achieves small standard errors by combining the
multiple estimates that arise from comparing outcomes for cells jj+1 j+1j+2 j+2j+3 and so on It is
unnecessary to expand the bandwidth beyond two units
9 ldquoSlightly lessrdquo and ldquoslightly morerdquo mean than X falls within a region X+δ and X-δ as δ approaches zero Expanding the bandwidth means that δ is allowed to get bigger
25
The Relationship between Prison Length of Stay and Recidivism -- This report was prepared by Abt Associates using Federal funding provided by the Bureau of Justice Statistics (BJS) Opinions andor points of view expressed are those of the author(s) and do not necessarily reflect the official position or policies of the US Department of Justice
In the conventional application a researcher would assure the relationship between the
outcome variable and the running variable is linear to the left and right of the breakpoint10 Because
our approach employs just two points j and j+1 this test is unavailable to us Arguably it is also
inapplicable because when estimating an effect we do not expand the bandwidth beyond j and j+1
In the conventional application the researcher will assure there is a discontinuity in treatment so
that treatment is more likely for those to the right of the cut-point than it is for those to the left We
do apply this conventional test showing that it holds
In conventional RDD analysis researchers worry about ldquogamingrdquo In the present context
defense attorneys have incentives to move their clients to lower guideline cells and prosecuting
attorneys have countervailing incentives to move offenders to higher guideline cells Gaming is
possible by manipulating guideline elements such as the amount of money stolen Defense
attorneys would argue the amount is lower than alleged prosecutors would argue the opposite In
conventional RDD analysis researchers use imperfect devices to test for gaming but those tests are
not necessary in the present context
To explain suppose a variable Z is associated with recidivism and is subject to gaming such
that defense attorneys are generally able to shift offenders from cell j+1 to cell j based on the value
of Z In our study we would expect a general shift in Z from j+2 to j+1 from j+1 to j from j to j-1
from j-1 to j-2 and so on In general this shift would have no effect on the contrasts because it
occurs across all adjacent cells Thus gaming is less relevant for a multiple-effect RDD than for a
conventional single-effect RDD Furthermore we are only concerned with gaming about variables
10 Postulating a linear relationship is frequent but some researchers expand their models to allow power functions of the running variable Hjalmarsson (2009) in a study of guidelines and juvenile justice discussed earlier used a quadratic This is a dangerous practice because the validity of the quadratic is difficult to assess and findings based on a RDD are sensitive to getting the model specification correct There are other elaborate alternatives to using local linear regressions but they are not applicable to our study
26
The Relationship between Prison Length of Stay and Recidivism -- This report was prepared by Abt Associates using Federal funding provided by the Bureau of Justice Statistics (BJS) Opinions andor points of view expressed are those of the author(s) and do not necessarily reflect the official position or policies of the US Department of Justice
that affect recidivism Because criminal history is held constant by construction of the guideline cells
the avenue for gaming is restricted Nevertheless we introduce some test for whether variable
associated with recidivism vary systematically across cells so that for example we ask whether
offenders in cell j+1 tend to be older than offenders in cell j We introduce these potential
confounders into the local linear regression Although we do not need a local linear regression for
identification we increase the efficiency of estimates by using a regression to include covariates in
the analysis Given the nature of the outcome variable when comparing outcomes in cells j and j+1
our study uses a Cox survival model sometimes called a Cox proportional hazard model but it is
ldquolocalrdquo only in the sense that (absent the intervention) the baseline survival model is invariant
around the cut-point and we estimate the treatment effect from a unit shift There exists an
extensive methodological literature on survival models (Lancaster 1990 Kalbfleisch amp Prentice
2002 Hosmer Lemeshow amp May 2008) which are frequently applied in studies of criminal
recidivism where time-at-risk is often censored A separate study justifies using the proportional
hazard model (rather than a parametric alternative) to study recidivism in the federal system
(Rhodes et al 2012) Although the approach seems uncommon others have used survival models as
the estimator in a RDD context (Rhodes amp Jalbert 2013 Bor Moscoe Mutevedzi Newell amp
Barnighausem 2014) We use the RDD identification strategy and the survival model estimation
strategy to identify and estimate the change in the hazard of recidivism across paired guideline cells
The most defensible approach consistent with the intuition of the RDD would seem to be to
compare the relative hazards for cell j and j+1 (holding criminal history category constant) because
offenders in cells j and j+1 are more alike than in any other comparison Both the previous discussion
and descriptive statistics discussed subsequently points toward a problem Cells j and j+1 are so
27
The Relationship between Prison Length of Stay and Recidivism -- This report was prepared by Abt Associates using Federal funding provided by the Bureau of Justice Statistics (BJS) Opinions andor points of view expressed are those of the author(s) and do not necessarily reflect the official position or policies of the US Department of Justice
alike the average time-served is not guaranteed to increase when comparing cell j to cell j+111 Even
when it increases the size of the increase may be so small that it is not informative As an extreme
example there is not much use in comparing recidivism for offenders who serve two years on
average when sentenced within cell j and two years plus one day on average when sentenced within
cell j+1 From experimentation to assure that average time served will increase between contrasted
cells we have found it better to compare the outcome from cell j and cell j+212 Notwithstanding
what was written above most of the analysis is based on that jj+2 comparison but we do offer
sensitivity tests that employ the original jj+1 comparison An alternative approach is to combine
cells j and j-1 and compare that with the combined cells j+1 and j+2 (This is equivalent to expanding
the bandwidth) However this alternative approach seems to offer no advantages and introduces
some difficult estimation problems (serial correlation and general model specification issues) when
combining multiple effects so we avoid its application
Because this identificationestimation strategy results in many hazard estimates (potentially
41x6) we use techniques familiar from meta-analysis to combine estimates (effects) into summary
statistics A useful explanation of a fixed-effect meta-regression is Rhodes (2012) For example for
the first criminal history category there are potentially 41 effects We estimate a weighted least-
squares linear regression to estimate the average of the 41 effects Because there are 6 criminal
history categories we repeat the meta-regression across the 6 criminal history categories and then
average the 6 meta-regression averages to derive a single inverse variance weighted estimate and
11 Especially for drug-law violations and weapons offenses federal statutes require application of mandatory minimum sentences Regardless of guideline recommendations judges cannot sentence below the mandatory minimums Because mandatory minimums are not evenly distributed across the offense seriousness levels it is possible for the average terms in cell j to be larger than the average terms in cell j+1
12 Across the six criminal history categories the average percent change in time-served between cells j and j+1 ranges from 9 to 18 with the change being largest for criminal history category 1 In comparison across the six criminal history categories the average percent change in time-served between cells j and j+1 ranges from 20 to 38 with the change being largest for criminal history category 1
28
The Relationship between Prison Length of Stay and Recidivism -- This report was prepared by Abt Associates using Federal funding provided by the Bureau of Justice Statistics (BJS) Opinions andor points of view expressed are those of the author(s) and do not necessarily reflect the official position or policies of the US Department of Justice
test statistic Thus although there are many estimates there is only one test statistics and hence no
multiple comparison problem
For reasons explained below when applying the meta-regression we must deal with error
terms that may be auto-correlated and heteroscedastic We will show that heteroscedasticity is a
major problem and to deal with it we used weighted least squares Because we compare cells j with
j+2 j+1 with j+3 j+2 with j+4 and so on we potentially introduce autocorrelation across the
estimates The jj+2 and j+2j+4 comparisons are not independent because they have j+2 in common
This problem has corrections (Prais-Winston estimators for example) but they are suspect in small
samples where ignoring the problem is likely better than attempting to introduce a feasible
generalized least squares solution (Greene 2008 p 648) This follows because small samples provide
inaccurate estimates for the autocorrelation coefficient We concentrate on the heteroscedasticity
problem however we provide a sensitivity test suggesting that autocorrelation can safely be
ignored
The meta-regression provides the average effect of moving from guidelines cell j to cell j+2
This is an intent-to-treat estimator If this movement were not statistically significant we would
conclude that increasing prison terms has no effect on criminal recidivism If the average effect is
statistically significant by itself it does not provide LATE the size of the effect resulting from a unit
increase in prison time Our approach is to report the size of the average effect when moving from
cell j to j+2 the average increase in the length of the prison term when moving from cell j to j+2 and
the ratio of the two The ratio is essentially the LATE
A more direct approach which requires the same assumptions as were applied above is to
apply an instrumental variable (IV) estimator where the shift from guideline cell j to j+2 is the
instrument That is offenders in cell j+2 are not inherently more or less recidivistic than are
29
The Relationship between Prison Length of Stay and Recidivism -- This report was prepared by Abt Associates using Federal funding provided by the Bureau of Justice Statistics (BJS) Opinions andor points of view expressed are those of the author(s) and do not necessarily reflect the official position or policies of the US Department of Justice
offenders in cell j but the longer average sentences served by offenders in cell j+2 cause those
offenders to recidivate at a greater or lesser rate than offenders in cell j Instead of a dummy
variable representing membership in cell j or j+2 the important right-hand-side variables is the
average time-served by offenders in cell j and j+213 That is the treatment variable takes one of two
values the average time-served by offenders in cell j (when the observation belongs to cell j) or the
average time-served by offenders in cell j+2 (when the observation belongs to cell j+2) The
advantage of this approach is that parameter estimates have the interpretation of ldquochange in the
relative hazard per additional month of time servedrdquo The disadvantage is that IV estimators lack
desirable asymptotic properties (that is they are biased even in large samples) when applied to a
non-linear model and the Cox regression is a non-linear model (Rhodes 2010) Nevertheless we
expect estimates to be approximate and worth comparing with the RDD estimates
RESULTS
This section has two parts The first part provides descriptive statistics and justification for
deleting cases from the analyses The second section provides estimates of the effect of increasing
time-served on recidivism using the RDD and IV approaches it also provides sensitivity tests for case
deletion and other analytic decisions
DESCRIPTIVE STATISTICS AND RULES FOR DELETING CASES
Table 1 reports the number of offenders available for the analysis before we add restrictions
To be included in this table an offender must meet three criteria First he or she must have been
sentenced under the guidelines because guidelines calculations are used in the analysis Second he
13 This is a two-stage estimation model The first-stage involves a regression of time-served on dummy variables representing the adjacent guideline cells But this regression will simply provide the mean time-served in each cell so we do not actually perform the regression
30
The Relationship between Prison Length of Stay and Recidivism -- This report was prepared by Abt Associates using Federal funding provided by the Bureau of Justice Statistics (BJS) Opinions andor points of view expressed are those of the author(s) and do not necessarily reflect the official position or policies of the US Department of Justice
or she must be a US citizen We cannot follow recidivism by deported offenders And third he or
she must have entered active community supervision following sentencing ndash either probation or a
term of supervised release ndash because active supervision initiates the time at risk of recidivism This
third criterion has two implications If an offender never entered active community supervision that
offender would not appear in the analysis Specifically if an offender was sentenced to prison and
remained in prison as of September 30 2014 that offender would not appear in the analysis Thus
offenders sentenced to long prison terms and especially offenders sentenced toward the end of the
data collection window are more likely to be excluded than are other offenders This systematic
selection will not bias the RDD estimates because any selection bias will be equally applicable to cell j
and cell j+2 That is the RDD implicitly adjusts for the selection bias
Insert Table 1 about here
Shading identifies cells with fewer than 100 observations Although data for the most and
least serious offense levels are sparse the sample sizes for the other cells are ample an important
point because the RDD approach holds criminal history category constant and compares outcomes
for offense serious levels j and j+2 Notice that about half the offenders fall into criminal history
category 1 and given that these are relatively inexperienced offenders a reader might put more
subjective weight on the analysis of offenders in this criminal history category To be included in the
principal analysis a cell must have 100 or more offenders Stripped of some other statistical issues
basically the RDD approach requires a comparison of the mean recidivism rates for cells j and j+2
Because the sampling variance for estimated difference in outcomes between offense seriousness
levels j and j+2 is inversely proportional to the number of offenders in cells j and j+2 setting a
minimum number of observations increases the average precision of estimated effects for those cells
31
The Relationship between Prison Length of Stay and Recidivism -- This report was prepared by Abt Associates using Federal funding provided by the Bureau of Justice Statistics (BJS) Opinions andor points of view expressed are those of the author(s) and do not necessarily reflect the official position or policies of the US Department of Justice
retained in the analysis but we will present sensitivity analyses of the 100-offender criterion
showing the analysis appears insensitive to this criterion
Using the same data applied to produce Table 1 Table 2 reports the percentage of offenders
who receive prison terms by guidelines cell Shading denotes that fewer than 50 of offenders
within a cell are sentenced to prison Prison is often imposed for federal crimes but sentencing
guidelines (and hence this table) are only mandatory for felonies and serious misdemeanors
Additionally many federal crimes are dual jurisdiction offenses and generally the most serious
crimes are prosecuted in federal court while the least serious crimes are prosecuted in state courts
These factors explain why prison terms are so frequent in these data Still prison is infrequent for
offenders convicted of the least serious crimes provided they lack serious criminal records For a cell
to be included in the principal analysis at least 50 of offenders in that cell must have received
prison terms Justification is that for estimating effects the effective sample size is proportional to
the number in the cell multiplied by the percentage sentenced to prison because probation
sentences count as zero for these calculations (Offenders sentenced to straight probation are
assigned prison terms of length zero) However we will provide sensitivity testing of this selection
criterion showing that findings are insensitive to the criterion
Insert Table 2 about here
Inspection of Table 2 shows some irregularities in the progression of sentence severity
especially for the least serious offense levels but the general pattern is that prison terms become
increasingly certain as we look down the table (from least to most serious crimes) and across the
table (from least to most serious offenders) Inspection of Table 3 which reports average time-
served (counting probation as zero) also shows some irregularities but the general pattern is that
32
The Relationship between Prison Length of Stay and Recidivism -- This report was prepared by Abt Associates using Federal funding provided by the Bureau of Justice Statistics (BJS) Opinions andor points of view expressed are those of the author(s) and do not necessarily reflect the official position or policies of the US Department of Justice
average time-served in prison increases as we look down the table (from least to most serious
crimes) and across the table (from least to most serious offenders)
The irregularities cause a problem for the RDD If the RDD compared cells j with j+1 for a
RDD strategy to work we must observe a substantial increase in the average time in prison as we
compare cell j with cell j+1 Logically small changes fail to create a credible contrast Looking
especially at Table 3 several cell j and j+1 contrasts fail to meet this criterion The problem is that
moving from cell j to cell j+1 is a subtle shift and we find a better comparison to be between cell j
and j+2 This is the reason for using a jj+2 comparison instead of a jj+1 comparison Although
comparing cells j and j+2 may raise validity issues whatever bias is introduced is likely to be small
and from a mean-squared-error perspective comparing jj+2 instead of jj+1 seems justified
However as a sensitivity test we also report estimates based on a comparison of cells j and j+1 and
qualitative results prove insensitive to whether the comparison is between jj+1 or jj+2
Insert Table 3 about here
One more table is useful for summarizing the recidivism measure Table 4 reports the
percentage of offenders who recidivate during their periods of community supervision These
statistics are right-hand-censored by the length of the time-at-risk and capped at three years They
do not account for censoring due to supervision terms less than three years Although most
offenders avoid returning to prison returning to prison is not an infrequent occurrence At this
descriptive stage of the analysis patterns may seem peculiar Looking down each column recidivism
rates are lower for offenders incarcerated for the most serious crimes and higher for offenders
incarcerated for the least serious crimes Although as description this pattern is correct the effect is
probably not causal It seems likely that offenders who serve the longest terms are older when
released from prison than are offenders who serve the shortest terms and given that age is
33
The Relationship between Prison Length of Stay and Recidivism -- This report was prepared by Abt Associates using Federal funding provided by the Bureau of Justice Statistics (BJS) Opinions andor points of view expressed are those of the author(s) and do not necessarily reflect the official position or policies of the US Department of Justice
predictive of recidivism the patterns may be partly a result of age Reading across the table
recidivism tends to increase with criminal history but small sample sizes for the most serious
criminal history scores may be responsible for imprecise estimates
Insert Table 4 about here
Intended as a summary of the patterns shown by Table 4 Figure 1 presents survival curves
based on Kaplan-Meier estimates stratified by criminal history categories To be included in this
analysis an offender had to be sentenced within a guideline cell with 100 or more offenders and at
least 50 percent of offenders within that cell must have received prison terms Those restrictions are
consistent with the restrictions imposed for the principal analysis presented later However the
figure changes very little when the restrictions are removed In general as the criminal history
category increases so too does the rate of recidivism although the difference between criminal
history categories 5 and 6 is barely perceptible
Insert Figure 1 about here
Table 5 extends the descriptive analysis appearing in Figure 1 to include covariates (The
table reports parameters from a Cox model not relative hazards) The regression is naiumlve in the
sense that it does not account for potential confounding variables that might ndash if known ndash explain
why recidivism falls as the offense severity level (and hence time-served) increases This regression
uses variables that will reappear in the local linear regressions that we use for the RDD analyses
Separate Cox regressions are reported for each criminal history category
Scaled time-served This is estimated time-served rescaled by dividing the original time-served by
the maximum time-served Time-served is capped at 180 months The cap is
inclusive of more than 99 percent of terms
34
The Relationship between Prison Length of Stay and Recidivism -- This report was prepared by Abt Associates using Federal funding provided by the Bureau of Justice Statistics (BJS) Opinions andor points of view expressed are those of the author(s) and do not necessarily reflect the official position or policies of the US Department of Justice
Time-served squared This is the square of scaled time-served
Scaled age This is the offender age at the time that he or she entered community
supervision rescaled to run from 0 to 1
Age squared This is scaled age squared
Female This is a dummy variable for female
Black This is a dummy variable for Black
Other race This is a dummy variable for race other than White or Black
Hispanic This is a dummy variable for Hispanic ethnicity It is not collinear with the
race variables
High school This is a dummy variable indicating the offender has a high school degree or
equivalent
Advanced degree This is a dummy variable indicating the offender has a degree beyond high
school
Lives alone This is a dummy variable indicating the offender is neither married nor living
in a common law relationship at the time of sentencing
Centered CH points The guidelines assign criminal history points based on criminal records that
are collapsed into the six criminal history categories The criminal history
points are centered to have a mean of zero for each guideline cell
District This is the judicial district where the sentence was imposed There are 94
federal districts including those in territories District enters the analysis
35
The Relationship between Prison Length of Stay and Recidivism -- This report was prepared by Abt Associates using Federal funding provided by the Bureau of Justice Statistics (BJS) Opinions andor points of view expressed are those of the author(s) and do not necessarily reflect the official position or policies of the US Department of Justice
when estimating the frailty parameter that is as a random effect associated
with the Cox model
Because they run from zero to one scaled variables are useful for interpreting quadratics
The centered criminal history points provide a more refined measure of criminal record beyond the
broader criminal history category Centering this score is unimportant for the results presented in
Table 5 but centering is useful for later analyses
Insert Table 5 about here
As description the estimates appearing in Table 5 tell a simple story As best as a quadratic
can capture the pattern recidivism falls as time-served increases after accounting for the criminal
history category The declines are substantial and tend to be greater (but not consistently) for those
with minor criminal records (category 1) than for those with serious criminal records (categories 2-6
exclusive of 5) As an illustration when time-served changes from 30 months to 60 months the
relative hazards from criminal history 1 to criminal history 6 are 081 074 072 075 081 and 077
respectively14
Except regarding age other parameters are less interesting for this current study because
they tell us nothing about how recidivism changes with time-served (Women are less recidivistic
than men Blacks and other races are more recidivistic than Whites Hispanics tend to be less
recidivistic than non-Hispanics The educated are less recidivistic than the under-educated Marital
association appears to have no predictive effect The relative importance of these covariates
appears to decrease as criminal history increases) The inverse relationship between recidivism and
2
180
3060
180180 180
60 3014 For example the relative hazard for criminal history category 1 equals exp 1707
0941
minus+minusminus
2
36
The Relationship between Prison Length of Stay and Recidivism -- This report was prepared by Abt Associates using Federal funding provided by the Bureau of Justice Statistics (BJS) Opinions andor points of view expressed are those of the author(s) and do not necessarily reflect the official position or policies of the US Department of Justice
time-served cannot be explained by age If we were to accept results from this naiumlve regression we
would conclude that longer prison terms cause recidivism to fall dramatically (up to 28 percent for a
30-month increase) but we are reluctant to attach causality to these regression results because we
cannot be sure that all confounding factors have been considered Hence we turn to the RDD
The results reported in Table 5 suggest that marital status does not predict recidivism
Because this variable is frequently missing we drop it from the following analysis The ethnic status
Hispanic sometimes predicts recidivism but the effect is not large and this variable is often missing
Consequently we also drop the ethnic category Hispanic from the following analysis
ESTIMATES OF THE EFFECT THAT INCREASING TIME-SERVED HAS ON
RECIDIVISM
The previous section described data sources and gross patterns in those data This section
presents evidence based on a regression discontinuity design For every jj+2 contrast we compute
a unique effect as a log-relative hazard Potentially this leads to 6x41 effects because there are 41
possible contrasts within each criminal history category and there are 6 criminal history categories
In fact we produce fewer estimates because data selection rules exclude some of the contrasts The
number entering the analysis depends on the sensitivity tests but 175 contrasts appear in the
principal analysis
For each contrast between cells j and j+2 we estimate a Cox survival model15 The effect size
is the parameter associated with a dummy variable coded 1 for cell j+2 and coded zero for cell j The
15 By default we estimated a Cox model with covariates and shared frailty the covariates and criterion for the shared frailty are described in the text Sometimes to estimate the model we removed the shared frailty parameter in which case we estimated the relative hazard using the covariates but not the shared frailty given the RDD the relative hazard is still
37
The Relationship between Prison Length of Stay and Recidivism -- This report was prepared by Abt Associates using Federal funding provided by the Bureau of Justice Statistics (BJS) Opinions andor points of view expressed are those of the author(s) and do not necessarily reflect the official position or policies of the US Department of Justice
outcome measure is returning to prison following placement on community supervision or being
revoked from supervision (When an offender enters community supervision multiple times we only
include the first period of supervision in the analysis) Time at risk is censored by the end of the
study period or by the end of community supervision or at three years if supervision is ongoing after
three years Censoring by the end of community supervision is important because thereafter an
offender cannot return to federal prison unless he or she is convicted of a new federal crime
Fundamentally once an offender successfully completes his term of community supervision the FJSP
no longer tracks his criminality so the study cannot extend beyond the end of community
supervision Occasionally an offender may serve his entire sentence and then commit a new federal
crime Although he or she would reappear in the FJSP we only consider the first conviction
When applying a RDD identification strategy researchers are careful to justify that two
conditions hold Translated into the current setting where we compare outcomes in cell j and j+2
the two conditions are (1) on average time-served in cell j+2 must be greater than time-served in
cell j (2) There must be no other differences between offenders in cells j and j+2 that could account
for differences in recidivism In practice this second condition is difficult to establish By
construction of the guidelines and given the fact that we compare cells j and j+2 along the offense
seriousness dimension and never along the criminal history dimension we are confident this
condition holds Nevertheless an indirect empirical test is whether the guidelines cause offenders in
cell j+2 to look systematically different than offenders in cell j This is testable
By the design of the guidelines we anticipate that variables sometimes associated with
recidivism will have about the same mean values in cell j as in cell j+2 Of course we expect time-
consistent Sometimes to estimate the model we removed both shared frailty and the covariates in which case we estimated the relative hazard with just an indication the data came from cell j rather than j+2 Again given the RDD the estimate of relative hazard is consistent but not efficient If we could not estimate the relative hazard the estimate is reported as missing
38
The Relationship between Prison Length of Stay and Recidivism -- This report was prepared by Abt Associates using Federal funding provided by the Bureau of Justice Statistics (BJS) Opinions andor points of view expressed are those of the author(s) and do not necessarily reflect the official position or policies of the US Department of Justice
served to differ between cell j and cell j+2 and it does by 54 months on average (Plt001) If this
difference were not large there would be little point to the analysis
On average other variables do not change significantly between cell j and j+2 16 We tested
the following variables date of birth educational attainment sex race Hispanic status marital
status date when sentenced and criminal history point score The differences were small and none
approached statistical significance The results for criminal history point score seem especially
important because we consider this variable to be highly correlated with recidivism The fact that
the criminal history point score does not change systematically from cell j to j+2 suggests that
offenders in cell j+2 are not inherently more or less recidivistic than are offenders in cell j Therefore
the data pass this diagnostic test
While the inclusion of covariates may be unnecessary for identification including covariates
in the Cox regression is expected to reduce residual variance and improve the precision of the
estimates As noted the principal variable is a dummy variable coded one if the observation is from
cell j+2 and coded zero if from cell j Other covariates with the noted exceptions are the same as
were used in the naiumlve regression Obviously we have also excluded the scaled time-served variable
and its square Because there are 41x6 possible regressions (175 in this main application) we do not
show the regression results from this stage of the analysis Instead we report the single parameter of
interest (the average effect) for each regression in graphical form
Within each criminal history category the Cox model estimates the hazard of recidivism for
offenders in category j+2 relative to offenders in category j holding covariates constant Using the
16 The change is computed for every jj+2 pair The statistics reported in the texts are a weighted average of those pair comparisons Weights equal the inverse of the sampling variances Because of the distribution of offenses within the guidelines the least serious criminal history categories and the middle of the offense seriousness range dominate the calculations Arguably the estimates are not independent so standard errors are suspect Nevertheless the estimates of differences between cells j and j+2 are not biased and these average differences are small
39
The Relationship between Prison Length of Stay and Recidivism -- This report was prepared by Abt Associates using Federal funding provided by the Bureau of Justice Statistics (BJS) Opinions andor points of view expressed are those of the author(s) and do not necessarily reflect the official position or policies of the US Department of Justice
log-relative hazard (eg the parameter that is exponentiated to get the relative hazard) the next step
is to estimate a regression where the estimated log-relative hazard is the dependent variable and the
independent variable is the centered offense seriousness level This is the meta-regression It is
specific to a criminal history category so there are six meta-regressions This specification allows us
to examine how the log-relative hazard varies over the offense seriousness levels That is the
regressions allow us to combine effects (our main motivation) and test for heterogeneity (a
secondary motivation)
Effects may be heterogeneous across offense seriousness levels for two reasons For one
offenders convicted of the most serious crimes who serve the longest prison terms may respond
differently to incremental increases in the lengths of their terms than do offenders convicted of the
least serious crimes who serve the shortest prison terms For another for offenders convicted of
the most serious crimes the incremental change in the length of a prison term from cell j to j+2 is
much larger than the incremental change for offenders convicted of the least serious crimes (See
Table 3) Heterogeneity in treatment effects seems likely but how that heterogeneity varies with
offense severity level is uncertain Examining Tables 1-3 recalling the selection rules and recalling
that we are using weighted least squares regression to estimate the heterogeneity information used
by the regression comes mostly from the middle offense seriousness levels so incremental changes
to time-served are fairly constant Quite possibly there is heterogeneity but we will have insufficient
power to detect it
As before the analysis is stratified on the criminal history category so for each regression
there are potentially 41 data points but many fewer (29 to 37 in the main analysis) enter the meta-
regression because of selection criteria identified earlier Referring to Tables 1 and 2 almost all the
lost contrasts come from having too few cases per cell or from having a low proportion of prison
40
The Relationship between Prison Length of Stay and Recidivism -- This report was prepared by Abt Associates using Federal funding provided by the Bureau of Justice Statistics (BJS) Opinions andor points of view expressed are those of the author(s) and do not necessarily reflect the official position or policies of the US Department of Justice
terms per cell referring to Table 3 few cells (and hence contrasts) are lost because average prison
terms do not increase from cell j to j+2 Because the RDD identifies the effect the right-hand-side
variables are not control variables rather the meta-regression is a descriptive device (with statistical
implications) helping us to detect possible patterns
Estimation has multiple steps We summarize with an algorithm
1 Select all offenders from criminal history category k = 1
a Select all offenders with offense seriousness levels j = 1 and j = 3 If the jj+2 contrast
does not meet selection criteria increase j by 1 and try again
b It the jj+2 contrast meets the selection criteria estimate a Cox regression where a
dummy variable is coded 1 for offenders in offense seriousness level j+2 and coded 0
for offenders in offense seriousness level j The parameter associated with this
dummy variable is the log-relative hazard for the jj+2 contrast Save this estimate
c Increase j by 1 and repeat steps a-c until j = 41
d Estimate a meta-regression where the dependent variable is the log-relative hazards
from steps a-c The independent variables are a constant and the centered offense
seriousness level equal to j+2 for the jj+2 contrast Save the estimated constant and
its standard error for use in step 3
2 Repeat steps 1a-d for criminal history categories 1-6 This leads to six estimated constants
and six estimated standard errors for step 3
3 For step 3 create weights proportional to the inverse of the squares of the six standard
errors The final estimate is the weighted average of the six estimated constants This is
interpreted as the average log-relative hazard Results are discussed below
41
The Relationship between Prison Length of Stay and Recidivism -- This report was prepared by Abt Associates using Federal funding provided by the Bureau of Justice Statistics (BJS) Opinions andor points of view expressed are those of the author(s) and do not necessarily reflect the official position or policies of the US Department of Justice
MAIN RESULTS
The main model adopts the following selection criteria
bull For a guideline cell to be included in the analysis 100 or more offenders must appear within that cell
bull For a guideline cell to be included in the analysis 50 or more of offenders must have received prison terms
Comparisons are of outcomes in cell j+2 and cell j
The main results are shown in Figure 2 The figure shows patterns in the relative hazards and
associated statistics The figure has six panels one for each of the criminal history categories
Within each panel the vertical axis is the scale for the relative hazard as estimated by the Cox model
A hazard equal to 1 implies that increasing prison time has a neutral effect on recidivism A hazard
greater than 1 implies that increasing prison time increases recidivism a hazard less than 1 implies
that increasing prison time decreases recidivism The horizontal axis corresponds to the contrast
The offense seriousness level of 3 is the contrast between offense seriousness levels 1 and 3 the
offense seriousness level of 4 is the contrast between levels 2 and 4 and so on until level 43 Within
each panel the dots report the relative hazards as estimated using the Cox model When we could
not estimate the relative hazard because of the cell exclusion criteria the point is missing The
vertical lines surrounding the dots are 95 confidence intervals for the relative hazards They are
non-symmetric and when the confidence interval extends above 25 it is truncated at 25 for
improved resolution of the figures The three lines running left to right come from the regression
the straight line shows the prediction and the curved lines represent a 95 confidence interval for
the regression line ndash not to be confused with a 95 confidence interval for a predicted point
explaining why many points fall outside the confidence interval for the regression
Insert Figure 2 about here
42
The Relationship between Prison Length of Stay and Recidivism -- This report was prepared by Abt Associates using Federal funding provided by the Bureau of Justice Statistics (BJS) Opinions andor points of view expressed are those of the author(s) and do not necessarily reflect the official position or policies of the US Department of Justice
The table below the figure shows associated statistics from the meta-regression Recall the
dependent variable is the parameter associated with the log-relative hazard ndash that is the natural
logarithm of the relative hazard The row specified as ldquolinearrdquo identifies the centered offense
severity level variable entering the weighted least squares meta-regression The simple regression
specification has a constant and a term that is linear in the centered offense severity level Because
the estimator is weighted least squares and given the offense severity level is centered the constant
is the weighted average effect across the contrasts It is our principal interest R2 has its usual
interpretation but note that any ldquoexplained variancerdquo is attributable to the linear trend because we
are most interested in the constant R2 is not an especially important statistic and certainly has no
interpretation as the ldquogoodness of fitrdquo for our purposes because the constant does not contribute to
R2 At a maximum the regression would be based on 41 observations (N in the table) but fewer data
points enter the analysis because (as already discussed) we discarded contrasts that failed to meet
predetermined criteria
The table below the figure requires some additional explanation Recall the right-hand-side
variable was centered so the constant can be interpreted as an average A constant of zero is
neutral implying that on average additional prison time neither increases nor decreases recidivism
A positive constant implies that additional prison time increases recidivism a negative constant
implies that additional prison time decreases recidivism Converting these constants into a hazard
metric just requires exponentiation Letting α be the constant exp(α) is the relative hazard Letting
σ2 represent the constantrsquos estimated sampling variance by the delta rule the estimated sampling
variance for the hazard is exp(α)2 σ2 These transformations are employed when drawing Figure 2
Examining the table below Figure 2 the constant is negative and statistically significant in all
six regressions On average the estimated constant equals -0073 and is statistically significant with a
43
The Relationship between Prison Length of Stay and Recidivism -- This report was prepared by Abt Associates using Federal funding provided by the Bureau of Justice Statistics (BJS) Opinions andor points of view expressed are those of the author(s) and do not necessarily reflect the official position or policies of the US Department of Justice
standard error of 0007 The implied hazard is 0930 These are the inverse-variance weighted
estimates across the six criminal history categories The linear slopes have mixed signs and are never
statistically significant so we detect no heterogeneity
We must be caution about this interpretation Suppose as suggested by the evidence the
relative hazards are the same for all criminal history categories Looking at table 3 the average
increase in time-served for a move from cell j to j+2 is about 7 months for criminal history category 1
and about 10 months for criminal history category 6 Thus a somewhat larger increase in time-
served for more serious criminal history categories achieves about the same effect as a somewhat
smaller increase in time-served for less serious criminal history categories This might be taken as
some evidence of criminal history heterogeneity but if so the evidence is not especially compelling
Outliers are a potential concern in Figure 2 However when an outlier appears it is
associated with a high standard error and plays a small role in the weighted least squares regression
Therefore we conclude that outliers are not a practical concern
On average the estimated relative hazard that results from moving from cell j to cell j+2 is
0930 Qualitatively a relative hazard less than 1 implies that a longer prison term decreases
recidivism but translating this relative hazard into a quantitative decrease in the probability of
recidivism is complicated because the decrease in the probability of recidivism varies across the jj+2
comparisons A descriptive summary provides some intuition
First continue to consider the relative hazard as a metric On average across the severity
levels and the criminal history categories moving from cell j to cell j+2 increases time-served by
about 27 (On average this 27 change equals about 54 months) This is to say that a 27
increase in the length of incarceration appears to reduce the instantaneous probability of recidivism
(eg the hazard) by less than 10 percent For readers who are familiar with interpreting hazards a
44
The Relationship between Prison Length of Stay and Recidivism -- This report was prepared by Abt Associates using Federal funding provided by the Bureau of Justice Statistics (BJS) Opinions andor points of view expressed are those of the author(s) and do not necessarily reflect the official position or policies of the US Department of Justice
sizable increase in prison time (namely a 27 increase on average) has a fairly small decrease in the
relative hazard (by a multiple of 0930) Admittedly the descriptive term fairly small is subjective
and a reader can make his or her own subjective assessment
A change in the instantaneous probability of recidivism ndash the relative hazard ndash is not the
same as a change in the probability of recidivism Second then consider the probability of
recidivism as a metric We can get a sense of how a change in the relative hazard affects the
probability of recidivism Because we are using the Cox model the probability of recidivism equals
one minus the baseline survival rate to the power of the relative hazard (Hosmer Lemeshow amp May
2008 p 72) For our data the probability of recidivism is about 02 within three years (See figure
1) The relative hazard is about 0930 So a 27 increase in the length of incarceration would
decrease the probability of recidivism by about 02 ndash (1-080930) That is from a base rate of
recidivism of about 20 a 27 increase in prison time would cause recidivism to fall to about 187
Readers can draw their own conclusions but our sense is the effect is not large and that prison
length of stay has a largely neutral effect on recidivism
Once again some caution is merited If we again accept the relative hazards are about the
same across the six criminal history categories figure 1 shows the baseline rates of recidivism are
progressively higher as the criminal history category increases from k=1 to k=6 so the percentage
change in recidivism is larger for more serious criminal history categories than for the lesser criminal
history categories This might be deemed heterogeneity ndash that increasing time-served has a larger
effect on the most serious offenders We are reluctant to accept such a conclusion because it comes
from accepting the null hypothesis of constant relative hazards across the criminal history categories
More likely if such heterogeneity exists we have too little power to detect its effect
45
The Relationship between Prison Length of Stay and Recidivism -- This report was prepared by Abt Associates using Federal funding provided by the Bureau of Justice Statistics (BJS) Opinions andor points of view expressed are those of the author(s) and do not necessarily reflect the official position or policies of the US Department of Justice
It is possible to stratify the analysis by sex by race and by education ndash variables described
earlier Cell sizes get small so we restrict the analysis to offenders in criminal history category 1 and
we require a minimum of 50 offenders per cell rather than 100 For men the relative hazard is
0935 and for women it is 0931 but these differences are not statistically significant so we fail to
reject the null that prison length has the same effect on men and on women For white offenders
the relative hazard is 0936 and for black offenders the relative hazard is 0932 and the difference is
not statistically significant so we fail to reject the null that prison length has the same effect on
white and black offenders For offenders who lack high school degrees the relative hazard is 0930
and for offenders who have high school degrees the relative hazard is 0933 The difference is not
statistically significance This test based on education is not as sensitive as desired because most
offenders have high school degrees or the equivalent Overall we do not find strong evidence the
effect of time-served on recidivism is sensitive to sex race or education
We observed that an IV estimator should lead to estimates that are like the RDD estimates
We demonstrate that here The only difference between the IV and RDD approaches is that for the
IV approach the treatment variable is the mean time-served in cell j+2 or j and for the RDD
approach the treatment variable is a dummy variable denoting sentencing in cell j+2 rather than cell
j17 Interpretations differ For the IV approach the treatment effect is the change in recidivism per
month of additional time-served for the RDD approach the treatment effect is the change in
recidivism from being sentenced in cell j+2 rather than cell j These differences are scale effects we
do not expect then to change substantive interpretations
17 Instrumental variable estimation often uses a two-step approach In the first step the treatment variable (here the time served) is regressed on the instrument (and perhaps some additional variables) to predict the treatment (or in our case the average time-served) In the second step the average time-served replaces the observed time-served We compute average time-served without using the first-step regression
46
The Relationship between Prison Length of Stay and Recidivism -- This report was prepared by Abt Associates using Federal funding provided by the Bureau of Justice Statistics (BJS) Opinions andor points of view expressed are those of the author(s) and do not necessarily reflect the official position or policies of the US Department of Justice
Figure 3 reports results from the IV estimation Across the six criminal history categories the
weighted average effect size is -00122 which is statistically significant at P lt 001 While this effect
seems much smaller than the effect based on the RDD when we multiple by the average increase in
time-served between cell j and j+2 the rescaled effect is -0066 and relative hazard of a 54 month
increase in the sentence is 0936 There is no material difference between the RDD estimator and
the RDD estimator
Insert Figure 3 about here
SENSITIVITY TESTING
We conducted sensitivity tests evaluating whether the effect of length of stay on recidivism
depends on constraints we applied to produce the results shown in Figure 2 and its associated table
Minimum Cell Size of 50 instead of 100 - Figure 4 A first step in sensitivity testing is to learn
whether requiring a minimum of 50 cases instead of 100 cases per cell changes findings The
advantage to relaxing this assumption is that we gain a few data points The disadvantage is that
some of those new data points have extreme values As before the constant is always negative and
statistically significant The weighted average is -0073 with a standard error of 0007 and the
implied relative hazard is 0930 Because we use weighted least squares results do not change much
from those reported for the main model despite the expansion of sample size estimates with large
standard errors do not contribute much to the regression
Insert Figure 4 about here
Minimum cell size of 150 instead of 100 ndash Figure 5 If we set a criterion of 150 cases per cell instead
of 100 we lose a few data points The constant remains negative and statistically significant across
the six criminal history categories Overall the average constant is -0071 (with a standard error
47
The Relationship between Prison Length of Stay and Recidivism -- This report was prepared by Abt Associates using Federal funding provided by the Bureau of Justice Statistics (BJS) Opinions andor points of view expressed are those of the author(s) and do not necessarily reflect the official position or policies of the US Department of Justice
0008) and the corresponding relative hazard is 0931 Apparently the findings are insensitive to the
criterion for cases per cell because the weighted least squares analysis is dominated by calculations
that are based on large cell sizes For the remaining sensitivity tests we set the minimum cell size to
100
Insert Figure 5 about here
Minimum percentage of prison terms 75 instead of 50 - Figure 6 The next sensitivity test
changes the criterion for minimum percentage of prison terms to be 75 within a cell rather than
50 within a cell As expected some cells are excluded from the analysis but as before the
substantive findings do not much change The average affect is -0077 with standard error of 0009
The increased standard error is understandable Given the RDD basically calls for a difference in
mean estimates between cells j and j+2 (conditional on covariates) the effective sample size for
computing variances is the number of offenders within a cell multiplied by the proportion who are
sentenced to prison Cells with high proportions of offenders serving probation terms have high
sampling variances for two reasons (1) The effective sample size is smaller than the apparent sample
size based on the number of offenders within a cell (2) The average difference in time-served
between cells j and j+2 tends to be small (so the effect is small and has high sampling variance) for
those cells where probation is especially likely Consequently given the regressions use weights that
are inversely proportional to the sampling variance the estimates are insensitive to the criterion
establishing a minimum proportion of offenders sentenced to prison
Insert Figure 6 about here
Contrasts that are j and j+1 instead of j and j+2 ndash Figure 7 We believe that contrasts observed by
comparing cells j and j+2 are more appropriate for this analysis than contrasts observed by
comparing cells j and j+1 because the contrast between j and j+2 provides assurance that average
48
The Relationship between Prison Length of Stay and Recidivism -- This report was prepared by Abt Associates using Federal funding provided by the Bureau of Justice Statistics (BJS) Opinions andor points of view expressed are those of the author(s) and do not necessarily reflect the official position or policies of the US Department of Justice
prison terms increase by a substantial amount This assurance is not forthcoming when comparing
cells j and j+1 Nevertheless increasing the distance between compared cells raises validity
challenges because the RDD rests on an assumption that offenders within both compared cells are
alike in ways that affect recidivism The closer the cells the more justified the assumption For this
sensitivity test we maintain the original criteria for selecting cells but contrast cell j with cell j+1
(We discard contrasts where the average sentence in cell j+1 is less than the average sentence in cell
j) Averaged across the six estimates the estimated constant is -0030 with a standard error of 0013
This is statistically significant at P lt 005 The relative hazard is 0970 While results from the jj+1
contrasts are smaller than those from the jj+2 contrasts this is expected because the jj+2 contrast
results in a larger increase in time-served and consequently a larger effect
Insert Figure 7 about here
Contrasts testing for auto-correlation using the Prais-Winston estimator ndash Figure 8 The analysis
immediately above which changed the comparison from cells jj+2 to cells jj+1 suggests another
sensitivity test Earlier we commented that by construction we may have induced autocorrelation in
the data used for the final step regression For example consider the estimated hazard for cells j and
j+1 and the estimated hazard for cells j+1 and j+2 The estimates have j+1 in common and this may
introduce first-order autocorrelation into the analysis Following recommendations from Greene we
have elected to ignore this complication because commonly used corrections have uncertain small
sample properties However we can test how much the autocorrelation affects the results using a
Prais-Winston estimator a feasible generalized least squares estimator that corrects for first-order
autocorrelation
Insert Figure 8 about here
49
The Relationship between Prison Length of Stay and Recidivism -- This report was prepared by Abt Associates using Federal funding provided by the Bureau of Justice Statistics (BJS) Opinions andor points of view expressed are those of the author(s) and do not necessarily reflect the official position or policies of the US Department of Justice
A problem when using the Prais-Winston estimator is that we cannot simultaneously adjust
for autocorrelation and heteroscedasticity To correct estimated standard errors we can employ a
robust covariance estimator but this is problematic in two ways First without adjusting for
heteroscedasticity during parameter estimation the solution is inefficient because the data points
with large standard errors receive the same weight as the data points with low standard errors
Figure 2 suggests the inefficiency can be large Second the Prais-Winston estimator assumes
homoscedasticity but we know that our data are heteroscedastic To deal with this problem we
adopt restrictions (1) There must be 150 observations per cell and (2) at least 75 of offenders
within any cell must receive prison terms The idea is to minimize heteroscedasticity and we have
already seen that imposing these restrictions has little effect on results Allowing the contrast to be
jj+1 which may cause a one-lag autocorrelation we use a Prais-Winston estimator to estimate the
effects
The sensitivity test is encouraging The estimates for ρ the autocorrelation efficient have
mixed signs We take this wide variation in the estimates of ρ to mean the estimates are imprecise
Apparently provided we restrict estimates to cells with enough offenders we induce modest
autocorrelation and our decision to ignore autocorrelation seems justified Second basing the
results on the Prais-Winston estimator does not make a big difference in the findings The average
value for the constant is -0042 with a standard error of 0008
Separating contrasts into independent sets ndash Tables 6 and 7 Another approach to dealing with
autocorrelation is straightforward and can be performed with the jj+2 contrasts and both the 100
observations per cell criterion and the 050 prison sentence criterion To explain consider the
contrasts based on cells 13 24 35 46 57 and so on The contrasts 13 and 24 are
independent and the contrast 35 and 46 are independent but the contrasts 13 and 35 are not
50
The Relationship between Prison Length of Stay and Recidivism -- This report was prepared by Abt Associates using Federal funding provided by the Bureau of Justice Statistics (BJS) Opinions andor points of view expressed are those of the author(s) and do not necessarily reflect the official position or policies of the US Department of Justice
independent because they both rely on cell 3 A solution is to break the analysis into two parts In
the first part we use the contrasts 13 24 57 68 and so on in the second part we use the
contrasts 35 46 79 810 and so on For each analysis the effects can be averaged across the
criminal history categories and then across the two analyses For the first analysis the effect is -
0034 with a standard error of 0018 For the second analysis the effect is -0106 with a standard
error of 0030 significant at p lt 001 The average effect is -0067 with a standard error of 0018
Recalling the effect from the main analysis was -0073 with a standard error of 0007 these new
results are very close even though they are based on a different weighting scheme (a result of
running two regressions instead of one) As with the previous test we take this sensitivity test as
evidence that provided we restrict the effective number of observations per cell results are
insensitive to autocorrelation
Insert Table 6 and Table 7 about here
Entering prison as recidivism ndash Figure 9 An additional sensitivity test returns to the original model
specification whose results were presented in Figure 2 and changes the definition of recidivism from
ldquoentering prison or being revoked from community supervisionrdquo to ldquoentering prisonrdquo We are unsure
of the best definition of recidivism but it appears the definition does not much matter The
estimated effects are about the same The log-relative hazard is -0076 with a standard error of
0007 the relative hazard is 0927 The rate of recidivism is about 20 percent using the
comprehensive definition of returning to prison or being revoked and slightly less than 19 percent
when using the more restrictive definition of returning to prison so consistency between the main
results and results from this sensitivity test is not surprising
Insert Figure 9 about here
51
The Relationship between Prison Length of Stay and Recidivism -- This report was prepared by Abt Associates using Federal funding provided by the Bureau of Justice Statistics (BJS) Opinions andor points of view expressed are those of the author(s) and do not necessarily reflect the official position or policies of the US Department of Justice
Eliminating drug law offenders from the analysis ndash Figure 10 A final analysis recognizes that drug
law violations are somewhat peculiar to the federal system High-level drug dealing is often dealt
with in the federal system because cross-border drug dealing is a federal law enforcement
responsibility the federal government has more resources for dealing with high-level drug dealing
than do state governments and even when state and federal authorities collaborate federal
prosecution is typical because federal sentences are more severe18 Judges frequently sentence
high-level drug dealers to Congressionally-mandated mandatory minimums so for high-level drug
dealers the guidelines operate differently than described earlier Another sensitivity test results
from removing drug-law violators from the analysis
Insert Figure 10 about here
With the removal of drug-law violations fewer cells enter the analysis but the parameter estimates
do not change much so qualitative conclusions do not change The average effect is -0060 with a
standard error of 0008 This is statistically significant at plt001 Dropping drug law violators does
not alter conclusions
Eliminating covariates from the analysis ndash Figure 11 Reviewers of an earlier version of this study
wondered if findings based on Cox regressions with no covariates would be the same as findings
based on Cox regressions with covariates After eliminating covariates the weighted average effect
is -0073 with a standard error of 0008 Removing covariates has caused the standard error to
increase by about 10 but has not altered substantive conclusions This is sensible The covariates
were unnecessary for identification but they have the potential to reduce standard errors
18 This assertion is based on the authorsrsquo extensive experience performing program reviews for High Intensity Drug Trafficking Areas multijurisdictional drug task forces with federal state and local participation Our team has visited all 28 HIDTAs over a five-year period The assertion made in the text is based on those visits
52
The Relationship between Prison Length of Stay and Recidivism -- This report was prepared by Abt Associates using Federal funding provided by the Bureau of Justice Statistics (BJS) Opinions andor points of view expressed are those of the author(s) and do not necessarily reflect the official position or policies of the US Department of Justice
Figure 11 about here
Using the Earlier Guidelines ndash Figure 12 Reviewers of an earlier version of this study also observed
that guidelines have changed over the period of this study and expressed concern that these changes
may affect conclusions We doubt these changes matter because cell j+2 has always had longer
terms than cell j Nevertheless in response to reviewersrsquo concerns we identify the mean date for
guidelines entering the analysis and we perform the analysis on just those offenders sentenced
under the guidelines prior to that mean date The effect is ndash 0088 with a standard error of 0009
The relative hazard is 0916 It seems unlikely that changes to the guidelines account for findings
Figure 12 about here
Examining offenders sentenced during the earlier years provides another implicit diagnostic test
Because the analysis is based on offenders who completed their prison terms and were released to
community supervision offenders with high offense seriousness scores or high criminal history
scores and therefore long prison terms are unlikely to enter they analysis when sentenced close to
the data collection period Any resulting bias is lessened by restricting the analysis to offenders
sentenced during the early part of the data collection period If there is a selection bias it does not
appear to be serious
Summarizing the sensitivity testing From the principal analysis the estimated average effect across
the six criminal history categories was -0073 with a standard error of 0007 Provided we contrast
outcomes in cells j and j+2 results do not much change over sensitivity tests and even when we
contrast outcomes in cells j and j+1 results conform with expectations
53
The Relationship between Prison Length of Stay and Recidivism -- This report was prepared by Abt Associates using Federal funding provided by the Bureau of Justice Statistics (BJS) Opinions andor points of view expressed are those of the author(s) and do not necessarily reflect the official position or policies of the US Department of Justice
DISCUSSION
The effect of prison length of stay on recidivism has implications for both theory and policy
From a theoretical perspective incarceration is a potentially transformative event experienced
during an offenderrsquos life course This study provides no evidence that an offenderrsquos criminal
trajectory is negatively affected ndash that is that criminal behavior is accelerated ndash by the length of an
offenderrsquos prison term If anything longer prison terms modestly reduce rates of recidivism beyond
what is attributable to incapacitation This ldquotreatment effectrdquo of a longer period of incarceration is
small The three-year base rate of 20 recidivism is reduced to 187 when prison length of stay
increases by an average of 54 months We are inclined to characterize this as a benign close to
neutral effect on recidivism From a policy perspective prison length of stay can be reduced without
incurring a large increase in recidivism
All observational studies come with validity challenges Still a regression discontinuity
design is a strong quasi-experimental design and we have argued the guidelinesrsquo structure satisfies
the assumptions of an RDD We conducted many sensitivity tests to assess the robustness of the
results The findings require qualification Because of limitations in the bandwidth of an RDD design
we are unable to examine how long prison terms (say five years) affect recidivism relative to
relatively short terms (say two years) The logic of the RDD forces us to compare prison terms of
length L relative to prison terms that are about 27 longer While this is a limitation in the
application of the RDD design it seems unlikely that Congress or the US Sentencing Commission
would reduce terms by a large percentage but not inconceivable that they might reduce prison
terms by a small percentage Thus these findings ndash limited to small changes in prison terms ndash have
implications for sentencing reform
54
The Relationship between Prison Length of Stay and Recidivism -- This report was prepared by Abt Associates using Federal funding provided by the Bureau of Justice Statistics (BJS) Opinions andor points of view expressed are those of the author(s) and do not necessarily reflect the official position or policies of the US Department of Justice
A secondary goal of this research was to examine potential heterogeneity in the effects of
prison length of stay To evaluate heterogeneity we examine whether exogenous covariates
moderate the effect of length of stay Neither offense seriousness nor criminal history moderate the
effect of prison length of stay In the context of federal sentencing these would be two of the most
important potential moderators of prison length of stay The Sentencing Reform Act of 1984
precludes federal judges from using demographic factors in assigning sentences even if these are
empirical moderators of the effect of prison length of stay We also found the effect of time-served
on recidivism was invariant with respect to sex race and education
One class of moderators suggested by Mears Cochran and Cullen (2014) is the level of post-
release supervision In many state jurisdictions a sizable number of offenders are released without
supervision For those released to supervision the level of community control and surveillance is
usually commensurate to risk This source of heterogeneity is limited in the federal context because
everyone receives a term of post-release supervision We censored anyone whose supervision ended
prior to the end of the three-year follow-up period Post-release supervision is also a potential source
of bias as suggested by Roodman but we could eliminate this potential artifact because everyone in
our sample received a term of post-release supervision and they were censored when that term
ended
Some additional caveats are applicable First the results apply to adults Rarely appearing in
federal court juveniles are excluded from the analysis Second we offer no comparison between
adult offenders sentenced to prison rather than probation Third although there is considerable
overlap between federal and state crimes jurisdictional differences cause federal crimes to differ
from state crime counterparts so the relationship between prison terms and recidivism at the state
level may differ from the relationship at the federal level These are important inter-jurisdictional
55
The Relationship between Prison Length of Stay and Recidivism -- This report was prepared by Abt Associates using Federal funding provided by the Bureau of Justice Statistics (BJS) Opinions andor points of view expressed are those of the author(s) and do not necessarily reflect the official position or policies of the US Department of Justice
differences but by removing offenders who were deported or transferred to other authorities we
have made the federal offenders look more like state offenders and when we exclude high-level
drug traffickers results do not much change Furthermore federal jurisdiction is national while
state jurisdictions are local so a study based on national data has a stronger claim to generalizability
It is difficult to see how federal and state crimes are so different that criminologist can disregard
these findings A further limitation of our findings is that they apply only to offenders who receive a
term of community supervision after their release May states have offenders who receive no such
post-release supervision
While some scholars might consider the federal system unique and our results limited to
federal offenders there are many structural differences among states that often preclude
generalizations beyond a specific state as well Even if these findings are not generalizable to state
jurisdictions the federal prison population is about 12 percent of all incarcerated offenders and
represents a significant public policy concern
As we mentioned the RDD framework only allows us to examine relatively small increments
in time-served ndash about 54 months on average Although these are small relative changes these are
not small absolute changes Five additional months in prison is a serious disruption of an offenderrsquos
life and the associated cost savings of a five-month reduction in federal prison length of stay would
save substantial capital and operational costs We make a back-of-the-envelope estimate of potential
savings in prison beds The current average federal prison length of stay for federally sentenced
prisoners is about 35 months A reduction of 5 months in a steady state system would reduce the
prison population over time by 15 percent Given the current Bureau of Prisons inmate population of
195000 a 15 percent reduction would save 29000 beds Under this scenario the BOP could close
prisons rather than simply reduce the prison population in each of its facilities saving both
56
The Relationship between Prison Length of Stay and Recidivism -- This report was prepared by Abt Associates using Federal funding provided by the Bureau of Justice Statistics (BJS) Opinions andor points of view expressed are those of the author(s) and do not necessarily reflect the official position or policies of the US Department of Justice
operational and maintenance costs This back-of-the-envelope calculation shows that small
decrements in length of stay can have large impacts when they are not confined to select subgroups
of offenders
Amplifying this latter point one of the advantages to evaluating prison length of stay is that
any change will have a broad impact on the entire incarcerated population Most contemporary
reforms such as those found in states which implemented the Justice Reinvestment Initiative (JRI)
seek to move the least serious offenders convicted of the least serious crimes from prison to
community corrections (La Vigne et al 2014) Low-level offenders are a very small proportion of
federal prison stocks and based on tabulations from the National Corrections Reporting Program
they are also a small proportion of state prison stocks A policy shift that reduces the length of all
federal prison terms by 27 percent would reduce the federal prison stock by about 29000 inmates
without unduly harming public safety This policy change would have a bigger impact on the federal
prison population than diverting offenders with low offense seriousness and minor or no criminal
history
Prisons are expensive and reducing prison stays has the potential to save public expenditures
(La Vigne et al 2014) Nevertheless advocates of general deterrence and incapacitation might
argue that maintaining or even increasing the length of prison stays is worth the additional expense
and at least increasing prison stays will not make offenders any more criminogenic Nagin et al
(2009) propose a theoretical model that frames these questions distinguishing between high and low
sanction regimes Higher sanction regimes have a higher probability of imprisonment and longer
length of stay than low sanction regimes This model specifies relationships between these relative
regimes the size of the prison populations sizes of the populations with and without a prison record
and the underlying crime rate The model provides a framework for addressing the interrelationship
57
The Relationship between Prison Length of Stay and Recidivism -- This report was prepared by Abt Associates using Federal funding provided by the Bureau of Justice Statistics (BJS) Opinions andor points of view expressed are those of the author(s) and do not necessarily reflect the official position or policies of the US Department of Justice
among these factors without precisely specifying how the outputs change under the low and high
sanction regimes It is straightforward to postulate that high sanction regimes will produce more
people with criminal records however the impact of a high sanction regime on the crime rate is
uncertain High sanction regimes may preclude more crime through general deterrence but may
increase crime if imprisonment is criminogenic not just for the individual but for the prisonerrsquos
family and the community (NRC 2014) The marginal effects and the sizes of the subpopulations
affected will determine the impact on crime rates If we could analyze all the system dynamics of this
model simultaneously we could optimize the level of sanctions to minimize the crime rate In the
absence of such a comprehensive model policy goals should be circumscribed If length of stays
were reduced incrementally it is hard to see how this would have more than a minor effect on crime
through any general deterrent mediated impact and from our results through any criminogenic
impact on the offender
Savings from reduced prison usage can be diverted into evidence-based programs that
reduce offending but such diversion is unlikely as most JRI states have put savings into other non-
justice programs (La Vigne et al 2014) Even if these funds are diverted to other social welfare
programs higher education or other state and local needs we would expect a net social welfare
benefit
58
The Relationship between Prison Length of Stay and Recidivism -- This report was prepared by Abt Associates using Federal funding provided by the Bureau of Justice Statistics (BJS) Opinions andor points of view expressed are those of the author(s) and do not necessarily reflect the official position or policies of the US Department of Justice
REFERENCES
Andrews D A and James Bonta 2006 The Psychology of Criminal Conduct 4th ed Cincinnati Anderson Pub
Andrews D A Ivan Zinger Robert D Hoge James Bonta Paul Gendreau and Francis T Cullen 1990 Does Correctional Treatment Work A Clinically Relevant and Psychologically Informed Meta-Analysis Criminology 28 (3) 369ndash404 doi101111j1745-91251990tb01330x
Angrist Joshua D 2006 Instrumental Variables Methods in Experimental Criminological Research What Why and How Journal of Experimental Criminology 2 (1) 23ndash44 doi101007s11292-005-5126-x
Becker Gary S 1968 Crime and Punishment An Economic Approach Journal of Political Economy 76 (2) 169ndash217 doi101086259394
Berecochea John E and Dorothy R Jaman and Welton A Jones 1981 Time Served in Prison and Parole Outcome - An Experimental Study Report Number 2 Sacramento
Berk Richard 2010 Recent Perspectives on the Regression Discontinuity Design Essay In Handbook of Quantitative Criminology eds Alexis Russell Piquero and David Weisburd New York Springer
Berk Richard A and David Rauma 1983 Capitalizing on Nonrandom Assignment to Treatments A Regression-Discontinuity Evaluation of a Crime-Control Program Journal of the American Statistical Association 78 (381) 21ndash27 doi10108001621459198310477917
Berk Richard A and Jan De Leeuw 1999 An Evaluation of Californias Inmate Classification System Using a Generalized Regression Discontinuity Design Journal of the American Statistical Association 94 (448) 1045ndash52 doi10108001621459199910473857
Berk Richard Geoffrey Barnes Lindsay Ahlman and Ellen Kurtz 2010 When Second Best Is Good Enough A Comparison between a True Experiment and a Regression Discontinuity Quasi-Experiment Journal of Experimental Criminology 6 (2) 191ndash208 doi101007s11292-010-9095-3
Berube Danton and Donald P Green 2007 The Effects of Sentencing on Recidivism Results from a Natural Experiment Ms The Effects of Sentencing on Recidivism Results from a Natural Experiment New Haven
Bloom Howard S 2012 Modern Regression Discontinuity Analysis Journal of Research on Educational Effectiveness 5 (1) 43ndash82 doi101080193457472011578707
Bor J Moscoe E Mutevedzi P Newell M amp Barnighausem T (2014) Regression Discontinuity Designs in Epidemiology Epidemiology 25(5) 729-737
59
The Relationship between Prison Length of Stay and Recidivism -- This report was prepared by Abt Associates using Federal funding provided by the Bureau of Justice Statistics (BJS) Opinions andor points of view expressed are those of the author(s) and do not necessarily reflect the official position or policies of the US Department of Justice
Boshier R and D Johnson 1974 Does Conviction Affect Employment Opportunities British Journal of Criminology 14 264ndash68
Braithwaite John 1989 Crime Shame and Reintegration Cambridge Cambridge University Press
Cameron Adrian Colin and P K Trivedi 2005 Microeconometrics Methods and Applications Cambridge Cambridge University Press
Carroll Leo 1988 Hacks Blacks and Cons Race Relations in a Maximum Security Prison Prospect Heights IL Waveland Press
Cattaneo Matias D Rociacuteo Titiunik Gonzalo Vazquez-Bare and Luke Keele 2016 Interpreting Regression Discontinuity Designs with Multiple Cutoffs The Journal of Politics 78 (3) doi101086686802
Chen M Keith and Jesse M Shapiro 2007 Do Harsher Prison Conditions Reduce Recidivism A Discontinuity-Based Approach American Law and Economics Review 9 (1) 1ndash29 doi101093alerahm006
Clemmer Donald 1940 The Prison Community Boston The Christopher Publishing House
Cook Thomas D 2008 lsquoWaiting for Life to Arriversquo A History of the Regression-Discontinuity Design in Psychology Statistics and Economics Journal of Econometrics 142 (2) 636ndash54 doi101016jjeconom200705002
Cullen Francis T Cheryl Lero Jonson and Daniel S Nagin 2011 Prisons Do Not Reduce Recidivism The High Cost of Ignoring Science The Prison Journal 91 (3 Suppl) doi1011770032885511415224
Deschenes Elizabeth Piper Susan Piper and Joan Petersilia 1995 Intensive Community Supervision in Minnesota A Dual Experiment in Prison Diversion and Enhanced Supervised Release Santa Monica CA RAND Corporation
DiNardo John and David S Lee 2010 Program Evaluation and Research Designs Essay In Handbook of Labor Economics eds Orley Ashenfelter and David Card Vol 4A Elsevier
Drago Francesco Roberto Galbiati and Pietro Vertova 2009 The Deterrent Effects of Prison Evidence from a Natural Experiment Journal of Political Economy 117 (2) 257ndash80 doi101086599286
Fleisher Mark S 1989 Warehousing Violence Newbury Park CA Sage Publications
Gaes Gerald G William D Bales and Samuel J A Scaggs 2016 The Effect of Imprisonment on Recommitment An Analysis Using Exact Coarsened Exact and Radius Matching with the Propensity Score Journal of Experimental Criminology 12 (1) 143ndash58 doi101007s11292-015-9251-x
Gaes Gerald G and Scott D Camp 2009 Unintended Consequences Experimental Evidence for the Criminogenic Effect of Prison Security Level Placement on Post-Release Recidivism Journal of Experimental Criminology 5 (2) 139ndash62 doi101007s11292-009-9070-z
60
The Relationship between Prison Length of Stay and Recidivism -- This report was prepared by Abt Associates using Federal funding provided by the Bureau of Justice Statistics (BJS) Opinions andor points of view expressed are those of the author(s) and do not necessarily reflect the official position or policies of the US Department of Justice
Gaes Gerald G Timothy J Flanagan Laurence L Motiuk and Lynn Stewart 1999 Adult Correctional Treatment Essay In Crime and Justice a Review of Research Prisons eds Michael Tonry and Joan Petersilia 76361ndash426 Chicago University of Chicago Press
Gendreau Paul Paula Smith and Sheila French 2008 The Theory of Effective Correctional Intervention Empirical Status and Future Directions Essay In Taking Stock The Status of Criminological Theory Advances in Criminological Theory eds T Francis FT Cullen JP Wright and KR Blevins Vol 15 New Brunswick NJ Transaction
Gendreau Paul Claire Goggin and Francis T Cullen 1999 The Effects of Prison Sentences on Recidivism 1999-3 The Effects of Prison Sentences on Recidivism 1999-3 Ottawa Canada Solicitor General
Goffman Erving 1961 Asylums Essays on the Social Situation of Mental Patients and Other Inmates Chicago Aldine
Green Donald P and Daniel Winik 2010 Using Random Judge Assignments to Estimate the Effects of Incarceration and Probation on Recidivism Among Drug Offenders Criminology 48 (2) 357ndash87 doi101111j1745-9125201000189x
Greene William H 2008 Econometric Analysis Upper Saddle River NJ Prentice Hall
Hahn Jinyong Petra Todd and Wilbert Klaauw 2001 Identification and Estimation of Treatment Effects with a Regression-Discontinuity Design Econometrica 69 (1) 201ndash9 doi1011111468-026200183
Hjalmarsson Randi (2009) Juvenile Jails A path to the straight and narrow or to hardened criminality Journal of Law and Economics 52 779-809
Horney Julie D Wayne Osgood and Ineke Haen Marshall 1995 Criminal Careers in the Short-Term Intra-Individual Variability in Crime and Its Relation to Local Life Circumstances American Sociological Review 60 (5) 655 doi1023072096316
Hosmer David W Stanley Lemeshow and Susanne May 2008 Applied Survival Analysis Regression Modeling of Time-to-Event Data Hoboken NJ Wiley-Interscience
Imbens G (2009) Better LATE Than Nothing Some Comments on Deaton (2009) and Heckman and Urzua (2009) Unpublished paper downloaded from httpwwweconomicsharvardedufacultyimbensfilesbltn_09apr10pdf on December 2 2009
Imbens Guido W and Joshua D Angrist 1994 Identification and Estimation of Local Average Treatment Effects Econometrica 62 (2) 467 doi1023072951620
Imbens Guido W and Thomas Lemieux 2007 Regression Discontinuity Designs A Guide to Practice National Bureau of Economic Research Working Paper
61
The Relationship between Prison Length of Stay and Recidivism -- This report was prepared by Abt Associates using Federal funding provided by the Bureau of Justice Statistics (BJS) Opinions andor points of view expressed are those of the author(s) and do not necessarily reflect the official position or policies of the US Department of Justice
Imbens Guido W and Donald B Rubin 2015 Causal Inference for Statistics Social and Biomedical Sciences an Introduction Cambridge Cambridge University Press
Irwin John 1980 Prisons in Turmoil Boston Little Brown
Irwin John 2005 The Warehouse Prison Disposal of the New Dangerous Class Los Angeles CA Roxbury Pub Co
Irwin John (2009) Lifers Seeking redemption in prison (Criminology and justice studies) New York Routledge
Jacobs James B 1977 Statesville The Penitentiary in Mass Society Chicago IL Chicago University Press
Jaman Dorothy R Robert M Dickover and Lawrence A Bennett 1972 Parole Outcome as a Function of Time Served British Journal of Criminology 12 (1) 5ndash34
Kalbfleisch J D and Ross L Prentice 2002 The Statistical Analysis of Failure Time Data Hoboken NJ J Wiley
Kling R W Rhodes D Izrael C Cutler K Shah and C Dyous 2016 Creating an Offender-Based Tracking System Using the FJSP Draft Final for BJS Review Cambridge MA Abt Associates
Kraus J 1981 The Effects of Committal to a Special School for Truants International Journal of Offender Therapy and Comparative Criminology 25 (2) 130ndash38 doi1011770306624x8102500205
Kuziemko I 2012 How Should Inmates Be Released from Prison An Assessment of Parole versus Fixed-Sentence Regimes The Quarterly Journal of Economics 128 (1) 371ndash424 doi101093qjeqjs052
La Vigne Nancy Samuel Bieler Lindsey Cramer Helen Ho Cybele Kotonias Deborah Mayer David McClure Laura Pacifici Erika Parks Bryce Peterson and Julie Samuels 2014 Justice Reinvestment Initiative State Assessment Report Washington DC The Urban Institute
Lancaster Tony 1990 The Econometric Analysis of Transition Data Cambridge Cambridge University Press
Lee David S and Thomas Lemieux 2010 Regression Discontinuity Designs in Economics Journal of Economic Literature 48 (2) 281ndash355 doi101257jel482281
Lee S and Card D 2006 Regression Discontinuity Inference with Specification Error Technical Working paper 322 National Bureau of Economic Research
What Works Clearinghouse Procedures and Standards Handbook Version 30 US Department of Education httpsiesedgovnceewwcDocsreferenceresourceswwc_procedures_v3_0_standards_handboo kpdf
62
The Relationship between Prison Length of Stay and Recidivism -- This report was prepared by Abt Associates using Federal funding provided by the Bureau of Justice Statistics (BJS) Opinions andor points of view expressed are those of the author(s) and do not necessarily reflect the official position or policies of the US Department of Justice
Lerman Amy 2009a The People Prisons Make Effects of Incarceration on Criminal Psychology In Do Prisons make Us Safer The Benefits and Costs of the Prison Boom eds Steven Raphael and Michael A Stoll New York Russel Sage
Lerman Amy 2009b Bowling Alone (With My Own Ball and Chain) Effects of Incarceration and the Dark Side of Social Capital Lecture
Letkemann Peter 1973 Crime as Work Englewood Cliffs NJ Prentice-Hall
Listwan Shelley Johnson Christopher J Sullivan Robert Agnew Francis T Cullen and Mark Colvin 2013 The Pains of Imprisonment Revisited The Impact of Strain on Inmate Recidivism Justice Quarterly 30 (1) 144ndash68 doi101080074188252011597772
Loeffler Charles E 2013 Does Imprisonment Alter the Life Course Evidence on Crime and Employment from A Natural Experiment Criminology 51 (1) 137ndash66 doi1011111745-912512000
Loughran Thomas A Edward P Mulvey Carol A Schubert Jeffrey Fagan Alex R Piquero and Sandra H Losoya 2009 Estimating A Dose-Response Relationship Between Length of Stay and Future Recidivism in Serious Juvenile Offenders Criminology 47 (3) 699ndash740 doi101111j1745-9125200900165x
MacKenzie Doris L 2006 What Works in Corrections Reducing the Criminal Activities of Offenders and Delinquents New York Cambridge University Press
Manski Charles F and Daniel S Nagin 1998 Bounding Disagreements About Treatment Effects A Case Study of Sentencing and Recidivism Sociological Methodology 28 (1) 99ndash137 doi1011110081-175000043
Meade Benjamin Benjamin Steiner Matthew Makarios and Lawrence Travis 2012 Estimating a Dose-Response Relationship Between Time Served in Prison and Recidivism Journal of Research in Crime and Delinquency 50 (4) 525ndash50 doi1011770022427812458928
Mears Daniel P Joshua C Cochran and Francis T Cullen 2014 Incarceration Heterogeneity and Its Implications for Assessing the Effectiveness of Imprisonment on Recidivism Criminal Justice Policy Review 26 (7) 691ndash712 doi1011770887403414528950
Mears Daniel P Joshua C Cochran William D Bales and Avinash S Bhati (2016) Recidivism and time served in prison Journal of Criminal Law and Criminology 106(1) 82-122
Morgan Stephen and Christopher Winship 2015 Counterfactuals and Causal Inference Methods and Principals for Social Research 2nd ed Cambridge MA Cambridge University Press
Nagin Daniel S Francis T Cullen and Cheryl Lero Jonson 2009 Imprisonment and Reoffending Essay In Crime and Justice A Review of Research eds Michael Tonry 38115ndash200 Chicago University of Chicago Press
63
The Relationship between Prison Length of Stay and Recidivism -- This report was prepared by Abt Associates using Federal funding provided by the Bureau of Justice Statistics (BJS) Opinions andor points of view expressed are those of the author(s) and do not necessarily reflect the official position or policies of the US Department of Justice
Nguyen H Loughran T A Paternoster R Fagan J amp Piquero A R (2017) Institutional placement and illegal earnings Examining the crime school hypothesis Journal of Quantitative Criminology 33(2) 207-235
Owen B A (1998) In the Mix Struggle and Survival in a Womens Prison SUNY Press
Pager Devah and Lincoln Quillian 2005 Walking the Talk What Employers Say Versus What They Do American Sociological Review 70 (3) 355ndash80 doi101177000312240507000301
Pager Devah Bart Bonikowski and Bruce Western 2009 Discrimination in a Low-Wage Labor Market A Field Experiment American Sociological Review 74 (5) 777ndash99 doi101177000312240907400505
Pager Devah 2007 Marked Race Crime and Finding Work in an Era of Mass Incarceration Chicago University of Chicago Press
Rhodes William and Sarah K Jalbert 2013 Regression Discontinuity Design in Criminal Justice Evaluation An Introduction and Illustration Evaluation Review 37 (3-4) 239ndash73 doi1011770193841x14523004
Rhodes W Dyous C Kling R Hunt D and Luallen J (2012) Recidivism of Offenders on Federal Community Supervision Bureau of Justice Statistics award 2010-BJ-CX-K069 NCRJS document number 241018
Rhodes W (2010) Estimating treatment effects and predicting recidivism for community supervision using survival analysis with instrumental variables Journal of Quantitative Criminology 26(3) 391-413
Rhodes W (2012) Meta-analysis An introduction using regression models Evaluation review 36(1) 24-71
Roach Michael A and Max M Schanzenbach 2015 The Effect of Prison Sentence Length on Recidivism Evidence from Random Judicial Assignment Northwestern Law ampAmp Econ Research Paper doi102139ssrn2701549
Roodman David 2016 The impacts of incarceration on crime Open Philanthropy Project
Rosenbaum Paul R 2002 Observational Studies 2nd ed New York Springer
Smith Douglas A and Raymond Paternoster 1990 Formal Processing and Future Delinquency Deviance Amplification as Selection Artifact Law ampAmp Society Review 24 (5) 1109 doi1023073053663
Sampson Robert J and John H Laub 1993 Crime in the Making Pathways and Turning Points Through Life Cambridge MA Harvard University Press
64
The Relationship between Prison Length of Stay and Recidivism -- This report was prepared by Abt Associates using Federal funding provided by the Bureau of Justice Statistics (BJS) Opinions andor points of view expressed are those of the author(s) and do not necessarily reflect the official position or policies of the US Department of Justice
Smith Paula 2006 The Effects of Incarceration on Recidivism A Longitudinal Examination of Program Participation and Institutional Adjustment in Federally Sentenced Adult Male Offenders Dissertation University of New Brunswick Dept of Psychology
Smith Paula Paul Gendreau and Claire Goggin 2002 The Effects of Prison Sentences and Intermediate Sanctions on Recidivism General Effects and Individual Differences Ottawa Solicitor General Canada
Snodgrass G Matthew Arjan A J Blokland Amelia Haviland Paul Nieuwbeerta and Daniel S Nagin 2011 Does the Time Cause the Crime An Examination of the Relationship Between Time Served and Reoffending in The Netherlands Criminology 49 (4) 1149ndash94 doi101111j1745-9125201100254x
Sykes Gresham M 1958 The Society of Captives A Study of a Maximum Security Prison Princeton NJ Princeton University Press
National Research Council Jeremy Travis Bruce Western Steve Redburn 2014 The Growth of Incarceration in the United States Exploring Causes and Consequences eds Committee on Causes and Consequences of High Rates of Incarceration Committee on Law and Justice and Division of Behavioral and Social Sciences and Education Washington DC The National Academies Press
van der Klaauw Wilbert 2002 Estimating the Effect of Financial Aid Offers on College Enrollment A Regression-Discontinuity Approach International Economic Review 43 (4) 1249ndash87 doi1011111468-2354t01-1-00055
Villettaz P M Killias and I Zoder 2006 The Effects of Custodial vs Non-Custodial Sentences on Re-Offending A Systematic Review of the State of Knowledge Campbell Collaboration Crime and Justice Group doi104073csr200613
Wacquant Loiumlc 2001 Deadly Symbiosis When Ghetto and Prison Meet and Mesh Mass Imprisonment Social Causes and Consequences 82ndash120 doi1041359781446221228n8
Western Bruce 2002 The Impact of Incarceration on Wage Mobility and Inequality American Sociological Review 67 (4) 526 doi1023073088944
65
The Relationship between Prison Length of Stay and Recidivism -- This report was prepared by Abt Associates using Federal funding provided by the Bureau of Justice Statistics (BJS) Opinions andor points of view expressed are those of the author(s) and do not necessarily reflect the official position or policies of the US Department of Justice
Tables and Figures
Table 1 - Number of Offenders Meeting Study Requirements per Guidelines Cell
Criminal History Categories (1 least serious 6 most serious) Offense
Seriousness Level CH 1 CH 2 CH 3 CH 4 CH 5 CH 6 Total
1 38 6 1 1 1 1 48 2 909 176 178 90 42 61 1456 3 143 26 33 20 9 25 256 4 3244 818 981 523 371 613 6550 5 442 119 132 84 64 119 960 6 3005 641 752 429 300 505 5632 7 1511 381 653 576 440 680 4241 8 4497 882 1023 543 361 552 7858 9 1969 465 566 321 229 363 3913
10 8511 1873 2342 1119 765 1109 15719 11 2824 558 728 472 304 521 5407 12 9748 2368 3330 1968 1204 1667 20285 13 13159 2961 3668 2009 1226 1777 24800 14 4219 746 854 430 275 788 7312 15 10534 2680 3131 1599 951 1257 20152 16 4394 760 831 396 227 318 6926 17 8743 2598 4189 2919 1690 1981 22120 18 4876 745 758 388 212 306 7285 19 9053 2116 2902 1720 1095 1301 18187 20 3761 779 930 532 262 319 6583 21 13674 2293 3341 2511 1706 2421 25946 22 3674 654 850 480 289 392 6339 23 10627 4101 5642 2996 1742 1904 27012 24 3706 719 788 487 282 445 6427 25 7748 2816 3460 1835 1036 1137 18032 26 2946 728 856 420 228 355 5533 27 9418 1797 2221 1126 630 647 15839 28 2509 506 554 306 144 178 4197 29 6180 2614 3442 1736 870 3174 18016 30 1819 344 367 384 218 654 3786 31 3868 1800 2308 1157 554 2945 12632 32 1144 307 377 161 86 213 2288 33 2570 873 1155 566 259 365 5788 34 776 244 260 111 79 1831 3301 35 1145 645 820 368 197 446 3621 36 431 128 153 66 35 47 860
Leas
t Ser
ious
(1) t
o Mo
st S
erio
us (4
3)
66
The Relationship between Prison Length of Stay and Recidivism -- This report was prepared by Abt Associates using Federal funding provided by the Bureau of Justice Statistics (BJS) Opinions andor points of view expressed are those of the author(s) and do not necessarily reflect the official position or policies of the US Department of Justice
Criminal History Categories (1 least serious 6 most serious) Offense
Seriousness Level CH 1 CH 2 CH 3 CH 4 CH 5 CH 6 Total
37 543 210 305 148 54 221 1481 38 290 83 122 59 30 64 648 39 200 62 91 36 21 58 468 40 174 37 58 22 22 35 348 41 94 31 43 18 6 23 215 42 64 23 28 9 5 8 137 43 86 24 25 12 4 19 170
All 169266 42737 55248 31153 18525 31845 348774 Note Cells with fewer than 100 observations are highlighted
67
The Relationship between Prison Length of Stay and Recidivism -- This report was prepared by Abt Associates using Federal funding provided by the Bureau of Justice Statistics (BJS) Opinions andor points of view expressed are those of the author(s) and do not necessarily reflect the official position or policies of the US Department of Justice
Table 2 -- Percentage of Offenders Sentenced to Prison per Guideline Cell
Criminal History Categories (1 least serious 6 most serious) Offense
Seriousness Level CH 1 CH 2 CH 3 CH 4 CH 5 CH 6 Total
1 11 0 0 0 100 100 13 2 15 20 42 52 69 72 25 3 11 31 42 50 78 76 29 4 14 27 45 68 74 82 34 5 14 34 54 83 84 93 42 6 17 40 59 73 89 94 40 7 16 43 69 91 95 96 58 8 17 43 58 86 91 96 39 9 27 53 79 90 90 97 53
10 33 75 86 94 96 96 58 11 63 85 91 95 99 98 77 12 69 84 92 96 97 98 81 13 74 89 94 97 98 98 83 14 79 90 94 97 99 98 86 15 82 93 96 97 99 99 89 16 84 92 95 98 98 98 88 17 85 93 97 98 99 99 92 18 90 95 97 99 98 99 92 19 89 93 97 99 99 99 93 20 92 96 99 98 99 99 94 21 92 96 98 99 99 99 95 22 93 96 98 99 99 99 95 23 93 97 98 99 99 99 96 24 95 98 99 100 99 100 96 25 95 98 98 99 99 99 97 26 97 98 98 99 100 100 98 27 96 99 99 100 99 100 97 28 96 98 99 99 100 99 97 29 96 98 99 99 99 99 98 30 97 100 100 98 99 100 98 31 97 98 99 99 99 99 98 32 98 98 99 99 100 100 99 33 96 98 99 99 100 99 97 34 97 100 99 100 100 99 99 35 97 98 99 98 99 99 98 36 98 99 99 97 100 100 98 37 97 98 99 100 96 98 98 38 98 99 98 100 100 98 98
68
The Relationship between Prison Length of Stay and Recidivism -- This report was prepared by Abt Associates using Federal funding provided by the Bureau of Justice Statistics (BJS) Opinions andor points of view expressed are those of the author(s) and do not necessarily reflect the official position or policies of the US Department of Justice
Criminal History Categories (1 least serious 6 most serious) Offense
Seriousness Level CH 1 CH 2 CH 3 CH 4 CH 5 CH 6 Total
39 98 98 99 100 100 98 99 40 98 97 100 100 100 100 99 41 98 100 100 100 100 100 99 42 97 100 100 100 100 100 99 43 98 100 96 100 100 95 98 All 78 89 93 97 98 98 87
Note Cells with less than 50 prison terms are highlighted
69
The Relationship between Prison Length of Stay and Recidivism -- This report was prepared by Abt Associates using Federal funding provided by the Bureau of Justice Statistics (BJS) Opinions andor points of view expressed are those of the author(s) and do not necessarily reflect the official position or policies of the US Department of Justice
Table 3 -- Average Time Served (Months) per Guideline Cell
Criminal History Categories (1 least serious 6 most serious) Offense Seriousness Level
CH 1 CH 2 CH 3 CH 4 CH 5 CH 6
Leas
t Ser
ious
(1) t
o Mo
st S
erio
us (4
3)
1 04 00 00 00 209 65 2 10 13 25 36 41 73 3 08 17 27 47 47 73 4 13 22 35 57 67 85 5 13 21 42 87 90 138 6 13 41 49 84 115 140 7 11 29 50 81 117 146 8 14 38 59 96 137 175 9 21 50 71 119 168 208
10 30 72 94 150 191 230 11 43 82 119 161 217 251 12 60 103 137 189 237 279 13 81 124 157 212 260 300 14 106 160 187 256 298 324 15 120 170 204 256 320 355 16 147 198 233 303 359 408 17 164 222 260 326 392 446 18 196 257 297 362 454 515 19 216 282 326 407 498 547 20 262 343 401 481 573 637 21 255 342 394 481 570 636 22 313 409 483 582 689 721 23 336 429 484 577 670 728 24 369 493 543 685 786 853 25 418 495 562 671 785 842 26 480 571 676 783 902 964 27 474 597 659 783 868 909 28 552 706 784 902 961 1048 29 584 722 813 878 976 981 30 685 845 938 1063 1120 1213 31 695 823 916 1039 1129 1117 32 850 991 1116 1241 1417 1312 33 779 935 1056 1203 1338 1401 34 969 1166 1220 1365 1396 1326 35 900 1033 1182 1335 1385 1403 36 1176 1265 1456 1510 1551 1461
70
The Relationship between Prison Length of Stay and Recidivism -- This report was prepared by Abt Associates using Federal funding provided by the Bureau of Justice Statistics (BJS) Opinions andor points of view expressed are those of the author(s) and do not necessarily reflect the official position or policies of the US Department of Justice
Criminal History Categories (1 least serious 6 most serious) Offense Seriousness Level
CH 1 CH 2 CH 3 CH 4 CH 5 CH 6
37 1028 1289 1356 1604 1382 1849 38 1279 1434 1625 1726 1399 1769 39 1072 1468 1540 1567 1544 1656 40 1414 1520 1648 1482 1490 1658 41 1315 1562 1788 2045 2124 1899 42 1263 1878 1468 1974 1422 1974 43 1497 1685 2078 2909 1280 2243
71
The Relationship between Prison Length of Stay and Recidivism -- This report was prepared by Abt Associates using Federal funding provided by the Bureau of Justice Statistics (BJS) Opinions andor points of view expressed are those of the author(s) and do not necessarily reflect the official position or policies of the US Department of Justice
Table 4 -- Percentage of Offenders Recidivating within Three Years (Not Accounting for Censoring) per Guideline Cell
Criminal History Categories (1 least serious 6 most serious) Offense Seriousness Level CH 1 CH 2 CH 3 CH 4 CH 5 CH 6
Leas
t Ser
ious
(1) t
o Mo
st S
erio
us (4
3)
1 395 333 1000 00 00 1000 2 232 324 382 433 524 328 3 238 346 424 450 444 440 4 201 334 399 405 415 512 5 215 378 379 440 422 454 6 198 348 430 462 407 475 7 212 336 449 507 502 568 8 177 330 324 385 427 438 9 182 286 337 340 397 477
10 167 262 350 367 383 459 11 116 228 299 326 365 407 12 130 266 335 388 442 475 13 132 248 297 368 396 444 14 94 180 297 347 360 391 15 129 241 315 386 420 423 16 95 186 276 323 300 377 17 99 207 280 342 382 425 18 95 179 240 312 274 359 19 106 197 274 320 359 414 20 94 181 247 301 336 376 21 103 172 235 283 336 352 22 81 191 259 313 356 375 23 84 142 192 247 293 330 24 86 172 221 277 337 348 25 77 122 167 215 251 277 26 70 126 173 193 241 318 27 71 124 157 186 216 253 28 72 144 148 180 201 298 29 63 93 131 169 208 221 30 73 96 166 188 239 252 31 52 99 129 137 181 166 32 68 94 135 161 105 174 33 51 86 127 133 201 186 34 44 90 88 153 215 118 35 53 62 87 122 178 143 36 42 55 85 136 229 128 37 52 90 95 135 93 163
72
The Relationship between Prison Length of Stay and Recidivism -- This report was prepared by Abt Associates using Federal funding provided by the Bureau of Justice Statistics (BJS) Opinions andor points of view expressed are those of the author(s) and do not necessarily reflect the official position or policies of the US Department of Justice
Criminal History Categories (1 least serious 6 most serious) Offense Seriousness Level CH 1 CH 2 CH 3 CH 4 CH 5 CH 6
38 24 24 57 68 233 156 39 20 48 99 139 190 52 40 40 108 103 182 136 114 41 32 32 47 111 333 130 42 63 00 143 222 200 125 43 81 00 200 167 250 158
73
The Relationship between Prison Length of Stay and Recidivism -- This report was prepared by Abt Associates using Federal funding provided by the Bureau of Justice Statistics (BJS) Opinions andor points of view expressed are those of the author(s) and do not necessarily reflect the official position or policies of the US Department of Justice
Table 5 -- Results from a Naive Regressions (Cox Proportional Hazard)
CH 1 CH 2 CH 3 CH 4 CH 5 CH 6 scaled time-served -1707 -2381 -2536 -1941 -1079 -1588
(0155) (0212) (0155) (0187) (0235) (0161) time-served squared 0941 1166 1154 0487 -0336 0016
(0263) (0328) (0234) (0263) (0323) (0192) scaled age -7718 -6272 -6200 -6174 -6028 -2779
(0257) (0385) (0295) (0388) (0496) (0468) age squared 6798 5207 5927 6619 6433 1160
(0503) (0775) (0608) (0791) (0983) (0881) female -0348 -0343 -0281 -0219 -0280 -0331
(0021) (0035) (0028) (0040) (0052) (0041) Black 0194 0115 0120 0088 -0016 -0054
(0023) (0030) (0022) (0026) (0031) (0023) other race 0567 0426 0348 0301 0371 0267
(0030) (0049) (0039) (0049) (0062) (0051) Hispanic -0085 -0095 -0072 -0018 0008 -0053
(0024) (0037) (0028) (0034) (0041) (0034) high_school -0124 -0142 -0127 -0106 -0088 -0036
(0039) (0049) (0036) (0042) (0051) (0038) advanced_degree -0611 -0441 -0423 -0287 -0169 -0051
(0053) (0084) (0070) (0088) (0112) (0078) lives_alone -0023 0006 0011 -0020 -0033 -0036
(0021) (0029) (0021) (0025) (0030) (0022) centered points 0311 -0026 0100 0057 0051 0041
(0015) (0022) (0009) (0012) (0013) (0002) N 143058 38733 52654 30049 17697 30247
74
The Relationship between Prison Length of Stay and Recidivism -- This report was prepared by Abt Associates using Federal funding provided by the Bureau of Justice Statistics (BJS) Opinions andor points of view expressed are those of the author(s) and do not necessarily reflect the official position or policies of the US Department of Justice
Table 6 ndash Results when Contrasts are Cells 13 24 57 68 911 1012 and so on
Criminal History 1
Criminal History 2
Criminal History 3
Criminal History 4
Criminal History 5
Criminal History 6
linear 0002 0004
-0002 0003
-0002 0004
-0003 0003
-0008 0005
-0005 0003
constant -0074 0048
-0034 0041
-0050 0041
-0012 0037
0054 0062
-0054 0041
R2 0010 0040 0020 0060 0150 0110 N 15 15 18 19 17 19 plt005 plt001 The constant is the average parameter for the estimated hazard (zero is neutral) Six criminal history scores labeled Criminal History The contrasts are cells 13 24 57 68 911 1012 and so on All the contrasts are independent
Table 7 ndash Results when Contrasts are Cells 24 35 68 79 1012 1113 and so on
Criminal History 1
Criminal History 2
Criminal History 3
Criminal History 4
Criminal History 5
Criminal History 6
linear 0003 -0003
0004 -0005
0003 -0003
-0002 -0004
0007 -0005
0000 -0004
constant -0103 (0032)
-0153 -0071
-0109 (0033)
-0097 -0050
-0188 (0064)
-0049 -0048
R2 0060 0070 0060 0010 0120 0000 N 16 14 18 17 17 18
plt005 plt001 The constant is the average parameter for the estimated hazard (zero is neutral) Six criminal history scores labeled Criminal History The contrasts are cells 24 35 69 710 1012 1113 etc
75
0 Q) bull ~ middot - 0
20gt () agto
0 00 co 0)0 C = a ctl lshyu c o 0 middot- o t ltD 0 aO 0 _ Q0
I()
ci 0 500
Time at Risk in Days
Crim H 1
Crim H 3
Crim H 5
Crim H is the criminal history category
Crim H 2
Crim H 4
Crim H 6
Crim H 1 is the highest l ine and others a re in descending order Crim H 5 and Crim H 6 are nearly indistinguishable
1000
The Relationship between Prison Length of Stay and Recidivism -- This report was prepared by Abt Associates using Federal funding provided by the Bureau of Justice Statistics (BJS) Opinions andor points of view expressed are those of the author(s) and do not necessarily reflect the official position or policies of the US Department of Justice
Figure 1 ndash Kaplan-Meier Estimates of Time until Recidivism by Criminal History Category
plt005 plt001 Six criminal history scores labeled Criminal History Scales variables run from 0 to 1 Centered points Criminal history points centered at zero
76
The Relationship between Prison Length of Stay and Recidivism -- This report was prepared by Abt Associates using Federal funding provided by the Bureau of Justice Statistics (BJS) Opinions andor points of view expressed are those of the author(s) and do not necessarily reflect the official position or policies of the US Department of Justice
Figure 2 ndash Relationship between Time-Served and Recidivism Principal Specification (Return and Revocation)
0 5 1
15
2 25
Relative Hazard
0 10 20 30 40 Offense Seriousness Level
Crim Hist Category 1
5
1 15
2 25
Relative Hazard
0 10 20 30 40 Offense Seriousness Level
Crim Hist Category 2
5
1 15
2 25
Relative Hazard
0 10 20 30 40 Offense Seriousness Level
Crim Hist Category 3 0
5 1
15
2 25
Relative Hazard
0 10 20 30 40 Offense Seriousness Level
Crim Hist Category 4 0
5 1
15
2 25
Relative Hazard
0 10 20 30 40 Offense Seriousness Level
Crim Hist Category 5
5
1 15
2 25
Relative Hazard
0 10 20 30 40 Offense Seriousness Level
Crim Hist Category 6
Dots are estimated relative hazards (shown if between -25 and 25)Vertical lines are 95 confidence interval for the estimated relative hazards (truncated at 25)Smooth lines are linear predictions and 95 confidence intervals for the regression line
Criminal History 1
Criminal History 2
Criminal History 3
Criminal History 4
Criminal History 5
Criminal History 6
linear 0002 (0002)
0000 (0003)
0000 (0002)
-0003 (0003)
0000 (0004)
-0003 (0003)
constant -0068 (0013)
-0075 (0019)
-0075 (0017)
-0076 (0019)
-0068 (0028)
-0077 (0020)
R2 003 000 000 003 000 003 N 31 29 36 36 34 37
plt005 plt001 The constant is the average parameter for the estimated hazard (zero is neutral) Six criminal history scores labeled Criminal History
77
The Relationship between Prison Length of Stay and Recidivism -- This report was prepared by Abt Associates using Federal funding provided by the Bureau of Justice Statistics (BJS) Opinions andor points of view expressed are those of the author(s) and do not necessarily reflect the official position or policies of the US Department of Justice
Figure 3 ndash Relationship between Time-Served and Recidivism Principal Specification (Return and Revocation) using an Instrumental Variable Estimator
7
8
9
1 11
Relative Hazard
0 10 20 30 40 Offense Seriousness Level
Crim Hist Category 1
9 95
1 105 11 115
Relative Hazard
0 10 20 30 40 Offense Seriousness Level
Crim Hist Category 2
6
8
1 12
14
Relative Hazard
0 10 20 30 40 Offense Seriousness Level
Crim Hist Category 3 5
1 15
2 25
Relative Hazard
0 10 20 30 40 Offense Seriousness Level
Crim Hist Category 4 8
9
1 11
12
Relative Hazard
0 10 20 30 40 Offense Seriousness Level
Crim Hist Category 5
5
1 15
2 25
Relative Hazard
0 10 20 30 40 Offense Seriousness Level
Crim Hist Category 6
Dots are estimated relative hazards (shown if between -25 and 25)Vertical lines are 95 confidence interval for the estimated relative hazards (truncated at 25)Smooth lines are linear predictions and 95 confidence intervals for the regression line
Criminal History 1
Criminal History 2
Criminal History 3
Criminal History 4
Criminal History 5
Criminal History 6
linear 0001 (0000)
0001 (0000)
0001 (0000)
0000 0000
0000 0000
0000 0000
constant -0014 (0002)
-0015 (0003)
-0011 (0003)
-0011 (0003)
-0009 0005
-0009 (0003)
R2 043 022 012 003 001 010 N 31 29 36 36 34 37
plt005 plt001 The constant is the average parameter for the estimated hazard (zero is neutral) Six criminal history scores labeled Criminal History
78
The Relationship between Prison Length of Stay and Recidivism -- This report was prepared by Abt Associates using Federal funding provided by the Bureau of Justice Statistics (BJS) Opinions andor points of view expressed are those of the author(s) and do not necessarily reflect the official position or policies of the US Department of Justice
Figure 4 ndash Sensitivity Test Minimum Cell Size 50 instead of 100
0 5 1
15
2 25
Relative Hazard
0 10 20 30 40 Offense Seriousness Level
Crim Hist Category 1
0 5 1
15
2 25
Relative Hazard
0 10 20 30 40 Offense Seriousness Level
Crim Hist Category 2
5
1 15
2 25
Relative Hazard
0 10 20 30 40 Offense Seriousness Level
Crim Hist Category 3 0
5 1
15
2 25
Relative Hazard
0 10 20 30 40 Offense Seriousness Level
Crim Hist Category 4 0
5 1
15
2 25
Relative Hazard
0 10 20 30 40 Offense Seriousness Level
Crim Hist Category 5
0 5 1
15
2 25
Relative Hazard
0 10 20 30 40 Offense Seriousness Level
Crim Hist Category 6
Dots are estimated relative hazards (shown if between -25 and 25)Vertical lines are 95 confidence interval for the estimated relative hazards (truncated at 25)Smooth lines are linear predictions and 95 confidence intervals for the regression line
Criminal History 1
Criminal History 2
Criminal History 3
Criminal History 4
Criminal History 5
Criminal History 6
linear 0002 (0002)
0000 (0003)
0000 (0002)
-0002 (0003)
0000 (0004)
-0003 (0002)
constant -0068 (0013)
-0075 (0018)
-0073 (0018)
-0078 (0019)
-0068 (0027)
-0084 (0021)
R2 003 000 000 002 000 003 N 31 32 37 37 37 40
Six criminal history scores labeled Criminal History plt005 plt001 The constant is the average parameter for the estimated hazard (zero is neutral)
79
The Relationship between Prison Length of Stay and Recidivism -- This report was prepared by Abt Associates using Federal funding provided by the Bureau of Justice Statistics (BJS) Opinions andor points of view expressed are those of the author(s) and do not necessarily reflect the official position or policies of the US Department of Justice
Figure 5 ndash Sensitivity Test Minimum Cell Size 150 instead of 100
0 5 1
15
2 25
Relative Hazard
0 10 20 30 40 Offense Seriousness Level
Crim Hist Category 1
5
1 15
2 25
Relative Hazard
0 10 20 30 40 Offense Seriousness Level
Crim Hist Category 2
5
1 15
2 25
Relative Hazard
0 10 20 30 40 Offense Seriousness Level
Crim Hist Category 3
5
1 15
2 25
Relative Hazard
0 10 20 30 40 Offense Seriousness Level
Crim Hist Category 4
0 5 1
15
2 25
Relative Hazard
0 10 20 30 40 Offense Seriousness Level
Crim Hist Category 5
5
1 15
2 25
Relative Hazard
0 10 20 30 40 Offense Seriousness Level
Crim Hist Category 6
Dots are estimated relative hazards (shown if between -25 and 25)Vertical lines are 95 confidence interval for the estimated relative hazards (truncated at 25)Smooth lines are linear predictions and 95 confidence intervals for the regression line
Criminal History 1
Criminal History 2
Criminal History 3
Criminal History 4
Criminal History 5
Criminal History 6
linear 0002
(0002)
0000
(0003)
0000
(0002)
-0003
(0003)
-0001
(0004)
-0003
(0003) constant -0068
(0013) -0075 (0021)
-0076 (0017)
-0071 (0020)
-0066 (0031)
-0071 (0021)
R2 003 000 000 003 000 004 N 31 28 34 34 32 35
plt005 plt001 The constant is the average parameter for the estimated hazard (zero is neutral) Six criminal history scores labeled Criminal History
80
The Relationship between Prison Length of Stay and Recidivism -- This report was prepared by Abt Associates using Federal funding provided by the Bureau of Justice Statistics (BJS) Opinions andor points of view expressed are those of the author(s) and do not necessarily reflect the official position or policies of the US Department of Justice
Figure 6 -- Sensitivity Test Minimum Percentage of Prison Terms 75 instead of 50
0 5 1
15
2 25
Relative Hazard
0 10 20 30 40 Offense Seriousness Level
Crim Hist Category 1
5
1 15
2 25
Relative Hazard
0 10 20 30 40 Offense Seriousness Level
Crim Hist Category 2
5
1 15
2 25
Relative Hazard
0 10 20 30 40 Offense Seriousness Level
Crim Hist Category 3
0 5 1
15
2 25
Relative Hazard
0 10 20 30 40 Offense Seriousness Level
Crim Hist Category 4
0 5 1
15
2 25
Relative Hazard
0 10 20 30 40 Offense Seriousness Level
Crim Hist Category 5
5
1 15
2 25
Relative Hazard
0 10 20 30 40 Offense Seriousness Level
Crim Hist Category 6
Dots are estimated relative hazards (shown if between -25 and 25)Vertical lines are 95 confidence interval for the estimated relative hazards (truncated at 25)Smooth lines are linear predictions and 95 confidence intervals for the regression line
Criminal History 1
Criminal History 2
Criminal History 3
Criminal History 4
Criminal History 5
Criminal History 6
linear 0004 (0003)
0002 (0003)
-0001 (0003)
-0002 (0003)
0000 (0004)
-0003 (0003)
constant -0086 (0021)
-0091 (0023)
-0070 (0017)
-0074 (0020)
-0069 (0031)
-0076 (0020)
R2 007 002 001 002 000 004 N 27 28 32 33 31 36
plt005 plt001 The constant is the average parameter for the estimated hazard (zero is neutral) Six criminal history scores labeled Criminal History
81
The Relationship between Prison Length of Stay and Recidivism -- This report was prepared by Abt Associates using Federal funding provided by the Bureau of Justice Statistics (BJS) Opinions andor points of view expressed are those of the author(s) and do not necessarily reflect the official position or policies of the US Department of Justice
Figure 7 ndash Sensitivity Test Contrasts that are J and J+1 instead of J and J+2 5
1 15
2 25
Relative Hazard
0 10 20 30 40 Offense Seriousness Level
Crim Hist Category 1
0 5 1
15
2 25
Relative Hazard
0 10 20 30 40 Offense Seriousness Level
Crim Hist Category 2
5
1 15
2 25
Relative Hazard
0 10 20 30 40 Offense Seriousness Level
Crim Hist Category 3
5
1 15
2 25
Relative Hazard
0 10 20 30 40 Offense Seriousness Level
Crim Hist Category 4
5
1 15
2 25
Relative Hazard
0 10 20 30 40 Offense Seriousness Level
Crim Hist Category 5
5
1 15
2 25
Relative Hazard
0 10 20 30 40 Offense Seriousness Level
Crim Hist Category 6
Dots are estimated relative hazards (shown if between -25 and 25)Vertical lines are 95 confidence interval for the estimated relative hazards (truncated at 25)Smooth lines are linear predictions and 95 confidence intervals for the regression line
Criminal History 1
Criminal History 2
Criminal History 3
Criminal History 4
Criminal History 5
Criminal History 6
linear 0002 (0004)
-0002 (0005)
0005 (0004)
0006 (0004)
0003 (0006)
0006 (0004)
constant -0030 (0029)
-0017 (0040)
-0037 (0032)
-0039 (0028)
-0031 (0046)
-0023 (0028)
R2 0010 000 004 010 001 009 N 25 25 27 26 29 29
plt005 plt001 The constant is the average parameter for the estimated hazard (zero is neutral) Six criminal history scores labeled Criminal History
82
The Relationship between Prison Length of Stay and Recidivism -- This report was prepared by Abt Associates using Federal funding provided by the Bureau of Justice Statistics (BJS) Opinions andor points of view expressed are those of the author(s) and do not necessarily reflect the official position or policies of the US Department of Justice
Figure 8 -- Sensitivity Test Using the Prais-Winston Estimator
5
1 15
2 25
Relative Hazard
0 10 20 30 40 Offense Seriousness Level
Crim Hist Category 1
0 5 1
15
2 25
Relative Hazard
0 10 20 30 40 Offense Seriousness Level
Crim Hist Category 2
5
1 15
2 25
Relative Hazard
0 10 20 30 40 Offense Seriousness Level
Crim Hist Category 3
5
1 15
2 25
Relative Hazard
0 10 20 30 40 Offense Seriousness Level
Crim Hist Category 4
5
1 15
2 25
Relative Hazard
0 10 20 30 40 Offense Seriousness Level
Crim Hist Category 5
5
1 15
2 25
Relative Hazard
0 10 20 30 40 Offense Seriousness Level
Crim Hist Category 6
Dots are estimated relative hazards (shown if between -25 and 25)Vertical lines are 95 confidence interval for the estimated relative hazards (truncated at 25)Smooth lines are linear predictions and 95 confidence intervals for the regression line
Criminal History 1
Criminal History 2
Criminal History 3
Criminal History 4
Criminal History 5
Criminal History 6
linear 0019 -0010
0005 -0003
0003 -0003
0007 (0003)
0002 -0006
0006 (0003)
constant -0133 0065
-0060 0020
-0035 0016
-0030 0031
-0032 0029
-0040 0013
Rho 0100 -0940 -0790 0010 -0260 -0730 R2 0240 0210 0110 0210 0020 0330 N 25 25 27 26 29 29
plt005 plt001 The constant is the average parameter for the estimated hazard Six criminal history scores labeled Criminal History
83
The Relationship between Prison Length of Stay and Recidivism -- This report was prepared by Abt Associates using Federal funding provided by the Bureau of Justice Statistics (BJS) Opinions andor points of view expressed are those of the author(s) and do not necessarily reflect the official position or policies of the US Department of Justice
Figure 9 -- Sensitivity Test Entering Prison as Recidivism
0 5 1
15
2 25
Relative Hazard
0 10 20 30 40 Offense Seriousness Level
Crim Hist Category 1
5
1 15
2 25
Relative Hazard
0 10 20 30 40 Offense Seriousness Level
Crim Hist Category 2
0 5 1
15
2 25
Relative Hazard
0 10 20 30 40 Offense Seriousness Level
Crim Hist Category 3
0 5 1
15
2 25
Relative Hazard
0 10 20 30 40 Offense Seriousness Level
Crim Hist Category 4
0 5 1
15
2 25
Relative Hazard
0 10 20 30 40 Offense Seriousness Level
Crim Hist Category 5
5
1 15
2 25
Relative Hazard
0 10 20 30 40 Offense Seriousness Level
Crim Hist Category 6
Dots are estimated relative hazards (shown if between -25 and 25)Vertical lines are 95 confidence interval for the estimated relative hazards (truncated at 25)Smooth lines are linear predictions and 95 confidence intervals for the regression line
Criminal History 1
Criminal History 2
Criminal History 3
Criminal History 4
Criminal History 5
Criminal History 6
linear 0003 (0002)
0002 (0002)
0001 (0002)
-0004 (0003)
0000 (0004)
-0003 (0003)
constant -0070 (0014)
-0084 (0017)
-0077 (0018)
-0071 (0020)
-0074 (0030)
-0080 (0020)
R2 004 002 000 005 000 003 N 40 36 39 37 33 37
plt005 plt001 The constant is the average parameter for the estimated hazard (zero is neutral) Six criminal history scores labeled Criminal History
84
The Relationship between Prison Length of Stay and Recidivism -- This report was prepared by Abt Associates using Federal funding provided by the Bureau of Justice Statistics (BJS) Opinions andor points of view expressed are those of the author(s) and do not necessarily reflect the official position or policies of the US Department of Justice
Figure 10 -- Sensitivity Testing Eliminating Drug-Law Offenders from the Analysis
0 5 1
15
2 25
Relative Hazard
0 10 20 30 40 Offense Seriousness Level
Crim Hist Category 1
0 5 1
15
2 25
Relative Hazard
0 10 20 30 40 Offense Seriousness Level
Crim Hist Category 2
5
1 15
2 25
Relative Hazard
0 10 20 30 40 Offense Seriousness Level
Crim Hist Category 3
5
1 15
2 25
Relative Hazard
0 10 20 30 40 Offense Seriousness Level
Crim Hist Category 4
0 5 1
15
2 25
Relative Hazard
0 10 20 30 40 Offense Seriousness Level
Crim Hist Category 5
5
1 15
2 25
Relative Hazard
0 10 20 30 40 Offense Seriousness Level
Crim Hist Category 6
Dots are estimated relative hazards (shown if between -25 and 25)Vertical lines are 95 confidence interval for the estimated relative hazards (truncated at 25)Smooth lines are linear predictions and 95 confidence intervals for the regression line
Criminal History 1
Criminal History 2
Criminal History 3
Criminal History 4
Criminal History 5
Criminal History 6
linear 0001 (0003)
-0001 (0004)
-0001 (0003)
-0002 (0003)
0001 (0005)
-0003 (0003)
constant -0055 (0014)
-0065 (0022)
-0066 (0019)
-0057 (0022)
-0059 -0031
-0062 (0022)
R2 000 000 000 001 000 003 N 31 27 34 32 32 35
plt005 plt001 The constant is the average parameter for the estimated hazard (zero is neutral) Six criminal history scores labeled Criminal History
85
The Relationship between Prison Length of Stay and Recidivism -- This report was prepared by Abt Associates using Federal funding provided by the Bureau of Justice Statistics (BJS) Opinions andor points of view expressed are those of the author(s) and do not necessarily reflect the official position or policies of the US Department of Justice
Figure 11 -- Sensitivity Testing No Covariates
0 5 1
15
2 25
Relative Hazard
0 10 20 30 40 Offense Seriousness Level
Crim Hist Category 1
5
1 15
2 25
Relative Hazard
0 10 20 30 40 Offense Seriousness Level
Crim Hist Category 2
5
1 15
2 25
Relative Hazard
0 10 20 30 40 Offense Seriousness Level
Crim Hist Category 3
0 5 1
15
2 25
Relative Hazard
0 10 20 30 40 Offense Seriousness Level
Crim Hist Category 4
0 5 1
15
2 25
Relative Hazard
0 10 20 30 40 Offense Seriousness Level
Crim Hist Category 5
5
1 15
2 25
Relative Hazard
0 10 20 30 40 Offense Seriousness Level
Crim Hist Category 6
Dots are estimated relative hazards (shown if between -25 and 25)Vertical lines are 95 confidence interval for the estimated relative hazards (truncated at 25)Smooth lines are linear predictions and 95 confidence intervals for the regression line
Criminal History 1
Criminal History 2
Criminal History 3
Criminal History 4
Criminal History 5
Criminal History 6
linear 0001 (0003)
-0003 (0003)
-0002 (0003)
-0004 (0003)
-0002 (0004)
-0004 (0003)
constant -0062 (0015)
-0067 (0020)
-0081 (0018)
-0082 (0022)
-0071 (0028)
-0084 (0022)
R2 000 003 002 005 001 007 N 31 29 36 36 34 37
plt005 plt001 The constant is the average parameter for the estimated hazard (zero is neutral) Six criminal history scores labeled Criminal History
86
The Relationship between Prison Length of Stay and Recidivism -- This report was prepared by Abt Associates using Federal funding provided by the Bureau of Justice Statistics (BJS) Opinions andor points of view expressed are those of the author(s) and do not necessarily reflect the official position or policies of the US Department of Justice
Figure 12 -- Sensitivity Testing Using the Earlier Guidelines
0 1
2 3
4 5
Relative Hazard
0 10 20 30 40 Offense Seriousness Level
Crim Hist Category 1
0 5 1
15
2 25
Relative Hazard
0 10 20 30 40 Offense Seriousness Level
Crim Hist Category 2
5
1 15
2 25
Relative Hazard
0 10 20 30 40 Offense Seriousness Level
Crim Hist Category 3
0 5 1
15
2 25
Relative Hazard
0 10 20 30 40 Offense Seriousness Level
Crim Hist Category 4
0 5 1
15
2 25
Relative Hazard
0 10 20 30 40 Offense Seriousness Level
Crim Hist Category 5
5
1 15
2 25
Relative Hazard
0 10 20 30 40 Offense Seriousness Level
Crim Hist Category 6
Dots are estimated relative hazards (shown if between -25 and 25)Vertical lines are 95 confidence interval for the estimated relative hazards (truncated at 25)Smooth lines are linear predictions and 95 confidence intervals for the regression line
Criminal History 1
Criminal History 2
Criminal History 3
Criminal History 4
Criminal History 5
Criminal History 6
linear 0000 (0003)
0001 (0004)
0000 (0003)
-0004 (0002)
-0002 (0004)
-0004 (0003)
constant -0085 (0017)
-0097 (0025)
-0096 (0019)
-0085 (0018)
-0076 (0030)
-0081 (0028)
R2 000 000 000 007 001 004 N 31 29 34 35 33 34
plt005 plt001 The constant is the average parameter for the estimated hazard (zero is neutral) Six criminal history scores labeled Criminal History
87

The Relationship between Prison Length of Stay and Recidivism -- This report was prepared by Abt Associates using Federal funding provided by the Bureau of Justice Statistics (BJS) Opinions andor points of view expressed are those of the author(s) and do not necessarily reflect the official position or policies of the US Department of Justice
recounting the pains of imprisonment However these same ethnographers also emphasize prison
socialization This scholarship includes classic ethnographies of prison life such as Sykesrsquo Society of
Captives A Study of a Maximum Security Prison (1958) and Clemmerrsquos The Prison Community (1940)
Clemmer and Sykes provided a framework for studying inmate society and culture emphasizing the
nature of prison as a total institution in which separation from the community and the relationship
between inmates and guards redefine roles rules and personal identities Later ethnographies by
Carroll (1988) Jacobs (1977) Goffman (1961) Irwin (2009) Owen (1998) and Fleisher (1989) all
emphasize the strains deriving from both prison conditions and the antagonism pitting inmates
against guards None of these ethnographers provide strong empirical support for the relationship
between acculturation strain and recidivism
A line of research employing experimental and regression discontinuity designs (Chen and
Shapiro 2007 Gaes and Camp 2009 Lerman 2009 a b) evaluate the impact of security level
placement on in-prison and post-release outcomes Under the assumption that higher security levels
produce more strain Chen and Shapiro using an RDD and Gaes and Camp using an experiment found
higher security level placement led to higher levels of post-release recidivism Lerman employing an
RDD found that inmates placed in higher security levels had friends who were more likely to be
gang-involved and who were more likely to have had prior arrests and commitments Using other
data Lerman shows how these personal networks of friends are likely to be acquired in prison
Although these studies identify security level placement as a cause of in-prison socialization and
post-prison increases in recidivism supporting strain and socialization hypotheses they cannot rule
out other mediating mechanisms such as labeling though self-identification
Other criminologists argue that prisons are schools for crime where prisoners learn from
other inmates how to become more knowledgeable offenders (Cullen Jonson and Nagin 2011
6
The Relationship between Prison Length of Stay and Recidivism -- This report was prepared by Abt Associates using Federal funding provided by the Bureau of Justice Statistics (BJS) Opinions andor points of view expressed are those of the author(s) and do not necessarily reflect the official position or policies of the US Department of Justice
Letkemann 1973 Nguyen Loughran Paternoster Fagan amp Piquero 2017) Other research
suggests that prisons reinforce cultural values conforming to criminal activity that is offenders
import these values from their community and deviant values are reinforced by the structure and
organization of prison (Carroll 1988 Irwin 1980 2005 Jacobs 1977 Wacquant 2001)
Even if an offenderrsquos orientation toward reoffending is unaltered by prison labeling
(Braithwaite 1989) may affect recidivism Ex-offenders may be denied employment or prohibited
from accessing social benefits programs after release Whether these events are internalized
limiting the offenderrsquos subjective expectations or simply reduce legitimate avenues for community
integration they may increase the propensity to reoffend By manipulating job applications (Boshier
amp Johnson 1974) or by using actors posing as prior offenders (Pager et al 2009) research has
demonstrated a stigmatizing effect of a criminal record on employment reducing legitimate
opportunities for ex-offenders especially in a low wage job market Of course the stigma may come
from any term of imprisonment and long terms may be no more disadvantageous than short terms
PREVENTATIVE THEORIES
Preventative theories of imprisonment rest on a prisonerrsquos rational expectation of future
punishment or on theories of rehabilitation that envision prison as an opportunity to reform and
retrain Specific deterrence theorists (Becker 1968) assert that offenders are rational actors
weighing the costs and benefits of crime Experiencing prison reinforces its noxiousness and
provides a disincentive to future criminal behavior Reentry programming and other rehabilitative
training adopting evidence-based practices may reduce recidivism (Andrews amp Bonta 2006 Andrews
et al 1990 Gaes et al 1999 Gendreau et al 1999 Gendreau et al 2008 MacKenzie 2006 Smith
2006) so that prison can be used to change the trajectory of criminality Longer prison terms might
allow for more intensive reentry training and longer prison terms should reinforce the expectation of
7
The Relationship between Prison Length of Stay and Recidivism -- This report was prepared by Abt Associates using Federal funding provided by the Bureau of Justice Statistics (BJS) Opinions andor points of view expressed are those of the author(s) and do not necessarily reflect the official position or policies of the US Department of Justice
future punishment However because of the strong association between age and crime longer
prison terms produce inmates who are older at the time of release so that merely incapacitating
offenders for longer periods will reduce the likelihood of crime absent any other intervention or
causal mechanism As noted in Snodgras et al (2015) length of stay and aging are inseparable causal
factors even if one controls for age at release or age at sentence
Prison experiences may unleash forces that both push offenders away from crime and pull
them toward reoffending However as Loefler (2013) argues prison may simply collect people who
are predisposed toward criminality because of pre-existing life experiences and deficits He calls this
social selection crediting Manski and Nagin (1998) Nagin Cullen and Jonson (2009) and Smith and
Paternoster (1990) Loeffler argues that imprisonment itself is a highly selective process Only a small
proportion of people are imprisoned even people who are committed for the first time usually have
an extensive history of criminal justice contacts From this point of view prison has no causal
impact it is where offenders are housed much as hospitals are places where people predisposed to
illness are treated Loefflerrsquos argument is more relevant to an analysis of imprisonment than to
length of stay The relevant question we address is Even if there is a selection process does length
of stay have an impact on future reoffending
PRIOR STUDIES OF PRISON LENGTH OF STAY
Relying on criminological theory then provides no clear expectation of whether
incarceration will decrease or increase reoffending Nagin et al (2009) review empirical studies
addressing the question of whether on balance imprisonment pushes ex-offenders away or pulls ex-
offenders towards new crime They conclude that imprisonment per se seems to have a
criminogenic effect although they recognize studies that contradict that conclusion Nagin et al also
state there is little convincing evidence that length of stay ndash in their parlance prison dosage ndash
8
The Relationship between Prison Length of Stay and Recidivism -- This report was prepared by Abt Associates using Federal funding provided by the Bureau of Justice Statistics (BJS) Opinions andor points of view expressed are those of the author(s) and do not necessarily reflect the official position or policies of the US Department of Justice
increases recidivism They are skeptical of observational studies that use regression procedures to
uncover the causal impact of prison length of stay because identification requires an exacting
standard -- selection on observables (Rosenbaum 2002) -- in which covariates completely adjust for
any spurious relationship between time-served and recidivism
Nagin Cullen and Jonson (2009) identify 14 regression studies two experiments and three
matching studies evaluating the effect of length of stay in their 2009 review Because we are also
skeptical of the regression studies we do not review them1 The experimental studies of length of
stay by Berecochea and Jaman (1981) and Deschenes Turner and Petersilia (1995) manipulated
sentence reductions for offenders who had already served time in prison Part of the study design
for the Deschenes et al experiment diverted offenders from prison and would qualify as an
imprisonment but not a length of stay study However a subset of offenders was randomly assigned
to early release to be placed on intensive community supervision Analysis of the 17 dependent
variables showed only one that was significantly affected by prison length The Berecochea and
Jaman experiment randomly assigned offenders to a six-month reduction which was on average a
16 percent sentence reduction Inmates receiving a sentence reduction had higher parole failure
rates at one and two years after the release from prison but these differences were not statistically
significant Thus rigorous random design studies do not find that increasing prison length either
increases or decreases future criminality
Of the three matching studies identified by Nagin Cullen and Jonson (2009) two evaluate
length of stay on juveniles (Kraus 1981 and Loughran et al 2009) The third study by Jaman
Dickover and Bennett (1972) found recidivism to be higher for adult male burglars receiving 25
months or longer versus those serving 24 or fewer months but the difference was only significant at
1 The 14 regression studies mostly find null effects with specific deterrent and criminogenic effects about equal 9
The Relationship between Prison Length of Stay and Recidivism -- This report was prepared by Abt Associates using Federal funding provided by the Bureau of Justice Statistics (BJS) Opinions andor points of view expressed are those of the author(s) and do not necessarily reflect the official position or policies of the US Department of Justice
the 24-month horizon Kraus (1981) evaluated length of stay contrasts for juveniles that depended
on the juvenilersquos age group For example Kraus contrasted a term of 8 to 20 months versus a term up
to 7 months for 14 and 15-year oldrsquos however for juveniles who were 13 the contrast was between
9 to 16 months and 8 months or less None of the contrasts were statistically significant Loughran et
al (2009) employ propensity score methods The authors categorized the continuous length of stay
into discrete ordinal categories and used ordinal logit to estimate propensity scores The variation in
length of stay extended from 0-3 months up to greater than 12 months Whether using arrest or
self-reported reoffending Loughran et al found no marginal effect of length of stay on either
outcome
Meade Steiner Makarios and Travis (2012) also used ordinal logit to estimate the propensity
score creating ordered subsamples stratified by the estimated log odds of being in a category of
length of stay They stratified their sample into dosage categories and compared people within a
ldquodosagerdquo stratum to those with ldquosimilarrdquo propensity scores who had longer or shorter sentences
Meade et al found that beyond 16 months higher doses of imprisonment lowered recidivism (felony
arrest) however only the highest dose (gt= 78 months) was statistically significant
Snodgrass Blokland Haviland Nieuwbeerta and Nagin (2011) also conducted a dosage
study of time served among prisoners in the Netherlands and restricted their sample to first time
commitments convicted of violent property or drug offenses who were between age 12-40 and who
had sufficient time post-release to assess recidivism The discrete categories of time served were 1
month or less 1-2 months 2-3 months 3-6 months 6-12 months and 12+ months Consistent with
the other propensity score studies they estimated the propensity score using ordinal logit with many
covariates to predict the ordinal level of prison length of stay Rather than use only the propensity
scores to match offenders they used exact matches on sex age (+- two years) and one of four
10
The Relationship between Prison Length of Stay and Recidivism -- This report was prepared by Abt Associates using Federal funding provided by the Bureau of Justice Statistics (BJS) Opinions andor points of view expressed are those of the author(s) and do not necessarily reflect the official position or policies of the US Department of Justice
trajectory group memberships as well as a propensity score matching caliper of 15 The matched
pairings produced sets of offenders who served different sentence lengths The matched pairs
allowed Snodgrass et al to examine measures of recidivism comparing any given ordinal category of
length of stay to the other categories where a matched pair could be found The results showed no
relationship between length of stay and recidivism The Snodgrass et al study takes great care in
constructing counterfactuals for the offenders within a given length of stay class But as they note
the average levels of time served are much shorter than one would observe in most United States
adult prison samples
Roach and Schanzenbach (2015) use randomization of judges assigned to sentencing
convicted offenders to map the relationship between length of stay (median of 4 months) and one
two and three-year rates of recidivism Using reduced form and two-stage regression they find that
each additional month of sentence length decreases recidivism by about 1 percent When they
stratify on criminal history Roach and Schanzenbach find a strong effect of sentence length for
offenders with minimal criminal history and a weak or insignificant effect for offenders with more
extensive criminal histories They also found that relative to the base hazard rate the impact
occurred almost entirely within the first year of release Roach and Schanzenbach argue the impact
of length of stay is a combination of severity of punishment and rehabilitation The researchers argue
that offenders with longer sentences can participate in more rehabilitative prison programs Roach
and Schanzenbachrsquos Table 2 (page 19) does indicate possible sources of bias in the relationship
between length of stay and recidivism The judge dummy variables not only demonstrate a strong
relationship to sentence length essential to the study design but they also predict the offenderrsquos
offense severity level and number of prior non-violent convictions These offender characteristics
could be associated with the sentence length and the level of recidivism qualifying as backdoor
variables (Morgan and Winship 2015) Roodmanrsquos (2016) review of this study offers the possibility
11
The Relationship between Prison Length of Stay and Recidivism -- This report was prepared by Abt Associates using Federal funding provided by the Bureau of Justice Statistics (BJS) Opinions andor points of view expressed are those of the author(s) and do not necessarily reflect the official position or policies of the US Department of Justice
the longer sentences in this study would lead to longer parole supervision elevating recidivism
because of technical parole violations
Kuziemko (2012) uses the Georgia parole guideline grid as a means of identifying the causal
effect of length of stay She restricts her analysis to offenders with less severe offenses and whose
criminal history category is in the average to high range She uses the discontinuity in the grid
recommendation (separating high from average risk) as an instrument for time served with the
instrumented time served in stage one and recidivism regressed on the instrument in stage two
along with other covariates One of her estimates restricts the sample to people whose points are
just above or just below the discontinuity threshold (8 versus 9 points) which should yield the best
approximation to an exogenous variation She finds each additional month of time served lowers the
three-year recidivism rate by 15 percent It is not clear why Kuziemko restricted her analysis to this
threshold limiting the analysis to a narrow range of the guideline grid Most offenders have lower
criminal history scores and restricting the analysis to the higher thresholds limits the generalizability
of the study In fact Roodmanrsquos (2016) reanalysis of these data evaluates other discontinuity cut
points and finds either insignificant length of stay coefficients or coefficients with the opposite sign
indicating increased length of stay increases the probability of recidivism
Mears et al (2016) used the generalized propensity score to balance covariates across levels
of length of stay They balanced within four subgroups of time served categories using
demographics categories of commitment offense offense severity scores prior record scores
dummy coded year of release and dummy coded judicial district While they achieved balance on
this set of covariates they did not conduct a sensitivity test to evaluate the potential impact of an
omitted variable (Rosenbaum 2002) Mears et al (2016) found the effect of time served on
recidivism depended on the level of length of stay Short terms produced increased recidivism up to
12
The Relationship between Prison Length of Stay and Recidivism -- This report was prepared by Abt Associates using Federal funding provided by the Bureau of Justice Statistics (BJS) Opinions andor points of view expressed are those of the author(s) and do not necessarily reflect the official position or policies of the US Department of Justice
one year From one to two years time served decreases recidivism and thereafter has no effect
Long terms (more than 6 years) could not be evaluated due to large error terms
An RDD design employed by Hjalmarsson (2009) was also based on a guideline system
however the study applied to a juvenile population in the state of Washington and the discontinuity
was based on a sanction to a state run juvenile facility versus a local sanction This latter punishment
included sanctions involving much shorter sentences served in a local facility a term of community
supervision fines or community service Hjalmarsson found a deterrent effect of state-run
confinement for juveniles compared to the local sanctions This study was not a test of length of
stay but a test of state-run juvenile confinement as opposed to a bevy of alternate juvenile
punishments To control for the fact the running variable was correlated with recidivism across
levels of criminal history the study used a quadratic regression of the running variable
Furthermore the author used all the data without regard for bandwidth This puts tremendous
pressure on his quadratic expression being correct Secondly rather than using an intent-to-treat
estimator and perhaps converting that into LATE the author drops cross-overs from the
analysis There is no justification for doing so and we are unaware of other RDDrsquos that takes such a
step Finally the author made no attempt to justify an implicit assumption that right-hand-censoring
is independent In fact given data construction and what we know about juvenile justice right-
hand-censoring is unlikely to be independent Specifically offenders with longer terms are more
likely to be censored This relationship alone may explain the findings that incarceration reduced
recidivism
One last study of note was conducted by Drago Galbiati and Vertova (2009) in which the
authors examined the effect of a Clemency Bill in Italy that shortened the sentence of offenders
anywhere from 1 to 36 months This could be described as an exogenous treatment since the
13
The Relationship between Prison Length of Stay and Recidivism -- This report was prepared by Abt Associates using Federal funding provided by the Bureau of Justice Statistics (BJS) Opinions andor points of view expressed are those of the author(s) and do not necessarily reflect the official position or policies of the US Department of Justice
application of clemency was applied irrespective of criminal history offense age and other factors
affecting the outcome However the early release came with a caveat The remaining time to serve
would be reinstated if the offender was convicted of another crime within five years So this was a
reduction in length of stay with an added disincentive to commit a new offense People who had
spent more time in prison were less likely to reoffend and each month of remaining time to serve
was associated with a 124 percent reduction to commit a new crime2
Even with these additional studies the literature on length of stay using strong
counterfactual designs is still sparse and presents a mixed picture of effects Most studies show no
effect or that increased prison length reduces recidivism slightly Several are imbalanced in ways
that could bias the length of stay effects The studies also span different populations juveniles
adults and cover different international jurisdictions (Italy the Netherlands and United Sates) The
present study uses a very large sample of federal offenders sentenced to prison with varying lengths
of stay
INCARCERATION TREATMENT HETEROGENEITY
Scholars have argued that prison dosage (length of stay) may have different effects
conditional on factors associated with the individual with the social context with sentencing
structure and with potentially many other factors The National Academy of Sciences study on mass
incarceration finds evidence for the heterogeneity of incarceration effects (NRC 2014 427) But we
need a template to systematically examine incarceration heterogeneity
Mears Cochran and Cullen (2014) provide one such template They propose three types of
sources of heterogeneity prior sanctioning experience in-prison experiences and the level of post-
2 Kuziemko (2012) also capitalizes on early release in Georgia because jail overcrowding allowed her to compare offenders with different amounts of time served having the same prior risk levels She finds people with longer time served have lower recidivism rates These results are challenged by Roodman as possible evidence of parole bias in Kuziemkorsquos analysis
14
The Relationship between Prison Length of Stay and Recidivism -- This report was prepared by Abt Associates using Federal funding provided by the Bureau of Justice Statistics (BJS) Opinions andor points of view expressed are those of the author(s) and do not necessarily reflect the official position or policies of the US Department of Justice
release supervision ndash a pre- within- post-custody framework The National Academy of Sciences
report takes an even broader perspective by suggesting that there may be incarceration effects for
different units ndash the effect on people may be substantially different than the effect on families or
neighborhoods Based on the Mears et al hypothesized framework it seems sentencing jurisdictions
will vary on many of the important pre within and post dimensions We may be reluctant to accept
that results from Florida apply to Massachusetts unless we have a framework that tells us how to
compare jurisdictions within this pre within and post sentencing framework
For the current application we use the structure of the U S Sentencing Guidelines
sanctioning grid in our RDD design to test whether criminal history or offense seriousness moderates
the effect of length of stay increments We find that increments in length of stay have about the
same effect regardless of either of these dimensions We also separately evaluate criminal history
sex race education and marital status all showing homogeneous effects of length of stay
PRESENT METHODOLOGY DATA STATISTICS AND INFERENCE
This methodology section has three parts The first part identifies the source of the data ndash
the Federal Justice Statistics Program To provide necessary background before discussing the
regression discontinuity design the second part summarizes the US Sentencing Guidelines The
third part discusses statistical methods and the RDD identification strategy3 This application of RDD
is unconventional There are multiple break-points and hence multiple effects the effects are
summarized using a meta-regression borrowed from meta-analysis Furthermore for each effect
the bandwidth is exactly two units so search for an optimal bandwidth is not a concern Several
3 Some readers may prefer to characterize our approach as using instrumental variables The US Sentencing Guidelines are the instrument that moves offenders who otherwise have the same propensity to recidivate between two guidelines cells the first of which prescribes a shorter prison term on average than does the second Because there are many guideline cells there are many estimates based on contiguous cells The multiple estimates are averaged using inverse variance weights
15
The Relationship between Prison Length of Stay and Recidivism -- This report was prepared by Abt Associates using Federal funding provided by the Bureau of Justice Statistics (BJS) Opinions andor points of view expressed are those of the author(s) and do not necessarily reflect the official position or policies of the US Department of Justice
conventional tests used in RDD are inapplicable in this setting For example we need not test how
expanding the bandwidth affects estimates
Although the parallel is disputed (Imbens amp Lemieux 2007) some see RDD as an
instrumental variable estimator and it is practical to employ IV as the estimator This alternative
estimator is also used in this study Results show the RDD estimator and the IV estimator yield
essentially the same results
Data Source
Data for this study come from the Federal Justice Statistics Program (FJSP) a Bureau of
Justice Statistics (BJS) sponsored project to assemble federal justice records To be included in the
analysis an offender must have been sentenced under the guidelines between 1999 and 2014
Practically the period studied is shorter because to be included in the analysis an offender must have
entered community supervision but many offenders sentenced between 1999 and 2014 were still
incarcerated at the end of 2014
The FJSP has a thirty-five-year history however recent refinements link federal offenders
from investigation through corrections This paper uses a subset of the linked data running from
sentencing through a single cycle of release to community supervision and possible recidivism The
US Sentencing Commission (USSC) provides data on offenses and offenders at the time of
sentencing the Administrative Office of the US Courts (AOUSC) provides data on offenders under
community supervision and the Bureau of Prisons (BOP) provides data on offenders during periods
of incarceration Details regarding construction of the FJSP data appear elsewhere (Kling et al
2016) this paper summarizes
16
The Relationship between Prison Length of Stay and Recidivism -- This report was prepared by Abt Associates using Federal funding provided by the Bureau of Justice Statistics (BJS) Opinions andor points of view expressed are those of the author(s) and do not necessarily reflect the official position or policies of the US Department of Justice
Since 1987 federal offenders have been sentenced using sentencing guidelines and data
about guideline application have been assembled (and contributed to the FJSP) by the USSC
Guidelines data provide detailed accounts of the offenderrsquos criminal history the offense of
conviction the sentence imposed and expected prison time Expected prison time differs from
actual prison time but the two are close because sentencing in the federal system uses determinate
or real-time sentencing and as explained below actual time-served is observed with systematic
error
When an offender is sentenced to prison he or she serves time in a facility run by the
Federal Bureau of Prisons (BOP) which reports data from its inmate tracking system (SENTRY) to the
FJSP Most offender prison terms are recorded in SENTRY but some are not because (1) some
offenders are sentenced to time-served prior to trial (2) some offenders spend part of their terms in
state detention and (3) terms of thirty days or fewer are inconsistently recorded in SENTRY Because
of these limitations we use expected time-served reported by the USSC as a measure of prison time
However we use admission into a BOP facility during the period of community corrections as one
measure of recidivism
When an offender is sentenced to probation or when an offender leaves prison to serve a
statutorily required term of supervised release (a judge-imposed sentence to post-incarceration
supervision) his or her term of community supervision is recorded in Probation and Pretrial Services
Automated Case Tracking System (PACTS) an information system maintained by the Administrative
Office of the U S Courts specifically by the Probation and Pretrial Services Office (PPSO) After
some manipulation4 the PACTS data record periods of community supervision and outcomes Being
4 Federal probation officers frequently open terms of probation before the offender is sentenced and terms of supervised release before the offender is released from prison For probation the probation officer may be responsible for pretrial supervision continued into post-conviction supervision and this appears as a continuous period of community supervision
17
The Relationship between Prison Length of Stay and Recidivism -- This report was prepared by Abt Associates using Federal funding provided by the Bureau of Justice Statistics (BJS) Opinions andor points of view expressed are those of the author(s) and do not necessarily reflect the official position or policies of the US Department of Justice
revoked from community supervision is another measure of recidivism Every federal offender in our
sample received a term of community supervision eliminating one source of variability and
heterogeneity
For the recidivism analysis time-at-risk starts with the beginning of a term of supervised
release for offenders sentenced to prison The time-at-risk ends with recidivism or with the first
occurrence of one of the following censoring events completion of the community supervision term
three years or with the end of data collection Using the measures described above recidivism is
defined by the occurrence of a recognized failure event If the offender reappears in the federal BOP
data he or she is deemed to have recidivated If the offender does not reappear in the BOP data but
we observe the offender is revoked from community supervision he or she is deemed to have
recidivated Although there are several explanations for being revoked from supervision but not
entering federal prison one common reason is the offender is arrested for a state-level crime and
detained in state custody pending trial The date when an offender reenters prison is the date of
recidivism if the offender does not reenter prison but is revoked from supervision the date of the
revocation is the date of recidivism Based on years of working with the PPSO checking algorithms
with PPSO administrative staff and field staff we have confirmed that this approach ndash providing
primacy to returning to prison according to the BOP ndash is the best way to identify recidivism5
Many federal offenders are arrested for new crimes without returning to prison or having
their community supervision status revoked Using the FJSP data we estimate three-year recidivism
in the FJSP Also for probation an officer may open a supervision record when preparing a presentence report The correction is to change the beginning of supervision to the date of sentencing For a term of supervised release the probation officer might open the term in preparation for post-release planning To correct this we changed the beginning of supervision to coincide with the end of prison 5 An offenderrsquos community supervision must be revoked before he or she is committed to prison so the date of revocation would seem to be the better date for the failure event In fact probation officers often fail or are unable to record the date of revocation until weeks or months after it occurs Consequently the date of entering prison (when it occurs) is a more accurate indicator for a study of recidivism
18
The Relationship between Prison Length of Stay and Recidivism -- This report was prepared by Abt Associates using Federal funding provided by the Bureau of Justice Statistics (BJS) Opinions andor points of view expressed are those of the author(s) and do not necessarily reflect the official position or policies of the US Department of Justice
rates of about 20 percent for federal offenders placed on community supervision If new arrests
were included in the analysis the recidivism rate would be closer to 30 percent6 The FJSP does not
include arrest data so we could not define recidivism as being arrested but an arrest that does not
result in revocation is typically for a minor or unfounded crime so the outcome measures used in
this study are for events that are sufficiently serious to provoke a return to custody
To be included in the analysis the offender must have been convicted and sentenced under
the US Sentencing Guidelines since 1999 This is the period covered by the data linkage Only
offenders convicted of felonies and serious misdemeanors are sentenced routinely under the
guidelines so this study is limited to those serious offenders Others rarely serve prison terms so
the omission is inconsequential To be included in the study the offender must have entered
community supervision else we could not identify a recidivism follow-up period Because of this
requirement some offenders sentenced under the guidelines are excluded from the analysis
Several reasons explain why offenders do not enter community supervision First before entering
community supervision offenders sentenced to prison must have been released from prison
Second many federal offenders are foreign nationals in the country legally or illegally they are often
deported upon prison release so they are not candidates for a recidivism study and consequently
this study is based on US citizens7 Some other offenders are released from prison to detainers
exercised by state authorities Because offenders who never enter community supervision provide
no information for analysis they are excluded from the analysis file
6 The authors have worked with PPSO for six years to match community supervision records with criminal history records (eg criminal record histories held by state authorities and linked using an FBI index) Data use agreements preclude including criminal history records in the FJSP so they are unavailable for this analysis Based on our work with PPSO we know that recidivism rates based on arrests are near 30 percent 7 Non-citizens are sentenced to community supervision but they are deported and never enter active community supervision If they reenter the county illegally their supervision status can be revoked However this form of recidivism is very different from the form of recidivism studied in this paper so we chose to exclude non-citizens We might have retained non-citizens who entered active community supervision but they are difficult to distinguish reliably in the OBTS so we chose to exclude all non-citizens
19
The Relationship between Prison Length of Stay and Recidivism -- This report was prepared by Abt Associates using Federal funding provided by the Bureau of Justice Statistics (BJS) Opinions andor points of view expressed are those of the author(s) and do not necessarily reflect the official position or policies of the US Department of Justice
Data limitations discussed in this section seem to raise concerns about bias when measuring
recidivism but these concerns are not serious for this study Essentially a RDD study compares
offenders from group A with offenders from group B where group A and group B are closely
matched Due to matching whatever biases arise regarding the measurement of recidivism are likely
the same in groups A and B Therefore a comparison of recidivism for groups A and B is valid even if
estimates of recidivism are systematically biased
SENTENCING GUIDELINES
Explaining the RDD requires a short description of federal sentencing guidelines Under the
guidelines offense seriousness is determined by a complex set of rules that take the offense of
conviction and real offense behavior into account to classify sentencing factors into one of 43 offense
seriousness levels with j=1 being the least serious and j=43 being the most serious and six criminal
history categories with k=1 being the least serious (least likely to recidivate) and k=6 being the most
serious (most likely to recidivate) By design the offense seriousness levels reflect the USSCrsquos
assessment of offense seriousness and do not consider an offenderrsquos threat to recidivate Likewise
by design the offenderrsquos criminal history category reflects the USSCrsquos assessment of the likelihood
that an offender will recidivate Important to note subtle differences in offense conduct cause an
offenderrsquos crime to be associated with offense level j rather than offense level j-1 or j+1 For
example unarmed bank robbers armed bank robbers who do not display their weapons armed
bank robbers who display but do not threaten with their weapons and bank robbers who explicitly
threaten with their weapons all appear in different seriousness levels Furthermore offenders
convicted of violent crimes drug-law violations and property crimes can all appear in the same
offense seriousness level Based on this subtlety we expect that offenders in offense seriousness
level j will not be inherently more likely to recidivate than will offenders in seriousness levels j-1 and
20
The Relationship between Prison Length of Stay and Recidivism -- This report was prepared by Abt Associates using Federal funding provided by the Bureau of Justice Statistics (BJS) Opinions andor points of view expressed are those of the author(s) and do not necessarily reflect the official position or policies of the US Department of Justice
j+1 provided criminal history is held constant8 In fact holding criminal history constant it seems
likely that offenders in offense seriousness category j are not inherently more or less likely to
recidivate than are offenders in offense seriousness categories j-k and j+k where k is a small number
This assumption provides the identification logic for the RDD and for the instrumental variable
alternative
Under the guidelines another complex set of rules determine criminal history points which
are collapsed into six criminal history categories for the guidelines application with category 1 being
the least serious criminal record and category 6 being the most serious record Based on the offense
seriousness level and the criminal history category the federal sentencing guidelines are a 43x6 grid
comprising 43 offense seriousness rows and 6 criminal history columns Holding the criminal history
category constant moving down the grid from least serious offense level to most serious offense
level the recommended prison term increases Holding the offense seriousness level constant
moving from left to right across the grid from least serious criminal history category to most serious
criminal history category the recommended prison term increases For the least serious offenses
and for the least dangerous offenders the guidelines recommend probation or alternative sanctions
although prison terms are allowed and sometimes imposed
Every year the Commission can recommend changes to the guidelines for Congressional
approval and in fact the guidelines have changed over time These changes have little consequence
for the analysis reported in this paper Even if the composition of offenders within specific guideline
cells has changed over time recommended sentence terms have always increased with offense
8 Possibly some factors entering the determination of the offense seriousness level might predict recidivism However crimes committed in the federal system are so diverse and factors entering the guidelines are so detailed it seems unlikely that increases in the offense seriousness levels would be systematically associated with recidivism holding criminal history constant Possibly for some cell jj+1 comparisons factors that enter the offense seriousness determination may cause recidivism to increase or decrease but provided these factors are not systematic ndash meaning that they do not always increase recidivism as the comparison moves from cell j to j+1 ndash the treatment effect is still identified
21
The Relationship between Prison Length of Stay and Recidivism -- This report was prepared by Abt Associates using Federal funding provided by the Bureau of Justice Statistics (BJS) Opinions andor points of view expressed are those of the author(s) and do not necessarily reflect the official position or policies of the US Department of Justice
seriousness level As explained in this next section that regularity is sufficient to support the RDD
estimation procedure
THE RDD AND STATISTICAL METHODOLOGY
During the last decade methods for inferring causality have gone well beyond naive
regression models criticized by Nagin and his colleagues (Morgan amp Winship 2015 Imbens amp Rubin
2015) A regression discontinuity design (Hahn Todd amp van der Klauuw 2001 van der Klaauw 2002
Imbens amp Lemieux 2007 Lee amp Lemieux 2010 Bloom 2012) is a rigorous approach often applied in
non-criminal justice research and sometimes applied in criminal justice studies (Berk amp Rauma 1983
Berk amp DeLeeuw 1999 Berk 2010 Rhodes amp Jalbert Regression Discontiuity Design in Criminal
Justice Evaluation An Introduction and Illustration 2013) Commonly the RDD is applied in a setting
where a decision rule based on factors (such as offense seriousness level holding criminal history
constant) can be used to define a ldquocut-pointrdquo that places study subjects (such as offenders) into one
group that does and another group that does not receive treatment Very near that rule-imposed
cut-point study subjects who do and do not receive treatment are so similar that a comparison of
outcomes for the two groups is deemed valid This section explains that our application of the RDD
identification strategy differs from the conventional application
One difference between our application and the standard application is that for us treatment
is a dose (eg the length of a prison term) while in standard applications treatment is a binary
condition On average the dose received by offenders in cell j+1 is higher than the dose received by
offenders in cell j Because offenders in cells j and j+1 are otherwise the same regarding the threat to
recidivate we can ask whether offenders in cell j+1 have higher or lower recidivism rates than
offenders in cell j and if so we have justification for attributing causation As a stylized example
22
The Relationship between Prison Length of Stay and Recidivism -- This report was prepared by Abt Associates using Federal funding provided by the Bureau of Justice Statistics (BJS) Opinions andor points of view expressed are those of the author(s) and do not necessarily reflect the official position or policies of the US Department of Justice
suppose first-time offenders who steal $100000 are sentenced according to offense seriousness
level j while first-time offenders who steal $125000 are sentenced according to offense seriousness
level j+1 In deference to the more serious crime the guidelines call for a term between 20 and 23
months for first-time offenders sentenced within guideline cell j and between 22 and 26 months for
first-time offenders sentenced within guidelines cell j+1 Given judicial discretion sentences imposed
on offenders within guideline cell j overlap with sentences imposed on offenders within guideline cell
j+1 but on average prison sentences within guideline cell j+1 are longer than those imposed within
guideline cell j This average difference drives the identification strategy Specifically holding the
criminal history category constant offenders sentenced within guideline cell j+1 are not inherently
more recidivistic than are offenders sentenced within guideline cell j but offenders sentenced within
guideline cell j+1 receive longer prison terms on average and we can test for whether those longer
prison terms account for higher or lower recidivism
Usually when applying RDD researchers consider a variable X (called a running variable in
the RDD context) and a critical value Xo that assigns study subjects to a comparison group when X lt
Xo and to a treatment group otherwise A sharp design occurs when the assignment is exact a fuzzy
design occurs when the assignment is inexact Although both sharp and fuzzy designs both estimate
the treatment effect sharp designs are preferred because (from a statistical estimation standpoint)
they are more efficient and interpreting the effect is clear
When treatment is binary as it is in standard applications the distinction between sharp and
fuzzy is straightforward Let PL be the probability of treatment when X lt Xo and let PR be the
probability of treatment otherwise If PL = 0 and PR = 1 then the design is sharp Let YL be the mean
outcome when X lt Xo and let YR be the mean outcome otherwise An estimator for the treatment
effect is YR-YL or just the difference in the mean outcomes But suppose that PL ge 0 or PR le 1 or both
23
The Relationship between Prison Length of Stay and Recidivism -- This report was prepared by Abt Associates using Federal funding provided by the Bureau of Justice Statistics (BJS) Opinions andor points of view expressed are those of the author(s) and do not necessarily reflect the official position or policies of the US Department of Justice
then the design is fuzzy Given a fuzzy RDD an often-used estimator is (YR-YL)(PR-PL) This
alternative estimator is sometimes called a local average treatment effect (LATE) Note the
numerator is an intent-to-treat estimator and in fact statistical testing is based on the numerator
because dividing by a constant will not change the properties of the basic test of whether treatment
is effective
For our application treatment is a dose and doses are distributed about a mean that
depends on whether X lt Xo or X ge Xo A necessary condition is that a shift in the offender from
guideline cell j to guideline cell j+1 will always (a sharp design) or sometime (a fuzzy design) cause an
offender to receive a longer prison term The monotonicity assumption is that this shift will never
cause an offender to receive a shorter prison term We presume the monotonicity assumption holds
and see no reason to assume otherwise
A test of the null hypothesis of no treatment effect is based on YR-YL Let TL be the average
prison term for X lt Xo let TR be the average prison term for X ge Xo Then the counterpart to the LATE
estimator for the binary treatment effect is (YR-YL)(TR-TL) or the change in recidivism per unit of
additional prison This too is a local average treatment effect Its interpretation is the average
increasedecrease in recidivism resulting from an average increase in prison length
In both these illustrations the estimator is LATE LATE is not necessarily the average
treatment effect or in this case the average increasedecrease in recidivism from increasing time-
served by one unit However LATE is almost always used as a substitute for that average which is
unidentified (Imbens 2009)
Returning to the standard application the ideal identification strategy requires that
estimation be limited to study subjects whose X values are just slightly less than Xo or equal to or
24
The Relationship between Prison Length of Stay and Recidivism -- This report was prepared by Abt Associates using Federal funding provided by the Bureau of Justice Statistics (BJS) Opinions andor points of view expressed are those of the author(s) and do not necessarily reflect the official position or policies of the US Department of Justice
slightly more than Xo9 Because very few observations meet these demanding conditions evaluators
usually expand the bandwidth to be broader than ldquoslightly lessrdquo and ldquoslightly morerdquo Because this
expansion of the bandwidth violates the asymptotic identification assumptions evaluators typically
assume that a local linear regression of the outcome variable Y on X will capture the relationship
between Y and X absent any intervention Given the intervention any departure from the local linear
regression around Xo is deemed the treatment effect A standard application would test the
credibility of this local linear regression and a standard application would test the sensitivity of
findings to the size of the bandwidth
Our application differs from the standard application in important ways Typically when
researchers apply the RDD strategy there is a single cut-point so there is a single estimate of the
treatment effect Less commonly there are multiple cut-points and a researcher can estimate
multiple treatment effects (Cattaneo Keele Tituinik amp Vazquez-Bare 2016) Given the structure of
the sentencing guidelines our study is based on a multiple cut-point RDD That is we estimate
multiple effects then combine them to generalize conclusions
Rather than increasing efficacy by expanding the bandwidth we always make comparison
across adjacent cells so that cell j is deemed ldquoslightly lessrdquo than the offense seriousness level that
determines cell j+1 Employing multiple cut-points achieves small standard errors by combining the
multiple estimates that arise from comparing outcomes for cells jj+1 j+1j+2 j+2j+3 and so on It is
unnecessary to expand the bandwidth beyond two units
9 ldquoSlightly lessrdquo and ldquoslightly morerdquo mean than X falls within a region X+δ and X-δ as δ approaches zero Expanding the bandwidth means that δ is allowed to get bigger
25
The Relationship between Prison Length of Stay and Recidivism -- This report was prepared by Abt Associates using Federal funding provided by the Bureau of Justice Statistics (BJS) Opinions andor points of view expressed are those of the author(s) and do not necessarily reflect the official position or policies of the US Department of Justice
In the conventional application a researcher would assure the relationship between the
outcome variable and the running variable is linear to the left and right of the breakpoint10 Because
our approach employs just two points j and j+1 this test is unavailable to us Arguably it is also
inapplicable because when estimating an effect we do not expand the bandwidth beyond j and j+1
In the conventional application the researcher will assure there is a discontinuity in treatment so
that treatment is more likely for those to the right of the cut-point than it is for those to the left We
do apply this conventional test showing that it holds
In conventional RDD analysis researchers worry about ldquogamingrdquo In the present context
defense attorneys have incentives to move their clients to lower guideline cells and prosecuting
attorneys have countervailing incentives to move offenders to higher guideline cells Gaming is
possible by manipulating guideline elements such as the amount of money stolen Defense
attorneys would argue the amount is lower than alleged prosecutors would argue the opposite In
conventional RDD analysis researchers use imperfect devices to test for gaming but those tests are
not necessary in the present context
To explain suppose a variable Z is associated with recidivism and is subject to gaming such
that defense attorneys are generally able to shift offenders from cell j+1 to cell j based on the value
of Z In our study we would expect a general shift in Z from j+2 to j+1 from j+1 to j from j to j-1
from j-1 to j-2 and so on In general this shift would have no effect on the contrasts because it
occurs across all adjacent cells Thus gaming is less relevant for a multiple-effect RDD than for a
conventional single-effect RDD Furthermore we are only concerned with gaming about variables
10 Postulating a linear relationship is frequent but some researchers expand their models to allow power functions of the running variable Hjalmarsson (2009) in a study of guidelines and juvenile justice discussed earlier used a quadratic This is a dangerous practice because the validity of the quadratic is difficult to assess and findings based on a RDD are sensitive to getting the model specification correct There are other elaborate alternatives to using local linear regressions but they are not applicable to our study
26
The Relationship between Prison Length of Stay and Recidivism -- This report was prepared by Abt Associates using Federal funding provided by the Bureau of Justice Statistics (BJS) Opinions andor points of view expressed are those of the author(s) and do not necessarily reflect the official position or policies of the US Department of Justice
that affect recidivism Because criminal history is held constant by construction of the guideline cells
the avenue for gaming is restricted Nevertheless we introduce some test for whether variable
associated with recidivism vary systematically across cells so that for example we ask whether
offenders in cell j+1 tend to be older than offenders in cell j We introduce these potential
confounders into the local linear regression Although we do not need a local linear regression for
identification we increase the efficiency of estimates by using a regression to include covariates in
the analysis Given the nature of the outcome variable when comparing outcomes in cells j and j+1
our study uses a Cox survival model sometimes called a Cox proportional hazard model but it is
ldquolocalrdquo only in the sense that (absent the intervention) the baseline survival model is invariant
around the cut-point and we estimate the treatment effect from a unit shift There exists an
extensive methodological literature on survival models (Lancaster 1990 Kalbfleisch amp Prentice
2002 Hosmer Lemeshow amp May 2008) which are frequently applied in studies of criminal
recidivism where time-at-risk is often censored A separate study justifies using the proportional
hazard model (rather than a parametric alternative) to study recidivism in the federal system
(Rhodes et al 2012) Although the approach seems uncommon others have used survival models as
the estimator in a RDD context (Rhodes amp Jalbert 2013 Bor Moscoe Mutevedzi Newell amp
Barnighausem 2014) We use the RDD identification strategy and the survival model estimation
strategy to identify and estimate the change in the hazard of recidivism across paired guideline cells
The most defensible approach consistent with the intuition of the RDD would seem to be to
compare the relative hazards for cell j and j+1 (holding criminal history category constant) because
offenders in cells j and j+1 are more alike than in any other comparison Both the previous discussion
and descriptive statistics discussed subsequently points toward a problem Cells j and j+1 are so
27
The Relationship between Prison Length of Stay and Recidivism -- This report was prepared by Abt Associates using Federal funding provided by the Bureau of Justice Statistics (BJS) Opinions andor points of view expressed are those of the author(s) and do not necessarily reflect the official position or policies of the US Department of Justice
alike the average time-served is not guaranteed to increase when comparing cell j to cell j+111 Even
when it increases the size of the increase may be so small that it is not informative As an extreme
example there is not much use in comparing recidivism for offenders who serve two years on
average when sentenced within cell j and two years plus one day on average when sentenced within
cell j+1 From experimentation to assure that average time served will increase between contrasted
cells we have found it better to compare the outcome from cell j and cell j+212 Notwithstanding
what was written above most of the analysis is based on that jj+2 comparison but we do offer
sensitivity tests that employ the original jj+1 comparison An alternative approach is to combine
cells j and j-1 and compare that with the combined cells j+1 and j+2 (This is equivalent to expanding
the bandwidth) However this alternative approach seems to offer no advantages and introduces
some difficult estimation problems (serial correlation and general model specification issues) when
combining multiple effects so we avoid its application
Because this identificationestimation strategy results in many hazard estimates (potentially
41x6) we use techniques familiar from meta-analysis to combine estimates (effects) into summary
statistics A useful explanation of a fixed-effect meta-regression is Rhodes (2012) For example for
the first criminal history category there are potentially 41 effects We estimate a weighted least-
squares linear regression to estimate the average of the 41 effects Because there are 6 criminal
history categories we repeat the meta-regression across the 6 criminal history categories and then
average the 6 meta-regression averages to derive a single inverse variance weighted estimate and
11 Especially for drug-law violations and weapons offenses federal statutes require application of mandatory minimum sentences Regardless of guideline recommendations judges cannot sentence below the mandatory minimums Because mandatory minimums are not evenly distributed across the offense seriousness levels it is possible for the average terms in cell j to be larger than the average terms in cell j+1
12 Across the six criminal history categories the average percent change in time-served between cells j and j+1 ranges from 9 to 18 with the change being largest for criminal history category 1 In comparison across the six criminal history categories the average percent change in time-served between cells j and j+1 ranges from 20 to 38 with the change being largest for criminal history category 1
28
The Relationship between Prison Length of Stay and Recidivism -- This report was prepared by Abt Associates using Federal funding provided by the Bureau of Justice Statistics (BJS) Opinions andor points of view expressed are those of the author(s) and do not necessarily reflect the official position or policies of the US Department of Justice
test statistic Thus although there are many estimates there is only one test statistics and hence no
multiple comparison problem
For reasons explained below when applying the meta-regression we must deal with error
terms that may be auto-correlated and heteroscedastic We will show that heteroscedasticity is a
major problem and to deal with it we used weighted least squares Because we compare cells j with
j+2 j+1 with j+3 j+2 with j+4 and so on we potentially introduce autocorrelation across the
estimates The jj+2 and j+2j+4 comparisons are not independent because they have j+2 in common
This problem has corrections (Prais-Winston estimators for example) but they are suspect in small
samples where ignoring the problem is likely better than attempting to introduce a feasible
generalized least squares solution (Greene 2008 p 648) This follows because small samples provide
inaccurate estimates for the autocorrelation coefficient We concentrate on the heteroscedasticity
problem however we provide a sensitivity test suggesting that autocorrelation can safely be
ignored
The meta-regression provides the average effect of moving from guidelines cell j to cell j+2
This is an intent-to-treat estimator If this movement were not statistically significant we would
conclude that increasing prison terms has no effect on criminal recidivism If the average effect is
statistically significant by itself it does not provide LATE the size of the effect resulting from a unit
increase in prison time Our approach is to report the size of the average effect when moving from
cell j to j+2 the average increase in the length of the prison term when moving from cell j to j+2 and
the ratio of the two The ratio is essentially the LATE
A more direct approach which requires the same assumptions as were applied above is to
apply an instrumental variable (IV) estimator where the shift from guideline cell j to j+2 is the
instrument That is offenders in cell j+2 are not inherently more or less recidivistic than are
29
The Relationship between Prison Length of Stay and Recidivism -- This report was prepared by Abt Associates using Federal funding provided by the Bureau of Justice Statistics (BJS) Opinions andor points of view expressed are those of the author(s) and do not necessarily reflect the official position or policies of the US Department of Justice
offenders in cell j but the longer average sentences served by offenders in cell j+2 cause those
offenders to recidivate at a greater or lesser rate than offenders in cell j Instead of a dummy
variable representing membership in cell j or j+2 the important right-hand-side variables is the
average time-served by offenders in cell j and j+213 That is the treatment variable takes one of two
values the average time-served by offenders in cell j (when the observation belongs to cell j) or the
average time-served by offenders in cell j+2 (when the observation belongs to cell j+2) The
advantage of this approach is that parameter estimates have the interpretation of ldquochange in the
relative hazard per additional month of time servedrdquo The disadvantage is that IV estimators lack
desirable asymptotic properties (that is they are biased even in large samples) when applied to a
non-linear model and the Cox regression is a non-linear model (Rhodes 2010) Nevertheless we
expect estimates to be approximate and worth comparing with the RDD estimates
RESULTS
This section has two parts The first part provides descriptive statistics and justification for
deleting cases from the analyses The second section provides estimates of the effect of increasing
time-served on recidivism using the RDD and IV approaches it also provides sensitivity tests for case
deletion and other analytic decisions
DESCRIPTIVE STATISTICS AND RULES FOR DELETING CASES
Table 1 reports the number of offenders available for the analysis before we add restrictions
To be included in this table an offender must meet three criteria First he or she must have been
sentenced under the guidelines because guidelines calculations are used in the analysis Second he
13 This is a two-stage estimation model The first-stage involves a regression of time-served on dummy variables representing the adjacent guideline cells But this regression will simply provide the mean time-served in each cell so we do not actually perform the regression
30
The Relationship between Prison Length of Stay and Recidivism -- This report was prepared by Abt Associates using Federal funding provided by the Bureau of Justice Statistics (BJS) Opinions andor points of view expressed are those of the author(s) and do not necessarily reflect the official position or policies of the US Department of Justice
or she must be a US citizen We cannot follow recidivism by deported offenders And third he or
she must have entered active community supervision following sentencing ndash either probation or a
term of supervised release ndash because active supervision initiates the time at risk of recidivism This
third criterion has two implications If an offender never entered active community supervision that
offender would not appear in the analysis Specifically if an offender was sentenced to prison and
remained in prison as of September 30 2014 that offender would not appear in the analysis Thus
offenders sentenced to long prison terms and especially offenders sentenced toward the end of the
data collection window are more likely to be excluded than are other offenders This systematic
selection will not bias the RDD estimates because any selection bias will be equally applicable to cell j
and cell j+2 That is the RDD implicitly adjusts for the selection bias
Insert Table 1 about here
Shading identifies cells with fewer than 100 observations Although data for the most and
least serious offense levels are sparse the sample sizes for the other cells are ample an important
point because the RDD approach holds criminal history category constant and compares outcomes
for offense serious levels j and j+2 Notice that about half the offenders fall into criminal history
category 1 and given that these are relatively inexperienced offenders a reader might put more
subjective weight on the analysis of offenders in this criminal history category To be included in the
principal analysis a cell must have 100 or more offenders Stripped of some other statistical issues
basically the RDD approach requires a comparison of the mean recidivism rates for cells j and j+2
Because the sampling variance for estimated difference in outcomes between offense seriousness
levels j and j+2 is inversely proportional to the number of offenders in cells j and j+2 setting a
minimum number of observations increases the average precision of estimated effects for those cells
31
The Relationship between Prison Length of Stay and Recidivism -- This report was prepared by Abt Associates using Federal funding provided by the Bureau of Justice Statistics (BJS) Opinions andor points of view expressed are those of the author(s) and do not necessarily reflect the official position or policies of the US Department of Justice
retained in the analysis but we will present sensitivity analyses of the 100-offender criterion
showing the analysis appears insensitive to this criterion
Using the same data applied to produce Table 1 Table 2 reports the percentage of offenders
who receive prison terms by guidelines cell Shading denotes that fewer than 50 of offenders
within a cell are sentenced to prison Prison is often imposed for federal crimes but sentencing
guidelines (and hence this table) are only mandatory for felonies and serious misdemeanors
Additionally many federal crimes are dual jurisdiction offenses and generally the most serious
crimes are prosecuted in federal court while the least serious crimes are prosecuted in state courts
These factors explain why prison terms are so frequent in these data Still prison is infrequent for
offenders convicted of the least serious crimes provided they lack serious criminal records For a cell
to be included in the principal analysis at least 50 of offenders in that cell must have received
prison terms Justification is that for estimating effects the effective sample size is proportional to
the number in the cell multiplied by the percentage sentenced to prison because probation
sentences count as zero for these calculations (Offenders sentenced to straight probation are
assigned prison terms of length zero) However we will provide sensitivity testing of this selection
criterion showing that findings are insensitive to the criterion
Insert Table 2 about here
Inspection of Table 2 shows some irregularities in the progression of sentence severity
especially for the least serious offense levels but the general pattern is that prison terms become
increasingly certain as we look down the table (from least to most serious crimes) and across the
table (from least to most serious offenders) Inspection of Table 3 which reports average time-
served (counting probation as zero) also shows some irregularities but the general pattern is that
32
The Relationship between Prison Length of Stay and Recidivism -- This report was prepared by Abt Associates using Federal funding provided by the Bureau of Justice Statistics (BJS) Opinions andor points of view expressed are those of the author(s) and do not necessarily reflect the official position or policies of the US Department of Justice
average time-served in prison increases as we look down the table (from least to most serious
crimes) and across the table (from least to most serious offenders)
The irregularities cause a problem for the RDD If the RDD compared cells j with j+1 for a
RDD strategy to work we must observe a substantial increase in the average time in prison as we
compare cell j with cell j+1 Logically small changes fail to create a credible contrast Looking
especially at Table 3 several cell j and j+1 contrasts fail to meet this criterion The problem is that
moving from cell j to cell j+1 is a subtle shift and we find a better comparison to be between cell j
and j+2 This is the reason for using a jj+2 comparison instead of a jj+1 comparison Although
comparing cells j and j+2 may raise validity issues whatever bias is introduced is likely to be small
and from a mean-squared-error perspective comparing jj+2 instead of jj+1 seems justified
However as a sensitivity test we also report estimates based on a comparison of cells j and j+1 and
qualitative results prove insensitive to whether the comparison is between jj+1 or jj+2
Insert Table 3 about here
One more table is useful for summarizing the recidivism measure Table 4 reports the
percentage of offenders who recidivate during their periods of community supervision These
statistics are right-hand-censored by the length of the time-at-risk and capped at three years They
do not account for censoring due to supervision terms less than three years Although most
offenders avoid returning to prison returning to prison is not an infrequent occurrence At this
descriptive stage of the analysis patterns may seem peculiar Looking down each column recidivism
rates are lower for offenders incarcerated for the most serious crimes and higher for offenders
incarcerated for the least serious crimes Although as description this pattern is correct the effect is
probably not causal It seems likely that offenders who serve the longest terms are older when
released from prison than are offenders who serve the shortest terms and given that age is
33
The Relationship between Prison Length of Stay and Recidivism -- This report was prepared by Abt Associates using Federal funding provided by the Bureau of Justice Statistics (BJS) Opinions andor points of view expressed are those of the author(s) and do not necessarily reflect the official position or policies of the US Department of Justice
predictive of recidivism the patterns may be partly a result of age Reading across the table
recidivism tends to increase with criminal history but small sample sizes for the most serious
criminal history scores may be responsible for imprecise estimates
Insert Table 4 about here
Intended as a summary of the patterns shown by Table 4 Figure 1 presents survival curves
based on Kaplan-Meier estimates stratified by criminal history categories To be included in this
analysis an offender had to be sentenced within a guideline cell with 100 or more offenders and at
least 50 percent of offenders within that cell must have received prison terms Those restrictions are
consistent with the restrictions imposed for the principal analysis presented later However the
figure changes very little when the restrictions are removed In general as the criminal history
category increases so too does the rate of recidivism although the difference between criminal
history categories 5 and 6 is barely perceptible
Insert Figure 1 about here
Table 5 extends the descriptive analysis appearing in Figure 1 to include covariates (The
table reports parameters from a Cox model not relative hazards) The regression is naiumlve in the
sense that it does not account for potential confounding variables that might ndash if known ndash explain
why recidivism falls as the offense severity level (and hence time-served) increases This regression
uses variables that will reappear in the local linear regressions that we use for the RDD analyses
Separate Cox regressions are reported for each criminal history category
Scaled time-served This is estimated time-served rescaled by dividing the original time-served by
the maximum time-served Time-served is capped at 180 months The cap is
inclusive of more than 99 percent of terms
34
The Relationship between Prison Length of Stay and Recidivism -- This report was prepared by Abt Associates using Federal funding provided by the Bureau of Justice Statistics (BJS) Opinions andor points of view expressed are those of the author(s) and do not necessarily reflect the official position or policies of the US Department of Justice
Time-served squared This is the square of scaled time-served
Scaled age This is the offender age at the time that he or she entered community
supervision rescaled to run from 0 to 1
Age squared This is scaled age squared
Female This is a dummy variable for female
Black This is a dummy variable for Black
Other race This is a dummy variable for race other than White or Black
Hispanic This is a dummy variable for Hispanic ethnicity It is not collinear with the
race variables
High school This is a dummy variable indicating the offender has a high school degree or
equivalent
Advanced degree This is a dummy variable indicating the offender has a degree beyond high
school
Lives alone This is a dummy variable indicating the offender is neither married nor living
in a common law relationship at the time of sentencing
Centered CH points The guidelines assign criminal history points based on criminal records that
are collapsed into the six criminal history categories The criminal history
points are centered to have a mean of zero for each guideline cell
District This is the judicial district where the sentence was imposed There are 94
federal districts including those in territories District enters the analysis
35
The Relationship between Prison Length of Stay and Recidivism -- This report was prepared by Abt Associates using Federal funding provided by the Bureau of Justice Statistics (BJS) Opinions andor points of view expressed are those of the author(s) and do not necessarily reflect the official position or policies of the US Department of Justice
when estimating the frailty parameter that is as a random effect associated
with the Cox model
Because they run from zero to one scaled variables are useful for interpreting quadratics
The centered criminal history points provide a more refined measure of criminal record beyond the
broader criminal history category Centering this score is unimportant for the results presented in
Table 5 but centering is useful for later analyses
Insert Table 5 about here
As description the estimates appearing in Table 5 tell a simple story As best as a quadratic
can capture the pattern recidivism falls as time-served increases after accounting for the criminal
history category The declines are substantial and tend to be greater (but not consistently) for those
with minor criminal records (category 1) than for those with serious criminal records (categories 2-6
exclusive of 5) As an illustration when time-served changes from 30 months to 60 months the
relative hazards from criminal history 1 to criminal history 6 are 081 074 072 075 081 and 077
respectively14
Except regarding age other parameters are less interesting for this current study because
they tell us nothing about how recidivism changes with time-served (Women are less recidivistic
than men Blacks and other races are more recidivistic than Whites Hispanics tend to be less
recidivistic than non-Hispanics The educated are less recidivistic than the under-educated Marital
association appears to have no predictive effect The relative importance of these covariates
appears to decrease as criminal history increases) The inverse relationship between recidivism and
2
180
3060
180180 180
60 3014 For example the relative hazard for criminal history category 1 equals exp 1707
0941
minus+minusminus
2
36
The Relationship between Prison Length of Stay and Recidivism -- This report was prepared by Abt Associates using Federal funding provided by the Bureau of Justice Statistics (BJS) Opinions andor points of view expressed are those of the author(s) and do not necessarily reflect the official position or policies of the US Department of Justice
time-served cannot be explained by age If we were to accept results from this naiumlve regression we
would conclude that longer prison terms cause recidivism to fall dramatically (up to 28 percent for a
30-month increase) but we are reluctant to attach causality to these regression results because we
cannot be sure that all confounding factors have been considered Hence we turn to the RDD
The results reported in Table 5 suggest that marital status does not predict recidivism
Because this variable is frequently missing we drop it from the following analysis The ethnic status
Hispanic sometimes predicts recidivism but the effect is not large and this variable is often missing
Consequently we also drop the ethnic category Hispanic from the following analysis
ESTIMATES OF THE EFFECT THAT INCREASING TIME-SERVED HAS ON
RECIDIVISM
The previous section described data sources and gross patterns in those data This section
presents evidence based on a regression discontinuity design For every jj+2 contrast we compute
a unique effect as a log-relative hazard Potentially this leads to 6x41 effects because there are 41
possible contrasts within each criminal history category and there are 6 criminal history categories
In fact we produce fewer estimates because data selection rules exclude some of the contrasts The
number entering the analysis depends on the sensitivity tests but 175 contrasts appear in the
principal analysis
For each contrast between cells j and j+2 we estimate a Cox survival model15 The effect size
is the parameter associated with a dummy variable coded 1 for cell j+2 and coded zero for cell j The
15 By default we estimated a Cox model with covariates and shared frailty the covariates and criterion for the shared frailty are described in the text Sometimes to estimate the model we removed the shared frailty parameter in which case we estimated the relative hazard using the covariates but not the shared frailty given the RDD the relative hazard is still
37
The Relationship between Prison Length of Stay and Recidivism -- This report was prepared by Abt Associates using Federal funding provided by the Bureau of Justice Statistics (BJS) Opinions andor points of view expressed are those of the author(s) and do not necessarily reflect the official position or policies of the US Department of Justice
outcome measure is returning to prison following placement on community supervision or being
revoked from supervision (When an offender enters community supervision multiple times we only
include the first period of supervision in the analysis) Time at risk is censored by the end of the
study period or by the end of community supervision or at three years if supervision is ongoing after
three years Censoring by the end of community supervision is important because thereafter an
offender cannot return to federal prison unless he or she is convicted of a new federal crime
Fundamentally once an offender successfully completes his term of community supervision the FJSP
no longer tracks his criminality so the study cannot extend beyond the end of community
supervision Occasionally an offender may serve his entire sentence and then commit a new federal
crime Although he or she would reappear in the FJSP we only consider the first conviction
When applying a RDD identification strategy researchers are careful to justify that two
conditions hold Translated into the current setting where we compare outcomes in cell j and j+2
the two conditions are (1) on average time-served in cell j+2 must be greater than time-served in
cell j (2) There must be no other differences between offenders in cells j and j+2 that could account
for differences in recidivism In practice this second condition is difficult to establish By
construction of the guidelines and given the fact that we compare cells j and j+2 along the offense
seriousness dimension and never along the criminal history dimension we are confident this
condition holds Nevertheless an indirect empirical test is whether the guidelines cause offenders in
cell j+2 to look systematically different than offenders in cell j This is testable
By the design of the guidelines we anticipate that variables sometimes associated with
recidivism will have about the same mean values in cell j as in cell j+2 Of course we expect time-
consistent Sometimes to estimate the model we removed both shared frailty and the covariates in which case we estimated the relative hazard with just an indication the data came from cell j rather than j+2 Again given the RDD the estimate of relative hazard is consistent but not efficient If we could not estimate the relative hazard the estimate is reported as missing
38
The Relationship between Prison Length of Stay and Recidivism -- This report was prepared by Abt Associates using Federal funding provided by the Bureau of Justice Statistics (BJS) Opinions andor points of view expressed are those of the author(s) and do not necessarily reflect the official position or policies of the US Department of Justice
served to differ between cell j and cell j+2 and it does by 54 months on average (Plt001) If this
difference were not large there would be little point to the analysis
On average other variables do not change significantly between cell j and j+2 16 We tested
the following variables date of birth educational attainment sex race Hispanic status marital
status date when sentenced and criminal history point score The differences were small and none
approached statistical significance The results for criminal history point score seem especially
important because we consider this variable to be highly correlated with recidivism The fact that
the criminal history point score does not change systematically from cell j to j+2 suggests that
offenders in cell j+2 are not inherently more or less recidivistic than are offenders in cell j Therefore
the data pass this diagnostic test
While the inclusion of covariates may be unnecessary for identification including covariates
in the Cox regression is expected to reduce residual variance and improve the precision of the
estimates As noted the principal variable is a dummy variable coded one if the observation is from
cell j+2 and coded zero if from cell j Other covariates with the noted exceptions are the same as
were used in the naiumlve regression Obviously we have also excluded the scaled time-served variable
and its square Because there are 41x6 possible regressions (175 in this main application) we do not
show the regression results from this stage of the analysis Instead we report the single parameter of
interest (the average effect) for each regression in graphical form
Within each criminal history category the Cox model estimates the hazard of recidivism for
offenders in category j+2 relative to offenders in category j holding covariates constant Using the
16 The change is computed for every jj+2 pair The statistics reported in the texts are a weighted average of those pair comparisons Weights equal the inverse of the sampling variances Because of the distribution of offenses within the guidelines the least serious criminal history categories and the middle of the offense seriousness range dominate the calculations Arguably the estimates are not independent so standard errors are suspect Nevertheless the estimates of differences between cells j and j+2 are not biased and these average differences are small
39
The Relationship between Prison Length of Stay and Recidivism -- This report was prepared by Abt Associates using Federal funding provided by the Bureau of Justice Statistics (BJS) Opinions andor points of view expressed are those of the author(s) and do not necessarily reflect the official position or policies of the US Department of Justice
log-relative hazard (eg the parameter that is exponentiated to get the relative hazard) the next step
is to estimate a regression where the estimated log-relative hazard is the dependent variable and the
independent variable is the centered offense seriousness level This is the meta-regression It is
specific to a criminal history category so there are six meta-regressions This specification allows us
to examine how the log-relative hazard varies over the offense seriousness levels That is the
regressions allow us to combine effects (our main motivation) and test for heterogeneity (a
secondary motivation)
Effects may be heterogeneous across offense seriousness levels for two reasons For one
offenders convicted of the most serious crimes who serve the longest prison terms may respond
differently to incremental increases in the lengths of their terms than do offenders convicted of the
least serious crimes who serve the shortest prison terms For another for offenders convicted of
the most serious crimes the incremental change in the length of a prison term from cell j to j+2 is
much larger than the incremental change for offenders convicted of the least serious crimes (See
Table 3) Heterogeneity in treatment effects seems likely but how that heterogeneity varies with
offense severity level is uncertain Examining Tables 1-3 recalling the selection rules and recalling
that we are using weighted least squares regression to estimate the heterogeneity information used
by the regression comes mostly from the middle offense seriousness levels so incremental changes
to time-served are fairly constant Quite possibly there is heterogeneity but we will have insufficient
power to detect it
As before the analysis is stratified on the criminal history category so for each regression
there are potentially 41 data points but many fewer (29 to 37 in the main analysis) enter the meta-
regression because of selection criteria identified earlier Referring to Tables 1 and 2 almost all the
lost contrasts come from having too few cases per cell or from having a low proportion of prison
40
The Relationship between Prison Length of Stay and Recidivism -- This report was prepared by Abt Associates using Federal funding provided by the Bureau of Justice Statistics (BJS) Opinions andor points of view expressed are those of the author(s) and do not necessarily reflect the official position or policies of the US Department of Justice
terms per cell referring to Table 3 few cells (and hence contrasts) are lost because average prison
terms do not increase from cell j to j+2 Because the RDD identifies the effect the right-hand-side
variables are not control variables rather the meta-regression is a descriptive device (with statistical
implications) helping us to detect possible patterns
Estimation has multiple steps We summarize with an algorithm
1 Select all offenders from criminal history category k = 1
a Select all offenders with offense seriousness levels j = 1 and j = 3 If the jj+2 contrast
does not meet selection criteria increase j by 1 and try again
b It the jj+2 contrast meets the selection criteria estimate a Cox regression where a
dummy variable is coded 1 for offenders in offense seriousness level j+2 and coded 0
for offenders in offense seriousness level j The parameter associated with this
dummy variable is the log-relative hazard for the jj+2 contrast Save this estimate
c Increase j by 1 and repeat steps a-c until j = 41
d Estimate a meta-regression where the dependent variable is the log-relative hazards
from steps a-c The independent variables are a constant and the centered offense
seriousness level equal to j+2 for the jj+2 contrast Save the estimated constant and
its standard error for use in step 3
2 Repeat steps 1a-d for criminal history categories 1-6 This leads to six estimated constants
and six estimated standard errors for step 3
3 For step 3 create weights proportional to the inverse of the squares of the six standard
errors The final estimate is the weighted average of the six estimated constants This is
interpreted as the average log-relative hazard Results are discussed below
41
The Relationship between Prison Length of Stay and Recidivism -- This report was prepared by Abt Associates using Federal funding provided by the Bureau of Justice Statistics (BJS) Opinions andor points of view expressed are those of the author(s) and do not necessarily reflect the official position or policies of the US Department of Justice
MAIN RESULTS
The main model adopts the following selection criteria
bull For a guideline cell to be included in the analysis 100 or more offenders must appear within that cell
bull For a guideline cell to be included in the analysis 50 or more of offenders must have received prison terms
Comparisons are of outcomes in cell j+2 and cell j
The main results are shown in Figure 2 The figure shows patterns in the relative hazards and
associated statistics The figure has six panels one for each of the criminal history categories
Within each panel the vertical axis is the scale for the relative hazard as estimated by the Cox model
A hazard equal to 1 implies that increasing prison time has a neutral effect on recidivism A hazard
greater than 1 implies that increasing prison time increases recidivism a hazard less than 1 implies
that increasing prison time decreases recidivism The horizontal axis corresponds to the contrast
The offense seriousness level of 3 is the contrast between offense seriousness levels 1 and 3 the
offense seriousness level of 4 is the contrast between levels 2 and 4 and so on until level 43 Within
each panel the dots report the relative hazards as estimated using the Cox model When we could
not estimate the relative hazard because of the cell exclusion criteria the point is missing The
vertical lines surrounding the dots are 95 confidence intervals for the relative hazards They are
non-symmetric and when the confidence interval extends above 25 it is truncated at 25 for
improved resolution of the figures The three lines running left to right come from the regression
the straight line shows the prediction and the curved lines represent a 95 confidence interval for
the regression line ndash not to be confused with a 95 confidence interval for a predicted point
explaining why many points fall outside the confidence interval for the regression
Insert Figure 2 about here
42
The Relationship between Prison Length of Stay and Recidivism -- This report was prepared by Abt Associates using Federal funding provided by the Bureau of Justice Statistics (BJS) Opinions andor points of view expressed are those of the author(s) and do not necessarily reflect the official position or policies of the US Department of Justice
The table below the figure shows associated statistics from the meta-regression Recall the
dependent variable is the parameter associated with the log-relative hazard ndash that is the natural
logarithm of the relative hazard The row specified as ldquolinearrdquo identifies the centered offense
severity level variable entering the weighted least squares meta-regression The simple regression
specification has a constant and a term that is linear in the centered offense severity level Because
the estimator is weighted least squares and given the offense severity level is centered the constant
is the weighted average effect across the contrasts It is our principal interest R2 has its usual
interpretation but note that any ldquoexplained variancerdquo is attributable to the linear trend because we
are most interested in the constant R2 is not an especially important statistic and certainly has no
interpretation as the ldquogoodness of fitrdquo for our purposes because the constant does not contribute to
R2 At a maximum the regression would be based on 41 observations (N in the table) but fewer data
points enter the analysis because (as already discussed) we discarded contrasts that failed to meet
predetermined criteria
The table below the figure requires some additional explanation Recall the right-hand-side
variable was centered so the constant can be interpreted as an average A constant of zero is
neutral implying that on average additional prison time neither increases nor decreases recidivism
A positive constant implies that additional prison time increases recidivism a negative constant
implies that additional prison time decreases recidivism Converting these constants into a hazard
metric just requires exponentiation Letting α be the constant exp(α) is the relative hazard Letting
σ2 represent the constantrsquos estimated sampling variance by the delta rule the estimated sampling
variance for the hazard is exp(α)2 σ2 These transformations are employed when drawing Figure 2
Examining the table below Figure 2 the constant is negative and statistically significant in all
six regressions On average the estimated constant equals -0073 and is statistically significant with a
43
The Relationship between Prison Length of Stay and Recidivism -- This report was prepared by Abt Associates using Federal funding provided by the Bureau of Justice Statistics (BJS) Opinions andor points of view expressed are those of the author(s) and do not necessarily reflect the official position or policies of the US Department of Justice
standard error of 0007 The implied hazard is 0930 These are the inverse-variance weighted
estimates across the six criminal history categories The linear slopes have mixed signs and are never
statistically significant so we detect no heterogeneity
We must be caution about this interpretation Suppose as suggested by the evidence the
relative hazards are the same for all criminal history categories Looking at table 3 the average
increase in time-served for a move from cell j to j+2 is about 7 months for criminal history category 1
and about 10 months for criminal history category 6 Thus a somewhat larger increase in time-
served for more serious criminal history categories achieves about the same effect as a somewhat
smaller increase in time-served for less serious criminal history categories This might be taken as
some evidence of criminal history heterogeneity but if so the evidence is not especially compelling
Outliers are a potential concern in Figure 2 However when an outlier appears it is
associated with a high standard error and plays a small role in the weighted least squares regression
Therefore we conclude that outliers are not a practical concern
On average the estimated relative hazard that results from moving from cell j to cell j+2 is
0930 Qualitatively a relative hazard less than 1 implies that a longer prison term decreases
recidivism but translating this relative hazard into a quantitative decrease in the probability of
recidivism is complicated because the decrease in the probability of recidivism varies across the jj+2
comparisons A descriptive summary provides some intuition
First continue to consider the relative hazard as a metric On average across the severity
levels and the criminal history categories moving from cell j to cell j+2 increases time-served by
about 27 (On average this 27 change equals about 54 months) This is to say that a 27
increase in the length of incarceration appears to reduce the instantaneous probability of recidivism
(eg the hazard) by less than 10 percent For readers who are familiar with interpreting hazards a
44
The Relationship between Prison Length of Stay and Recidivism -- This report was prepared by Abt Associates using Federal funding provided by the Bureau of Justice Statistics (BJS) Opinions andor points of view expressed are those of the author(s) and do not necessarily reflect the official position or policies of the US Department of Justice
sizable increase in prison time (namely a 27 increase on average) has a fairly small decrease in the
relative hazard (by a multiple of 0930) Admittedly the descriptive term fairly small is subjective
and a reader can make his or her own subjective assessment
A change in the instantaneous probability of recidivism ndash the relative hazard ndash is not the
same as a change in the probability of recidivism Second then consider the probability of
recidivism as a metric We can get a sense of how a change in the relative hazard affects the
probability of recidivism Because we are using the Cox model the probability of recidivism equals
one minus the baseline survival rate to the power of the relative hazard (Hosmer Lemeshow amp May
2008 p 72) For our data the probability of recidivism is about 02 within three years (See figure
1) The relative hazard is about 0930 So a 27 increase in the length of incarceration would
decrease the probability of recidivism by about 02 ndash (1-080930) That is from a base rate of
recidivism of about 20 a 27 increase in prison time would cause recidivism to fall to about 187
Readers can draw their own conclusions but our sense is the effect is not large and that prison
length of stay has a largely neutral effect on recidivism
Once again some caution is merited If we again accept the relative hazards are about the
same across the six criminal history categories figure 1 shows the baseline rates of recidivism are
progressively higher as the criminal history category increases from k=1 to k=6 so the percentage
change in recidivism is larger for more serious criminal history categories than for the lesser criminal
history categories This might be deemed heterogeneity ndash that increasing time-served has a larger
effect on the most serious offenders We are reluctant to accept such a conclusion because it comes
from accepting the null hypothesis of constant relative hazards across the criminal history categories
More likely if such heterogeneity exists we have too little power to detect its effect
45
The Relationship between Prison Length of Stay and Recidivism -- This report was prepared by Abt Associates using Federal funding provided by the Bureau of Justice Statistics (BJS) Opinions andor points of view expressed are those of the author(s) and do not necessarily reflect the official position or policies of the US Department of Justice
It is possible to stratify the analysis by sex by race and by education ndash variables described
earlier Cell sizes get small so we restrict the analysis to offenders in criminal history category 1 and
we require a minimum of 50 offenders per cell rather than 100 For men the relative hazard is
0935 and for women it is 0931 but these differences are not statistically significant so we fail to
reject the null that prison length has the same effect on men and on women For white offenders
the relative hazard is 0936 and for black offenders the relative hazard is 0932 and the difference is
not statistically significant so we fail to reject the null that prison length has the same effect on
white and black offenders For offenders who lack high school degrees the relative hazard is 0930
and for offenders who have high school degrees the relative hazard is 0933 The difference is not
statistically significance This test based on education is not as sensitive as desired because most
offenders have high school degrees or the equivalent Overall we do not find strong evidence the
effect of time-served on recidivism is sensitive to sex race or education
We observed that an IV estimator should lead to estimates that are like the RDD estimates
We demonstrate that here The only difference between the IV and RDD approaches is that for the
IV approach the treatment variable is the mean time-served in cell j+2 or j and for the RDD
approach the treatment variable is a dummy variable denoting sentencing in cell j+2 rather than cell
j17 Interpretations differ For the IV approach the treatment effect is the change in recidivism per
month of additional time-served for the RDD approach the treatment effect is the change in
recidivism from being sentenced in cell j+2 rather than cell j These differences are scale effects we
do not expect then to change substantive interpretations
17 Instrumental variable estimation often uses a two-step approach In the first step the treatment variable (here the time served) is regressed on the instrument (and perhaps some additional variables) to predict the treatment (or in our case the average time-served) In the second step the average time-served replaces the observed time-served We compute average time-served without using the first-step regression
46
The Relationship between Prison Length of Stay and Recidivism -- This report was prepared by Abt Associates using Federal funding provided by the Bureau of Justice Statistics (BJS) Opinions andor points of view expressed are those of the author(s) and do not necessarily reflect the official position or policies of the US Department of Justice
Figure 3 reports results from the IV estimation Across the six criminal history categories the
weighted average effect size is -00122 which is statistically significant at P lt 001 While this effect
seems much smaller than the effect based on the RDD when we multiple by the average increase in
time-served between cell j and j+2 the rescaled effect is -0066 and relative hazard of a 54 month
increase in the sentence is 0936 There is no material difference between the RDD estimator and
the RDD estimator
Insert Figure 3 about here
SENSITIVITY TESTING
We conducted sensitivity tests evaluating whether the effect of length of stay on recidivism
depends on constraints we applied to produce the results shown in Figure 2 and its associated table
Minimum Cell Size of 50 instead of 100 - Figure 4 A first step in sensitivity testing is to learn
whether requiring a minimum of 50 cases instead of 100 cases per cell changes findings The
advantage to relaxing this assumption is that we gain a few data points The disadvantage is that
some of those new data points have extreme values As before the constant is always negative and
statistically significant The weighted average is -0073 with a standard error of 0007 and the
implied relative hazard is 0930 Because we use weighted least squares results do not change much
from those reported for the main model despite the expansion of sample size estimates with large
standard errors do not contribute much to the regression
Insert Figure 4 about here
Minimum cell size of 150 instead of 100 ndash Figure 5 If we set a criterion of 150 cases per cell instead
of 100 we lose a few data points The constant remains negative and statistically significant across
the six criminal history categories Overall the average constant is -0071 (with a standard error
47
The Relationship between Prison Length of Stay and Recidivism -- This report was prepared by Abt Associates using Federal funding provided by the Bureau of Justice Statistics (BJS) Opinions andor points of view expressed are those of the author(s) and do not necessarily reflect the official position or policies of the US Department of Justice
0008) and the corresponding relative hazard is 0931 Apparently the findings are insensitive to the
criterion for cases per cell because the weighted least squares analysis is dominated by calculations
that are based on large cell sizes For the remaining sensitivity tests we set the minimum cell size to
100
Insert Figure 5 about here
Minimum percentage of prison terms 75 instead of 50 - Figure 6 The next sensitivity test
changes the criterion for minimum percentage of prison terms to be 75 within a cell rather than
50 within a cell As expected some cells are excluded from the analysis but as before the
substantive findings do not much change The average affect is -0077 with standard error of 0009
The increased standard error is understandable Given the RDD basically calls for a difference in
mean estimates between cells j and j+2 (conditional on covariates) the effective sample size for
computing variances is the number of offenders within a cell multiplied by the proportion who are
sentenced to prison Cells with high proportions of offenders serving probation terms have high
sampling variances for two reasons (1) The effective sample size is smaller than the apparent sample
size based on the number of offenders within a cell (2) The average difference in time-served
between cells j and j+2 tends to be small (so the effect is small and has high sampling variance) for
those cells where probation is especially likely Consequently given the regressions use weights that
are inversely proportional to the sampling variance the estimates are insensitive to the criterion
establishing a minimum proportion of offenders sentenced to prison
Insert Figure 6 about here
Contrasts that are j and j+1 instead of j and j+2 ndash Figure 7 We believe that contrasts observed by
comparing cells j and j+2 are more appropriate for this analysis than contrasts observed by
comparing cells j and j+1 because the contrast between j and j+2 provides assurance that average
48
The Relationship between Prison Length of Stay and Recidivism -- This report was prepared by Abt Associates using Federal funding provided by the Bureau of Justice Statistics (BJS) Opinions andor points of view expressed are those of the author(s) and do not necessarily reflect the official position or policies of the US Department of Justice
prison terms increase by a substantial amount This assurance is not forthcoming when comparing
cells j and j+1 Nevertheless increasing the distance between compared cells raises validity
challenges because the RDD rests on an assumption that offenders within both compared cells are
alike in ways that affect recidivism The closer the cells the more justified the assumption For this
sensitivity test we maintain the original criteria for selecting cells but contrast cell j with cell j+1
(We discard contrasts where the average sentence in cell j+1 is less than the average sentence in cell
j) Averaged across the six estimates the estimated constant is -0030 with a standard error of 0013
This is statistically significant at P lt 005 The relative hazard is 0970 While results from the jj+1
contrasts are smaller than those from the jj+2 contrasts this is expected because the jj+2 contrast
results in a larger increase in time-served and consequently a larger effect
Insert Figure 7 about here
Contrasts testing for auto-correlation using the Prais-Winston estimator ndash Figure 8 The analysis
immediately above which changed the comparison from cells jj+2 to cells jj+1 suggests another
sensitivity test Earlier we commented that by construction we may have induced autocorrelation in
the data used for the final step regression For example consider the estimated hazard for cells j and
j+1 and the estimated hazard for cells j+1 and j+2 The estimates have j+1 in common and this may
introduce first-order autocorrelation into the analysis Following recommendations from Greene we
have elected to ignore this complication because commonly used corrections have uncertain small
sample properties However we can test how much the autocorrelation affects the results using a
Prais-Winston estimator a feasible generalized least squares estimator that corrects for first-order
autocorrelation
Insert Figure 8 about here
49
The Relationship between Prison Length of Stay and Recidivism -- This report was prepared by Abt Associates using Federal funding provided by the Bureau of Justice Statistics (BJS) Opinions andor points of view expressed are those of the author(s) and do not necessarily reflect the official position or policies of the US Department of Justice
A problem when using the Prais-Winston estimator is that we cannot simultaneously adjust
for autocorrelation and heteroscedasticity To correct estimated standard errors we can employ a
robust covariance estimator but this is problematic in two ways First without adjusting for
heteroscedasticity during parameter estimation the solution is inefficient because the data points
with large standard errors receive the same weight as the data points with low standard errors
Figure 2 suggests the inefficiency can be large Second the Prais-Winston estimator assumes
homoscedasticity but we know that our data are heteroscedastic To deal with this problem we
adopt restrictions (1) There must be 150 observations per cell and (2) at least 75 of offenders
within any cell must receive prison terms The idea is to minimize heteroscedasticity and we have
already seen that imposing these restrictions has little effect on results Allowing the contrast to be
jj+1 which may cause a one-lag autocorrelation we use a Prais-Winston estimator to estimate the
effects
The sensitivity test is encouraging The estimates for ρ the autocorrelation efficient have
mixed signs We take this wide variation in the estimates of ρ to mean the estimates are imprecise
Apparently provided we restrict estimates to cells with enough offenders we induce modest
autocorrelation and our decision to ignore autocorrelation seems justified Second basing the
results on the Prais-Winston estimator does not make a big difference in the findings The average
value for the constant is -0042 with a standard error of 0008
Separating contrasts into independent sets ndash Tables 6 and 7 Another approach to dealing with
autocorrelation is straightforward and can be performed with the jj+2 contrasts and both the 100
observations per cell criterion and the 050 prison sentence criterion To explain consider the
contrasts based on cells 13 24 35 46 57 and so on The contrasts 13 and 24 are
independent and the contrast 35 and 46 are independent but the contrasts 13 and 35 are not
50
The Relationship between Prison Length of Stay and Recidivism -- This report was prepared by Abt Associates using Federal funding provided by the Bureau of Justice Statistics (BJS) Opinions andor points of view expressed are those of the author(s) and do not necessarily reflect the official position or policies of the US Department of Justice
independent because they both rely on cell 3 A solution is to break the analysis into two parts In
the first part we use the contrasts 13 24 57 68 and so on in the second part we use the
contrasts 35 46 79 810 and so on For each analysis the effects can be averaged across the
criminal history categories and then across the two analyses For the first analysis the effect is -
0034 with a standard error of 0018 For the second analysis the effect is -0106 with a standard
error of 0030 significant at p lt 001 The average effect is -0067 with a standard error of 0018
Recalling the effect from the main analysis was -0073 with a standard error of 0007 these new
results are very close even though they are based on a different weighting scheme (a result of
running two regressions instead of one) As with the previous test we take this sensitivity test as
evidence that provided we restrict the effective number of observations per cell results are
insensitive to autocorrelation
Insert Table 6 and Table 7 about here
Entering prison as recidivism ndash Figure 9 An additional sensitivity test returns to the original model
specification whose results were presented in Figure 2 and changes the definition of recidivism from
ldquoentering prison or being revoked from community supervisionrdquo to ldquoentering prisonrdquo We are unsure
of the best definition of recidivism but it appears the definition does not much matter The
estimated effects are about the same The log-relative hazard is -0076 with a standard error of
0007 the relative hazard is 0927 The rate of recidivism is about 20 percent using the
comprehensive definition of returning to prison or being revoked and slightly less than 19 percent
when using the more restrictive definition of returning to prison so consistency between the main
results and results from this sensitivity test is not surprising
Insert Figure 9 about here
51
The Relationship between Prison Length of Stay and Recidivism -- This report was prepared by Abt Associates using Federal funding provided by the Bureau of Justice Statistics (BJS) Opinions andor points of view expressed are those of the author(s) and do not necessarily reflect the official position or policies of the US Department of Justice
Eliminating drug law offenders from the analysis ndash Figure 10 A final analysis recognizes that drug
law violations are somewhat peculiar to the federal system High-level drug dealing is often dealt
with in the federal system because cross-border drug dealing is a federal law enforcement
responsibility the federal government has more resources for dealing with high-level drug dealing
than do state governments and even when state and federal authorities collaborate federal
prosecution is typical because federal sentences are more severe18 Judges frequently sentence
high-level drug dealers to Congressionally-mandated mandatory minimums so for high-level drug
dealers the guidelines operate differently than described earlier Another sensitivity test results
from removing drug-law violators from the analysis
Insert Figure 10 about here
With the removal of drug-law violations fewer cells enter the analysis but the parameter estimates
do not change much so qualitative conclusions do not change The average effect is -0060 with a
standard error of 0008 This is statistically significant at plt001 Dropping drug law violators does
not alter conclusions
Eliminating covariates from the analysis ndash Figure 11 Reviewers of an earlier version of this study
wondered if findings based on Cox regressions with no covariates would be the same as findings
based on Cox regressions with covariates After eliminating covariates the weighted average effect
is -0073 with a standard error of 0008 Removing covariates has caused the standard error to
increase by about 10 but has not altered substantive conclusions This is sensible The covariates
were unnecessary for identification but they have the potential to reduce standard errors
18 This assertion is based on the authorsrsquo extensive experience performing program reviews for High Intensity Drug Trafficking Areas multijurisdictional drug task forces with federal state and local participation Our team has visited all 28 HIDTAs over a five-year period The assertion made in the text is based on those visits
52
The Relationship between Prison Length of Stay and Recidivism -- This report was prepared by Abt Associates using Federal funding provided by the Bureau of Justice Statistics (BJS) Opinions andor points of view expressed are those of the author(s) and do not necessarily reflect the official position or policies of the US Department of Justice
Figure 11 about here
Using the Earlier Guidelines ndash Figure 12 Reviewers of an earlier version of this study also observed
that guidelines have changed over the period of this study and expressed concern that these changes
may affect conclusions We doubt these changes matter because cell j+2 has always had longer
terms than cell j Nevertheless in response to reviewersrsquo concerns we identify the mean date for
guidelines entering the analysis and we perform the analysis on just those offenders sentenced
under the guidelines prior to that mean date The effect is ndash 0088 with a standard error of 0009
The relative hazard is 0916 It seems unlikely that changes to the guidelines account for findings
Figure 12 about here
Examining offenders sentenced during the earlier years provides another implicit diagnostic test
Because the analysis is based on offenders who completed their prison terms and were released to
community supervision offenders with high offense seriousness scores or high criminal history
scores and therefore long prison terms are unlikely to enter they analysis when sentenced close to
the data collection period Any resulting bias is lessened by restricting the analysis to offenders
sentenced during the early part of the data collection period If there is a selection bias it does not
appear to be serious
Summarizing the sensitivity testing From the principal analysis the estimated average effect across
the six criminal history categories was -0073 with a standard error of 0007 Provided we contrast
outcomes in cells j and j+2 results do not much change over sensitivity tests and even when we
contrast outcomes in cells j and j+1 results conform with expectations
53
The Relationship between Prison Length of Stay and Recidivism -- This report was prepared by Abt Associates using Federal funding provided by the Bureau of Justice Statistics (BJS) Opinions andor points of view expressed are those of the author(s) and do not necessarily reflect the official position or policies of the US Department of Justice
DISCUSSION
The effect of prison length of stay on recidivism has implications for both theory and policy
From a theoretical perspective incarceration is a potentially transformative event experienced
during an offenderrsquos life course This study provides no evidence that an offenderrsquos criminal
trajectory is negatively affected ndash that is that criminal behavior is accelerated ndash by the length of an
offenderrsquos prison term If anything longer prison terms modestly reduce rates of recidivism beyond
what is attributable to incapacitation This ldquotreatment effectrdquo of a longer period of incarceration is
small The three-year base rate of 20 recidivism is reduced to 187 when prison length of stay
increases by an average of 54 months We are inclined to characterize this as a benign close to
neutral effect on recidivism From a policy perspective prison length of stay can be reduced without
incurring a large increase in recidivism
All observational studies come with validity challenges Still a regression discontinuity
design is a strong quasi-experimental design and we have argued the guidelinesrsquo structure satisfies
the assumptions of an RDD We conducted many sensitivity tests to assess the robustness of the
results The findings require qualification Because of limitations in the bandwidth of an RDD design
we are unable to examine how long prison terms (say five years) affect recidivism relative to
relatively short terms (say two years) The logic of the RDD forces us to compare prison terms of
length L relative to prison terms that are about 27 longer While this is a limitation in the
application of the RDD design it seems unlikely that Congress or the US Sentencing Commission
would reduce terms by a large percentage but not inconceivable that they might reduce prison
terms by a small percentage Thus these findings ndash limited to small changes in prison terms ndash have
implications for sentencing reform
54
The Relationship between Prison Length of Stay and Recidivism -- This report was prepared by Abt Associates using Federal funding provided by the Bureau of Justice Statistics (BJS) Opinions andor points of view expressed are those of the author(s) and do not necessarily reflect the official position or policies of the US Department of Justice
A secondary goal of this research was to examine potential heterogeneity in the effects of
prison length of stay To evaluate heterogeneity we examine whether exogenous covariates
moderate the effect of length of stay Neither offense seriousness nor criminal history moderate the
effect of prison length of stay In the context of federal sentencing these would be two of the most
important potential moderators of prison length of stay The Sentencing Reform Act of 1984
precludes federal judges from using demographic factors in assigning sentences even if these are
empirical moderators of the effect of prison length of stay We also found the effect of time-served
on recidivism was invariant with respect to sex race and education
One class of moderators suggested by Mears Cochran and Cullen (2014) is the level of post-
release supervision In many state jurisdictions a sizable number of offenders are released without
supervision For those released to supervision the level of community control and surveillance is
usually commensurate to risk This source of heterogeneity is limited in the federal context because
everyone receives a term of post-release supervision We censored anyone whose supervision ended
prior to the end of the three-year follow-up period Post-release supervision is also a potential source
of bias as suggested by Roodman but we could eliminate this potential artifact because everyone in
our sample received a term of post-release supervision and they were censored when that term
ended
Some additional caveats are applicable First the results apply to adults Rarely appearing in
federal court juveniles are excluded from the analysis Second we offer no comparison between
adult offenders sentenced to prison rather than probation Third although there is considerable
overlap between federal and state crimes jurisdictional differences cause federal crimes to differ
from state crime counterparts so the relationship between prison terms and recidivism at the state
level may differ from the relationship at the federal level These are important inter-jurisdictional
55
The Relationship between Prison Length of Stay and Recidivism -- This report was prepared by Abt Associates using Federal funding provided by the Bureau of Justice Statistics (BJS) Opinions andor points of view expressed are those of the author(s) and do not necessarily reflect the official position or policies of the US Department of Justice
differences but by removing offenders who were deported or transferred to other authorities we
have made the federal offenders look more like state offenders and when we exclude high-level
drug traffickers results do not much change Furthermore federal jurisdiction is national while
state jurisdictions are local so a study based on national data has a stronger claim to generalizability
It is difficult to see how federal and state crimes are so different that criminologist can disregard
these findings A further limitation of our findings is that they apply only to offenders who receive a
term of community supervision after their release May states have offenders who receive no such
post-release supervision
While some scholars might consider the federal system unique and our results limited to
federal offenders there are many structural differences among states that often preclude
generalizations beyond a specific state as well Even if these findings are not generalizable to state
jurisdictions the federal prison population is about 12 percent of all incarcerated offenders and
represents a significant public policy concern
As we mentioned the RDD framework only allows us to examine relatively small increments
in time-served ndash about 54 months on average Although these are small relative changes these are
not small absolute changes Five additional months in prison is a serious disruption of an offenderrsquos
life and the associated cost savings of a five-month reduction in federal prison length of stay would
save substantial capital and operational costs We make a back-of-the-envelope estimate of potential
savings in prison beds The current average federal prison length of stay for federally sentenced
prisoners is about 35 months A reduction of 5 months in a steady state system would reduce the
prison population over time by 15 percent Given the current Bureau of Prisons inmate population of
195000 a 15 percent reduction would save 29000 beds Under this scenario the BOP could close
prisons rather than simply reduce the prison population in each of its facilities saving both
56
The Relationship between Prison Length of Stay and Recidivism -- This report was prepared by Abt Associates using Federal funding provided by the Bureau of Justice Statistics (BJS) Opinions andor points of view expressed are those of the author(s) and do not necessarily reflect the official position or policies of the US Department of Justice
operational and maintenance costs This back-of-the-envelope calculation shows that small
decrements in length of stay can have large impacts when they are not confined to select subgroups
of offenders
Amplifying this latter point one of the advantages to evaluating prison length of stay is that
any change will have a broad impact on the entire incarcerated population Most contemporary
reforms such as those found in states which implemented the Justice Reinvestment Initiative (JRI)
seek to move the least serious offenders convicted of the least serious crimes from prison to
community corrections (La Vigne et al 2014) Low-level offenders are a very small proportion of
federal prison stocks and based on tabulations from the National Corrections Reporting Program
they are also a small proportion of state prison stocks A policy shift that reduces the length of all
federal prison terms by 27 percent would reduce the federal prison stock by about 29000 inmates
without unduly harming public safety This policy change would have a bigger impact on the federal
prison population than diverting offenders with low offense seriousness and minor or no criminal
history
Prisons are expensive and reducing prison stays has the potential to save public expenditures
(La Vigne et al 2014) Nevertheless advocates of general deterrence and incapacitation might
argue that maintaining or even increasing the length of prison stays is worth the additional expense
and at least increasing prison stays will not make offenders any more criminogenic Nagin et al
(2009) propose a theoretical model that frames these questions distinguishing between high and low
sanction regimes Higher sanction regimes have a higher probability of imprisonment and longer
length of stay than low sanction regimes This model specifies relationships between these relative
regimes the size of the prison populations sizes of the populations with and without a prison record
and the underlying crime rate The model provides a framework for addressing the interrelationship
57
The Relationship between Prison Length of Stay and Recidivism -- This report was prepared by Abt Associates using Federal funding provided by the Bureau of Justice Statistics (BJS) Opinions andor points of view expressed are those of the author(s) and do not necessarily reflect the official position or policies of the US Department of Justice
among these factors without precisely specifying how the outputs change under the low and high
sanction regimes It is straightforward to postulate that high sanction regimes will produce more
people with criminal records however the impact of a high sanction regime on the crime rate is
uncertain High sanction regimes may preclude more crime through general deterrence but may
increase crime if imprisonment is criminogenic not just for the individual but for the prisonerrsquos
family and the community (NRC 2014) The marginal effects and the sizes of the subpopulations
affected will determine the impact on crime rates If we could analyze all the system dynamics of this
model simultaneously we could optimize the level of sanctions to minimize the crime rate In the
absence of such a comprehensive model policy goals should be circumscribed If length of stays
were reduced incrementally it is hard to see how this would have more than a minor effect on crime
through any general deterrent mediated impact and from our results through any criminogenic
impact on the offender
Savings from reduced prison usage can be diverted into evidence-based programs that
reduce offending but such diversion is unlikely as most JRI states have put savings into other non-
justice programs (La Vigne et al 2014) Even if these funds are diverted to other social welfare
programs higher education or other state and local needs we would expect a net social welfare
benefit
58
The Relationship between Prison Length of Stay and Recidivism -- This report was prepared by Abt Associates using Federal funding provided by the Bureau of Justice Statistics (BJS) Opinions andor points of view expressed are those of the author(s) and do not necessarily reflect the official position or policies of the US Department of Justice
REFERENCES
Andrews D A and James Bonta 2006 The Psychology of Criminal Conduct 4th ed Cincinnati Anderson Pub
Andrews D A Ivan Zinger Robert D Hoge James Bonta Paul Gendreau and Francis T Cullen 1990 Does Correctional Treatment Work A Clinically Relevant and Psychologically Informed Meta-Analysis Criminology 28 (3) 369ndash404 doi101111j1745-91251990tb01330x
Angrist Joshua D 2006 Instrumental Variables Methods in Experimental Criminological Research What Why and How Journal of Experimental Criminology 2 (1) 23ndash44 doi101007s11292-005-5126-x
Becker Gary S 1968 Crime and Punishment An Economic Approach Journal of Political Economy 76 (2) 169ndash217 doi101086259394
Berecochea John E and Dorothy R Jaman and Welton A Jones 1981 Time Served in Prison and Parole Outcome - An Experimental Study Report Number 2 Sacramento
Berk Richard 2010 Recent Perspectives on the Regression Discontinuity Design Essay In Handbook of Quantitative Criminology eds Alexis Russell Piquero and David Weisburd New York Springer
Berk Richard A and David Rauma 1983 Capitalizing on Nonrandom Assignment to Treatments A Regression-Discontinuity Evaluation of a Crime-Control Program Journal of the American Statistical Association 78 (381) 21ndash27 doi10108001621459198310477917
Berk Richard A and Jan De Leeuw 1999 An Evaluation of Californias Inmate Classification System Using a Generalized Regression Discontinuity Design Journal of the American Statistical Association 94 (448) 1045ndash52 doi10108001621459199910473857
Berk Richard Geoffrey Barnes Lindsay Ahlman and Ellen Kurtz 2010 When Second Best Is Good Enough A Comparison between a True Experiment and a Regression Discontinuity Quasi-Experiment Journal of Experimental Criminology 6 (2) 191ndash208 doi101007s11292-010-9095-3
Berube Danton and Donald P Green 2007 The Effects of Sentencing on Recidivism Results from a Natural Experiment Ms The Effects of Sentencing on Recidivism Results from a Natural Experiment New Haven
Bloom Howard S 2012 Modern Regression Discontinuity Analysis Journal of Research on Educational Effectiveness 5 (1) 43ndash82 doi101080193457472011578707
Bor J Moscoe E Mutevedzi P Newell M amp Barnighausem T (2014) Regression Discontinuity Designs in Epidemiology Epidemiology 25(5) 729-737
59
The Relationship between Prison Length of Stay and Recidivism -- This report was prepared by Abt Associates using Federal funding provided by the Bureau of Justice Statistics (BJS) Opinions andor points of view expressed are those of the author(s) and do not necessarily reflect the official position or policies of the US Department of Justice
Boshier R and D Johnson 1974 Does Conviction Affect Employment Opportunities British Journal of Criminology 14 264ndash68
Braithwaite John 1989 Crime Shame and Reintegration Cambridge Cambridge University Press
Cameron Adrian Colin and P K Trivedi 2005 Microeconometrics Methods and Applications Cambridge Cambridge University Press
Carroll Leo 1988 Hacks Blacks and Cons Race Relations in a Maximum Security Prison Prospect Heights IL Waveland Press
Cattaneo Matias D Rociacuteo Titiunik Gonzalo Vazquez-Bare and Luke Keele 2016 Interpreting Regression Discontinuity Designs with Multiple Cutoffs The Journal of Politics 78 (3) doi101086686802
Chen M Keith and Jesse M Shapiro 2007 Do Harsher Prison Conditions Reduce Recidivism A Discontinuity-Based Approach American Law and Economics Review 9 (1) 1ndash29 doi101093alerahm006
Clemmer Donald 1940 The Prison Community Boston The Christopher Publishing House
Cook Thomas D 2008 lsquoWaiting for Life to Arriversquo A History of the Regression-Discontinuity Design in Psychology Statistics and Economics Journal of Econometrics 142 (2) 636ndash54 doi101016jjeconom200705002
Cullen Francis T Cheryl Lero Jonson and Daniel S Nagin 2011 Prisons Do Not Reduce Recidivism The High Cost of Ignoring Science The Prison Journal 91 (3 Suppl) doi1011770032885511415224
Deschenes Elizabeth Piper Susan Piper and Joan Petersilia 1995 Intensive Community Supervision in Minnesota A Dual Experiment in Prison Diversion and Enhanced Supervised Release Santa Monica CA RAND Corporation
DiNardo John and David S Lee 2010 Program Evaluation and Research Designs Essay In Handbook of Labor Economics eds Orley Ashenfelter and David Card Vol 4A Elsevier
Drago Francesco Roberto Galbiati and Pietro Vertova 2009 The Deterrent Effects of Prison Evidence from a Natural Experiment Journal of Political Economy 117 (2) 257ndash80 doi101086599286
Fleisher Mark S 1989 Warehousing Violence Newbury Park CA Sage Publications
Gaes Gerald G William D Bales and Samuel J A Scaggs 2016 The Effect of Imprisonment on Recommitment An Analysis Using Exact Coarsened Exact and Radius Matching with the Propensity Score Journal of Experimental Criminology 12 (1) 143ndash58 doi101007s11292-015-9251-x
Gaes Gerald G and Scott D Camp 2009 Unintended Consequences Experimental Evidence for the Criminogenic Effect of Prison Security Level Placement on Post-Release Recidivism Journal of Experimental Criminology 5 (2) 139ndash62 doi101007s11292-009-9070-z
60
The Relationship between Prison Length of Stay and Recidivism -- This report was prepared by Abt Associates using Federal funding provided by the Bureau of Justice Statistics (BJS) Opinions andor points of view expressed are those of the author(s) and do not necessarily reflect the official position or policies of the US Department of Justice
Gaes Gerald G Timothy J Flanagan Laurence L Motiuk and Lynn Stewart 1999 Adult Correctional Treatment Essay In Crime and Justice a Review of Research Prisons eds Michael Tonry and Joan Petersilia 76361ndash426 Chicago University of Chicago Press
Gendreau Paul Paula Smith and Sheila French 2008 The Theory of Effective Correctional Intervention Empirical Status and Future Directions Essay In Taking Stock The Status of Criminological Theory Advances in Criminological Theory eds T Francis FT Cullen JP Wright and KR Blevins Vol 15 New Brunswick NJ Transaction
Gendreau Paul Claire Goggin and Francis T Cullen 1999 The Effects of Prison Sentences on Recidivism 1999-3 The Effects of Prison Sentences on Recidivism 1999-3 Ottawa Canada Solicitor General
Goffman Erving 1961 Asylums Essays on the Social Situation of Mental Patients and Other Inmates Chicago Aldine
Green Donald P and Daniel Winik 2010 Using Random Judge Assignments to Estimate the Effects of Incarceration and Probation on Recidivism Among Drug Offenders Criminology 48 (2) 357ndash87 doi101111j1745-9125201000189x
Greene William H 2008 Econometric Analysis Upper Saddle River NJ Prentice Hall
Hahn Jinyong Petra Todd and Wilbert Klaauw 2001 Identification and Estimation of Treatment Effects with a Regression-Discontinuity Design Econometrica 69 (1) 201ndash9 doi1011111468-026200183
Hjalmarsson Randi (2009) Juvenile Jails A path to the straight and narrow or to hardened criminality Journal of Law and Economics 52 779-809
Horney Julie D Wayne Osgood and Ineke Haen Marshall 1995 Criminal Careers in the Short-Term Intra-Individual Variability in Crime and Its Relation to Local Life Circumstances American Sociological Review 60 (5) 655 doi1023072096316
Hosmer David W Stanley Lemeshow and Susanne May 2008 Applied Survival Analysis Regression Modeling of Time-to-Event Data Hoboken NJ Wiley-Interscience
Imbens G (2009) Better LATE Than Nothing Some Comments on Deaton (2009) and Heckman and Urzua (2009) Unpublished paper downloaded from httpwwweconomicsharvardedufacultyimbensfilesbltn_09apr10pdf on December 2 2009
Imbens Guido W and Joshua D Angrist 1994 Identification and Estimation of Local Average Treatment Effects Econometrica 62 (2) 467 doi1023072951620
Imbens Guido W and Thomas Lemieux 2007 Regression Discontinuity Designs A Guide to Practice National Bureau of Economic Research Working Paper
61
The Relationship between Prison Length of Stay and Recidivism -- This report was prepared by Abt Associates using Federal funding provided by the Bureau of Justice Statistics (BJS) Opinions andor points of view expressed are those of the author(s) and do not necessarily reflect the official position or policies of the US Department of Justice
Imbens Guido W and Donald B Rubin 2015 Causal Inference for Statistics Social and Biomedical Sciences an Introduction Cambridge Cambridge University Press
Irwin John 1980 Prisons in Turmoil Boston Little Brown
Irwin John 2005 The Warehouse Prison Disposal of the New Dangerous Class Los Angeles CA Roxbury Pub Co
Irwin John (2009) Lifers Seeking redemption in prison (Criminology and justice studies) New York Routledge
Jacobs James B 1977 Statesville The Penitentiary in Mass Society Chicago IL Chicago University Press
Jaman Dorothy R Robert M Dickover and Lawrence A Bennett 1972 Parole Outcome as a Function of Time Served British Journal of Criminology 12 (1) 5ndash34
Kalbfleisch J D and Ross L Prentice 2002 The Statistical Analysis of Failure Time Data Hoboken NJ J Wiley
Kling R W Rhodes D Izrael C Cutler K Shah and C Dyous 2016 Creating an Offender-Based Tracking System Using the FJSP Draft Final for BJS Review Cambridge MA Abt Associates
Kraus J 1981 The Effects of Committal to a Special School for Truants International Journal of Offender Therapy and Comparative Criminology 25 (2) 130ndash38 doi1011770306624x8102500205
Kuziemko I 2012 How Should Inmates Be Released from Prison An Assessment of Parole versus Fixed-Sentence Regimes The Quarterly Journal of Economics 128 (1) 371ndash424 doi101093qjeqjs052
La Vigne Nancy Samuel Bieler Lindsey Cramer Helen Ho Cybele Kotonias Deborah Mayer David McClure Laura Pacifici Erika Parks Bryce Peterson and Julie Samuels 2014 Justice Reinvestment Initiative State Assessment Report Washington DC The Urban Institute
Lancaster Tony 1990 The Econometric Analysis of Transition Data Cambridge Cambridge University Press
Lee David S and Thomas Lemieux 2010 Regression Discontinuity Designs in Economics Journal of Economic Literature 48 (2) 281ndash355 doi101257jel482281
Lee S and Card D 2006 Regression Discontinuity Inference with Specification Error Technical Working paper 322 National Bureau of Economic Research
What Works Clearinghouse Procedures and Standards Handbook Version 30 US Department of Education httpsiesedgovnceewwcDocsreferenceresourceswwc_procedures_v3_0_standards_handboo kpdf
62
The Relationship between Prison Length of Stay and Recidivism -- This report was prepared by Abt Associates using Federal funding provided by the Bureau of Justice Statistics (BJS) Opinions andor points of view expressed are those of the author(s) and do not necessarily reflect the official position or policies of the US Department of Justice
Lerman Amy 2009a The People Prisons Make Effects of Incarceration on Criminal Psychology In Do Prisons make Us Safer The Benefits and Costs of the Prison Boom eds Steven Raphael and Michael A Stoll New York Russel Sage
Lerman Amy 2009b Bowling Alone (With My Own Ball and Chain) Effects of Incarceration and the Dark Side of Social Capital Lecture
Letkemann Peter 1973 Crime as Work Englewood Cliffs NJ Prentice-Hall
Listwan Shelley Johnson Christopher J Sullivan Robert Agnew Francis T Cullen and Mark Colvin 2013 The Pains of Imprisonment Revisited The Impact of Strain on Inmate Recidivism Justice Quarterly 30 (1) 144ndash68 doi101080074188252011597772
Loeffler Charles E 2013 Does Imprisonment Alter the Life Course Evidence on Crime and Employment from A Natural Experiment Criminology 51 (1) 137ndash66 doi1011111745-912512000
Loughran Thomas A Edward P Mulvey Carol A Schubert Jeffrey Fagan Alex R Piquero and Sandra H Losoya 2009 Estimating A Dose-Response Relationship Between Length of Stay and Future Recidivism in Serious Juvenile Offenders Criminology 47 (3) 699ndash740 doi101111j1745-9125200900165x
MacKenzie Doris L 2006 What Works in Corrections Reducing the Criminal Activities of Offenders and Delinquents New York Cambridge University Press
Manski Charles F and Daniel S Nagin 1998 Bounding Disagreements About Treatment Effects A Case Study of Sentencing and Recidivism Sociological Methodology 28 (1) 99ndash137 doi1011110081-175000043
Meade Benjamin Benjamin Steiner Matthew Makarios and Lawrence Travis 2012 Estimating a Dose-Response Relationship Between Time Served in Prison and Recidivism Journal of Research in Crime and Delinquency 50 (4) 525ndash50 doi1011770022427812458928
Mears Daniel P Joshua C Cochran and Francis T Cullen 2014 Incarceration Heterogeneity and Its Implications for Assessing the Effectiveness of Imprisonment on Recidivism Criminal Justice Policy Review 26 (7) 691ndash712 doi1011770887403414528950
Mears Daniel P Joshua C Cochran William D Bales and Avinash S Bhati (2016) Recidivism and time served in prison Journal of Criminal Law and Criminology 106(1) 82-122
Morgan Stephen and Christopher Winship 2015 Counterfactuals and Causal Inference Methods and Principals for Social Research 2nd ed Cambridge MA Cambridge University Press
Nagin Daniel S Francis T Cullen and Cheryl Lero Jonson 2009 Imprisonment and Reoffending Essay In Crime and Justice A Review of Research eds Michael Tonry 38115ndash200 Chicago University of Chicago Press
63
The Relationship between Prison Length of Stay and Recidivism -- This report was prepared by Abt Associates using Federal funding provided by the Bureau of Justice Statistics (BJS) Opinions andor points of view expressed are those of the author(s) and do not necessarily reflect the official position or policies of the US Department of Justice
Nguyen H Loughran T A Paternoster R Fagan J amp Piquero A R (2017) Institutional placement and illegal earnings Examining the crime school hypothesis Journal of Quantitative Criminology 33(2) 207-235
Owen B A (1998) In the Mix Struggle and Survival in a Womens Prison SUNY Press
Pager Devah and Lincoln Quillian 2005 Walking the Talk What Employers Say Versus What They Do American Sociological Review 70 (3) 355ndash80 doi101177000312240507000301
Pager Devah Bart Bonikowski and Bruce Western 2009 Discrimination in a Low-Wage Labor Market A Field Experiment American Sociological Review 74 (5) 777ndash99 doi101177000312240907400505
Pager Devah 2007 Marked Race Crime and Finding Work in an Era of Mass Incarceration Chicago University of Chicago Press
Rhodes William and Sarah K Jalbert 2013 Regression Discontinuity Design in Criminal Justice Evaluation An Introduction and Illustration Evaluation Review 37 (3-4) 239ndash73 doi1011770193841x14523004
Rhodes W Dyous C Kling R Hunt D and Luallen J (2012) Recidivism of Offenders on Federal Community Supervision Bureau of Justice Statistics award 2010-BJ-CX-K069 NCRJS document number 241018
Rhodes W (2010) Estimating treatment effects and predicting recidivism for community supervision using survival analysis with instrumental variables Journal of Quantitative Criminology 26(3) 391-413
Rhodes W (2012) Meta-analysis An introduction using regression models Evaluation review 36(1) 24-71
Roach Michael A and Max M Schanzenbach 2015 The Effect of Prison Sentence Length on Recidivism Evidence from Random Judicial Assignment Northwestern Law ampAmp Econ Research Paper doi102139ssrn2701549
Roodman David 2016 The impacts of incarceration on crime Open Philanthropy Project
Rosenbaum Paul R 2002 Observational Studies 2nd ed New York Springer
Smith Douglas A and Raymond Paternoster 1990 Formal Processing and Future Delinquency Deviance Amplification as Selection Artifact Law ampAmp Society Review 24 (5) 1109 doi1023073053663
Sampson Robert J and John H Laub 1993 Crime in the Making Pathways and Turning Points Through Life Cambridge MA Harvard University Press
64
The Relationship between Prison Length of Stay and Recidivism -- This report was prepared by Abt Associates using Federal funding provided by the Bureau of Justice Statistics (BJS) Opinions andor points of view expressed are those of the author(s) and do not necessarily reflect the official position or policies of the US Department of Justice
Smith Paula 2006 The Effects of Incarceration on Recidivism A Longitudinal Examination of Program Participation and Institutional Adjustment in Federally Sentenced Adult Male Offenders Dissertation University of New Brunswick Dept of Psychology
Smith Paula Paul Gendreau and Claire Goggin 2002 The Effects of Prison Sentences and Intermediate Sanctions on Recidivism General Effects and Individual Differences Ottawa Solicitor General Canada
Snodgrass G Matthew Arjan A J Blokland Amelia Haviland Paul Nieuwbeerta and Daniel S Nagin 2011 Does the Time Cause the Crime An Examination of the Relationship Between Time Served and Reoffending in The Netherlands Criminology 49 (4) 1149ndash94 doi101111j1745-9125201100254x
Sykes Gresham M 1958 The Society of Captives A Study of a Maximum Security Prison Princeton NJ Princeton University Press
National Research Council Jeremy Travis Bruce Western Steve Redburn 2014 The Growth of Incarceration in the United States Exploring Causes and Consequences eds Committee on Causes and Consequences of High Rates of Incarceration Committee on Law and Justice and Division of Behavioral and Social Sciences and Education Washington DC The National Academies Press
van der Klaauw Wilbert 2002 Estimating the Effect of Financial Aid Offers on College Enrollment A Regression-Discontinuity Approach International Economic Review 43 (4) 1249ndash87 doi1011111468-2354t01-1-00055
Villettaz P M Killias and I Zoder 2006 The Effects of Custodial vs Non-Custodial Sentences on Re-Offending A Systematic Review of the State of Knowledge Campbell Collaboration Crime and Justice Group doi104073csr200613
Wacquant Loiumlc 2001 Deadly Symbiosis When Ghetto and Prison Meet and Mesh Mass Imprisonment Social Causes and Consequences 82ndash120 doi1041359781446221228n8
Western Bruce 2002 The Impact of Incarceration on Wage Mobility and Inequality American Sociological Review 67 (4) 526 doi1023073088944
65
The Relationship between Prison Length of Stay and Recidivism -- This report was prepared by Abt Associates using Federal funding provided by the Bureau of Justice Statistics (BJS) Opinions andor points of view expressed are those of the author(s) and do not necessarily reflect the official position or policies of the US Department of Justice
Tables and Figures
Table 1 - Number of Offenders Meeting Study Requirements per Guidelines Cell
Criminal History Categories (1 least serious 6 most serious) Offense
Seriousness Level CH 1 CH 2 CH 3 CH 4 CH 5 CH 6 Total
1 38 6 1 1 1 1 48 2 909 176 178 90 42 61 1456 3 143 26 33 20 9 25 256 4 3244 818 981 523 371 613 6550 5 442 119 132 84 64 119 960 6 3005 641 752 429 300 505 5632 7 1511 381 653 576 440 680 4241 8 4497 882 1023 543 361 552 7858 9 1969 465 566 321 229 363 3913
10 8511 1873 2342 1119 765 1109 15719 11 2824 558 728 472 304 521 5407 12 9748 2368 3330 1968 1204 1667 20285 13 13159 2961 3668 2009 1226 1777 24800 14 4219 746 854 430 275 788 7312 15 10534 2680 3131 1599 951 1257 20152 16 4394 760 831 396 227 318 6926 17 8743 2598 4189 2919 1690 1981 22120 18 4876 745 758 388 212 306 7285 19 9053 2116 2902 1720 1095 1301 18187 20 3761 779 930 532 262 319 6583 21 13674 2293 3341 2511 1706 2421 25946 22 3674 654 850 480 289 392 6339 23 10627 4101 5642 2996 1742 1904 27012 24 3706 719 788 487 282 445 6427 25 7748 2816 3460 1835 1036 1137 18032 26 2946 728 856 420 228 355 5533 27 9418 1797 2221 1126 630 647 15839 28 2509 506 554 306 144 178 4197 29 6180 2614 3442 1736 870 3174 18016 30 1819 344 367 384 218 654 3786 31 3868 1800 2308 1157 554 2945 12632 32 1144 307 377 161 86 213 2288 33 2570 873 1155 566 259 365 5788 34 776 244 260 111 79 1831 3301 35 1145 645 820 368 197 446 3621 36 431 128 153 66 35 47 860
Leas
t Ser
ious
(1) t
o Mo
st S
erio
us (4
3)
66
The Relationship between Prison Length of Stay and Recidivism -- This report was prepared by Abt Associates using Federal funding provided by the Bureau of Justice Statistics (BJS) Opinions andor points of view expressed are those of the author(s) and do not necessarily reflect the official position or policies of the US Department of Justice
Criminal History Categories (1 least serious 6 most serious) Offense
Seriousness Level CH 1 CH 2 CH 3 CH 4 CH 5 CH 6 Total
37 543 210 305 148 54 221 1481 38 290 83 122 59 30 64 648 39 200 62 91 36 21 58 468 40 174 37 58 22 22 35 348 41 94 31 43 18 6 23 215 42 64 23 28 9 5 8 137 43 86 24 25 12 4 19 170
All 169266 42737 55248 31153 18525 31845 348774 Note Cells with fewer than 100 observations are highlighted
67
The Relationship between Prison Length of Stay and Recidivism -- This report was prepared by Abt Associates using Federal funding provided by the Bureau of Justice Statistics (BJS) Opinions andor points of view expressed are those of the author(s) and do not necessarily reflect the official position or policies of the US Department of Justice
Table 2 -- Percentage of Offenders Sentenced to Prison per Guideline Cell
Criminal History Categories (1 least serious 6 most serious) Offense
Seriousness Level CH 1 CH 2 CH 3 CH 4 CH 5 CH 6 Total
1 11 0 0 0 100 100 13 2 15 20 42 52 69 72 25 3 11 31 42 50 78 76 29 4 14 27 45 68 74 82 34 5 14 34 54 83 84 93 42 6 17 40 59 73 89 94 40 7 16 43 69 91 95 96 58 8 17 43 58 86 91 96 39 9 27 53 79 90 90 97 53
10 33 75 86 94 96 96 58 11 63 85 91 95 99 98 77 12 69 84 92 96 97 98 81 13 74 89 94 97 98 98 83 14 79 90 94 97 99 98 86 15 82 93 96 97 99 99 89 16 84 92 95 98 98 98 88 17 85 93 97 98 99 99 92 18 90 95 97 99 98 99 92 19 89 93 97 99 99 99 93 20 92 96 99 98 99 99 94 21 92 96 98 99 99 99 95 22 93 96 98 99 99 99 95 23 93 97 98 99 99 99 96 24 95 98 99 100 99 100 96 25 95 98 98 99 99 99 97 26 97 98 98 99 100 100 98 27 96 99 99 100 99 100 97 28 96 98 99 99 100 99 97 29 96 98 99 99 99 99 98 30 97 100 100 98 99 100 98 31 97 98 99 99 99 99 98 32 98 98 99 99 100 100 99 33 96 98 99 99 100 99 97 34 97 100 99 100 100 99 99 35 97 98 99 98 99 99 98 36 98 99 99 97 100 100 98 37 97 98 99 100 96 98 98 38 98 99 98 100 100 98 98
68
The Relationship between Prison Length of Stay and Recidivism -- This report was prepared by Abt Associates using Federal funding provided by the Bureau of Justice Statistics (BJS) Opinions andor points of view expressed are those of the author(s) and do not necessarily reflect the official position or policies of the US Department of Justice
Criminal History Categories (1 least serious 6 most serious) Offense
Seriousness Level CH 1 CH 2 CH 3 CH 4 CH 5 CH 6 Total
39 98 98 99 100 100 98 99 40 98 97 100 100 100 100 99 41 98 100 100 100 100 100 99 42 97 100 100 100 100 100 99 43 98 100 96 100 100 95 98 All 78 89 93 97 98 98 87
Note Cells with less than 50 prison terms are highlighted
69
The Relationship between Prison Length of Stay and Recidivism -- This report was prepared by Abt Associates using Federal funding provided by the Bureau of Justice Statistics (BJS) Opinions andor points of view expressed are those of the author(s) and do not necessarily reflect the official position or policies of the US Department of Justice
Table 3 -- Average Time Served (Months) per Guideline Cell
Criminal History Categories (1 least serious 6 most serious) Offense Seriousness Level
CH 1 CH 2 CH 3 CH 4 CH 5 CH 6
Leas
t Ser
ious
(1) t
o Mo
st S
erio
us (4
3)
1 04 00 00 00 209 65 2 10 13 25 36 41 73 3 08 17 27 47 47 73 4 13 22 35 57 67 85 5 13 21 42 87 90 138 6 13 41 49 84 115 140 7 11 29 50 81 117 146 8 14 38 59 96 137 175 9 21 50 71 119 168 208
10 30 72 94 150 191 230 11 43 82 119 161 217 251 12 60 103 137 189 237 279 13 81 124 157 212 260 300 14 106 160 187 256 298 324 15 120 170 204 256 320 355 16 147 198 233 303 359 408 17 164 222 260 326 392 446 18 196 257 297 362 454 515 19 216 282 326 407 498 547 20 262 343 401 481 573 637 21 255 342 394 481 570 636 22 313 409 483 582 689 721 23 336 429 484 577 670 728 24 369 493 543 685 786 853 25 418 495 562 671 785 842 26 480 571 676 783 902 964 27 474 597 659 783 868 909 28 552 706 784 902 961 1048 29 584 722 813 878 976 981 30 685 845 938 1063 1120 1213 31 695 823 916 1039 1129 1117 32 850 991 1116 1241 1417 1312 33 779 935 1056 1203 1338 1401 34 969 1166 1220 1365 1396 1326 35 900 1033 1182 1335 1385 1403 36 1176 1265 1456 1510 1551 1461
70
The Relationship between Prison Length of Stay and Recidivism -- This report was prepared by Abt Associates using Federal funding provided by the Bureau of Justice Statistics (BJS) Opinions andor points of view expressed are those of the author(s) and do not necessarily reflect the official position or policies of the US Department of Justice
Criminal History Categories (1 least serious 6 most serious) Offense Seriousness Level
CH 1 CH 2 CH 3 CH 4 CH 5 CH 6
37 1028 1289 1356 1604 1382 1849 38 1279 1434 1625 1726 1399 1769 39 1072 1468 1540 1567 1544 1656 40 1414 1520 1648 1482 1490 1658 41 1315 1562 1788 2045 2124 1899 42 1263 1878 1468 1974 1422 1974 43 1497 1685 2078 2909 1280 2243
71
The Relationship between Prison Length of Stay and Recidivism -- This report was prepared by Abt Associates using Federal funding provided by the Bureau of Justice Statistics (BJS) Opinions andor points of view expressed are those of the author(s) and do not necessarily reflect the official position or policies of the US Department of Justice
Table 4 -- Percentage of Offenders Recidivating within Three Years (Not Accounting for Censoring) per Guideline Cell
Criminal History Categories (1 least serious 6 most serious) Offense Seriousness Level CH 1 CH 2 CH 3 CH 4 CH 5 CH 6
Leas
t Ser
ious
(1) t
o Mo
st S
erio
us (4
3)
1 395 333 1000 00 00 1000 2 232 324 382 433 524 328 3 238 346 424 450 444 440 4 201 334 399 405 415 512 5 215 378 379 440 422 454 6 198 348 430 462 407 475 7 212 336 449 507 502 568 8 177 330 324 385 427 438 9 182 286 337 340 397 477
10 167 262 350 367 383 459 11 116 228 299 326 365 407 12 130 266 335 388 442 475 13 132 248 297 368 396 444 14 94 180 297 347 360 391 15 129 241 315 386 420 423 16 95 186 276 323 300 377 17 99 207 280 342 382 425 18 95 179 240 312 274 359 19 106 197 274 320 359 414 20 94 181 247 301 336 376 21 103 172 235 283 336 352 22 81 191 259 313 356 375 23 84 142 192 247 293 330 24 86 172 221 277 337 348 25 77 122 167 215 251 277 26 70 126 173 193 241 318 27 71 124 157 186 216 253 28 72 144 148 180 201 298 29 63 93 131 169 208 221 30 73 96 166 188 239 252 31 52 99 129 137 181 166 32 68 94 135 161 105 174 33 51 86 127 133 201 186 34 44 90 88 153 215 118 35 53 62 87 122 178 143 36 42 55 85 136 229 128 37 52 90 95 135 93 163
72
The Relationship between Prison Length of Stay and Recidivism -- This report was prepared by Abt Associates using Federal funding provided by the Bureau of Justice Statistics (BJS) Opinions andor points of view expressed are those of the author(s) and do not necessarily reflect the official position or policies of the US Department of Justice
Criminal History Categories (1 least serious 6 most serious) Offense Seriousness Level CH 1 CH 2 CH 3 CH 4 CH 5 CH 6
38 24 24 57 68 233 156 39 20 48 99 139 190 52 40 40 108 103 182 136 114 41 32 32 47 111 333 130 42 63 00 143 222 200 125 43 81 00 200 167 250 158
73
The Relationship between Prison Length of Stay and Recidivism -- This report was prepared by Abt Associates using Federal funding provided by the Bureau of Justice Statistics (BJS) Opinions andor points of view expressed are those of the author(s) and do not necessarily reflect the official position or policies of the US Department of Justice
Table 5 -- Results from a Naive Regressions (Cox Proportional Hazard)
CH 1 CH 2 CH 3 CH 4 CH 5 CH 6 scaled time-served -1707 -2381 -2536 -1941 -1079 -1588
(0155) (0212) (0155) (0187) (0235) (0161) time-served squared 0941 1166 1154 0487 -0336 0016
(0263) (0328) (0234) (0263) (0323) (0192) scaled age -7718 -6272 -6200 -6174 -6028 -2779
(0257) (0385) (0295) (0388) (0496) (0468) age squared 6798 5207 5927 6619 6433 1160
(0503) (0775) (0608) (0791) (0983) (0881) female -0348 -0343 -0281 -0219 -0280 -0331
(0021) (0035) (0028) (0040) (0052) (0041) Black 0194 0115 0120 0088 -0016 -0054
(0023) (0030) (0022) (0026) (0031) (0023) other race 0567 0426 0348 0301 0371 0267
(0030) (0049) (0039) (0049) (0062) (0051) Hispanic -0085 -0095 -0072 -0018 0008 -0053
(0024) (0037) (0028) (0034) (0041) (0034) high_school -0124 -0142 -0127 -0106 -0088 -0036
(0039) (0049) (0036) (0042) (0051) (0038) advanced_degree -0611 -0441 -0423 -0287 -0169 -0051
(0053) (0084) (0070) (0088) (0112) (0078) lives_alone -0023 0006 0011 -0020 -0033 -0036
(0021) (0029) (0021) (0025) (0030) (0022) centered points 0311 -0026 0100 0057 0051 0041
(0015) (0022) (0009) (0012) (0013) (0002) N 143058 38733 52654 30049 17697 30247
74
The Relationship between Prison Length of Stay and Recidivism -- This report was prepared by Abt Associates using Federal funding provided by the Bureau of Justice Statistics (BJS) Opinions andor points of view expressed are those of the author(s) and do not necessarily reflect the official position or policies of the US Department of Justice
Table 6 ndash Results when Contrasts are Cells 13 24 57 68 911 1012 and so on
Criminal History 1
Criminal History 2
Criminal History 3
Criminal History 4
Criminal History 5
Criminal History 6
linear 0002 0004
-0002 0003
-0002 0004
-0003 0003
-0008 0005
-0005 0003
constant -0074 0048
-0034 0041
-0050 0041
-0012 0037
0054 0062
-0054 0041
R2 0010 0040 0020 0060 0150 0110 N 15 15 18 19 17 19 plt005 plt001 The constant is the average parameter for the estimated hazard (zero is neutral) Six criminal history scores labeled Criminal History The contrasts are cells 13 24 57 68 911 1012 and so on All the contrasts are independent
Table 7 ndash Results when Contrasts are Cells 24 35 68 79 1012 1113 and so on
Criminal History 1
Criminal History 2
Criminal History 3
Criminal History 4
Criminal History 5
Criminal History 6
linear 0003 -0003
0004 -0005
0003 -0003
-0002 -0004
0007 -0005
0000 -0004
constant -0103 (0032)
-0153 -0071
-0109 (0033)
-0097 -0050
-0188 (0064)
-0049 -0048
R2 0060 0070 0060 0010 0120 0000 N 16 14 18 17 17 18
plt005 plt001 The constant is the average parameter for the estimated hazard (zero is neutral) Six criminal history scores labeled Criminal History The contrasts are cells 24 35 69 710 1012 1113 etc
75
0 Q) bull ~ middot - 0
20gt () agto
0 00 co 0)0 C = a ctl lshyu c o 0 middot- o t ltD 0 aO 0 _ Q0
I()
ci 0 500
Time at Risk in Days
Crim H 1
Crim H 3
Crim H 5
Crim H is the criminal history category
Crim H 2
Crim H 4
Crim H 6
Crim H 1 is the highest l ine and others a re in descending order Crim H 5 and Crim H 6 are nearly indistinguishable
1000
The Relationship between Prison Length of Stay and Recidivism -- This report was prepared by Abt Associates using Federal funding provided by the Bureau of Justice Statistics (BJS) Opinions andor points of view expressed are those of the author(s) and do not necessarily reflect the official position or policies of the US Department of Justice
Figure 1 ndash Kaplan-Meier Estimates of Time until Recidivism by Criminal History Category
plt005 plt001 Six criminal history scores labeled Criminal History Scales variables run from 0 to 1 Centered points Criminal history points centered at zero
76
The Relationship between Prison Length of Stay and Recidivism -- This report was prepared by Abt Associates using Federal funding provided by the Bureau of Justice Statistics (BJS) Opinions andor points of view expressed are those of the author(s) and do not necessarily reflect the official position or policies of the US Department of Justice
Figure 2 ndash Relationship between Time-Served and Recidivism Principal Specification (Return and Revocation)
0 5 1
15
2 25
Relative Hazard
0 10 20 30 40 Offense Seriousness Level
Crim Hist Category 1
5
1 15
2 25
Relative Hazard
0 10 20 30 40 Offense Seriousness Level
Crim Hist Category 2
5
1 15
2 25
Relative Hazard
0 10 20 30 40 Offense Seriousness Level
Crim Hist Category 3 0
5 1
15
2 25
Relative Hazard
0 10 20 30 40 Offense Seriousness Level
Crim Hist Category 4 0
5 1
15
2 25
Relative Hazard
0 10 20 30 40 Offense Seriousness Level
Crim Hist Category 5
5
1 15
2 25
Relative Hazard
0 10 20 30 40 Offense Seriousness Level
Crim Hist Category 6
Dots are estimated relative hazards (shown if between -25 and 25)Vertical lines are 95 confidence interval for the estimated relative hazards (truncated at 25)Smooth lines are linear predictions and 95 confidence intervals for the regression line
Criminal History 1
Criminal History 2
Criminal History 3
Criminal History 4
Criminal History 5
Criminal History 6
linear 0002 (0002)
0000 (0003)
0000 (0002)
-0003 (0003)
0000 (0004)
-0003 (0003)
constant -0068 (0013)
-0075 (0019)
-0075 (0017)
-0076 (0019)
-0068 (0028)
-0077 (0020)
R2 003 000 000 003 000 003 N 31 29 36 36 34 37
plt005 plt001 The constant is the average parameter for the estimated hazard (zero is neutral) Six criminal history scores labeled Criminal History
77
The Relationship between Prison Length of Stay and Recidivism -- This report was prepared by Abt Associates using Federal funding provided by the Bureau of Justice Statistics (BJS) Opinions andor points of view expressed are those of the author(s) and do not necessarily reflect the official position or policies of the US Department of Justice
Figure 3 ndash Relationship between Time-Served and Recidivism Principal Specification (Return and Revocation) using an Instrumental Variable Estimator
7
8
9
1 11
Relative Hazard
0 10 20 30 40 Offense Seriousness Level
Crim Hist Category 1
9 95
1 105 11 115
Relative Hazard
0 10 20 30 40 Offense Seriousness Level
Crim Hist Category 2
6
8
1 12
14
Relative Hazard
0 10 20 30 40 Offense Seriousness Level
Crim Hist Category 3 5
1 15
2 25
Relative Hazard
0 10 20 30 40 Offense Seriousness Level
Crim Hist Category 4 8
9
1 11
12
Relative Hazard
0 10 20 30 40 Offense Seriousness Level
Crim Hist Category 5
5
1 15
2 25
Relative Hazard
0 10 20 30 40 Offense Seriousness Level
Crim Hist Category 6
Dots are estimated relative hazards (shown if between -25 and 25)Vertical lines are 95 confidence interval for the estimated relative hazards (truncated at 25)Smooth lines are linear predictions and 95 confidence intervals for the regression line
Criminal History 1
Criminal History 2
Criminal History 3
Criminal History 4
Criminal History 5
Criminal History 6
linear 0001 (0000)
0001 (0000)
0001 (0000)
0000 0000
0000 0000
0000 0000
constant -0014 (0002)
-0015 (0003)
-0011 (0003)
-0011 (0003)
-0009 0005
-0009 (0003)
R2 043 022 012 003 001 010 N 31 29 36 36 34 37
plt005 plt001 The constant is the average parameter for the estimated hazard (zero is neutral) Six criminal history scores labeled Criminal History
78
The Relationship between Prison Length of Stay and Recidivism -- This report was prepared by Abt Associates using Federal funding provided by the Bureau of Justice Statistics (BJS) Opinions andor points of view expressed are those of the author(s) and do not necessarily reflect the official position or policies of the US Department of Justice
Figure 4 ndash Sensitivity Test Minimum Cell Size 50 instead of 100
0 5 1
15
2 25
Relative Hazard
0 10 20 30 40 Offense Seriousness Level
Crim Hist Category 1
0 5 1
15
2 25
Relative Hazard
0 10 20 30 40 Offense Seriousness Level
Crim Hist Category 2
5
1 15
2 25
Relative Hazard
0 10 20 30 40 Offense Seriousness Level
Crim Hist Category 3 0
5 1
15
2 25
Relative Hazard
0 10 20 30 40 Offense Seriousness Level
Crim Hist Category 4 0
5 1
15
2 25
Relative Hazard
0 10 20 30 40 Offense Seriousness Level
Crim Hist Category 5
0 5 1
15
2 25
Relative Hazard
0 10 20 30 40 Offense Seriousness Level
Crim Hist Category 6
Dots are estimated relative hazards (shown if between -25 and 25)Vertical lines are 95 confidence interval for the estimated relative hazards (truncated at 25)Smooth lines are linear predictions and 95 confidence intervals for the regression line
Criminal History 1
Criminal History 2
Criminal History 3
Criminal History 4
Criminal History 5
Criminal History 6
linear 0002 (0002)
0000 (0003)
0000 (0002)
-0002 (0003)
0000 (0004)
-0003 (0002)
constant -0068 (0013)
-0075 (0018)
-0073 (0018)
-0078 (0019)
-0068 (0027)
-0084 (0021)
R2 003 000 000 002 000 003 N 31 32 37 37 37 40
Six criminal history scores labeled Criminal History plt005 plt001 The constant is the average parameter for the estimated hazard (zero is neutral)
79
The Relationship between Prison Length of Stay and Recidivism -- This report was prepared by Abt Associates using Federal funding provided by the Bureau of Justice Statistics (BJS) Opinions andor points of view expressed are those of the author(s) and do not necessarily reflect the official position or policies of the US Department of Justice
Figure 5 ndash Sensitivity Test Minimum Cell Size 150 instead of 100
0 5 1
15
2 25
Relative Hazard
0 10 20 30 40 Offense Seriousness Level
Crim Hist Category 1
5
1 15
2 25
Relative Hazard
0 10 20 30 40 Offense Seriousness Level
Crim Hist Category 2
5
1 15
2 25
Relative Hazard
0 10 20 30 40 Offense Seriousness Level
Crim Hist Category 3
5
1 15
2 25
Relative Hazard
0 10 20 30 40 Offense Seriousness Level
Crim Hist Category 4
0 5 1
15
2 25
Relative Hazard
0 10 20 30 40 Offense Seriousness Level
Crim Hist Category 5
5
1 15
2 25
Relative Hazard
0 10 20 30 40 Offense Seriousness Level
Crim Hist Category 6
Dots are estimated relative hazards (shown if between -25 and 25)Vertical lines are 95 confidence interval for the estimated relative hazards (truncated at 25)Smooth lines are linear predictions and 95 confidence intervals for the regression line
Criminal History 1
Criminal History 2
Criminal History 3
Criminal History 4
Criminal History 5
Criminal History 6
linear 0002
(0002)
0000
(0003)
0000
(0002)
-0003
(0003)
-0001
(0004)
-0003
(0003) constant -0068
(0013) -0075 (0021)
-0076 (0017)
-0071 (0020)
-0066 (0031)
-0071 (0021)
R2 003 000 000 003 000 004 N 31 28 34 34 32 35
plt005 plt001 The constant is the average parameter for the estimated hazard (zero is neutral) Six criminal history scores labeled Criminal History
80
The Relationship between Prison Length of Stay and Recidivism -- This report was prepared by Abt Associates using Federal funding provided by the Bureau of Justice Statistics (BJS) Opinions andor points of view expressed are those of the author(s) and do not necessarily reflect the official position or policies of the US Department of Justice
Figure 6 -- Sensitivity Test Minimum Percentage of Prison Terms 75 instead of 50
0 5 1
15
2 25
Relative Hazard
0 10 20 30 40 Offense Seriousness Level
Crim Hist Category 1
5
1 15
2 25
Relative Hazard
0 10 20 30 40 Offense Seriousness Level
Crim Hist Category 2
5
1 15
2 25
Relative Hazard
0 10 20 30 40 Offense Seriousness Level
Crim Hist Category 3
0 5 1
15
2 25
Relative Hazard
0 10 20 30 40 Offense Seriousness Level
Crim Hist Category 4
0 5 1
15
2 25
Relative Hazard
0 10 20 30 40 Offense Seriousness Level
Crim Hist Category 5
5
1 15
2 25
Relative Hazard
0 10 20 30 40 Offense Seriousness Level
Crim Hist Category 6
Dots are estimated relative hazards (shown if between -25 and 25)Vertical lines are 95 confidence interval for the estimated relative hazards (truncated at 25)Smooth lines are linear predictions and 95 confidence intervals for the regression line
Criminal History 1
Criminal History 2
Criminal History 3
Criminal History 4
Criminal History 5
Criminal History 6
linear 0004 (0003)
0002 (0003)
-0001 (0003)
-0002 (0003)
0000 (0004)
-0003 (0003)
constant -0086 (0021)
-0091 (0023)
-0070 (0017)
-0074 (0020)
-0069 (0031)
-0076 (0020)
R2 007 002 001 002 000 004 N 27 28 32 33 31 36
plt005 plt001 The constant is the average parameter for the estimated hazard (zero is neutral) Six criminal history scores labeled Criminal History
81
The Relationship between Prison Length of Stay and Recidivism -- This report was prepared by Abt Associates using Federal funding provided by the Bureau of Justice Statistics (BJS) Opinions andor points of view expressed are those of the author(s) and do not necessarily reflect the official position or policies of the US Department of Justice
Figure 7 ndash Sensitivity Test Contrasts that are J and J+1 instead of J and J+2 5
1 15
2 25
Relative Hazard
0 10 20 30 40 Offense Seriousness Level
Crim Hist Category 1
0 5 1
15
2 25
Relative Hazard
0 10 20 30 40 Offense Seriousness Level
Crim Hist Category 2
5
1 15
2 25
Relative Hazard
0 10 20 30 40 Offense Seriousness Level
Crim Hist Category 3
5
1 15
2 25
Relative Hazard
0 10 20 30 40 Offense Seriousness Level
Crim Hist Category 4
5
1 15
2 25
Relative Hazard
0 10 20 30 40 Offense Seriousness Level
Crim Hist Category 5
5
1 15
2 25
Relative Hazard
0 10 20 30 40 Offense Seriousness Level
Crim Hist Category 6
Dots are estimated relative hazards (shown if between -25 and 25)Vertical lines are 95 confidence interval for the estimated relative hazards (truncated at 25)Smooth lines are linear predictions and 95 confidence intervals for the regression line
Criminal History 1
Criminal History 2
Criminal History 3
Criminal History 4
Criminal History 5
Criminal History 6
linear 0002 (0004)
-0002 (0005)
0005 (0004)
0006 (0004)
0003 (0006)
0006 (0004)
constant -0030 (0029)
-0017 (0040)
-0037 (0032)
-0039 (0028)
-0031 (0046)
-0023 (0028)
R2 0010 000 004 010 001 009 N 25 25 27 26 29 29
plt005 plt001 The constant is the average parameter for the estimated hazard (zero is neutral) Six criminal history scores labeled Criminal History
82
The Relationship between Prison Length of Stay and Recidivism -- This report was prepared by Abt Associates using Federal funding provided by the Bureau of Justice Statistics (BJS) Opinions andor points of view expressed are those of the author(s) and do not necessarily reflect the official position or policies of the US Department of Justice
Figure 8 -- Sensitivity Test Using the Prais-Winston Estimator
5
1 15
2 25
Relative Hazard
0 10 20 30 40 Offense Seriousness Level
Crim Hist Category 1
0 5 1
15
2 25
Relative Hazard
0 10 20 30 40 Offense Seriousness Level
Crim Hist Category 2
5
1 15
2 25
Relative Hazard
0 10 20 30 40 Offense Seriousness Level
Crim Hist Category 3
5
1 15
2 25
Relative Hazard
0 10 20 30 40 Offense Seriousness Level
Crim Hist Category 4
5
1 15
2 25
Relative Hazard
0 10 20 30 40 Offense Seriousness Level
Crim Hist Category 5
5
1 15
2 25
Relative Hazard
0 10 20 30 40 Offense Seriousness Level
Crim Hist Category 6
Dots are estimated relative hazards (shown if between -25 and 25)Vertical lines are 95 confidence interval for the estimated relative hazards (truncated at 25)Smooth lines are linear predictions and 95 confidence intervals for the regression line
Criminal History 1
Criminal History 2
Criminal History 3
Criminal History 4
Criminal History 5
Criminal History 6
linear 0019 -0010
0005 -0003
0003 -0003
0007 (0003)
0002 -0006
0006 (0003)
constant -0133 0065
-0060 0020
-0035 0016
-0030 0031
-0032 0029
-0040 0013
Rho 0100 -0940 -0790 0010 -0260 -0730 R2 0240 0210 0110 0210 0020 0330 N 25 25 27 26 29 29
plt005 plt001 The constant is the average parameter for the estimated hazard Six criminal history scores labeled Criminal History
83
The Relationship between Prison Length of Stay and Recidivism -- This report was prepared by Abt Associates using Federal funding provided by the Bureau of Justice Statistics (BJS) Opinions andor points of view expressed are those of the author(s) and do not necessarily reflect the official position or policies of the US Department of Justice
Figure 9 -- Sensitivity Test Entering Prison as Recidivism
0 5 1
15
2 25
Relative Hazard
0 10 20 30 40 Offense Seriousness Level
Crim Hist Category 1
5
1 15
2 25
Relative Hazard
0 10 20 30 40 Offense Seriousness Level
Crim Hist Category 2
0 5 1
15
2 25
Relative Hazard
0 10 20 30 40 Offense Seriousness Level
Crim Hist Category 3
0 5 1
15
2 25
Relative Hazard
0 10 20 30 40 Offense Seriousness Level
Crim Hist Category 4
0 5 1
15
2 25
Relative Hazard
0 10 20 30 40 Offense Seriousness Level
Crim Hist Category 5
5
1 15
2 25
Relative Hazard
0 10 20 30 40 Offense Seriousness Level
Crim Hist Category 6
Dots are estimated relative hazards (shown if between -25 and 25)Vertical lines are 95 confidence interval for the estimated relative hazards (truncated at 25)Smooth lines are linear predictions and 95 confidence intervals for the regression line
Criminal History 1
Criminal History 2
Criminal History 3
Criminal History 4
Criminal History 5
Criminal History 6
linear 0003 (0002)
0002 (0002)
0001 (0002)
-0004 (0003)
0000 (0004)
-0003 (0003)
constant -0070 (0014)
-0084 (0017)
-0077 (0018)
-0071 (0020)
-0074 (0030)
-0080 (0020)
R2 004 002 000 005 000 003 N 40 36 39 37 33 37
plt005 plt001 The constant is the average parameter for the estimated hazard (zero is neutral) Six criminal history scores labeled Criminal History
84
The Relationship between Prison Length of Stay and Recidivism -- This report was prepared by Abt Associates using Federal funding provided by the Bureau of Justice Statistics (BJS) Opinions andor points of view expressed are those of the author(s) and do not necessarily reflect the official position or policies of the US Department of Justice
Figure 10 -- Sensitivity Testing Eliminating Drug-Law Offenders from the Analysis
0 5 1
15
2 25
Relative Hazard
0 10 20 30 40 Offense Seriousness Level
Crim Hist Category 1
0 5 1
15
2 25
Relative Hazard
0 10 20 30 40 Offense Seriousness Level
Crim Hist Category 2
5
1 15
2 25
Relative Hazard
0 10 20 30 40 Offense Seriousness Level
Crim Hist Category 3
5
1 15
2 25
Relative Hazard
0 10 20 30 40 Offense Seriousness Level
Crim Hist Category 4
0 5 1
15
2 25
Relative Hazard
0 10 20 30 40 Offense Seriousness Level
Crim Hist Category 5
5
1 15
2 25
Relative Hazard
0 10 20 30 40 Offense Seriousness Level
Crim Hist Category 6
Dots are estimated relative hazards (shown if between -25 and 25)Vertical lines are 95 confidence interval for the estimated relative hazards (truncated at 25)Smooth lines are linear predictions and 95 confidence intervals for the regression line
Criminal History 1
Criminal History 2
Criminal History 3
Criminal History 4
Criminal History 5
Criminal History 6
linear 0001 (0003)
-0001 (0004)
-0001 (0003)
-0002 (0003)
0001 (0005)
-0003 (0003)
constant -0055 (0014)
-0065 (0022)
-0066 (0019)
-0057 (0022)
-0059 -0031
-0062 (0022)
R2 000 000 000 001 000 003 N 31 27 34 32 32 35
plt005 plt001 The constant is the average parameter for the estimated hazard (zero is neutral) Six criminal history scores labeled Criminal History
85
The Relationship between Prison Length of Stay and Recidivism -- This report was prepared by Abt Associates using Federal funding provided by the Bureau of Justice Statistics (BJS) Opinions andor points of view expressed are those of the author(s) and do not necessarily reflect the official position or policies of the US Department of Justice
Figure 11 -- Sensitivity Testing No Covariates
0 5 1
15
2 25
Relative Hazard
0 10 20 30 40 Offense Seriousness Level
Crim Hist Category 1
5
1 15
2 25
Relative Hazard
0 10 20 30 40 Offense Seriousness Level
Crim Hist Category 2
5
1 15
2 25
Relative Hazard
0 10 20 30 40 Offense Seriousness Level
Crim Hist Category 3
0 5 1
15
2 25
Relative Hazard
0 10 20 30 40 Offense Seriousness Level
Crim Hist Category 4
0 5 1
15
2 25
Relative Hazard
0 10 20 30 40 Offense Seriousness Level
Crim Hist Category 5
5
1 15
2 25
Relative Hazard
0 10 20 30 40 Offense Seriousness Level
Crim Hist Category 6
Dots are estimated relative hazards (shown if between -25 and 25)Vertical lines are 95 confidence interval for the estimated relative hazards (truncated at 25)Smooth lines are linear predictions and 95 confidence intervals for the regression line
Criminal History 1
Criminal History 2
Criminal History 3
Criminal History 4
Criminal History 5
Criminal History 6
linear 0001 (0003)
-0003 (0003)
-0002 (0003)
-0004 (0003)
-0002 (0004)
-0004 (0003)
constant -0062 (0015)
-0067 (0020)
-0081 (0018)
-0082 (0022)
-0071 (0028)
-0084 (0022)
R2 000 003 002 005 001 007 N 31 29 36 36 34 37
plt005 plt001 The constant is the average parameter for the estimated hazard (zero is neutral) Six criminal history scores labeled Criminal History
86
The Relationship between Prison Length of Stay and Recidivism -- This report was prepared by Abt Associates using Federal funding provided by the Bureau of Justice Statistics (BJS) Opinions andor points of view expressed are those of the author(s) and do not necessarily reflect the official position or policies of the US Department of Justice
Figure 12 -- Sensitivity Testing Using the Earlier Guidelines
0 1
2 3
4 5
Relative Hazard
0 10 20 30 40 Offense Seriousness Level
Crim Hist Category 1
0 5 1
15
2 25
Relative Hazard
0 10 20 30 40 Offense Seriousness Level
Crim Hist Category 2
5
1 15
2 25
Relative Hazard
0 10 20 30 40 Offense Seriousness Level
Crim Hist Category 3
0 5 1
15
2 25
Relative Hazard
0 10 20 30 40 Offense Seriousness Level
Crim Hist Category 4
0 5 1
15
2 25
Relative Hazard
0 10 20 30 40 Offense Seriousness Level
Crim Hist Category 5
5
1 15
2 25
Relative Hazard
0 10 20 30 40 Offense Seriousness Level
Crim Hist Category 6
Dots are estimated relative hazards (shown if between -25 and 25)Vertical lines are 95 confidence interval for the estimated relative hazards (truncated at 25)Smooth lines are linear predictions and 95 confidence intervals for the regression line
Criminal History 1
Criminal History 2
Criminal History 3
Criminal History 4
Criminal History 5
Criminal History 6
linear 0000 (0003)
0001 (0004)
0000 (0003)
-0004 (0002)
-0002 (0004)
-0004 (0003)
constant -0085 (0017)
-0097 (0025)
-0096 (0019)
-0085 (0018)
-0076 (0030)
-0081 (0028)
R2 000 000 000 007 001 004 N 31 29 34 35 33 34
plt005 plt001 The constant is the average parameter for the estimated hazard (zero is neutral) Six criminal history scores labeled Criminal History
87
The Relationship between Prison Length of Stay and Recidivism -- This report was prepared by Abt Associates using Federal funding provided by the Bureau of Justice Statistics (BJS) Opinions andor points of view expressed are those of the author(s) and do not necessarily reflect the official position or policies of the US Department of Justice
Letkemann 1973 Nguyen Loughran Paternoster Fagan amp Piquero 2017) Other research
suggests that prisons reinforce cultural values conforming to criminal activity that is offenders
import these values from their community and deviant values are reinforced by the structure and
organization of prison (Carroll 1988 Irwin 1980 2005 Jacobs 1977 Wacquant 2001)
Even if an offenderrsquos orientation toward reoffending is unaltered by prison labeling
(Braithwaite 1989) may affect recidivism Ex-offenders may be denied employment or prohibited
from accessing social benefits programs after release Whether these events are internalized
limiting the offenderrsquos subjective expectations or simply reduce legitimate avenues for community
integration they may increase the propensity to reoffend By manipulating job applications (Boshier
amp Johnson 1974) or by using actors posing as prior offenders (Pager et al 2009) research has
demonstrated a stigmatizing effect of a criminal record on employment reducing legitimate
opportunities for ex-offenders especially in a low wage job market Of course the stigma may come
from any term of imprisonment and long terms may be no more disadvantageous than short terms
PREVENTATIVE THEORIES
Preventative theories of imprisonment rest on a prisonerrsquos rational expectation of future
punishment or on theories of rehabilitation that envision prison as an opportunity to reform and
retrain Specific deterrence theorists (Becker 1968) assert that offenders are rational actors
weighing the costs and benefits of crime Experiencing prison reinforces its noxiousness and
provides a disincentive to future criminal behavior Reentry programming and other rehabilitative
training adopting evidence-based practices may reduce recidivism (Andrews amp Bonta 2006 Andrews
et al 1990 Gaes et al 1999 Gendreau et al 1999 Gendreau et al 2008 MacKenzie 2006 Smith
2006) so that prison can be used to change the trajectory of criminality Longer prison terms might
allow for more intensive reentry training and longer prison terms should reinforce the expectation of
7
The Relationship between Prison Length of Stay and Recidivism -- This report was prepared by Abt Associates using Federal funding provided by the Bureau of Justice Statistics (BJS) Opinions andor points of view expressed are those of the author(s) and do not necessarily reflect the official position or policies of the US Department of Justice
future punishment However because of the strong association between age and crime longer
prison terms produce inmates who are older at the time of release so that merely incapacitating
offenders for longer periods will reduce the likelihood of crime absent any other intervention or
causal mechanism As noted in Snodgras et al (2015) length of stay and aging are inseparable causal
factors even if one controls for age at release or age at sentence
Prison experiences may unleash forces that both push offenders away from crime and pull
them toward reoffending However as Loefler (2013) argues prison may simply collect people who
are predisposed toward criminality because of pre-existing life experiences and deficits He calls this
social selection crediting Manski and Nagin (1998) Nagin Cullen and Jonson (2009) and Smith and
Paternoster (1990) Loeffler argues that imprisonment itself is a highly selective process Only a small
proportion of people are imprisoned even people who are committed for the first time usually have
an extensive history of criminal justice contacts From this point of view prison has no causal
impact it is where offenders are housed much as hospitals are places where people predisposed to
illness are treated Loefflerrsquos argument is more relevant to an analysis of imprisonment than to
length of stay The relevant question we address is Even if there is a selection process does length
of stay have an impact on future reoffending
PRIOR STUDIES OF PRISON LENGTH OF STAY
Relying on criminological theory then provides no clear expectation of whether
incarceration will decrease or increase reoffending Nagin et al (2009) review empirical studies
addressing the question of whether on balance imprisonment pushes ex-offenders away or pulls ex-
offenders towards new crime They conclude that imprisonment per se seems to have a
criminogenic effect although they recognize studies that contradict that conclusion Nagin et al also
state there is little convincing evidence that length of stay ndash in their parlance prison dosage ndash
8
The Relationship between Prison Length of Stay and Recidivism -- This report was prepared by Abt Associates using Federal funding provided by the Bureau of Justice Statistics (BJS) Opinions andor points of view expressed are those of the author(s) and do not necessarily reflect the official position or policies of the US Department of Justice
increases recidivism They are skeptical of observational studies that use regression procedures to
uncover the causal impact of prison length of stay because identification requires an exacting
standard -- selection on observables (Rosenbaum 2002) -- in which covariates completely adjust for
any spurious relationship between time-served and recidivism
Nagin Cullen and Jonson (2009) identify 14 regression studies two experiments and three
matching studies evaluating the effect of length of stay in their 2009 review Because we are also
skeptical of the regression studies we do not review them1 The experimental studies of length of
stay by Berecochea and Jaman (1981) and Deschenes Turner and Petersilia (1995) manipulated
sentence reductions for offenders who had already served time in prison Part of the study design
for the Deschenes et al experiment diverted offenders from prison and would qualify as an
imprisonment but not a length of stay study However a subset of offenders was randomly assigned
to early release to be placed on intensive community supervision Analysis of the 17 dependent
variables showed only one that was significantly affected by prison length The Berecochea and
Jaman experiment randomly assigned offenders to a six-month reduction which was on average a
16 percent sentence reduction Inmates receiving a sentence reduction had higher parole failure
rates at one and two years after the release from prison but these differences were not statistically
significant Thus rigorous random design studies do not find that increasing prison length either
increases or decreases future criminality
Of the three matching studies identified by Nagin Cullen and Jonson (2009) two evaluate
length of stay on juveniles (Kraus 1981 and Loughran et al 2009) The third study by Jaman
Dickover and Bennett (1972) found recidivism to be higher for adult male burglars receiving 25
months or longer versus those serving 24 or fewer months but the difference was only significant at
1 The 14 regression studies mostly find null effects with specific deterrent and criminogenic effects about equal 9
The Relationship between Prison Length of Stay and Recidivism -- This report was prepared by Abt Associates using Federal funding provided by the Bureau of Justice Statistics (BJS) Opinions andor points of view expressed are those of the author(s) and do not necessarily reflect the official position or policies of the US Department of Justice
the 24-month horizon Kraus (1981) evaluated length of stay contrasts for juveniles that depended
on the juvenilersquos age group For example Kraus contrasted a term of 8 to 20 months versus a term up
to 7 months for 14 and 15-year oldrsquos however for juveniles who were 13 the contrast was between
9 to 16 months and 8 months or less None of the contrasts were statistically significant Loughran et
al (2009) employ propensity score methods The authors categorized the continuous length of stay
into discrete ordinal categories and used ordinal logit to estimate propensity scores The variation in
length of stay extended from 0-3 months up to greater than 12 months Whether using arrest or
self-reported reoffending Loughran et al found no marginal effect of length of stay on either
outcome
Meade Steiner Makarios and Travis (2012) also used ordinal logit to estimate the propensity
score creating ordered subsamples stratified by the estimated log odds of being in a category of
length of stay They stratified their sample into dosage categories and compared people within a
ldquodosagerdquo stratum to those with ldquosimilarrdquo propensity scores who had longer or shorter sentences
Meade et al found that beyond 16 months higher doses of imprisonment lowered recidivism (felony
arrest) however only the highest dose (gt= 78 months) was statistically significant
Snodgrass Blokland Haviland Nieuwbeerta and Nagin (2011) also conducted a dosage
study of time served among prisoners in the Netherlands and restricted their sample to first time
commitments convicted of violent property or drug offenses who were between age 12-40 and who
had sufficient time post-release to assess recidivism The discrete categories of time served were 1
month or less 1-2 months 2-3 months 3-6 months 6-12 months and 12+ months Consistent with
the other propensity score studies they estimated the propensity score using ordinal logit with many
covariates to predict the ordinal level of prison length of stay Rather than use only the propensity
scores to match offenders they used exact matches on sex age (+- two years) and one of four
10
The Relationship between Prison Length of Stay and Recidivism -- This report was prepared by Abt Associates using Federal funding provided by the Bureau of Justice Statistics (BJS) Opinions andor points of view expressed are those of the author(s) and do not necessarily reflect the official position or policies of the US Department of Justice
trajectory group memberships as well as a propensity score matching caliper of 15 The matched
pairings produced sets of offenders who served different sentence lengths The matched pairs
allowed Snodgrass et al to examine measures of recidivism comparing any given ordinal category of
length of stay to the other categories where a matched pair could be found The results showed no
relationship between length of stay and recidivism The Snodgrass et al study takes great care in
constructing counterfactuals for the offenders within a given length of stay class But as they note
the average levels of time served are much shorter than one would observe in most United States
adult prison samples
Roach and Schanzenbach (2015) use randomization of judges assigned to sentencing
convicted offenders to map the relationship between length of stay (median of 4 months) and one
two and three-year rates of recidivism Using reduced form and two-stage regression they find that
each additional month of sentence length decreases recidivism by about 1 percent When they
stratify on criminal history Roach and Schanzenbach find a strong effect of sentence length for
offenders with minimal criminal history and a weak or insignificant effect for offenders with more
extensive criminal histories They also found that relative to the base hazard rate the impact
occurred almost entirely within the first year of release Roach and Schanzenbach argue the impact
of length of stay is a combination of severity of punishment and rehabilitation The researchers argue
that offenders with longer sentences can participate in more rehabilitative prison programs Roach
and Schanzenbachrsquos Table 2 (page 19) does indicate possible sources of bias in the relationship
between length of stay and recidivism The judge dummy variables not only demonstrate a strong
relationship to sentence length essential to the study design but they also predict the offenderrsquos
offense severity level and number of prior non-violent convictions These offender characteristics
could be associated with the sentence length and the level of recidivism qualifying as backdoor
variables (Morgan and Winship 2015) Roodmanrsquos (2016) review of this study offers the possibility
11
The Relationship between Prison Length of Stay and Recidivism -- This report was prepared by Abt Associates using Federal funding provided by the Bureau of Justice Statistics (BJS) Opinions andor points of view expressed are those of the author(s) and do not necessarily reflect the official position or policies of the US Department of Justice
the longer sentences in this study would lead to longer parole supervision elevating recidivism
because of technical parole violations
Kuziemko (2012) uses the Georgia parole guideline grid as a means of identifying the causal
effect of length of stay She restricts her analysis to offenders with less severe offenses and whose
criminal history category is in the average to high range She uses the discontinuity in the grid
recommendation (separating high from average risk) as an instrument for time served with the
instrumented time served in stage one and recidivism regressed on the instrument in stage two
along with other covariates One of her estimates restricts the sample to people whose points are
just above or just below the discontinuity threshold (8 versus 9 points) which should yield the best
approximation to an exogenous variation She finds each additional month of time served lowers the
three-year recidivism rate by 15 percent It is not clear why Kuziemko restricted her analysis to this
threshold limiting the analysis to a narrow range of the guideline grid Most offenders have lower
criminal history scores and restricting the analysis to the higher thresholds limits the generalizability
of the study In fact Roodmanrsquos (2016) reanalysis of these data evaluates other discontinuity cut
points and finds either insignificant length of stay coefficients or coefficients with the opposite sign
indicating increased length of stay increases the probability of recidivism
Mears et al (2016) used the generalized propensity score to balance covariates across levels
of length of stay They balanced within four subgroups of time served categories using
demographics categories of commitment offense offense severity scores prior record scores
dummy coded year of release and dummy coded judicial district While they achieved balance on
this set of covariates they did not conduct a sensitivity test to evaluate the potential impact of an
omitted variable (Rosenbaum 2002) Mears et al (2016) found the effect of time served on
recidivism depended on the level of length of stay Short terms produced increased recidivism up to
12
The Relationship between Prison Length of Stay and Recidivism -- This report was prepared by Abt Associates using Federal funding provided by the Bureau of Justice Statistics (BJS) Opinions andor points of view expressed are those of the author(s) and do not necessarily reflect the official position or policies of the US Department of Justice
one year From one to two years time served decreases recidivism and thereafter has no effect
Long terms (more than 6 years) could not be evaluated due to large error terms
An RDD design employed by Hjalmarsson (2009) was also based on a guideline system
however the study applied to a juvenile population in the state of Washington and the discontinuity
was based on a sanction to a state run juvenile facility versus a local sanction This latter punishment
included sanctions involving much shorter sentences served in a local facility a term of community
supervision fines or community service Hjalmarsson found a deterrent effect of state-run
confinement for juveniles compared to the local sanctions This study was not a test of length of
stay but a test of state-run juvenile confinement as opposed to a bevy of alternate juvenile
punishments To control for the fact the running variable was correlated with recidivism across
levels of criminal history the study used a quadratic regression of the running variable
Furthermore the author used all the data without regard for bandwidth This puts tremendous
pressure on his quadratic expression being correct Secondly rather than using an intent-to-treat
estimator and perhaps converting that into LATE the author drops cross-overs from the
analysis There is no justification for doing so and we are unaware of other RDDrsquos that takes such a
step Finally the author made no attempt to justify an implicit assumption that right-hand-censoring
is independent In fact given data construction and what we know about juvenile justice right-
hand-censoring is unlikely to be independent Specifically offenders with longer terms are more
likely to be censored This relationship alone may explain the findings that incarceration reduced
recidivism
One last study of note was conducted by Drago Galbiati and Vertova (2009) in which the
authors examined the effect of a Clemency Bill in Italy that shortened the sentence of offenders
anywhere from 1 to 36 months This could be described as an exogenous treatment since the
13
The Relationship between Prison Length of Stay and Recidivism -- This report was prepared by Abt Associates using Federal funding provided by the Bureau of Justice Statistics (BJS) Opinions andor points of view expressed are those of the author(s) and do not necessarily reflect the official position or policies of the US Department of Justice
application of clemency was applied irrespective of criminal history offense age and other factors
affecting the outcome However the early release came with a caveat The remaining time to serve
would be reinstated if the offender was convicted of another crime within five years So this was a
reduction in length of stay with an added disincentive to commit a new offense People who had
spent more time in prison were less likely to reoffend and each month of remaining time to serve
was associated with a 124 percent reduction to commit a new crime2
Even with these additional studies the literature on length of stay using strong
counterfactual designs is still sparse and presents a mixed picture of effects Most studies show no
effect or that increased prison length reduces recidivism slightly Several are imbalanced in ways
that could bias the length of stay effects The studies also span different populations juveniles
adults and cover different international jurisdictions (Italy the Netherlands and United Sates) The
present study uses a very large sample of federal offenders sentenced to prison with varying lengths
of stay
INCARCERATION TREATMENT HETEROGENEITY
Scholars have argued that prison dosage (length of stay) may have different effects
conditional on factors associated with the individual with the social context with sentencing
structure and with potentially many other factors The National Academy of Sciences study on mass
incarceration finds evidence for the heterogeneity of incarceration effects (NRC 2014 427) But we
need a template to systematically examine incarceration heterogeneity
Mears Cochran and Cullen (2014) provide one such template They propose three types of
sources of heterogeneity prior sanctioning experience in-prison experiences and the level of post-
2 Kuziemko (2012) also capitalizes on early release in Georgia because jail overcrowding allowed her to compare offenders with different amounts of time served having the same prior risk levels She finds people with longer time served have lower recidivism rates These results are challenged by Roodman as possible evidence of parole bias in Kuziemkorsquos analysis
14
The Relationship between Prison Length of Stay and Recidivism -- This report was prepared by Abt Associates using Federal funding provided by the Bureau of Justice Statistics (BJS) Opinions andor points of view expressed are those of the author(s) and do not necessarily reflect the official position or policies of the US Department of Justice
release supervision ndash a pre- within- post-custody framework The National Academy of Sciences
report takes an even broader perspective by suggesting that there may be incarceration effects for
different units ndash the effect on people may be substantially different than the effect on families or
neighborhoods Based on the Mears et al hypothesized framework it seems sentencing jurisdictions
will vary on many of the important pre within and post dimensions We may be reluctant to accept
that results from Florida apply to Massachusetts unless we have a framework that tells us how to
compare jurisdictions within this pre within and post sentencing framework
For the current application we use the structure of the U S Sentencing Guidelines
sanctioning grid in our RDD design to test whether criminal history or offense seriousness moderates
the effect of length of stay increments We find that increments in length of stay have about the
same effect regardless of either of these dimensions We also separately evaluate criminal history
sex race education and marital status all showing homogeneous effects of length of stay
PRESENT METHODOLOGY DATA STATISTICS AND INFERENCE
This methodology section has three parts The first part identifies the source of the data ndash
the Federal Justice Statistics Program To provide necessary background before discussing the
regression discontinuity design the second part summarizes the US Sentencing Guidelines The
third part discusses statistical methods and the RDD identification strategy3 This application of RDD
is unconventional There are multiple break-points and hence multiple effects the effects are
summarized using a meta-regression borrowed from meta-analysis Furthermore for each effect
the bandwidth is exactly two units so search for an optimal bandwidth is not a concern Several
3 Some readers may prefer to characterize our approach as using instrumental variables The US Sentencing Guidelines are the instrument that moves offenders who otherwise have the same propensity to recidivate between two guidelines cells the first of which prescribes a shorter prison term on average than does the second Because there are many guideline cells there are many estimates based on contiguous cells The multiple estimates are averaged using inverse variance weights
15
The Relationship between Prison Length of Stay and Recidivism -- This report was prepared by Abt Associates using Federal funding provided by the Bureau of Justice Statistics (BJS) Opinions andor points of view expressed are those of the author(s) and do not necessarily reflect the official position or policies of the US Department of Justice
conventional tests used in RDD are inapplicable in this setting For example we need not test how
expanding the bandwidth affects estimates
Although the parallel is disputed (Imbens amp Lemieux 2007) some see RDD as an
instrumental variable estimator and it is practical to employ IV as the estimator This alternative
estimator is also used in this study Results show the RDD estimator and the IV estimator yield
essentially the same results
Data Source
Data for this study come from the Federal Justice Statistics Program (FJSP) a Bureau of
Justice Statistics (BJS) sponsored project to assemble federal justice records To be included in the
analysis an offender must have been sentenced under the guidelines between 1999 and 2014
Practically the period studied is shorter because to be included in the analysis an offender must have
entered community supervision but many offenders sentenced between 1999 and 2014 were still
incarcerated at the end of 2014
The FJSP has a thirty-five-year history however recent refinements link federal offenders
from investigation through corrections This paper uses a subset of the linked data running from
sentencing through a single cycle of release to community supervision and possible recidivism The
US Sentencing Commission (USSC) provides data on offenses and offenders at the time of
sentencing the Administrative Office of the US Courts (AOUSC) provides data on offenders under
community supervision and the Bureau of Prisons (BOP) provides data on offenders during periods
of incarceration Details regarding construction of the FJSP data appear elsewhere (Kling et al
2016) this paper summarizes
16
The Relationship between Prison Length of Stay and Recidivism -- This report was prepared by Abt Associates using Federal funding provided by the Bureau of Justice Statistics (BJS) Opinions andor points of view expressed are those of the author(s) and do not necessarily reflect the official position or policies of the US Department of Justice
Since 1987 federal offenders have been sentenced using sentencing guidelines and data
about guideline application have been assembled (and contributed to the FJSP) by the USSC
Guidelines data provide detailed accounts of the offenderrsquos criminal history the offense of
conviction the sentence imposed and expected prison time Expected prison time differs from
actual prison time but the two are close because sentencing in the federal system uses determinate
or real-time sentencing and as explained below actual time-served is observed with systematic
error
When an offender is sentenced to prison he or she serves time in a facility run by the
Federal Bureau of Prisons (BOP) which reports data from its inmate tracking system (SENTRY) to the
FJSP Most offender prison terms are recorded in SENTRY but some are not because (1) some
offenders are sentenced to time-served prior to trial (2) some offenders spend part of their terms in
state detention and (3) terms of thirty days or fewer are inconsistently recorded in SENTRY Because
of these limitations we use expected time-served reported by the USSC as a measure of prison time
However we use admission into a BOP facility during the period of community corrections as one
measure of recidivism
When an offender is sentenced to probation or when an offender leaves prison to serve a
statutorily required term of supervised release (a judge-imposed sentence to post-incarceration
supervision) his or her term of community supervision is recorded in Probation and Pretrial Services
Automated Case Tracking System (PACTS) an information system maintained by the Administrative
Office of the U S Courts specifically by the Probation and Pretrial Services Office (PPSO) After
some manipulation4 the PACTS data record periods of community supervision and outcomes Being
4 Federal probation officers frequently open terms of probation before the offender is sentenced and terms of supervised release before the offender is released from prison For probation the probation officer may be responsible for pretrial supervision continued into post-conviction supervision and this appears as a continuous period of community supervision
17
The Relationship between Prison Length of Stay and Recidivism -- This report was prepared by Abt Associates using Federal funding provided by the Bureau of Justice Statistics (BJS) Opinions andor points of view expressed are those of the author(s) and do not necessarily reflect the official position or policies of the US Department of Justice
revoked from community supervision is another measure of recidivism Every federal offender in our
sample received a term of community supervision eliminating one source of variability and
heterogeneity
For the recidivism analysis time-at-risk starts with the beginning of a term of supervised
release for offenders sentenced to prison The time-at-risk ends with recidivism or with the first
occurrence of one of the following censoring events completion of the community supervision term
three years or with the end of data collection Using the measures described above recidivism is
defined by the occurrence of a recognized failure event If the offender reappears in the federal BOP
data he or she is deemed to have recidivated If the offender does not reappear in the BOP data but
we observe the offender is revoked from community supervision he or she is deemed to have
recidivated Although there are several explanations for being revoked from supervision but not
entering federal prison one common reason is the offender is arrested for a state-level crime and
detained in state custody pending trial The date when an offender reenters prison is the date of
recidivism if the offender does not reenter prison but is revoked from supervision the date of the
revocation is the date of recidivism Based on years of working with the PPSO checking algorithms
with PPSO administrative staff and field staff we have confirmed that this approach ndash providing
primacy to returning to prison according to the BOP ndash is the best way to identify recidivism5
Many federal offenders are arrested for new crimes without returning to prison or having
their community supervision status revoked Using the FJSP data we estimate three-year recidivism
in the FJSP Also for probation an officer may open a supervision record when preparing a presentence report The correction is to change the beginning of supervision to the date of sentencing For a term of supervised release the probation officer might open the term in preparation for post-release planning To correct this we changed the beginning of supervision to coincide with the end of prison 5 An offenderrsquos community supervision must be revoked before he or she is committed to prison so the date of revocation would seem to be the better date for the failure event In fact probation officers often fail or are unable to record the date of revocation until weeks or months after it occurs Consequently the date of entering prison (when it occurs) is a more accurate indicator for a study of recidivism
18
The Relationship between Prison Length of Stay and Recidivism -- This report was prepared by Abt Associates using Federal funding provided by the Bureau of Justice Statistics (BJS) Opinions andor points of view expressed are those of the author(s) and do not necessarily reflect the official position or policies of the US Department of Justice
rates of about 20 percent for federal offenders placed on community supervision If new arrests
were included in the analysis the recidivism rate would be closer to 30 percent6 The FJSP does not
include arrest data so we could not define recidivism as being arrested but an arrest that does not
result in revocation is typically for a minor or unfounded crime so the outcome measures used in
this study are for events that are sufficiently serious to provoke a return to custody
To be included in the analysis the offender must have been convicted and sentenced under
the US Sentencing Guidelines since 1999 This is the period covered by the data linkage Only
offenders convicted of felonies and serious misdemeanors are sentenced routinely under the
guidelines so this study is limited to those serious offenders Others rarely serve prison terms so
the omission is inconsequential To be included in the study the offender must have entered
community supervision else we could not identify a recidivism follow-up period Because of this
requirement some offenders sentenced under the guidelines are excluded from the analysis
Several reasons explain why offenders do not enter community supervision First before entering
community supervision offenders sentenced to prison must have been released from prison
Second many federal offenders are foreign nationals in the country legally or illegally they are often
deported upon prison release so they are not candidates for a recidivism study and consequently
this study is based on US citizens7 Some other offenders are released from prison to detainers
exercised by state authorities Because offenders who never enter community supervision provide
no information for analysis they are excluded from the analysis file
6 The authors have worked with PPSO for six years to match community supervision records with criminal history records (eg criminal record histories held by state authorities and linked using an FBI index) Data use agreements preclude including criminal history records in the FJSP so they are unavailable for this analysis Based on our work with PPSO we know that recidivism rates based on arrests are near 30 percent 7 Non-citizens are sentenced to community supervision but they are deported and never enter active community supervision If they reenter the county illegally their supervision status can be revoked However this form of recidivism is very different from the form of recidivism studied in this paper so we chose to exclude non-citizens We might have retained non-citizens who entered active community supervision but they are difficult to distinguish reliably in the OBTS so we chose to exclude all non-citizens
19
The Relationship between Prison Length of Stay and Recidivism -- This report was prepared by Abt Associates using Federal funding provided by the Bureau of Justice Statistics (BJS) Opinions andor points of view expressed are those of the author(s) and do not necessarily reflect the official position or policies of the US Department of Justice
Data limitations discussed in this section seem to raise concerns about bias when measuring
recidivism but these concerns are not serious for this study Essentially a RDD study compares
offenders from group A with offenders from group B where group A and group B are closely
matched Due to matching whatever biases arise regarding the measurement of recidivism are likely
the same in groups A and B Therefore a comparison of recidivism for groups A and B is valid even if
estimates of recidivism are systematically biased
SENTENCING GUIDELINES
Explaining the RDD requires a short description of federal sentencing guidelines Under the
guidelines offense seriousness is determined by a complex set of rules that take the offense of
conviction and real offense behavior into account to classify sentencing factors into one of 43 offense
seriousness levels with j=1 being the least serious and j=43 being the most serious and six criminal
history categories with k=1 being the least serious (least likely to recidivate) and k=6 being the most
serious (most likely to recidivate) By design the offense seriousness levels reflect the USSCrsquos
assessment of offense seriousness and do not consider an offenderrsquos threat to recidivate Likewise
by design the offenderrsquos criminal history category reflects the USSCrsquos assessment of the likelihood
that an offender will recidivate Important to note subtle differences in offense conduct cause an
offenderrsquos crime to be associated with offense level j rather than offense level j-1 or j+1 For
example unarmed bank robbers armed bank robbers who do not display their weapons armed
bank robbers who display but do not threaten with their weapons and bank robbers who explicitly
threaten with their weapons all appear in different seriousness levels Furthermore offenders
convicted of violent crimes drug-law violations and property crimes can all appear in the same
offense seriousness level Based on this subtlety we expect that offenders in offense seriousness
level j will not be inherently more likely to recidivate than will offenders in seriousness levels j-1 and
20
The Relationship between Prison Length of Stay and Recidivism -- This report was prepared by Abt Associates using Federal funding provided by the Bureau of Justice Statistics (BJS) Opinions andor points of view expressed are those of the author(s) and do not necessarily reflect the official position or policies of the US Department of Justice
j+1 provided criminal history is held constant8 In fact holding criminal history constant it seems
likely that offenders in offense seriousness category j are not inherently more or less likely to
recidivate than are offenders in offense seriousness categories j-k and j+k where k is a small number
This assumption provides the identification logic for the RDD and for the instrumental variable
alternative
Under the guidelines another complex set of rules determine criminal history points which
are collapsed into six criminal history categories for the guidelines application with category 1 being
the least serious criminal record and category 6 being the most serious record Based on the offense
seriousness level and the criminal history category the federal sentencing guidelines are a 43x6 grid
comprising 43 offense seriousness rows and 6 criminal history columns Holding the criminal history
category constant moving down the grid from least serious offense level to most serious offense
level the recommended prison term increases Holding the offense seriousness level constant
moving from left to right across the grid from least serious criminal history category to most serious
criminal history category the recommended prison term increases For the least serious offenses
and for the least dangerous offenders the guidelines recommend probation or alternative sanctions
although prison terms are allowed and sometimes imposed
Every year the Commission can recommend changes to the guidelines for Congressional
approval and in fact the guidelines have changed over time These changes have little consequence
for the analysis reported in this paper Even if the composition of offenders within specific guideline
cells has changed over time recommended sentence terms have always increased with offense
8 Possibly some factors entering the determination of the offense seriousness level might predict recidivism However crimes committed in the federal system are so diverse and factors entering the guidelines are so detailed it seems unlikely that increases in the offense seriousness levels would be systematically associated with recidivism holding criminal history constant Possibly for some cell jj+1 comparisons factors that enter the offense seriousness determination may cause recidivism to increase or decrease but provided these factors are not systematic ndash meaning that they do not always increase recidivism as the comparison moves from cell j to j+1 ndash the treatment effect is still identified
21
The Relationship between Prison Length of Stay and Recidivism -- This report was prepared by Abt Associates using Federal funding provided by the Bureau of Justice Statistics (BJS) Opinions andor points of view expressed are those of the author(s) and do not necessarily reflect the official position or policies of the US Department of Justice
seriousness level As explained in this next section that regularity is sufficient to support the RDD
estimation procedure
THE RDD AND STATISTICAL METHODOLOGY
During the last decade methods for inferring causality have gone well beyond naive
regression models criticized by Nagin and his colleagues (Morgan amp Winship 2015 Imbens amp Rubin
2015) A regression discontinuity design (Hahn Todd amp van der Klauuw 2001 van der Klaauw 2002
Imbens amp Lemieux 2007 Lee amp Lemieux 2010 Bloom 2012) is a rigorous approach often applied in
non-criminal justice research and sometimes applied in criminal justice studies (Berk amp Rauma 1983
Berk amp DeLeeuw 1999 Berk 2010 Rhodes amp Jalbert Regression Discontiuity Design in Criminal
Justice Evaluation An Introduction and Illustration 2013) Commonly the RDD is applied in a setting
where a decision rule based on factors (such as offense seriousness level holding criminal history
constant) can be used to define a ldquocut-pointrdquo that places study subjects (such as offenders) into one
group that does and another group that does not receive treatment Very near that rule-imposed
cut-point study subjects who do and do not receive treatment are so similar that a comparison of
outcomes for the two groups is deemed valid This section explains that our application of the RDD
identification strategy differs from the conventional application
One difference between our application and the standard application is that for us treatment
is a dose (eg the length of a prison term) while in standard applications treatment is a binary
condition On average the dose received by offenders in cell j+1 is higher than the dose received by
offenders in cell j Because offenders in cells j and j+1 are otherwise the same regarding the threat to
recidivate we can ask whether offenders in cell j+1 have higher or lower recidivism rates than
offenders in cell j and if so we have justification for attributing causation As a stylized example
22
The Relationship between Prison Length of Stay and Recidivism -- This report was prepared by Abt Associates using Federal funding provided by the Bureau of Justice Statistics (BJS) Opinions andor points of view expressed are those of the author(s) and do not necessarily reflect the official position or policies of the US Department of Justice
suppose first-time offenders who steal $100000 are sentenced according to offense seriousness
level j while first-time offenders who steal $125000 are sentenced according to offense seriousness
level j+1 In deference to the more serious crime the guidelines call for a term between 20 and 23
months for first-time offenders sentenced within guideline cell j and between 22 and 26 months for
first-time offenders sentenced within guidelines cell j+1 Given judicial discretion sentences imposed
on offenders within guideline cell j overlap with sentences imposed on offenders within guideline cell
j+1 but on average prison sentences within guideline cell j+1 are longer than those imposed within
guideline cell j This average difference drives the identification strategy Specifically holding the
criminal history category constant offenders sentenced within guideline cell j+1 are not inherently
more recidivistic than are offenders sentenced within guideline cell j but offenders sentenced within
guideline cell j+1 receive longer prison terms on average and we can test for whether those longer
prison terms account for higher or lower recidivism
Usually when applying RDD researchers consider a variable X (called a running variable in
the RDD context) and a critical value Xo that assigns study subjects to a comparison group when X lt
Xo and to a treatment group otherwise A sharp design occurs when the assignment is exact a fuzzy
design occurs when the assignment is inexact Although both sharp and fuzzy designs both estimate
the treatment effect sharp designs are preferred because (from a statistical estimation standpoint)
they are more efficient and interpreting the effect is clear
When treatment is binary as it is in standard applications the distinction between sharp and
fuzzy is straightforward Let PL be the probability of treatment when X lt Xo and let PR be the
probability of treatment otherwise If PL = 0 and PR = 1 then the design is sharp Let YL be the mean
outcome when X lt Xo and let YR be the mean outcome otherwise An estimator for the treatment
effect is YR-YL or just the difference in the mean outcomes But suppose that PL ge 0 or PR le 1 or both
23
The Relationship between Prison Length of Stay and Recidivism -- This report was prepared by Abt Associates using Federal funding provided by the Bureau of Justice Statistics (BJS) Opinions andor points of view expressed are those of the author(s) and do not necessarily reflect the official position or policies of the US Department of Justice
then the design is fuzzy Given a fuzzy RDD an often-used estimator is (YR-YL)(PR-PL) This
alternative estimator is sometimes called a local average treatment effect (LATE) Note the
numerator is an intent-to-treat estimator and in fact statistical testing is based on the numerator
because dividing by a constant will not change the properties of the basic test of whether treatment
is effective
For our application treatment is a dose and doses are distributed about a mean that
depends on whether X lt Xo or X ge Xo A necessary condition is that a shift in the offender from
guideline cell j to guideline cell j+1 will always (a sharp design) or sometime (a fuzzy design) cause an
offender to receive a longer prison term The monotonicity assumption is that this shift will never
cause an offender to receive a shorter prison term We presume the monotonicity assumption holds
and see no reason to assume otherwise
A test of the null hypothesis of no treatment effect is based on YR-YL Let TL be the average
prison term for X lt Xo let TR be the average prison term for X ge Xo Then the counterpart to the LATE
estimator for the binary treatment effect is (YR-YL)(TR-TL) or the change in recidivism per unit of
additional prison This too is a local average treatment effect Its interpretation is the average
increasedecrease in recidivism resulting from an average increase in prison length
In both these illustrations the estimator is LATE LATE is not necessarily the average
treatment effect or in this case the average increasedecrease in recidivism from increasing time-
served by one unit However LATE is almost always used as a substitute for that average which is
unidentified (Imbens 2009)
Returning to the standard application the ideal identification strategy requires that
estimation be limited to study subjects whose X values are just slightly less than Xo or equal to or
24
The Relationship between Prison Length of Stay and Recidivism -- This report was prepared by Abt Associates using Federal funding provided by the Bureau of Justice Statistics (BJS) Opinions andor points of view expressed are those of the author(s) and do not necessarily reflect the official position or policies of the US Department of Justice
slightly more than Xo9 Because very few observations meet these demanding conditions evaluators
usually expand the bandwidth to be broader than ldquoslightly lessrdquo and ldquoslightly morerdquo Because this
expansion of the bandwidth violates the asymptotic identification assumptions evaluators typically
assume that a local linear regression of the outcome variable Y on X will capture the relationship
between Y and X absent any intervention Given the intervention any departure from the local linear
regression around Xo is deemed the treatment effect A standard application would test the
credibility of this local linear regression and a standard application would test the sensitivity of
findings to the size of the bandwidth
Our application differs from the standard application in important ways Typically when
researchers apply the RDD strategy there is a single cut-point so there is a single estimate of the
treatment effect Less commonly there are multiple cut-points and a researcher can estimate
multiple treatment effects (Cattaneo Keele Tituinik amp Vazquez-Bare 2016) Given the structure of
the sentencing guidelines our study is based on a multiple cut-point RDD That is we estimate
multiple effects then combine them to generalize conclusions
Rather than increasing efficacy by expanding the bandwidth we always make comparison
across adjacent cells so that cell j is deemed ldquoslightly lessrdquo than the offense seriousness level that
determines cell j+1 Employing multiple cut-points achieves small standard errors by combining the
multiple estimates that arise from comparing outcomes for cells jj+1 j+1j+2 j+2j+3 and so on It is
unnecessary to expand the bandwidth beyond two units
9 ldquoSlightly lessrdquo and ldquoslightly morerdquo mean than X falls within a region X+δ and X-δ as δ approaches zero Expanding the bandwidth means that δ is allowed to get bigger
25
The Relationship between Prison Length of Stay and Recidivism -- This report was prepared by Abt Associates using Federal funding provided by the Bureau of Justice Statistics (BJS) Opinions andor points of view expressed are those of the author(s) and do not necessarily reflect the official position or policies of the US Department of Justice
In the conventional application a researcher would assure the relationship between the
outcome variable and the running variable is linear to the left and right of the breakpoint10 Because
our approach employs just two points j and j+1 this test is unavailable to us Arguably it is also
inapplicable because when estimating an effect we do not expand the bandwidth beyond j and j+1
In the conventional application the researcher will assure there is a discontinuity in treatment so
that treatment is more likely for those to the right of the cut-point than it is for those to the left We
do apply this conventional test showing that it holds
In conventional RDD analysis researchers worry about ldquogamingrdquo In the present context
defense attorneys have incentives to move their clients to lower guideline cells and prosecuting
attorneys have countervailing incentives to move offenders to higher guideline cells Gaming is
possible by manipulating guideline elements such as the amount of money stolen Defense
attorneys would argue the amount is lower than alleged prosecutors would argue the opposite In
conventional RDD analysis researchers use imperfect devices to test for gaming but those tests are
not necessary in the present context
To explain suppose a variable Z is associated with recidivism and is subject to gaming such
that defense attorneys are generally able to shift offenders from cell j+1 to cell j based on the value
of Z In our study we would expect a general shift in Z from j+2 to j+1 from j+1 to j from j to j-1
from j-1 to j-2 and so on In general this shift would have no effect on the contrasts because it
occurs across all adjacent cells Thus gaming is less relevant for a multiple-effect RDD than for a
conventional single-effect RDD Furthermore we are only concerned with gaming about variables
10 Postulating a linear relationship is frequent but some researchers expand their models to allow power functions of the running variable Hjalmarsson (2009) in a study of guidelines and juvenile justice discussed earlier used a quadratic This is a dangerous practice because the validity of the quadratic is difficult to assess and findings based on a RDD are sensitive to getting the model specification correct There are other elaborate alternatives to using local linear regressions but they are not applicable to our study
26
The Relationship between Prison Length of Stay and Recidivism -- This report was prepared by Abt Associates using Federal funding provided by the Bureau of Justice Statistics (BJS) Opinions andor points of view expressed are those of the author(s) and do not necessarily reflect the official position or policies of the US Department of Justice
that affect recidivism Because criminal history is held constant by construction of the guideline cells
the avenue for gaming is restricted Nevertheless we introduce some test for whether variable
associated with recidivism vary systematically across cells so that for example we ask whether
offenders in cell j+1 tend to be older than offenders in cell j We introduce these potential
confounders into the local linear regression Although we do not need a local linear regression for
identification we increase the efficiency of estimates by using a regression to include covariates in
the analysis Given the nature of the outcome variable when comparing outcomes in cells j and j+1
our study uses a Cox survival model sometimes called a Cox proportional hazard model but it is
ldquolocalrdquo only in the sense that (absent the intervention) the baseline survival model is invariant
around the cut-point and we estimate the treatment effect from a unit shift There exists an
extensive methodological literature on survival models (Lancaster 1990 Kalbfleisch amp Prentice
2002 Hosmer Lemeshow amp May 2008) which are frequently applied in studies of criminal
recidivism where time-at-risk is often censored A separate study justifies using the proportional
hazard model (rather than a parametric alternative) to study recidivism in the federal system
(Rhodes et al 2012) Although the approach seems uncommon others have used survival models as
the estimator in a RDD context (Rhodes amp Jalbert 2013 Bor Moscoe Mutevedzi Newell amp
Barnighausem 2014) We use the RDD identification strategy and the survival model estimation
strategy to identify and estimate the change in the hazard of recidivism across paired guideline cells
The most defensible approach consistent with the intuition of the RDD would seem to be to
compare the relative hazards for cell j and j+1 (holding criminal history category constant) because
offenders in cells j and j+1 are more alike than in any other comparison Both the previous discussion
and descriptive statistics discussed subsequently points toward a problem Cells j and j+1 are so
27
The Relationship between Prison Length of Stay and Recidivism -- This report was prepared by Abt Associates using Federal funding provided by the Bureau of Justice Statistics (BJS) Opinions andor points of view expressed are those of the author(s) and do not necessarily reflect the official position or policies of the US Department of Justice
alike the average time-served is not guaranteed to increase when comparing cell j to cell j+111 Even
when it increases the size of the increase may be so small that it is not informative As an extreme
example there is not much use in comparing recidivism for offenders who serve two years on
average when sentenced within cell j and two years plus one day on average when sentenced within
cell j+1 From experimentation to assure that average time served will increase between contrasted
cells we have found it better to compare the outcome from cell j and cell j+212 Notwithstanding
what was written above most of the analysis is based on that jj+2 comparison but we do offer
sensitivity tests that employ the original jj+1 comparison An alternative approach is to combine
cells j and j-1 and compare that with the combined cells j+1 and j+2 (This is equivalent to expanding
the bandwidth) However this alternative approach seems to offer no advantages and introduces
some difficult estimation problems (serial correlation and general model specification issues) when
combining multiple effects so we avoid its application
Because this identificationestimation strategy results in many hazard estimates (potentially
41x6) we use techniques familiar from meta-analysis to combine estimates (effects) into summary
statistics A useful explanation of a fixed-effect meta-regression is Rhodes (2012) For example for
the first criminal history category there are potentially 41 effects We estimate a weighted least-
squares linear regression to estimate the average of the 41 effects Because there are 6 criminal
history categories we repeat the meta-regression across the 6 criminal history categories and then
average the 6 meta-regression averages to derive a single inverse variance weighted estimate and
11 Especially for drug-law violations and weapons offenses federal statutes require application of mandatory minimum sentences Regardless of guideline recommendations judges cannot sentence below the mandatory minimums Because mandatory minimums are not evenly distributed across the offense seriousness levels it is possible for the average terms in cell j to be larger than the average terms in cell j+1
12 Across the six criminal history categories the average percent change in time-served between cells j and j+1 ranges from 9 to 18 with the change being largest for criminal history category 1 In comparison across the six criminal history categories the average percent change in time-served between cells j and j+1 ranges from 20 to 38 with the change being largest for criminal history category 1
28
The Relationship between Prison Length of Stay and Recidivism -- This report was prepared by Abt Associates using Federal funding provided by the Bureau of Justice Statistics (BJS) Opinions andor points of view expressed are those of the author(s) and do not necessarily reflect the official position or policies of the US Department of Justice
test statistic Thus although there are many estimates there is only one test statistics and hence no
multiple comparison problem
For reasons explained below when applying the meta-regression we must deal with error
terms that may be auto-correlated and heteroscedastic We will show that heteroscedasticity is a
major problem and to deal with it we used weighted least squares Because we compare cells j with
j+2 j+1 with j+3 j+2 with j+4 and so on we potentially introduce autocorrelation across the
estimates The jj+2 and j+2j+4 comparisons are not independent because they have j+2 in common
This problem has corrections (Prais-Winston estimators for example) but they are suspect in small
samples where ignoring the problem is likely better than attempting to introduce a feasible
generalized least squares solution (Greene 2008 p 648) This follows because small samples provide
inaccurate estimates for the autocorrelation coefficient We concentrate on the heteroscedasticity
problem however we provide a sensitivity test suggesting that autocorrelation can safely be
ignored
The meta-regression provides the average effect of moving from guidelines cell j to cell j+2
This is an intent-to-treat estimator If this movement were not statistically significant we would
conclude that increasing prison terms has no effect on criminal recidivism If the average effect is
statistically significant by itself it does not provide LATE the size of the effect resulting from a unit
increase in prison time Our approach is to report the size of the average effect when moving from
cell j to j+2 the average increase in the length of the prison term when moving from cell j to j+2 and
the ratio of the two The ratio is essentially the LATE
A more direct approach which requires the same assumptions as were applied above is to
apply an instrumental variable (IV) estimator where the shift from guideline cell j to j+2 is the
instrument That is offenders in cell j+2 are not inherently more or less recidivistic than are
29
The Relationship between Prison Length of Stay and Recidivism -- This report was prepared by Abt Associates using Federal funding provided by the Bureau of Justice Statistics (BJS) Opinions andor points of view expressed are those of the author(s) and do not necessarily reflect the official position or policies of the US Department of Justice
offenders in cell j but the longer average sentences served by offenders in cell j+2 cause those
offenders to recidivate at a greater or lesser rate than offenders in cell j Instead of a dummy
variable representing membership in cell j or j+2 the important right-hand-side variables is the
average time-served by offenders in cell j and j+213 That is the treatment variable takes one of two
values the average time-served by offenders in cell j (when the observation belongs to cell j) or the
average time-served by offenders in cell j+2 (when the observation belongs to cell j+2) The
advantage of this approach is that parameter estimates have the interpretation of ldquochange in the
relative hazard per additional month of time servedrdquo The disadvantage is that IV estimators lack
desirable asymptotic properties (that is they are biased even in large samples) when applied to a
non-linear model and the Cox regression is a non-linear model (Rhodes 2010) Nevertheless we
expect estimates to be approximate and worth comparing with the RDD estimates
RESULTS
This section has two parts The first part provides descriptive statistics and justification for
deleting cases from the analyses The second section provides estimates of the effect of increasing
time-served on recidivism using the RDD and IV approaches it also provides sensitivity tests for case
deletion and other analytic decisions
DESCRIPTIVE STATISTICS AND RULES FOR DELETING CASES
Table 1 reports the number of offenders available for the analysis before we add restrictions
To be included in this table an offender must meet three criteria First he or she must have been
sentenced under the guidelines because guidelines calculations are used in the analysis Second he
13 This is a two-stage estimation model The first-stage involves a regression of time-served on dummy variables representing the adjacent guideline cells But this regression will simply provide the mean time-served in each cell so we do not actually perform the regression
30
The Relationship between Prison Length of Stay and Recidivism -- This report was prepared by Abt Associates using Federal funding provided by the Bureau of Justice Statistics (BJS) Opinions andor points of view expressed are those of the author(s) and do not necessarily reflect the official position or policies of the US Department of Justice
or she must be a US citizen We cannot follow recidivism by deported offenders And third he or
she must have entered active community supervision following sentencing ndash either probation or a
term of supervised release ndash because active supervision initiates the time at risk of recidivism This
third criterion has two implications If an offender never entered active community supervision that
offender would not appear in the analysis Specifically if an offender was sentenced to prison and
remained in prison as of September 30 2014 that offender would not appear in the analysis Thus
offenders sentenced to long prison terms and especially offenders sentenced toward the end of the
data collection window are more likely to be excluded than are other offenders This systematic
selection will not bias the RDD estimates because any selection bias will be equally applicable to cell j
and cell j+2 That is the RDD implicitly adjusts for the selection bias
Insert Table 1 about here
Shading identifies cells with fewer than 100 observations Although data for the most and
least serious offense levels are sparse the sample sizes for the other cells are ample an important
point because the RDD approach holds criminal history category constant and compares outcomes
for offense serious levels j and j+2 Notice that about half the offenders fall into criminal history
category 1 and given that these are relatively inexperienced offenders a reader might put more
subjective weight on the analysis of offenders in this criminal history category To be included in the
principal analysis a cell must have 100 or more offenders Stripped of some other statistical issues
basically the RDD approach requires a comparison of the mean recidivism rates for cells j and j+2
Because the sampling variance for estimated difference in outcomes between offense seriousness
levels j and j+2 is inversely proportional to the number of offenders in cells j and j+2 setting a
minimum number of observations increases the average precision of estimated effects for those cells
31
The Relationship between Prison Length of Stay and Recidivism -- This report was prepared by Abt Associates using Federal funding provided by the Bureau of Justice Statistics (BJS) Opinions andor points of view expressed are those of the author(s) and do not necessarily reflect the official position or policies of the US Department of Justice
retained in the analysis but we will present sensitivity analyses of the 100-offender criterion
showing the analysis appears insensitive to this criterion
Using the same data applied to produce Table 1 Table 2 reports the percentage of offenders
who receive prison terms by guidelines cell Shading denotes that fewer than 50 of offenders
within a cell are sentenced to prison Prison is often imposed for federal crimes but sentencing
guidelines (and hence this table) are only mandatory for felonies and serious misdemeanors
Additionally many federal crimes are dual jurisdiction offenses and generally the most serious
crimes are prosecuted in federal court while the least serious crimes are prosecuted in state courts
These factors explain why prison terms are so frequent in these data Still prison is infrequent for
offenders convicted of the least serious crimes provided they lack serious criminal records For a cell
to be included in the principal analysis at least 50 of offenders in that cell must have received
prison terms Justification is that for estimating effects the effective sample size is proportional to
the number in the cell multiplied by the percentage sentenced to prison because probation
sentences count as zero for these calculations (Offenders sentenced to straight probation are
assigned prison terms of length zero) However we will provide sensitivity testing of this selection
criterion showing that findings are insensitive to the criterion
Insert Table 2 about here
Inspection of Table 2 shows some irregularities in the progression of sentence severity
especially for the least serious offense levels but the general pattern is that prison terms become
increasingly certain as we look down the table (from least to most serious crimes) and across the
table (from least to most serious offenders) Inspection of Table 3 which reports average time-
served (counting probation as zero) also shows some irregularities but the general pattern is that
32
The Relationship between Prison Length of Stay and Recidivism -- This report was prepared by Abt Associates using Federal funding provided by the Bureau of Justice Statistics (BJS) Opinions andor points of view expressed are those of the author(s) and do not necessarily reflect the official position or policies of the US Department of Justice
average time-served in prison increases as we look down the table (from least to most serious
crimes) and across the table (from least to most serious offenders)
The irregularities cause a problem for the RDD If the RDD compared cells j with j+1 for a
RDD strategy to work we must observe a substantial increase in the average time in prison as we
compare cell j with cell j+1 Logically small changes fail to create a credible contrast Looking
especially at Table 3 several cell j and j+1 contrasts fail to meet this criterion The problem is that
moving from cell j to cell j+1 is a subtle shift and we find a better comparison to be between cell j
and j+2 This is the reason for using a jj+2 comparison instead of a jj+1 comparison Although
comparing cells j and j+2 may raise validity issues whatever bias is introduced is likely to be small
and from a mean-squared-error perspective comparing jj+2 instead of jj+1 seems justified
However as a sensitivity test we also report estimates based on a comparison of cells j and j+1 and
qualitative results prove insensitive to whether the comparison is between jj+1 or jj+2
Insert Table 3 about here
One more table is useful for summarizing the recidivism measure Table 4 reports the
percentage of offenders who recidivate during their periods of community supervision These
statistics are right-hand-censored by the length of the time-at-risk and capped at three years They
do not account for censoring due to supervision terms less than three years Although most
offenders avoid returning to prison returning to prison is not an infrequent occurrence At this
descriptive stage of the analysis patterns may seem peculiar Looking down each column recidivism
rates are lower for offenders incarcerated for the most serious crimes and higher for offenders
incarcerated for the least serious crimes Although as description this pattern is correct the effect is
probably not causal It seems likely that offenders who serve the longest terms are older when
released from prison than are offenders who serve the shortest terms and given that age is
33
The Relationship between Prison Length of Stay and Recidivism -- This report was prepared by Abt Associates using Federal funding provided by the Bureau of Justice Statistics (BJS) Opinions andor points of view expressed are those of the author(s) and do not necessarily reflect the official position or policies of the US Department of Justice
predictive of recidivism the patterns may be partly a result of age Reading across the table
recidivism tends to increase with criminal history but small sample sizes for the most serious
criminal history scores may be responsible for imprecise estimates
Insert Table 4 about here
Intended as a summary of the patterns shown by Table 4 Figure 1 presents survival curves
based on Kaplan-Meier estimates stratified by criminal history categories To be included in this
analysis an offender had to be sentenced within a guideline cell with 100 or more offenders and at
least 50 percent of offenders within that cell must have received prison terms Those restrictions are
consistent with the restrictions imposed for the principal analysis presented later However the
figure changes very little when the restrictions are removed In general as the criminal history
category increases so too does the rate of recidivism although the difference between criminal
history categories 5 and 6 is barely perceptible
Insert Figure 1 about here
Table 5 extends the descriptive analysis appearing in Figure 1 to include covariates (The
table reports parameters from a Cox model not relative hazards) The regression is naiumlve in the
sense that it does not account for potential confounding variables that might ndash if known ndash explain
why recidivism falls as the offense severity level (and hence time-served) increases This regression
uses variables that will reappear in the local linear regressions that we use for the RDD analyses
Separate Cox regressions are reported for each criminal history category
Scaled time-served This is estimated time-served rescaled by dividing the original time-served by
the maximum time-served Time-served is capped at 180 months The cap is
inclusive of more than 99 percent of terms
34
The Relationship between Prison Length of Stay and Recidivism -- This report was prepared by Abt Associates using Federal funding provided by the Bureau of Justice Statistics (BJS) Opinions andor points of view expressed are those of the author(s) and do not necessarily reflect the official position or policies of the US Department of Justice
Time-served squared This is the square of scaled time-served
Scaled age This is the offender age at the time that he or she entered community
supervision rescaled to run from 0 to 1
Age squared This is scaled age squared
Female This is a dummy variable for female
Black This is a dummy variable for Black
Other race This is a dummy variable for race other than White or Black
Hispanic This is a dummy variable for Hispanic ethnicity It is not collinear with the
race variables
High school This is a dummy variable indicating the offender has a high school degree or
equivalent
Advanced degree This is a dummy variable indicating the offender has a degree beyond high
school
Lives alone This is a dummy variable indicating the offender is neither married nor living
in a common law relationship at the time of sentencing
Centered CH points The guidelines assign criminal history points based on criminal records that
are collapsed into the six criminal history categories The criminal history
points are centered to have a mean of zero for each guideline cell
District This is the judicial district where the sentence was imposed There are 94
federal districts including those in territories District enters the analysis
35
The Relationship between Prison Length of Stay and Recidivism -- This report was prepared by Abt Associates using Federal funding provided by the Bureau of Justice Statistics (BJS) Opinions andor points of view expressed are those of the author(s) and do not necessarily reflect the official position or policies of the US Department of Justice
when estimating the frailty parameter that is as a random effect associated
with the Cox model
Because they run from zero to one scaled variables are useful for interpreting quadratics
The centered criminal history points provide a more refined measure of criminal record beyond the
broader criminal history category Centering this score is unimportant for the results presented in
Table 5 but centering is useful for later analyses
Insert Table 5 about here
As description the estimates appearing in Table 5 tell a simple story As best as a quadratic
can capture the pattern recidivism falls as time-served increases after accounting for the criminal
history category The declines are substantial and tend to be greater (but not consistently) for those
with minor criminal records (category 1) than for those with serious criminal records (categories 2-6
exclusive of 5) As an illustration when time-served changes from 30 months to 60 months the
relative hazards from criminal history 1 to criminal history 6 are 081 074 072 075 081 and 077
respectively14
Except regarding age other parameters are less interesting for this current study because
they tell us nothing about how recidivism changes with time-served (Women are less recidivistic
than men Blacks and other races are more recidivistic than Whites Hispanics tend to be less
recidivistic than non-Hispanics The educated are less recidivistic than the under-educated Marital
association appears to have no predictive effect The relative importance of these covariates
appears to decrease as criminal history increases) The inverse relationship between recidivism and
2
180
3060
180180 180
60 3014 For example the relative hazard for criminal history category 1 equals exp 1707
0941
minus+minusminus
2
36
The Relationship between Prison Length of Stay and Recidivism -- This report was prepared by Abt Associates using Federal funding provided by the Bureau of Justice Statistics (BJS) Opinions andor points of view expressed are those of the author(s) and do not necessarily reflect the official position or policies of the US Department of Justice
time-served cannot be explained by age If we were to accept results from this naiumlve regression we
would conclude that longer prison terms cause recidivism to fall dramatically (up to 28 percent for a
30-month increase) but we are reluctant to attach causality to these regression results because we
cannot be sure that all confounding factors have been considered Hence we turn to the RDD
The results reported in Table 5 suggest that marital status does not predict recidivism
Because this variable is frequently missing we drop it from the following analysis The ethnic status
Hispanic sometimes predicts recidivism but the effect is not large and this variable is often missing
Consequently we also drop the ethnic category Hispanic from the following analysis
ESTIMATES OF THE EFFECT THAT INCREASING TIME-SERVED HAS ON
RECIDIVISM
The previous section described data sources and gross patterns in those data This section
presents evidence based on a regression discontinuity design For every jj+2 contrast we compute
a unique effect as a log-relative hazard Potentially this leads to 6x41 effects because there are 41
possible contrasts within each criminal history category and there are 6 criminal history categories
In fact we produce fewer estimates because data selection rules exclude some of the contrasts The
number entering the analysis depends on the sensitivity tests but 175 contrasts appear in the
principal analysis
For each contrast between cells j and j+2 we estimate a Cox survival model15 The effect size
is the parameter associated with a dummy variable coded 1 for cell j+2 and coded zero for cell j The
15 By default we estimated a Cox model with covariates and shared frailty the covariates and criterion for the shared frailty are described in the text Sometimes to estimate the model we removed the shared frailty parameter in which case we estimated the relative hazard using the covariates but not the shared frailty given the RDD the relative hazard is still
37
The Relationship between Prison Length of Stay and Recidivism -- This report was prepared by Abt Associates using Federal funding provided by the Bureau of Justice Statistics (BJS) Opinions andor points of view expressed are those of the author(s) and do not necessarily reflect the official position or policies of the US Department of Justice
outcome measure is returning to prison following placement on community supervision or being
revoked from supervision (When an offender enters community supervision multiple times we only
include the first period of supervision in the analysis) Time at risk is censored by the end of the
study period or by the end of community supervision or at three years if supervision is ongoing after
three years Censoring by the end of community supervision is important because thereafter an
offender cannot return to federal prison unless he or she is convicted of a new federal crime
Fundamentally once an offender successfully completes his term of community supervision the FJSP
no longer tracks his criminality so the study cannot extend beyond the end of community
supervision Occasionally an offender may serve his entire sentence and then commit a new federal
crime Although he or she would reappear in the FJSP we only consider the first conviction
When applying a RDD identification strategy researchers are careful to justify that two
conditions hold Translated into the current setting where we compare outcomes in cell j and j+2
the two conditions are (1) on average time-served in cell j+2 must be greater than time-served in
cell j (2) There must be no other differences between offenders in cells j and j+2 that could account
for differences in recidivism In practice this second condition is difficult to establish By
construction of the guidelines and given the fact that we compare cells j and j+2 along the offense
seriousness dimension and never along the criminal history dimension we are confident this
condition holds Nevertheless an indirect empirical test is whether the guidelines cause offenders in
cell j+2 to look systematically different than offenders in cell j This is testable
By the design of the guidelines we anticipate that variables sometimes associated with
recidivism will have about the same mean values in cell j as in cell j+2 Of course we expect time-
consistent Sometimes to estimate the model we removed both shared frailty and the covariates in which case we estimated the relative hazard with just an indication the data came from cell j rather than j+2 Again given the RDD the estimate of relative hazard is consistent but not efficient If we could not estimate the relative hazard the estimate is reported as missing
38
The Relationship between Prison Length of Stay and Recidivism -- This report was prepared by Abt Associates using Federal funding provided by the Bureau of Justice Statistics (BJS) Opinions andor points of view expressed are those of the author(s) and do not necessarily reflect the official position or policies of the US Department of Justice
served to differ between cell j and cell j+2 and it does by 54 months on average (Plt001) If this
difference were not large there would be little point to the analysis
On average other variables do not change significantly between cell j and j+2 16 We tested
the following variables date of birth educational attainment sex race Hispanic status marital
status date when sentenced and criminal history point score The differences were small and none
approached statistical significance The results for criminal history point score seem especially
important because we consider this variable to be highly correlated with recidivism The fact that
the criminal history point score does not change systematically from cell j to j+2 suggests that
offenders in cell j+2 are not inherently more or less recidivistic than are offenders in cell j Therefore
the data pass this diagnostic test
While the inclusion of covariates may be unnecessary for identification including covariates
in the Cox regression is expected to reduce residual variance and improve the precision of the
estimates As noted the principal variable is a dummy variable coded one if the observation is from
cell j+2 and coded zero if from cell j Other covariates with the noted exceptions are the same as
were used in the naiumlve regression Obviously we have also excluded the scaled time-served variable
and its square Because there are 41x6 possible regressions (175 in this main application) we do not
show the regression results from this stage of the analysis Instead we report the single parameter of
interest (the average effect) for each regression in graphical form
Within each criminal history category the Cox model estimates the hazard of recidivism for
offenders in category j+2 relative to offenders in category j holding covariates constant Using the
16 The change is computed for every jj+2 pair The statistics reported in the texts are a weighted average of those pair comparisons Weights equal the inverse of the sampling variances Because of the distribution of offenses within the guidelines the least serious criminal history categories and the middle of the offense seriousness range dominate the calculations Arguably the estimates are not independent so standard errors are suspect Nevertheless the estimates of differences between cells j and j+2 are not biased and these average differences are small
39
The Relationship between Prison Length of Stay and Recidivism -- This report was prepared by Abt Associates using Federal funding provided by the Bureau of Justice Statistics (BJS) Opinions andor points of view expressed are those of the author(s) and do not necessarily reflect the official position or policies of the US Department of Justice
log-relative hazard (eg the parameter that is exponentiated to get the relative hazard) the next step
is to estimate a regression where the estimated log-relative hazard is the dependent variable and the
independent variable is the centered offense seriousness level This is the meta-regression It is
specific to a criminal history category so there are six meta-regressions This specification allows us
to examine how the log-relative hazard varies over the offense seriousness levels That is the
regressions allow us to combine effects (our main motivation) and test for heterogeneity (a
secondary motivation)
Effects may be heterogeneous across offense seriousness levels for two reasons For one
offenders convicted of the most serious crimes who serve the longest prison terms may respond
differently to incremental increases in the lengths of their terms than do offenders convicted of the
least serious crimes who serve the shortest prison terms For another for offenders convicted of
the most serious crimes the incremental change in the length of a prison term from cell j to j+2 is
much larger than the incremental change for offenders convicted of the least serious crimes (See
Table 3) Heterogeneity in treatment effects seems likely but how that heterogeneity varies with
offense severity level is uncertain Examining Tables 1-3 recalling the selection rules and recalling
that we are using weighted least squares regression to estimate the heterogeneity information used
by the regression comes mostly from the middle offense seriousness levels so incremental changes
to time-served are fairly constant Quite possibly there is heterogeneity but we will have insufficient
power to detect it
As before the analysis is stratified on the criminal history category so for each regression
there are potentially 41 data points but many fewer (29 to 37 in the main analysis) enter the meta-
regression because of selection criteria identified earlier Referring to Tables 1 and 2 almost all the
lost contrasts come from having too few cases per cell or from having a low proportion of prison
40
The Relationship between Prison Length of Stay and Recidivism -- This report was prepared by Abt Associates using Federal funding provided by the Bureau of Justice Statistics (BJS) Opinions andor points of view expressed are those of the author(s) and do not necessarily reflect the official position or policies of the US Department of Justice
terms per cell referring to Table 3 few cells (and hence contrasts) are lost because average prison
terms do not increase from cell j to j+2 Because the RDD identifies the effect the right-hand-side
variables are not control variables rather the meta-regression is a descriptive device (with statistical
implications) helping us to detect possible patterns
Estimation has multiple steps We summarize with an algorithm
1 Select all offenders from criminal history category k = 1
a Select all offenders with offense seriousness levels j = 1 and j = 3 If the jj+2 contrast
does not meet selection criteria increase j by 1 and try again
b It the jj+2 contrast meets the selection criteria estimate a Cox regression where a
dummy variable is coded 1 for offenders in offense seriousness level j+2 and coded 0
for offenders in offense seriousness level j The parameter associated with this
dummy variable is the log-relative hazard for the jj+2 contrast Save this estimate
c Increase j by 1 and repeat steps a-c until j = 41
d Estimate a meta-regression where the dependent variable is the log-relative hazards
from steps a-c The independent variables are a constant and the centered offense
seriousness level equal to j+2 for the jj+2 contrast Save the estimated constant and
its standard error for use in step 3
2 Repeat steps 1a-d for criminal history categories 1-6 This leads to six estimated constants
and six estimated standard errors for step 3
3 For step 3 create weights proportional to the inverse of the squares of the six standard
errors The final estimate is the weighted average of the six estimated constants This is
interpreted as the average log-relative hazard Results are discussed below
41
The Relationship between Prison Length of Stay and Recidivism -- This report was prepared by Abt Associates using Federal funding provided by the Bureau of Justice Statistics (BJS) Opinions andor points of view expressed are those of the author(s) and do not necessarily reflect the official position or policies of the US Department of Justice
MAIN RESULTS
The main model adopts the following selection criteria
bull For a guideline cell to be included in the analysis 100 or more offenders must appear within that cell
bull For a guideline cell to be included in the analysis 50 or more of offenders must have received prison terms
Comparisons are of outcomes in cell j+2 and cell j
The main results are shown in Figure 2 The figure shows patterns in the relative hazards and
associated statistics The figure has six panels one for each of the criminal history categories
Within each panel the vertical axis is the scale for the relative hazard as estimated by the Cox model
A hazard equal to 1 implies that increasing prison time has a neutral effect on recidivism A hazard
greater than 1 implies that increasing prison time increases recidivism a hazard less than 1 implies
that increasing prison time decreases recidivism The horizontal axis corresponds to the contrast
The offense seriousness level of 3 is the contrast between offense seriousness levels 1 and 3 the
offense seriousness level of 4 is the contrast between levels 2 and 4 and so on until level 43 Within
each panel the dots report the relative hazards as estimated using the Cox model When we could
not estimate the relative hazard because of the cell exclusion criteria the point is missing The
vertical lines surrounding the dots are 95 confidence intervals for the relative hazards They are
non-symmetric and when the confidence interval extends above 25 it is truncated at 25 for
improved resolution of the figures The three lines running left to right come from the regression
the straight line shows the prediction and the curved lines represent a 95 confidence interval for
the regression line ndash not to be confused with a 95 confidence interval for a predicted point
explaining why many points fall outside the confidence interval for the regression
Insert Figure 2 about here
42
The Relationship between Prison Length of Stay and Recidivism -- This report was prepared by Abt Associates using Federal funding provided by the Bureau of Justice Statistics (BJS) Opinions andor points of view expressed are those of the author(s) and do not necessarily reflect the official position or policies of the US Department of Justice
The table below the figure shows associated statistics from the meta-regression Recall the
dependent variable is the parameter associated with the log-relative hazard ndash that is the natural
logarithm of the relative hazard The row specified as ldquolinearrdquo identifies the centered offense
severity level variable entering the weighted least squares meta-regression The simple regression
specification has a constant and a term that is linear in the centered offense severity level Because
the estimator is weighted least squares and given the offense severity level is centered the constant
is the weighted average effect across the contrasts It is our principal interest R2 has its usual
interpretation but note that any ldquoexplained variancerdquo is attributable to the linear trend because we
are most interested in the constant R2 is not an especially important statistic and certainly has no
interpretation as the ldquogoodness of fitrdquo for our purposes because the constant does not contribute to
R2 At a maximum the regression would be based on 41 observations (N in the table) but fewer data
points enter the analysis because (as already discussed) we discarded contrasts that failed to meet
predetermined criteria
The table below the figure requires some additional explanation Recall the right-hand-side
variable was centered so the constant can be interpreted as an average A constant of zero is
neutral implying that on average additional prison time neither increases nor decreases recidivism
A positive constant implies that additional prison time increases recidivism a negative constant
implies that additional prison time decreases recidivism Converting these constants into a hazard
metric just requires exponentiation Letting α be the constant exp(α) is the relative hazard Letting
σ2 represent the constantrsquos estimated sampling variance by the delta rule the estimated sampling
variance for the hazard is exp(α)2 σ2 These transformations are employed when drawing Figure 2
Examining the table below Figure 2 the constant is negative and statistically significant in all
six regressions On average the estimated constant equals -0073 and is statistically significant with a
43
The Relationship between Prison Length of Stay and Recidivism -- This report was prepared by Abt Associates using Federal funding provided by the Bureau of Justice Statistics (BJS) Opinions andor points of view expressed are those of the author(s) and do not necessarily reflect the official position or policies of the US Department of Justice
standard error of 0007 The implied hazard is 0930 These are the inverse-variance weighted
estimates across the six criminal history categories The linear slopes have mixed signs and are never
statistically significant so we detect no heterogeneity
We must be caution about this interpretation Suppose as suggested by the evidence the
relative hazards are the same for all criminal history categories Looking at table 3 the average
increase in time-served for a move from cell j to j+2 is about 7 months for criminal history category 1
and about 10 months for criminal history category 6 Thus a somewhat larger increase in time-
served for more serious criminal history categories achieves about the same effect as a somewhat
smaller increase in time-served for less serious criminal history categories This might be taken as
some evidence of criminal history heterogeneity but if so the evidence is not especially compelling
Outliers are a potential concern in Figure 2 However when an outlier appears it is
associated with a high standard error and plays a small role in the weighted least squares regression
Therefore we conclude that outliers are not a practical concern
On average the estimated relative hazard that results from moving from cell j to cell j+2 is
0930 Qualitatively a relative hazard less than 1 implies that a longer prison term decreases
recidivism but translating this relative hazard into a quantitative decrease in the probability of
recidivism is complicated because the decrease in the probability of recidivism varies across the jj+2
comparisons A descriptive summary provides some intuition
First continue to consider the relative hazard as a metric On average across the severity
levels and the criminal history categories moving from cell j to cell j+2 increases time-served by
about 27 (On average this 27 change equals about 54 months) This is to say that a 27
increase in the length of incarceration appears to reduce the instantaneous probability of recidivism
(eg the hazard) by less than 10 percent For readers who are familiar with interpreting hazards a
44
The Relationship between Prison Length of Stay and Recidivism -- This report was prepared by Abt Associates using Federal funding provided by the Bureau of Justice Statistics (BJS) Opinions andor points of view expressed are those of the author(s) and do not necessarily reflect the official position or policies of the US Department of Justice
sizable increase in prison time (namely a 27 increase on average) has a fairly small decrease in the
relative hazard (by a multiple of 0930) Admittedly the descriptive term fairly small is subjective
and a reader can make his or her own subjective assessment
A change in the instantaneous probability of recidivism ndash the relative hazard ndash is not the
same as a change in the probability of recidivism Second then consider the probability of
recidivism as a metric We can get a sense of how a change in the relative hazard affects the
probability of recidivism Because we are using the Cox model the probability of recidivism equals
one minus the baseline survival rate to the power of the relative hazard (Hosmer Lemeshow amp May
2008 p 72) For our data the probability of recidivism is about 02 within three years (See figure
1) The relative hazard is about 0930 So a 27 increase in the length of incarceration would
decrease the probability of recidivism by about 02 ndash (1-080930) That is from a base rate of
recidivism of about 20 a 27 increase in prison time would cause recidivism to fall to about 187
Readers can draw their own conclusions but our sense is the effect is not large and that prison
length of stay has a largely neutral effect on recidivism
Once again some caution is merited If we again accept the relative hazards are about the
same across the six criminal history categories figure 1 shows the baseline rates of recidivism are
progressively higher as the criminal history category increases from k=1 to k=6 so the percentage
change in recidivism is larger for more serious criminal history categories than for the lesser criminal
history categories This might be deemed heterogeneity ndash that increasing time-served has a larger
effect on the most serious offenders We are reluctant to accept such a conclusion because it comes
from accepting the null hypothesis of constant relative hazards across the criminal history categories
More likely if such heterogeneity exists we have too little power to detect its effect
45
The Relationship between Prison Length of Stay and Recidivism -- This report was prepared by Abt Associates using Federal funding provided by the Bureau of Justice Statistics (BJS) Opinions andor points of view expressed are those of the author(s) and do not necessarily reflect the official position or policies of the US Department of Justice
It is possible to stratify the analysis by sex by race and by education ndash variables described
earlier Cell sizes get small so we restrict the analysis to offenders in criminal history category 1 and
we require a minimum of 50 offenders per cell rather than 100 For men the relative hazard is
0935 and for women it is 0931 but these differences are not statistically significant so we fail to
reject the null that prison length has the same effect on men and on women For white offenders
the relative hazard is 0936 and for black offenders the relative hazard is 0932 and the difference is
not statistically significant so we fail to reject the null that prison length has the same effect on
white and black offenders For offenders who lack high school degrees the relative hazard is 0930
and for offenders who have high school degrees the relative hazard is 0933 The difference is not
statistically significance This test based on education is not as sensitive as desired because most
offenders have high school degrees or the equivalent Overall we do not find strong evidence the
effect of time-served on recidivism is sensitive to sex race or education
We observed that an IV estimator should lead to estimates that are like the RDD estimates
We demonstrate that here The only difference between the IV and RDD approaches is that for the
IV approach the treatment variable is the mean time-served in cell j+2 or j and for the RDD
approach the treatment variable is a dummy variable denoting sentencing in cell j+2 rather than cell
j17 Interpretations differ For the IV approach the treatment effect is the change in recidivism per
month of additional time-served for the RDD approach the treatment effect is the change in
recidivism from being sentenced in cell j+2 rather than cell j These differences are scale effects we
do not expect then to change substantive interpretations
17 Instrumental variable estimation often uses a two-step approach In the first step the treatment variable (here the time served) is regressed on the instrument (and perhaps some additional variables) to predict the treatment (or in our case the average time-served) In the second step the average time-served replaces the observed time-served We compute average time-served without using the first-step regression
46
The Relationship between Prison Length of Stay and Recidivism -- This report was prepared by Abt Associates using Federal funding provided by the Bureau of Justice Statistics (BJS) Opinions andor points of view expressed are those of the author(s) and do not necessarily reflect the official position or policies of the US Department of Justice
Figure 3 reports results from the IV estimation Across the six criminal history categories the
weighted average effect size is -00122 which is statistically significant at P lt 001 While this effect
seems much smaller than the effect based on the RDD when we multiple by the average increase in
time-served between cell j and j+2 the rescaled effect is -0066 and relative hazard of a 54 month
increase in the sentence is 0936 There is no material difference between the RDD estimator and
the RDD estimator
Insert Figure 3 about here
SENSITIVITY TESTING
We conducted sensitivity tests evaluating whether the effect of length of stay on recidivism
depends on constraints we applied to produce the results shown in Figure 2 and its associated table
Minimum Cell Size of 50 instead of 100 - Figure 4 A first step in sensitivity testing is to learn
whether requiring a minimum of 50 cases instead of 100 cases per cell changes findings The
advantage to relaxing this assumption is that we gain a few data points The disadvantage is that
some of those new data points have extreme values As before the constant is always negative and
statistically significant The weighted average is -0073 with a standard error of 0007 and the
implied relative hazard is 0930 Because we use weighted least squares results do not change much
from those reported for the main model despite the expansion of sample size estimates with large
standard errors do not contribute much to the regression
Insert Figure 4 about here
Minimum cell size of 150 instead of 100 ndash Figure 5 If we set a criterion of 150 cases per cell instead
of 100 we lose a few data points The constant remains negative and statistically significant across
the six criminal history categories Overall the average constant is -0071 (with a standard error
47
The Relationship between Prison Length of Stay and Recidivism -- This report was prepared by Abt Associates using Federal funding provided by the Bureau of Justice Statistics (BJS) Opinions andor points of view expressed are those of the author(s) and do not necessarily reflect the official position or policies of the US Department of Justice
0008) and the corresponding relative hazard is 0931 Apparently the findings are insensitive to the
criterion for cases per cell because the weighted least squares analysis is dominated by calculations
that are based on large cell sizes For the remaining sensitivity tests we set the minimum cell size to
100
Insert Figure 5 about here
Minimum percentage of prison terms 75 instead of 50 - Figure 6 The next sensitivity test
changes the criterion for minimum percentage of prison terms to be 75 within a cell rather than
50 within a cell As expected some cells are excluded from the analysis but as before the
substantive findings do not much change The average affect is -0077 with standard error of 0009
The increased standard error is understandable Given the RDD basically calls for a difference in
mean estimates between cells j and j+2 (conditional on covariates) the effective sample size for
computing variances is the number of offenders within a cell multiplied by the proportion who are
sentenced to prison Cells with high proportions of offenders serving probation terms have high
sampling variances for two reasons (1) The effective sample size is smaller than the apparent sample
size based on the number of offenders within a cell (2) The average difference in time-served
between cells j and j+2 tends to be small (so the effect is small and has high sampling variance) for
those cells where probation is especially likely Consequently given the regressions use weights that
are inversely proportional to the sampling variance the estimates are insensitive to the criterion
establishing a minimum proportion of offenders sentenced to prison
Insert Figure 6 about here
Contrasts that are j and j+1 instead of j and j+2 ndash Figure 7 We believe that contrasts observed by
comparing cells j and j+2 are more appropriate for this analysis than contrasts observed by
comparing cells j and j+1 because the contrast between j and j+2 provides assurance that average
48
The Relationship between Prison Length of Stay and Recidivism -- This report was prepared by Abt Associates using Federal funding provided by the Bureau of Justice Statistics (BJS) Opinions andor points of view expressed are those of the author(s) and do not necessarily reflect the official position or policies of the US Department of Justice
prison terms increase by a substantial amount This assurance is not forthcoming when comparing
cells j and j+1 Nevertheless increasing the distance between compared cells raises validity
challenges because the RDD rests on an assumption that offenders within both compared cells are
alike in ways that affect recidivism The closer the cells the more justified the assumption For this
sensitivity test we maintain the original criteria for selecting cells but contrast cell j with cell j+1
(We discard contrasts where the average sentence in cell j+1 is less than the average sentence in cell
j) Averaged across the six estimates the estimated constant is -0030 with a standard error of 0013
This is statistically significant at P lt 005 The relative hazard is 0970 While results from the jj+1
contrasts are smaller than those from the jj+2 contrasts this is expected because the jj+2 contrast
results in a larger increase in time-served and consequently a larger effect
Insert Figure 7 about here
Contrasts testing for auto-correlation using the Prais-Winston estimator ndash Figure 8 The analysis
immediately above which changed the comparison from cells jj+2 to cells jj+1 suggests another
sensitivity test Earlier we commented that by construction we may have induced autocorrelation in
the data used for the final step regression For example consider the estimated hazard for cells j and
j+1 and the estimated hazard for cells j+1 and j+2 The estimates have j+1 in common and this may
introduce first-order autocorrelation into the analysis Following recommendations from Greene we
have elected to ignore this complication because commonly used corrections have uncertain small
sample properties However we can test how much the autocorrelation affects the results using a
Prais-Winston estimator a feasible generalized least squares estimator that corrects for first-order
autocorrelation
Insert Figure 8 about here
49
The Relationship between Prison Length of Stay and Recidivism -- This report was prepared by Abt Associates using Federal funding provided by the Bureau of Justice Statistics (BJS) Opinions andor points of view expressed are those of the author(s) and do not necessarily reflect the official position or policies of the US Department of Justice
A problem when using the Prais-Winston estimator is that we cannot simultaneously adjust
for autocorrelation and heteroscedasticity To correct estimated standard errors we can employ a
robust covariance estimator but this is problematic in two ways First without adjusting for
heteroscedasticity during parameter estimation the solution is inefficient because the data points
with large standard errors receive the same weight as the data points with low standard errors
Figure 2 suggests the inefficiency can be large Second the Prais-Winston estimator assumes
homoscedasticity but we know that our data are heteroscedastic To deal with this problem we
adopt restrictions (1) There must be 150 observations per cell and (2) at least 75 of offenders
within any cell must receive prison terms The idea is to minimize heteroscedasticity and we have
already seen that imposing these restrictions has little effect on results Allowing the contrast to be
jj+1 which may cause a one-lag autocorrelation we use a Prais-Winston estimator to estimate the
effects
The sensitivity test is encouraging The estimates for ρ the autocorrelation efficient have
mixed signs We take this wide variation in the estimates of ρ to mean the estimates are imprecise
Apparently provided we restrict estimates to cells with enough offenders we induce modest
autocorrelation and our decision to ignore autocorrelation seems justified Second basing the
results on the Prais-Winston estimator does not make a big difference in the findings The average
value for the constant is -0042 with a standard error of 0008
Separating contrasts into independent sets ndash Tables 6 and 7 Another approach to dealing with
autocorrelation is straightforward and can be performed with the jj+2 contrasts and both the 100
observations per cell criterion and the 050 prison sentence criterion To explain consider the
contrasts based on cells 13 24 35 46 57 and so on The contrasts 13 and 24 are
independent and the contrast 35 and 46 are independent but the contrasts 13 and 35 are not
50
The Relationship between Prison Length of Stay and Recidivism -- This report was prepared by Abt Associates using Federal funding provided by the Bureau of Justice Statistics (BJS) Opinions andor points of view expressed are those of the author(s) and do not necessarily reflect the official position or policies of the US Department of Justice
independent because they both rely on cell 3 A solution is to break the analysis into two parts In
the first part we use the contrasts 13 24 57 68 and so on in the second part we use the
contrasts 35 46 79 810 and so on For each analysis the effects can be averaged across the
criminal history categories and then across the two analyses For the first analysis the effect is -
0034 with a standard error of 0018 For the second analysis the effect is -0106 with a standard
error of 0030 significant at p lt 001 The average effect is -0067 with a standard error of 0018
Recalling the effect from the main analysis was -0073 with a standard error of 0007 these new
results are very close even though they are based on a different weighting scheme (a result of
running two regressions instead of one) As with the previous test we take this sensitivity test as
evidence that provided we restrict the effective number of observations per cell results are
insensitive to autocorrelation
Insert Table 6 and Table 7 about here
Entering prison as recidivism ndash Figure 9 An additional sensitivity test returns to the original model
specification whose results were presented in Figure 2 and changes the definition of recidivism from
ldquoentering prison or being revoked from community supervisionrdquo to ldquoentering prisonrdquo We are unsure
of the best definition of recidivism but it appears the definition does not much matter The
estimated effects are about the same The log-relative hazard is -0076 with a standard error of
0007 the relative hazard is 0927 The rate of recidivism is about 20 percent using the
comprehensive definition of returning to prison or being revoked and slightly less than 19 percent
when using the more restrictive definition of returning to prison so consistency between the main
results and results from this sensitivity test is not surprising
Insert Figure 9 about here
51
The Relationship between Prison Length of Stay and Recidivism -- This report was prepared by Abt Associates using Federal funding provided by the Bureau of Justice Statistics (BJS) Opinions andor points of view expressed are those of the author(s) and do not necessarily reflect the official position or policies of the US Department of Justice
Eliminating drug law offenders from the analysis ndash Figure 10 A final analysis recognizes that drug
law violations are somewhat peculiar to the federal system High-level drug dealing is often dealt
with in the federal system because cross-border drug dealing is a federal law enforcement
responsibility the federal government has more resources for dealing with high-level drug dealing
than do state governments and even when state and federal authorities collaborate federal
prosecution is typical because federal sentences are more severe18 Judges frequently sentence
high-level drug dealers to Congressionally-mandated mandatory minimums so for high-level drug
dealers the guidelines operate differently than described earlier Another sensitivity test results
from removing drug-law violators from the analysis
Insert Figure 10 about here
With the removal of drug-law violations fewer cells enter the analysis but the parameter estimates
do not change much so qualitative conclusions do not change The average effect is -0060 with a
standard error of 0008 This is statistically significant at plt001 Dropping drug law violators does
not alter conclusions
Eliminating covariates from the analysis ndash Figure 11 Reviewers of an earlier version of this study
wondered if findings based on Cox regressions with no covariates would be the same as findings
based on Cox regressions with covariates After eliminating covariates the weighted average effect
is -0073 with a standard error of 0008 Removing covariates has caused the standard error to
increase by about 10 but has not altered substantive conclusions This is sensible The covariates
were unnecessary for identification but they have the potential to reduce standard errors
18 This assertion is based on the authorsrsquo extensive experience performing program reviews for High Intensity Drug Trafficking Areas multijurisdictional drug task forces with federal state and local participation Our team has visited all 28 HIDTAs over a five-year period The assertion made in the text is based on those visits
52
The Relationship between Prison Length of Stay and Recidivism -- This report was prepared by Abt Associates using Federal funding provided by the Bureau of Justice Statistics (BJS) Opinions andor points of view expressed are those of the author(s) and do not necessarily reflect the official position or policies of the US Department of Justice
Figure 11 about here
Using the Earlier Guidelines ndash Figure 12 Reviewers of an earlier version of this study also observed
that guidelines have changed over the period of this study and expressed concern that these changes
may affect conclusions We doubt these changes matter because cell j+2 has always had longer
terms than cell j Nevertheless in response to reviewersrsquo concerns we identify the mean date for
guidelines entering the analysis and we perform the analysis on just those offenders sentenced
under the guidelines prior to that mean date The effect is ndash 0088 with a standard error of 0009
The relative hazard is 0916 It seems unlikely that changes to the guidelines account for findings
Figure 12 about here
Examining offenders sentenced during the earlier years provides another implicit diagnostic test
Because the analysis is based on offenders who completed their prison terms and were released to
community supervision offenders with high offense seriousness scores or high criminal history
scores and therefore long prison terms are unlikely to enter they analysis when sentenced close to
the data collection period Any resulting bias is lessened by restricting the analysis to offenders
sentenced during the early part of the data collection period If there is a selection bias it does not
appear to be serious
Summarizing the sensitivity testing From the principal analysis the estimated average effect across
the six criminal history categories was -0073 with a standard error of 0007 Provided we contrast
outcomes in cells j and j+2 results do not much change over sensitivity tests and even when we
contrast outcomes in cells j and j+1 results conform with expectations
53
The Relationship between Prison Length of Stay and Recidivism -- This report was prepared by Abt Associates using Federal funding provided by the Bureau of Justice Statistics (BJS) Opinions andor points of view expressed are those of the author(s) and do not necessarily reflect the official position or policies of the US Department of Justice
DISCUSSION
The effect of prison length of stay on recidivism has implications for both theory and policy
From a theoretical perspective incarceration is a potentially transformative event experienced
during an offenderrsquos life course This study provides no evidence that an offenderrsquos criminal
trajectory is negatively affected ndash that is that criminal behavior is accelerated ndash by the length of an
offenderrsquos prison term If anything longer prison terms modestly reduce rates of recidivism beyond
what is attributable to incapacitation This ldquotreatment effectrdquo of a longer period of incarceration is
small The three-year base rate of 20 recidivism is reduced to 187 when prison length of stay
increases by an average of 54 months We are inclined to characterize this as a benign close to
neutral effect on recidivism From a policy perspective prison length of stay can be reduced without
incurring a large increase in recidivism
All observational studies come with validity challenges Still a regression discontinuity
design is a strong quasi-experimental design and we have argued the guidelinesrsquo structure satisfies
the assumptions of an RDD We conducted many sensitivity tests to assess the robustness of the
results The findings require qualification Because of limitations in the bandwidth of an RDD design
we are unable to examine how long prison terms (say five years) affect recidivism relative to
relatively short terms (say two years) The logic of the RDD forces us to compare prison terms of
length L relative to prison terms that are about 27 longer While this is a limitation in the
application of the RDD design it seems unlikely that Congress or the US Sentencing Commission
would reduce terms by a large percentage but not inconceivable that they might reduce prison
terms by a small percentage Thus these findings ndash limited to small changes in prison terms ndash have
implications for sentencing reform
54
The Relationship between Prison Length of Stay and Recidivism -- This report was prepared by Abt Associates using Federal funding provided by the Bureau of Justice Statistics (BJS) Opinions andor points of view expressed are those of the author(s) and do not necessarily reflect the official position or policies of the US Department of Justice
A secondary goal of this research was to examine potential heterogeneity in the effects of
prison length of stay To evaluate heterogeneity we examine whether exogenous covariates
moderate the effect of length of stay Neither offense seriousness nor criminal history moderate the
effect of prison length of stay In the context of federal sentencing these would be two of the most
important potential moderators of prison length of stay The Sentencing Reform Act of 1984
precludes federal judges from using demographic factors in assigning sentences even if these are
empirical moderators of the effect of prison length of stay We also found the effect of time-served
on recidivism was invariant with respect to sex race and education
One class of moderators suggested by Mears Cochran and Cullen (2014) is the level of post-
release supervision In many state jurisdictions a sizable number of offenders are released without
supervision For those released to supervision the level of community control and surveillance is
usually commensurate to risk This source of heterogeneity is limited in the federal context because
everyone receives a term of post-release supervision We censored anyone whose supervision ended
prior to the end of the three-year follow-up period Post-release supervision is also a potential source
of bias as suggested by Roodman but we could eliminate this potential artifact because everyone in
our sample received a term of post-release supervision and they were censored when that term
ended
Some additional caveats are applicable First the results apply to adults Rarely appearing in
federal court juveniles are excluded from the analysis Second we offer no comparison between
adult offenders sentenced to prison rather than probation Third although there is considerable
overlap between federal and state crimes jurisdictional differences cause federal crimes to differ
from state crime counterparts so the relationship between prison terms and recidivism at the state
level may differ from the relationship at the federal level These are important inter-jurisdictional
55
The Relationship between Prison Length of Stay and Recidivism -- This report was prepared by Abt Associates using Federal funding provided by the Bureau of Justice Statistics (BJS) Opinions andor points of view expressed are those of the author(s) and do not necessarily reflect the official position or policies of the US Department of Justice
differences but by removing offenders who were deported or transferred to other authorities we
have made the federal offenders look more like state offenders and when we exclude high-level
drug traffickers results do not much change Furthermore federal jurisdiction is national while
state jurisdictions are local so a study based on national data has a stronger claim to generalizability
It is difficult to see how federal and state crimes are so different that criminologist can disregard
these findings A further limitation of our findings is that they apply only to offenders who receive a
term of community supervision after their release May states have offenders who receive no such
post-release supervision
While some scholars might consider the federal system unique and our results limited to
federal offenders there are many structural differences among states that often preclude
generalizations beyond a specific state as well Even if these findings are not generalizable to state
jurisdictions the federal prison population is about 12 percent of all incarcerated offenders and
represents a significant public policy concern
As we mentioned the RDD framework only allows us to examine relatively small increments
in time-served ndash about 54 months on average Although these are small relative changes these are
not small absolute changes Five additional months in prison is a serious disruption of an offenderrsquos
life and the associated cost savings of a five-month reduction in federal prison length of stay would
save substantial capital and operational costs We make a back-of-the-envelope estimate of potential
savings in prison beds The current average federal prison length of stay for federally sentenced
prisoners is about 35 months A reduction of 5 months in a steady state system would reduce the
prison population over time by 15 percent Given the current Bureau of Prisons inmate population of
195000 a 15 percent reduction would save 29000 beds Under this scenario the BOP could close
prisons rather than simply reduce the prison population in each of its facilities saving both
56
The Relationship between Prison Length of Stay and Recidivism -- This report was prepared by Abt Associates using Federal funding provided by the Bureau of Justice Statistics (BJS) Opinions andor points of view expressed are those of the author(s) and do not necessarily reflect the official position or policies of the US Department of Justice
operational and maintenance costs This back-of-the-envelope calculation shows that small
decrements in length of stay can have large impacts when they are not confined to select subgroups
of offenders
Amplifying this latter point one of the advantages to evaluating prison length of stay is that
any change will have a broad impact on the entire incarcerated population Most contemporary
reforms such as those found in states which implemented the Justice Reinvestment Initiative (JRI)
seek to move the least serious offenders convicted of the least serious crimes from prison to
community corrections (La Vigne et al 2014) Low-level offenders are a very small proportion of
federal prison stocks and based on tabulations from the National Corrections Reporting Program
they are also a small proportion of state prison stocks A policy shift that reduces the length of all
federal prison terms by 27 percent would reduce the federal prison stock by about 29000 inmates
without unduly harming public safety This policy change would have a bigger impact on the federal
prison population than diverting offenders with low offense seriousness and minor or no criminal
history
Prisons are expensive and reducing prison stays has the potential to save public expenditures
(La Vigne et al 2014) Nevertheless advocates of general deterrence and incapacitation might
argue that maintaining or even increasing the length of prison stays is worth the additional expense
and at least increasing prison stays will not make offenders any more criminogenic Nagin et al
(2009) propose a theoretical model that frames these questions distinguishing between high and low
sanction regimes Higher sanction regimes have a higher probability of imprisonment and longer
length of stay than low sanction regimes This model specifies relationships between these relative
regimes the size of the prison populations sizes of the populations with and without a prison record
and the underlying crime rate The model provides a framework for addressing the interrelationship
57
The Relationship between Prison Length of Stay and Recidivism -- This report was prepared by Abt Associates using Federal funding provided by the Bureau of Justice Statistics (BJS) Opinions andor points of view expressed are those of the author(s) and do not necessarily reflect the official position or policies of the US Department of Justice
among these factors without precisely specifying how the outputs change under the low and high
sanction regimes It is straightforward to postulate that high sanction regimes will produce more
people with criminal records however the impact of a high sanction regime on the crime rate is
uncertain High sanction regimes may preclude more crime through general deterrence but may
increase crime if imprisonment is criminogenic not just for the individual but for the prisonerrsquos
family and the community (NRC 2014) The marginal effects and the sizes of the subpopulations
affected will determine the impact on crime rates If we could analyze all the system dynamics of this
model simultaneously we could optimize the level of sanctions to minimize the crime rate In the
absence of such a comprehensive model policy goals should be circumscribed If length of stays
were reduced incrementally it is hard to see how this would have more than a minor effect on crime
through any general deterrent mediated impact and from our results through any criminogenic
impact on the offender
Savings from reduced prison usage can be diverted into evidence-based programs that
reduce offending but such diversion is unlikely as most JRI states have put savings into other non-
justice programs (La Vigne et al 2014) Even if these funds are diverted to other social welfare
programs higher education or other state and local needs we would expect a net social welfare
benefit
58
The Relationship between Prison Length of Stay and Recidivism -- This report was prepared by Abt Associates using Federal funding provided by the Bureau of Justice Statistics (BJS) Opinions andor points of view expressed are those of the author(s) and do not necessarily reflect the official position or policies of the US Department of Justice
REFERENCES
Andrews D A and James Bonta 2006 The Psychology of Criminal Conduct 4th ed Cincinnati Anderson Pub
Andrews D A Ivan Zinger Robert D Hoge James Bonta Paul Gendreau and Francis T Cullen 1990 Does Correctional Treatment Work A Clinically Relevant and Psychologically Informed Meta-Analysis Criminology 28 (3) 369ndash404 doi101111j1745-91251990tb01330x
Angrist Joshua D 2006 Instrumental Variables Methods in Experimental Criminological Research What Why and How Journal of Experimental Criminology 2 (1) 23ndash44 doi101007s11292-005-5126-x
Becker Gary S 1968 Crime and Punishment An Economic Approach Journal of Political Economy 76 (2) 169ndash217 doi101086259394
Berecochea John E and Dorothy R Jaman and Welton A Jones 1981 Time Served in Prison and Parole Outcome - An Experimental Study Report Number 2 Sacramento
Berk Richard 2010 Recent Perspectives on the Regression Discontinuity Design Essay In Handbook of Quantitative Criminology eds Alexis Russell Piquero and David Weisburd New York Springer
Berk Richard A and David Rauma 1983 Capitalizing on Nonrandom Assignment to Treatments A Regression-Discontinuity Evaluation of a Crime-Control Program Journal of the American Statistical Association 78 (381) 21ndash27 doi10108001621459198310477917
Berk Richard A and Jan De Leeuw 1999 An Evaluation of Californias Inmate Classification System Using a Generalized Regression Discontinuity Design Journal of the American Statistical Association 94 (448) 1045ndash52 doi10108001621459199910473857
Berk Richard Geoffrey Barnes Lindsay Ahlman and Ellen Kurtz 2010 When Second Best Is Good Enough A Comparison between a True Experiment and a Regression Discontinuity Quasi-Experiment Journal of Experimental Criminology 6 (2) 191ndash208 doi101007s11292-010-9095-3
Berube Danton and Donald P Green 2007 The Effects of Sentencing on Recidivism Results from a Natural Experiment Ms The Effects of Sentencing on Recidivism Results from a Natural Experiment New Haven
Bloom Howard S 2012 Modern Regression Discontinuity Analysis Journal of Research on Educational Effectiveness 5 (1) 43ndash82 doi101080193457472011578707
Bor J Moscoe E Mutevedzi P Newell M amp Barnighausem T (2014) Regression Discontinuity Designs in Epidemiology Epidemiology 25(5) 729-737
59
The Relationship between Prison Length of Stay and Recidivism -- This report was prepared by Abt Associates using Federal funding provided by the Bureau of Justice Statistics (BJS) Opinions andor points of view expressed are those of the author(s) and do not necessarily reflect the official position or policies of the US Department of Justice
Boshier R and D Johnson 1974 Does Conviction Affect Employment Opportunities British Journal of Criminology 14 264ndash68
Braithwaite John 1989 Crime Shame and Reintegration Cambridge Cambridge University Press
Cameron Adrian Colin and P K Trivedi 2005 Microeconometrics Methods and Applications Cambridge Cambridge University Press
Carroll Leo 1988 Hacks Blacks and Cons Race Relations in a Maximum Security Prison Prospect Heights IL Waveland Press
Cattaneo Matias D Rociacuteo Titiunik Gonzalo Vazquez-Bare and Luke Keele 2016 Interpreting Regression Discontinuity Designs with Multiple Cutoffs The Journal of Politics 78 (3) doi101086686802
Chen M Keith and Jesse M Shapiro 2007 Do Harsher Prison Conditions Reduce Recidivism A Discontinuity-Based Approach American Law and Economics Review 9 (1) 1ndash29 doi101093alerahm006
Clemmer Donald 1940 The Prison Community Boston The Christopher Publishing House
Cook Thomas D 2008 lsquoWaiting for Life to Arriversquo A History of the Regression-Discontinuity Design in Psychology Statistics and Economics Journal of Econometrics 142 (2) 636ndash54 doi101016jjeconom200705002
Cullen Francis T Cheryl Lero Jonson and Daniel S Nagin 2011 Prisons Do Not Reduce Recidivism The High Cost of Ignoring Science The Prison Journal 91 (3 Suppl) doi1011770032885511415224
Deschenes Elizabeth Piper Susan Piper and Joan Petersilia 1995 Intensive Community Supervision in Minnesota A Dual Experiment in Prison Diversion and Enhanced Supervised Release Santa Monica CA RAND Corporation
DiNardo John and David S Lee 2010 Program Evaluation and Research Designs Essay In Handbook of Labor Economics eds Orley Ashenfelter and David Card Vol 4A Elsevier
Drago Francesco Roberto Galbiati and Pietro Vertova 2009 The Deterrent Effects of Prison Evidence from a Natural Experiment Journal of Political Economy 117 (2) 257ndash80 doi101086599286
Fleisher Mark S 1989 Warehousing Violence Newbury Park CA Sage Publications
Gaes Gerald G William D Bales and Samuel J A Scaggs 2016 The Effect of Imprisonment on Recommitment An Analysis Using Exact Coarsened Exact and Radius Matching with the Propensity Score Journal of Experimental Criminology 12 (1) 143ndash58 doi101007s11292-015-9251-x
Gaes Gerald G and Scott D Camp 2009 Unintended Consequences Experimental Evidence for the Criminogenic Effect of Prison Security Level Placement on Post-Release Recidivism Journal of Experimental Criminology 5 (2) 139ndash62 doi101007s11292-009-9070-z
60
The Relationship between Prison Length of Stay and Recidivism -- This report was prepared by Abt Associates using Federal funding provided by the Bureau of Justice Statistics (BJS) Opinions andor points of view expressed are those of the author(s) and do not necessarily reflect the official position or policies of the US Department of Justice
Gaes Gerald G Timothy J Flanagan Laurence L Motiuk and Lynn Stewart 1999 Adult Correctional Treatment Essay In Crime and Justice a Review of Research Prisons eds Michael Tonry and Joan Petersilia 76361ndash426 Chicago University of Chicago Press
Gendreau Paul Paula Smith and Sheila French 2008 The Theory of Effective Correctional Intervention Empirical Status and Future Directions Essay In Taking Stock The Status of Criminological Theory Advances in Criminological Theory eds T Francis FT Cullen JP Wright and KR Blevins Vol 15 New Brunswick NJ Transaction
Gendreau Paul Claire Goggin and Francis T Cullen 1999 The Effects of Prison Sentences on Recidivism 1999-3 The Effects of Prison Sentences on Recidivism 1999-3 Ottawa Canada Solicitor General
Goffman Erving 1961 Asylums Essays on the Social Situation of Mental Patients and Other Inmates Chicago Aldine
Green Donald P and Daniel Winik 2010 Using Random Judge Assignments to Estimate the Effects of Incarceration and Probation on Recidivism Among Drug Offenders Criminology 48 (2) 357ndash87 doi101111j1745-9125201000189x
Greene William H 2008 Econometric Analysis Upper Saddle River NJ Prentice Hall
Hahn Jinyong Petra Todd and Wilbert Klaauw 2001 Identification and Estimation of Treatment Effects with a Regression-Discontinuity Design Econometrica 69 (1) 201ndash9 doi1011111468-026200183
Hjalmarsson Randi (2009) Juvenile Jails A path to the straight and narrow or to hardened criminality Journal of Law and Economics 52 779-809
Horney Julie D Wayne Osgood and Ineke Haen Marshall 1995 Criminal Careers in the Short-Term Intra-Individual Variability in Crime and Its Relation to Local Life Circumstances American Sociological Review 60 (5) 655 doi1023072096316
Hosmer David W Stanley Lemeshow and Susanne May 2008 Applied Survival Analysis Regression Modeling of Time-to-Event Data Hoboken NJ Wiley-Interscience
Imbens G (2009) Better LATE Than Nothing Some Comments on Deaton (2009) and Heckman and Urzua (2009) Unpublished paper downloaded from httpwwweconomicsharvardedufacultyimbensfilesbltn_09apr10pdf on December 2 2009
Imbens Guido W and Joshua D Angrist 1994 Identification and Estimation of Local Average Treatment Effects Econometrica 62 (2) 467 doi1023072951620
Imbens Guido W and Thomas Lemieux 2007 Regression Discontinuity Designs A Guide to Practice National Bureau of Economic Research Working Paper
61
The Relationship between Prison Length of Stay and Recidivism -- This report was prepared by Abt Associates using Federal funding provided by the Bureau of Justice Statistics (BJS) Opinions andor points of view expressed are those of the author(s) and do not necessarily reflect the official position or policies of the US Department of Justice
Imbens Guido W and Donald B Rubin 2015 Causal Inference for Statistics Social and Biomedical Sciences an Introduction Cambridge Cambridge University Press
Irwin John 1980 Prisons in Turmoil Boston Little Brown
Irwin John 2005 The Warehouse Prison Disposal of the New Dangerous Class Los Angeles CA Roxbury Pub Co
Irwin John (2009) Lifers Seeking redemption in prison (Criminology and justice studies) New York Routledge
Jacobs James B 1977 Statesville The Penitentiary in Mass Society Chicago IL Chicago University Press
Jaman Dorothy R Robert M Dickover and Lawrence A Bennett 1972 Parole Outcome as a Function of Time Served British Journal of Criminology 12 (1) 5ndash34
Kalbfleisch J D and Ross L Prentice 2002 The Statistical Analysis of Failure Time Data Hoboken NJ J Wiley
Kling R W Rhodes D Izrael C Cutler K Shah and C Dyous 2016 Creating an Offender-Based Tracking System Using the FJSP Draft Final for BJS Review Cambridge MA Abt Associates
Kraus J 1981 The Effects of Committal to a Special School for Truants International Journal of Offender Therapy and Comparative Criminology 25 (2) 130ndash38 doi1011770306624x8102500205
Kuziemko I 2012 How Should Inmates Be Released from Prison An Assessment of Parole versus Fixed-Sentence Regimes The Quarterly Journal of Economics 128 (1) 371ndash424 doi101093qjeqjs052
La Vigne Nancy Samuel Bieler Lindsey Cramer Helen Ho Cybele Kotonias Deborah Mayer David McClure Laura Pacifici Erika Parks Bryce Peterson and Julie Samuels 2014 Justice Reinvestment Initiative State Assessment Report Washington DC The Urban Institute
Lancaster Tony 1990 The Econometric Analysis of Transition Data Cambridge Cambridge University Press
Lee David S and Thomas Lemieux 2010 Regression Discontinuity Designs in Economics Journal of Economic Literature 48 (2) 281ndash355 doi101257jel482281
Lee S and Card D 2006 Regression Discontinuity Inference with Specification Error Technical Working paper 322 National Bureau of Economic Research
What Works Clearinghouse Procedures and Standards Handbook Version 30 US Department of Education httpsiesedgovnceewwcDocsreferenceresourceswwc_procedures_v3_0_standards_handboo kpdf
62
The Relationship between Prison Length of Stay and Recidivism -- This report was prepared by Abt Associates using Federal funding provided by the Bureau of Justice Statistics (BJS) Opinions andor points of view expressed are those of the author(s) and do not necessarily reflect the official position or policies of the US Department of Justice
Lerman Amy 2009a The People Prisons Make Effects of Incarceration on Criminal Psychology In Do Prisons make Us Safer The Benefits and Costs of the Prison Boom eds Steven Raphael and Michael A Stoll New York Russel Sage
Lerman Amy 2009b Bowling Alone (With My Own Ball and Chain) Effects of Incarceration and the Dark Side of Social Capital Lecture
Letkemann Peter 1973 Crime as Work Englewood Cliffs NJ Prentice-Hall
Listwan Shelley Johnson Christopher J Sullivan Robert Agnew Francis T Cullen and Mark Colvin 2013 The Pains of Imprisonment Revisited The Impact of Strain on Inmate Recidivism Justice Quarterly 30 (1) 144ndash68 doi101080074188252011597772
Loeffler Charles E 2013 Does Imprisonment Alter the Life Course Evidence on Crime and Employment from A Natural Experiment Criminology 51 (1) 137ndash66 doi1011111745-912512000
Loughran Thomas A Edward P Mulvey Carol A Schubert Jeffrey Fagan Alex R Piquero and Sandra H Losoya 2009 Estimating A Dose-Response Relationship Between Length of Stay and Future Recidivism in Serious Juvenile Offenders Criminology 47 (3) 699ndash740 doi101111j1745-9125200900165x
MacKenzie Doris L 2006 What Works in Corrections Reducing the Criminal Activities of Offenders and Delinquents New York Cambridge University Press
Manski Charles F and Daniel S Nagin 1998 Bounding Disagreements About Treatment Effects A Case Study of Sentencing and Recidivism Sociological Methodology 28 (1) 99ndash137 doi1011110081-175000043
Meade Benjamin Benjamin Steiner Matthew Makarios and Lawrence Travis 2012 Estimating a Dose-Response Relationship Between Time Served in Prison and Recidivism Journal of Research in Crime and Delinquency 50 (4) 525ndash50 doi1011770022427812458928
Mears Daniel P Joshua C Cochran and Francis T Cullen 2014 Incarceration Heterogeneity and Its Implications for Assessing the Effectiveness of Imprisonment on Recidivism Criminal Justice Policy Review 26 (7) 691ndash712 doi1011770887403414528950
Mears Daniel P Joshua C Cochran William D Bales and Avinash S Bhati (2016) Recidivism and time served in prison Journal of Criminal Law and Criminology 106(1) 82-122
Morgan Stephen and Christopher Winship 2015 Counterfactuals and Causal Inference Methods and Principals for Social Research 2nd ed Cambridge MA Cambridge University Press
Nagin Daniel S Francis T Cullen and Cheryl Lero Jonson 2009 Imprisonment and Reoffending Essay In Crime and Justice A Review of Research eds Michael Tonry 38115ndash200 Chicago University of Chicago Press
63
The Relationship between Prison Length of Stay and Recidivism -- This report was prepared by Abt Associates using Federal funding provided by the Bureau of Justice Statistics (BJS) Opinions andor points of view expressed are those of the author(s) and do not necessarily reflect the official position or policies of the US Department of Justice
Nguyen H Loughran T A Paternoster R Fagan J amp Piquero A R (2017) Institutional placement and illegal earnings Examining the crime school hypothesis Journal of Quantitative Criminology 33(2) 207-235
Owen B A (1998) In the Mix Struggle and Survival in a Womens Prison SUNY Press
Pager Devah and Lincoln Quillian 2005 Walking the Talk What Employers Say Versus What They Do American Sociological Review 70 (3) 355ndash80 doi101177000312240507000301
Pager Devah Bart Bonikowski and Bruce Western 2009 Discrimination in a Low-Wage Labor Market A Field Experiment American Sociological Review 74 (5) 777ndash99 doi101177000312240907400505
Pager Devah 2007 Marked Race Crime and Finding Work in an Era of Mass Incarceration Chicago University of Chicago Press
Rhodes William and Sarah K Jalbert 2013 Regression Discontinuity Design in Criminal Justice Evaluation An Introduction and Illustration Evaluation Review 37 (3-4) 239ndash73 doi1011770193841x14523004
Rhodes W Dyous C Kling R Hunt D and Luallen J (2012) Recidivism of Offenders on Federal Community Supervision Bureau of Justice Statistics award 2010-BJ-CX-K069 NCRJS document number 241018
Rhodes W (2010) Estimating treatment effects and predicting recidivism for community supervision using survival analysis with instrumental variables Journal of Quantitative Criminology 26(3) 391-413
Rhodes W (2012) Meta-analysis An introduction using regression models Evaluation review 36(1) 24-71
Roach Michael A and Max M Schanzenbach 2015 The Effect of Prison Sentence Length on Recidivism Evidence from Random Judicial Assignment Northwestern Law ampAmp Econ Research Paper doi102139ssrn2701549
Roodman David 2016 The impacts of incarceration on crime Open Philanthropy Project
Rosenbaum Paul R 2002 Observational Studies 2nd ed New York Springer
Smith Douglas A and Raymond Paternoster 1990 Formal Processing and Future Delinquency Deviance Amplification as Selection Artifact Law ampAmp Society Review 24 (5) 1109 doi1023073053663
Sampson Robert J and John H Laub 1993 Crime in the Making Pathways and Turning Points Through Life Cambridge MA Harvard University Press
64
The Relationship between Prison Length of Stay and Recidivism -- This report was prepared by Abt Associates using Federal funding provided by the Bureau of Justice Statistics (BJS) Opinions andor points of view expressed are those of the author(s) and do not necessarily reflect the official position or policies of the US Department of Justice
Smith Paula 2006 The Effects of Incarceration on Recidivism A Longitudinal Examination of Program Participation and Institutional Adjustment in Federally Sentenced Adult Male Offenders Dissertation University of New Brunswick Dept of Psychology
Smith Paula Paul Gendreau and Claire Goggin 2002 The Effects of Prison Sentences and Intermediate Sanctions on Recidivism General Effects and Individual Differences Ottawa Solicitor General Canada
Snodgrass G Matthew Arjan A J Blokland Amelia Haviland Paul Nieuwbeerta and Daniel S Nagin 2011 Does the Time Cause the Crime An Examination of the Relationship Between Time Served and Reoffending in The Netherlands Criminology 49 (4) 1149ndash94 doi101111j1745-9125201100254x
Sykes Gresham M 1958 The Society of Captives A Study of a Maximum Security Prison Princeton NJ Princeton University Press
National Research Council Jeremy Travis Bruce Western Steve Redburn 2014 The Growth of Incarceration in the United States Exploring Causes and Consequences eds Committee on Causes and Consequences of High Rates of Incarceration Committee on Law and Justice and Division of Behavioral and Social Sciences and Education Washington DC The National Academies Press
van der Klaauw Wilbert 2002 Estimating the Effect of Financial Aid Offers on College Enrollment A Regression-Discontinuity Approach International Economic Review 43 (4) 1249ndash87 doi1011111468-2354t01-1-00055
Villettaz P M Killias and I Zoder 2006 The Effects of Custodial vs Non-Custodial Sentences on Re-Offending A Systematic Review of the State of Knowledge Campbell Collaboration Crime and Justice Group doi104073csr200613
Wacquant Loiumlc 2001 Deadly Symbiosis When Ghetto and Prison Meet and Mesh Mass Imprisonment Social Causes and Consequences 82ndash120 doi1041359781446221228n8
Western Bruce 2002 The Impact of Incarceration on Wage Mobility and Inequality American Sociological Review 67 (4) 526 doi1023073088944
65
The Relationship between Prison Length of Stay and Recidivism -- This report was prepared by Abt Associates using Federal funding provided by the Bureau of Justice Statistics (BJS) Opinions andor points of view expressed are those of the author(s) and do not necessarily reflect the official position or policies of the US Department of Justice
Tables and Figures
Table 1 - Number of Offenders Meeting Study Requirements per Guidelines Cell
Criminal History Categories (1 least serious 6 most serious) Offense
Seriousness Level CH 1 CH 2 CH 3 CH 4 CH 5 CH 6 Total
1 38 6 1 1 1 1 48 2 909 176 178 90 42 61 1456 3 143 26 33 20 9 25 256 4 3244 818 981 523 371 613 6550 5 442 119 132 84 64 119 960 6 3005 641 752 429 300 505 5632 7 1511 381 653 576 440 680 4241 8 4497 882 1023 543 361 552 7858 9 1969 465 566 321 229 363 3913
10 8511 1873 2342 1119 765 1109 15719 11 2824 558 728 472 304 521 5407 12 9748 2368 3330 1968 1204 1667 20285 13 13159 2961 3668 2009 1226 1777 24800 14 4219 746 854 430 275 788 7312 15 10534 2680 3131 1599 951 1257 20152 16 4394 760 831 396 227 318 6926 17 8743 2598 4189 2919 1690 1981 22120 18 4876 745 758 388 212 306 7285 19 9053 2116 2902 1720 1095 1301 18187 20 3761 779 930 532 262 319 6583 21 13674 2293 3341 2511 1706 2421 25946 22 3674 654 850 480 289 392 6339 23 10627 4101 5642 2996 1742 1904 27012 24 3706 719 788 487 282 445 6427 25 7748 2816 3460 1835 1036 1137 18032 26 2946 728 856 420 228 355 5533 27 9418 1797 2221 1126 630 647 15839 28 2509 506 554 306 144 178 4197 29 6180 2614 3442 1736 870 3174 18016 30 1819 344 367 384 218 654 3786 31 3868 1800 2308 1157 554 2945 12632 32 1144 307 377 161 86 213 2288 33 2570 873 1155 566 259 365 5788 34 776 244 260 111 79 1831 3301 35 1145 645 820 368 197 446 3621 36 431 128 153 66 35 47 860
Leas
t Ser
ious
(1) t
o Mo
st S
erio
us (4
3)
66
The Relationship between Prison Length of Stay and Recidivism -- This report was prepared by Abt Associates using Federal funding provided by the Bureau of Justice Statistics (BJS) Opinions andor points of view expressed are those of the author(s) and do not necessarily reflect the official position or policies of the US Department of Justice
Criminal History Categories (1 least serious 6 most serious) Offense
Seriousness Level CH 1 CH 2 CH 3 CH 4 CH 5 CH 6 Total
37 543 210 305 148 54 221 1481 38 290 83 122 59 30 64 648 39 200 62 91 36 21 58 468 40 174 37 58 22 22 35 348 41 94 31 43 18 6 23 215 42 64 23 28 9 5 8 137 43 86 24 25 12 4 19 170
All 169266 42737 55248 31153 18525 31845 348774 Note Cells with fewer than 100 observations are highlighted
67
The Relationship between Prison Length of Stay and Recidivism -- This report was prepared by Abt Associates using Federal funding provided by the Bureau of Justice Statistics (BJS) Opinions andor points of view expressed are those of the author(s) and do not necessarily reflect the official position or policies of the US Department of Justice
Table 2 -- Percentage of Offenders Sentenced to Prison per Guideline Cell
Criminal History Categories (1 least serious 6 most serious) Offense
Seriousness Level CH 1 CH 2 CH 3 CH 4 CH 5 CH 6 Total
1 11 0 0 0 100 100 13 2 15 20 42 52 69 72 25 3 11 31 42 50 78 76 29 4 14 27 45 68 74 82 34 5 14 34 54 83 84 93 42 6 17 40 59 73 89 94 40 7 16 43 69 91 95 96 58 8 17 43 58 86 91 96 39 9 27 53 79 90 90 97 53
10 33 75 86 94 96 96 58 11 63 85 91 95 99 98 77 12 69 84 92 96 97 98 81 13 74 89 94 97 98 98 83 14 79 90 94 97 99 98 86 15 82 93 96 97 99 99 89 16 84 92 95 98 98 98 88 17 85 93 97 98 99 99 92 18 90 95 97 99 98 99 92 19 89 93 97 99 99 99 93 20 92 96 99 98 99 99 94 21 92 96 98 99 99 99 95 22 93 96 98 99 99 99 95 23 93 97 98 99 99 99 96 24 95 98 99 100 99 100 96 25 95 98 98 99 99 99 97 26 97 98 98 99 100 100 98 27 96 99 99 100 99 100 97 28 96 98 99 99 100 99 97 29 96 98 99 99 99 99 98 30 97 100 100 98 99 100 98 31 97 98 99 99 99 99 98 32 98 98 99 99 100 100 99 33 96 98 99 99 100 99 97 34 97 100 99 100 100 99 99 35 97 98 99 98 99 99 98 36 98 99 99 97 100 100 98 37 97 98 99 100 96 98 98 38 98 99 98 100 100 98 98
68
The Relationship between Prison Length of Stay and Recidivism -- This report was prepared by Abt Associates using Federal funding provided by the Bureau of Justice Statistics (BJS) Opinions andor points of view expressed are those of the author(s) and do not necessarily reflect the official position or policies of the US Department of Justice
Criminal History Categories (1 least serious 6 most serious) Offense
Seriousness Level CH 1 CH 2 CH 3 CH 4 CH 5 CH 6 Total
39 98 98 99 100 100 98 99 40 98 97 100 100 100 100 99 41 98 100 100 100 100 100 99 42 97 100 100 100 100 100 99 43 98 100 96 100 100 95 98 All 78 89 93 97 98 98 87
Note Cells with less than 50 prison terms are highlighted
69
The Relationship between Prison Length of Stay and Recidivism -- This report was prepared by Abt Associates using Federal funding provided by the Bureau of Justice Statistics (BJS) Opinions andor points of view expressed are those of the author(s) and do not necessarily reflect the official position or policies of the US Department of Justice
Table 3 -- Average Time Served (Months) per Guideline Cell
Criminal History Categories (1 least serious 6 most serious) Offense Seriousness Level
CH 1 CH 2 CH 3 CH 4 CH 5 CH 6
Leas
t Ser
ious
(1) t
o Mo
st S
erio
us (4
3)
1 04 00 00 00 209 65 2 10 13 25 36 41 73 3 08 17 27 47 47 73 4 13 22 35 57 67 85 5 13 21 42 87 90 138 6 13 41 49 84 115 140 7 11 29 50 81 117 146 8 14 38 59 96 137 175 9 21 50 71 119 168 208
10 30 72 94 150 191 230 11 43 82 119 161 217 251 12 60 103 137 189 237 279 13 81 124 157 212 260 300 14 106 160 187 256 298 324 15 120 170 204 256 320 355 16 147 198 233 303 359 408 17 164 222 260 326 392 446 18 196 257 297 362 454 515 19 216 282 326 407 498 547 20 262 343 401 481 573 637 21 255 342 394 481 570 636 22 313 409 483 582 689 721 23 336 429 484 577 670 728 24 369 493 543 685 786 853 25 418 495 562 671 785 842 26 480 571 676 783 902 964 27 474 597 659 783 868 909 28 552 706 784 902 961 1048 29 584 722 813 878 976 981 30 685 845 938 1063 1120 1213 31 695 823 916 1039 1129 1117 32 850 991 1116 1241 1417 1312 33 779 935 1056 1203 1338 1401 34 969 1166 1220 1365 1396 1326 35 900 1033 1182 1335 1385 1403 36 1176 1265 1456 1510 1551 1461
70
The Relationship between Prison Length of Stay and Recidivism -- This report was prepared by Abt Associates using Federal funding provided by the Bureau of Justice Statistics (BJS) Opinions andor points of view expressed are those of the author(s) and do not necessarily reflect the official position or policies of the US Department of Justice
Criminal History Categories (1 least serious 6 most serious) Offense Seriousness Level
CH 1 CH 2 CH 3 CH 4 CH 5 CH 6
37 1028 1289 1356 1604 1382 1849 38 1279 1434 1625 1726 1399 1769 39 1072 1468 1540 1567 1544 1656 40 1414 1520 1648 1482 1490 1658 41 1315 1562 1788 2045 2124 1899 42 1263 1878 1468 1974 1422 1974 43 1497 1685 2078 2909 1280 2243
71
The Relationship between Prison Length of Stay and Recidivism -- This report was prepared by Abt Associates using Federal funding provided by the Bureau of Justice Statistics (BJS) Opinions andor points of view expressed are those of the author(s) and do not necessarily reflect the official position or policies of the US Department of Justice
Table 4 -- Percentage of Offenders Recidivating within Three Years (Not Accounting for Censoring) per Guideline Cell
Criminal History Categories (1 least serious 6 most serious) Offense Seriousness Level CH 1 CH 2 CH 3 CH 4 CH 5 CH 6
Leas
t Ser
ious
(1) t
o Mo
st S
erio
us (4
3)
1 395 333 1000 00 00 1000 2 232 324 382 433 524 328 3 238 346 424 450 444 440 4 201 334 399 405 415 512 5 215 378 379 440 422 454 6 198 348 430 462 407 475 7 212 336 449 507 502 568 8 177 330 324 385 427 438 9 182 286 337 340 397 477
10 167 262 350 367 383 459 11 116 228 299 326 365 407 12 130 266 335 388 442 475 13 132 248 297 368 396 444 14 94 180 297 347 360 391 15 129 241 315 386 420 423 16 95 186 276 323 300 377 17 99 207 280 342 382 425 18 95 179 240 312 274 359 19 106 197 274 320 359 414 20 94 181 247 301 336 376 21 103 172 235 283 336 352 22 81 191 259 313 356 375 23 84 142 192 247 293 330 24 86 172 221 277 337 348 25 77 122 167 215 251 277 26 70 126 173 193 241 318 27 71 124 157 186 216 253 28 72 144 148 180 201 298 29 63 93 131 169 208 221 30 73 96 166 188 239 252 31 52 99 129 137 181 166 32 68 94 135 161 105 174 33 51 86 127 133 201 186 34 44 90 88 153 215 118 35 53 62 87 122 178 143 36 42 55 85 136 229 128 37 52 90 95 135 93 163
72
The Relationship between Prison Length of Stay and Recidivism -- This report was prepared by Abt Associates using Federal funding provided by the Bureau of Justice Statistics (BJS) Opinions andor points of view expressed are those of the author(s) and do not necessarily reflect the official position or policies of the US Department of Justice
Criminal History Categories (1 least serious 6 most serious) Offense Seriousness Level CH 1 CH 2 CH 3 CH 4 CH 5 CH 6
38 24 24 57 68 233 156 39 20 48 99 139 190 52 40 40 108 103 182 136 114 41 32 32 47 111 333 130 42 63 00 143 222 200 125 43 81 00 200 167 250 158
73
The Relationship between Prison Length of Stay and Recidivism -- This report was prepared by Abt Associates using Federal funding provided by the Bureau of Justice Statistics (BJS) Opinions andor points of view expressed are those of the author(s) and do not necessarily reflect the official position or policies of the US Department of Justice
Table 5 -- Results from a Naive Regressions (Cox Proportional Hazard)
CH 1 CH 2 CH 3 CH 4 CH 5 CH 6 scaled time-served -1707 -2381 -2536 -1941 -1079 -1588
(0155) (0212) (0155) (0187) (0235) (0161) time-served squared 0941 1166 1154 0487 -0336 0016
(0263) (0328) (0234) (0263) (0323) (0192) scaled age -7718 -6272 -6200 -6174 -6028 -2779
(0257) (0385) (0295) (0388) (0496) (0468) age squared 6798 5207 5927 6619 6433 1160
(0503) (0775) (0608) (0791) (0983) (0881) female -0348 -0343 -0281 -0219 -0280 -0331
(0021) (0035) (0028) (0040) (0052) (0041) Black 0194 0115 0120 0088 -0016 -0054
(0023) (0030) (0022) (0026) (0031) (0023) other race 0567 0426 0348 0301 0371 0267
(0030) (0049) (0039) (0049) (0062) (0051) Hispanic -0085 -0095 -0072 -0018 0008 -0053
(0024) (0037) (0028) (0034) (0041) (0034) high_school -0124 -0142 -0127 -0106 -0088 -0036
(0039) (0049) (0036) (0042) (0051) (0038) advanced_degree -0611 -0441 -0423 -0287 -0169 -0051
(0053) (0084) (0070) (0088) (0112) (0078) lives_alone -0023 0006 0011 -0020 -0033 -0036
(0021) (0029) (0021) (0025) (0030) (0022) centered points 0311 -0026 0100 0057 0051 0041
(0015) (0022) (0009) (0012) (0013) (0002) N 143058 38733 52654 30049 17697 30247
74
The Relationship between Prison Length of Stay and Recidivism -- This report was prepared by Abt Associates using Federal funding provided by the Bureau of Justice Statistics (BJS) Opinions andor points of view expressed are those of the author(s) and do not necessarily reflect the official position or policies of the US Department of Justice
Table 6 ndash Results when Contrasts are Cells 13 24 57 68 911 1012 and so on
Criminal History 1
Criminal History 2
Criminal History 3
Criminal History 4
Criminal History 5
Criminal History 6
linear 0002 0004
-0002 0003
-0002 0004
-0003 0003
-0008 0005
-0005 0003
constant -0074 0048
-0034 0041
-0050 0041
-0012 0037
0054 0062
-0054 0041
R2 0010 0040 0020 0060 0150 0110 N 15 15 18 19 17 19 plt005 plt001 The constant is the average parameter for the estimated hazard (zero is neutral) Six criminal history scores labeled Criminal History The contrasts are cells 13 24 57 68 911 1012 and so on All the contrasts are independent
Table 7 ndash Results when Contrasts are Cells 24 35 68 79 1012 1113 and so on
Criminal History 1
Criminal History 2
Criminal History 3
Criminal History 4
Criminal History 5
Criminal History 6
linear 0003 -0003
0004 -0005
0003 -0003
-0002 -0004
0007 -0005
0000 -0004
constant -0103 (0032)
-0153 -0071
-0109 (0033)
-0097 -0050
-0188 (0064)
-0049 -0048
R2 0060 0070 0060 0010 0120 0000 N 16 14 18 17 17 18
plt005 plt001 The constant is the average parameter for the estimated hazard (zero is neutral) Six criminal history scores labeled Criminal History The contrasts are cells 24 35 69 710 1012 1113 etc
75
0 Q) bull ~ middot - 0
20gt () agto
0 00 co 0)0 C = a ctl lshyu c o 0 middot- o t ltD 0 aO 0 _ Q0
I()
ci 0 500
Time at Risk in Days
Crim H 1
Crim H 3
Crim H 5
Crim H is the criminal history category
Crim H 2
Crim H 4
Crim H 6
Crim H 1 is the highest l ine and others a re in descending order Crim H 5 and Crim H 6 are nearly indistinguishable
1000
The Relationship between Prison Length of Stay and Recidivism -- This report was prepared by Abt Associates using Federal funding provided by the Bureau of Justice Statistics (BJS) Opinions andor points of view expressed are those of the author(s) and do not necessarily reflect the official position or policies of the US Department of Justice
Figure 1 ndash Kaplan-Meier Estimates of Time until Recidivism by Criminal History Category
plt005 plt001 Six criminal history scores labeled Criminal History Scales variables run from 0 to 1 Centered points Criminal history points centered at zero
76
The Relationship between Prison Length of Stay and Recidivism -- This report was prepared by Abt Associates using Federal funding provided by the Bureau of Justice Statistics (BJS) Opinions andor points of view expressed are those of the author(s) and do not necessarily reflect the official position or policies of the US Department of Justice
Figure 2 ndash Relationship between Time-Served and Recidivism Principal Specification (Return and Revocation)
0 5 1
15
2 25
Relative Hazard
0 10 20 30 40 Offense Seriousness Level
Crim Hist Category 1
5
1 15
2 25
Relative Hazard
0 10 20 30 40 Offense Seriousness Level
Crim Hist Category 2
5
1 15
2 25
Relative Hazard
0 10 20 30 40 Offense Seriousness Level
Crim Hist Category 3 0
5 1
15
2 25
Relative Hazard
0 10 20 30 40 Offense Seriousness Level
Crim Hist Category 4 0
5 1
15
2 25
Relative Hazard
0 10 20 30 40 Offense Seriousness Level
Crim Hist Category 5
5
1 15
2 25
Relative Hazard
0 10 20 30 40 Offense Seriousness Level
Crim Hist Category 6
Dots are estimated relative hazards (shown if between -25 and 25)Vertical lines are 95 confidence interval for the estimated relative hazards (truncated at 25)Smooth lines are linear predictions and 95 confidence intervals for the regression line
Criminal History 1
Criminal History 2
Criminal History 3
Criminal History 4
Criminal History 5
Criminal History 6
linear 0002 (0002)
0000 (0003)
0000 (0002)
-0003 (0003)
0000 (0004)
-0003 (0003)
constant -0068 (0013)
-0075 (0019)
-0075 (0017)
-0076 (0019)
-0068 (0028)
-0077 (0020)
R2 003 000 000 003 000 003 N 31 29 36 36 34 37
plt005 plt001 The constant is the average parameter for the estimated hazard (zero is neutral) Six criminal history scores labeled Criminal History
77
The Relationship between Prison Length of Stay and Recidivism -- This report was prepared by Abt Associates using Federal funding provided by the Bureau of Justice Statistics (BJS) Opinions andor points of view expressed are those of the author(s) and do not necessarily reflect the official position or policies of the US Department of Justice
Figure 3 ndash Relationship between Time-Served and Recidivism Principal Specification (Return and Revocation) using an Instrumental Variable Estimator
7
8
9
1 11
Relative Hazard
0 10 20 30 40 Offense Seriousness Level
Crim Hist Category 1
9 95
1 105 11 115
Relative Hazard
0 10 20 30 40 Offense Seriousness Level
Crim Hist Category 2
6
8
1 12
14
Relative Hazard
0 10 20 30 40 Offense Seriousness Level
Crim Hist Category 3 5
1 15
2 25
Relative Hazard
0 10 20 30 40 Offense Seriousness Level
Crim Hist Category 4 8
9
1 11
12
Relative Hazard
0 10 20 30 40 Offense Seriousness Level
Crim Hist Category 5
5
1 15
2 25
Relative Hazard
0 10 20 30 40 Offense Seriousness Level
Crim Hist Category 6
Dots are estimated relative hazards (shown if between -25 and 25)Vertical lines are 95 confidence interval for the estimated relative hazards (truncated at 25)Smooth lines are linear predictions and 95 confidence intervals for the regression line
Criminal History 1
Criminal History 2
Criminal History 3
Criminal History 4
Criminal History 5
Criminal History 6
linear 0001 (0000)
0001 (0000)
0001 (0000)
0000 0000
0000 0000
0000 0000
constant -0014 (0002)
-0015 (0003)
-0011 (0003)
-0011 (0003)
-0009 0005
-0009 (0003)
R2 043 022 012 003 001 010 N 31 29 36 36 34 37
plt005 plt001 The constant is the average parameter for the estimated hazard (zero is neutral) Six criminal history scores labeled Criminal History
78
The Relationship between Prison Length of Stay and Recidivism -- This report was prepared by Abt Associates using Federal funding provided by the Bureau of Justice Statistics (BJS) Opinions andor points of view expressed are those of the author(s) and do not necessarily reflect the official position or policies of the US Department of Justice
Figure 4 ndash Sensitivity Test Minimum Cell Size 50 instead of 100
0 5 1
15
2 25
Relative Hazard
0 10 20 30 40 Offense Seriousness Level
Crim Hist Category 1
0 5 1
15
2 25
Relative Hazard
0 10 20 30 40 Offense Seriousness Level
Crim Hist Category 2
5
1 15
2 25
Relative Hazard
0 10 20 30 40 Offense Seriousness Level
Crim Hist Category 3 0
5 1
15
2 25
Relative Hazard
0 10 20 30 40 Offense Seriousness Level
Crim Hist Category 4 0
5 1
15
2 25
Relative Hazard
0 10 20 30 40 Offense Seriousness Level
Crim Hist Category 5
0 5 1
15
2 25
Relative Hazard
0 10 20 30 40 Offense Seriousness Level
Crim Hist Category 6
Dots are estimated relative hazards (shown if between -25 and 25)Vertical lines are 95 confidence interval for the estimated relative hazards (truncated at 25)Smooth lines are linear predictions and 95 confidence intervals for the regression line
Criminal History 1
Criminal History 2
Criminal History 3
Criminal History 4
Criminal History 5
Criminal History 6
linear 0002 (0002)
0000 (0003)
0000 (0002)
-0002 (0003)
0000 (0004)
-0003 (0002)
constant -0068 (0013)
-0075 (0018)
-0073 (0018)
-0078 (0019)
-0068 (0027)
-0084 (0021)
R2 003 000 000 002 000 003 N 31 32 37 37 37 40
Six criminal history scores labeled Criminal History plt005 plt001 The constant is the average parameter for the estimated hazard (zero is neutral)
79
The Relationship between Prison Length of Stay and Recidivism -- This report was prepared by Abt Associates using Federal funding provided by the Bureau of Justice Statistics (BJS) Opinions andor points of view expressed are those of the author(s) and do not necessarily reflect the official position or policies of the US Department of Justice
Figure 5 ndash Sensitivity Test Minimum Cell Size 150 instead of 100
0 5 1
15
2 25
Relative Hazard
0 10 20 30 40 Offense Seriousness Level
Crim Hist Category 1
5
1 15
2 25
Relative Hazard
0 10 20 30 40 Offense Seriousness Level
Crim Hist Category 2
5
1 15
2 25
Relative Hazard
0 10 20 30 40 Offense Seriousness Level
Crim Hist Category 3
5
1 15
2 25
Relative Hazard
0 10 20 30 40 Offense Seriousness Level
Crim Hist Category 4
0 5 1
15
2 25
Relative Hazard
0 10 20 30 40 Offense Seriousness Level
Crim Hist Category 5
5
1 15
2 25
Relative Hazard
0 10 20 30 40 Offense Seriousness Level
Crim Hist Category 6
Dots are estimated relative hazards (shown if between -25 and 25)Vertical lines are 95 confidence interval for the estimated relative hazards (truncated at 25)Smooth lines are linear predictions and 95 confidence intervals for the regression line
Criminal History 1
Criminal History 2
Criminal History 3
Criminal History 4
Criminal History 5
Criminal History 6
linear 0002
(0002)
0000
(0003)
0000
(0002)
-0003
(0003)
-0001
(0004)
-0003
(0003) constant -0068
(0013) -0075 (0021)
-0076 (0017)
-0071 (0020)
-0066 (0031)
-0071 (0021)
R2 003 000 000 003 000 004 N 31 28 34 34 32 35
plt005 plt001 The constant is the average parameter for the estimated hazard (zero is neutral) Six criminal history scores labeled Criminal History
80
The Relationship between Prison Length of Stay and Recidivism -- This report was prepared by Abt Associates using Federal funding provided by the Bureau of Justice Statistics (BJS) Opinions andor points of view expressed are those of the author(s) and do not necessarily reflect the official position or policies of the US Department of Justice
Figure 6 -- Sensitivity Test Minimum Percentage of Prison Terms 75 instead of 50
0 5 1
15
2 25
Relative Hazard
0 10 20 30 40 Offense Seriousness Level
Crim Hist Category 1
5
1 15
2 25
Relative Hazard
0 10 20 30 40 Offense Seriousness Level
Crim Hist Category 2
5
1 15
2 25
Relative Hazard
0 10 20 30 40 Offense Seriousness Level
Crim Hist Category 3
0 5 1
15
2 25
Relative Hazard
0 10 20 30 40 Offense Seriousness Level
Crim Hist Category 4
0 5 1
15
2 25
Relative Hazard
0 10 20 30 40 Offense Seriousness Level
Crim Hist Category 5
5
1 15
2 25
Relative Hazard
0 10 20 30 40 Offense Seriousness Level
Crim Hist Category 6
Dots are estimated relative hazards (shown if between -25 and 25)Vertical lines are 95 confidence interval for the estimated relative hazards (truncated at 25)Smooth lines are linear predictions and 95 confidence intervals for the regression line
Criminal History 1
Criminal History 2
Criminal History 3
Criminal History 4
Criminal History 5
Criminal History 6
linear 0004 (0003)
0002 (0003)
-0001 (0003)
-0002 (0003)
0000 (0004)
-0003 (0003)
constant -0086 (0021)
-0091 (0023)
-0070 (0017)
-0074 (0020)
-0069 (0031)
-0076 (0020)
R2 007 002 001 002 000 004 N 27 28 32 33 31 36
plt005 plt001 The constant is the average parameter for the estimated hazard (zero is neutral) Six criminal history scores labeled Criminal History
81
The Relationship between Prison Length of Stay and Recidivism -- This report was prepared by Abt Associates using Federal funding provided by the Bureau of Justice Statistics (BJS) Opinions andor points of view expressed are those of the author(s) and do not necessarily reflect the official position or policies of the US Department of Justice
Figure 7 ndash Sensitivity Test Contrasts that are J and J+1 instead of J and J+2 5
1 15
2 25
Relative Hazard
0 10 20 30 40 Offense Seriousness Level
Crim Hist Category 1
0 5 1
15
2 25
Relative Hazard
0 10 20 30 40 Offense Seriousness Level
Crim Hist Category 2
5
1 15
2 25
Relative Hazard
0 10 20 30 40 Offense Seriousness Level
Crim Hist Category 3
5
1 15
2 25
Relative Hazard
0 10 20 30 40 Offense Seriousness Level
Crim Hist Category 4
5
1 15
2 25
Relative Hazard
0 10 20 30 40 Offense Seriousness Level
Crim Hist Category 5
5
1 15
2 25
Relative Hazard
0 10 20 30 40 Offense Seriousness Level
Crim Hist Category 6
Dots are estimated relative hazards (shown if between -25 and 25)Vertical lines are 95 confidence interval for the estimated relative hazards (truncated at 25)Smooth lines are linear predictions and 95 confidence intervals for the regression line
Criminal History 1
Criminal History 2
Criminal History 3
Criminal History 4
Criminal History 5
Criminal History 6
linear 0002 (0004)
-0002 (0005)
0005 (0004)
0006 (0004)
0003 (0006)
0006 (0004)
constant -0030 (0029)
-0017 (0040)
-0037 (0032)
-0039 (0028)
-0031 (0046)
-0023 (0028)
R2 0010 000 004 010 001 009 N 25 25 27 26 29 29
plt005 plt001 The constant is the average parameter for the estimated hazard (zero is neutral) Six criminal history scores labeled Criminal History
82
The Relationship between Prison Length of Stay and Recidivism -- This report was prepared by Abt Associates using Federal funding provided by the Bureau of Justice Statistics (BJS) Opinions andor points of view expressed are those of the author(s) and do not necessarily reflect the official position or policies of the US Department of Justice
Figure 8 -- Sensitivity Test Using the Prais-Winston Estimator
5
1 15
2 25
Relative Hazard
0 10 20 30 40 Offense Seriousness Level
Crim Hist Category 1
0 5 1
15
2 25
Relative Hazard
0 10 20 30 40 Offense Seriousness Level
Crim Hist Category 2
5
1 15
2 25
Relative Hazard
0 10 20 30 40 Offense Seriousness Level
Crim Hist Category 3
5
1 15
2 25
Relative Hazard
0 10 20 30 40 Offense Seriousness Level
Crim Hist Category 4
5
1 15
2 25
Relative Hazard
0 10 20 30 40 Offense Seriousness Level
Crim Hist Category 5
5
1 15
2 25
Relative Hazard
0 10 20 30 40 Offense Seriousness Level
Crim Hist Category 6
Dots are estimated relative hazards (shown if between -25 and 25)Vertical lines are 95 confidence interval for the estimated relative hazards (truncated at 25)Smooth lines are linear predictions and 95 confidence intervals for the regression line
Criminal History 1
Criminal History 2
Criminal History 3
Criminal History 4
Criminal History 5
Criminal History 6
linear 0019 -0010
0005 -0003
0003 -0003
0007 (0003)
0002 -0006
0006 (0003)
constant -0133 0065
-0060 0020
-0035 0016
-0030 0031
-0032 0029
-0040 0013
Rho 0100 -0940 -0790 0010 -0260 -0730 R2 0240 0210 0110 0210 0020 0330 N 25 25 27 26 29 29
plt005 plt001 The constant is the average parameter for the estimated hazard Six criminal history scores labeled Criminal History
83
The Relationship between Prison Length of Stay and Recidivism -- This report was prepared by Abt Associates using Federal funding provided by the Bureau of Justice Statistics (BJS) Opinions andor points of view expressed are those of the author(s) and do not necessarily reflect the official position or policies of the US Department of Justice
Figure 9 -- Sensitivity Test Entering Prison as Recidivism
0 5 1
15
2 25
Relative Hazard
0 10 20 30 40 Offense Seriousness Level
Crim Hist Category 1
5
1 15
2 25
Relative Hazard
0 10 20 30 40 Offense Seriousness Level
Crim Hist Category 2
0 5 1
15
2 25
Relative Hazard
0 10 20 30 40 Offense Seriousness Level
Crim Hist Category 3
0 5 1
15
2 25
Relative Hazard
0 10 20 30 40 Offense Seriousness Level
Crim Hist Category 4
0 5 1
15
2 25
Relative Hazard
0 10 20 30 40 Offense Seriousness Level
Crim Hist Category 5
5
1 15
2 25
Relative Hazard
0 10 20 30 40 Offense Seriousness Level
Crim Hist Category 6
Dots are estimated relative hazards (shown if between -25 and 25)Vertical lines are 95 confidence interval for the estimated relative hazards (truncated at 25)Smooth lines are linear predictions and 95 confidence intervals for the regression line
Criminal History 1
Criminal History 2
Criminal History 3
Criminal History 4
Criminal History 5
Criminal History 6
linear 0003 (0002)
0002 (0002)
0001 (0002)
-0004 (0003)
0000 (0004)
-0003 (0003)
constant -0070 (0014)
-0084 (0017)
-0077 (0018)
-0071 (0020)
-0074 (0030)
-0080 (0020)
R2 004 002 000 005 000 003 N 40 36 39 37 33 37
plt005 plt001 The constant is the average parameter for the estimated hazard (zero is neutral) Six criminal history scores labeled Criminal History
84
The Relationship between Prison Length of Stay and Recidivism -- This report was prepared by Abt Associates using Federal funding provided by the Bureau of Justice Statistics (BJS) Opinions andor points of view expressed are those of the author(s) and do not necessarily reflect the official position or policies of the US Department of Justice
Figure 10 -- Sensitivity Testing Eliminating Drug-Law Offenders from the Analysis
0 5 1
15
2 25
Relative Hazard
0 10 20 30 40 Offense Seriousness Level
Crim Hist Category 1
0 5 1
15
2 25
Relative Hazard
0 10 20 30 40 Offense Seriousness Level
Crim Hist Category 2
5
1 15
2 25
Relative Hazard
0 10 20 30 40 Offense Seriousness Level
Crim Hist Category 3
5
1 15
2 25
Relative Hazard
0 10 20 30 40 Offense Seriousness Level
Crim Hist Category 4
0 5 1
15
2 25
Relative Hazard
0 10 20 30 40 Offense Seriousness Level
Crim Hist Category 5
5
1 15
2 25
Relative Hazard
0 10 20 30 40 Offense Seriousness Level
Crim Hist Category 6
Dots are estimated relative hazards (shown if between -25 and 25)Vertical lines are 95 confidence interval for the estimated relative hazards (truncated at 25)Smooth lines are linear predictions and 95 confidence intervals for the regression line
Criminal History 1
Criminal History 2
Criminal History 3
Criminal History 4
Criminal History 5
Criminal History 6
linear 0001 (0003)
-0001 (0004)
-0001 (0003)
-0002 (0003)
0001 (0005)
-0003 (0003)
constant -0055 (0014)
-0065 (0022)
-0066 (0019)
-0057 (0022)
-0059 -0031
-0062 (0022)
R2 000 000 000 001 000 003 N 31 27 34 32 32 35
plt005 plt001 The constant is the average parameter for the estimated hazard (zero is neutral) Six criminal history scores labeled Criminal History
85
The Relationship between Prison Length of Stay and Recidivism -- This report was prepared by Abt Associates using Federal funding provided by the Bureau of Justice Statistics (BJS) Opinions andor points of view expressed are those of the author(s) and do not necessarily reflect the official position or policies of the US Department of Justice
Figure 11 -- Sensitivity Testing No Covariates
0 5 1
15
2 25
Relative Hazard
0 10 20 30 40 Offense Seriousness Level
Crim Hist Category 1
5
1 15
2 25
Relative Hazard
0 10 20 30 40 Offense Seriousness Level
Crim Hist Category 2
5
1 15
2 25
Relative Hazard
0 10 20 30 40 Offense Seriousness Level
Crim Hist Category 3
0 5 1
15
2 25
Relative Hazard
0 10 20 30 40 Offense Seriousness Level
Crim Hist Category 4
0 5 1
15
2 25
Relative Hazard
0 10 20 30 40 Offense Seriousness Level
Crim Hist Category 5
5
1 15
2 25
Relative Hazard
0 10 20 30 40 Offense Seriousness Level
Crim Hist Category 6
Dots are estimated relative hazards (shown if between -25 and 25)Vertical lines are 95 confidence interval for the estimated relative hazards (truncated at 25)Smooth lines are linear predictions and 95 confidence intervals for the regression line
Criminal History 1
Criminal History 2
Criminal History 3
Criminal History 4
Criminal History 5
Criminal History 6
linear 0001 (0003)
-0003 (0003)
-0002 (0003)
-0004 (0003)
-0002 (0004)
-0004 (0003)
constant -0062 (0015)
-0067 (0020)
-0081 (0018)
-0082 (0022)
-0071 (0028)
-0084 (0022)
R2 000 003 002 005 001 007 N 31 29 36 36 34 37
plt005 plt001 The constant is the average parameter for the estimated hazard (zero is neutral) Six criminal history scores labeled Criminal History
86
The Relationship between Prison Length of Stay and Recidivism -- This report was prepared by Abt Associates using Federal funding provided by the Bureau of Justice Statistics (BJS) Opinions andor points of view expressed are those of the author(s) and do not necessarily reflect the official position or policies of the US Department of Justice
Figure 12 -- Sensitivity Testing Using the Earlier Guidelines
0 1
2 3
4 5
Relative Hazard
0 10 20 30 40 Offense Seriousness Level
Crim Hist Category 1
0 5 1
15
2 25
Relative Hazard
0 10 20 30 40 Offense Seriousness Level
Crim Hist Category 2
5
1 15
2 25
Relative Hazard
0 10 20 30 40 Offense Seriousness Level
Crim Hist Category 3
0 5 1
15
2 25
Relative Hazard
0 10 20 30 40 Offense Seriousness Level
Crim Hist Category 4
0 5 1
15
2 25
Relative Hazard
0 10 20 30 40 Offense Seriousness Level
Crim Hist Category 5
5
1 15
2 25
Relative Hazard
0 10 20 30 40 Offense Seriousness Level
Crim Hist Category 6
Dots are estimated relative hazards (shown if between -25 and 25)Vertical lines are 95 confidence interval for the estimated relative hazards (truncated at 25)Smooth lines are linear predictions and 95 confidence intervals for the regression line
Criminal History 1
Criminal History 2
Criminal History 3
Criminal History 4
Criminal History 5
Criminal History 6
linear 0000 (0003)
0001 (0004)
0000 (0003)
-0004 (0002)
-0002 (0004)
-0004 (0003)
constant -0085 (0017)
-0097 (0025)
-0096 (0019)
-0085 (0018)
-0076 (0030)
-0081 (0028)
R2 000 000 000 007 001 004 N 31 29 34 35 33 34
plt005 plt001 The constant is the average parameter for the estimated hazard (zero is neutral) Six criminal history scores labeled Criminal History
87

The Relationship between Prison Length of Stay and Recidivism -- This report was prepared by Abt Associates using Federal funding provided by the Bureau of Justice Statistics (BJS) Opinions andor points of view expressed are those of the author(s) and do not necessarily reflect the official position or policies of the US Department of Justice
trajectory group memberships as well as a propensity score matching caliper of 15 The matched
pairings produced sets of offenders who served different sentence lengths The matched pairs
allowed Snodgrass et al to examine measures of recidivism comparing any given ordinal category of
length of stay to the other categories where a matched pair could be found The results showed no
relationship between length of stay and recidivism The Snodgrass et al study takes great care in
constructing counterfactuals for the offenders within a given length of stay class But as they note
the average levels of time served are much shorter than one would observe in most United States
adult prison samples
Roach and Schanzenbach (2015) use randomization of judges assigned to sentencing
convicted offenders to map the relationship between length of stay (median of 4 months) and one
two and three-year rates of recidivism Using reduced form and two-stage regression they find that
each additional month of sentence length decreases recidivism by about 1 percent When they
stratify on criminal history Roach and Schanzenbach find a strong effect of sentence length for
offenders with minimal criminal history and a weak or insignificant effect for offenders with more
extensive criminal histories They also found that relative to the base hazard rate the impact
occurred almost entirely within the first year of release Roach and Schanzenbach argue the impact
of length of stay is a combination of severity of punishment and rehabilitation The researchers argue
that offenders with longer sentences can participate in more rehabilitative prison programs Roach
and Schanzenbachrsquos Table 2 (page 19) does indicate possible sources of bias in the relationship
between length of stay and recidivism The judge dummy variables not only demonstrate a strong
relationship to sentence length essential to the study design but they also predict the offenderrsquos
offense severity level and number of prior non-violent convictions These offender characteristics
could be associated with the sentence length and the level of recidivism qualifying as backdoor
variables (Morgan and Winship 2015) Roodmanrsquos (2016) review of this study offers the possibility
11
The Relationship between Prison Length of Stay and Recidivism -- This report was prepared by Abt Associates using Federal funding provided by the Bureau of Justice Statistics (BJS) Opinions andor points of view expressed are those of the author(s) and do not necessarily reflect the official position or policies of the US Department of Justice
the longer sentences in this study would lead to longer parole supervision elevating recidivism
because of technical parole violations
Kuziemko (2012) uses the Georgia parole guideline grid as a means of identifying the causal
effect of length of stay She restricts her analysis to offenders with less severe offenses and whose
criminal history category is in the average to high range She uses the discontinuity in the grid
recommendation (separating high from average risk) as an instrument for time served with the
instrumented time served in stage one and recidivism regressed on the instrument in stage two
along with other covariates One of her estimates restricts the sample to people whose points are
just above or just below the discontinuity threshold (8 versus 9 points) which should yield the best
approximation to an exogenous variation She finds each additional month of time served lowers the
three-year recidivism rate by 15 percent It is not clear why Kuziemko restricted her analysis to this
threshold limiting the analysis to a narrow range of the guideline grid Most offenders have lower
criminal history scores and restricting the analysis to the higher thresholds limits the generalizability
of the study In fact Roodmanrsquos (2016) reanalysis of these data evaluates other discontinuity cut
points and finds either insignificant length of stay coefficients or coefficients with the opposite sign
indicating increased length of stay increases the probability of recidivism
Mears et al (2016) used the generalized propensity score to balance covariates across levels
of length of stay They balanced within four subgroups of time served categories using
demographics categories of commitment offense offense severity scores prior record scores
dummy coded year of release and dummy coded judicial district While they achieved balance on
this set of covariates they did not conduct a sensitivity test to evaluate the potential impact of an
omitted variable (Rosenbaum 2002) Mears et al (2016) found the effect of time served on
recidivism depended on the level of length of stay Short terms produced increased recidivism up to
12
The Relationship between Prison Length of Stay and Recidivism -- This report was prepared by Abt Associates using Federal funding provided by the Bureau of Justice Statistics (BJS) Opinions andor points of view expressed are those of the author(s) and do not necessarily reflect the official position or policies of the US Department of Justice
one year From one to two years time served decreases recidivism and thereafter has no effect
Long terms (more than 6 years) could not be evaluated due to large error terms
An RDD design employed by Hjalmarsson (2009) was also based on a guideline system
however the study applied to a juvenile population in the state of Washington and the discontinuity
was based on a sanction to a state run juvenile facility versus a local sanction This latter punishment
included sanctions involving much shorter sentences served in a local facility a term of community
supervision fines or community service Hjalmarsson found a deterrent effect of state-run
confinement for juveniles compared to the local sanctions This study was not a test of length of
stay but a test of state-run juvenile confinement as opposed to a bevy of alternate juvenile
punishments To control for the fact the running variable was correlated with recidivism across
levels of criminal history the study used a quadratic regression of the running variable
Furthermore the author used all the data without regard for bandwidth This puts tremendous
pressure on his quadratic expression being correct Secondly rather than using an intent-to-treat
estimator and perhaps converting that into LATE the author drops cross-overs from the
analysis There is no justification for doing so and we are unaware of other RDDrsquos that takes such a
step Finally the author made no attempt to justify an implicit assumption that right-hand-censoring
is independent In fact given data construction and what we know about juvenile justice right-
hand-censoring is unlikely to be independent Specifically offenders with longer terms are more
likely to be censored This relationship alone may explain the findings that incarceration reduced
recidivism
One last study of note was conducted by Drago Galbiati and Vertova (2009) in which the
authors examined the effect of a Clemency Bill in Italy that shortened the sentence of offenders
anywhere from 1 to 36 months This could be described as an exogenous treatment since the
13
The Relationship between Prison Length of Stay and Recidivism -- This report was prepared by Abt Associates using Federal funding provided by the Bureau of Justice Statistics (BJS) Opinions andor points of view expressed are those of the author(s) and do not necessarily reflect the official position or policies of the US Department of Justice
application of clemency was applied irrespective of criminal history offense age and other factors
affecting the outcome However the early release came with a caveat The remaining time to serve
would be reinstated if the offender was convicted of another crime within five years So this was a
reduction in length of stay with an added disincentive to commit a new offense People who had
spent more time in prison were less likely to reoffend and each month of remaining time to serve
was associated with a 124 percent reduction to commit a new crime2
Even with these additional studies the literature on length of stay using strong
counterfactual designs is still sparse and presents a mixed picture of effects Most studies show no
effect or that increased prison length reduces recidivism slightly Several are imbalanced in ways
that could bias the length of stay effects The studies also span different populations juveniles
adults and cover different international jurisdictions (Italy the Netherlands and United Sates) The
present study uses a very large sample of federal offenders sentenced to prison with varying lengths
of stay
INCARCERATION TREATMENT HETEROGENEITY
Scholars have argued that prison dosage (length of stay) may have different effects
conditional on factors associated with the individual with the social context with sentencing
structure and with potentially many other factors The National Academy of Sciences study on mass
incarceration finds evidence for the heterogeneity of incarceration effects (NRC 2014 427) But we
need a template to systematically examine incarceration heterogeneity
Mears Cochran and Cullen (2014) provide one such template They propose three types of
sources of heterogeneity prior sanctioning experience in-prison experiences and the level of post-
2 Kuziemko (2012) also capitalizes on early release in Georgia because jail overcrowding allowed her to compare offenders with different amounts of time served having the same prior risk levels She finds people with longer time served have lower recidivism rates These results are challenged by Roodman as possible evidence of parole bias in Kuziemkorsquos analysis
14
The Relationship between Prison Length of Stay and Recidivism -- This report was prepared by Abt Associates using Federal funding provided by the Bureau of Justice Statistics (BJS) Opinions andor points of view expressed are those of the author(s) and do not necessarily reflect the official position or policies of the US Department of Justice
release supervision ndash a pre- within- post-custody framework The National Academy of Sciences
report takes an even broader perspective by suggesting that there may be incarceration effects for
different units ndash the effect on people may be substantially different than the effect on families or
neighborhoods Based on the Mears et al hypothesized framework it seems sentencing jurisdictions
will vary on many of the important pre within and post dimensions We may be reluctant to accept
that results from Florida apply to Massachusetts unless we have a framework that tells us how to
compare jurisdictions within this pre within and post sentencing framework
For the current application we use the structure of the U S Sentencing Guidelines
sanctioning grid in our RDD design to test whether criminal history or offense seriousness moderates
the effect of length of stay increments We find that increments in length of stay have about the
same effect regardless of either of these dimensions We also separately evaluate criminal history
sex race education and marital status all showing homogeneous effects of length of stay
PRESENT METHODOLOGY DATA STATISTICS AND INFERENCE
This methodology section has three parts The first part identifies the source of the data ndash
the Federal Justice Statistics Program To provide necessary background before discussing the
regression discontinuity design the second part summarizes the US Sentencing Guidelines The
third part discusses statistical methods and the RDD identification strategy3 This application of RDD
is unconventional There are multiple break-points and hence multiple effects the effects are
summarized using a meta-regression borrowed from meta-analysis Furthermore for each effect
the bandwidth is exactly two units so search for an optimal bandwidth is not a concern Several
3 Some readers may prefer to characterize our approach as using instrumental variables The US Sentencing Guidelines are the instrument that moves offenders who otherwise have the same propensity to recidivate between two guidelines cells the first of which prescribes a shorter prison term on average than does the second Because there are many guideline cells there are many estimates based on contiguous cells The multiple estimates are averaged using inverse variance weights
15
The Relationship between Prison Length of Stay and Recidivism -- This report was prepared by Abt Associates using Federal funding provided by the Bureau of Justice Statistics (BJS) Opinions andor points of view expressed are those of the author(s) and do not necessarily reflect the official position or policies of the US Department of Justice
conventional tests used in RDD are inapplicable in this setting For example we need not test how
expanding the bandwidth affects estimates
Although the parallel is disputed (Imbens amp Lemieux 2007) some see RDD as an
instrumental variable estimator and it is practical to employ IV as the estimator This alternative
estimator is also used in this study Results show the RDD estimator and the IV estimator yield
essentially the same results
Data Source
Data for this study come from the Federal Justice Statistics Program (FJSP) a Bureau of
Justice Statistics (BJS) sponsored project to assemble federal justice records To be included in the
analysis an offender must have been sentenced under the guidelines between 1999 and 2014
Practically the period studied is shorter because to be included in the analysis an offender must have
entered community supervision but many offenders sentenced between 1999 and 2014 were still
incarcerated at the end of 2014
The FJSP has a thirty-five-year history however recent refinements link federal offenders
from investigation through corrections This paper uses a subset of the linked data running from
sentencing through a single cycle of release to community supervision and possible recidivism The
US Sentencing Commission (USSC) provides data on offenses and offenders at the time of
sentencing the Administrative Office of the US Courts (AOUSC) provides data on offenders under
community supervision and the Bureau of Prisons (BOP) provides data on offenders during periods
of incarceration Details regarding construction of the FJSP data appear elsewhere (Kling et al
2016) this paper summarizes
16
The Relationship between Prison Length of Stay and Recidivism -- This report was prepared by Abt Associates using Federal funding provided by the Bureau of Justice Statistics (BJS) Opinions andor points of view expressed are those of the author(s) and do not necessarily reflect the official position or policies of the US Department of Justice
Since 1987 federal offenders have been sentenced using sentencing guidelines and data
about guideline application have been assembled (and contributed to the FJSP) by the USSC
Guidelines data provide detailed accounts of the offenderrsquos criminal history the offense of
conviction the sentence imposed and expected prison time Expected prison time differs from
actual prison time but the two are close because sentencing in the federal system uses determinate
or real-time sentencing and as explained below actual time-served is observed with systematic
error
When an offender is sentenced to prison he or she serves time in a facility run by the
Federal Bureau of Prisons (BOP) which reports data from its inmate tracking system (SENTRY) to the
FJSP Most offender prison terms are recorded in SENTRY but some are not because (1) some
offenders are sentenced to time-served prior to trial (2) some offenders spend part of their terms in
state detention and (3) terms of thirty days or fewer are inconsistently recorded in SENTRY Because
of these limitations we use expected time-served reported by the USSC as a measure of prison time
However we use admission into a BOP facility during the period of community corrections as one
measure of recidivism
When an offender is sentenced to probation or when an offender leaves prison to serve a
statutorily required term of supervised release (a judge-imposed sentence to post-incarceration
supervision) his or her term of community supervision is recorded in Probation and Pretrial Services
Automated Case Tracking System (PACTS) an information system maintained by the Administrative
Office of the U S Courts specifically by the Probation and Pretrial Services Office (PPSO) After
some manipulation4 the PACTS data record periods of community supervision and outcomes Being
4 Federal probation officers frequently open terms of probation before the offender is sentenced and terms of supervised release before the offender is released from prison For probation the probation officer may be responsible for pretrial supervision continued into post-conviction supervision and this appears as a continuous period of community supervision
17
The Relationship between Prison Length of Stay and Recidivism -- This report was prepared by Abt Associates using Federal funding provided by the Bureau of Justice Statistics (BJS) Opinions andor points of view expressed are those of the author(s) and do not necessarily reflect the official position or policies of the US Department of Justice
revoked from community supervision is another measure of recidivism Every federal offender in our
sample received a term of community supervision eliminating one source of variability and
heterogeneity
For the recidivism analysis time-at-risk starts with the beginning of a term of supervised
release for offenders sentenced to prison The time-at-risk ends with recidivism or with the first
occurrence of one of the following censoring events completion of the community supervision term
three years or with the end of data collection Using the measures described above recidivism is
defined by the occurrence of a recognized failure event If the offender reappears in the federal BOP
data he or she is deemed to have recidivated If the offender does not reappear in the BOP data but
we observe the offender is revoked from community supervision he or she is deemed to have
recidivated Although there are several explanations for being revoked from supervision but not
entering federal prison one common reason is the offender is arrested for a state-level crime and
detained in state custody pending trial The date when an offender reenters prison is the date of
recidivism if the offender does not reenter prison but is revoked from supervision the date of the
revocation is the date of recidivism Based on years of working with the PPSO checking algorithms
with PPSO administrative staff and field staff we have confirmed that this approach ndash providing
primacy to returning to prison according to the BOP ndash is the best way to identify recidivism5
Many federal offenders are arrested for new crimes without returning to prison or having
their community supervision status revoked Using the FJSP data we estimate three-year recidivism
in the FJSP Also for probation an officer may open a supervision record when preparing a presentence report The correction is to change the beginning of supervision to the date of sentencing For a term of supervised release the probation officer might open the term in preparation for post-release planning To correct this we changed the beginning of supervision to coincide with the end of prison 5 An offenderrsquos community supervision must be revoked before he or she is committed to prison so the date of revocation would seem to be the better date for the failure event In fact probation officers often fail or are unable to record the date of revocation until weeks or months after it occurs Consequently the date of entering prison (when it occurs) is a more accurate indicator for a study of recidivism
18
The Relationship between Prison Length of Stay and Recidivism -- This report was prepared by Abt Associates using Federal funding provided by the Bureau of Justice Statistics (BJS) Opinions andor points of view expressed are those of the author(s) and do not necessarily reflect the official position or policies of the US Department of Justice
rates of about 20 percent for federal offenders placed on community supervision If new arrests
were included in the analysis the recidivism rate would be closer to 30 percent6 The FJSP does not
include arrest data so we could not define recidivism as being arrested but an arrest that does not
result in revocation is typically for a minor or unfounded crime so the outcome measures used in
this study are for events that are sufficiently serious to provoke a return to custody
To be included in the analysis the offender must have been convicted and sentenced under
the US Sentencing Guidelines since 1999 This is the period covered by the data linkage Only
offenders convicted of felonies and serious misdemeanors are sentenced routinely under the
guidelines so this study is limited to those serious offenders Others rarely serve prison terms so
the omission is inconsequential To be included in the study the offender must have entered
community supervision else we could not identify a recidivism follow-up period Because of this
requirement some offenders sentenced under the guidelines are excluded from the analysis
Several reasons explain why offenders do not enter community supervision First before entering
community supervision offenders sentenced to prison must have been released from prison
Second many federal offenders are foreign nationals in the country legally or illegally they are often
deported upon prison release so they are not candidates for a recidivism study and consequently
this study is based on US citizens7 Some other offenders are released from prison to detainers
exercised by state authorities Because offenders who never enter community supervision provide
no information for analysis they are excluded from the analysis file
6 The authors have worked with PPSO for six years to match community supervision records with criminal history records (eg criminal record histories held by state authorities and linked using an FBI index) Data use agreements preclude including criminal history records in the FJSP so they are unavailable for this analysis Based on our work with PPSO we know that recidivism rates based on arrests are near 30 percent 7 Non-citizens are sentenced to community supervision but they are deported and never enter active community supervision If they reenter the county illegally their supervision status can be revoked However this form of recidivism is very different from the form of recidivism studied in this paper so we chose to exclude non-citizens We might have retained non-citizens who entered active community supervision but they are difficult to distinguish reliably in the OBTS so we chose to exclude all non-citizens
19
The Relationship between Prison Length of Stay and Recidivism -- This report was prepared by Abt Associates using Federal funding provided by the Bureau of Justice Statistics (BJS) Opinions andor points of view expressed are those of the author(s) and do not necessarily reflect the official position or policies of the US Department of Justice
Data limitations discussed in this section seem to raise concerns about bias when measuring
recidivism but these concerns are not serious for this study Essentially a RDD study compares
offenders from group A with offenders from group B where group A and group B are closely
matched Due to matching whatever biases arise regarding the measurement of recidivism are likely
the same in groups A and B Therefore a comparison of recidivism for groups A and B is valid even if
estimates of recidivism are systematically biased
SENTENCING GUIDELINES
Explaining the RDD requires a short description of federal sentencing guidelines Under the
guidelines offense seriousness is determined by a complex set of rules that take the offense of
conviction and real offense behavior into account to classify sentencing factors into one of 43 offense
seriousness levels with j=1 being the least serious and j=43 being the most serious and six criminal
history categories with k=1 being the least serious (least likely to recidivate) and k=6 being the most
serious (most likely to recidivate) By design the offense seriousness levels reflect the USSCrsquos
assessment of offense seriousness and do not consider an offenderrsquos threat to recidivate Likewise
by design the offenderrsquos criminal history category reflects the USSCrsquos assessment of the likelihood
that an offender will recidivate Important to note subtle differences in offense conduct cause an
offenderrsquos crime to be associated with offense level j rather than offense level j-1 or j+1 For
example unarmed bank robbers armed bank robbers who do not display their weapons armed
bank robbers who display but do not threaten with their weapons and bank robbers who explicitly
threaten with their weapons all appear in different seriousness levels Furthermore offenders
convicted of violent crimes drug-law violations and property crimes can all appear in the same
offense seriousness level Based on this subtlety we expect that offenders in offense seriousness
level j will not be inherently more likely to recidivate than will offenders in seriousness levels j-1 and
20
The Relationship between Prison Length of Stay and Recidivism -- This report was prepared by Abt Associates using Federal funding provided by the Bureau of Justice Statistics (BJS) Opinions andor points of view expressed are those of the author(s) and do not necessarily reflect the official position or policies of the US Department of Justice
j+1 provided criminal history is held constant8 In fact holding criminal history constant it seems
likely that offenders in offense seriousness category j are not inherently more or less likely to
recidivate than are offenders in offense seriousness categories j-k and j+k where k is a small number
This assumption provides the identification logic for the RDD and for the instrumental variable
alternative
Under the guidelines another complex set of rules determine criminal history points which
are collapsed into six criminal history categories for the guidelines application with category 1 being
the least serious criminal record and category 6 being the most serious record Based on the offense
seriousness level and the criminal history category the federal sentencing guidelines are a 43x6 grid
comprising 43 offense seriousness rows and 6 criminal history columns Holding the criminal history
category constant moving down the grid from least serious offense level to most serious offense
level the recommended prison term increases Holding the offense seriousness level constant
moving from left to right across the grid from least serious criminal history category to most serious
criminal history category the recommended prison term increases For the least serious offenses
and for the least dangerous offenders the guidelines recommend probation or alternative sanctions
although prison terms are allowed and sometimes imposed
Every year the Commission can recommend changes to the guidelines for Congressional
approval and in fact the guidelines have changed over time These changes have little consequence
for the analysis reported in this paper Even if the composition of offenders within specific guideline
cells has changed over time recommended sentence terms have always increased with offense
8 Possibly some factors entering the determination of the offense seriousness level might predict recidivism However crimes committed in the federal system are so diverse and factors entering the guidelines are so detailed it seems unlikely that increases in the offense seriousness levels would be systematically associated with recidivism holding criminal history constant Possibly for some cell jj+1 comparisons factors that enter the offense seriousness determination may cause recidivism to increase or decrease but provided these factors are not systematic ndash meaning that they do not always increase recidivism as the comparison moves from cell j to j+1 ndash the treatment effect is still identified
21
The Relationship between Prison Length of Stay and Recidivism -- This report was prepared by Abt Associates using Federal funding provided by the Bureau of Justice Statistics (BJS) Opinions andor points of view expressed are those of the author(s) and do not necessarily reflect the official position or policies of the US Department of Justice
seriousness level As explained in this next section that regularity is sufficient to support the RDD
estimation procedure
THE RDD AND STATISTICAL METHODOLOGY
During the last decade methods for inferring causality have gone well beyond naive
regression models criticized by Nagin and his colleagues (Morgan amp Winship 2015 Imbens amp Rubin
2015) A regression discontinuity design (Hahn Todd amp van der Klauuw 2001 van der Klaauw 2002
Imbens amp Lemieux 2007 Lee amp Lemieux 2010 Bloom 2012) is a rigorous approach often applied in
non-criminal justice research and sometimes applied in criminal justice studies (Berk amp Rauma 1983
Berk amp DeLeeuw 1999 Berk 2010 Rhodes amp Jalbert Regression Discontiuity Design in Criminal
Justice Evaluation An Introduction and Illustration 2013) Commonly the RDD is applied in a setting
where a decision rule based on factors (such as offense seriousness level holding criminal history
constant) can be used to define a ldquocut-pointrdquo that places study subjects (such as offenders) into one
group that does and another group that does not receive treatment Very near that rule-imposed
cut-point study subjects who do and do not receive treatment are so similar that a comparison of
outcomes for the two groups is deemed valid This section explains that our application of the RDD
identification strategy differs from the conventional application
One difference between our application and the standard application is that for us treatment
is a dose (eg the length of a prison term) while in standard applications treatment is a binary
condition On average the dose received by offenders in cell j+1 is higher than the dose received by
offenders in cell j Because offenders in cells j and j+1 are otherwise the same regarding the threat to
recidivate we can ask whether offenders in cell j+1 have higher or lower recidivism rates than
offenders in cell j and if so we have justification for attributing causation As a stylized example
22
The Relationship between Prison Length of Stay and Recidivism -- This report was prepared by Abt Associates using Federal funding provided by the Bureau of Justice Statistics (BJS) Opinions andor points of view expressed are those of the author(s) and do not necessarily reflect the official position or policies of the US Department of Justice
suppose first-time offenders who steal $100000 are sentenced according to offense seriousness
level j while first-time offenders who steal $125000 are sentenced according to offense seriousness
level j+1 In deference to the more serious crime the guidelines call for a term between 20 and 23
months for first-time offenders sentenced within guideline cell j and between 22 and 26 months for
first-time offenders sentenced within guidelines cell j+1 Given judicial discretion sentences imposed
on offenders within guideline cell j overlap with sentences imposed on offenders within guideline cell
j+1 but on average prison sentences within guideline cell j+1 are longer than those imposed within
guideline cell j This average difference drives the identification strategy Specifically holding the
criminal history category constant offenders sentenced within guideline cell j+1 are not inherently
more recidivistic than are offenders sentenced within guideline cell j but offenders sentenced within
guideline cell j+1 receive longer prison terms on average and we can test for whether those longer
prison terms account for higher or lower recidivism
Usually when applying RDD researchers consider a variable X (called a running variable in
the RDD context) and a critical value Xo that assigns study subjects to a comparison group when X lt
Xo and to a treatment group otherwise A sharp design occurs when the assignment is exact a fuzzy
design occurs when the assignment is inexact Although both sharp and fuzzy designs both estimate
the treatment effect sharp designs are preferred because (from a statistical estimation standpoint)
they are more efficient and interpreting the effect is clear
When treatment is binary as it is in standard applications the distinction between sharp and
fuzzy is straightforward Let PL be the probability of treatment when X lt Xo and let PR be the
probability of treatment otherwise If PL = 0 and PR = 1 then the design is sharp Let YL be the mean
outcome when X lt Xo and let YR be the mean outcome otherwise An estimator for the treatment
effect is YR-YL or just the difference in the mean outcomes But suppose that PL ge 0 or PR le 1 or both
23
The Relationship between Prison Length of Stay and Recidivism -- This report was prepared by Abt Associates using Federal funding provided by the Bureau of Justice Statistics (BJS) Opinions andor points of view expressed are those of the author(s) and do not necessarily reflect the official position or policies of the US Department of Justice
then the design is fuzzy Given a fuzzy RDD an often-used estimator is (YR-YL)(PR-PL) This
alternative estimator is sometimes called a local average treatment effect (LATE) Note the
numerator is an intent-to-treat estimator and in fact statistical testing is based on the numerator
because dividing by a constant will not change the properties of the basic test of whether treatment
is effective
For our application treatment is a dose and doses are distributed about a mean that
depends on whether X lt Xo or X ge Xo A necessary condition is that a shift in the offender from
guideline cell j to guideline cell j+1 will always (a sharp design) or sometime (a fuzzy design) cause an
offender to receive a longer prison term The monotonicity assumption is that this shift will never
cause an offender to receive a shorter prison term We presume the monotonicity assumption holds
and see no reason to assume otherwise
A test of the null hypothesis of no treatment effect is based on YR-YL Let TL be the average
prison term for X lt Xo let TR be the average prison term for X ge Xo Then the counterpart to the LATE
estimator for the binary treatment effect is (YR-YL)(TR-TL) or the change in recidivism per unit of
additional prison This too is a local average treatment effect Its interpretation is the average
increasedecrease in recidivism resulting from an average increase in prison length
In both these illustrations the estimator is LATE LATE is not necessarily the average
treatment effect or in this case the average increasedecrease in recidivism from increasing time-
served by one unit However LATE is almost always used as a substitute for that average which is
unidentified (Imbens 2009)
Returning to the standard application the ideal identification strategy requires that
estimation be limited to study subjects whose X values are just slightly less than Xo or equal to or
24
The Relationship between Prison Length of Stay and Recidivism -- This report was prepared by Abt Associates using Federal funding provided by the Bureau of Justice Statistics (BJS) Opinions andor points of view expressed are those of the author(s) and do not necessarily reflect the official position or policies of the US Department of Justice
slightly more than Xo9 Because very few observations meet these demanding conditions evaluators
usually expand the bandwidth to be broader than ldquoslightly lessrdquo and ldquoslightly morerdquo Because this
expansion of the bandwidth violates the asymptotic identification assumptions evaluators typically
assume that a local linear regression of the outcome variable Y on X will capture the relationship
between Y and X absent any intervention Given the intervention any departure from the local linear
regression around Xo is deemed the treatment effect A standard application would test the
credibility of this local linear regression and a standard application would test the sensitivity of
findings to the size of the bandwidth
Our application differs from the standard application in important ways Typically when
researchers apply the RDD strategy there is a single cut-point so there is a single estimate of the
treatment effect Less commonly there are multiple cut-points and a researcher can estimate
multiple treatment effects (Cattaneo Keele Tituinik amp Vazquez-Bare 2016) Given the structure of
the sentencing guidelines our study is based on a multiple cut-point RDD That is we estimate
multiple effects then combine them to generalize conclusions
Rather than increasing efficacy by expanding the bandwidth we always make comparison
across adjacent cells so that cell j is deemed ldquoslightly lessrdquo than the offense seriousness level that
determines cell j+1 Employing multiple cut-points achieves small standard errors by combining the
multiple estimates that arise from comparing outcomes for cells jj+1 j+1j+2 j+2j+3 and so on It is
unnecessary to expand the bandwidth beyond two units
9 ldquoSlightly lessrdquo and ldquoslightly morerdquo mean than X falls within a region X+δ and X-δ as δ approaches zero Expanding the bandwidth means that δ is allowed to get bigger
25
The Relationship between Prison Length of Stay and Recidivism -- This report was prepared by Abt Associates using Federal funding provided by the Bureau of Justice Statistics (BJS) Opinions andor points of view expressed are those of the author(s) and do not necessarily reflect the official position or policies of the US Department of Justice
In the conventional application a researcher would assure the relationship between the
outcome variable and the running variable is linear to the left and right of the breakpoint10 Because
our approach employs just two points j and j+1 this test is unavailable to us Arguably it is also
inapplicable because when estimating an effect we do not expand the bandwidth beyond j and j+1
In the conventional application the researcher will assure there is a discontinuity in treatment so
that treatment is more likely for those to the right of the cut-point than it is for those to the left We
do apply this conventional test showing that it holds
In conventional RDD analysis researchers worry about ldquogamingrdquo In the present context
defense attorneys have incentives to move their clients to lower guideline cells and prosecuting
attorneys have countervailing incentives to move offenders to higher guideline cells Gaming is
possible by manipulating guideline elements such as the amount of money stolen Defense
attorneys would argue the amount is lower than alleged prosecutors would argue the opposite In
conventional RDD analysis researchers use imperfect devices to test for gaming but those tests are
not necessary in the present context
To explain suppose a variable Z is associated with recidivism and is subject to gaming such
that defense attorneys are generally able to shift offenders from cell j+1 to cell j based on the value
of Z In our study we would expect a general shift in Z from j+2 to j+1 from j+1 to j from j to j-1
from j-1 to j-2 and so on In general this shift would have no effect on the contrasts because it
occurs across all adjacent cells Thus gaming is less relevant for a multiple-effect RDD than for a
conventional single-effect RDD Furthermore we are only concerned with gaming about variables
10 Postulating a linear relationship is frequent but some researchers expand their models to allow power functions of the running variable Hjalmarsson (2009) in a study of guidelines and juvenile justice discussed earlier used a quadratic This is a dangerous practice because the validity of the quadratic is difficult to assess and findings based on a RDD are sensitive to getting the model specification correct There are other elaborate alternatives to using local linear regressions but they are not applicable to our study
26
The Relationship between Prison Length of Stay and Recidivism -- This report was prepared by Abt Associates using Federal funding provided by the Bureau of Justice Statistics (BJS) Opinions andor points of view expressed are those of the author(s) and do not necessarily reflect the official position or policies of the US Department of Justice
that affect recidivism Because criminal history is held constant by construction of the guideline cells
the avenue for gaming is restricted Nevertheless we introduce some test for whether variable
associated with recidivism vary systematically across cells so that for example we ask whether
offenders in cell j+1 tend to be older than offenders in cell j We introduce these potential
confounders into the local linear regression Although we do not need a local linear regression for
identification we increase the efficiency of estimates by using a regression to include covariates in
the analysis Given the nature of the outcome variable when comparing outcomes in cells j and j+1
our study uses a Cox survival model sometimes called a Cox proportional hazard model but it is
ldquolocalrdquo only in the sense that (absent the intervention) the baseline survival model is invariant
around the cut-point and we estimate the treatment effect from a unit shift There exists an
extensive methodological literature on survival models (Lancaster 1990 Kalbfleisch amp Prentice
2002 Hosmer Lemeshow amp May 2008) which are frequently applied in studies of criminal
recidivism where time-at-risk is often censored A separate study justifies using the proportional
hazard model (rather than a parametric alternative) to study recidivism in the federal system
(Rhodes et al 2012) Although the approach seems uncommon others have used survival models as
the estimator in a RDD context (Rhodes amp Jalbert 2013 Bor Moscoe Mutevedzi Newell amp
Barnighausem 2014) We use the RDD identification strategy and the survival model estimation
strategy to identify and estimate the change in the hazard of recidivism across paired guideline cells
The most defensible approach consistent with the intuition of the RDD would seem to be to
compare the relative hazards for cell j and j+1 (holding criminal history category constant) because
offenders in cells j and j+1 are more alike than in any other comparison Both the previous discussion
and descriptive statistics discussed subsequently points toward a problem Cells j and j+1 are so
27
The Relationship between Prison Length of Stay and Recidivism -- This report was prepared by Abt Associates using Federal funding provided by the Bureau of Justice Statistics (BJS) Opinions andor points of view expressed are those of the author(s) and do not necessarily reflect the official position or policies of the US Department of Justice
alike the average time-served is not guaranteed to increase when comparing cell j to cell j+111 Even
when it increases the size of the increase may be so small that it is not informative As an extreme
example there is not much use in comparing recidivism for offenders who serve two years on
average when sentenced within cell j and two years plus one day on average when sentenced within
cell j+1 From experimentation to assure that average time served will increase between contrasted
cells we have found it better to compare the outcome from cell j and cell j+212 Notwithstanding
what was written above most of the analysis is based on that jj+2 comparison but we do offer
sensitivity tests that employ the original jj+1 comparison An alternative approach is to combine
cells j and j-1 and compare that with the combined cells j+1 and j+2 (This is equivalent to expanding
the bandwidth) However this alternative approach seems to offer no advantages and introduces
some difficult estimation problems (serial correlation and general model specification issues) when
combining multiple effects so we avoid its application
Because this identificationestimation strategy results in many hazard estimates (potentially
41x6) we use techniques familiar from meta-analysis to combine estimates (effects) into summary
statistics A useful explanation of a fixed-effect meta-regression is Rhodes (2012) For example for
the first criminal history category there are potentially 41 effects We estimate a weighted least-
squares linear regression to estimate the average of the 41 effects Because there are 6 criminal
history categories we repeat the meta-regression across the 6 criminal history categories and then
average the 6 meta-regression averages to derive a single inverse variance weighted estimate and
11 Especially for drug-law violations and weapons offenses federal statutes require application of mandatory minimum sentences Regardless of guideline recommendations judges cannot sentence below the mandatory minimums Because mandatory minimums are not evenly distributed across the offense seriousness levels it is possible for the average terms in cell j to be larger than the average terms in cell j+1
12 Across the six criminal history categories the average percent change in time-served between cells j and j+1 ranges from 9 to 18 with the change being largest for criminal history category 1 In comparison across the six criminal history categories the average percent change in time-served between cells j and j+1 ranges from 20 to 38 with the change being largest for criminal history category 1
28
The Relationship between Prison Length of Stay and Recidivism -- This report was prepared by Abt Associates using Federal funding provided by the Bureau of Justice Statistics (BJS) Opinions andor points of view expressed are those of the author(s) and do not necessarily reflect the official position or policies of the US Department of Justice
test statistic Thus although there are many estimates there is only one test statistics and hence no
multiple comparison problem
For reasons explained below when applying the meta-regression we must deal with error
terms that may be auto-correlated and heteroscedastic We will show that heteroscedasticity is a
major problem and to deal with it we used weighted least squares Because we compare cells j with
j+2 j+1 with j+3 j+2 with j+4 and so on we potentially introduce autocorrelation across the
estimates The jj+2 and j+2j+4 comparisons are not independent because they have j+2 in common
This problem has corrections (Prais-Winston estimators for example) but they are suspect in small
samples where ignoring the problem is likely better than attempting to introduce a feasible
generalized least squares solution (Greene 2008 p 648) This follows because small samples provide
inaccurate estimates for the autocorrelation coefficient We concentrate on the heteroscedasticity
problem however we provide a sensitivity test suggesting that autocorrelation can safely be
ignored
The meta-regression provides the average effect of moving from guidelines cell j to cell j+2
This is an intent-to-treat estimator If this movement were not statistically significant we would
conclude that increasing prison terms has no effect on criminal recidivism If the average effect is
statistically significant by itself it does not provide LATE the size of the effect resulting from a unit
increase in prison time Our approach is to report the size of the average effect when moving from
cell j to j+2 the average increase in the length of the prison term when moving from cell j to j+2 and
the ratio of the two The ratio is essentially the LATE
A more direct approach which requires the same assumptions as were applied above is to
apply an instrumental variable (IV) estimator where the shift from guideline cell j to j+2 is the
instrument That is offenders in cell j+2 are not inherently more or less recidivistic than are
29
The Relationship between Prison Length of Stay and Recidivism -- This report was prepared by Abt Associates using Federal funding provided by the Bureau of Justice Statistics (BJS) Opinions andor points of view expressed are those of the author(s) and do not necessarily reflect the official position or policies of the US Department of Justice
offenders in cell j but the longer average sentences served by offenders in cell j+2 cause those
offenders to recidivate at a greater or lesser rate than offenders in cell j Instead of a dummy
variable representing membership in cell j or j+2 the important right-hand-side variables is the
average time-served by offenders in cell j and j+213 That is the treatment variable takes one of two
values the average time-served by offenders in cell j (when the observation belongs to cell j) or the
average time-served by offenders in cell j+2 (when the observation belongs to cell j+2) The
advantage of this approach is that parameter estimates have the interpretation of ldquochange in the
relative hazard per additional month of time servedrdquo The disadvantage is that IV estimators lack
desirable asymptotic properties (that is they are biased even in large samples) when applied to a
non-linear model and the Cox regression is a non-linear model (Rhodes 2010) Nevertheless we
expect estimates to be approximate and worth comparing with the RDD estimates
RESULTS
This section has two parts The first part provides descriptive statistics and justification for
deleting cases from the analyses The second section provides estimates of the effect of increasing
time-served on recidivism using the RDD and IV approaches it also provides sensitivity tests for case
deletion and other analytic decisions
DESCRIPTIVE STATISTICS AND RULES FOR DELETING CASES
Table 1 reports the number of offenders available for the analysis before we add restrictions
To be included in this table an offender must meet three criteria First he or she must have been
sentenced under the guidelines because guidelines calculations are used in the analysis Second he
13 This is a two-stage estimation model The first-stage involves a regression of time-served on dummy variables representing the adjacent guideline cells But this regression will simply provide the mean time-served in each cell so we do not actually perform the regression
30
The Relationship between Prison Length of Stay and Recidivism -- This report was prepared by Abt Associates using Federal funding provided by the Bureau of Justice Statistics (BJS) Opinions andor points of view expressed are those of the author(s) and do not necessarily reflect the official position or policies of the US Department of Justice
or she must be a US citizen We cannot follow recidivism by deported offenders And third he or
she must have entered active community supervision following sentencing ndash either probation or a
term of supervised release ndash because active supervision initiates the time at risk of recidivism This
third criterion has two implications If an offender never entered active community supervision that
offender would not appear in the analysis Specifically if an offender was sentenced to prison and
remained in prison as of September 30 2014 that offender would not appear in the analysis Thus
offenders sentenced to long prison terms and especially offenders sentenced toward the end of the
data collection window are more likely to be excluded than are other offenders This systematic
selection will not bias the RDD estimates because any selection bias will be equally applicable to cell j
and cell j+2 That is the RDD implicitly adjusts for the selection bias
Insert Table 1 about here
Shading identifies cells with fewer than 100 observations Although data for the most and
least serious offense levels are sparse the sample sizes for the other cells are ample an important
point because the RDD approach holds criminal history category constant and compares outcomes
for offense serious levels j and j+2 Notice that about half the offenders fall into criminal history
category 1 and given that these are relatively inexperienced offenders a reader might put more
subjective weight on the analysis of offenders in this criminal history category To be included in the
principal analysis a cell must have 100 or more offenders Stripped of some other statistical issues
basically the RDD approach requires a comparison of the mean recidivism rates for cells j and j+2
Because the sampling variance for estimated difference in outcomes between offense seriousness
levels j and j+2 is inversely proportional to the number of offenders in cells j and j+2 setting a
minimum number of observations increases the average precision of estimated effects for those cells
31
The Relationship between Prison Length of Stay and Recidivism -- This report was prepared by Abt Associates using Federal funding provided by the Bureau of Justice Statistics (BJS) Opinions andor points of view expressed are those of the author(s) and do not necessarily reflect the official position or policies of the US Department of Justice
retained in the analysis but we will present sensitivity analyses of the 100-offender criterion
showing the analysis appears insensitive to this criterion
Using the same data applied to produce Table 1 Table 2 reports the percentage of offenders
who receive prison terms by guidelines cell Shading denotes that fewer than 50 of offenders
within a cell are sentenced to prison Prison is often imposed for federal crimes but sentencing
guidelines (and hence this table) are only mandatory for felonies and serious misdemeanors
Additionally many federal crimes are dual jurisdiction offenses and generally the most serious
crimes are prosecuted in federal court while the least serious crimes are prosecuted in state courts
These factors explain why prison terms are so frequent in these data Still prison is infrequent for
offenders convicted of the least serious crimes provided they lack serious criminal records For a cell
to be included in the principal analysis at least 50 of offenders in that cell must have received
prison terms Justification is that for estimating effects the effective sample size is proportional to
the number in the cell multiplied by the percentage sentenced to prison because probation
sentences count as zero for these calculations (Offenders sentenced to straight probation are
assigned prison terms of length zero) However we will provide sensitivity testing of this selection
criterion showing that findings are insensitive to the criterion
Insert Table 2 about here
Inspection of Table 2 shows some irregularities in the progression of sentence severity
especially for the least serious offense levels but the general pattern is that prison terms become
increasingly certain as we look down the table (from least to most serious crimes) and across the
table (from least to most serious offenders) Inspection of Table 3 which reports average time-
served (counting probation as zero) also shows some irregularities but the general pattern is that
32
The Relationship between Prison Length of Stay and Recidivism -- This report was prepared by Abt Associates using Federal funding provided by the Bureau of Justice Statistics (BJS) Opinions andor points of view expressed are those of the author(s) and do not necessarily reflect the official position or policies of the US Department of Justice
average time-served in prison increases as we look down the table (from least to most serious
crimes) and across the table (from least to most serious offenders)
The irregularities cause a problem for the RDD If the RDD compared cells j with j+1 for a
RDD strategy to work we must observe a substantial increase in the average time in prison as we
compare cell j with cell j+1 Logically small changes fail to create a credible contrast Looking
especially at Table 3 several cell j and j+1 contrasts fail to meet this criterion The problem is that
moving from cell j to cell j+1 is a subtle shift and we find a better comparison to be between cell j
and j+2 This is the reason for using a jj+2 comparison instead of a jj+1 comparison Although
comparing cells j and j+2 may raise validity issues whatever bias is introduced is likely to be small
and from a mean-squared-error perspective comparing jj+2 instead of jj+1 seems justified
However as a sensitivity test we also report estimates based on a comparison of cells j and j+1 and
qualitative results prove insensitive to whether the comparison is between jj+1 or jj+2
Insert Table 3 about here
One more table is useful for summarizing the recidivism measure Table 4 reports the
percentage of offenders who recidivate during their periods of community supervision These
statistics are right-hand-censored by the length of the time-at-risk and capped at three years They
do not account for censoring due to supervision terms less than three years Although most
offenders avoid returning to prison returning to prison is not an infrequent occurrence At this
descriptive stage of the analysis patterns may seem peculiar Looking down each column recidivism
rates are lower for offenders incarcerated for the most serious crimes and higher for offenders
incarcerated for the least serious crimes Although as description this pattern is correct the effect is
probably not causal It seems likely that offenders who serve the longest terms are older when
released from prison than are offenders who serve the shortest terms and given that age is
33
The Relationship between Prison Length of Stay and Recidivism -- This report was prepared by Abt Associates using Federal funding provided by the Bureau of Justice Statistics (BJS) Opinions andor points of view expressed are those of the author(s) and do not necessarily reflect the official position or policies of the US Department of Justice
predictive of recidivism the patterns may be partly a result of age Reading across the table
recidivism tends to increase with criminal history but small sample sizes for the most serious
criminal history scores may be responsible for imprecise estimates
Insert Table 4 about here
Intended as a summary of the patterns shown by Table 4 Figure 1 presents survival curves
based on Kaplan-Meier estimates stratified by criminal history categories To be included in this
analysis an offender had to be sentenced within a guideline cell with 100 or more offenders and at
least 50 percent of offenders within that cell must have received prison terms Those restrictions are
consistent with the restrictions imposed for the principal analysis presented later However the
figure changes very little when the restrictions are removed In general as the criminal history
category increases so too does the rate of recidivism although the difference between criminal
history categories 5 and 6 is barely perceptible
Insert Figure 1 about here
Table 5 extends the descriptive analysis appearing in Figure 1 to include covariates (The
table reports parameters from a Cox model not relative hazards) The regression is naiumlve in the
sense that it does not account for potential confounding variables that might ndash if known ndash explain
why recidivism falls as the offense severity level (and hence time-served) increases This regression
uses variables that will reappear in the local linear regressions that we use for the RDD analyses
Separate Cox regressions are reported for each criminal history category
Scaled time-served This is estimated time-served rescaled by dividing the original time-served by
the maximum time-served Time-served is capped at 180 months The cap is
inclusive of more than 99 percent of terms
34
The Relationship between Prison Length of Stay and Recidivism -- This report was prepared by Abt Associates using Federal funding provided by the Bureau of Justice Statistics (BJS) Opinions andor points of view expressed are those of the author(s) and do not necessarily reflect the official position or policies of the US Department of Justice
Time-served squared This is the square of scaled time-served
Scaled age This is the offender age at the time that he or she entered community
supervision rescaled to run from 0 to 1
Age squared This is scaled age squared
Female This is a dummy variable for female
Black This is a dummy variable for Black
Other race This is a dummy variable for race other than White or Black
Hispanic This is a dummy variable for Hispanic ethnicity It is not collinear with the
race variables
High school This is a dummy variable indicating the offender has a high school degree or
equivalent
Advanced degree This is a dummy variable indicating the offender has a degree beyond high
school
Lives alone This is a dummy variable indicating the offender is neither married nor living
in a common law relationship at the time of sentencing
Centered CH points The guidelines assign criminal history points based on criminal records that
are collapsed into the six criminal history categories The criminal history
points are centered to have a mean of zero for each guideline cell
District This is the judicial district where the sentence was imposed There are 94
federal districts including those in territories District enters the analysis
35
The Relationship between Prison Length of Stay and Recidivism -- This report was prepared by Abt Associates using Federal funding provided by the Bureau of Justice Statistics (BJS) Opinions andor points of view expressed are those of the author(s) and do not necessarily reflect the official position or policies of the US Department of Justice
when estimating the frailty parameter that is as a random effect associated
with the Cox model
Because they run from zero to one scaled variables are useful for interpreting quadratics
The centered criminal history points provide a more refined measure of criminal record beyond the
broader criminal history category Centering this score is unimportant for the results presented in
Table 5 but centering is useful for later analyses
Insert Table 5 about here
As description the estimates appearing in Table 5 tell a simple story As best as a quadratic
can capture the pattern recidivism falls as time-served increases after accounting for the criminal
history category The declines are substantial and tend to be greater (but not consistently) for those
with minor criminal records (category 1) than for those with serious criminal records (categories 2-6
exclusive of 5) As an illustration when time-served changes from 30 months to 60 months the
relative hazards from criminal history 1 to criminal history 6 are 081 074 072 075 081 and 077
respectively14
Except regarding age other parameters are less interesting for this current study because
they tell us nothing about how recidivism changes with time-served (Women are less recidivistic
than men Blacks and other races are more recidivistic than Whites Hispanics tend to be less
recidivistic than non-Hispanics The educated are less recidivistic than the under-educated Marital
association appears to have no predictive effect The relative importance of these covariates
appears to decrease as criminal history increases) The inverse relationship between recidivism and
2
180
3060
180180 180
60 3014 For example the relative hazard for criminal history category 1 equals exp 1707
0941
minus+minusminus
2
36
The Relationship between Prison Length of Stay and Recidivism -- This report was prepared by Abt Associates using Federal funding provided by the Bureau of Justice Statistics (BJS) Opinions andor points of view expressed are those of the author(s) and do not necessarily reflect the official position or policies of the US Department of Justice
time-served cannot be explained by age If we were to accept results from this naiumlve regression we
would conclude that longer prison terms cause recidivism to fall dramatically (up to 28 percent for a
30-month increase) but we are reluctant to attach causality to these regression results because we
cannot be sure that all confounding factors have been considered Hence we turn to the RDD
The results reported in Table 5 suggest that marital status does not predict recidivism
Because this variable is frequently missing we drop it from the following analysis The ethnic status
Hispanic sometimes predicts recidivism but the effect is not large and this variable is often missing
Consequently we also drop the ethnic category Hispanic from the following analysis
ESTIMATES OF THE EFFECT THAT INCREASING TIME-SERVED HAS ON
RECIDIVISM
The previous section described data sources and gross patterns in those data This section
presents evidence based on a regression discontinuity design For every jj+2 contrast we compute
a unique effect as a log-relative hazard Potentially this leads to 6x41 effects because there are 41
possible contrasts within each criminal history category and there are 6 criminal history categories
In fact we produce fewer estimates because data selection rules exclude some of the contrasts The
number entering the analysis depends on the sensitivity tests but 175 contrasts appear in the
principal analysis
For each contrast between cells j and j+2 we estimate a Cox survival model15 The effect size
is the parameter associated with a dummy variable coded 1 for cell j+2 and coded zero for cell j The
15 By default we estimated a Cox model with covariates and shared frailty the covariates and criterion for the shared frailty are described in the text Sometimes to estimate the model we removed the shared frailty parameter in which case we estimated the relative hazard using the covariates but not the shared frailty given the RDD the relative hazard is still
37
The Relationship between Prison Length of Stay and Recidivism -- This report was prepared by Abt Associates using Federal funding provided by the Bureau of Justice Statistics (BJS) Opinions andor points of view expressed are those of the author(s) and do not necessarily reflect the official position or policies of the US Department of Justice
outcome measure is returning to prison following placement on community supervision or being
revoked from supervision (When an offender enters community supervision multiple times we only
include the first period of supervision in the analysis) Time at risk is censored by the end of the
study period or by the end of community supervision or at three years if supervision is ongoing after
three years Censoring by the end of community supervision is important because thereafter an
offender cannot return to federal prison unless he or she is convicted of a new federal crime
Fundamentally once an offender successfully completes his term of community supervision the FJSP
no longer tracks his criminality so the study cannot extend beyond the end of community
supervision Occasionally an offender may serve his entire sentence and then commit a new federal
crime Although he or she would reappear in the FJSP we only consider the first conviction
When applying a RDD identification strategy researchers are careful to justify that two
conditions hold Translated into the current setting where we compare outcomes in cell j and j+2
the two conditions are (1) on average time-served in cell j+2 must be greater than time-served in
cell j (2) There must be no other differences between offenders in cells j and j+2 that could account
for differences in recidivism In practice this second condition is difficult to establish By
construction of the guidelines and given the fact that we compare cells j and j+2 along the offense
seriousness dimension and never along the criminal history dimension we are confident this
condition holds Nevertheless an indirect empirical test is whether the guidelines cause offenders in
cell j+2 to look systematically different than offenders in cell j This is testable
By the design of the guidelines we anticipate that variables sometimes associated with
recidivism will have about the same mean values in cell j as in cell j+2 Of course we expect time-
consistent Sometimes to estimate the model we removed both shared frailty and the covariates in which case we estimated the relative hazard with just an indication the data came from cell j rather than j+2 Again given the RDD the estimate of relative hazard is consistent but not efficient If we could not estimate the relative hazard the estimate is reported as missing
38
The Relationship between Prison Length of Stay and Recidivism -- This report was prepared by Abt Associates using Federal funding provided by the Bureau of Justice Statistics (BJS) Opinions andor points of view expressed are those of the author(s) and do not necessarily reflect the official position or policies of the US Department of Justice
served to differ between cell j and cell j+2 and it does by 54 months on average (Plt001) If this
difference were not large there would be little point to the analysis
On average other variables do not change significantly between cell j and j+2 16 We tested
the following variables date of birth educational attainment sex race Hispanic status marital
status date when sentenced and criminal history point score The differences were small and none
approached statistical significance The results for criminal history point score seem especially
important because we consider this variable to be highly correlated with recidivism The fact that
the criminal history point score does not change systematically from cell j to j+2 suggests that
offenders in cell j+2 are not inherently more or less recidivistic than are offenders in cell j Therefore
the data pass this diagnostic test
While the inclusion of covariates may be unnecessary for identification including covariates
in the Cox regression is expected to reduce residual variance and improve the precision of the
estimates As noted the principal variable is a dummy variable coded one if the observation is from
cell j+2 and coded zero if from cell j Other covariates with the noted exceptions are the same as
were used in the naiumlve regression Obviously we have also excluded the scaled time-served variable
and its square Because there are 41x6 possible regressions (175 in this main application) we do not
show the regression results from this stage of the analysis Instead we report the single parameter of
interest (the average effect) for each regression in graphical form
Within each criminal history category the Cox model estimates the hazard of recidivism for
offenders in category j+2 relative to offenders in category j holding covariates constant Using the
16 The change is computed for every jj+2 pair The statistics reported in the texts are a weighted average of those pair comparisons Weights equal the inverse of the sampling variances Because of the distribution of offenses within the guidelines the least serious criminal history categories and the middle of the offense seriousness range dominate the calculations Arguably the estimates are not independent so standard errors are suspect Nevertheless the estimates of differences between cells j and j+2 are not biased and these average differences are small
39
The Relationship between Prison Length of Stay and Recidivism -- This report was prepared by Abt Associates using Federal funding provided by the Bureau of Justice Statistics (BJS) Opinions andor points of view expressed are those of the author(s) and do not necessarily reflect the official position or policies of the US Department of Justice
log-relative hazard (eg the parameter that is exponentiated to get the relative hazard) the next step
is to estimate a regression where the estimated log-relative hazard is the dependent variable and the
independent variable is the centered offense seriousness level This is the meta-regression It is
specific to a criminal history category so there are six meta-regressions This specification allows us
to examine how the log-relative hazard varies over the offense seriousness levels That is the
regressions allow us to combine effects (our main motivation) and test for heterogeneity (a
secondary motivation)
Effects may be heterogeneous across offense seriousness levels for two reasons For one
offenders convicted of the most serious crimes who serve the longest prison terms may respond
differently to incremental increases in the lengths of their terms than do offenders convicted of the
least serious crimes who serve the shortest prison terms For another for offenders convicted of
the most serious crimes the incremental change in the length of a prison term from cell j to j+2 is
much larger than the incremental change for offenders convicted of the least serious crimes (See
Table 3) Heterogeneity in treatment effects seems likely but how that heterogeneity varies with
offense severity level is uncertain Examining Tables 1-3 recalling the selection rules and recalling
that we are using weighted least squares regression to estimate the heterogeneity information used
by the regression comes mostly from the middle offense seriousness levels so incremental changes
to time-served are fairly constant Quite possibly there is heterogeneity but we will have insufficient
power to detect it
As before the analysis is stratified on the criminal history category so for each regression
there are potentially 41 data points but many fewer (29 to 37 in the main analysis) enter the meta-
regression because of selection criteria identified earlier Referring to Tables 1 and 2 almost all the
lost contrasts come from having too few cases per cell or from having a low proportion of prison
40
The Relationship between Prison Length of Stay and Recidivism -- This report was prepared by Abt Associates using Federal funding provided by the Bureau of Justice Statistics (BJS) Opinions andor points of view expressed are those of the author(s) and do not necessarily reflect the official position or policies of the US Department of Justice
terms per cell referring to Table 3 few cells (and hence contrasts) are lost because average prison
terms do not increase from cell j to j+2 Because the RDD identifies the effect the right-hand-side
variables are not control variables rather the meta-regression is a descriptive device (with statistical
implications) helping us to detect possible patterns
Estimation has multiple steps We summarize with an algorithm
1 Select all offenders from criminal history category k = 1
a Select all offenders with offense seriousness levels j = 1 and j = 3 If the jj+2 contrast
does not meet selection criteria increase j by 1 and try again
b It the jj+2 contrast meets the selection criteria estimate a Cox regression where a
dummy variable is coded 1 for offenders in offense seriousness level j+2 and coded 0
for offenders in offense seriousness level j The parameter associated with this
dummy variable is the log-relative hazard for the jj+2 contrast Save this estimate
c Increase j by 1 and repeat steps a-c until j = 41
d Estimate a meta-regression where the dependent variable is the log-relative hazards
from steps a-c The independent variables are a constant and the centered offense
seriousness level equal to j+2 for the jj+2 contrast Save the estimated constant and
its standard error for use in step 3
2 Repeat steps 1a-d for criminal history categories 1-6 This leads to six estimated constants
and six estimated standard errors for step 3
3 For step 3 create weights proportional to the inverse of the squares of the six standard
errors The final estimate is the weighted average of the six estimated constants This is
interpreted as the average log-relative hazard Results are discussed below
41
The Relationship between Prison Length of Stay and Recidivism -- This report was prepared by Abt Associates using Federal funding provided by the Bureau of Justice Statistics (BJS) Opinions andor points of view expressed are those of the author(s) and do not necessarily reflect the official position or policies of the US Department of Justice
MAIN RESULTS
The main model adopts the following selection criteria
bull For a guideline cell to be included in the analysis 100 or more offenders must appear within that cell
bull For a guideline cell to be included in the analysis 50 or more of offenders must have received prison terms
Comparisons are of outcomes in cell j+2 and cell j
The main results are shown in Figure 2 The figure shows patterns in the relative hazards and
associated statistics The figure has six panels one for each of the criminal history categories
Within each panel the vertical axis is the scale for the relative hazard as estimated by the Cox model
A hazard equal to 1 implies that increasing prison time has a neutral effect on recidivism A hazard
greater than 1 implies that increasing prison time increases recidivism a hazard less than 1 implies
that increasing prison time decreases recidivism The horizontal axis corresponds to the contrast
The offense seriousness level of 3 is the contrast between offense seriousness levels 1 and 3 the
offense seriousness level of 4 is the contrast between levels 2 and 4 and so on until level 43 Within
each panel the dots report the relative hazards as estimated using the Cox model When we could
not estimate the relative hazard because of the cell exclusion criteria the point is missing The
vertical lines surrounding the dots are 95 confidence intervals for the relative hazards They are
non-symmetric and when the confidence interval extends above 25 it is truncated at 25 for
improved resolution of the figures The three lines running left to right come from the regression
the straight line shows the prediction and the curved lines represent a 95 confidence interval for
the regression line ndash not to be confused with a 95 confidence interval for a predicted point
explaining why many points fall outside the confidence interval for the regression
Insert Figure 2 about here
42
The Relationship between Prison Length of Stay and Recidivism -- This report was prepared by Abt Associates using Federal funding provided by the Bureau of Justice Statistics (BJS) Opinions andor points of view expressed are those of the author(s) and do not necessarily reflect the official position or policies of the US Department of Justice
The table below the figure shows associated statistics from the meta-regression Recall the
dependent variable is the parameter associated with the log-relative hazard ndash that is the natural
logarithm of the relative hazard The row specified as ldquolinearrdquo identifies the centered offense
severity level variable entering the weighted least squares meta-regression The simple regression
specification has a constant and a term that is linear in the centered offense severity level Because
the estimator is weighted least squares and given the offense severity level is centered the constant
is the weighted average effect across the contrasts It is our principal interest R2 has its usual
interpretation but note that any ldquoexplained variancerdquo is attributable to the linear trend because we
are most interested in the constant R2 is not an especially important statistic and certainly has no
interpretation as the ldquogoodness of fitrdquo for our purposes because the constant does not contribute to
R2 At a maximum the regression would be based on 41 observations (N in the table) but fewer data
points enter the analysis because (as already discussed) we discarded contrasts that failed to meet
predetermined criteria
The table below the figure requires some additional explanation Recall the right-hand-side
variable was centered so the constant can be interpreted as an average A constant of zero is
neutral implying that on average additional prison time neither increases nor decreases recidivism
A positive constant implies that additional prison time increases recidivism a negative constant
implies that additional prison time decreases recidivism Converting these constants into a hazard
metric just requires exponentiation Letting α be the constant exp(α) is the relative hazard Letting
σ2 represent the constantrsquos estimated sampling variance by the delta rule the estimated sampling
variance for the hazard is exp(α)2 σ2 These transformations are employed when drawing Figure 2
Examining the table below Figure 2 the constant is negative and statistically significant in all
six regressions On average the estimated constant equals -0073 and is statistically significant with a
43
The Relationship between Prison Length of Stay and Recidivism -- This report was prepared by Abt Associates using Federal funding provided by the Bureau of Justice Statistics (BJS) Opinions andor points of view expressed are those of the author(s) and do not necessarily reflect the official position or policies of the US Department of Justice
standard error of 0007 The implied hazard is 0930 These are the inverse-variance weighted
estimates across the six criminal history categories The linear slopes have mixed signs and are never
statistically significant so we detect no heterogeneity
We must be caution about this interpretation Suppose as suggested by the evidence the
relative hazards are the same for all criminal history categories Looking at table 3 the average
increase in time-served for a move from cell j to j+2 is about 7 months for criminal history category 1
and about 10 months for criminal history category 6 Thus a somewhat larger increase in time-
served for more serious criminal history categories achieves about the same effect as a somewhat
smaller increase in time-served for less serious criminal history categories This might be taken as
some evidence of criminal history heterogeneity but if so the evidence is not especially compelling
Outliers are a potential concern in Figure 2 However when an outlier appears it is
associated with a high standard error and plays a small role in the weighted least squares regression
Therefore we conclude that outliers are not a practical concern
On average the estimated relative hazard that results from moving from cell j to cell j+2 is
0930 Qualitatively a relative hazard less than 1 implies that a longer prison term decreases
recidivism but translating this relative hazard into a quantitative decrease in the probability of
recidivism is complicated because the decrease in the probability of recidivism varies across the jj+2
comparisons A descriptive summary provides some intuition
First continue to consider the relative hazard as a metric On average across the severity
levels and the criminal history categories moving from cell j to cell j+2 increases time-served by
about 27 (On average this 27 change equals about 54 months) This is to say that a 27
increase in the length of incarceration appears to reduce the instantaneous probability of recidivism
(eg the hazard) by less than 10 percent For readers who are familiar with interpreting hazards a
44
The Relationship between Prison Length of Stay and Recidivism -- This report was prepared by Abt Associates using Federal funding provided by the Bureau of Justice Statistics (BJS) Opinions andor points of view expressed are those of the author(s) and do not necessarily reflect the official position or policies of the US Department of Justice
sizable increase in prison time (namely a 27 increase on average) has a fairly small decrease in the
relative hazard (by a multiple of 0930) Admittedly the descriptive term fairly small is subjective
and a reader can make his or her own subjective assessment
A change in the instantaneous probability of recidivism ndash the relative hazard ndash is not the
same as a change in the probability of recidivism Second then consider the probability of
recidivism as a metric We can get a sense of how a change in the relative hazard affects the
probability of recidivism Because we are using the Cox model the probability of recidivism equals
one minus the baseline survival rate to the power of the relative hazard (Hosmer Lemeshow amp May
2008 p 72) For our data the probability of recidivism is about 02 within three years (See figure
1) The relative hazard is about 0930 So a 27 increase in the length of incarceration would
decrease the probability of recidivism by about 02 ndash (1-080930) That is from a base rate of
recidivism of about 20 a 27 increase in prison time would cause recidivism to fall to about 187
Readers can draw their own conclusions but our sense is the effect is not large and that prison
length of stay has a largely neutral effect on recidivism
Once again some caution is merited If we again accept the relative hazards are about the
same across the six criminal history categories figure 1 shows the baseline rates of recidivism are
progressively higher as the criminal history category increases from k=1 to k=6 so the percentage
change in recidivism is larger for more serious criminal history categories than for the lesser criminal
history categories This might be deemed heterogeneity ndash that increasing time-served has a larger
effect on the most serious offenders We are reluctant to accept such a conclusion because it comes
from accepting the null hypothesis of constant relative hazards across the criminal history categories
More likely if such heterogeneity exists we have too little power to detect its effect
45
The Relationship between Prison Length of Stay and Recidivism -- This report was prepared by Abt Associates using Federal funding provided by the Bureau of Justice Statistics (BJS) Opinions andor points of view expressed are those of the author(s) and do not necessarily reflect the official position or policies of the US Department of Justice
It is possible to stratify the analysis by sex by race and by education ndash variables described
earlier Cell sizes get small so we restrict the analysis to offenders in criminal history category 1 and
we require a minimum of 50 offenders per cell rather than 100 For men the relative hazard is
0935 and for women it is 0931 but these differences are not statistically significant so we fail to
reject the null that prison length has the same effect on men and on women For white offenders
the relative hazard is 0936 and for black offenders the relative hazard is 0932 and the difference is
not statistically significant so we fail to reject the null that prison length has the same effect on
white and black offenders For offenders who lack high school degrees the relative hazard is 0930
and for offenders who have high school degrees the relative hazard is 0933 The difference is not
statistically significance This test based on education is not as sensitive as desired because most
offenders have high school degrees or the equivalent Overall we do not find strong evidence the
effect of time-served on recidivism is sensitive to sex race or education
We observed that an IV estimator should lead to estimates that are like the RDD estimates
We demonstrate that here The only difference between the IV and RDD approaches is that for the
IV approach the treatment variable is the mean time-served in cell j+2 or j and for the RDD
approach the treatment variable is a dummy variable denoting sentencing in cell j+2 rather than cell
j17 Interpretations differ For the IV approach the treatment effect is the change in recidivism per
month of additional time-served for the RDD approach the treatment effect is the change in
recidivism from being sentenced in cell j+2 rather than cell j These differences are scale effects we
do not expect then to change substantive interpretations
17 Instrumental variable estimation often uses a two-step approach In the first step the treatment variable (here the time served) is regressed on the instrument (and perhaps some additional variables) to predict the treatment (or in our case the average time-served) In the second step the average time-served replaces the observed time-served We compute average time-served without using the first-step regression
46
The Relationship between Prison Length of Stay and Recidivism -- This report was prepared by Abt Associates using Federal funding provided by the Bureau of Justice Statistics (BJS) Opinions andor points of view expressed are those of the author(s) and do not necessarily reflect the official position or policies of the US Department of Justice
Figure 3 reports results from the IV estimation Across the six criminal history categories the
weighted average effect size is -00122 which is statistically significant at P lt 001 While this effect
seems much smaller than the effect based on the RDD when we multiple by the average increase in
time-served between cell j and j+2 the rescaled effect is -0066 and relative hazard of a 54 month
increase in the sentence is 0936 There is no material difference between the RDD estimator and
the RDD estimator
Insert Figure 3 about here
SENSITIVITY TESTING
We conducted sensitivity tests evaluating whether the effect of length of stay on recidivism
depends on constraints we applied to produce the results shown in Figure 2 and its associated table
Minimum Cell Size of 50 instead of 100 - Figure 4 A first step in sensitivity testing is to learn
whether requiring a minimum of 50 cases instead of 100 cases per cell changes findings The
advantage to relaxing this assumption is that we gain a few data points The disadvantage is that
some of those new data points have extreme values As before the constant is always negative and
statistically significant The weighted average is -0073 with a standard error of 0007 and the
implied relative hazard is 0930 Because we use weighted least squares results do not change much
from those reported for the main model despite the expansion of sample size estimates with large
standard errors do not contribute much to the regression
Insert Figure 4 about here
Minimum cell size of 150 instead of 100 ndash Figure 5 If we set a criterion of 150 cases per cell instead
of 100 we lose a few data points The constant remains negative and statistically significant across
the six criminal history categories Overall the average constant is -0071 (with a standard error
47
The Relationship between Prison Length of Stay and Recidivism -- This report was prepared by Abt Associates using Federal funding provided by the Bureau of Justice Statistics (BJS) Opinions andor points of view expressed are those of the author(s) and do not necessarily reflect the official position or policies of the US Department of Justice
0008) and the corresponding relative hazard is 0931 Apparently the findings are insensitive to the
criterion for cases per cell because the weighted least squares analysis is dominated by calculations
that are based on large cell sizes For the remaining sensitivity tests we set the minimum cell size to
100
Insert Figure 5 about here
Minimum percentage of prison terms 75 instead of 50 - Figure 6 The next sensitivity test
changes the criterion for minimum percentage of prison terms to be 75 within a cell rather than
50 within a cell As expected some cells are excluded from the analysis but as before the
substantive findings do not much change The average affect is -0077 with standard error of 0009
The increased standard error is understandable Given the RDD basically calls for a difference in
mean estimates between cells j and j+2 (conditional on covariates) the effective sample size for
computing variances is the number of offenders within a cell multiplied by the proportion who are
sentenced to prison Cells with high proportions of offenders serving probation terms have high
sampling variances for two reasons (1) The effective sample size is smaller than the apparent sample
size based on the number of offenders within a cell (2) The average difference in time-served
between cells j and j+2 tends to be small (so the effect is small and has high sampling variance) for
those cells where probation is especially likely Consequently given the regressions use weights that
are inversely proportional to the sampling variance the estimates are insensitive to the criterion
establishing a minimum proportion of offenders sentenced to prison
Insert Figure 6 about here
Contrasts that are j and j+1 instead of j and j+2 ndash Figure 7 We believe that contrasts observed by
comparing cells j and j+2 are more appropriate for this analysis than contrasts observed by
comparing cells j and j+1 because the contrast between j and j+2 provides assurance that average
48
The Relationship between Prison Length of Stay and Recidivism -- This report was prepared by Abt Associates using Federal funding provided by the Bureau of Justice Statistics (BJS) Opinions andor points of view expressed are those of the author(s) and do not necessarily reflect the official position or policies of the US Department of Justice
prison terms increase by a substantial amount This assurance is not forthcoming when comparing
cells j and j+1 Nevertheless increasing the distance between compared cells raises validity
challenges because the RDD rests on an assumption that offenders within both compared cells are
alike in ways that affect recidivism The closer the cells the more justified the assumption For this
sensitivity test we maintain the original criteria for selecting cells but contrast cell j with cell j+1
(We discard contrasts where the average sentence in cell j+1 is less than the average sentence in cell
j) Averaged across the six estimates the estimated constant is -0030 with a standard error of 0013
This is statistically significant at P lt 005 The relative hazard is 0970 While results from the jj+1
contrasts are smaller than those from the jj+2 contrasts this is expected because the jj+2 contrast
results in a larger increase in time-served and consequently a larger effect
Insert Figure 7 about here
Contrasts testing for auto-correlation using the Prais-Winston estimator ndash Figure 8 The analysis
immediately above which changed the comparison from cells jj+2 to cells jj+1 suggests another
sensitivity test Earlier we commented that by construction we may have induced autocorrelation in
the data used for the final step regression For example consider the estimated hazard for cells j and
j+1 and the estimated hazard for cells j+1 and j+2 The estimates have j+1 in common and this may
introduce first-order autocorrelation into the analysis Following recommendations from Greene we
have elected to ignore this complication because commonly used corrections have uncertain small
sample properties However we can test how much the autocorrelation affects the results using a
Prais-Winston estimator a feasible generalized least squares estimator that corrects for first-order
autocorrelation
Insert Figure 8 about here
49
The Relationship between Prison Length of Stay and Recidivism -- This report was prepared by Abt Associates using Federal funding provided by the Bureau of Justice Statistics (BJS) Opinions andor points of view expressed are those of the author(s) and do not necessarily reflect the official position or policies of the US Department of Justice
A problem when using the Prais-Winston estimator is that we cannot simultaneously adjust
for autocorrelation and heteroscedasticity To correct estimated standard errors we can employ a
robust covariance estimator but this is problematic in two ways First without adjusting for
heteroscedasticity during parameter estimation the solution is inefficient because the data points
with large standard errors receive the same weight as the data points with low standard errors
Figure 2 suggests the inefficiency can be large Second the Prais-Winston estimator assumes
homoscedasticity but we know that our data are heteroscedastic To deal with this problem we
adopt restrictions (1) There must be 150 observations per cell and (2) at least 75 of offenders
within any cell must receive prison terms The idea is to minimize heteroscedasticity and we have
already seen that imposing these restrictions has little effect on results Allowing the contrast to be
jj+1 which may cause a one-lag autocorrelation we use a Prais-Winston estimator to estimate the
effects
The sensitivity test is encouraging The estimates for ρ the autocorrelation efficient have
mixed signs We take this wide variation in the estimates of ρ to mean the estimates are imprecise
Apparently provided we restrict estimates to cells with enough offenders we induce modest
autocorrelation and our decision to ignore autocorrelation seems justified Second basing the
results on the Prais-Winston estimator does not make a big difference in the findings The average
value for the constant is -0042 with a standard error of 0008
Separating contrasts into independent sets ndash Tables 6 and 7 Another approach to dealing with
autocorrelation is straightforward and can be performed with the jj+2 contrasts and both the 100
observations per cell criterion and the 050 prison sentence criterion To explain consider the
contrasts based on cells 13 24 35 46 57 and so on The contrasts 13 and 24 are
independent and the contrast 35 and 46 are independent but the contrasts 13 and 35 are not
50
The Relationship between Prison Length of Stay and Recidivism -- This report was prepared by Abt Associates using Federal funding provided by the Bureau of Justice Statistics (BJS) Opinions andor points of view expressed are those of the author(s) and do not necessarily reflect the official position or policies of the US Department of Justice
independent because they both rely on cell 3 A solution is to break the analysis into two parts In
the first part we use the contrasts 13 24 57 68 and so on in the second part we use the
contrasts 35 46 79 810 and so on For each analysis the effects can be averaged across the
criminal history categories and then across the two analyses For the first analysis the effect is -
0034 with a standard error of 0018 For the second analysis the effect is -0106 with a standard
error of 0030 significant at p lt 001 The average effect is -0067 with a standard error of 0018
Recalling the effect from the main analysis was -0073 with a standard error of 0007 these new
results are very close even though they are based on a different weighting scheme (a result of
running two regressions instead of one) As with the previous test we take this sensitivity test as
evidence that provided we restrict the effective number of observations per cell results are
insensitive to autocorrelation
Insert Table 6 and Table 7 about here
Entering prison as recidivism ndash Figure 9 An additional sensitivity test returns to the original model
specification whose results were presented in Figure 2 and changes the definition of recidivism from
ldquoentering prison or being revoked from community supervisionrdquo to ldquoentering prisonrdquo We are unsure
of the best definition of recidivism but it appears the definition does not much matter The
estimated effects are about the same The log-relative hazard is -0076 with a standard error of
0007 the relative hazard is 0927 The rate of recidivism is about 20 percent using the
comprehensive definition of returning to prison or being revoked and slightly less than 19 percent
when using the more restrictive definition of returning to prison so consistency between the main
results and results from this sensitivity test is not surprising
Insert Figure 9 about here
51
The Relationship between Prison Length of Stay and Recidivism -- This report was prepared by Abt Associates using Federal funding provided by the Bureau of Justice Statistics (BJS) Opinions andor points of view expressed are those of the author(s) and do not necessarily reflect the official position or policies of the US Department of Justice
Eliminating drug law offenders from the analysis ndash Figure 10 A final analysis recognizes that drug
law violations are somewhat peculiar to the federal system High-level drug dealing is often dealt
with in the federal system because cross-border drug dealing is a federal law enforcement
responsibility the federal government has more resources for dealing with high-level drug dealing
than do state governments and even when state and federal authorities collaborate federal
prosecution is typical because federal sentences are more severe18 Judges frequently sentence
high-level drug dealers to Congressionally-mandated mandatory minimums so for high-level drug
dealers the guidelines operate differently than described earlier Another sensitivity test results
from removing drug-law violators from the analysis
Insert Figure 10 about here
With the removal of drug-law violations fewer cells enter the analysis but the parameter estimates
do not change much so qualitative conclusions do not change The average effect is -0060 with a
standard error of 0008 This is statistically significant at plt001 Dropping drug law violators does
not alter conclusions
Eliminating covariates from the analysis ndash Figure 11 Reviewers of an earlier version of this study
wondered if findings based on Cox regressions with no covariates would be the same as findings
based on Cox regressions with covariates After eliminating covariates the weighted average effect
is -0073 with a standard error of 0008 Removing covariates has caused the standard error to
increase by about 10 but has not altered substantive conclusions This is sensible The covariates
were unnecessary for identification but they have the potential to reduce standard errors
18 This assertion is based on the authorsrsquo extensive experience performing program reviews for High Intensity Drug Trafficking Areas multijurisdictional drug task forces with federal state and local participation Our team has visited all 28 HIDTAs over a five-year period The assertion made in the text is based on those visits
52
The Relationship between Prison Length of Stay and Recidivism -- This report was prepared by Abt Associates using Federal funding provided by the Bureau of Justice Statistics (BJS) Opinions andor points of view expressed are those of the author(s) and do not necessarily reflect the official position or policies of the US Department of Justice
Figure 11 about here
Using the Earlier Guidelines ndash Figure 12 Reviewers of an earlier version of this study also observed
that guidelines have changed over the period of this study and expressed concern that these changes
may affect conclusions We doubt these changes matter because cell j+2 has always had longer
terms than cell j Nevertheless in response to reviewersrsquo concerns we identify the mean date for
guidelines entering the analysis and we perform the analysis on just those offenders sentenced
under the guidelines prior to that mean date The effect is ndash 0088 with a standard error of 0009
The relative hazard is 0916 It seems unlikely that changes to the guidelines account for findings
Figure 12 about here
Examining offenders sentenced during the earlier years provides another implicit diagnostic test
Because the analysis is based on offenders who completed their prison terms and were released to
community supervision offenders with high offense seriousness scores or high criminal history
scores and therefore long prison terms are unlikely to enter they analysis when sentenced close to
the data collection period Any resulting bias is lessened by restricting the analysis to offenders
sentenced during the early part of the data collection period If there is a selection bias it does not
appear to be serious
Summarizing the sensitivity testing From the principal analysis the estimated average effect across
the six criminal history categories was -0073 with a standard error of 0007 Provided we contrast
outcomes in cells j and j+2 results do not much change over sensitivity tests and even when we
contrast outcomes in cells j and j+1 results conform with expectations
53
The Relationship between Prison Length of Stay and Recidivism -- This report was prepared by Abt Associates using Federal funding provided by the Bureau of Justice Statistics (BJS) Opinions andor points of view expressed are those of the author(s) and do not necessarily reflect the official position or policies of the US Department of Justice
DISCUSSION
The effect of prison length of stay on recidivism has implications for both theory and policy
From a theoretical perspective incarceration is a potentially transformative event experienced
during an offenderrsquos life course This study provides no evidence that an offenderrsquos criminal
trajectory is negatively affected ndash that is that criminal behavior is accelerated ndash by the length of an
offenderrsquos prison term If anything longer prison terms modestly reduce rates of recidivism beyond
what is attributable to incapacitation This ldquotreatment effectrdquo of a longer period of incarceration is
small The three-year base rate of 20 recidivism is reduced to 187 when prison length of stay
increases by an average of 54 months We are inclined to characterize this as a benign close to
neutral effect on recidivism From a policy perspective prison length of stay can be reduced without
incurring a large increase in recidivism
All observational studies come with validity challenges Still a regression discontinuity
design is a strong quasi-experimental design and we have argued the guidelinesrsquo structure satisfies
the assumptions of an RDD We conducted many sensitivity tests to assess the robustness of the
results The findings require qualification Because of limitations in the bandwidth of an RDD design
we are unable to examine how long prison terms (say five years) affect recidivism relative to
relatively short terms (say two years) The logic of the RDD forces us to compare prison terms of
length L relative to prison terms that are about 27 longer While this is a limitation in the
application of the RDD design it seems unlikely that Congress or the US Sentencing Commission
would reduce terms by a large percentage but not inconceivable that they might reduce prison
terms by a small percentage Thus these findings ndash limited to small changes in prison terms ndash have
implications for sentencing reform
54
The Relationship between Prison Length of Stay and Recidivism -- This report was prepared by Abt Associates using Federal funding provided by the Bureau of Justice Statistics (BJS) Opinions andor points of view expressed are those of the author(s) and do not necessarily reflect the official position or policies of the US Department of Justice
A secondary goal of this research was to examine potential heterogeneity in the effects of
prison length of stay To evaluate heterogeneity we examine whether exogenous covariates
moderate the effect of length of stay Neither offense seriousness nor criminal history moderate the
effect of prison length of stay In the context of federal sentencing these would be two of the most
important potential moderators of prison length of stay The Sentencing Reform Act of 1984
precludes federal judges from using demographic factors in assigning sentences even if these are
empirical moderators of the effect of prison length of stay We also found the effect of time-served
on recidivism was invariant with respect to sex race and education
One class of moderators suggested by Mears Cochran and Cullen (2014) is the level of post-
release supervision In many state jurisdictions a sizable number of offenders are released without
supervision For those released to supervision the level of community control and surveillance is
usually commensurate to risk This source of heterogeneity is limited in the federal context because
everyone receives a term of post-release supervision We censored anyone whose supervision ended
prior to the end of the three-year follow-up period Post-release supervision is also a potential source
of bias as suggested by Roodman but we could eliminate this potential artifact because everyone in
our sample received a term of post-release supervision and they were censored when that term
ended
Some additional caveats are applicable First the results apply to adults Rarely appearing in
federal court juveniles are excluded from the analysis Second we offer no comparison between
adult offenders sentenced to prison rather than probation Third although there is considerable
overlap between federal and state crimes jurisdictional differences cause federal crimes to differ
from state crime counterparts so the relationship between prison terms and recidivism at the state
level may differ from the relationship at the federal level These are important inter-jurisdictional
55
The Relationship between Prison Length of Stay and Recidivism -- This report was prepared by Abt Associates using Federal funding provided by the Bureau of Justice Statistics (BJS) Opinions andor points of view expressed are those of the author(s) and do not necessarily reflect the official position or policies of the US Department of Justice
differences but by removing offenders who were deported or transferred to other authorities we
have made the federal offenders look more like state offenders and when we exclude high-level
drug traffickers results do not much change Furthermore federal jurisdiction is national while
state jurisdictions are local so a study based on national data has a stronger claim to generalizability
It is difficult to see how federal and state crimes are so different that criminologist can disregard
these findings A further limitation of our findings is that they apply only to offenders who receive a
term of community supervision after their release May states have offenders who receive no such
post-release supervision
While some scholars might consider the federal system unique and our results limited to
federal offenders there are many structural differences among states that often preclude
generalizations beyond a specific state as well Even if these findings are not generalizable to state
jurisdictions the federal prison population is about 12 percent of all incarcerated offenders and
represents a significant public policy concern
As we mentioned the RDD framework only allows us to examine relatively small increments
in time-served ndash about 54 months on average Although these are small relative changes these are
not small absolute changes Five additional months in prison is a serious disruption of an offenderrsquos
life and the associated cost savings of a five-month reduction in federal prison length of stay would
save substantial capital and operational costs We make a back-of-the-envelope estimate of potential
savings in prison beds The current average federal prison length of stay for federally sentenced
prisoners is about 35 months A reduction of 5 months in a steady state system would reduce the
prison population over time by 15 percent Given the current Bureau of Prisons inmate population of
195000 a 15 percent reduction would save 29000 beds Under this scenario the BOP could close
prisons rather than simply reduce the prison population in each of its facilities saving both
56
The Relationship between Prison Length of Stay and Recidivism -- This report was prepared by Abt Associates using Federal funding provided by the Bureau of Justice Statistics (BJS) Opinions andor points of view expressed are those of the author(s) and do not necessarily reflect the official position or policies of the US Department of Justice
operational and maintenance costs This back-of-the-envelope calculation shows that small
decrements in length of stay can have large impacts when they are not confined to select subgroups
of offenders
Amplifying this latter point one of the advantages to evaluating prison length of stay is that
any change will have a broad impact on the entire incarcerated population Most contemporary
reforms such as those found in states which implemented the Justice Reinvestment Initiative (JRI)
seek to move the least serious offenders convicted of the least serious crimes from prison to
community corrections (La Vigne et al 2014) Low-level offenders are a very small proportion of
federal prison stocks and based on tabulations from the National Corrections Reporting Program
they are also a small proportion of state prison stocks A policy shift that reduces the length of all
federal prison terms by 27 percent would reduce the federal prison stock by about 29000 inmates
without unduly harming public safety This policy change would have a bigger impact on the federal
prison population than diverting offenders with low offense seriousness and minor or no criminal
history
Prisons are expensive and reducing prison stays has the potential to save public expenditures
(La Vigne et al 2014) Nevertheless advocates of general deterrence and incapacitation might
argue that maintaining or even increasing the length of prison stays is worth the additional expense
and at least increasing prison stays will not make offenders any more criminogenic Nagin et al
(2009) propose a theoretical model that frames these questions distinguishing between high and low
sanction regimes Higher sanction regimes have a higher probability of imprisonment and longer
length of stay than low sanction regimes This model specifies relationships between these relative
regimes the size of the prison populations sizes of the populations with and without a prison record
and the underlying crime rate The model provides a framework for addressing the interrelationship
57
The Relationship between Prison Length of Stay and Recidivism -- This report was prepared by Abt Associates using Federal funding provided by the Bureau of Justice Statistics (BJS) Opinions andor points of view expressed are those of the author(s) and do not necessarily reflect the official position or policies of the US Department of Justice
among these factors without precisely specifying how the outputs change under the low and high
sanction regimes It is straightforward to postulate that high sanction regimes will produce more
people with criminal records however the impact of a high sanction regime on the crime rate is
uncertain High sanction regimes may preclude more crime through general deterrence but may
increase crime if imprisonment is criminogenic not just for the individual but for the prisonerrsquos
family and the community (NRC 2014) The marginal effects and the sizes of the subpopulations
affected will determine the impact on crime rates If we could analyze all the system dynamics of this
model simultaneously we could optimize the level of sanctions to minimize the crime rate In the
absence of such a comprehensive model policy goals should be circumscribed If length of stays
were reduced incrementally it is hard to see how this would have more than a minor effect on crime
through any general deterrent mediated impact and from our results through any criminogenic
impact on the offender
Savings from reduced prison usage can be diverted into evidence-based programs that
reduce offending but such diversion is unlikely as most JRI states have put savings into other non-
justice programs (La Vigne et al 2014) Even if these funds are diverted to other social welfare
programs higher education or other state and local needs we would expect a net social welfare
benefit
58
The Relationship between Prison Length of Stay and Recidivism -- This report was prepared by Abt Associates using Federal funding provided by the Bureau of Justice Statistics (BJS) Opinions andor points of view expressed are those of the author(s) and do not necessarily reflect the official position or policies of the US Department of Justice
REFERENCES
Andrews D A and James Bonta 2006 The Psychology of Criminal Conduct 4th ed Cincinnati Anderson Pub
Andrews D A Ivan Zinger Robert D Hoge James Bonta Paul Gendreau and Francis T Cullen 1990 Does Correctional Treatment Work A Clinically Relevant and Psychologically Informed Meta-Analysis Criminology 28 (3) 369ndash404 doi101111j1745-91251990tb01330x
Angrist Joshua D 2006 Instrumental Variables Methods in Experimental Criminological Research What Why and How Journal of Experimental Criminology 2 (1) 23ndash44 doi101007s11292-005-5126-x
Becker Gary S 1968 Crime and Punishment An Economic Approach Journal of Political Economy 76 (2) 169ndash217 doi101086259394
Berecochea John E and Dorothy R Jaman and Welton A Jones 1981 Time Served in Prison and Parole Outcome - An Experimental Study Report Number 2 Sacramento
Berk Richard 2010 Recent Perspectives on the Regression Discontinuity Design Essay In Handbook of Quantitative Criminology eds Alexis Russell Piquero and David Weisburd New York Springer
Berk Richard A and David Rauma 1983 Capitalizing on Nonrandom Assignment to Treatments A Regression-Discontinuity Evaluation of a Crime-Control Program Journal of the American Statistical Association 78 (381) 21ndash27 doi10108001621459198310477917
Berk Richard A and Jan De Leeuw 1999 An Evaluation of Californias Inmate Classification System Using a Generalized Regression Discontinuity Design Journal of the American Statistical Association 94 (448) 1045ndash52 doi10108001621459199910473857
Berk Richard Geoffrey Barnes Lindsay Ahlman and Ellen Kurtz 2010 When Second Best Is Good Enough A Comparison between a True Experiment and a Regression Discontinuity Quasi-Experiment Journal of Experimental Criminology 6 (2) 191ndash208 doi101007s11292-010-9095-3
Berube Danton and Donald P Green 2007 The Effects of Sentencing on Recidivism Results from a Natural Experiment Ms The Effects of Sentencing on Recidivism Results from a Natural Experiment New Haven
Bloom Howard S 2012 Modern Regression Discontinuity Analysis Journal of Research on Educational Effectiveness 5 (1) 43ndash82 doi101080193457472011578707
Bor J Moscoe E Mutevedzi P Newell M amp Barnighausem T (2014) Regression Discontinuity Designs in Epidemiology Epidemiology 25(5) 729-737
59
The Relationship between Prison Length of Stay and Recidivism -- This report was prepared by Abt Associates using Federal funding provided by the Bureau of Justice Statistics (BJS) Opinions andor points of view expressed are those of the author(s) and do not necessarily reflect the official position or policies of the US Department of Justice
Boshier R and D Johnson 1974 Does Conviction Affect Employment Opportunities British Journal of Criminology 14 264ndash68
Braithwaite John 1989 Crime Shame and Reintegration Cambridge Cambridge University Press
Cameron Adrian Colin and P K Trivedi 2005 Microeconometrics Methods and Applications Cambridge Cambridge University Press
Carroll Leo 1988 Hacks Blacks and Cons Race Relations in a Maximum Security Prison Prospect Heights IL Waveland Press
Cattaneo Matias D Rociacuteo Titiunik Gonzalo Vazquez-Bare and Luke Keele 2016 Interpreting Regression Discontinuity Designs with Multiple Cutoffs The Journal of Politics 78 (3) doi101086686802
Chen M Keith and Jesse M Shapiro 2007 Do Harsher Prison Conditions Reduce Recidivism A Discontinuity-Based Approach American Law and Economics Review 9 (1) 1ndash29 doi101093alerahm006
Clemmer Donald 1940 The Prison Community Boston The Christopher Publishing House
Cook Thomas D 2008 lsquoWaiting for Life to Arriversquo A History of the Regression-Discontinuity Design in Psychology Statistics and Economics Journal of Econometrics 142 (2) 636ndash54 doi101016jjeconom200705002
Cullen Francis T Cheryl Lero Jonson and Daniel S Nagin 2011 Prisons Do Not Reduce Recidivism The High Cost of Ignoring Science The Prison Journal 91 (3 Suppl) doi1011770032885511415224
Deschenes Elizabeth Piper Susan Piper and Joan Petersilia 1995 Intensive Community Supervision in Minnesota A Dual Experiment in Prison Diversion and Enhanced Supervised Release Santa Monica CA RAND Corporation
DiNardo John and David S Lee 2010 Program Evaluation and Research Designs Essay In Handbook of Labor Economics eds Orley Ashenfelter and David Card Vol 4A Elsevier
Drago Francesco Roberto Galbiati and Pietro Vertova 2009 The Deterrent Effects of Prison Evidence from a Natural Experiment Journal of Political Economy 117 (2) 257ndash80 doi101086599286
Fleisher Mark S 1989 Warehousing Violence Newbury Park CA Sage Publications
Gaes Gerald G William D Bales and Samuel J A Scaggs 2016 The Effect of Imprisonment on Recommitment An Analysis Using Exact Coarsened Exact and Radius Matching with the Propensity Score Journal of Experimental Criminology 12 (1) 143ndash58 doi101007s11292-015-9251-x
Gaes Gerald G and Scott D Camp 2009 Unintended Consequences Experimental Evidence for the Criminogenic Effect of Prison Security Level Placement on Post-Release Recidivism Journal of Experimental Criminology 5 (2) 139ndash62 doi101007s11292-009-9070-z
60
The Relationship between Prison Length of Stay and Recidivism -- This report was prepared by Abt Associates using Federal funding provided by the Bureau of Justice Statistics (BJS) Opinions andor points of view expressed are those of the author(s) and do not necessarily reflect the official position or policies of the US Department of Justice
Gaes Gerald G Timothy J Flanagan Laurence L Motiuk and Lynn Stewart 1999 Adult Correctional Treatment Essay In Crime and Justice a Review of Research Prisons eds Michael Tonry and Joan Petersilia 76361ndash426 Chicago University of Chicago Press
Gendreau Paul Paula Smith and Sheila French 2008 The Theory of Effective Correctional Intervention Empirical Status and Future Directions Essay In Taking Stock The Status of Criminological Theory Advances in Criminological Theory eds T Francis FT Cullen JP Wright and KR Blevins Vol 15 New Brunswick NJ Transaction
Gendreau Paul Claire Goggin and Francis T Cullen 1999 The Effects of Prison Sentences on Recidivism 1999-3 The Effects of Prison Sentences on Recidivism 1999-3 Ottawa Canada Solicitor General
Goffman Erving 1961 Asylums Essays on the Social Situation of Mental Patients and Other Inmates Chicago Aldine
Green Donald P and Daniel Winik 2010 Using Random Judge Assignments to Estimate the Effects of Incarceration and Probation on Recidivism Among Drug Offenders Criminology 48 (2) 357ndash87 doi101111j1745-9125201000189x
Greene William H 2008 Econometric Analysis Upper Saddle River NJ Prentice Hall
Hahn Jinyong Petra Todd and Wilbert Klaauw 2001 Identification and Estimation of Treatment Effects with a Regression-Discontinuity Design Econometrica 69 (1) 201ndash9 doi1011111468-026200183
Hjalmarsson Randi (2009) Juvenile Jails A path to the straight and narrow or to hardened criminality Journal of Law and Economics 52 779-809
Horney Julie D Wayne Osgood and Ineke Haen Marshall 1995 Criminal Careers in the Short-Term Intra-Individual Variability in Crime and Its Relation to Local Life Circumstances American Sociological Review 60 (5) 655 doi1023072096316
Hosmer David W Stanley Lemeshow and Susanne May 2008 Applied Survival Analysis Regression Modeling of Time-to-Event Data Hoboken NJ Wiley-Interscience
Imbens G (2009) Better LATE Than Nothing Some Comments on Deaton (2009) and Heckman and Urzua (2009) Unpublished paper downloaded from httpwwweconomicsharvardedufacultyimbensfilesbltn_09apr10pdf on December 2 2009
Imbens Guido W and Joshua D Angrist 1994 Identification and Estimation of Local Average Treatment Effects Econometrica 62 (2) 467 doi1023072951620
Imbens Guido W and Thomas Lemieux 2007 Regression Discontinuity Designs A Guide to Practice National Bureau of Economic Research Working Paper
61
The Relationship between Prison Length of Stay and Recidivism -- This report was prepared by Abt Associates using Federal funding provided by the Bureau of Justice Statistics (BJS) Opinions andor points of view expressed are those of the author(s) and do not necessarily reflect the official position or policies of the US Department of Justice
Imbens Guido W and Donald B Rubin 2015 Causal Inference for Statistics Social and Biomedical Sciences an Introduction Cambridge Cambridge University Press
Irwin John 1980 Prisons in Turmoil Boston Little Brown
Irwin John 2005 The Warehouse Prison Disposal of the New Dangerous Class Los Angeles CA Roxbury Pub Co
Irwin John (2009) Lifers Seeking redemption in prison (Criminology and justice studies) New York Routledge
Jacobs James B 1977 Statesville The Penitentiary in Mass Society Chicago IL Chicago University Press
Jaman Dorothy R Robert M Dickover and Lawrence A Bennett 1972 Parole Outcome as a Function of Time Served British Journal of Criminology 12 (1) 5ndash34
Kalbfleisch J D and Ross L Prentice 2002 The Statistical Analysis of Failure Time Data Hoboken NJ J Wiley
Kling R W Rhodes D Izrael C Cutler K Shah and C Dyous 2016 Creating an Offender-Based Tracking System Using the FJSP Draft Final for BJS Review Cambridge MA Abt Associates
Kraus J 1981 The Effects of Committal to a Special School for Truants International Journal of Offender Therapy and Comparative Criminology 25 (2) 130ndash38 doi1011770306624x8102500205
Kuziemko I 2012 How Should Inmates Be Released from Prison An Assessment of Parole versus Fixed-Sentence Regimes The Quarterly Journal of Economics 128 (1) 371ndash424 doi101093qjeqjs052
La Vigne Nancy Samuel Bieler Lindsey Cramer Helen Ho Cybele Kotonias Deborah Mayer David McClure Laura Pacifici Erika Parks Bryce Peterson and Julie Samuels 2014 Justice Reinvestment Initiative State Assessment Report Washington DC The Urban Institute
Lancaster Tony 1990 The Econometric Analysis of Transition Data Cambridge Cambridge University Press
Lee David S and Thomas Lemieux 2010 Regression Discontinuity Designs in Economics Journal of Economic Literature 48 (2) 281ndash355 doi101257jel482281
Lee S and Card D 2006 Regression Discontinuity Inference with Specification Error Technical Working paper 322 National Bureau of Economic Research
What Works Clearinghouse Procedures and Standards Handbook Version 30 US Department of Education httpsiesedgovnceewwcDocsreferenceresourceswwc_procedures_v3_0_standards_handboo kpdf
62
The Relationship between Prison Length of Stay and Recidivism -- This report was prepared by Abt Associates using Federal funding provided by the Bureau of Justice Statistics (BJS) Opinions andor points of view expressed are those of the author(s) and do not necessarily reflect the official position or policies of the US Department of Justice
Lerman Amy 2009a The People Prisons Make Effects of Incarceration on Criminal Psychology In Do Prisons make Us Safer The Benefits and Costs of the Prison Boom eds Steven Raphael and Michael A Stoll New York Russel Sage
Lerman Amy 2009b Bowling Alone (With My Own Ball and Chain) Effects of Incarceration and the Dark Side of Social Capital Lecture
Letkemann Peter 1973 Crime as Work Englewood Cliffs NJ Prentice-Hall
Listwan Shelley Johnson Christopher J Sullivan Robert Agnew Francis T Cullen and Mark Colvin 2013 The Pains of Imprisonment Revisited The Impact of Strain on Inmate Recidivism Justice Quarterly 30 (1) 144ndash68 doi101080074188252011597772
Loeffler Charles E 2013 Does Imprisonment Alter the Life Course Evidence on Crime and Employment from A Natural Experiment Criminology 51 (1) 137ndash66 doi1011111745-912512000
Loughran Thomas A Edward P Mulvey Carol A Schubert Jeffrey Fagan Alex R Piquero and Sandra H Losoya 2009 Estimating A Dose-Response Relationship Between Length of Stay and Future Recidivism in Serious Juvenile Offenders Criminology 47 (3) 699ndash740 doi101111j1745-9125200900165x
MacKenzie Doris L 2006 What Works in Corrections Reducing the Criminal Activities of Offenders and Delinquents New York Cambridge University Press
Manski Charles F and Daniel S Nagin 1998 Bounding Disagreements About Treatment Effects A Case Study of Sentencing and Recidivism Sociological Methodology 28 (1) 99ndash137 doi1011110081-175000043
Meade Benjamin Benjamin Steiner Matthew Makarios and Lawrence Travis 2012 Estimating a Dose-Response Relationship Between Time Served in Prison and Recidivism Journal of Research in Crime and Delinquency 50 (4) 525ndash50 doi1011770022427812458928
Mears Daniel P Joshua C Cochran and Francis T Cullen 2014 Incarceration Heterogeneity and Its Implications for Assessing the Effectiveness of Imprisonment on Recidivism Criminal Justice Policy Review 26 (7) 691ndash712 doi1011770887403414528950
Mears Daniel P Joshua C Cochran William D Bales and Avinash S Bhati (2016) Recidivism and time served in prison Journal of Criminal Law and Criminology 106(1) 82-122
Morgan Stephen and Christopher Winship 2015 Counterfactuals and Causal Inference Methods and Principals for Social Research 2nd ed Cambridge MA Cambridge University Press
Nagin Daniel S Francis T Cullen and Cheryl Lero Jonson 2009 Imprisonment and Reoffending Essay In Crime and Justice A Review of Research eds Michael Tonry 38115ndash200 Chicago University of Chicago Press
63
The Relationship between Prison Length of Stay and Recidivism -- This report was prepared by Abt Associates using Federal funding provided by the Bureau of Justice Statistics (BJS) Opinions andor points of view expressed are those of the author(s) and do not necessarily reflect the official position or policies of the US Department of Justice
Nguyen H Loughran T A Paternoster R Fagan J amp Piquero A R (2017) Institutional placement and illegal earnings Examining the crime school hypothesis Journal of Quantitative Criminology 33(2) 207-235
Owen B A (1998) In the Mix Struggle and Survival in a Womens Prison SUNY Press
Pager Devah and Lincoln Quillian 2005 Walking the Talk What Employers Say Versus What They Do American Sociological Review 70 (3) 355ndash80 doi101177000312240507000301
Pager Devah Bart Bonikowski and Bruce Western 2009 Discrimination in a Low-Wage Labor Market A Field Experiment American Sociological Review 74 (5) 777ndash99 doi101177000312240907400505
Pager Devah 2007 Marked Race Crime and Finding Work in an Era of Mass Incarceration Chicago University of Chicago Press
Rhodes William and Sarah K Jalbert 2013 Regression Discontinuity Design in Criminal Justice Evaluation An Introduction and Illustration Evaluation Review 37 (3-4) 239ndash73 doi1011770193841x14523004
Rhodes W Dyous C Kling R Hunt D and Luallen J (2012) Recidivism of Offenders on Federal Community Supervision Bureau of Justice Statistics award 2010-BJ-CX-K069 NCRJS document number 241018
Rhodes W (2010) Estimating treatment effects and predicting recidivism for community supervision using survival analysis with instrumental variables Journal of Quantitative Criminology 26(3) 391-413
Rhodes W (2012) Meta-analysis An introduction using regression models Evaluation review 36(1) 24-71
Roach Michael A and Max M Schanzenbach 2015 The Effect of Prison Sentence Length on Recidivism Evidence from Random Judicial Assignment Northwestern Law ampAmp Econ Research Paper doi102139ssrn2701549
Roodman David 2016 The impacts of incarceration on crime Open Philanthropy Project
Rosenbaum Paul R 2002 Observational Studies 2nd ed New York Springer
Smith Douglas A and Raymond Paternoster 1990 Formal Processing and Future Delinquency Deviance Amplification as Selection Artifact Law ampAmp Society Review 24 (5) 1109 doi1023073053663
Sampson Robert J and John H Laub 1993 Crime in the Making Pathways and Turning Points Through Life Cambridge MA Harvard University Press
64
The Relationship between Prison Length of Stay and Recidivism -- This report was prepared by Abt Associates using Federal funding provided by the Bureau of Justice Statistics (BJS) Opinions andor points of view expressed are those of the author(s) and do not necessarily reflect the official position or policies of the US Department of Justice
Smith Paula 2006 The Effects of Incarceration on Recidivism A Longitudinal Examination of Program Participation and Institutional Adjustment in Federally Sentenced Adult Male Offenders Dissertation University of New Brunswick Dept of Psychology
Smith Paula Paul Gendreau and Claire Goggin 2002 The Effects of Prison Sentences and Intermediate Sanctions on Recidivism General Effects and Individual Differences Ottawa Solicitor General Canada
Snodgrass G Matthew Arjan A J Blokland Amelia Haviland Paul Nieuwbeerta and Daniel S Nagin 2011 Does the Time Cause the Crime An Examination of the Relationship Between Time Served and Reoffending in The Netherlands Criminology 49 (4) 1149ndash94 doi101111j1745-9125201100254x
Sykes Gresham M 1958 The Society of Captives A Study of a Maximum Security Prison Princeton NJ Princeton University Press
National Research Council Jeremy Travis Bruce Western Steve Redburn 2014 The Growth of Incarceration in the United States Exploring Causes and Consequences eds Committee on Causes and Consequences of High Rates of Incarceration Committee on Law and Justice and Division of Behavioral and Social Sciences and Education Washington DC The National Academies Press
van der Klaauw Wilbert 2002 Estimating the Effect of Financial Aid Offers on College Enrollment A Regression-Discontinuity Approach International Economic Review 43 (4) 1249ndash87 doi1011111468-2354t01-1-00055
Villettaz P M Killias and I Zoder 2006 The Effects of Custodial vs Non-Custodial Sentences on Re-Offending A Systematic Review of the State of Knowledge Campbell Collaboration Crime and Justice Group doi104073csr200613
Wacquant Loiumlc 2001 Deadly Symbiosis When Ghetto and Prison Meet and Mesh Mass Imprisonment Social Causes and Consequences 82ndash120 doi1041359781446221228n8
Western Bruce 2002 The Impact of Incarceration on Wage Mobility and Inequality American Sociological Review 67 (4) 526 doi1023073088944
65
The Relationship between Prison Length of Stay and Recidivism -- This report was prepared by Abt Associates using Federal funding provided by the Bureau of Justice Statistics (BJS) Opinions andor points of view expressed are those of the author(s) and do not necessarily reflect the official position or policies of the US Department of Justice
Tables and Figures
Table 1 - Number of Offenders Meeting Study Requirements per Guidelines Cell
Criminal History Categories (1 least serious 6 most serious) Offense
Seriousness Level CH 1 CH 2 CH 3 CH 4 CH 5 CH 6 Total
1 38 6 1 1 1 1 48 2 909 176 178 90 42 61 1456 3 143 26 33 20 9 25 256 4 3244 818 981 523 371 613 6550 5 442 119 132 84 64 119 960 6 3005 641 752 429 300 505 5632 7 1511 381 653 576 440 680 4241 8 4497 882 1023 543 361 552 7858 9 1969 465 566 321 229 363 3913
10 8511 1873 2342 1119 765 1109 15719 11 2824 558 728 472 304 521 5407 12 9748 2368 3330 1968 1204 1667 20285 13 13159 2961 3668 2009 1226 1777 24800 14 4219 746 854 430 275 788 7312 15 10534 2680 3131 1599 951 1257 20152 16 4394 760 831 396 227 318 6926 17 8743 2598 4189 2919 1690 1981 22120 18 4876 745 758 388 212 306 7285 19 9053 2116 2902 1720 1095 1301 18187 20 3761 779 930 532 262 319 6583 21 13674 2293 3341 2511 1706 2421 25946 22 3674 654 850 480 289 392 6339 23 10627 4101 5642 2996 1742 1904 27012 24 3706 719 788 487 282 445 6427 25 7748 2816 3460 1835 1036 1137 18032 26 2946 728 856 420 228 355 5533 27 9418 1797 2221 1126 630 647 15839 28 2509 506 554 306 144 178 4197 29 6180 2614 3442 1736 870 3174 18016 30 1819 344 367 384 218 654 3786 31 3868 1800 2308 1157 554 2945 12632 32 1144 307 377 161 86 213 2288 33 2570 873 1155 566 259 365 5788 34 776 244 260 111 79 1831 3301 35 1145 645 820 368 197 446 3621 36 431 128 153 66 35 47 860
Leas
t Ser
ious
(1) t
o Mo
st S
erio
us (4
3)
66
The Relationship between Prison Length of Stay and Recidivism -- This report was prepared by Abt Associates using Federal funding provided by the Bureau of Justice Statistics (BJS) Opinions andor points of view expressed are those of the author(s) and do not necessarily reflect the official position or policies of the US Department of Justice
Criminal History Categories (1 least serious 6 most serious) Offense
Seriousness Level CH 1 CH 2 CH 3 CH 4 CH 5 CH 6 Total
37 543 210 305 148 54 221 1481 38 290 83 122 59 30 64 648 39 200 62 91 36 21 58 468 40 174 37 58 22 22 35 348 41 94 31 43 18 6 23 215 42 64 23 28 9 5 8 137 43 86 24 25 12 4 19 170
All 169266 42737 55248 31153 18525 31845 348774 Note Cells with fewer than 100 observations are highlighted
67
The Relationship between Prison Length of Stay and Recidivism -- This report was prepared by Abt Associates using Federal funding provided by the Bureau of Justice Statistics (BJS) Opinions andor points of view expressed are those of the author(s) and do not necessarily reflect the official position or policies of the US Department of Justice
Table 2 -- Percentage of Offenders Sentenced to Prison per Guideline Cell
Criminal History Categories (1 least serious 6 most serious) Offense
Seriousness Level CH 1 CH 2 CH 3 CH 4 CH 5 CH 6 Total
1 11 0 0 0 100 100 13 2 15 20 42 52 69 72 25 3 11 31 42 50 78 76 29 4 14 27 45 68 74 82 34 5 14 34 54 83 84 93 42 6 17 40 59 73 89 94 40 7 16 43 69 91 95 96 58 8 17 43 58 86 91 96 39 9 27 53 79 90 90 97 53
10 33 75 86 94 96 96 58 11 63 85 91 95 99 98 77 12 69 84 92 96 97 98 81 13 74 89 94 97 98 98 83 14 79 90 94 97 99 98 86 15 82 93 96 97 99 99 89 16 84 92 95 98 98 98 88 17 85 93 97 98 99 99 92 18 90 95 97 99 98 99 92 19 89 93 97 99 99 99 93 20 92 96 99 98 99 99 94 21 92 96 98 99 99 99 95 22 93 96 98 99 99 99 95 23 93 97 98 99 99 99 96 24 95 98 99 100 99 100 96 25 95 98 98 99 99 99 97 26 97 98 98 99 100 100 98 27 96 99 99 100 99 100 97 28 96 98 99 99 100 99 97 29 96 98 99 99 99 99 98 30 97 100 100 98 99 100 98 31 97 98 99 99 99 99 98 32 98 98 99 99 100 100 99 33 96 98 99 99 100 99 97 34 97 100 99 100 100 99 99 35 97 98 99 98 99 99 98 36 98 99 99 97 100 100 98 37 97 98 99 100 96 98 98 38 98 99 98 100 100 98 98
68
The Relationship between Prison Length of Stay and Recidivism -- This report was prepared by Abt Associates using Federal funding provided by the Bureau of Justice Statistics (BJS) Opinions andor points of view expressed are those of the author(s) and do not necessarily reflect the official position or policies of the US Department of Justice
Criminal History Categories (1 least serious 6 most serious) Offense
Seriousness Level CH 1 CH 2 CH 3 CH 4 CH 5 CH 6 Total
39 98 98 99 100 100 98 99 40 98 97 100 100 100 100 99 41 98 100 100 100 100 100 99 42 97 100 100 100 100 100 99 43 98 100 96 100 100 95 98 All 78 89 93 97 98 98 87
Note Cells with less than 50 prison terms are highlighted
69
The Relationship between Prison Length of Stay and Recidivism -- This report was prepared by Abt Associates using Federal funding provided by the Bureau of Justice Statistics (BJS) Opinions andor points of view expressed are those of the author(s) and do not necessarily reflect the official position or policies of the US Department of Justice
Table 3 -- Average Time Served (Months) per Guideline Cell
Criminal History Categories (1 least serious 6 most serious) Offense Seriousness Level
CH 1 CH 2 CH 3 CH 4 CH 5 CH 6
Leas
t Ser
ious
(1) t
o Mo
st S
erio
us (4
3)
1 04 00 00 00 209 65 2 10 13 25 36 41 73 3 08 17 27 47 47 73 4 13 22 35 57 67 85 5 13 21 42 87 90 138 6 13 41 49 84 115 140 7 11 29 50 81 117 146 8 14 38 59 96 137 175 9 21 50 71 119 168 208
10 30 72 94 150 191 230 11 43 82 119 161 217 251 12 60 103 137 189 237 279 13 81 124 157 212 260 300 14 106 160 187 256 298 324 15 120 170 204 256 320 355 16 147 198 233 303 359 408 17 164 222 260 326 392 446 18 196 257 297 362 454 515 19 216 282 326 407 498 547 20 262 343 401 481 573 637 21 255 342 394 481 570 636 22 313 409 483 582 689 721 23 336 429 484 577 670 728 24 369 493 543 685 786 853 25 418 495 562 671 785 842 26 480 571 676 783 902 964 27 474 597 659 783 868 909 28 552 706 784 902 961 1048 29 584 722 813 878 976 981 30 685 845 938 1063 1120 1213 31 695 823 916 1039 1129 1117 32 850 991 1116 1241 1417 1312 33 779 935 1056 1203 1338 1401 34 969 1166 1220 1365 1396 1326 35 900 1033 1182 1335 1385 1403 36 1176 1265 1456 1510 1551 1461
70
The Relationship between Prison Length of Stay and Recidivism -- This report was prepared by Abt Associates using Federal funding provided by the Bureau of Justice Statistics (BJS) Opinions andor points of view expressed are those of the author(s) and do not necessarily reflect the official position or policies of the US Department of Justice
Criminal History Categories (1 least serious 6 most serious) Offense Seriousness Level
CH 1 CH 2 CH 3 CH 4 CH 5 CH 6
37 1028 1289 1356 1604 1382 1849 38 1279 1434 1625 1726 1399 1769 39 1072 1468 1540 1567 1544 1656 40 1414 1520 1648 1482 1490 1658 41 1315 1562 1788 2045 2124 1899 42 1263 1878 1468 1974 1422 1974 43 1497 1685 2078 2909 1280 2243
71
The Relationship between Prison Length of Stay and Recidivism -- This report was prepared by Abt Associates using Federal funding provided by the Bureau of Justice Statistics (BJS) Opinions andor points of view expressed are those of the author(s) and do not necessarily reflect the official position or policies of the US Department of Justice
Table 4 -- Percentage of Offenders Recidivating within Three Years (Not Accounting for Censoring) per Guideline Cell
Criminal History Categories (1 least serious 6 most serious) Offense Seriousness Level CH 1 CH 2 CH 3 CH 4 CH 5 CH 6
Leas
t Ser
ious
(1) t
o Mo
st S
erio
us (4
3)
1 395 333 1000 00 00 1000 2 232 324 382 433 524 328 3 238 346 424 450 444 440 4 201 334 399 405 415 512 5 215 378 379 440 422 454 6 198 348 430 462 407 475 7 212 336 449 507 502 568 8 177 330 324 385 427 438 9 182 286 337 340 397 477
10 167 262 350 367 383 459 11 116 228 299 326 365 407 12 130 266 335 388 442 475 13 132 248 297 368 396 444 14 94 180 297 347 360 391 15 129 241 315 386 420 423 16 95 186 276 323 300 377 17 99 207 280 342 382 425 18 95 179 240 312 274 359 19 106 197 274 320 359 414 20 94 181 247 301 336 376 21 103 172 235 283 336 352 22 81 191 259 313 356 375 23 84 142 192 247 293 330 24 86 172 221 277 337 348 25 77 122 167 215 251 277 26 70 126 173 193 241 318 27 71 124 157 186 216 253 28 72 144 148 180 201 298 29 63 93 131 169 208 221 30 73 96 166 188 239 252 31 52 99 129 137 181 166 32 68 94 135 161 105 174 33 51 86 127 133 201 186 34 44 90 88 153 215 118 35 53 62 87 122 178 143 36 42 55 85 136 229 128 37 52 90 95 135 93 163
72
The Relationship between Prison Length of Stay and Recidivism -- This report was prepared by Abt Associates using Federal funding provided by the Bureau of Justice Statistics (BJS) Opinions andor points of view expressed are those of the author(s) and do not necessarily reflect the official position or policies of the US Department of Justice
Criminal History Categories (1 least serious 6 most serious) Offense Seriousness Level CH 1 CH 2 CH 3 CH 4 CH 5 CH 6
38 24 24 57 68 233 156 39 20 48 99 139 190 52 40 40 108 103 182 136 114 41 32 32 47 111 333 130 42 63 00 143 222 200 125 43 81 00 200 167 250 158
73
The Relationship between Prison Length of Stay and Recidivism -- This report was prepared by Abt Associates using Federal funding provided by the Bureau of Justice Statistics (BJS) Opinions andor points of view expressed are those of the author(s) and do not necessarily reflect the official position or policies of the US Department of Justice
Table 5 -- Results from a Naive Regressions (Cox Proportional Hazard)
CH 1 CH 2 CH 3 CH 4 CH 5 CH 6 scaled time-served -1707 -2381 -2536 -1941 -1079 -1588
(0155) (0212) (0155) (0187) (0235) (0161) time-served squared 0941 1166 1154 0487 -0336 0016
(0263) (0328) (0234) (0263) (0323) (0192) scaled age -7718 -6272 -6200 -6174 -6028 -2779
(0257) (0385) (0295) (0388) (0496) (0468) age squared 6798 5207 5927 6619 6433 1160
(0503) (0775) (0608) (0791) (0983) (0881) female -0348 -0343 -0281 -0219 -0280 -0331
(0021) (0035) (0028) (0040) (0052) (0041) Black 0194 0115 0120 0088 -0016 -0054
(0023) (0030) (0022) (0026) (0031) (0023) other race 0567 0426 0348 0301 0371 0267
(0030) (0049) (0039) (0049) (0062) (0051) Hispanic -0085 -0095 -0072 -0018 0008 -0053
(0024) (0037) (0028) (0034) (0041) (0034) high_school -0124 -0142 -0127 -0106 -0088 -0036
(0039) (0049) (0036) (0042) (0051) (0038) advanced_degree -0611 -0441 -0423 -0287 -0169 -0051
(0053) (0084) (0070) (0088) (0112) (0078) lives_alone -0023 0006 0011 -0020 -0033 -0036
(0021) (0029) (0021) (0025) (0030) (0022) centered points 0311 -0026 0100 0057 0051 0041
(0015) (0022) (0009) (0012) (0013) (0002) N 143058 38733 52654 30049 17697 30247
74
The Relationship between Prison Length of Stay and Recidivism -- This report was prepared by Abt Associates using Federal funding provided by the Bureau of Justice Statistics (BJS) Opinions andor points of view expressed are those of the author(s) and do not necessarily reflect the official position or policies of the US Department of Justice
Table 6 ndash Results when Contrasts are Cells 13 24 57 68 911 1012 and so on
Criminal History 1
Criminal History 2
Criminal History 3
Criminal History 4
Criminal History 5
Criminal History 6
linear 0002 0004
-0002 0003
-0002 0004
-0003 0003
-0008 0005
-0005 0003
constant -0074 0048
-0034 0041
-0050 0041
-0012 0037
0054 0062
-0054 0041
R2 0010 0040 0020 0060 0150 0110 N 15 15 18 19 17 19 plt005 plt001 The constant is the average parameter for the estimated hazard (zero is neutral) Six criminal history scores labeled Criminal History The contrasts are cells 13 24 57 68 911 1012 and so on All the contrasts are independent
Table 7 ndash Results when Contrasts are Cells 24 35 68 79 1012 1113 and so on
Criminal History 1
Criminal History 2
Criminal History 3
Criminal History 4
Criminal History 5
Criminal History 6
linear 0003 -0003
0004 -0005
0003 -0003
-0002 -0004
0007 -0005
0000 -0004
constant -0103 (0032)
-0153 -0071
-0109 (0033)
-0097 -0050
-0188 (0064)
-0049 -0048
R2 0060 0070 0060 0010 0120 0000 N 16 14 18 17 17 18
plt005 plt001 The constant is the average parameter for the estimated hazard (zero is neutral) Six criminal history scores labeled Criminal History The contrasts are cells 24 35 69 710 1012 1113 etc
75
0 Q) bull ~ middot - 0
20gt () agto
0 00 co 0)0 C = a ctl lshyu c o 0 middot- o t ltD 0 aO 0 _ Q0
I()
ci 0 500
Time at Risk in Days
Crim H 1
Crim H 3
Crim H 5
Crim H is the criminal history category
Crim H 2
Crim H 4
Crim H 6
Crim H 1 is the highest l ine and others a re in descending order Crim H 5 and Crim H 6 are nearly indistinguishable
1000
The Relationship between Prison Length of Stay and Recidivism -- This report was prepared by Abt Associates using Federal funding provided by the Bureau of Justice Statistics (BJS) Opinions andor points of view expressed are those of the author(s) and do not necessarily reflect the official position or policies of the US Department of Justice
Figure 1 ndash Kaplan-Meier Estimates of Time until Recidivism by Criminal History Category
plt005 plt001 Six criminal history scores labeled Criminal History Scales variables run from 0 to 1 Centered points Criminal history points centered at zero
76
The Relationship between Prison Length of Stay and Recidivism -- This report was prepared by Abt Associates using Federal funding provided by the Bureau of Justice Statistics (BJS) Opinions andor points of view expressed are those of the author(s) and do not necessarily reflect the official position or policies of the US Department of Justice
Figure 2 ndash Relationship between Time-Served and Recidivism Principal Specification (Return and Revocation)
0 5 1
15
2 25
Relative Hazard
0 10 20 30 40 Offense Seriousness Level
Crim Hist Category 1
5
1 15
2 25
Relative Hazard
0 10 20 30 40 Offense Seriousness Level
Crim Hist Category 2
5
1 15
2 25
Relative Hazard
0 10 20 30 40 Offense Seriousness Level
Crim Hist Category 3 0
5 1
15
2 25
Relative Hazard
0 10 20 30 40 Offense Seriousness Level
Crim Hist Category 4 0
5 1
15
2 25
Relative Hazard
0 10 20 30 40 Offense Seriousness Level
Crim Hist Category 5
5
1 15
2 25
Relative Hazard
0 10 20 30 40 Offense Seriousness Level
Crim Hist Category 6
Dots are estimated relative hazards (shown if between -25 and 25)Vertical lines are 95 confidence interval for the estimated relative hazards (truncated at 25)Smooth lines are linear predictions and 95 confidence intervals for the regression line
Criminal History 1
Criminal History 2
Criminal History 3
Criminal History 4
Criminal History 5
Criminal History 6
linear 0002 (0002)
0000 (0003)
0000 (0002)
-0003 (0003)
0000 (0004)
-0003 (0003)
constant -0068 (0013)
-0075 (0019)
-0075 (0017)
-0076 (0019)
-0068 (0028)
-0077 (0020)
R2 003 000 000 003 000 003 N 31 29 36 36 34 37
plt005 plt001 The constant is the average parameter for the estimated hazard (zero is neutral) Six criminal history scores labeled Criminal History
77
The Relationship between Prison Length of Stay and Recidivism -- This report was prepared by Abt Associates using Federal funding provided by the Bureau of Justice Statistics (BJS) Opinions andor points of view expressed are those of the author(s) and do not necessarily reflect the official position or policies of the US Department of Justice
Figure 3 ndash Relationship between Time-Served and Recidivism Principal Specification (Return and Revocation) using an Instrumental Variable Estimator
7
8
9
1 11
Relative Hazard
0 10 20 30 40 Offense Seriousness Level
Crim Hist Category 1
9 95
1 105 11 115
Relative Hazard
0 10 20 30 40 Offense Seriousness Level
Crim Hist Category 2
6
8
1 12
14
Relative Hazard
0 10 20 30 40 Offense Seriousness Level
Crim Hist Category 3 5
1 15
2 25
Relative Hazard
0 10 20 30 40 Offense Seriousness Level
Crim Hist Category 4 8
9
1 11
12
Relative Hazard
0 10 20 30 40 Offense Seriousness Level
Crim Hist Category 5
5
1 15
2 25
Relative Hazard
0 10 20 30 40 Offense Seriousness Level
Crim Hist Category 6
Dots are estimated relative hazards (shown if between -25 and 25)Vertical lines are 95 confidence interval for the estimated relative hazards (truncated at 25)Smooth lines are linear predictions and 95 confidence intervals for the regression line
Criminal History 1
Criminal History 2
Criminal History 3
Criminal History 4
Criminal History 5
Criminal History 6
linear 0001 (0000)
0001 (0000)
0001 (0000)
0000 0000
0000 0000
0000 0000
constant -0014 (0002)
-0015 (0003)
-0011 (0003)
-0011 (0003)
-0009 0005
-0009 (0003)
R2 043 022 012 003 001 010 N 31 29 36 36 34 37
plt005 plt001 The constant is the average parameter for the estimated hazard (zero is neutral) Six criminal history scores labeled Criminal History
78
The Relationship between Prison Length of Stay and Recidivism -- This report was prepared by Abt Associates using Federal funding provided by the Bureau of Justice Statistics (BJS) Opinions andor points of view expressed are those of the author(s) and do not necessarily reflect the official position or policies of the US Department of Justice
Figure 4 ndash Sensitivity Test Minimum Cell Size 50 instead of 100
0 5 1
15
2 25
Relative Hazard
0 10 20 30 40 Offense Seriousness Level
Crim Hist Category 1
0 5 1
15
2 25
Relative Hazard
0 10 20 30 40 Offense Seriousness Level
Crim Hist Category 2
5
1 15
2 25
Relative Hazard
0 10 20 30 40 Offense Seriousness Level
Crim Hist Category 3 0
5 1
15
2 25
Relative Hazard
0 10 20 30 40 Offense Seriousness Level
Crim Hist Category 4 0
5 1
15
2 25
Relative Hazard
0 10 20 30 40 Offense Seriousness Level
Crim Hist Category 5
0 5 1
15
2 25
Relative Hazard
0 10 20 30 40 Offense Seriousness Level
Crim Hist Category 6
Dots are estimated relative hazards (shown if between -25 and 25)Vertical lines are 95 confidence interval for the estimated relative hazards (truncated at 25)Smooth lines are linear predictions and 95 confidence intervals for the regression line
Criminal History 1
Criminal History 2
Criminal History 3
Criminal History 4
Criminal History 5
Criminal History 6
linear 0002 (0002)
0000 (0003)
0000 (0002)
-0002 (0003)
0000 (0004)
-0003 (0002)
constant -0068 (0013)
-0075 (0018)
-0073 (0018)
-0078 (0019)
-0068 (0027)
-0084 (0021)
R2 003 000 000 002 000 003 N 31 32 37 37 37 40
Six criminal history scores labeled Criminal History plt005 plt001 The constant is the average parameter for the estimated hazard (zero is neutral)
79
The Relationship between Prison Length of Stay and Recidivism -- This report was prepared by Abt Associates using Federal funding provided by the Bureau of Justice Statistics (BJS) Opinions andor points of view expressed are those of the author(s) and do not necessarily reflect the official position or policies of the US Department of Justice
Figure 5 ndash Sensitivity Test Minimum Cell Size 150 instead of 100
0 5 1
15
2 25
Relative Hazard
0 10 20 30 40 Offense Seriousness Level
Crim Hist Category 1
5
1 15
2 25
Relative Hazard
0 10 20 30 40 Offense Seriousness Level
Crim Hist Category 2
5
1 15
2 25
Relative Hazard
0 10 20 30 40 Offense Seriousness Level
Crim Hist Category 3
5
1 15
2 25
Relative Hazard
0 10 20 30 40 Offense Seriousness Level
Crim Hist Category 4
0 5 1
15
2 25
Relative Hazard
0 10 20 30 40 Offense Seriousness Level
Crim Hist Category 5
5
1 15
2 25
Relative Hazard
0 10 20 30 40 Offense Seriousness Level
Crim Hist Category 6
Dots are estimated relative hazards (shown if between -25 and 25)Vertical lines are 95 confidence interval for the estimated relative hazards (truncated at 25)Smooth lines are linear predictions and 95 confidence intervals for the regression line
Criminal History 1
Criminal History 2
Criminal History 3
Criminal History 4
Criminal History 5
Criminal History 6
linear 0002
(0002)
0000
(0003)
0000
(0002)
-0003
(0003)
-0001
(0004)
-0003
(0003) constant -0068
(0013) -0075 (0021)
-0076 (0017)
-0071 (0020)
-0066 (0031)
-0071 (0021)
R2 003 000 000 003 000 004 N 31 28 34 34 32 35
plt005 plt001 The constant is the average parameter for the estimated hazard (zero is neutral) Six criminal history scores labeled Criminal History
80
The Relationship between Prison Length of Stay and Recidivism -- This report was prepared by Abt Associates using Federal funding provided by the Bureau of Justice Statistics (BJS) Opinions andor points of view expressed are those of the author(s) and do not necessarily reflect the official position or policies of the US Department of Justice
Figure 6 -- Sensitivity Test Minimum Percentage of Prison Terms 75 instead of 50
0 5 1
15
2 25
Relative Hazard
0 10 20 30 40 Offense Seriousness Level
Crim Hist Category 1
5
1 15
2 25
Relative Hazard
0 10 20 30 40 Offense Seriousness Level
Crim Hist Category 2
5
1 15
2 25
Relative Hazard
0 10 20 30 40 Offense Seriousness Level
Crim Hist Category 3
0 5 1
15
2 25
Relative Hazard
0 10 20 30 40 Offense Seriousness Level
Crim Hist Category 4
0 5 1
15
2 25
Relative Hazard
0 10 20 30 40 Offense Seriousness Level
Crim Hist Category 5
5
1 15
2 25
Relative Hazard
0 10 20 30 40 Offense Seriousness Level
Crim Hist Category 6
Dots are estimated relative hazards (shown if between -25 and 25)Vertical lines are 95 confidence interval for the estimated relative hazards (truncated at 25)Smooth lines are linear predictions and 95 confidence intervals for the regression line
Criminal History 1
Criminal History 2
Criminal History 3
Criminal History 4
Criminal History 5
Criminal History 6
linear 0004 (0003)
0002 (0003)
-0001 (0003)
-0002 (0003)
0000 (0004)
-0003 (0003)
constant -0086 (0021)
-0091 (0023)
-0070 (0017)
-0074 (0020)
-0069 (0031)
-0076 (0020)
R2 007 002 001 002 000 004 N 27 28 32 33 31 36
plt005 plt001 The constant is the average parameter for the estimated hazard (zero is neutral) Six criminal history scores labeled Criminal History
81
The Relationship between Prison Length of Stay and Recidivism -- This report was prepared by Abt Associates using Federal funding provided by the Bureau of Justice Statistics (BJS) Opinions andor points of view expressed are those of the author(s) and do not necessarily reflect the official position or policies of the US Department of Justice
Figure 7 ndash Sensitivity Test Contrasts that are J and J+1 instead of J and J+2 5
1 15
2 25
Relative Hazard
0 10 20 30 40 Offense Seriousness Level
Crim Hist Category 1
0 5 1
15
2 25
Relative Hazard
0 10 20 30 40 Offense Seriousness Level
Crim Hist Category 2
5
1 15
2 25
Relative Hazard
0 10 20 30 40 Offense Seriousness Level
Crim Hist Category 3
5
1 15
2 25
Relative Hazard
0 10 20 30 40 Offense Seriousness Level
Crim Hist Category 4
5
1 15
2 25
Relative Hazard
0 10 20 30 40 Offense Seriousness Level
Crim Hist Category 5
5
1 15
2 25
Relative Hazard
0 10 20 30 40 Offense Seriousness Level
Crim Hist Category 6
Dots are estimated relative hazards (shown if between -25 and 25)Vertical lines are 95 confidence interval for the estimated relative hazards (truncated at 25)Smooth lines are linear predictions and 95 confidence intervals for the regression line
Criminal History 1
Criminal History 2
Criminal History 3
Criminal History 4
Criminal History 5
Criminal History 6
linear 0002 (0004)
-0002 (0005)
0005 (0004)
0006 (0004)
0003 (0006)
0006 (0004)
constant -0030 (0029)
-0017 (0040)
-0037 (0032)
-0039 (0028)
-0031 (0046)
-0023 (0028)
R2 0010 000 004 010 001 009 N 25 25 27 26 29 29
plt005 plt001 The constant is the average parameter for the estimated hazard (zero is neutral) Six criminal history scores labeled Criminal History
82
The Relationship between Prison Length of Stay and Recidivism -- This report was prepared by Abt Associates using Federal funding provided by the Bureau of Justice Statistics (BJS) Opinions andor points of view expressed are those of the author(s) and do not necessarily reflect the official position or policies of the US Department of Justice
Figure 8 -- Sensitivity Test Using the Prais-Winston Estimator
5
1 15
2 25
Relative Hazard
0 10 20 30 40 Offense Seriousness Level
Crim Hist Category 1
0 5 1
15
2 25
Relative Hazard
0 10 20 30 40 Offense Seriousness Level
Crim Hist Category 2
5
1 15
2 25
Relative Hazard
0 10 20 30 40 Offense Seriousness Level
Crim Hist Category 3
5
1 15
2 25
Relative Hazard
0 10 20 30 40 Offense Seriousness Level
Crim Hist Category 4
5
1 15
2 25
Relative Hazard
0 10 20 30 40 Offense Seriousness Level
Crim Hist Category 5
5
1 15
2 25
Relative Hazard
0 10 20 30 40 Offense Seriousness Level
Crim Hist Category 6
Dots are estimated relative hazards (shown if between -25 and 25)Vertical lines are 95 confidence interval for the estimated relative hazards (truncated at 25)Smooth lines are linear predictions and 95 confidence intervals for the regression line
Criminal History 1
Criminal History 2
Criminal History 3
Criminal History 4
Criminal History 5
Criminal History 6
linear 0019 -0010
0005 -0003
0003 -0003
0007 (0003)
0002 -0006
0006 (0003)
constant -0133 0065
-0060 0020
-0035 0016
-0030 0031
-0032 0029
-0040 0013
Rho 0100 -0940 -0790 0010 -0260 -0730 R2 0240 0210 0110 0210 0020 0330 N 25 25 27 26 29 29
plt005 plt001 The constant is the average parameter for the estimated hazard Six criminal history scores labeled Criminal History
83
The Relationship between Prison Length of Stay and Recidivism -- This report was prepared by Abt Associates using Federal funding provided by the Bureau of Justice Statistics (BJS) Opinions andor points of view expressed are those of the author(s) and do not necessarily reflect the official position or policies of the US Department of Justice
Figure 9 -- Sensitivity Test Entering Prison as Recidivism
0 5 1
15
2 25
Relative Hazard
0 10 20 30 40 Offense Seriousness Level
Crim Hist Category 1
5
1 15
2 25
Relative Hazard
0 10 20 30 40 Offense Seriousness Level
Crim Hist Category 2
0 5 1
15
2 25
Relative Hazard
0 10 20 30 40 Offense Seriousness Level
Crim Hist Category 3
0 5 1
15
2 25
Relative Hazard
0 10 20 30 40 Offense Seriousness Level
Crim Hist Category 4
0 5 1
15
2 25
Relative Hazard
0 10 20 30 40 Offense Seriousness Level
Crim Hist Category 5
5
1 15
2 25
Relative Hazard
0 10 20 30 40 Offense Seriousness Level
Crim Hist Category 6
Dots are estimated relative hazards (shown if between -25 and 25)Vertical lines are 95 confidence interval for the estimated relative hazards (truncated at 25)Smooth lines are linear predictions and 95 confidence intervals for the regression line
Criminal History 1
Criminal History 2
Criminal History 3
Criminal History 4
Criminal History 5
Criminal History 6
linear 0003 (0002)
0002 (0002)
0001 (0002)
-0004 (0003)
0000 (0004)
-0003 (0003)
constant -0070 (0014)
-0084 (0017)
-0077 (0018)
-0071 (0020)
-0074 (0030)
-0080 (0020)
R2 004 002 000 005 000 003 N 40 36 39 37 33 37
plt005 plt001 The constant is the average parameter for the estimated hazard (zero is neutral) Six criminal history scores labeled Criminal History
84
The Relationship between Prison Length of Stay and Recidivism -- This report was prepared by Abt Associates using Federal funding provided by the Bureau of Justice Statistics (BJS) Opinions andor points of view expressed are those of the author(s) and do not necessarily reflect the official position or policies of the US Department of Justice
Figure 10 -- Sensitivity Testing Eliminating Drug-Law Offenders from the Analysis
0 5 1
15
2 25
Relative Hazard
0 10 20 30 40 Offense Seriousness Level
Crim Hist Category 1
0 5 1
15
2 25
Relative Hazard
0 10 20 30 40 Offense Seriousness Level
Crim Hist Category 2
5
1 15
2 25
Relative Hazard
0 10 20 30 40 Offense Seriousness Level
Crim Hist Category 3
5
1 15
2 25
Relative Hazard
0 10 20 30 40 Offense Seriousness Level
Crim Hist Category 4
0 5 1
15
2 25
Relative Hazard
0 10 20 30 40 Offense Seriousness Level
Crim Hist Category 5
5
1 15
2 25
Relative Hazard
0 10 20 30 40 Offense Seriousness Level
Crim Hist Category 6
Dots are estimated relative hazards (shown if between -25 and 25)Vertical lines are 95 confidence interval for the estimated relative hazards (truncated at 25)Smooth lines are linear predictions and 95 confidence intervals for the regression line
Criminal History 1
Criminal History 2
Criminal History 3
Criminal History 4
Criminal History 5
Criminal History 6
linear 0001 (0003)
-0001 (0004)
-0001 (0003)
-0002 (0003)
0001 (0005)
-0003 (0003)
constant -0055 (0014)
-0065 (0022)
-0066 (0019)
-0057 (0022)
-0059 -0031
-0062 (0022)
R2 000 000 000 001 000 003 N 31 27 34 32 32 35
plt005 plt001 The constant is the average parameter for the estimated hazard (zero is neutral) Six criminal history scores labeled Criminal History
85
The Relationship between Prison Length of Stay and Recidivism -- This report was prepared by Abt Associates using Federal funding provided by the Bureau of Justice Statistics (BJS) Opinions andor points of view expressed are those of the author(s) and do not necessarily reflect the official position or policies of the US Department of Justice
Figure 11 -- Sensitivity Testing No Covariates
0 5 1
15
2 25
Relative Hazard
0 10 20 30 40 Offense Seriousness Level
Crim Hist Category 1
5
1 15
2 25
Relative Hazard
0 10 20 30 40 Offense Seriousness Level
Crim Hist Category 2
5
1 15
2 25
Relative Hazard
0 10 20 30 40 Offense Seriousness Level
Crim Hist Category 3
0 5 1
15
2 25
Relative Hazard
0 10 20 30 40 Offense Seriousness Level
Crim Hist Category 4
0 5 1
15
2 25
Relative Hazard
0 10 20 30 40 Offense Seriousness Level
Crim Hist Category 5
5
1 15
2 25
Relative Hazard
0 10 20 30 40 Offense Seriousness Level
Crim Hist Category 6
Dots are estimated relative hazards (shown if between -25 and 25)Vertical lines are 95 confidence interval for the estimated relative hazards (truncated at 25)Smooth lines are linear predictions and 95 confidence intervals for the regression line
Criminal History 1
Criminal History 2
Criminal History 3
Criminal History 4
Criminal History 5
Criminal History 6
linear 0001 (0003)
-0003 (0003)
-0002 (0003)
-0004 (0003)
-0002 (0004)
-0004 (0003)
constant -0062 (0015)
-0067 (0020)
-0081 (0018)
-0082 (0022)
-0071 (0028)
-0084 (0022)
R2 000 003 002 005 001 007 N 31 29 36 36 34 37
plt005 plt001 The constant is the average parameter for the estimated hazard (zero is neutral) Six criminal history scores labeled Criminal History
86
The Relationship between Prison Length of Stay and Recidivism -- This report was prepared by Abt Associates using Federal funding provided by the Bureau of Justice Statistics (BJS) Opinions andor points of view expressed are those of the author(s) and do not necessarily reflect the official position or policies of the US Department of Justice
Figure 12 -- Sensitivity Testing Using the Earlier Guidelines
0 1
2 3
4 5
Relative Hazard
0 10 20 30 40 Offense Seriousness Level
Crim Hist Category 1
0 5 1
15
2 25
Relative Hazard
0 10 20 30 40 Offense Seriousness Level
Crim Hist Category 2
5
1 15
2 25
Relative Hazard
0 10 20 30 40 Offense Seriousness Level
Crim Hist Category 3
0 5 1
15
2 25
Relative Hazard
0 10 20 30 40 Offense Seriousness Level
Crim Hist Category 4
0 5 1
15
2 25
Relative Hazard
0 10 20 30 40 Offense Seriousness Level
Crim Hist Category 5
5
1 15
2 25
Relative Hazard
0 10 20 30 40 Offense Seriousness Level
Crim Hist Category 6
Dots are estimated relative hazards (shown if between -25 and 25)Vertical lines are 95 confidence interval for the estimated relative hazards (truncated at 25)Smooth lines are linear predictions and 95 confidence intervals for the regression line
Criminal History 1
Criminal History 2
Criminal History 3
Criminal History 4
Criminal History 5
Criminal History 6
linear 0000 (0003)
0001 (0004)
0000 (0003)
-0004 (0002)
-0002 (0004)
-0004 (0003)
constant -0085 (0017)
-0097 (0025)
-0096 (0019)
-0085 (0018)
-0076 (0030)
-0081 (0028)
R2 000 000 000 007 001 004 N 31 29 34 35 33 34
plt005 plt001 The constant is the average parameter for the estimated hazard (zero is neutral) Six criminal history scores labeled Criminal History
87