Embed Size (px)
Citation preview
This report looks at all 3rd graders in a district with the designation of "FRM" or free reduced meal. Meta data can be easily used for federal or district sub-group analysis.
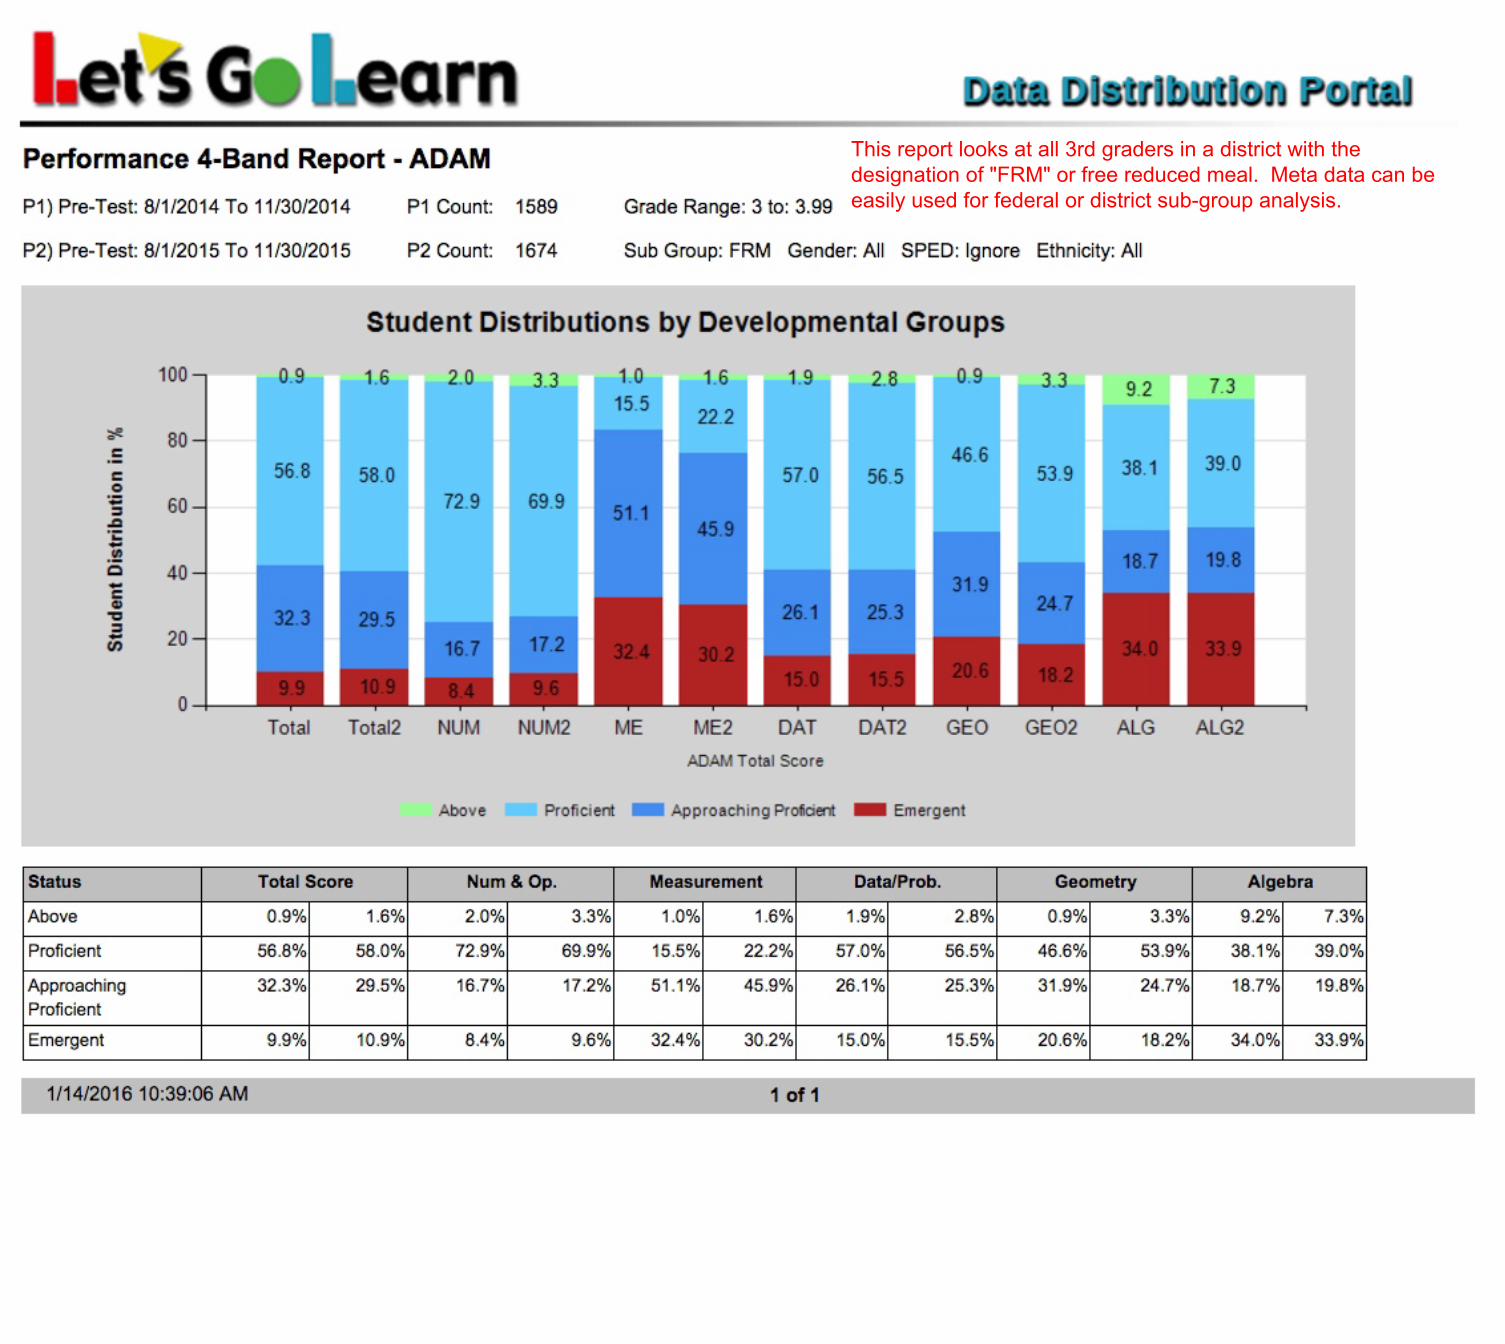
This is a Performance Band report for reading. It breaks reading into 6 sub-tests. We see percentages of students in 3 developmental groups. It can be run per site or across multiple sites. In addition, many parameters can be adjusted such as grade levels and student meta data.
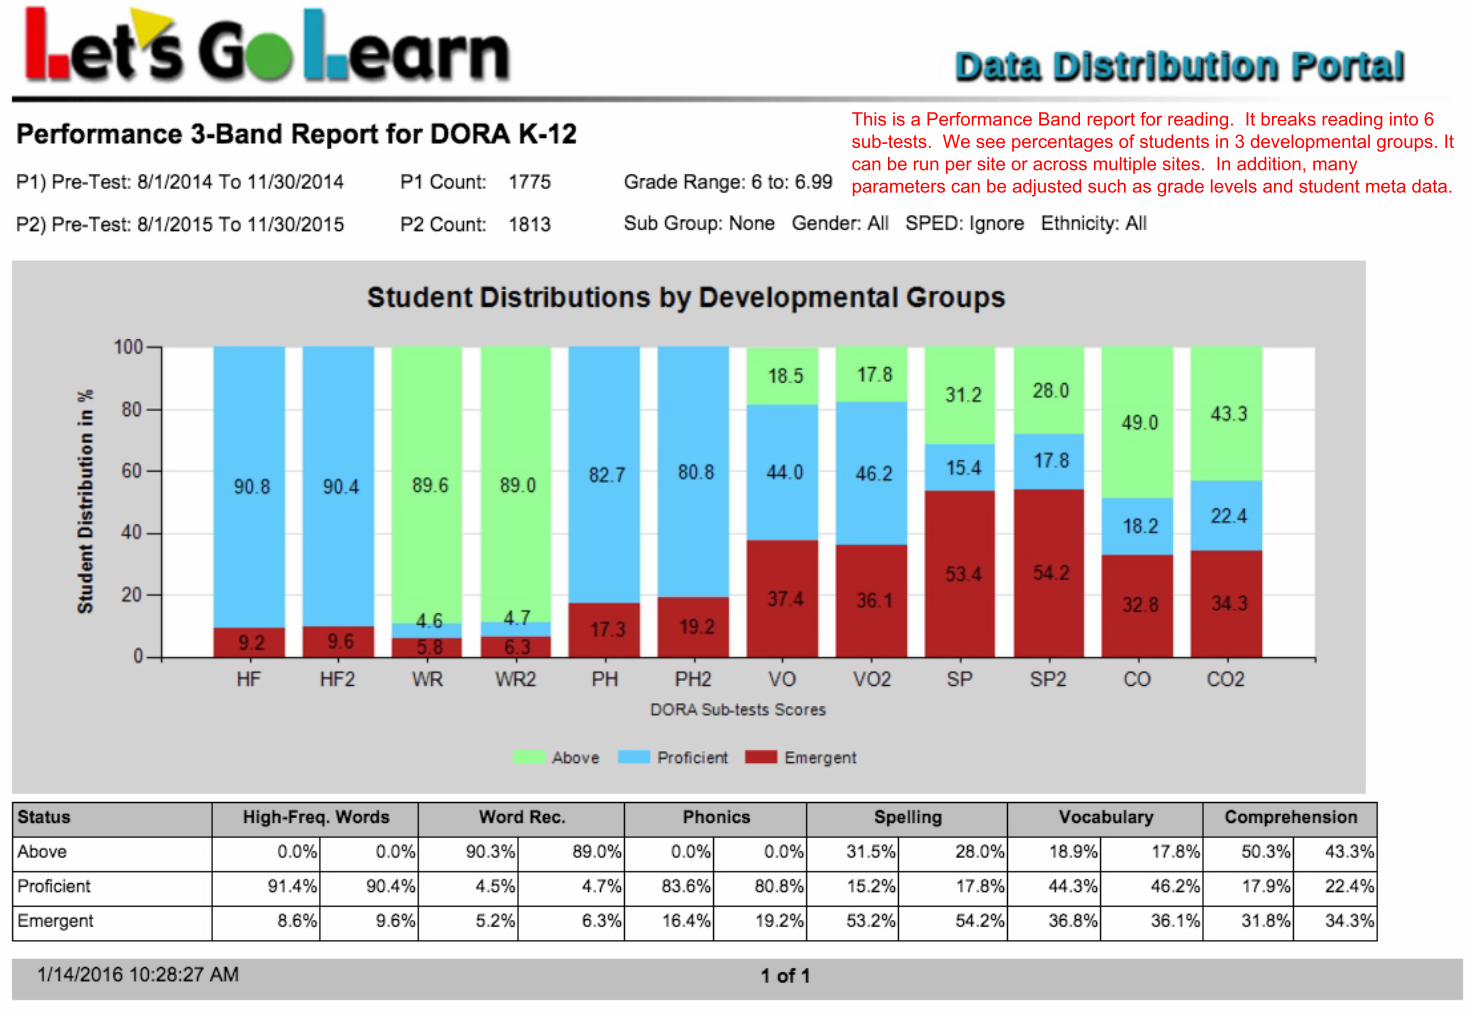
Average Scores Report for DORA K-12
P1) Pre-Test: 8/1/2014 To 11/30/2014
P2) Pre-Test: 8/1/2015 To 11/30/2015
High-Freq. Words Word Rec. Phonics Vocabulary Spelling Comprehension
3.29 3.39 5.73 6.73 3.36 3.64 3.49 3.68 2.14 2.19 2.51 2.58
P1 Count: 57
P2 Count: 60
Grade Range: 3 to: 3.99
1/14/2016 10:43:41 AM 1 of 1
This report is looking at average scores within a single grade level. It can be run by principals or by district administrators
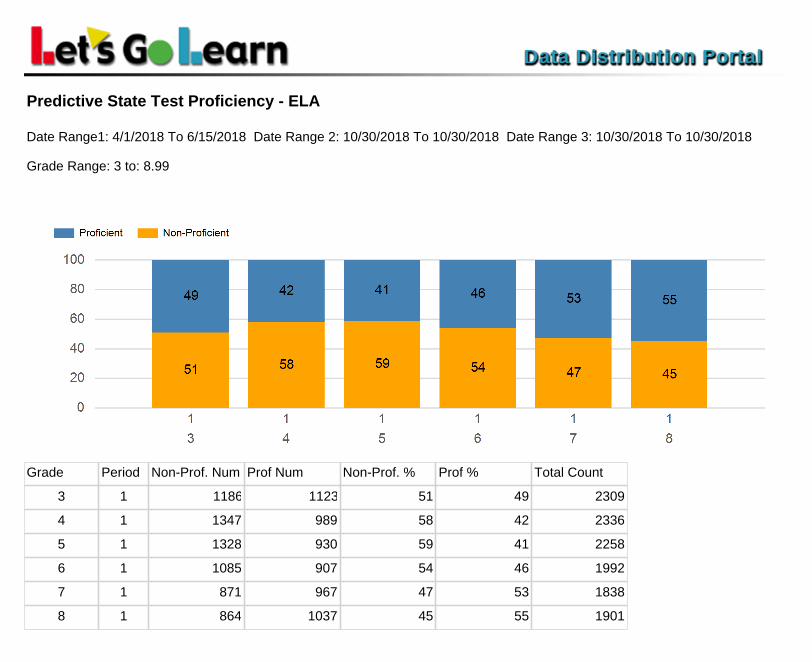
Grade Period Non-Prof. Num Prof Num Non-Prof. % Prof % Total Count
3 1 1186 1123 51 49 2309
4 1 1347 989 58 42 2336
5 1 1328 930 59 41 2258
6 1 1085 907 54 46 1992
7 1 871 967 47 53 1838
8 1 864 1037 45 55 1901
Predictive State Test Proficiency - ELA
Date Range1: 4/1/2018 To 6/15/2018 Date Range 2: 10/30/2018 To 10/30/2018 Date Range 3: 10/30/2018 To 10/30/2018
Grade Range: 3 to: 8.99
10/27/2018 8:44:29 PM 1 of 1
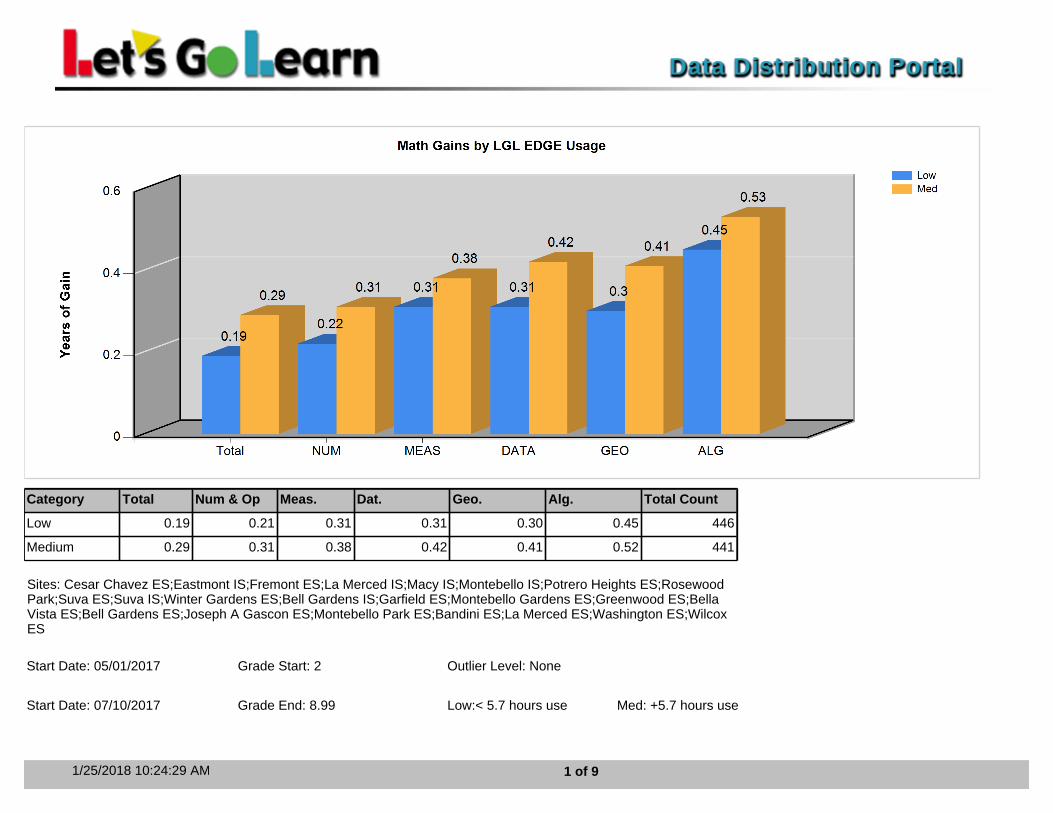
Category Total Num & Op Meas. Dat. Geo. Alg. Total Count
Low 0.19 0.21 0.31 0.31 0.30 0.45 446
Medium 0.29 0.31 0.38 0.42 0.41 0.52 441
Start Date: 05/01/2017
Start Date: 07/10/2017
Grade Start: 2
Grade End: 8.99
Outlier Level: None
Low:< 5.7 hours use Med: +5.7 hours use
Sites: Cesar Chavez ES;Eastmont IS;Fremont ES;La Merced IS;Macy IS;Montebello IS;Potrero Heights ES;Rosewood Park;Suva ES;Suva IS;Winter Gardens ES;Bell Gardens IS;Garfield ES;Montebello Gardens ES;Greenwood ES;Bella Vista ES;Bell Gardens ES;Joseph A Gascon ES;Montebello Park ES;Bandini ES;La Merced ES;Washington ES;Wilcox ES
1/25/2018 10:24:29 AM 1 of 9
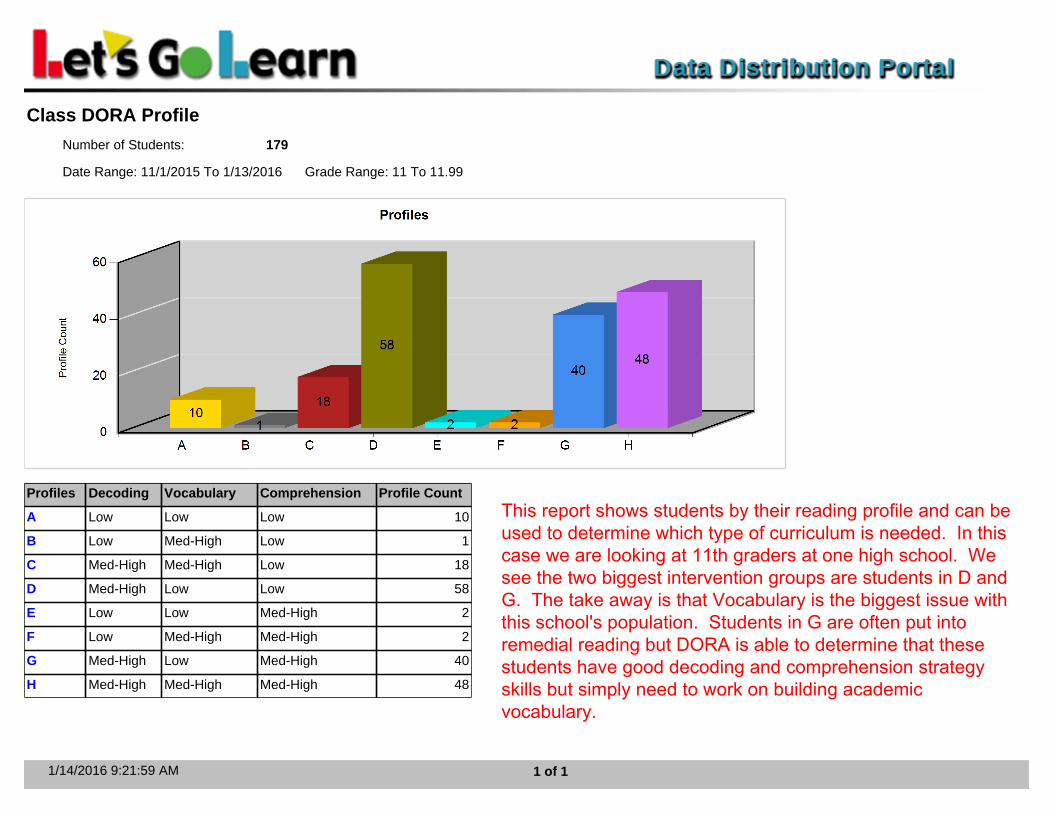
Profiles Decoding Vocabulary Comprehension Profile Count
A Low Low Low 10
B Low Med-High Low 1
C Med-High Med-High Low 18
D Med-High Low Low 58
E Low Low Med-High 2
F Low Med-High Med-High 2
G Med-High Low Med-High 40
H Med-High Med-High Med-High 48
Class DORA Profile
Number of Students: 179
Date Range: 11/1/2015 To 1/13/2016 Grade Range: 11 To 11.99
1/14/2016 9:21:59 AM 1 of 1
This report shows students by their reading profile and can be used to determine which type of curriculum is needed. In this case we are looking at 11th graders at one high school. We see the two biggest intervention groups are students in D and G. The take away is that Vocabulary is the biggest issue with this school's population. Students in G are often put into remedial reading but DORA is able to determine that these students have good decoding and comprehension strategy skills but simply need to work on building academic vocabulary.
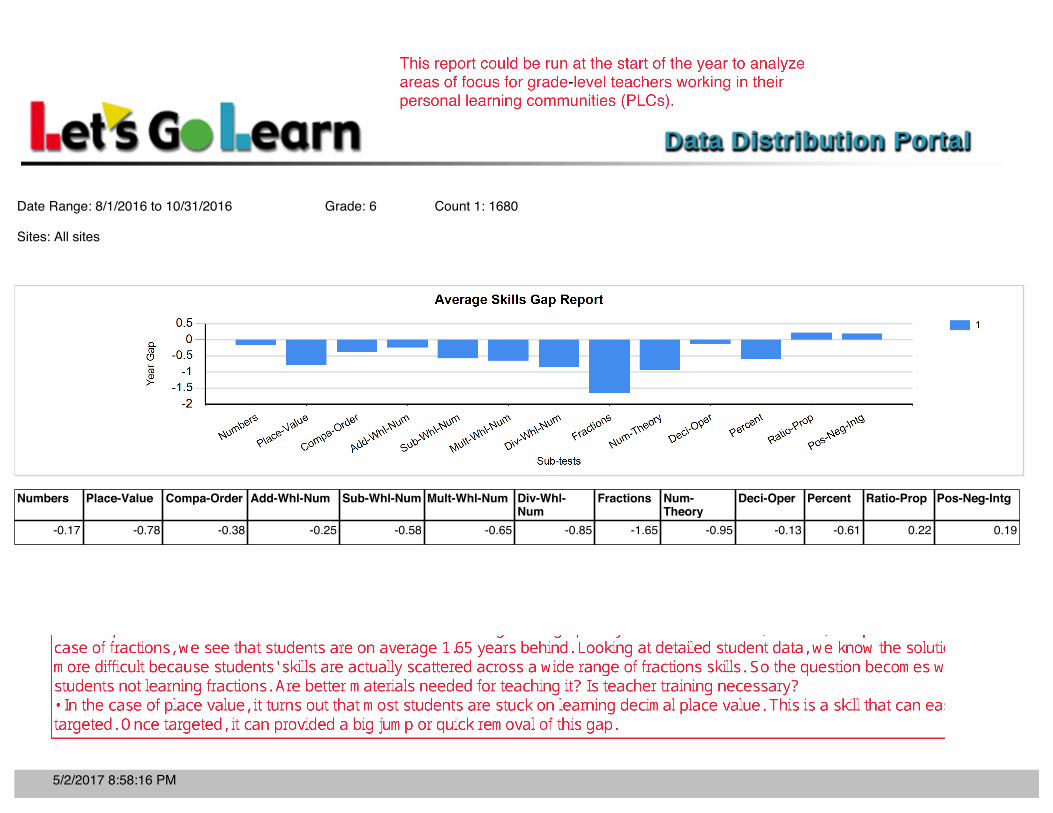
Date Range: 8/1/2016 to 10/31/2016
Sites: All sites
Grade: 6 Count 1: 1680
Numbers Place-Value Compa-Order Add-Whl-Num Sub-Whl-Num Mult-Whl-Num Div-Whl-Num
Fractions Num-Theory
Deci-Oper Percent Ratio-Prop Pos-Neg-Intg
-0.17 -0.78 -0.38 -0.25 -0.58 -0.65 -0.85 -1.65 -0.95 -0.13 -0.61 0.22 0.19
5/2/2017 8:58:16 PM
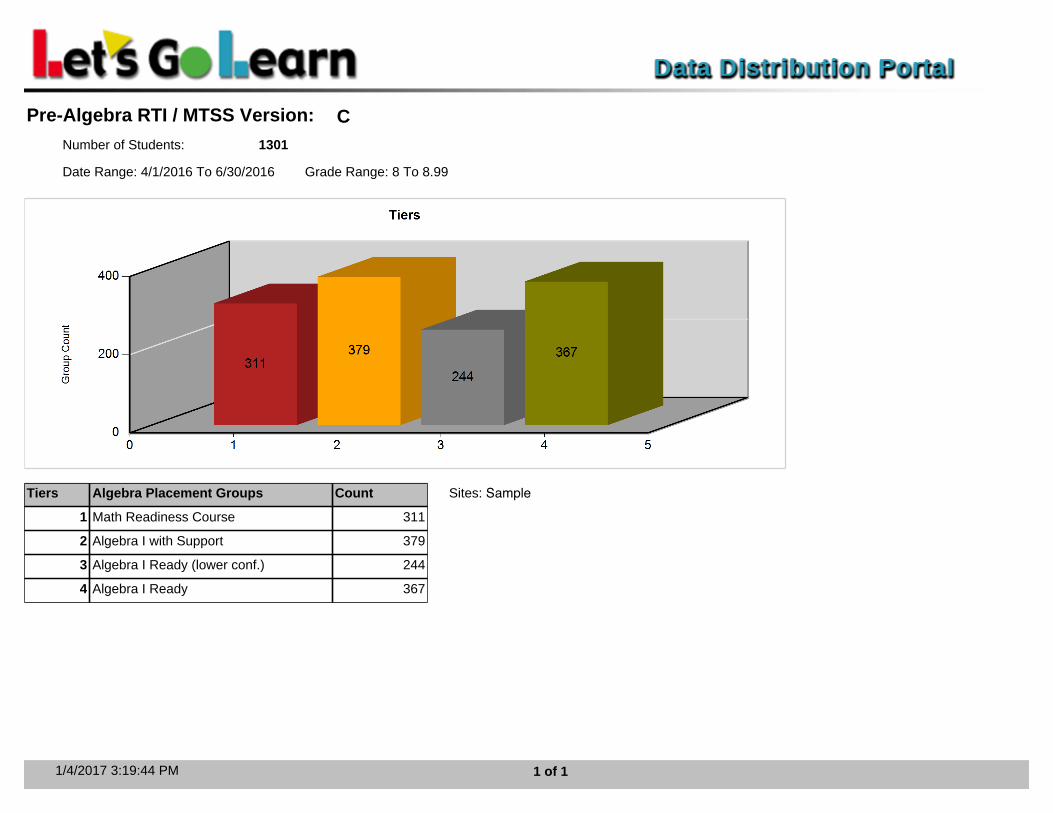
Tiers Algebra Placement Groups Count
1 Math Readiness Course 311
2 Algebra I with Support 379
3 Algebra I Ready (lower conf.) 244
4 Algebra I Ready 367
Pre-Algebra RTI / MTSS Version:
Number of Students: 1301
Date Range: 4/1/2016 To 6/30/2016 Grade Range: 8 To 8.99
Sites: Sample
C
1/4/2017 3:19:44 PM 1 of 1
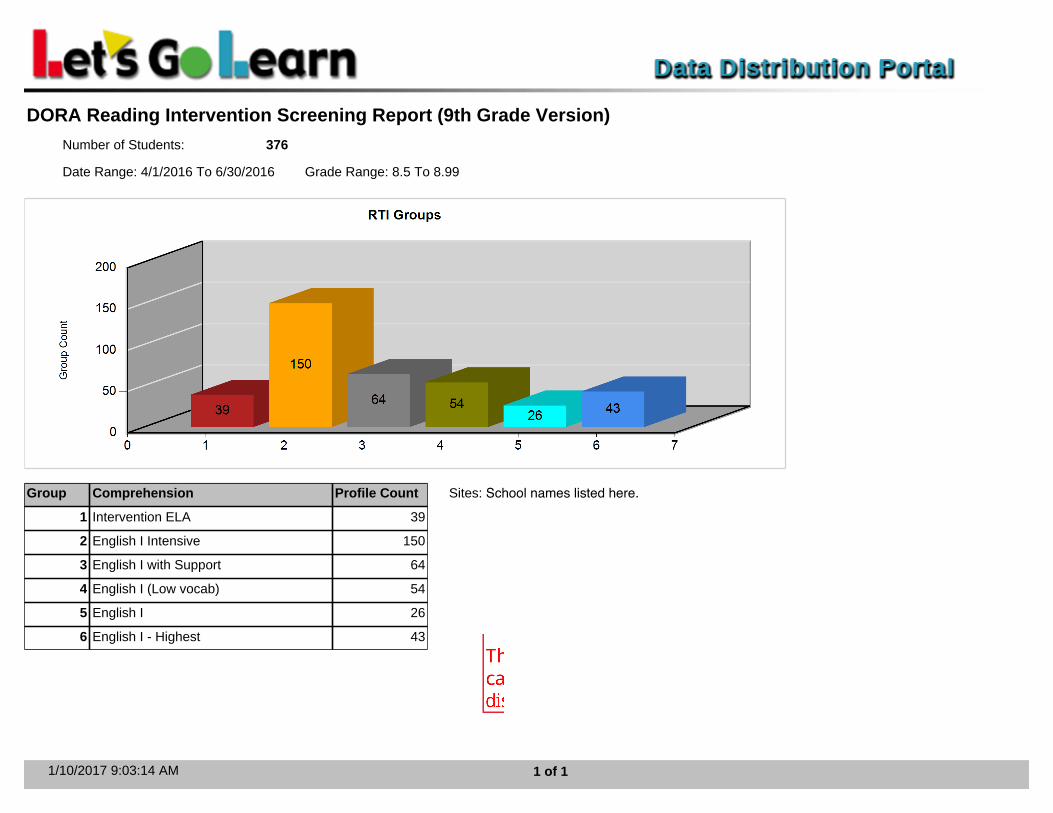
Group Comprehension Profile Count
1 Intervention ELA 39
2 English I Intensive 150
3 English I with Support 64
4 English I (Low vocab) 54
5 English I 26
6 English I - Highest 43
DORA Reading Intervention Screening Report (9th Grade Version)
Number of Students: 376
Date Range: 4/1/2016 To 6/30/2016 Grade Range: 8.5 To 8.99
Sites: School names listed here.
1/10/2017 9:03:14 AM 1 of 1