Embed Size (px)
Citation preview

This presentation premiered at WaterSmart Innovations
watersmartinnovations.com

Best Practices for Production Flow Data Management for
Water UtilitiesGeorge Kunkel, P.E.
Kunkel Water Efficiency Consulting
WaterSmart Innovations Conference 2015
Las Vegas, NV
October 7, 2015

Water “Use” Reporting and Trends• Pacific Institute Report: Water Use Trends in the United
States (2015)• United States Geologic Survey Report: Estimated Water Use
of Water in the United States in 2010 (published every 5 years)• Both reports highlight the distinct drop in the estimate of water
used from 2005 to 2010; water use is now lower than 1970 levels• Thermoelectric power – down 20%
• Agriculture – down 9%
• Public water supply – down 5%
• Water “Use” vs. water “Used”
• These reports actually document estimates of water withdrawals by “category of use”
• Water “use” in the Public Water Supply sector is recognized to include system leakage, and various occurrences of unauthorized consumption, and unbilled authorized consumption
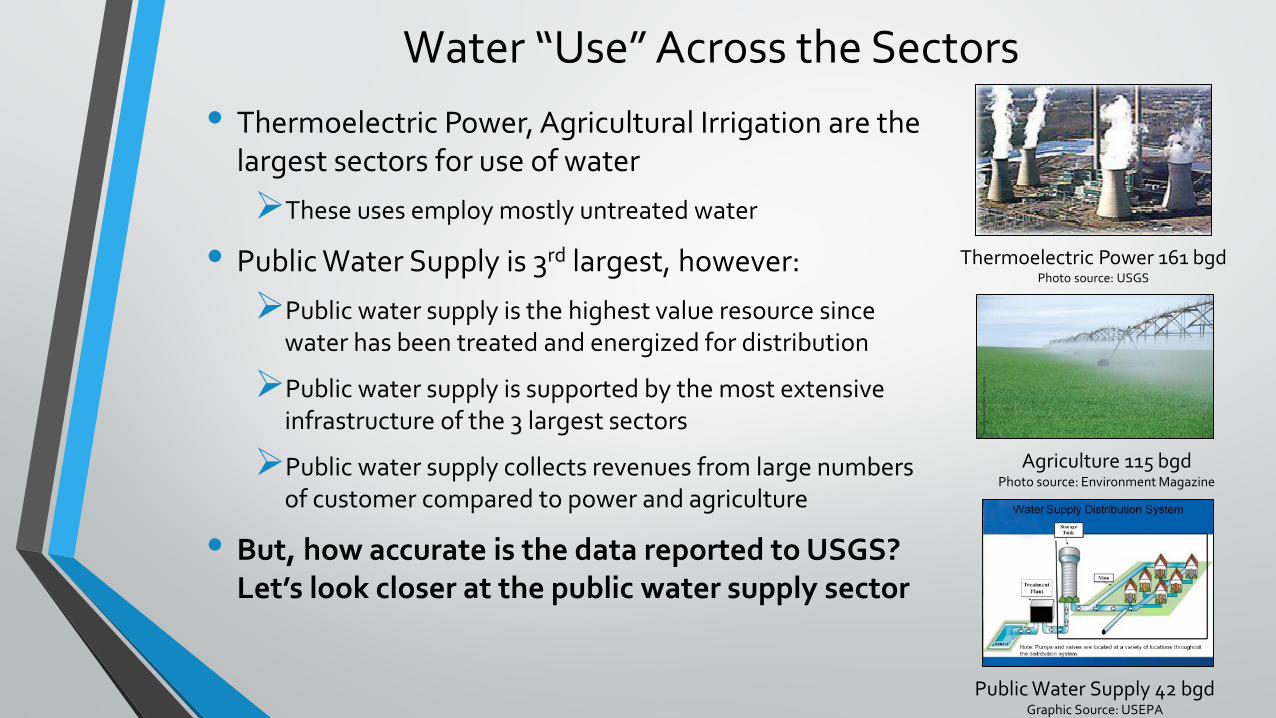
Water “Use” Across the Sectors • Thermoelectric Power, Agricultural Irrigation are the
largest sectors for use of water
These uses employ mostly untreated water
• Public Water Supply is 3rd largest, however:
Public water supply is the highest value resource since water has been treated and energized for distribution
Public water supply is supported by the most extensive infrastructure of the 3 largest sectors
Public water supply collects revenues from large numbers of customer compared to power and agriculture
• But, how accurate is the data reported to USGS? Let’s look closer at the public water supply sector
Thermoelectric Power 161 bgdPhoto source: USGS
Agriculture 115 bgdPhoto source: Environment Magazine
Public Water Supply 42 bgdGraphic Source: USEPA
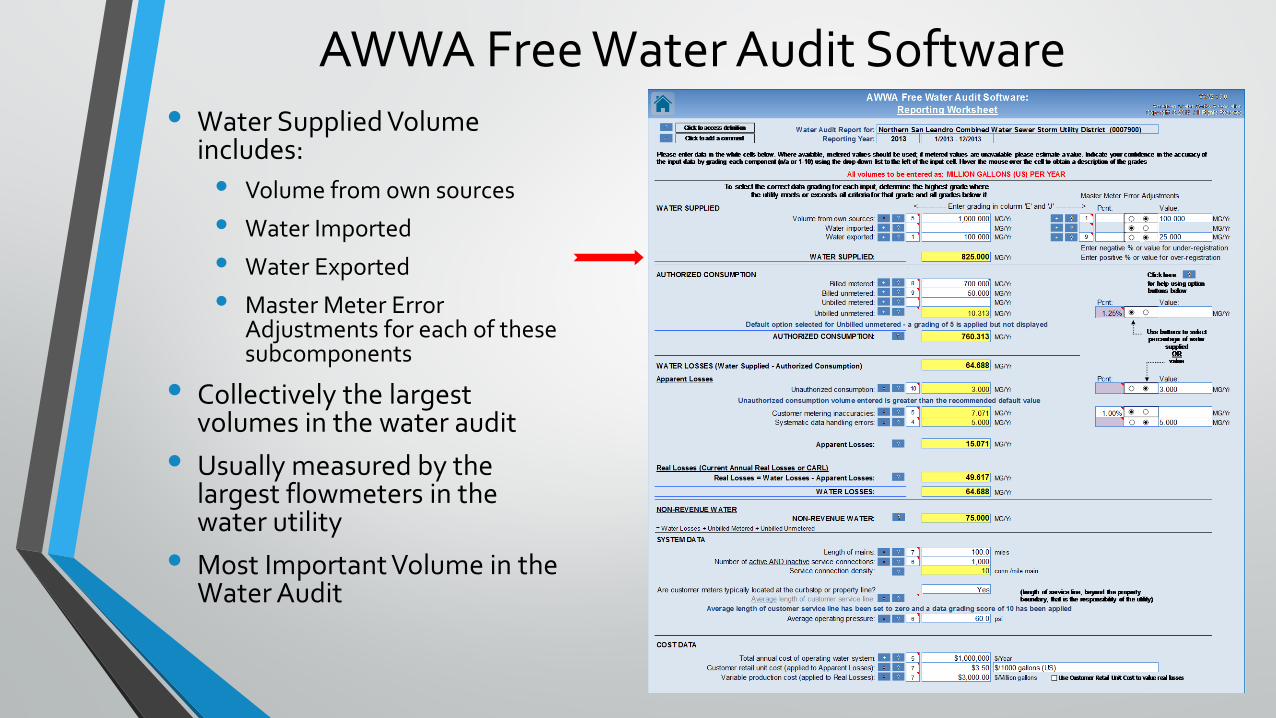
AWWA Free Water Audit Software• Water Supplied Volume
includes:• Volume from own sources
• Water Imported
• Water Exported
• Master Meter Error Adjustments for each of these subcomponents
• Collectively the largest volumes in the water audit
• Usually measured by the largest flowmeters in the water utility
• Most Important Volume in the Water Audit
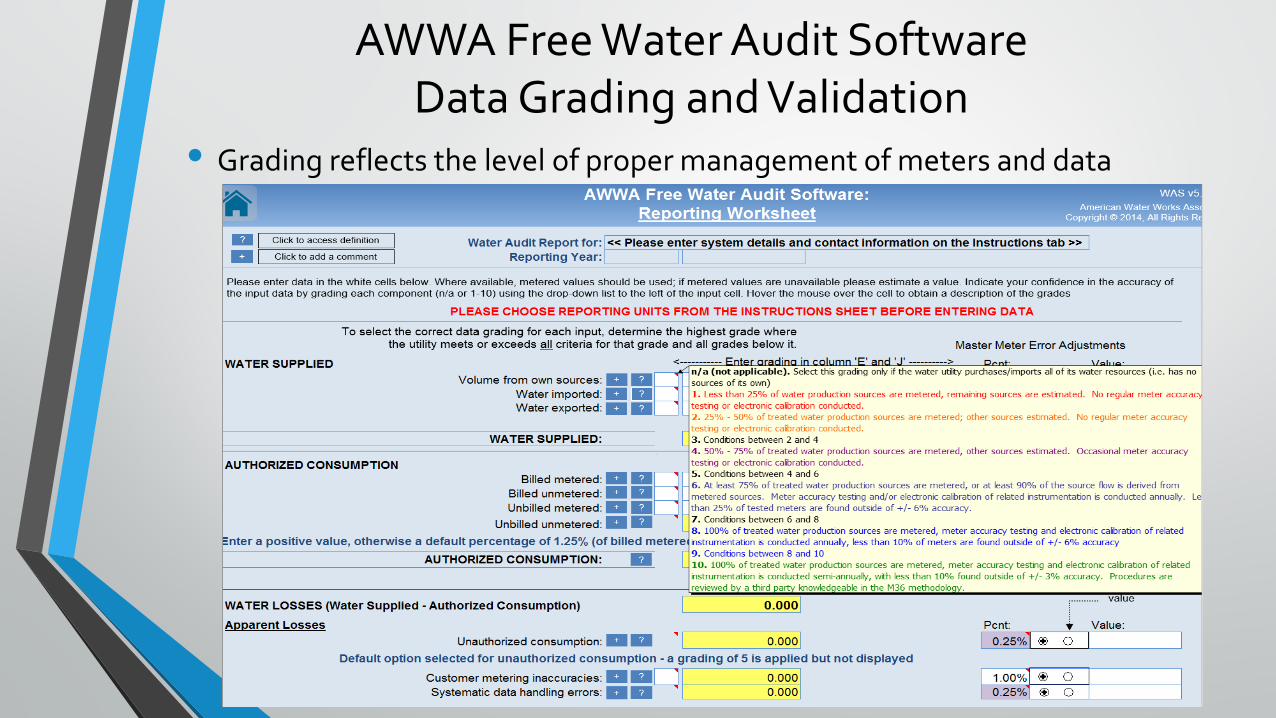
AWWA Free Water Audit SoftwareData Grading and Validation
• Grading reflects the level of proper management of meters and data
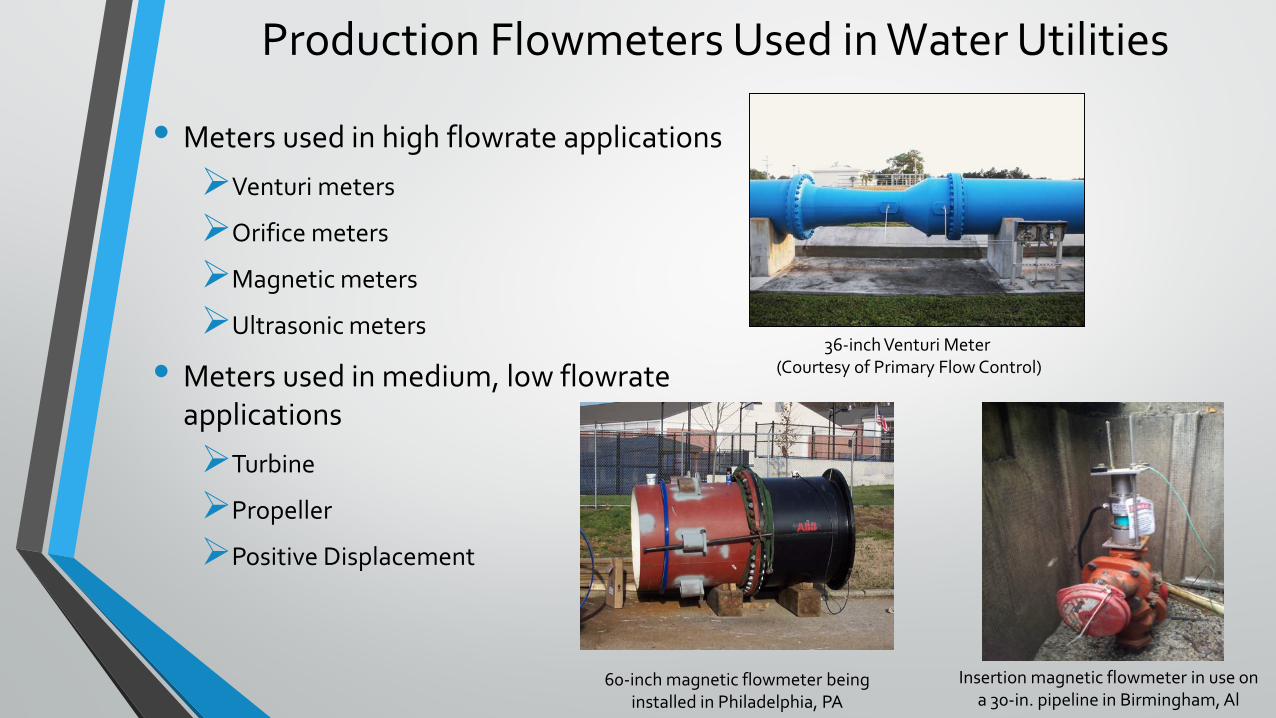
Production Flowmeters Used in Water Utilities
• Meters used in high flowrate applications
Venturi meters
Orifice meters
Magnetic meters
Ultrasonic meters
• Meters used in medium, low flowrate applications
Turbine
Propeller
Positive Displacement
Insertion magnetic flowmeter in use on a 30-in. pipeline in Birmingham, Al
36-inch Venturi Meter(Courtesy of Primary Flow Control)
60-inch magnetic flowmeter being installed in Philadelphia, PA
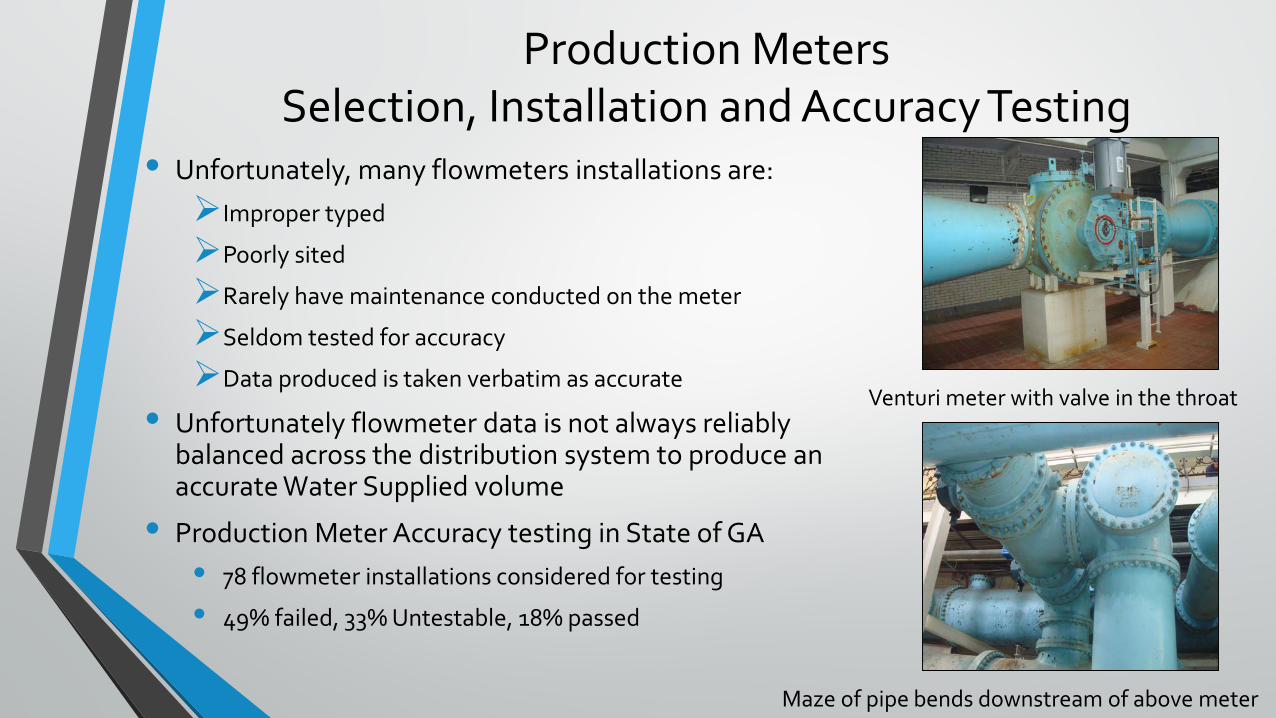
Production MetersSelection, Installation and Accuracy Testing
• Unfortunately, many flowmeters installations are:Improper typed
Poorly sited
Rarely have maintenance conducted on the meter
Seldom tested for accuracy
Data produced is taken verbatim as accurate
• Unfortunately flowmeter data is not always reliably balanced across the distribution system to produce an accurate Water Supplied volume
• Production Meter Accuracy testing in State of GA• 78 flowmeter installations considered for testing
• 49% failed, 33% Untestable, 18% passed
Venturi meter with valve in the throat
Maze of pipe bends downstream of above meter
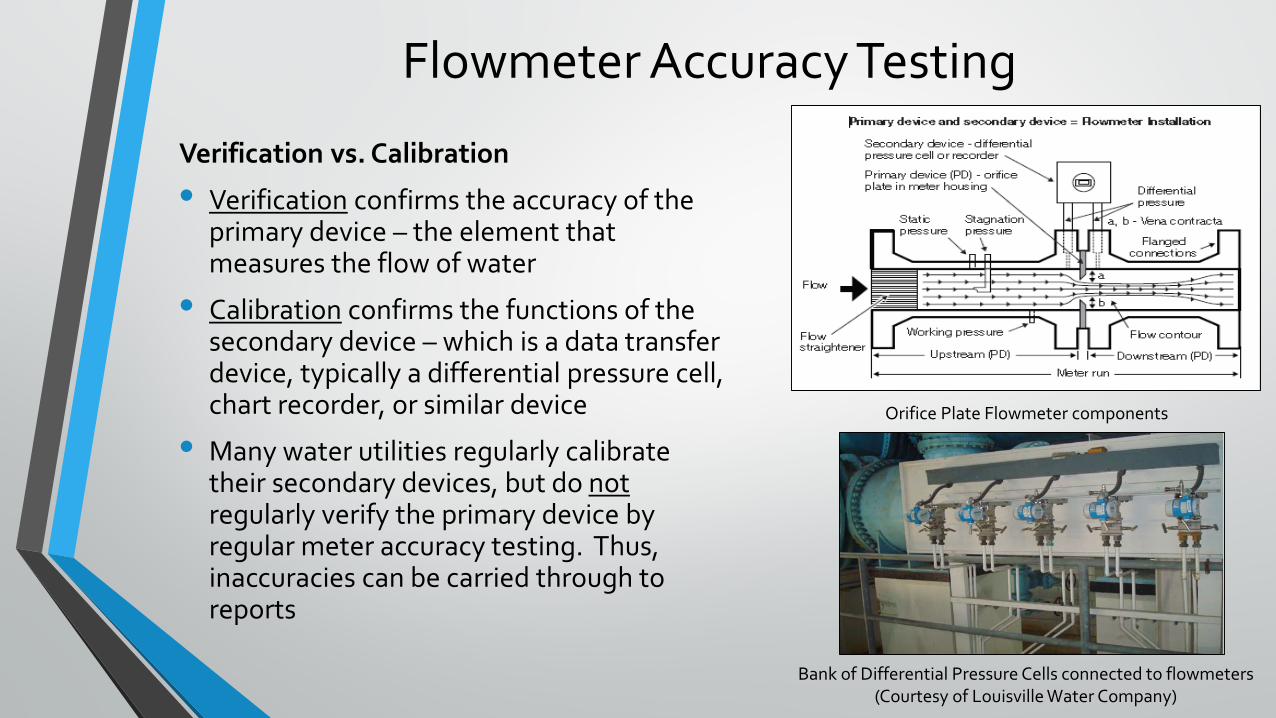
Flowmeter Accuracy Testing
Verification vs. Calibration
• Verification confirms the accuracy of the primary device – the element that measures the flow of water
• Calibration confirms the functions of the secondary device – which is a data transfer device, typically a differential pressure cell, chart recorder, or similar device
• Many water utilities regularly calibrate their secondary devices, but do notregularly verify the primary device by regular meter accuracy testing. Thus, inaccuracies can be carried through to reports
Bank of Differential Pressure Cells connected to flowmeters(Courtesy of Louisville Water Company)
Orifice Plate Flowmeter components

Basic Pipeline Hydraulics
• Friction forces along the pipe wall slow the flow often giving the bullet-shaped velocity profile at top
• Obstructions close to a point of measurement (such as a flowmeter) cause a distorted velocity profile
• Good design will avoid the occurrence of distorted flow profiles
• Knowing the true velocity profile near a flowmeter is important to obtaining a representative meter accuracy test
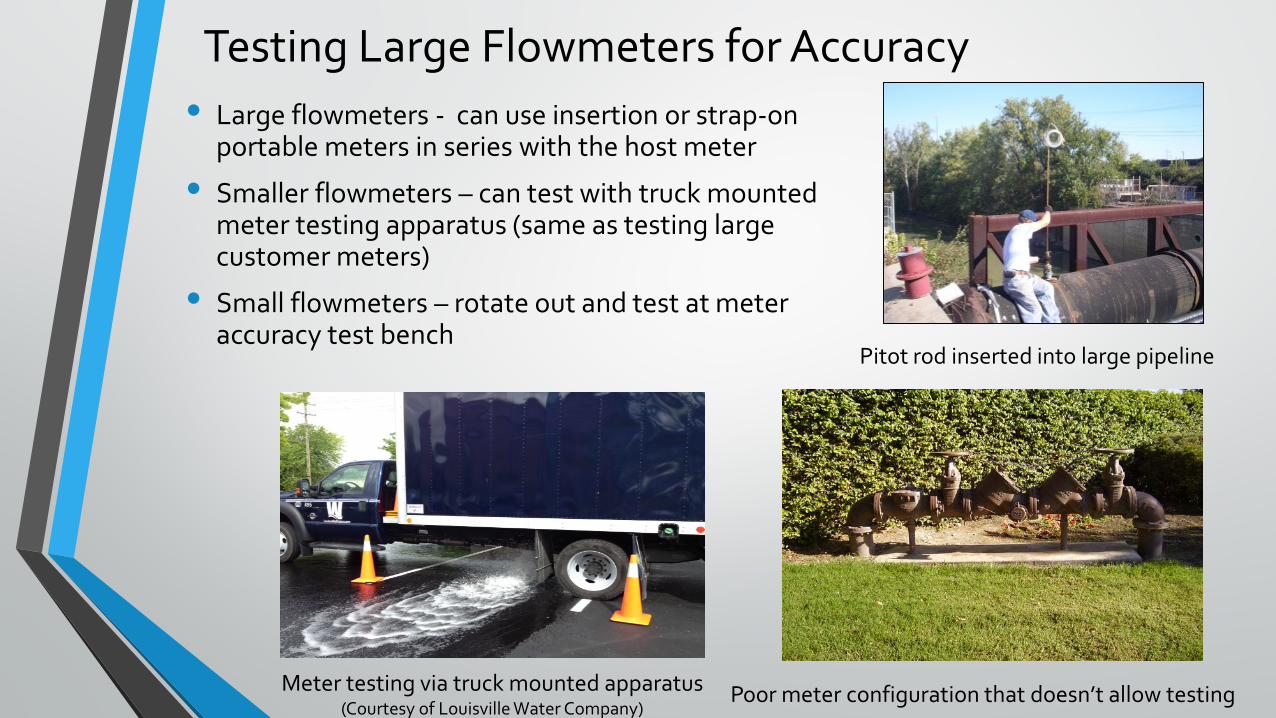
Testing Large Flowmeters for Accuracy• Large flowmeters - can use insertion or strap-on
portable meters in series with the host meter
• Smaller flowmeters – can test with truck mounted meter testing apparatus (same as testing large customer meters)
• Small flowmeters – rotate out and test at meter accuracy test bench
Pitot rod inserted into large pipeline
Poor meter configuration that doesn’t allow testingMeter testing via truck mounted apparatus(Courtesy of Louisville Water Company)
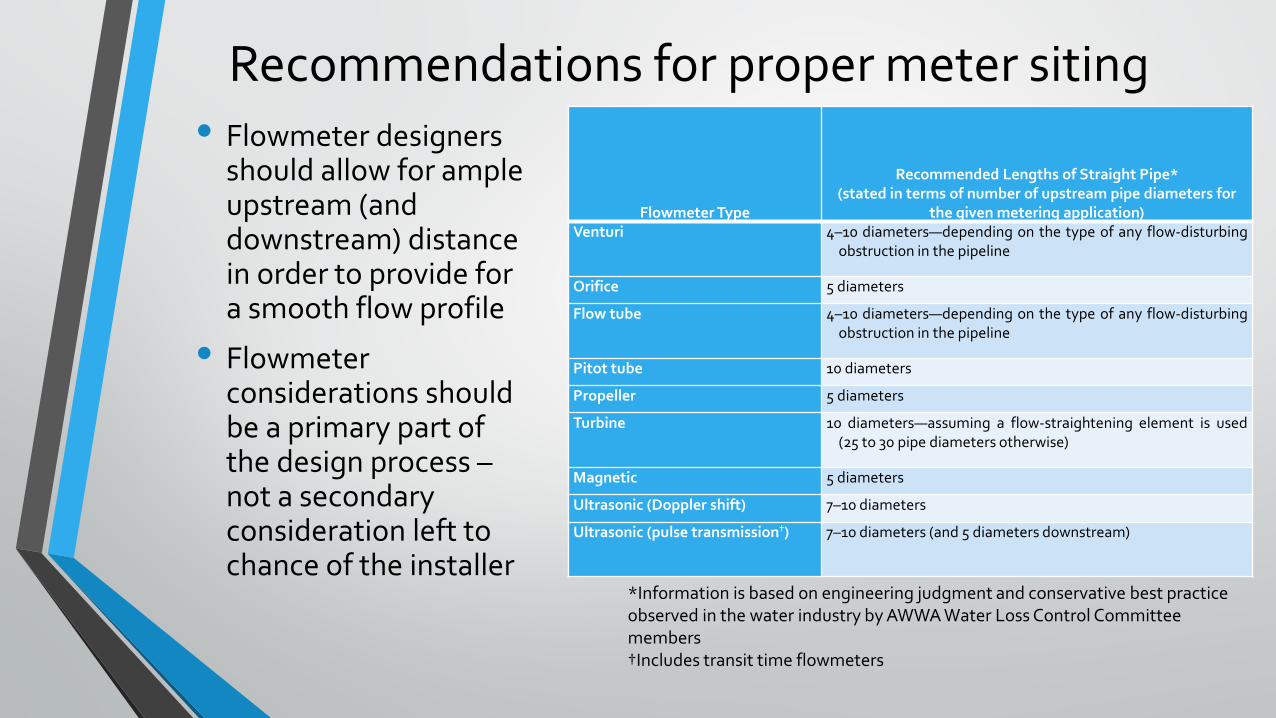
Recommendations for proper meter siting • Flowmeter designers
should allow for ample upstream (and downstream) distance in order to provide for a smooth flow profile
• Flowmeter considerations should be a primary part of the design process –not a secondary consideration left to chance of the installer
Flowmeter Type
Recommended Lengths of Straight Pipe*(stated in terms of number of upstream pipe diameters for
the given metering application)Venturi 4–10 diameters—depending on the type of any flow-disturbing
obstruction in the pipeline
Orifice 5 diameters
Flow tube 4–10 diameters—depending on the type of any flow-disturbingobstruction in the pipeline
Pitot tube 10 diameters
Propeller 5 diameters
Turbine 10 diameters—assuming a flow-straightening element is used(25 to 30 pipe diameters otherwise)
Magnetic 5 diameters
Ultrasonic (Doppler shift) 7–10 diameters
Ultrasonic (pulse transmission†) 7–10 diameters (and 5 diameters downstream)
*Information is based on engineering judgment and conservative best practice observed in the water industry by AWWA Water Loss Control Committee members†Includes transit time flowmeters

Accurately Quantifying the Water Supplied Volume
Several steps can exist to reliably quantify the Water Supplied Volume
1.Source water, imported water and exported water should always be metered
a. Ideally, these meters should be the continuously recording type ideally linked to a Supervisory control and data acquisition (SCADA) System
b. If meters are not linked to a SCADA System, then data should be collected as frequently as possible, at least weekly
c. If meters are not continuously recording type, and are read infrequently, plan to upgrade the metering installation as soon as possible
Accurately Quantifying the Water Supplied Volume
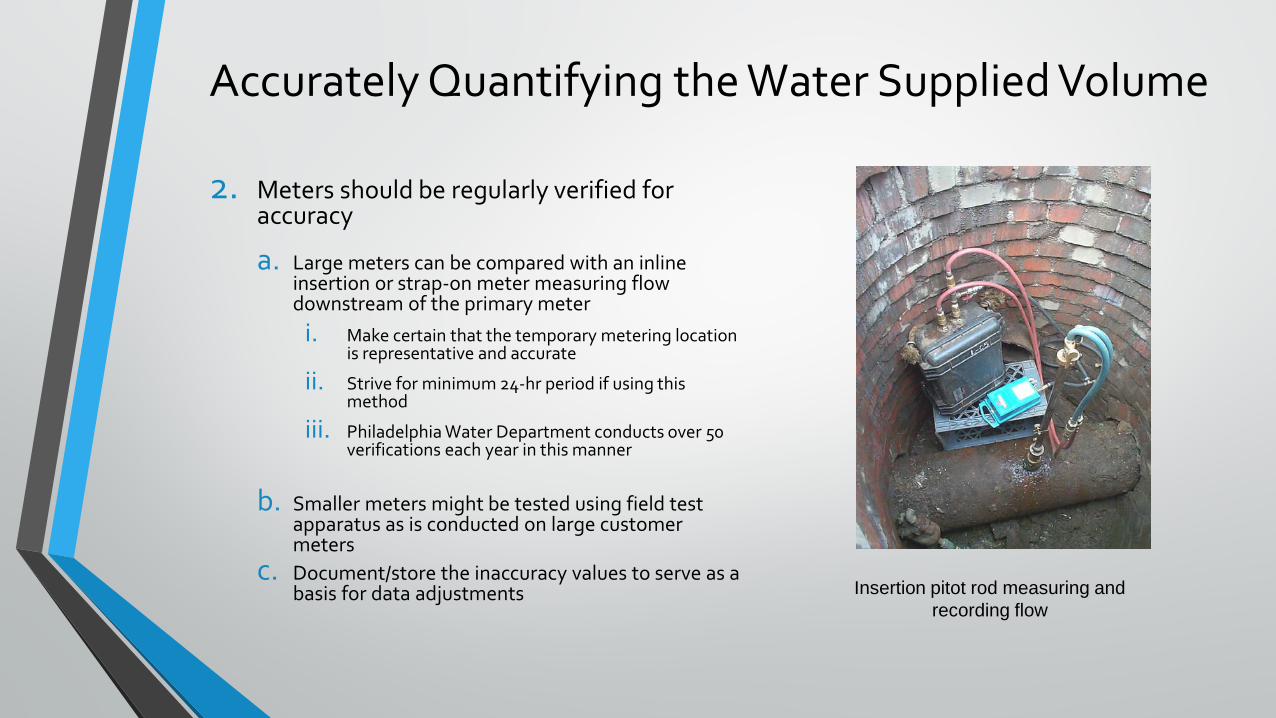
2. Meters should be regularly verified for accuracy
a. Large meters can be compared with an inline insertion or strap-on meter measuring flow downstream of the primary meter
i. Make certain that the temporary metering location is representative and accurate
ii. Strive for minimum 24-hr period if using this method
iii. Philadelphia Water Department conducts over 50 verifications each year in this manner
b. Smaller meters might be tested using field test apparatus as is conducted on large customer meters
c. Document/store the inaccuracy values to serve as a basis for data adjustments Insertion pitot rod measuring and
recording flow
Accurately Quantifying the Water Supplied Volume
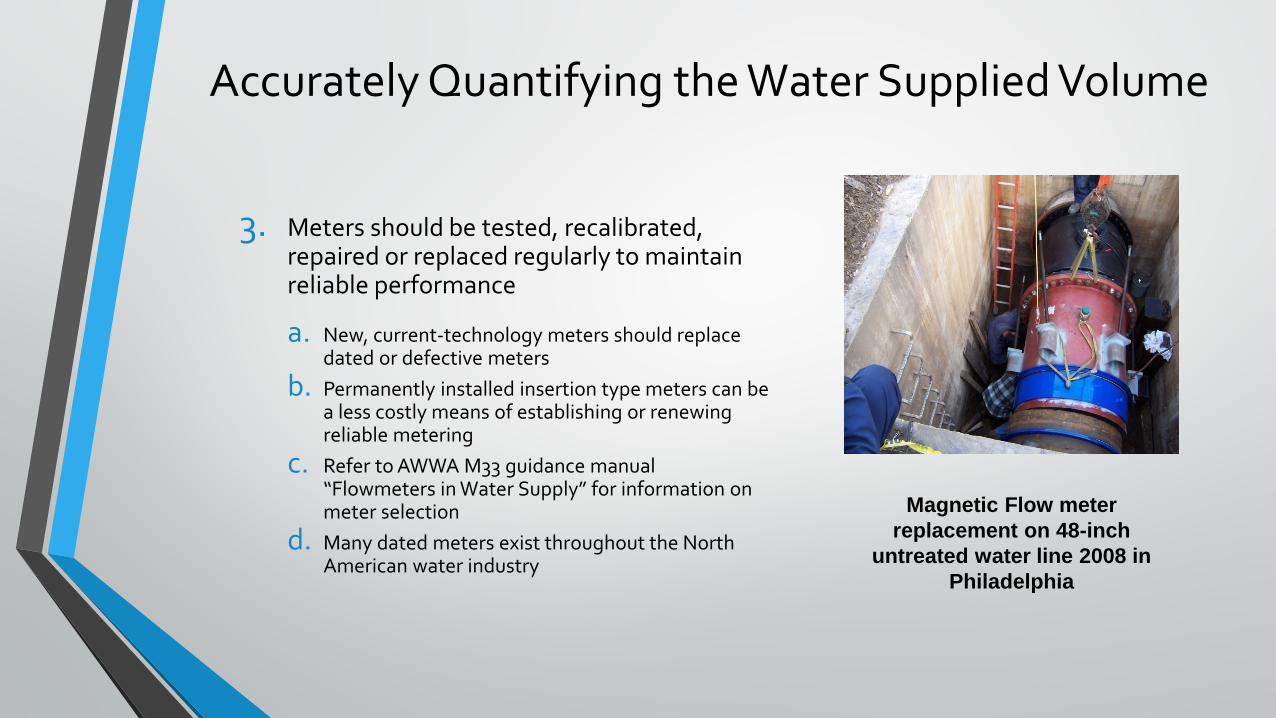
3. Meters should be tested, recalibrated, repaired or replaced regularly to maintain reliable performance
a. New, current-technology meters should replace dated or defective meters
b. Permanently installed insertion type meters can be a less costly means of establishing or renewing reliable metering
c. Refer to AWWA M33 guidance manual “Flowmeters in Water Supply” for information on meter selection
d. Many dated meters exist throughout the North American water industry
Magnetic Flow meter replacement on 48-inch
untreated water line 2008 in Philadelphia
Accurately Quantifying the Water Supplied Volume
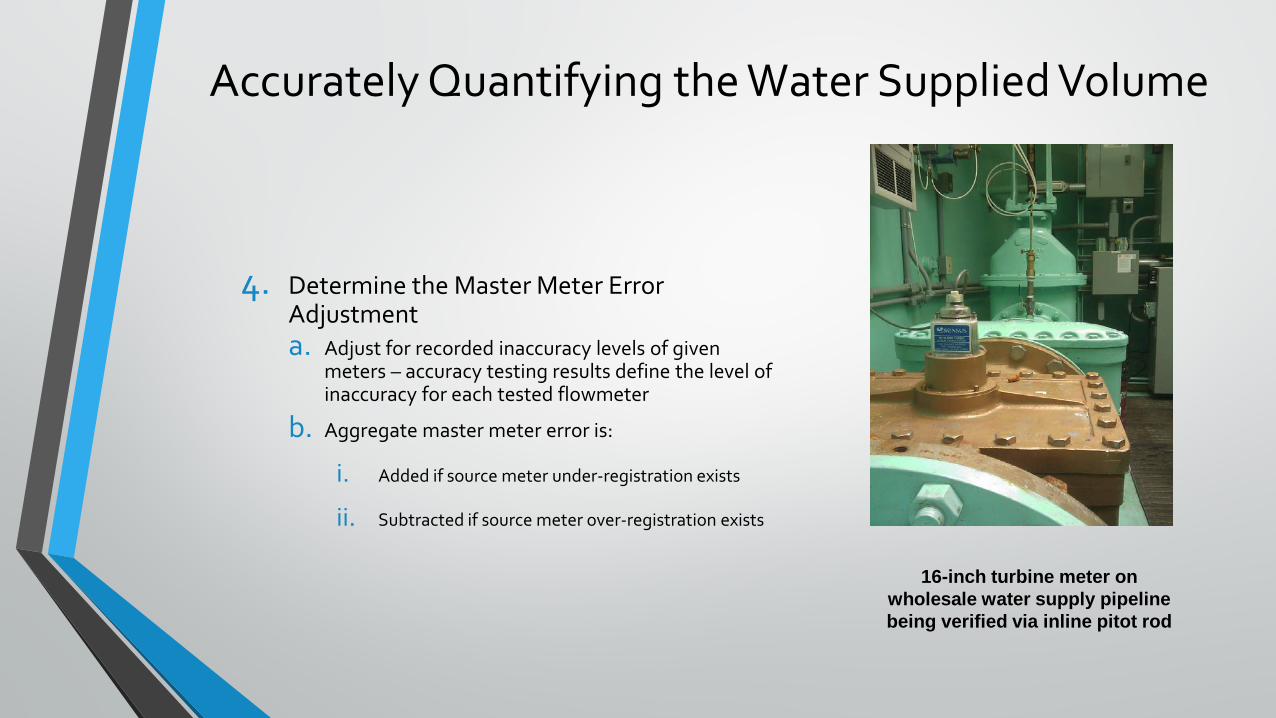
4. Determine the Master Meter Error Adjustmenta. Adjust for recorded inaccuracy levels of given
meters – accuracy testing results define the level of inaccuracy for each tested flowmeter
b. Aggregate master meter error is:
i. Added if source meter under-registration exists
ii. Subtracted if source meter over-registration exists
16-inch turbine meter on wholesale water supply pipeline being verified via inline pitot rod

Accurately Quantifying the Water Supplied Volume
5. Regularly balance supplies across the water distribution system to arrive at the Water Supplied Volume a. Use spreadsheet reports to tabulate water
flowing in/out of all parts of the distribution system – on a daily basis
b. Data should be reviewed at least weekly, but ideally, each business day, for trends/anomalies
c. Storage tank/reservoir levels should be monitored and recorded, and influent/effluent metered as practical
d. Water transfers among pressure zones or District Metered Areas (DMA) should be metered and recorded
e. Make adjustments to correct data errors
f. Make adjustments to correct data gapsPhiladelphia “Map Board” showing pressure districts, pressures and storage elevations
(Courtesy of the Philadelphia Water Department)
16

Detailed Monitoring of Supply across the distribution system
Daily tracking allows unusual variations to be detected and data corrected
Instrument outages, tank draining/filling, tank overflows can be detected and/or observed by closely watching data
Courtesy of the City of Ames, IA

Philadelphia’s “Mass Balance” Technique to Monitor Production Meter Performance
PHILADELPHIA WATER DEPARTMENTQUEEN LANE WATER TREATMENT PLANT CONFIGURATION
HIGH SERVICE PUMPING
B FILTERS C
FW STORAGE
RAW WATER BASIN METERS
RAW WATER PUMPING
A A = Raw water pumping flowSCHUYLKILL RIVER B = Pretreatment flow GRAVITY MAIN DISTRIBUTION
METERS C = Treated Water Flow
Plant Output = Meter Rates C +/- Changes in Volume of Filtered Water Storage Basins
SYSTEM LOSSES
A to B: Loss in transmission mains, flume, and raw water basin leakage; typically 1% - 2% of raw water pumped B to C: Loss in treatment process; chemical application, filter backwash, typically 5% - 8% of raw water pumped A to C: Overall total = sum of A to B and B to C and metering inaccuracies; typically 7% - 10%
(Note: changes in raw water basin and filtered water storage basins are included when determing loss)

Philadelphia’s “Mass Balance” Technique to Monitor Production Meter Performance
A B CRAW WATER FILTER
DATE +/- EVEV EFFLUENT(MG) (MG) (MG) (MG) (%) (MG) (%) (MG) (%)
06/01/12 56.82 55.90 51.55 0.92 1.61 4.35 7.78 5.27 9.27 06/02/12 57.69 56.60 52.17 1.09 1.89 4.43 7.83 5.52 9.57 06/03/12 58.16 57.10 52.75 1.06 1.82 4.35 7.62 5.41 9.31 06/04/12 56.77 55.90 51.56 0.87 1.53 4.34 7.76 5.21 9.17 06/05/12 58.50 57.50 53.02 1.00 1.71 4.48 7.80 5.48 9.37 06/06/12 57.82 56.80 52.33 1.02 1.77 4.47 7.86 5.49 9.50 06/07/12 57.03 56.00 52.03 1.03 1.81 3.97 7.10 5.01 8.78 06/08/12 57.19 56.30 51.99 0.89 1.55 4.31 7.65 5.19 9.08 06/09/12 57.92 56.90 52.81 1.02 1.76 4.09 7.19 5.11 8.82 06/10/12 58.01 57.00 52.57 1.01 1.75 4.43 7.78 5.45 9.39
TOTAL 575.9 566.0 522.8 9.9 43.2 53.1AVERAGE 57.6 56.6 52.3 1.0 1.7 4.3 7.6 5.3 9.2MAXIMUM 58.5 57.5 53.0 1.1 1.9 4.5 7.9 5.5 9.6MINIMUM 56.8 55.9 51.6 0.9 1.5 4.0 7.1 5.0 8.8
FILTER PLANT MASS BALANCE REPORT
PHILADELPHIA WATER DEPARTMENT
PLANT MASTER METERS WATER LOSS
QUEEN LANE WATER TREATMENT PLANT
A - B B - C A - CPRETREAT

Adjusting for Data Gaps• Production flow data should
be reviewed every business day for data gaps
• Gaps occur due to:
• Unplanned interruption: lightning strike, power failure
• Planned interruption: instrumentation calibration
• Gaps in water flow data should be quantified and added back to the daily total
8/15/2012,hrs
High Service Pumping Rate, mgd
actual flow
High Service Pumping Rate, mgdraw recorded data
High Service Pumping Rate, mgd
adjusted data0:00 8.69 8.69 8.691:00 8.65 8.65 8.652:00 8.32 8.32 8.323:00 8.11 8.11 8.114:00 7.94 0 85:00 8.02 0 86:00 8.44 0 87:00 8.98 0 98:00 9.34 0 9.39:00 9.25 0 9.310:00 9.17 0 9.311:00 9.12 9.12 9.1212:00 9.27 9.27 9.2713:00 9.22 9.22 9.2214:00 9.08 9.08 9.0815:00 8.99 8.99 8.9916:00 9.14 9.14 9.1417:00 9.18 9.18 9.1818:00 9.25 9.25 9.2519:00 9.22 9.22 9.2220:00 8.82 8.82 8.8221:00 8.78 8.78 8.7822:00 8.75 8.75 8.7523:00 8.71 8.71 8.710:00 8.68 8.68 8.68
Total 212.43 151.29 212.19Average 8.85 6.30 8.84
Difference 2.55 0.01
Example of Water Pumping Data Gaps and Adjustments

Assembling Data for the Annual Water Audit
Month Number of days
Original SCADA
System data: unedited daily average water system input
based on SCADA A
history i t
Monthly total system input volume based
on original (unedited) total delivery - MG
Average daily system input
volume based on
edited SCADA B
history report-MGD*
Monthly total system input volume based
on edited SCADA B
history report-MG
Difference
July'10 31 276.9 8583.2 276.0 8556.4 -0.9Aug'10 31 263.1 8155.9 262.3 8131.7 -0.8Sep'10 30 257.7 7732.0 253.2 7594.5 -4.6Oct'10 31 244.6 7582.5 239.0 7408.5 -5.6Nov'10 30 243.6 7309.1 239.9 7196.1 -3.8Dec'10 31 252.5 7828.5 251.4 7792.4 -1.2Jan'11 31 264.1 8186.7 262.7 8143.1 -1.4Feb'11 28 258.5 7237.9 256.8 7191.0 -1.7Mar'11 31 248.0 7687.4 239.0 7408.6 -9.0Apr'11 30 238.4 7151.9 231.0 6929.4 -7.4May'11 31 241.1 7473.2 237.3 7355.8 -3.8Jun'11 30 256.2 7684.7 251.7 7551.6 -4.4Sum 365 92613.0 91259.1 1353.9Average 253.7 250.0 3.7
Composite Water System Input Adjustments - Fiscal Year 2011Philadelphia Water Department
*Adjustments are based upon several factors including regular master meter verification testing, mass balance comparisons of flows into and out of water treatment plants, operational histories at facilities and instrumentation history.
SCADA “A” history: raw data from the field
SCADA “B” history: corrected, final data
Summary• USGS Water “Use” Report reveals a notable declining trend in water
withdrawals for all major sectors
• Water withdrawal data in public water supplies is not always managed with strong accuracy due to • Inappropriate, dated, poorly monitored flowmeters
• Insufficient surveillance of production data and lack of proper QA/QC on the data
• Accurate water withdrawal data is needed to assess water resources management at the macro-level, and to assist water efficiency efforts at the micro-level
• Drinking water utilities have the opportunity to investigate the performance of their supply sources and flowmeters and bring their practices up-to-date
• Forthcoming 4th Edition of the AWWA M36 manual will provide detailed guidance on production flowmeters and production data management