Embed Size (px)
Citation preview

This presentation may contain statements that are forward
looking. These statements are based on current expectations and
assumptions that are subject to risks and uncertainties, which may
cause actual results to differ materially. A summary of risks and
uncertainties is described in more detail in our periodic reports filed
with the Securities and Exchange Commission (SEC).
We undertake no duty to update or revise this presentation, whether
as a result of new information, future events or otherwise. For the
most recent financial, risk and other information about PACCAR,
please see our SEC filings and most recent earnings release
available on the Investor Resources page of www.paccar.com.
Page 2 October 2015
Page 3 October 2015
Page 4 October 2015
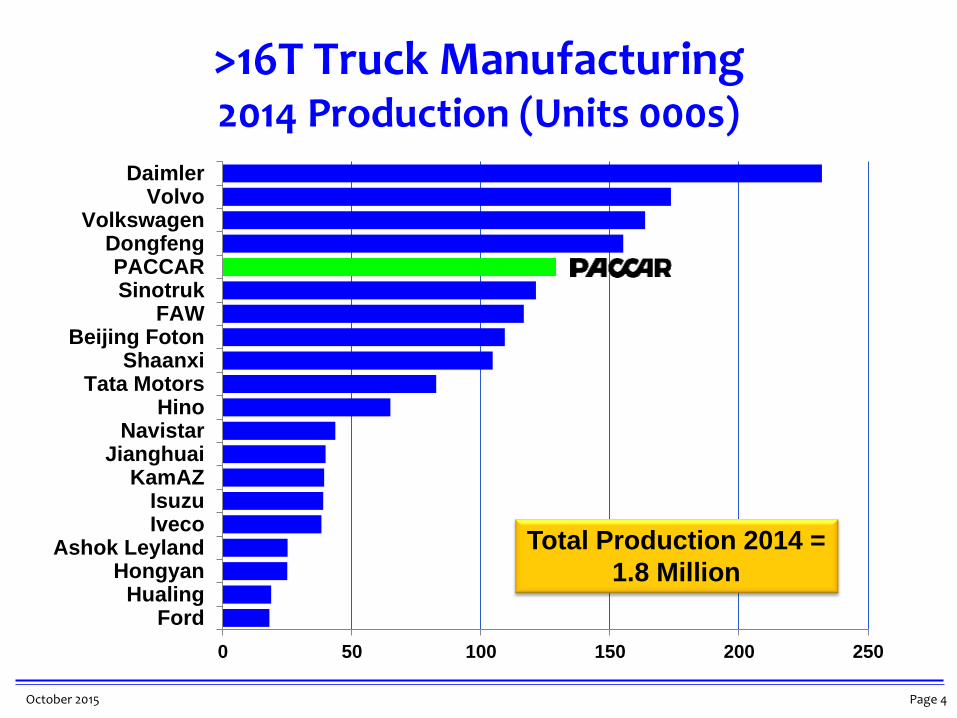
>16T Truck Manufacturing 2014 Production (Units 000s)
0 50 100 150 200 250
FordHualing
HongyanAshok Leyland
IvecoIsuzu
KamAZJianghuai
NavistarHino
Tata MotorsShaanxi
Beijing FotonFAW
SinotrukPACCAR
DongfengVolkswagen
VolvoDaimler
#5
Total Production 2014 =
1.8 Million
Page 5 October 2015
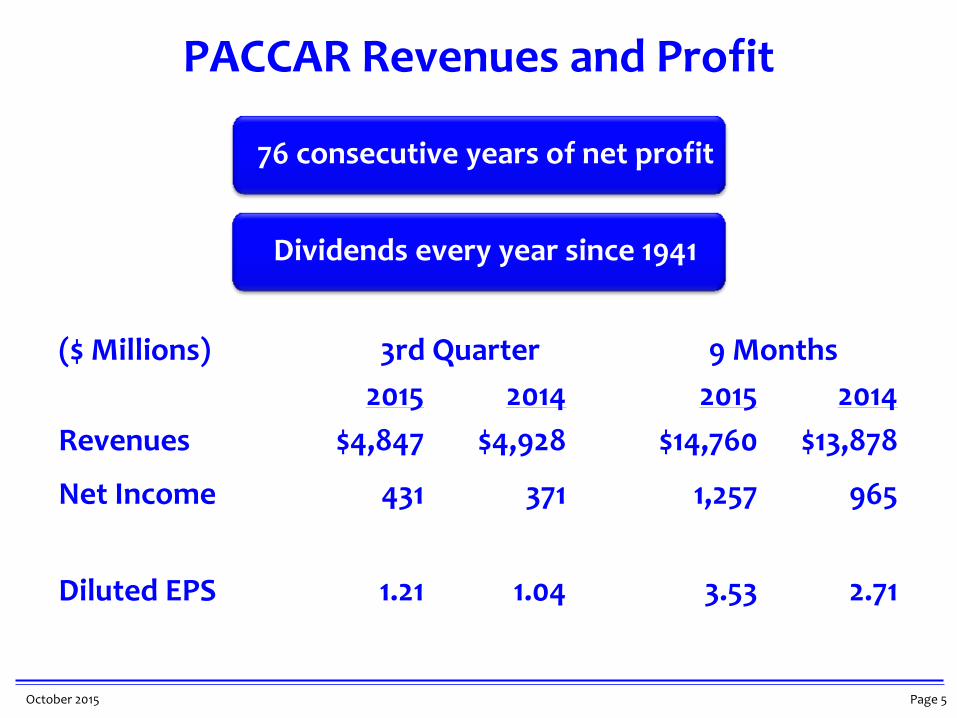
PACCAR Revenues and Profit
($ Millions) 3rd Quarter 9 Months
2015 2014 2015 2014
Revenues $4,847 $4,928 $14,760 $13,878
Net Income 431 371 1,257 965
Diluted EPS 1.21 1.04 3.53 2.71
76 consecutive years of net profit
Dividends every year since 1941
Page 6 October 2015
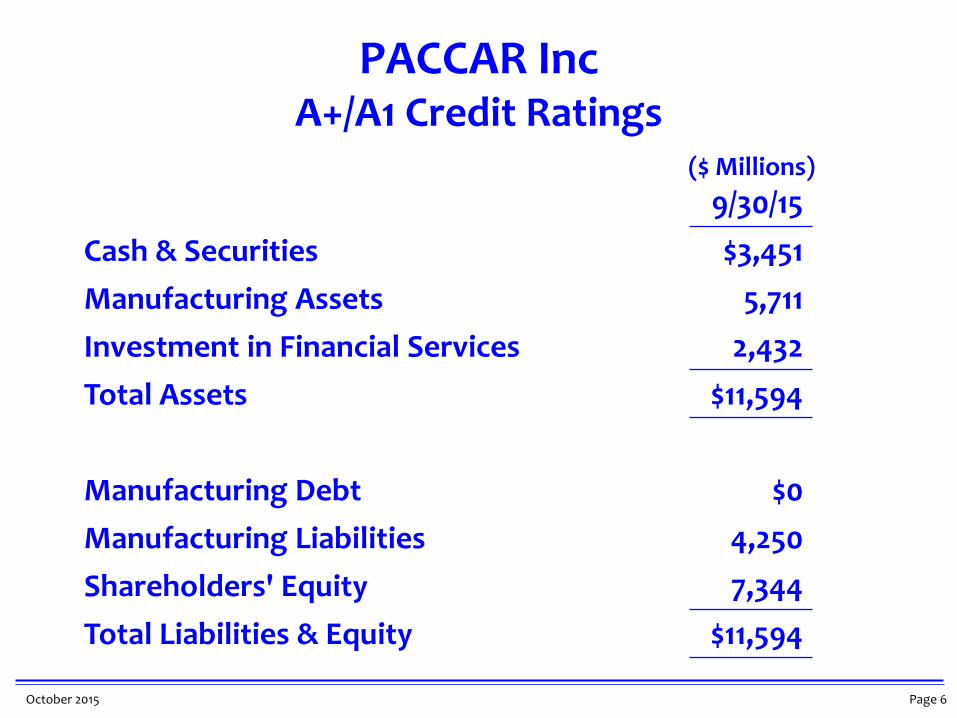
PACCAR Inc A+/A1 Credit Ratings
9/30/15
Cash & Securities $3,451
Manufacturing Assets 5,711
Investment in Financial Services 2,432
Total Assets $11,594
Manufacturing Debt $0
Manufacturing Liabilities 4,250
Shareholders' Equity 7,344
Total Liabilities & Equity $11,594
($ Millions)
Page 7 October 2015
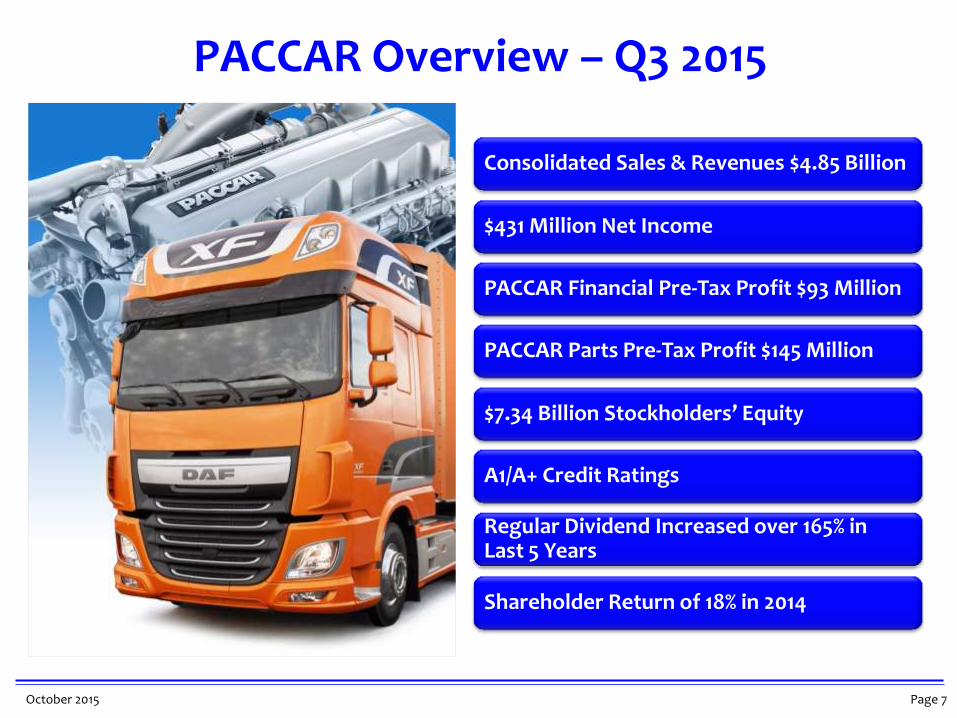
PACCAR Overview – Q3 2015
Consolidated Sales & Revenues $4.85 Billion
$431 Million Net Income
PACCAR Financial Pre-Tax Profit $93 Million
PACCAR Parts Pre-Tax Profit $145 Million
$7.34 Billion Stockholders’ Equity
A1/A+ Credit Ratings
Regular Dividend Increased over 165% in Last 5 Years
Shareholder Return of 18% in 2014
Page 8 October 2015
0
150
300
450
600
750
900
0
150
300
450
600
750
900
06 07 08 09 10 11 12 13 14 15
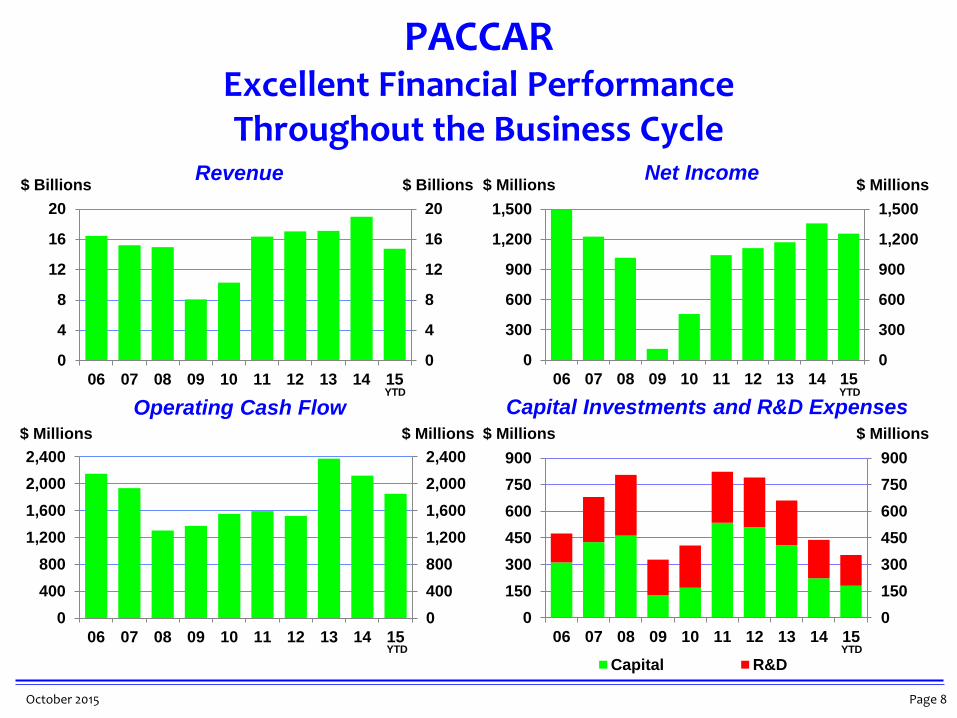
Capital R&D
Capital Investments and R&D Expenses
PACCAR Excellent Financial Performance Throughout the Business Cycle
0
4
8
12
16
20
0
4
8
12
16
20
06 07 08 09 10 11 12 13 14 15
Revenue
0
300
600
900
1,200
1,500
0
300
600
900
1,200
1,500
06 07 08 09 10 11 12 13 14 15
Net Income
0
400
800
1,200
1,600
2,000
2,400
0
400
800
1,200
1,600
2,000
2,400
06 07 08 09 10 11 12 13 14 15
Operating Cash Flow
$ Billions $ Billions $ Millions $ Millions
$ Millions $ Millions $ Millions $ Millions
YTD YTD
YTD YTD
Page 9 October 2015
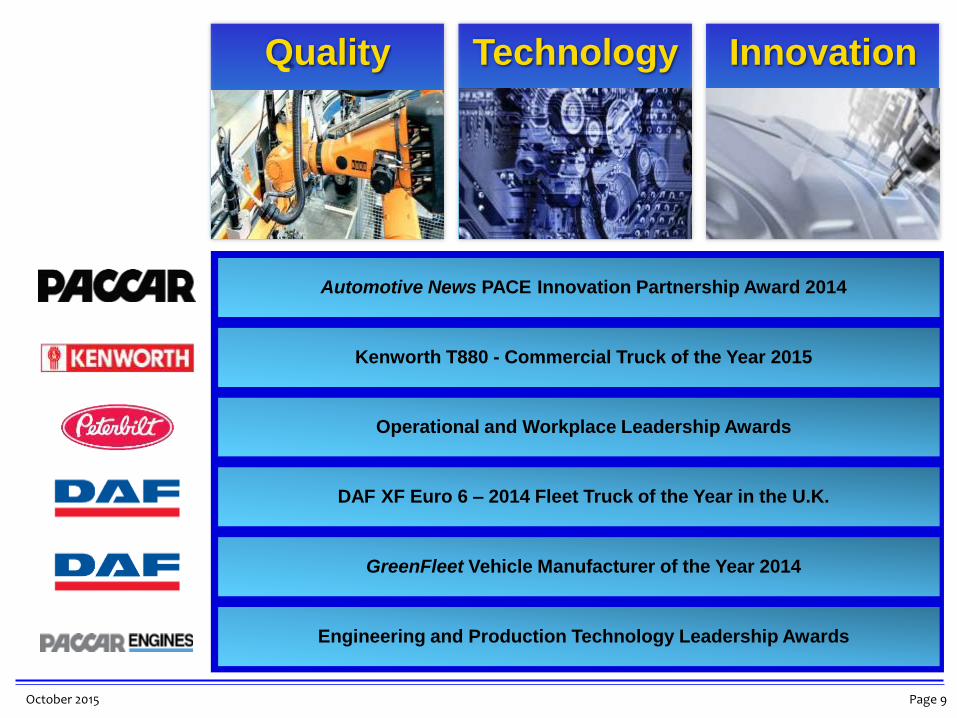
Quality Technology Innovation
DAF XF Euro 6 – 2014 Fleet Truck of the Year in the U.K.
GreenFleet Vehicle Manufacturer of the Year 2014
Engineering and Production Technology Leadership Awards
Automotive News PACE Innovation Partnership Award 2014
Kenworth T880 - Commercial Truck of the Year 2015
Operational and Workplace Leadership Awards

Page 10 October 2015
Commercial Vehicles Aftermarket Support
Financial Services Information Technology
Powertrain
Page 11 October 2015
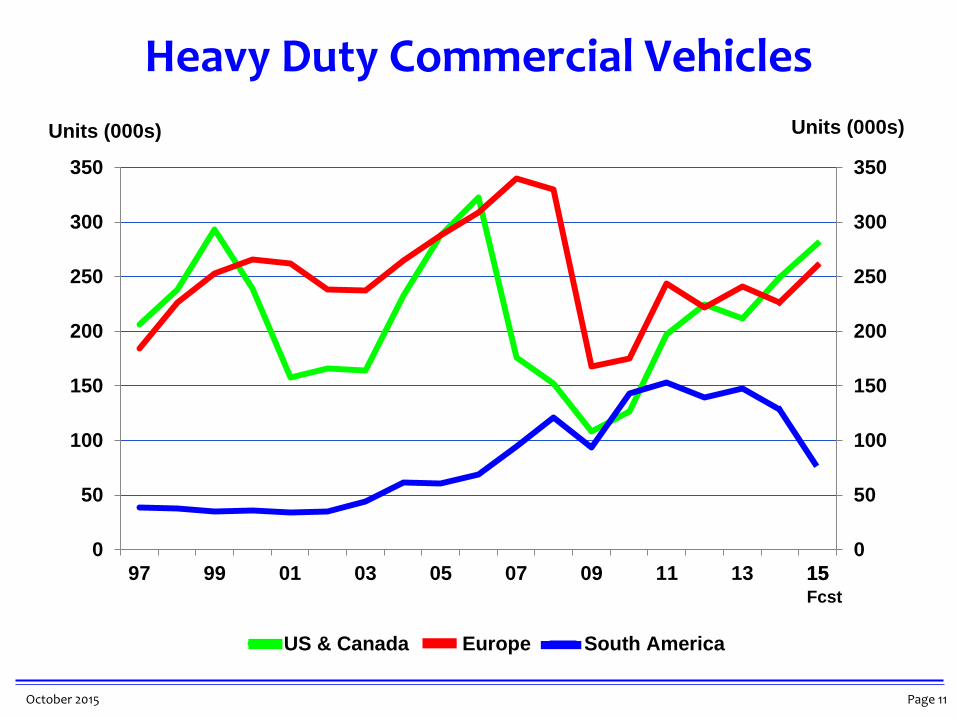
Heavy Duty Commercial Vehicles
0
50
100
150
200
250
300
350
0
50
100
150
200
250
300
350
97 99 01 03 05 07 09 11 13 15
Units (000s) Units 000s
US & Canada Europe South America
15 Fcst
Units (000s)
Page 12 October 2015
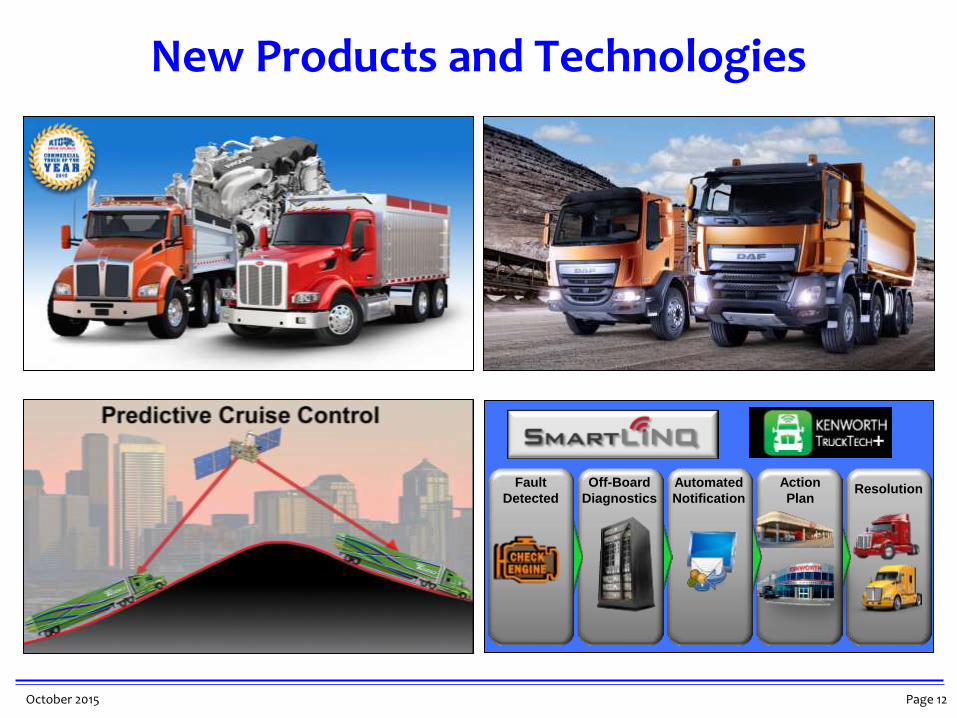
New Products and Technologies
Action
Plan
Automated
Notification
Off-Board
Diagnostics Resolution
Fault
Detected
Page 13 October 2015
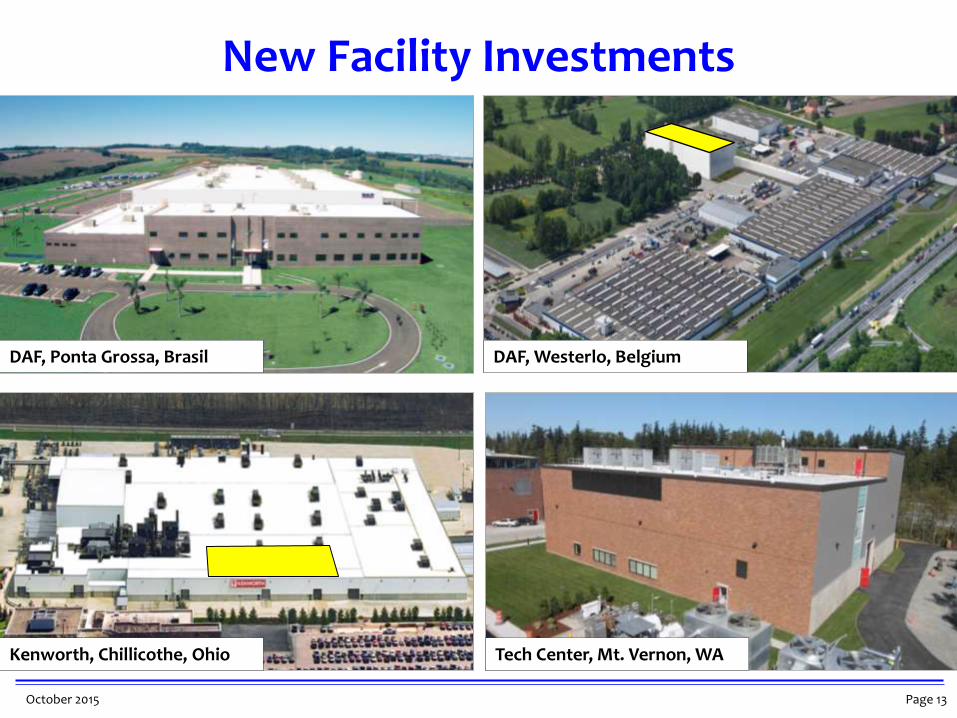
New Facility Investments
• Westerlo
DAF, Ponta Grossa, Brasil
Kenworth, Chillicothe, Ohio Tech Center, Mt. Vernon, WA
DAF, Westerlo, Belgium
Page 14 October 2015
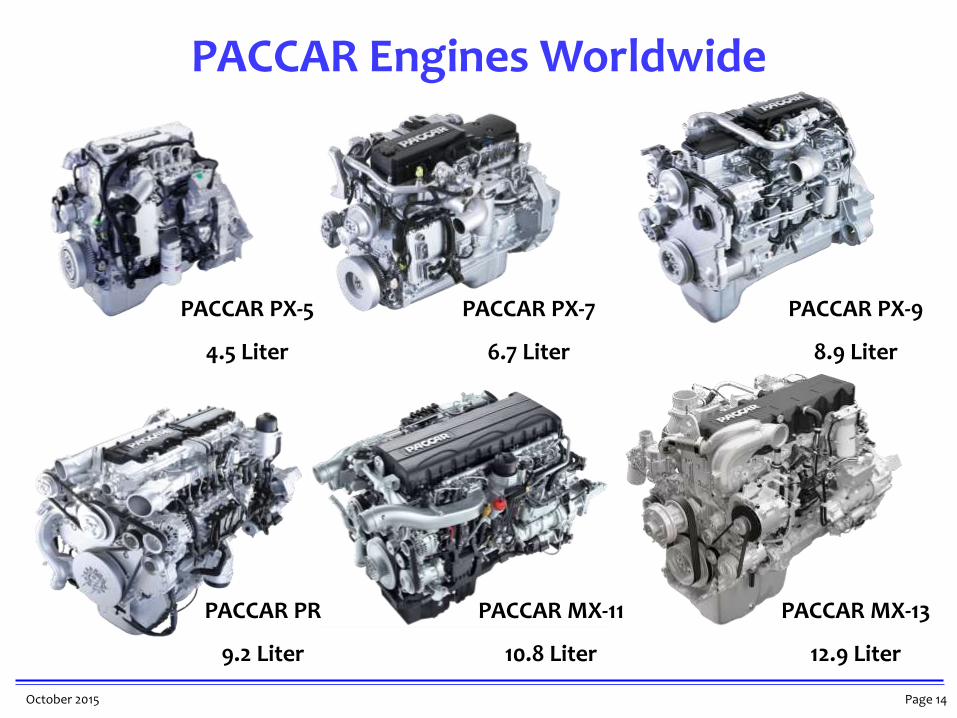
PACCAR PR
9.2 Liter
PACCAR MX-13
12.9 Liter
PACCAR PX-7
6.7 Liter
PACCAR PX-5
4.5 Liter
PACCAR Engines Worldwide
PACCAR MX-11
10.8 Liter
PACCAR PX-9
8.9 Liter
Page 15 October 2015
0
50
100
150
200
250
300
350
400
0
50
100
150
200
250
300
350
400
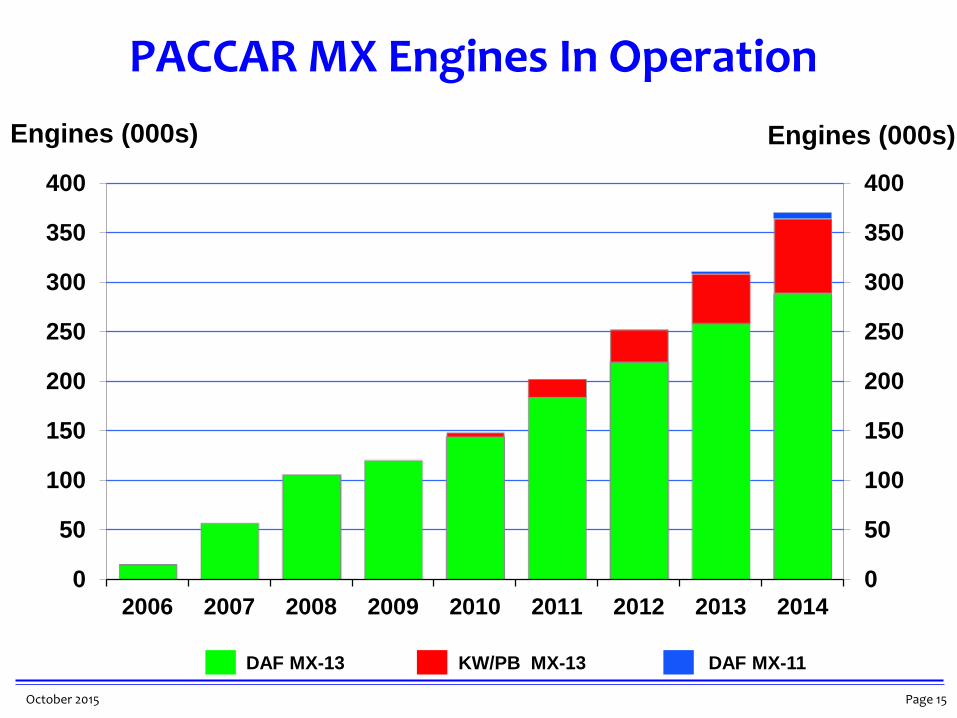
2006 2007 2008 2009 2010 2011 2012 2013 2014
Engines (000s) Engines (000s)
PACCAR MX Engines In Operation
KW/PB MX-13 DAF MX-11 DAF MX-13
Page 16 October 2015
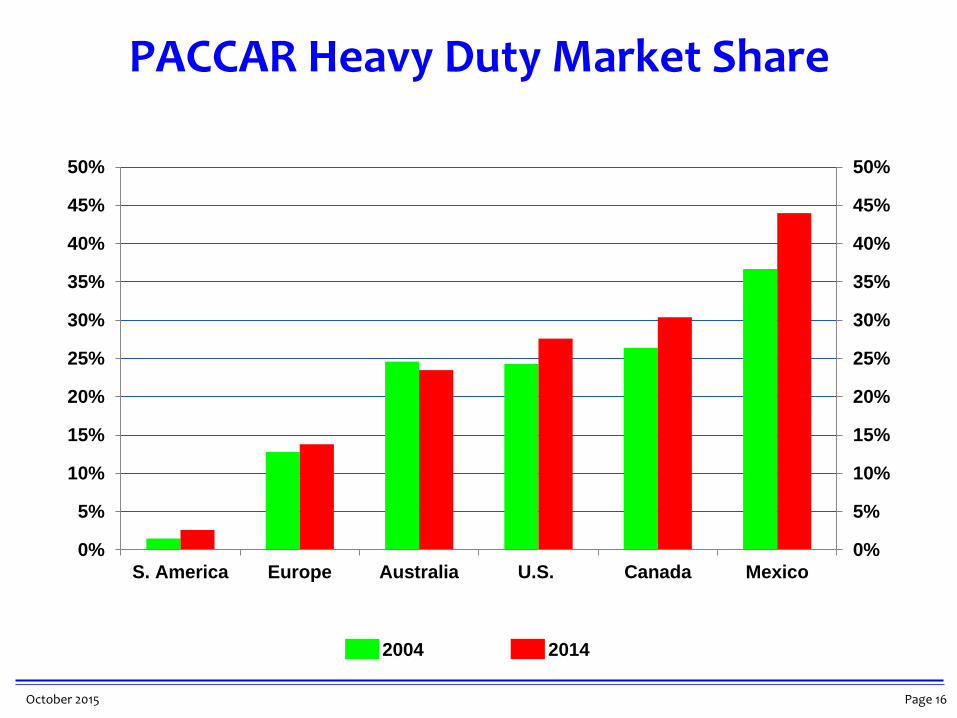
PACCAR Heavy Duty Market Share
0%
5%
10%
15%
20%
25%
30%
35%
40%
45%
50%
0%
5%
10%
15%
20%
25%
30%
35%
40%
45%
50%
S. America Europe Australia U.S. Canada Mexico
2004 2014
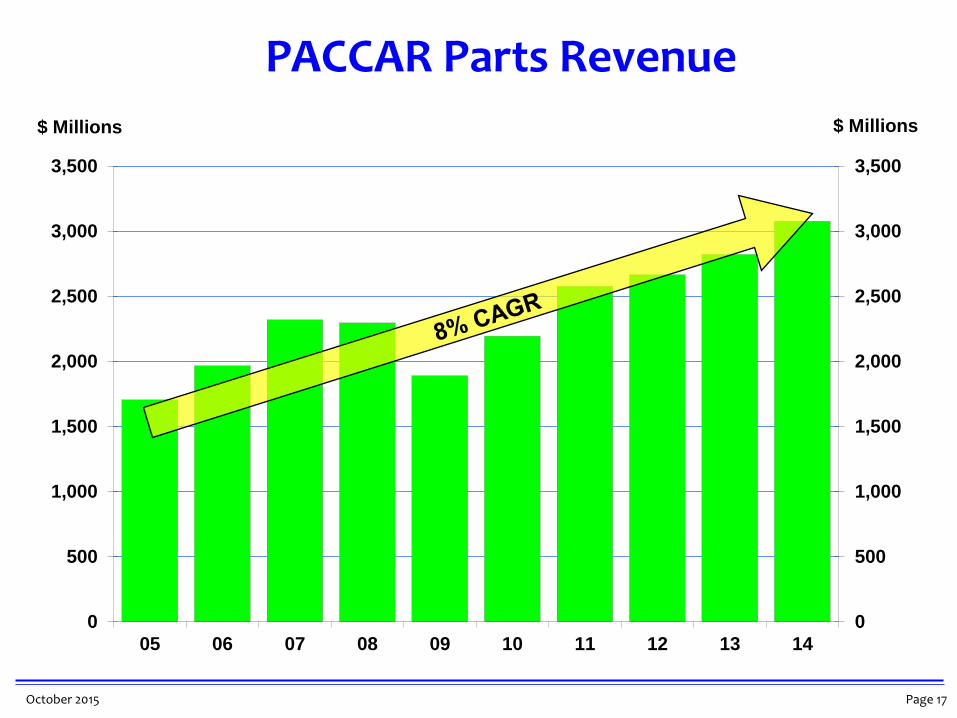
Page 17 October 2015
0
500
1,000
1,500
2,000
2,500
3,000
3,500
0
500
1,000
1,500
2,000
2,500
3,000
3,500
05 06 07 08 09 10 11 12 13 14
$ Millions $ Millions
PACCAR Parts Revenue
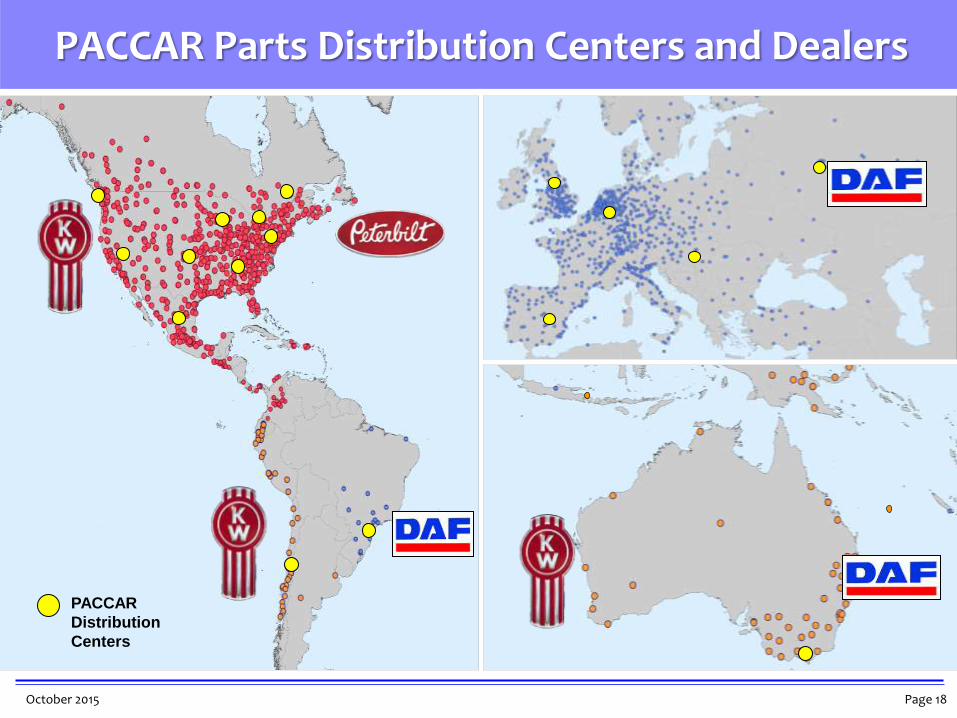
Page 18 October 2015
PACCAR
Distribution
Centers
PACCAR Parts Distribution Centers and Dealers
Page 19 October 2015
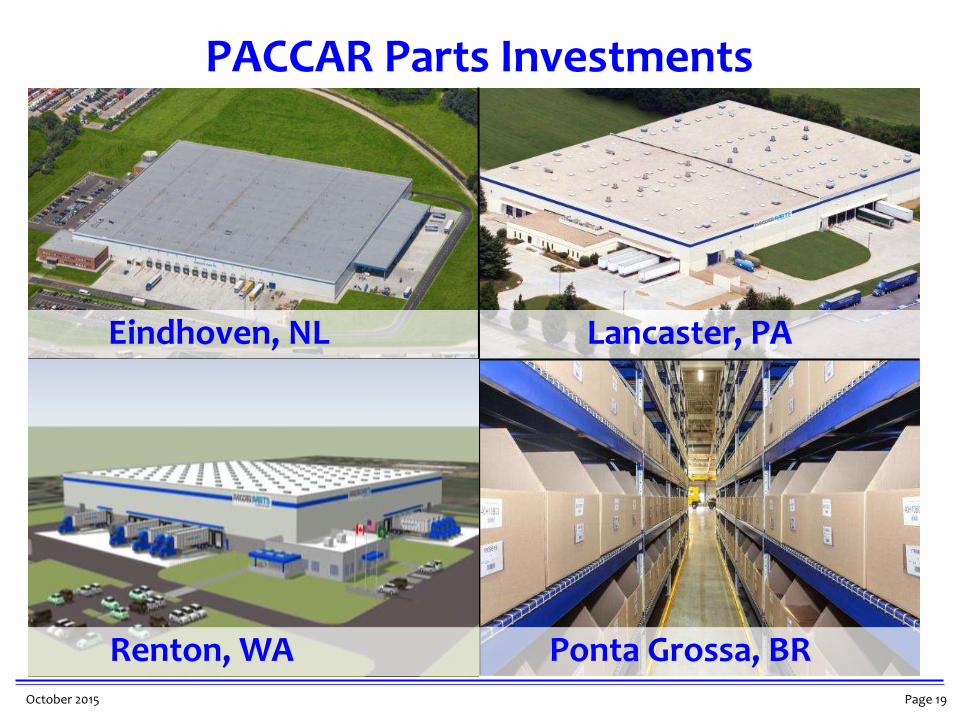
Eindhoven, NL Lancaster, PA
Ponta Grossa, BR
PACCAR Parts Investments
Renton, WA
Page 20 October 2015
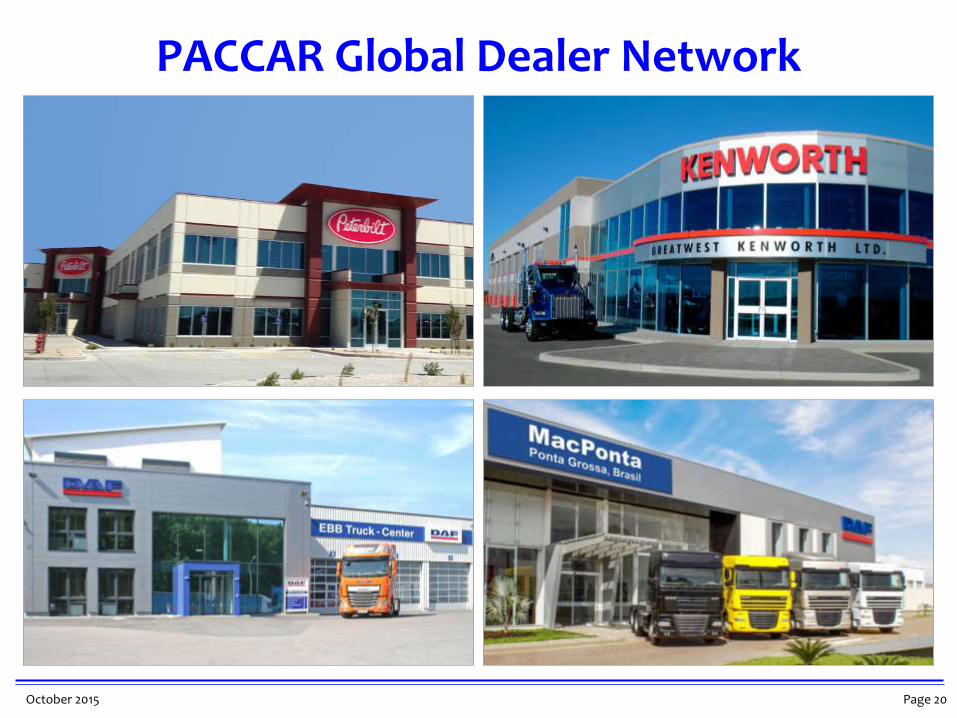
PACCAR Global Dealer Network
Page 21 October 2015
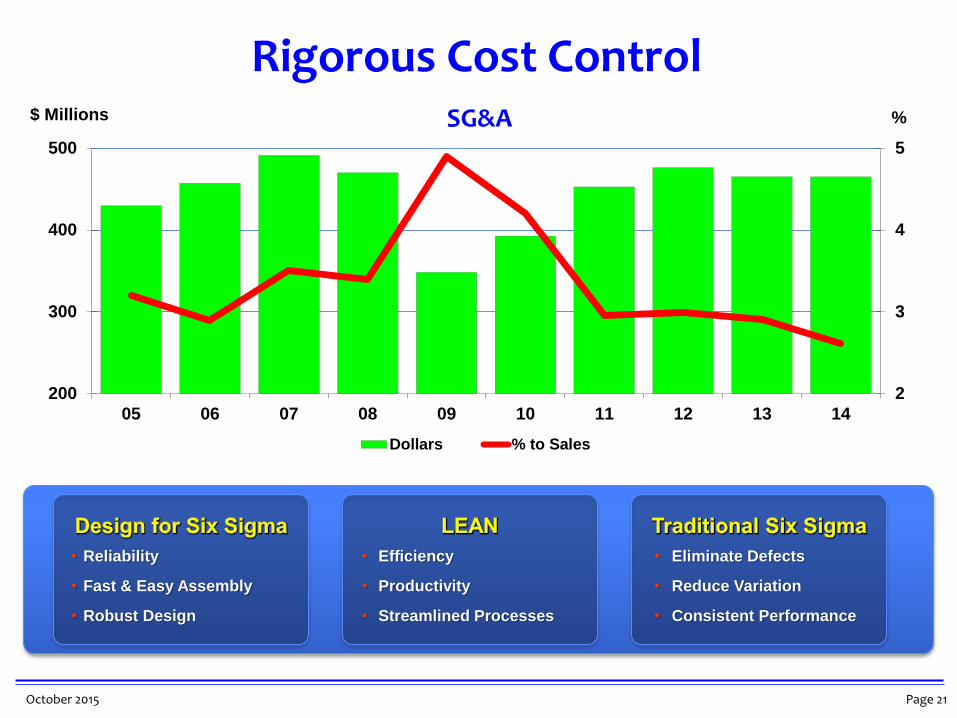
Rigorous Cost Control
2
3
4
5
200
300
400
500
05 06 07 08 09 10 11 12 13 14
% $ Millions
Dollars % to Sales
SG&A
• Efficiency
• Productivity
• Streamlined Processes
• Reliability
• Fast & Easy Assembly
• Robust Design
• Eliminate Defects
• Reduce Variation
• Consistent Performance
Page 22 October 2015
Throughout the world, PACCAR has earned a reputation for unsurpassed quality. Much of
the credit for this global success goes to PACCAR partner suppliers. We salute these
companies who join with us to make product quality the ultimate competitive advantage.
Page 23 October 2015
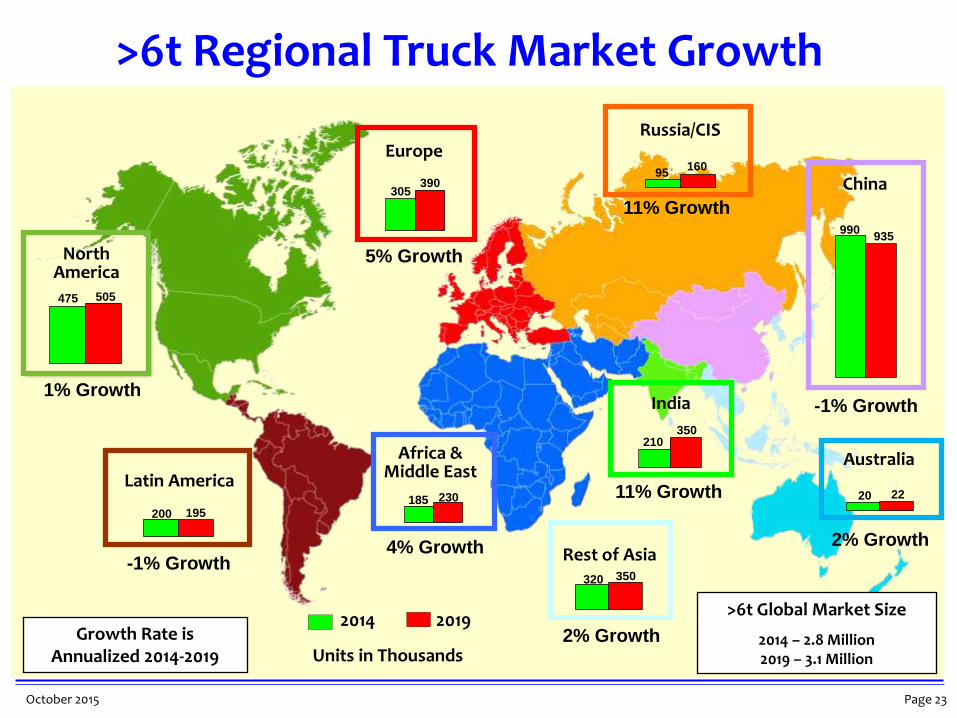
210 350
305
935
475 505
200 195 185 230
95 160
2014 2019
Units in Thousands
>6t Global Market Size
2014 – 2.8 Million 2019 – 3.1 Million
990
390
North America
Latin America
Africa & Middle East
Europe
India 1% Growth
-1% Growth
5% Growth
11% Growth
-1% Growth
11% Growth
4% Growth
320 350
2% Growth
Rest of Asia
Growth Rate is Annualized 2014-2019
Russia/CIS
China
20 22
2% Growth
Australia
>6t Regional Truck Market Growth
Page 24 October 2015
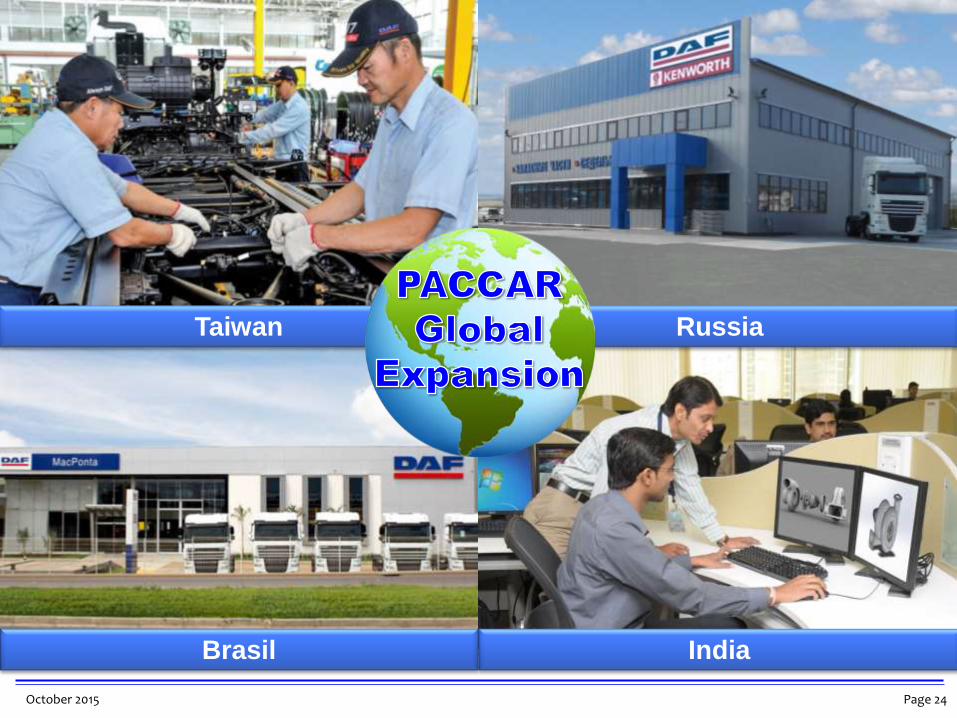
Taiwan Russia
India Brasil
Page 25 October 2015
Page 26 October 2015
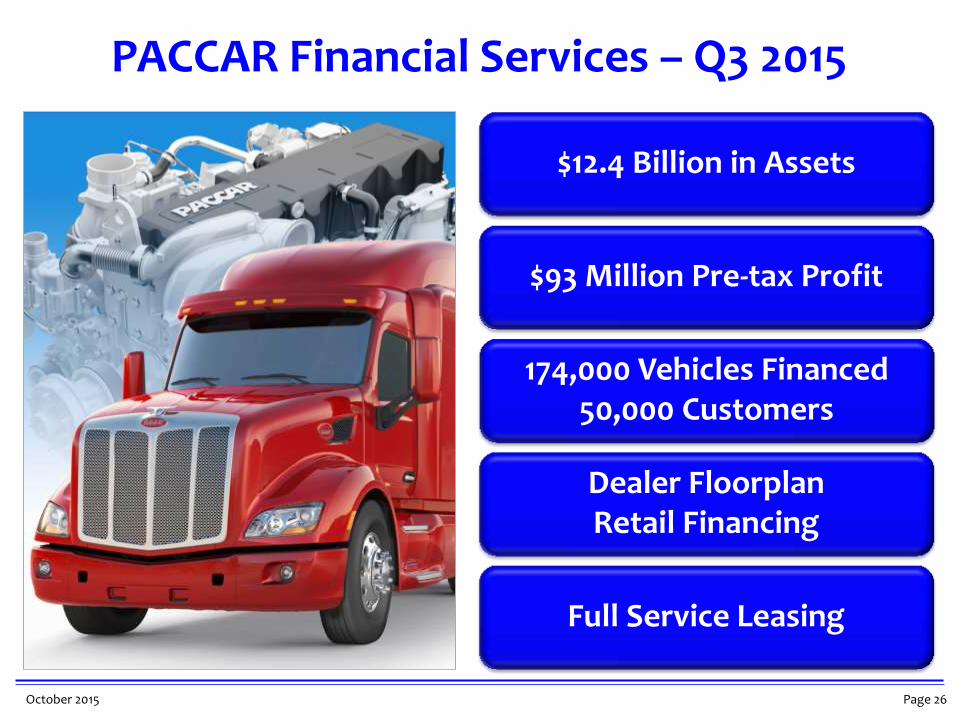
PACCAR Financial Services – Q3 2015
$12.4 Billion in Assets
$93 Million Pre-tax Profit
Full Service Leasing
Dealer Floorplan Retail Financing
174,000 Vehicles Financed 50,000 Customers
Page 27 October 2015
PACCAR Financial Services Competitive Advantages
A+/A1 Credit Ratings
Quality Portfolio
Technology Leadership
Page 28 October 2015
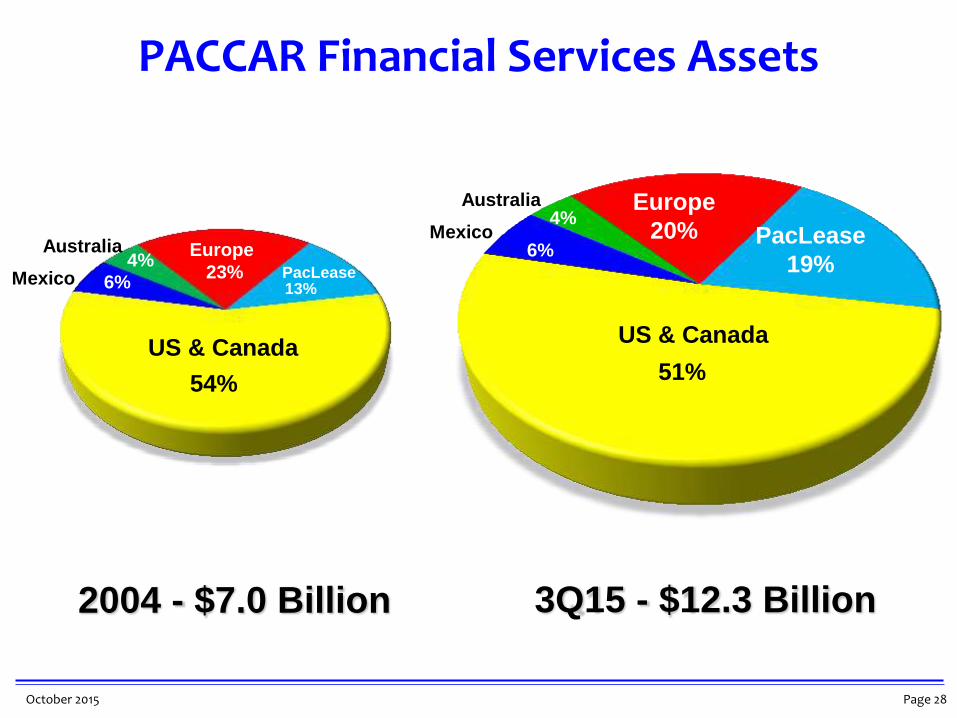
PACCAR Financial Services Assets
2004 - $7.0 Billion 3Q15 - $12.3 Billion
54%
13% PacLease
US & Canada 51%
Europe
20%
US & Canada
Europe
23% 6%
Mexico
Australia
6%
4%
PacLease
19%
Australia 4%
Mexico
Page 29 October 2015
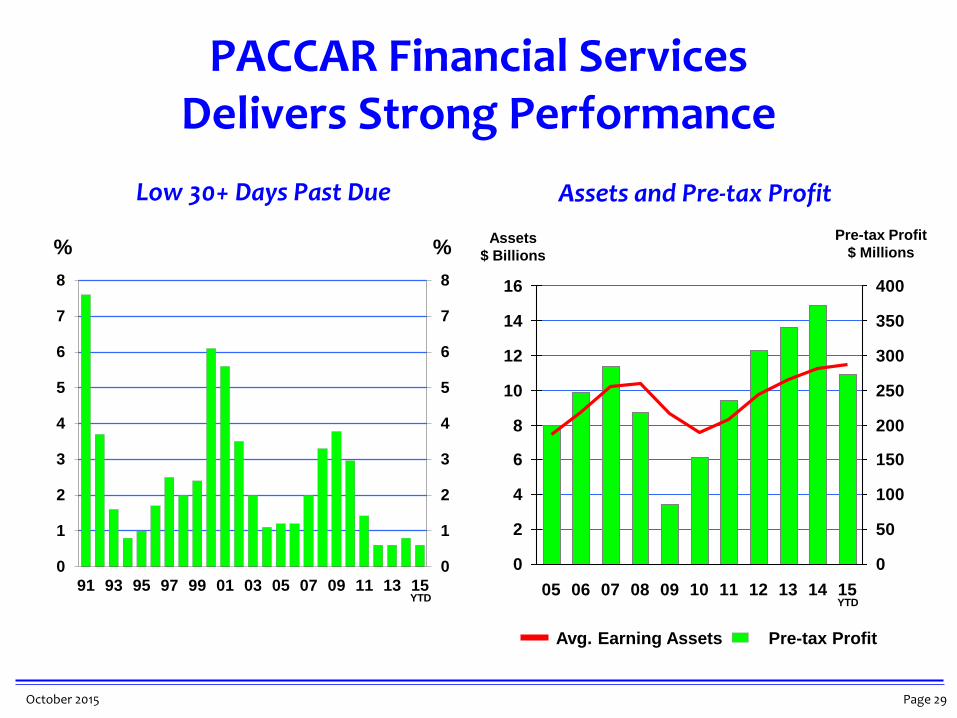
PACCAR Financial Services Delivers Strong Performance
0
1
2
3
4
5
6
7
8
0
1
2
3
4
5
6
7
8
91 93 95 97 99 01 03 05 07 09 11 13 15
% %
Low 30+ Days Past Due
0
2
4
6
8
10
12
14
16
05 06 07 08 09 10 11 12 13 14 15
0
50
100
150
200
250
300
350
400
Assets and Pre-tax Profit
Assets
$ Billions
Pre-tax Profit
$ Millions
Pre-tax Profit Avg. Earning Assets
YTD YTD
Page 30 October 2015
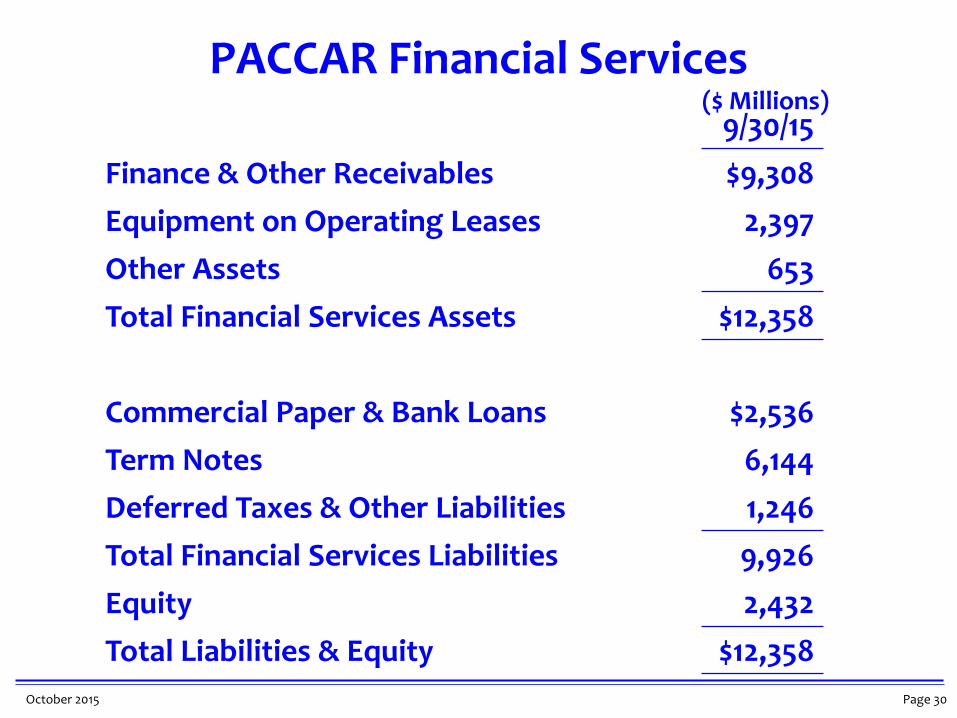
PACCAR Financial Services
9/30/15
Finance & Other Receivables $9,308
Equipment on Operating Leases 2,397
Other Assets 653
Total Financial Services Assets $12,358
Commercial Paper & Bank Loans $2,536
Term Notes 6,144
Deferred Taxes & Other Liabilities 1,246
Total Financial Services Liabilities 9,926
Equity 2,432
Total Liabilities & Equity $12,358
($ Millions)
Page 31 October 2015
Page 32 October 2015
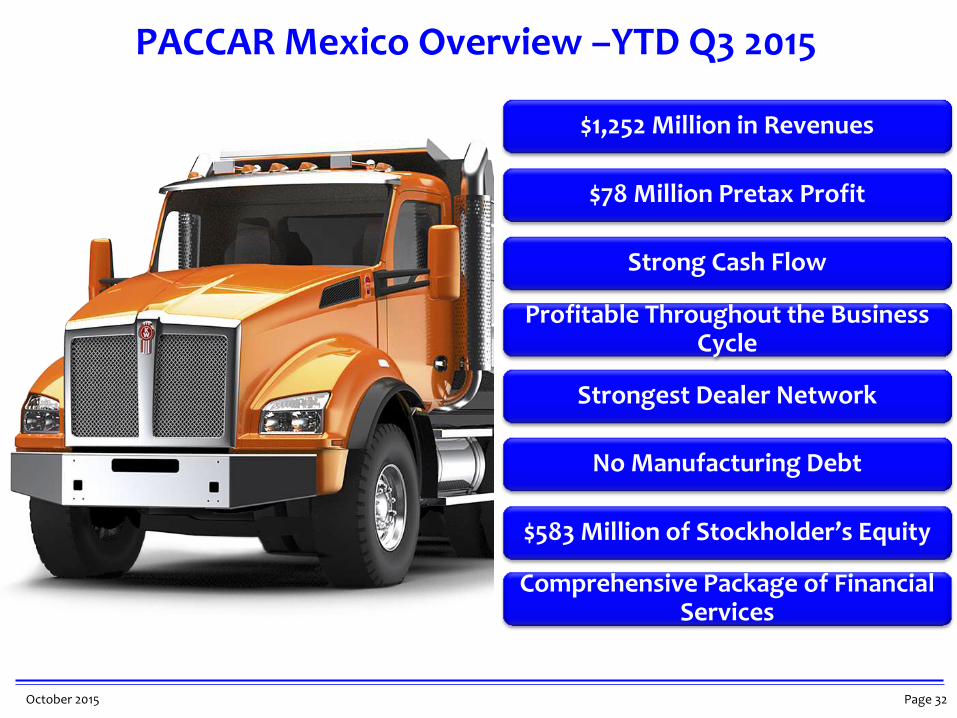
PACCAR Mexico Overview –YTD Q3 2015
$1,252 Million in Revenues
Profitable Throughout the Business Cycle
Strongest Dealer Network
No Manufacturing Debt
Comprehensive Package of Financial Services
Strong Cash Flow
$78 Million Pretax Profit
$583 Million of Stockholder’s Equity
Page 33 October 2015
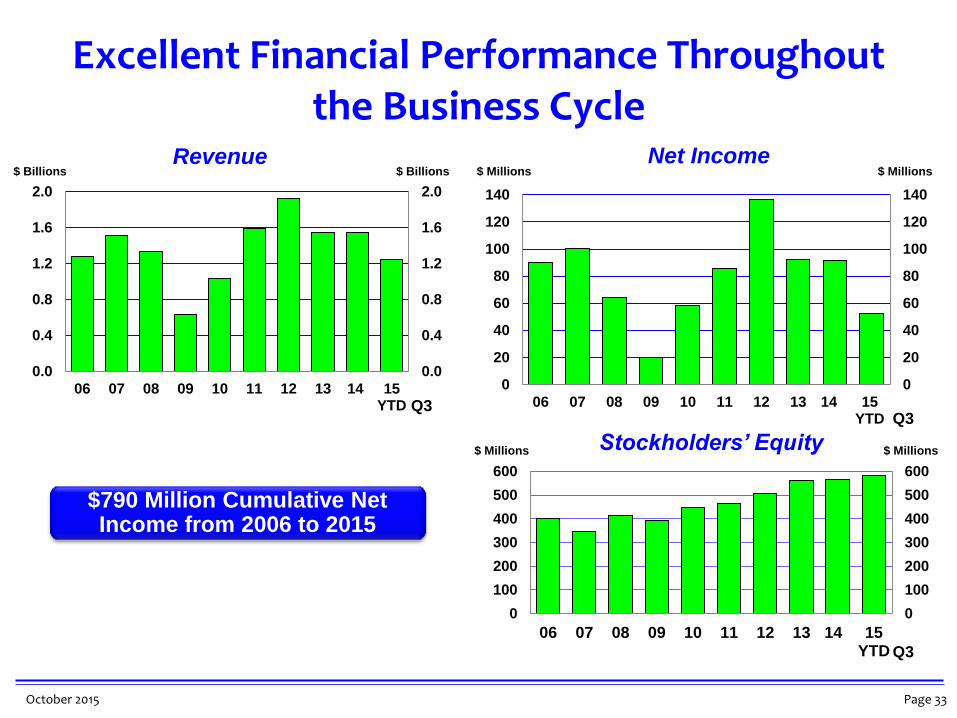
Excellent Financial Performance Throughout the Business Cycle
0
100
200
300
400
500
600
0
100
200
300
400
500
600
06 07 08 09 10 11 12 13 14 15YTD
Stockholders’ Equity $ Millions
$ Millions
0.0
0.4
0.8
1.2
1.6
2.0
0.0
0.4
0.8
1.2
1.6
2.0
06 07 08 09 10 11 12 13 14 15YTD
Revenue $ Billions
$ Billions
0
20
40
60
80
100
120
140
0
20
40
60
80
100
120
140
06 07 08 09 10 11 12 13 14 15YTD
Net Income $ Millions
$ Millions
$790 Million Cumulative Net Income from 2006 to 2015
Q3 Q3
Q3
Page 34 October 2015
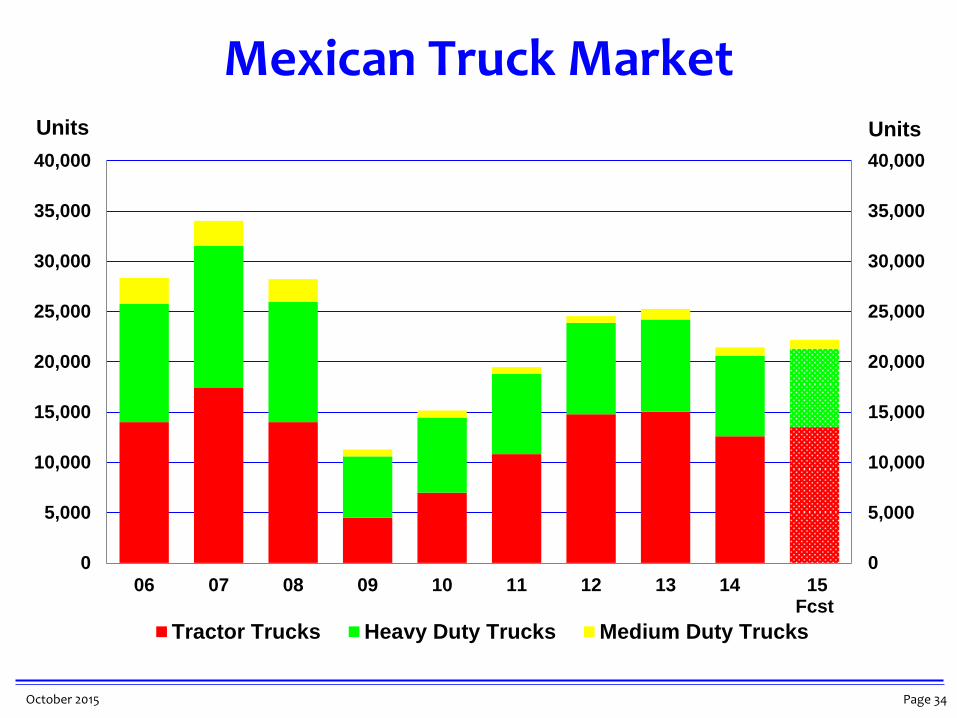
Mexican Truck Market Units Units
0
5,000
10,000
15,000
20,000
25,000
30,000
35,000
40,000
0
5,000
10,000
15,000
20,000
25,000
30,000
35,000
40,000
06 07 08 09 10 11 12 13 14 15Fcst
Tractor Trucks Heavy Duty Trucks Medium Duty Trucks
Page 35 October 2015
Units
Per Day Production
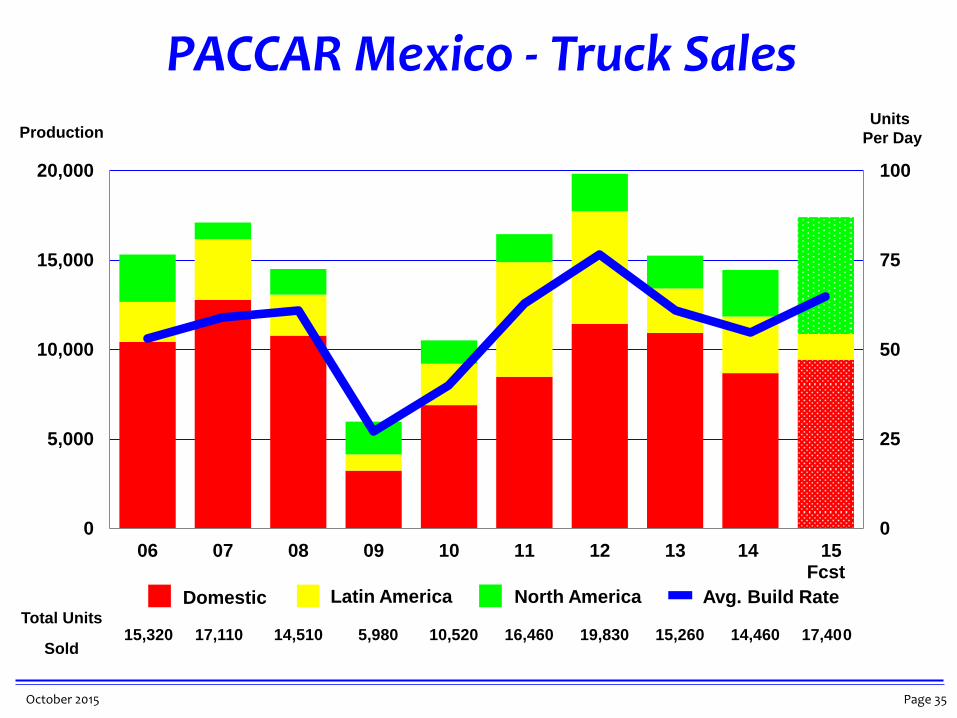
PACCAR Mexico - Truck Sales
Total Units
Sold 15,320 17,110 14,510 5,980 10,520 16,460 19,830 15,260 14,460 17,400
0
25
50
75
100
0
5,000
10,000
15,000
20,000
06 07 08 09 10 11 12 13 14 15Fcst
Domestic Latin America North America Avg. Build Rate
Page 36 October 2015
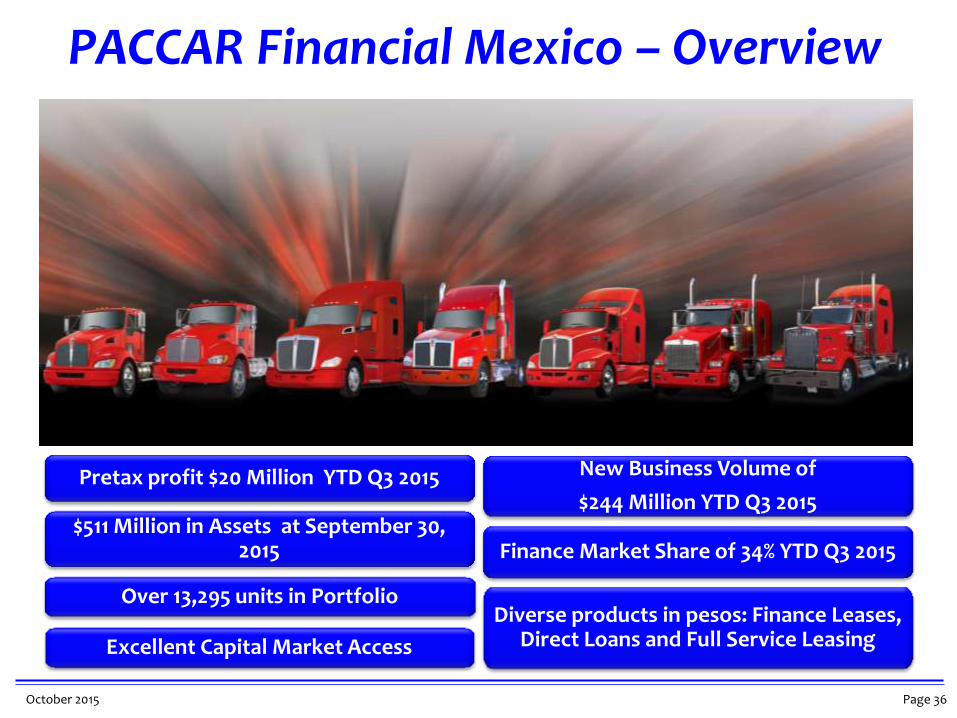
PACCAR Financial Mexico – Overview
$511 Million in Assets at September 30, 2015
Over 13,295 units in Portfolio
Finance Market Share of 34% YTD Q3 2015
New Business Volume of
$244 Million YTD Q3 2015
Excellent Capital Market Access
Diverse products in pesos: Finance Leases, Direct Loans and Full Service Leasing
Pretax profit $20 Million YTD Q3 2015
Page 37 October 2015
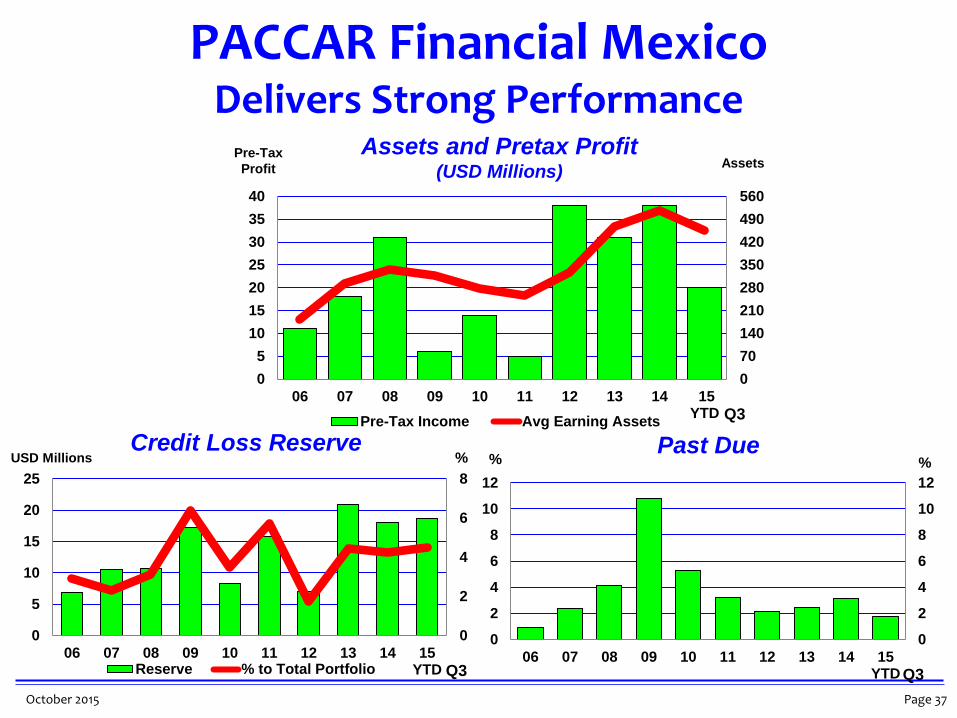
PACCAR Financial Mexico Delivers Strong Performance
Credit Loss Reserve USD Millions
Past Due %
%
Assets and Pretax Profit (USD Millions)
Assets Pre-Tax
Profit
%
0
70
140
210
280
350
420
490
560
0
5
10
15
20
25
30
35
40
06 07 08 09 10 11 12 13 14 15YTD
Pre-Tax Income Avg Earning Assets
0
2
4
6
8
10
12
0
2
4
6
8
10
12
06 07 08 09 10 11 12 13 14 15YTD
0
2
4
6
8
0
5
10
15
20
25
06 07 08 09 10 11 12 13 14 15YTDReserve % to Total Portfolio
Q3
Q3 Q3
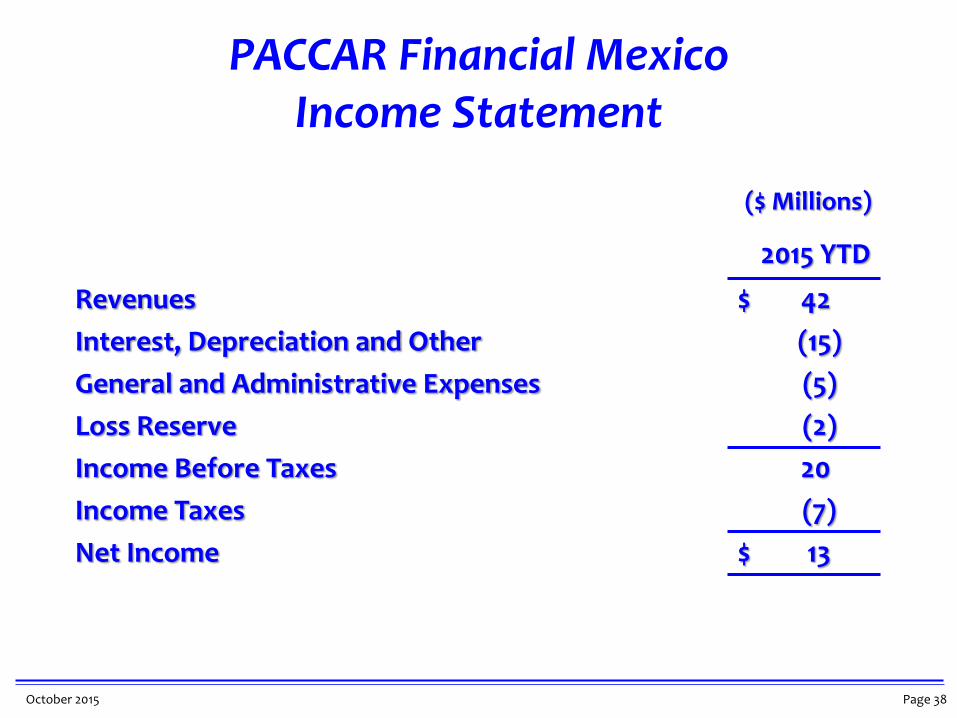
Page 38 October 2015
2015 YTD
Revenues $ 42
Interest, Depreciation and Other (15)
General and Administrative Expenses (5)
Loss Reserve (2)
Income Before Taxes 20
Income Taxes (7)
Net Income $ 13
($ Millions)
PACCAR Financial Mexico Income Statement
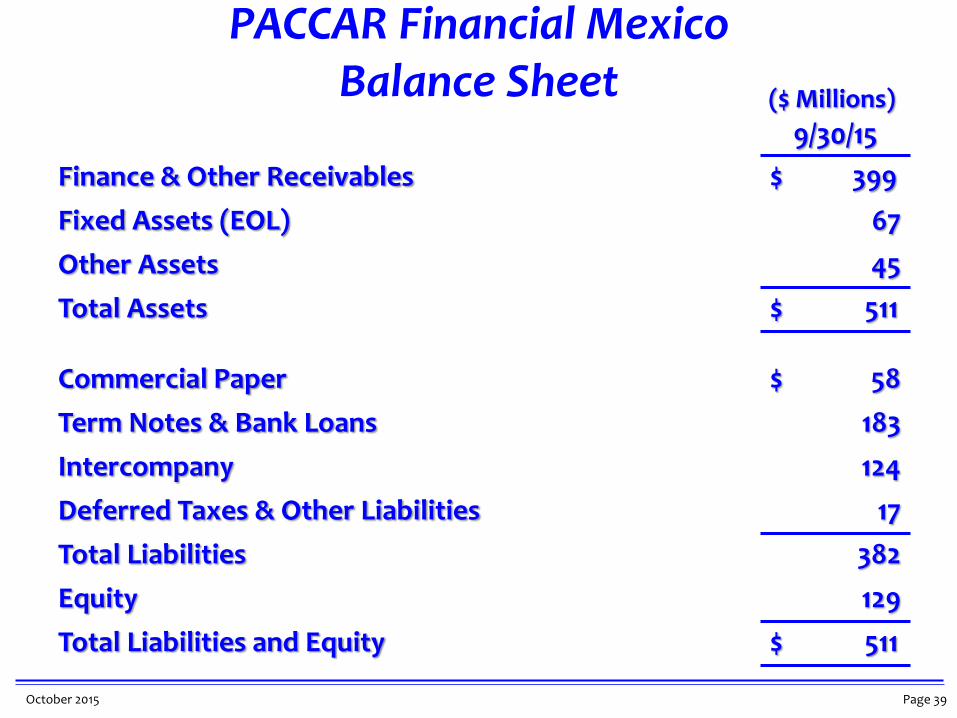
Page 39 October 2015
9/30/15
Finance & Other Receivables $ 399
Fixed Assets (EOL) 67
Other Assets 45
Total Assets $ 511
Commercial Paper $ 58
Term Notes & Bank Loans 183
Intercompany 124
Deferred Taxes & Other Liabilities 17
Total Liabilities 382
Equity 129
Total Liabilities and Equity $ 511
($ Millions)
PACCAR Financial Mexico Balance Sheet
Page 40 October 2015
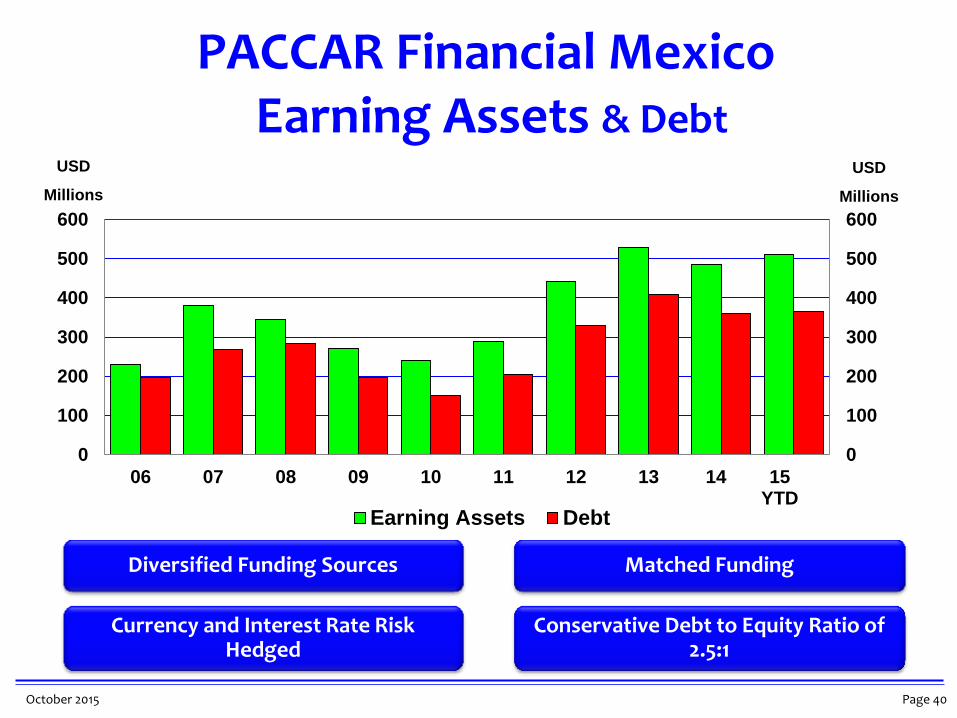
PACCAR Financial Mexico Earning Assets & Debt
USD
Millions
USD
Millions
Diversified Funding Sources
Currency and Interest Rate Risk Hedged
Matched Funding
Conservative Debt to Equity Ratio of 2.5:1
0
100
200
300
400
500
600
06 07 08 09 10 11 12 13 14 15YTD
0
100
200
300
400
500
600
Earning Assets Debt
Page 41 October 2015
MXN
Millions
MXN
Millions
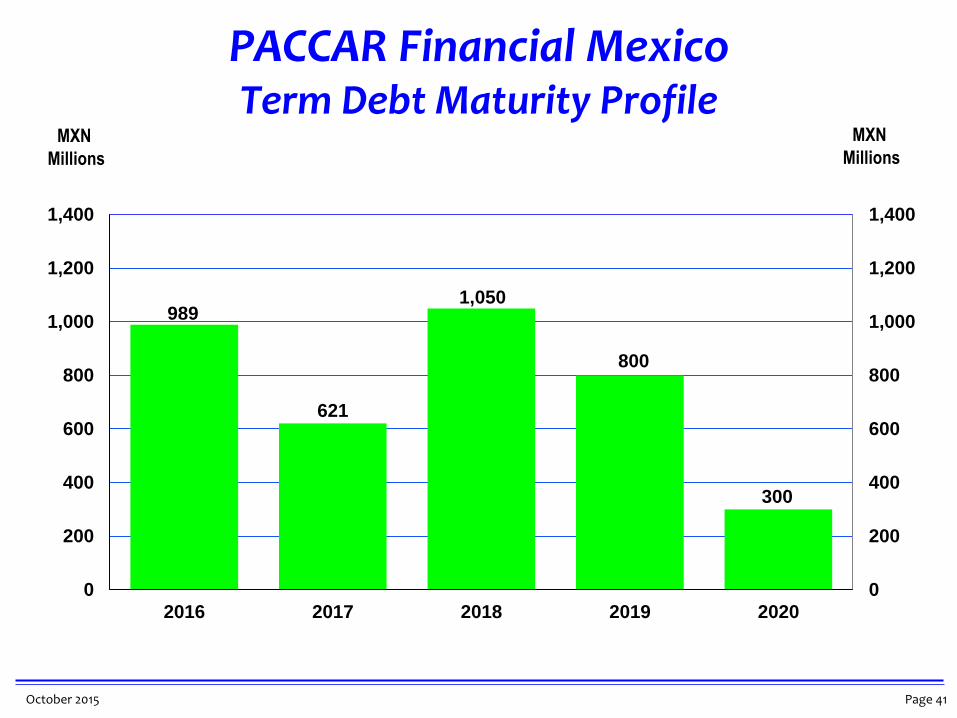
PACCAR Financial Mexico Term Debt Maturity Profile
989
621
1,050
800
300
0
200
400
600
800
1,000
1,200
1,400
0
200
400
600
800
1,000
1,200
1,400
2016 2017 2018 2019 2020
Page 42 October 2015
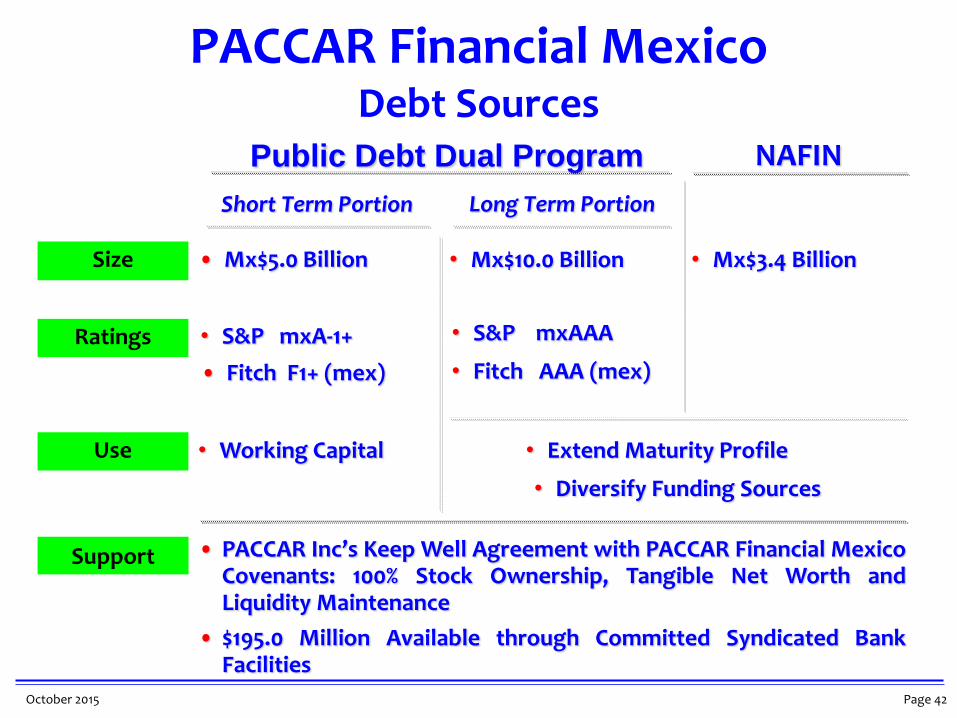
PACCAR Financial Mexico Debt Sources
• PACCAR Inc’s Keep Well Agreement with PACCAR Financial Mexico Covenants: 100% Stock Ownership, Tangible Net Worth and Liquidity Maintenance
• $195.0 Million Available through Committed Syndicated Bank Facilities
• Diversify Funding Sources
• Extend Maturity Profile • Working Capital Use
• S&P mxAAA • S&P mxA-1+
• Fitch AAA (mex) • Fitch F1+ (mex)
Ratings
• Mx$3.4 Billion • Mx$10.0 Billion • Mx$5.0 Billion Size
NAFIN
Short Term Portion
Support
Long Term Portion
Public Debt Dual Program
Page 43 October 2015
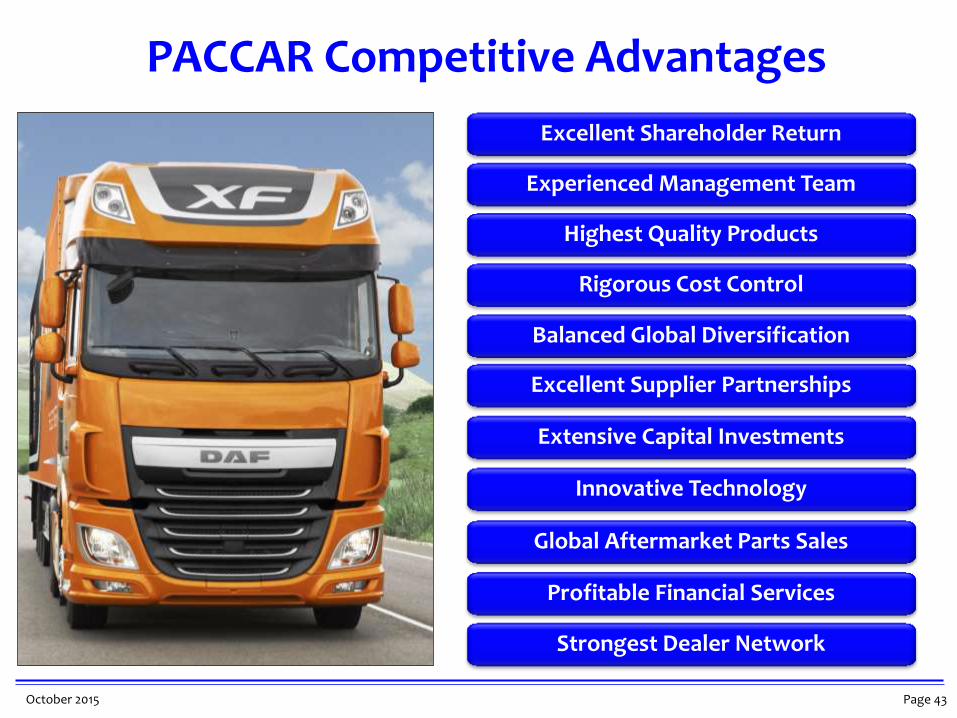
PACCAR Competitive Advantages
Excellent Shareholder Return
Experienced Management Team
Highest Quality Products
Rigorous Cost Control
Balanced Global Diversification
Excellent Supplier Partnerships
Extensive Capital Investments
Innovative Technology
Global Aftermarket Parts Sales
Strongest Dealer Network
Profitable Financial Services

Page 44 October 2015