Embed Size (px)
Citation preview
[ C L I E N T N AM E ]
Presentation3
Investor Meetings
August 2013
[ C L I E N T N AM E ]
Presentation3
Disclaimer (Forward looking statements)
This presentation may contain forward‐looking statements concerning recent acquisitions, its financial and
business impact, management’s beliefs and objectives with respect thereto, and management’s current
expectations for future operating and financial performance, based on assumptions currently believed to be valid.
Forward‐looking statements are all statements other than statements of historical facts. The words “anticipates,”
“may,” “can,” “plans,” “believes,” “estimates,” “expects,” “projects,” “intends,” “likely,” “will,” “should,” “to be,”
and any similar expressions or other words of similar meaning are intended to identify those assertions as forward‐
looking statements. It is uncertain whether the events anticipated will transpire, or if they do occur what impact
they will have on the results of operations and financial condition of Alicorp or of the consolidated company.
Alicorp does not undertake any obligation to update the forward‐looking statements included in this presentation
to reflect subsequent events or circumstances.
1

[ C L I E N T N AM E ]
Business Overview
2
[ C L I E N T N AM E ]
Presentation3
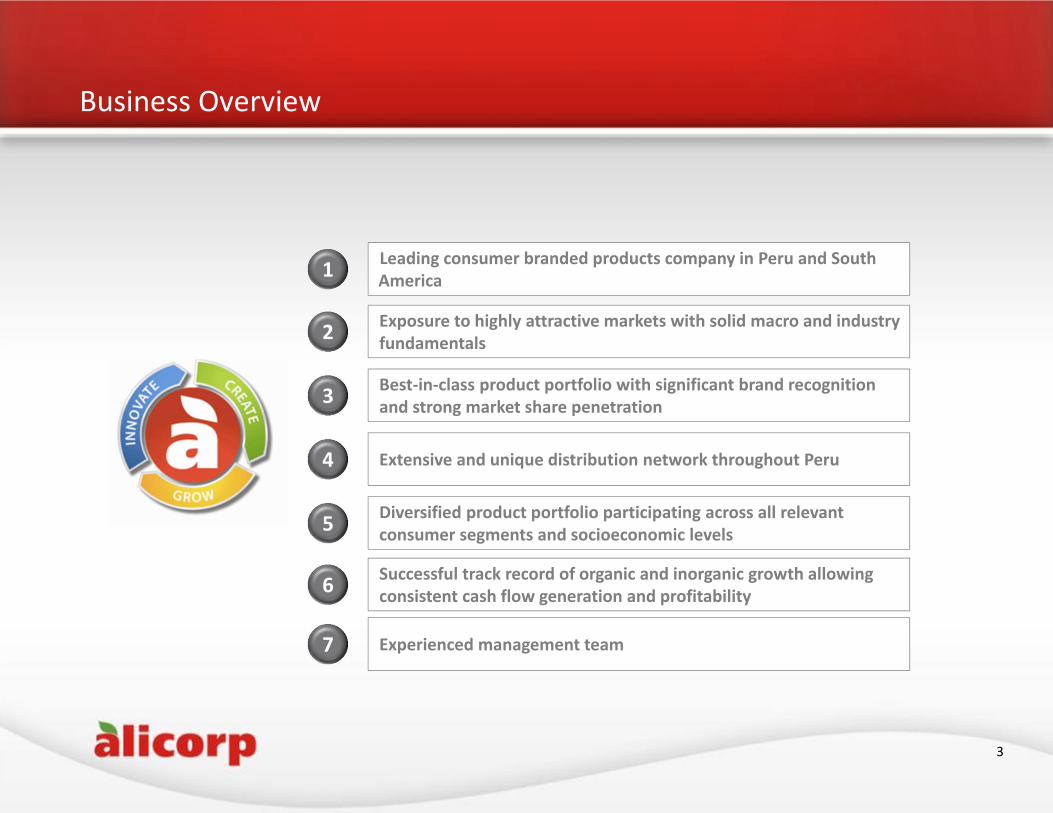
Extensive and unique distribution network throughout Peru
Best‐in‐class product portfolio with significant brand recognition and strong market share penetration
Business Overview
Leading consumer branded products company in Peru and South America
Exposure to highly attractive markets with solid macro and industry fundamentals
Experienced management team
1
2
3
4
7
Diversified product portfolio participating across all relevant consumer segments and socioeconomic levels5
3
Successful track record of organic and inorganic growth allowing consistent cash flow generation and profitability6
[ C L I E N T N AM E ]
Presentation3
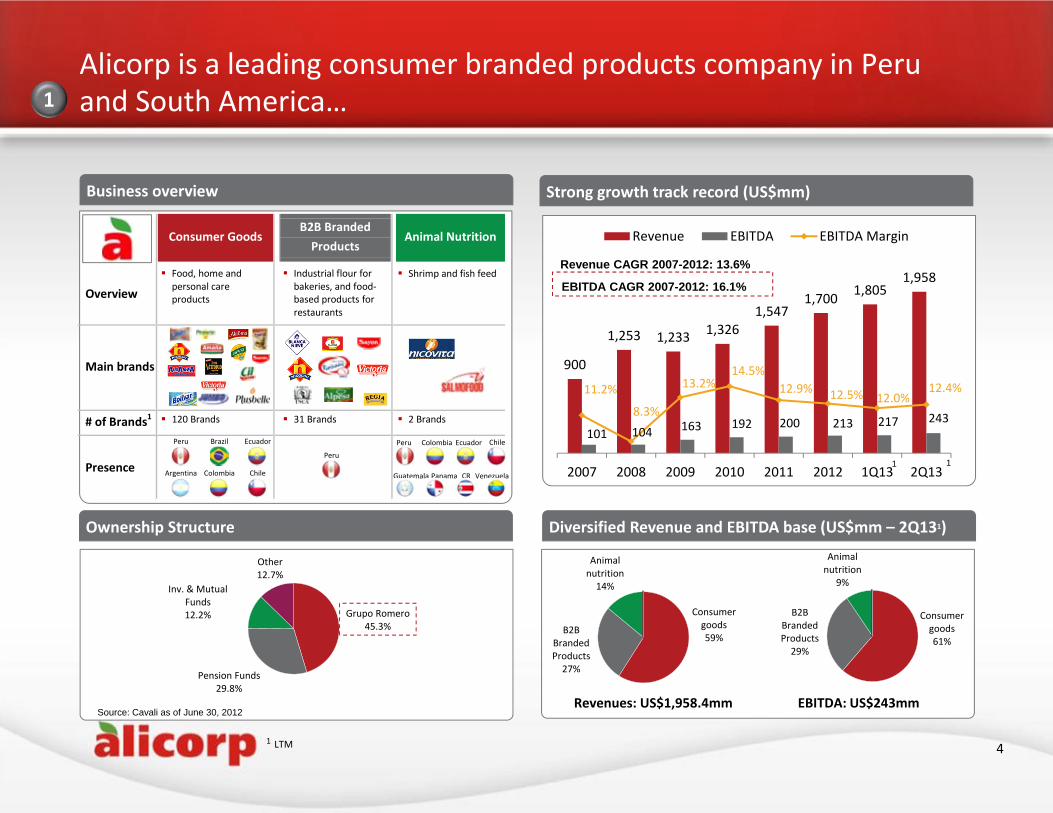
Consumer goods61%
B2B Branded Products29%
Animal nutrition
9%
Consumer goods59%
B2B Branded Products27%
Animal nutrition14%
Ownership Structure
Grupo Romero45.3%
Pension Funds29.8%
Inv. & Mutual Funds12.2%
Other12.7%
Alicorp is a leading consumer branded products company in Peru and South America…
Business overview
Consumer Goods B2B Branded
Products Animal Nutrition
Overview
Food, home and personal care products
Industrial flour for bakeries, and food‐based products for restaurants
Shrimp and fish feed
Main brands
# of Brands1 120 Brands 31 Brands
2 Brands
Presence
EcuadorColombiaPeru
ChileColombiaArgentina
Ecuador
Peru
Peru
Guatemala
Strong growth track record (US$mm)
Diversified Revenue and EBITDA base (US$mm – 2Q131)
Revenues: US$1,958.4mm EBITDA: US$243mm
1
4
Brazil
900
1,253 1,233 1,326 1,547
1,700 1,805 1,958
101 104 163 192 200 213 217 243
11.2%
8.3%
13.2% 14.5%
12.9% 12.5% 12.0% 12.4%
2007 2008 2009 2010 2011 2012 1Q13 2Q13
Revenue EBITDA EBITDA Margin
Source: Cavali as of June 30, 2012
Chile
Panama CR Venezuela
1 LTM
Revenue CAGR 2007-2012: 13.6%
EBITDA CAGR 2007-2012: 16.1%
11
[ C L I E N T N AM E ]
Presentation3
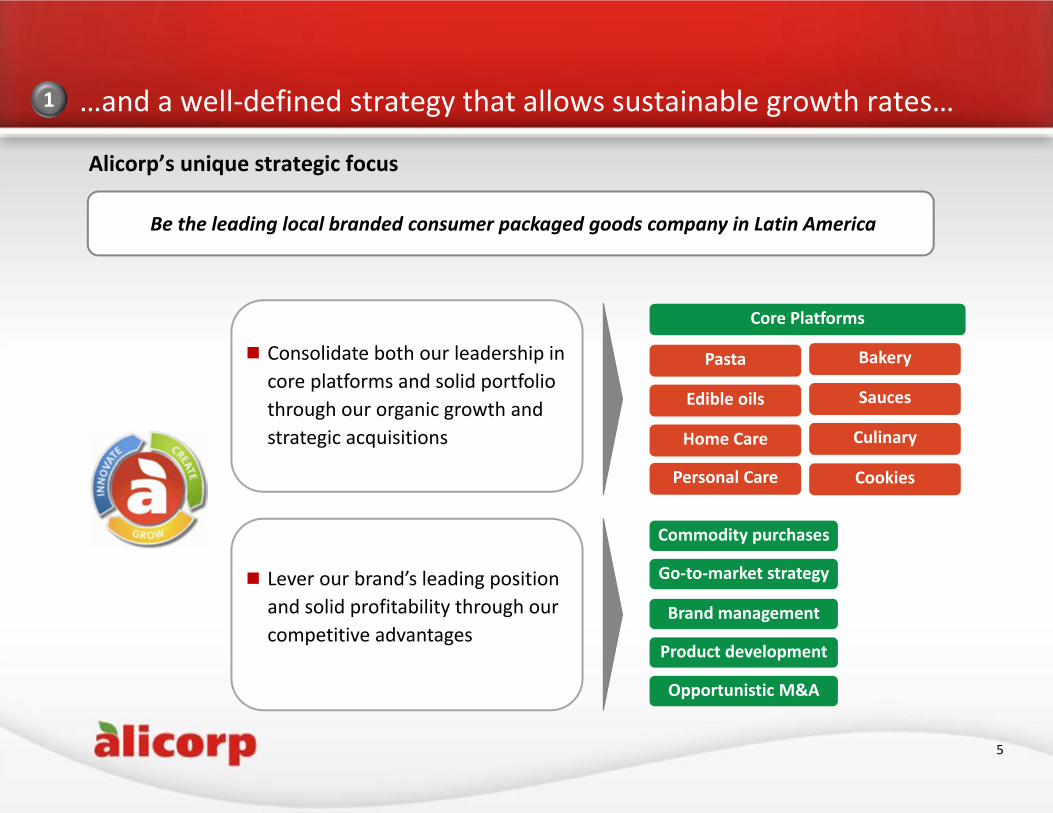
…and a well‐defined strategy that allows sustainable growth rates…1
5
Alicorp’s unique strategic focus
Pasta
Edible oils
Home Care
Bakery
Sauces
Culinary
Personal Care
Core Platforms
Be the leading local branded consumer packaged goods company in Latin America
Consolidate both our leadership in core platforms and solid portfolio through our organic growth and strategic acquisitions
Lever our brand’s leading position and solid profitability through our competitive advantages
Commodity purchases
Go‐to‐market strategy
Brand management
Opportunistic M&A
Product development
Cookies
[ C L I E N T N AM E ]
Presentation3
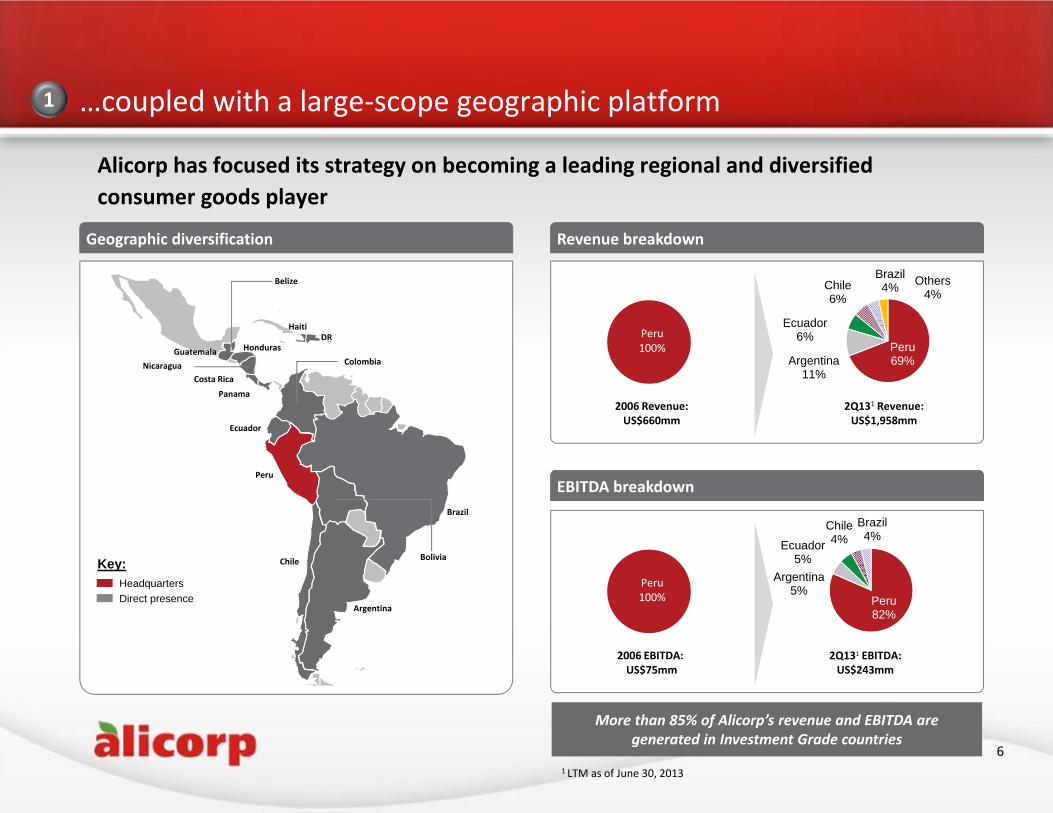
Peru82%
Argentina5%
Ecuador5%
Chile4%
Brazil4%
Peru69%Argentina
11%
Ecuador6%
Chile6%
Brazil4% Others
4%
Peru100%
…coupled with a large‐scope geographic platform
Alicorp has focused its strategy on becoming a leading regional and diversified consumer goods player
Geographic diversification Revenue breakdown
EBITDA breakdown
Bolivia
Argentina
Chile
Haiti
Ecuador
ColombiaGuatemala Honduras
Nicaragua
Peru
DR
Panama
Belize
Costa Rica
Brazil
2006 Revenue:US$660mm
Peru100%
2006 EBITDA: US$75mm
1
More than 85% of Alicorp’s revenue and EBITDA are generated in Investment Grade countries
6
Key:HeadquartersDirect presence
2Q131 Revenue:US$1,958mm
2Q131 EBITDA:US$243mm
1 LTM as of June 30, 2013
[ C L I E N T N AM E ]
Presentation3
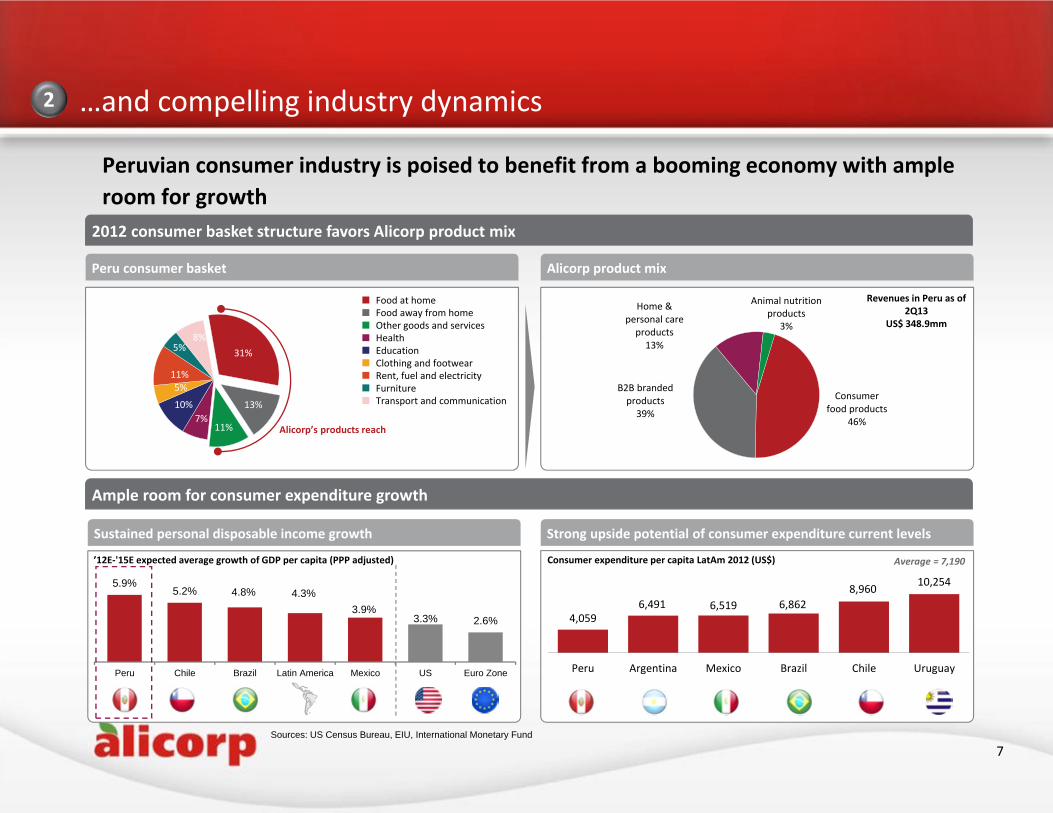
5.9%5.2% 4.8% 4.3%
3.9%3.3% 2.6%
Peru Chile Brazil Latin America Mexico US Euro Zone
Consumer food products
46%
B2B branded products39%
Home & personal care products13%
Animal nutrition products
3%
…and compelling industry dynamics2
Peruvian consumer industry is poised to benefit from a booming economy with ample room for growth
2012 consumer basket structure favors Alicorp product mix
Alicorp product mix
Ample room for consumer expenditure growth
Strong upside potential of consumer expenditure current levels
Consumer expenditure per capita LatAm 2012 (US$)
4,0596,491 6,519 6,862
8,960 10,254
Peru Argentina Mexico Brazil Chile Uruguay
Sustained personal disposable income growth
’12E‐'15E expected average growth of GDP per capita (PPP adjusted)
Sources: US Census Bureau, EIU, International Monetary Fund
7
31%
13%
11%7%
10%
5%11%
5%8%
Peru consumer basket
Food at homeFood away from homeOther goods and servicesHealthEducationClothing and footwearRent, fuel and electricityFurnitureTransport and communication
Alicorp’s products reach
Average = 7,190
Revenues in Peru as of 2Q13
US$ 348.9mm
[ C L I E N T N AM E ]
Presentation3
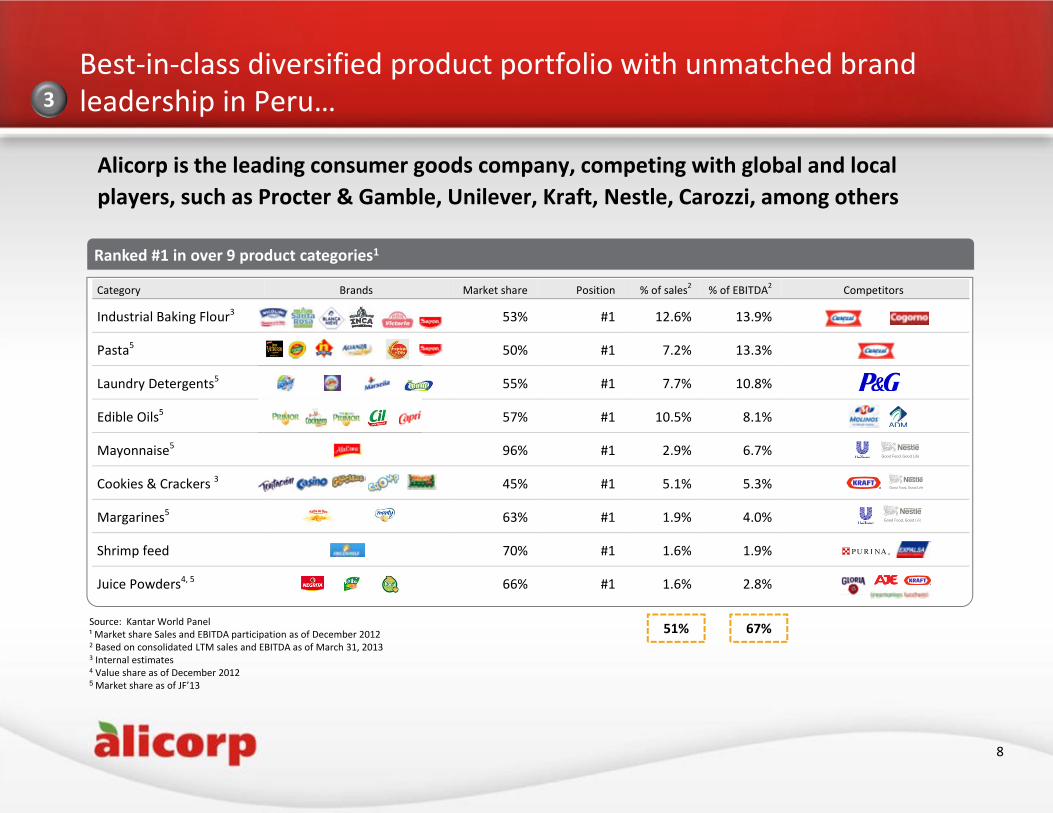
Category Brands Market share Position % of sales2 % of EBITDA2 Competitors
Industrial Baking Flour3 53% #1 12.6% 13.9%
Pasta5 50% #1 7.2% 13.3%
Laundry Detergents5 55% #1 7.7% 10.8%
Edible Oils5 57% #1 10.5% 8.1%
Mayonnaise5 96% #1 2.9% 6.7%
Cookies & Crackers 3 45% #1 5.1% 5.3%
Margarines5 63% #1 1.9% 4.0%
Shrimp feed 70% #1 1.6% 1.9%
Juice Powders4, 5 66% #1 1.6% 2.8%
Alicorp is the leading consumer goods company, competing with global and local players, such as Procter & Gamble, Unilever, Kraft, Nestle, Carozzi, among others
Best‐in‐class diversified product portfolio with unmatched brand leadership in Peru…3
8
Ranked #1 in over 9 product categories1
51% 67%Source: Kantar World Panel¹ Market share Sales and EBITDA participation as of December 20122 Based on consolidated LTM sales and EBITDA as of March 31, 2013 3 Internal estimates4 Value share as of December 20125 Market share as of JF’13
[ C L I E N T N AM E ]
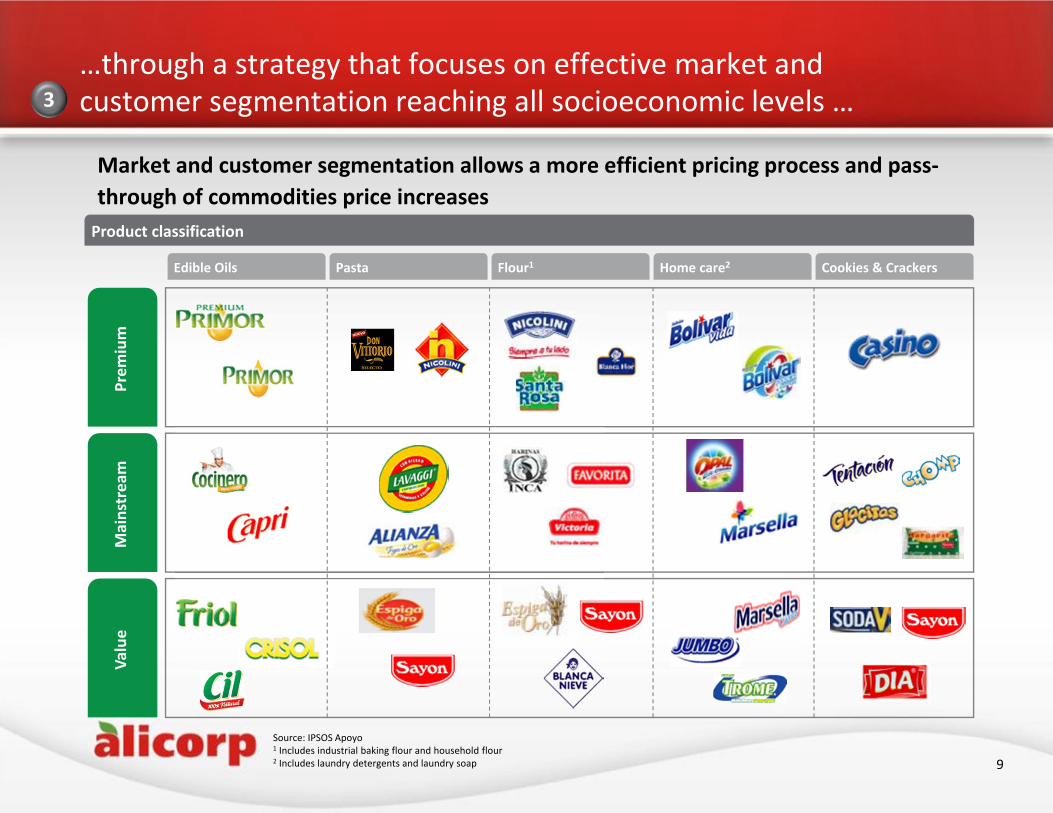
Presentation3…through a strategy that focuses on effective market and customer segmentation reaching all socioeconomic levels …3
Source: IPSOS Apoyo1 Includes industrial baking flour and household flour2 Includes laundry detergents and laundry soap
Prem
ium
Mainstream
Value
9
Market and customer segmentation allows a more efficient pricing process and pass‐through of commodities price increasesProduct classification
Edible Oils Pasta Home care2 Cookies & CrackersFlour1
[ C L I E N T N AM E ]
Presentation3
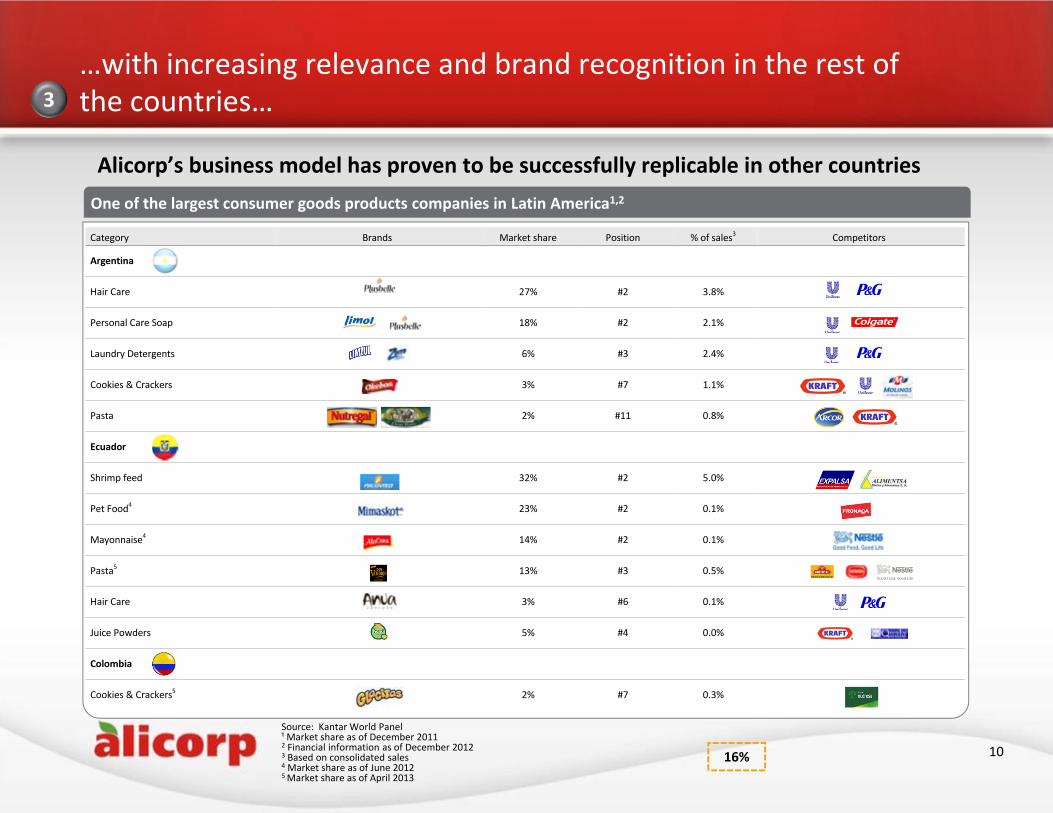
Category Brands Market share Position % of sales3 Competitors
Argentina
Hair Care 27% #2 3.8%
Personal Care Soap 18% #2 2.1%
Laundry Detergents 6% #3 2.4%
Cookies & Crackers 3% #7 1.1%
Pasta 2% #11 0.8%
Ecuador
Shrimp feed 32% #2 5.0%
Pet Food4 23% #2 0.1%
Mayonnaise4 14% #2 0.1%
Pasta5 13% #3 0.5%
Hair Care 3% #6 0.1%
Juice Powders 5% #4 0.0%
Colombia
Cookies & Crackers5 2% #7 0.3%
…with increasing relevance and brand recognition in the rest of the countries…3
10
One of the largest consumer goods products companies in Latin America1,2
16%
Source: Kantar World Panel¹ Market share as of December 20112 Financial information as of December 20123 Based on consolidated sales4 Market share as of June 20125 Market share as of April 2013
Alicorp’s business model has proven to be successfully replicable in other countries
[ C L I E N T N AM E ]
Presentation3
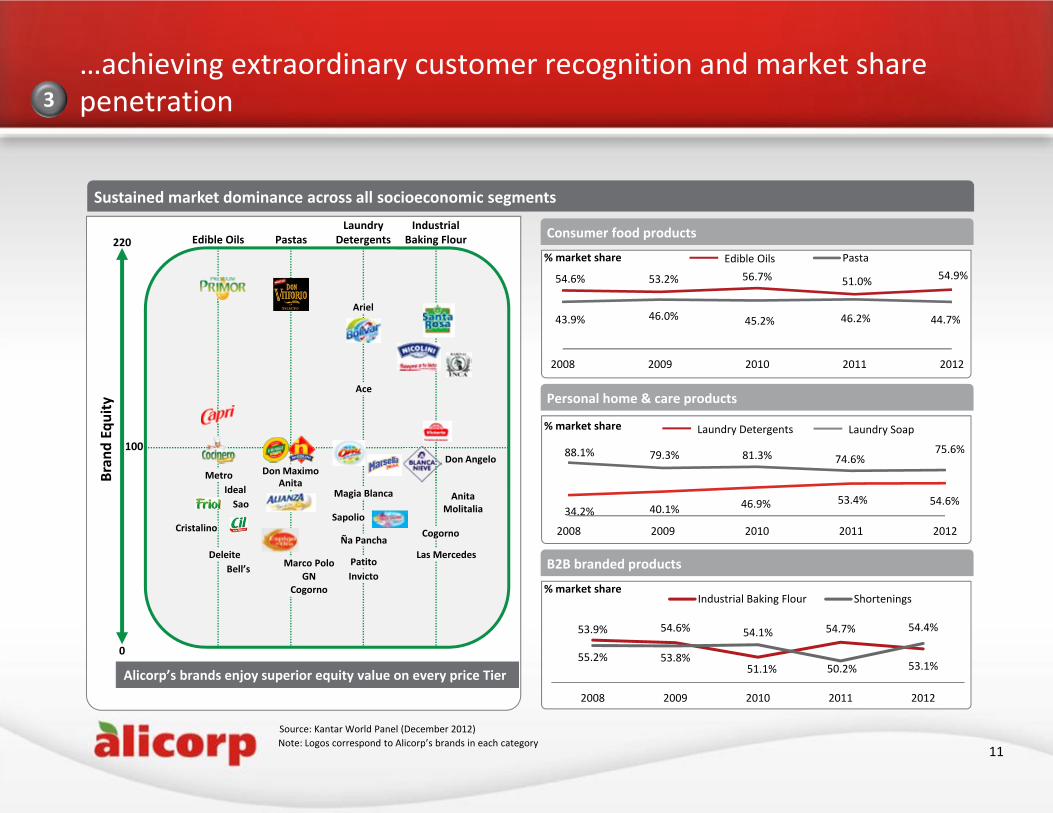
34.2% 40.1% 46.9% 53.4% 54.6%
88.1% 79.3% 81.3% 74.6%75.6%
2008 2009 2010 2011 2012
54.6% 53.2% 56.7% 51.0% 54.9%
43.9% 46.0% 45.2% 46.2% 44.7%
2008 2009 2010 2011 2012
Pasta
Personal home & care products
…achieving extraordinary customer recognition and market share penetration3
Sustained market dominance across all socioeconomic segments
% market share
% market share
% market share
Consumer food products
B2B branded products
11Note: Logos correspond to Alicorp’s brands in each categorySource: Kantar World Panel (December 2012)
Edible Oils
55.2%
54.6%
51.1%
54.7%
53.1%
53.9%
53.8%
54.1%
50.2%
54.4%
2008 2009 2010 2011 2012
Industrial Baking Flour Shortenings
Laundry Detergents Laundry Soap
Alicorp’s brands enjoy superior equity value on every price Tier
Bran
d Equity
Edible Oils PastasLaundry
DetergentsIndustrial
Baking Flour220
0
100
Ideal Metro
Cristalino
Sao
Bell’sDeleite
Don MaximoAnita
Ariel
Ace
Magia Blanca
Sapolio
Ña Pancha
PatitoInvicto
Las Mercedes
Cogorno
Don Angelo
AnitaMolitalia
Marco PoloGN
Cogorno
[ C L I E N T N AM E ]
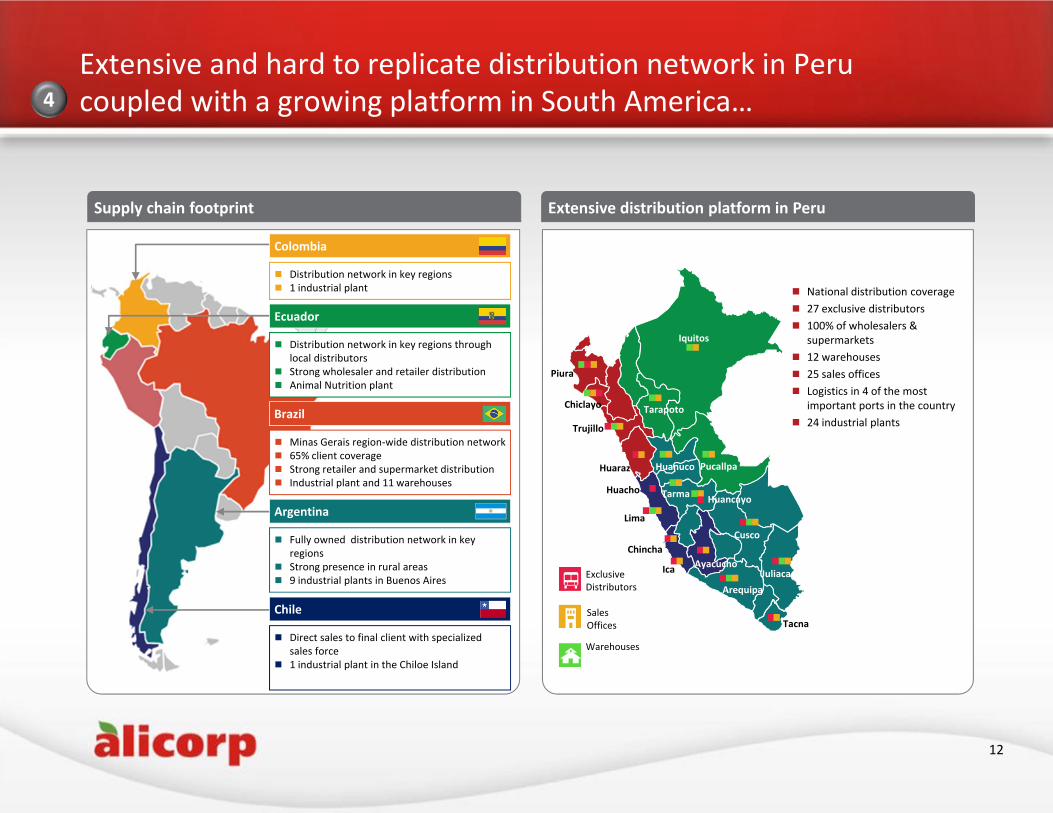
Presentation3Extensive and hard to replicate distribution network in Peru coupled with a growing platform in South America…
Extensive distribution platform in Peru
ExclusiveDistributors
Warehouses
SalesOffices
Iquitos
Piura
Chiclayo Tarapoto
Huanuco
Tarma Huancayo
Lima
Ica Ayacucho
Cusco
ArequipaJuliaca
Tacna
Pucallpa
Trujillo
Huaraz
Chincha
Huacho
4
National distribution coverage 27 exclusive distributors 100% of wholesalers &
supermarkets 12 warehouses 25 sales offices Logistics in 4 of the most
important ports in the country 24 industrial plants
12
Supply chain footprint
Brazil
Minas Gerais region‐wide distribution network 65% client coverage Strong retailer and supermarket distribution Industrial plant and 11 warehouses
Colombia
Distribution network in key regions 1 industrial plant
Ecuador
Distribution network in key regions through local distributors
Strong wholesaler and retailer distribution Animal Nutrition plant
Argentina
Fully owned distribution network in key regions
Strong presence in rural areas 9 industrial plants in Buenos Aires
Chile
Direct sales to final client with specialized sales force
1 industrial plant in the Chiloe Island
[ C L I E N T N AM E ]
Presentation3
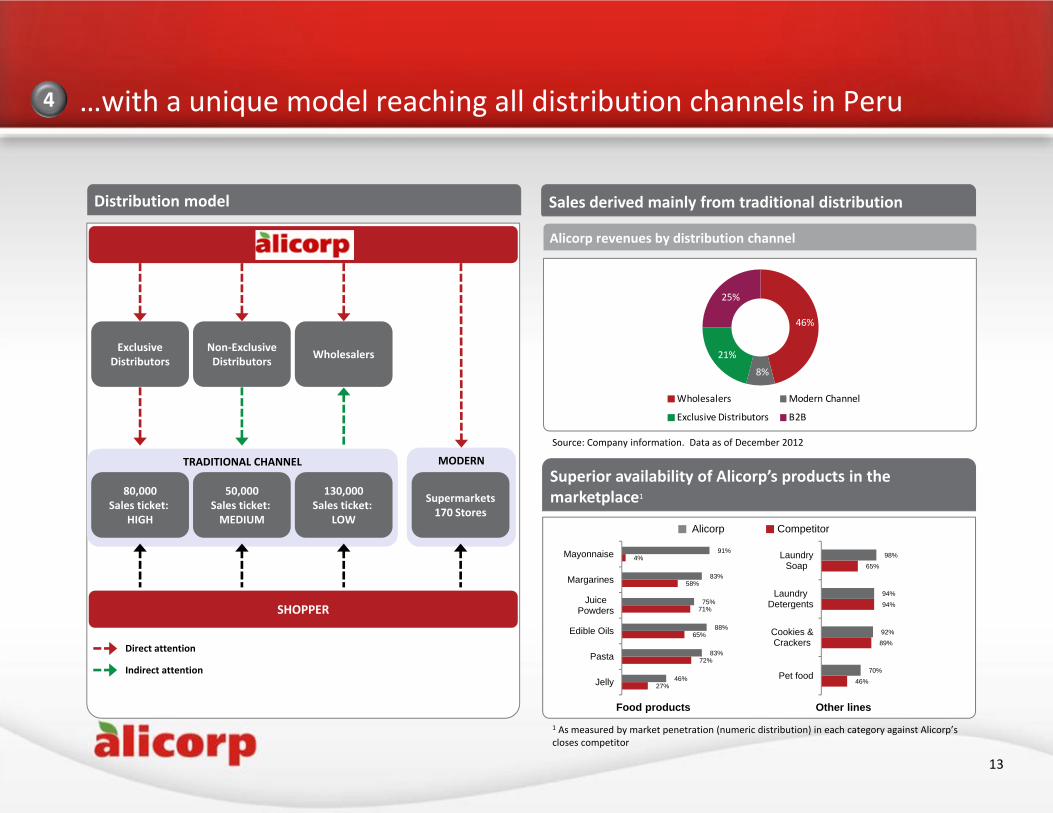
…with a unique model reaching all distribution channels in Peru
Distribution model Barriers of entry
MODERN TRADITIONAL CHANNEL
ALICORP
SHOPPER
80,000Sales ticket:
HIGH
50,000Sales ticket: MEDIUM
130,000Sales ticket:
LOW
Supermarkets170 Stores
Exclusive Distributors
Non‐ExclusiveDistributors Wholesalers
Direct attention
Indirect attention
Alicorp revenues by distribution channel
Sales derived mainly from traditional distribution
Superior availability of Alicorp’s products in the marketplace1
46%
8%
21%
25%
Wholesalers Modern Channel
Exclusive Distributors B2B
4
13
27%
72%
65%
71%
58%
4%
46%
83%
88%
75%
83%
91%
Jelly
Pasta
Edible Oils
JuicePowders
Margarines
Mayonnaise
Food products Other lines
46%
89%
94%
65%
70%
92%
94%
98%
Pet food
Cookies &Crackers
LaundryDetergents
LaundrySoap
Alicorp Competitor
1 As measured by market penetration (numeric distribution) in each category against Alicorp’scloses competitor
Source: Company information. Data as of December 2012
[ C L I E N T N AM E ]
Presentation3
Peru
International
Food Products
Home & Personal
Care ProductsConsumer Goods
B2B branded products
Animal Nutrition
Food Products
Home & Personal
Care Products
Consumer Goods
B2B branded products
Animal Nutrition
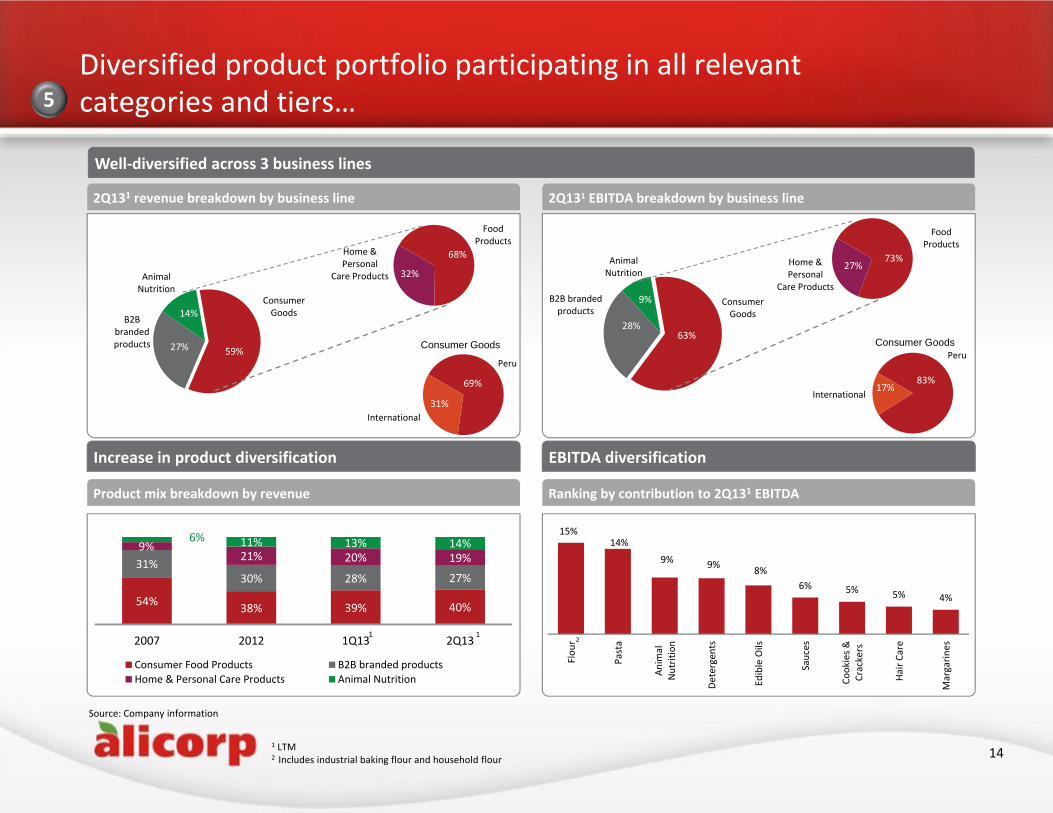
15%14%
9% 9% 8%6% 5% 5% 4%
Flou
r
Pasta
Anim
alNutrition
Detergen
ts
Edible Oils
Sauces
Cookies &
Crackers
Hair C
are
Margarin
es
2Q131 revenue breakdown by business line
Diversified product portfolio participating in all relevant categories and tiers…5
Well‐diversified across 3 business lines
2Q131 EBITDA breakdown by business line
65%
73%27%
63%28%
9%
65%59%
14%
Product mix breakdown by revenue
Increase in product diversification
Ranking by contribution to 2Q131 EBITDA
EBITDA diversification
54% 38% 39% 40%
31%30% 28% 27%
9%21% 20% 19%
6% 11% 13% 14%
2007 2012 1Q13 2Q13
Consumer Food Products B2B branded productsHome & Personal Care Products Animal Nutrition
Source: Company information
27%
32%
68%
14
2
1 LTM 2 Includes industrial baking flour and household flour
1
Peru
International83%
17%
Consumer GoodsConsumer Goods
69%
31%
1
[ C L I E N T N AM E ]
Presentation3
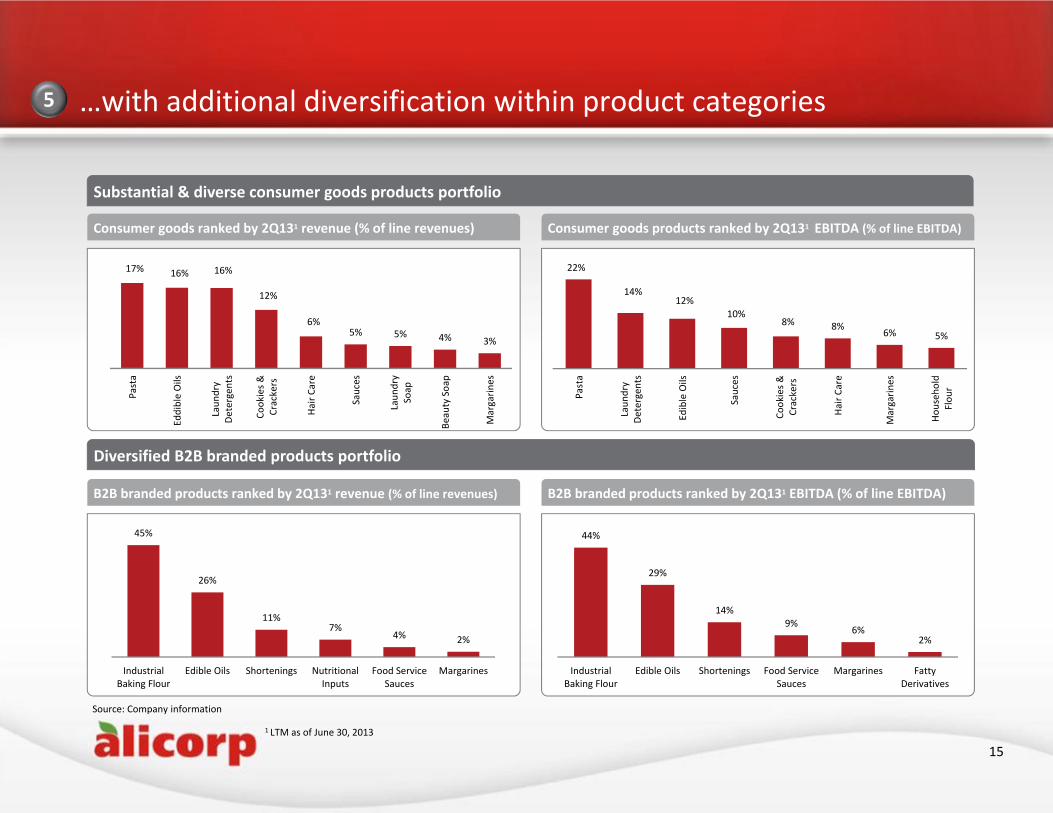
17% 16% 16%
12%
6%5% 5% 4% 3%
Pasta
Eddible Oils
Laun
dry
Detergen
ts
Cookies &
Crackers
Hair C
are
Sauces
Laun
dry
Soap
Beauty Soap
Margarin
es
22%
14%12%
10%8% 8% 6% 5%
Pasta
Laun
dry
Detergen
ts
Edible Oils
Sauces
Cookies &
Crackers
Hair C
are
Margarin
es
Househ
old
Flou
r
45%
26%
11%7%
4% 2%
IndustrialBaking Flour
Edible Oils Shortenings NutritionalInputs
Food ServiceSauces
Margarines
44%
29%
14%9%
6%2%
IndustrialBaking Flour
Edible Oils Shortenings Food ServiceSauces
Margarines FattyDerivatives
Consumer goods ranked by 2Q131 revenue (% of line revenues)
…with additional diversification within product categories5
Substantial & diverse consumer goods products portfolio
Consumer goods products ranked by 2Q131 EBITDA (% of line EBITDA)
B2B branded products ranked by 2Q131 revenue (% of line revenues) B2B branded products ranked by 2Q131 EBITDA (% of line EBITDA)
Diversified B2B branded products portfolio
Source: Company information
15
1 LTM as of June 30, 2013
[ C L I E N T N AM E ]
Presentation3
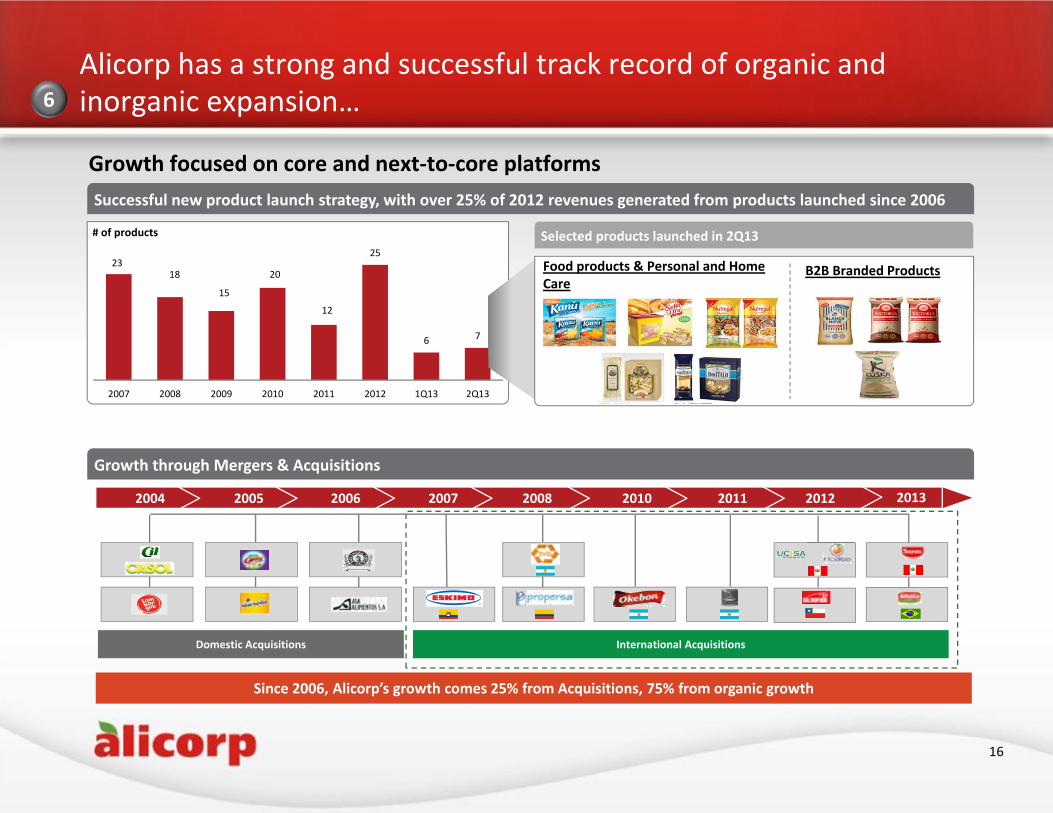
Selected products launched in 2Q13
Alicorp has a strong and successful track record of organic and inorganic expansion…6
Successful new product launch strategy, with over 25% of 2012 revenues generated from products launched since 2006
Growth through Mergers & Acquisitions
2318
15
20
12
25
6 7
2007 2008 2009 2010 2011 2012 1Q13 2Q13
International AcquisitionsDomestic Acquisitions
20122004 2005 2006 2007 2008 2010 2011
Since 2006, Alicorp’s growth comes 25% from Acquisitions, 75% from organic growth
16
Growth focused on core and next‐to‐core platforms
Food products & Personal and Home Care
B2B Branded Products
# of products
2013
[ C L I E N T N AM E ]
Presentation3
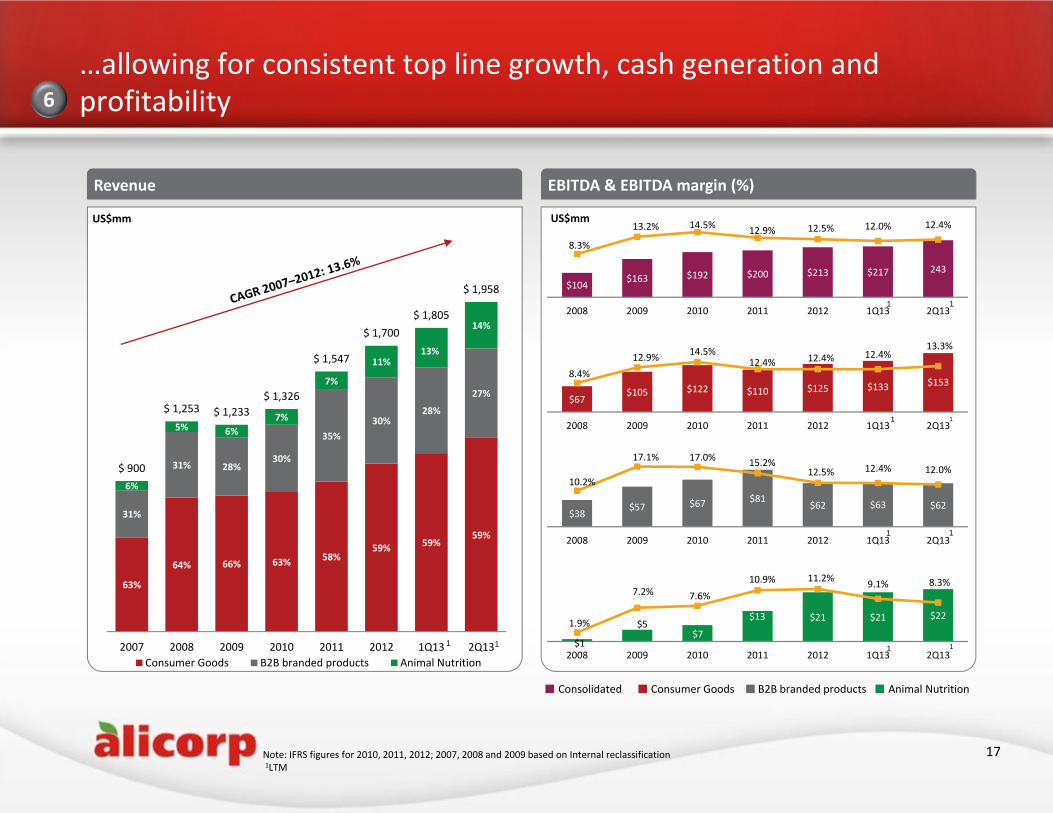
63%
64% 66% 63% 58%59% 59%
59%
31%
31% 28%30%
35%30%
28%
27%
6%
5% 6%7%
7%
11%13%
14%
$ 900
$ 1,253 $ 1,233$ 1,326
$ 1,547
$ 1,700$ 1,805
$ 1,958
2007 2008 2009 2010 2011 2012 1Q13 2Q13Consumer Goods B2B branded products Animal Nutrition
…allowing for consistent top line growth, cash generation and profitability 6
Revenue EBITDA & EBITDA margin (%)
Note: IFRS figures for 2010, 2011, 2012; 2007, 2008 and 2009 based on Internal reclassification1LTM
$104 $163 $192 $200 $213 $217 243
8.3%
13.2% 14.5% 12.9% 12.5% 12.0% 12.4%
2008 2009 2010 2011 2012 1Q13 2Q13
Consumer Goods B2B branded products Animal NutritionConsolidated
US$mmUS$mm
$67 $105 $122 $110 $125 $133 $153
8.4%12.9% 14.5%
12.4% 12.4% 12.4%13.3%
2008 2009 2010 2011 2012 1Q13 2Q13
$38 $57 $67 $81
$62 $63 $62
10.2%
17.1% 17.0% 15.2%12.5% 12.4% 12.0%
2008 2009 2010 2011 2012 1Q13 2Q13
$1
$5 $7
$13 $21 $21 $22 1.9%
7.2% 7.6%
10.9% 11.2% 9.1% 8.3%
2008 2009 2010 2011 2012 1Q13 2Q13
17
1
1
1
11
1
1
1
11
[ C L I E N T N AM E ]
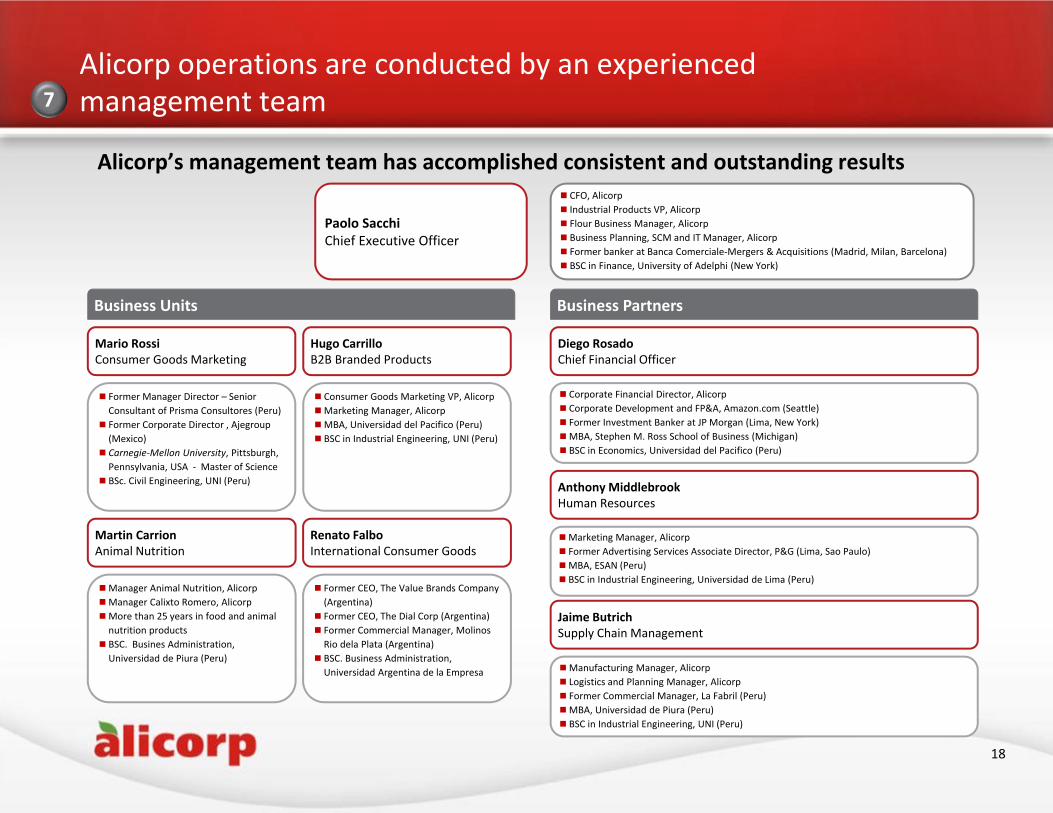
Presentation3Alicorp operations are conducted by an experienced management team
Alicorp’s management team has accomplished consistent and outstanding results
7
18
Paolo SacchiChief Executive Officer
Renato FalboInternational Consumer Goods
Martin CarrionAnimal Nutrition
Hugo CarrilloB2B Branded Products
Mario RossiConsumer Goods Marketing
Business Units Business Partners
Former Manager Director – Senior Consultant of Prisma Consultores (Peru)
Former Corporate Director , Ajegroup(Mexico)
Carnegie‐Mellon University, Pittsburgh, Pennsylvania, USA ‐ Master of Science
BSc. Civil Engineering, UNI (Peru)
Manager Animal Nutrition, AlicorpManager Calixto Romero, AlicorpMore than 25 years in food and animal nutrition products
BSC. Busines Administration, Universidad de Piura (Peru)
Consumer Goods Marketing VP, AlicorpMarketing Manager, AlicorpMBA, Universidad del Pacifico (Peru) BSC in Industrial Engineering, UNI (Peru)
Former CEO, The Value Brands Company (Argentina)
Former CEO, The Dial Corp (Argentina) Former Commercial Manager, Molinos Rio dela Plata (Argentina)
BSC. Business Administration, Universidad Argentina de la Empresa
Diego RosadoChief Financial Officer
Corporate Financial Director, Alicorp Corporate Development and FP&A, Amazon.com (Seattle) Former Investment Banker at JP Morgan (Lima, New York)MBA, Stephen M. Ross School of Business (Michigan) BSC in Economics, Universidad del Pacifico (Peru)
Anthony MiddlebrookHuman Resources
Marketing Manager, Alicorp Former Advertising Services Associate Director, P&G (Lima, Sao Paulo)MBA, ESAN (Peru) BSC in Industrial Engineering, Universidad de Lima (Peru)
Jaime ButrichSupply Chain Management
Manufacturing Manager, Alicorp Logistics and Planning Manager, Alicorp Former Commercial Manager, La Fabril (Peru)MBA, Universidad de Piura (Peru) BSC in Industrial Engineering, UNI (Peru)
CFO, Alicorp Industrial Products VP, Alicorp Flour Business Manager, Alicorp Business Planning, SCM and IT Manager, Alicorp Former banker at Banca Comerciale‐Mergers & Acquisitions (Madrid, Milan, Barcelona) BSC in Finance, University of Adelphi (New York)

[ C L I E N T N AM E ]
Finance Overview
19
[ C L I E N T N AM E ]
Presentation3
Finance Overview
20
Historical Performance8
Acquisition growth has been conservatively financed9
Diversified Capital Structure10
Risk diversification11
[ C L I E N T N AM E ]
Presentation3
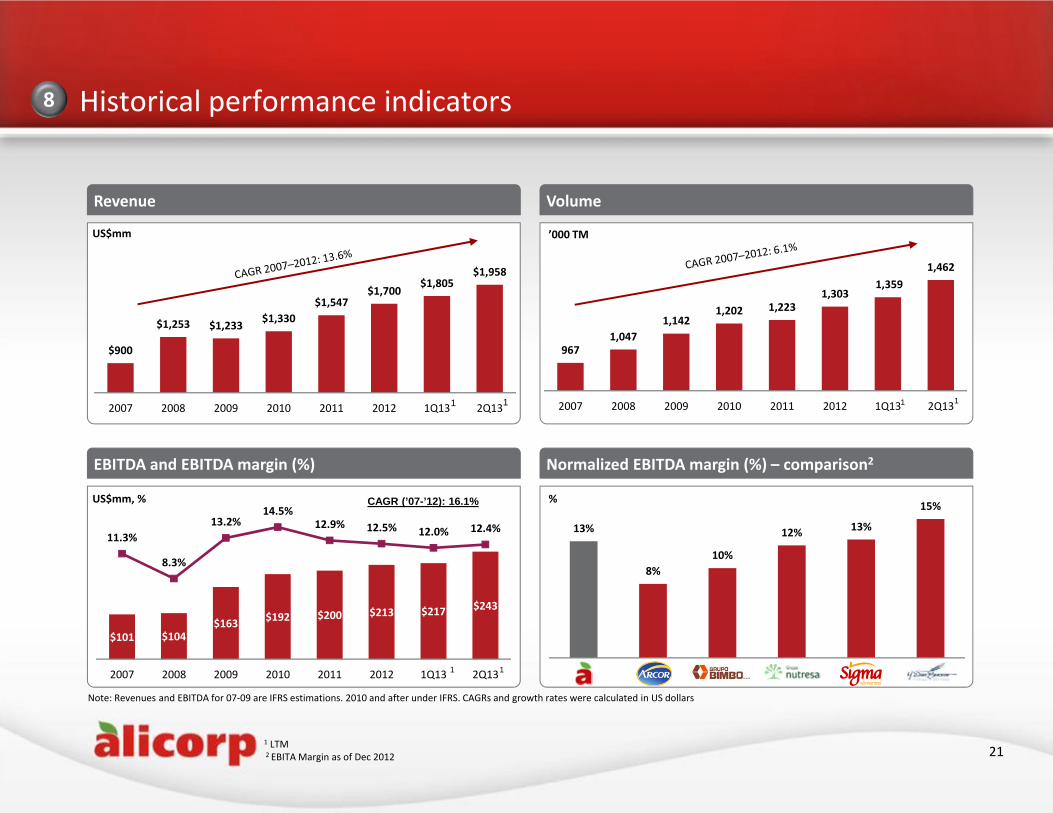
Historical performance indicators
Revenue Volume
EBITDA and EBITDA margin (%) Normalized EBITDA margin (%) – comparison2
13%
8%10%
12% 13%
15%US$mm, %
$900
$1,253 $1,233 $1,330 $1,547
$1,700 $1,805
$1,958
2007 2008 2009 2010 2011 2012 1Q13 2Q13
$101 $104 $163 $192 $200 $213 $217 $243
11.3%
8.3%
13.2%14.5%
12.9% 12.5% 12.0% 12.4%
2007 2008 2009 2010 2011 2012 1Q13 2Q13
967 1,047
1,142 1,202 1,223
1,303 1,359
1,462
2007 2008 2009 2010 2011 2012 1Q13 2Q13
Note: Revenues and EBITDA for 07‐09 are IFRS estimations. 2010 and after under IFRS. CAGRs and growth rates were calculated in US dollars
US$mm ’000 TM
21
CAGR (’07-’12): 16.1% %
1
1
1 LTM 2 EBITA Margin as of Dec 2012
1
8
1 1
1
[ C L I E N T N AM E ]
Presentation3
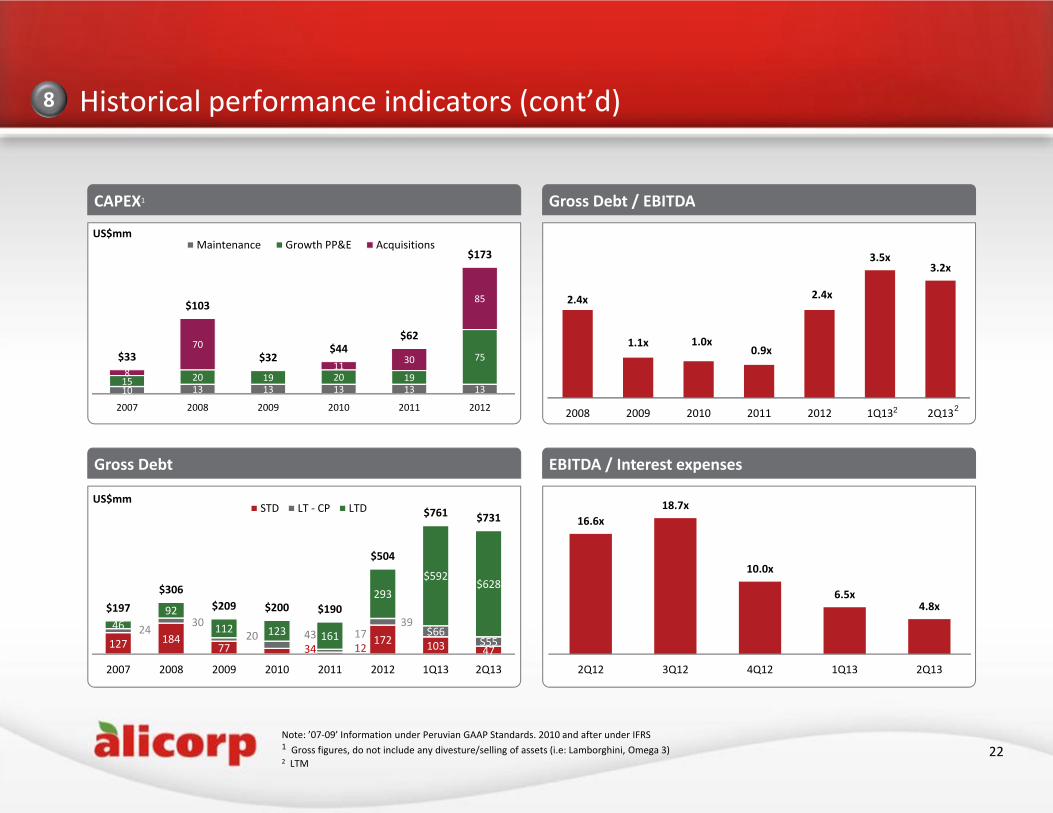
Historical performance indicators (cont’d)
CAPEX1
Gross Debt
10 13 13 13 13 1315 20 19 20 19
758
70
11 30
85
$33
$103
$32$44
$62
$173
2007 2008 2009 2010 2011 2012
Maintenance Growth PP&E Acquisitions
Note: ’07‐09’ Information under Peruvian GAAP Standards. 2010 and after under IFRS1 Gross figures, do not include any divesture/selling of assets (i.e: Lamborghini, Omega 3) 2 LTM
US$mm
127 184 77 34 12
172 103 47
24 3020 43 17
39$66
$55 46
92112 123 161
293$592
$628
$197 $306
$209 $200 $190
$504
$761 $731
2007 2008 2009 2010 2011 2012 1Q13 2Q13
STD LT ‐ CP LTDUS$mm
22
Gross Debt / EBITDA
EBITDA / Interest expenses
16.6x18.7x
10.0x
6.5x4.8x
2Q12 3Q12 4Q12 1Q13 2Q13
8
2.4x
1.1x 1.0x0.9x
2.4x
3.5x3.2x
2008 2009 2010 2011 2012 1Q13 2Q132 2
[ C L I E N T N AM E ]
Presentation3
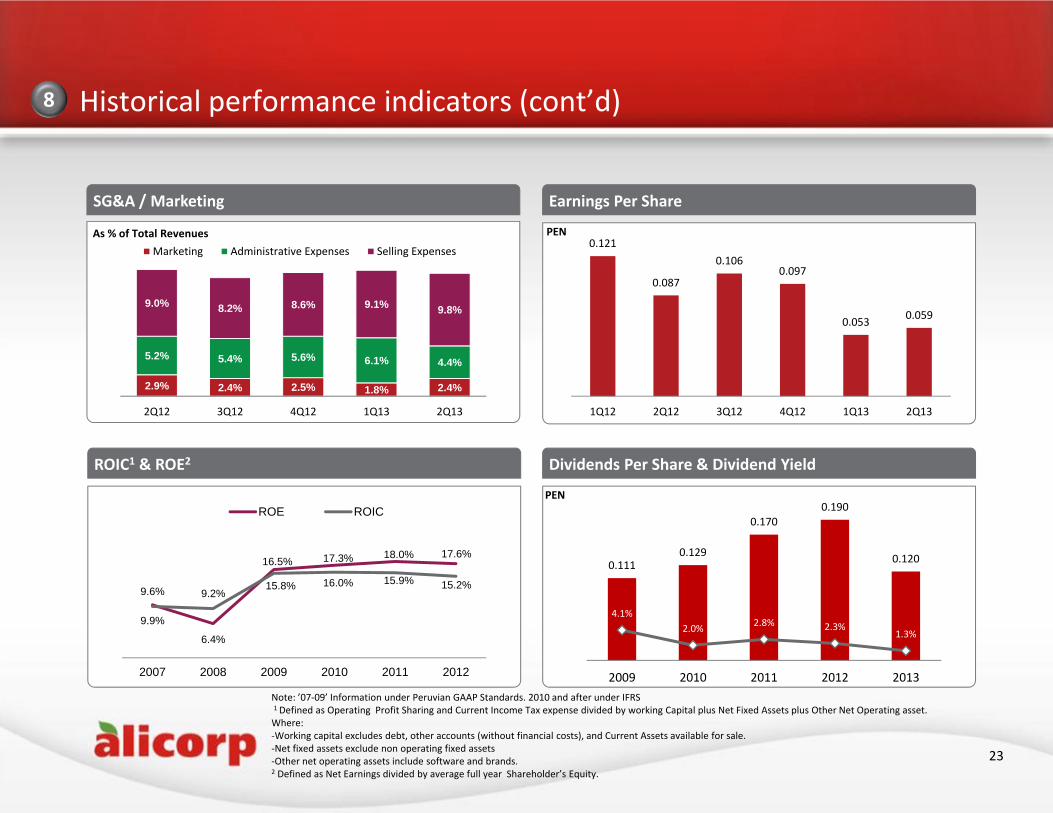
Historical performance indicators (cont’d)
SG&A / Marketing
ROIC1 & ROE2
Note: ’07‐09’ Information under Peruvian GAAP Standards. 2010 and after under IFRS1 Defined as Operating Profit Sharing and Current Income Tax expense divided by working Capital plus Net Fixed Assets plus Other Net Operating asset.Where:‐Working capital excludes debt, other accounts (without financial costs), and Current Assets available for sale.‐Net fixed assets exclude non operating fixed assets‐Other net operating assets include software and brands.2 Defined as Net Earnings divided by average full year Shareholder’s Equity.
As % of Total Revenues
23
Earnings Per Share
Dividends Per Share & Dividend Yield
PEN
PEN
9.9%
6.4%
16.5% 17.3% 18.0% 17.6%
9.6% 9.2%15.8% 16.0% 15.9% 15.2%
2007 2008 2009 2010 2011 2012
ROE ROIC
8
2.9% 2.4% 2.5% 1.8% 2.4%
5.2% 5.4% 5.6% 6.1% 4.4%
9.0% 8.2% 8.6% 9.1% 9.8%
2Q12 3Q12 4Q12 1Q13 2Q13
Marketing Administrative Expenses Selling Expenses0.121
0.087
0.1060.097
0.053 0.059
1Q12 2Q12 3Q12 4Q12 1Q13 2Q13
0.1110.129
0.1700.190
0.120
4.1%2.0% 2.8% 2.3%
1.3%
2009 2010 2011 2012 2013
[ C L I E N T N AM E ]
Presentation3
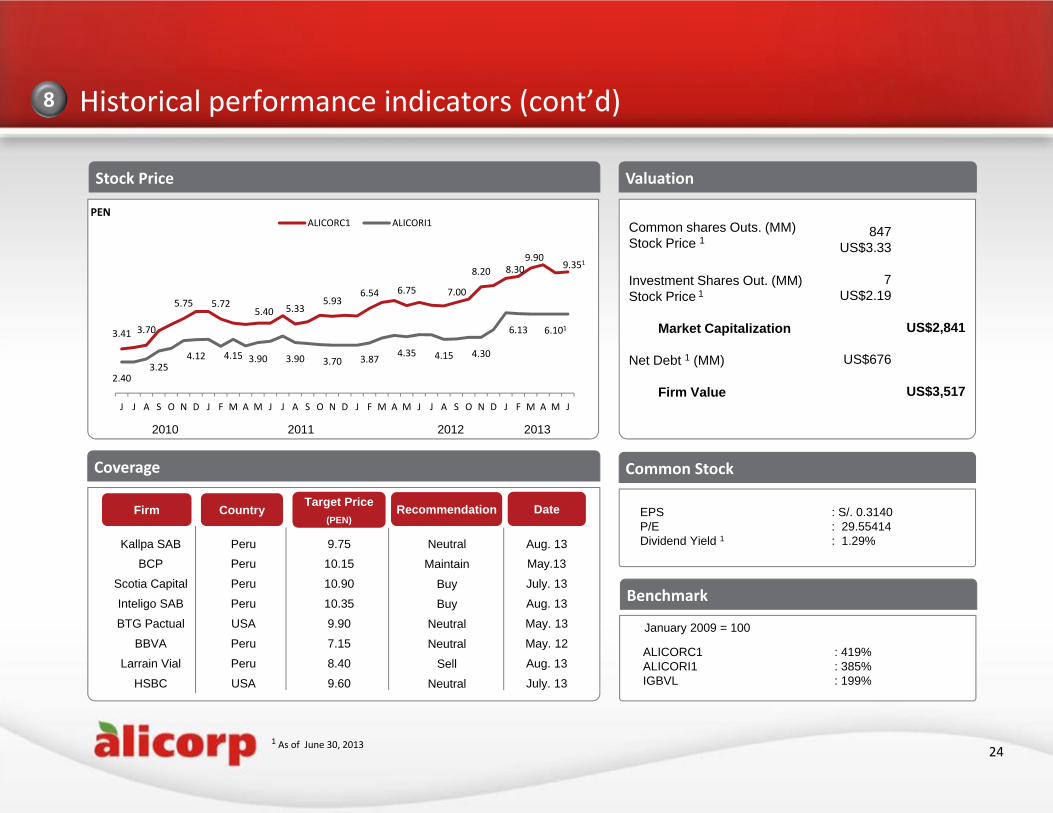
Kallpa SAB Peru 9.75 Neutral Aug. 13BCP Peru 10.15 Maintain May.13
Scotia Capital Peru 10.90 Buy July. 13
Inteligo SAB Peru 10.35 Buy Aug. 13
BTG Pactual USA 9.90 Neutral May. 13
BBVA Peru 7.15 Neutral May. 12
Larrain Vial Peru 8.40 Sell Aug. 13
HSBC USA 9.60 Neutral July. 13
Historical performance indicators (cont’d)
Stock Price
Coverage
1 As of June 30, 2013 24
Common Stock
PEN
Valuation
2010 2011 2012 2013
Common shares Outs. (MM)Stock Price 1
Investment Shares Out. (MM) Stock Price 1
Market Capitalization
Net Debt 1 (MM)
Firm Value
847US$3.33
7US$2.19
US$676
US$2,841
US$3,517
Firm Country Target Price(PEN)
Recommendation Date EPS : S/. 0.3140P/E : 29.55414Dividend Yield 1 : 1.29%
Benchmark
ALICORC1 : 419%ALICORI1 : 385%IGBVL : 199%
January 2009 = 100
8
3.41 3.70
5.75 5.725.40 5.33
5.936.54 6.75 7.00
8.20 8.309.90
9.351
2.403.25
4.12 4.15 3.90 3.90 3.70 3.87 4.35 4.15 4.30
6.13 6.101
J J A S O N D J F M A M J J A S O N D J F M A M J J A S O N D J F M A M J
ALICORC1 ALICORI1
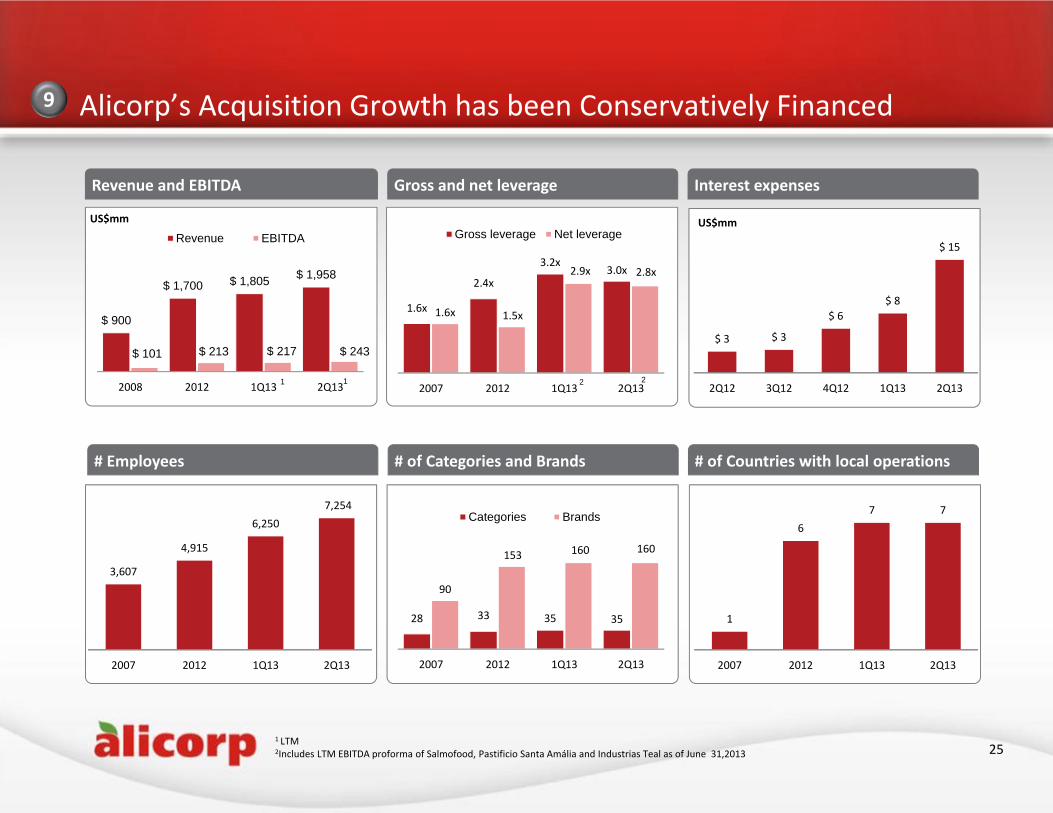
[ C L I E N T N AM E ]
Presentation3
28 33 35 35
90
153 160 160
2007 2012 1Q13 2Q13
Categories Brands
Alicorp’s Acquisition Growth has been Conservatively Financed 9
Revenue and EBITDA
$ 3 $ 3
$ 6$ 8
$ 15
2Q12 3Q12 4Q12 1Q13 2Q13
Gross and net leverage Interest expenses
# Employees
1
67 7
2007 2012 1Q13 2Q13
# of Categories and Brands # of Countries with local operations
25
$ 900
$ 1,700 $ 1,805 $ 1,958
$ 101 $ 213 $ 217 $ 243
2008 2012 1Q13 2Q13
Revenue EBITDA
1 LTM2Includes LTM EBITDA proforma of Salmofood, Pastificio Santa Amália and Industrias Teal as of June 31,2013
1.6x
2.4x
3.2x3.0x
1.6x 1.5x
2.9x 2.8x
2007 2012 1Q13 2Q13
Gross leverage Net leverage
3,607
4,915
6,2507,254
2007 2012 1Q13 2Q13
US$mm US$mm
21 21
[ C L I E N T N AM E ]
Presentation3
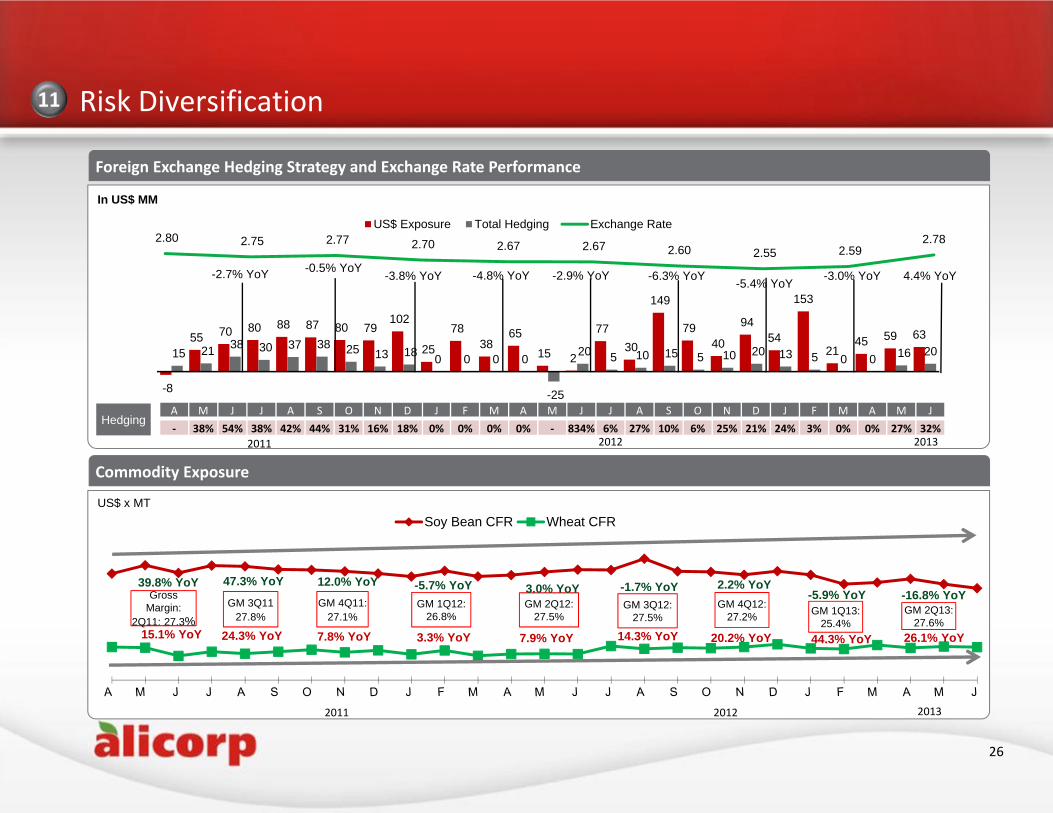
2.80 2.75 2.77 2.70 2.67 2.67 2.60 2.55 2.59 2.78
Exchange Rate
-8
55 70 80 88 87 80 79 102
25
78 38
65
15 2
77 30
149
79 40
94 54
153
2145 59 63
15 21 38 30 37 38 25 13 18 0 0 0 0
-25
20 5 10 15 5 10 20 13 5 0 0 16 20
US$ Exposure Total Hedging
Soy Bean CFR Wheat CFR
15.1% YoY 24.3% YoY 7.8% YoY
39.8% YoY 47.3% YoY 12.0% YoYGross
Margin:2Q11: 27.3%
GM 3Q1127.8%
GM 4Q11:27.1%
GM 1Q12: 26.8%
3.3% YoY
-5.7% YoYGM 2Q12:
27.5%GM 3Q12:
27.5%
3.0% YoY
7.9% YoY
GM 4Q12: 27.2%
-1.7% YoY
14.3% YoY
2.2% YoY
GM 1Q13: 25.4%
20.2% YoY
-5.9% YoY
44.3% YoY
-16.8% YoY
26.1% YoY
Risk Diversification
Foreign Exchange Hedging Strategy and Exchange Rate Performance
26
Commodity Exposure
In US$ MM
A M J J A S O N D J F M A M J J A S O N D J F M A M J‐ 38% 54% 38% 42% 44% 31% 16% 18% 0% 0% 0% 0% ‐ 834% 6% 27% 10% 6% 25% 21% 24% 3% 0% 0% 27% 32%
Hedging
US$ x MT
2011 2012
2011 2012 2013
2013
11
-2.7% YoY -0.5% YoY-3.8% YoY -4.8% YoY -2.9% YoY -6.3% YoY -5.4% YoY -3.0% YoY 4.4% YoY
GM 2Q13: 27.6%
[ C L I E N T N AM E ]
Presentation3
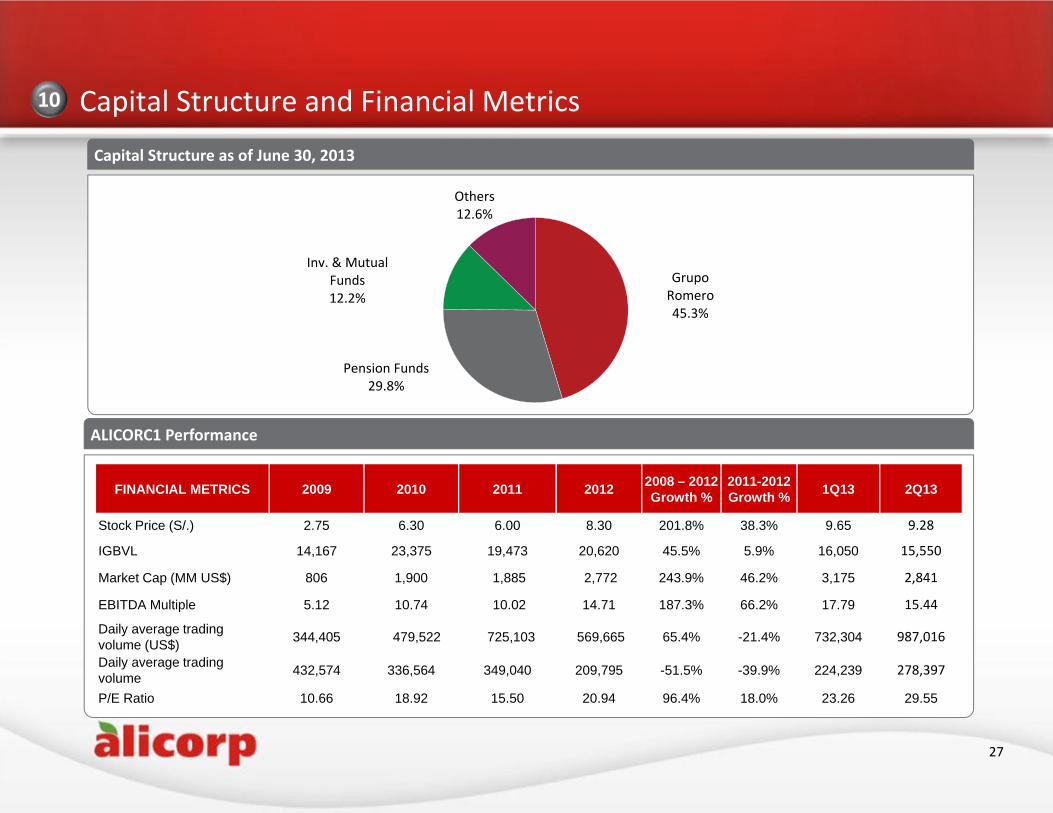
Capital Structure and Financial MetricsCapital Structure as of June 30, 2013
27
FINANCIAL METRICS 2009 2010 2011 2012 2008 – 2012 Growth %
2011-2012Growth % 1Q13 2Q13
Stock Price (S/.) 2.75 6.30 6.00 8.30 201.8% 38.3% 9.65 9.28
IGBVL 14,167 23,375 19,473 20,620 45.5% 5.9% 16,050 15,550
Market Cap (MM US$) 806 1,900 1,885 2,772 243.9% 46.2% 3,175 2,841
EBITDA Multiple 5.12 10.74 10.02 14.71 187.3% 66.2% 17.79 15.44
Daily average trading volume (US$) 344,405 479,522 725,103 569,665 65.4% -21.4% 732,304 987,016
Daily average trading volume 432,574 336,564 349,040 209,795 -51.5% -39.9% 224,239 278,397
P/E Ratio 10.66 18.92 15.50 20.94 96.4% 18.0% 23.26 29.55
ALICORC1 Performance
Grupo Romero45.3%
Pension Funds29.8%
Inv. & Mutual Funds12.2%
Others12.6%
10


![Looking back and looking forward[1]](https://img.pdfslide.us/doc/110x75/5559ad0dd8b42aa4288b511b/looking-back-and-looking-forward1.jpg)