Embed Size (px)
Citation preview

This PDF is a selection from an out-of-print volume from the NationalBureau of Economic Research
Volume Title: The Role of Middleman Transactions in World Trade
Volume Author/Editor: Robert M. Lichtenberg
Volume Publisher: UMI
Volume ISBN: 0-87014-378-6
Volume URL: http://www.nber.org/books/lich59-1
Publication Date: 1959
Chapter Title: EVIDENCE ON MAGNITUDE AND CONCENTRATIONOF MIDDLEMAN TRADE IN RELATION TO WORLD TRADE BYCOUNTRIES AND COMMODITIES
Chapter Author: Robert M. Lichtenberg
Chapter URL: http://www.nber.org/chapters/c2564
Chapter pages in book: (p. 8 - 37)

trade between countries, using both exporters' and importers' records foreach transaction.
Section 4 gives the conclusions of this study, and, on the basis of theanalysis, a critical examination of recent proposals put forth by the UnitedNations and the International Monetary Fund to improve the recordingby countries of international trade statistics.
1. EVIDENCE ON MAGNITUDE AND CONCENTRATION OF MIDDLEMANTRADE IN RELATION TO WORLD TRADE BY COUNTRIES
AND COMMODITIES
Middleman Trade in the Imports of Selected Countries
Tables 1, 2, 3, and 4 describe middleman trade in commodities purchasedfrom, but not produced in, middleman countries by seven importing coun-tries. Table 1 gives the value of their total imports from middleman coun-tries; Tables 2 and 3 show the figures by a commodity breakdown; andTable 4 shows the relative importance of the major middleman countriesin this trade.
In these tables, the excess of amounts purchased by the final importingcountry (I) from a middleman country (M) over the amount originatingin country (M) is only a net measure of (I's) purchases from (M) ofall other countries' goods. It is net because other middlemen may sellsome of the produce of country (M) to (I). For two of the seven coun-tries — Yugoslavia and Colombia — only these net measures were easilyobtainable. For another two — Germany and Denmark — cross-classifi-cation tables are given so that completely gross data (total imports pur-chased from but not produced in middleman countries) can be obtained.And for the other three import data in broad commodity groups wereused to get a partially gross record.'
As noted in the Appendix, both conceptual and practical problemsare involved in the use of the concepts "country of origin" and "countryof purchase," but these are less serious than the corresponding problems'Obviously, the degree of grossness depends partly upon the fineness of the com-modity classification available or feasible to use for the compilation of total excessof purchase over origin. Sweden provides commodity-country imports by countryof purchase and country of origin for only 12 commodity groups; for Norway there
8

on the export side.2 The German data raised a special problem; untilJanuary 1955 Germany reported its imports from all European overseasterritories as purchases from the corresponding metropoles unless theywere bought from middleman countries other than the correspondingmetropoles. The adjusted figures for these imports for the first half of1955 (see Table 11), however, indicate that a very small error in totalmiddleman trade recorded by Germany was introduced by this practice.3For imports from countries other than overseas territories, Germanyshifted in August 1954 from defining "country of purchase" as thecountry to which payment was made to defining it as the "country inwhich the foreign seller transacts his business."4 In this adjustment,according to the German statistical office, comparability with the previousperiod is not essentially affected, since with few exceptions the country to
are 48 commodity groups; for Finland one may use either the summary tablesgiving both sets of figures for 86 commodity groups or the basic commodity classifi-cation in well over a thousand categories; Colombia gives this comparison only inits most detailed record of trade. It is therefore possible to compile "partly gross"data for Finland and Colombia, but we decided that the cost was too great. Onlypartly gross data are available for Sweden and Norway, and only net for Yugoslavia.So far as I know these are the only countries providing purchase-origin data for1952. Beginning in 1953, Austria provides these data on a net basis; New Zealandprovides data labeled "country of purchase" but they actually show the countryof shipment.2The League of Nations showed in the early 1930's that exporters do not usuallyknow the final destination of their goods if there is reconsignment (InternationalTrade Statistics, R. G. D. Allen and 1. Edward Ely, eds., Wiley, 1953, p. 124). Itappeared to H. B. Woolley that this situation still existed in 1951 ("On the Elabora-tion of a System of International Transaction Accounts," Problems in the Inter-national Comparison of Economic Accounts, Studies in Income and Wealth, VolumeTwenty, Princeton University Press for National Bureau of Economic Research,1957).3The proportion of total sales reported by the colonies under the adjusted methodis very low except for overseas territories of France (5.8 percent) and of theNetherlands (10.1 percent), and, inasmuch as the Netherlands O.T.'s are of rela-tively minor importance in German import trade the distortion of the record forearlier years is not great. These percentages applied to 1952 data give a total of$10.3 million of German imports bought directly from the O.T.'s, of which $5.2million is from U.K. O.T.'s and $3.8 million from French O.T.'s. Since all otherselected importing countries report that some imports are bought directly from theO.T.'s, we can assume that this peculiarity in technique of recording country ofpurchase was limited to Germany.4Letter from Dr. Schmidt, Statistisches Bundesamt, Wiesbaden, Germany. In thetrade publication (Der Aussenhandel der Bundesrepublik Deutsch!and, 1954, Teil3, p. 3) "country of purchase" is defined as "country in which the foreign tradingpartner has his usual residence (Aufenthalt), his main office or his registration(Sitz) ." This definition does not clarify the treatment of branches or subsidiaries ofmultinational producers. The data indicate, however, that Germany and the othercountries reporting on country of purchase basis follow the reasonable approachof reporting either the parent company or the affiliate as the seller depending uponwhich handles the international financial transactions.
9
which payment is made is also the country in which the foreign sellerconducts his business.
Magnitude and Concentration, Seven Selected Countries
Table 1 reveals that, while the bulk of trade of the seven selected import-ing countries is direct trade, the amount of their indirect trade is large.In 1952 they purchased 13 percent of their imports, by simple average,and 16 percent by weighted average from middleman countries. But theseaverages cannot be taken as an indication of world middleman trade. Theseven countries, selected for availability not representativeness, coveronly 11.2 percent of the international Financial Statistics5 value of worldimports in 1952. In addition there is wide dispersion around the average.
An explanation of part of this dispersion is suggested by an analysis ofthe commodity composition of the imports of these seven countries inrelation to the structure of middleman commodity trade. Table 2 shows,for each of five importing countries, its imports of each commodity grouppurchased from middlemen as a percentage of its total imports of thatcommodity group in 1952. From this point of view the major commoditygroup is rubber and rubber products (possibly a result of the broad groupsused by the countries). All countries except Norway purchased at least40 percent of their imports of rubber and rubber products from middle-men. Imports purchased from middlemen were also a relatively high per-cent of total (compared with the ratio of total purchases from middlemento total imports) for other primary and semimanufactured goods: crudeand semimanufactured minerals, fertilizers and fuels; beverages, tobacco,sugar, and fodder; fats, oils and wax; and perhaps (excepting Germany)for live animals, meat, fish, dairy products, fruits, nuts, and vegetables.They were relatively low percentages of total for the broad categories ofcotton, wool, and all textile materials; chemical and pharmaceutical prod-ucts; transportation equipment; machinery, apparatus, and appliances;and manufactures of base metals.
To generalize, imports purchased from middlemen by these five coun-tries include a higher percent, by value, of primary and semimanufacturedgoods than do their direct imports. For Finland and the Scandinaviancountries, the proportion of manufactures in total imports was 54 to 67percent in 1953 (Standard International Trade Classification, SITC,Sections 5-8)° in contrast with roughly corresponding imports from mid-dlemen of less than 30 percent (1952), as shown in Table 3. For Ger-5lnternational Financial Statistics, International Monetary Fund, May 1953, p; 17.6Yearbook of International Trade Statistics, 1954, United Nations, pp. 129, 152,188, 208, 466, 470, 552. Data in commodity groups of the Standard InternationalTrade Classification are available for all of our importing countries except Finlandfrom 1953; the data in commodity groups for Finland were compiled.
10

TABLE 1
• Value of Imports Purchased from, but Not Produced in, Middleman Countriesby Selected Importers as Percent of Total Imports, 1952
(dollar amounts in millions)
SELECTED PURCHASESIMPORTINO FROM TOTAL
COUNTRY MIDDLEMEN IMPORTS PERCENT
Gross
Denmark 144.8 962.2 15.0Germany 853.1 3,853.9 22.1
Subtotal 9979 4,816.1 20.7
Partly gross
Norway 87.3 873.5 10.0Sweden 228.3 1,728.6 13.2Finland 76.1 792.1 9.6
Subtotal 391.7 3,394.2 11.5
Net
Yugoslavia 34.6 271.4 12.7Colombia 21.8 415.4 5.2
Subtotal 56.4 686.8 8.2
Grand total 1,446.0 8,897.1 16.2
Gross equals imports purchased from, but not produced in, each middleman country.Partly gross equals imports purchased from each middleman country minus
imports originating there, computed by individual commodity group.Net equals total imports purchased in each middleman country minus total
imports originating there.
Sources:
Germany — Der Aussenhandel der Bundesrepublik Deutschland, 1952 (Stati-stisches Bundesamt, Wiesbaden, 1953), Teil 3, pp. 18-22 and 75-83.
Denmark — Foreign Trade of Denmark, 1952 (Statistical Department, Copen-hagen, 1953) p. 28*.
Norway — Norges Handel, 1952 (Statistik Sentralbyra, Oslo, 1954), Del II, pp.30-31 and 36-41.
Sweden — Handel Berättelse For Ar 1952 (Kommerskollegium, Sveriges OfficiellaStatistik, 1954), pp. 26-3 1 and 36.
Finland — Foreign Trade, 1952 (Finlands Officiella Statistik, 1953), pp. 2-23,19*, and 25*.
Yugoslavia — Statistics of Foreign Trade o/the FPR of Yugoslavia, 1953 (ForeignTrade Division, Belgrade, 1954), pp. xx-xxi and xxiv (total of "regular" imports).
Colombia — Anuario de Comercio Exterior de 1952 (Departamento Administra-tivo Nacional de Estadistica, 1954), pp. 8 and 9.
11

TA
BL
E 2
Impo
rts
Purc
hase
d by
Ger
man
y, F
inla
nd, a
nd S
cand
inav
ian
Cou
ntri
es f
rom
Cou
ntri
es O
ther
than
Cou
ntry
of
Ori
gin,
Show
ing
Val
ue o
f Id
entif
ied
Com
mod
ities
, Val
ue o
f T
otal
Com
mod
ity G
roup
, and
The
ir P
erce
ntag
e R
atio
toT
otal
Cor
resp
ondi
ng C
omm
odity
Im
port
s, 1
952
(dol
lar
amou
nts
in m
illio
ns)
RE
POR
TIN
G C
OU
NT
RY
CO
MM
OD
ITY
GR
OU
P
Ani
mal
s, m
eat,
fish
, dai
ry p
rodu
cts,
nuts
and
veg
etab
les
Fats
, oils
and
wax
(an
imal
and
veg
etab
le)
Bev
erag
es, t
obac
co, s
ugar
and
fod
der
Cof
fee
Coc
oa a
nd it
s pr
oduc
tsT
obac
coSu
gar T
otal
iden
tifie
d
Cer
eals
and
pro
duct
sW
heat
Bar
ley
Cor
nR
ice
Tot
al id
entif
ied
All
text
ile m
ater
ials
and
pro
duct
sR
aw c
otto
nR
aw w
ool a
nd h
airs
Oth
er te
xtile
mat
eria
ls a
nd p
rodu
cts
Tot
al id
entif
ied
Woo
d, c
ork
and
woo
d pr
oduc
tsW
ood,
cor
k an
d ca
neL
umbe
rT
otal
iden
tifie
d
38.2
15.7
2.1
4.5
29.0
24.5
5.9
17.7
1.5
5.9
67.2
18.5
9.5
8.9
Finl
and
Val
ue P
erce
ntSw
eden
Val
uePe
rcen
tN
orw
ayV
alue
Perc
ent
Den
mar
kV
alue
Per
cent
Ger
man
yV
alue
Perc
ent
14.3
18.5
43.7
78.3
1.3
2.!
75e
13.5
66.8
26.9
44.6
23.9
82.7
64.5
14.9
21.2
0.8
7.8
143.
036
.2
3.0
10.6
22.6
9•9a
9.3
28.3
4.6
25.2
1.9
16.4
2.9
17.1
0.9
18.4
21.4
61.8
18.3
26.8
12.7
b49
.6
1.2
17.9
2.7
13.5
16.6
31.7
8.9
16.4
8.2
14.1
6.1c
20.5
27.1
30.9
0.2d
3.3
11.4
59.2
1.8
10.4
8.1
15.2
11.4
59.2
3.9
5.6
0.2
4.2
8.6
34.3
9.5
9.0
16.2
8.9
3.0
2.8
11.2
9.5
-
15.5
21.8
1.1
1.4
16.6
11.0
0.2
11.1
0.7
2.3
0.8
3.4
0.6
0.6
11.2
9.5
0.6
0.6
11.2
9.5

TA
BL
E 2
, con
clud
ed
RE
POR
TIN
G C
OU
NT
RY
Rub
ber
and
its p
rodu
cts
Pulp
, pap
er a
nd th
eir
prod
ucts
2.9
3.2
0.0
Cru
de a
nd s
emi-
man
ufac
ture
d m
iner
als,
fert
ilize
rs a
nd m
iner
al f
uels
Coa
l and
cok
ePe
trol
eum
Fert
ilize
rsFe
rrou
s or
e an
d fe
rrou
s pr
oduc
ts19
.213
.9T
in4.
828
.4O
ther
non
-fer
rous
ore
s an
d m
etal
s21
.947
.2T
otal
iden
tifie
d16
4.0
32.4
Man
ufac
ture
rs o
f ba
se m
etal
sC
hem
ical
and
pha
rmac
eutic
al p
rodu
cts
Tra
nspo
rtat
ion
equi
pmen
tM
achi
nery
, app
arat
us a
nd a
pplia
nces
Oth
er
Tot
al o
r av
erag
e
Val
ue f
igur
es in
ord
inar
y ty
pe r
efer
to id
entif
ied
com
mod
ities
; in
italic
s, to
the
tota
l for
the
com
mod
ity g
roup
.
"Inc
ludi
ng c
erea
l and
cer
eal p
rodu
cts.
bInc
ludi
ng te
a an
d sp
ices
.C
Incl
udin
g te
a an
d co
coa.
dlnc
ludi
ng to
bacc
o m
anuf
actu
res.
esljg
ar m
olas
ses,
and
syr
ups.
crud
e m
iner
als.
glro
n an
d st
eel.
bAll
ores
, sla
g, a
nd a
sh.
1lro
n an
d st
eel p
rodu
cts,
incl
udin
g fi
nish
ed.
iCom
mod
ity g
roup
s fo
r w
hich
no
figu
res
are
ente
red
abov
e.
CO
MM
OD
ITY
GR
OU
PG
erm
any
Finl
and
Swed
enN
orw
ayD
enm
ark
Val
uePe
rcen
tV
alue
Perc
ent
Val
uePe
rcen
tV
alue
Perc
ent
Val
uePe
rcen
t
53.1
70.9
3.5
41.7
12.0
46.5
1.6
20.5
3.6
91.9
25.8
92.3
12.4
94.1
0.1
0.5
0.1
1.7
29.9
12.0
122.
816
.445
.819
.051
.525
.9
7.0
37.6
0.2
2.2
43.8
1.Sg
1.4
0.1
1.3
2.4"
9.8
12.1
114
.010
.94.
412
.47.
18.
243
.8
0.0
0.0
27.6
9.6
0.1
0.4
6.9
6.9
1.5
4.6
2.4
2.8
1.6
1.8
031.
51.
411
.30.
80.
80.
30.
10.
50.
533
9.5i
16.8
1.2
3.8
11.1
9.8
5.2
10.3
853.
!22
.176
.19.
622
8.3
13.2
1.5
8.0
9.91
2.7
873
9.6
144.
815
.0

TABLE 3
Imports Purchased by Germany, Finland, and Scandinavian Countries fromCountries Other than Country of Origin, Showing Individual Commodity
Purchases as Percent of Total Commodity Purchases, 1952(percent)
REPORTING COUNTRYCOMMODiTY GROUP Germany Finland Sweden Norway Denmark
Animals, meat, fish, dairyproducts, fruits, nuts andvegetables 4.0 9.9 10.7 3.2
Fats, oils and wax (animaland vegetable) 2.5 1.3 1.0 14.8
Beverages, tobacco, sugarand fodder 24.0 3.9 9.4 18.7
Total identified 7.8 (21.8) (9.3) (7.9)Cereals and their products 5.1 0.2 5.9
Total identified 16.8
All textile materials andand products 12.5 7.1 3.4 7.7
Total identified 7.9 (12.5) (0.7) (7.7)
Wood, cork and wood products 0.3 0.3 0.9Total identified 2.0
Rubber and its products 6.2 4.6 5.3 1.8 2.5Pulp, paper and their products 0.3 0.0 0.1Crude and semi-manufactured
minerals, fertilizers andmineral fuels 39.3 53.8 52.5 35.6
Total identified 19.2 (14.3) (14.2) (5.7)Manufacturers of base metals 0.0 12.1 0.1 4.8Chemical and pharmaceutical
products 2.0 0.7 0.3Transportation equipment 3.2 0.7 12.9Machinery, apparatus and
appliances 1.0 0.1 0.6Other 39.8 1.6 4.9 6.0 6.8
Total 100.0 100.0 100.0 100.0 100.0
Figures in parentheses are percentages of components of each group identified inTable 2.
Source: See notes to Table 1.
14

many, of 80 percent of purchases from middlemen only about2 percent were manufactured goods in contrast to the proportion of manu-factured imports to total imports of 21 percent in the same year.
These commodity groups are too broad to permit refined analysis ofthe relation between commodity composition of imports and the ratio ofimports purchased from middleman to total imports of these countries. Anexamination of extreme cases for our seven importer countries suggests,however, a positive correlation between the ratio of primary and semi-manufactured goods to total imports and the ratio of total imports pur-chased from middlemen to total imports. Germany, with the highestproportion of imports purchased from middlemen, is a relatively smallimporter of manufactured goods; and Colombia, at the other extreme, isa relatively high importer of manufactures (81 percent of her imports in1953). For the other five countries, 50-67 percent of imports were manu-factures in 1953. The variation in types of goods demanded by theseimporting countries and the tendency for middlemen to specialize in pri-mary and semimanufactured goods thus may partly explain the dispersionaround the average of their proportion of imports bought from middlemen.
In addition to the concentration in certain commodity categories, thesedata for seven importing countries show a high concentration of middle-man trade in a few middleman countries. Table 4 shows that, for thesecountries, the U.K. is by far the most important middleman country, sell-ing an average of 46.8 percent of the total imports they purchased fromcountries other than the country of production, and over 40 percent ofsuch imports by each of these countries except Colombia. Apart from theU.K., only seven countries are significant in middleman activity. Of these,the U.S., France, and the Netherlands are most important on the average;but, unlike the U..K., their relative importance in the trade of the sevencountries varies considerably. For example, comparing the positions ofthe U.S. and France in the purchases from middlemen by Denmark andFinland, we see that the U.S. sold 12.6 percent and France sold 9.6 per-cent of Denmark's purchases, while the U.S. sold only 4.9 percent andFrance 14.1 percent of Finland's purchases. For the only Latin Americancountry represented — Colombia — the U.S. is by far the major middle-man country.
7Der Aussenhandel der Bundesrepublik Deutschland, 1952 (Statistisches Bunde-samt, Wiesbaden), Teil 3, Table IC. This table compares country of purchase andcountry of origin by broad commodity groups. A comparison was made for theeight major middleman countries shown in Table 4.
15

TA
BL
E 4
Val
ue o
f Im
port
s Pu
rcha
sed
from
, but
Not
Pro
duce
d in
, Mid
dlem
an C
ount
ries
by
Sele
cted
Im
port
ers
as P
erce
nt o
f T
otal
Purc
hase
s fr
om A
ll M
iddl
emen
, 195
2(d
olla
r am
ount
s in
mill
ions
)
NE
TH
ER
-SW
ITZ
ER
-IM
POR
TE
RS
U.K
.U
.S.
PRA
NC
EL
AN
DS
BE
LG
IUM
LA
ND
DE
NM
AR
KSW
ED
EN
OT
HE
RT
OT
AL
Gro
ssD
enm
ark
Val
ue68
.218
.313
.918
.98.
51.
53.
112
.414
4.8
Perc
enta
ge47
.112
.69.
613
.05.
91.
02.
18.
610
0.0
Ger
man
yaV
alue
374.
211
5.5
99.9
74.9
64.0
42.4
1.2
11.4
69.6
853.
1Pe
rcen
tage
43.9
13.5
11.7
8.8
7.5
5.0
0.1
1.3
8.2
100.
0Pa
rtly
gro
ssN
orw
ayV
alue
42.5
11.8
2.4
4.7
3.8
1.2
13.1
0.9
6.9
87.3
Perc
enta
ge48
.713
.52.
85.
44.
41.
415
.01.
07.
910
0.0
Swed
enV
alue
142.
447
.09.
56.
52.
21.
05.
714
.022
8.3
Perc
enta
ge62
.420
.64.
22.
81.
00.
42.
56.
110
0.0
Finl
and
Val
ue32
.03.
710
.76.
40.
11.
51.
63.
117
.076
.1Pe
rcen
tage
42.0
4.9
14.1
8.4
0.1
2.0
2.1
4.1
22.3
100.
0N
etY
ugos
lavi
abV
alue
17.2
10.0
0.1
4.4
2.9
34.6
Perc
enta
ge52
.330
.40.
313
.43.
610
0.0
Col
ombi
aV
alue
18.2
0.5
0.5
2.6
21.8
Perc
enta
ge83
.52.
32.
311
.910
0.0
Tot
al Val
ue67
6.5
224.
513
6.4
112.
078
.652
.021
.619
.012
5.4
1,44
6.0
Perc
enta
ge46
.815
.59.
47.
85.
43.
61.
51.
38.
710
0.0
For
expl
anat
ion
of g
ross
, par
tly g
ross
, and
net
, and
for
sou
rces
, see
not
es to
Tab
le 1
.
figu
res
are
slig
htly
exa
gger
ated
(se
e T
able
10,
not
e a)
. Adj
ustm
ents
bas
ed u
pon
data
for
195
5 sh
own
in T
able
10
and
disc
usse
d in
the
text
wou
ld p
roba
bly
redu
ce th
e U
.K. m
erch
antin
g by
$5.
2 m
illio
n, F
renc
h by
$4.
1 m
illio
n, w
ith o
ther
min
or c
hang
es.
blm
port
tota
l exc
ludi
ng e
cono
mic
aid
.

TABLE 5
United States Water-Borne General Imports of Merchandise Laden inCountries Other than Country of Origin, by Areas of Origin and
Three Major Countries of Lading,a 1953(millions of dollars)
COUNTRY OF LADINGAREA OR COUNTRY United
OP ORIGIN Kingdom Netherlands Belgium Total
Canada 0.9 0.9Dollar Latin America 0.8 0.2 1.0Nondollar Latin America 1.2 26.5 12.8 40.5Sterling Europe 0.7 6.9 3.7 11.3Nonsterling EPU
(except W. Germany) 10.9 15.8 40.1 66.8West Germany 0.8 72.3 22.5 95.6Other Europe 1.0 4.5 0.5 6.0Soviet bloc 2.4 4.9 5.1 12.4Sterling overseas territories 7.6 23.2 2.9 33.7Other sterling 14.4 4.8 2.4 21.6Indonesia 7.2 0.2 7.4Other 4.4 20.1 3.0 27.5
Total 45.1 186.4 93.2 324.7
aExciudes imports from countries with no ports, except imports from Soviet blocand landlocked countries laden in the United Kingdom.
Source: Tabulations SA 352 provided by Foreign Trade Division, Bureau of theCensus.
Imports by the United States Laden in CountriesOther than Country of Origin
Although the United States does not report imports by country of pur-chase, some interesting information can be gleaned from a census tabula-tion of U.S. water-borne imports by country of lading and country oforigin. About 10 percent8 of U.S. imports were laden in countries otherthan country of origin in 1953 and, of this, about one-quarter originatedin countries without port facilities. Table 5 shows U.S. water-borneimports laden, but not produced, in three major countries of WesternEurope, distributed by areas of origin, exclusive of countries without portfacilities unless there was an obvious reshipment. Table 6 shows a simi-lar distribution for major countries of lading outside of Western Europe.
8My selection totaled only 8.8 percent of U.S. imports. But an examination of thecoverage achieved by this selection for a single month in an earlier year (1951)suggests that it is close to 90 percent of total U.S. imports laden in countries otherthan country of origin.
17

TABLE 6
United States Water-Borne General Imports of Merchandise Laden inCountries Other than Country of Origin,a by Major Countries of
Lading Outside of Western Europe, 1953(millions of dollars)
COUNTRY OF COUNTRY OFLADING ORIGIN VALUE
Lebanon Total 69.2Saudi Arabia 52.7Iraq 8.4Other 8.1
British Malaya Total 72.0Thailand 34.8Indonesia 30.2Burma 3.4Indochina 1.9Australia 1.4Other 0.3
Macao Total 47.3Philippines 47.0Other 0.3
Japan Total 25.2Republic of Korea 24.3Other 0.9
Angola Total 31.7Belgian Congo 30.2Other 1.5
British East Africa Total 11.7Belgian Congo 11.1Other 0.6
Mozambique Total. 10.3Union of South Africa 8.3British East Africa• 1.5Other 0.5
Guatemala Total 8.5El Salvador 6.6Costa Rica 0.6Nicaragua 0.5Other 0.8
Trinidad and Tobago Total 12.5Surinam 10.6Venezuela 0.7Other 1.2
Total selected countries S 288.4
Source: Same as Table 5.
of countries of origin which have no ports. U.S. imports from countriesfor which the Census Bureau reports no ports listed are (in millions of dollars):Bolivia, 61; Austria, 29; Czechoslovakia, 2; Hungary, 2; Switzerland, 68; Afghan-istan, 15; Ethiopia, 31; British Somaliland, I; Northern Rhodesia, 53 and SouthernRhodesia, 15.
18

Without further information our conclusions about middleman activitydrawn from these tables can be only limited. Country of lading data aredeficient because of the omission of offshore merchanting; on the otherhand, they are excessive in that they include the value of merchandiseladen from a country whether or not it was resold by a middleman who isresident of that country. It is known, for example, that a large part ofthe exports of European countries laden in the Netherlands are not resoldby Dutch merchants.9 Also the exclusion of countries having no portfacilities leads to the omission of a certain amount of middleman activity.
But despite these limitations, some features of these tables tell a story.Table 5 shows that merchandise is shipped to Western Europe, particu-larly to the Netherlands, from all parts of the world before being sent tothe United States. The highly irregular routes followed by some merchan-dise may represent merely rerouting by the original exporters after discov-ery of better markets; but a large part of it can be attributed to switchtrade. Table 6 shows that except for Western European countries there areonly a few important countries of lading for reshipment to the U.S. (asidefrom those reshipping merchandise of countries without ports). Moreover,not all of these are middleman countries. Lebanon, for example, is not amiddleman for Saudi Arabia, since the transshipment is entirely petroleum.
Table 7 shows a commodity breakdown of 83 percent of U.S. importsfrom countries other than country of origin, exclusive of those with noports. The high concentration in staple foods and raw materials is evident.
Middleman Activity from Point of View of Other Importing Countries
For relatively underdeveloped countries as final importers, there are noprecise data on middleman trade. Concerning overseas territories, thereis good evidence only that residents of the metropoles control a high per-centage of O.T. imports. P. T. Bauer has noted, for example, that in 1949about 85 percent of Nigerian import trade was handled by European firms,about 10 percent by Levantine and Indian firms, and about 5 percent byAfrican firms.1° And he found the same pattern in the Gold Coast beforeit became the Republic of Ghana, though the share of African firms wasprobably somewhat larger. Thus, most of the imports of these countriesand dependencies are bought from non-African traders, but it is possible°In contrast to the U.S. report of $72 million of German produce purchased by theU.S. as laden in the Netherlands in 1953, Germany reports sales to the Netherlandsof only $20 million of merchandise destined for consumption in the U.S. in thesame year (Der Aussenhandel der Bundesrepublik Deutschland, 1954, Teil 3, p. 51).The German data may be too low, of course, since exporters do not always knowthe final destination of their produce.lOp. T. Bauer, West African Trade, University Press, Cambridge, England, 1954,p. 65. Bauer adds that since 1949 the African share has probably increased slightly.
19

TABLE 7
Selected United States Commodity Imports Laden in Countries Other thanCountry of Origin, in Value and Percent of Total Such Imports, 1953
(dollar amounts in millions)
VALUEIncludes Excludescountry countryof origin of origin Go!. 2 aswith no with no percent of
port porta columnCOMMODITY DESCRIPTION (1) (2) total
Total Selected:Coffee 106.5 77.3 10.1Tea and cocOa 36.6 36.3 4.7Sugar and related products 16.9 16.9 2.2Other animal and vegetable food products 23.4 23.1 3.0
Raw materials and other animal andvegetable products 429.2 306.3 39.8
Crude vegetable products, inedible,exci. fiber 82.6 82.6 10.7
Hides and skins 9.4 5.3 0.7Other inedible animal products 11.2 9.6 1.2Textile raw materials, md. fiber 38.4 38.4 5.0Copper ore and concentrates 53.8 3.4 0.4Tin ore and concentrates 42.9 4.7 0.6Other crude metals 131.3 112.7 14.7Crude petroleum 59.6 49.6 6.5
Textiles, semifinished metals, nonmetallicminerals and manufactures 201.2 149.9 19.5
Textiles, manufactured 54.0 33.7 4.4Rolled and finished steel mill products 45.4 45.1 5.9Other metals and manufactures 77.0 59.4 7.7Nonmetallic minerals and manufactures 24.8 11.7 1.5
Machinery and chemicals 49.1 29.6 3.8Machinery and parts 15.7 4.1 0.5Chemicals 33.4 25.5 3.3
Total selected commodities 862.9 639.4 83.1
Commodities not elsewhere specified 176.4 129.7 16.9
Total commoditiesb 1,039.3b 769.1 100.0
shipments laden in the United Kingdom from landlocked countries.blncomplete — estimated as 85-90 percent of total.
Source: Same as Table 5.
20

that a high proportion of this trade is direct trade. Bauer's classificationof commodity groups by "expatriate" firms makes clear that part of theirsales represented middleman trade, but it is not possible to estimate itsmagnitude.
As to the Far East, the importance of middleman trade is indicatedby the re-exports of Malaya and Hong Kong (see Table 19). Thesere-exports include merchandise produced in highly industrialized coun-tries and destined for South and Southeast Asia, and also produce ofSouth and Southeast Asia destined for the industrialized countries. Themiddlemen are mainly British and Chinese.
In short, these data suggest the hypothesis that middleman trade playsan important part in total imports of those relatively developed countrieswhich import primarily foods, raw materials, and semiprocessed goods,and is also of considerable importance in total imports of at least someof the relatively underdeveloped countries in Asia.
Middleman Trade by Major Middleman Countries
Looking at these data next from the standpoint of the middleman country,we see in Table 8 that middleman trade is a significant addition to thevalue of domestic exports of the major industrial middleman countriesin trade with some (though not all) of the seven importing countries —21 percent of domestic exports, in weighted average, for all selected mid-dlemen. For the U.K. it averages 74.7 percent of domestic exports intrade with these seven countries and is, on average, above 24 percent ofdomestic exports except to Colombia. For five other major middlemancountries it is above 16 percent of domestic exports with all of them,although the variation around the average is wide.
Several factors appear to be involved in the variation shown in theimportance of middleman trade to the middleman countries in their tradewith these seven countries; among these are diversity in structure ofimports of final importing countries, geographic proximity, hardness ofcurrency of the middleman countries and principal trading relationshipsof the final importing countries.
Middleman Trade in Exports by Country of Origin
In Table 9 the data supplied by the seven selected importing countriesare used to show the importance of middleman activity to the countriesof origin within area groups and to the areas of origin. For example, 22.2percent of imports bought by Germany from individual countries in non-dollar Latin America in 1952 were purchased from countries other thanthe country of origin. And these purchases from middlemen were 20.0
21

percent of the total imports by Germany of merchandise originating inall countries of nondollar Latin America.
In general, a high percentage of imports originating in the relativelyunderdeveloped areas of the world were purchased from middlemen byeach of the seven selected importing countries in 1952. The greatest mid-dleman activity is shown for countries which are primarily petroleumproducers, as we would expect from the well-known fact that almost allof their petroleum is sold by U.K. and U.S. multinational concerns. Apartfrom the exports of the major petroleum-producing countries, more than50 percent of exports by Asia and Africa (exclusive of the sterlingdominions and the Soviet bloc) and nearly 50 percent of exports ofCanada and Greenland were sold on average by the industrial middlemancountries to the selected importing countries of Western Europe and toColombia.
Middleman countries are less active but still important in the sale ofproduce of Latin America and the overseas sterling areas, excluding colo-nies. For overseas sterling areas, except colonies, only Germany reportspurchases from middlemen of less than 30 percent. For exports of dollarLatin America, middleman activity accounts for more than 20 percentof the purchases by each of the importers, except by Colombia. For non-dollar Latin America, several of the importers report middleman activitybelow 15 percent, and the percentages are still lower on the average forthe Soviet bloc.
Middlemen countries also sell produce of the highly industrializedcountries to third countries; the category "Continental OEEC, U.S., andJapan" accounts for about one-fifth in weighted average of total middle-man trade, but that trade is a small percentage of total domestic or specialexports of these countries.
Two of the final importing countries, Germany and Demnark, providea cross classification of imports by country of origin and by middlemancountry. These data, shown in Tables 10, 11, 12, and 13, are classified tobring out the role of the major middleman countries in sale of produceof their own overseas territories or monetary areas." Tables 10 and 11reveal clearly that in trade with Germany and Denmark the metropoleacts as a middleman in the sale of a high percentage of the exports of itsown overseas territories; the exception in the case of the Netherlands isthe result of the role of the U.K. and the U.S. in the petroleum exports ofDutch territories.
11Tables 10, 11, 12, and 13 differ from Table 9 mainly in distinguishing betweenimports from overseas territories and from all other countries. Additional differ-ences that may be puzzling are: the inclusion in Tables 12 and 13 of the U.K. inthe sterling area while in Table 9 the U.K. is included with the industrial coun-tries; and the inclusion of Japan in the Middle and Far East in Tables 12 and 13.
22

TA
BL
E 8
Val
ue o
f Im
port
s Pu
rcha
sed
from
, but
Not
Pro
duce
d in
, Mid
dlem
an C
ount
ries
, by
Sele
cted
Im
port
ers
as P
erce
nt o
f T
otal
Impo
rts
Ori
gina
ting
in C
orre
spon
ding
Mid
dlem
an C
ount
ry, 1
952
(per
cent
)
MID
DLE
MA
NC
OU
NT
RIE
SU
nite
dN
ethe
r-U
nite
dSw
itzer
-So
viet
Tot
alIM
POR
TE
RS
Kin
gdom
land
sB
elgi
umSt
ates
Fran
cela
ndSw
eden
Uni
onD
enm
ark
Oth
er M
iddl
emen
Gro
ssD
enm
ark
34.4
39.8
16.5
25.6
37.1
7.3
3.8
02.
824
.4W
. Ger
man
y29
9.4
26.9
28.5
19.4
69.3
38.6
5.2
01.
13.
431
.8
Part
ly g
ross
Nor
way
24.3
12.9
7.6
13.5
7.4
11.8
0.7
037
.80.
89.
6Sw
eden
57.5
7.2
2.1
28.4
15.2
2.7
1.9
13.0
0.6
16.4
Finl
and
26.8
14.5
0.2
6.1
15.4
18.8
7.3
17.5
5.7
0.8
10.8
Net
Yug
osla
via
87.8
1.9
036
.10
74.2
0a
00.
912
.4C
olom
bia
010
.10
7.0
00
6.8
a11
.511
.15.
5A
vera
ge74
.721
.916
.217
.536
.127
.44.
011
.49.
72.
321
.0
Gro
s.s
equa
ls im
port
s pu
rcha
sed
from
, but
not
pro
duce
d in
, eac
h m
iddl
eman
cou
ntry
.Pa
rtly
gro
ss e
qual
s im
port
s pu
rcha
sed
from
eac
h m
iddl
eman
cou
ntry
min
us im
port
s or
igin
atin
g th
ere,
com
pute
d by
indi
vidu
alco
mm
odity
gro
up.
Net
equ
als
tota
l im
port
s pu
rcha
sed
in e
ach
mid
dlem
an c
ount
ry m
inus
tota
l im
port
s or
igin
atin
g th
ere.
aNo
impo
rts
from
mid
dlem
an c
ount
ry.
Sour
ce: S
ee n
otes
to T
able
I.

TA
BL
E 9
Val
ue o
f Im
port
s by
Sel
ecte
d C
ount
ries
Pur
chas
ed f
rom
Cou
ntri
es, w
ithin
Are
a G
roup
s, O
ther
than
Cou
ntry
of
Prod
uctio
n,as
Per
cent
of
Tot
al I
mpo
rts
Prod
uced
in E
ach
Are
a, 1
952
(val
ues
in m
illio
ns o
f do
llars
)
SEL
EC
TE
DO
EE
Cd
PET
RO
-IM
POR
TIN
GC
AN
AD
A &
LA
TIN
AM
ER
ICA
OV
ER
SEA
SO
TH
ER
OT
HE
RSO
VIE
TU
.S.,
&O
TH
ER
LE
UM
CO
UN
TR
IES
GR
EE
NL
AN
D$
£ A
RE
ASb
ASI
AC
AFR
ICA
BL
OC
JAPA
NE
UR
OpE
eT
OT
AL
Gro
ssG
erm
any
A72
.025
.041
.153
.597
.524
1.6
31.2
183.
35.
610
2.3
853.
1B
%56
.123
.722
.225
.957
.286
.641
.87.
82.
979
.1C
%56
.123
.720
.025
.957
.286
.641
.87.
82.
979
.1
Den
mar
kA
6.7
0.3
12.2
8.9
26.9
20.5
9.1
38.8
1.8
19.6
144.
8B
%60
.421
.427
.171
.280
.771
.819
.57.
85.
393
.1C
%43
.221
.427
.171
.280
.571
.719
.45.
45.
292
.9Pa
rtly
gro
ssN
orw
ayA
2.7
0.9
2.8
5.6
7.1
16.9
2.7
27.2
0.1
21.3
87.3
B%
6.9
87.6
11.2
53.9
67.0
71.6
8.0
4.0
0.4
84.4
C%
6.9
87.6
11.2
53.9
67.0
71.6
7.1
4.0
0.4
84.4
Swed
enA
6.8
8.9
14.7
17.3
19.6
31.6
4.0
25.3
0.1
100.
022
8.3
B%
44.6
57.4
13.8
36.6
73.9
67.6
4.3
2.1
0.3
88.6
C%
44.6
57.4
13.8
36.6
73.9
67.6
3.7
2.1
0.2
88.2
Finl
and
A1.
33.
016
.49.
94.
48.
515
.015
.71.
80.
176
.1B
%44
.562
.440
.674
.174
.160
.418
.82.
915
.333
.7C
%44
.562
.438
.574
.146
.260
.49.
82.
515
.320
.0

TA
BL
E 9
, con
clud
ed
SEL
EC
TE
DO
EE
Cd
PET
RO
-IM
POR
TIN
GC
AN
AD
A &
LA
TIN
AM
ER
ICA
OV
ER
SEA
SO
TH
ER
OT
HE
RSO
VIE
TU
.S.,
&O
TH
ER
LE
UM
CO
UN
TR
IES
GR
EE
NL
AN
D3
£ A
RE
ASb
ASI
AC
AFR
ICA
BL
OC
JAPA
NE
UR
OPE
eT
OT
AL
Net Y
ugos
lavi
aA
15.9
0.7
0.7
1.9
0.3
13.8
1.3
34.6
B%
99.5
68.9
85.4
85.4
100.
011
.310
0.0
C%
99.5
52.7
85.4
79.0
11.1
5.6
100.
0
Col
ombi
aA
7.6
0.4
0.1
0.5
7.0
0.5
5.4
0.1
0.2
21.8
B%
50.6
4.9
8.5
30.4
8.3
99.3
6.4
11.2
100.
0C
%50
.64.
41.
530
.48.
399
.31.
511
.21.
3
Tot
al A11
3.0
38.5
88.0
96.4
164.
431
9.9
62.0
309.
59.
524
4.8
1,44
6.0
B%
48.7
28.4
21.8
33.7
63.7
81.4
18.9
5.4
3.3
84.3
C%
48.1
28.1
20.3
33.7
62.8
80.9
14.7
5.1
3.2
80.0
For
expl
anat
ion
of g
ross
, par
tly g
ross
, and
net
, and
for
sou
rces
, see
not
es to
Tab
le 1
.
A =
Val
ueof
impo
rts
prod
uced
, but
not
pur
chas
ed f
rom
cou
ntri
es, w
ithin
are
as.
B =
Aas
per
cent
of
tota
l im
port
s pr
oduc
ed in
cor
resp
ondi
ng c
ount
ries
with
in a
reas
.C
=A
as p
erce
nt o
f tot
al im
port
s pr
oduc
ed in
the
area
.
ainc
lude
s E
urop
e's
over
seas
terr
itori
es.
dCon
tinen
tal O
EE
C.
colo
nies
.eE
xcep
t EPU
.O
cean
ia a
nd A
ntar
ctic
Reg
ion.
tPet
role
um p
rodu
cing
cou
ntri
es.

TABLE 10
Value of Imports by Germany and Denmark of Produce Originating inOverseas Territories, by Country of Purchase, 1951 and 1952
(millions of dollars)
OVERSEAS TERRITORIESMETROPOLEMIDDLEMEN British French Dutch Belgian Portuguese Others Total
Imports reported by GermanyU.K.
1951 184.6 0.1 0.3 0.2 0 0 185.21952 191.2 5.3 0.7 0.1 0.7 0 198.0
France1951 0.1 62.5 0 0 0 0 62.61952 0 70.8 0 0 0 0 70.8
Netherlands1951 0.6 0.7 1.6 0 0 0 2.91952 2.1 1.1 1.9 0.8 0.2 0 6.1
Be]gium1951 0 1.4 0.1 36.4 0 0 .' 37.91952 0.3 0.2 0 49.5 0.1 0 50.1
Portugal1951 0 0 0 0 12.9 0 12.91952 0 0 0 0 11.4 0 11.4
U.S.1951 0.8 0.1 0 0 0.3 0 1.21952 1.5 0 0 0 0 0.1 1.6
Other1951 0.1 0.2 0 0.2. 0 5.4 5.91952 0.6 0.7 0 0 0 10.7 12.0
O.T.'s19511952
Total1951 186.2 65.0 2.0 36.8 13.2 5.4 308.61952 195.7 78.1 2.6 50.4 12.4 10.8 350.0
26

TABLE 10, concluded
OVERSEAS TERRITORIESMETROPOLEMIDDLEMEN British French Dutch Belgian Port z.eguese Others Total
Imports reported by DenmarkU.K.
1951 25.4 0.1 4.9 0 2.6 0.3 33.31952 13.4 0.2 4.7 0 1.2 0 19.5
France1951 0 6.3 0 0 0 0 6.31952 0 7.9 0 0 0 0 7.9
Netherlands1951 0.2 .0 0.1 0 0.2 0 0.51952 0.5 0.1 0.1 0.1 0.1 0 0.9
Belgium1951 0 0 0 2.2 0.1 0 2.31952 0 0 0 2.6 0 0 2.6
Portugal1951 0 0 0 0 2.3a 0 2.3a1952 0 0 0 0 0
0 16.3 0 0 0 16.61952 0.4 0 10.4 0 0 0.1 10.9
Other1951 0.3 0 0.2 0 0 3.8 4.31952 0.3 0.3 0 0.1 0.5 0 1.2
O.T.'s1951 3.1 2.6 0.3 0 0.2 5.4 11.61952 1.5 4.4 0 0 0.2 2.0 8.1
Total1951 29.3 9.0 21.8 2.2 5.4 9.5 77.21952 16.1 12.9 15.2 2.8 2.8 2.1 51.9
aBased on assumption that own metropole sells all exports of overseas territoriesnot sold by other middlemen listed by Denmark.
Source: See note to Table 11.
27

TA
BL
E 1
1
Val
ue o
f Im
port
s by
Ger
man
y an
d D
enm
ark
of P
rodu
ce O
rigi
natin
g in
Ove
rsea
s T
erri
tori
es, C
lass
ifie
d by
Per
cent
Pur
chas
edfr
om O
wn
Met
ropo
le, O
ther
Met
ropo
les,
and
Cou
ntry
of
Ori
gin,
195
1-19
52 a
nd, f
or G
erm
any,
195
3, 1
954,
and
Janu
ary-
June
195
5(p
erce
ntag
e di
stri
butio
ns o
f va
lue
of im
port
s)
OV
ER
SEA
S T
ER
RIT
OR
IES
Bri
tish
Fren
chD
utch
Bel
gian
Port
ugue
seO
ther
IMPO
RT
S B
YC
OU
NT
RY
OF
Ger
-D
en-
Ger
-D
en-
Ger
-D
en-
Ger
-D
en-
Ger
-D
en-
Ger
-D
en-
PUR
CH
ASE
,nan
yam
ark
n2an
yam
ark
,nan
yam
anya
mar
km
anya
mar
k,n
anya
mar
k
(1)
(2)
(3)
(4)
(5)
(6)
(7)
(8)
(9)
(10)
(11)
(12)
0O19
51•
.M
etro
poic
Ow
n99
.286
.596
.170
.181
.20.
399
.099
.597
.743
.8b
100.
038
.3b
Oth
er0.
82.
83.
91.
218
.898
.31.
00.
12.
353
.2b
06.
7bO
.T.
10.7
28.7
1.4
0.4
3•Ø
b55
0b
1952
Met
ropo
leO
wn
97.7
82:8
90.6
61.4
71.7
0.4
98.1
91.4
92.1
28.4
b10
0.0
1.8b
Oth
er2.
37.
69.
44.
228
.399
.61.
97.
17.
964
.9b
0Ø
•3b
O.T
.9.
634
.40
1.5
6.7b
979b
1953
Met
ropo
leO
wn
96.7
80.1
31.1
98.3
83.0
Oth
er3.
319
.968
.91.
717
.0O
.T.

TA
BL
E 1
1, c
oncl
uded
(1)
(2)
(3)
(4)
(5)
(6)
(7)
(8)
(9)
(10)
(11)
(12)
1954
Met
ropo
leO
wn
94.4
87.9
33.6
97.7
69.6
Oth
er5.
612
.166
.42.
330
.4O
.T.
1955
cM
etro
pole
Ow
n90
.270
.514
.495
.553
.4'.0
Oth
er7.
115
.775
.63.
343
.3O
.T.
2.7
5.8
10.1
1.2
3.2
aUnt
jl 19
55, a
ll im
port
s by
Ger
man
y fr
om o
vers
eas
terr
itori
es n
ot b
ough
t fro
m "
othe
r m
etro
pole
s" w
ere
reco
rded
as
boug
ht f
rom
"ow
n m
etro
pole
."-
bBas
edon
ass
umpt
ion
that
ow
n m
etro
pole
sel
ls a
ll ex
port
s of
ove
rsea
s te
rrito
ries
not
sol
d by
oth
er m
iddl
emen
list
ed b
y D
enm
ark
orby
ove
rsea
s te
rrito
ries
.
cFir
st s
ix m
onth
s.
Sour
ce: F
orei
gn T
rade
0/
Den
mar
k,19
51 a
nd 1
952
(Sta
tistic
al D
ept.,
Cop
enha
gen)
; for
Ger
man
y in
195
1-1
954,
the
year
book
Der
Aus
senh
ande
l der
Bun
desr
epub
lik D
euts
chla
nd, T
eil 3
(St
atis
tiseh
es B
unde
sam
t, W
iesb
aden
), a
nd in
195
5, u
npub
lishe
d da
ta p
rovi
ded
by P
. Sch
mid
t of
the
Stat
istis
ches
Bun
desa
mt.

Tables 12 and 13 show that the U.K. and the U.S. are the middlemenfor the petroleum-producing countries. The U.S. is the major middlemanfor dollar Latin America, but it runs into competition by the U.K. forCanada and nondollar Latin America. Sterling area products are soldlargely by the U.K.; the Netherlands tends to dominate in the Middle andFar East.
Middleman Trade Revealed in Netherlands Trade Records'2
Although data on middleman trade provided in the entrepôt and transittrade records of the Netherlands trade statistics are difficult to interpretand inadequate as a measure of Dutch merchanting with any particularcountry, they, nonetheless, merit consideration.
Two major problems of interpretation are involved in the use ofentrepôt and transit trade data: the distinction between exports consignedto the Netherlands and those passing through the country for shipmentpurposes only; and the distinction between consignment to Dutch mer-chants as principals and consignment to Dutch agents of foreign princi-pals. As to the entrepôt data, it was assumed that in most cases the Dutchmerchants acted on their own account; they acted in the capacity of agentsfor foreign principals for only an insignificant part of the goods placed inDutch warehouses and later re-exported. To the transit trade records,however, a highly conservative approach was adopted to avoid the possi-bility of making serious errors. Transit trade was excluded if the traderoute of the commodity could be considered economically reasonable,unless there was good evidence that Dutch merchanting was involved'3(despite the fact that Dutch merchants have operated as middlemen inmuch of the trade with Western Europe). In addition, that part of thecargo which might have been transshipped by British merchants wasomitted.
To estimate values from the quantity data provided in entrepôt andtransit trade, unit values of the special export of the commodity in thefinest classification given for that year were used, where possible. If thecommodity did not pass through the special export record, special importunit values were used. Because this task was arduous only the major121 am indebted to Herman F. Karreman for permission to abstract from his manu-script, "Dutch Merchanting Activities Revealed in Netherlands Trade Statistics,1951" (unpublished, National Bureau of Economic Research, 1952), Tables 10and 11 on Dutch entrepôt and transshipment trade, as well as their interpretation.13Th is excluded goods transshipped in the Netherlands on the way to or from WestGermany, Switzerland, Austria, Hungary, Czechoslovakia, East Germany, Finland,Sweden, Norway, and Denmark, as well as to eastern parts of Belgium and France."All cargo going via the Netherlands from the sterling area to the United Kingdomwas excluded, and also rubber from Indonesia en route to the U.K.
'30

TABLE 12
Purchases by Germany from Major Middleman Countries of Produce Originating inAreas or Countries Other than Overseas Territories, 1951 and 1952
(millions of dollars)
COUNTRY OF PURCHASEPurchased Country of merchandisefrom and purchased from middlemen countries
Imported originat-AREA OR from ing in All
COUNTRY country country Nether- middle-OF ORIGIN of origin of origin U.K. U.S. lands Other men
United States 1951 647.3 637.3 2.0 4.8 3.2 10.01952 595.8 509.2 43.4 31.5 11.7 86.6
Canada 1951 51.1 18.6 0.1 26.6 3.3 2.5 32.51952 128.2 56.2 23.5 22.0 4.6 21.9 72.0
Dollar L.A. 1951 99.2 55.9 0.1 39.7 2.4 1.1 43.31952 105.3 80.3 0.1 20.9 1.0 25.0
NondollarL.A. 1951 218.2 189.7 1.6 '15.1 '4.1 7.7 28.51952 204.0 167.0 5.5 93 3.8 18.4 37.0
Sterling Area 1951 377.0 282.3 64.7 8.4 12.4 9.2 94.71952 335.8 268.8 24.1 2.4 4.8 35.7 67.0
NonsterlingEPU 1951 1,323.4 1,292.3 17.1 2.6 2.3 9.1 31.11952 1,616.7 1,534.6 23.8 4.9 15.3 38.1 82.1
Soviet bloc 1951 102.0 44.1 24.9 0.9 2.3 29.8 57.91952 74.6 43.4 17.6 0.5 2.5 10.6 31.2
Middle&FarEast 1951 131.1 85.3 5.1 9.1 30.6 1.0 45.81952 131.6 120.1 1.4 5.5 1.6 3.0 11.5
Mainly petroleum 1951 109.9 32.6 31.9 45.1 0 ' 0.3 77.31952 112.2 27.0 35.8 48.4 0.9 0.1 85.2
Other Europe 1951 135.2 131.5 0 1.4 0.7 1.6 3.71952 191.2 185.6 1.7 0.1 0.8 3.0 5.6
Total 1951 3,194.4 2,769.6 147.5 148.9 62.9 65.5 424.81952 3,495.4 2,992.2 176.9 114.0 68.8 143.5 503.2
Source: Der A ussenhandel der Bundesrepublik Deutschland, 1951 and 1952, Teil 3' (StatistischesBundesamt, Wiesbaden).
commodities in the entrepôt, and in the transit-with-transshipment cate-gories were valued. For the entrepÔt trade, the data in Tables 14 and 15provide about 80 percent of the value of goods released from the ware-houses and destined for foreign countries in 1951. For transit trade thepercentage is probably much lower and also represents only a particularkind of merchanting.
Table 14 shows that the sources of the goods for merchanting are the
31

TABLE 13
Purchases by Denmark from Major Middleman Countries of Produce Originating inAreas or Countries Other than Overseas Territories, 1951 and 1952
(millions of dollars)
COUNTRY OF PURCHASEPurchased Country of origin merchandisefrom and purchased from middlemen countries
imported originat-AREA OR from ing in All
COUNTRY country country Nether- middle-ORIGIN of origin of origin U.K. U.S. lands Other men
United States 1951 89.0 80.8 2.8 0.8 4.6 8.21952 71.4 61.7 3.7 1.7 4.3 9.7
Canada 1951 6.5 2.0 0 4.5 0 0 4.51952 11.1 4.4 2.7 3.3 0 0.7 6.7
DollarL.A. 1951 2.7 1.4 0.1 1.0 0.1 0.1 1.31952 1.4 1.2 0.1 0.1 0 0 0.2
NondollarL.A. 1951 43.3 31.2 7.2 1.0 0.4 3.5 12.11952 43.9 32.8 4.3 0.8 0.1 5.9 11.1
Sterling Area 1951 193.7 180.3 11.1 0 0.9 1.4 13.41952 211.2 200.6 7.6 0.4 0.4 2.2 10.6
Nonsterling EPU 1951 430.6 405.7 23.0 0 0.1 1.8 24.91952 451.6 424.3 22.5 0.1 0.8 3.9 27.3
Soviet bloc .1951 80.0 69.2 2.2 0.4 0.4 7.8 10.81952 46.8 37.7 3.0 0 0.1 6.0 9.1
Middle & Far East 1951 29.2 12.5 3.1 0.1 11.1 2.4 16.71952 31.8 11.1 2.4 0 14.4 3.9 20.7
Mainly petroleum 1951 13.1 0.7 8.8 3.6 0 0 12.41952 5.5 1.7 1.1 2.7 0 0 3.8
Other Europe 1951 49.8 48.0 1.4 0 0 0.4 1.81952 33.1 31.2 1.3 0 0.4 0.2 1.9
Total 1951 937.9 831.8 59.7 10.6 13.8 22.0 106.11952 907.8 806.7 48.7 7.4 17.9 27.1 101.1
Source: Foreign Trade of Denmark, 1951 and 1952 (Statistical Department, Copenhagen).
relatively underdeveloped areas of the world and the major destinationsare the highly developed industrial countries. Also, expectedly, the majorsource of the supply for the Netherlands is the Far East, primarilyIndonesia.
Surprisingly, the dollar area was not an important destination forentrepôt trade, practically all of this trade going to Western Europeancountries. In the transit trade, however, exports to the United States werelarge. Of these more than half was coffee, mainly from Brazil, with Indo-
32

TABLE 14
Countries of Provenance and of Destination of Major Commodities Exportedby Netherlands Merchants from Entrepôt and
Transit-with-Transshipment, 1951(millions of dollars)
PROVENANCE DESTINATION
Transit Transitwith with
Entre- trans- Entre- trans-AREA OR COUNTRY pot thiprnent Total pot shipment TotalUnited Kingdom 0.3 1.3 1.6 4.7 16.7 21.4
Sterling O.T.'s 8.5 24.7 33.2 0.6 1.0 1.6Other Europe 0.1 0.1 1.3 1.8 3.1Othersterling 11.1 4.7 15.8 0.1 1.6 1.7
Total sterling 19.9 30.8 50.7 6.7 21.1 27.8
Continental OEECNorthwest 0.9 0.9 73.0 73.0Mediterranean 1.8 2.2 4.0 3.9 18.1 22.0O.T.'s 3.0 10.0 13.0 2.3 2.6 4.9
Total ContinentalOEEC 5.7 12.2 17.9 79.2 20.7 99.9
United States 11.0 3.7 14.7 6.6 46.1 52.7Dollar L.A. 3.5 5.7 9.2 0.5 0.5NondollarL.A. 22.2 28.4 50.6 2.2 2.8 5.0Far East 34.7 43.9 78.6 0.8 1.2 2.0Soviet bloc 0.8 1.5 2.3 1.9 26.3 28.2Other 4.4 1.8 6.2 4.7 9.6 14.3
Total 102.2 128.0 230.2 102.1 128.3 230.4
Source: See note to Table 15.
nesia the second source; 23 percent was rubber, mainly from Indonesia;and about 7 percent was wool, primarily from Iran. Other importantmarkets were engaged as the Netherlands transshipped to the U.K. teafrom Indonesia, hides and skins from non-OEEC Europe, the U.S., OEECEurope, the Middle East, and the Soviet bloc. The transshipments to theSoviet bloc were almost exclusively rubber and tin.
The values of commodities shown in Table 15 substantiate the earlierfindings of a high concentration in more or less refined foods and mate-rials for middleman trade. It should be noted, however, that the unusuallyhigh concentration in a few products, particularly for the transit trade, ispartly the result of the method of selection employed.
In addition to these data on entrepôt and transshipment the processingactivities of the Netherlands should be taken into account. In computingthe balance of payments the Netherlands deducted about $150 million
3.3
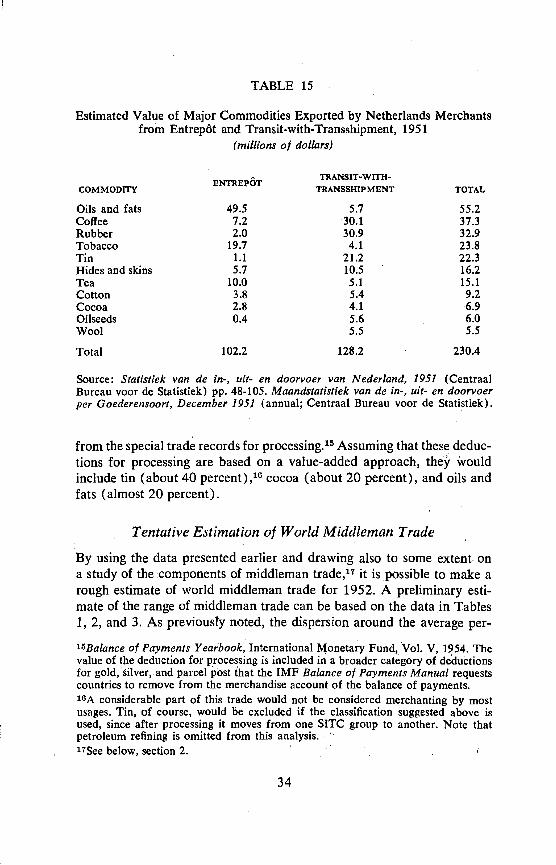
TABLE 15
Estimated Value of Major Commodities Exported by Netherlands Merchantsfrom Entrepôt and Transit-with-Transshipment, 1951
(millions of dollars)
TRANSIT-WITH-COMMODITY
ENTREPOTTRANSSHIPMENT TOTAL
Oils and fats 49.5 5.7 55.2Coffee 7.2 30.1 37.3Rubber 2.0 30.9 32.9Tobacco 19.7 4.1 23.8Tin 1.1 21.2 22.3Hides and skins 5.7 10.5 16.2Tea 10.0 5.1 15.1Cotton 3.8 5.4 9.2Cocoa 2.8 4.1 •6.9Oilseeds 0.4 5.6 6.0Wool 5.5 5.5
Total 102.2 128.2 230.4
Source: Statistiek van de in-, uit- en doorvoer van Nederland, 1951 (CentraalBureau voor de Statistiek) pp. 48-105. Maandstatistiek van de in-, uit- en doorvoerper Goederensoort, December 1951 (annual; Centraal Bureau voor de Statistiek).
from the special trade records for processing.15 Assuming that these deduc-tions for processing are based on a value-added approach, they wouldinclude tin (about 40 percent) cocoa (about 20 percent), and oils andfats (almost 20 percent).
Tentative Estimation of World Middleman Trade
By using the data presented earlier and drawing also to some extent. ona study of the components of middleman trade,'7 it is possible to make arough estimate of world middleman trade for 1952. A preliminary esti-mate of the range of middleman trade can be based on the data in Tables1, 2, and 3. As previously noted, the dispersion around the average per-
l5Balance of Payments Yearbook, International Monetary Fund, Vol. V, 1954. Thevalue of the deduction for processing is included in a broader category of deductionsfor gold, silver,.and parcel post that the IMF Balance of Payments Manual requestscountries to remove from the merchandise account of the. balance of payments.'°A considerable part of this trade would not be considered merchanting by mostusages. Tin, of course, would be excluded if the classification suggested above isused, since after processing it moves from one SITC group to another. Note thatpetroleum refining is omitted from this analysis.'7See below, section 2. .
34

centage of imports purchased by these seven countries from middlemancountries can be partly explained by the concentration of middleman tradein primary and semimanufactured products. Countries with a relativelysmall (great) proportion of manufactured imports have a relatively great(small) proportion of imports from middlemen. If we now compare thecommodity structure of our seven countries with those of the world as awhole for 1953, we find that Germany with 24 percent of her imports inmanufactured goods categories (SITC Sections 5-8) was below the esti-mated world average of 39 percent of imports in manufactured goodscategories (SITC Sections 5-8) ,18 while the other six countries were aboveit (ranging from 50 percent for Yugoslavia to 80 percent for Colombia).Thus, on the basis of commodity composition of imports, it appears thatthe 22 percent (Table 1) of Germany's imports purchased from middle-men is excessive as a measure of world imports purchased from middle-men; and — at the other extreme — the 5 percent of Colombia's importspurchased from middleman countries is low as a measure of world importspurchased from middleman countries. The weighted average of 16 percent(Table 1) for all these countries thus appears reasonable.
However, apart from the crudeness of these calculations, other weak-nesses in the estimate must be kept in mind. The middleman trade ofthese seven countries, unrepresentative of world middleman trade in com-modity composition, is also not typical in other ways. Omission of allmajor middleman countries from the list of final importers probably tendsto give the estimate an upward bias because middleman countries wouldbe less likely to use middleman facilities of other countries in securingtheir imports. Omission of the relatively underdeveloped countries mayalso cause an upward bias because overseas territories tend to buy heavilyfrom their own metropoles (though there is probably a high percentageof middleman trade in the residue). In addition, the highly erratic switchtrade, discussed below,. may have been particularly important . in theimports of Western Europe.
Some of these weaknesses in the above estimate can be reduced bymaking use of the weighted average of imports purchased from middle-men as percentages of total imports classified by areas of origin as shownin Table 9. If we weight the value of exports to the world of each of theseareas of origin by the above percentages, we take into account to someextent the concentration of middleman trade in primary and semimanu-factured products, which is reflected in the higher weights for the under-developed areas. The higher percentages for these regions also reflect inpart the tendency of middlemen trading in O.T. produce to sell to coun-
l8lnternational Trade 1953, Contracting Parties to the General Agreement onTariffs and Trade, Geneva, 1954, Table I, p. 142.
.35

tries other than middleman countries. By using this approach we are alsoable to correct for the probably very slight middleman trade betweencertain countries of origin and final destination. Thus, in calculatingmiddleman trade it seems reasonable to reduce the highly weighted O.T.trade figures by subtracting the O.T. exports to the corresponding metro-poles and the exports of the metropoles to their overseas territories. Ihave also excluded trade between the U.K. and the sterling area, tradebetween the US, and other Western Hemisphere countries, and petro-leum exports to the U.S. and the U.K.
The estimate of total middleman trade obtained by this method is 13.2percent of world trade for 1952, and the proportion of this trade con-tributed by each exporting region is shown in Table 16.
This estimate must be qualified because of three factors (for which wecan provide only rough orders of magnitude) whose net effect is probablyquite small. First, re-exports by Western Europe of own O.T. produceand re-exports by the U.S. of Western Hemisphere produce are clearlynot zero, as assumed in column 2 of Table 16. But the limited availabledata on these transactions indicates that they comprise only a small partof middleman trade. Rough calculations based on U.K. and U.S.re-export data, coupled with substantial allowances for continental OEECre-exports, indicate a downward bias in our estimate that can hardlyexceed 1.5 percent-points.19 A second factor, probably largely offsettingthe first, is the upward bias in our estimate resulting from the inclusion oftrade between neighboring countries. The dispersion around our averageregional weight (lines C of Table 9), particularly for Colombia, appearsto be partly accounted for by relatively low intraregional middleman tradebetween neighboring countries which may be responsible for an upwardbias of 1 to 2 percentage points in our estimate of world middleman trade.Third, there is the special category of middleman transactions resultingfrom postwar foreign aid programs. Thus, the U.S. government has actedat times in middleman capacity by purchasing commodities abroad andtransferring them, as part of its foreign aid, to the country of consump-tion. This type of activity may have formed part of the U.S. offshore paidcommodity shipments under economic assistance programs of the Mutual
'°Total 1952 U.K. re-exports were $403 million, of which overseas territorial pro-duce re-exports, weighted by our regional weights (Table 16), were only $155million. Total 1952 U.S. re-exports plus transshipment of Mexican cotton amountedto $250 million. Thus, with the assumption of a high average regional weight forthese re-exports, the adjustment to our estimate for these two major middlemancountries is less than 0.5 percentage points. And, since the total exports of thecontinental O.T.'s to their own metropoles was only a little over a billion dollarsin 1952, they can hardly add more than 1 percentage point to our estimate of worldmiddleman trade.
36
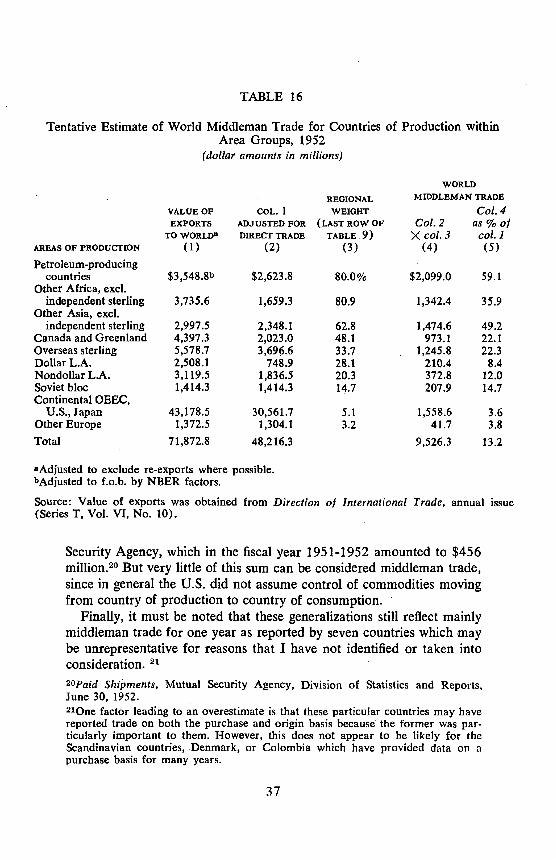
TABLE 16
Tentative Estimate of World Middleman Trade for Countries of Production withinArea Groups, 1952
(dollar amounts in millions)
WORLD
REGIONAL MIDDLEMAN TRADE
VALUE OF COL. 1 WEIGHT Col. 4EXPORTS ADJUSTED FOR (LAST ROW OF Col. 2 as % ot
TO WORLDa DIRECT TRADE TABLE 9) X col. 3 col. 1AREAS OF PRODUCTION (1) (2) (3) (4) (5)Petroleum-producing
countries $3,548.8b $2,623.8 80.0% $2,099.0 59.1Other Africa, exci.
independent sterling 3,735.6 1,659.3 80.9 1,342.4 35.9Other Asia, excl.
independent sterling 2,997.5 2,348.1 62.8 1,474.6 49.2Canada and Greenland 4,397.3 2,023.0 48.1 973.1 22.1Overseas sterling 5,578.7 3,696.6 33.7 1,245.8 22.3Dollar L.A. 2,508.1 748.9 28.1 210.4 8.4NondollarL.A. 3,119.5 1,836.5 20.3 372.8 12.0Soviet bloc 1,414.3 1,414.3 14.7 207.9 14.7Continental OEEC,
U.S., Japan 43,178.5 30,561.7 5.1 1,558.6 3.6Other Europe 1,372.5 1,304.1 3.2 41.7 3.8
Total 71,872.8 48,216.3 9,526.3 13.2
aAdjusted to exclude re-exports where possible.bAdjusted to f.o.b. by NBER factors.
Source: Value of exports was obtained from Direction of International Trade, annual issue(Series T, Vol. VI, No. 10).
Security Agency, which in the fiscal year 195 1-1952 amounted to $456million.20 But very little of this sum can be considered middleman trade,since in general the U.S. did not assume control of commodities movingfrom country of production to country of consumption.
Finally, it must be noted that these generalizations still reflect mainlymiddleman trade for one year as reported by seven countries which maybe unrepresentative for reasons that I have not identified or taken intoconsideration. 21
2OPaid Shipments, Mutual Security Agency, Division of Statistics and Reports,June 30, 1952.210ne factor leading to an overestimate is that these particular countries may havereported trade on both the purchase and origin basis because the former was par-ticularly important to them. However, this does not appear to be likely for theScandinavian countries, Denmark, or Colombia which have provided data on apurchase basis for many years.
37


![Grasping the Bible · 2019. 4. 2. · History of the O.T. [Historians record what happened to the nation of Israel from Conquest to Exile] (Joshua-Nehemiah) 3. Poetry of the O.T](https://img.pdfslide.us/doc/110x75/60067042bae246165e7b417f/grasping-the-2019-4-2-history-of-the-ot-historians-record-what-happened.jpg)