Embed Size (px)
Citation preview


ii
This page is intentionally blank.

iii
IRRIGATION FOR SMALL FARMS
Author
Dana Porter, Ph.D., P.E.
Associate Professor and Extension Specialist – Agricultural Engineering
Texas AgriLife Research and Extension Service Department of Biological and Agricultural Engineering
Texas A&M System
Acknowledgements
This resource is made available through efforts in support of Texas Water Development Board
Contract #1003581100, “Youth Education on Rainwater Harvesting and Agricultural Irrigation Training for Small Acreage Landowners” and through partial funding support from the
USDA-ARS Ogallala Aquifer Program.
Special thanks are extended to Brent Clayton, Extension Program Specialist, Department of Biological and Agricultural Engineering, for his dedicated and capable assistance in project
management; to Justin Mechell, former Extension Program Specialist, Department of Biological and Agricultural Engineering, for his assistance in project management and
contributions to this publication; to Thomas Marek, P.E., Senior Research Engineer, Texas AgriLife Research, for his technical review; and to Dr. Patrick Porter, Extension
Entomologist/Integrated Pest Management Specialist, Texas AgriLife Extension Service, for his editorial assistance

iv
This page is intentionally blank.

v
CONTENTS
1. Introduction………………………………………………………….……….………….. 1 2. Irrigation Options: Technologies and Methods…………………………….……...… 3 3. Crop Water Requirements …………………………………………….……….…… 19 4. Soil Moisture Management………………………………………..………….……… 31 5. Water Sources and Water Quality…………………………………..……….……… 37 6. Irrigation Best Management Practices……………………………………….……… 51
Educational programs of Texas AgriLife Extension Service are open to all people without regard to race, color, sex, disability, religion, age, or national origin.

vi
This page is intentionally blank.

1
1. INTRODUCTION Water is often a limiting factor in crop production systems, where constraints may be primarily physical (water resource availability, capacity or quality); economic (costs of equipment and operation vs. economic benefit); or operational (management and labor capabilities). Where rainfall is insufficient to meet in-season crop water needs, irrigation is an important risk management tool, improving crop yields and quality. Selection of irrigation technologies and management strategies involves considering suitability or adaptability of a technology or practice to a specific operation. This involves site-specific conditions (field shape and size, topography, soil conditions, crops grown, water source) and operational considerations (labor availability, management requirements, producer preferences). Adoption of irrigation technologies and best management practices is supported through access to information and products. The irrigation industry offers a wide array of products and tools. Agricultural research programs have developed technology-specific and crop-specific recommendations for efficient irrigation management. There are many excellent educational and information resources available to support producers in irrigation decisions. This manual provides an overview of crop water requirements, soil moisture management, irrigation water quality issues, and irrigation technologies. It also directs the reader to additional information resources that address specific subject matter in greater detail.

2
This page is intentionally blank.

3
2. IRRIGATION OPTIONS: TECHNOLOGIES AND METHODS Introduction Decisions of whether to invest in irrigation systems, which methods and technologies are applicable to a given operation; and how to manage these tools appropriately warrant careful consideration. The following overview of irrigation technologies and methods presents some more commonly used and commercially available options. Photos, images and mention of manufacturers or products are intended for information only, and not as an endorsement. All irrigation tools and technologies have advantages and disadvantages; most are not universally applicable, but warrant consideration of local (site, crop, soil, energy and water infrastructure, and other) conditions; labor and management capabilities; and cost/benefit factors.\\ Key Points:
1. Surface irrigation generally is less efficient than other irrigation methods, but careful system layout and management can improve irrigation efficiency and uniformity.
2. Sprinkler irrigation includes a range of technologies. High pressure systems require higher energy requirement and are often less efficient than low pressure systems. Portable systems require less capital investment, but more labor than permanent systems.
3. Low pressure center pivot irrigation systems include LEPA, LESA, MESA and LPIC irrigation. All of these can be very efficient with good management.
4. Microirrigation includes surface drip irrigation, subsurface drip irrigation and microspray irrigation. Microirrigation can deliver water very precisely to the target area
2.1. Surface Irrigation Surface irrigation methods, including level basin flooding (figure 2.1) and furrow irrigation (figure 2.2) generally require the lowest capital investment, but can require significant manual labor for effective management. Surface irrigation generally is considered less efficient than other methods due to runoff, deep percolation, and evaporation losses. Practices and options that can improve surface irrigation include land leveling or land grading to improve the uniformity of application over the field; lining of irrigation ditches or use of pipelines to transmit water to the field to limit transmission losses; alternate furrow application to limit wetted surface area (and hence limit evaporation losses); use of berms to prevent runoff or use of tailwater reuse systems to catch and re-apply runoff water; use of shorter row length to reduce required set times and limit deep percolation losses; use of “cut-back” or surge irrigation strategies to limit runoff or deep percolation losses; and use of high volume ditch turn-outs to apply water more quickly and uniformly over the field. These practices are discussed in Rogers (1995) and Yonts (2007).

4
Figure 2.1. Flood irrigation can be conveyed to the field through irrigation district ditch networks (see far left image) or through underground pipelines. As the name infers, the field is flooded with overland flow, which is contained by borders or berms (see below).
Figure 2.2. Furrow irrigation is simple, portable and inexpensive. Labor requirement is high.

5
2.2. Sprinkler Irrigation Sprinkler irrigation methods include a wide range of irrigation technologies and tools. They include fixed (solid set), portable, and self-propelled equipment. Some of the more widely used and commercially available options are described below in general terms. Big gun, traveling gun and hose reel sprinkler systems (figure 2.3) often are used in pastures and turf (farms and sports fields), but they are readily applicable to a variety of crops, fields and operations. Big gun sprinklers use large capacity sprinkler heads and operate at high pressures (90 to 125 psi) to throw water over the field. The head is mounted on a wheeled cart and connected to a flexible or hard-hose wrapped on a trailer-mounted reel (Scherer, 2010). Before an irrigation set, the hose is extended; through the course of the irrigation set, the hose is retracted on the reel, pulling the applicator toward the reel. Many big gun systems have their own power units (or can work from another portable power source, such as a PTO from a tractor) and pumps; they are portable and applicable to irregularly shaped fields and over a range of field sizes. Operation of the big gun requires some hand labor for operation, and the high pressures and long “throw” of the water can make them less energy and water efficient than many other irrigation methods. Because big gun sprinklers use large nozzles, they are less susceptible to clogging than methods using smaller nozzles; hence they can be used to apply water with significant suspended solids (including wastewater) (Mukhtar, 2000). Because they can cover a large area with a single nozzle, they also are used for dust suppression (Mukhtar and Auvermann, 2009).
Figure 2.3. Traveling “big gun” hose reel system on an irrigated pasture.
Solid set and portable fixed-set sprinkler systems (figure 2.4) use sprinklers placed in a regular pattern over the irrigated area. All of the sprinklers may be operated at once, or the crop may be irrigated in zones (alternately irrigating groups of sprinklers connected with common laterals). Solid set sprinkler systems may be permanent, typical for applications in orchards, nurseries, horticultural crops, or lawn/landscape applications, or they may be placed for a season or for a partial season. Permanent systems are connected to permanent (buried) PVC pipelines; temporary systems may be connected to the water source by portable aluminum manifolds or permanent (buried) PVC manifolds (Smajstrla et al. 1997). With these systems, there can be a trade-off between investment cost and labor requirements. Permanent solid systems require design and more hardware (higher initial cost) but less labor than portable systems. Permanent systems also are used for frost protection and crop cooling for high value crops, such as orchards (Evans and Sneed, 1996).

6
Figure 2.4. Solid set sprinkler systems are often used for irrigating small fields. They may also be used for frost-control, dust suppression and other applications.
Side roll irrigation systems. Side roll (wheel line, wheel roll) systems (figure 2.5) are best suited to rectangular fields. These systems use moderate to high pressure (35-60 psi) impact sprinklers distributed along a 4-5 inch diameter lateral pipe that acts as an “axel” for the wheels. Wheels are available in a range of sizes, from 4 to 10 feet in diameter. Because the lateral line must be above the crop canopy, side-roll systems are not appropriate for tall crops. The lateral line is connected by flexible hose to hydrants located in the field. The lateral line is disconnected from the water source and drained between irrigation sets. Side roll systems are stationary during an irrigation set, but moving the system between irrigation sets is facilitated by a small gasoline or diesel power unit located in the center of the system, making it easier (requiring less labor) and faster to move than a hand-move system. They are less efficient and more labor intensive than center pivot or microirrigation systems. Operation and management of side roll system are addressed more thoroughly in Hill (2000) and Scherer (2010).

7
Figure 2.5. Side roll (wheel roll or wheel line) sprinkler irrigation.
Center pivot and linear move sprinkler irrigation systems (figures 2.7 and 2.8) are used widely throughout the High Plains, especially in the Texas High Plains where most of the systems are low pressure center pivot systems. Center pivot irrigation systems include a pipe lateral supported by motor-driven towers that travel around a center pivot point (figure 2.6.a). Water is delivered through nozzles placed along the length of the lateral (figure 2.9). Linear move systems operate very similarly, but travel in a straight line (figure 2.6.b), rather than in a circle. Small fields may be accommodated by using a limited number of lateral spans, but some irrigation manufacturers offer scaled-down mini-pivots specially suited to small farm applications (figures 2.10 and 2.11). It is worth noting that the per-acre capital investment tends to be higher for smaller farms. Still these systems are widely used, are easily automated, and require less labor than most other irrigation options. Ongoing improvements to center pivot and linear move sprinkler irrigation technologies continue to improve automation capabilities and expand applicability to a wider range of field layouts.
Figure 2.6.a. Center pivot systems move in a circular pattern. Water is supplied to the lateral at the pivot point.
Figure 2.6.b. Linear move sprinkler systems move in a straight-line pattern. A flexible hose connects the lateral to the water source.
Figure 2.6. Travel of center pivot and linear move sprinkler irrigation systems. Arrows and dashed lines indicate travel patterns of wheeled towers.

8
Low pressure spray application options Low pressure sprinkler systems are more efficient, requiring lower energy to operate and reducing evaporation losses compared to high pressure systems. Specific applications of low pressure center irrigation include Low Energy Precision Application (LEPA), Low Elevation Spray Application (LESA), Mid-Elevation Spray Application (MESA), and Low Pressure In-Canopy (LPIC). Low Energy Precision Application or LEPA irrigation (figure 2.12) applies as much to a management package as the actual hardware. LEPA irrigation applies water directly to the soil surface through drag hoses (primarily) or through "bubbler" type applicators. By definition, LEPA also involves farming in a circular pattern under center pivot irrigation systems or straight rows under linear irrigation systems. It also includes use of furrow dikes and/or residue management to hold water in place until it can infiltrate into the soil. LEPA irrigation typically is applied to alternate furrows; reducing overall wetted surface area, and hence reducing evaporation losses after an irrigation application. Because a relatively large amount of water is applied to a relatively small surface area, there is risk of runoff losses from LEPA, especially on clay soils and/or sloping fields. Furrow dikes and circular planting patterns help reduce the runoff risk. While very high application efficiencies are achievable with the system, LEPA is not universally applicable; some slopes are too steep for effective application of LEPA irrigation. Some commercially available LEPA applicators are easily adaptable to LESA “spray” mode for chemigation applications or for other spray applications. Low Elevation Spray Application (LESA), Low Pressure In-Canopy (LPIC) and Mid-Elevation Spray Application (MESA) (figures 2.13 and 2.14) describe similar irrigation application systems that include the LEPA technology but do not meet one or more of the criteria to be called LEPA. Strictly interpreted, LESA systems have spray applicators within 18 inches of the ground (USDA-NRCS, 2003), while MESA systems apply water from between five and ten feet above the ground. LPIC systems apply water at a height less than seven feet above ground and discharge water within the crop canopy for a considerable portion during the crop season. Low pressure LESA, LPIC, and MESA spray systems are considered somewhat less efficient than LEPA, primarily due to increased evaporation from a larger wetted soil surface area and potential for evaporation of spray droplets during application. Properly managed, LEPA, LESA, LPIC and MESA can be very efficient. LEPA allows for alternate furrow irrigation, in which alternate dry "traffic" furrows are more accessible for timely field applications. By limiting field operation traffic to the dry furrows, infiltration capacity of soil in the "wet" irrigated furrows is preserved. LEPA also allows for irrigation without foliar wetting. For some crops this can offer reduced foliar disease risk. If water quality (salinity) is an issue, LEPA can reduce risk of salt damage to foliage. In very coarse soils, there sometimes may be insufficient lateral soil water movement from alternate furrow LEPA applications. This is mainly a concern for seed germination, shallow rooted crops and crops (such as peanuts) that require a moist zone near the soil surface. Spray irrigation (LESA, LPIC, MESA) wet the soil surface more uniformly than LEPA. Commonly available nozzles are easily exchanged between LEPA and spray modes, making it possible to apply LESA for crop germination/establishment, then convert to LEPA to take advantage of the higher irrigation application efficiency in season, and convert back to spray applications for chemigation or for uniform wetting of the shallow root zone as needed.

9
Figure 2.7. Self-propelled linear move sprinkler irrigation system equipped with both LEPA drag hoses and LESA spray nozzles for research conducted at the USDA-ARS Conservation and Production Laboratory at Bushland, TX.
Figure 2.8. Center pivot irrigation system with the crop planted in a circular row pattern parallel with the direction of travel of the irrigation system.
Figure 2.9. Center pivot sprinkler irrigation system equipped with mid-elevation spray applicator nozzles. Photo by Justin Mechell.
Figure 2.10. Scaled down two-span mini-pivot sprinkler irrigation system. Photo by Justin Mechell.
Figure 2.11. Four-span mini-pivot sprinkler.

10
Figure 2.12. LEPA irrigation applies water directly to the soil surface in alternate furrows. Crop residue (photo above) or furrow dikes (top left photo) are used to impound the water until it infiltrates into the soil, thus preventing runoff.
Figure 2.13. Mid-Elevation Spray Application (MESA) applies water above the crop canopy.

11
Figure 2.14. LESA irrigation applies water through low pressure sprinkler applicators within 18 inches of the soil surface. Large water droplet sizes and near surface application reduce evaporation losses.
2.3. Microirrigation (surface drip, subsurface drip and microspray irrigation) Microirrigation systems are most often used for high value horticultural crops, nurseries, landscaping, vineyards and similar applications. Microirrigation is easily scalable for small acreages and specialty crops, and there is a wide range of products commercially available. Microirrigation systems typically work at relatively low pressures, so energy requirements are comparable to low pressure center pivot systems. Microirrigation can deliver water very precisely to the target area, and minimizes runoff and evaporation losses. They are easily automated, and they can consist of very simple designs and components (generally for temporary installations) or more elaborate systems for permanent and large-scale applications. Components of subsurface drip irrigation systems are discussed in Rogers et al (2003). Surface Drip Irrigation (figure 2.15) can be used in permanent installations, as is often found in landscaping and vineyards. High quality materials are required to reduce risk of mechanical damage or ultraviolet light damage. Surface drip tape or very shallow subsurface drip tape

12
(figure 2.16) frequently is covered by a mulch to reduce light exposure. Since precipitation of salts in the water is accelerated by high temperatures, mulching also helps reduce precipitate clogging of tape emitters. For temporary surface drip applications, less expensive materials (including thin wall tape products) are more often used.
Figure 2.15. Surface drip irrigation.
Subsurface Drip Irrigation Subsurface drip irrigation (SDI) (figures 2.17 and 2.18) is gaining popularity in production of agronomic “row” crops, especially in areas of limited well capacities and/or small or irregularly shaped fields not well suited to center pivots. Initial cost of SDI is high, but a properly designed and maintained microirrigation system can last more than 20 years. A recommended maintenance program includes adequate filtration (figure 2.21) and maintenance (cleaning) of filters; flushing lines and manifolds; and injecting chemicals (chlorine and/or acid) as necessary to prevent emitter clogging. Specific maintenance requirements depend upon the irrigation system components and water quality; additional information on maintaining SDI systems is included in Enciso, et al. (2004) and Alam, et al. (2002). Frequently cited advantages of SDI include high efficiency and uniformity of water application; precise application of fertigation and chemigation; reduced labor requirement compared to other irrigation technologies; applicability to operations with large or small water capacities and over a range of field sizes, topographic and soil conditions; and ease of automation. Disadvantages include high initial cost; requirement of higher skill level for operation and management; potential problems with emitter clogging, root intrusion, rodent and insect damage to driplines; potential problems with germination of a crop; limited root zone and limited options for deep tillage and deep injection of chemicals that may be needed for pest and disease management.

13
Microspray or microbubbler irrigation uses a separate applicator, either inserted into the tape lateral or connected to the lateral with thin “spaghetti” tubing (Figure 2.20). Microspray irrigation is commonly used in greenhouses, nurseries, landscaping, and similar applications.
Figure 2.16. Shallow Subsurface Drip Irrigation under plastic mulch.
Figure 2.17. Excavation showing placement of Subsurface Drip Irrigation tape.

14
Figure 2.18. Shallow Subsurface Drip Irrigation under onions (left and below) and spinach (right).

15
Figure 2.19. Microirrigation on trellises in a vineyard.
Figure 2.20. Microspray or microbubblers are often used in landscaping and nursery applications.

16
Figure 2.21. Sand media filters (left); hydrocyclone and disk filters (right) remove particulate matter from water to reduce risk of tape or emitter plugging.
References and Information Sources Alam, Mahbub, Todd P. Trooien, Freddie R. Lamm, and Danny H. Rogers. 2002. Filtration and
Maintenance Considerations for Subsurface Drip Irrigation (SDI) Systems. Publication MF-2361. Kansas State University Agricultural Experiment Station and Cooperative Extension Service. Available at: http://www.ksre.ksu.edu/library/ageng2/mf2361.pdf. Accessed 10 January 2012.
Enciso, Juan and Dana Porter. 2005. Basics of Microirrigation. Extension Fact Sheet B-6160. Texas AgriLife Extension Service. College Station, TX. pp.
Enciso, Juan, Dana Porter, Jim Bordovsky, and Guy Fipps. 2004. Maintaining Subsurface Drip Irrigation Systems. Texas AgriLife Extension Service Publication L-5406. Available at: http://lubbocktx.tamu.edu/cottondvd/content/cottondvd/Irrigation/MaintainingSDISystems.pdfAccessed 10 January 2012.
Evans, Robert, and R.E. Sneed. 1996. Selection and Management of Efficient Hand-Move, Solid-Set, and Permanent Sprinkler Irrigation Systems. North Carolina Cooperative Extension Service Publication EBAE-91-152. Available at: http://www.bae.ncsu.edu/programs/extension/evans/ebae-91-152.html. Accessed 16 January 2012.
Hill, Robert W. 2000. Wheelmove Sprinkler Irrigation Operation and Management. Utah State University Cooperative Extension Publication ENGR/BIE/WM/08. Available at: http://extension.usu.edu/files/publications/publication/ENGR_BIE_WM_08.pdf. Accessed 15 February 2012.
Mukhtar, Saqib. 2000. Using Animal Manure and Wastewater for Crops and Pastures. Extension Fact Sheet E-47. Texas AgriLife Extension Service, Texas A&M System, College Station. Available at: tammi.tamu.edu/cropsandpastures.pdf Accessed 14 February 2012.
Mukhtar, Saqib and Brent Auvermann. 2009. Improving the Air Qualityof Animal Feeding Operations with Proper Facility and Manure Management. Extension Fact Sheet E-585. Texas AgriLife Extension Service, Texas A&M System, College Station. Available at: tammi.tamu.edu/improvingAQ2009pub.pdf. Accessed 14 February 2012.
17
Rogers, Danny H. 1995. Managing Furrow Irrigation Systems. Publication L-913. Kansas State University Agricultural Experiment Station and Cooperative Extension Service. Available at: http://www.ksre.ksu.edu/library/ageng2/L913.PDF. Accessed 10 January 2012.
Rogers, Danny H., Freddie R. Lamm, and Mahbub Alam. 2003. Subsurface Drip Irrigation (SDI) Components: Minimum Requirements. Publication MF-2576. Kansas State University Agricultural Experiment Station and Cooperative Extension Service. Available at: http://www.ksre.ksu.edu/sdi/Reports/2003/mf2576.pdf. Accessed 10 January 2012.
Scherer, Tom. Selecting a Sprinkler Irrigation System. 2010. North Dakota State University Extension Service Publication # AE-91. Available at: http://www.ag.ndsu.edu/waterquality/documents/ae91_Selecting_a_Sprinkler_Irrigation_System.pdf. Accessed 10 January 2012.
Smajstrla, A.G., B.J. Boman, G.A. Clark, D.Z. Haman, D.J. Pitts and F.S. Zazueta. 1997. Field Evaluations of Irrigation Systems: Solid Set or Portable Sprinkler Systems. Bulletin 266. University of Florida Extension. Available at: http://edis.ifas.ufl.edu/ae384. Accessed 16 February 2012.
USDA-NRCS. 2003. Conservation Practice Standard, Irrigation System, Sprinkler, Code 442. Available at: ftp://ftp-fc.sc.egov.usda.gov/NHQ/practice-standards/standards/442.pdf. Accessed 10 January 2012.
Yonts, C. Dean. 2007. Managing Furrow Irrigation Systems, NebGuide Publication G1338. University of Nebraska - Lincoln Extension. Available at: http://www.ianrpubs.unl.edu/epublic/live/g1338/build/g1338.pdf. Accessed 10 January 2012.

18
This page is intentionally blank.
19
3. CROP WATER REQUIREMENTS
Introduction Effective water management provides sufficient moisture available to prevent drought stress in the crop, yet avoids over-watering that can negatively affect crop yield or quality. Some crops are more drought sensitive or drought tolerant than others. Specific irrigation guidelines are provided for some major crops grown in Texas; additional information resources are provided. Key Points:
1. Crop water demand is determined by weather conditions, crop type and growth stage, and other local conditions.
2. Crop-specific irrigation recommendations address seasonal water demand, peak water demand, critical periods for drought stress, and water quality requirements.
3.1 How Plants Use Water Plants need water for photosynthesis. They move water upward from the soil, through roots, xylem, leaf veins, leaf tissue, and eventually through the stomata (pores) on the leaves. This process is called transpiration. Water moves in response to water potential energy gradient. The energy level is higher in the water surrounding the roots and lower in the air space within the spongy parenchyma (porous tissue) of the leaf. Evaporation pulls water molecules away from the film of water coating air spaces within the leaf tissue, outward through the stomata into the atmosphere. Evaporation also results in cooling of the plant. (In effect, the plant functions as its own built-in evaporative cooler.) Water molecules are bound to each other by hydrogen bonds. As water molecules evaporate from the air spaces in the leaf, water from surrounding cells and air spaces is pulled towards this area in response to the resulting suction. The suction is transmitted to water molecules lower in the plant. When water is moved from the soil into the plant, some dissolved nutrients and other elements are transported in the water (soil solution). This is how plants get nutrients from the soil. (It is also a pathway through which some harmful constituents, such as toxic elements or herbicides, enter the plant.) During the day, plants photosynthesize using the solar energy, water, and carbon dioxide (CO2) from the air to make oxygen and carbohydrate. Oxygen is released from plants' leaves through the stomata during the day. Plants also use some oxygen and release CO2 into the air. This process is called respiration. When plants are stressed due to insufficient water availability or excessive evaporation, the guard cells around the stomata lose pressure and effectively restrict the stomatal opening, reducing transpiration water loss (and other gas exchange) through the stomata. A plant that is stressed generally will wilt. Reduced transpiration slows the process of water and nutrient uptake; reduced gas exchange slows photosynthesis. This, in turn of course reduces plant growth and crop yield.

20
3.2 Evapotranspiration Evapotranspiration is a term that describes crop water demand by combining evaporation and transpiration components of crop water demand (figure 3.1). Evaporation is the process through which water is removed from moist soil and wet surfaces (such as dew on leaves). As previously stated, transpiration is the process through which water is drawn up through the plant. Evapotranspiration is affected by crop factors (crop type, growth stage, plant health) and environmental factors (air temperature, solar radiation, humidity, wind). Of course it is also limited to water that is made available to the plant (access to soil moisture in the root zone).
Figure 3.1. Evapotranspiration is crop water demand that encompasses evaporation from the soil and wet surfaces and transpiration of water through plants. (Graphic by Dana Porter)
Estimating Evapotranspiration (ET) Reference crop evapotranspiration, ETo (formerly also referred to as Potential Evapotranspiration - PET), is an estimate of water requirement for a well watered reference crop. This reference crop (grass or alfalfa) is essentially an idealized crop used as a basis for the ET model. Reference ET is calculated by applying climate data (temperature, solar radiation, wind, humidity) in a model (equation). It is helpful to note that reference ET is only an estimate of the water demand for this idealized crop, based upon weather station data at a given location. ET Networks in Texas use an idealized grass reference crop. How is Crop Evapotranspiration calculated? Crop-specific ET is estimated by multiplying the Reference ET by a crop coefficient.
Crop ET = Reference ET x Crop Coefficient

21
The crop coefficient takes into account the crop's water use (at a given growth stage) compared with the reference crop. For instance, seedling corn does not use as much water as the idealized grass reference crop, but during silking the corn can use more water than the grass reference crop. The crop coefficient is understood to follow a pattern (curve) of the general shape shown below. Each crop (wheat, sorghum, etc.) has its own crop coefficient curve, based upon the crop’s growth stage curve. Since crop development is often modeled as a function of number of days after planting or heat unit accumulation, crop coefficient curve models also use days after planting or heat unit accumulation to model growth stages for crop coefficient curves.
Figure 3.2. Generalized crop coefficient curve (after various sources, including Allen et al. 1998).
Reference crop ET model and the crop coefficient curves have been developed from long-term research at various locations. Actual crop water demand can be affected by many factors, including soil moisture available, health of the crop, and likely by plant populations and crop variety traits. These factors are not taken into account by the models. Hence, ET data provided by on-line networks are probably best used as guidelines for irrigation scheduling. The predicted growth stage and estimated water use should be verified with field observations. The actual crop water use likely will be less than the predicted value due to less than optimal field conditions. How is estimated ET used to schedule irrigation? There are a variety of irrigation scheduling methods, models and tools available. Many are essentially based upon a "checkbook" approach: water stored in the soil (in the crop's root zone) is withdrawn by evapotranspiration; water is deposited into the soil through precipitation and irrigation. When soil moisture storage falls below a desired threshold value, irrigation should be applied to restore the moisture. The threshold value may be determined by crop drought sensitivity, by irrigation system capabilities, or other farm-level criteria. 3.3 Irrigation Management for Selected Crops Important considerations in managing irrigation are seasonal water requirement (how much total water does the crop need?); peak water demand (how much water is needed during the crop’s highest water use period?); sensitivity to drought stress (or even waterlogging stress);

22
critical growth stages during which the crop is most susceptible to drought stress; and water quality requirements (crop sensitivity to salinity or potentially toxic levels of salts or nutrients that may be in the water.) Much of this information is available in crop production guides available from Texas AgriLife Extension Service and from commodity organizations. Water management information for selected crops is summarized below. The reader is encouraged to consult with local crop production guides for more specific water management recommendations, as well as recommendations for nutrient management, Integrated Pest Management, variety selection, and other key production management decisions. 3.3.1 Irrigation Management for Corn Production Corn is a relatively high water use and drought-sensitive crop. Seasonal water use for corn in the Texas High Plains is approximately 28 to 36 inches per season. Peak water use begins a few days before tasseling (concurrent with maximum leaf area index); water demand begins to decline about midway through the grain-fill period (dent stage). The most critical period during which water stress will have the greatest effect on yield corresponds with the maximum water demand period, approximately two weeks before and after silking. The general trend of crop water demand during the season is shown in Figure 3.3
Figure 3.3. Approximate corn water demand in the Texas High Plains (Porter et al. 2005).
The root zone depth of corn typically ranges from 2.6 to 5.6 ft, depending upon soil conditions. Roots are generally developed early in the season, and will grow in moist (but not saturated or extremely dry) soil. Like most crops, corn will extract most (70% - 85%) of its water requirement from the top one to two feet of soil, and almost all of its water from the top 3 feet of soil, if water is available. Deep soil moisture is beneficial primarily when the shallow moisture is depleted in high water demand periods. Irrigation capacity to meet peak water demand. Because corn is a drought sensitive crop, irrigation system capacity and soil moisture storage capacity should be considered - especially where rainfall is very limited - in planting and rotation decisions. Drought-stressed corn is more susceptible to some pest infestations (including spider mites) and quality (including aflatoxin) issues. Peak water demand for corn can exceed 0.35 inches per day (6.4 gallons per
23
minute/acre) in some areas of the state. Because soil moisture storage (3 to 6 inches of water in the top 3 ft. of soil) can help meet water requirements during the high demand period, irrigation capacities of 5 to 6 gpm/acre are generally adequate for corn production, provided highly efficient irrigation equipment and management are used. Of course timely rainfall reduces drought stress risk and irrigation requirements. Irrigation water quality: salinity. Corn is moderately sensitive to salinity in soil and irrigation water. Grain yield is adversely affected by irrigation water salinity above 1.1 dS/m electrical conductivity (EC), or soil salinity above 1.7 dS/m EC. A 50% yield reduction is expected with irrigation water EC of 3.9 dS/m. Corn is also moderately sensitive to foliar injury from sodium (tolerance between 230 and 460 ppm) and chloride (tolerance between 350 and 700 ppm) in irrigation water. Spray irrigation applications present a higher risk of foliar damage from marginal quality waters. Periodic excess applications of water (irrigation and/or precipitation) can facilitate leaching of accumulated salts from the root zone.
3.3.2 Irrigation Management for Cotton Production (after: Sansone, et al. 2002.) Cotton is a relatively drought-tolerant and salt-tolerant crop that responds well to irrigation. Cotton can be produced over a range of irrigation levels, from rain-fed (dryland) to full irrigation. Often it is grown under a managed deficit irrigation strategy, wherein an irrigation level targeting less than full irrigation is applied. Cotton water use efficiency is generally higher under managed deficit irrigation than under full irrigation; however excessive water deficit or drought stress at critical growth stages can have a considerable negative impact on yield potential for the crop. Seasonal water use for cotton in the Texas High Plains ranges from approximately 13 inches (dryland) to 27 inches (fully irrigated) per season, with seasonal crop ET demand of 24 to 28 inches. Deficit irrigation management (water applied less than full crop demand) is common practice, often due to limited irrigation water capacities. Peak water use occurs during flowering and boll development (figure 2.4). The most critical period during which water stress will have the greatest effect on yield is early in the season when drought stress can cause square shedding. Excessive irrigation with excess available nitrogen can support excessive vegetative growth, necessitating use of plant growth regulators. In the High Plains (where the crop season is limited in length), over-irrigation late in the season also has been associated with lower lint quality, due to higher numbers of immature “green” bolls at harvest. Pre-Plant, Planting and Stand Establishment. Roots grow in moist soil (not in saturated or dry soil); hence good moisture conditions in the root zone are key to establishment of a good root system early in the season. An extensive root system improves the crop’s access to moisture and nutrients from a larger area of the soil profile. In West Texas, fields are often pre-irrigated because of limited rainfall in the winter and spring. The timing of pre-season irrigation depends on water availability, soil texture, irrigation system capacity and soil drainage. The amount of water applied depends on rooting depth, available moisture-holding capacity and current soil moisture. Because deep percolation and evaporation losses of pre-season applied irrigation can be high, it is recommended that pre-season irrigation be applied just prior to planting. Emergence to First Bloom. From crop emergence to first bloom growth stage, water use increases from less than 1 inch per week at emergence to approximately 2 inches per week at first bloom. The goal is to avoid water stress early in the season and to have a full soil water profile as the plant reaches peak bloom (usually 3 weeks after first bloom).

24
First Bloom to First Open Boll. Water use increases dramatically from first bloom to open boll stages. Estimated crop evapotranspiration can be as high 0.4 inches per day or 2.8 inches per week, generally only for brief periods, depending upon local weather conditions. Soil moisture storage capacity and soil moisture management should be considered to offset temporary irrigation system capacity shortfalls. Once blooming starts, cotton responds better to frequent, low-volume applications of water than to large, less frequent amounts. This strategy also minimizes water stress between rain or irrigation events and increases fruit retention. In West Texas, very few producers have the irrigation capacity to satisfy crop demands (0.3 to 0.4 inches per day). Highly efficient advanced irrigation technologies, including low pressure center pivot irrigation (LEPA-low energy precision application and LESA- low elevation spray application) and subsurface drip irrigation have proven to be excellent tools in these water-limited production systems. Research indicates that cotton responds very well to high-frequency deficit irrigations, even with amounts as low as 0.20 to 0.25 inch applied every 2 days. When irrigation capacities are above 0.2 inch per day, the frequency of irrigation is less critical. First Open Boll to Harvest. At peak bloom, cotton requires about 0.3 inch of water per day. By harvest, the rate will drop considerably, to less than 0.1 inch per day. Ideally dryland fields will have a full profile of moisture at the third week of bloom, followed by timely rain showers. Late applications of excessive water can lead to many problems, including boll rot, late season re-growth, increase in late-season insect pests, added harvest aid input requirements and possible grade reductions from late-season re-growth. In West Texas, furrow irrigation should be terminated before September 1. Sprinkler or drip irrigation should be continued for 1 to 2 weeks after open boll or until 20 percent of the bolls are open. The goal is to provide adequate moisture for the last harvestable bolls to mature.
Figure 3.4. Approximate cotton water demand in the Texas High Plains. (Source: Texas High Plains ET Network.)

25
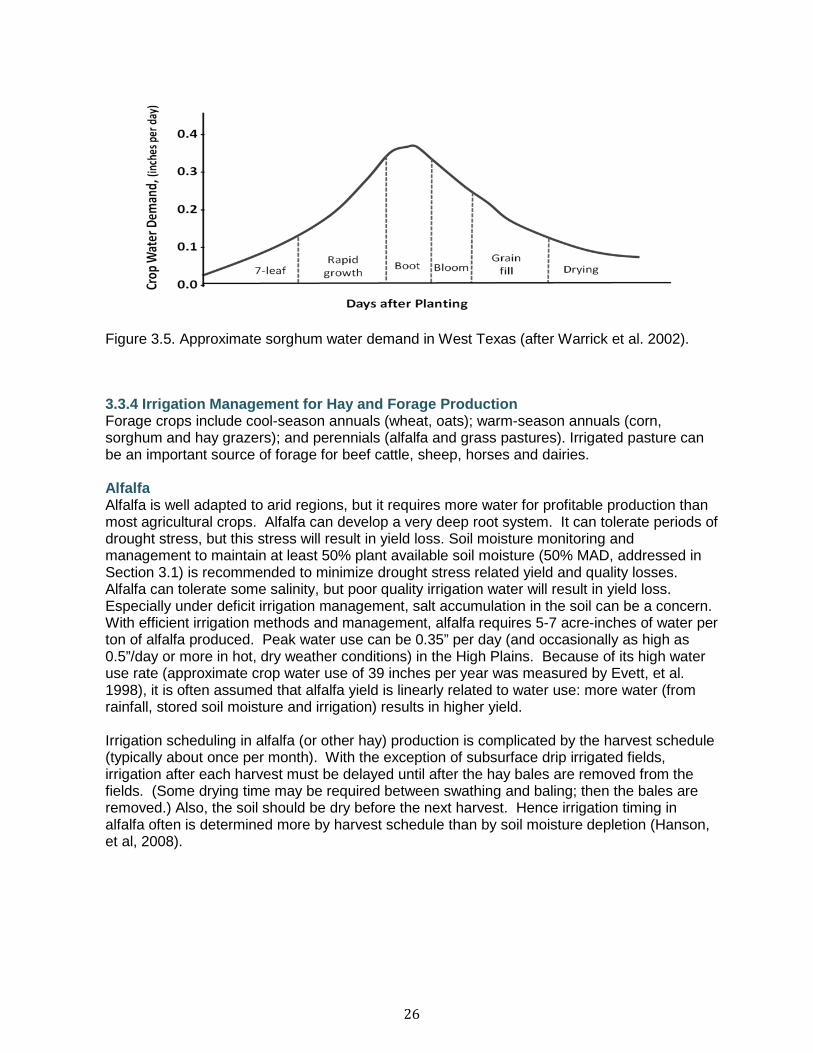
3.3.3 Irrigation Management for Sorghum Production Sorghum is a relatively drought-tolerant crop that can be produced over a range of irrigation levels, from rain-fed (dryland) to deficit to full irrigation. It is often a feed grain of choice where irrigation capacity is limited. Seasonal water use for sorghum in the Texas High Plains is approximately 13 (dryland) to 28+ (fully irrigated) inches per season. Deficit irrigation management (water available is less than crop demand) is common practice, often due to limited irrigation water capacities. Peak water use occurs just before and during boot stage (figure 2.5). Grain sorghum is a tropically adapted plant that can survive under drought and adverse conditions. Because of its ability to survive in unfavorable conditions, sorghum is often produced in poor soils and less intense management. However, profitable sorghum production requires sufficient water at critical points in the crop’s development. Good crop management, including good irrigation management, is key to high yields and profitability. Sorghum can produce an extensive fibrous root system as deep as 5-6 feet, but it generally extracts more than 75 percent of its water and nutrients from the top 3 feet of soil. As moisture is depleted from the top 3 feet, the crop will extract water (if available) from deeper in the root zone. Plants can use about 50 percent of the total available water (50% Management Allowable Depletion) without undergoing stress. Water availability is most critical during the rapid growth stage and before the reproductive stage (figure 3.5). If plant maturity is delayed due to water stress, the crop may face frost damage in the event of an early freeze. Late-season water stress during grain filling can result in shriveled seeds, which reduces yield. Grain sorghum’s peak use begins at approximately initiation of the reproductive stage; this peak can be 0.3 inches per day (or temporarily higher in hot, dry weather conditions). Seasonal water demand for grain sorghum is 24-28 inches (from rainfall, stored soil moisture and irrigation). Grain sorghum has an extensive root system, and its drought tolerance makes it suitable for limited (deficit) irrigation. Irrigation of grain sorghum on sandy soils requires more frequent and smaller irrigation applications than on soils with higher water holding capacity. Center pivot irrigation is an excellent option for irrigating in these conditions. Irrigation scheduling using evapotranspiration or by maintaining a given soil water depletion balance may be especially useful where soils with low water holding capacity and/or restricted root zones present challenges to irrigation management.
26
Figure 3.5. Approximate sorghum water demand in West Texas (after Warrick et al. 2002).
3.3.4 Irrigation Management for Hay and Forage Production Forage crops include cool-season annuals (wheat, oats); warm-season annuals (corn, sorghum and hay grazers); and perennials (alfalfa and grass pastures). Irrigated pasture can be an important source of forage for beef cattle, sheep, horses and dairies. Alfalfa Alfalfa is well adapted to arid regions, but it requires more water for profitable production than most agricultural crops. Alfalfa can develop a very deep root system. It can tolerate periods of drought stress, but this stress will result in yield loss. Soil moisture monitoring and management to maintain at least 50% plant available soil moisture (50% MAD, addressed in Section 3.1) is recommended to minimize drought stress related yield and quality losses. Alfalfa can tolerate some salinity, but poor quality irrigation water will result in yield loss. Especially under deficit irrigation management, salt accumulation in the soil can be a concern. With efficient irrigation methods and management, alfalfa requires 5-7 acre-inches of water per ton of alfalfa produced. Peak water use can be 0.35” per day (and occasionally as high as 0.5”/day or more in hot, dry weather conditions) in the High Plains. Because of its high water use rate (approximate crop water use of 39 inches per year was measured by Evett, et al. 1998), it is often assumed that alfalfa yield is linearly related to water use: more water (from rainfall, stored soil moisture and irrigation) results in higher yield. Irrigation scheduling in alfalfa (or other hay) production is complicated by the harvest schedule (typically about once per month). With the exception of subsurface drip irrigated fields, irrigation after each harvest must be delayed until after the hay bales are removed from the fields. (Some drying time may be required between swathing and baling; then the bales are removed.) Also, the soil should be dry before the next harvest. Hence irrigation timing in alfalfa often is determined more by harvest schedule than by soil moisture depletion (Hanson, et al, 2008).
27
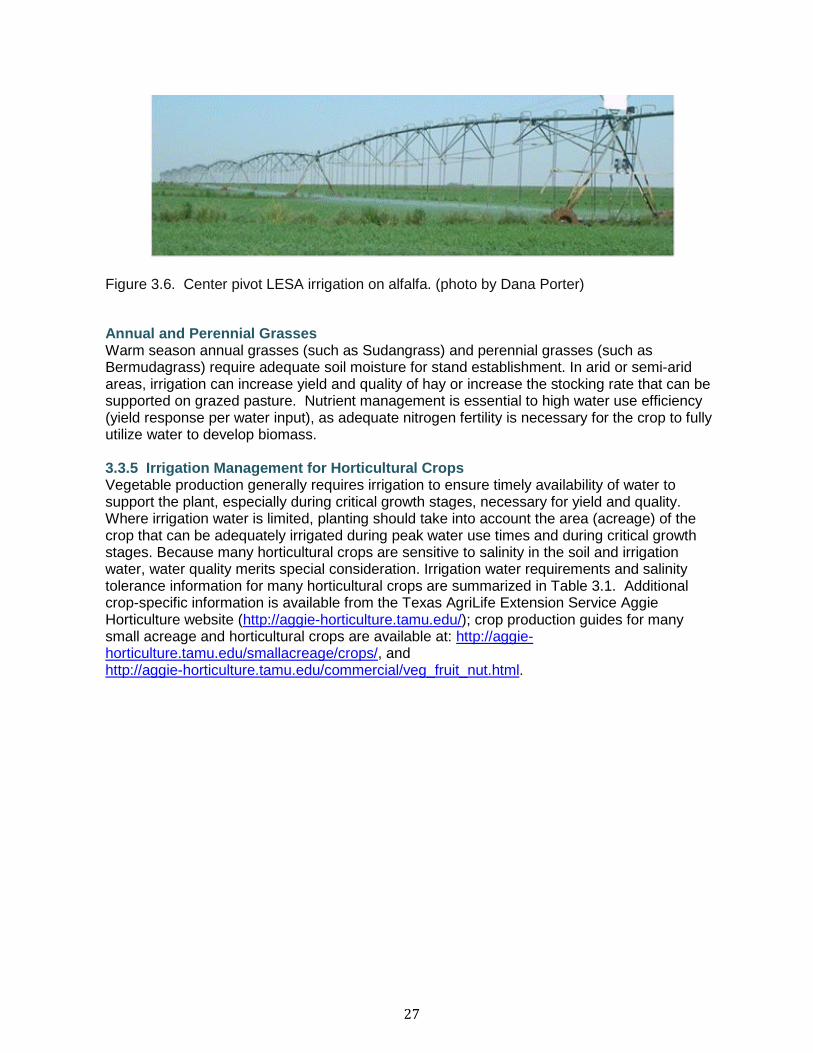
Figure 3.6. Center pivot LESA irrigation on alfalfa. (photo by Dana Porter)
Annual and Perennial Grasses Warm season annual grasses (such as Sudangrass) and perennial grasses (such as Bermudagrass) require adequate soil moisture for stand establishment. In arid or semi-arid areas, irrigation can increase yield and quality of hay or increase the stocking rate that can be supported on grazed pasture. Nutrient management is essential to high water use efficiency (yield response per water input), as adequate nitrogen fertility is necessary for the crop to fully utilize water to develop biomass. 3.3.5 Irrigation Management for Horticultural Crops Vegetable production generally requires irrigation to ensure timely availability of water to support the plant, especially during critical growth stages, necessary for yield and quality. Where irrigation water is limited, planting should take into account the area (acreage) of the crop that can be adequately irrigated during peak water use times and during critical growth stages. Because many horticultural crops are sensitive to salinity in the soil and irrigation water, water quality merits special consideration. Irrigation water requirements and salinity tolerance information for many horticultural crops are summarized in Table 3.1. Additional crop-specific information is available from the Texas AgriLife Extension Service Aggie Horticulture website (http://aggie-horticulture.tamu.edu/); crop production guides for many small acreage and horticultural crops are available at: http://aggie-horticulture.tamu.edu/smallacreage/crops/, and http://aggie-horticulture.tamu.edu/commercial/veg_fruit_nut.html.

28
Table 3.1 Approximate seasonal water requirements, critical drought stress stages and relative salinity tolerance for selected vegetable crops.
Water
Requirement, Inches
Critical Stages for Drought Stress Salinity Tolerance or Sensitivity
Asparagus 10 – 18 Plant development (bush) following harvest Tolerant Bean Green Pinto
10 - 15 15 – 20
Bloom and pod set Bloom and pod set
Sensitive
Beet, table 10 – 15 Establishment and early growth Moderately Tolerant
Broccoli 20 – 25 Transplant and flower bud initiation, heading Moderately Sensitive
Cabbage 20 – 25 Head development Moderately Sensitive Cantaloupe 15 – 20 Vining, pollination and fruit enlargement Moderately Tolerant
Carrot Root enlargement Sensitive
Cauliflower 20 – 25 Transplant and curd development Moderately Sensitive
Cowpea 10 – 20 Bloom, fruit set, pod development Moderately Sensitive Cucumber Pickling Slicing
15 – 20 20 – 25
Fruit enlargement period Moderately Sensitive
Eggplant 20 – 35 Flowering and fruit development Moderately Sensitive
Lettuce 8 – 12 Establishment and head development Moderately Sensitive
Onion 25 – 30 Bulb enlargement Sensitive
Pepper 25 – 35 Vegetable growth (planting to fruit set) Moderately Sensitive
Potato 20 – 40 Tuber set and tuber enlargement Moderately Sensitive
Pumpkin 25 – 30 Establishment; 2-4 weeks after emergence; bloom-fruit set-fruit enlargement Moderately Sensitive
Radish 5 – 6 Rapid growth and development; root enlargement Moderately Sensitive
Spinach 10 -15 Throughout growing season Moderately Sensitive Squash Scallop Zucchini
15 – 20 Uniform throughout growth Moderately Sensitive Moderately Tolerant
Sweet corn 20 – 35 Silking and tasseling, ear development Moderately Sensitive
Tomato 20 – 25 Early flowering, fruit set and enlargement Moderately Sensitive
Turnip 10 – 15 Root enlargement Moderately Sensitive
Watermelon 10 – 15 Uniform until 10 - 14 days prior to harvest Moderately Sensitive References: Masabni, et al. 2011. http://aggie-horticulture.tamu.edu/publications/guides/vegetable-crops/waterrequirements.html Grattan, Stephen R. 2002. http://anrcatalog.ucdavis.edu/pdf/8066.pdf Ayers and Westcot. 1985. http://www.fao.org/DOCREP/003/T0234E/T0234E03.htm

29
References and Other Resources Aggie Horticulture Website, Texas AgriLife Extension Service, College Station, TX. Available
at: http://aggie-horticulture.tamu.edu/; http://aggie-horticulture.tamu.edu/smallacreage/crops/; and http://aggie-horticulture.tamu.edu/commercial/veg_fruit_nut.html. Accessed 16 February 2012.
Allen, Richard G., Luis S. Pereira, Dirk Raes, and Martin Smith. 1998. Crop evapotranspiration - Guidelines for computing crop water requirements - FAO Irrigation and Drainage Paper 56. FAO - Food and Agriculture Organization of the United Nations, Rome. Available at: http://www.fao.org/docrep/X0490E/X0490E00.htm. Accessed 9 May 2011.
Ayers, R.S. and D.W. Westcot. 1985. Water quality for agriculture. FAO Irrigation and Drainage Paper 29 Rev. 1. Food and Agriculture Organization of the United Nations, Rome. Available at: http://www.fao.org/DOCREP/003/T0234E/T0234E00.htm#TOC Accessed 8 June 2011.
Enciso, Juan, Dana Porter, Guy Fipps and Paul Colaizzi. 2004. Irrigation of Forage Crops. Extension Fact Sheet B-6150. Texas AgriLife Extension Service. College Station, TX. Available at: http://gfipps.tamu.edu/Publications&Papers/Extension%20Publications/B-6150.pdf. Accessed 13 May 2011.
Evett, S. R., Howell, T. A., Todd, R. W., Schneider, A. D., and Tolk, J. A. 1998. Evapotranspiration of irrigated alfalfa in a semi-arid environment. ASAE Paper No. 98-2123. Available at: http://www.cprl.ars.usda.gov/swmru-publications.php. Accessed 8 January 2012.
Grattan, Stephen R. 2002. Irrigation Water Salinity and Crop Production. FWQP Reference Sheet 9.10. Publication 8066. University of California Agriculture and Natural Resources. Available at: http://anrcatalog.ucdavis.edu/pdf/8066.pdf. Accessed 8 June 2011.
Hanson, Blaine R., Khaled M. Bali, and Blake L. Sanden. 2008. Irrigating Alfalfa in Arid Regions. University of California Division of Agriculture and Natural Resources Publication 8293. Available at: http://alfalfa.ucdavis.edu/IrrigatedAlfalfa/ Accessed 8 June 2011.
Lemon, Robert, Randy Boman, Jimmy Carroll and Patrick Porter. 2007. 2007 Cotton Resource DVD. Texas AgriLife Research and Extension Center, Lubbock, TX. Available at: http://lubbock.tamu.edu/cottondvd/. Accessed 13 May 2011.
Masabni, Joe, Frank Dainello, and Sam Cotner. 2011. The Texas Vegetable Growers' Handbook. Publication SP_387. Department of Horticultural Sciences, Texas AgriLife Extension Service, College Station, TX 77843-2134. Available at: http://aggie-horticulture.tamu.edu/publications/veghandbook//index.html. Accessed 17 May 2011.
Porter, Patrick, Noel N. Troxclair, Greta Schuster, Dana Porter, Gregory B. Cronholm, Edsel Bynum, Jr., Carl D. Patrick and Steven Davis. 2005. Texas Corn Production Emphasizing Pest Management and Irrigation. Extension Fact Sheet B-6177. Texas AgriLife Extension Service. College Station, TX. September 8, 2005. 72 pp. Available at: http://lubbock.tamu.edu/ipm/AgWeb/2008Publications/B-6177_Corn_IPM_Manual.pdf. Accessed 12 May 2011.
Sansone, C., T. Isakeit, R. Lemon, and B. Warrick. 2002. Texas cotton production: Emphasizing integrated pest management. Texas AgriLife Extension Service, Texas A&M University System, B-6116, 4-02. 72p. Available at: http://lubbock.tamu.edu/cottondvd/content/cottondvd/General%20Production/texascottonproduction/tcpemphipm.html. Accessed 13 May 2011.
Sauls, Julian W. 2008. Citrus Water Management. Texas AgriLife Extension Service, Texas A&M University System. Available at: http://aggie-horticulture.tamu.edu/citrus/water/L2307.htm. Accessed 17 May 2011.
Stein, Larry and George Ray McEachern. Table Grapes: A Potential Alternative Crop. http://winegrapes.tamu.edu/grow/tablegrapes.html

30
Stichler, Charles. 1997. Texas Alfalfa Production. Fact Sheet B-5017. Texas AgriLife Extension Service, Texas A&M University System. Available at: http://lubbock.tamu.edu/othercrops/pdf/alfalfa/txalfalfaprod.pdf. Accessed 22 June 2011.
Stichler, Charles and David Bade. 1996. Forage Bermudagrass: Selection, Establishment and Management. Fact Sheet B-6035. Texas AgriLife Extension Service, Texas A&M University System. Available at: http://lubbock.tamu.edu/othercrops/pdf/forage/foragebermuda.pdf. Accessed 22 June 2011.
Warrick, Billy E., Chris Sansone and Jason Johnson. 2002. Grain Sorghum Production in West Central Texas. Texas AgriLife Research and Extension Center at San Angelo. Available at: http://sanangelo.tamu.edu/programs/agronomy/publications/grain_sorghum/. Accessed 13 May 2011.

31
4. SOIL MOISTURE MANAGEMENT Introduction Soil moisture management is key to optimizing crop production. Plants extract water and nutrients from the soil through roots. A healthy and extensive root system affords the plant greater access to water and nutrients. Roots grow in moist soil; they can be limited by excessively wet or dry soil conditions. The goal of soil moisture management is to provide sufficient available water to prevent drought stress, yet avoid over-watering and hence promote high water use efficiency, crop yield and quality. Key Points: 1. Soil permeability is affected by soil texture, structure, and moisture. 2. Plant available water in the root zone is that which can be stored in the soil between field
capacity and permanent wilting point. Plant available water is soil-specific. 3. Water in soil is subjected to gravity, osmotic potential (suction), and matric (or capillary)
potential (suction). 4. There are several methods available for measuring or estimating soil moisture. These
include gravimetric (oven dry), soil feel and appearance, resistance (gypsum blocks or WaterMark™ sensors), tensiometry, capacitance, and other methods. Factors affecting selection of soil moisture monitoring method include costs, convenience, ease of use, precision and accuracy required, and personal preference of the operator.
4.1 Soil moisture storage capacity Soil moisture characteristics: A soil’s capacity for storing moisture is affected by soil structure and organic matter content, but it is determined primarily by soil texture. Figure 4.1 illustrates plant available soil moisture storage capacities by soil texture. Field capacity is the soil water content after soil has been thoroughly wetted when the drainage rate due to gravity becomes negligible - when all the gravitational water has drained. Field capacity normally is attained 2-3 days after irrigation and is reached when the soil water tension is approximately 0.3 bars (30 kPa or 4.35 psi) in clay or loam soils, or 0.1 bar in sandy soils. Permanent wilting point is the water content below which plants cannot readily obtain water and permanently wilt. This parameter may vary with plant species and soil type but generally is assumed to occur at a soil water tension of 10-20 bars. Hygroscopic water is held tightly on the soil particles (below permanent wilting point) and cannot be extracted by plant roots. Plant available water is retained in the soil between field capacity and the permanent wilting point. It is often expressed as a volumetric percentage or in inches of water per foot of soil depth. Approximate plant available water storage capacities for various soil textures are illustrated in Figure 4.1. Management Allowable Depletion is a management concept that represents a fraction of soil water depletion that will trigger an irrigation application before significant drought stress occurs. For many crops, 50% plant available water depletion (50% MAD) is recommended; for

32
drought sensitive crops, the value will be less than 50% of the soil’s plant available water holding capacity.
Figure 4.1 Available water storage by soil type. (Graphic by Dana Porter) If the goal is to apply water to moisten the root zone to some target level (75% field capacity, for instance, depending upon local factors), it is essential to know how much water the soil will hold at field capacity, and how much water is already in the soil. Estimating soil moisture can be accomplished through direct methods (gravimetric soil moisture determination) or indirect methods. Soil moisture monitoring instruments, including gypsum blocks, tensiometers, and other sensors and tools commercially available provide the means to estimate soil moisture quickly and easily. Alternately, a soil's moisture condition can be assessed by observing its feel and appearance. A soil probe, auger, or spade may be used to extract a small soil sample within each foot of root zone depth. The sample is manually gently squeezed to determine whether the soil will form a ball or cast, and whether it leaves a film of water and/or soil in the hand. Pressing a portion of the sample between the thumb and forefinger allows one to observe whether the soil will form a ribbon. Results of the sample are compared with the guidelines summarized in Table 4.1.

33
Table 4.1. How soil feels and looks at various soil moisture levels Soil moisture level
Fine sand, loamy fine sand
Sandy loam, fine sandy loam
Sandy clay loam, loam, silt loam
Clay loam, clay, silty clay loam
0 - 25% available soil moisture
Appears dry; will not retain shape when disturbed or squeezed in hand.
Appears dry; may make a cast when squeezed in hand but seldom holds together.
Appears dry. Aggregates crumble with applied pressure.
Appears dry. Soil aggregates separate easily, but clods are hard to crumble with applied pressure.
25 - 50% available soil moisture
Slightly moist appearance. Soil may stick together in very weak cast or ball.
Slightly moist. Soil forms weak ball or cast under pressure. Slight staining on finger.
Slightly moist. Forms a weak ball with rough surface. No water staining on fingers.
Slightly moist; forms weak ball when squeezed, but no water stains. Clods break with applied pressure.
50 - 75% available soil moisture
Appears and feels moist. Darkened color. May form weak cast or ball. Leaves wet outline or slight smear on hand.
Appears and feels moist. Color is dark. Forms cast or ball with finger marks. Will leave a smear or stain and leaves wet outline on hand.
Appears and feels moist and pliable. Color is dark. Forms ball and ribbons when squeezed.
Appears moist. Forms smooth ball with defined finger marks; ribbons when squeezed between thumb and forefinger.
75 - 100% available soil moisture
Appears and feels wet. Color is dark. May form weak cast or ball. Leaves wet outline or smear on hand.
Appears and feels wet. Color is dark. Forms cast or ball. Will smear or stain and leaves wet outline on hand; will make weak ribbon.
Appears and feels wet. Color is dark. Forms ball and ribbons when squeezed. Stains and smears. Leaves wet outline on hand.
Appears and feels wet; may feel sticky. Ribbons easily; smears and leaves wet outline on hand. Forms good ball.
After: USDA-NRCS. Estimating Soil Moisture by Feel and Appearance. 1998. United States Department of Agriculture – Natural Resources Conservation Service. Available at: ftp://ftp-fc.sc.egov.usda.gov/MT/www/technical/soilmoist.pdf. Accessed 4 May 2011.
Root zone depth: Roots generally are developed early in the season, and will grow in moist (not saturated or extremely dry) soil. Soil compaction, caliche (calcium carbonate) layers, perched water tables, and other impeding conditions limit the effective rooting depth. Most crops will extract most (70% - 85%) of their water requirement from the top one to two feet of soil, and almost all of their water from the top 3 feet of soil, if water is available. Deep soil moisture is beneficial primarily when the shallow moisture is depleted to a water stress level. Commonly reported effective root zone depths by crop are listed in Table 4.2. Permeability is the ability of the soil to take in water through infiltration. A soil with low permeability cannot take in water as fast as a soil with high permeability; permeability therefore affects the risk for runoff loss of applied water. Permeability is affected by soil texture, structure, and surface condition. Generally speaking, fine textured soils (clays, clay loams) have lower permeability than coarse soils (sand). Surface sealing, compaction, and poor structure (particularly at or near the surface) limit permeability.

34
Table 4.2. Root zone depths reported for various crops.*
Crop Approximate Effective Rooting Depth (feet)
Alfalfa 3.3 – 6.6+ Beans ~ 2.5 Corn 2.6 – 5.6 Cotton 2.6 – 5.6 Peanut 1.6 – 3.3 Sorghum 3.3 – 6.6 Soybeans 3 – 4 Wheat 3 – 6+ Perennial pasture/turf ~ 1-2.5 Orchards ~ 6 Vegetable crops 1 - 3 Root crops (potato, beets) ~ 2-3 Grapes ~ 3+
* Active root zone depths, compiled from various sources. These values represent the majority of feeder roots. Actual root depth will be affected by local soil conditions (texture, structure, moisture).
4.2 Using soil moisture information to improve irrigation efficiency Deep percolation losses are often overlooked, but they can be significant. Water applied in excess of the soil's moisture storage capacity can drain below the crop's effective root zone. In some cases, periodic deep leaching is desirable to remove accumulated salts from the root zone. In most cases, however, deep percolation losses can have a significant negative impact on overall water use efficiency - even under otherwise efficient irrigation practices such as low energy precision application (LEPA) and subsurface drip (SDI) irrigation. Furrow irrigation poses risk of increased deep percolation losses at upper and lower ends of excessively long runs. Surge irrigation can improve irrigation distribution uniformity, and hence reduce deep percolation losses. Coarse soils are particularly vulnerable to deep percolation losses due to their low water holding capacity. Other soils may exhibit preferential flow deep percolation along cracks and in other channels formed under various soil structural and wetting pattern scenarios. Runoff losses occur when water application rate (from irrigation or rainfall) exceeds soil permeability. Sloping fields with low permeability soils are at greatest risk for runoff losses. Vegetative cover, surface conditioning (including furrow dikes), and grade management (land leveling, contouring, or terracing) can reduce runoff losses. Irrigation equipment selection (nozzle packages) and management can also help to minimize runoff losses.

35
4.3 Soil moisture measurement Methods used to measure soil water are classified as direct and indirect. The direct method refers to the gravimetric method in which a soil sample is collected, weighed, oven-dried and weighed again to determine the sample’s water content on a mass percent basis. The gravimetric method is the standard against which the indirect methods are calibrated. Some commonly used indirect methods include electrical resistance, capacitance and tensiometry. Electrical resistance methods include gypsum blocks or granular matrix sensors (more durable and more expensive than gypsum blocks) that are used to measure electrical resistance in a porous medium. Electrical resistance increases as soil moisture decreases. Sensors are placed in the soil root zone, and a meter is connected to lead wires extending above the ground surface for each reading. For most on-farm applications, small portable handheld meters are used; automated readings and controls may be achieved through use of dataloggers. Capacitance sensors measure changes in the dielectric constant of the soil with a capacitor, which consists of two plates of a conductor material separated by a short distance (less than 3⁄8 of an inch). A voltage is applied at one extreme of the plate, and the material that is between the two plates stores some voltage. A meter reads the voltage conducted between the plates. If the plates are separated only by air, the capacitor measures 1 (the dielectric constant of air). Most solid soil components (soil particles), have a dielectric constant between 2 and 4. Water has a much higher dielectric constant of 78. Hence, higher water contents in a capacitance sensor are indicated by higher measured dielectric constants. Changes in the dielectric constant provide an indication of soil water content. Sensors are often left in place in the root zone, and they can be connected to a datalogger for monitoring over time. Tensiometers measure tension of water in the soil (soil suction). A tensiometer consists of a sealed water-filled tube equipped with a vacuum gauge on the upper end and a porous ceramic tip on the lower end. As the soil dries, soil water tension (suction) increases; in response to this increased suction, water is moved from the tensiometer through the porous ceramic tip, creating a vacuum in the sealed tensiometer tube. Water can also move from the soil into the tensiometer during or following irrigation. Most tensiometers have a vacuum gauge graduated from 0 to 100 (centibars, cb, or kilopascals, kPa). A reading of 0 indicates a saturated soil. As the soil dries, the reading on the gauge increases. The useful limit of the tensiometer is about 80 cb. Above this tension, air enters through the ceramic cup and causes the instrument to lose suction. Therefore, these instruments are most useful in sandy soils and with drought-sensitive crops because they have a relatively narrow soil moisture range. Soil water monitoring methods have advantages and limitations. They vary in cost, accuracy, ease of use, and applicability to local conditions (soils, moisture ranges, etc.) Most require calibration for accurate moisture measurement. Proficiency of use and in interpreting information results from practice and experience under given field conditions. References and Resources Enciso, Juan, Dana Porter, and Xavier Peries. 2007. Irrigation Monitoring with Soil Water
Sensors. Extension Fact Sheets B-6194 and B-6194S (Spanish). Texas AgriLife Extension Service. College Station, TX. January 19, 2007 and July 25, 2007. 12 pp. Available at: http://lubbock.tamu.edu/cottondvd/content/cottondvd/Irrigation/SoilWaterSensors.pdf. Accessed 4 May 2011.

36
Porter, Dana. 2003. Crop Production Guide Series: Pre-Plant Irrigation Management. In Focus on Entomology for South Plains Agriculture. Texas AgriLife Extension Service, Lubbock, Texas. April 2003. Available at: http://lubbock.tamu.edu/irrigate/usefulPublications/prePlantIrrigation.pdf. Accessed 27 April 2011.
USDA-NRCS. Estimating Soil Moisture by Feel and Appearance. 1998. United States Department of Agriculture – Natural Resources Conservation Service. Available at: ftp://ftp-fc.sc.egov.usda.gov/MT/www/technical/soilmoist.pdf. Accessed 4 May 2011.

37
5. WATER SOURCES AND WATER QUALITY
Introduction Primary sources of irrigation water include surface water and groundwater. Each water resource has its own water quality concerns, and recommendations to protect water quality depend upon the nature of the water resource and upon the potential sources and pathways of contamination. The water used for irrigation is a potential source of salts and pathogens that can affect or contaminate a crop. Municipal water, wastewater and harvested rainwater are considered alternative water sources for irrigation. Municipal water irrigation use is generally limited to landscaping, turf, and horticultural (nurseries, greenhouses, gardening) applications. Because it is treated to drinking water standards, municipal water poses very little risk as a source of contamination, but special care is necessary to avoid potential contamination of the source through backflow. Harvested rainwater is essentially surface water, so water quality concerns are the same as for other surface water sources. Special precautions are necessary in using wastewater sources due to higher water quality concerns. Key Points:
1. Irrigation water sources include surface water, groundwater and alternative water sources. Water quality considerations depend upon the source and local factors.
2. Water quality considerations for irrigation include protection of water quality, managing salinity, and special concerns to avoid contamination of crops.
5.1 Water Sources 5.1.1 Surface water Surface water is the primary source of irrigation water in the United States. It is also the most likely source of water to be contaminated. The leading cause of pollution in surface water is storm water runoff. Storm water runoff from agricultural and urban landscapes can transport nutrients, sediments, pathogens, pesticides and other dissolved and suspended materials to surface water. A good first step in determining the risk of contamination is to look at the site as a whole and consider all activity in the watershed. A watershed is defined as the land area contributing surface runoff and pollutants to a given point on a stream (ASABE, 2007). Observing activities and land uses in the watershed and how water flows within the watershed can indicate potential contamination sources and risks. To reduce contamination of surface water, land managers can adopt best management practices (BMPs) to control runoff and reduce pollution. Examples of BMPs to protect surface water quality include 1) using terraces and/or filter strips to reduce runoff and remove sediment from runoff water; 2) providing off-stream water and keeping livestock out of streams to reduce sediment, nutrient and potential pathogen load in the stream; and 3) storing, applying and disposing of fuels, agricultural chemicals, and wastes properly. Runoff management is even more critical where activities are concentrated, such as in concentrated animal feeding operations (CAFOs), construction/development sites, areas with

38
large populations of wildlife. Poor management practices can have detrimental effects on quality of surface water and groundwater. Figure 5.1 shows Texas surface water resources affected by bacterial contamination or other impairments.
a. b.
Figure 5.1. a. Bacterial contamination in Texas water bodies, and b. impaired water bodies listed according to Clean Water Act Section 303d. (Source: Texas Commission on Environmental Quality, http://www.tceq.texas.gov/assets/public/gis/docs/303d.pdf) Sampling and analysis of water for all potential contaminants can be very expensive and generally is not necessary. An efficient and cost-effective option for monitoring water quality is through use of indicator tests. For instance, a sample can be analyzed for a specific microorganism, and the results can be used to estimate the populations of other microbes in the water. Common indicator microorganism tests are those for generic E. coli, total coliform, and fecal coliform. These bacteria are easy to test for and are good indicators of the likely presence of other pathogens in the water. Other indicator tests can include nutrients (primarily nitrogen and phosphorus), salts (either EC or TDS) and other contaminants, as deemed appropriate for the given watershed, local sources of contamination and intended use of the water. From the results of these tests, it may be determined whether more extensive testing is warranted. 5.1.2. Groundwater Groundwater makes up about 42 percent of the irrigation water used for U.S. agriculture. Groundwater is less likely to be contaminated than surface water. However, groundwater can still be contaminated if it interacts with other contaminated groundwater or surface water. Risks of groundwater contamination are related to depth of the water table and local hydrogeological conditions. Best management practices (BMPs) can reduce risk of groundwater contamination. Common groundwater contaminants include sediment, dissolved consitituents (including salts) and biological contaminants. Sediment is mostly naturally occurring or it can be increased due to well construction. Sediment is a special concern in microirrigation as it can cause blockage of emitters and tubing, but this risk can be minimized through filtration. Excessive sediment can cause rapid wear on pumps and other irrigation system components. Dissolved constituents, including salts can be naturally occurring or introduced through contamination. Some crops are more tolerant of salts than others. Some salt constituents are more likely to be
39
toxic or cause other problems than others. Biological contaminants may be naturally occurring or introduced; some are mainly nuisances, and others can present health hazards. Wells should be properly maintained and inspected annually to identify and correct problems that can increase risk of contamination. Best management practices (BMPs) to protect groundwater from contamination include: • Direct surface runoff away from wellheads. • Ensure well casings are watertight. A damaged well casing can allow surface runoff to
pollute groundwater. • Observe water well setback distances stipulated by the Texas Administrative Code. Drill
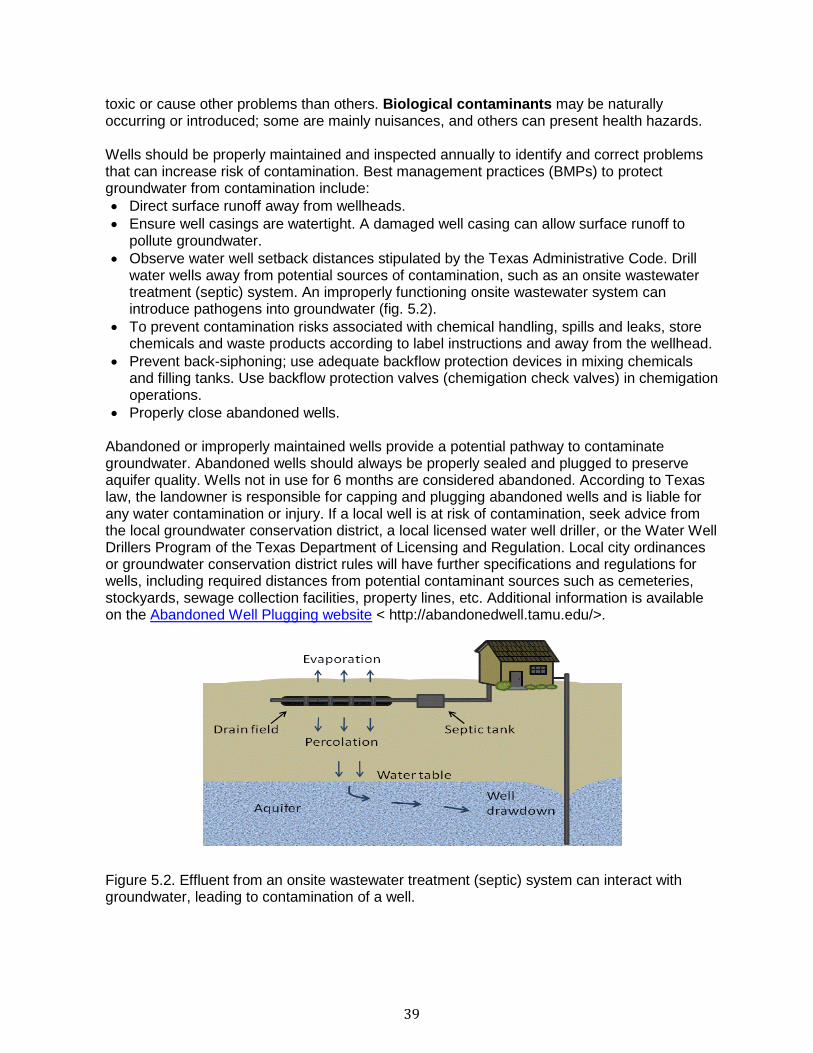
water wells away from potential sources of contamination, such as an onsite wastewater treatment (septic) system. An improperly functioning onsite wastewater system can introduce pathogens into groundwater (fig. 5.2).
• To prevent contamination risks associated with chemical handling, spills and leaks, store chemicals and waste products according to label instructions and away from the wellhead.
• Prevent back-siphoning; use adequate backflow protection devices in mixing chemicals and filling tanks. Use backflow protection valves (chemigation check valves) in chemigation operations.
• Properly close abandoned wells. Abandoned or improperly maintained wells provide a potential pathway to contaminate groundwater. Abandoned wells should always be properly sealed and plugged to preserve aquifer quality. Wells not in use for 6 months are considered abandoned. According to Texas law, the landowner is responsible for capping and plugging abandoned wells and is liable for any water contamination or injury. If a local well is at risk of contamination, seek advice from the local groundwater conservation district, a local licensed water well driller, or the Water Well Drillers Program of the Texas Department of Licensing and Regulation. Local city ordinances or groundwater conservation district rules will have further specifications and regulations for wells, including required distances from potential contaminant sources such as cemeteries, stockyards, sewage collection facilities, property lines, etc. Additional information is available on the Abandoned Well Plugging website < http://abandonedwell.tamu.edu/>.
Figure 5.2. Effluent from an onsite wastewater treatment (septic) system can interact with groundwater, leading to contamination of a well.

40
5.1.3. Alternative Water Resources Alternative water sources include municipal water, harvested rainwater, graywater or wastewater with appropriate treatment. Municipal water sources (and other similar community water systems) are typically potable quality, and pose little risk for irrigation. The main concern is that municipal sources must be properly protected from contamination due to backflow. This is generally accomplished through properly installed backflow prevention valves. Local ordinances address these requirements. Harvesting rainwater for supplemental irrigation of landscapes is becoming more popular, and rainwater harvesting is addressed more completely in other references (including Persyn, et al, 2004; rainwaterharvesting.tamu.edu). Because untreated harvested rainwater is not potable, it is important to label the system with signs conveying that the water is non-potable. Black water includes domestic wastewater generated from toilets, urinals, or food preparation sinks; and graywater includes other water from domestic usage such as the washing machine or showers. Homes can separate black water from graywater and use the graywater to irrigate non-food crops, sending only the black water to the wastewater treatment system (http://ossf.tamu.edu). If a homeowner chooses to re-route graywater from an onsite wastewater treatment system, he or she should consult an onsite wastewater professional to determine potential effects on the onsite wastewater treatment system. To reuse graywater, the homeowner first must decide which graywater sources to collect, as some sources are more likely to present contamination risks. Common graywater system components include (1) collection from residential wastewater from plumbing fixtures and appliances; (2) temporary storage in holding tanks not for treatment; (3) treatment through septic tanks; and (4) dispersal via gravity flow or subsurface irrigation. Additional information on graywater and onsite wastewater treatment options is available on the Texas AgriLife Extension Service Onsite Wastewater Treatment and Reuse website http://ossf.tamu.edu. In systems built before Jan. 6, 2005, graywater from residential clothes washing machines may be discharged onto the ground through a gravity flow system. Graywater should be diverted through settling tanks and pump tanks for treatment and distribution. Generally, graywater should be stored for less than 1 day, especially is if it is to be dispersed onto the ground surface. Texas graywater rules also require that graywater be collected in an approved tank that: is labeled clearly as “non-potable water”, restricts access especially to children, eliminates habitats for mosquitoes and other vectors, can be cleaned, and meets the structural requirements of the current American Water Works Association http://www.awwa.org/ standards. Graywater should be applied underground to minimize potential health risks and odors. Spraying graywater is forbidden. Guidelines can help protect human and environmental health include: • Do not irrigate edible root crops, fruit or vegetables with graywater. • Use graywater for well-established plants rather than for seedlings. • Graywater usually is slightly alkaline, so it may affect soil pH or micronutrient availability. • To prevent salt accumulation, distribute graywater over a large surface area and rotate
distribution from one field to another. • Select reuse applications appropriate for the amount of water to be generated in the
system.

41
Additional information on graywater reuse systems is available in Texas AgriLife Extension Service publications B-6176, Onsite Wastewater Treatment Systems: Graywater, and L-5480, Onsite Wastewater Treatment Systems: Graywater Safety available on the Texas AgriLife Extension Service Onsite Wastewater Treatment and Reuse website <http://ossf.tamu.edu/>. 5.2. Water Quality Implications of Salts One of the most common water quality concerns for irrigated agriculture is salinity. All major irrigation water sources contain dissolved salts. These salts include a variety of natural occurring dissolved minerals, which can vary with location, time, and water source. Many of these mineral salts are micronutrients, having beneficial effects. However, excessive total salt concentration or excessive levels of some potentially toxic elements can have detrimental effects on plant health, crop yield, and/or soil conditions. The term “salinity” is used to describe the concentration of (ionic) salt species, generally including calcium (Ca2+), Magnesium (Mg2+), sodium (Na+), potassium (K+), chloride (Cl-), bicarbonate (HCO3
-), carbonate (CO32-), sulfate
(SO42-), and others (Table 4.1). Types and concentrations of salts vary with water source and
location.
Table 5.1. Salts normally found in irrigation waters. (after: Longenecker and Lyerly, 1994; Fipps, 2003)
Chemical name Chemical symbol Sodium chloride NaCl Sodium sulfate Na2SO4 Calcium chloride CaCl2 Calcium sulfate (gypsum) CaSO4 2H2O Magnesium chloride MgCl2
Magnesium sulfate MgSO4
Potassium chloride KCl Potassium sulfate K2SO4 Sodium bicarbonate NaHCO3
Calcium carbonate CaCO3 Sodium carbonate Na2CO3
Nitrate NO3-
5.2.1. Salinity Hazards and Analysis High salinity in water (or soil solution) causes a high osmotic potential. In simple terms, the salts in solution and in the soil “compete” with the plant for available water. Some salts can have a toxic effect on the plant or can “burn” plant roots and/or foliage. Excessive levels of some minerals may interfere with relative availability and plant uptake of other micronutrients. Soil pH, cation exchange capacity (CEC) and other properties also influence these interactions. High concentrations of sodium in soil can lead to the dispersion of soil aggregates, thereby damaging soil structure and interfering with soil permeability. Hence special consideration of the sodium level or “sodicity” in soils is warranted.

42
Figure 5.3. Foliar damage on peanut due to salinity in irrigation water applied through spray irrigation (right) compared to LEPA irrigation (left) that minimizes leaf wetting.
Figure 5.4. Accumulation of salts at the soil surface under irrigated cotton.
Water and soil testing are essential to determining whether salinity will present a problem for a particular field situation. If wastewater or manure is applied to a field, or if the irrigation water source varies in quality, soil salinity should be monitored regularly for accumulation of salts. Water quality and soil chemical analyses determine which salts are present and the concentrations of these salts. Salinity is expressed in terms of electrical conductivity (EC), in units of millimhos per centimeter (mmhos/cm), micromhos per centimeter (umhos/cm), or deciSiemens per meter (dS/m). The electrical conductivity of a water sample is proportional to the concentration of the dissolved ions in the sample; hence EC is a simple indicator of total salt concentration. Total Dissolved Solids (TDS) is another term frequently used in describing water quality and is a measure of the mass concentration of dissolved constituents in water. TDS is generally reported in units of milligrams per liter (mg/l) or parts per million (ppm). Specific salts reported on a laboratory analysis report are often expressed in terms of mg/l or ppm; these represent mass concentrations of each component in the water sample. Another term used to express mass concentration is normality; units of normality are milligram equivalents per liter (meq/l). Standard laboratory analyses include total salinity reported as electrical conductivity (EC) or as Total Dissolved Solids (TDS). Tables 5.2 and 5.3 include commonly used terms, units, and useful conversion information for understanding water quality analysis reports.

43
Table 5.2. Terms, units, and useful conversions for understanding water quality analysis reports (after: Fipps, 2003; Rogers, et al. 2003).
Water Quality Indicator Units General Interpretation
Total Salinity
Electrical Conductivity, EC
mmhos/cm, µmhos/cm or dS/m 1 dS/m = 1 mmhos/cm = 1000 µmhos/cm
< 0.25 dS/m excellent 0.25 – 0.75 dS/m good 0.75 – 2.0 dS/m permissible 2.0 - 3.0 dS/m caution1 >3.0 dS/m unsuitable2
Total Dissolved Solids, TDS mg/l = ppm
< 175 mg/l excellent 175-525 mg/l good 525 – 1,400 mg/l permissible 1,400 – 2,100 mg/l caution1 >2,100 mg/l unsuitable2
Approximate conversions between EC and TDS For EC < 5 dS/m: TDS (mg/L) = EC (dS/m) x 640 For EC > 5 dS/m: TDS (mg/L) = EC (dS/m) x 800 mg/L = milligrams per liter ppm = parts per million dS/m = deci Siemens per meter at 25°C
Sodium Hazard
Sodium Absorption Ratio, SAR
Calculated ratio of sodium to calcium and magnesium (combined) concentrations
1-9 low risk 10-17 medium risk3 18 – 25 high risk4 > 25 very high risk5
Exchangeable Sodium Percentage, ESP
% saturation by sodium of the soil exchange capacity (exchangeable sodium / CEC)
Plant tolerance to ESP levels 2-10 very sensitive 10-20 sensitive 20-40 moderately tolerant 40 – 60 tolerant 60+ very tolerant
1 Careful management is warranted to avoid excessive salt accumulation in the soil. Leaching is recommended. 2 Good management (leaching and drainage) is necessary. Avoid using on sensitive plants. 3 Amendments (such as gypsum) and leaching should be used to prevent excess sodium accumulation. 4 Generally unsuitable for continuous irrigation use. 5 Generally unsuitable for irrigation.

44
Table 5.3. Water quality (salinity) constituents, conversions and toxicity risks (after: Fipps, 2003; Rogers, et al. 2003; Tanji, et al. 2007).
Constituents Atomic weight
Convert ppm to meq/l multiply by
Convert meq/l to ppm multiply by
Cations Calcium, Ca2+ 40.1 0.050 20 Magnesium, Mg2+ 24.3 0.083 12 Sodium, Na+ 23.0 0.043 23 Potassium, K+ 39.1 0.026 39
Anions Bicarbonate, HCO3
- 61.0 0.016 61 Sulphate, SO4
2- 96.1 0.021 48 Chloride, Cl- 35.5 0.029 35.5 Carbonate, CO3
2- 60.0 0.033 30 Nitrate, NO3
- 62.0 0.016 62
General Risk of Toxicity6
Potential toxicity concerns low medium high Boron – mg/l < 0.7 0.7 – 2.0 > 2 Chloride – meq/l Chloride - mg/l
< 4 < 140
4 – 10 142 - 350
> 10 > 350
Sodium (adjusted SAR) Sodium – mg/l
< 3 < 70
3 – 9 > 70
> 9 - -
6 Relative risk of toxicity depends upon the plant sensitivity and growth stage; method of irrigation; and other factors.
Additional information from soil and water analysis, including concentrations of specific salt components, indicates the relative risk of sodicity and toxicity. High sodium can present a risk of toxicity to plants. It can also indicate a risk of soil aggregate dispersion, which can result in a breakdown of soil structure, and hence reduce the soil’s permeability. Relative risk of soil damage due to sodicity is indicated by the Sodium Adsorption Ratio (SAR), which relates to the relative concentrations of sodium (Na+) compared to the combined concentrations of calcium (Ca++) and magnesium (Mg++). Private soil and water testing laboratories and the Texas AgriLife Extension Service Soil, Water and Forage Testing Laboratory (http://soiltesting.tamu.edu.) can analyze samples for salinity and salinity components (sodium, etc.) for a reasonable fee. Salinity and irrigation Salinity indicates the potential risk of damage to plants. Generally, electrical conductivity (measure of salt content) of a water source should be below 2.0 dS/m for irrigation. Sprinkler irrigation with water of high electrical conductivity (high salinity) will most likely result in foliar damage to crops. General crop tolerances to salinity of irrigation water and soil are listed in Table 5.4. These values should be considered only as guidelines, since crop management, site specific conditions, and crop growth stage can affect salinity tolerance.

45
Table 5.4. Tolerance* of selected crops to salinity in irrigation water and soil (Porter and Marek, 2003).
Crop Threshold EC in irrigation water in mmhos/cm or dS/m
Threshold EC in soil (saturated soil extract) in
mmhos/cm or dS/m
0% yield reduction
50% yield reduction
0% yield reduction
50% yield reduction
Alfalfa 1.3 5.9 2.0 8.8 Barley 5.0 12.0 8.0 18.0 Bermudagrass 4.6 9.8 6.9 14.7 Corn 1.1 3.9 1.7 5.9 Cotton 5.1 12.0 7.7 17.0 Sorghum 2.7 7.2 6.8 11.0 Soybean 3.3 5.0 5.0 7.5 Wheat 4.0 8.7 6.0 13.0 *After Rhoades, et. al. (1992); Fipps (2003) and various sources
5.2.2. Salinity Management Minimize Application of Salts An obvious, if not simple, option to minimize effects of salinity is to minimize irrigation application and the resultant accumulation of salts in the field. This can be accomplished through converting to a rain-fed (dry-land) production system; maximizing effectiveness of precipitation to reduce the amount of irrigation required; adopting highly efficient irrigation and tillage practices to reduce irrigation applications required; and/or using a higher quality irrigation water source (if available). Since some salts are added through fertilizers or as components (or contaminants) of other soil additives, soil fertility testing is warranted to refine nutrient management programs. Crop Selection Some crops and varieties are more tolerant of salinity than others. For instance barley, cotton, rye, and bermudagrass are classified as salt tolerant (a relative term). Wheat, oats, sorghum, and soybean are classified as moderately salt tolerant. Corn, alfalfa, many clovers, and most vegetables are moderately sensitive to salt. Some relatively salt tolerant crops (such as barley and sugarbeet) are more sensitive at emergence and early growth stages than in their later growth stages. Crop breeding programs are working to address salt tolerance for several crops, including small grains and forages. Some field crops are particularly susceptible to particular salts or specific elements or to foliar injury if saline water is applied through sprinkler irrigation methods. Elements of particular concern include sodium (Na), chlorine (Cl), and boron (B). More crop-specific information related to tolerances to salinity Na, Cl, and B are available in Fipps (2003), Rhoades, et al (1992), and other sources. Leaching Leaching is a classical solution to salinity management in the field and is done through flushing accumulated salts below the root zone. This is often accomplished by occasional
46
excessive irrigation applications to dissolve, dilute, and transport the salts. The amount of excess irrigation application required (often referred to as the “leaching fraction”) depends upon the concentrations of salts within the soil and in the water applied to accomplish the leaching. A commonly used equation to estimate leaching fraction requirement (expressed as a percent of irrigation requirement) is: Leaching fraction = EC of irrigation water/ permissible EC in the soil x 100% Where the irrigation water quantity is limited, sufficient water for leaching may not be available. The combined problem of limited water volume and poor water quality can be particularly difficult to manage. Soil additives and field drainage can be used to facilitate the leaching process. Site specific issues (including soil and water chemistry, soil characteristics, and field layout) should be considered in determining the best approach to accomplish effective leaching. For instance, gypsum, sulfur, sulfuric acid, and other sulfur containing compounds, as well as calcium and calcium salts may be used to increase the availability of calcium in soil solution to “displace” sodium adsorbed to soil particles and hence facilitate sodium leaching for remediation of sodic soils. In soils with insufficient internal drainage for salt leaching and removal, mechanical drainage (subsurface drain tiles, ditches, etc.) may be necessary. Local Texas AgriLife Extension Service office or USDA-NRCS field office staff are good resources that should be familiar with specific local soils and salt issues. Irrigation Method Where foliar damage by salts in irrigation water is a concern, irrigation methods that do not wet plant leaves can be very beneficial. Furrow irrigation, low energy precision application (LEPA) irrigation, surface drip irrigation and subsurface drip irrigation (SDI) methods can be very effective in applying irrigation without leaf wetting. Of course, more advanced irrigation technologies (such as LEPA or SDI) also offer greater achievable irrigation application efficiency and distribution uniformity. Further filtration and/or acid injection may be necessary in order to prevent clogging of microirrigation systems due to salts precipitating out of solution. Wetting patterns by different irrigation methods affect patterns of salt accumulation in the seedbed and in the root zone. Evaporation and root uptake of water also affect the salt accumulation patterns. Often the pattern of salt accumulation can be detected by a visible white residue along the side of a furrow, in the bottom of a dry furrow, or on the top of a row. Additional salt accumulations may be located at or near the outer/lower perimeter (outer wetting front) of the irrigated zone in the soil profile. Seedbed and Field Management Strategies In some operations, seed placement can be adapted to avoid planting directly into areas of highest salt accumulation. Row spacing and water movement within the soil can affect the amount of water available for seedlings as well as the amount of water required and available for the dilution of salts. Irrigation Frequency and Timing Light, frequent irrigation applications can result in a limited wetted zone and limited capacity for dilution or leaching of salts. When salt deposits accumulate near the soil surface (due to small irrigation amounts combined with evaporation from the soil surface), crop germination problems and seedling damage are more likely. In arid and semi-arid conditions a smaller

47
wetted zone generally results in a smaller effective root zone; hence the crop is more vulnerable to salt damage and to drought stress injury. Although excessive deep percolation losses of irrigation are discouraged for their obvious reduction in irrigation efficiency and for their potential to contribute to groundwater contamination, occasional large irrigation applications may be required for leaching of salts. Managing irrigation schedules (amounts and timing) to support an extensive root zone helps to keep salt accumulations dispersed and away from plant roots, provides for better root uptake of nutrients, and offers improved protection from short-term drought conditions. Residue Management/ Organic Matter Organic matter offers chemical and physical benefits to mitigate effects of salts. Organic matter can contribute to a higher cation exchange capacity (CEC) and therefore lower the exchangeable sodium percentage, thereby helping to mitigate negative effects of sodium. By improving and preserving soil structure and permeability, organic matter helps to support ready movement of water through the soil and maintain higher water holding capacity of the soil. Where feasible, organic or other mulches also can reduce evaporation from the soil surface, thereby increasing water use efficiency (and possibly lowering irrigation demand). Because some organic mulch materials can contain appreciable salts, sampling and analysis for salt content of these products is recommended. To find out more information about soil sampling contact a local Texas AgriLife Extension Service office or the Soil, Water and Forage Testing Laboratory. Instructions for using this service can be found at http://soiltesting.tamu.edu. Water Quality Implications- Bacteria/Pathogens Water used for irrigation is a potential source of pathogens that can contaminate produce on a farm. Risks of pathogen contamination of water depend on the water source and local potential sources of contamination. Surface water resources are most likely to be contaminated by pathogens, due to natural contamination from wildlife and runoff from other land uses and activities in the watershed. Best management practices to reduce risk include exclusion fences around creeks and providing an off-stream supply of water for livestock or wildlife to reduce fecal contamination in the creek that could end up in irrigation water and proper maintenance of septic systems. Methods and timing of irrigation can help manage risk of contaminating crops. For instance, furrow irrigation and drip irrigation pose less risk of contaminating foliage or fruit than overhead spray irrigation. Timing of irrigation with respect to crop growth stage (especially as harvest approaches) affects risk of contamination of products, as well. Water treatment options The type of treatment used on the water depends on the constituents to be removed and the final water quality desired. Three basic treatment methods used to improve water quality include filtration, adsorption, and disinfection. Filtration removes suspended solids from the water. Depending on the filtration method used, this process may remove microorganisms, clays, silts, iron, manganese, natural organic matter, and by-products from other treatment processes. This process clarifies water and makes UV disinfection more effective. Through adsorption organic contaminants in water are attracted to the surface of a material such as activated carbon. Activated carbon filters with more surface area can capture more

48
contaminants. For producing potable water, the activated carbon filter should be certified by the American National Standards Institute and NSF International (ANSI/NSF certified). A disadvantage of adsorption filters is that they are not primary sanitation devices; use them only in addition to other treatment devices. Disinfection destroys or inactivates harmful organisms in the water. It is often the last step in a multi-stage water treatment system. Of the many methods of disinfection available, the three most common are chlorination, ozonation, and ultraviolet light. Selection of disinfection method depends upon site-specific water characteristics. Additional information on disinfection of water is available from the Texas AgriLife Extension Service On-Site Sewage Facilities website at: http://ossf.tamu.edu/disinfection/ and in TWDB (2005). References and Resources Fipps, Guy. 2003. Irrigation Water Quality Standards and Salinity Management Strategies.
Texas AgriLife Extension Service. Fact Sheet Number B-1667. College Station, TX. Longenecker, D.E. and P.J. Lyerly. 1974. B-876 Control of Soluble Salts in Farming and
Gardening. Texas Agricultural Experiment Station, Texas A&M University System, College Station. June. 36pp.
Melton, Rebecca and Bruce Lesikar. 2008. Onsite Wastewater Treatment Systems: Graywater Safety. Texas AgriLife Extension Service. Fact Sheet Number L-5480. College Station, TX
Melton, Rebecca, Bruce J. Lesikar, David Smith, Courtney O'Neill. 2008. Onsite Wastewater Treatment Systems: Graywater. Texas AgriLife Extension Service. Fact Sheet Number B-6176. College Station, TX.
NSF International./ANSI 55. Ultraviolet Microbiological Water Treatment Systems. 2007. Persyn, Russell, Dana Porter, and Val Silvy. 2004. Rainwater Harvesting: A Viable Option for
Texans. Fact Sheet B-6153. Texas Cooperative Extension. College Station, TX. Porter, Dana and Thomas Marek. 2006. Irrigation management with Saline Water. 2006.
Proceedings of the 2006 Central Plains Irrigation Conference, Colby, KS, February 21-22, 2006.
Rainwater Harvesting Website. Texas AgriLife Extension Service. http://rainwaterharvesting.tamu.edu/
Suslow, Trevor V., Elizabeth A. Bihn, Anusuva Rangaraian, Robert B. Gravani, and Randy Worobo. “Reducing Microbial Risks During Harvest and Post Harvest.” National Good Agricultural Practices Network for Education and Training Educational Materials. Accessed 05Feb10. Accessed at: http://www.gaps.cornell.edu/Educationalmaterials/GAPsCDPPTS/GAPs_Reducing_Microbial_Risks_During_arvest_and_Postharvest.pdf.
Rhoades, J.D., A. Kandiah, and A.M. Mashali. 1992. Use of saline waters for crop production (FAO Irrigation and Drainage Paper 48). Rome: Food and Agriculture Organization of the United Nations. Available at: http://www.fao.org/docrep/T0667E/T0667E00.htm. Accessed 15 December 2011.
Rogers, Danny H., Freddie R. Lamm, and Mahbub Alam. 2003. Subsurface Drip Irrigation Systems (SDI) Water Quality Assessment Guidelines. Irrigation Management Series Publication MF-2575. Kansas State University Agricultural Experiment Station and Cooperative Extension Service.
Tanji, Kenneth K., Larry Rollins, Pat Suyama, and Craig Farris. 2007. Salinity Management Guide. WateReuse Foundation. Alexandria, VA. Available at: http://www.salinitymanagement.org/Salinity%20Management%20Guide/index.html. Accessed 5 May 2011.

49
Texas AgriLife Extension Service On-Site Sewage Facilities website. Available at: http://ossf.tamu.edu/disinfection/. Accessed 16 January 2012.
Texas Commission on Environmental Quality. 2002. Map of 2000 Texas Clean Water Act Section 303(d) – Listed Water Bodies. Available at: http://www.tceq.texas.gov/assets/public/gis/docs/303d.pdf. Accessed 28 April 2011.
Texas Water Development Board. 2005. The Texas Manual on Rainwater Harvesting, 3rd Edition. Available at: http://www.twdb.state.tx.us/publications/reports/rainwaterharvestingmanual_3rdedition.pdf. Accessed 16 January 2012.
Texas Water Development Board. Rainwater Harvesting Resources website. http://www.twdb.state.tx.us/innovativewater/rainwater/resources.asp
USGS. “Irrigation Water Use.” Accessed 05Feb10. <http://ga.water.usgs.gov/edu/wuir.html>. USEPA. 1996. Managing Urban Runoff. Washington D.C. U.S. Environmental Protection
Agency (EPA 841-F-96-004G).

50
This page is intentionally blank.

51
6. IRRIGATION BEST MANAGEMENT PRACTICES
Irrigation technologies, especially advanced irrigation technologies such as low pressure center pivot and microirrigation systems can be excellent tools for applying water efficiently. The benefits of these systems, however, can only be realized with good management. Irrigation system planning and design The decision to adopt a specific technology or to invest in irrigation equipment should take into consideration site-specific conditions, including size and shape of the field; crop(s) to be grown; water source, capacity and quality; labor availability and management capability; access to utilities necessary to operate the system; initial and operating costs, and other factors. A good design by a qualified professional (professional engineer or Certified Irrigation Designer) is especially important for permanent systems such as center pivot or linear move systems or subsurface drip irrigation systems; even relatively simple systems merit design consideration of components (pumps, motors, pipelines, etc.). A good design will include all necessary components, and take into account site-specific conditions, maintenance and operator considerations. Irrigation equipment and system maintenance Proficiency in installation and diligence in maintenance of equipment are very important. A good maintenance program is necessary to avoid costly in-season down time and application inefficiency. Recommendations include monitoring of system pressure and flow, checking sprinkler or LEPA nozzle packages to maximize water distribution uniformity, and using pressure regulators on center pivot or linear irrigation systems applying to sloping fields. Information available to support irrigation management decisions Knowledge of crop water requirements, root zone and soil moisture holding characteristics, water quality and other factors are critical for efficient water management. Goals of soil moisture management are to promote an extensive effective root zone and optimize benefit of precipitation; provide adequate moisture to avoid drought stress without over-watering; take advantage of the soil’s moisture storage capacity to help meet crop water demand during peak water use periods; and schedule limited water resources for the times when they will be most beneficial to the crop. Roots grow in moist soil. Effective root zone depth for many crops may be deeper, but most water uptake occurs in the top 1-3 feet of soil. Caliche layers, dry soil, or other barriers can further limit the effective root zone. Use knowledge of soil water holding capacity and soil moisture monitoring to plan irrigation applications. Frequent light irrigation applications may result in excessive evaporation losses. Irrigation applications that exceed the soil’s water holding capacity can result in runoff losses and/or deep percolation losses. In-season soil moisture monitoring is key to optimizing irrigation management. Crop water demand estimates provided by Evapotranspiration Networks are especially useful in scheduling irrigation to meet in-season crop water requirements. Crop production guides available from Texas AgriLife Extension Service (and Extension services in other states) and other sources address crop-specific water requirements, including seasonal water use, peak water use, critical growth stages (when the crop is more sensitive to drought stress), and water quality considerations.

52
Soil moisture monitoring, using a simple “feel and appearance” method or one of a range of commercially available soil moisture sensors or systems, is fundamental to managing moisture in the root zone. Sensors also are available to monitor plant or crop water stress indicators (canopy temperature, plant water potential). Conservation practices Irrigation is just one source of water for the crop; rainfall stored during the off-season and fully utilized during the crop season improves the overall water use efficiency of the crop. Residue management, mulches, land forming (furrow diking, grading, leveling, terracing), can help to reduce evaporation or runoff losses. Maintaining residue on the soil surface increases water infiltration, reduces erosion, increases organic matter, reduces weed pressure, saves and reduces costs. Integrated crop production management to optimize results within farm-level constraints It is especially worth noting that while water often is the most limiting factor in crop production, especially in arid and semi-arid areas, an integrated cropping system approach addresses nutrient management, crop variety, and Integrated Pest Management, as well as water management. Where irrigation water capacities are limited, selection of drought-tolerant crops or varieties can help mitigate drought-related losses; adjusting planted acres/rotations to match crop water requirements to irrigation capacity, minimizing drought-related risk. Since water is not always the most limiting factor, Integrated Pest Management (IPM) approaches to address insect, weed and disease issues that can negatively impact yield, and effective nutrient (fertilizer) management programs are essential to optimize crop (yield and quality) response. References and Resources Texas Water Development Board Water Conservation Implementation Task Force. 2004. Water Conservation Best Management Practices Guide. Texas Water Development Board Report 362 Available at: http://www.savetexaswater.org/doc/wcitfbmpguide.pdf Texas Water Development Board. Agricultural Water Conservation Management Best Management Practices Overview. Available at: http://www.twdb.state.tx.us/publications/brochures/conservation/doc/AgConsBMPoverview.pdf Texas Water Development Board. Agricultural Water Conservation Irrigation Water Use Management Best Management Practices. Available at: http://www.twdb.state.tx.us/publications/brochures/conservation/doc/AgBrochure2_irrigation.pdf United States Department of Agriculture – Natural Resources Conservation Service. NRCS Home Page. Available at: http://www.nrcs.usda.gov/wps/portal/nrcs/main/national/water/manage/irrigation Water Conservation Advisory Council. 2012. Water Conservation Best Management Practices. Save Texas Water Website. Available at:http://www.savetexaswater.org/bmp/

53
This page is intentionally blank.

54
Educational programs of Texas AgriLife Extension Service are open to all people without regard to race, color, sex, disability, religion, age, or national origin.