Embed Size (px)
Citation preview
Effect of Deficit Furrow Irrigation on Yield and
Water Productivity of Tomato
(Solanum Lycopersicum L.) in Central Rift Valley
Intensive Irrigation System at East Shewa Zone,
Oromia, Ethiopia Lemma Teklu Kumsa
Oromia Agricultural Research Institute, Bako Agricultural Research Center,
P. O. Box 03, Bako, West Shoa, Ethiopia,
Abstract:- This study attempted to evaluate the effects of alternative furrow irrigation (AFI), fixed furrow irrigation (FFI) and
conventional furrow irrigation (CFI) systems on crop yield and water use efficiencies. The general objective were to study the effect of
deficit irrigation on yield and water use efficiency for improved agricultural production, environmental sustainability and water
productivity, with specific objectives of investigating the effect of deficit irrigation under different furrow irrigation systems on yield
and water use efficiency of tomato. A field experiment was designed as a two factor factorial in RCBD; with three time replicate. The
two factors were irrigation systems and water application levels. Irrigation depth was monitored using a Parshall flume of an opening
diameter 3 inch with discharge of 3.532 l/s at a head of 8cm. Results were compared in terms of flow parameters, water use
efficiencies and yield at (P<0.05). Flow parameters had shown that, recession time of AFI system was highly significant from both of
CFI and FFI systems and 100 % ETc from the remaining three application levels and their interaction was significant. For water use
efficiency parameters; the mean results of both crop water use efficiency (CWUE) and field water use efficiency (FWUE) of AFI, FFI
and CFI were 256.69, 214.77 and 130.53 kgha-1mm-1 respectively and showing highly significant difference between them. There were
highly significant differences between the mean results of irrigation systems of AFI and CFI systems on Christian's uniformity
coefficient (UCC), application efficiency (Ea), storage efficiency (Er) and deep percolation losses (Dp) and Water application levels
between 100% ETc and the remaining three application levels on UCC and Er, while for Ea and Dp between 85% ETc and 50% ETc
and their interaction were also highly significant. There was no significant difference between the yield obtained from AFI and CFI,
However, there were highly significant difference between yield of FFI and CFI systems. In view of the results, AFI system is taken as
promising for conservation of water (1232.9m3/ha), time (522:09'15" hours/ha) and costs (187502.00 birr/ha) without negligible trade-
off in yield.
Key words: Deficit Irrigation, Irrigation systems, Water use efficiency and Tomato yield.
INTRODUCTION
Increased agricultural production has become an urgent requirement of the expanding world population (Chen et al., 2011). Yet,
there has been a continued decrease in available fresh water that can be used by agricultural production (Cai and Rosegrant,
2003). As a result, deficit irrigation has been prevalently used in irrigated agriculture. Deficit irrigation can lead to greater
economic gains by maximizing yield per unit of water applied under conditions of scarce water supply and drought, as well as
by increasing of cultivable frequency or irrigable area (Bekele and Tilahun, 2007; Kifle and Gebretsadikan,2016). The
expectation is that, any yield reduction will be insignificant compared with the benefits that are gained from the conservation of
water. But, its effects on yield or harvest quality are crop specific (Costa et al., 2007).
In Ethiopia, most irrigators allocate irrigation water to their field below the maximum crop water requirement for maximum
yield because of the limited water and high level of competition at tail of scheme (Lorite et al., 2007). Most of irrigation in
Ethiopia (97.8%) is done by surface irrigation methods, especially by furrow system in farmer’s fields and majority of the
commercial farms (FAO, 2001; Lemma, 2017). The furrow irrigation systems were includes conventional furrow irrigation
(CFI), fixed furrow irrigation (FFI) and alternative furrow irrigation (AFI). CFI is where every furrow is irrigated during
consecutive watering, is known to be less efficient particularly in areas where there is shortage of irrigation water. The
development towards optimum utilization of irrigation is to irrigate alternate furrows during each irrigation time (Zhang et al.,
2000). By irrigating alternative furrows, half of root is exposed to wet soil condition and the other half is exposed to dry soil
condition. According Hodges et al., 1989 and Graterol et al., 1993, FFI is a means of selection some furrows for irrigation while
other adjacent furrows were not irrigated for the whole season.
Tomato (Solanum lycopersicon L.) is one of the most important irrigated vegetable crops and is one of the most demanding in
terms of water use (Peet, 2005). The application of various deficit irrigation strategies to this crop may significantly led to save
irrigation water (Costa et al., 2007). According to Patane et al. (2011), the adoption of deficit irrigation strategies in which a
50% reduction in ETc was applied for the whole or partial growing season to save water helped to minimize fruit losses and
maintain high fruit quality.
International Journal of Engineering Research & Technology (IJERT)
ISSN: 2278-0181http://www.ijert.org
IJERTV9IS030292(This work is licensed under a Creative Commons Attribution 4.0 International License.)
Published by :
www.ijert.org
Vol. 9 Issue 03, March-2020
323
In the study area, poor rainfall distribution and over application of irrigation water without determining the crop water
requirement were identified as the major problem of a crop failure. Under such existing condition, practicing of deficit irrigation
and water saving methods of furrow irrigation systems could help to increase agricultural production by expanding irrigable
land with the given limited amount of water. Therefore, this study aims with the objectives to evaluate the effect of deficit
irrigation under furrow irrigation methods on yield and water use efficiency of tomato for improved agricultural production,
environmental sustainability and water productivity.
MATERIALS AND METHODS
Study Area Description
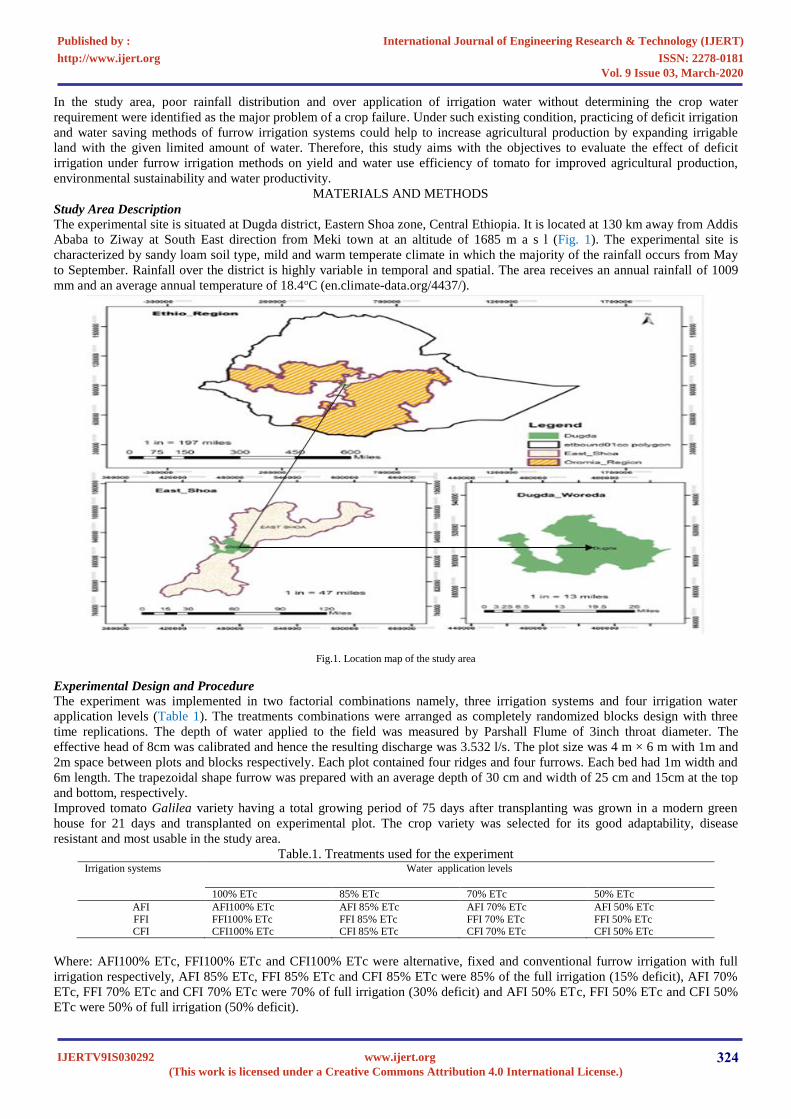
The experimental site is situated at Dugda district, Eastern Shoa zone, Central Ethiopia. It is located at 130 km away from Addis
Ababa to Ziway at South East direction from Meki town at an altitude of 1685 m a s l (Fig. 1). The experimental site is
characterized by sandy loam soil type, mild and warm temperate climate in which the majority of the rainfall occurs from May
to September. Rainfall over the district is highly variable in temporal and spatial. The area receives an annual rainfall of 1009
mm and an average annual temperature of 18.4oC (en.climate-data.org/4437/).
Fig.1. Location map of the study area
Experimental Design and Procedure
The experiment was implemented in two factorial combinations namely, three irrigation systems and four irrigation water
application levels (Table 1). The treatments combinations were arranged as completely randomized blocks design with three
time replications. The depth of water applied to the field was measured by Parshall Flume of 3inch throat diameter. The
effective head of 8cm was calibrated and hence the resulting discharge was 3.532 l/s. The plot size was 4 m × 6 m with 1m and
2m space between plots and blocks respectively. Each plot contained four ridges and four furrows. Each bed had 1m width and
6m length. The trapezoidal shape furrow was prepared with an average depth of 30 cm and width of 25 cm and 15cm at the top
and bottom, respectively.
Improved tomato Galilea variety having a total growing period of 75 days after transplanting was grown in a modern green
house for 21 days and transplanted on experimental plot. The crop variety was selected for its good adaptability, disease
resistant and most usable in the study area.
Table.1. Treatments used for the experiment Irrigation systems Water application levels
100% ETc 85% ETc 70% ETc 50% ETc
AFI AFI100% ETc AFI 85% ETc AFI 70% ETc AFI 50% ETc
FFI FFI100% ETc FFI 85% ETc FFI 70% ETc FFI 50% ETc CFI CFI100% ETc CFI 85% ETc CFI 70% ETc CFI 50% ETc
Where: AFI100% ETc, FFI100% ETc and CFI100% ETc were alternative, fixed and conventional furrow irrigation with full
irrigation respectively, AFI 85% ETc, FFI 85% ETc and CFI 85% ETc were 85% of the full irrigation (15% deficit), AFI 70%
ETc, FFI 70% ETc and CFI 70% ETc were 70% of full irrigation (30% deficit) and AFI 50% ETc, FFI 50% ETc and CFI 50%
ETc were 50% of full irrigation (50% deficit).
International Journal of Engineering Research & Technology (IJERT)
ISSN: 2278-0181http://www.ijert.org
IJERTV9IS030292(This work is licensed under a Creative Commons Attribution 4.0 International License.)
Published by :
www.ijert.org
Vol. 9 Issue 03, March-2020
324
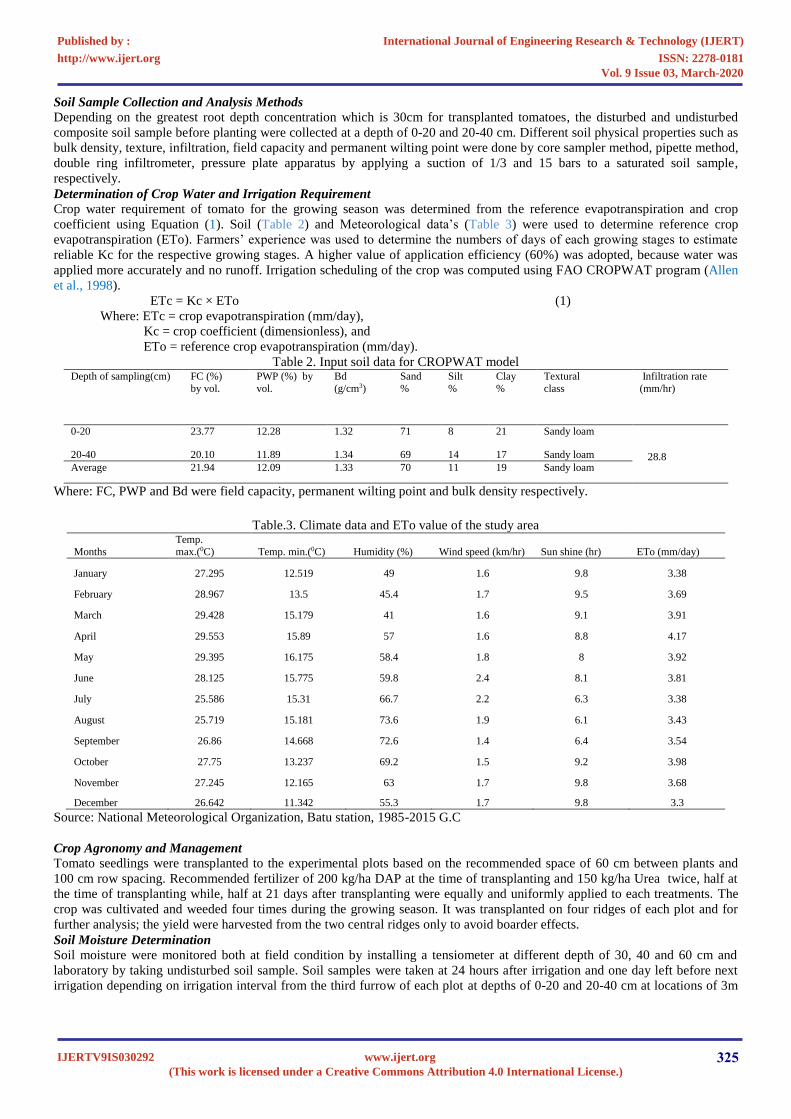
Soil Sample Collection and Analysis Methods
Depending on the greatest root depth concentration which is 30cm for transplanted tomatoes, the disturbed and undisturbed
composite soil sample before planting were collected at a depth of 0-20 and 20-40 cm. Different soil physical properties such as
bulk density, texture, infiltration, field capacity and permanent wilting point were done by core sampler method, pipette method,
double ring infiltrometer, pressure plate apparatus by applying a suction of 1/3 and 15 bars to a saturated soil sample,
respectively.
Determination of Crop Water and Irrigation Requirement
Crop water requirement of tomato for the growing season was determined from the reference evapotranspiration and crop
coefficient using Equation (1). Soil (Table 2) and Meteorological data’s (Table 3) were used to determine reference crop
evapotranspiration (ETo). Farmers’ experience was used to determine the numbers of days of each growing stages to estimate
reliable Kc for the respective growing stages. A higher value of application efficiency (60%) was adopted, because water was
applied more accurately and no runoff. Irrigation scheduling of the crop was computed using FAO CROPWAT program (Allen
et al., 1998).
ETc = Kc × ETo (1)
Where: ETc = crop evapotranspiration (mm/day),
Kc = crop coefficient (dimensionless), and
ETo = reference crop evapotranspiration (mm/day).
Table 2. Input soil data for CROPWAT model Depth of sampling(cm) FC (%)
by vol.
PWP (%) by
vol.
Bd
(g/cm3)
Sand
%
Silt
%
Clay
%
Textural
class
Infiltration rate
(mm/hr)
0-20 23.77 12.28 1.32 71 8 21 Sandy loam
28.8 20-40 20.10 11.89 1.34 69 14 17 Sandy loam
Average 21.94 12.09 1.33 70 11 19 Sandy loam
Where: FC, PWP and Bd were field capacity, permanent wilting point and bulk density respectively.
Table.3. Climate data and ETo value of the study area
Months
Temp.
max.(0C) Temp. min.(0C) Humidity (%) Wind speed (km/hr) Sun shine (hr) ETo (mm/day)
January 27.295 12.519 49 1.6 9.8 3.38
February 28.967 13.5 45.4 1.7 9.5 3.69
March 29.428 15.179 41 1.6 9.1 3.91
April 29.553 15.89 57 1.6 8.8 4.17
May 29.395 16.175 58.4 1.8 8 3.92
June 28.125 15.775 59.8 2.4 8.1 3.81
July 25.586 15.31 66.7 2.2 6.3 3.38
August 25.719 15.181 73.6 1.9 6.1 3.43
September 26.86 14.668 72.6 1.4 6.4 3.54
October 27.75 13.237 69.2 1.5 9.2 3.98
November 27.245 12.165 63 1.7 9.8 3.68
December 26.642 11.342 55.3 1.7 9.8 3.3
Source: National Meteorological Organization, Batu station, 1985-2015 G.C
Crop Agronomy and Management
Tomato seedlings were transplanted to the experimental plots based on the recommended space of 60 cm between plants and
100 cm row spacing. Recommended fertilizer of 200 kg/ha DAP at the time of transplanting and 150 kg/ha Urea twice, half at
the time of transplanting while, half at 21 days after transplanting were equally and uniformly applied to each treatments. The
crop was cultivated and weeded four times during the growing season. It was transplanted on four ridges of each plot and for
further analysis; the yield were harvested from the two central ridges only to avoid boarder effects.
Soil Moisture Determination
Soil moisture were monitored both at field condition by installing a tensiometer at different depth of 30, 40 and 60 cm and
laboratory by taking undisturbed soil sample. Soil samples were taken at 24 hours after irrigation and one day left before next
irrigation depending on irrigation interval from the third furrow of each plot at depths of 0-20 and 20-40 cm at locations of 3m
International Journal of Engineering Research & Technology (IJERT)
ISSN: 2278-0181http://www.ijert.org
IJERTV9IS030292(This work is licensed under a Creative Commons Attribution 4.0 International License.)
Published by :
www.ijert.org
Vol. 9 Issue 03, March-2020
325
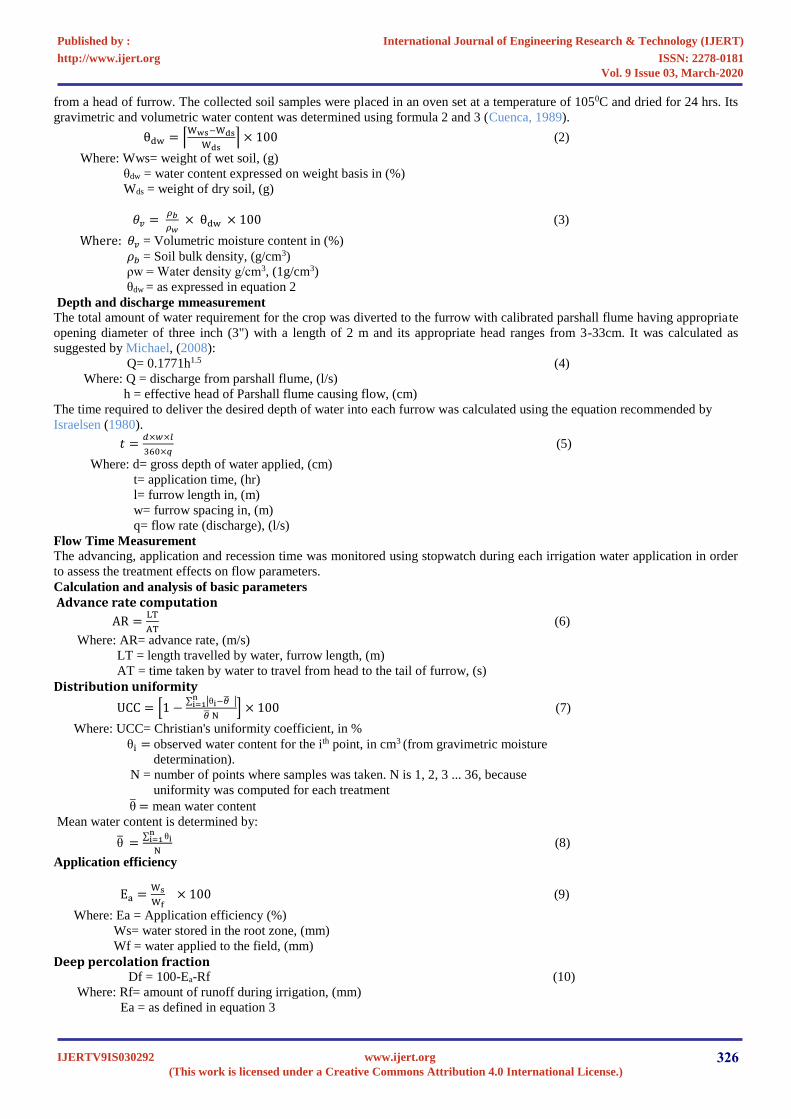
from a head of furrow. The collected soil samples were placed in an oven set at a temperature of 1050C and dried for 24 hrs. Its
gravimetric and volumetric water content was determined using formula 2 and 3 (Cuenca, 1989).
θdw = ⌈Wws−Wds
Wds⌉ × 100 (2)
Where: Wws= weight of wet soil, (g)
θdw = water content expressed on weight basis in (%)
Wds = weight of dry soil, (g)
𝜃𝑣 = 𝜌𝑏
𝜌𝑤 × θdw × 100 (3)
Where: 𝜃𝑣 = Volumetric moisture content in (%)
𝜌𝑏 = Soil bulk density, (g/cm3)
ρw = Water density g/cm3, (1g/cm3)
θdw = as expressed in equation 2
Depth and discharge mmeasurement
The total amount of water requirement for the crop was diverted to the furrow with calibrated parshall flume having appropriate
opening diameter of three inch (3") with a length of 2 m and its appropriate head ranges from 3-33cm. It was calculated as
suggested by Michael, (2008):
Q= 0.1771h1.5 (4)
Where: Q = discharge from parshall flume, (l/s)
h = effective head of Parshall flume causing flow, (cm)
The time required to deliver the desired depth of water into each furrow was calculated using the equation recommended by
Israelsen (1980).
𝑡 =𝑑×𝑤×𝑙
360×𝑞 (5)
Where: d= gross depth of water applied, (cm)
t= application time, (hr)
l= furrow length in, (m)
w= furrow spacing in, (m)
q= flow rate (discharge), (l/s)
Flow Time Measurement
The advancing, application and recession time was monitored using stopwatch during each irrigation water application in order
to assess the treatment effects on flow parameters.
Calculation and analysis of basic parameters
Advance rate computation
AR =LT
AT (6)
Where: AR= advance rate, (m/s)
LT = length travelled by water, furrow length, (m)
AT = time taken by water to travel from head to the tail of furrow, (s)
Distribution uniformity
UCC = [1 −∑ |θi−�̅� |n
i=1
�̅� N] × 100 (7)
Where: UCC= Christian's uniformity coefficient, in %
θi = observed water content for the ith point, in cm3 (from gravimetric moisture
determination).
N = number of points where samples was taken. N is 1, 2, 3 ... 36, because
uniformity was computed for each treatment
θ̅ = mean water content
Mean water content is determined by:
θ̅ =∑ θi
ni=1
N (8)
Application efficiency
Ea =Ws
Wf × 100 (9)
Where: Ea = Application efficiency (%)
Ws= water stored in the root zone, (mm)
Wf = water applied to the field, (mm)
Deep percolation fraction Df = 100-Ea-Rf (10)
Where: Rf= amount of runoff during irrigation, (mm)
Ea = as defined in equation 3
International Journal of Engineering Research & Technology (IJERT)
ISSN: 2278-0181http://www.ijert.org
IJERTV9IS030292(This work is licensed under a Creative Commons Attribution 4.0 International License.)
Published by :
www.ijert.org
Vol. 9 Issue 03, March-2020
326
Df= amount of water deep percolated during irrigation, (mm)
Storage efficiency
𝐸𝑟 =WS
Wn× 100 (11)
Where: Er = storage efficiency (%)
Ws = water stored in the root zone during irrigation, (cm)
Wn = water needed in the root zone prior to irrigation, (cm)
Yield assessments (y) Yield obtained in ton per ha = y × 104 (12)
Where: y = yield obtained per square meter
Water use efficiency Crop water use efficiency
CWUE =y
ETc (13)
Where: CWUE = crop water use efficiency (kg/ha-mm)
Y = yield in Kg ha-1 and
ETc = evapotranspiration (mm)
Field water use efficiency
FWUE =y
Net irrigation (14)
Where: FWUE = field water use efficiency (kg/ha-mm)
Y= yield (ton/ha)
Net irrigation (mm)
Statistical Analysis
The collected data were analyzed using GenStat18th edition, ANOVA and the mean difference was estimated using the least
significance difference (LSD) comparisons.
RESULTS AND DISCUSSIONS
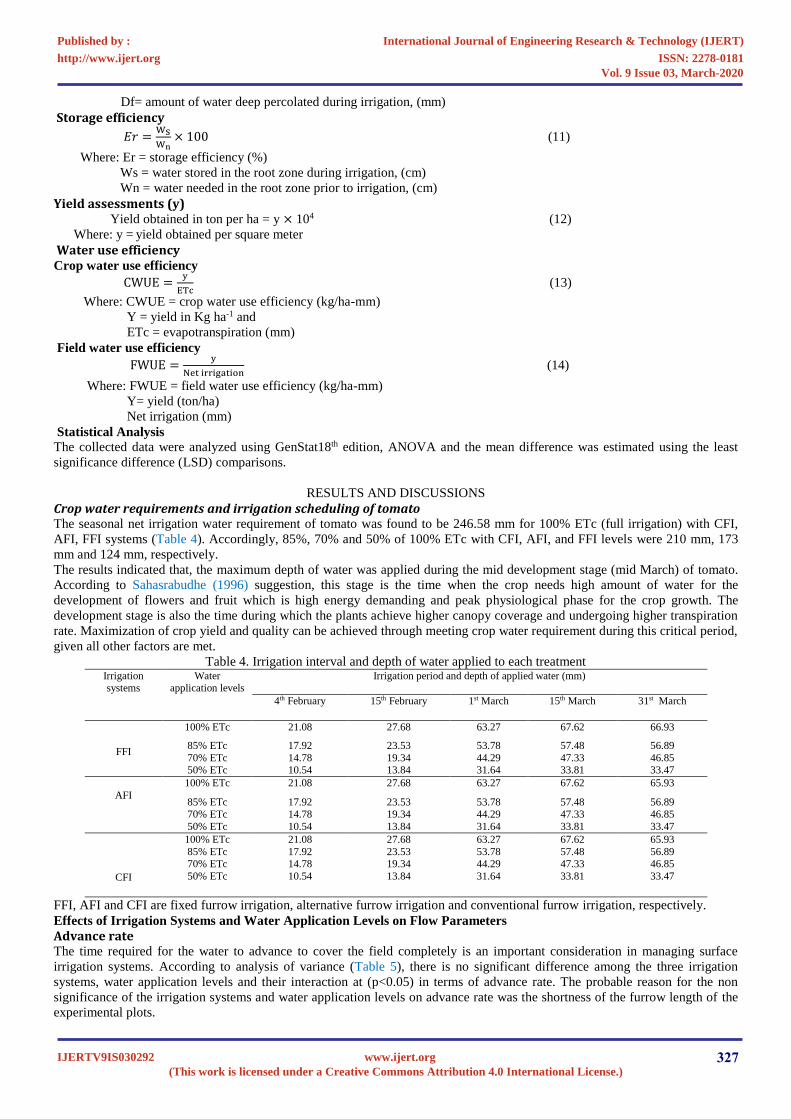
Crop water requirements and irrigation scheduling of tomato The seasonal net irrigation water requirement of tomato was found to be 246.58 mm for 100% ETc (full irrigation) with CFI,
AFI, FFI systems (Table 4). Accordingly, 85%, 70% and 50% of 100% ETc with CFI, AFI, and FFI levels were 210 mm, 173
mm and 124 mm, respectively.
The results indicated that, the maximum depth of water was applied during the mid development stage (mid March) of tomato.
According to Sahasrabudhe (1996) suggestion, this stage is the time when the crop needs high amount of water for the
development of flowers and fruit which is high energy demanding and peak physiological phase for the crop growth. The
development stage is also the time during which the plants achieve higher canopy coverage and undergoing higher transpiration
rate. Maximization of crop yield and quality can be achieved through meeting crop water requirement during this critical period,
given all other factors are met.
Table 4. Irrigation interval and depth of water applied to each treatment Irrigation systems
Water application levels
Irrigation period and depth of applied water (mm)
4th February 15th February 1st March 15th March 31st March
FFI
100% ETc 21.08 27.68 63.27 67.62 66.93
85% ETc 17.92 23.53 53.78 57.48 56.89
70% ETc 14.78 19.34 44.29 47.33 46.85 50% ETc 10.54 13.84 31.64 33.81 33.47
AFI
100% ETc 21.08 27.68 63.27 67.62 65.93
85% ETc 17.92 23.53 53.78 57.48 56.89 70% ETc 14.78 19.34 44.29 47.33 46.85
50% ETc 10.54 13.84 31.64 33.81 33.47
CFI
100% ETc 21.08 27.68 63.27 67.62 65.93
85% ETc 17.92 23.53 53.78 57.48 56.89 70% ETc 14.78 19.34 44.29 47.33 46.85
50% ETc 10.54 13.84 31.64 33.81 33.47
FFI, AFI and CFI are fixed furrow irrigation, alternative furrow irrigation and conventional furrow irrigation, respectively.
Effects of Irrigation Systems and Water Application Levels on Flow Parameters
Advance rate The time required for the water to advance to cover the field completely is an important consideration in managing surface
irrigation systems. According to analysis of variance (Table 5), there is no significant difference among the three irrigation
systems, water application levels and their interaction at (p<0.05) in terms of advance rate. The probable reason for the non
significance of the irrigation systems and water application levels on advance rate was the shortness of the furrow length of the
experimental plots.
International Journal of Engineering Research & Technology (IJERT)
ISSN: 2278-0181http://www.ijert.org
IJERTV9IS030292(This work is licensed under a Creative Commons Attribution 4.0 International License.)
Published by :
www.ijert.org
Vol. 9 Issue 03, March-2020
327
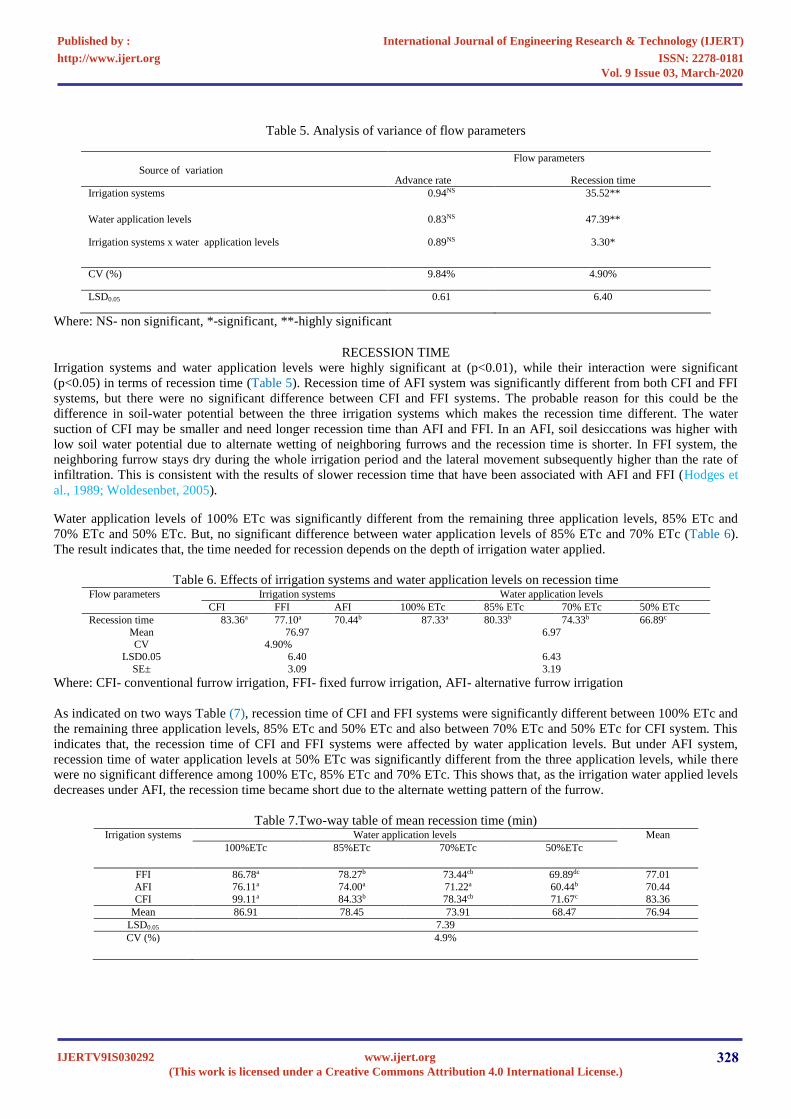
Table 5. Analysis of variance of flow parameters
Source of variation
Flow parameters
Advance rate Recession time
Irrigation systems 0.94NS 35.52**
Water application levels 0.83NS 47.39**
Irrigation systems x water application levels 0.89NS 3.30*
CV (%) 9.84% 4.90%
LSD0.05 0.61 6.40
Where: NS- non significant, *-significant, **-highly significant
RECESSION TIME
Irrigation systems and water application levels were highly significant at (p<0.01), while their interaction were significant
(p<0.05) in terms of recession time (Table 5). Recession time of AFI system was significantly different from both CFI and FFI
systems, but there were no significant difference between CFI and FFI systems. The probable reason for this could be the
difference in soil-water potential between the three irrigation systems which makes the recession time different. The water
suction of CFI may be smaller and need longer recession time than AFI and FFI. In an AFI, soil desiccations was higher with
low soil water potential due to alternate wetting of neighboring furrows and the recession time is shorter. In FFI system, the
neighboring furrow stays dry during the whole irrigation period and the lateral movement subsequently higher than the rate of
infiltration. This is consistent with the results of slower recession time that have been associated with AFI and FFI (Hodges et
al., 1989; Woldesenbet, 2005).
Water application levels of 100% ETc was significantly different from the remaining three application levels, 85% ETc and
70% ETc and 50% ETc. But, no significant difference between water application levels of 85% ETc and 70% ETc (Table 6).
The result indicates that, the time needed for recession depends on the depth of irrigation water applied.
Table 6. Effects of irrigation systems and water application levels on recession time Flow parameters Irrigation systems Water application levels
CFI FFI AFI 100% ETc 85% ETc 70% ETc 50% ETc
Recession time 83.36a 77.10a 70.44b 87.33a 80.33b 74.33b 66.89c
Mean 76.97 6.97 CV 4.90%
LSD0.05 6.40 6.43
SE± 3.09 3.19
Where: CFI- conventional furrow irrigation, FFI- fixed furrow irrigation, AFI- alternative furrow irrigation
As indicated on two ways Table (7), recession time of CFI and FFI systems were significantly different between 100% ETc and
the remaining three application levels, 85% ETc and 50% ETc and also between 70% ETc and 50% ETc for CFI system. This
indicates that, the recession time of CFI and FFI systems were affected by water application levels. But under AFI system,
recession time of water application levels at 50% ETc was significantly different from the three application levels, while there
were no significant difference among 100% ETc, 85% ETc and 70% ETc. This shows that, as the irrigation water applied levels
decreases under AFI, the recession time became short due to the alternate wetting pattern of the furrow.
Table 7.Two-way table of mean recession time (min) Irrigation systems Water application levels Mean
100%ETc 85%ETc 70%ETc 50%ETc
FFI 86.78a 78.27b 73.44cb 69.89dc 77.01
AFI 76.11a 74.00a 71.22a 60.44b 70.44
CFI 99.11a 84.33b 78.34cb 71.67c 83.36
Mean 86.91 78.45 73.91 68.47 76.94
LSD0.05 7.39
CV (%) 4.9%
International Journal of Engineering Research & Technology (IJERT)
ISSN: 2278-0181http://www.ijert.org
IJERTV9IS030292(This work is licensed under a Creative Commons Attribution 4.0 International License.)
Published by :
www.ijert.org
Vol. 9 Issue 03, March-2020
328
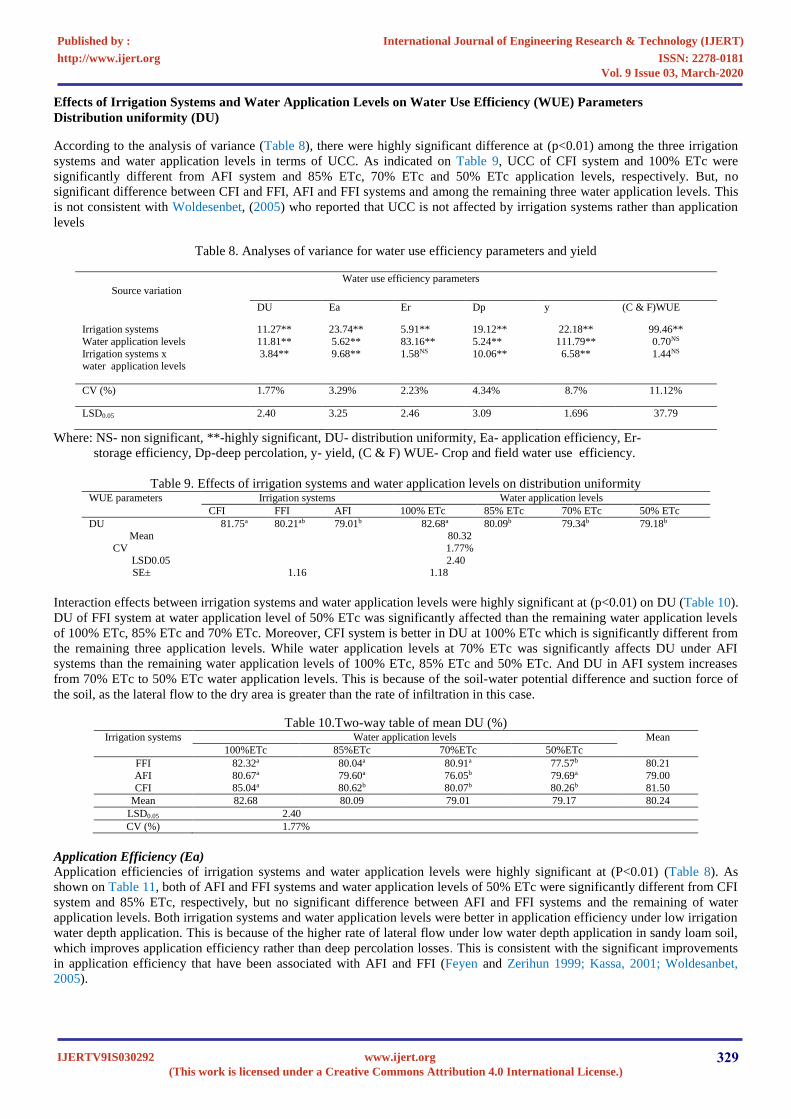
Effects of Irrigation Systems and Water Application Levels on Water Use Efficiency (WUE) Parameters
Distribution uniformity (DU)
According to the analysis of variance (Table 8), there were highly significant difference at (p<0.01) among the three irrigation
systems and water application levels in terms of UCC. As indicated on Table 9, UCC of CFI system and 100% ETc were
significantly different from AFI system and 85% ETc, 70% ETc and 50% ETc application levels, respectively. But, no
significant difference between CFI and FFI, AFI and FFI systems and among the remaining three water application levels. This
is not consistent with Woldesenbet, (2005) who reported that UCC is not affected by irrigation systems rather than application
levels
Table 8. Analyses of variance for water use efficiency parameters and yield
Source variation Water use efficiency parameters
DU Ea Er Dp y (C & F)WUE
Irrigation systems 11.27** 23.74** 5.91** 19.12** 22.18** 99.46**
Water application levels 11.81** 5.62** 83.16** 5.24** 111.79** 0.70NS
Irrigation systems x
water application levels
3.84** 9.68** 1.58NS 10.06** 6.58** 1.44NS
CV (%) 1.77% 3.29% 2.23% 4.34% 8.7% 11.12%
LSD0.05 2.40 3.25 2.46 3.09 1.696 37.79
Where: NS- non significant, **-highly significant, DU- distribution uniformity, Ea- application efficiency, Er-
storage efficiency, Dp-deep percolation, y- yield, (C & F) WUE- Crop and field water use efficiency.
Table 9. Effects of irrigation systems and water application levels on distribution uniformity WUE parameters Irrigation systems Water application levels
CFI FFI AFI 100% ETc 85% ETc 70% ETc 50% ETc
DU 81.75a 80.21ab 79.01b 82.68a 80.09b 79.34b 79.18b Mean 80.32
CV 1.77%
LSD0.05 2.40 SE± 1.16 1.18
Interaction effects between irrigation systems and water application levels were highly significant at (p<0.01) on DU (Table 10).
DU of FFI system at water application level of 50% ETc was significantly affected than the remaining water application levels
of 100% ETc, 85% ETc and 70% ETc. Moreover, CFI system is better in DU at 100% ETc which is significantly different from
the remaining three application levels. While water application levels at 70% ETc was significantly affects DU under AFI
systems than the remaining water application levels of 100% ETc, 85% ETc and 50% ETc. And DU in AFI system increases
from 70% ETc to 50% ETc water application levels. This is because of the soil-water potential difference and suction force of
the soil, as the lateral flow to the dry area is greater than the rate of infiltration in this case.
Table 10.Two-way table of mean DU (%) Irrigation systems Water application levels Mean
100%ETc 85%ETc 70%ETc 50%ETc
FFI 82.32a 80.04a 80.91a 77.57b 80.21
AFI 80.67a 79.60a 76.05b 79.69a 79.00
CFI 85.04a 80.62b 80.07b 80.26b 81.50
Mean 82.68 80.09 79.01 79.17 80.24
LSD0.05 2.40
CV (%) 1.77%
Application Efficiency (Ea)
Application efficiencies of irrigation systems and water application levels were highly significant at (P<0.01) (Table 8). As
shown on Table 11, both of AFI and FFI systems and water application levels of 50% ETc were significantly different from CFI
system and 85% ETc, respectively, but no significant difference between AFI and FFI systems and the remaining of water
application levels. Both irrigation systems and water application levels were better in application efficiency under low irrigation
water depth application. This is because of the higher rate of lateral flow under low water depth application in sandy loam soil,
which improves application efficiency rather than deep percolation losses. This is consistent with the significant improvements
in application efficiency that have been associated with AFI and FFI (Feyen and Zerihun 1999; Kassa, 2001; Woldesanbet,
2005).
International Journal of Engineering Research & Technology (IJERT)
ISSN: 2278-0181http://www.ijert.org
IJERTV9IS030292(This work is licensed under a Creative Commons Attribution 4.0 International License.)
Published by :
www.ijert.org
Vol. 9 Issue 03, March-2020
329
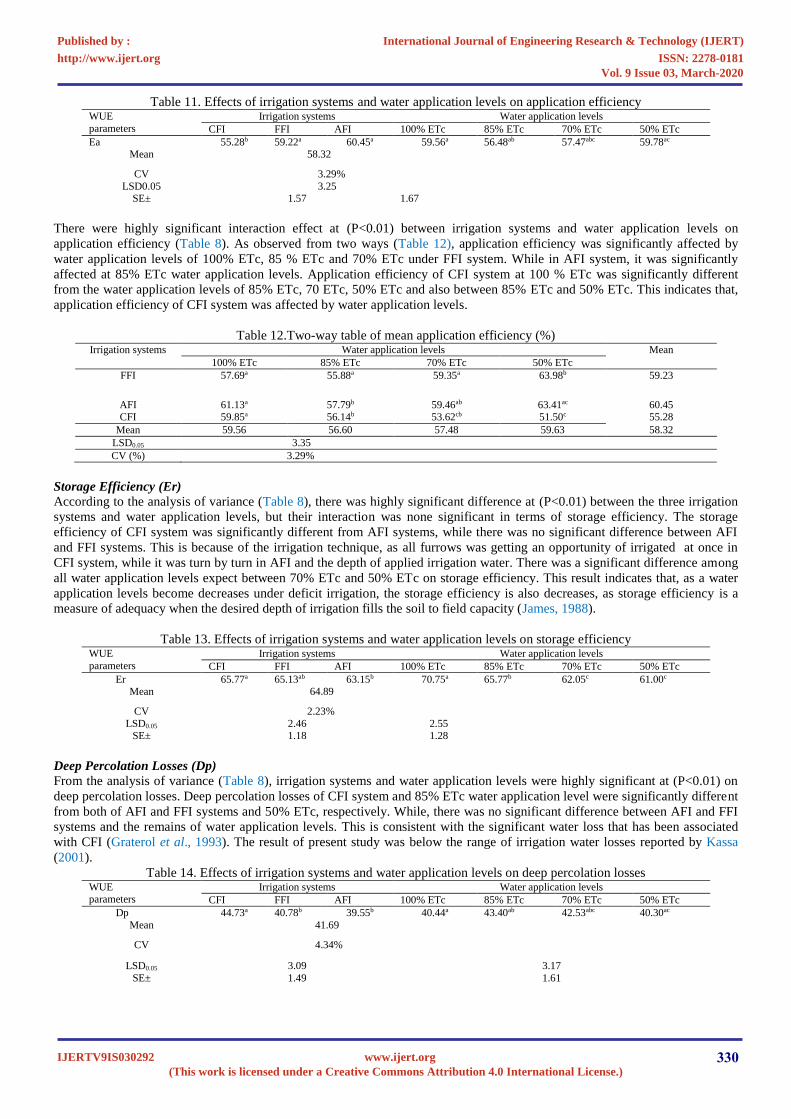
Table 11. Effects of irrigation systems and water application levels on application efficiency WUE
parameters
Irrigation systems Water application levels
CFI FFI AFI 100% ETc 85% ETc 70% ETc 50% ETc
Ea 55.28b 59.22a 60.45a 59.56a 56.48ab 57.47abc 59.78ac Mean 58.32
CV 3.29%
LSD0.05 3.25 SE± 1.57 1.67
There were highly significant interaction effect at (P<0.01) between irrigation systems and water application levels on
application efficiency (Table 8). As observed from two ways (Table 12), application efficiency was significantly affected by
water application levels of 100% ETc, 85 % ETc and 70% ETc under FFI system. While in AFI system, it was significantly
affected at 85% ETc water application levels. Application efficiency of CFI system at 100 % ETc was significantly different
from the water application levels of 85% ETc, 70 ETc, 50% ETc and also between 85% ETc and 50% ETc. This indicates that,
application efficiency of CFI system was affected by water application levels.
Table 12.Two-way table of mean application efficiency (%) Irrigation systems Water application levels Mean
100% ETc 85% ETc 70% ETc 50% ETc
FFI 57.69a 55.88a 59.35a 63.98b 59.23
AFI 61.13a 57.79b 59.46ab 63.41ac 60.45 CFI 59.85a 56.14b 53.62cb 51.50c 55.28
Mean 59.56 56.60 57.48 59.63 58.32
LSD0.05 3.35
CV (%) 3.29%
Storage Efficiency (Er)
According to the analysis of variance (Table 8), there was highly significant difference at (P<0.01) between the three irrigation
systems and water application levels, but their interaction was none significant in terms of storage efficiency. The storage
efficiency of CFI system was significantly different from AFI systems, while there was no significant difference between AFI
and FFI systems. This is because of the irrigation technique, as all furrows was getting an opportunity of irrigated at once in
CFI system, while it was turn by turn in AFI and the depth of applied irrigation water. There was a significant difference among
all water application levels expect between 70% ETc and 50% ETc on storage efficiency. This result indicates that, as a water
application levels become decreases under deficit irrigation, the storage efficiency is also decreases, as storage efficiency is a
measure of adequacy when the desired depth of irrigation fills the soil to field capacity (James, 1988).
Table 13. Effects of irrigation systems and water application levels on storage efficiency WUE
parameters
Irrigation systems Water application levels
CFI FFI AFI 100% ETc 85% ETc 70% ETc 50% ETc
Er 65.77a 65.13ab 63.15b 70.75a 65.77b 62.05c 61.00c Mean 64.89
CV 2.23%
LSD0.05 2.46 2.55 SE± 1.18 1.28
Deep Percolation Losses (Dp)
From the analysis of variance (Table 8), irrigation systems and water application levels were highly significant at (P<0.01) on
deep percolation losses. Deep percolation losses of CFI system and 85% ETc water application level were significantly different
from both of AFI and FFI systems and 50% ETc, respectively. While, there was no significant difference between AFI and FFI
systems and the remains of water application levels. This is consistent with the significant water loss that has been associated
with CFI (Graterol et al., 1993). The result of present study was below the range of irrigation water losses reported by Kassa
(2001).
Table 14. Effects of irrigation systems and water application levels on deep percolation losses WUE parameters
Irrigation systems Water application levels
CFI FFI AFI 100% ETc 85% ETc 70% ETc 50% ETc
Dp 44.73a 40.78b 39.55b 40.44a 43.40ab 42.53abc 40.30ac
Mean 41.69
CV 4.34%
LSD0.05 3.09 3.17
SE± 1.49 1.61
International Journal of Engineering Research & Technology (IJERT)
ISSN: 2278-0181http://www.ijert.org
IJERTV9IS030292(This work is licensed under a Creative Commons Attribution 4.0 International License.)
Published by :
www.ijert.org
Vol. 9 Issue 03, March-2020
330
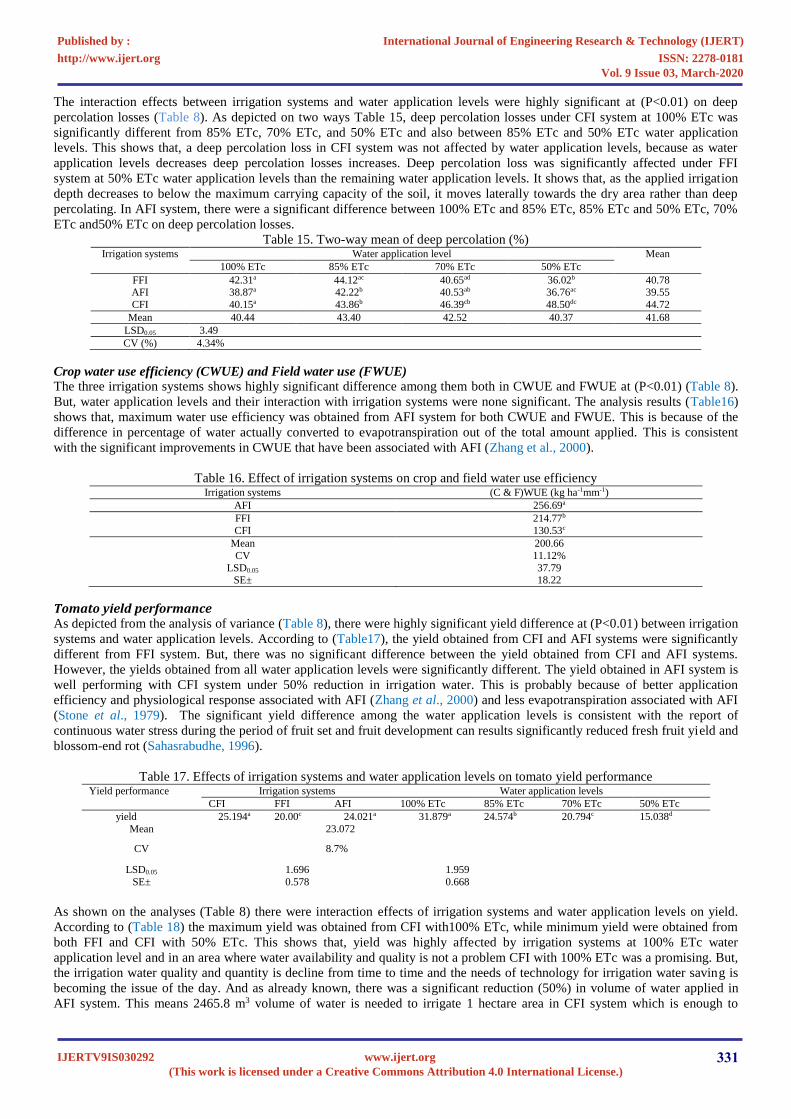
The interaction effects between irrigation systems and water application levels were highly significant at (P<0.01) on deep
percolation losses (Table 8). As depicted on two ways Table 15, deep percolation losses under CFI system at 100% ETc was
significantly different from 85% ETc, 70% ETc, and 50% ETc and also between 85% ETc and 50% ETc water application
levels. This shows that, a deep percolation loss in CFI system was not affected by water application levels, because as water
application levels decreases deep percolation losses increases. Deep percolation loss was significantly affected under FFI
system at 50% ETc water application levels than the remaining water application levels. It shows that, as the applied irrigation
depth decreases to below the maximum carrying capacity of the soil, it moves laterally towards the dry area rather than deep
percolating. In AFI system, there were a significant difference between 100% ETc and 85% ETc, 85% ETc and 50% ETc, 70%
ETc and50% ETc on deep percolation losses.
Table 15. Two-way mean of deep percolation (%) Irrigation systems Water application level Mean
100% ETc 85% ETc 70% ETc 50% ETc
FFI 42.31a 44.12ac 40.65ad 36.02b 40.78 AFI 38.87a 42.22b 40.53ab 36.76ac 39.55
CFI 40.15a 43.86b 46.39cb 48.50dc 44.72
Mean 40.44 43.40 42.52 40.37 41.68
LSD0.05 3.49
CV (%) 4.34%
Crop water use efficiency (CWUE) and Field water use (FWUE)
The three irrigation systems shows highly significant difference among them both in CWUE and FWUE at (P<0.01) (Table 8).
But, water application levels and their interaction with irrigation systems were none significant. The analysis results (Table16)
shows that, maximum water use efficiency was obtained from AFI system for both CWUE and FWUE. This is because of the
difference in percentage of water actually converted to evapotranspiration out of the total amount applied. This is consistent
with the significant improvements in CWUE that have been associated with AFI (Zhang et al., 2000).
Table 16. Effect of irrigation systems on crop and field water use efficiency Irrigation systems (C & F)WUE (kg ha-1mm-1)
AFI 256.69a
FFI 214.77b
CFI 130.53c
Mean 200.66
CV 11.12%
LSD0.05 37.79 SE± 18.22
Tomato yield performance As depicted from the analysis of variance (Table 8), there were highly significant yield difference at (P<0.01) between irrigation
systems and water application levels. According to (Table17), the yield obtained from CFI and AFI systems were significantly
different from FFI system. But, there was no significant difference between the yield obtained from CFI and AFI systems.
However, the yields obtained from all water application levels were significantly different. The yield obtained in AFI system is
well performing with CFI system under 50% reduction in irrigation water. This is probably because of better application
efficiency and physiological response associated with AFI (Zhang et al., 2000) and less evapotranspiration associated with AFI
(Stone et al., 1979). The significant yield difference among the water application levels is consistent with the report of
continuous water stress during the period of fruit set and fruit development can results significantly reduced fresh fruit yield and
blossom-end rot (Sahasrabudhe, 1996).
Table 17. Effects of irrigation systems and water application levels on tomato yield performance Yield performance Irrigation systems Water application levels
CFI FFI AFI 100% ETc 85% ETc 70% ETc 50% ETc
yield 25.194a 20.00c 24.021a 31.879a 24.574b 20.794c 15.038d
Mean 23.072
CV 8.7%
LSD0.05 1.696 1.959
SE± 0.578 0.668
As shown on the analyses (Table 8) there were interaction effects of irrigation systems and water application levels on yield.
According to (Table 18) the maximum yield was obtained from CFI with100% ETc, while minimum yield were obtained from
both FFI and CFI with 50% ETc. This shows that, yield was highly affected by irrigation systems at 100% ETc water
application level and in an area where water availability and quality is not a problem CFI with 100% ETc was a promising. But,
the irrigation water quality and quantity is decline from time to time and the needs of technology for irrigation water saving is
becoming the issue of the day. And as already known, there was a significant reduction (50%) in volume of water applied in
AFI system. This means 2465.8 m3 volume of water is needed to irrigate 1 hectare area in CFI system which is enough to
International Journal of Engineering Research & Technology (IJERT)
ISSN: 2278-0181http://www.ijert.org
IJERTV9IS030292(This work is licensed under a Creative Commons Attribution 4.0 International License.)
Published by :
www.ijert.org
Vol. 9 Issue 03, March-2020
331
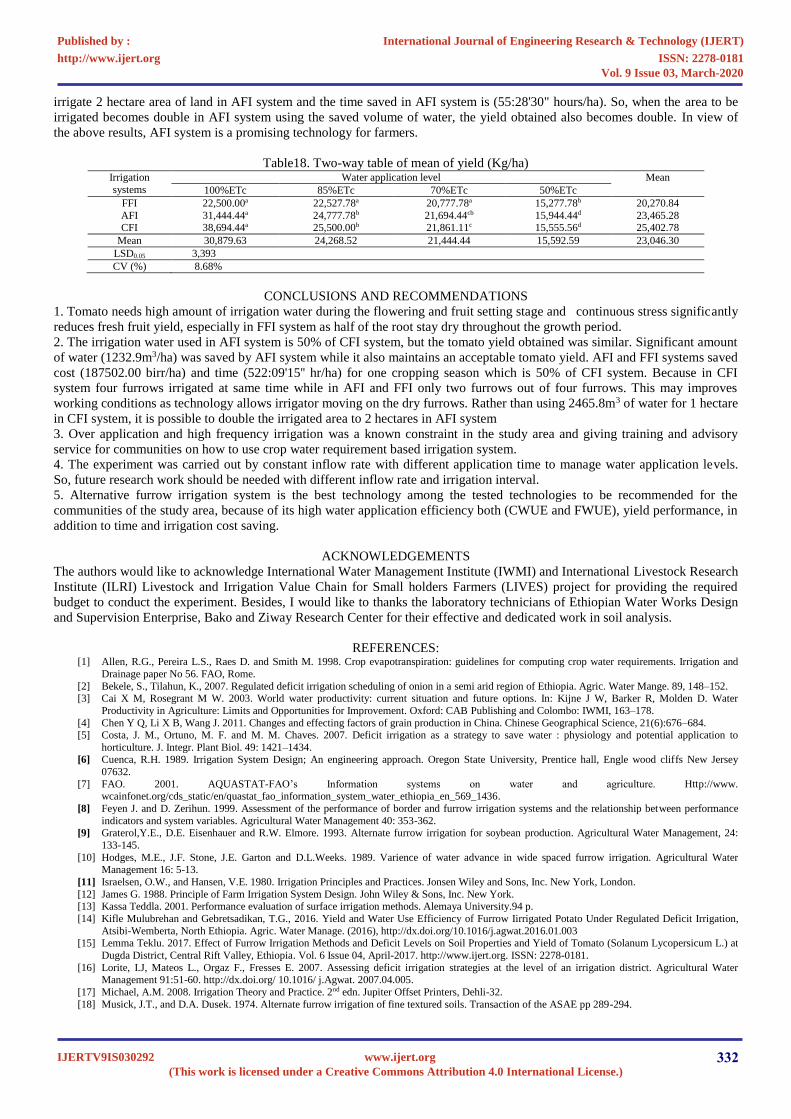
irrigate 2 hectare area of land in AFI system and the time saved in AFI system is (55:28'30" hours/ha). So, when the area to be
irrigated becomes double in AFI system using the saved volume of water, the yield obtained also becomes double. In view of
the above results, AFI system is a promising technology for farmers.
Table18. Two-way table of mean of yield (Kg/ha) Irrigation
systems
Water application level Mean
100%ETc 85%ETc 70%ETc 50%ETc
FFI 22,500.00a 22,527.78a 20,777.78a 15,277.78b 20,270.84
AFI 31,444.44a 24,777.78b 21,694.44cb 15,944.44d 23,465.28 CFI 38,694.44a 25,500.00b 21,861.11c 15,555.56d 25,402.78
Mean 30,879.63 24,268.52 21,444.44 15,592.59 23,046.30
LSD0.05 3,393
CV (%) 8.68%
CONCLUSIONS AND RECOMMENDATIONS
1. Tomato needs high amount of irrigation water during the flowering and fruit setting stage and continuous stress significantly
reduces fresh fruit yield, especially in FFI system as half of the root stay dry throughout the growth period.
2. The irrigation water used in AFI system is 50% of CFI system, but the tomato yield obtained was similar. Significant amount
of water (1232.9m3/ha) was saved by AFI system while it also maintains an acceptable tomato yield. AFI and FFI systems saved
cost (187502.00 birr/ha) and time (522:09'15'' hr/ha) for one cropping season which is 50% of CFI system. Because in CFI
system four furrows irrigated at same time while in AFI and FFI only two furrows out of four furrows. This may improves
working conditions as technology allows irrigator moving on the dry furrows. Rather than using 2465.8m3 of water for 1 hectare
in CFI system, it is possible to double the irrigated area to 2 hectares in AFI system
3. Over application and high frequency irrigation was a known constraint in the study area and giving training and advisory
service for communities on how to use crop water requirement based irrigation system.
4. The experiment was carried out by constant inflow rate with different application time to manage water application levels.
So, future research work should be needed with different inflow rate and irrigation interval.
5. Alternative furrow irrigation system is the best technology among the tested technologies to be recommended for the
communities of the study area, because of its high water application efficiency both (CWUE and FWUE), yield performance, in
addition to time and irrigation cost saving.
ACKNOWLEDGEMENTS
The authors would like to acknowledge International Water Management Institute (IWMI) and International Livestock Research
Institute (ILRI) Livestock and Irrigation Value Chain for Small holders Farmers (LIVES) project for providing the required
budget to conduct the experiment. Besides, I would like to thanks the laboratory technicians of Ethiopian Water Works Design
and Supervision Enterprise, Bako and Ziway Research Center for their effective and dedicated work in soil analysis.
REFERENCES: [1] Allen, R.G., Pereira L.S., Raes D. and Smith M. 1998. Crop evapotranspiration: guidelines for computing crop water requirements. Irrigation and
Drainage paper No 56. FAO, Rome.
[2] Bekele, S., Tilahun, K., 2007. Regulated deficit irrigation scheduling of onion in a semi arid region of Ethiopia. Agric. Water Mange. 89, 148–152. [3] Cai X M, Rosegrant M W. 2003. World water productivity: current situation and future options. In: Kijne J W, Barker R, Molden D. Water
Productivity in Agriculture: Limits and Opportunities for Improvement. Oxford: CAB Publishing and Colombo: IWMI, 163–178.
[4] Chen Y Q, Li X B, Wang J. 2011. Changes and effecting factors of grain production in China. Chinese Geographical Science, 21(6):676–684. [5] Costa, J. M., Ortuno, M. F. and M. M. Chaves. 2007. Deficit irrigation as a strategy to save water : physiology and potential application to
horticulture. J. Integr. Plant Biol. 49: 1421–1434. [6] Cuenca, R.H. 1989. Irrigation System Design; An engineering approach. Oregon State University, Prentice hall, Engle wood cliffs New Jersey
07632.
[7] FAO. 2001. AQUASTAT-FAO’s Information systems on water and agriculture. Http://www. wcainfonet.org/cds_static/en/quastat_fao_information_system_water_ethiopia_en_569_1436.
[8] Feyen J. and D. Zerihun. 1999. Assessment of the performance of border and furrow irrigation systems and the relationship between performance
indicators and system variables. Agricultural Water Management 40: 353-362. [9] Graterol,Y.E., D.E. Eisenhauer and R.W. Elmore. 1993. Alternate furrow irrigation for soybean production. Agricultural Water Management, 24:
133-145.
[10] Hodges, M.E., J.F. Stone, J.E. Garton and D.L.Weeks. 1989. Varience of water advance in wide spaced furrow irrigation. Agricultural Water
Management 16: 5-13.
[11] Israelsen, O.W., and Hansen, V.E. 1980. Irrigation Principles and Practices. Jonsen Wiley and Sons, Inc. New York, London.
[12] James G. 1988. Principle of Farm Irrigation System Design. John Wiley & Sons, Inc. New York.[13] Kassa Teddla. 2001. Performance evaluation of surface irrigation methods. Alemaya University.94 p.
[14] Kifle Mulubrehan and Gebretsadikan, T.G., 2016. Yield and Water Use Efficiency of Furrow Iirrigated Potato Under Regulated Deficit Irrigation,
Atsibi-Wemberta, North Ethiopia. Agric. Water Manage. (2016), http://dx.doi.org/10.1016/j.agwat.2016.01.003[15] Lemma Teklu. 2017. Effect of Furrow Irrigation Methods and Deficit Levels on Soil Properties and Yield of Tomato (Solanum Lycopersicum L.) at
Dugda District, Central Rift Valley, Ethiopia. Vol. 6 Issue 04, April-2017. http://www.ijert.org. ISSN: 2278-0181.
[16] Lorite, I.J, Mateos L., Orgaz F., Fresses E. 2007. Assessing deficit irrigation strategies at the level of an irrigation district. Agricultural Water Management 91:51-60. http://dx.doi.org/ 10.1016/ j.Agwat. 2007.04.005.
[17] Michael, A.M. 2008. Irrigation Theory and Practice. 2nd edn. Jupiter Offset Printers, Dehli-32.
[18] Musick, J.T., and D.A. Dusek. 1974. Alternate furrow irrigation of fine textured soils. Transaction of the ASAE pp 289-294.
International Journal of Engineering Research & Technology (IJERT)
ISSN: 2278-0181http://www.ijert.org
IJERTV9IS030292(This work is licensed under a Creative Commons Attribution 4.0 International License.)
Published by :
www.ijert.org
Vol. 9 Issue 03, March-2020
332

[19] Patane, C., Tringali, S. and O. Sortino. 2011. Effects of deficit irrigation on biomass, yield, water productivity and fruit quality of processing tomato
under semi-arid Mediterranean climate conditions. Scientia Horticulturae, 129: 590 – 596. [20] Peet, M. M. 2005. Irrigation and fertilization. In: Heuvelink E, ed. Tomatoes, Crop Production Science in Horticulture. CABI Publishing, UK. pp.
171-198.
[21] Sahasrabudhe, S.R.1996. Irrigation Engineering and Hydraulic Structures. S.K. Kataria and Sons. Delhi.[22] Stone, J.F., J.E. Garton, B. B. Reeves and H.E. Keflemariam. 1979. Irrigation water conservation using wide-spaced furrows. Soil Sci. Am. J., 43:
407-411.
[23] Walker, W.R. 1989. Guidelines for Design and Evaluating Surface Irrigation System. FAO irrigation and drainage paper 45. Rome.[24] Woldesenbet Gebre, 2005. Evaluating alternate furrow irrigation for potato production in sub-humid area of east Gojam, Alemaya University. 80p
[25] Zhang, J., S. Kang, Z. Liang., Y. Z. Pan, P. Shi, Y. H. Pan, Z. S. Liang, X. T. Hu. 2000. Soil water distribution, uniformity and water use efficiency
under alternate furrow irrigation in arid areas. Irrigation Science 19: 181-190.
International Journal of Engineering Research & Technology (IJERT)
ISSN: 2278-0181http://www.ijert.org
IJERTV9IS030292(This work is licensed under a Creative Commons Attribution 4.0 International License.)
Published by :
www.ijert.org
Vol. 9 Issue 03, March-2020
333