Embed Size (px)
Citation preview
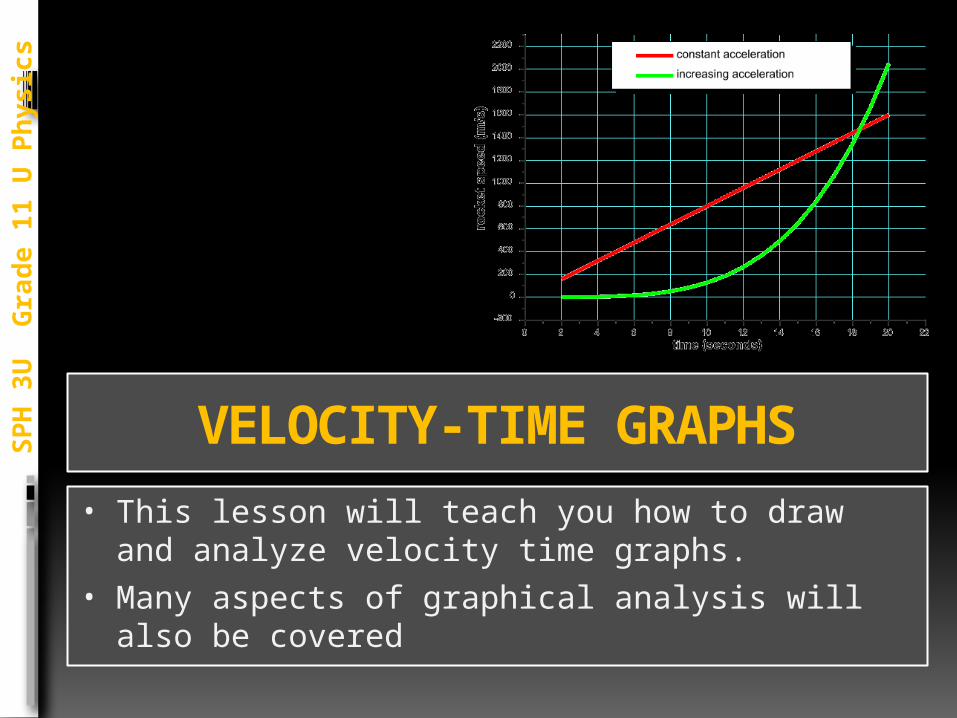
VELOCITY-TIME GRAPHS• This lesson will teach you how to draw and
analyze velocity time graphs.• Many aspects of graphical analysis will also be
covered
SP
H 3
U
Gra
de 1
1 U
Ph
ysic
s

By the end of this lesson, you will be able to:
What are we going to cover today?
v-t graphing basics
SP
H 3
U
Gra
de 1
1 U
Ph
ysic
s
Analyze uniform v-t graphsAnalyze non -uniform v-t graphs
Homework
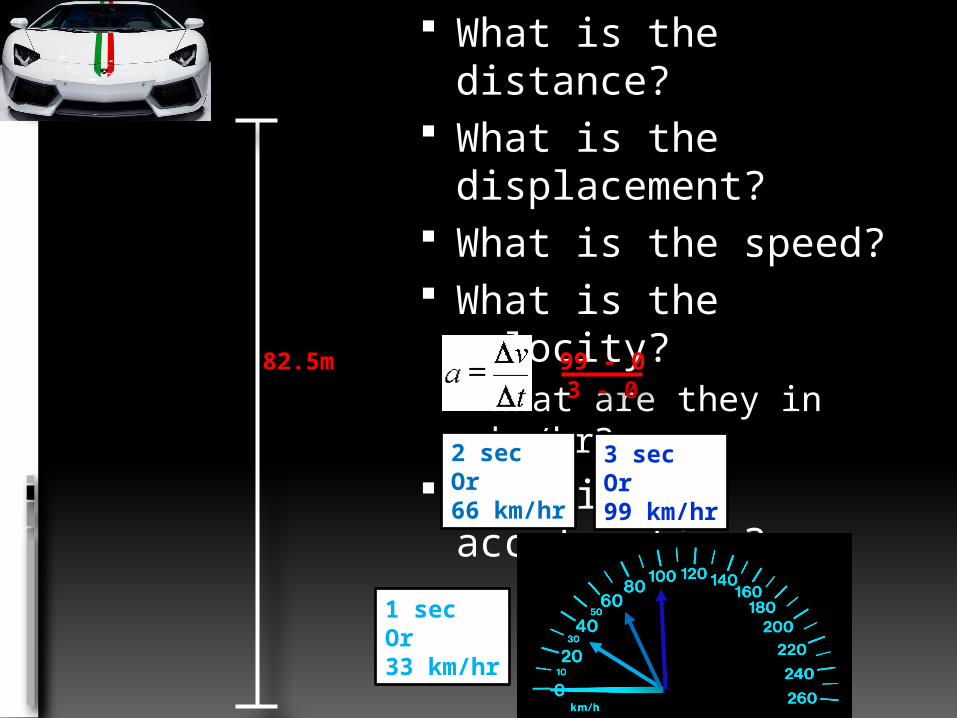
What is the distance? What is the
displacement? What is the speed? What is the velocity?
What are they in km/hr? What is the
acceleration?82.5m
3s
1 secOr33 km/hr
2 secOr66 km/hr
3 secOr99 km/hr
99 - 03 - 0
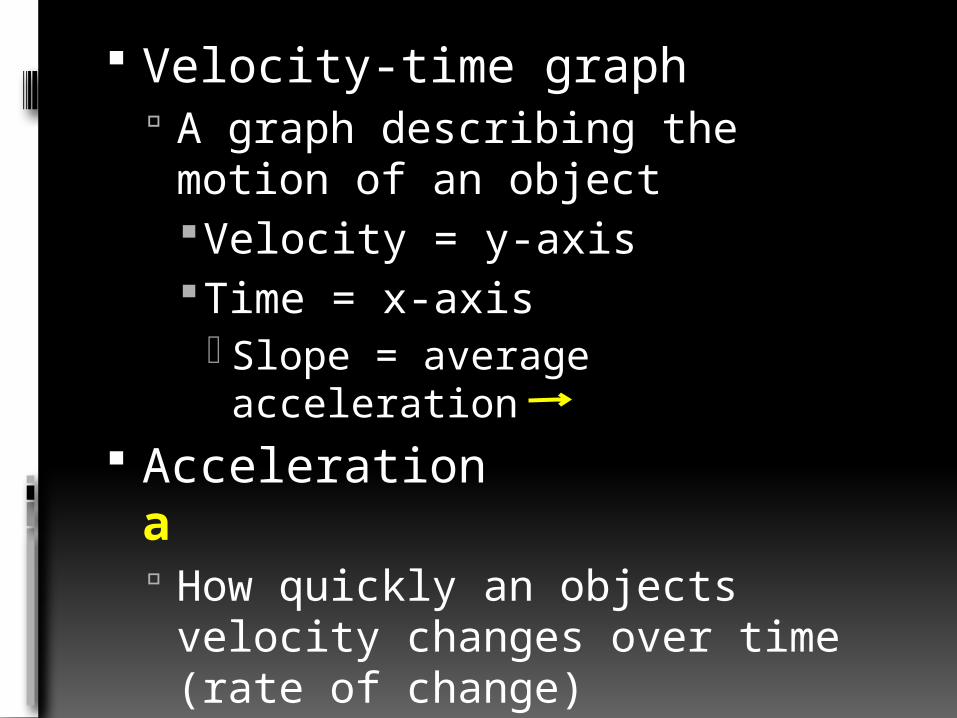
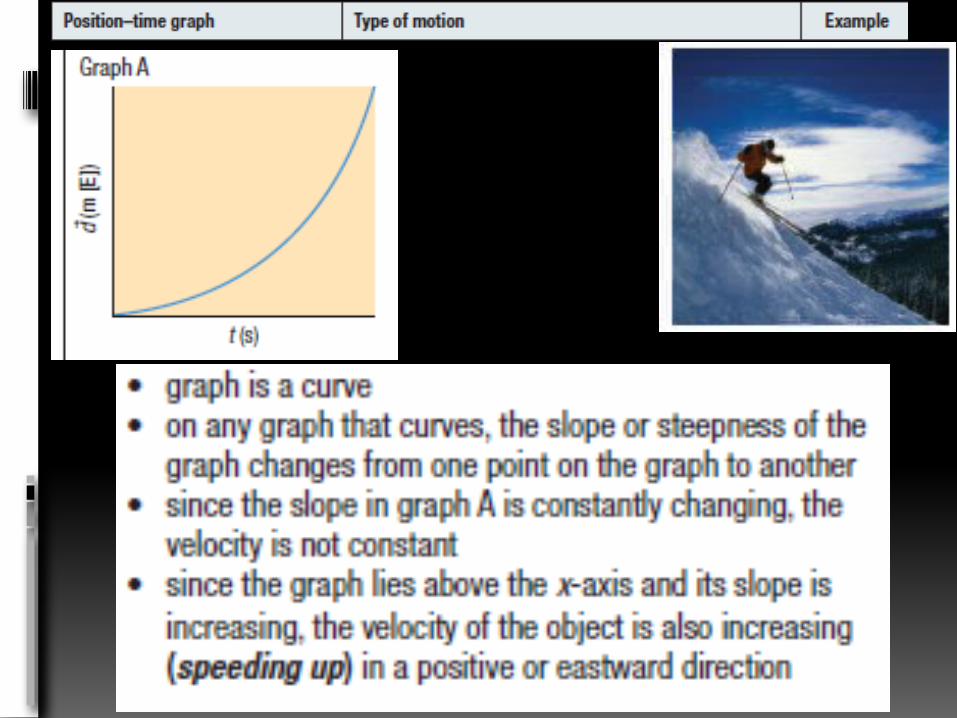
Velocity-time graph A graph describing the motion of
an objectVelocity = y-axisTime = x-axis Slope = average acceleration
Acceleration a How quickly an objects velocity
changes over time (rate of change)
vector
SP
H 3
U
Gra
de 1
1 U
Ph
ysic
s
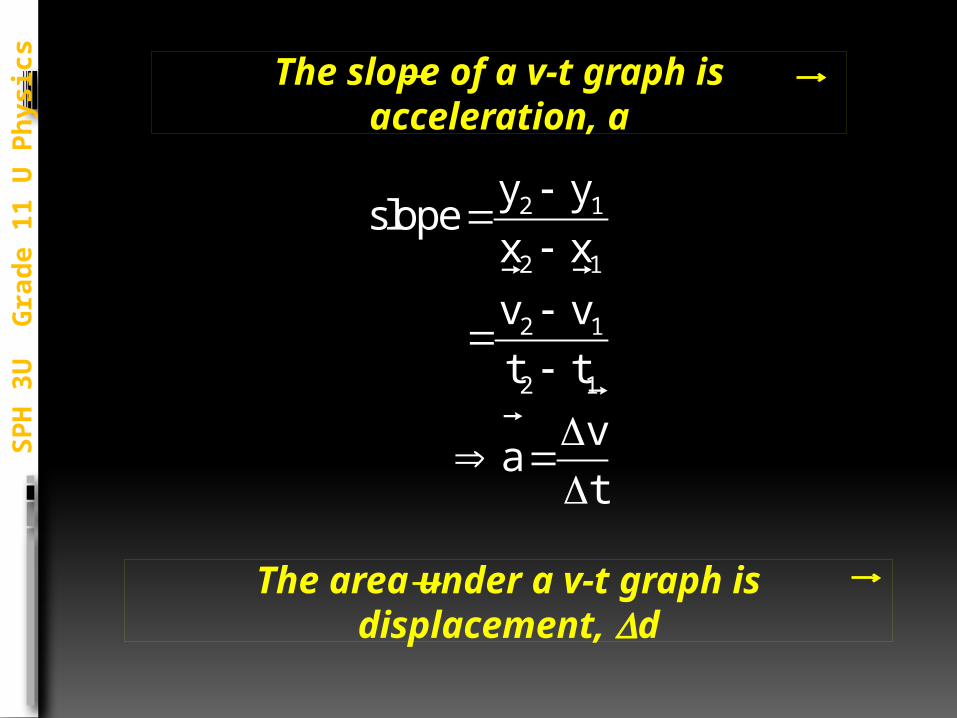
The slope of a v-t graph is acceleration, a
The area under a v-t graph is displacement, Dd
y yslope
x x
v vt t
va
t
2 1
2 1
2 1
2 1
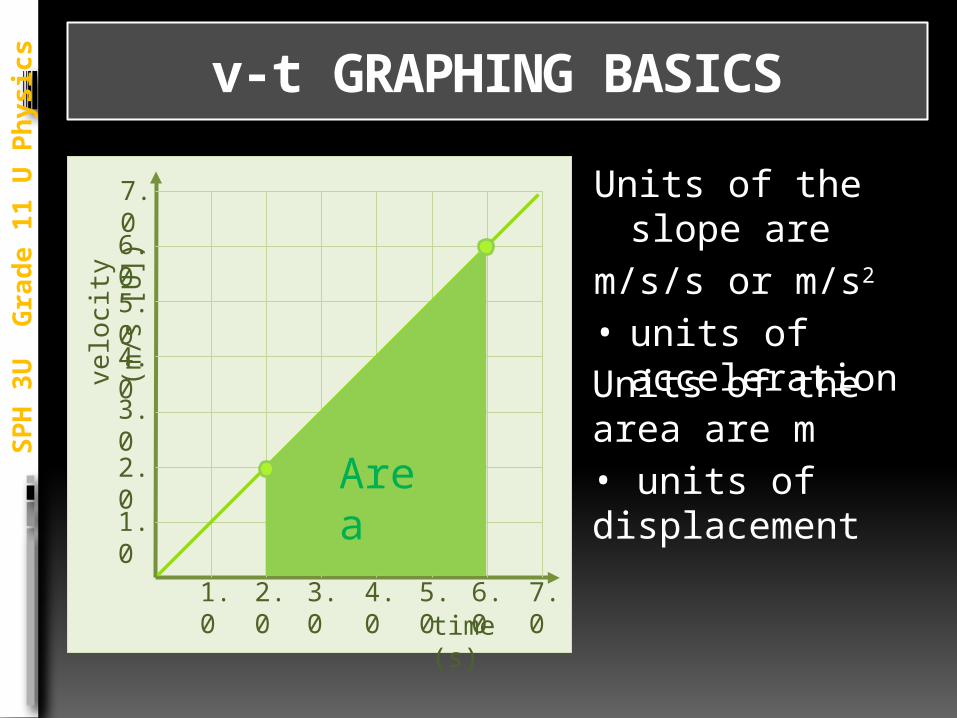
v-t GRAPHING BASICSS
PH
3U
G
rad
e 1
1 U
Ph
ysic
s
time (s)
7.0
velo
city
(m
/s
[U])
6.05.0
3.0
4.0
1.0
2.0
1.0
2.0
3.0
4.0
5.0
6.0
7.0
Units of the slope are
m/s/s or m/s2 • units of
acceleration
Area
Units of the area are m• units of displacement
-2.0
-1.0
0
1.0
2.0
3.0
4.0
11 12 13 14
-3.0
-4.0
velo
city
(m
/s
[E])
1.0 2.0 3.0 4.0 5.0 6.0 7.0 8.0 9.0 10.time (s)
SP
H 3
U
Gra
de 1
1 U
Ph
ysic
s
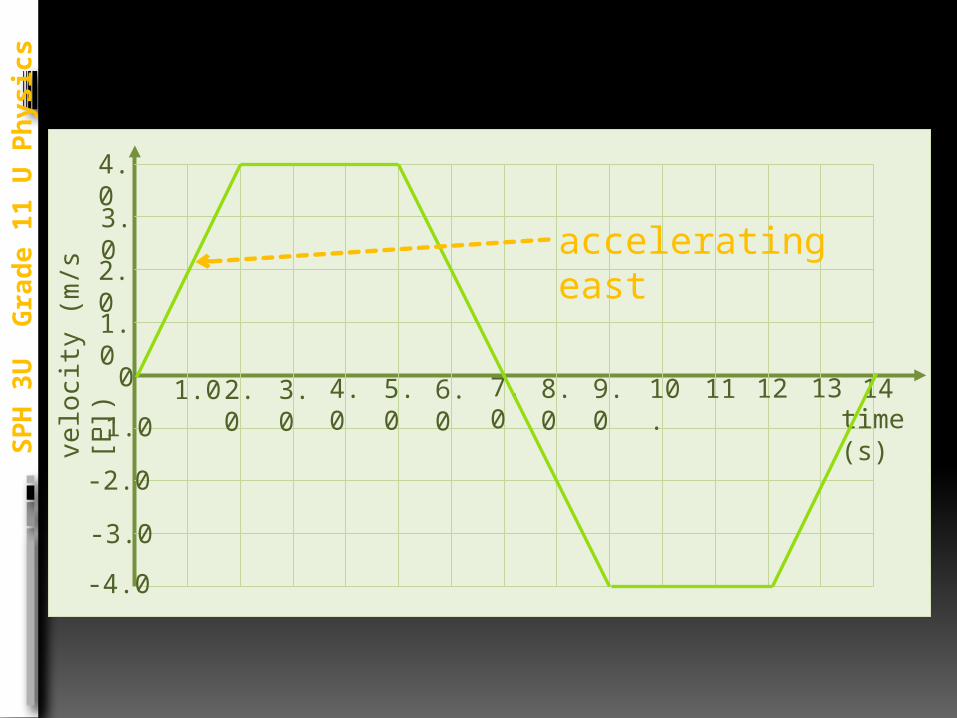
accelerating east
-2.0
-1.0
0
1.0
2.0
3.0
4.0
11 12 13 14
-3.0
-4.0
velo
city
(m
/s
[E])
1.0 2.0 3.0 4.0 5.0 6.0 7.0 8.0 9.0 10.time (s)
SP
H 3
U
Gra
de 1
1 U
Ph
ysic
s
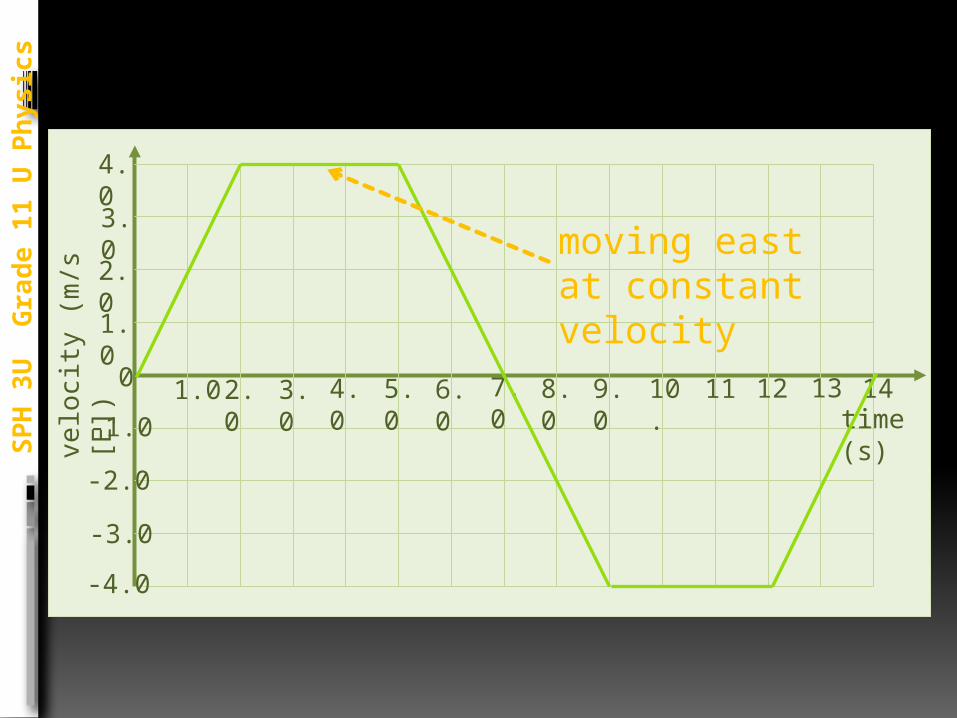
moving east at constant velocity
-2.0
-1.0
0
1.0
2.0
3.0
4.0
11 12 13 14
-3.0
-4.0
velo
city
(m
/s
[E])
1.0 2.0 3.0 4.0 5.0 6.0 7.0 8.0 9.0 10.time (s)
SP
H 3
U
Gra
de 1
1 U
Ph
ysic
s
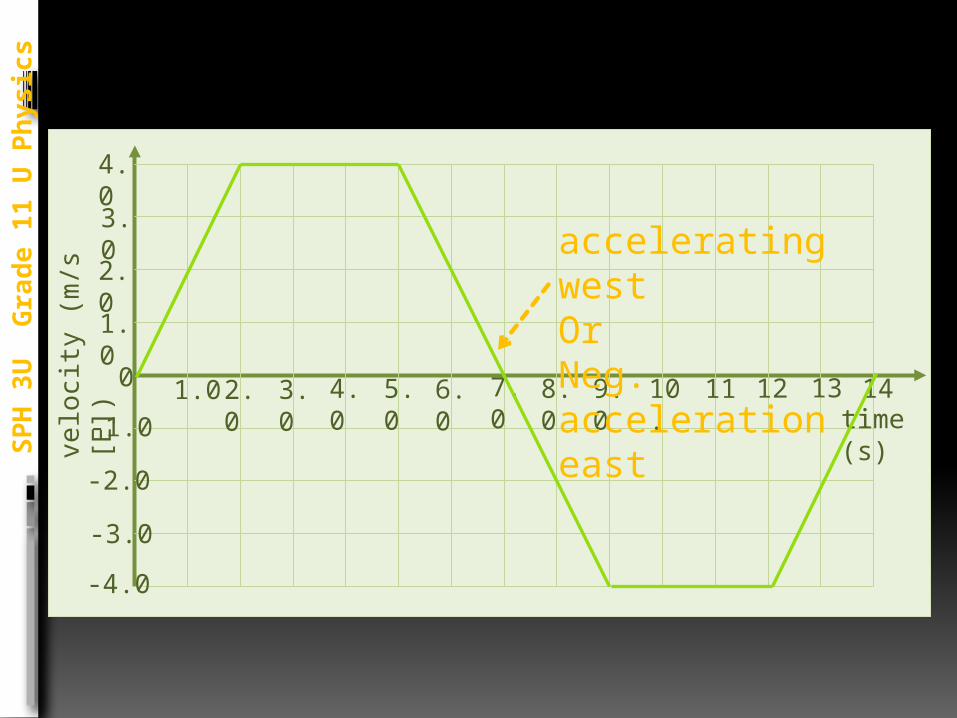
accelerating westOrNeg. acceleration east
-2.0
-1.0
0
1.0
2.0
3.0
4.0
11 12 13 14
-3.0
-4.0
velo
city
(m
/s
[E])
1.0 2.0 3.0 4.0 5.0 6.0 7.0 8.0 9.0 10.time (s)
SP
H 3
U
Gra
de 1
1 U
Ph
ysic
s
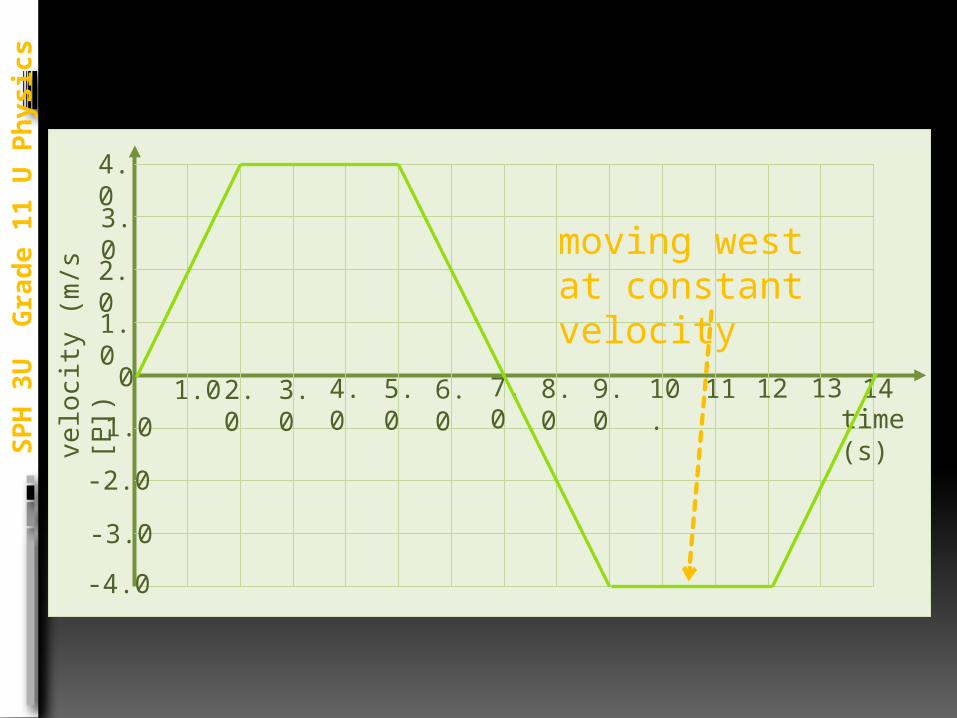
moving west at constant velocity
-2.0
-1.0
0
1.0
2.0
3.0
4.0
11 12 13 14
-3.0
-4.0
velo
city
(m
/s
[E])
1.0 2.0 3.0 4.0 5.0 6.0 7.0 8.0 9.0 10.time (s)
SP
H 3
U
Gra
de 1
1 U
Ph
ysic
s
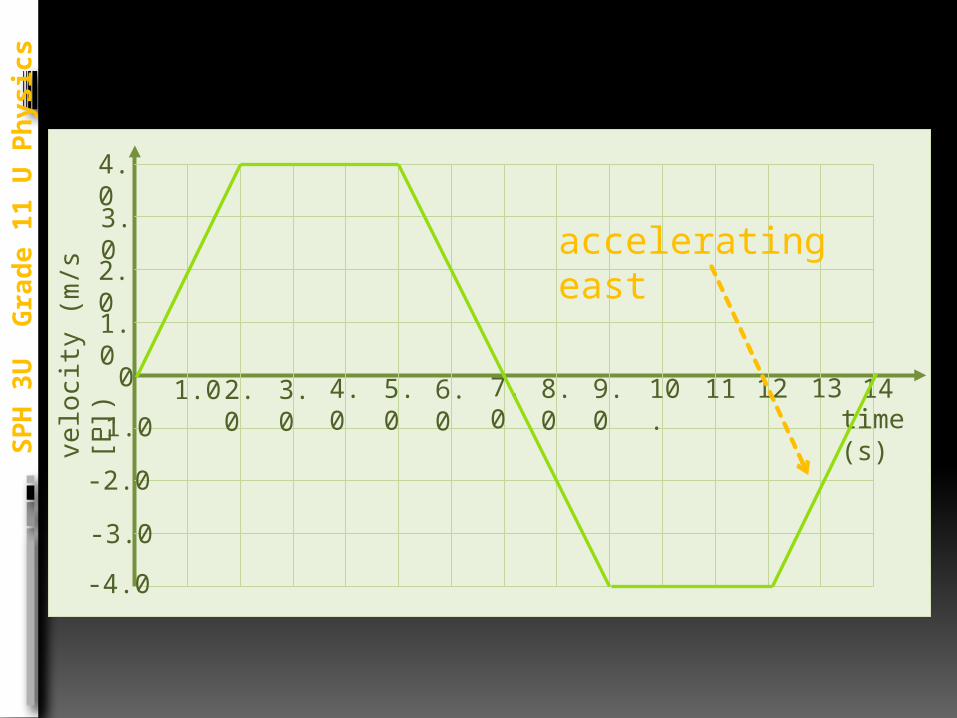
accelerating east
-2.0
-1.0
0
1.0
2.0
3.0
4.0
11 12 13 14
-3.0
-4.0
velo
city
(m
/s
[E])
1.0 2.0 3.0 4.0 5.0 6.0 7.0 8.0 9.0 10.time (s)
SP
H 3
U
Gra
de 1
1 U
Ph
ysic
s
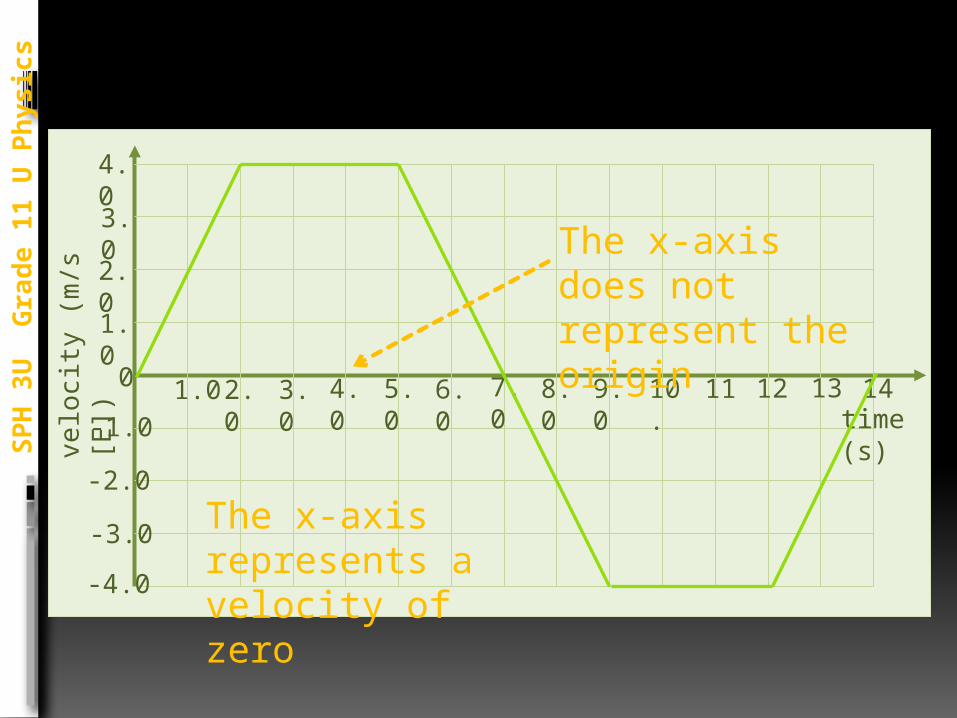
The x-axis does not represent the origin
The x-axis represents a velocity of zero
PRACTICE QUESTION
1. What is the slope of a v-t graph?
SP
H 3
U
Gra
de 1
1 U
Ph
ysic
s
a. Displacementb. Velocityc. Accelerationd. Positione. None of the above
PRACTICE QUESTION
2. What is the area under a v-t graph?
SP
H 3
U
Gra
de 1
1 U
Ph
ysic
s
a. Displacementb. Velocityc. Accelerationd. Positione. None of the above
PRACTICE QUESTIONS
PH
3U
G
rad
e 1
1 U
Ph
ysic
s
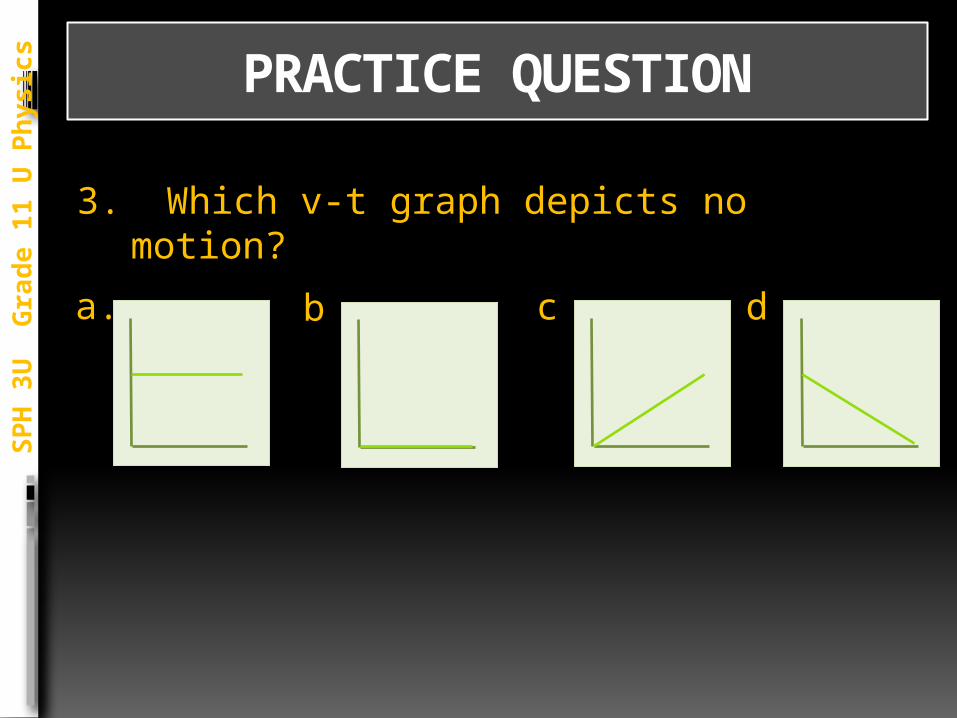
3. Which v-t graph depicts no motion?
a. b. c. d.
time (s)
14
velo
city
(m
/s
[U])
12
10.
6.0
8.0
2.0
4.0
1.0
2.0
3.0
4.0
5.0
6.0
7.0
time (s)
velocity (m/s [U])
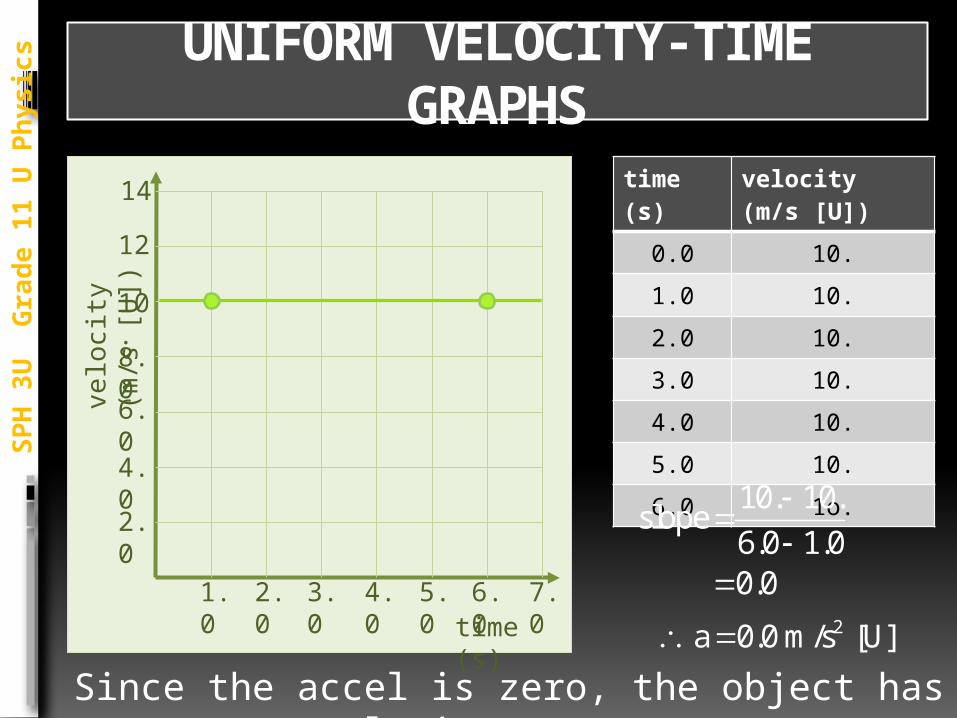
0.0 10.
1.0 10.
2.0 10.
3.0 10.
4.0 10.
5.0 10.
6.0 1o.
UNIFORM VELOCITY-TIME GRAPHS
. .slope
. .
.
10 106 0 1 00 0
Since the accel is zero, the object has a constant velocity
SP
H 3
U
Gra
de 1
1 U
Ph
ysic
s
2 a . m/s [U] 0 0
SP
H 3
U
Gra
de 1
1 U
Ph
ysic
s
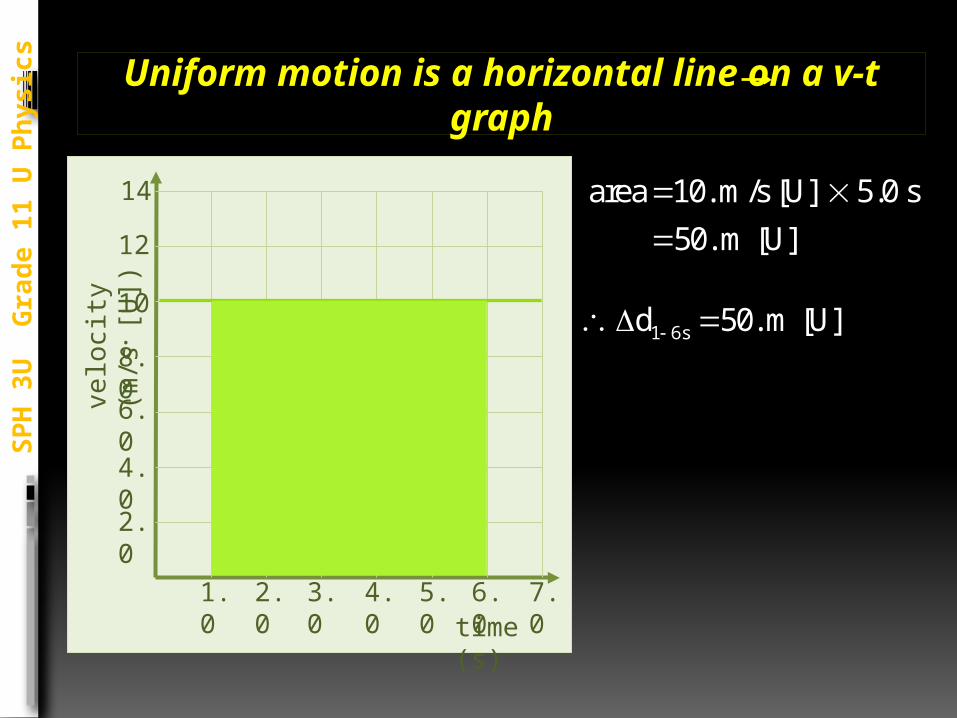
Uniform motion is a horizontal line on a v-t graph
time (s)
14
velo
city
(m
/s
[U])
12
10.
6.0
8.0
2.0
4.0
1.0
2.0
3.0
4.0
5.0
6.0
7.0
area . m/s [U] . s
. m [U]
10 5 050
s d . m [U] 1 6 50
time (s)
14
velo
city
(m/s
[E
])
12
10.
6.0
8.0
2.0
4.0
1.0
2.0
3.0
time (s)
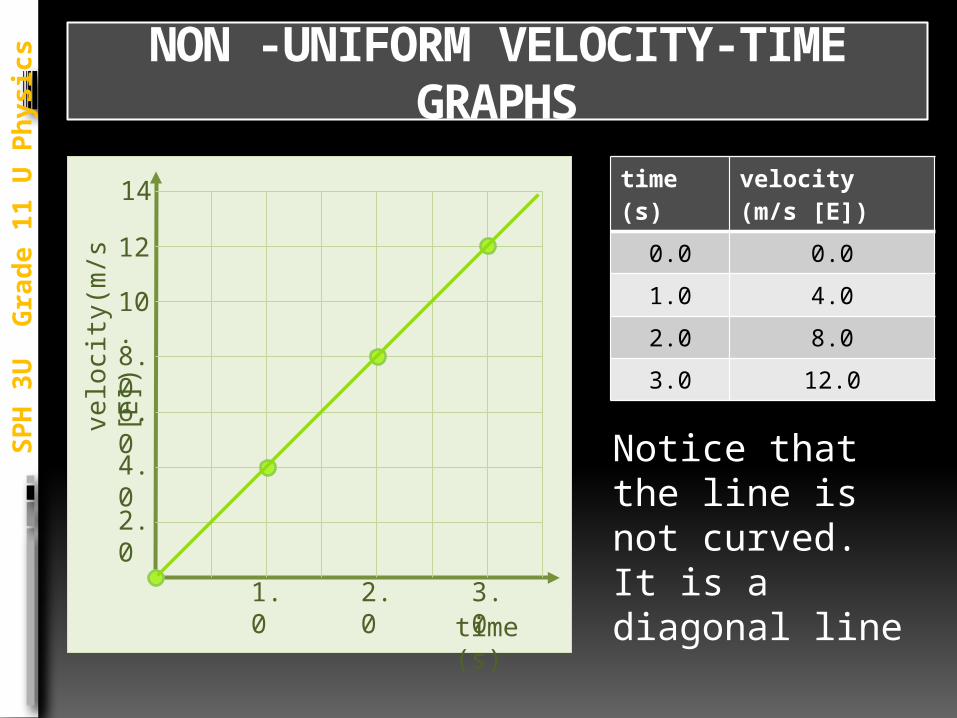
velocity (m/s [E])
0.0 0.0
1.0 4.0
2.0 8.0
3.0 12.0
NON -UNIFORM VELOCITY-TIME GRAPHS
Notice that the line is not curved. It is a diagonal line
SP
H 3
U
Gra
de 1
1 U
Ph
ysic
s
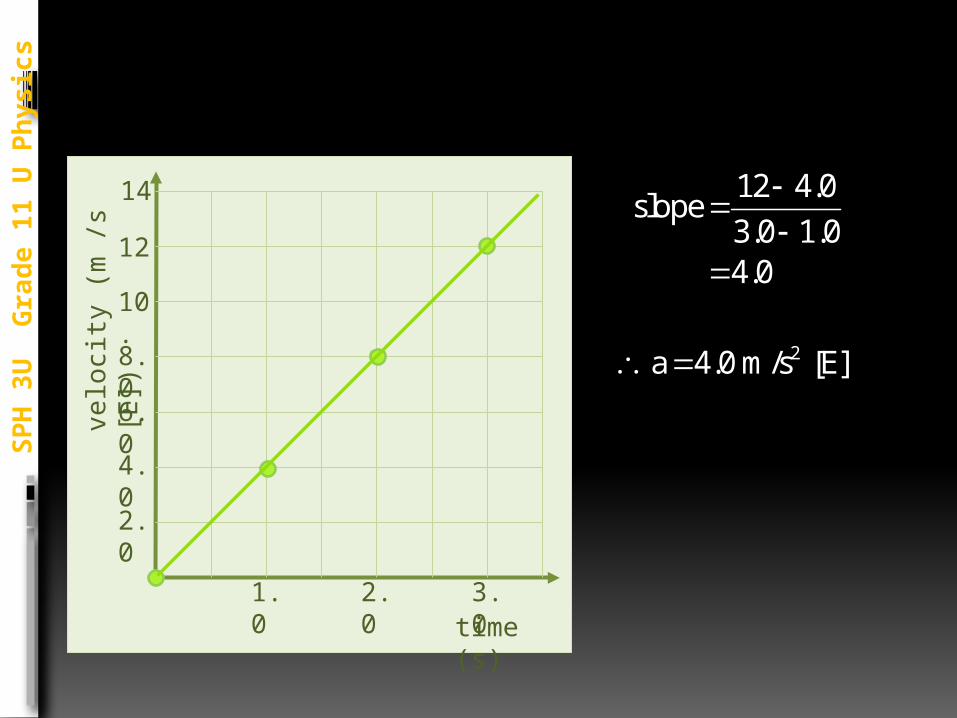
.slope
. .
.
12 4 03 0 1 04 0
2 a . m/s [E] 4 0
time (s)
14
velo
city
(m
/s
[E])
12
10.
6.0
8.0
2.0
4.0
1.0
2.0
3.0
SP
H 3
U
Gra
de 1
1 U
Ph
ysic
s
SP
H 3
U
Gra
de 1
1 U
Ph
ysic
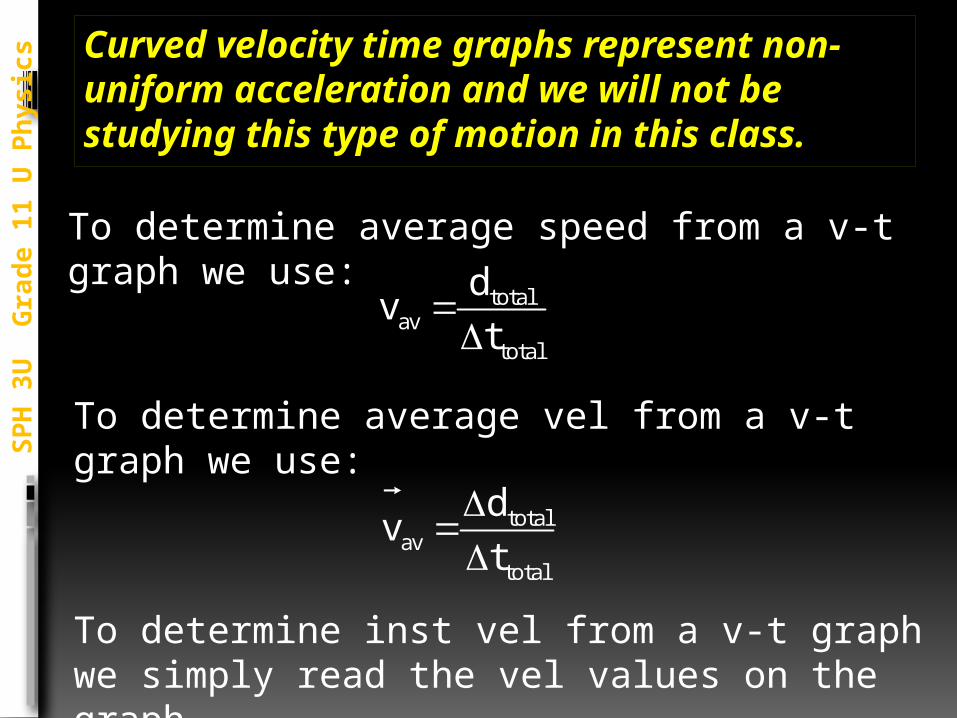
s Curved velocity time graphs represent non-uniform acceleration and we will not be studying this type of motion in this class.
totalav
total
dv
t
To determine average speed from a v-t graph we use:
totalav
total
dv
t
To determine average vel from a v-t graph we use:
To determine inst vel from a v-t graph we simply read the vel values on the graph
PRACTICE QUESTIONS
PH
3U
G
rad
e 1
1 U
Ph
ysic
s
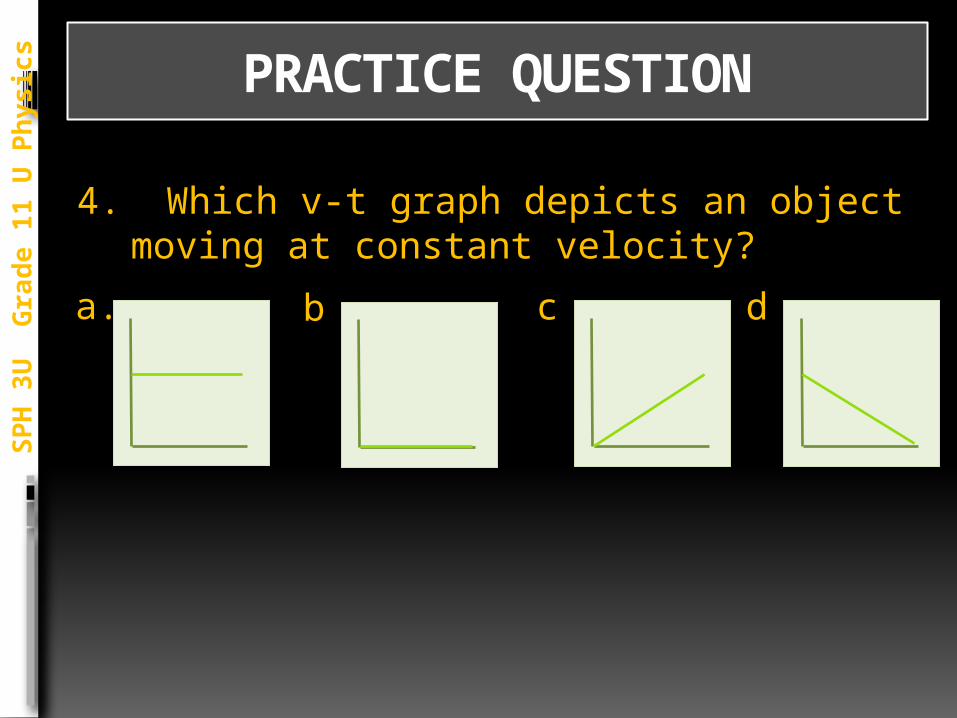
4. Which v-t graph depicts an object moving at constant velocity?
a. b. c. d.
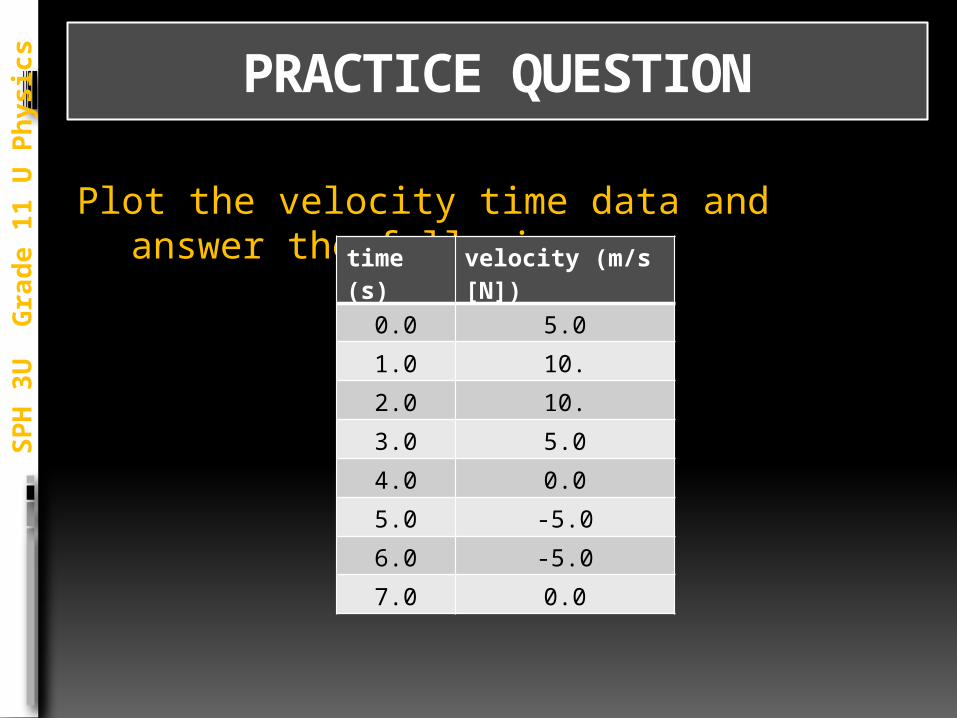
PRACTICE QUESTION
Plot the velocity time data and answer the following
SP
H 3
U
Gra
de 1
1 U
Ph
ysic
s
time (s)
velocity (m/s [N])
0.0 5.0
1.0 10.
2.0 10.
3.0 5.0
4.0 0.0
5.0 -5.0
6.0 -5.0
7.0 0.0
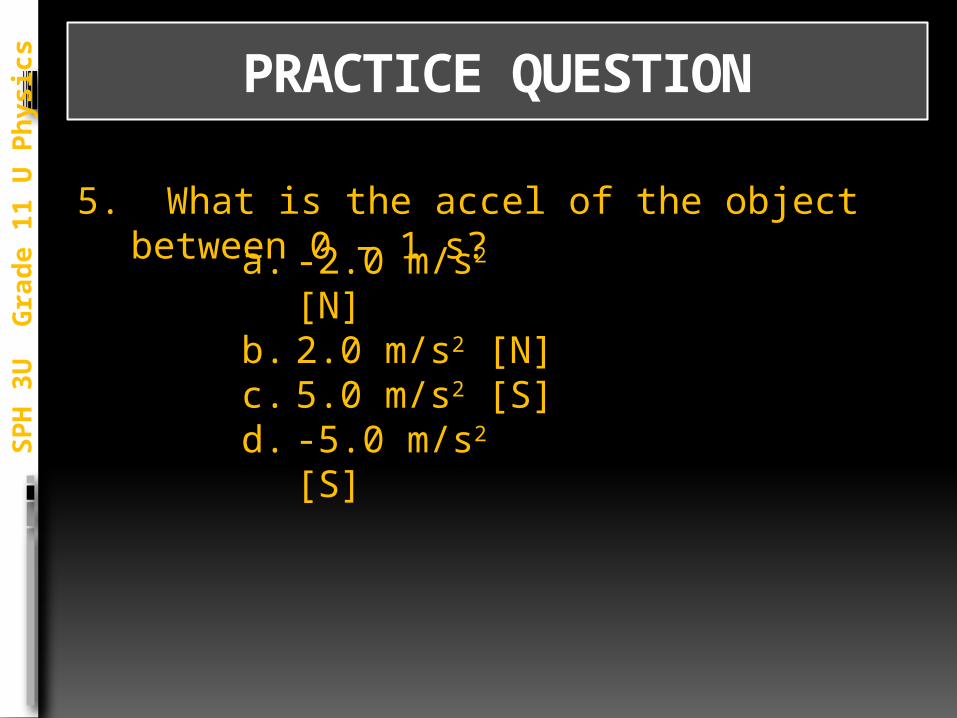
PRACTICE QUESTION
5. What is the accel of the object between 0 – 1 s?
SP
H 3
U
Gra
de 1
1 U
Ph
ysic
s
a. -2.0 m/s2 [N]b. 2.0 m/s2 [N]c. 5.0 m/s2 [S]d. -5.0 m/s2 [S]
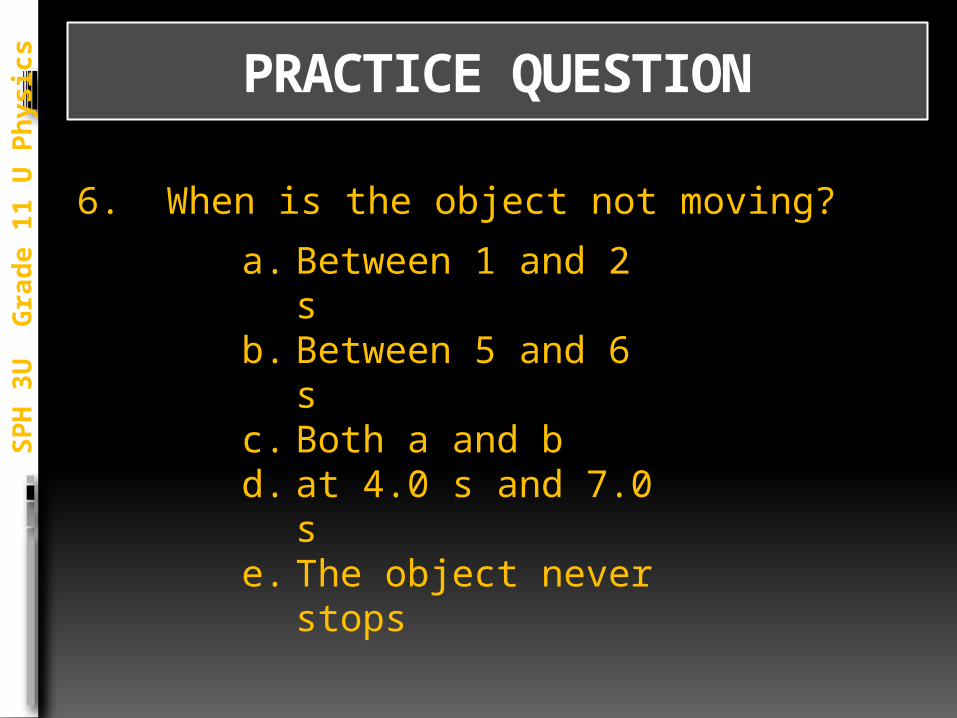
PRACTICE QUESTION
6. When is the object not moving?
SP
H 3
U
Gra
de 1
1 U
Ph
ysic
s
a. Between 1 and 2 s b. Between 5 and 6 sc. Both a and bd. at 4.0 s and 7.0 se. The object never
stops
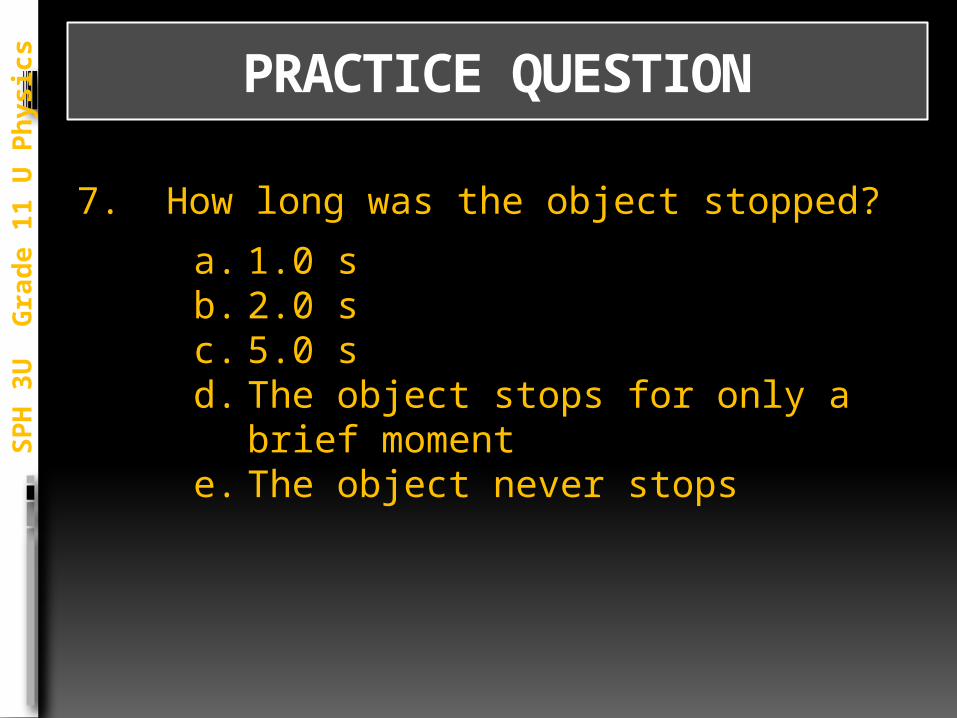
PRACTICE QUESTION
7. How long was the object stopped?
SP
H 3
U
Gra
de 1
1 U
Ph
ysic
s
a. 1.0 sb. 2.0 sc. 5.0 sd. The object stops for only a brief
momente. The object never stops
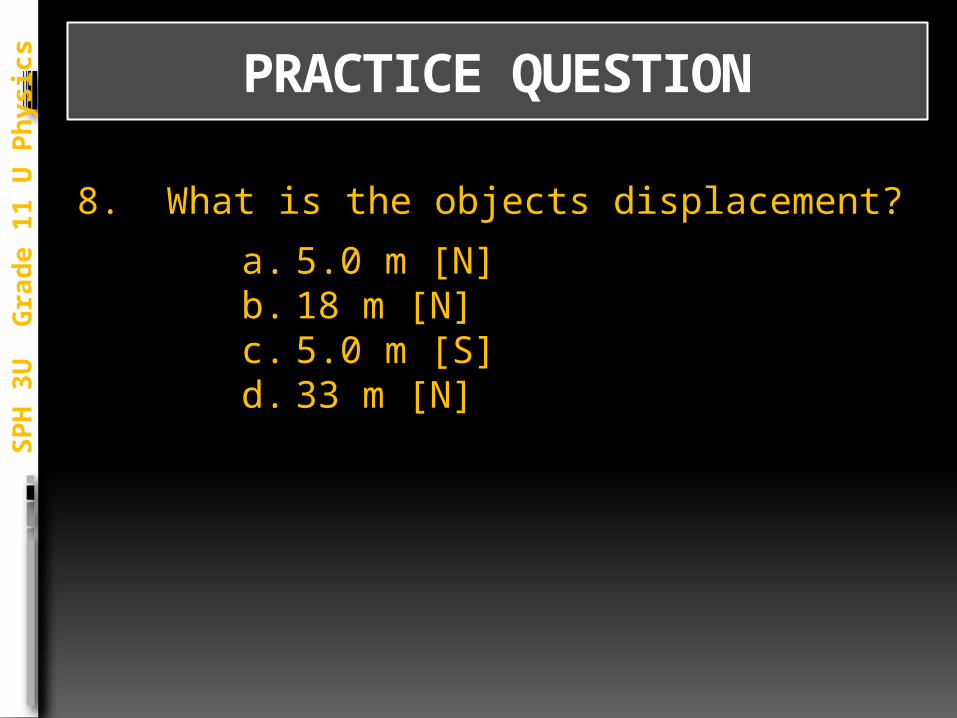
PRACTICE QUESTION
8. What is the objects displacement?
SP
H 3
U
Gra
de 1
1 U
Ph
ysic
s
a. 5.0 m [N]b. 18 m [N]c. 5.0 m [S]d. 33 m [N]
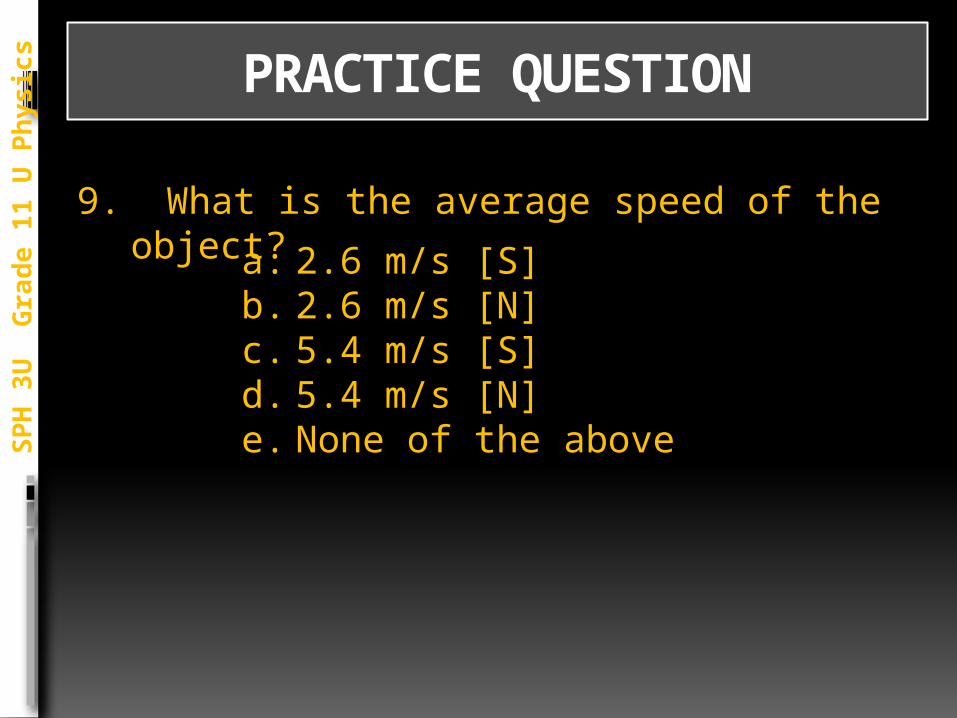
PRACTICE QUESTION
9. What is the average speed of the object?
SP
H 3
U
Gra
de 1
1 U
Ph
ysic
s
a. 2.6 m/s [S]b. 2.6 m/s [N]c. 5.4 m/s [S]d. 5.4 m/s [N]e. None of the above
PRACTICE QUESTION
10. What is the average velocity of the object?
SP
H 3
U
Gra
de 1
1 U
Ph
ysic
s
a. 2.6 m/s [N]b. 2.6 m/s [S]c. 5.4 m/s [N]d. 5.4 m/s [S]e. None of the above
HOMEWORKS
PH
3U
G
rad
e 1
1 U
Ph
ysic
s
Read pgs 21 – 35
Practice 1 & 2 on pg 29
Questions 1-4 on pg 35