Embed Size (px)
Citation preview
Linear Motion III
Acceleration, Velocity vs. Time Graphs
Average Acceleration
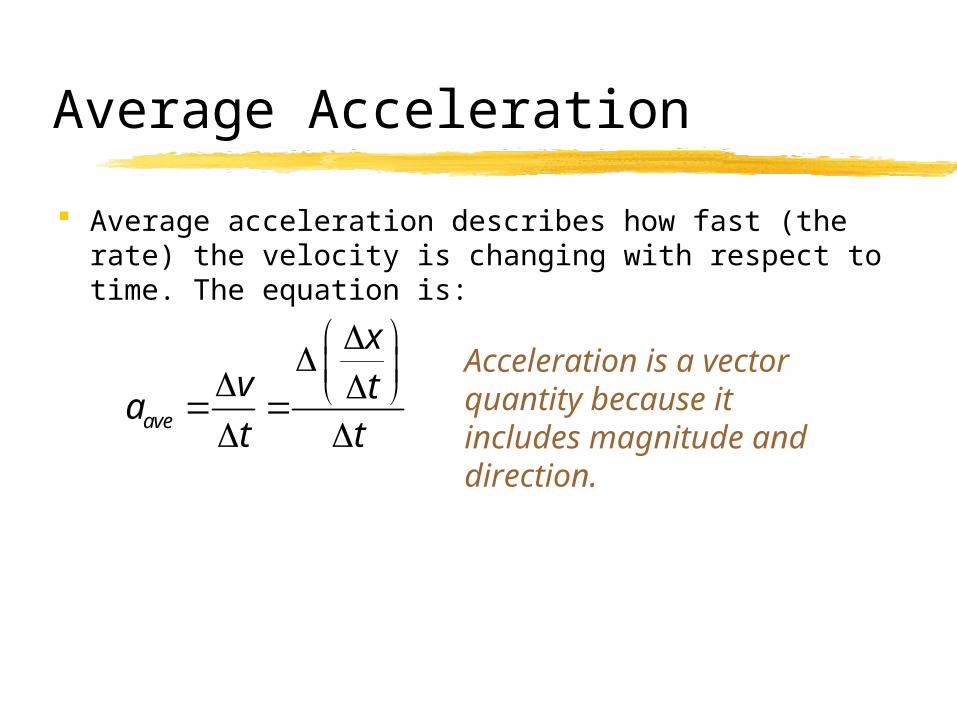
Average acceleration describes how fast (the rate) the velocity is changing with respect to time. The equation is:
Acceleration is a vector quantity because it includes magnitude and direction.
ave
xv t
at t
Example: Listen to the song, “In a Hurry” and calculate the average acceleration of the car mentioned in the lyrics.
Example: It takes a motorist half a minute to change his speed from 10 m/s to 40 m/s. What is his average acceleration?
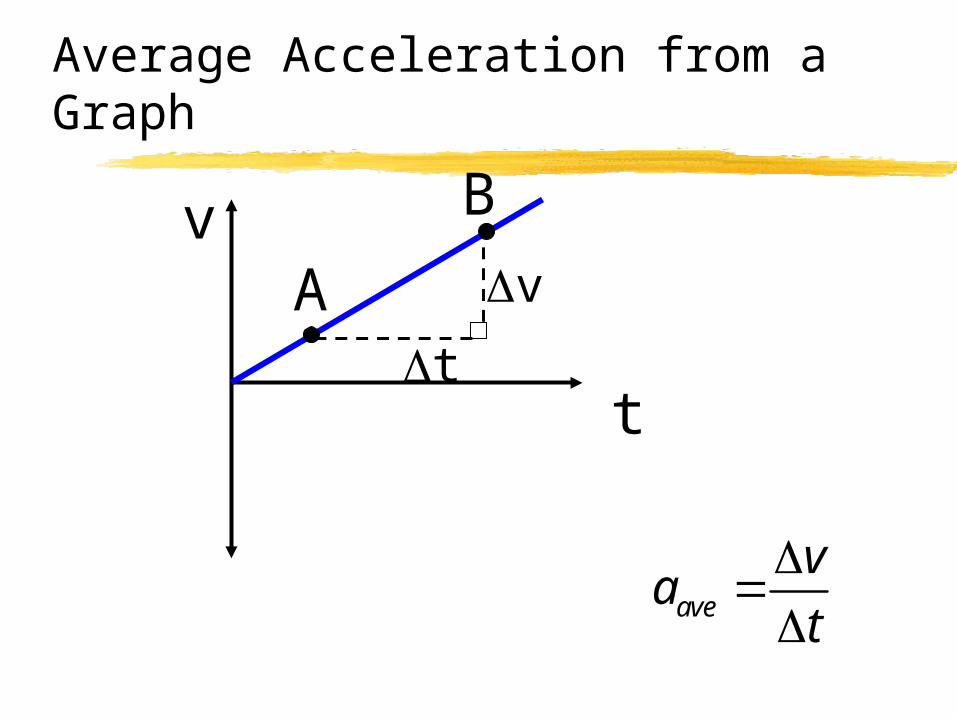
Average Acceleration from a Graph
t
vA
B
v
t
ave
va
t
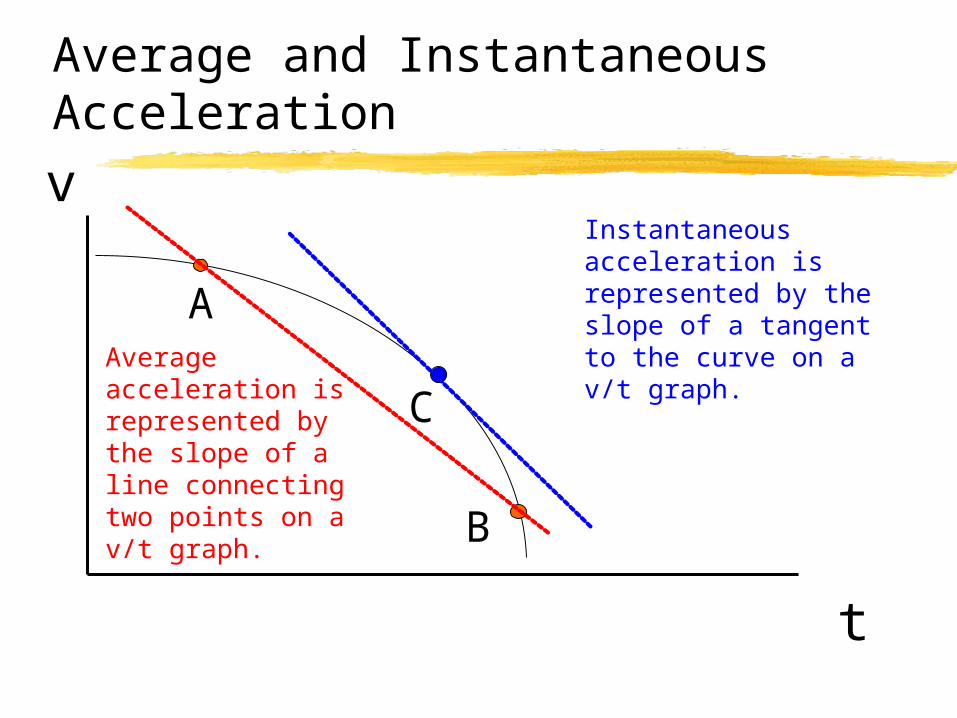
Average and Instantaneous Acceleration
t
v
Average acceleration is represented by the slope of a line connecting two points on a v/t graph.
Instantaneous acceleration is represented by the slope of a tangent to the curve on a v/t graph.
A
B
C
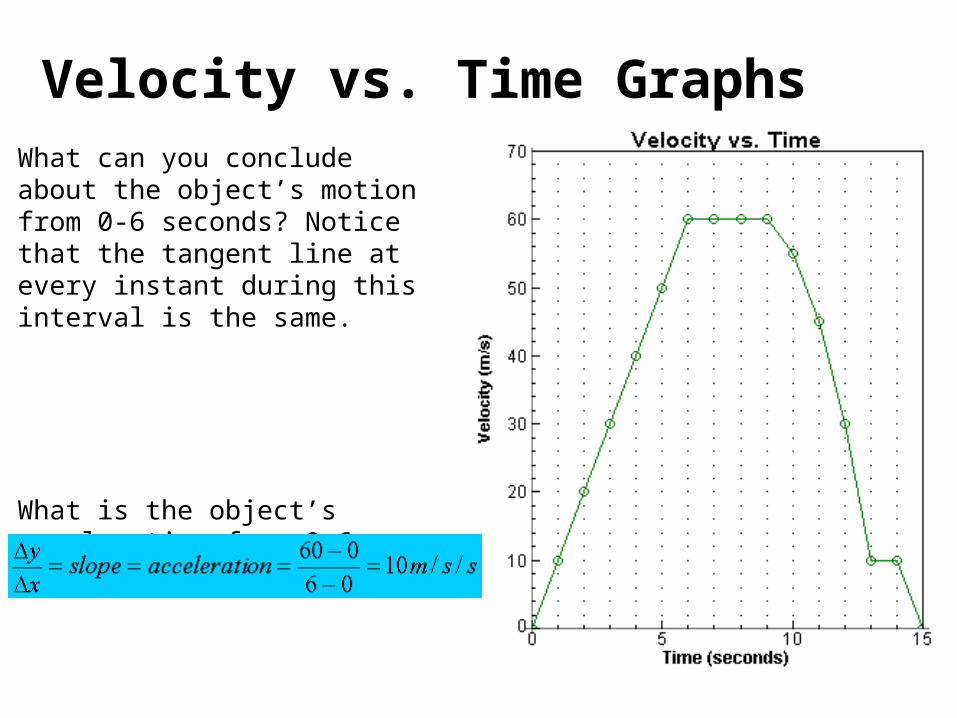
What can you conclude about the object’s motion from 0-6 seconds? Notice that the tangent line at every instant during this interval is the same.
What is the object’s acceleration from 0-6 seconds?
Velocity vs. Time Graphs
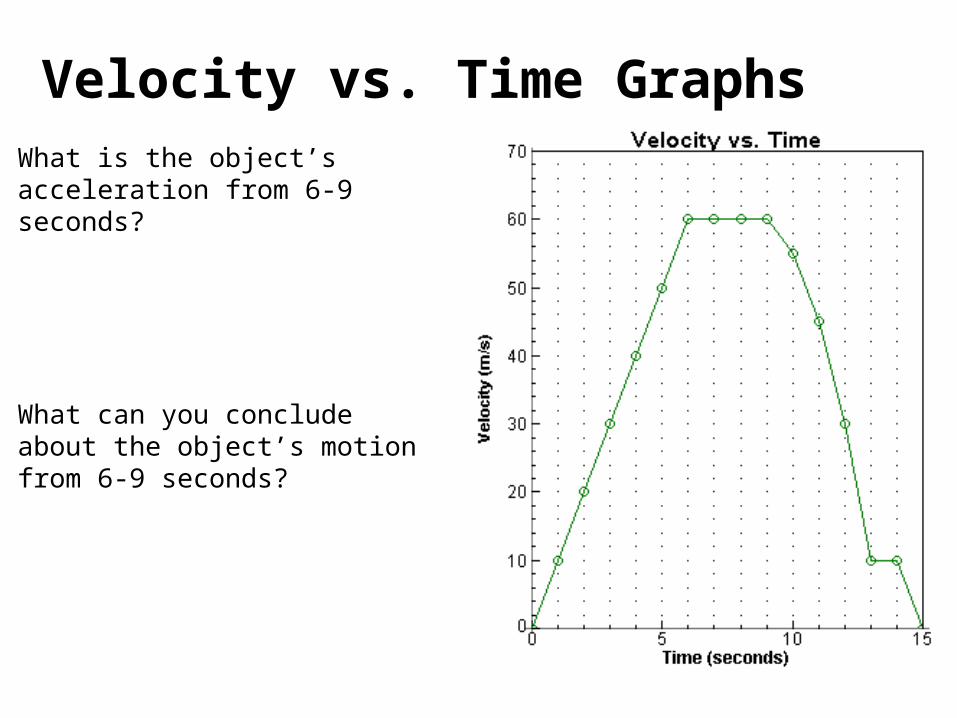
What is the object’s acceleration from 6-9 seconds?
What can you conclude about the object’s motion from 6-9 seconds?
Velocity vs. Time Graphs
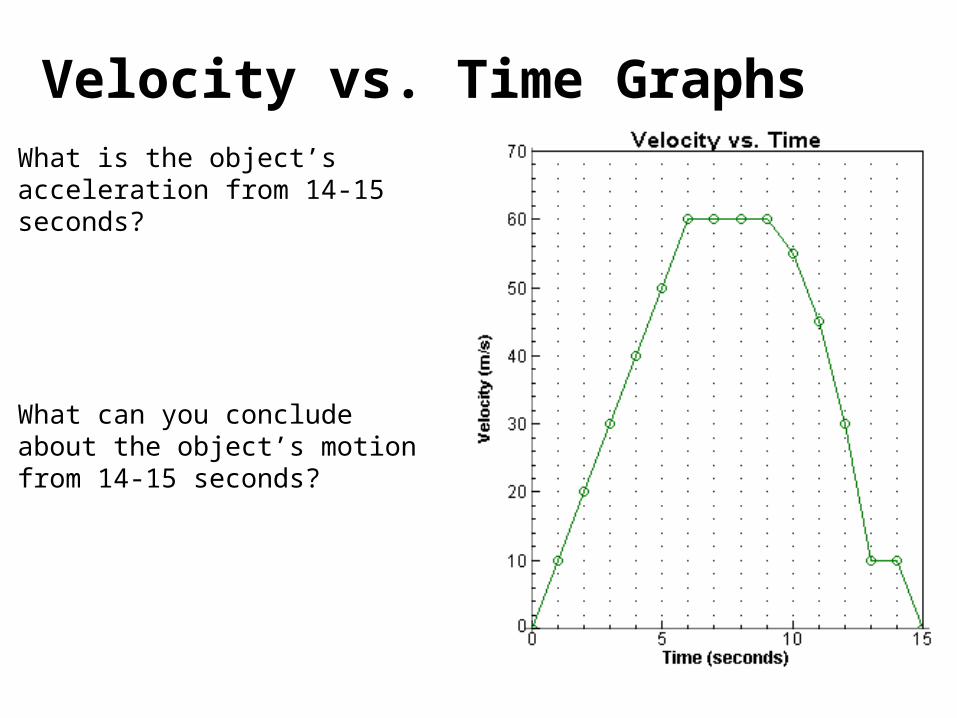
What is the object’s acceleration from 14-15 seconds?
What can you conclude about the object’s motion from 14-15 seconds?
Velocity vs. Time Graphs
Velocity vs. Time GraphsWhat can you conclude about these objects’ motions?
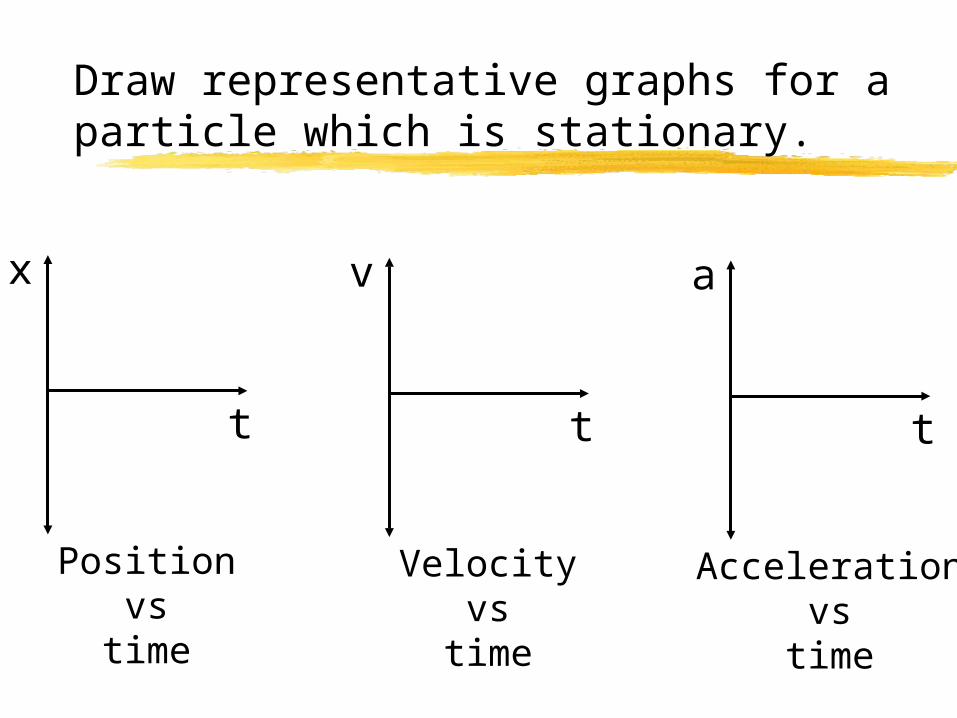
Draw representative graphs for a particle which is stationary.
x
t
Positionvs
time
v
t
Velocityvs
time
a
t
Accelerationvs
time
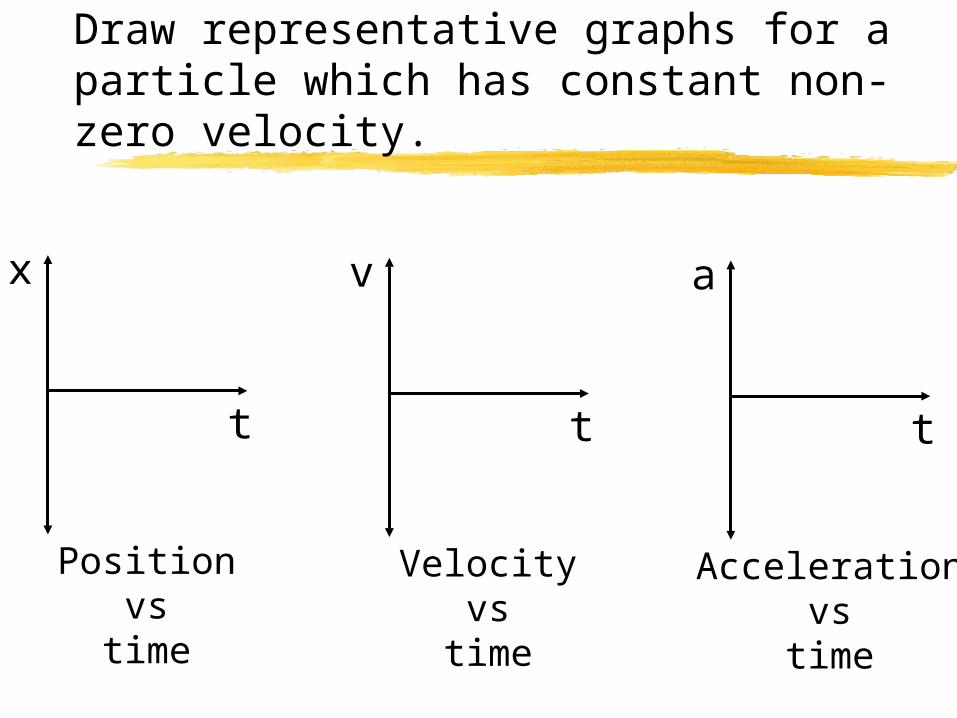
Draw representative graphs for a particle which has constant non-zero velocity.
x
t
Positionvs
time
v
t
Velocityvs
time
a
t
Accelerationvs
time
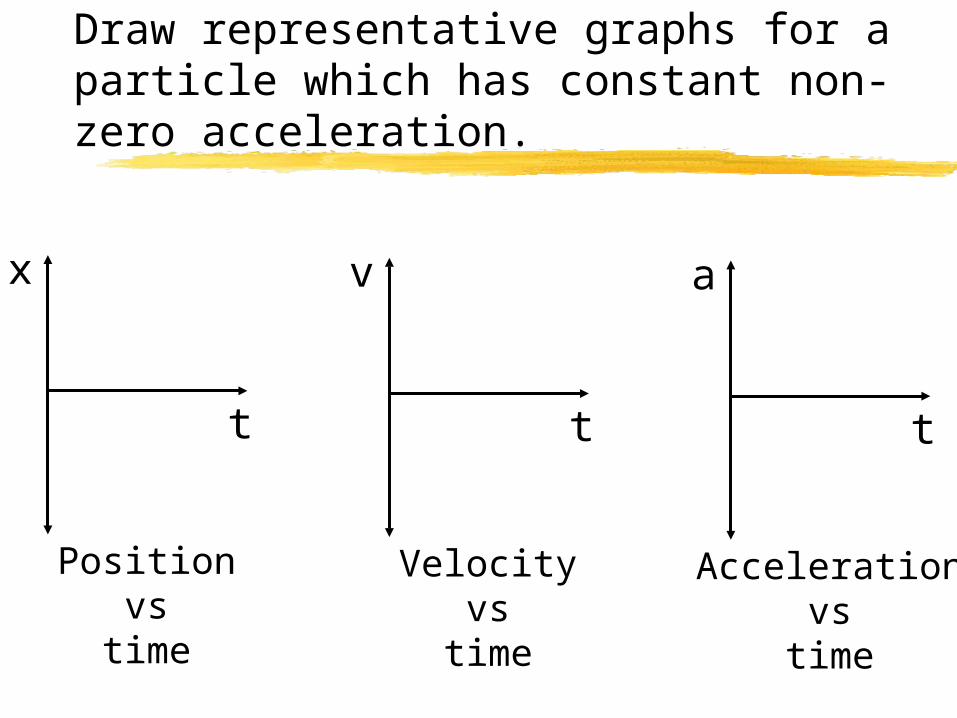
x
t
Positionvs
time
v
t
Velocityvs
time
a
t
Accelerationvs
time
Draw representative graphs for a particle which has constant non-zero acceleration.
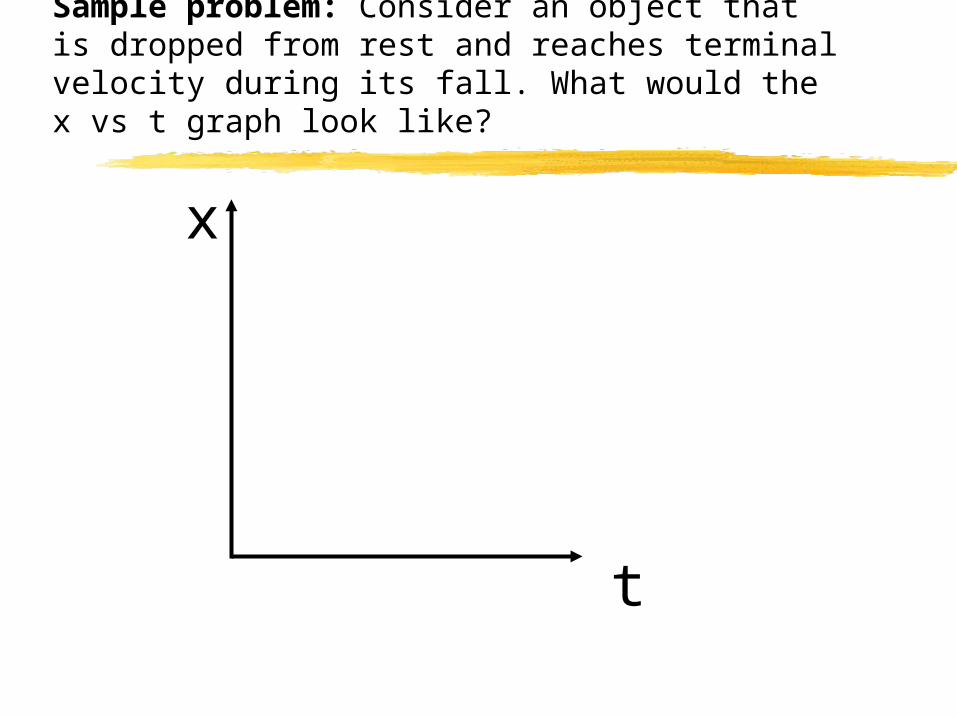
Sample problem: Consider an object that is dropped from rest and reaches terminal velocity during its fall. What would the x vs t graph look like?
t
x
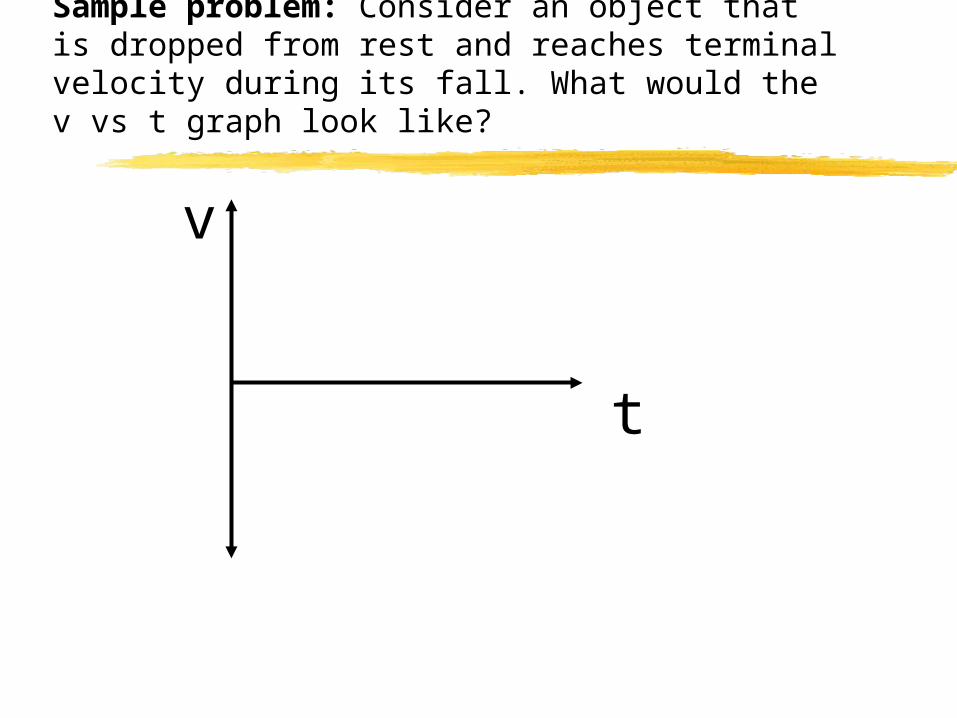
Sample problem: Consider an object that is dropped from rest and reaches terminal velocity during its fall. What would the v vs t graph look like?
t
v

Sample problem: A ball is thrown straight up and then falls straight back down and is caught a few seconds later. What would the x vs t graph look like?
t
x
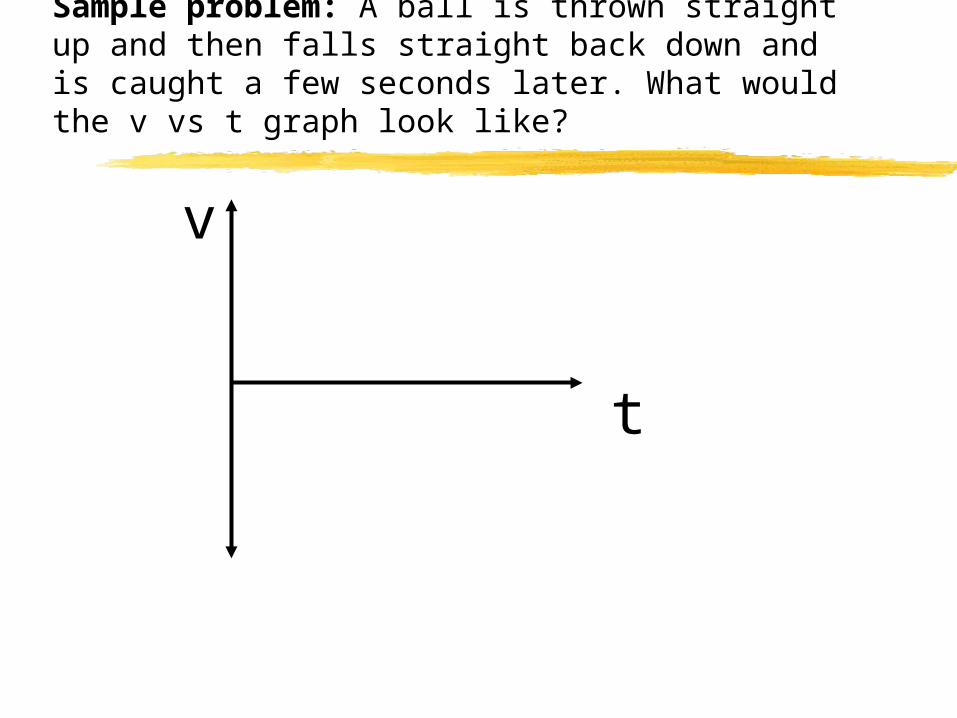
Sample problem: A ball is thrown straight up and then falls straight back down and is caught a few seconds later. What would the v vs t graph look like?
t
v
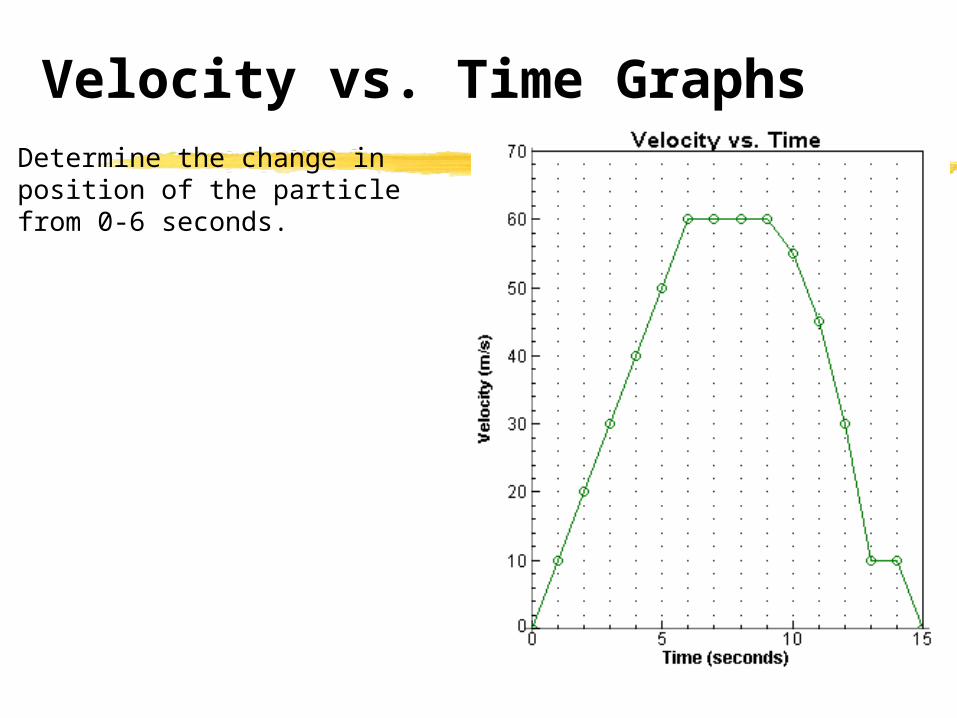
Determine the change in position of the particle from 0-6 seconds.
Velocity vs. Time Graphs
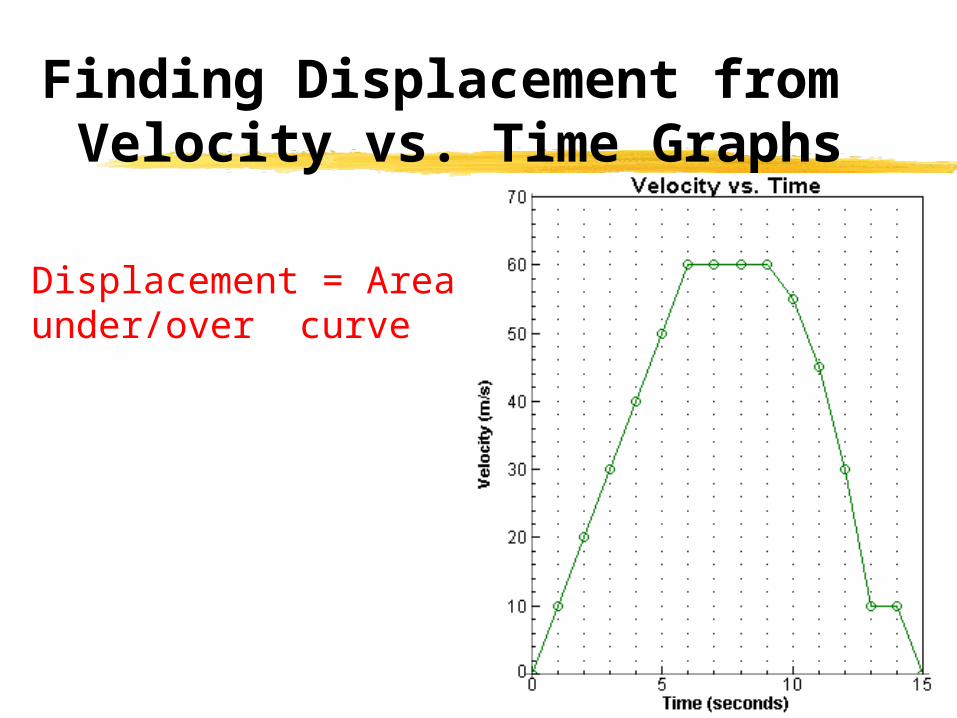
Displacement = Area under/over curve
Finding Displacement from Velocity vs. Time Graphs

Determine the change in position of the particle from 6-9 seconds.
Velocity vs. Time Graphs

Determine the change in position of the particle from 12-13 seconds.
Velocity vs. Time Graphs
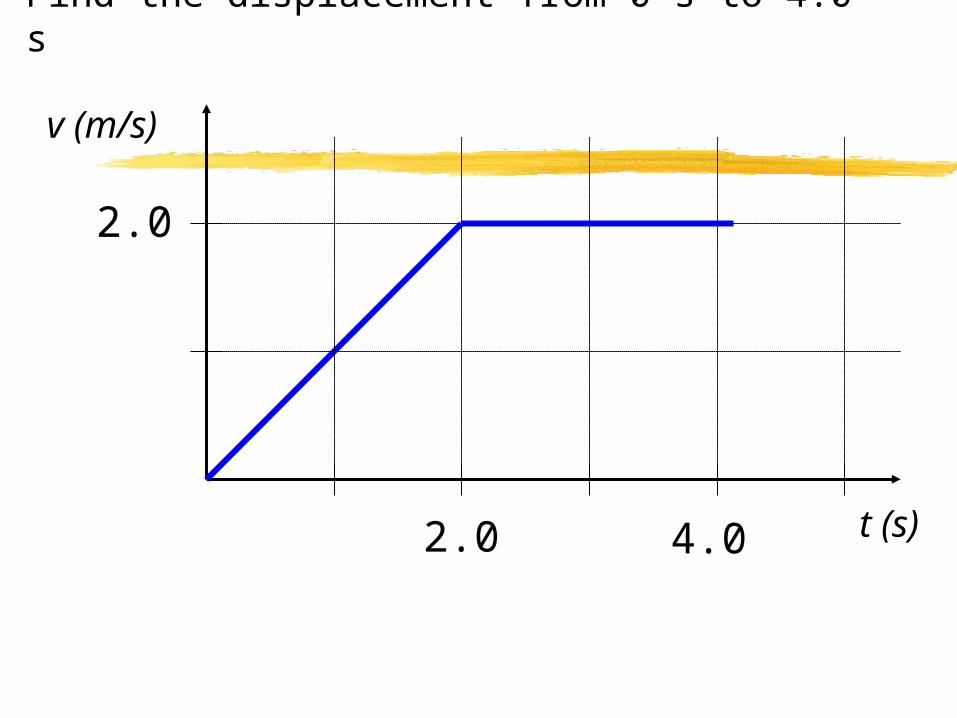
Find the displacement from 0 s to 4.0 s
v (m/s)
2.0
t (s)2.0 4.0