Embed Size (px)
Citation preview


This is an unpublished M.Sc. dissertation and is not prepared for further distribution. The
author and the promoter give the permission to use this Master dissertation for
consultation and to copy parts of it for personal use. Every other use is subject to the
copyright laws, more specifically the source must be extensively specified when using
results from this Master dissertation.
Gent,
The Promoter(s),
Prof. Dr. ir. Stefaan De Neve (LA12)
The Author
Okky Amalia
i
ACKNOWLEDGEMENT
First of all, I thank to Allah SWT for giving me the strength to complete this study. I am
sincerely grateful to Prof. Dr. ir. Stefaan De Neve, my promoter for offering me opportunity
to conduct this study, for his guidance, advise, support and patience during my thesis work.
I am also grateful to VLIR-UOS for granting me the opportunity to study in Ghent University,
Belgium. My thanks to Prof. Dr. E. Van Ranst, the head of Physical Land Resources program,
and all teaching staffs of Physical Land Resources and Bioscience Engineering who gave the
pleasure assistance during lecture.
I would like to thank Pak Sukristiyonubowo and all field workers for helping me during soil
sampling in Indonesia and also to ISRI Laboratory for providing me data of soil physical and
chemical properties. Many thanks to all laboratory staff of the Department of Soil
Management for their kind assistance and corporation, especially Luc and Sophie. Special
thanks to David, Steven, and Bram for their help on analyses procedures in the laboratory.
I would like to express my grateful to my beloved parents and brother for their patience,
support, encouragement, and understanding during my study. My sincerely thanks to my
best friend, Inda Fariani, for her support and taking care of my family. Finally, thanks to Nur
Ahyani for her valuable help and to all those who helped me in my way to make this study
success.
Gent, August 2011
Okky Amalia

ii
ABSTRACT
A comparative study of organic and conventional farming systems both in paddy and
vegetable fields was conducted to determine the effect of management practices on soil
chemical and biological properties as soil quality indicator. Seven samples from each
organic and neighbouring conventional sites in West and Central Java, Indonesia were
obtained and analyzed for soil chemical and biological properties. Soil organic C (SOC), total
N, nutrient availability (potential and available P2O5 and K2O, plant available macronutrients
and micronutrients), the activity of dehydrogenase, β-glucosidase, β-glucosaminidase,
microbial biomass C (MBC) and microbial community composition by phospholipid fatty
acid analysis were measured in this study. Moreover, the negative impact of inorganic
fertilizer application on soil pH was observed. Result showed all enzyme activities, MBC and
PLFA correlated with SOC and total N in paddy fields, while correlation of β-glucosidase and
β-glucosaminidase activity with MBC and PLFA were observed in vegetable fields. SOC and
total N combining with β-glucosidase activity, MBC and PLFA appears to be particularly
suited indicators to determine management practices impact on soil quality in paddy fields,
while in vegetable fields, suitable indicators are SOC, total N, dehydrogenase, β-
glucosaminidase activity and MBC. Higher soil organic matter, soil pH, nutrient availability,
microbial activity, microbial biomass and microbial community composition were also
detected in organic farming compared to conventional farming systems both in paddy and
vegetable fields. In conclusion, organic farming might have higher soil quality than
conventional farming systems.

iii
TABLE OF CONTENTS
ACKNOWLEDGEMENT i
ABSTRACT ii
TABLE OF CONTENTS iii
LIST OF FIGURES v
LIST OF TABLES vii
LIST OF ABBREVIATIONS viii
CHAPTER 1 INTRODUCTION 1
CHAPTER 2 LITERATURE REVIEW 3
2.1 Soil quality 3
2.2 Soil quality indicators 3
2.2.1 Chemical indicators 5
2.2.1.1 Soil organic matter 5
2.2.1.2 Soil pH 6
2.2.1.3 Nutrient availability 7
2.2.2 Physical indicators 7
2.2.3 Biological indicators 8
2.2.3.1 Enzyme activities as indicator of microbial activity 8
2.2.3.2 Microbial biomass C (MBC) 11
2.2.3.3 The soil microbial community composition 13
2.2.3.4 Soil fauna 15
2.3 Management practices and soil quality 16
2.3.1 Organic farming versus conventional farming 16
2.3.2 Conservation tillage 18
CHAPTER 3 MATERIALS AND METHODS 19
3.1 Site description 19
3.2 Soil sampling 25
3.3 Physical and chemical analyses 26
3.4 Biological analyses 28
3.4.1 Dehydrogenase activity 28
3.4.2 β-glucosidase 28
3.4.3 β-glucosaminidase 28
3.4.4 Microbial biomass C 29
3.4.5 Phospholipids fatty acids 29
3.5 Statistical analyses 30 CHAPTER 4 RESULTS 31
4.1 Soil texture 31
4.2 Soil chemical indicators 31
4.2.1 General soil properties 31
4.2.2 Plant available nutrients 32
4.3 Enzyme activities 38
4.4 Microbial biomass C 40

iv
4.5 Phospholipids fatty acids 41
CHAPTER 5 DISCUSSION 46
5.1 Soil texture 46
5.2 Soil chemicals indicators 46
5.2.1 Plant available macronutrients 47
5.2.2 Plant available micronutrients 48
5.2.3 Overview of soil chemical indicators 48 5.3 Enzyme activities 49
5.4 Microbial biomass C 51
5.5 Phospholipids fatty acids 52
5.6 Overview soil biological indicators 53 CHAPTER 6 CONCLUSION AND RECOMMENDATION 55
REFERENCES 56

v
LIST OF FIGURES
Figure 1. Soil quality framework outlining the process for selecting indicators for MDS to assess soil quality (adapted from USDA-NRCS, 2001).
5
Figure 2. Conceptual diagram of microbial contribution to C sequestration in agroecosystems (Six et al., 2006).
12
Figure 3. Location of the study area in West and Central Java, Indonesia.
19
Figure 4. Example of paddy field site (O2p).
26
Figure 5. Example of vegetable field site (O10u).
26
Figure 6. Soil texture classes of each study sites. Paired organic and conventional field site marked with the same number.
27
Figure 7. Plant available macronutrients: Ca, Mg, Na. Error bars indicate standard errors. Bars followed by * are significant at P<0.05. Colorless bars indicate site that omitted from statistic analyses.
34
Figure 8. Plant available micronutrients: Fe, Mn, Cu, Zn, B, Mo, Co, Cr, Ni. Error bars indicate standard errors. Bars followed by * are significant at P<0.05. Colorless bars indicate site that omitted from statistic analyses.
35
Figure 9. Dehydrogenase activity, error bars indicate standard errors. Bars followed by * are significant at P<0.05. Colorless bars indicate site that omitted from statistic analyses.
38
Figure 10. β-glucosidase activity, error bars indicate standard errors. Bars followed by * are significant at P<0.05. Colorless bars indicate site that omitted from statistic analyses.
39
Figure 11. β-glucosaminidase activity, error bars indicate standard errors. Bars followed by * are significant at P<0.05. Colorless bars indicate site that omitted from statistic analyses.
39
Figure 12. Microbial biomass C. Error bars indicate standard errors. Bars followed by * are significant at P<0.05. Colorless bars indicate site that omitted from statistic analyses.
40
Figure 13. Gram positive bacteria. Error bars indicate standard errors. Colorless bars indicate site that omitted from statistic analyses.
42
Figure 14. Gram negative bacteria. Error bars indicate standard errors. Colorless bars indicate site that omitted from statistic analyses.
42
Figure 15. Total bacteria. Error bars indicate standard errors. Colorless bars indicate site that omitted from statistic analyses.
42
Figure 16. Actinomycetes. Error bars indicate standard errors. Colorless bars indicate site that omitted from statistic analyses.
43

vi
Figure 17. Fungi. Error bars indicate standard errors. Colorless bars indicate site that omitted from statistic analyses.
43
Figure 18. AMF. Error bars indicate standard errors. Colorless bars indicate site that omitted from statistic analyses.
44
Figure 19. Protozoa. Error bars indicate standard errors. Colorless bars indicate site that omitted from statistic analyses.
44
Figure 20. Bacteria/Fungi ratio. Error bars indicate standard errors. Colorless bars indicate site that omitted from statistic analyses.
45

vii
LIST OF TABLES
Table 1. Management practices of selected field sites
20
Table 2. Clay content (%) comparison at each sites of organic and conventional farming systems.
31
Table 3. General soil chemical properties in the comparable organic and conventional paddy fields.
33
Table 4. General soil chemical properties in the comparable organic and conventional vegetable fields.
33
Table 5. Pearson correlation coefficients between parameter at paddy fields.
41
Table 6. Pearson correlation coefficients between parameter at vegetable fields
41
Table 7. Overview Pearson coefficients correlation between parameter at paddy fields.
45
Table 8. Overview Pearson coefficients correlation between parameter at vegetable fields.
45

viii
LIST OF ABBREVIATIONS
AMF Arbuscular mychorizal fungi
asl Above sea level
B/F Bacteria to fungi ratio
CEC Cation exchange capacity
MBC Microbial biomass carbon
PLFA Phospholipid fatty acid
PNP p-nitrophenol
PNNAG p-nitrophenyl-N-acetyl-β-glucosaminidase
SOC Soil organic carbon
SOM Soil organic matter
TPF Triphenyl formazan

1
CHAPTER 1 INTRODUCTION
Worldwide increasing pressure from population growth brings the consequence of
increasing food needs. Shifting to intensive farming has been globally practiced, including in
Asia, to boost the land production and crops yields in order to meet the food demands.
Strong population growth in Indonesia, 1.49% per year, with 237.556.363 inhabitants
encourages to optimize land utilization to meet the demand (Central Bureau of Statistics of
Indonesia, 2011). Verburg et al. (1999) observed that the increasing population pressure in
Java, one of the major islands in Indonesia which are densely populated, has caused
agricultural land use to become more intensive. Now, more and more evidence shows that
the intensification of agriculture has negative impacts such as increased soil erosion,
decreased soil fertility, soil and groundwater pollution, reduced biodiversity, etc.
Soil management practices affect soil chemical, physical and biological properties.
There are several agricultural management systems which differ fundamentally with
respect to e.g. soil management practices. Two important examples are organic and
conventional farming.
Conventional farming differs from organic farming system mainly in tillage methods,
crop rotations, fertilizer applications, and pest control methods. Whereas conventional
farming systems use chemical fertilizers and pesticides often in large amount, organic
farming systems avoid or largely exclude their use by relying upon sound crop rotations,
manuring, organic fertilizers, and biological pest control to maintain soil productivity,
supply plant nutrients, and control pests. According to Pimentel et al. (1995) in Mäder et al.
(2002), intensive agriculture has increased the crop yields but posed severe environmental
problems. When improperly managed, soil can become eroded, polluted, or degraded. The
concern and awareness to prevent the environment from degradation has encouraged
people to become increasingly interested in organic farming systems and led a significant
number of farmers worldwide to convert from conventional to organic farming systems.
The changes in soil properties and soil processes as a result of farming systems can be
considered as indicators to assess soil quality. Agro-ecosystem management can affect soil
quality in the long-term at a rate that is largely dependent on climate conditions and
farming systems (Mazzoncini et al., 2010). The important thing to consider in the selection
of soil quality indicators is responsiveness to any changes in the soil. The change of soil
physical and chemical properties are generally slow, so the change of soil biological
2
properties by soil disturbances should receive special attention due to its rapid response to
ecological changes (Kandeler et al., 1999).
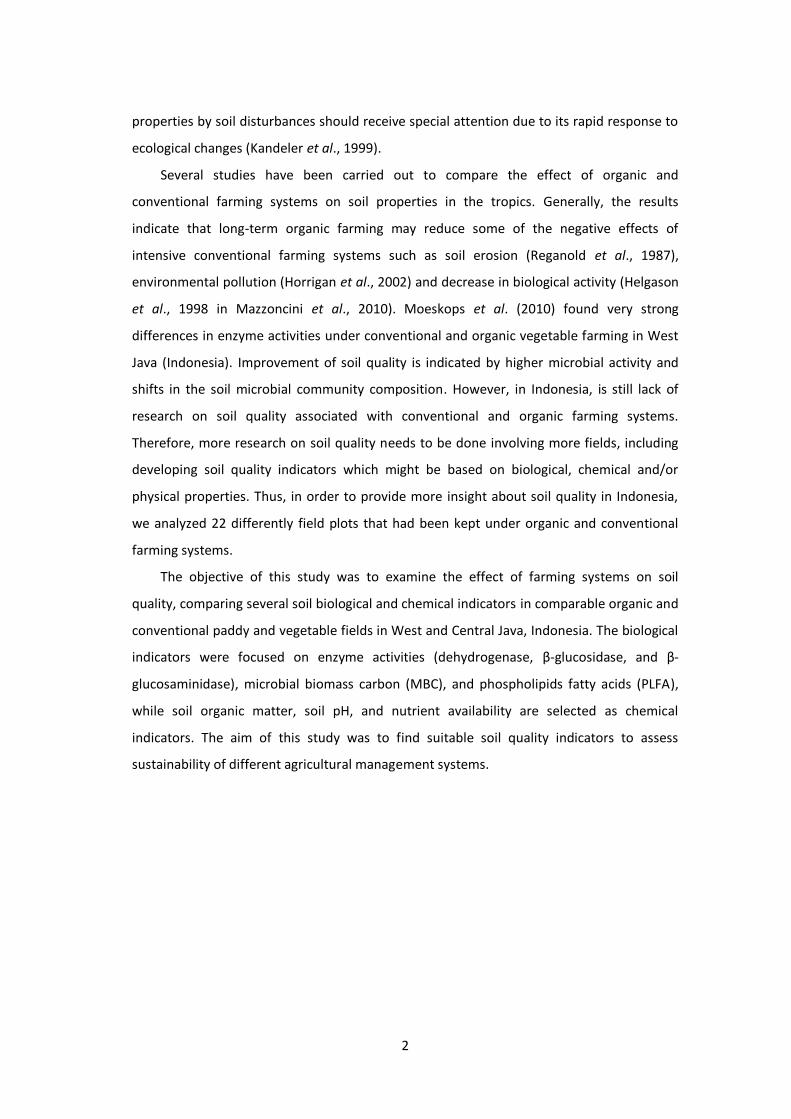
Several studies have been carried out to compare the effect of organic and
conventional farming systems on soil properties in the tropics. Generally, the results
indicate that long-term organic farming may reduce some of the negative effects of
intensive conventional farming systems such as soil erosion (Reganold et al., 1987),
environmental pollution (Horrigan et al., 2002) and decrease in biological activity (Helgason
et al., 1998 in Mazzoncini et al., 2010). Moeskops et al. (2010) found very strong
differences in enzyme activities under conventional and organic vegetable farming in West
Java (Indonesia). Improvement of soil quality is indicated by higher microbial activity and
shifts in the soil microbial community composition. However, in Indonesia, is still lack of
research on soil quality associated with conventional and organic farming systems.
Therefore, more research on soil quality needs to be done involving more fields, including
developing soil quality indicators which might be based on biological, chemical and/or
physical properties. Thus, in order to provide more insight about soil quality in Indonesia,
we analyzed 22 differently field plots that had been kept under organic and conventional
farming systems.
The objective of this study was to examine the effect of farming systems on soil
quality, comparing several soil biological and chemical indicators in comparable organic and
conventional paddy and vegetable fields in West and Central Java, Indonesia. The biological
indicators were focused on enzyme activities (dehydrogenase, β-glucosidase, and β-
glucosaminidase), microbial biomass carbon (MBC), and phospholipids fatty acids (PLFA),
while soil organic matter, soil pH, and nutrient availability are selected as chemical
indicators. The aim of this study was to find suitable soil quality indicators to assess
sustainability of different agricultural management systems.

3
CHAPTER 2 LITERATURE REVIEW
2.1 Soil quality
The term soil quality has been used to describe the combination of chemical, physical,
and biological characteristics that enables soils to perform a wide range of functions
(Evanylo and McGuinn, 2009) and to indicate the capacity of soil to function as a vital living
systems to sustain biological productivity, promote environmental quality, and maintain
plant and animal health (Doran and Zeiss, 2000).
Basically, soil quality is a concept about fitness of the soil as an indicator to evaluate
sustainable land management in agro-ecosystems (Herrick, 2000; Larson and Pierce, 1991
in Carter, 2002). The soil quality concept originated from the concern related to soil
degradation and the need for improving sustainable soil management in agro-ecosystems,
with respect to specific functions or uses of soil. Interest in evaluating the quality and
health of our soil resources has been stimulated by increasing awareness that soil is a
critically important component of the earth’s biosphere, functioning not only in the
production of food and fiber but also in the maintenance of local, regional, and global
environmental quality (Glanz, 1995 in Doran and Zeiss, 2000). Moreover, soil is considered
as a non-renewable natural resource.
Studying soil quality is about understanding and establishing the link among all the
dynamic processes in the soil system, involving soil properties (as indicators) which interact
with environmental factors as a result of management practices. Thus, soil quality has
different meanings in accordance with the perspective of the person and depends on the
scale of concern. From literature, we can deduce that the main point of soil quality is about
soil performance considering all inherent and dynamic soil characteristics that are affected
by soil management practices (chemical, physical, and biological) to conduct its function in
ecosystem.
2.2 Soil quality indicators
The types of soil quality indicators that are most useful depend on the function of soil
for which soil quality is being evaluated. Dynamic soil properties can help determine how
well a soil performs ecological services or functions essential to people and their
environment (USDA-NRCS, 1996).
Soil functions include: media for plant growth; sustain biological activity, diversity, and
productivity; regulate and partition water flow through the environment; filter and buffer,

4
degrade, immobilize, and detoxify organic and inorganic materials, including agricultural,
industrial and municipal by-products and atmospheric deposition; store and cycle nutrients;
and provide physical stability and support for plants or socioeconomic structures associated
with human habitation.
Soil quality depends on a large number of physical, chemical and biological soil
properties, and its characterization requires the selection of indicators most sensitive to
changes in management practices (Elliot, 1994 in Marinari et al., 2006). The proper
approach to define soil quality should be provided by good soil quality indicators. Criteria of
good soil quality indicators include:
Describe the major ecological processes in soil (Doran and Safley, 1997 in Marinari et al.,
2006);
Give some measure of the capacity of the soil to function with respect to plant and
biological productivity, environmental quality and human and animal health;
Used to assess the change in soil function within land use or ecosystem boundaries
(Seybold et al., 1997);
Easy and inexpensive to measure; and
Sensitive to changes due to management practices (Doran and Zeiss, 2000).
Soil quality indicators are not always too clearly designated since soil properties can
interact in complex ways and affect multiple soil functions. For example, organic matter is
the most commonly used indicator in soil quality assessment. Organic matter, as chemical
indicator, affects other indicators, e.g. physical indicators such as aggregate stability, and
biological indicators such as nutrient cycling, so selection of soil indicators is necessary. The
chosen indicators should be considered to location and the purpose of the assessment.
The selection of soil indicators can be done by making a minimum data set (MDS)
which is the smallest set of soil indicators needed to measure soil quality. The purposes of
MDS are to obtain a comprehensive understanding in the soil evaluated, to identify locally
relevant indicators selected, and to evaluate the link between indicators and significant soil
and plant properties for the region. The simple flow scheme of a framework to select
indicators and to create a MDS is shown in Figure 1.
The MDS proposed by Doran and Parkin (1996) for soil quality measurement are
texture, depth of soil, infiltration, bulk density, water holding capacity, soil organic matter,
soil pH, electrical conductivity, microbial biomass C and N, potentially mineralizable N and
soil respiration. Each MDS is adjusted to a particular region or soil map unit (soil type) and

5
includes only those properties relevant to the soil types, farming system, and land uses of
the areas being evaluated.
Figure 1. Soil quality framework outlining the process for selecting indicators for
MDS to assess soil quality (adapted from USDA-NRCS, 2001).
In the following paragraphs, we will discuss a number of important soil quality
indicators with the emphasis on biological soil indicators.
2.2.1 Chemical indicators
Soil chemical indicators include soil pH, soil organic matter, organic carbon, cation
exchange capacity (CEC), N-P-K concentrations, salinity, electrical conductivity and
concentrations of elements that may be potential contaminants (heavy metals, radioactive
compounds, etc) or those that are needed for plant growth. Standard soil fertility attributes
(soil pH, organic carbon, available N, P, and K) are the most important factors in terms of
plant growth, crop production and microbial diversity and function (Chen, 1999).
2.2.1.1 Soil organic matter
Soil organic matter (SOM) plays important roles as an indicator of soil quality, and it is
obviously strongly related to other indicators such as physical soil structure and biological
activity of the soil. The improvement of soil quality can be indicated by SOM because it
regulates water movement and water holding capacity, provides nutrients for plants and

6
controls soil structural stability by affecting the quantity of macro- and micro-aggregates
(Handayani et al., 2008).
SOM content is a function of organic matter inputs (residues and roots) and litter
decomposition. The total organic matter can be reflected by the amount of organic carbon
and total nitrogen in soil. Organic matter is therefore often considered as the best indicator
in response to changes in management practices. However, despite its importance, the
level of total organic matter is only a good long-term indicator because its changes only
very slowly in response to management (Lewandowski and Zumwinkl, 1999).
Total organic matter requires decades to change significantly in response to most
management changes. Measurement of SOM fractions can give a better insight of soil
quality than the measurement of total organic matter because the active fractions of
organic matter are expected to give a quick response to management practices. Several
authors reported that particulate organic matter (POM) or light fraction organic matter
(LFOM) often respond more rapidly to the land management changes compared to total
soil organic matter (Cambardella and Elliott, 1992; Gregorich and Janzen, 1996; Six et al.,
1998). Another alternative measurement is hot water extractable C (HWC). HWC as a
component of the SOM is considered as a sensitive measure for determining subtle change
within an ecosystem since it tends to relate well with microbial biomass C (Sparling et al.,
1998) and can be applied for determining the available pool of organic N (Keeney and
Bremner, 1966). Ghani et al. (2003) have been found that HWC was one of the most
sensitive and consistent indicators examined at 52 sites under different management
practices. HWC was positively correlated with microbial biomass C, mineralizable N,
extractable total carbohydrates, water soluble C and total organic C. They suggested that
HWC could be used as an integrated measure of soil quality.
2.2.1.2 Soil pH
Soil pH can be a good soil quality indicator depending on specific situations, not only
on soil type but also very much on the type of crops, as every crop has different optimum
pH range to grow. The availability of nutrients in soil are dependent of soil pH (Karlen et al.,
1997), and different nutrients have different pH ranges for optimum availability for plant
uptake. Soil pH is also related to base saturation, as the amount of basic cations increases,
the pH increases. Smith and Doran (1996) suggested that measurement of pH provides
valuable information for assessing soil condition for plant growth, nutrient cycling and
biological activity.

7
2.2.1.3 Nutrient availability
Nutrient availability is influenced by physical properties (e.g. soil texture), biological
properties (e.g. microbial activity, soil fauna) and chemical properties (e.g. soil pH, soil
organic C, total exchangeable bases) and also by management practices.
In farming systems, application of nutrients as an input are important to supply and
maintain soil nutrient availability for plant growth in order to obtain good crop yields. The
source of nutrients can be from both inorganic (chemical fertilizer) and organic fertilizers
(manure, compost, cover crops). Therefore it is possible to alter the pool of available
nutrients by adding inorganic fertilizers, incorporating cover crops, and using other organic
materials in form of manures and composts (Stocking, 2003).
As mentioned before, the standard soil fertility attributes for soil quality indicator are
available N, P, and K. These three elements are major elements needed for plant growth.
Nitrogen availability is a common indicator of soil quality. For example, nitrogen
mineralization (Nmin) can be used as an index of N availability. It is influenced by quality of
soil organic matter, microbial biomass and activity and soil temperature and moisture
(Knoepp et al., 2000).
Besides the macronutrients required for plant growth, micronutrients sometimes go
unnoticed even though micronutrients can be a limitation to achieve a high crop yield.
Intensive agriculture with the application of inorganic fertilizers without micronutrients
contents may lead to micronutrients depletion in the soil, giving eventually deficiency of
micronutrients. Rodrigues De Lima et al. (2008), selected OM and micronutrients (Cu, Zn,
and Mn) as indicator in a minimum data set for soil quality assessment in rice production
systems and they found that micronutrients were the most powerful soil properties in
distinguishing among different soil textural classes and management systems.
2.2.2 Physical indicators
Some physical indicators that have been selected by Doran and Parkin (1994) for the
assessment of soil quality are depth of soil, topsoil or rooting; infiltration; soil bulk density;
and water holding capacity.
Soil physical indicators provide information related to the soil ability to arrangement of
solid particles and pores, aeration and soil hydrological status, and capacity of soil to retain
water. Soil physical properties also affect nutrient availability and plant growth through the
process of water movement which is influenced by soil structure. Physical indicators

8
primarily reflect limitations to root growth, seedling emergence, infiltration, or movement
of water within the soil profile.
Bulk density is an important physical indicator of soil quality because density is
influenced by tillage and soil organisms, and density affects water infiltration and root
development. Therefore soil bulk density is an indicator of tillage, biological activity, water
movement, and root growth (Lewandowski and Zumwinkl, 1999).
2.2.3 Biological indicators
Biological indicators include measurements of micro and macro-organisms, their
activity, or byproducts. Abundance and diversity of soil microorganisms (e.g. fungi and
bacteria) and fauna (e.g. earthworms, insects, and arthropods) can be used as indicator of
soil biological activity because they respond sensitively to anthropogenic disturbance. Soil
respiration rate is an indicator of biological activity which reflects the rate of organic matter
decomposition (Evanylo and McGuinn, 2009). Doran and Parkin (1994) proposed some
biological indicators of soil quality, including: microbial carbon and nitrogen; potential
mineralizable nitrogen (anaerobic incubation); and soil respiration rate.
Castillo and Joergensen (2001) stated that soil biological properties play an important
role as indicators of changing soil fertility and soil quality. In much of the literature,
biological indicators are the most commonly used to assess the soil quality. According to
Doran and Zeiss (2000), soil organisms are the most useful indicators of sustainable land
management.
In this study, the soil biological indicators will focus on microbial aspects because soil
microorganisms generally are the most sensitive indicators to any slight modification in soil
so they fulfill the important criteria of good soil quality indicator as mentioned in a previous
subchapter. In addition, the microbial measurement methods are more or less
standardized. One of the studies has shown that parameters associated with
microbiological activity were more sensitive and rapid indicators than chemical properties
(soil C and N stocks) as effects of soil management, demonstrating their usefulness as
indicators of soil quality in the tropics (Franchini et al., 2007).
2.2.3.1 Enzyme activities as indicator of microbial activity
Soil microorganisms play a vital role in organic matter decomposition and nutrient
cycling. Their activities are involved in regulating processes related to nutrients availability
in soil for plant uptake. Microbial activity and biochemical characteristics are used as

9
potential indicators of soil quality, even if soil quality depends on a complex of physical,
chemical and biological properties (Kennedy and Papendick, 1995). The rationale for the
use of microbial and biochemical characteristics as soil quality indicators is their central role
in cycling of C and N and their sensitivity to changes in the soil environment (Nannipieri et
al., 1990).
Soil enzymes play a key role in biochemical functions in the overall process of nutrient
cycling. They are catalyzing important reactions necessary for soil microorganism living
processes and stabilization of soil structure, decomposition of organic wastes, formation of
organic matter and nutrient cycling (Dick et al., 1994). Their activities reveal the functional
diversity and capacity of soil (Naseby and Lynch, 2002).
Enzymes can originate from plants, animals, and microorganisms and they can be
found as both intracellular and extracellular enzymes. The activities of enzymes in soil are
affected by different factors ranging from soil management practices, type of vegetation,
environmental conditions, soil types, organic matter content and structure, trace elements,
and mainly by pH changes in soil solution. Enzyme activities can provide indication to subtle
alteration of soil quality (Pascual et al., 2000).
The reason behind the wide use of enzyme activities as soil quality indicator in much
research is thus due to their crucial role in soil biological activities, but also to the ease of
measurement and the rapid response to changes in soil management practices (Dick, 1994;
Dick, 1997; Bandick and Dick, 1999). In several studies, the response of enzyme activities
has also been used as indicator to compare soil management practices such as organic
versus conventional farming systems.
Dehydrogenase
Dehydrogenase is commonly used as biological activity indicator in soil. This enzyme is
considered as an integral part of intact cells but it might accumulate extracellularly
accumulated in soil following cell lysis, associated with organic matter or colloidal surfaces
(Nannipieri et al., 2002). Dehydrogenase activity represents the intracellular flux of
electrons to O2 and is due to the activity of several intracellular enzymes catalyzing the
transfer of hydrogen and electrons from one compound to another which is part of
respiration pathway of soil microorganisms (Nannipieri et al., 1990).
Dehydrogenase activity in the soil is very important as it may give indications of the
soil potential to support biochemical processes which are essential for maintaining soil

10
fertility. In particular, dehydrogenase enzyme activity is often used as a measure of the
effects caused by pesticides and trace elements (Frank and Malkomes, 1993).
β-glucosidase
This enzyme is produced by plants, animals, fungi and bacteria. β-glucosidase plays an
important role in soils because it is involved in catalyzing the hydrolysis and biodegradation
of various β-glucosides present in plant debris decomposing in the ecosystem (Ajwa and
Tabatabai, 1994; Martinez and Tabatabai, 1997). Its final product is glucose (Esen, 1993).
β-glucosidase activities may give a reflection of past biological activity, the capacity of
soil to stabilize the soil organic matter, and can be used to detect management effect on
soils (Ndiaye et al., 2000). Soil changes, e.g. soil pH (Acosta-Martinez and Tabatabai, 2000)
and soil organic carbon (Dick et al., 1996), as affected by management practices can be
sensitively indicated by this enzyme, thus it has been proposed as a good soil biochemical
indicator.
β-glucosaminidase
This enzyme is found in bacteria, fungi, plants and invertebrates such as protozoans,
arachnids, insects, crustaceans and nematodes (Trudel and Asselin, 1989), as well as in
humans (Neufeld, 1989). β-glucosaminidase belongs to one of the three chitinases that
degrade chitin which is the second most abundant biopolymer on earth.
Activities of N-acetyl-β-D-glucosaminidase (NAGase) may be involved in N-acquiring
activities of microorganism (Sinsabaugh and Moorhead, 1995). They hydrolyze N-acetyl-β-
D-glucosamine (NAG) residues from the terminal non-reducing ends of
chitooligosaccharides. The activities of this enzyme were also highly correlated with fungal
biomass and have been proposed to be used as a semi-quantitative indicator of soil fungal
biomass (Miller et al., 1998). Chitin, as a major structural component in insects and fungal
cell walls, serves as an important transient pool of organic C and N in soils (Wood et al.,
1994). It has been suggested that the activity of this enzyme could be used as an index of N
mineralization in soils since Ekenler and Tabatabai (2002) found significant correlation
between this enzyme and N mineralization in soils under different cropping systems. Thus,
β-glucosaminidase plays an important role in both C and N cycling in soil. It is also known
that β-glucosaminidase may be involved in suppressing plant pathogenic fungi (Parham and
Deng, 2000).

11
Other enzymes
Other groups of enzymes that are used as soil quality indicators are arylsulphatases,
phosphatase, protease, amylase, cellulase, chitinase, and urease. They are known also as
enzymes with capability to influence the nutrient availability in soil.
Soil sulphur availability, in the form of SO42-, depends on arylsulphatase activity which
is involved in the mineralization or mobilization process of sulphur esters (Fitzgerald, 1976)
which releases SO4-S as a byproduct (Dodgson et al., 1982). Phosphatases enhance the
solubilization and remobilization of phosphate in soil when deficiency of P occurs, thus
influencing the ability of the plant to cope with P-stressed condition (Muchhal et al., 1996).
Protease enzymes in soil play a significant role in N mineralization (Ladd and Jackson, 1982),
while urease is responsible for the hydrolysis of urea fertilizer into NH3 and CO2 with a
concomitant rise of soil pH (Byrnes and Amberger, 1989) and also can be considered as an
important enzyme regulating the N supply for plants after urea fertilization. Amylase (α and
β-amylase) can be synthesized by plants, animals and microorganisms (Thoma, et al., 1971).
This enzyme plays a role in the breakdown of starch. Celullases are groups of enzymes that
catalyze the degradation of cellulose (Deng and Tabatabai 1994), the most abundant
organic compound in the biosphere. Chitinase enzymes are considered as key enzymes
responsible in hydrolysis and degradation of chitin. This enzyme also acts as biological
agents involved in the defense of plant against pest or pathogen infection (Desphande,
1986) through antibiosis or competition mechanisms.
2.2.3.2 Microbial biomass C (MBC)
Soil microbial biomass is the living part of soil organic matter, excluding plant roots and
multi cellular fauna. Its content and activity are closely related to the organic C content in
soil. In general 1-3% of total soil C and 5% of total soil N is soil microbial biomass C and N
respectively, and they are often considered as the most labile C and N pools in soils
(Jenkinson and Ladd, 1981). Therefore the nutrient availability and productivity of agro
ecosystems mainly is thought to depend on the size and activity of the microbial biomass
(Friedel et al., 1996). Six et al. (2006) stated that the microbial contribution to soil C storage
is governed by the interactions between the amount of microbial biomass, microbial
community structure, microbial byproducts, and soil properties such as texture, clay
mineralogy, pore-size distribution, and aggregate dynamics. They summarized the
processes of microbial contribution to C sequestration in agroecosystems into a conceptual
diagram (Figure 2).

12
Microbial C pool sizes in Figure 2 are indicated by the relative size of the boxes, and
the relative rate of C transfer from one pool to another (including CO2 evolution) is
represented by arrow thickness. In Step I, substrate C is partitioned between bacterial and
fungal biomass. The amount of C incorporated into biomass and metabolite production
versus that lost as CO2 is dependent on the microbial growth efficiency of the microbial
community. The amount of bacterial versus fungal biomass is also determined by the
relative degree of protection conferred by the soil matrix (characterized by pore and
aggregate size distribution and by clay type and content). In Step II, the rate of transfer of
microbial biomass C to microbially derived organic matter is influenced by the chemical
recalcitrance of microbial products, the sensitivity of decomposition to (micro)climatic
factors, and differential interactions between bacterial and fungal products and the soil
matrix. They suggest that a fungal dominated microbial community improves the physical
environment for C stabilization and produces more protected and stable C.
Figure 2. Conceptual diagram of microbial contribution to C sequestration in agroecosystems (Six et al., 2006).
The size, dynamics and composition of soil microbial biomass is dictated by a variety of
soil and environmental parameters, for example soil texture and structure, pH, air and

13
moisture contents, soil temperature and redox potential (Shannon et al., 2002).
Additionally, the dynamic process and quick response of microbial biomass turnover are
affected by changes in environmental condition, i.e. climate, input of nutrients, and
disturbance. Baaru et al., (2007) found that microbial biomass was greatly influenced by the
quality of the organic inputs and time. Lupwayi et al. (2001) noted that soil tillage impacted
the size and diversity of microbial biomass.
Microbial biomass C determinations may provide estimation of the net flux of carbon
through microbial pools and it reflects the contribution of microorganisms as both a source
and a sink of carbon in soils. Thus the MBC can be used as indicator of changes in soil
organic matter content.
2.2.3.3 The soil microbial community composition
Measurement of the microbial community composition contributing to soil processes
has the potential to provide particularly rapid and sensitive indication of soil quality
alteration. Soil microbial community can be used as a picture of microbial diversity, which is
strongly affected by a wide variety of environmental and edaphic factors. The principal
factors determining soil microbial community composition are soil type, type of cropping
and tillage systems (Suzuki et al., 2005). Therefore, when management systems are
compared using microbial indicator, environmental and edaphic factors need to be as equal
as possible.
The traditional cultivation method for microorganisms are not very suitable for soil
organisms because limitations such as the difficulty to determine the specific microbial
species due to the extremely high diversity of soil microbial communities (Nannipieri et al.,
2003), and the fact that the majority of micro-organisms in their natural habitat cannot be
cultured and remain unidentified (Wagner et al., 1993). This has led to a lack of knowledge
of microbial community composition and function. To overcome problems associated with
non-culturable bacteria and fungi, various methods have been developed to identify and
study these microorganisms including fatty acid analysis and numerous DNA- and RNA-
based methods.
The molecular techniques generally involve extraction of nucleic acid, directly or
indirectly, from soil. They are independent of culture, and according to their sensitivity can
detect species, genera, families or even higher taxonomic groups (Nannipieri et al., 2003).
This method based on DNA fingerprints from soils allows to determine the overall genetic
composition of the microbial community. There are several DNA extraction techniques

14
which can influence the ability to characterize the specific community such as polymerase
chain reaction (PCR), ribosomal inter space analysis (RISA), random amplified polymorphic
DNA (RAPD), and denaturing gradient gel electrophoresis (DGGE) or temperature gradient
gel electrophoresis (TGGE). Furthermore Crosbby and Criddle (2003) reported that the most
widely used techniques for organism identification and community analysis include those
based on 16S rRNA (rrn) genes because of the quality of phylogenetic information, rapid
and straightforward procedures, and large databases of sequence information. These
molecular techniques have a limitation when different techniques of DNA extraction are
applied which lead to different yields of product (Wintzingerode et al., 1997) which then
produce bias in molecular diversity analysis and influence the interpretation of microbial
community.
An alternative method to measure composition of the soil microflora is phospholipid
fatty acid (PLFA) analysis. This is a biochemical measure that can represent the viable
composition of microbial community in soil. This measure can be used to estimate the
relative size of fungal, actinomycete, anaerobic, Gram + and Gram - communities (Waldrop
et al., 2000). Phospholipids are major constituents of the cell membranes of microflora (e.g.
eubacteria and eukaryotes) and break down rapidly when the cells die (White et al., 1996;
Zelles, 1999). They do not survive long enough to interact with soil colloids (Zelles, 1999).
Consequently, extraction of phospholipid from soil samples provides information about the
microbial communities present at a given time.
The PLFA profile is used as a ‘fingerprint’ of the soil community. PLFA analysis is based
on the extraction of signature lipid biomarkers from the cell membranes and walls of
microorganisms, the lipids are then concentrated and analyzed by GC to identify individual
lipids. Differences in types and abundance of microbial lipids can distinguish between
different types of bacteria and also provide information on the total viable bacterial and
micro-eukaryotic organisms in soil (Findlay and Dobbs, 1993). Certain bacterial groups make
'signature' fatty acids, so a profile of the PLFA in a sample can be used to characterize the
microbial community according to which fatty acids are found and in what concentrations.
In addition, PLFA profiles may contain information concerning the dynamics of larger
groups of organisms such as eukaryotes. However, typical fatty acids (e.g. polyenoic fatty
acids) found in eukaryotes are less distinguished in comparison to a number of fatty acids
found almost exclusively in bacteria (Tunlid and White, 1992).

15
The PLFA profile is widely used as indicator in soil quality because its provides a
sensitive measure and powerful approach to yield detailed information about the change in
microbial community structure (Vestal and White, 1989; Bossio and Scow, 1998).
2.2.3.4 Soil fauna
Soil fauna are often used as indicator of soil quality. The feeding habits and intensity of
soil fauna are known as factors affecting the microbial populations, microbial biomass
turnover rates, and also nutrients availability. Swift et al. (1979) distinguishes soil fauna
according to their size, namely microfauna (e.g. nematodes, protozoa), mesofauna (e.g.
mites, small worms, collembolan) and macrofauna (e.g. ants, earthworms, termites,
millipedes). The use of faunal groups as indicators for soil quality requires a choice of
organisms, that form a dominant group and occurs in all soil types; have a high abundance
and high biodiversity; and play an important role in soil functioning, e.g. in food webs
(Scholer et al., 2003).
Nematodes are considered as promising soil quality indicators because of their
tremendous diversity and their participation in many functions at different levels of the soil
food web (Blair et al., 1996). Nematodes have also been well researched so that a good
knowledge on nematodes-based indices is available (e.g. maturity index, the plant-parasite
index, and indices related to diversity and species) and there are standardized extraction
and determination methods. In addition to their diversity, nematodes may be useful
indicators because their populations are relatively stable in response to changes in
moisture and temperature (in contrast to bacteria), yet nematode populations respond to
land management changes in predictable ways. Because they are quite small and live in
water films, changes in nematode populations reflect changes in soil microenvironments
(Ingham, 2011).
The burrows of earthworms contribute to macroporosity and so influence water
infiltration and aeration (Lee and Foster, 1991). Besides that, earthworms transport and
mix organic, mineral, and microbial soil components to deeper soil horizons and enhance
microbial activity in the casts. The earthworms are not favored by tillage, and in general the
greater the intensity and frequency of disturbance, the lower the population density or
biomass of earthworms (Haukka, 1988).

16
2.3 Management practices and soil quality
Soil management in agriculture production deals with the human intervention
manipulating soil chemical, physical and biological properties. Good soil management tends
to maintain and improve soil fertility generating sustainable cultivation with the optimal
yield throughout year, whereas inappropriate soil management practices can lead to the
degradation of soil fertility and declining crop yield relatively within a short period of time
(Juo and Franzluebbers, 2003). Severe degradation of agro-ecosystems also has been
reported, e.g. in Nicaragua (Castillo, 2000 in Castillo and Joergensen, 2001) as an adverse
impact of improper agriculture practices.
Farming systems vary greatly from one climatic region to another, while the intensity
of farming systems is primarily determined by population pressure, the fertility of the soil,
and to some extent, the availability of technology and inputs, such as irrigation and
fertilization. Humid tropical regions have high temperatures throughout the year, often
sufficient rainfall and soils of variable fertility and because of that are often densely
populated and hence intensively cultivated.
Soil management practices can be divided into several farming systems including
organic farming, conventional farming, low-input farming, conservation farming (reduce
tillage, no tillage) and others. As described in previous chapter, management practices are
strongly correlated with the soil quality changes by affecting soil properties as indicators.
This study is focusing on two farming systems, i.e. conventional and organic farming
system, and the effect of organic farming system on soil quality will be compared to
conventional farming system.
2.3.1 Organic farming versus conventional farming systems
Adverse environmental effects of conventional faming due to the misuse of pesticide
and fertilizer eventually build the people awareness. Recently, more organic farming are
developed as people more concern to the environmental sustainability.
In general organic farming is a form of farming which is closer to natural cycles, which
means that mainly natural compounds are used as an input into the system. Use of
synthetic compounds (such as synthetic fertilizer, pesticides, plant growth regulators and
other synthetic chemicals) is avoided or mostly excluded in organic farming systems.
According to Flieβbach et al. (2007), the main principle of organic farming systems is based
on maintenance and increase of soil fertility by the use of farmyard manure, omission of
synthetic fertilizers and synthetic pesticides, and lower use of high energy consuming

17
feedstuff. In contrast, the conventional farming is often an industrialized agricultural system
characterized by mechanization, monocultures, and the use of synthetic inputs such as
chemical fertilizers and pesticides, with an emphasis on maximizing productivity and
profitability (Eicher, 2003). Chemical fertilizers and pesticides application on intensive
farming have caused environmental problems such as soil erosion (Reganold et al., 1987),
environmental pollution (Horrigan et al., 2002) and decrease in biological activity (Helgason
et al., 1998 in Mazzoncini et al., 2010). According to Pimentel et al. (1995) in Mäder et al.
(2002), intensive agriculture has increased crop yields but also posed severe environmental
problems.
Generally, organic farming (as compared to conventional farming) is characterized by
higher SOM, total N, soil pH, plant-available nutrients (Reganold et al., 1988; Drinkwater et
al., 1995), total C, CEC (Bulluck et al., 2002), as well as lower bulk density as soil physical
properties improvement (Bulluck et al., 2002). While for studies with comparing soil
biological indicators, soil under organic farming generally showed some enhancement in
microbial biomass and activities (Chander et al., 1997; Bulluck et al., 2002; Flieβbach et al.,
2007).
In a study conducted by Moeskops et al. (2010) in West Java, Indonesia, several soil
biochemical properties were used as soil quality indicators to compare a limited number of
organic and conventional vegetable farms, and a secondary forest was included to obtain
natural reference values. On the organic farms, soil fertility was maintained mainly with
composted organic matter in contrast to conventional farmers who combine fresh manure
and chemical fertilizers, and typically apply large amounts of pesticides. Parameters
measured were dehydrogenase, β-glucosidase, acid phosphomonoesterase and β-
glucosaminidase activity, microbial biomass C (MBC) and microbial community composition
by phospholipid fatty acid analysis. The results showed that the extreme differences in
management practices between organic and conventional fields were reflected in very
strong differences in enzyme activities. The composition of the soil microbial community
strongly differed between forest and cultivated soil, and a less strong but still clear
difference was observed between conventional and organic farming. Dehydrogenase
activity and C16:1ω5c, marker fatty acid for AMF, appeared particularly suited to highlight
the impact of management on the soil microbial community.

18
2.3.2 Conservation tillage
Conservation tillage refers to a set of practices such as reduced tillage and no tillage
systems which are focused on the preservation of crop residues on at least 30% of the soil
surface, altering soil composition, structure and natural biodiversity as little as possible
(Roldàn et al., 2004). Conservation tillage strongly reduces soil erosion and degradation and
improves soil fertility (Roldàn et al., 2004; Gadermaier et al., 2011). Reduced tillage and no
tillage may improve the environmental and economic performance of organic farming, but
they are still not common practice among organic farmers (Gadermaier et al., 2011).
Several studies have been carried out examining the effect of conservation tillage on
soil quality. Gadermaier et al., (2011) compared the effects of reduced tillage (RT) with
conventional tillage (CT) on soil fertility indicators such as soil organic carbon (Corg),
microbial biomass and microbial activity, soil nutrients and nutrient budgets in an organic
farming system during the first six-year (2002 – 2008) crop rotation period of a long-term
experiment on a clayey soil in a temperate climate. They found RT caused stratification of
soil organic carbon (Corg), microbial properties and soil nutrients in the soil profile. Under
RT, Corg in the 0–10 cm soil layer increased, whereas it remained constant under CT. In both
tillage treatments, Corg remained constant in the 10–20 cm soil depth. Microbial biomass C,
dehydrogenase activity, soluble soil P and K were higher in the 0–10 cm soil depth under RT
when compared with CT. Soil microbial biomass C and dehydrogenase activity in the 10–20
cm soil depth were also higher under RT. They conclude that RT is a suitable method for
increasing indicators of soil fertility in organic farming systems.
Berner et al. (2008) studied the effect of reduced tillage on soil fertility indicators and
crop yield in a heavy soil (45% clay) in a crop rotation under organic farming conditions in a
long-term field trial located in Switzerland. The results of soil analyses after three cropping
years (2002-2005). Soil organic carbon (Corg) increased over that period in the 0-10 cm soil
layer in the reduced tillage plots, while it remained constant in the ploughed plots. Soil
microbial carbon (Cmic) and dehydrogenase activity were higher in reduced-tillage plots in
this soil layer. Biological soil quality as calculated by Cmic to Corg was enhanced under
reduced tillage. In the 10-20 cm soil layer no significant Corg, Cmic, Cmic to Corg and
dehydrogenase activity differences between the tillage schemes were found. They
suggested that reduced tillage improves important indicators of soil fertility during the
conversion period. Long-term aspects of soil fertility, crop yield and weed infestation need
investigation over a prolonged experimental period.
19
CHAPTER 3 MATERIALS AND METHODS
3.1 Site description
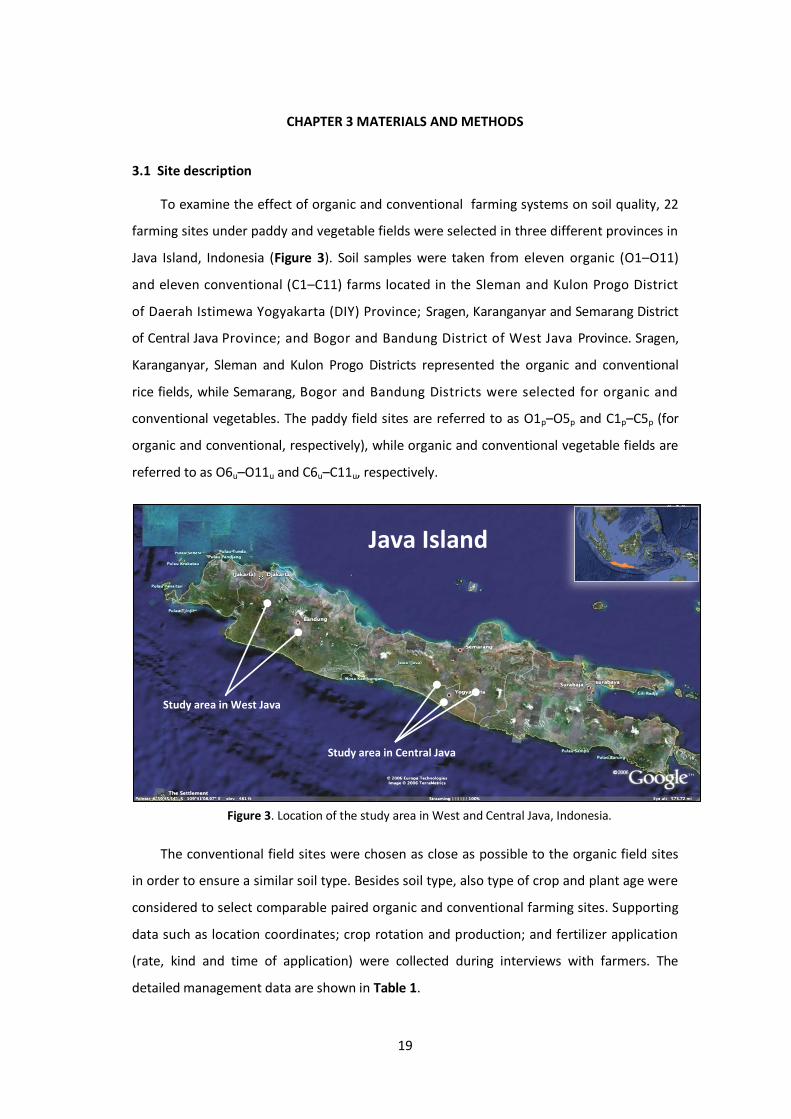
To examine the effect of organic and conventional farming systems on soil quality, 22
farming sites under paddy and vegetable fields were selected in three different provinces in
Java Island, Indonesia (Figure 3). Soil samples were taken from eleven organic (O1–O11)
and eleven conventional (C1–C11) farms located in the Sleman and Kulon Progo District
of Daerah Istimewa Yogyakarta (DIY) Province; Sragen, Karanganyar and Semarang District
of Central Java Province; and Bogor and Bandung District of West Java Province. Sragen,
Karanganyar, Sleman and Kulon Progo Districts represented the organic and conventional
rice fields, while Semarang, Bogor and Bandung Districts were selected for organic and
conventional vegetables. The paddy field sites are referred to as O1p–O5p and C1p–C5p (for
organic and conventional, respectively), while organic and conventional vegetable fields are
referred to as O6u–O11u and C6u–C11u, respectively.
Figure 3. Location of the study area in West and Central Java, Indonesia.
The conventional field sites were chosen as close as possible to the organic field sites
in order to ensure a similar soil type. Besides soil type, also type of crop and plant age were
considered to select comparable paired organic and conventional farming sites. Supporting
data such as location coordinates; crop rotation and production; and fertilizer application
(rate, kind and time of application) were collected during interviews with farmers. The
detailed management data are shown in Table 1.
Study area in West Java
Study area in Central Java
Java Island

20
Table 1. Management practices of selected field sites Sample
Code Location Crops Organic Farming Sample
Code Location Crops Conventional Farming
O1p Sambirejo subdist., Sragen district, Central Java Prov. 07° 31’ 19.3” S 111° 08’ 43.6” E 485 m asl
Rice Crop rotation: rice-rice-rice. Soil was sampled at 30 day after planting (DAP). Fertilizer: compost made from rice straw and cattle dung with rate of 2-3 t ha
-1, given every
planting season and distributed a week before planting. Soil type: Inceptisols. Yield: previous year was 5-6 t ha
-1, average
yield obtained was 6 t ha -1
. Organically cultivated since 1999.
C1p Kerjo subdist., Karanganyar district, Central Java Prov. 07° 32' 05.9" S 111° 02’ 01.6” E 298 m asl
Rice
Crop rotation: rice-rice-rice.
Samples were taken at 26 DAP.
Fertilizer:
1) Petroganik (orgacnic): 300 kg ha-1
givet at 7 DAP 2) Urea: 150 kg ha
-1 given at 20 DAP.
Soil type: Inceptisols. Yield: the 1
st season of 6 t ha
-1, the 2
nd season of 6-7 t
ha-1
, and the 3rd
season of 7.2 t ha-1
.
O2p Sambirejo subdist., Sragen district, Central Java Prov. 07° 30’ 48.8” S 111° 08’ 44.2” E 430 m asl
Rice Crop rotation: rice-rice-rice. Soil was sampled at 7 DAP. Fertilizer: manure 2 t ha
-1 and petroganik
0.1-0.25 t ha-1
, given every planting season and distributed a week before planting. Pesticide: organic made from milk, egg, honey, and plants extract. Given every planting season at 10, 20 and 35 DAP. Soil type: Inceptisols. Yield: previous year was 5-6 t ha
-1 for the 1
st
and 2nd
planting and 6.5 t ha-1
for the 3rd
planting. Organically cultivated since 2008.
C2p Kerjo Subdist., Karanganyar district, Central Java Prov. 07° 32’ 12.5” S 111° 02’ 26.0” E 318 m asl
Rice Crop rotation: rice-rice-rice. Soil was sampled at 20 DAP. Fertilizer: 1) Urea: 100 kg ha
-1
2) NPK PONSKA (15-15-15): 100 kg ha-1
3) Petroganik: 100 kg ha
-1
The 1st
application at 7 DAP (50 kg petroganik, 50 kg urea), the 2
nd application at 21 DAP (100 kg NPK
PONSKA, 50 kg urea and 50 kg petroganik). Soil type: Inceptisols Yield: wet season 8-10 t ha
-1, 2
nd season 9 t ha
-1,
the dry season 8-9 t ha-1
.

21
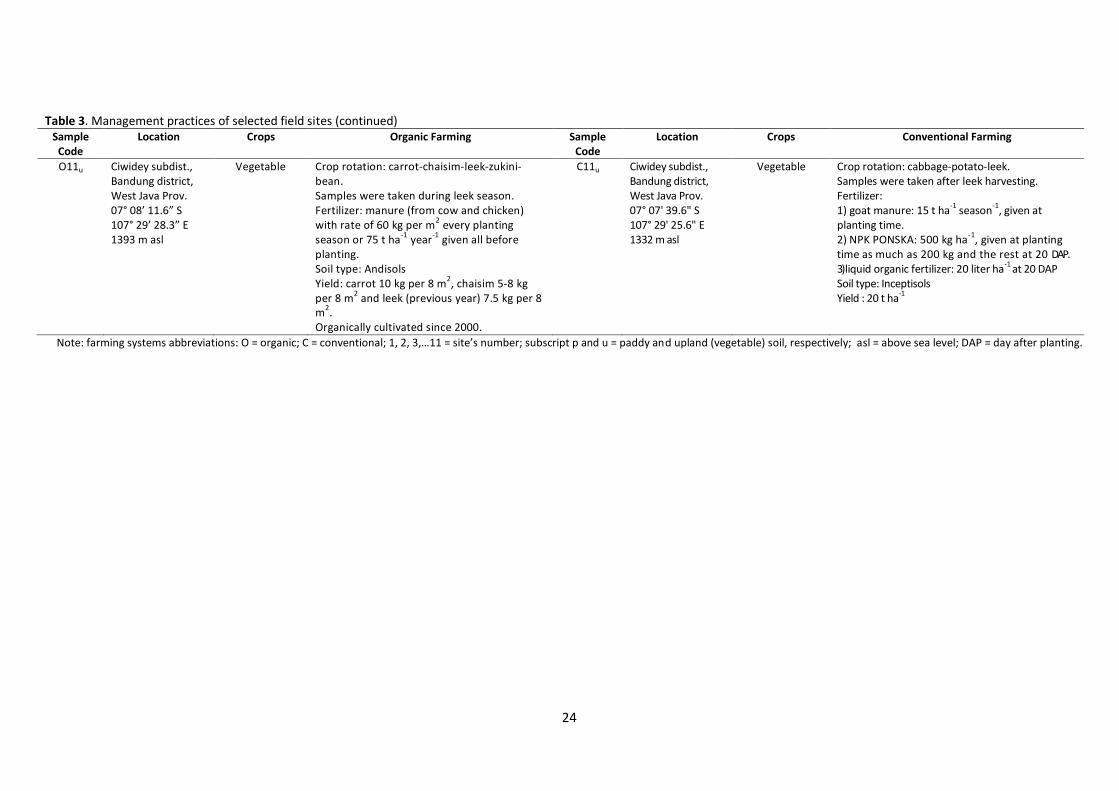
Table 3. Management practices of selected field sites (continued) Sample
Code Location Crops Organic Farming Sample
Code Location Crops Conventional Farming
O3p Gondang subdist., Sragen district, Central Java Prov. 07° 23' 47.5" S 111° 07' 38.3" E 102 m asl
Rice Crop rotation: rice-rice-rice. Soil was sampled at 10 DAP. Fertilizer: Biogas waste product about 5 t ha
-1,
split into 3 times application, i.e. the 1st
at land ploughing I, the 2
nd at land ploughing II, and the
3rd
at harrowing. Pesticide: organic from plants extract. Soil type: Vertisols. Yield: average yields were 9 t ha
- 1 for the wet
season, 7 t ha- 1 for the second planting season
and 10 t ha- 1 for the dry period, respectively.
Organically cultivated since early of 2000.
C3p Ngrampal subdist., Sragen district, Central Java Prov. 07° 24' 38.0" S 111° 03' 07.8" E 93 m asl
Rice Crop rotation: rice-rice-rice. Soil was sampled at 10 DAP. Fertilizers: 1) Urea: 100 kg ha
-1
2) NPK PONSKA (15-15-15): 50 kg ha-1
3) Ammonium sulfate: 50 kg ha
-1
4) Petroganik (organic): 150 kg ha-1
Fertilizers were applied 3 times: at planting (100 kg petroganik and 50 kg urea ha
-1 together
with applying insecticide Furadan 3 kg ha-1
); the 2
nd at 21 DAP (50 kg ZA, 50 kg urea and 50 kg
petroganik ha-1
); and the 3rd
at 35 DAP (50 kg PONSKA ha
-1).
Soil type: Vertisols. Average yields: Wet Season (season I) 8-9 t ha
-1, season II: 6-7.5 t ha
-1, and at dry season
(season III): 9-10.5 t ha-1
.
O4p Godean subdist., Sleman district, DIY Prov. 07° 44’ 24.7” S 110° 16’ 06.1” E 162 m asl
Rice Crop rotation: rice-rice-rice. Soil was sampled at 25 DAP. Fertilizer: compost made from straw and manure with rate of 15 t ha
-1, given during land
ploughing. In 2006 he applied eggs instead of manure. Yield: 7 t ha
-1 in average.
Soil type: Inceptisols Organically cultivated since early of 2004.
C4p Godean subdist., Sleman district, DIY Prov. 07° 44' 26.0" S 110° 16' 08.6" E
147 m asl
Rice Crop rotation: rice-rice-rice
Soil was sampled at 21 DAP. Fertilizer: 1) Urea: 300 kg ha
-1
2) SP-36: 250 kg ha-1
3) KCl: 150 kg ha-1
All fertilizers were given at 30 DAP. Soil type: Inceptisols. Average yield: The 1
st season of 5 t ha
-1, the 2
nd
season of 5-6 t ha, and the 3
rd season of 6.5 t ha
-1.

22
Table 3. Management practices of selected field sites (continued) Sample
Code Location Crops Organic Farming Sample
Code Location Crops Conventional Farming
O5p Wates subdist., Kulon Progo district, DIY Prov. 07° 54’ 03.4” S 110° 08’ 05.7” E 21 m asl
Rice Cash crop
Crop rotation: rice-rice-cash crop (maize). Soil was sampled during maize season at 14 DAP. Fertilizer: straw compost about 3 t ha
-1, given
during planting time at the planting hole made with hoe. Soil type: Inceptisols Yield: average yield of rice was about 4-5 t ha
-1, while for maize about 7-9 t ha
-1.
Organically cultivated since 2005.
C5p Wates subdist., Kulon Progo district, DIY Prov. 07° 54' 03.2" S
110° 08' 07.2" E
22m asl
Rice Cash crop
Crop rotation: rice-rice-cash crop (peanut and chili). Soils were sampled during rice season at 10 DAP. Fertilizer: 1) Ammonium sulfate: 100 kg ha
-1 season
-1
2) Urea: 50 kg ha-1
season-1
3) Manure: 5 t ha
-1 was given only for cash crop
at 7 day before planting. Soil type: Inceptisols.
O6u Getasan subdist., Semarang district, Central Java Prov. 07° 23.46’ 8” S 111° 26’ 00.4” E 1447 m asl
Vegetable Crop rotation: tomato-tomato-broccoli-French bean-French bean-carrot. Samples were taken at French bean season. Fertilizer: manure (goat and cow) with rate of 20 t ha
-1 year
-1, plus urine of cow.
Soil type: Andisols Yield: tomato of 22.5 t ha
-1, bean of 18-27 t ha
-
1, broccoli of 250 g crop
-1.
Organically cultivated since 2000.
C6u Getasan subdist., Semarang district, Central Java Prov. 07° 24' 00.8" S 111° 24' 54.8" E
1433 m asl
Vegetable Crop rotation: leek-potato-leek Soils were taken during leek season. Fertilizer: 1) Urea: 250 kg ha
-1 season
-1
2) SP-36: 250 kg ha-1
season-1
3) KCl: 150 kg ha
-1 season
-1
4) Manure: 30 t ha-1
season-1
Soil type: Andisols
O7u Megamendung subdist., Bogor district, West Java Prov. 06° 42’ 10.5” S 106° 55’ 15.8” E 960 m asl
Vegetable Crop rotation: radish-broccoli-Chinese cabbage-carrot. Samples were taken during carrot season at 60 DAP. Fertilizer: organic liquid made from wild crop surrounding the field and given with two way : 1) spraying at ploughing; 2) pouring at 30 DAP. Soil type: Andisols. Yield: radish of 8 t ha
-1, broccoli of 8 t ha
-1 or
200-300 g crop-1
, Chinese cabbage of 8 ha-1
and carrot 8 t ha
-1.
Organically cultivated since 2009.
C7u Megamendung subdist., Bogor district, West Java Prov. 06° 41' 44.3" S 106° 54' 36.0" E
875 m asl
Vegetable Crop rotation: carrot-carrot-leek Samples were taken at leek season, 60 DAP. Fertilizer: 1) manure: 5 t ha
-1 season
-1 given at planting.
2) Urea: 100 kg ha-1
season-1
3) SP-36: 100 kg ha-1
season-1
4) NPK PONSKA: 100 kg ha
-1 season
-1
All chemical fertilizer given at 30 DAP. Soil type: Andisols Yield: in average of 20 t ha
-1 season
-1

23
Table 3. Management practices of selected field sites (continued) Sample
Code Location Crops Organic Farming Sample
Code Location Crops Conventional Farming
O8u Cisarua subdist., Bogor district, West Java Prov. 06° 40’ 53.9” S 106° 57’ 51.3” E 1089 m asl
Vegetable Crop rotation: water spinach-spinach-broccoli-tomato. Samples were taken during tomato season at 60 DAP. Fertilizer: 25 t ha
-1 of chicken manure given during
ploughing and liquid fertilizer (from goat) of 1 L crop
-1 at 21-30 DAP.
Soil type: Andisols Yield: water spinach of 8 kg per 10 m
2, spinach 7
kg per 10 m2, broccoli 7.5 kg 10 m
2, tomato 15-20
t ha-1
. Organically cultivated since 2000.
C8u Cisarua subdist., Bogor district, West Java Prov. 06° 41 '00.1" S 106° 57' 50.8" E 1074 m asl
Vegetable Crop rotation: tomato-tomato-tomato Soil samples were taken at the 4
th harvest.
Fertilizer: 1) chicken manure: 2 t ha
-1 season
-1
2) goat manure: 1,5 t ha-1
season-1
3) Urea: 100 kg ha
-1 season
-1
All organic fertilizers were given at a week after planting. Soil type: Andisols Yield: 15-20 t ha
-1 season
-1
O9u Cisarua subdist., Bogor district, West Java Prov. 06° 40’ 40.1” S 106° 57’ 25.5” E 1015 m asl
Vegetable Crop rotation: carrot-cucumber-leek. Samples were taken during leek season at 40 DAP. Fertilizer: 5 t ha
-1 of manure given at
ploughing. Soil type: Andisols Yield: 20 t ha
-1 of carrot, 15-25 t ha
-1 of
cucumber and 30 t ha-1
of leek. Organically cultivated since 2000.
C9u Cisarua subdist., Bogor district, West Java Prov. 06° 41' 16.2" S 106° 55' 45,5" E 921 m asl
Vegetable Crop rotation: carrot-carrot-leek Samples were taken at leek season Fertilizer: 1) Urea: 100 kg ha
-1 season
-1
2) NPK PHONSKA: 100 kg ha-1
season-1
3) Compost: 2 t ha-1
given a week before planting Soil type: Andisols
O10u Ciwidey subdist., Bandung district, West Java Prov. 07° 07’ 42.1” S 107° 29’ 26.4” E 1345 m asl
Vegetable Samples were taken at leek season. Fertilizer: manure with rate of 120 t ha
-1 year
-1 or
25 t ha-1
crop season-1
. Soil type: Andisols New organic vegetables farming system, started in July 2010.
C10u Ciwidey subdist., Bandung district, West Java Prov. 07° 07' 38.7" S 107° 29' 35.5" E 1325 m asl
Vegetable Crop rotation: bean-pakcoi+bean-leek Samples were taken at leek season, 50 DAP. Fertilizer: 1) manure: 9 t ha
-1 season
-1, given a week before
planting. 2) NPK PONSKA: 400 kg ha
-1 season
-1, given at 7
and 40 DAP with rate of 200 kg ha-1
, respectively. Soil type: Inceptisols Yield: 5 t ha
-1 for bean and 9 t ha
-1 for pakcoi.
24
Table 3. Management practices of selected field sites (continued) Sample
Code Location Crops Organic Farming Sample
Code Location Crops Conventional Farming
O11u Ciwidey subdist., Bandung district, West Java Prov. 07° 08’ 11.6” S 107° 29’ 28.3” E 1393 m asl
Vegetable Crop rotation: carrot-chaisim-leek-zukini-bean. Samples were taken during leek season. Fertilizer: manure (from cow and chicken) with rate of 60 kg per m
2 every planting
season or 75 t ha-1
year-1
given all before planting. Soil type: Andisols Yield: carrot 10 kg per 8 m
2, chaisim 5-8 kg
per 8 m2 and leek (previous year) 7.5 kg per 8
m2.
Organically cultivated since 2000.
C11u Ciwidey subdist., Bandung district, West Java Prov. 07° 07' 39.6" S 107° 29' 25.6" E 1332 m asl
Vegetable Crop rotation: cabbage-potato-leek. Samples were taken after leek harvesting. Fertilizer: 1) goat manure: 15 t ha
-1 season
-1, given at
planting time. 2) NPK PONSKA: 500 kg ha
-1, given at planting
time as much as 200 kg and the rest at 20 DAP. 3) liquid organic fertilizer: 20 liter ha
-1 at 20 DAP
Soil type: Inceptisols Yield : 20 t ha
-1
Note: farming systems abbreviations: O = organic; C = conventional; 1, 2, 3,…11 = site’s number; subscript p and u = paddy and upland (vegetable) soil, respectively; asl = above sea level; DAP = day after planting.
25
Based on Köppen-Geiger climate classification, the study area in West Java is grouped
within climate zone of tropical rainforest (Af) and tropical monsoon (Am) while the study
area in Central Java is tropical monsoon climate (Am) (Peel et al., 2007). The climate in
West Java is characterized by two seasons, namely rainy season from October to April and
dry season from May to September. For Central Java the rainy season starts from
November to April and dry season from May to October.
3.2 Soil sampling
In July 2010, soil sampling on organic and conventional farming sites was done
according to the management system of local farmer. The way of selecting the three plots
(three replicates) per location differed from site to site because each farming site was
differently managed. The plot dimension for paddy fields was about 20 m2 (see Figure 4),
while for vegetable crops, which are grown on small beds, the dimensions ranged from 8 –
10 m2 (see Figure 5). Composite soil samples were collected from 0-15 cm depth of 10
randomly selected points in each plot. This resulted in 66 composite soil samples in total
(11 field plots of organic farming systems and 11 field plots of conventional farming
systems). Every composite soil sample was separated in two parts, 500 gram for chemical
and physical analyses and 300 gram for microbiological analyses purposes. Soils for
microbiological analyses were immediately kept in the ice box during the sampling to keep
the original condition and stored in refrigerator at -18 °C before sending to Ghent. Soils for
chemical analyses were air dried, grinded and sieved (2 mm) before being analyzed.
Three types of soil were observed during sampling, namely Vertisols and Inceptisols,
mainly found in paddy field areas, and Andisols at the vegetable farming areas, except on C10u
and C11u which are Inceptisols.
Soil samples for enzyme activities and PLFA analyses were freeze-dried after sampling
and subsequently stored at -18°C until extraction, while air-dried sieved soils (2 mm) were
used for MBC, physical and chemical properties analyses. Soil was pre-incubated for one
week at 35 w% moisture content and 25°C prior to extraction procedures for enzyme
activities and MBC.

26
Figure 4. Example of paddy field site (O2p).
Figure 5. Example of vegetable field site (O10u).
3.3 Physical and chemical analyses
Soil texture and chemical properties (pH KCl, SOC, total N, potential P and K, and
available P and K) were analyzed in Laboratory of Soil Research and Testing of ISRI,
Indonesia, while plant available macronutrients and micronutrients were analyzed at The
Department of Soil Management of Ghent University. All measurements conducted in ISRI
was followed ISRI Technical Guidelines for Soil Chemical Analyses (Balai Penelitian Tanah,
2005). Soil texture was classified according to USDA soil texture class (Figure 6).
Plant available Ca, Mg, Na, Fe, Mn, Zn, Cu, Co, Cr and Ni in the soil were determined
according to Nkana et al. (2001). Five gram of air-dried soil (2 mm sieved) was weigh in

27
polyethylene bottles, 50 ml solution of NH4OAc-EDTA at pH 4,65 were added and then
shaken for 4 h. After that soil suspension was filtered and the filtrates were measured with
iCAP 6000 Series ICP spectrometer, Thermo Fisher Scientific Inc.
Plant available Mo in soil was determined with the modified method of Grigg (1953 in
Carter and Gregorich, 2006). Five gram of air-dried soil (2 mm sieved) was weighed and 50
ml of 0,2 M Ammonium oxalate pH 3,3 were added. Then the soil suspension was shaken
for 16 h at room temperature at 200 rpm. All the filtrates were measured by iCAP 6000
Series ICP spectrometer, Thermo Fisher Scientific Inc.
Determination of plant available B in soil was done using hot water extraction (Gupta,
1993 in Carter and Gregorich, 2006). The mixtures of ten gram of air-dried soil (2 mm
sieved) and 20 ml deionized water were boiled for 5 min on a hotplate. The loss in weight
due to boiling was made up by adding deionized water and the mixture was filtered while
still hot. The filtrates were measured by iCAP 6000 Series ICP spectrometer, Thermo Fisher
Scientific Inc.
Figure 6. Soil texture classes of each study sites. Paired organic and conventional field site marked with the same number.
28
3.4 Biological analyses
3.4.1 Dehydrogenase activity
The procedure for analyzing dehydrogenase activity was modified from Casida et al.
(1964). Five gram of moist soil was weighed in glass vials, and 2 ml 3% solution of
triphenyltetrazolium (TTC) chloride and 2 ml Tris buffer pH 7.8 were added. Soil suspension
were mixed and incubated in the dark for 24 h at 37°C. After incubation, 18 ml of methanol
was added and shaken in the dark for 2 h on a linear shaker (125 rpm). Filtrates were
collected in 50 ml volumetric flasks. The remaining soil in the vials was washed twice with
methanol to extract all produced triphenyl formazen (TPF) and then filter papers were also
washed twice. Filtrates in the volumetric flasks were diluted to 50 ml with methanol. The
colour intensity of the filtrates was measured at 485 nm with Cary 50 UV-Visible
spectrophotometer, Varian Inc. All measurements were carried out in duplicate with one
blank.
3.4.2 β-glucosidase
Method of Alef and Nannipieri (1995) was used to determine β-glucosidase activity.
One gram of moist soil was weighed in glass vials, 4 ml Modified Universal Buffer pH 6.0
and 1 ml 25 mM p-nitrophenyl-β-D-glucoside (PNG) were added. Soil suspensions were
incubated for 1 h at 37°C. Afterward, 1 ml of 0.5 M CaCl2 and 4 ml Tris buffer pH 12 were
added then mixed and filtered. The colour intensity of the filtrates was measured at 400 nm
with Cary 50 UV-Visible spectrophotometer, Varian Inc. All measurements were carried out
in triplicate with one blank. Dilution with Tris buffer pH 10 was made to the filtrates with
higher concentrations of p-nitrophenol (PNP) than the standard series.
3.4.3 β-glucosaminidase
The activity of β-glucosaminidase was determined by method of Parham and Deng
(2000). One gram of moist soil was weighed in glass vials, and 4 ml acetate buffer pH 5.5
and 1 ml 10 mM p-nitrophenyl-N-acetyl-β-D-glucosaminide were added. After incubation, 1
ml of 0.5 M CaCl2 and 4 ml Tris buffer pH 12 were added to extract PNP and filtrates colour
intensity was measured at 405 nm with Cary 50 UV-Visible spectrophotometer, Varian Inc.
All measurements were carried out in duplicate with one blank.

29
3.4.4 Microbial biomass C
MBC was determined using chloroform fumigation-extraction method (Voroney et al.,
1993). Thirty gram of moist soil both for fumigated and non-fumigated controls were
extracted with 60 ml 0,5 M K2SO4. The soil suspension was shaken for 1 h and filtered. The
extracts were stored at -18°C until analysis. Organic carbon contents of the extracts were
determined with a TOC analyser (TOC-VCPN). MBC was calculated as a difference in C
content in fumigated and non-fumigated sample (EC) using kEC coefficient. The value kEC =
0.45 was used to calculate MBC (Joergensen, 1996).
3.4.5 Phospholipid fatty acid
Determination of PLFAs followed a procedure modified from Balser (2001). Two gram
freeze-dried soil was weighed into glass tubes. Then, 3.6 ml P-buffer pH 7.0, 4 ml CHCl3 and
8 ml MeOH were added. The mixtures were shaken for 1 h and afterwards centrifuged for
10 min (2500 rpm) at 21°C. The first supernatant was decanted into funnel and for the
second one, 3.6 ml P-buffer and 4 ml CHCl3 were added before decantation. Samples were
left overnight for phase separation. The next day, the lipid layer was drained to new tubes.
The combined lipid fraction was dried under N2. Phospholipids were separated from the
lipid extracts by Solid Phase Extraction (SPE) cartridges, using silica columns (Chromabond,
Macherey-Nagel GmbH, Düren, Germany). After discarding neutral and glycolipids by 4 ml
CHCl3 and 10 ml acetone respectively, phospholipids were eluted using MeOH. The MeOh
fraction was dried under N2. The dried phospholipids were then dissolved in 1 ml
MeOH:toluene (1:1 vol:vol) and 1 ml 0.2 M methanolic KOH. Samples were incubated at
35°C for 15 min to allow transesterification to methyl esters. After cooling to room
temperature, 2 ml hexane:CHCl3 (4:1 vol:vol), 1 ml 1 M acetic acid and 2 ml distilled water
were added to the tubes. Afterward, the samples were mixed with vortex and centrifuged
for 5min (2000 rpm). The hexane layer, containing the methylated PLFAs, was transferred
to pointed tubes. The aqueous phase was washed twice with hexane:CHCl3. The combined
hexane phase was dried under N2. The fatty-acid methyl esters were finally dissolved in 0.3
ml of hexane containing internal standard of methyl nonadecanoate fatty acid (C19:0).
PLFAs were determined by GC–MS on a Thermo Focus GC combined with a Thermo DSQ
quadrupole MS (Thermo Fisher Scientific Inc., Waltham, USA) in electron ionization mode.
Samples were injected on a Varian capillary column CP Sil 88 (100 m × 0.25 mm i.d., 0.2 m
film thickness; Varian Inc., Palo Alto, USA). The sums of marker fatty acid concentrations for
selected microbial groups were calculated. The sum of iC14:0, iC15:0, aC15:0, iC16:0,

30
aC16:0, iC17:0 and aC17:0 was used for grouping the Gram-positive bacteria and for Gram-
negative bacteria are cy17:0 and cy19:0. The typical biomarkers used to identify
actinomycetes were 10MeC16 and 10MeC18. The fatty acids C18:2c9,12, C18:1c9 and
C18:3c9,12,15 were considered as indicator of fungi while C16:1c11 represents the
arbuscular mychorrhizal fungi (AMF). For protozoa represented by the sum of biomarker
C20:4 and C20:5. Bacteria/fungi ratios were calculated by dividing the total of bacterial
community (Gram-positive bacteria, Gram-negative bacteria, C15:0 and C17:0) with the
total of fungal community.
3.5 Statistical analyses
The determination of management practices effect on soil quality indicators was
splitted into comparing means between organic and conventional. Mean values of each soil
quality indicators were gathered from three measurements (three replicates, i.e. three
plots) per location. To check the normality of the data, Shapiro-Wilk test was performed.
For data which are normally distributed, the independent t-test was used to check
significant effects of soil management practices on soil quality indicators by comparing the
means within sites. Assumption of equality of variances was tested by Levene’s test. The
non parametric Mann-Whitney U test was used to check significant differences for data
which were not normally distributed. Significance was evaluated at P<0.05 in all cases
except for Pearson correlation where both 0.05 and 0.01 levels of significance. All statistical
analyses were performed using SPSS (version 16.0, SPSS Inc., Chicago, USA).

31
CHAPTER 4 RESULTS
4.1 Soil texture
The similarity in soil type (soil texture) of organic and conventional fields was
statistically checked by comparing means of clay content (Knight and Dick, 2004; García-
Ruiz et al., 2008). There were significant differences in clay content between organic and
conventional farming in site 1 in paddy fields and 7, 10, and 11 in vegetable fields (Table 2).
The field sites having significant difference of clay content between organic and
conventional farming system within same location were omitted from further statistical
analyses with respect to soil quality. So the sites which are considered as comparable
paired fields to examine the soil management effects on soil quality indicators are site 2, 3,
4, 5, 6, 8 and 9.
Table 2. Clay content (%) comparison at each sites of organic and conventional farming systems.
Site
Paddy soil
Site
Vegetable soil
Organic Conventional Organic Conventional
1 44 64 S 6 19 13 NS
2 37 55 NS 7 20 51 S
3 50 55 NS 8 24 24 NS
4 44 47 NS 9 27 33 NS
5 65 74 NS 10 29 82 S
11 27 85 S
S signifies value was significant at P<0.05. NS signifies value was not significant at P>0.05.
4.2 Soil chemical indicators
The chemical indicators include: soil pH KCl (1:5); SOC; total N; P2O5 and K2O (HCl 25%);
available P2O5 and K2O; plant available macronutrients and micronutrients. There were no
consistently significant differences in some soil chemical indicators at paddy and vegetable
field sites that were managed either organically or conventionally.
4.2.1 General soil chemical properties
Table 3 and 4 summarizes the effect of farming systems on general soil chemical
properties. In paddy fields, soil pH KCl under organic management was significantly higher
than conventional management (P<0.05), except site 5 which pH of organic field was
significantly lower than conventional field, while in vegetable field sites only site 6 which
not significantly difference between organic and conventional management (P>0.05). The
significance differences of SOC and total N between organic and conventional fields were

32
found both in paddy and vegetable fields. Higher SOC and total N was significantly observed
for site 3 and 9, while in site 8 lower value of these indicators was found in organic field
compared to conventional ones. Considering all sites in paddy and vegetable farming, the
concentration of potential P2O5 and K2O (extracted by HCl 25%) in soil was found higher in
organic than conventional management, although some of these were not statistically
significant. The exception was found at site 2 in paddy and site 6 in vegetable where the
P2O5 and K2O value in conventional was higher than organic field. For available P2O5 and K2O
values were showed the same trend with P2O5 and K2O HCl 25%.
4.2.2 Plant available nutrients
There were significant differences between organic and conventional farming system
both in paddy and vegetable fields with respect to plant available macronutrients (Figure
7). Ca content was significantly higher in organic than conventional fields, except in C5p
where Ca content was extremely large (14914 mg kg-1) compared to all other sites. The
highest Ca content was reached in soil under conventionally managed, i.e. in C5p and C6u.
For Mg content in paddy fields, only site 3 was significantly different (P<0.05) while in
vegetable fields Mg content was significantly different at all sites. The highest content of
Mg was observed for O3p and O6u. Analogous to Mg, the highest content of Na was also
found at O3p and O6u. Even though the concentration of Na in O3p was 3.2 times higher
than C3p and in O6u was 11.3 times higher than C6u, the statistical analyses showed no
significant differences (P>0.05). This can be due to the non-normality of the data.
There were significant differences (P<0.05) of all micronutrients in some or all sites
between organically and conventionally managed soil both in paddy and vegetable fields,
except for Cu concentration in paddy fields which were not significantly different (P>0.05)
at all sites (Figure 8). We observed a consistent trend in O3p that Fe, Cu, Zn and B
concentration were higher than C3p, even though for B and Cu the differences were not
significant. In site 8, the difference between organic and conventional site was significant
for all micronutrients observed, except Mo.
The concentration of Co, Cr and Ni in the conventional paddy fields in several sites
tend to be higher than the organic ones, in contrast with vegetable fields in which the
concentration of these micronutrients in organic sites tend to be higher than conventional
ones (Figure 8). The highest concentration of Co in paddy and vegetable fields was found in
C3p and O8u, respectively; highest concentration of Cr in C2p and C9u; and highest
concentration of Ni was observed for C4p and O8u.

33
Table 3. General soil chemical properties in the comparable organic and conventional paddy fields.
Properties Site 2 Site 3 Site 4 Site 5
O2p C2p O3p C3p O4p C4p O5p C5p
pH KCl (1:5) 5.65 (0.03) 4.85 (0.16) S 5.80 (0.10) 5.33 (0.09) S 5.43 (0.05) 4.83 (0.10) S 6.76 (0.05) 7.20 (0.02) S
SOC (%) 1.04 (0.02) 1.61 (0.24) NS 2.12 (0.08) 1.02 (0.10) S 2.32 (0.02) 2.18 (0.10) NS 1.30 (0.05) 1.60 (0.08) S
Total N (%) 0.09 (0.01) 0.11 (0.02) NS 0.16 (0.01) 0.05 (0.01) S 0.17 (0.00) 0.13 (0.01) S 0.10 (0.01) 0.09 (0.00) NS
P2O5 HCl 25% (mg kg-1
) 871 (162.69) 1978 (611.68) NS 1409 (122.91) 1338 (417.36) NS 663 (144.47) 580 (135.35) NS 1637 (470.00) 1472 (289.75) NS
K2O HCl 25% (mg kg-1) 100 (19.46) 56 (18.35) NS 975 (320.72) 17 (2.31) NS 166 (10.69) 96 (4.81) S 125 (19.00) 139 (19.50) NS
Available P2O5 (mg kg-1) 29 (2.85) 28 (0.00) NS 240 (30.12) 99 (12.49) S 34 (2.31) 20 (0.00) S 80 (7.50) 28 (1.53) S
Available K2O (mg kg-1) 94 (14.77) 67 (18.22) NS 1062 (50.00) 14 (2.73) NS 163 (10.17) 94 (2.65) S 53 (0.00) 73 (10.07) NS
Number in parentheses represent standard error. S signifies value was significant at P<0.05. NS signifies value was not significant at P>0.05.
Table 4 General soil chemical properties in the comparable organic and conventional vegetable fields.
Properties Site 6 Site 8 Site 9
O6u C6u O8u C8u O9u C9u
pH KCl (1:5) 5.92 (0.14) 6.02 (0.07) NS 5.75 (0.04) 5.07 (0.05) S 5.28 (0.06) 4.76 (0.03) S
SOC (%) 4.13 (0.02) 3.07 (0.08) NS 2.50 (0.14) 3.49 (0.07) S 3.05 (0.07) 2.72 (0.05) S
Total N (%) 0.35 (0.02) 0.27 (0.01) S 0.19 (0.02) 0.32 (0.01) S 0.30 (0.02) 0.23 (0.00) S
P2O5 HCl 25% (mg kg-1) 4179 (492.31) 6766 (247.09) S 2396 (78.00) 1748 (150.59) S 3131 (1101.07) 2716 (19.92) NS
K2O HCl 25% (mg kg-1) 1197 (384.03) 238 (32.70) NS 617 (15.50) 191 (7.13) NS 572 (24.43) 319 (49.41) S
Available P2O5 (mg kg-1) 346 (98.20) 573 (62.30) NS 284 (6.50) 91 (0.00) NS 459 (112.57) 109 (1.57) NS
Available K2O (mg kg-1) 1586 (346.67) 270 (29.54) S 835 (81.00) 252 (7.06) NS 795 (86.56 412 (63.31) S
Number in parentheses represent standard error. S signifies value was significant at P<0.05. NS signifies value was not significant at P>0.05.

34
Figure 7. Plant available macronutrients: Ca, Mg, Na. Error bars indicate standard errors. Bars followed by * are significant at P<0.05. Colorless bars indicate site that omitted from statistic analyses.
0
2
4
6
8
10
12
14
16
18
C1p
O1p
C2p
O2p
C3p
O3p
C4p
O4p
C5p
O5p
mg
kg-1
(Thousands)
Paddy fields
Organic Conventional
0
1
2
3
4
5
C6u
O6u
C7u
O7u
C8u
O8u
C9u
O9u
C10u
O10u
C11u
O11u
mg
kg-1
(Thousands)
Vegetable fields
Organic Conventional
0
2
4
6
8
10
12
C1p
O1p
C2p
O2p
C3p
O3p
C4p
O4p
C5p
O5p
mg
kg-1
(Hundreds)
Paddy fields
Organic Conventional
0
1
2
3
4
5
6
C6u
O6u
C7u
O7u
C8u
O8u
C9u
O9u
C10u
O10u
C11u
O11u
mg
kg-1
(Hundreds)
Vegetable fields
Organic Conventional
0
50
100
150
200
250
300
350
C1p
O1p
C2p
O2p
C3p
O3p
C4p
O4p
C5p
O5p
mg
kg-1
Paddy fields
Organic Conventional
0
20
40
60
80
100
120
140
160
C6u
O6u
C7u
O7u
C8u
O8u
C9u
O9u
C10u
O10u
C11u
O11u
mg
kg-1
Vegetable fields
Organic Conventional
* *
*
*
* *
* *
* *
*
Ca Ca
Mg Mg
Na Na

35
Figure 8. Plant available micronutrients: Fe, Mn, Cu, Zn, B, Mo, Co, Cr, Ni. Error bars indicate standard errors. Bars followed by * are significant at P<0.05. Colorless bars indicate site that omitted from statistic analyses.
0
5
10
15
20
25
C1p
O1p
C2p
O2p
C3p
O3p
C4p
O4p
C5p
O5p
mg
kg-1
(Hundreds)
Paddy fields
Organic Conventional
0
1
2
3
4
C6u
O6u
C7u
O7u
C8u
O8u
C9u
O9u
C10u
O10u
C11u
O11u
mg
kg-1
(Hundreds)
Vegetable fields
Organic Conventional
0
5
10
15
20
25
30
C1p
O1p
C2p
O2p
C3p
O3p
C4p
O4p
C5p
O5p
mg
kg-1
(Hundreds)
Paddy fields
Organic Conventional
0
1
2
3
4
5
6
7
C6u
O6u
C7u
O7u
C8u
O8u
C9u
O9u
C10u
O10u
C11u
O11u
mg
kg-1
(Hundreds)
Vegetable fields
Organic Conventional
0
2
4
6
8
10
12
14
16
C1p
O1p
C2p
O2p
C3p
O3p
C4p
O4p
C5p
O5p
mg
kg-1
Paddy fields
Organic Conventional
0
5
10
15
20
25
30
35
C6u
O6u
C7u
O7u
C8u
O8u
C9u
O9u
C10u
O10u
C11u
O11u
mg
kg-1
Vegetable fields
Organic Conventional
* *
*
*
*
Fe Fe
Mn Mn
* *
*
*
Cu Cu
*
*

36
Figure 8. Plant available micronutrients (continued): Fe, Mn, Cu, Zn, B, Mo, Co, Cr, Ni. Error bars indicate standard errors. Bars followed by * are not significant at P<0.05. Colorless bars indicate site that omitted from statistic analyses.
0
1
2
3
4
C1p
O1p
C2p
O2p
C3p
O3p
C4p
O4p
C5p
O5p
mg
kg-1
Paddy fields
Organic Conventional
0
5
10
15
20
25
C6u
O6u
C7u
O7u
C8u
O8u
C9u
O9u
C10u
O10u
C11u
O11u
mg
kg-1
Vegetable fields
Organic Conventional
0,00
0,10
0,20
0,30
0,40
0,50
C1p
O1p
C2p
O2p
C3p
O3p
C4p
O4p
C5p
O5p
mg
kg-1
Paddy fields
Organic Conventional
0,00
0,02
0,04
0,06
0,08
0,10
0,12
C6u
O6u
C7u
O7u
C8u
O8u
C9u
O9u
C10u
O10u
C11u
O11u
mg
kg-1
Vegetable fields
Organic Conventional
0,00
0,10
0,20
0,30
0,40
C1p
O1p
C2p
O2p
C3p
O3p
C4p
O4p
C5p
O5p
mg
kg-1
Paddy fields
Organic Conventional
0,00
0,20
0,40
0,60
0,80
1,00
1,20
1,40
C6u
O6u
C7u
O7u
C8u
O8u
C9u
O9u
C10u
O10u
C11u
O11u
mg
kg-1
Vegetable fields
Organic Conventional
*
*
*
*
*
Zn Zn
B B
*
*
*
Mo Mo
*
* *
*

37
Figure 8. Plant available micronutrients (continued): Fe, Mn, Cu, Zn, B, Mo, Co, Cr, Ni. Error bars indicate standard errors. Bars followed by * are not significant at P<0.05. Colorless bars indicate site that omitted from statistic analyses.
0
5
10
15
20
25
C1p
O1p
C2p
O2p
C3p
O3p
C4p
O4p
C5p
O5p
mg
kg-1
Paddy fields
Organic Conventional
0
2
4
6
8
10
C6u
O6u
C7u
O7u
C8u
O8u
C9u
O9u
C10u
O10u
C11u
O11u
mg
kg-1
Vegetable fields
Organic Conventional
0,00
0,02
0,04
0,06
0,08
0,10
0,12
0,14
C1p
O1p
C2p
O2p
C3p
O3p
C4p
O4p
C5p
O5p
mg
kg-1
Paddy fields
Organic Conventional
0,00
0,01
0,02
0,03
0,04
0,05
0,06
C6u
O6u
C7u
O7u
C8u
O8u
C9u
O9u
C10u
O10u
C11u
O11u
mg
kg-1
Vegetable fields
Organic Conventional
0,0
0,3
0,6
0,9
1,2
1,5
1,8
2,1
C1p
O1p
C2p
O2p
C3p
O3p
C4p
O4p
C5p
O5p
mg
kg-1
Paddy soil
Organic Conventional
0,0
0,2
0,4
0,6
0,8
1,0
1,2
C6u
O6u
C7u
O7u
C8u
O8u
C9u
O9u
C10u
O10u
C11u
O11u
mg
kg-1
Vegetable fields
Organic Conventional
Ni Ni
Cr Cr
Co Co
* *
*
*
*
* *
*
*
* *

38
4.3 Enzyme activities
Significant effects of farming systems were found for enzyme activities both in paddy
and vegetable field sites. There were no significant differences between organic and
conventional paddy fields at all sites with respect to dehydrogenase activity (P>0.05), while
in all vegetable fields dehydrogenase activity was significantly higher in organic compared
to conventional sites (P<0.05). Sites O7u, O10u and O11u were not included in this analyses
given the highly deviating soil texture between organic and conventional sites (Figure 9).
The highest value of dehydrogenase activity at comparable vegetable fields was 28.66 µg
TPF g-1 dry soil.24h-1 for O8u and the lowest ones was 0.58 µg TPF g-1 dry soil.24h-1 for C6u.
Figure 9. Dehydrogenase activity, error bars indicate standard errors. Bars followed by * are significant at P<0.05. Colorless bars indicate site that omitted from statistic analyses.
β-glucosidase activity in paddy fields ranged from 18.71 to 49.22 µg PNP g-1 dry soil.h-1
with the highest value observed for O3p and the lowest value for C3p. The significant
differences were found on site 3, 4 and 5 where the activity in organic site was significantly
higher than the conventionally managed ones. In vegetable field sites, the significant
difference of β-glucosidase activity was only found at site 9 with the value for O9u was
66.98 µg PNP g-1 dry soil.h-1 and 37.39 µg PNP g-1 dry soil.h-1 for C9u. Considering all sites in
paddy and vegetable fields, the sites which have largest different of β-glucosidase activity
were O3p compared to C3p and O9u to C9u (Figure 10).
0
5
10
15
20
25
30
35
40
45
C1p
O1p
C2p
O2p
C3p
O3p
C4p
O4p
C5p
O5p
µg
TPF
g-1d
ry s
oil.
24h
-1
Paddy fields
Organic Conventional
0
5
10
15
20
25
30
35
40
C6u
O6u
C7u
O7u
C8u
O8u
C9u
O9u
C10u
O10u
C11u
O11u
µg
TPF
g-1d
ry s
oil.
24h
-1
Vegetable fields
Organic Conventional
*
*
*

39
Figure 10. β-glucosidase activity, error bars indicate standard errors. Bars followed by * are significant at P<0.05. Colorless bars indicate site that omitted from statistic analyses.
In paddy fields, there were no significant differences of β-glucosaminidase activity
between organic and conventional field site in site 2, 3 and 4, while the significant
difference was observed for O5p compared to C5p. The β-glucosaminidase activity in
vegetable field sites under organic management was higher than under conventional,
except O7u, although the difference was only significant at O8u with a value of 98.61 µg PNP
g-1 dry soil.h-1 compared to 62.40 µg PNP g-1 dry soil.h-1 at C8u (Figure 11). The activity at O9u
was 2.8 times higher than C9u but it was not statistically significant (due to the data being
not normally distributed).
Figure 11. β-glucosaminidase activity, error bars indicate standard errors. Bars followed by * are significant at P<0.05. Colorless bars indicate site that omitted from statistic analyses.
0
10
20
30
40
50
60
70
80
C1p
O1p
C2p
O2p
C3p
O3p
C4p
O4p
C5p
O5p
µg
PN
P g
-1d
ry s
oil.
h-1
Paddy fields
Organic Conventional
0
10
20
30
40
50
60
70
80
C6u
O6u
C7u
O7u
C8u
O8u
C9u
O9u
C10u
O10u
C11u
O11u
µg
PN
P g
-1d
ry s
oil.
h-1
Vegetable fields
Organic Conventional
0
20
40
60
80
100
120
C1p
O1p
C2p
O2p
C3p
O3p
C4p
O4p
C5p
O5p
µg
PN
P g
-1d
ry s
oil.
h-1
Paddy fields
Organic Conventional
0
20
40
60
80
100
120
C6u
O6u
C7u
O7u
C8u
O8u
C9u
O9u
C10u
O10u
C11u
O11u
µg
PN
P g
-1d
ry s
oil.
h-1
Vegetable fields
Organic Conventional
* *
*
*
*
*

40
4.4 Microbial biomass C
Soil under organic management showed higher microbial biomass C than soil under
conventional management at all vegetable field sites, but only one out of the three sites
which statistically different at P<0.05 (Figure 12). In paddy fields, in two out of the four
organic sites, MBC was significantly higher than at the conventional sites. At site 5 MBC
under organic management (O5p) was significantly lower than under conventional (C5p)
while at site 2 the MBC of organic management was also lower than conventional ones but
the difference was not significant. The highest value of microbial biomass C in paddy and
vegetable fields was 517.65 g C g-1 dry soil for C5p and 432.01 g C g-1 dry soil for O6u.
Figure 12. Microbial biomass C. Error bars indicate standard errors. Bars followed by * are significant at P<0.05. Colorless bars indicate site that omitted from statistic analyses.
An overview of Pearson correlation coefficients between biological indicators and
some chemical indicators are reported in Table 5 and 6. According to Pearson correlation
coefficients in paddy fields (Table 5), there were no significant correlations between MBC
and all enzyme activities, but significant correlation was found with SOC content at 0.05
level of significance. Enzyme activities were significantly and positively correlated with SOC
and total N content (β-glucosidase and β-glucosaminidase activities at P<0.01;
dehydrogenase at P<0.05).
0
100
200
300
400
500
600
C1p
O1p
C2p
O2p
C3p
O3p
C4p
O4p
C5p
O5p
µg
C g
-1d
ry s
oil
Paddy fields
Organic Conventional
0
100
200
300
400
500
600
C6u
O6u
C7u
O7u
C8u
O8u
C9u
O9u
C10u
O10u
C11u
O11u
µg
C g
-1d
ry s
oil
Vegetable fields
Organic Conventional
* *
*
**

41
Table 5. Pearson correlation coefficients between parameter at paddy fields.
β-glucosidase β-glucosaminidase MBC SOC Total N
Dehydrogenase 0,305 0,577** 0,334 0,464* 0,423*
β-glucosidase
0,589** 0,384 0,662** 0,814**
β-glucosaminidase
0,359 0,518** 0,527**
MBC
0,458* 0,334
SOC
0,912**
*Correlation is significant at the 0.05 level. **Correlation is significant at the 0.01 level.
In vegetable fields, MBC showed significant correlations with β-glucosidase and β-
glucosaminidase activities (P<0.05) (Table 6). Negative significant correlations were found
between dehydrogenase activity and SOC and total N (P<0.05).
Table 6. Pearson correlation coefficients between parameter at vegetable fields.
β-glucosidase β-glucosaminidase MBC SOC Total N
Dehydrogenase 0,193 0,790** 0,304 -0,535* -0,535*
β-glucosidase
0,626** 0,539* 0,063 0,323
β-glucosaminidase
0,498* -0,312 -0,168
MBC
0,223 0,206
SOC
0,889**
*Correlation is significant at the 0.05 level. **Correlation is significant at the 0.01 level.
4.5 Phospholipids fatty acids
There were no significant differences for all biomarkers PLFA at all sites both in paddy
and vegetable fields (P>0.05). Nevertheless in Figure 13-20 we can see that the amount of
PLFA biomarkers in some organic fields tended to be slightly higher than conventional ones
with similar trend according to the field sites both in paddy and vegetable fields.
Although not significantly different, in paddy fields, the amount of Gram-positive,
Gram-negative bacteria, total bacteria and actinomycetes in organic fields was slightly
higher than conventional fields, except site 2 where the amount of those markers fatty
acids in O2p was lower than C2p. The highest value of Gram-positive and total bacteria was
observed for C2p i.e. 5.81 nmol g-1 dry soil and 8.09 nmol g-1 dry soil, respectively. While at
O5p was found to be highest value of Gram-negative bacteria with value of 1.47 nmol g-1 dry
soil and actinomycetes with value of 1.82 nmol g-1 dry soil. For PLFAs markers in vegetable
fields, analogous to paddy fields, the amount of those markers was slightly higher in organic
fields compared to conventional fields, except for site 8. The highest value of Gram-positive
(5.95 nmol g-1 dry soil), Gram-negative bacteria (1.77 nmol g-1 dry soil), total bacteria (8.24
nmol g-1 dry soil) and actinomycetes (1.67 nmol g-1 dry soil) was found at O8u.

42
Figure 13. Gram positive bacteria. Error bars indicate standard errors. Colorless bars indicate site that omitted from statistic analyses.
Figure 14. Gram negative bacteria. Error bars indicate standard errors. Colorless bars indicate site that omitted from statistic analyses.
Figure 15. Total bacteria. Error bars indicate standard errors. Colorless bars indicate site that omitted from statistic analyses.
0,0
1,0
2,0
3,0
4,0
5,0
6,0
7,0
8,0
9,0
C1p
O1p
C2p
O2p
C3p
O3p
C4p
O4p
C5p
O5p
nm
ol g
-1d
ry s
oil
Paddy fields
Organic Conventional
0,0
1,0
2,0
3,0
4,0
5,0
6,0
7,0
8,0
9,0
C6u
O6u
C7u
O7u
C8u
O8u
C9u
O9u
C10u
O10u
C11u
O11u
nm
ol g
-1d
ry s
oil
Vegetable fields
Organic Conventional
0,0
0,5
1,0
1,5
2,0
C1p
O1p
C2p
O2p
C3p
O3p
C4p
O4p
C5p
O5p
nm
ol g
-1d
ry s
oil
Paddy fields
Organic Conventional
0,0
0,5
1,0
1,5
2,0
2,5
C6u
O6u
C7u
O7u
C8u
O8u
C9u
O9u
C10u
O10u
C11u
O11u
nm
ol g
-1d
ry s
oil
Vegetable fields
Organic Conventional
0,0
2,0
4,0
6,0
8,0
10,0
12,0
C1p
O1p
C2p
O2p
C3p
O3p
C4p
O4p
C5p
O5p
nm
ol g
-1d
ry s
oil
Paddy fields
Organic Conventional
0,0
2,0
4,0
6,0
8,0
10,0
12,0
C6u
O6u
C7u
O7u
C8u
O8u
C9u
O9u
C10u
O10u
C11u
O11u
nm
ol g
-1d
ry s
oil
Vegetable fields
Organic Conventional

43
Figure 16. Actinomycetes. Error bars indicate standard errors. Colorless bars indicate site that omitted from statistic analyses.
The effect of farming systems on fungi and AMF community resulted higher
concentration in some of organic sites compared to conventional sites both in paddy and
vegetable fields, although the differences were not significant. The concentration of fungi
and AMF at O3p, O4p and O9u were higher than C3p, C4p and O9u, respectively. While
organic sites at site 2, 5, 6 and 8 showed lower fungi and AMF than their paired
conventional sites.
Figure 17. Fungi. Error bars indicate standard errors. Colorless bars indicate site that omitted from statistic analyses.
0,0
0,5
1,0
1,5
2,0
2,5
C1p
O1p
C2p
O2p
C3p
O3p
C4p
O4p
C5p
O5p
nm
ol g
-1d
ry s
oil
Paddy fields
Organic Conventional
0,0
0,5
1,0
1,5
2,0
2,5
C6u
O6u
C7u
O7u
C8u
O8u
C9u
O9u
C10u
O10u
C11u
O11u
nm
ol g
-1d
ry s
oil
Vegetable fields
Organic Conventional
0,0
0,5
1,0
1,5
2,0
2,5
C1p
O1p
C2p
O2p
C3p
O3p
C4p
O4p
C5p
O5p
nm
ol g
-1d
ry s
oil
Paddy fields
Organic Conventional
0,0
0,5
1,0
1,5
2,0
2,5
3,0
C6u
O6u
C7u
O7u
C8u
O8u
C9u
O9u
C10u
O10u
C11u
O11u
nm
ol g
-1d
ry s
oil
Vegetable fields
Organic Conventional

44
Figure 18. AMF. Error bars indicate standard errors. Colorless bars indicate site that omitted from statistic analyses.
Higher concentrations of protozoa’s marker in paddy fields were found at site 3 and 4,
while at site 2 and 5 the concentrations were comparable between organically and
conventionally managed fields (Figure 19). The highest concentration of protozoa marker
was shown at O3p i.e. 0.41 nmol g-1 dry soil. In contrast to paddy fields, concentration of
protozoa in vegetable fields were comparable between organic and conventional
management in all sites. Comparable bacteria/fungi ratios were found at all sites in paddy
fields whereas in vegetable fields, higher ratio was only found at site 6. O8u and O9u had
lower ratio of bacteria/fungi compared to C8u and C9u, respectively.
Figure 19. Protozoa. Error bars indicate standard errors. Colorless bars indicate site that omitted from statistic analyses.
0,0
0,2
0,4
0,6
0,8
C1p
O1p
C2p
O2p
C3p
O3p
C4p
O4p
C5p
O5p
nm
ol g
-1d
ry s
oil
Paddy fields
Organic Conventional
0,0
0,2
0,4
0,6
0,8
1,0
1,2
C6u
O6u
C7u
O7u
C8u
O8u
C9u
O9u
C10u
O10u
C11u
O11u
nm
ol g
-1d
ry s
oil
Vegetable fields
Organic Conventional
0,0
0,1
0,2
0,3
0,4
0,5
C1p
O1p
C2p
O2p
C3p
O3p
C4p
O4p
C5p
O5p
nm
ol g
-1d
ry s
oil
Paddy fields
Organic Conventional
0,0
0,1
0,2
0,3
0,4
0,5
0,6
0,7
C6u
O6u
C7u
O7u
C8u
O8u
C9u
O9u
C10u
O10u
C11u
O11u
nm
ol g
-1d
ry s
oil
Vegetable fields
Organic Conventional

45
Figure 20. Bacteria/Fungi ratio. Error bars indicate standard errors. Colorless bars indicate site that omitted from statistic analyses.
In paddy field sites, there were positive correlations between PLFAs markers and
enzyme activities; MBC; SOC and total N (Table 7). Total PLFA was significantly correlated
with SOC and total N at 0.05 level of significance but it was not significantly correlated with
MBC. In contrast with paddy fields, SOC content in vegetable fields was not correlated with
total PLFA (Table 8). Total PLFA was only significantly positively correlated with β-
glucosidase activity (P<0.05).
Table 7. Overview Pearson coefficients correlation between parameter at paddy fields.
Gram + Gram - Total bacteria
Actino-mycetes
Fungi AMF Protozoa Total PLFA
Dehydrogenase 0,33 0,332 0,351 0,099 0,571* 0,318 0,342 0,466
β-glucosidase 0,325 0,299 0,335 0,156 0,376 0,391 0,516* 0,414
β-glucosaminidase 0,331 0,401 0,351 0,228 0,354 0,237 0,195 0,367
MBC 0,423 0,527* 0,444 0,463 0,406 0,381 0,117 0,413
SOC 0,35 0,264 0,369 0,012 0,587* 0,408 0,625** 0,545*
Total N 0,352 0,223 0,367 -0,036 0,579* 0,423 0,759** 0,540*
*Correlation is significant at the 0.05 level. **Correlation is significant at the 0.01 level.
Table 8. Overview Pearson coefficients correlation between parameter at vegetable fields.
Gram + Gram - Total bacteria
Actino- mycetes
Fungi AMF Protozoa Total PLFA
Dehydrogenase 0,098 0,021 0,133 -0,064 0,129 0,145 0,520 0,144
β-glucosidase 0,550 0,604* 0,609* 0,530 0,573 0,694* 0,543 0,628*
β-glucosaminidase 0,493 0,403 0,459 0,340 0,409 0,570 0,689* 0,540
MBC 0,389 0,438 0,350 0,317 0,193 0,348 0,401 0,399
SOC -0,024 0,323 0,066 0,153 -0,089 -0,125 -0,280 -0,002
Total N 0,204 0,519 0,295 0,394 0,113 0,150 -0,115 0,241
*Correlation is significant at the 0.05 level. **Correlation is significant at the 0.01 level.
0,0
1,0
2,0
3,0
4,0
5,0
6,0
7,0
C1p
O1p
C2p
O2p
C3p
O3p
C4p
O4p
C5p
O5p
nm
ol g
-1d
ry s
oil
Paddy fields
Organic Conventional
0,0
1,0
2,0
3,0
4,0
5,0
6,0
7,0
C6u
O6u
C7u
O7u
C8u
O8u
C9u
O9u
C10u
O10u
C11u
O11u
nm
ol g
-1d
ry s
oil
Vegetable fields
Organic Conventional
46
CHAPTER 5 DISCUSSION
5.1 Soil texture
Soil texture is the main factor to select comparable paired field sites between
organically and conventionally managed soil. The important of soil texture for soil quality
comparison in this study is to assure that the significant effect on soil quality indicators was
attributed by management practices, not due to soil type differences (Knight and Dick,
2004).
There were number of fields which had big difference on clay content, therefore we
used statistical analyses to check the significant of soil texture (clay content) differences.
We found significant differences on clay content between conventional and organic fields
at site 1, 7, 10 and 11 (Table 2), so these sites were not considered as comparable sites and
not included in soil quality comparison between organic and conventional. The non
significant difference of soil texture between organically and conventionally managed fields
confirms that our paired sampling sites were on the same soil type and included in soil
quality comparison, i.e. site 2, 3, 4, 5, 6, 8 and 9.
5.2 Soil chemical indicators
Soil under conventional farming systems showed slightly lower pH-KCl than under
organic farming systems, with the exception on C5p. This might be due to the application of
inorganic N fertilizer which can cause soil acidification, as all conventional field sites in this
study had received large amounts of inorganic N fertilizers such as urea, ammonium sulfate
and NPK Phonska. Most of N-containing inorganic fertilizers supply NH4+ or result in its
production which upon the oxidation will release H+ (Magdoff et al., 1997). This has also
been found by other studies that acidification occurred in soil under conventional
management which received inorganic N fertilizer intensively (Knight and Dick, 2004;
Lalfakzuala et al., 2008; Moeskops et al., 2010). In case of higher soil pH-KCl at C5p than
O5p, manure was applied during the crop rotation in C5p (Table 3) which may contribute to
soil organic C content and increase the buffering capacity of soil, so the soil becomes less
sensitive to any acidification from N mineral fertilizer (ammonium sulfate and urea)
application. It has been stated by Akpegi et al. (2006) that chemical transformations
involving humus in soil colloidal ion exchange complexes is a crucial factor to the soil buffer
capacity.

47
The significantly higher contents of SOC and total N in soil under organic than
conventional were found both in paddy and vegetable fields. This was expected to result
from organic fertilizer (mainly manure and compost) inputs on organic farming systems.
Depending on soil type, climate, management, and the capacity of soil to store organic
matter, organic C levels may increase with the amount of organic matter input (Carter,
2002). Organic matter, as nutrient reservoir, releases N, P and S through the mineralization.
Therefore organic fertilizer application not only adding N into soil but also other nutrients
simultaneously. Most of the conventional fields in this study also applied manure or
compost as organic fertilizer which found to e.g. resulted in significantly higher organic C
and total N at C8u than O8u. This was probably due to the type, quality, and application time
of manure given to soil and could be from such high amount of urea applied every planting
season. We assumed that urea is not completely lost from the soil but incorporated into
soil organic matter as organic N. Other finding can be seen from site 3 where soil under
organic management had respectively 2 times higher organic C and 3 times higher total N
compared to conventionally managed soil (Table 3). Combination of high amount of
inorganic fertilizer (mainly mineral N content fertilizer) and Petroganik (organic fertilizer)
could not yield high content of organic C and total N at C3p. This also possibly resulted from
different quality of organic fertilizer given.
As mentioned before, beside contributing to soil organic C and total N content, other
nutrients are also released upon the decomposition of organic matter. P and K both in
potential and available form were generally found higher in organic fields compared to
conventional. The higher content of P and K indicates that organic matter can maintain the
nutrients supply into soil and even better than inorganic P and K fertilizer. Organic fertilizer
is also known as a slow release nutrient source, so the nutrients can be effectively used for
plant uptake, preventing nutrient losses from soil. Higher P and K content at C3p and C6u
compared to their paired organic sites which is likely due to the regular and high amount of
P and K containing fertilizer that has been added recently.
5.2.1 Plant available macronutrients
Levels of plant available macronutrients were affected by organic fertilizer application
as the significantly higher of Ca, Mg and Na contents were found in soil under organic
farming (Figure 7). Ca content at site 5 was very high compared to other sites. Beside
affected by organic matter application, this is probably related to the soil parent material at

48
this site which tends to be an alkaline soil as characterized with the soil pH-KCl of O5p and
C5p, i.e. 6.76 and 7.20, respectively (Table 3).
5.2.2 Plant available micronutrients
Micronutrient status in soils and crops can be affected by different fertilization
practices during long-term fertilization. Li et al. (2007) reported that after 16 years fertilizer
experiment in China, application of organic fertilizer increased the concentrations of Zn, Fe,
and Mn from 0.41 to 1.08 mg kg-1, from 10.3 to 17.7 mg kg-1, and from 9.7 to 11.8 mg kg-1,
respectively, with increasing soil OM content compared to the field without fertilizer
application. In this study, micronutrients concentrations varied greatly amongst the
different study sites. The consistent higher concentrations of Fe, Cu, Zn and B that we
found in O3p were probably due to high content of soil organic matter. While the
significantly higher of Fe, Mn, Cu, Zn, and B at O8u may also due to the higher content and
type of organic matter used.
The influence of organic fertilizer application on Co, Cr and Ni concentrations in soil
under paddy cultivation showed opposite trend with soil under vegetable cropping systems.
High content of some micronutrients in paddy could be happened due to the aeration
condition which regulating the nutrients availability processes. Under anaerobic flooded
paddy soil, some of micronutrients can be reduced into plant available forms. While in
vegetable fields, one of factors behind the higher micronutrients content in organically than
conventionally managed soil may due to the organic matter inputs which containing such
amount micronutrients. Cang et al. (2005) reported that most of the poultry and livestock
feeds and manures under intensive farming in China, contained high concentration of
micronutrients exceeding standard for feeds and they were also found that Cu, Zn, Pb, Cd
and Cr concentrations in animal manures were also high, for example, Cu concentration in a
manure sample reached to as much as 1726.3 mg kg-1. Interaction between macronutrients
and organic matter can also increase the availability micronutrients in soil. Thus showing
the importance of soil organic matter as complete plant nutrition (no depletion of
micronutrients).
5.2.3 Overview soil chemical indicators
In general, soil under organic farming had better soil chemical properties than under
conventional farming. Soil organic matter content in the organic farming represented by
organic C and total N content had higher concentration than in the conventional farming.
49
These both nutrients were considered as important soil quality indicator to differentiate
between organic and conventional farming both in paddy and vegetable fields. Moreover,
conventional farming characterized by intensive application of inorganic N fertilizer had a
negative impact on soil pH, i.e. soil acidification. Meanwhile in our study, micronutrients
were less useful indicator to distinguish between different management practices in paddy
cultivation since the anaerobic system in flooded paddy soil can increase the availability of
some micronutrients. However, the nutrient availability in most of organic fields was higher
than conventional fields. Therefore it might be concluded that organic management
practice had positive impacts on soil organic matter stocks and nutrient availability.
5.3 Enzyme activities
In this study, enzyme activities in soil under organic farming systems both in paddy and
vegetable fields were generally higher than under conventional farming systems. This can
be due to the addition of organic fertilizer, mainly compost and manure, which can
contribute as source of energy for soil microorganisms living. The application of animal
manure on organic farms resulted in an increase in enzyme activities (Marinari et al., 2006).
Moeskops et al. (2010) reported that enzyme activities (dehydrogenase, β-glucosidase and
β-glucosaminidase) under organic farming were clearly higher than under conventional
farming in vegetable farms at West Java.
Dehydrogenase
The high variability of dehydrogenase activity in paddy fields resulted no significant
difference between soil under organic and conventional faming systems. Despite the
differences in soil dehydrogenase activity in paddy field were not significant at all sites, the
overall activity was higher compared to activity in soil under vegetable cultivation. The
activity in paddy fields ranged between 3.10 and 32.16 g TPF g-1 dry soil.24 h-1 while in
vegetable fields between 0.58 and 28.66 g TPF g-1dry soil.24 h-1. This could be related to
the anaerobic condition in flooded paddy soils, where the decreased redox potential
indirectly influenced the dehydrogenase activity. Brzezinska et al. (1998) found that the
decrease of redox potential after flooding is accompanied by an increase of dehydrogenase
activity. The oxygen depletion from flooded soil shifts the activity of microorganisms from
aerobic to anaerobic. Respiration pathways under anaerobic conditions, involving
facultative anaerobes use oxidized inorganic and organic compound as terminal acceptors
of electrons, and are initiated by action of intracellular dehydrogenase and are terminated
in the extracellular medium i.e. in the soil solution. The energetic efficiency of anaerobic

50
respiration is much lower than that of aerobic respiration. This is probably the main reason
for the close relationship between dehydrogenase activity and soil aeration status
(Brzezinska et al., 1998). Moeskops et al. (2010) conclude that dehydrogenase activity as
soil quality indicator become less useful in paddy fields because of high variability of this
enzyme activity under flooded soil. Dehydrogenase activity in paddy soils was more
influenced by soil aeration status than the management practices.
Dehydrogenase activity in paddy fields was significantly and positively correlated with
β-glucosaminidase (P<0.01), SOC and total N content (P<0.05). Although the differences
were not significant at any of paddy field sites, dehydrogenase activity of O3p and O4p were
higher than their paired conventional sites. This finding confirm the results of Miller and
Dick (1995) that organic matter added increased the dehydrogenase activity.
The effect of different management practices resulted significant differences on
dehydrogenase activity in vegetable fields. Dehydrogenase activity in soil under organic was
significantly higher than soil under conventional farming (P<0.05). In contrast with
dehydrogenase activity in paddy fields, this enzyme activity was significantly and negatively
correlated with SOC and total N content (P<0.05) (Table 4). This result is contrary to the
result from Moeskops et al. (2010) who found significant and positive correlation between
dehydrogenase activity and SOC content in vegetable fields in West Java but they also
found that the relationship between SOC content and enzyme activity was not
straightforward. The result from this study could indicate that soil organic matter indirectly
influenced the activity of dehydrogenase in soil, by improving soil physical properties, such
as soil structure and soil aeration. Organic matter plays a role in formation and stabilization
of micro-aggregates within macro-aggregates (Six et al., 1999) and as a result, increased
organic matter in macro-aggregates size fractions promotes a greater level of microbial
activity in comparison with micro-aggregates (Franzluebbers and Arshad, 1997).
β-glucosidase
Generally, the activity of β-glucosidase in organically managed soil were higher than in
conventionally managed soil, even though the significant differences were only found at
site 3, 4, 5 and 9. Activation of β-glucosidase by compost indicates enhanced hydrolysis of
the C derived from the incorporated organic matter, and remaining root and plant residues
after harvest (Ros et al., 2006). Therefore, in this study, soil with high content of organic C
was expected to have higher β-glucosidase activity and furthermore increase the microbial
biomass. Moeskops et al. (2010) reported significant correlation of β-glucosidase activity
51
and SOC content with significantly higher β-glucosidase activity in organically managed
soils. β-glucosidase activity in paddy fields was significantly correlated with SOC and total N
at 0.01 significance level (Table 5), even though β-glucosidase activity in vegetable fields
only had significant correlation with MBC (P<0.05) (Table 6).
β-glucosaminidase
The activity of β-glucosaminidase in organic fields was higher than conventional fields.
This indicates that labile organic C and N fraction in soil under organically managed were
more available than in soil under conventional management, since this enzyme plays an
important role in both C and N cycling in soil (Parham and Deng, 2000). The higher activity
of β-glucosaminidase as affected by organic management practice reflects the availability of
a transient pool of organic C and N in soils through the degradation of chitin, releasing an
easily mineralizable C and N source under the form of amino sugars (Enkeler and Tabatabai,
2003). Glucosaminidase activity has been positively correlated with the microbial biomass C
and N, and with fungi populations, as indicated by fungal indicator fatty acids (i.e., 18:2v6c)
(Parham and Deng, 2000; Acosta-Martínez et al., 2004). In this study, we also found positive
correlation between β-glucosaminidase activity and MBC (Table 7 and 8) and PLFAs
biomarkers for fungi (Table 9 and 10). Miller et al. (1998) found the correlation between
the activities of β-glucosaminidase with fungal biomass and this enzyme was proposed to
be used as a semi-quantitative indicator of soil fungal biomass. The lack of literature
concerning changes of β-glucosaminidase activity in relation to the different farming
systems (organic and conventional), making the relevant comparison difficult. However, in
general, our result for this enzyme activity was in agreement with the result from previous
study by Moeskops et al. (2010).
5.4 Microbial biomass C
In general, soil under organic management practices demonstrated higher microbial
biomass C than under conventional management. In paddy fields, higher MBC in the
organic sites would be due to the higher SOC content compared to conventional sites. The
organic C content and microbial biomass are generally correlated in soil, and this indicates
that organic matter is a good habitat for microorganisms. This finding is supported by a
positive significant correlation between MBC and SOC content in paddy fields (P<0.05)
(Table 5). Hence it can be concluded that high MBC in paddy fields was related to the
difference in SOC content rather than by differences in management practices. While in
vegetable fields, higher MBC in organic than in conventional fields correlated with the

52
enzyme activities. MBC content showed positive and significant correlation with β-
glucosidase and β-glucosaminidase at 0.05 significance level (Table 6). Sotomayor-Ramírez
et al. (2009) reported that increased β-glucosidase and β-glucosaminidase would be in
agreement with increased MBC and MBN due to enhanced substrate availability for
microbes. It has been shown that microbial activity and biomass is higher in fields with
organic amendments than fields with conventional fertilizers (Drinkwater et al., 1995).
Furthermore, the microbial biomass reflects the contribution of soil microorganisms as both
a source and a sink of carbon in soil ecosystem (Baaru et al., 2007).
5.5 Phospholipid fatty acid
Communities of Gram-positive and actinomycetes increased in relative abundance in
organic plots following manure application (Bossio et al., 1997). This is similar to the result
in this study, that the concentration of PLFAs Gram-positive, Gram-negative and
actinomycetes were slightly higher in soil under organic compared to conventional farming
systems both in paddy and vegetable fields. These PLFAs concentration may represent
organisms that are temporarily enriched by a labile C pool of recently added manure or
compost or bacterial population which were introduced with the manure (Bossio et al.,
1997). The lower concentration of Gram-negative bacteria in O2p and O8u could be
explained in agreement to the finding of Bossio et al. (1995) that decreases in cyclopropyl
fatty acids were consistently found associated with increased substrate availability in rice
soils.
Communities of AMF are highly influenced by management, and may be reduced by
mineral fertilizer application, cultivation and pesticides (Kurle and Pfleger, 1994) while
Mader et al. (2002) and Bending et al., (2004) reported low AMF colonization in
conventional relative to organic systems. This is similar with our finding at site 3, 4 and 9
where concentration of AMF in organic fields was higher than in conventional fields.
Low concentration of AMF detected in the conventional farms might have relation
with the alteration of nutrients availability in the substrate. As showed previously, soil in
the conventional farms content of lower nutrients availability including SOC and total N
than in the soil of organic farms, therefore the abundant of AMF will decrease as well.
Similar pattern also was identified in the fungi biomarker’s concentration. Lower
concentration of fungi biomarker’s was detected in the soil under the conventional farms
than in the soil managed organically.

53
Biomarkers concentrations for protozoa composition as affected by organic and
conventional farming systems were more pronounced at paddy fields compared to
vegetable fields. One of factors behind the abundant of protozoa in paddy field is because
protozoa, as aquatic organisms, requires moist soil condition for activity (Kuikman et al.,
1991). Protozoa composition in paddy fields was significantly correlated with β-glucosidase
(P<0.05), SOC and total N (P<0.01 respectively) (Table 7). In contrast with paddy fields,
protozoa composition in vegetable fields was not correlated with SOC and total N and was
only significant correlated with β-glucosaminidase activity (P<0.05) (Table 8).
The positive correlation between total PLFA was found significantly with SOC and total
N in paddy fields but not with MBC (Table 7). This correlation indicates that microbial
community composition shifts to be higher with increasing organic C and total N in the soil.
In vegetable fields, enzyme activity (β-glucosidase) was significantly correlated with total
PLFA indicates the increasing enzyme activities accompanied the increasing of microbial
community composition. There was also found significant correlation between fungi
concentration with SOC. Six et al. (2006) suggest that a fungal dominated microbial
community improves the physical environment for stabilization and produces more
protected and stable C.
5.6 Overview soil biological indicators
High enzyme activities in organic fields addressed a positive impact of organic
management practice on organic C dynamics. It was difficult to find suitable soil biological
indicators applied for both in paddy and vegetable cultivations since soil processes involved
in vegetable soil is different with anaerobic flooded paddy soil, therefore the suitable
indicators for paddy and vegetable will be explained separately. In vegetable fields, the
influence of organic and conventional farming systems was clearly shown on
dehydrogenase activity, as the significant differences were found at all sites. Although the
non normally of the β-glucosaminidase data could not produce significant differences
between soil under organic and conventional fields, this enzyme showed consistency trend
as affected by different management practices. Therefore it may be concluded that
dehydrogenase activity and β-glucosaminidase are suitable biological indicators to assess
soil quality in vegetable fields. While in paddy fields, β-glucosidase activity is a sensitive
biological indicator to differentiate effects from organic and conventional farming systems.
In conclusion, SOC and total N are the best chemical indicators in paddy fields supported by
the results from MBC and PLFAs analyses. SOC and total N content were positively

54
correlated with MBC and significantly correlated with total PLFA in paddy fields. Hence, it
can be concluded that SOC and total N combining with β-glucosidase, MBC and PLFA are
suitable indicators to assess soil quality in paddy fields. Meanwhile under vegetable fields,
SOC and total N content were also best indicators to assess the soil quality. PLFA was not
considered as suitable indicator in vegetable fields because most of all PLFA biomarkers
observed were not correlated with organic matter. Therefore, combining SOC and total N
content with dehydrogenase, β-glucosaminidase activity and MBC as indicators were
expected to give a better understanding about the effect of management practices on soil
quality in vegetable fields.

55
CHAPTER 6 CONCLUSION AND RECOMMENDATION
The result demonstrated organic farming systems have a great potential to enhance
soil organic matter, nutrient availability, microbial activity, microbial biomass and microbial
community composition. Soil chemical and biological indicators of soil quality were
generally higher in organic farming systems compared to conventional farming systems.
High of soil enzymes activity and microbial biomass C as affected by organic matter input in
organic systems emphasize the important role of element cycling processes supported by
an abundant and active soil biological community.
Different respond for each soil quality indicators affected by different management
practices (organic and conventional) resulted a set of sensitive indicators specific for
different cultivation, paddy and vegetable. In management practices, soil biological
indicators are generally more sensitive compared to chemical indicators. Therefore, using
chemical indicators only are not sensitive enough to track relatively soil quality
improvement. Moreover, based on the measurement of soil quality indicators and
correlation between soil organic matter and some of biological indicators, it can be
assumed that soil quality in organic farming systems of West and Central Java are higher
than soil quality in conventional farming systems both in paddy and vegetable fields.
However, since amount of organic fertilizer also applied in the conventional farming,
further research is required to be done to examine the effect of different type of organic
matter added on soil quality. This study showed organic matter amendments gave different
respond to microbial indicators. In the paddy soil, anaerobic state more involved in most of
soil processes instead of management practices, e.g. regulating micronutrients availability,
influence dehydrogenase activity, therefore soil quality assessment will be more obvious if
two contrasting cultivation (paddy and vegetable) are separated. Eventually related to the
findings of SOC which was not correlated to most of PLFA biomarkers and negatively
correlated with dehydrogenase and β-glucosaminidase activity in vegetable fields, it
requires further study involving soil organic matter fractions as indicator to give a better
understanding of management practices impact on soil quality. An active fractions of
organic matter are expected giving a quick response to management practices.

56
REFERENCES
Acosta-Martínez, V., Tabatabai, M.A., 2000. Enzyme activities in a limed agricultural soil. Biology and Fertility of Soils 31, 85-91.
Acosta-Martínez, V., Zobeck, T.M., Allen, V., 2004. Soil microbial, chemical and physical properties in continuous cotton and integrated crop-livestock systems. Soil Science Society American Journal. 68, 1875-1884.
Ajwa, H.A., Tabatabai, M.A., 1994. Decomposition of different organic materials in soils. Biology and Fertility of Soils 18, 175-182.
Akpegi GI, Ayuba SA, Ali A (2006). Effect of rice husk on the yield of tomato in Benue State of Nigeria. Proceedings of the 30th Annual Conference of the Soil Society of Nigeria 5th–9th December, 2006. Held at the University of Agriculture, Markurdi, pp. 221-226.
Alef, K., Nannipieri, P. (Eds), 1995. Methods in Applied Soil Microbiology and Biochemistry. Academic Press, London, 576pp.
APCAEM, 2007. Recent Develompments in Biogas Technology for Poverty Reduction and Sustainable Develompment. United Nations Asian and Pacific Centre for Agricultural Engineering and Machinery.
Baaru, M.W., Mungendi, D.N., Bationo, A., Verchot, L., Waceke, W., 2007. Soil microbial biomass carbon and nitrogen as influenced by organic and inorganic inputs at Kabete, Kenya. In: Bationo, A. (Eds) Advances in Integrated Soil Fertility Management in Sub-Saharan Africa: Challenges and Opportunities, 827-832.
Balai Penelitian Tanah, 2005. Petunjuk Teknis Analisis Kimia Tanah, Tanaman, Air dan Pupuk. Balai Penelitian dan Pengembangan Pertanian, Departemen Pertanian, Indonesia.
Balser, T.C., 2001. The impact of long term nitrogen addition on microbial community composition in three Hawaiian forest soils. Scientific World Journal 1, 500-504.
Bandick, A.K., Dick, R.P., 1999. Field management effects on soil enzyme activities. Soil Biol. Biochem. 31, 1471-1479.
Berner, A., Fließbach, A., Nietlispach, B., Mäder, P., 2008. Effects of reduced tillage on soil organic carbon and microbial activity in a clayey soil. In: Neuhoff et al., (Eds) Cultivating the future based on science. Volume 1: Organic Crop Production. Proceedings of the Second Scientific Conference of the International Society of Organic Agriculture Research (ISOFAR), held at the 16th IFOAM Organic World Conference in Cooperation with the International Federation of Organic Agriculture Movements (IFOAM) and the Consorzio ModenaBio in Modena, Italy, 18-20 June, 2008
Blair, J. M. et al. 1996. Soil invertebrates as indicators of soil quality. In Methods for Assessing Soil Quality, SSSA Special Publication 49, 273-291.
Bossio, D.A. and Scow, K.M., 1998. Impacts of carbon and flooding on soil microbial communities: phospholipid fatty acid profiles and substrate utilization patterns. Microbial Ecology 35, 265-278.
Brzezinska, M., Stepniewska, Z., Stepniewski, W., 1998. Soil oxygen status and dehydrogenase activity. Soil Biology & Biochemistry 30 (13), 1783-1790.
Bulluck III, L.R., Broisus, M., Evanylo, G.K., Ristaino, J.B., 2002. Organic and sythetic fertility amandments influence soil microbial, physical and chemical properties on organic and conventional farms. Applied Soil Ecology 19, 147-160.
Byrnes, B.H., Amberger, A., 1989. Fate of broadcast urea in a flooded soil when treated with N (n-butyl) thiophospheric triamide, a urease inhibitor. Fertilizer Research 18, 221-231.
Cambardella, C.A. and E.T. Elliott, 1992. Particulate soil organic matter changes across a grassland cultivation sequence. Soil Science Society of American Journal 56, 777-783.

57
Cang, L., Wang, Y., Zhou, D., and Dong, Y., 2005. Heavy metals pollution in pultry and livestock feeds and manures under intensive farming in Jiangsu Province, China. Journal of Environmental Sciences 16, 371-374.
Castillo, X. and Joergensen, R.G., 2001. Impact of ecological and conventional arable management systems on chemical and biological soil quality indices in Nicaragua. Soil Biology & Biochemistry 33, 1591-1597.
Carter, M.R., 2002. Soil Quality for sustainable land management: organic matter and aggregation interactions that maintain soil functions. Agronomy Journal, Vol. 94, January-February 2002.
Casida, L.E., Klein Jr., D.A., and Santoro, T., 1964. Soil dehydrogenase activity. Soil Science 98, 371-376.
Central Bureau of Statistics of Indonesia, 2011. Hasil Sensus Penduduk 2010. Data Agregat per Provinsi. http://www.bps.go.id. (Last accessed on 09/02/2011)
Chandler, K., Goyal, S., Mundra, Kapoor, K.K., 1997. Biol.Fertil.Soils 24, 306-310. Chen, Z.S., 1999. Selecting Indicators to Evaluate Soil Quality . Cited from: Food & Fertilizer
Technology Center. http://www.agnet.org/library/eb/473/. (Last accesed on 02/03/2010)
Deng, S.P., Tabatabai, M.A., 1994. Cellulase activity of soils. Soil Biol. Biochem. 26, 1347-1354. Deshpande, M.V., 1986. Enzymatic degradation of chitin and its biological applications.
Journal of Scientific and Industrial Research 45, 273-281. Doran, J.W. and Parkin, T.B., 1994. Defining and assessing soil quality. In: J.W. Doran et al.
(eds.) Defining Soil Quality for a Sustainable Environment. Soil Science Society of America, Madison, WI, Special Publication 35, 3-22.
Doran, J.W. and Parkin, T.B., 1996. Quantitative indicators of soil quality: a minimum data set. In: Doran, J.W., Jones, A.J. (Eds.), Method for Assessing Soil Quality. Soil Science Society of America, Special Publication 49, Madison. WI, pp. 25-37.
Doran, J.W., Zeiss, M.R., 2000. Soil health and sustainability: managing the biotic component of soil quality. Applied Soil Ecology 15, 3-11.
Dick, R.P., 1994. Soil enzyme activities as indicators of soil quality. In: Doran JV, Coleman DC, Bezdicek DF, Stewart BA (Eds.). Defining Soil Quality for a Sustainable Environment, Soil Science Society of America, American Society of Agriculture, Madison, 107-124.
Dick, R.P., Breakwell, D.P., Turco, R.F., 1996. Soil enzyme activities and biodiversity measurements as integrative microbiological indicators, Methods for Assessing Soil Quality, vol. 9. Soil Science Society of America, Madison, WI, 9–17.
Dick, R.P., 1997. Soil enzyme activities as integrative indicators of soil health. In: Pankhurst CE, Doube BM, Gupta VVSR (Eds.). Biological Indicators of Soil Health, CAB International, Wellingford, 121–156.
Dodgson, K.S., White, G., Fitzgerald, J.W., 1982. Sulphatase Enzyme of Microbial Origin, Vol. I. CRC Press, Florida.
Drinkwater, L.E., D.K. Letourneau, F. Workneh, A.H.C. van Bruggen, and C. Shennan. 1995. Fundamental difference between conventional and organic tomato agroecosystems in California. Ecological Applications 5, 1098–1112.
Eicher, A., 2003. Organic Agriculture A Glossary of Terms for Farmers and Gardeners. Organic Farming Program Coordinator, University of California. Cited from: http://ucce.ucdavis.edu/files/filelibrary/1068/8286.pdf (Last accesed on 02/10/2010)
Ekenler, M., Tabatabai, M.A., 2002. b-Glucosaminidase activity of soils: effect of cropping systems and its relationship to nitrogen mineralization. Biology and Fertility of Soils 36, 367–376.
Esen, A., 1993. b-Glucosidases: overview, in: Esen, A. (Ed.), β-Glucosidases: biochemistry and molecular biology. American Chemical Society, Washington, DC, 1–14.

58
Evanylo, G., McGuinn, R., 2009. Agricultural management practices and soil quality: Measuring, assessing, and comparing laboratory and field test kit indicators of soil quality attributes. Crop and Soil Environmental Sciences, Virginia Tech. Publication, 452-460.
Findlay, R.H. & Dobbs, F.C. 1993. Quantitative description of microbial communities using lipid analysis. In: Handbook of Methods in Aquatic Microbial Ecology (eds P.F. Kemp, E.B. Sherr & J.J. Cole), pp. 271–284. Lewis Publishers, Boca Raton, FL.
Fitzgerald, J.W., 1976. Sulphate ester formation and hydrolysis: a potentially important yet often ignored aspect of the sulphur cycle of aerobic soils. Bacteriological Review 40, 628-721.
Frank, T., Malkomes, H.P., 1993. Influence of temperature on microbial activities and their reaction to the herbicide Goltix in different soils under laboratory conditions. Zentralblatt für Mikrobiol. 148, 403-412.
Flieβbach, A., Oberholzer, H., Gunst, L., Mäder, P., 2007. Soil organic matter and biological soil quality indicators after 21 years of organic and conventional farming. Agriculture Ecosystems & Environment 118, 273-284.
Franchini, J.C., Crispino, C.C., Souza, R.A., Torres, E. and Hungria, M., 2007. Microbiological parameters as indicators of soil quality under various soil management and crop rotation systems in southern Brazil. Soil & Tillage Research 92, 18–29.
Franzluebbers, A.J., and M.A. Arshad. 1997. Soil microbial biomass and mineralizable carbon of water-stable aggregates. Soil Science Society of American Journal 61, 1090–1097.
Friedel, J.K, Munch, J.C, Fischer, W.R., 1996. Soil microbial properties and the assessment of available soil organic matter in a crop rotation. Soil Biology & Biochemistry 28, 479–488.
Gadermaier, F., Berner, A., Flieβbach, A., Friedel, J.K., Mäder, P., 2011. Impact of reduced tillage on soil organic carbon and nutrient budgets under organic farming. Renewable Agriculture and Food Systems. DOI: 10.1017/S1742170510000554
García-Ruiz, R., Ochoa, V., Hinojosa, M.B. and Carreira J.A., 2008. Suitability of enzyme activities for the monitoring of soil quality improvement in organic agricultural systems. Soil Biology & Chemistry 40, 2137-2145.
Ghani, A., Dexter, M. and Perrott, K.W., 2003. Hot-water extractable carbon in soils: a sensitive measurement for determining impacts of fertilisation, grazing and cultivation. Soil Biology and Biochemistry 35, 1231-1243.
Gregorich, E.G. and Janzen, H.H., 1996. Storage and soil carbon in the light fraction and macroorganic matter. In: Carter, M.R. and Stewart, B.A., (Eds) 1996. Structure and Organic Matter Storage in Agricultural Soils Series: Advances in Soil Science, CRC press, Boca Raton, 167–190.
Grigg, J.L. 1953. Determination of the available molybdenum of soils. N. Z. J. Sci. Tech. Sect. A-34: 405–414. In: Carter, M.R. and Gregorich, E.G (Eds) Soil Sampling and Methods of Analysis, 2006. Taylor & Francis Group.
Gupta, U.C. 1993. Boron, molybdenum, and selenium. In M.R. Carter, Ed. Soil Sampling and Methods of Analysis. CRC Press, Boca Raton, FL, pp. 91–99. In: Carter, M.R. and Gregorich, E.G (Eds) Soil Sampling and Methods of Analysis, 2006. Taylor & Francis Group.
Handayani, I.P., Prawito, P. and Muktamar, Z., 2002. The role of natural-bush fallow in abandoned land during shifting cultivation in Bengkulu II. The role of fallow vegetation. Indonesian Journal of Agricultural Sciences 4, 10-17.
Haukka, J., 1988. Effect of various cultivation earthworm biomasses and communities on different soil types. Ann. Agric. Fenniae 27, 263-269.

59
Herrick, J.E., 2000. Soil quality: an indicator of sustainable land management. Applied Soil Ecology 15, 75-83.
Horrigan, L., Lawrence, R.S., Walker, P., 2002. How sustainable agriculture can address the environmental and human health harms of industrial agriculture. Environmental Health Perspectives 110, 445-456.
Ingham, E.R., 2011. Chapter 6: Nematodes. Soil Biology Primer. USDA NRCS. Last modified 03/11/2011. (Last accessed on 03/19/2011)
Jenkinson D.S. and Ladd J.N., 1981. Microbial biomass in soil: measurement and turnover. In: Paul E.A. and Ladd J.N. (Eds) Soil biochemistry, vol. 5. Dekker, New York, 415–471.
Joergensen, R.G., 1996. The fumigation-extraction method to estimate soil microbial biomass: calibration of the kEC value. Soil Biology & Biochemistry 28, 25-31.
Juo, A.S.R. and Franzluebbers, K., 2003. Tropical Soils: Properties and Management for Sustainable Agriculture. Oxford University Press, NY.
Kandeler, E., Palli, S., Stemmer, M., Gerzabek, M.H., 1999a. Tillage changes microbial biomass and enzyme activities in particle-size fractions of a Haplic Chernozem. Soil Biology & Biochemistry 31, 1253–1264.
Karlen, D.L., Mausbach, M.J., Doran, J.W., Cline, R.G., Harris, R.F., and Schuman, G.E., 1997. Soil Quality: A Concept, Definition, and Framework for Evaluation. Soil Science Society of American Journal 61, 4-10.
Keeney, D.R., Bremner, J.M., 1966. Comparison and evaluation of laboratory methods of obtaining an index of soil nitrogen availability. Agronomy Journal 58, 498–503.
Kennedy, A.C. and Papendick, R.I., 1995. Microbial characteristics of soil quality. Journal of Soil and Water Conservation 50, 243–248.
Kirkham, M.B. 2006. Cadmium in plants on polluted soils: Effect of soil factors, hyperaccumulation, and amendments. Geoderma 137, 19–32.
Knight, T.R. and Dick, R.P., 2004. Differentiating microbial and stabilized β-glucosidase activity relative to soil quality. Soil Biology & Biochemistry 36, 2089-2096.
Knoepp, J.D., Coleman, D.C., Crossley Jr., D.A., Clark, J.S., 2000. Biological indices of soil quality: an ecosystems case study of their use. Forest Ecology and management 138. 357-368.
Ladd, J.N., Jackson, R.B., 1982. In: Stevenson FJ (Ed.). Nitrogen in Agricultural Soils, American Society of Agronomy, WI. 173-228.
Lalfakzuala, L., Kayang, H. and Dkhar, M.S., 2008. The effects of fertilizer on soil microbial components and chemical properties under Leguminous cultivation. American-Eurasian Journal of Agricultural and Environmental Science 3, 314-324.
Larson, W.E. and F.J. Pierce. 1991. Conservation and enhancement of soil quality. Evaluation for sustainable land management in the developing world. Proceedings of the International Workshop on Evaluation for Sustainable Land Management in the Developing World, Chiang Rai, Thailand, 15-21 September 1991 [Bangkok, Thailand: International Board for Soil Research and Management, 1991]. 175-203.
Lee, K.E. and Foster, R.C., 1991. Soil fauna and soil structure. Aust. J. Soil Res. 29, 745-775. Lewandowski, A. and Zumwinkle, M., 1999. Assessing the soil system. A review of soil
quality literature. Minnesota Dept. of Agriculture. Li, B.Y., Zhou, D.M., Cang, L., Zhang, H.L., Fan, X.H. and Qin, S.W., 2007. Soil micronutrient
availability to crops as affected by long-term inorganic and organic fertilizer applications. Soil & Tillage Research 96, 166–173.
Lupwayi, N.Z., Arshad, M.A., Rice, W.A. and Clayton, G.W., 2001. Bacterial diversity in water-stable aggregates of soils under conventional and zero tillage management. Applied Soil Ecology 16, 251-261.
Mäder, P., Fließbach, A., Dubois, D., Gunst, L., Fried, P., Niggli, U., 2002. Soil fertility and biodiversity in organic farming. Science 296, 1694-1697.

60
Magdoff, F., Lanyon, L. and Liebhardt, B., 1997. Nutrient cycling, transformations and flows: Implication for a more sustainable agriculture. Advances in Agronomy 60, 1-73.
Marinari, S., Mancinelli, R., Campiglia, E., Grego, S., 2006. Chemical and biological indicators of soil quality in organic and conventional farming systems in Central Italy. Ecological Indicators 6, 701-711.
Martinez, C.E., Tabatabai, M.A., 1997. Decomposition of biotechnology byproducts in soils. Journal of Environmental Quality 26, 625-632
Mazzoncini, M., Canali, S., Giovannetti, M., Castagnoli, M., Tittarelli, F., Antichi, D., Nanneli, R., Cristani, C., Barberi, P., 2010. Comparison of organic and conventional stockless arable systems: A multidisciplinary approach to soil quality evaluation. Applied Soil Ecology 44, 124 132.
Miller, M., Palojaérvi, A., Rangger, A., Reeslev, M., Kjùller, A., 1998. The use of fluorogenic substrates to measure fungal presence and activity in soil. Applied and Environmental Microbiology 64, 613-617.
Moeskops, B., Sukristiyonubowo, Buchan, D., Sleutel, S., Herawaty, L., Husen, E., Saraswati, R., Setyorini, D., De Neve, S., 2010. Soil microbial communities and activities under intensive organic and conventional vegetable farming in West Java, Indonesia. Applied Soil Ecology 45, 112-120.
Muchhal, U.S., Pardo, J.M., Raghothama, K.G., 1996. Phosphate transporters from the higher plant Arabidopsis. Proc. Natl. Acad. Sci. USA. 93, 10519-10523.
Nannipieri, P., Grego, S. and Ceccanti, B. 1990. Ecological significance of the biological activity in soil. In: Bollag, J.M. and G. Stotzky, G. (Eds) Soil Biochemistry 6, 293–355. Marcel Dekker, New York.
Nannipieri, P., Kandeler, E., Ruggiero, P., 2002. Enzyme activities and microbiological and biochemical processes in soil. In: Burns, R.G. and Dick, R.P. (Eds) Enzymes in the Environment, Marcel Dekker, Inc., New York, 1-33.
Nannipieri, P., Ascher, J., Ceccherini, M.T., Landi, G., Pietramellara, G., Renella, G., 2003. Microbial diversity and soil functions. European Journal of Soil Science 54, 655-670. Blackwell Publishing Ltd.
Ndiaye, E.L., Sandeno, J.M., McGrath, D., Dick, R.P., 2000. Integrative biological indicators for detecting change in soil quality. American Journal of Alternative Agriculture 15, 26-36.
Naseby, D.C. and Lynch, J.M., 2002. Enzymes and microorganisms in the rhizosphere. In: R.G. Burns and R.P. Dick, (Eds) Enzymes in the Environment: Activity, Ecology, and Applications, CRC Press, London, UK (2002), 109–123.
Neufeld, E.F., 1989. Natural history and inherited disorders of a lysosomal enzyme, b-hexosaminidase. Journal of Biological Chemistry 264, 10927-10930.
Nkana, J.C.V., Tack, F.M.G. and Verloo, M.G., 2001. Availability and plant uptake of nutrients following the application of paper pulp and lime to tropical acid soils. Journal of Plant Nutrition and Soil Science 164, 329-334.
Parham, J.A. and Deng, S.P., 2000. Detection, quantification and characterization of β-glucosaminidase activity in soil. Soil Biology & Biochemistry 32, 1183-1190.
Pascual, J.A., Garcia, G., Hernandez, T., Moreno, J.L., Ros, M., 2000. Soil microbial activity as a biomarker of degradation and remediation processes. Soil Biology & Biochemistry 32, 1877-1883.
Peel, M. C., Finlayson, B. L. and McMahon, T. A., 2007. Updated world map of the Köppen-Geiger climate classification. Hydrology and Earth System Sciences. 11, 1633–1644.
Reganold, J.P., Elliott, L.F., Unger, Y.L., 1987. Long-term effects of organic and conventional farming on soil erosion. Nature 330, 370-372.

61
Reganold, J.P., Drinkwater, L.E., C.A. Cambardella, J.D. Reeder, and Rice, C.W, 1988. Comparison of soil properties as influenced by organic and conventional farming systems. American Journal of Alternative Agriculture 3, 144–155
Rodrigues De Lima, A.C., A., Willem, H. and Lijbert, B., 2008. Soil Quality Assessment in Rice Production System : Establishing a Minimum Data Set. Journal of Environmental Quality 37, 623-630.
Roldán. A, Salinas-García, J.R., Alguacil, M.M., Díaz, G., Caravaca, F., 2004. Changes in soil microbial activity following conservation tillage practices in a sorghum field under subtropical conditions. Conference Paper. Conserving Soil and Water for Society: Sharing Solutions. ISCO 2004-13th International Soil Conservation Organization Conference-Brisbane, July 2004. Paper No. 687.
Sanchez, P.A., Miller, R.H., 1986. Organic matter and soil fertility management in acid soils of the tropics. Transactions of the XIII Congress of International Soil Science Society, p. 5.
Scholer, M., Dilly, O., Munch, J.C., 2003. Indicators for evaluating soil quality. Agriculture, Ecosystems and Environment 98, 255-262.
Seybold, C.A., Mausbach, M.J., Karlen, D.L., Rogers, H.H., 1997. Quantification of Soil Quality in. Lal et al., 1998. Soil Processes and The Carbon Cycle. CRC Press LLC. USA.
Shannon, D., Sen., A.M., Johnson, D.B., 2002. A comparative study of the microbiology of soils managed under organic and conventional regimes. Soil Use and Management 18, 274-283.
Sinsabaugh, R.L., Moorhead, D.L., 1995. Resource allocation to extracellular enzyme production: a model for nitrogen and phosphorus control of litter decomposition. Soil Biology & Biochemistry 26, 1305-1311.
Six, J., Elliott, E.T., Paustian, K. and Doran, J.W., 1998. Aggregation and soil organic matter accumulation in cultivated and native grassland soils. Soil Science Society of America Journal 62, 1367–1377.
Six, J., E.T. Elliott, and K. Paustian. 1999. Aggregate and soil organic matter dynamics under conventional and no-tillage systems. Soil Science Society of American Journal 63, 1350–1358.
Six, J., Frey, S. D., Thiet, R. K. and Batten, K. M., 2006. Bacterial and Fungal Contributions to Carbon Sequestration in Agroecosystems. Soil Science Society America Journal 70, 555–569.
Smith, J.L. and Doran, J.W., 1996. Measurement and use of pH and electrical conductivity for soil quality analysis. In: Doran, J.W. and Jones, A.J. (eds) Methods for assessing soil quality. 169-185.
Sparling, G., Vojvodic-Vukovic, M., Schipper, L.A., 1998. Hot-watersoluble C as a simple measure of labile soil organic matter: the relationship with microbial biomass C. Soil Biology & Biochemistry 30, 1469–1472.
Stocking, M. A, 2003. Tropical soils and food security: The next 50 years. Science 302, 1356-1359.
Suzuki, C., Kunito, T., Aono, T., Liu, C.-T. and Oyaizu, H., 2005. Microbial indices of soil fertility. Journal of Applied Microbiology 98, 1062–1074
Swift, M.J., Heal, O.W., Anderson, J.M., 1979. Decomposition in Terrestrial Ecosystems. 372pp. Blackwell Scientific Publications: Oxford.
Thoma, J.A., Spradlin, J.E., Dygert, S., 1971. Plant and animal amylases. In: Boyer, P.D. (Ed) The Enzymes 5, 115-189.
Trudel, J., Asselin, A., 1989. Detection of chitinase activity after polyacrylamide gel electrophoresis. Analytical Biochemistry 178, 362-366.

62
Tunlid, A., White, D.C., 1992. Biochemical analysis of biomass, community structure, nutritional status and metabolic activity of microbial communities in soil. Soil Biochemistry 7, 229 – 262.
USDA-NRCS, 1996. Indicator for Soil Quality Evaluation in Soil Quality Information Sheet. USDA-NRCS, 2001. Guidelines for Soil Quality Assessment in Conservation Planning. Verburg, P.H., Veldkamp, T.A., Bouma, J., 1999. Land use change under conditions of high
population pressure: the case of Java. Global Environmental Change 9, 303–312. Vestal, J.R., White, D.C., 1989. Lipid analysis in microbial ecology. Bioscience 39, 535-541. Voroney, R.P., Winter, J.P., Beyaert, R.P., 1993. Soil microbial biomass C and N. In: Carter,
E.M.R. (Ed.), Soil Sampling and Methods of Analysis. Canadian Society of Soil Science, Lewis Publishers, Boca Raton, FL, pp. 277–284.
Wagner, M., Amann, R., Lemmer, H. and Schleiffer, K.H., 1993. Probing activated sludge with oligonucleotides specific for proteobacteria: Inadequacy of culture-dependent methods for describing microbial community structure. Applied Environmental Microbiology 59, 1520-1525.
Waldrop, M.P., Balser, T.C., Firestone, M.K., 2000. Linking microbial community composition to function in a tropical soil. Soil Biology & Biochemistry 32, 1837-1846.
White, D.C., Pinkart, H.C., Ringelberg, D.B., 1996. Biomass measurements: biochemical approaches. In: Hurst, C.J. (Ed.), Manual of Environmental Microbiology. American Society for Microbiology Press, Washington D.C, 91-101.
Wintzingerode, F.v., Gobel, U.B., Stackebrandt, E., 1997. Determination of microbial diversity in environmental samples: pitfalls of PCR-based rRNA analysis. FEMS Microbiological Reviews 21, 213– 229.
Wood, C.W., Torbert, H.A., Rogers, H.H., Runion, G.B., Prior, S.A., 1994. Free-air CO2 enrichment effects on soil carbon and nitrogen. Agricultural and Forest Meteorology 70, 103-116.
Zelles, L. 1999. Fatty acid patterns of phospholipids and lipopolysaccharides in the characterization of microbial communities in soil: a review. Biology and Fertility of Soils 29, 111–129.