Embed Size (px)
Citation preview

This is a digital document from the collections of the Wyoming Water Resources Data System (WRDS) Library.
For additional information about this document and the document conversion process, please contact WRDS at [email protected] and include the phrase
“Digital Documents” in your subject heading.
To view other documents please visit the WRDS Library online at: http://library.wrds.uwyo.edu
Mailing Address: Water Resources Data System
University of Wyoming, Dept 3943 1000 E University Avenue
Laramie, WY 82071
Physical Address: Wyoming Hall, Room 249 University of Wyoming
Laramie, WY 82071
Phone: (307) 766-6651 Fax: (307) 766-3785
Funding for WRDS and the creation of this electronic document was provided by the Wyoming Water Development Commission
(http://wwdc.state.wy.us)

51.1248 (Greybull Valley) I
5 ..... 00 ~
CZl ~
1Tj o
~ 00
O 8 ~ 0 .......
~g ~~
GEl Cc)osultants, Inc . . _------------ -~------.-------------~-
Enclosures 1 through 3 Phase II Summary Report
Greybull Valley Dam and Reservoir Project
Prepared For
~~~~~ Cheyenne, Wyoming
~oo _\0 ~(]) _I
~ ~ ~~ ~and b~] ~~ g: ~;:J ~ gThe Greybull Valley Irrigation District
Emblem, Wyoming
prepared by GEl Consultants, Inc. in association with
States West Water Resources Corporation Watts and Associates ATC Engineering Consultants, Inc. (ECI)
---.-~.--.--.----
5660 Greenwood Plaza Blvd., Suite 202 Englewood, CO 80111 (303) 779-5565
August 1991 Project 91075

ENCLOSURE 1.
Addendum 1 to Appendix A
Geotechnical Investigations Report, Greybull Valley Dam and Reservoir - Lower Site

ADDENDUM 1 to APPENDIX A
GEOTECHNICAL INVESTIGATIONS REPORT GREYBULL VALLEY DAM AND RESERVOIR - LOWER SITE
1. INTRODUCTION
1.1 Purpose
This addendum presents the results of additional geological and geotechnical field investigations and instrumentation programs performed at the proposed Greybull Valley Dam and Reservoir - Lower Site. The investigation was performed between May 1, and May 9, 1991. This addendum also presents the results of our laboratory testing program performed on samples obtained during this field exploration program. The purpose of the field investigation and laboratory testing program were to collect data for use in preliminary and conceptual designs of the lower dam site. The data presented herein is suitable for use in final design; however, addition investigations will be required.
1.2 Scope of Services
The scope of work performed by GEl Consultants, Inc. (GEl) was in accordance with the Phase I scope of work outlined in Amendment No.1 of Contract No. 9-01064 dated March 13, 1991. A summary of the work performed is as follows:
a. Perform subsurface explorations of the lower dam foundation to support preparation of conceptual designs. Explorations included drilling 4 borings at the proposed lower dam site.
b. Identify sources of various materials required for construction of a dam at the lower site.
c. Perform laboratory testing to support feasibility and conceptual design of a dam at the lower site.
d. Update the Phase I project geologic maps to include the lower site as appropriate.
e. Prepare this summary Appendix A Addendum, including detained drilling logs, well logs, permeability test results, and laboratory test results.
Al-l
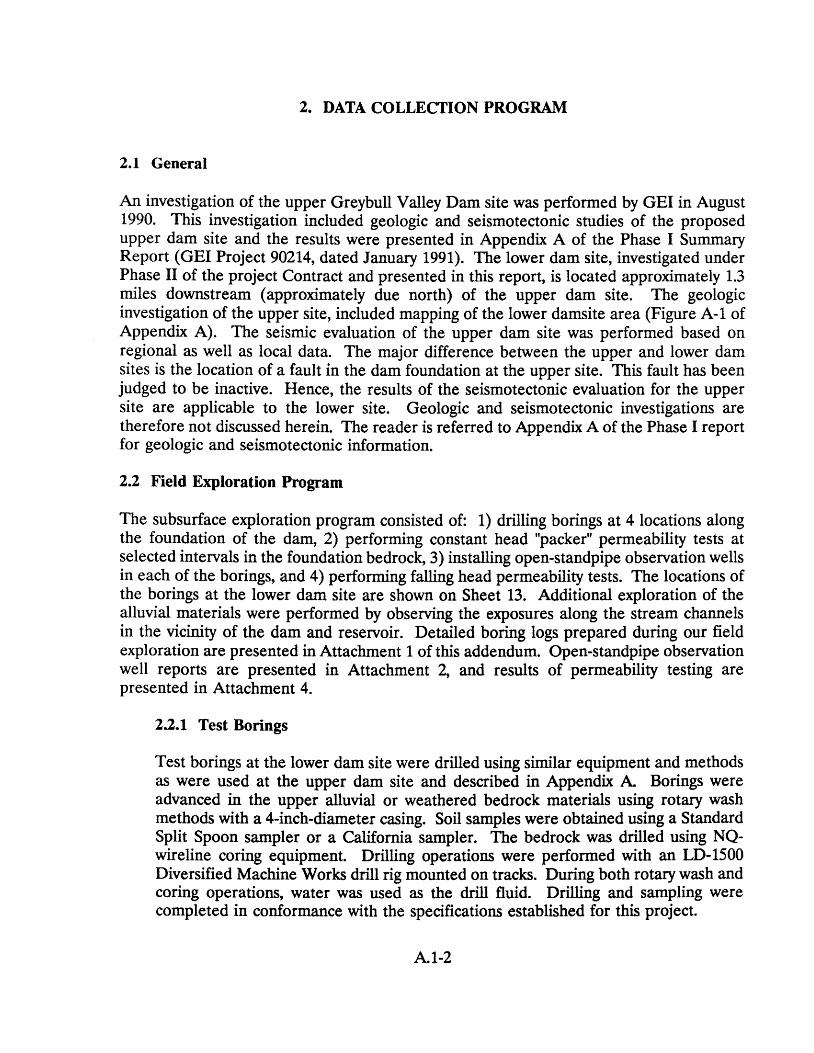
2. DATA COLLECTION PROGRAM
2.1 General
An investigation of the upper Greybull Valley Dam site was performed by GEl in August 1990. This investigation included geologic and seismotectonic studies of the proposed upper dam site and the results were presented in Appendix A of the Phase I Summary Report (GEl Project 90214, dated January 1991). The lower dam site, investigated under Phase II of the project Contract and presented in this report, is located approximately 1.3 miles downstream (approximately due north) of the upper dam site. The geologic investigation of the upper site, included mapping of the lower damsite area (Figure A-I of Appendix A). The seismic evaluation of the upper dam site was performed based on regional as well as local data. The major difference between the upper and lower dam sites is the location of a fault in the dam foundation at the upper site. This fault has been judged to be inactive. Hence, the results of the seismotectonic evaluation for the upper site are applicable to the lower site. Geologic and seismotectonic investigations are therefore not discussed herein. The reader is referred to Appendix A of the Phase I report for geologic and seismotectonic information.
2.2 Field Exploration Program
The subsurface exploration program consisted of: 1) drilling borings at 4 locations along the foundation of the dam, 2) performing constant head "packer" permeability tests at selected intervals in the foundation bedrock, 3) installing open-standpipe observation wells in each of the borings, and 4) performing falling head permeability tests. The locations of the borings at the lower dam site are shown on Sheet 13. Additional exploration of the alluvial materials were performed by observing the exposures along the stream channels in the vicinity of the dam and reservoir. Detailed boring logs prepared during our field exploration are presented in Attachment 1 of this addendum. Open-standpipe observation well reports are presented in Attachment 2, and results of permeability testing are presented in Attachment 4.
2.2.1 Test Borings
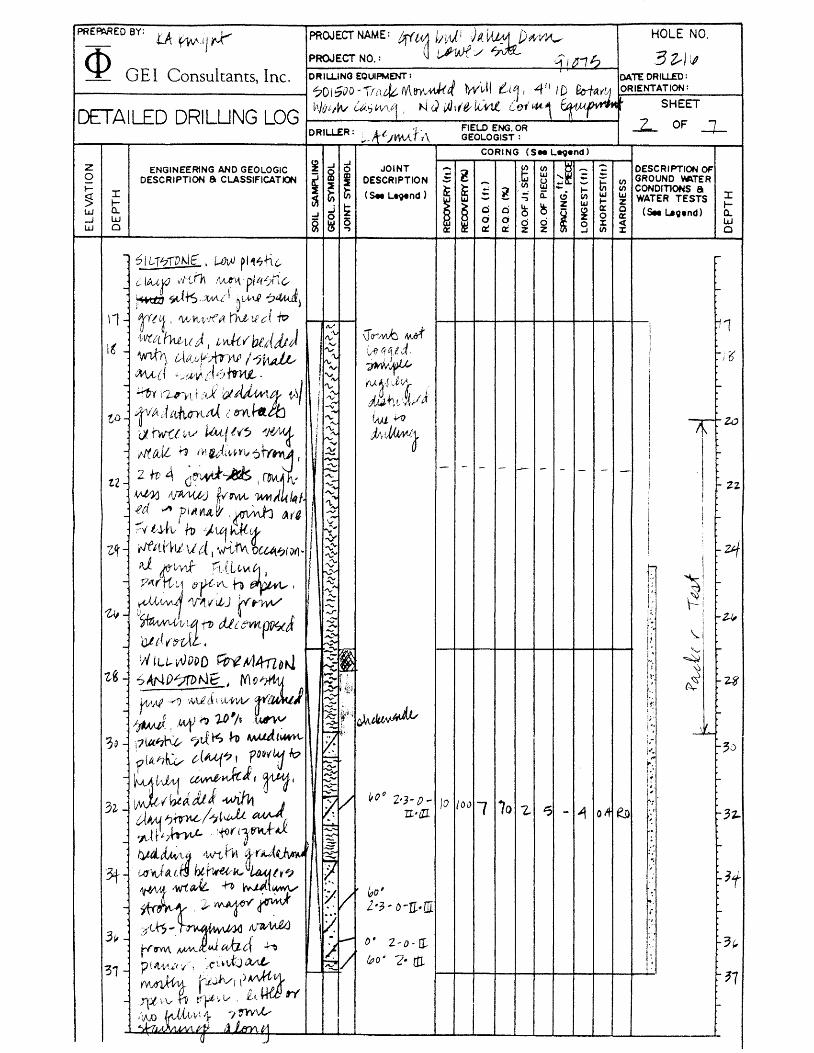
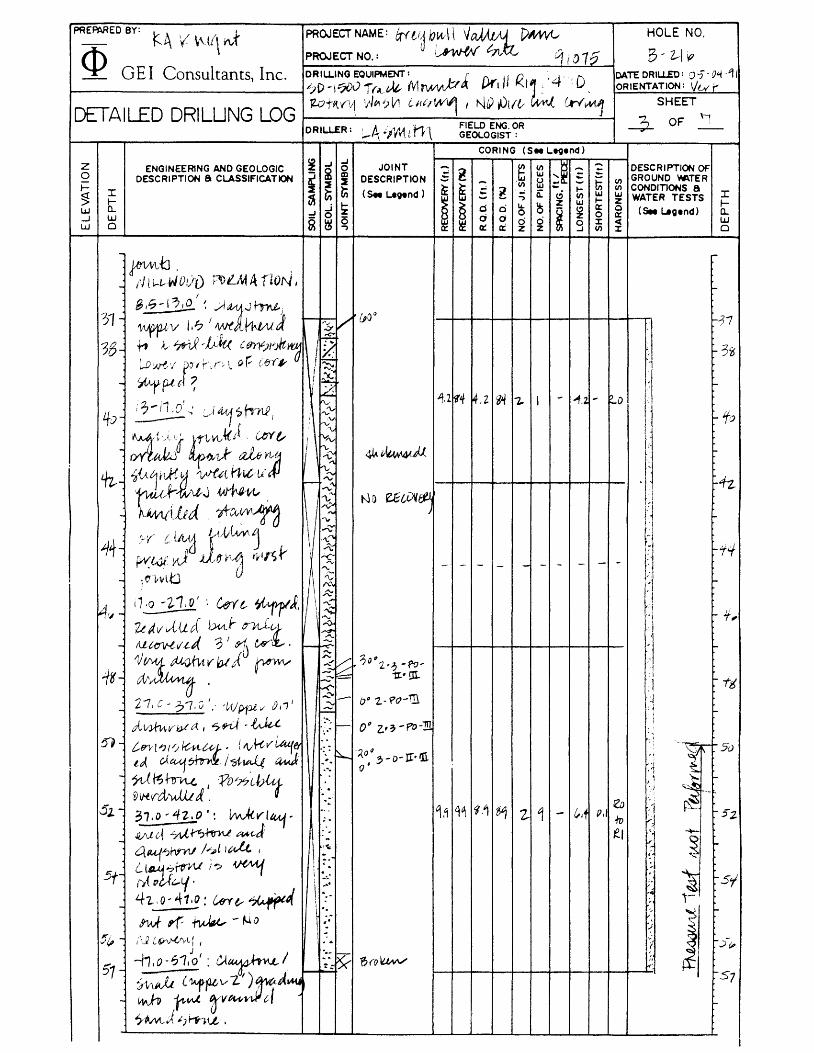
Test borings at the lower dam site were drilled using similar equipment and methods as were used at the upper dam site and described in Appendix A Borings were advanced in the upper alluvial or weathered bedrock materials using rotary wash methods with a 4-inch-diameter casing. Soil samples were obtained using a Standard Split Spoon sampler or a California sampler. The bedrock was drilled using NQwireline coring equipment. Drilling operations were performed with an LD-1500 Diversified Machine Works drill rig mounted on tracks. During both rotary wash and coring operations, water was used as the drill fluid. Drilling and sampling were completed in conformance with the specifications established for this project.
A1-2

2.2.2 Field Permeability Testing
Constant Head "Packer" Permeability Tests - Constant head "packer" permeability tests were performed on uncased sections of the cored hole prior to installation of the observation wells. The section of bedrock was tested by isolating the zone of interest with a double packer system as described in Appendix A Test procedures followed at the lower dam site consisted of: 1) drilling and coring the hole to the desired depth; 2) removing the core barrel and drill stem from the interval selected for testing; 3) seating the packers at the desired depth for the test; 4) performing a "holding test" by pumping water into the isolated section of the bedrock until a desired pressure was achieved, at the desired pressure pumping was discontinued and the rate at which the pressure dropped was measured, if the pressure drop exceeded 5 pounds per square inch (psi) per minute, a "pressure test" was performed, otherwise a new interval was selected for testing; and 5) if required, based on the results of the "holding test", a "pressure test" was performed by pumping water into the isolated section of the bedrock under constant pressure and measuring the flow rate, when a constant rate of flow was recorded for a period of 3 to 4 minutes the test was terminated.
Falling Head Permeability Tests - Falling head permeability tests were performed after installation of the open-standpipe observation wells. The section tested was that section of the bedrock isolated between the bentonite seals placed above and below the pervious section of the well. The depth to the groundwater surface was measured prior to beginning the falling head test. The open-standpipe was then filled with water to the top of the standpipe section. The depth to the water surface in the standpipe was measured at given time intervals until the water level had stabilized, or until the water level reached the level of the groundwater table as measured prior to beginning of the test.
2.2.3 Open-Standpipe Observation Wells
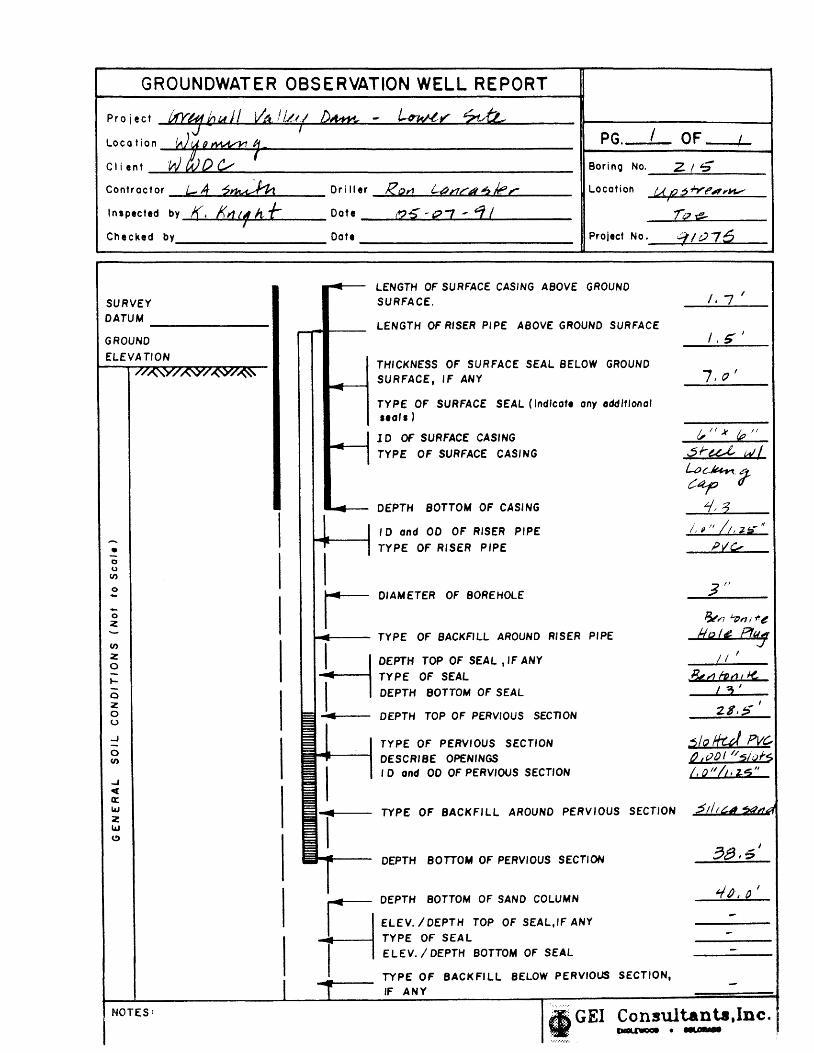
Open-standpipe observation wells were installed in each of the borings. The wells consisted of: 1) a 10-foot-Iong, I-inch diameter slotted PVC pipe, 2) I-inch PVC riser pipe, 3) a sand pack placed around the slotted PVC pipe, 4) bentonite seals placed above and below the sand pack to isolate the slotted PVC in an interval of interest, and 5) bentonite hole-plug to backfill the remainder of the borehole. A 6-inch-square steel locking casing was installed for all observation wells to provide secured access to the instruments. The depth interval where the slotted PVC section of each observation well was installed, was· selected in the field based on evaluation of the core samples, results of the constant head permeability tests, and other observations made during the drilling operations. Slotted sections were generally placed in zones where subsurface conditions indicated the potential for high permeability, or groundwater to exist. Details of the open-standpipe observation wells are given in reports presented in Attachment 2 of this addendum.
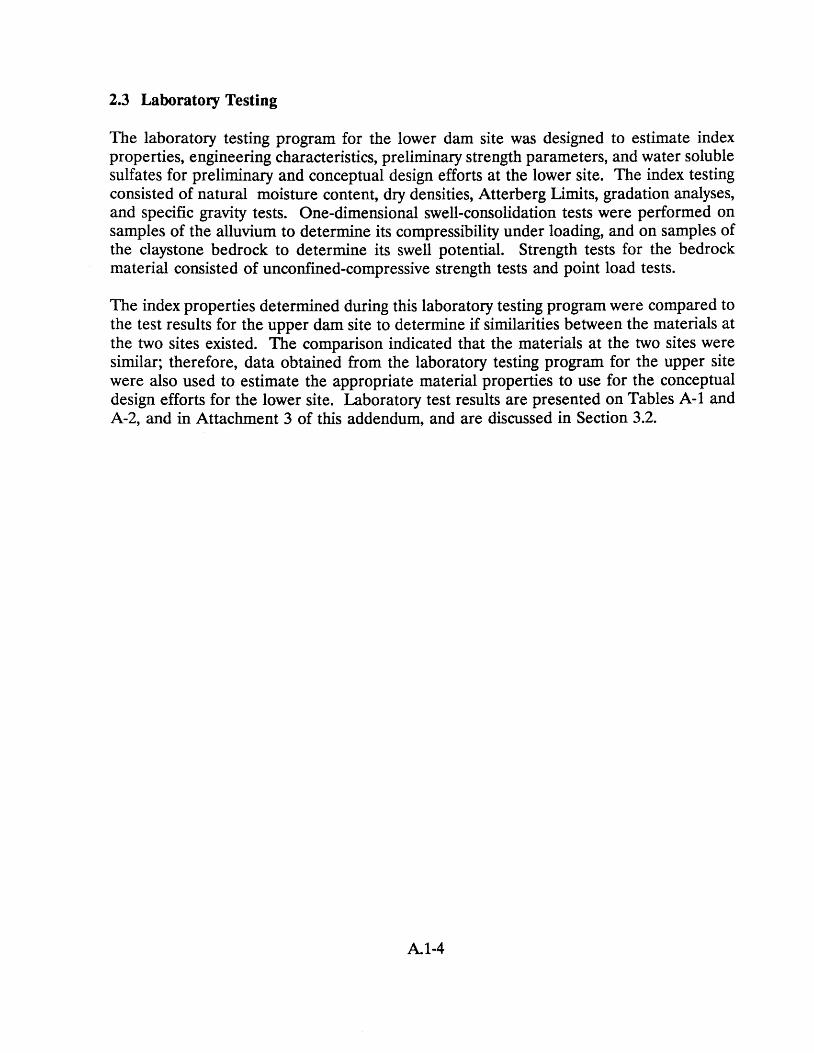
2.3 Laboratory Testing
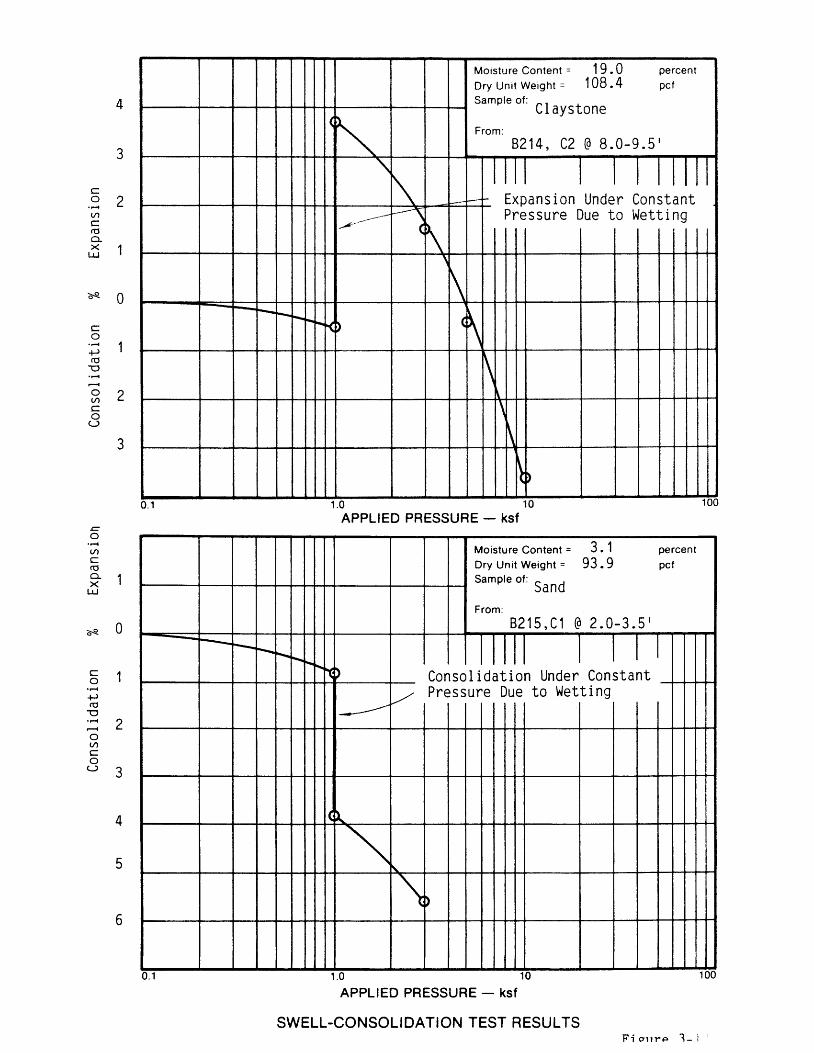
The laboratory testing program for the lower dam site was designed to estimate index properties, engineering characteristics, preliminary strength parameters, and water soluble sulfates for preliminary and conceptual design efforts at the lower site. The index testing consisted of natural moisture content, dry densities, Atterberg Limits, gradation analyses, and specific gravity tests. One-dimensional swell-consolidation tests were performed on samples of the alluvium to determine its compressibility under loading, and on samples of the claystone bedrock to determine its swell potential. Strength tests for the bedrock material consisted of unconfined-compressive strength tests and point load tests.
The index properties determined during this laboratory testing program were compared to the test results for the upper dam site to determine if similarities between the materials at the two sites existed. The comparison indicated that the materials at the two sites were similar; therefore, data obtained from the laboratory testing program for the upper site were also used to estimate the appropriate material properties to use for the conceptual design efforts for the lower site. Laboratory test results are presented on Tables A-I and A-2, and in Attachment 3 of this addendum, and are discussed in Section 3.2.
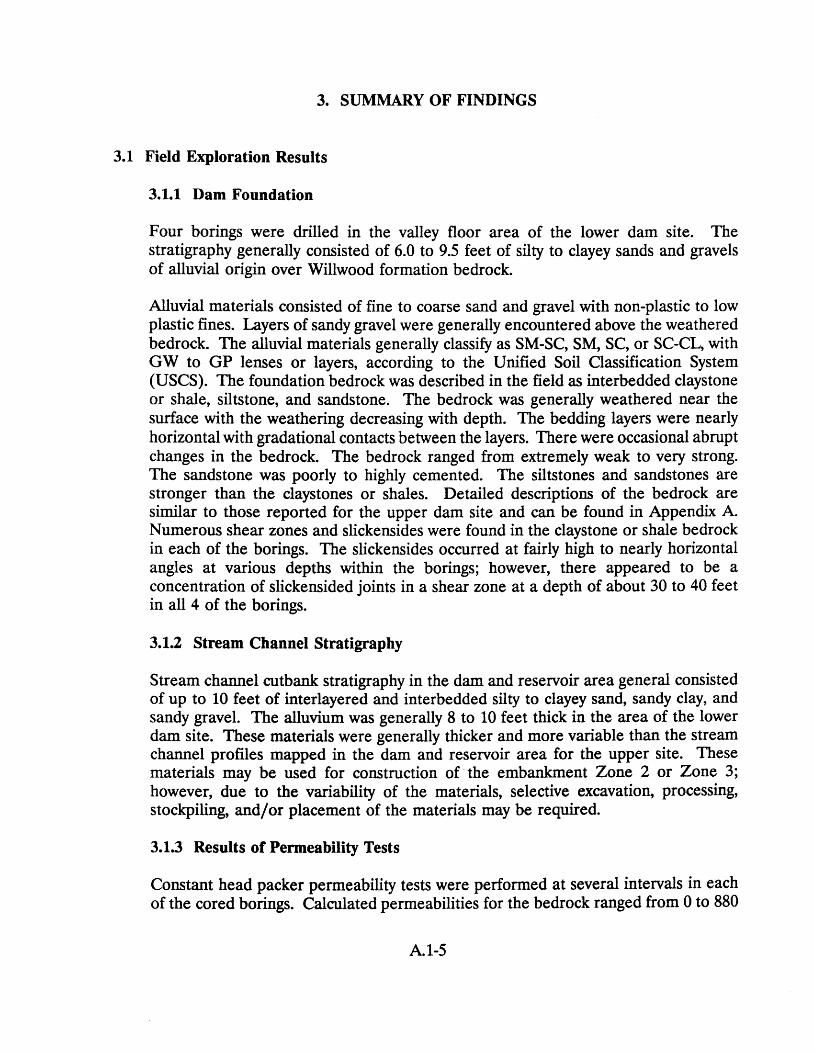
3. SUMMARY OF FINDINGS
3.1 Field Exploration Results
3.1.1 Dam Foundation
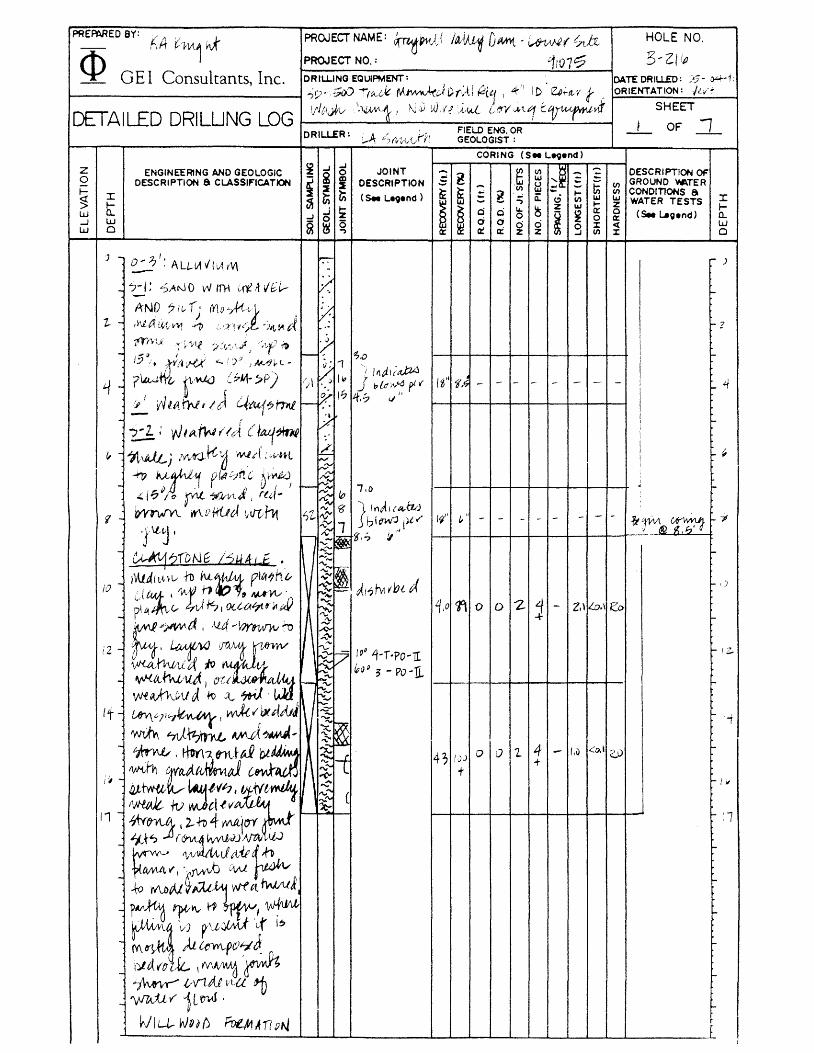
Four borings were drilled in the valley floor area of the lower dam site. The stratigraphy generally consisted of 6.0 to 9.S feet of silty to clayey sands and gravels of alluvial origin over Willwood formation bedrock.
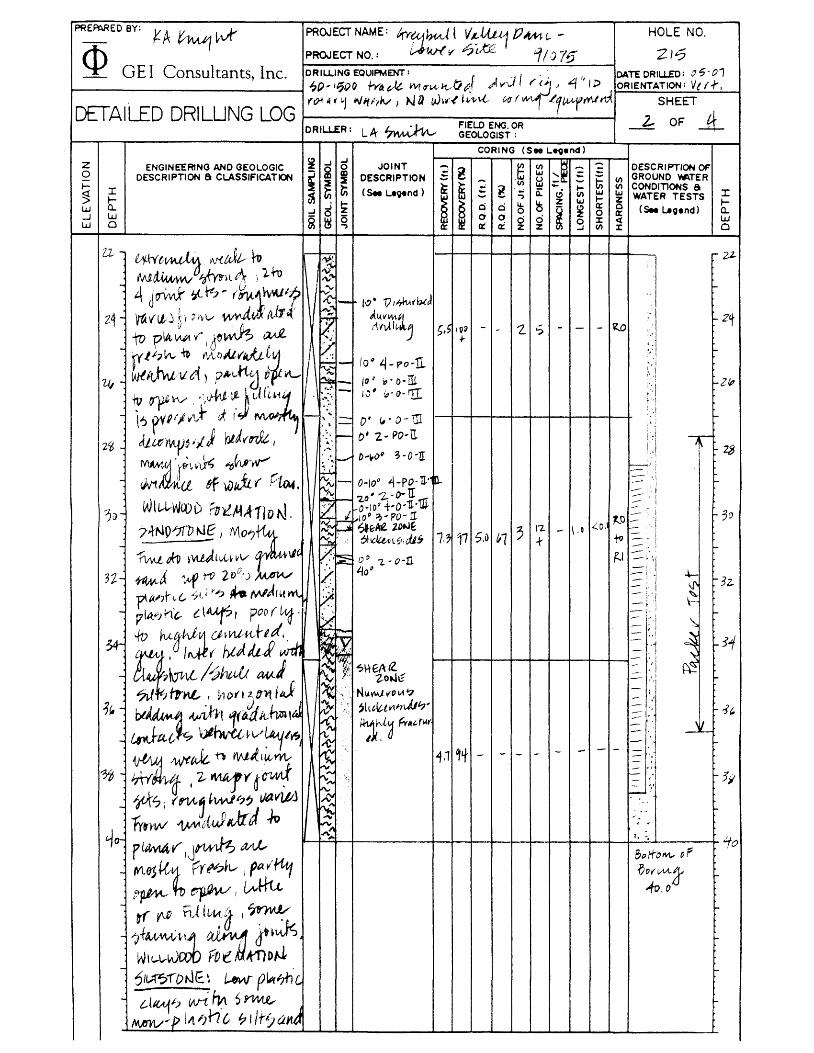
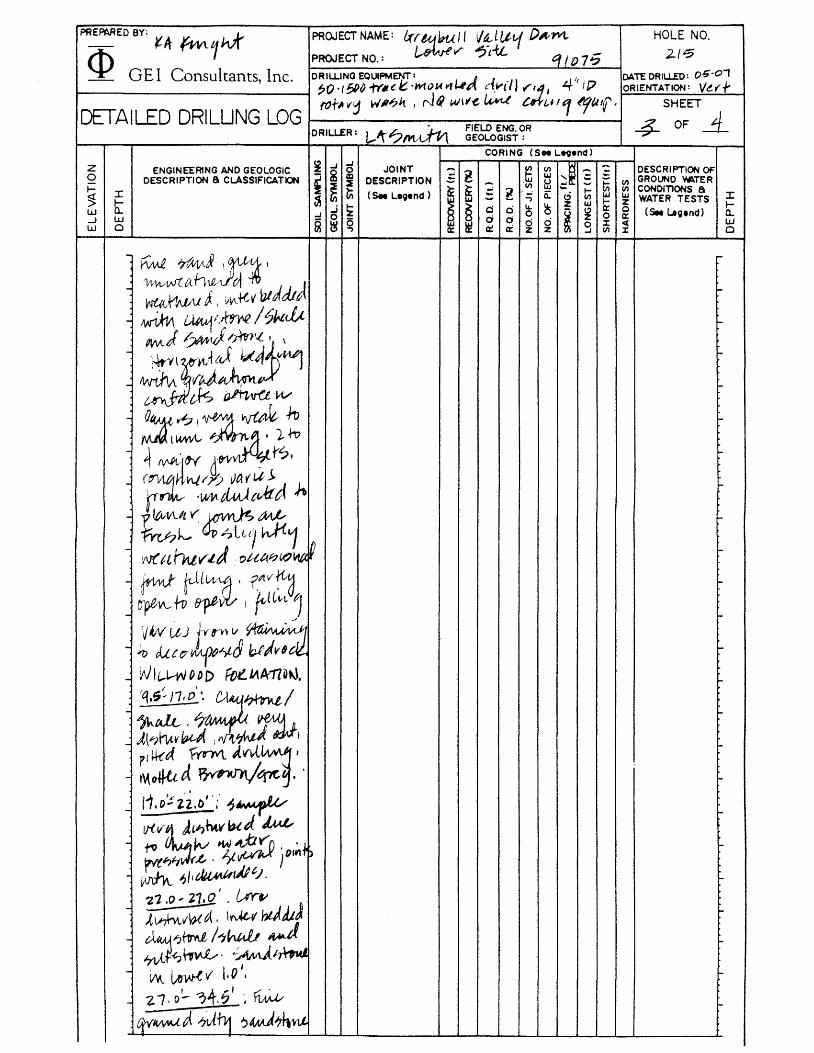
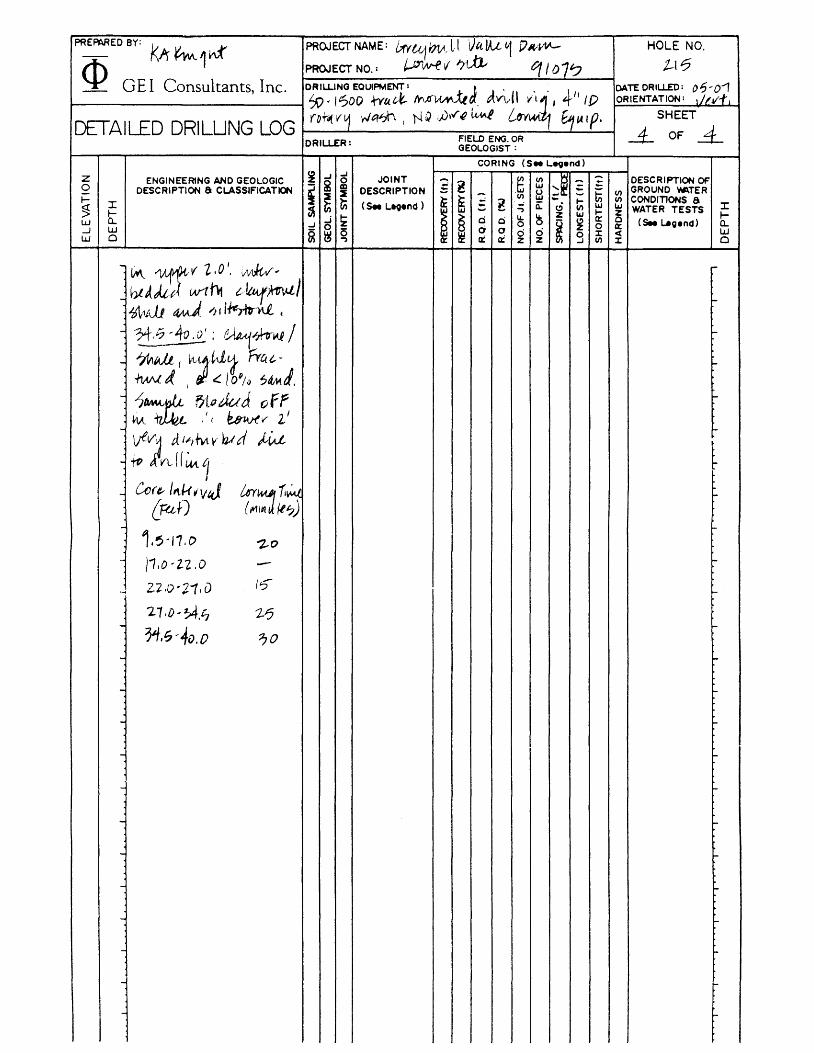
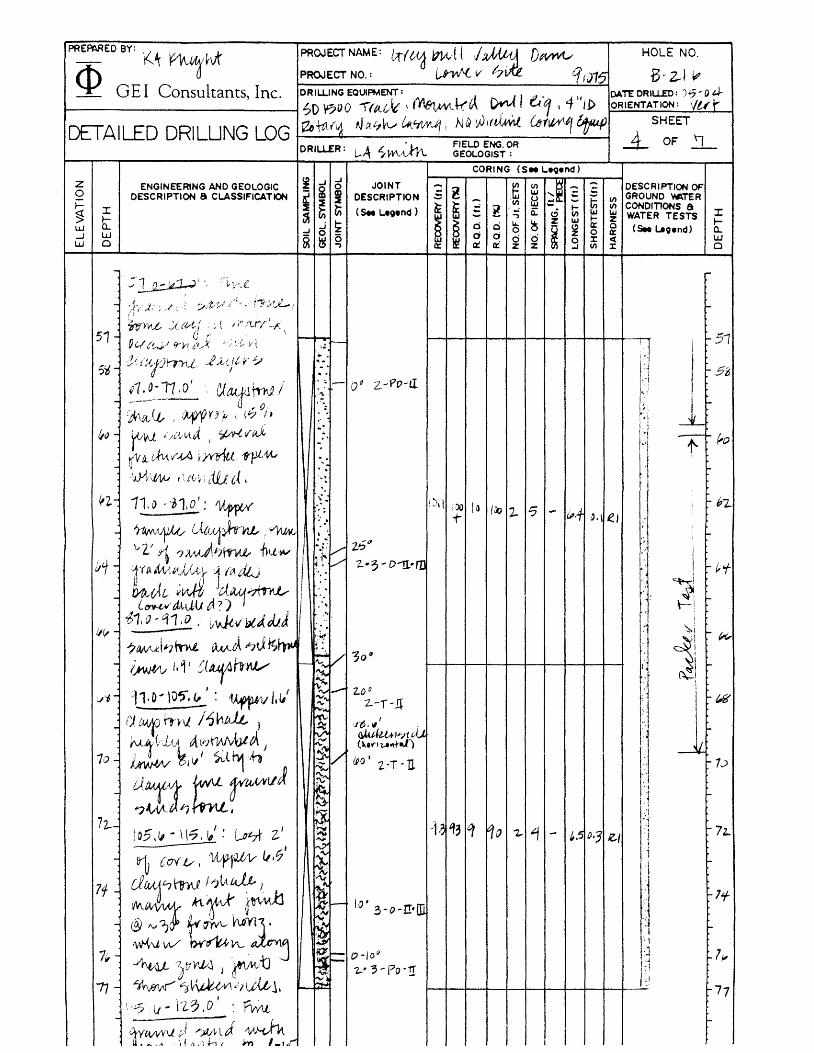
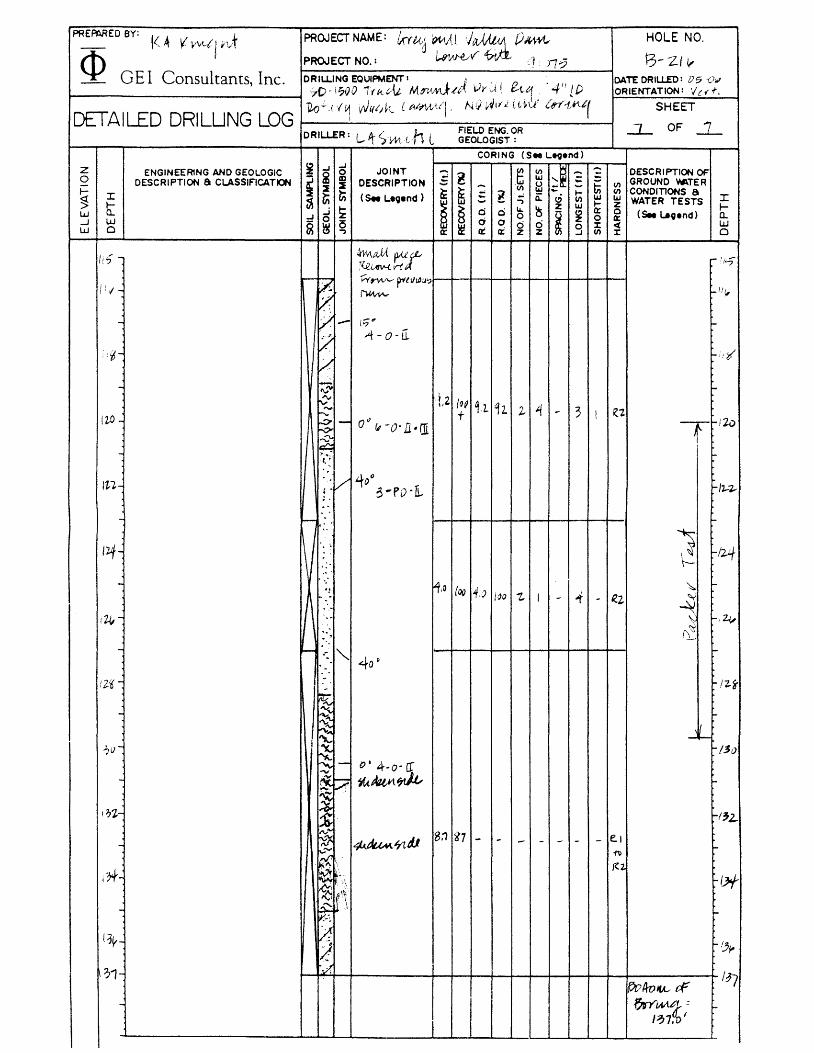
Alluvial materials consisted of fine to coarse sand and gravel with non-plastic to low plastic fines. Layers of sandy gravel were generally encountered above the weathered bedrock. The alluvial materials generally classify as SM-SC, SM, SC, or SC-CL, with GW to GP lenses or layers, according to the Unified Soil Classification System (USCS). The foundation bedrock was described in the field as interbedded claystone or shale, siltstone, and sandstone. The bedrock was generally weathered near the surface with the weathering decreasing with depth. The bedding layers were nearly horizontal with gradational contacts between the layers. There were occasional abrupt changes in the bedrock. The bedrock ranged from extremely weak to very strong. The sandstone was poorly to highly cemented. The siltstones and sandstones are stronger than the claystones or shales. Detailed descriptions of the bedrock are similar to those reported for the upper dam site and can be found in Appendix A. Numerous shear zones and slickensides were found in the claystone or shale bedrock in each of the borings. The slickensides occurred at fairly high to nearly horizontal angles at various depths within the borings; however, there appeared to be a concentration of slickensided joints in a shear zone at a depth of about 30 to 40 feet in all 4 of the borings.
3.1.2 Stream Channel Stratigraphy
Stream channel cutbank stratigraphy in the dam and reservoir area general consisted of up to 10 feet of interlayered and interbedded silty to clayey sand, sandy clay, and sandy gravel. The alluvium was generally 8 to 10 feet thick in the area of the lower dam site. These materials were generally thicker and more variable than the stream channel profiles mapped in the dam and reservoir area for the upper site. These materials may be used for construction of' the embankment Zone 2 or Zone 3; however, due to the variability of the materials, selective excavation, processing, stockpiling, and/or placement of the materials may be required.
3.1.3 Results of Permeability Tests
Constant head packer permeability tests were performed at several intervals in each of the cored borings. Calculated permeabilities for the bedrock ranged from 0 to 880
A.l-S

ft/yr (0.00085 cm/sec). The majority of the test intervals in the claystone and siltstone had zero measured permeability. In general, the sandstone bedrock encountered at the lower site appeared to be more permeable than the layers of sandstone bedrock found at the upper site.
Falling head permeability tests were performed in observation wells installed in Borings B-216 and B-217. Calculated permeabilities for the bedrock ranged from 12 to 1100 ft/yr (0.00001 to 0.00106 cm/sec). These permeabilities are also higher than permeabilities calculated for falling head tests at the upper site.
3.1.4 Other Field Observations
The following paragraphs outline observations which were recorded during our exploration program at the lower dam site. Conclusions which may affect the final design of the dam at this site are also discussed.
Core Recovery - As noted at the upper dam site, complete core recovery was difficult to achieve in the foundation claystones or shales. The claystones or shales, formed of highly plastic clays, tended to break down under the water pressure and rotation of the cutting head. Breakdown of the plastic materials would clog the water jets on the cutting face and, on occasion, water circulation was blocked. Occasionally, the core would rotate inside the core barrel and would be cut down to sizes smaller than NX core. The poor recovery of the claystone precluded laboratory testing of these materials for strength properties.
Water Loss During Drilling - Water loss during drilling tended to occur where the higher permeability sandstones were encountered. The drilling fluid would discharge into the permeable sandstones rather than being carried to the ground surface. Where this condition occurred, the permeable zones were later tested with constant head permeability equipment. On occasion, after considerable quantities of water had been lost, recovery of at least some percentage of the drill fluids would occur.
3.2 Laboratory Testing Results
3.2.1 Index Tests
Results of index and water soluble sulfate tests are presented in Table A-I, attached to this addendum. Generally, test results are similar to those found for soils and bedrock at the upper dam site. The following paragraphs briefly describe the results for the lower dam site.
The natural moisture contents of the alluvial soils and the foundation bedrock were low. Moisture contents for the alluvial materials were measured on two samples as 3.1 and 3.6 percent. The moisture contents for the bedrock were measured on two
Al-6
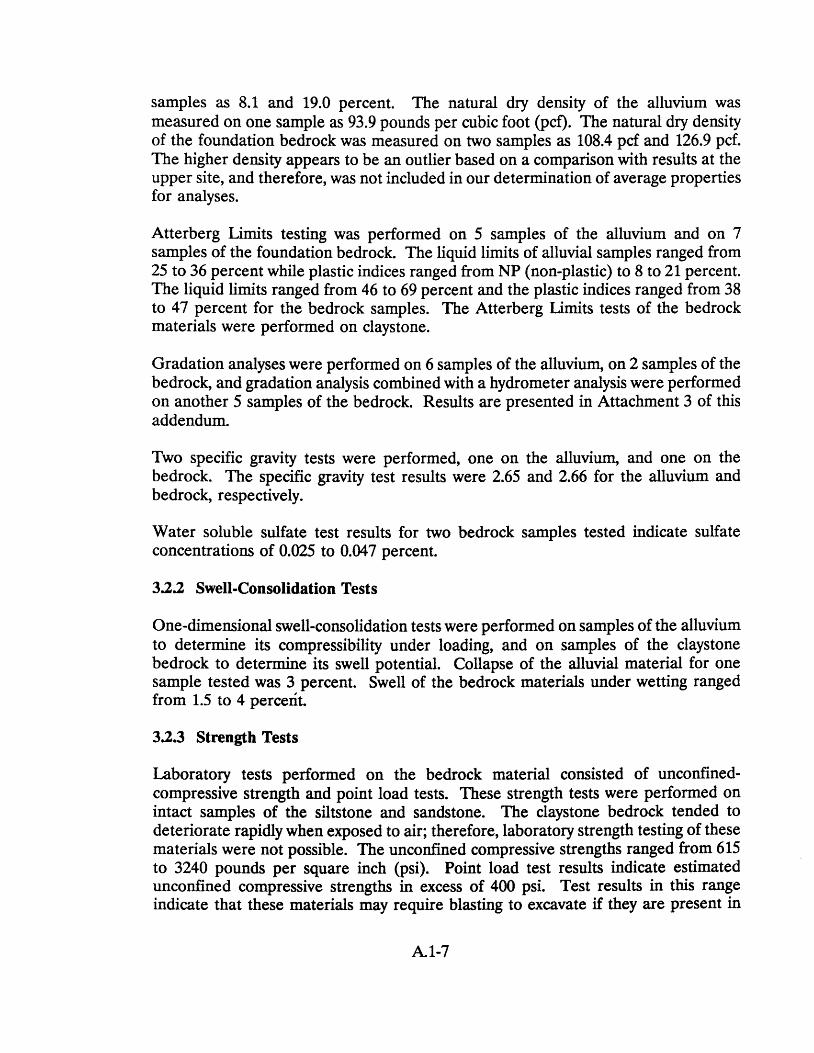
samples as 8.1 and 19.0 percent. The natural dry density of the alluvium was measured on one sample as 93.9 pounds per cubic foot (pcf). The natural dry density of the foundation bedrock was measured on two samples as 108.4 pcf and 126.9 pcf. The higher density appears to be an outlier based on a comparison with results at the upper site, and therefore, was not included in our determination of average properties for analyses.
Atterberg Limits testing was performed on 5 samples of the alluvium and on 7 samples of the foundation bedrock. The liquid limits of alluvial samples ranged from 25 to 36 percent while plastic indices ranged from NP (non-plastic) to 8 to 21 percent. The liquid limits ranged from 46 to 69 percent and the plastic indices ranged from 38 to 47 percent for the bedrock samples. The Atterberg Limits tests of the bedrock materials were performed on claystone.
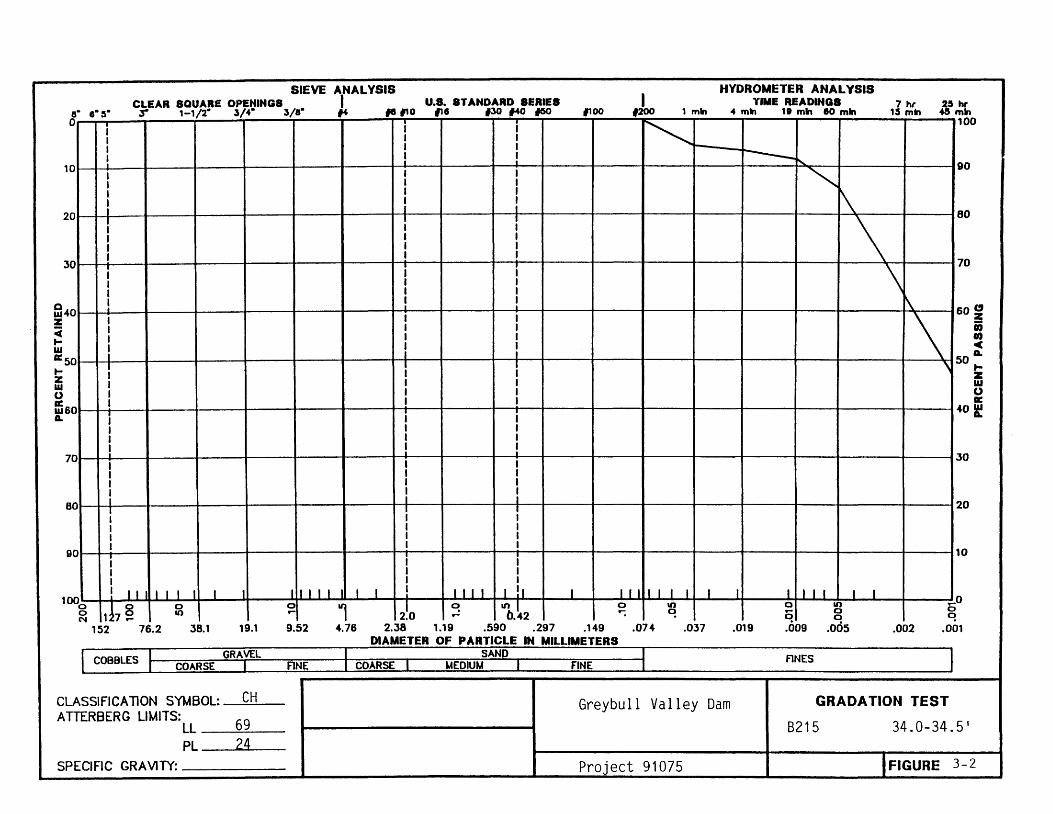
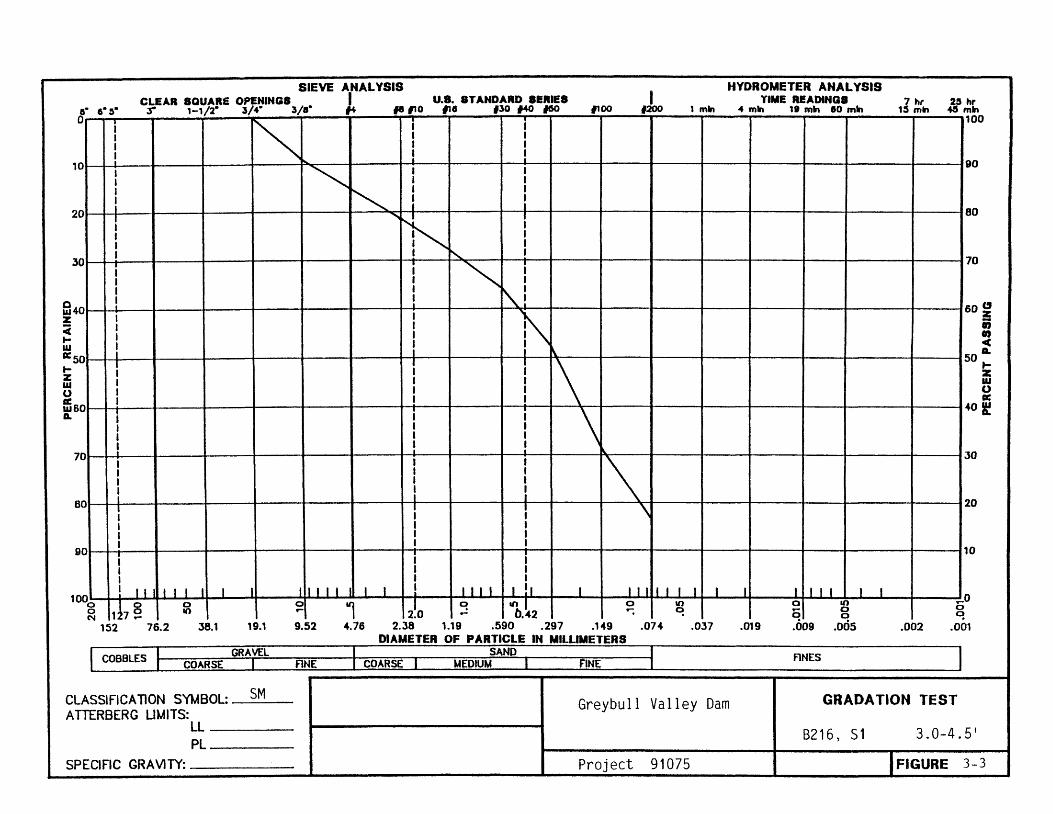
Gradation analyses were performed on 6 samples of the alluvium, on 2 samples of the bedrock, and gradation analysis combined with a hydrometer analysis were performed on another 5 samples of the bedrock. Results are presented in Attachment 3 of this addendum.
Two specific gravity tests were performed, one on the alluvium, and one on the bedrock. The specific gravity test results were 2.65 and 2.66 for the alluvium and bedrock, respectively.
Water soluble sulfate test results for two bedrock samples tested indicate sulfate concentrations of 0.025 to 0.047 percent.
3.2.2 Swell-Consolidation Tests
One-dimensional swell-consolidation tests were performed on samples of the alluvium to determine its compressibility under loading, and on samples of the claystone bedrock to determine its swell potential. Collapse of the alluvial material for one sample tested was 3 percent. Swell of the bedrock materials under wetting ranged from 1.5 to 4 percent.
3.2.3 Strength Tests
Laboratory tests performed on the bedrock material consisted of unconfinedcompressive strength and point load tests. These strength tests were performed on intact samples of the siltstone and sandstone. The claystone bedrock tended to deteriorate rapidly when exposed to air; therefore, laboratory strength testing of these materials were not possible. The unconfined compressive strengths ranged from 615 to 3240 pounds per square inch (psi). Point load test results indicate estimated unconfined compressive strengths in excess of 400 psi. Test results in this range indicate that these materials may require blasting to excavate if they are present in
A1-7

layers in excess of 2 to 3 feet thick. Unconfined compressive strength test results are presented in Table A.l-I. Point load test results are presented in Table A.l.II of this addendum. It should be noted that point load tests are not representative because they represent the best samples and therefore the highest strengths.
Al-8
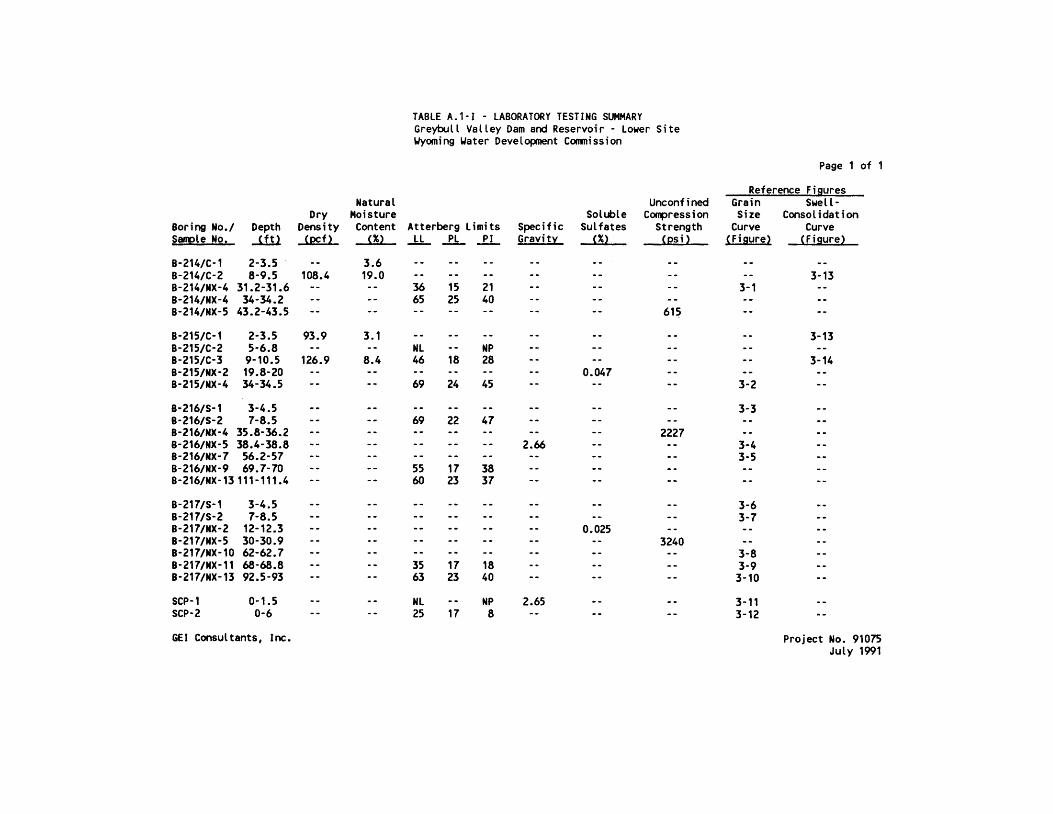
TABLE A.1-I - LABORATORY TESTING SUMMARY Greybull Valley Dam and Reservoir - Lower Site \lyoming Water Development Conmission
Page 1 of 1
Reference Figures Natural Unconfined Grain Swell-
Dry Moisture Soluble C~ression Size Consol idation Boring No./ Depth Density Content Atterberg Limits Specific Sulfates Strength Curve Curve Sgle No. .Jill ...ie£!L .....ffi.- ..1.L -f.L ..EL Gravit~ ~%~ ~I2S i ~ ~Figure~ ~Figure~
B-214/C-1 2-3.5 3.6 B-214/C-2 8-9.5 108.4 19.0 3-13 B-214/NX-4 31.2-31.6 36 15 21 3-1 B-214/NX-4 34-34.2 65 25 40 B-214/NX-5 43.2-43.5 615
B-215/C-1 2-3.5 93.9 3.1 3-13 B-215/C-2 5-6.8 NL NP B-215/C-3 9-10.5 126.9 8.4 46 18 28 3-14 B-215/NX-2 19.8-20 0.047 B-215/NX-4 34-34.5 69 24 45 3-2
B-216/S-1 3-4.5 3-3 B-216/S-2 7-8.5 69 22 47 B-216/NX-4 35.8-36.2 2227 B-216/NX-5 38.4-38.8 2.66 3-4 B-216/NX-7 56.2-57 3-5 B-216/NX-9 69.7-70 55 17 38 B-216/NX-131"-111.4 60 23 37
B-217/S-1 3-4.5 3-6 B-217/S-2 7-8.5 3-7 B-217/NX-2 12-12.3 0.025 B-217/NX-5 30-30.9 3240 B-217/NX-10 62-62.7 3-8 B-217/NX-11 68-68.8 35 17 18 3-9 B-217/NX-13 92.5-93 63 23 40 3-10
SCP-1 0-1.5 Nl NP 2.65 3-11 SCP-2 0-6 25 17 8 3-12
GEl Consultants, Inc. Project No. 91075 July 1991
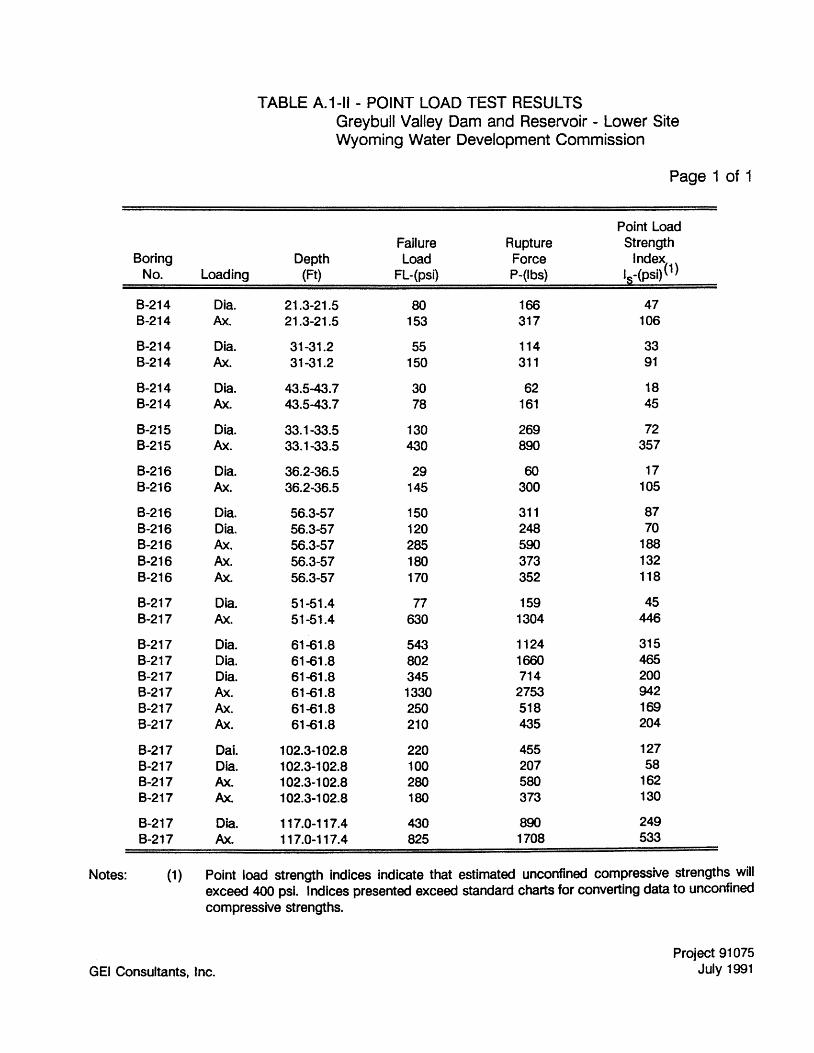
TABLE A.1-11 - POINT LOAD TEST RESULTS Greybull Valley Dam and Reservoir - Lower Site Wyoming Water Development Commission
Page 1 of 1
Point Load Failure Rupture Strength
80ring Depth Load Force Index No. Loading (Ft) FL-{psi) P-{Ibs) I§-(psi) (1)
8-214 Dia. 21.3-21.5 80 166 47 8-214 Ax. 21.3-21.5 153 317 106
8-214 Dia. 31-31.2 55 114 33 8-214 Ax. 31-31.2 150 311 91
8-214 Dia. 43.5-43.7 30 62 18 8-214 Ax. 43.5-43.7 78 161 45
8-215 Dia. 33.1-33.5 130 269 72 8-215 Ax. 33.1-33.5 430 890 357
8-216 Dia. 36.2-36.5 29 60 17 8-216 Ax. 36.2-36.5 145 300 105
8-216 Dia. 56.3-57 150 311 87 8-216 Dia. 56.3-57 120 248 70 8-216 Ax. 56.3-57 285 590 188 8-216 Ax. 56.3-57 180 373 132 8-216 Ax. 56.3-57 170 352 118
8-217 Dia. 51-51.4 77 159 45 8-217 Ax. 51-51.4 630 1304 446
8-217 Dia. 61-61.8 543 1124 315 8-217 Dia. 61-61.8 802 1660 465 8-217 Dia. 61-61.8 345 714 200 8-217 Ax. 61-61.8 1330 2753 942 8-217 Ax. 61-61.8 250 518 169 8-217 Ax. 61-61.8 210 435 204
8-217 Dai. 102.3-102.8 220 455 127 8-217 Dia. 102.3-102.8 100 207 58 8-217 Ax. 102.3-102.8 280 580 162 8-217 Ax. 102.3-102.8 180 373 130
8-217 Dia. 117.0-117.4 430 890 249 8-217 Ax. 117.0-117.4 825 1708 533
Notes: (1 ) Point load strength indices indicate that estimated unconfined compressive strengths will exceed 400 psi. Indices presented exceed standard charts for converting data to unconfined compressive strengths.
Project 91075
GEl Consultants, Inc. July 1991

ATIACHMENT 1
Boring Logs - Lower Site

PREPARED BY: 'A 0 I fl' v c t- \~l ~l/l{
<t> GE I Consultants, Inc.
I
t w Q
ENGINEERING AND GEOLOGIC DESCRIPTION a CLASSIFICATION
DRILLER:
JOINT DESCRIPTION
(See u9,nd)
CORI NG (S" L4t9,nd)
,~ (J)
~~ I.IJ --- (J) !rl :: ~ .... il: (!) (J) .., Z I.IJ
c:i C ~ ~ ~ ~ 0
ci ci 0 0 0 a:! Ii z Z ..J
~ I.IJ .... Q: 0 J: (J)
HOLE NO.
B- 2,14 DATE DRIU.EO: 05- Oif-'11 ORIENTATION: iU"t.
SHEET
_1_ OF ~
DESCRIPTION OF GROUND ~TER (J)
CONDITIONS a (J) I.IJ WATER TESTS I Z ..... 0 (See Legend) £l.. Q: c:( W J: Q
I r 0
-2
-
I i -1-
~
r- 8
-
i ~ 12.
i
I r-

PRE~ED BY:, !( ..1 Y, ... It1 ' ..y PROJECT NAME' J-., I. J I i I,.., I J 41 I D , \q "H'(\.." W\ . II\, TUj rJK-l,.\. V~ M1t\..-
I'h PROJECT NO. : IA-w-e V ~q ( ;) 76 ~ GE I Consultants, Inc. DRILLING EQUIPMENT:
t--____________ ~L70~I':?OO ,r~~-(¥\·~t1d d(l~d ft~') 4'1 iO
DETAILED DRILUNG LOG ror~{vJ Wf[i;Vv} NQWlfU!.'K! ~/~ .eD~hf~td FIELD ENG. OR GEOLOGIST:
DRILLER:
CORING (S .. Legend)
Z i ..J ..J
JOINT ~~ ENGINEERING AND GEOLOGIC 0 ~ ,~
VI 0 DESCRIPTION & CLASSIFICATION - ~ IX)
DESCRIPTION $ w - ~ i :J :J fcl ~ t; ~ ffi g VI I-
~ I ~ ~ (See LeQend) - a:: (!) VI W ~
~ .,
Z w I-
~ ~ d ~ ~ a:: w a..
== 5 0 0 i ~ ...J W (5 ci 0 0 0
0 ~ ~ <:) 0 z w ., a:: ~ ct z Z ..J VI
HOLE NO.
B - 2-14'
DATE DRlu..EO: r) '7 - 0<;5 ORIENTATION: v'Wf"
SHEET Z. OF ,.-, _ 2-
DESC R I PTION OF GROUND 'MTE R (I)
VI CONDITlONS a w WATER TESTS I Z ~ 0 (See lAgend) a.. a:: w ~ 1: 0
I - 21 i I I
h:1 -.1
,',: fo
o 0 Z fa - 0.'1"::' -hi D.I
! '"" ~.~i
"-
~ -~ ~
"
~ -~ ~~ -Zg
~ -
-32..
I ~34 i lI
I -t;;l -3",
~I ~-
~ -3'15 I i lI
i ~I-~
-
-
-41,

PREPARED BY: )<A ~w "1 ,J-- PROJECT NAME: IX( UJ :,~./t)! Jp)~tVWt..- HOLE NO.
<P PROJECT NO. : vYr .... ,'-l!/ ? '1 i 01:5 B ~Zl+ GEl Consultants, Inc. DRILLING EQUIPMENT I , f'" -4 'I DATE DRIU£D: 0"-0'6""1;
0D .. \ t;1Ji) il ~t~~ M"';fVn.t'~v .. d '/" ~¥'~11 I ~ ~D ORIENTATION: Ih-f;¥ri~1.J.
f!J t /1/0 wat/Yt c'CtIIJt"'1' N'CtWi((./,;t.W wf1 SHEET
DETAILED DRILUNG LOG 1
DRIL.L.ER: L,A / 'f'V\ FIELD ENG. OR .2L OF .3-! ,'~'Y~t,(, GEOLOGIST:
CORING (S .. LeQend)
Z ~ ..J ..J JOINT ~~ DESCRIPTION OF ENGINEERING AND GEOLOGIC i 0 - ~ ,~
II)
0 DESCRIPTION a CLASSIFICATION ~ CXl DESCRIPTION - I.IJ - ~ GROUND YlATER ~ .-. !rl II)
~ 2 ~ ffi
II) VI CONDITIONS a I ~ t; (See LeQlnd) :: l ii: t- I.IJ I.IJ I
~ ~ (!) II) WATER TESTS
b: ~ .,
t- Z ~ ~ ~
Z I.IJ f-..J 0 0 ~
i ~ a:: 0 (See Legend) Cl. UJ ..J 0 0 0 a::
-l W ~ ~ (5 0 0 0 0 0 J: < W
UJ 0 ., a:: ~ ct: z Z ..J II) J: 0
- ,-
~l. D .:31...1.~. 111 if? ~,,'k
-F~("t ,II D (!'lr)JIV'/ t-
:)YvcU ' kttv txt(?</ d - L,..4'~.\tA.( V ~ t'P,1 9'D ~ IU( ,; -~~-',-: ~ ~c~V - -~,
- 3710- 4",o~: 'J;W ZI t-
-- T,'1 /~ ) 7(,till, I-
)..,lrr' ) ~ 6Y~}~ V :; ~ II I ,?J f ~ - ~~
- W I f1;{(v V tJ ~jf~ ...
- tR-<)) (fi ) --
- ID,~¥l-'ljO 34- I-
~11 O' ... U,·V 21 - 1A, .) ~ 21 \) I-
1-0
- 17,0~ ~)1,? 40 t-
~. ~7, 0 - i-f':l;O -- ...
- I-
- I-
- ...
- ...
- I-
- -- r-
- I-
- r-
-
r -
I I

z i ..J ..J
JOINT ENGINEERING AND GEOLOGIC 0 - l 0 DESCRIPTION a CLASSIFICATION - i Q) DESCRIPTION ~ i :I :I i= t; i ffi ~
::r: ~ ~ (Seel..eg,nd)
~ ~ ~ W ..J ..J -1 W ~ ~ (5 W a .,
CORING (S .. Le;end)
~~ .~ (I) ..... w .... frl :: ~
(I) t-; ii: ci C/)
z w ci ci ~ ~ 0 i ~ d 0 d 0 0 a: a: z z ..J
~ w t-cr 0 J: C/)
HOLE NO.
6- 21 '5 DATE DRlu.EO: 045" 01 ORIENTATION: Vlyf.
SHEET
I OF-=L
DESCRIPTION OF GROUND ~TER (I)
(I) CONDITIONS a w WATER TESTS ::r: Z I-0 cr (See Lagend) a.. < W J: 0
PREFMED BY: rA ~1~vr PROJECT NAME: kYfj. ~ll '0~~'1 () ~ L. - HOLE NO.
¢ PROJECT NO.: k/-(v,?utt 1(075 21~
GEl Consultants, Inc. DRILL.ING EQUIPMENT: . ' I DATE DRILLED: CI? - (.11 t,()- '?OO h1Itk wr" ... ,,A:i) )v.J 1:f1.' "'i! IP ORIENTATION: Vt (-t. (o-t 4"1 rvitJ,1v I N ~ Ww'.( ti;1-1.{. (,.0- ( .trW1M1 rd., SHEET
DETAILED DRILUNG LOG J:. OF ..L DRILLER' LA ~ FIELD ENG. OR . GEOLOGIST:
CORING (S .. Le9tnd)
Z i ...J ...J
JOINT ~~ ENGINEERING AND GEOLOGIC 0 ~ ,E (f) DESC R I PTION OF
0 DESCRIPTION a CLASSIFICATION - 2 j DESCRIPTION .= UJ - ~ GROUND \'ATE R i 2 frl (f)
~ r;; ~ ffi = ~ (f)
~ (f) CONDITIONS a § I ~ ~ (See LtQend) ...: a: c5 (I) UJ w WATER TESTS I
~
~ -, z UJ ~ z I-
w a.. ~ ($ ~ ~ d 0 u. ~
~ ~ a: 0 (Set LAgend) a.. 0 0 a: ...J W
~ ~ (5 ci 0 d 0 0 J: ~ W
W 0 -, a: ~ Ii z Z ...J (I) J: 0
tL - UWt~ vV{tJt-- tv -~ .-zz
Mtt'-w~w ~.l t\- ) lh f~ -4 d~ ~1'7- (iv.llvoV'? \ I~ r-
1"- V/~(biJ ..
I~ 1-
24 - ~ V lti~ ;~ i ; ,'v V ~~ '/t .. 11' 4' ~ ~IAVlM.1 - Zf tv pIA, Wt v 'trwJ? cv.£ ~ ,1(,.,0" j ~.5 ffJ" - - 1. .; - - - ~ ;
V- i- "
- \ 6 l . )Yl';>k- ~ "'to;'.u~ ~ :,' >-
~ :- 1011 4-ro .1l . W{1(...h\l/v ci, ;/.4-d1.~ fJ V'- ~ /0 1 jp-o-ffi " 14 - , , . - 1-2~
~ or>>v'>'~J~J~ .. ,- iJ' 1p'0-'1I ,', .. '
- \~ rl/;lv~ ~ f -,'~ - 0' (,' o~m l-
· . "
JtU')~, 'I j (Jdvn.l.t I :.;. ....... O· 2- po,ll : -r 2~ - .... Z2 "\';\,J~ 'c~
· . ...-' ()-ioO~ 3· 0 ~n i · .... ( ~f
~ 0-10" 4-po· n.. ~ -- W1 ~,(l of 'W"'-tt ( ,c'lo4. ""..: ,.-> ' ....
~~ ",," -z..-o-[ -, WI L.-lrWQJ D Po 'i,tt All () N . Z - ,..0-10" t"o'1L'~ -
~)- .J ::', I ! - 50 lOP ?' po- il ~o :: ,I 7#1P'Jfl)tJe I MO'J:l
.~ p ~~Af utJf 3 17. - \,0 ..(0.
P 61 iC~t ~" rh~ 7., 17 5.u ill f9 - 1 , ,
f --. I -~'*o Vvwl(~H_V t t1J()
-"I r-.' ~ 0° -z. -o-!I. f?.1 -==~' '. J -I'
3~- hW-& ".of MI 2. Viii J ~ i.jo~ -- ~ - 1-3z..
rt('/r~c.. -Ji. i r-?,;" fAltll~m.. ...... -? - " ~~ ..
-- plR~'ln" tl4U.f?r poor ~- :"x; - I-~
\
*-4v ~~.":j (NVKt-1 d,. 1 ~ =' .. 1 -51 ~' ,-I q' I (/-,lJ.ItJ ..nil ___ .'i - , I
1~\l./~t1t~ av..J i ~~~: <S1-\-8At'l :'1 ~ - '2-0N~ .1 I"'
7J lfJ-rtL., ~1()(1 jO'l1 fJ :' "I
". \ ", N\,I.~(OIA? -
;.j 1{' -
~ :" ~lt~t 't1.f1J.J'?" - -if-~Mt-hl i(6./JIt:t.;..,rJ \;
c.,-,Ja;;, ~)lhvtt'H/~'~ ~(J Fr-1f"tU(, - J
~L - , .
I-
~~ - - -~ """,&<t n fWJ (U-~ ~ ~.1 - - - - -
- 'I
~- J,\-yj wt ,2-~y ~cw1 ~ '" ~' ':·1 - 3; -:
¥tt,; (~1 ~tM.II'7? lI~vlPJ ,0- ' .. ~
.' - ..... -rrrrw ~d,uP «1ld ~ ..z~ -< •
~o- F iM1A"v I Jf1,t-J? ~ ~; I. :~
'10 5",rt~i4t1,..- of
- 1119$ ~ Pr #.>Il.- i f"" H-tt ~orVlA-tr
fplM-' ~/ f LJ+u -40,0 -~ yt&'. rl.ll/.t~'8 f ~ -
- -'l~~ ~ JU,J<; I-
WI (....I.AJ Po e ,ffi D~ -
~1A?-rorJE ~ ~ pllti;h'c, I-
- t-lJ<.A1~) ,wi ~ 5 Ywtt,.. -
MIf'rV'" P lit I)M ~ ~ I1r'1 aittJ
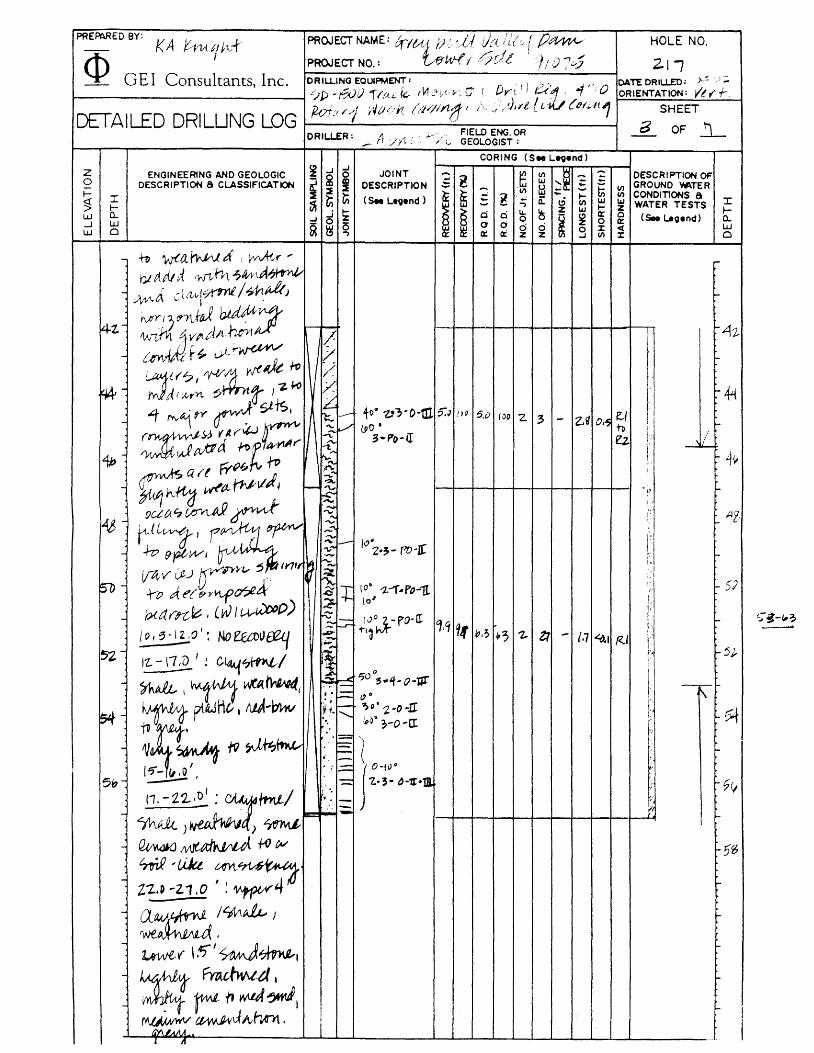
PREPARED BY: h1t' PROJECT NAME: l(~/1 V~lU,'1 f)",'YVL HOLE NO. - r.A (1AA1 2.{-:5
<t> GEl Consultants, Inc. PROJECT NO.: V ~-d:L q (f) 7'5 DRtLJ...ING EQUIPMENT I A '/ OATE DRIU.EO: 0,-01 ~O.(~~-tt'_,t·H10£hft.l c(Vill~, 4 II? ORIENTATION: V~f-r
rrJ+~ Vj WII~h) rJt( Wl(-t.-~ U1'1 h1tl'f· SHEET
DETAILED DRILUNG LOG -9- OF .A. DRILLER: 1,'r?MA ... ,h., FIELD ENG. OR
GEOLOGIST:
CORING (S .. L~end)
Z i ..J ..J JOINT .t ~~ DESCRIPTION OF ENGINEER1NG AND GEOLOGIC 2 i ~
(I)
0 DESCRIPTION a CLASSIFICATION ~ DESCRIPTION S lU - ~ GROUND ~TER ~ ~ ~
...... (I) frl (I)
CONDITIONS a li; i :: t .... (I)
~ I
~ (See LeQend) ..... .., n: ci (I) I.IJ I.IJ WATER TESTS I
t-~ ~
u.. ~ Z lU .... z t-w a.. ...i d 0
i ~ cr 0 (Set LAg.nd) a.. ..J
~ 0 0 cr ...J W
~ (5 d d 0 0 0 :r: « w w 0 .., ex! Ii z Z ..J (I) J: 0
- FWi ~J \~' r-
- 1NVvwt C( h~,\.1 ~ t W!ltkt~JAl ;, I Wt +tV 'r;I ddt ti I-
-~ ~l~/?hJ,t -PflVtJ ~1rfJ /)1'e-It.( I \ -:5lntA,tJ 1.0(14 -
_ ~ ,VN:t~~ .....
, ".fG'./ ~vaw
_~~\~~h l-
I WMA- :Jt1 ' }. h> - 1/IMJH d~1 ~r.;." I-
- (~",rr.> vtlv'l.J> -r 'wl-ttlM)td:td .h - f ftt,1I\.It V ~ ~ -~)~ , ~llAl ~'1
-)"'/( It fn.tv' . .tJ : ot.tt{/'JIQIA.p.~ I-
-~ tJltA.'Q.' f;tV~ I-
bptV\, tv e-pt I fA ~H ') ..... - J
VWI..tJ tn"'v ~ - .h, cJ..i C 1:7 l4itft?~& bt iv, I-
_ WI"--~WPDD Ft>l.~A11utJ. I-
'tf'7~J1,i: ~~I -~~/~a ~
I-
_ Jtv;t1A.V ~ I r{1(,~ I I-
r1ikt.i WrM. A~' - M o#tl ~ l}vncTil/tfIC- .' I-
_ l1'D~·ii,o_:.> 1~ I-
~V~LJ)htVIuJ J.w., - f'9 W tW Jt.b Y. , ,...
~* (.t,. ~~ jol>1h - ~~ J;/l tittMtI,H t/ . I-
'2"2.0 - zyL' . Urfl J - ~vV;(d, 1rvk4 wJJ I-
- :rtN/?Wtlt ......J I-
~. ~,",~. ":~J'}~' - ~ j),.w-.( V 1.0 I, -- I 4" ~ 1,7·0-? .f;) _ ~
I-
qY/(I\A\;lv{ ';tA ~ , W "~.~1l
PREPARED BY: kir hf PROJ ECT NAM E : brY U) ~J ! V Ct ItlL 1 Ii ",w- HOLE NO. - ~1
<t> G E I Consultants, Inc. PROJECT NO.: tJrvv-e V '!J:J., q 107":/ t.l? DRILLING EQUIPMENT: J' DATE DRIU£O: ()., ~ 04
~'I?OO +v"tt. ~~. Avvll /'1' 4" If) ORIENTATION: llt.iti rotil{V~ wt/f~h I NQ :;.)IV~ 'wAf L~1M.1 qlAlp. SHEET
DETAILED DRILUNG LOG -±. A-DRILLER: FIELD ENG. OR OF GEOf..OGIST:
CORI NG (S" L~_nd)
Z i ..J ..J JOINT .~ ~~ DESCRIPTION OF ENGINEERING AND GEOf..OGIC g 0
~ V)
0 DESCRIPTION a CI..ASSIFICATION ~ IX)
DESCRIPTION :: LU - ~ GROUND ~TER ~ - frl V)
~ ~ ~ i ffi ~ V)
l- V) CONDITIONS a ~
I ~
(See L.~nd) - ~ ~ c5 IJ) LU LU WATER TESTS ::c I-
~ ~ u.. ~ Z LU I- Z I-w 0.. .,j Q 0 0 i ~
cr 0 (See LAQ_nd) 0.. ..J 0 ci 0 cr .-J W ~ ~ (3 0 0 0 0 x < w w a ., a:: a: z z ..J IJ) X a
- 1M. ~ V 1,. 0 '. iiV1.kv" ...
blAh.({ went t~~1 '"" - 1ANJJ ~ /j I itry1Tri'-t c
- ?+,~~4o..:.2:; ~/h~ / "'"
- ~ I f~Jl\.hJ- frii t> "'" ~ d I '. ~ loQ/1> ?dMJ.
- -5~ 1}toduJ oFf -VIA ,I( ~V2'
-vev1 d /~IM v f..t d tid -
~ - tp Avt.[fu.tfj I
- Cere- /rtf.{ ivJ irr:1r;~ i-
(Fat) {l41tn 117) - ....
1.'5-11.0 '2.--0 - /110 ' Z. -Z .0 - f-
.... 2."2.0 '211 D I? r-
21ID"?4.~ 1-5 -31,fr4o.o
-:;0
-"'"
- I-
- I-
1 i-
- ...
- I-
- -- r-
- I-
- I-
- -... I-
DETAILED DRILUNG LOG
z o j:: g w ~ w
::x: h: w a
ENGINEERING AND GEOLOGIC DESCRIPTION a CLASSIFICATION
~
~ ~ ..J
~
..J
i ~ ~ ~
:;. /"
'/ ;Y'
..J JOINT 0
j DESCRIPTION
~ (See Leoend)
~ 0 ..,
CORING (S .. Legend)
~~ g ,~ (I) -.
5 w -frl ~ ffi :: l
(I) I-; d: (!) (I)
~ ......
Z w
~ 0 Q I/,. ~ i ~ 0 d a 0 0 9 Q: ~ Ii z z
I "j ,2 II 'i/.-, - - - - - -
~ w I-cr 0 J: (I)
HOLE NO.
S- 2/ (p
DAn: DRIU£D: )3 - ~-1;
ORIENTATION: 'h~'f
SHEET _,_ OF l
DESCRIPTION OF GROUND Wo\TER (I)
(I) CONDITlONS a w WATER TESTS ::x: Z I-0 (See LAgend) a.. 0:: « w J: 0
,.... )
-2
-
-
-, )
- I z..
i
4~ I)) 0 0 '2. 1 - f.y <o,i <.y
t
I-
1-1"
~ :1
r-
-
-I-
....
-r
L :
PRE~ED BY: tA~'iJ~ PROJECT NAME: W~ !lW' ).t~'WK-- HOLE NO.
<D ~,wf:./
3~1(J PROJECT NO. : c qit11tJ
GEl Consultants1 Inc. DRILLING EQUIPMENT: .
DATE DRIU£D:
?OIGOO ~ irtldt: Mlhvvtk4 w~H t'i~1 i , 4i1 I D M~ ORIENTATION :
.. SHEET
DETAILED DRILUNG LOG ~1.h)'f.Jk; U(~VV1.ll; N J WIt/? kvtl (:Qi I-u1 fIt~~·
.2.... OF -:L-DRIu.£R: 'A,1/~ 1:\ FIELD ENG. OR
....... c "t "I GEOLOGIST:
CORING (S" L~.nd)
Z ~ -' ...J JOINT ~~
...... ENGINEERING AND GEOLOGIC i 0 l ,~
(/) DESCRI PTION OF 0 DESCRIPTION a CLASSIFICATION i j DESCRIPTION :: I.IJ - ~ GROUND \'lATER 1= ~
..... (/) frl (/)
li; ?i ffi :: l t- (/) CONDITlONS a ~
I ~
<See Lagend) a:: (!) (J) W L\J WATER TESTS I
~ ..... .,
~ !z ~ ~ Z L\J t- Z ~
IJ.J CL ...i ci 0 l£..
i ~ cr 0 (See L..;end) ...J
~ 0 0 cr a..
...J IJ.J ~ (5 d Ci d 0 w 0 ::t ~
IJ.J 0 .., cr a:! ~ z Z ...J (J) ::t 0
- S I LT7TD~e • [...Ol)J pi ~t;+1~ r""
_ ~ 1M rd·tf'h ('~~.' pltt~rl" I-
~ ~t+s._1AA£ l t"'.R ?4M1fJ
\1- tt1; I\Nlttvf'A h\.t/.fcl W IV'
\T o-wvb M-<rf 11
6 I~I/(t/L hti/t,{ d j t.,J.{v·'bel(dJd IV""' v
C~1qla, I - ~f\ 'l" ir-'1r'V i .~ ........ "" -)'6 " v [).j.;;'" f /"'5V '\.. ~¥'-' ~d ~ >(A./~ (~.~d·"}1t- . '\;""
f\),a'{. ,.tv~ I - ~ '1-nl,I,',) bt I/k!t ~I :-'" -
~ dw.hl./,~"J tt tP - 11/ Ii. ;: (tttvntlu' r!. ~ Ht ;", WtVO ~ T -20
'(J r~'Ct "v Uuf tv';; AJtt1 '\.. ;b'~1 ~ - ",!ALL f1. l\l~h'YV?\Y:1' 'V -Z.
~ - - - - --- - - - - I t2 _ .<. +v <\ d~~' ~ , -"\..
..... - - zz W'J.1 ilJiV't{b) t ~ 1M1 Ii 14 f ~
.-", ! _.ec( .;t (lAvttt )~ ().(O I "'A- I
~ I -~"{ t,l.·, L .. ,h> '),l1 ~k t I ..... "\;
.:y : 1-z4 Z~- ;Jt'tlt'rli II c{ '...~!Y\ OlUt?ID~'1 ...... <fIr
"\,"" I
111 ROW kI(L~"~ -.:; I ~'V
m - ;7;.'\(/it-j Ct r{~'\. ~ I , ~ ~ .: )1 I-,;;'" i-
I,
~~fM1 rvltvLl-J r~1W .:: j': ~: u-
..,.. -I --.r r I
~lf1f1) d1{em~J ..::::: " j -24 .-
I~ (jJ{{{t9"d • ~ \. - -...::>-
~ "...., -
Vi tl.../... 'vvO{)D ~,(/l4notJ ~ f" ~
t~ - ..s..w07T/>NE? M0;:L L J ,..,,- :~,j I ~ --;.$
yvWI "'i '/Y\l! ,i ' ,MW ~ J ...5<- t;, _":-
- r::f th c).t~ Ii; I -~f :,~tf +'"J 1..0'/$ ,~ !~ I;'
i1ltt~t\t.- &]J 14 to AMUft~t- ~ i, i ~: ~l 30- !: i.-· . ....3;)
l' lA. f7h:v t.(/Uf?' pouv' 'tI b " j ...... -..;.
..,.~ $ :t4 ~.JtJ, M' 1.-- ....... - ! f ... I,
.....::- r,. 32- - ,{'ritJ.(J.d ~ 7 / ~oo 2'3- 0- 10 100 1 70 0.4-d~J;~!?,t~ rz>ar. ~ ? - .tt ~ r I- .32-
tt'~ !~(t'l~.J ~ - ~Jt. j.) , , ~ f:, W.u;,,~ ft,o/1"r~ t,( .... ~~ ~ -
"
7 .. 31-- ?l~~~~~ l: -31 ,-,
'7 / &0' , ~~~~
· . ~', - · . 2'p"'D-rr-m
~ ( -
,1{.t$ -~ J(,'IItA£il "
3y - i,....oo"" 0- -3~ rr~ ,MM.. .~,atz.ti h ~ 2 ~o - n::.
"
pto'tvti'( 'I', {C\,.JJ aAL ,/ (po • 2- ttL "
31- ~ \'
~ rJW, eH:e1 - - ;7 - J'{Jl \v t:'pt'-' v . t,.l.. r(
I-I'M {~{t(iV~ it 7,-w')....-~i",. I~ .. IM'I v~ /JiFrnIA
a .J
PREPARED BY: K A \(,\'\ ti\ i'\.-t PROJECT NAME: ~tljbi~\l V~D~ HOLE NO.
¢ ,
PROJECT NO. : ~ 7t- 11D75 B' 2.--1 ~ GEl Consultants, Inc. DRILLING EQUIPMENT: r Q'" ""' DATE DRIU£D: 0';-04 ·1/
/;)D -\?{)v 1(A.dt- M~pA [).rtli 'I,: -4 ; (), ORIENTATION: Vu i" ~t,ytV~ vJ~'jl;1 L;({,WlI'1 ' NQ {J{{& V01.{ (..rIwt1 SHEET
DETAILED DRILUNG LOG ~ '1 FIELD ENG. OR OF DRIL.1..£R: ~A. tlVwitth\ GEOLOGIST: -
CORING (S .. LeQ,nd)
Z ~ -' -' JOINT ~~ ENGINEERING AND GEOLOGIC g 0 2 ,~ V) ..... DESC R I PTION OF
0 DESCRIPTION a CLASSIFICATION ~ al DESCRIPTION :: IoU - ~ GROUND 'fIATE R
~ :I :I ~ V)
~ ?i ffi :: ~ V)
l- V) CONDITIONS a g I ~ (Set U9,nd) - ~ IoU IoU J: ~ ~
~ .., (!) V)
I- WATER TESTS
~ ~ ~ Z IoU Z ~
W CL .J d 0 IA.
i ~ cr 0 (See ug,nd) CL -' 0 0 0 cr -.J W
~ (5 d 0 0 w w 0 ~ d 0 J: ~ .., cr ~ ct z z -' V) J: 0
- -~tJ.
POLAf A [ION, _ d ( i-l--rJ VI)V -I
B ,'7-I?.&. ~ /I d.J mu.. 31- - ) ~o(J
1~'V II? I ~ ,/~wJ -"§ V '--31
38- h J.-. ~ -tela. {!I>'¥)I')hwa ~ iii roo 3j5 I '. ~~l~rI'l ~r- (UTI- i~
- i~ '2- -
i ? ., /1 . 0 '..: :,.,( toi-fA ..z, ~f1.2 ~ 4,1 14 4.2 '6~ 1. I - -1,2 - ~o.
lfJ-< -'V - 'fo ---- I I : f~ ~i'" ~\-k'( Urff/ , ·1
VI\; /;:1 -
fY'{ ~o .J- aU J1 I :~ ~~p -~
fl ft-- ¢1ilY~ "v"I't'[ hit Ii ~ .-~ 'i· -4z
'~J: \tJ ~.(tf." .
r~ Nl) eG(i~~
- t-.lvvtttl.td ,*Ct-~~ ) (' roo
:,-y" C {/t.~ Ld/~' J \ ..:.::: [ 44- -,\-'"
f-'(W ",j J~ '''1j (,!TS i' ; ~ -i.:f .-.c- r "" .- - - - - - - - - -"" , - if)' httJ ,,;:: -\ "'~ I:
17.0 -2.12.' • ~t- ~,f.11 .::.:::
~\I-\< 1 I.~ .. j
roo f" U d v vtl.1 d ~;Xttf- tr~L--l-1 :0- .J
~ - tVtC'H.I/t-d. '3 I 1 W' . r--~ -1
.... .... 1}~ ~(vkW.A ~
,..,
~ ~OIl2.''; -Po' ..,
1~-~ ,1
v1l , , :f S::: ~'!IL :1
f- "tg .1 2{, C - ?(,Q ' .. ·~uppev 19,1' ~ - of> 1.- Y'o-T!l ':j
- ..;..;;;. :i ....
vlV$ V' J-;.£ d, ..,..f'd -tJt.-L ' •. 0" z.,~-Po-]!
i ~ ... f-- , ~j
~n- te-v 1 ~ (I) f.c;;:t. i t\;~v Lt:uret .' ,
'~, .. : : ~ ;{o" - 5J
l~ c.{4 . / 'Zd-u~ ~ ,-D-JI''ll .,
1 - ' ,', 0' ~ - ?-tJ ~hvu I 'fvJ'7'7'{,jMt ' , ,1 ,~ -
· . . -,~ " ~ w. v'Ci\.VU.L d , · ."\.~ . .. eo 5],.- 31, 0 ~ 4z .. :.p '! VvvkVI4' -'. q,~ ~q ~., ~'1 2- 4 - (',f P,I :1 t" ... , .... sz 0- -+v :':)
~v. e-i .t.At f'?·hnu tit;e.-,J ~I '1 +-- - ~ c:::{1U{":lhnV /~,llt~ I
;-:.i :-1 -:.-
ltt:nWYt,l i"? 4 . ':1
) 5t- ." -5,/ rA p "'1' .. - ..
4?-.o,41,(): Urfer ~~ · .,;1 :
-< '. "
I -N,.-r ~ -~o \ ~;
~(., - /\.e '::'V'v'-<-,\.L r I
l,": · .. -,;;-(, J ..
~ 51- --Ii I 0 - s81.!£' : CA~ I -.!.:: ~(oluNv'
~h~ L %ftuv -l~ ?Jj-.d~ -57
- ~ ~M ~·VIU-·" {, I roo
~~ A '} t--f-11.t. \
PREPARED BY: \(k ~hk PROJECT NAME: itft~ 11l--1,A t j ~tJi, D~ HOLE NO.
m ' . 'd PROJECT NO.: /.,Yl-v"{ V /7iA!l Cj'{J15 B" z..j ~ ~ GEl Consultants, Inc. DR tL1..1 NG EQUIPMENT: .' ...• II OAT£DRIUED: )<?'O~
t--------------f ~D \?DO '!(tt&·'t \ t'r1.e1.w"J.-(~ ~ I i!.t1' 4 It> ORIENTATION: vur DETAILED DRILUNG LOG ~+V{iJA N~~,tAv ~~J! I NG Wt(~ WwY'if ~ SHEET
FIELD ENG. OR .A- OF l..
Z 0 i= ~ LLJ ...J W
I r-a.. w 0
-
ENGINEERING AND GEOLOGIC DESCRIPTION a CLASSIFICATION
-'1.1'\- I '//1 . .-:l i • ..J~f
- .f,.1' /:. 71.;.-/ /'F l ",. ~ ", \ ...
\-;0 "'I"'(I.'f 'It (fhrt, W}Y1£ , .. /, ,v"'.l '. \ I"~. t -'r.. \ 51 - (' r
Ol..-( tt..j,! .;,r'Y! t~(/.i;- .; '£.. 1'\
5'1J - .J~ i t1.,/)t7Y1.L, .R.'kjtv ~
_ ~~~.~_~~~~ , CCutJttllJ I :th~t-~ , ~n,}:, , ~t7 v/,
ito - rhl !/c{,.vt.J I 'j/K.v0,
r,1f fA (,tv\ v -<.A ~ ~Ul',uAN - u
:.JA, \.bJ,.t, r: d/~ , i. ttL {{ .
i .J - i i ~ ~ ~ .J .J
~ §
... ...
.J JOINT 0
Q'l DESCRIPTION ~
~ (See Legend)
!z (5 ..,
'; :- -- i)q z-Po-Ll ,,,, f'.
GEOLOGIST:
CORING (S .. Lltgend)
~~ .....
~ .~ (/) ..... :: w .... .... frl ....
~ ffi :: l (/)
l-:; a: (!) en
i i L&. ~ Z w
c:i 0
i ~ 0 a a d 0 0 IX It z Z ..J
f:\ I , ,JO I Q /fk) 2- ? ",1-f"" -
DESCRIPTION OF
~ GROUND 'MTER (/) (/) CONDITlONS a w w WATER TESTS I
I- Z r-a: a (Seeugend) a.. 0 a: J: ~ W (/) J: 0
I-
-51
-
: -"1-J. \ el ;
-j
/ i I': ! r-~'f
.- !i r-
;
~I "'w :
j\ '!
'j -\ i -/$
:·i ,,' ,'! -
J ~lL ,'.j
I- 1:; .1 'I
, ~ I-I'i
1':\
,'i -72-"
'i j
i i ~ -'j -71-~i ':,t -I
l '~
-1" :.1 ,.J ( I ~i .' 1-77
....

PREPARED BY:
~A-; f-~t1 vvr PROJECT NAME; ~-Yllj~l/ UQU..t~ V;ww HOLE NO,
<l> B~ Z/~ PROJECT NO. : LqrP-i\/ ~v ~~rl 01 f? GEl Consultants, Inc. DRIL1.ING EQUIPMENT 1 .., DATE DRIU£D: 0'7-0'5
~ !?oo ,1""( ~dlft1 OU/.,ltJ (/v'Jf JZt"l ! ~ if ltD ORIENTATION: Vwf,
ut/!i>1 Y'J4~h (t{',1 nl/, t~f) W(I<-lixt(Jt'f1./ SHEET DETAILED DRILUNG LOG .tL + DRILLER: L A /' A J-y FIELD ENG, OR OF
" "7l'vtA .... GEOL.OGIST :
CORI NG (S .. Legend)
Z i ~ ~ JOINT
,~ ~~ DESC R I PTION OF ENGINEERING AND GEOL.OGIC i 0 ..... ~
(/) ..... 0 DESCRIPTION a CL.ASSIFICATION ~
IX) DESCRIPTION ~ IJJ ... ~ GROUND YlATER ~ ~ (/) r- ~
~ ~ ffi !! t- V) CONDITIONS a ~
I ~ ~
(See Legend) ... .. 0:: (!) V) UJ UJ WATER TESTS I r-~
.., z UJ t- Z r-w Q.. .J ~ ~
c:i 0 L.I.. ~ i ~ fr 0 (See L.eQend) Q..
W ~ 0 a 0 0 0:: -.J ~ ~ 0 0 0 0 0 z < w w 0 .., 0:: ~ Ii z Z ..J V) Z 0
- f\ ! l i "1 t () ,tt I ./ .... ;l ... "'" i . t~, r t C , I
j~ f ft) hi"£ ''''} '<,:JC~V1,/l ~:i ;,:,,1'11'\.( -, - r-
z.~"\1-1 ,0 ~;: 'V\J.
71- ------ ,\ ~~ r--"' ~ • ., ' . . ·1 iC) 1-9¥t2.-j • t- 1 t...f· (. 'lA/tit t
.~ I i ,'U .. ~.. .' -'
1~- ;il(' ?r:"').;.IJ~t.{.'f "it/~~ f - 7z{ , ~
/JyitJ p I~~')rlc rv,J aLl {. - "0- ; 0 • '" - - -/'</Ij'y'br' ''I t'· i ~ :::=. ~'?-PO"
, \,.00" • ..{ . f",," t ~ · ... I-l!. ' U ~ 6) -
i!.~Ll_ # 131. 0 I
- r-iO " y -',,'
If. .' - t. " ~
? 10 /00 "
K - - (e 6-;,.- rAY (", (fi.1f tl) ,,{.,\ Vr;fe 1~~.o ; - - - ej I- '8'z..
l)\'1 lVU{ 4tJ) f r\ t tv " (~-.r) e:z. - j ~((j(.I/ r-
~ ,'1--' ';,0 1'1 -~,
/1 .. ,:- t7lnt1& "f -
~4 - - -:11 ,;;v r /1,0 V- I M -hAlx...-. I
---
34 -/1(0 -1-1 ,D 17.
=- " .. i - . .. 21 ,0 ~ ?110 Z4 _, .. 1; ;;. ~~.I· "
'i<, - 31,0 -4L,O i-5 l6 ~ ~~u(v T - 8(,
~ ",
4'2- 0~4-1 10 40 -~ i" .. r-
+1,0 .... 1J1. () 24- ~ ,-
" .. I tfi,' .. ~ -(
! ~8lf · ~ 51,0" 11110 1+
~ - I --- .:
~ 01:> 'Z.-rD*JL -- £11 i 0 -11. 0 71 -.' ~i I-
~ -. ,. -
</J - 1{lo"Sl,[) 3"1 · ' .. -' ~: - .. 'to ~~.
=1:' &1/0 ,111 0 8'2. ~ ~i >....-.... I I - · . i- -,' - ~, -1-0 ~ 3-4-D-fr[ -
Q110 .. /O;?, ~ .. _-
----' -~: Or . ~r~ - I
I 0,,), ~ w lfGd? itO if:. ..
~, - 11-6.D g~ '-. ,(,I) <tD 'Z. '3 - -1.1 (.1 fJ "--
j! --2-1 ';~ '-- I~,V s,rj2;,O #*1 - . l-
V. ~.': 4 . ' L+.i Cf1- l1 ?LO" \'2.1,0
.. ~
.' . I -1r .. " ""
" ! .' . 12.1 ,J -- I "?1 ( 0 - • t· ',. ...,
- ~ y ;' . 1-.....
1v - ~:: ~ ,
~ .J '''J
T 9'1'
~ -."" 11- -...... ~ r- '17
- -

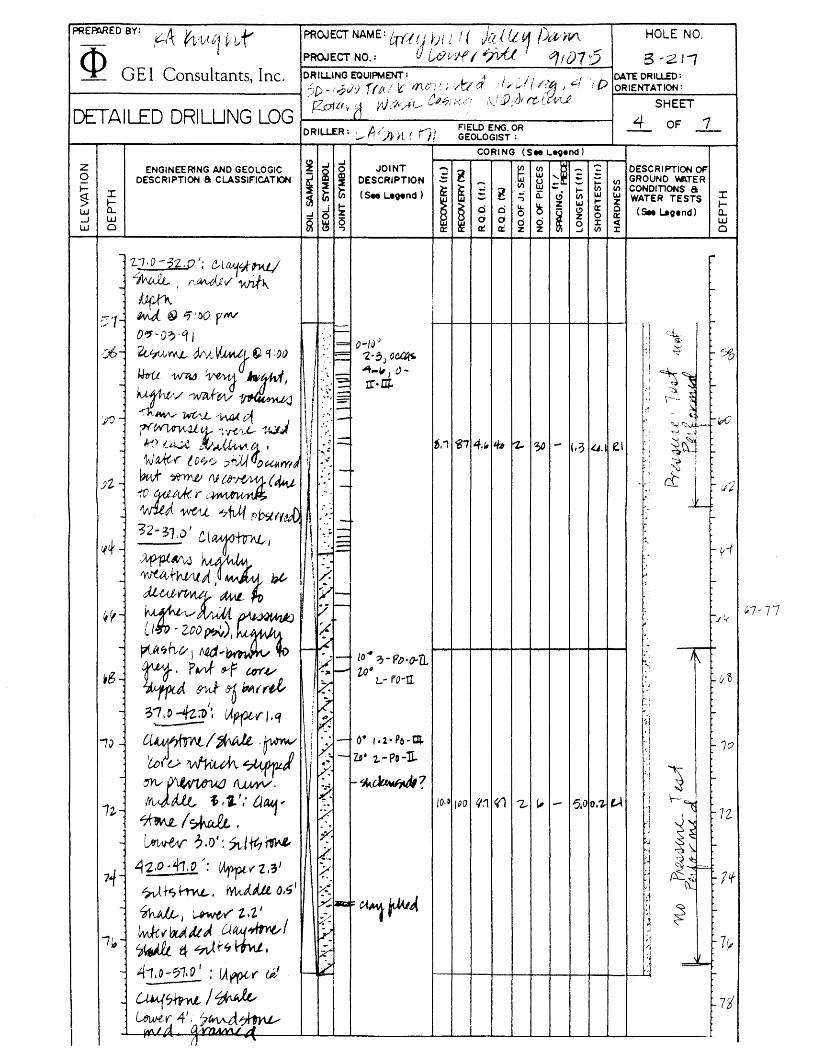
PRE~ED BY: KA f'4 h}
PROJECT NAME: WUjvIA.D j(V·(;lt;v1 t)~ HOLE NO.
¢ PROJECT NO. : ~v "7t1tt. ,;jj D 1..'? 6'2--11/ GEl Consultants, Inc. OR I t..L.1NG EQUIPMENT: . p{ " 'I' e .t/ If " OATE DRIu.ED: O~ -0 ~
-50' 10$00 Tl~C)t.- MC'"WVft Wv I fa,' If.) ORIENTATION : ·.it,v ( ~+(,'«("'! N().''I~l {(JJ/t'vJ:~.': N G Wlri! :,tl (ff.{.,· SHEET
DETAILED DRILUNG LOG i
--L -± DRILLER: !-A L~l~ FIELD ENG. OR OF GEOLOGIST:
CORI NG (S .. Legend)
Z ~ ...I ...I JOINT
.~ ~~ ....
DESCRI PTION OF ENGINEERING AND GEOLOGIC i 0 .-~
(I)
0 DESCRIPTION a CLASSIFICATION ~ CD DESCRIPTION - w - ~ GROUND YlATER :I - hi (I)
I- :I r;; ?i ffi :: l ... (I) CONDITIONS a ~
I ~ ~
(See ~nd)
~ ..... ..., a: <.:> (I) w w WATER TESTS I
h: !z i ~ z w ... z t-w .,.j d 0 I.&..
i ~ 0:: 0 (See LAvend) a.. ..J 0 0 0 0:: ...J W
~ ~ is c::i Ci 0 0 0 l: « W W Cl "") 0:: IX ~ z Z ..J (I) l: 0
- ,...
~" !--
- r-- "!V\/~ d!'J htvh -f ~ p,~ud~ q1- v"'" I~ ~:"l. ~ f-11 P(t, \l"'t.Cvv)
9c j-vVf,r1tt • , 'q~- ~\
I
I- +6 I'~ ~ i t ..
IfYac./--.tI4j ~i .' .... - ..... ~. ;.Wi YIJ ... : . ¥ ~ ..
~ &,,,)I.£, 0.£1
l r • (~) - ..
I- ItJD !~ ..
'. "" , ., - ., .'
to,l :00 - e.J " - - ~ - # -..
~ 11-
io~-,
-+ +0 -0 <"':-, I- 102 ".- rv"(.( c tv v'IJ It"
~
~ - ~"o ~\ -: .;. _V~ 'i'j,.. \L.
/Of .'
~ ... / I- 10"1 . '
I ' .. :' ~. I
I
- " ! f-... :
I--~ --.iL lOW -
;-;. A,~rYlv'~) -{ 0" ,,;.;~
1 i ~~ ......
- ~~ l-
f j$_ ~ ~ ~GAeZONI: f- I (J'6 iO' ~ ?() ~ z'?- ?o~n:
~ i'i' .
-~,
f-",,""'" i
~ '30· -3-0-11 ~I i tV -
~ ~ i-f,,;1
. ,. 30· 3>-O-o..'l). ~,1.. '52- 1,1 11 1- " - 3,~ O,~ lU ~ ~ " - I~ k &o~ ~ f-
I~ ~ 4..LU(Ui-~6\J.t ~7.
~ i!L-
~ I-/,z.
- ~ ,.. <'0/10
I~ . , . II~ - ~1::~ 1-111-
V " -f~ I-
'-~ j~ II~ - iI~
- I-
- -
z ENGINEERING AND GEOLOGIC 0 DESCRIPTION a CLASSIFICATION ~ I ~ w h: ..J W w a
-
-
!2-0 -
-
It1-
-
IUf-
-
-
-
-
-
-
-
i ..J ..J g - i i :I :I ~ ~ ~
..J ..J ~ ~ ~ 0 .,
JOINT DESCRIPTION
<s.t LeQend)
~" ,{ pM fl.t :(eiAIN. rl d.
..... ~ :: ....
! ffi ~ CORING (S .. L~end)
.~ (J)
~~ L&J -..... (J) h3 .... :: l ~ Ii: ci
... (I)
d d 1.1. :5 z I.IJ 0 i ~ d 0 0 0 0 a: a: z z ...J
HOLE NO.
6-Zlv DATE DRILLED: 0'3 i)., ORIENTATION: './{¥'';.
SHEET
-2- OF ...:L
DESCRIPTION OF GROUND 'MTE R CONDITIONS 8 WATER TESTS
(Set l.-Qend)
J: .-0.. W a
~~ p-tlIlWU';}.I--+---+---+--f.----'I--+--+--+--+---I
r-- ,: . ,,: " . ' ; ,
1\ '.:
~
Ii:;"" --1-0-il
\,2 ';41 ~.l. 12. 2, ~ ~ 3 I 0" (, -0-11-1].
- ... " _ 40 p
T
~ \,.
i ~ fl..,
II -~
~11v1fA... cF 1;n1NtA :
1;;7fo'
H2o
I-
1-/1-1--
I-
-124
--;Z{,
I-
-jz,a-
-
I-/Jo
I-
~/~Z-
I-
I-lJf
I-
''J~
/37
I-

DETAILED DRILUNG LOG
Z i ..J -' JOINT ENGINEERING AND GEOLOGIC 0 0 DESCRIPTION a CLASSIFICATION - i j DESCRIPTION i ~ ~ ~ g I ~ ~ (See Ltgend)
~ i LU a.. -' -' .-J w ~ ~ (5 LU 0 ..,
-
CORI NG (S .. L~.nd )
~ ~i ....
~ C/) ...... :: w - ~ -- frl C/)
~ ffi ... l C/) .... C/) - :; a:: ci C/) w w
~ ~ ~ z w .... z
d 0 LI..
i i a:: 0 0 0 a:: d 0 0 0 0 J: c( a:: ct! a: z z -' C/) J:
0000 -- ----
71' 100 _ _ l'
DESCRIPTION OF GROUND ~TER CONDITIONS a WATER TESTS I
~ (See t..Qend) a..
W 0
-e.,::),j.,;t ( .1
"'fA,"I'~ -r~ lv' 'f/ -
- 2.
-1 i ..
" !
... l
I - g I
-
..
-I~
-
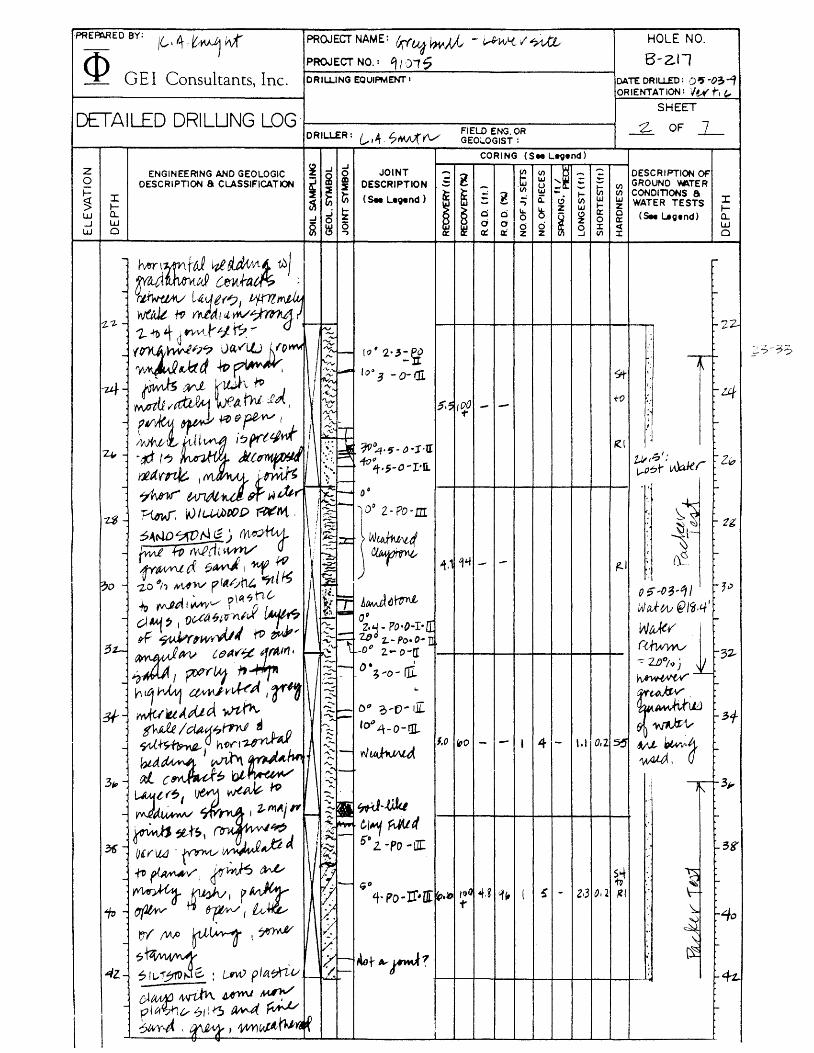
PREPARED BY: 1(..141~~ PROJ ECT NAME: fJifUrJ ~ - ~/A}-( :/ ~4 HOLE NO.
<P 6-Z11 PROJECT NO. : Q"J1? GEl 'Consultants, Inc. DRIU.ING EQUIPMENT I DATE DRIU£O: O'S ·O~-i
ORIENTATION: Vt-¥' h "-SHEET
DETAILED DRILUNG LOG ~ L DRILLER: (",4, cSMiV(" Y\,/ FIELD ENG. OR OF GEO;"'OGIST:
CORING (S" L~end)
Z ~ ..J ..J
JOINT ~~ ENGINEERING AND GEOLOGIC 0 .... l ,~
V'l DESC R I PTION OF 0 DESCRIPTION a CLASSIFICATION - ~ CD DESCRIPTION ~ w .... ~ GROUND ~TER f= ~ :! ~ V'l ~ V'l
~ li; ~ ~ ffi ~ ~ V'l CONDI11ONS a ~
I <See Le9.nd) - a:: c,; V'l W w WATER TESTS I ~ ~ .
~ -, z w ~ Z ~
w a... ..J ~ ~ d d Y.. ~
~ ~ cr 0 (See L..gend) a... ..J 0 0 0 cr -.J W
~ ~ (5 d d 0 0 0 J: ct W W 0 -, 0: a:! ci z Z ...J V'l 1: 0
- h,orl~ ~dtU:ft/1 r-
~ cmthl ; _. ~t(~J v;m~ -
1-~ _ 'y.J(/Jt. tv ~l k[. ~~) -~ - 2:2-'Z- -H> 1- ~ vv,,~A' ;;1 ~ -
I~ _ (~"'.l? U~~? .... r-- IO·1..~:t;f .. ~
-,--i-
"y1 d:td fp I '''":-.... :.- 100 3 -o-Qi. * t
\
-u/-- ~ ~ ~ til i~~ I ,~","
I
~t.4 ~ ,att-, <t trJ .f.,(, '\oN 5.~ ,00
to ~ - -
! ~'j 1" - f~~i'N'~1 i -:-.... f-
\¢. l 1'1 !Wf\k' ~prt4tJ'~ i Rl
j
'.' ~~'?~ ,,-I·a 4- . ad (-? Ji(v '17"-- >':', 1of , 5-0 -I'li
t.l/,t:y: - Zip
Y.tdrr¢ I J~ ~.~. - j,...O&,..~r
--~ ~ - ?'~ ~ ~ JJJ,.,. --.0 o· .. >-
i~ - ~1 F14W': 'i)1t.,Ubr;()() ~M ' r' 2-PD-m Vi - !~ : '- 2g
~~NDf71'VN IE) (}1~{ ;'.~ ~\,-
P 'til MP{it wn'V ; -- :z: )W~~ J - :-;: ~
l ~
p'~.tX S;~I1tf w ~ ~V q4 - - ~I ;
~o - '2-0 (1(') ,vlAW f' f4(1'.Al~ "1l' ~ i ~ ():; ,o3~dt I ~?~
~ (V'J~ I Wvvt../ r \ et '9 n c,.. ii :c A~d~ Wa.ttv @I~·t.ff - ~~, I oc.-ta~rq''tt,i ~ ~ OD z: 2.'"\ - POIO-I-[ W~
f-
~ ~,wr·vJJ' tv~, """ R 1../}0 1-- Po- 0'" J] ({.ft,vyyv ,\"
5z...; ~~ ttMY';;t .:t;/1I' ~~ f-Do 2- 0-[ r-3Z.
~ I ~U; it 1\ ~ 1- D· ' -::- Z/){)/9 j \~
I~ . ; "0- f11 ~_L-
- Yltt]~ a~v~A ,1'1 ...
~u)w r-
-' --.. 0" ~ .. o- ilL ~iJtJ 3f- wAUk'lA.vUd ~~ "" -5 - --~+
~ I cU~~f'71\R 8 ::: '0° 4-0-J]..
_ %~ h<fl~~ .... - 1.0 "'0 - - I 4 - 1.1 0.2 55 ML~~~ J hI~ il .",'" 1- rJ~ ~\
-, ......
3- ~~bt~ ~ 1-'-v
.• ~ ,~ -3"
~ ~tr~ ~~ ' .....
---- ~ I Z,~~iP~ .....
! ~-.ukt .... .... ;
~ ('11 F..ittd r-
~!£,t~, ~ /< .~ 1-0' 2. -Po -en: ~- vUl!4 .~~..,ted \ I ~ " -B8'
tZ" .'
1; ~ -~r~! ~'~~ r $1 - G'0 1'u ~ -
~~I?i:t 4- Po-Il"'l[ ~G IfJO 4t,g '1" I ~ - Z,3 0.2 ~I
1t1-~ , ~It& I;!. t' ~ r-4o
~(V1pf~\~ ~-/ " ~ ".
- V' ....
: ~ i2- : /..IW p it!7I"iv r~ - Il9tArrJ~ ~ 4Z- ---- -4:.. 1-
- M#lV" c)~~~ • - f'1~?hv~li~ /I.M4 ~ ~ l-i
~,~ \ ~ , 'VWl~f1..ha w .
z o
I f-Cl.. W o
ENGINEERING AND GEOLOGIC DESCRIPTION a CLASSIFICATION
JOINT DESCRIPTION
~ U') ~ DESCRIPTION OF ..... . ~:::~ - e U') GROUND W'.TER :: U') LU - I- U') (I) CONDITlONS a
~ "") ~ ci (I) ~ ~ WATER TESTS I d d ~ 0 ~ ~ ~ ~ (See Legend) t ~ ~ g g ~ g ~ ~ ~
PR_EPM_ED BY: ItCA ¥Vt"Ul ~Gt PROJECT NAME: /Ti{~,1 f)U I ( )aJ U1 l)ll/fvt HOLE NO.
m PROJECT NO.: (j Wt/tff I '7V£t. 1! 015 B ~ 2. II ~ GEl Consultants, Inc. DRILLING EQUIPMENT: .' ,I' '/ i '.\ ~1' DATE DRlu.EO: ~ ___________ ----I 7P-!JJ:) fftu'~' ·,n(~;;i; A:l'1' ,t~""i {IS*! i .... i P ORIENTATION:
DETAILED DRILUNG LOG lZattf , i1 0k;",-f'-- etl";"",: J),J{~{r""-" 4 SHoEFET..L A ' FIELD ENG. OR
DRILLER: ::..,.. . !)Ht C r]} GEOLOGIST:
CORI NG (S .. LeQend)
z ~ ..J ..J
JOINT ,~ ~~ DESCRIPTION OF ENGINEERING AND GEOLOGIC 0 .... ~
(J)
0 DESCRIPTION a CLASSIFICATION - ~ CD DESCRIPTION 5 w - ~ GROUND 'MTER i l: l: b3 (J)
i= ~ ~ ffi l (J)
~ (J) CONDITIONS a ~
I V; ~ (See Ll9lnd) - -, ii: ~ V) w w WATER TESTS I .-
~ w ~ z .-~ ~
d 0 u.. ~ cr 0 W Q.. ~ c5 0 i ~ 0 a:: (Set L..glnd) Q.. ....J W
~ ~ (5 d 0 0 0 0 J: ct W
W 0 -, a:: ~ It: z Z ...J V) J: 0
('7-77

Z 0 ~ ~ w ..J W
:::r: ..... a.. w 0
ENGIN£ERtNG AND GEOLOGIC DESCRIPTION a CLASSIFICATION
- ~tiVf; W7t~vuI{tY tv pYt i/&C'f'V) 1.·yt,t](t;t4A
- -r,,~rlv~
7tb -
-
~ ...J ...J
JOINT j - 2 DESCRIPTION i :i li; ~ ~ (See LeQ_nd)
~ ~ ...J
~ 0 -,
CORING (S .. LeQ_nd)
.~ ~i ......
DESCRIPTION OF (J)
~ ~ w .... ~ GROUND YATER frl (J)
6: ffi l (J)
I- (J) CONDrnONS a - a:: c5 C/) w l.tJ WATER TESTS
~ -- -, I- Z
~ w.. ~ ~
w c:i c:i ~
a:: 0 (See LeQend) 0 0 a:: ci 0 0 0 0 :t <{ a:: " a: z z ..J C/) :t
f-- "
- r
\ g -
-- • I - . I
- 'I
1~~~:1 -:-:-·,1 - :.,. ~
:. J I .," ~ >
,," I "_ .. '\. t
(.$ - ,
13 - /,1 0.3 .If ~
liZ~
:::r: I-a.. W 0
-
-«
I-
-
I t
PREPARED BY:
DETAILED DRILUNG LOG
z o ~
ENGINEERING AND GEOLOGIC DESCRIPTION a CLASSIFICATION
~ J: w h: ...J W W 0
-
jJf-
-
/rN-
-Ilt-
1)'~I'2.
1'2. -11 11· 202.-2'-" "')..1 21" ;" 3'l·';~
3""1~ ifl/~1
- 41-~1
il-o _ S1 - {'1 ~1"11
- 11 .. '1 I'~ '1·~1
1, "11>1 -
101-1 ~1 lit - 1\1 .. \11
-
II},-
-
--'
7 15
-2.4 Z:, tq
12-
2" I~
31 ~ 3't
-z:z. )g
II ..
JOINT DESCRIPTION
(See Le;end)
;:.. C-J"4~ ~ ~ . . -".1-.. ~.: 1\\.4 ~-, ." ,..... V"'\,!O.
CORI NG (S .. LI9.nd )
en en w z Q It C 1:
- III O:Z LI t1>
ItJ
HOLE NO.
T
DESCR I PTION OF GROUND YATER CONDrnONS a
J: WATER TESTS (See L..;lnd)
~ Q.. W 0
r-
~
~Cf7 ?4-foJ
f-Ij$
---t-
~ \- '""/ro ~
~ .. ~ ~ ";/oZ
-~-
- /.)1
-
IDb
f-
~ ..)~
f-If) 7 -f{7
~, )
h. f-/lz,
..
~ f-II~
~ 0-
J / I.,
f- //1
-

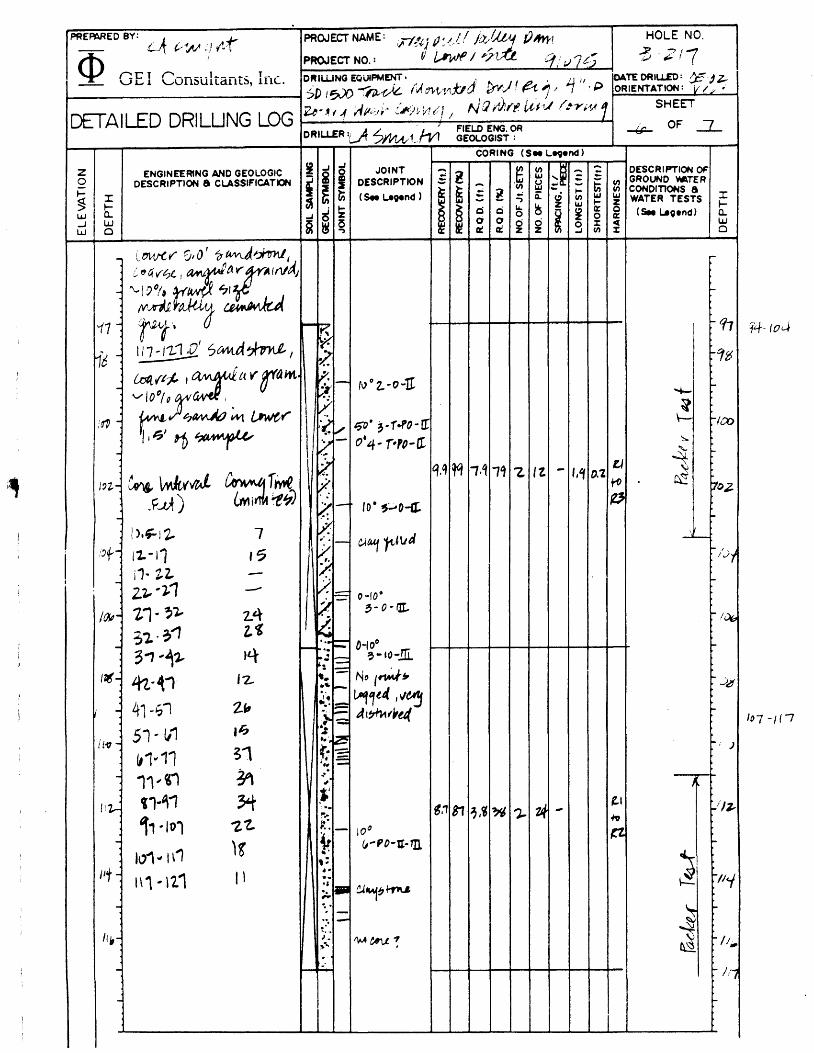
PRe:~e:D BY:
rA rn~\1~'Y PROJECT NAME: !At t<-1 () tA.J , 1tJ..J}f.tc! PJ:4'¥Yt HOLE NO.
eD PROJECT NO. : ~ ,? '~~ ~ 8~2)1 LQ""f .!,.' t;tt. .~ I D7?] GEl Consultants, Inc, DRILLING EQUIPMENT I d' . /I DATE DRIU£D: i)~ -:j) ']..
~ f~~1 ~':: ~~~I~~~; Jc:J::i:;:;~tf:~ ORIENTATION: ~y+--
DETAILED DRILUNG LOG il SHEET
LL£R . .A r '. FIELD ENG. OR ....::J- OF -7 DRI 'L' !-A,Jytf11 GEOLOGIST:
CORING (S .. L~end)
Z i ..J ..J JOINT ~~ ENGINEERING AND GEOLOGIC
~ 0 2 .t (I) DESCRIPTION OF
0 DESCRIPTION a CLASSIFICATION ~ CD DESCRIPTION :: w - ~ GROUND 'MTER ~ ..... frl (I)
1= ~ li; ! ffi :: !!
(I) I- (I) CONDITIONS a
~ I
~ li; (See Levend) ..... :; c: (!) (I) w w WATER TESTS I I-
~ ~ ~ z w I- Z I-
LU 0.. ..,j Ci 0 "'-
i ~ Q: 0 (See t..vend) 0.. ..J 0 0 0 Q:
...J W ~ ~ (5 d c; 0 0 0 J: « w w 0 , Q: a:: It: z Z ..J (I) J: 0
- -
- -
i ' 7- . ~~ "' ..... I--r--"'"
I
.... /11 .:~ ...
1I 6 - ~~. :::: O!.30" I- ''t .. ':* .. -f!", ~ z.'~-o-crr
- .~ .. - D!IOO . I-: .. /.:~ Z·?-PO -0-[. ..... - I~P 14.0- ..
~~V'OtAr~t'i1' .""': ~ J ~
- ,.' .::::::: O"I~' q,~ q~ g,; ~? t\ -~ I? - t.~ 4O, . " 'Z,.?-O-tn. to .:,.
i Z-l-- -. 'e.1. !- Iz.~ '-.. f--
- -. I-
/2+-..
~~Ut rVtltf] .. :,. !- i:z.tj .. -1- O-U0 - I- I-, .
'2- O-U ' . • 7-
/2{,- f "
!- lZ., i-
-I IA4 uYf..,? f
i~1 ~t)ffr;M of
tZ6- fm'M~ ....
-i
1'2-7(Of -
- -.
- -
- ...
- -- ,...
- !-
-
- !-
- -

ATfACHMENT 2
Observation Well Reports - Lower Site

GROUNDWATER OBSERVATION WELL REPORT
:~:~::n ~~~~tlkvf Dtwk-IArw-t'V" ~
PG. I OF I 2/4-Client i.d.vtlD.& Bori n9 No.
Contractor L, ~ . t".IW1A1l1
Inspected by bA l?M {f f,vf Checked by
SURVEY DATUM -------GROUND
ELEVATION
.! o u (I)
o --o Z
(I)
z o -... -o z o o
..J
o (I)
NOTES:
I I I I I I
Ori II er fZ..,rvy. ,~W t:.d#l j.(V Location L2f WVt #J ty (.:~{ ,~
Dote
Date
12?-O1'11 Project No.
LENGTH OF SURFACE CASING ABOVE GROUND SURFACE.
LENGTH OF RISER PIPE ABOVE GROUND SURFACE
THICKNESS OF SURFACE SEAL BELOW GROUND SURFACE, IF ANY
TYPE OF SURFACE SEAL (lnd/caf. any additIonal seal. )
10 OF SURFACE CASING ..... 1---4
TYPE OF SURFACE CASING
DEPTH BOTTOM OF CASING
I D and 00 OF RISER PIPE
TYPE OF RISER PIPE
I
-r(?~
~lOl'2
2,"
"I UJ1'L.( nt
(; /1 X f., II
StaJ 4)/
UJC-~J ~ap
3,2 I
/.0" II, Z5 r
PVC-
r DIAMETER OF BOREHOLE
TYPE OF BACKFILL AROUND RISER PIPE
4V'C J ~//? i7:J 1'-1'
~d ,3t Y1 hrl-vt.·f;(.. ] H DEPTH TOP OF SEAL ,IF ANY
TYPE OF SEAL I DEPTH BOTTOM OF SEAL
... DEPTH TOP OF PERVIOUS SECTION
TYPE OF PERVIOUS SECTION DESCRIBE OPENINGS I 0 and 00 OF PERVIOUS SECTION
npu--- 1m, zrW<>t:¢. u~ 2.3 1
TYPE OF BACKFILL AROUND PERVIOUS SECTION
DEPTH BOTTOM OF PERVIOUS SECTION
r DEPTH BOTTOM OF SAND COLUMN
~ ELEV./oEPTH TOP OF SEAL,/F ANY TYPE Of SEAL ELEV. / DEPTH BOTTOM OF SEAL
TYPE OF BACKFILL BELOW PERVIOUS SECTION,
IF ANY
GROUNDWATER OBSERVATION WELL REPORT
Project ~I::J /),14.1.1 VA lUll I
~)~OM&<n 1 Loco t ion
C Ii ent WwDc"" Contractor
Inspected
Checked
SURVEY DATUM
by
by
Ld: ~~~ 1(, M'fltt
-------GROUND
ELEVA TlON
• o o
CI)
o --o ;z:
(J)
;z: o -t-o ;z: o U
..J
o (J)
NOTES:
D.MM, - ~r: s:7t,,,b.,, I PG. OF l I
Borino No. Z/~
Driller RQ.!J /....0 dc:.4.. 2 Ie c:. Location LA f2. 2. +y e ~"",., , Date
Oat.
oS #' '27 " '11 Project No.
LENGTH OF SURFACE CASING ABOVE GROUND SURFACE.
LENGTH OF RISER PI PE ABOVE GROUND SURFACE
THICKNESS OF SURFACE SEAL BELOW GROUND SURFACE, IF ANY
TYPE OF SURFACE SEAL (Indlcat. any addltlonol I.al. )
10 OF SURFACE CASING ..... 1---1
TYPE OF SURFACE CASING
DEPTH BOTTOM OF CASI NG
10 and 00 OF RISER PIPE
TYPE OF RISER PIPE
r DIAMETER OF BOREHOLE
..... -- TYPE OF BACKFILL AROUND RISER PIPE
H DEPTH TOP OF SEAL I IF ANY
TYPE OF SEAL I DEPTH BOTTOM OF SEAL
~ DEPTH TOP OF PERVIOUS SECTION
rq¢=
'3.1(,)76
/. 7 I
(,flX kif .:zru,t, 1411 Lo~'1 Ct:tp ~l3
I,PIl/I'Z:;'1
PVk:
~I'; '1J1'11 re Hq/~ PlYJ
/1 I
TYPE OF PERVIOUS SECTION 'j/O fft.d PV~ DESCRIBE OPENINGS a,v!)I//'5/9f $
I 0 and 00 OF PERVIOUS SECTION I, ell/I. 1-2 II
TYPE OF BACKFILL AROUND PERVIOUS SECTION
DEPTH BOTTOM OF PERVIOUS SECTION
~ DEPTH BOTTOM OF SAND COLUMN
+-i ELEV. / DEPTH TOP OF SEAL,IF ANY
TYPE OF SEAL
I ELEV. / DEPTH BOTTOM OF SEAL
TYPE OF BACKFILL BELOW PERVIOUS SECTION,
IF ANY

GROUNDWATER OBSERVATION WELL REPORT
Project ;t:4,V&W~ OMfI - l..-tru''"'t Ii ?i<fL Loco tion PG. , OF L
C Ii ent ZI{, k' Wac, Borino No.
Contractor ~.~ ?Yl'Wl1 Inspected by k4 ¥f.vI..~l hi Checked by
SURVEY DATUM ______ _
GROUND
ELEVATION
• o u
(J)
o --o Z
(J)
z o t
o Z o o
-' o (I)
NOTES:
Driller "? '_Oyt ~ f.'i/d s' l..tJv Location Darn 4;. ovv
Date 05- ()t./ ' 11 UFt "2/~' Date Project No.
LENGTH OF SURFACE CASING ABOVE GROUND SURFACE.
LENGTH OF RISER PIPE ABOVE GROUND SURFACE
THICKNESS OF SURFACE SEAL BELOW GROUND SURFACE, IF ANY
TYPE OF SURFACE SEAL (Indlcat. any additional Ital. )
10 OF SURFACE CASING .... ~~ TYPE OF SURFACE CASING
DEPTH BOTTOM OF CASI NG
10 and 00 OF RISER PIPE
TYPE OF RISER PIPE
r OIAMETER OF BOREHOLE
...... -- TYPE OF BACKFIll AROUND RISER PIPE
H DEPTH TOP OF SEAL ,IF ANY TYPE OF SEAL I DEPTH BOTTOM OF SEAL
.... DEPTH TOP OF PERVIOUS SECnON
TYPE OF PERVIOUS SECTION DESCRIBE OPENINGS I 0 and 00 OF PERVIOUS SECTION
tJ../ D 75
I
2, (
Z,O '
I I
"'
~Y1h?;t."J:L
~tt PI:J 2-"2.,0 I
&l1fofl~ ~=I'2'
TYPE OF BACKFIll AROUND PERVIOUS SECTION
DEPTH BOTTOM OF PERVIOUS SECTION
r--- DEPTH BOTTOM OF SAND COLUMN
~ ELEV. / DEPTH TOP OF SEAL,IF ANY TYPE OF SEAL ~f'rhnt.il:l. £lEV. / DEPTH BOTTOM OF SEAL
TYPE OF BACKFilL BELOW PERVIOUS SECTION,
IF ANY
1?t3 I
/.fIJ/~ PI.., q /371 tt'
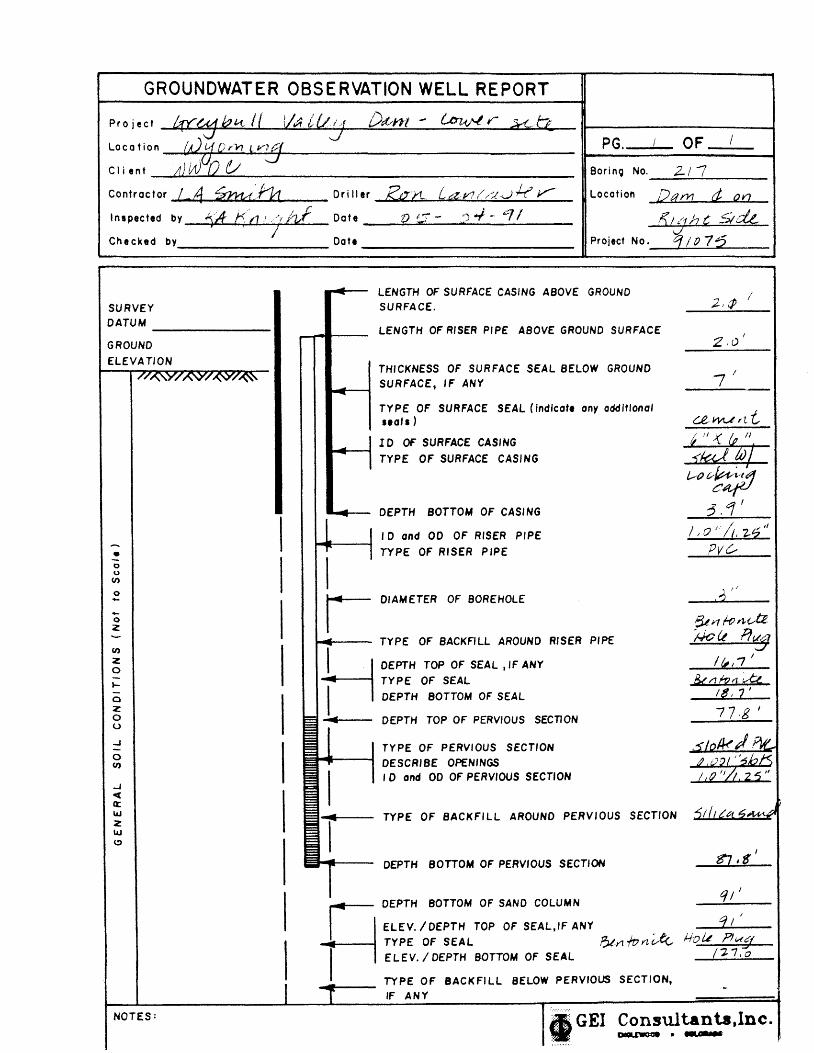
GROUNDWATER OBSERVATION WELL REPORT
Project ~bH I{ IbfitL("l D~nl .... u.,.l.(,)-l r ~a J PG. I OF I {)J c .• ! Q. r l1. ~ V} ?l Location
CI i ent dLWVO V J
Contractor l Inspected
Checked
SURVEY DATUM
by
by
t:l ~,!.t:b.
~A f<'{.l!.' -'r ilt.f I 7
-------GROUND
ELEVATION
..! o u (I)
o --o Z
(I)
z o -t-
o Z o (J
..J
o (I)
NOTES:
I
BorinQ No. 2./1
Dri II er £.z;tl La.'Y?//''l.JJ-t V Location D{1t11 d:. on
Date '() ;; - 'J ~ ~. ?ll '. if/ tit h t 5t ct?, J
Date Project No. q,lfJ7'5
LENGTH OF SURFACE CASING ABOVE GROUND SURFACE.
LENGTH OF RISER PIPE ABOVE GROUND SURFACE
THICKNESS OF SURFACE SEAL BELOW GROUND SURFACE, IF ANY
TYPE OF SURFACE SEAL (Indicate any oddltlonal seal. )
10 OF SURFACE CASING .... I--~
TYPE OF SURFACE CASING
DEPTH BOTTOM OF CAS' NG
, D and 00 OF RISER PIPE
TYPE OF RISER PIPE
r DIAMETER OF BOREHOLE
....... -- TYPE OF BACKFILL AROUND RISER PIPE
TYPE OF PERVIOUS SECTION
DESCRIBE OPENINGS I 0 and 00 OF PERVIOUS SECTION
TYPE OF BACKFILL AROUND PERVIOUS SECTION
DEPTH BOTTOM OF PERVIOUS SECTION
r--- DEPTH BOTTOM OF SAND COLUMN
~ ELEV. / DEPTH TOP OF SEAL,IF ANY . TYPE OF SEAL P;;.trr!ortvl("
I ELEV. / DEPTH BOTTOM OF SEAL
TYPE OF 8ACKFILL 8ELOW PERVIOUS SECTION,
IF ANY
7/
I 0 /: / ,." I 1/, 'Z=fZ
pvc"
6L;'1k?""~ /.JeU flvg
/ (,,7 I
77,& I
HOW ?llAq /Z11=&
I GEl =~~.lnc.

A'ITACHMENT 3
Laboratory Test Results - Lower Site

SIEVE ANAL VSIS I
HYDROMETER ANALYSIS CLEAR SQUAR£ OPENINGS I U.S. 8TANDARD SERIES YIME READINGS 7 hr 25 hr
8- '-5- S' 1-1/2- 3/.- 3/1- f4 ftJ 1'0 ,,1 ,lq ,..0 ftiO 1100 ,200 1 min .. min 11 min 10 min 15 mn ..s ",In 0
i i i 100
I I I ~ I I I I ! !
10 I I
\ 90
I I I I I I I
20 ~ I : 80 ; ~ , \ I
I
30 I
70 i ! !
\ I I
~40 ! i i 60 CJ Z I \ z :( I iii l- I ",
III I .~
11:50 i i 50 IL
I- ~ ~ ; \ to-
Z Z III I 1&1 0 I ()
1560 I a:
Do ! ! i '~ .0 ~
I I
70 i i ! r--- 30 I
~ I I
~ 80 i I I 20 ; ; ; " I I I I I I I I I
90 i i i 10
I I I I I I
1000
! J I I I I I I I I I II I I I I ! I II I I !I I I I I I I 1 I I I I I I I I I _0
lJ7 e 0 0 i 2~O ee b.~2 0 It) a It)
0 It) r- w- ee 5 0 0 N
..... 0 ee 152 76.2 38.1 19.1 9.52 4.76 2.38 1.19 .590 .297 .149 .07. .OJ7 .019 .009 .005 .002 .001
DIAMETER OF PARTICLE IN MILLIMETERS
I COBBLES ~ GRAVEL SAND FlNES COARSE I FlNE I COARSE I .... EDIUM I FINE I
CLASSIFICA T10N SYMBOL: CL GRADA TION TEST A TIERBERG LIMITS:
Greybull Valley Dam Ll 36 PL 15 8214 31.2-31.6 1
SPECIFIC GRAVITY: Project 91075 I FIGURE 3-1
SIEVE ANALYSIS I
HYDROMETER ANAL YSIS CLEAR SQUARe OPENINGS I u.s. 8TANDARD eERIES Y'ME READINGS 7 hr 25 hr
8- e-~- ~ 1-1/2- 3/"- 3/1- f4 f8 110 fll ,30 140 f60 1100 ,200 1 min " min 1. min 10 min 15 mh 45 min 0
i i i ~ 100
I I I I I I '"""-
! ! ! ------"- 90 10 I I
'" I I I I I I I
\ I I I
20 I 80
! ! !
\ 3D 70
! • !
\ ~40 i i I i\
60 "
\ z z iii ;C ", ... C w
i i I 50 D. lie 50 I ! ! " ... ... Z Z W W 0 0 a:
ffi60 ! ! ! 40 It! A.
70 i • 30
80 i i i 20 ~ I ; I I I I I I I I I
90 i i i
10
I I I I I I
1000
! II I I I I I I I I I I I I I I ! I III J !I I I II I I I I I I I I I I I I ..... 0
1~7 ~ a a 1 2~0 C! b.~2 a III 0 III
a 10 r- r- ~ ..... 0 0 N
.,.... 0 0 C! 152 76.2 38.1 19.1 9.52 4.76 2.38 1.19 .590 .297 .149 .074 .037 .019 .009 .005 .002 .001
DIAMETER OF PARTICLE IN MILLIMETERS
I COBBLES ; GRAVEL I SAND I flNES
COARSE I FINE I COARSE I MEDIUM I FINE
CLASSIFICA TJON SYMBOL: CH Greybull Valley Dam GRADA TION TEST A TTERBERG LIMITS:
LL 69 B215 34.0-34.5 1
PL 2~
SPECIFIC GRAVITY: Project 91075 IFIGURE 3-2
SIEve ANALYSIS I
HYDROMETER ANALYSIS CLEAR SQUARS OPENINGS I U.S. 8TANDARD SERIES YIME READINGS 7 hr 2:S hr ,- 6·~· ~ 1-1/2- 3/"- 3/'- ,.. flJ 110 fl' ,lO f4D fCSO 1100 ,200 1 min .. min 18 min 10 min 1S m*' 4!S min
0 i
~ i i 100
I • I I • I
! ! ! 90 10 I ~ I I I I I J
'" I I
20 : I , 80
~ ~
~ ; I I
• " I 30 , i ~ i 70
• I I
~! tl40 i !
60 " I 1\ z Z I ij ;( I ., ... : 4(
III i I \. 50 II. 11:50 ; ~ ; \
... ... Z Z I I III III I 0 0 I
ffi60 I I II:
D. i ! i \ 40 ~
I I I I
! I 70
I I 30 I I
\ I I I I
80 f i I 20 ; ; ; \ I I I I I I J I I
90 i i i
10
I I I I I I
1000
! II I I I I I t I I I I I I I I ! I I I t 1 !I I I II I I , I I I I 1 I I 1 1 .... 0 1~7 ~
0 0 i 2~0 ~ b.~2 0 III 0 III 0 III r- r- ~ .... 0 0
N .... 0 0 q
152 76.2 38.1 19.1 9.52 4.76 2.38 1.19 .590 .297 .149 .074 .037 .019 .009 .005 .002 .001 DIAMETER OF PARTICLE IN MllUMETERS
I COBBLES : GRAVEL I SAND I ANES
COARSE I ANE I COARSE I MEDIUM I FINE
CLASSIFICA 11 ON SYMBOL: SM Greybull Valley Dam GRADA TIOH TEST
A TTERBERG UMITS: LL PL
8216, S1 3.0-4.5 1
SPECIFIC GRAVITY: Project 91075 I FIGURE 3-3
SIEVE ANALYSIS I
HYDROMETER ANALYSIS CLEAR SQUARS OPENINGS I U.S. STANDARD aERIE8 YIME READINGS 7 hr 2~ hr
8- ,- ~- SO 1-1/2- 3/4- 3/S- f4 18 ,,0 ,UI ,30 f40 f50 1100 ,200 1 min .. min l' min 10 min lS m*' ..s min 0 i i i ~
100
I I I ----I I I
~ 10 ! ! ! 90
I I I
~ I I I I I I
I I : 20 ! !
\ 80
I
30 70 ! I I
\ ~40 i I 60 "
" Z z ii :c(
\ ., ... ~ w
I i i 50 A. a: SO I I ~
\ ... ... Z Z W W 0 0 II:
:560 ! ! ! , 40 Ie D.
70 i i I 30
80 i 1 i 20 ~ I : I I I I I I I I I
90 i i i
10
I I I I I I
1000
! II I I I I I I I I I I I I I I I ! I II I I !I I I I I I I I I I I I I I I I I ... 0
d7~ 0 0 '1 2~0 ~ b.~2 0 an a an 0 an ..... ..... ~ 0 0 0
N .... 0 ~
152 76.2 38.1 19.1 9.52 4.76 2.38 1.19 .590 .297 .149 .074 .037 .019 .009 .005 .002 .001 DIAMETER OF PARTICLE IN MILLIMETERS
I COBBLES I GRAVEL SAND I flNES COARSE I ANE I COARSE I MEDIUM I FINE
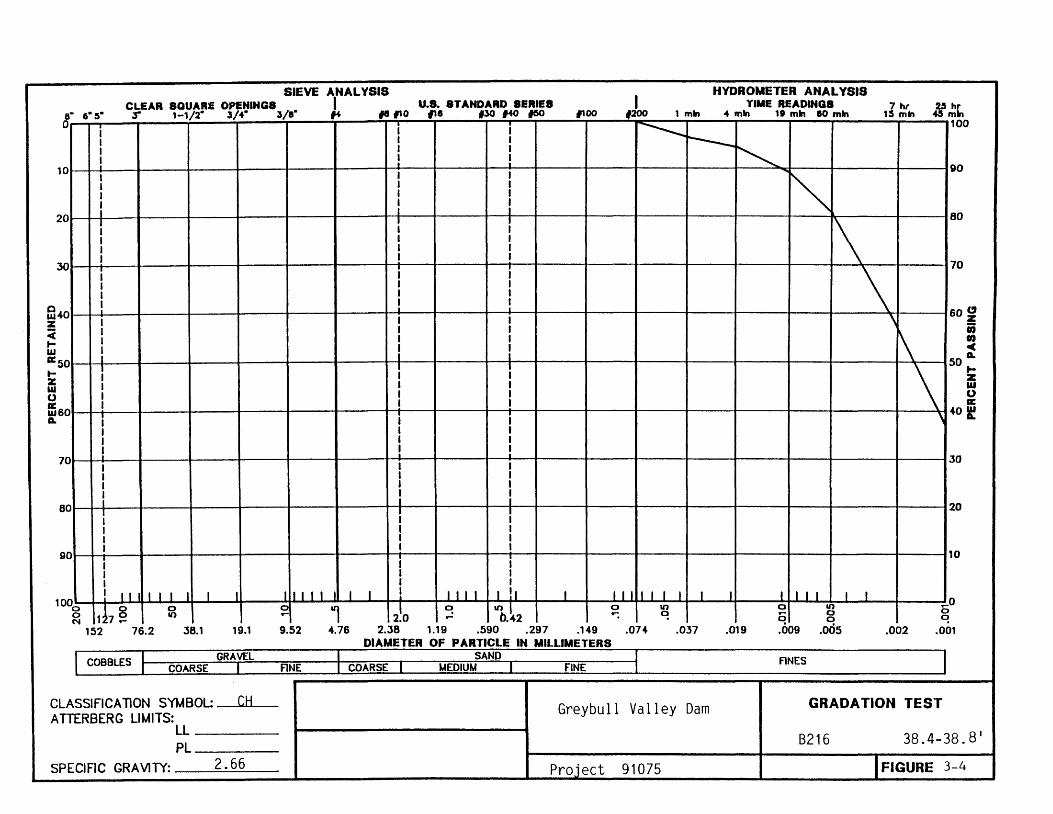
CLASSIFICA TlON SYMBOL: GtJ Greybull Valley Dam GRADA TION TEST A TTERBERG LIMITS:
LL 38.4-38.8' PL
B216
SPECIFIC GRA VlTY: 2.66 Project 91075 IFIGURE 3-4

SIEVE ANALYSIS I
HYDROMETER ANALYSIS CLEAR SQUARe OPENING8 I u.S. 8TANDARD 8ERlE8 YIME READINGS 7 hr 2~ hr
8- e- ~- S" 1-1/2- 3/"- 3/.- fit H 110 118 ,30 fItO 160 1100 ,200 1 min .. min " mn 80 m" 1S min 45 mn 0 i I ~
100
I I I I
10 ! ! ! ~ 90 I I I
\ I I I I I I
20 I t I 80 ~ I ~
\ 30 70
! -.- !
\ ~40 I
i . 60 "
1\ z z iii ;( ..,
I- 4( w
I i I 50 Do 11:50 ! I ~
\ l-I-
Z Z w w 0 0
ffi60 a:
Do ! .- !
\ 40 f
70 i i i 30 ,
60 i i i 20 : r I I I I I I I I I I
90 i i i
10
I I I I I I
1000
! II I I I I I I III I I I I I I ! I I I I I II I I II I I I I I I I I I I I I ...... 0
d7~ 0 0 1 ~o C! b.~2 0 10 0 III 0
0 III ... .- .- ~ 0 0 ~ N 0
152 76.2 38.1 19.1 9.52 4.76 2.38 1.19 .590 .297 .149 .074 .037 .019 .009 .005 .002 .001 DIAMETER OF PARTICLE IN MILLIMETERS
1 COBBLES : GRAVEL SAND I flNES
COARSE I flNE I COARSE .• UEOIUM I FINE I
CLASSIFICA TlON SYMBOL: SM Greybull Valley Dam GRADA TIOH TEST A TTERBERG LIMITS:
U B216 56.2-57.0 1
PL
SPECIFIC GRAVITY: Pro.iect 91075 IFIGURE 3-5
SIEVE ANALYSIS I
HYDROMETER ANALYSIS CLEAR 8QUARS OPENINGS I U.8. 8TANDARD 8ERIES YIME READING8 7 hr 2:. hr
8- 6-5- :.r 1-1/2- 3/.- 3/1- f4 IS 110 ". ,30 f40 160 flOO ,200 1 min .. min 11 min eo min 1$ m'" ..s min 0
i ~ i i 100
I I t I
'" I I
I ! ! 10 I 90
I " I J I
'" I I
I I I
20 : : : 80
I " I I I
I ~ I I
I I I I I I
30 i " i i
70
I
~ I
I I
fii40 ! , ,
60 " Z I I , I Z
:c I I
~ I ij
I I I ., ... : I : -c w a: 50 50 A.
... ~ I
~ ...
Z Z w •
1&1
0 I 0
ffiso I I , a:
A. i ! ;
"" 40 Ie
I t I I
70 ! i ! , 30
t t
~ I I I 1
60 : i I "'- 20 : I ; '" I I I
"'~ , I I I I I
90 i -; i --- I-- _ 10
I I I r------. I I I I II I I I I I I IIII I I I I ! I I I I I !I I I I I II I I I I I f I I I I I
1000
1!7 § 0 0 i 2!0
q b.~2 0 II) 0 II) ~O 0 II) .... .... q 5 0 0
N .- 0 q
152 76.2 38.1 19.1 9.52 4.76 2.38 1.19 .590 .297 .149 .074 .037 .019 .009 .005 .002 .001 DIAMETER OF PARTICLE IN MILLIMETERS
I COBBLES ; GRAVEL I SAND I ANES
COARSE I RNE COARSE I MEDIUM I fiNE
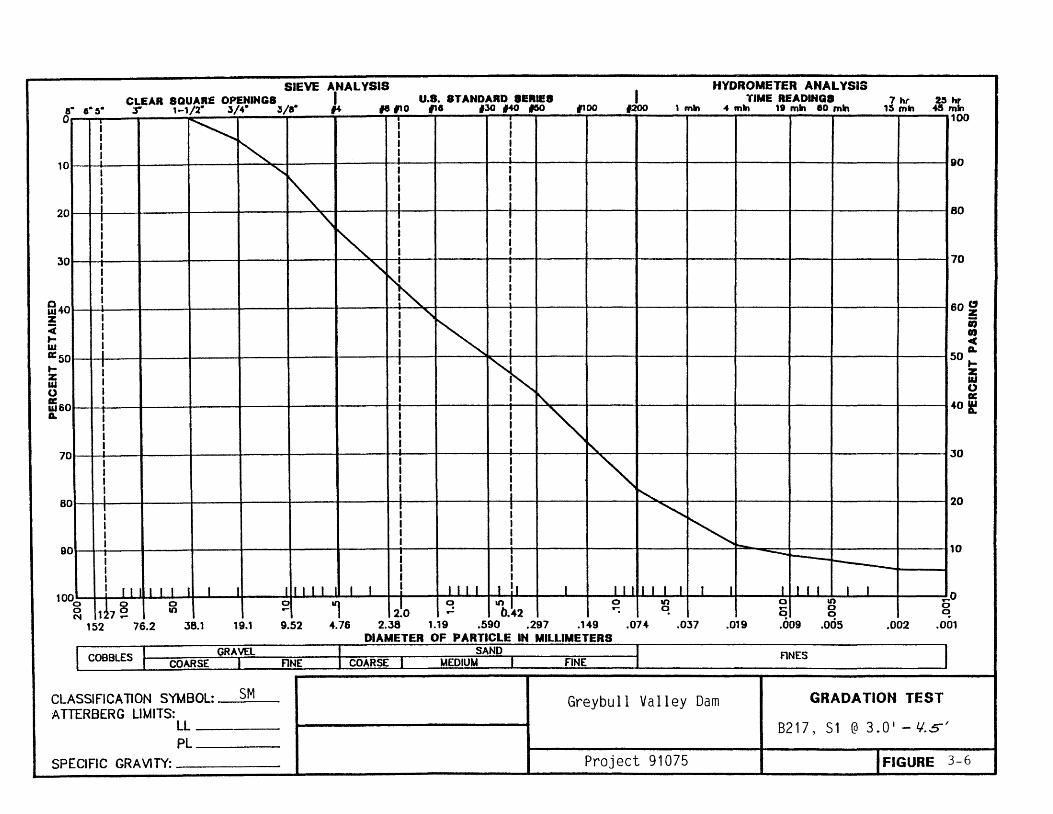
CLASSIFICA liON SYMBOL: SM Greybull Valley Dam GRADA TIOH TEST A mRBERG LIMITS:
LL 8217, S 1 @ 3.0 I - 1I. S J
PL
SPECIFIC GRAVITY: Project 91075 I FIGURE 3-6

SIEVE ANALYSIS I
HYDROMETER ANALYSIS CLEAR 8QUAR£ OPENING8 I U.S. 8T ANOARD aERIE8 Y'ME READINGS 7 hr 2!5 hr
8- ,- ~- SO 1-1/2- 3/"- 3/S- fit f8 110 f11 130 f-4O f60 ,,00 1200 1 min ... min 11 min 10 min 105 min ..s min 0
i
~ i i 100
I I I I I I
10 l ! ! 90 I \
I I I I I I I I
f f I
20 ~ I 80
~ ~
~ l ~
I I I
30 ! "\ -r ! 70
~ I I I
fi140 i ! I 60 "
Z ~ Z
:( ij ." t-
I '" 4( w
a:: 50 i I 50 A.
t- ~ I ~ I'l t-
Z Z w w 0 0
ffi60 a:
D. ! I i
~ 40 f
I I
i I
70 I I 30 I
'~ I I
80 i i : 20 : r I I I I I I I I I I
90 i i i
10
I I I I I I
1000
! II I I I I I I I III I I I I I ! I I I I I ! I I I I I I I I I I I I I I I I I ..... 0
1!7 ~ 0 0 1 ~o ~ b.~2 0 V) 0 V)
0 Ul .... .... ~ E 0 0
N ..... 0 ~
152 76.2 38.1 19.1 9.52 4.76 2.38 1.19 .590 .297 .149 .074 .037 .019 .009 .005 .002 .001 DIAMETER OF PARTICLE IN MILLIMETERS
COBBLES 1 GRAVEL I SAND I f1NES COARSE I FlNE I COARSE I MEDIUM I FINE I
CLASSIFICA 11 ON SYMBOL: SM GRADATION TEST A TTERBERG LIMITS: Greybu 11 Valley Dam
Ll PL 8217, 52 7.0-8.5 1
SPECIFIC GRAVITY: Project 91075 I FIGURE 3-7

SIEVE ANALYSIS I
HYDROMETER ANALYSIS CLEAR SQUARe OPENING8 I U.S. aT ANDARD 8ERIES YIME READINGS 7 hr 25 hr .- e- 5- ;r 1-1/2- 3/4- 3/S- f4 18110 ". ,30 f40 fC50 1100 ,200 1 min of min 11 min eo min 1S mtl ..s min
0 i i I
100
I I I
~ I I I
! ! ! 90 10 I I I
\ I I I I I I
: r I
20 I 80
! ~ !
\ 30 70 ~ !
\ ~40 i i I 60 "
\ z z iii :c D'J
t- C w i i I 50 IL a: 50 I ! !
\ ... t- Z Z W W 0 0 II:
:560 ! ! !
\ 40 ~
D.
70 i 1 I JO , 80 i i i " 20 : ; ;
"" I I I I I I I I I
90 i i i
10
I I I I I I
1000
! II I I I I I I 1111 I I I I ! I IJ I I !I I I I I I I I I I I I I I I I J .... 0
1!7 e 0 0 i 2!0 C! b.~2 0 V) 0 V)
0 10 .... .... ~ .... 0 0
'" .- 0 0 ~
152 76.2 38.1 19.1 9.52 4.76 2.38 1.19 .590 .297 .149 .074 .037 .019 .009 .005 .002 .001 DIAMETER OF PARTICLE IN MILUMETERS
l COBBLES I GRAVEL SAND I FlNES COARSE I FlNE I COARSE I UEDIUU I FINE
CLASSIFICATION SYMBOL: SM Greybull ,Valley Dam GRADA TION TEST A TTERBERG LIMITS:
LL PL 8217 62.0-62.7'
SPECIFIC GRA VlTY: Project 91075 I FIGURE 3-8
SIEVE ANALYSIS I
HYDROMETER ANAL YSIS CLEAR 8QUARe OPENING8 I U.S. 8T AHDARD eERIES Y'ME READING8 7 hr 2!S hr
8- 6-~- ;; 1-1/2- 3/4- 3/1- f4 II 110 fie ,30 f40 160 1100 ,200 1 min .. min 18 min eo min 1:5 min ..s min 0 i j
~ 100
I I I I I I I
10 ! ! ! 90 I I I
1\ I I I I I I
20 I I I 80 ! I ~
\ 30 70
! I ! \
ffi40 I i I ~ 60 "
\ z z OJ :c ." ... 4(
III I i i 50 A. 11:50 ... I I I
\ ...
z z W
III U U ffi60
II!
A. ! I !
~ 40 ~
70 i i i 30
~ ~
80 I i I 20 : I I .......
~ I I I I I I I I I
90 i
I I 10
I I I I I I I I II I I I I I I I III I I I I I I ! I I I I I !I I I II I I I I I I I I I I I I
1000
1!7 ~ 0 0 i 2~0 ~ b.~2 0 10 0 ." ..... 0
0 10 r- r- ~ 0 0 0
C'oI .- 0 ~
152 76.2 38.1 19.1 9.52 4.76 2.38 1.19 .590 .297 .149 .074 .037 .019 .009 .005 .002 .001 DIAMETER OF PARTICLE IN MILLIMETERS
I COBBLES : GRAVEL I SAND flNES
COARSE I FlNE I COARSE I MEDIUM I FINE I
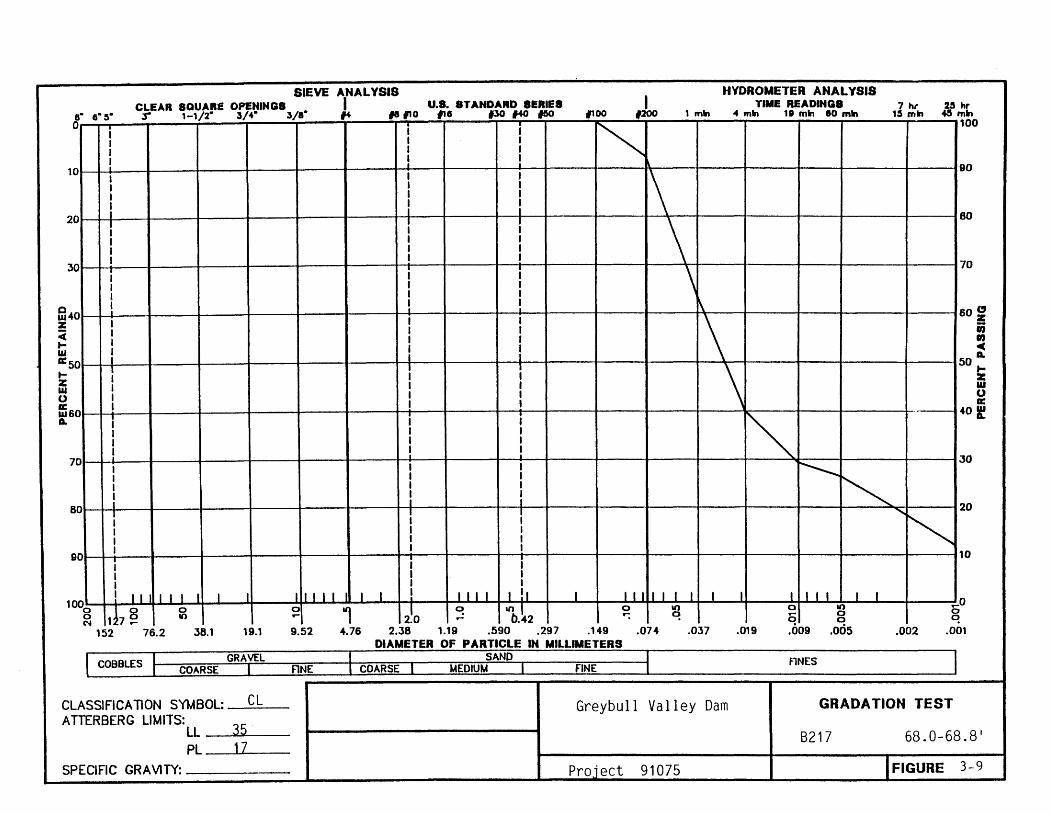
CLASSIFICA TlON SYMBOL: CL Greybull Valley Dam GRADATION TEST A TTERBERG LIMITS:
35 LL B217 68.0-68.8' PL 1Z
SPECIFIC GRAVITY: Project 91075 IFIGURE 3-9
SIEVE ANALYSIS I
HYDROMETER ANALYSIS CLEAR SQUARe OPENINGS I u.s. 8TANDARD SERIES TIME READINGS 7 ht 25 hr
8- 6-5- ~ 1-1/2- 3/.- 3/1- ,. IfJ 1'0 111 ,30 140 flSO 1100 ,200 1 mn .. mn 11 mn 10 min 1S m*' 4S Inn 0 i i i - 100
I I I ~ I I I
10 ! ! ! 90 I I I ~ I I I
~ I I I
: : I
"" 20 I 80 ; I : ~ I ,
I I r\ I ,
30 i
T i \ 70
I I I I
~40 ! i I I
60 " Z I I \
z ;C I I ii l- I I ., III : i : -c 0: 50 50 G.
I- ; I ; \ I-Z Z 1&1 I
, l\
III
0 I I 0
:160 I I a:
D. i T i '\
40 f I I I I
70 ! I ! 30 , I ,
I I I I
80 I i : 20 ~
I ; I I I I I I I I I I
90 i i i
10
I I I I I I
1000
! II I I I I I I III I I I I I I ! I I I I I !I I II J il I I J I I I I I I I I .... 0
1!7 e 0 0 i 2~0 ~ b.~2 0 111 a 111 0 111 .... .... ~ 0 a 0 N
.... a ~ 152 76.2 38.1 19.1 9.52 4.76 2.38 1.19 .590 .297 .149 .074 .037 .019 .009 .005 .002 .001
DIAMETER OF PARTICLE IN MILLIMETERS
I COBBLES : GRAVEL SAND I ANES
COARSE I FlNE I COARSE I MEDIUM I FINE I
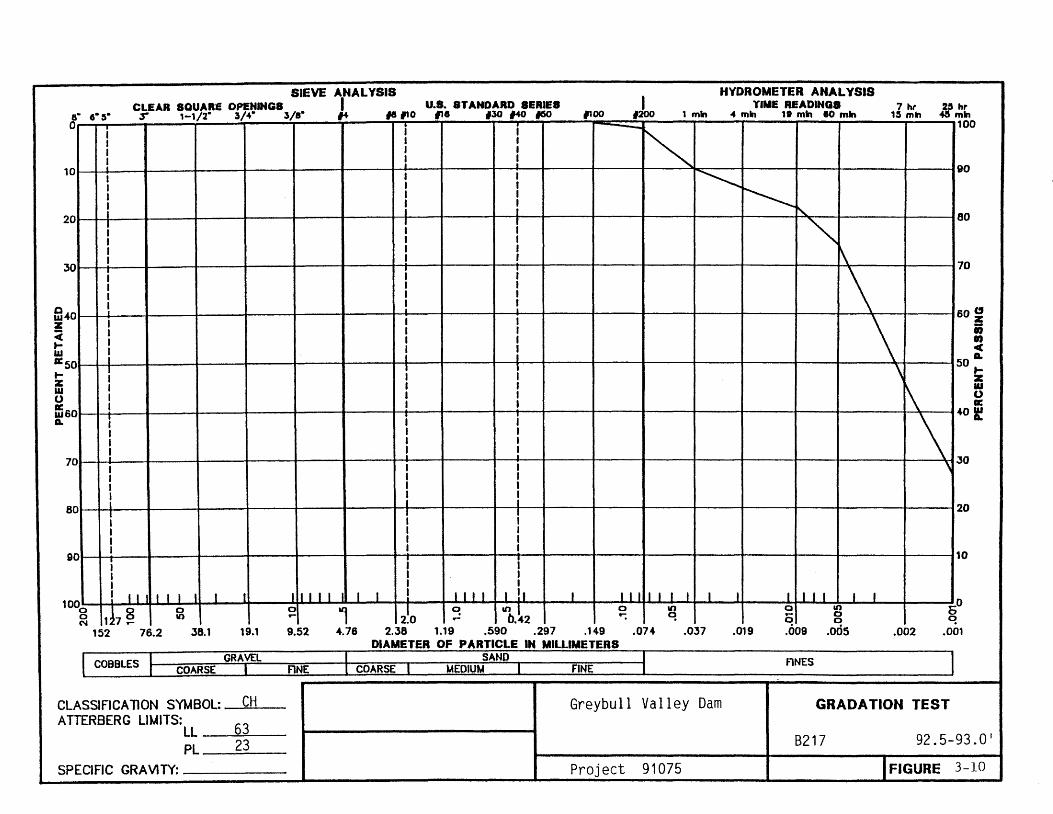
CLASSIFICAllON SYMBOL: CH Greybull Valley Dam GRADA TION TEST A TTERBERG LIMITS: 63 LL
PL 23 B217 92.5-93.0'
SPECIFIC GRAVITY: Project 91075 I FIGURE 3-10

SIEVE ANALYSIS I
HYDROMETER ANALYSIS CLEAR SQUARS OPENINGS I U.S. 8T AHDARD 8ERIEa YIME READING8 7 hr 25 hr
s- fi- 5- S- 1-1/28 3/4- 3/.- ,.. f8 110 IUS ,30 f40 f60 1100 ,200 1 min .of min 11 min eo min lS min .f5 min 0 i ~
100 I I I I I I i\
10 ! ! ! 90 I I I
\ I • I I I I
20 I t ~ 80 ; I ~ \ I I
30 I l 70 i
I !
1\ I I
fn40 I i 60 "
. I \ z z ii :c I
I .,
l-
I c w i i 50 D. a: 50
l-I I I
\ I-
Z Z UI
W 0 0 1560
II:
D. ! ~ ! , 40 ~
70 i i i 30
60 I i I 20 ~ I ; I I I I I I I I I
90 i i i
10
I I I I I I
1000
! II I I I I I I I IIII I I I I I ! I II I I!I I I I I I I I t I I t I I I i I .... 0
1!7 e 0 0 i 2~0 q b.~2 0 V) 0 V) 0
0 II) ... .- ... q 0 0 q N 0
152 76.2 36.1 19.1 9.52 4.76 2.38 1.19 .590 .297 .149 .074 .037 .019 .009 .005 .002 .001 DIAMETER OF PARTICLE IN MILLIMETERS
t COBBLES : GRAVEL I SAND flNES
COARSE I FINE COARSE I MEDIUM I FINE I
CLASSlflCA TlON SYMBOL: SM GRADA TION rEST A TTERBERG LIMITS: Greybull Valley Dam
LL ---Pl N~
SCP1 0-1.5'
SPECIFIC GRA YlTY: 2.65 Project 91075 I FIGURE 3-11

SIEVE ANALYSIS I
HYDROMETER ANALYSIS CLEAR SQUAR£ OPENINGS I U.S. STANDARD aERIE8 YIME READING8 7 h, 2:t hr
8- ,.~. :r 1-1/2- 3/"- 3/8- ,.. IS 110 11' ,30 140 f60 1100 ,200 1 min .. min 11 min 80 min 1S min .a min 0
i ---t-----. i i 100
I i _1 I I
! ! 1-~ 10
i 90 I I I ~ I I I I I I i\
20 l I : 80 !
-r ! \ 30 . I ! 70
~40 i i i 60 "
Z ~ :c ."
." l- .e w
i i i 50 A. G: 50 I- ! I I I-Z Z w w 0 0
:160 a:
II. ! I ! 40 I!
70 i i i 30
80 i i I 20 : I ; I I I I I I I I I
90 i i i 10
I I I I I I
! " I I I I I I III III I 1 I I I I I I 1 !I 1 I I I I I I I I I I 1 I 1 I 1 100
0 1~7 e 0 0 i 2~O C! b.~2 0 III 0 III _0 0 II) ... ... ~ 0 0 0
N .... 0 ~
152 76.2 38.1 19.1 9.52 4.76 2.38 1.19 .590 .297 .149 .074 .OJ7 .019 .009 .005 .002 .001 DIAMETER OF PARTICLE IN MILLIMETERS
I COBBLES ; GRAVEL I SAND flNES
COARSE I FINE I COARSE I MEDIUM J FINE I
CLASSIFICA TlON SYMBOL: CL GRADA TION TEST A TTERBERG LIMITS:
25 Greybull Valley Dam
LL PL 17 SCP2 0-6.0·
SPECIFIC GRAVITY: Project 91075 -,FIGURE 3-12
Moisture Content = 19.0 percent
Dry Unit Weight :: 108.4 pct
4
3
c:: 0 2
Sample of: CIt
(~ ays one
From: B214, C2 @ 8.0-9.5'
'\ 111\ I I I I 111\ \ ,-- f.--- Expansion Under Constant
V')
c:: ro 0. ><
tJ.J
~------~ Pressure Due to Wetting
(
~ , ~ 0 ~ c:: 0
- r-- -.. c\ I""-~ .... -<)
+> ro "'0 ...... ........ ~ 0 2 V')
c:: 0
, \
u
3 \ ~~
0.1 1.0 10 100
APPLIED PRESSURE - ksf J:' 0
V') Moisture Content = 3. 1 percent c:: ro Dry Unit Weight = 93.9 pct 0.. ><
tJ.J Sample of: Sand
From:
~ 0
c:: 0
B215,C1 @ 2.0-3.5' ;--. --- """'- IIIII I I I I ....... r--. ~ ....
"C~ Consolidation Under Constant +> ro "'0
/' Pressure Due to Wetting 1-----...... 2 ........
0 V')
c:: 0 u 3
4
5
I(~
~~ \)
6
0.1 1.0 10 100
APPLIED PRESSURE - ksf
SWELL-CONSOLIDATION TEST RESULTS Fiollrp 1_1

c o (/)
c C'O 0.. ><
W
*
c 0
+-l C'O
""0 .-........ 0 (/)
c 0 u
3
2
0
2
3
4
-------............ r-- r-.... I"- .........
0.1
0.1
Moisture Content = 8.4 percent Dry Unit Weight = 126.9 pef Sample of:
Sandy Claystone From:
8215, C3 @ 9.0-10.5 '
11111 I I I III Expansion Under Constant - r--
(~ ~/
/' Pressure Due to Wetting
/~ V
I~ ~ ~ "(')
r't~
1.0 10 100
APPLIED PRESSURE - ksf
Moisture Content = percent
Dry Unit Weight = pef Sample of:
From:
1.0 10 100
APPLIED PRESSURE - ksf

ATTACHMENT 4
Permeability Test Results - Lower Site

01
i I
HI Hi
H7 H7
G.W.T. -~ G.W T. Hl He
He HI
-I'""" .~ -'-
---1 0'1- _---A.J \r-'G;;......W;.o......;...;T _---'-__ y
CASE I CASE 2 CASE 3 CASE 4
K = Cll. Q1 ~ SINh -'(.!:l). 51( 01 > L 1 > £L (ENGLISH). 5 ~ 01> Ll> Ql (METRIC) 2'lfL"htHT 01 '12 - 24 UNITS I - 2 UNITS
PROGRAM INPUT: H()Le: TYPe:: ie. EX, AX, BX, NX. or \jN ~:J("
H = HOLE Nl;MfcEfi (INTEGER),
NOTE:
H7 = DEFTH TO TeF 'JF TE:3TfD LENGTH (FEET OR METERS),
He = DEFTH TO BOTTGf't! OF TE~'ED LENGTH (FEE T OR METERS), HI = DEPTH TO GWT. {FS::ET OR METERS), HQ = .;t::IGHT f)F GAGE ABovE GR'::UN~ SUR Ft..CE {F::E T on ME TfRS}, ~:-:PRESSUr.:: APPLIED AT SWIVE'_ (tJSI OR I<GF/CM 2 ),
C';: EC)TIMATED INFLOW RATt. \ IN GPM OR M..)/M:Nl; T = OURA r ION OF TEST IN MINUTE S.
Cl : 70260 (ENGLISH UNIT REDUCTION)
Cl = 1.67 (METRIC UNIT REDUCTION)
HT = Hl + Pl (CASES 1 AND 4) H1< H7 + bJ - 2
=H7+ ~' +Pl (CASES 2 AND 3) Hl> H7 .. ~ Dl=EFFECTIVE DIAMETER OF HOLE (INCHES OR METERS) 1I'MNN ALLOWS USER TO INPUT HOLE DIAMETERS
DIFFERENT FROM STANDAR("I EX THRU NX SJ.1.E.S INPUT IS IN INCHES OR METERS.
(2)
ftl)c\GVID CHEYENNE. WYOMING
'" GEl Consultants.Inc. 'V ENGLfWOOO. CIl.JIW)O
GREYBULL VAllEY DAAl ADDENDUM NO.1
TO APPENDIX A
CONSTANT HEAD PACKER FIELD
PERW:ABn.rrY TEST
PROJECT NO. 91075 AUGUST. 1991 I FIGURE 4.1

CONSTANT HEAD PACKER FIELD PERMEABILITY TESTS ---------------------------------------------
DEPTH DEPTH DEPTH APPLIED HEAD HEAD TOTAL ESTIMATED DIAM. TOP 80TTOM LENGTH TO HEIGHT PRESSURE WATER WATER ASSUMED QUANTITY
DUR- OF HOLE LENGTH LENGTH OF HOLE GRaJND- OF AT DUE TO DUE TO HEAD WATER CALCULATED CALCULATED HOLE ATION TESTED TESTED TESTED TESTED WATER GAGE SWIVel PRESSURE GRAVITY WATER INFLOW PERMEABILITY PERMEA81LITY
NO. (min) ( in) (ft) (ft) (ft) (ft) (ft) (psi) (ft) (ft) (ft) (gpm) (ft/year) (cm/sec) -----------------------------------------------------------------------------------------------------------------------------------------------------Synbol T D1 H7 H8 L1 H1 Hg P1 H3 H4 H5 Q1 K K
------------------------------------------------------------------------------------------------------------------------------.----------------------
8-214 2.0 3.0 20.5 30.2 9.7 13.8 0.0 10.0 23.1 13.8 36.9 0.0 0.00 0.00000 8-214 1.5 3.0 20.5 30.2 9.7 13.8 0.0 20.0 46.2 13.8 60.0 0.0 0.00 0.00000 8-214 1.0 3.0 30.5 40.2 9.7 13.8 0.0 15.0 34.6 13.8 48.4 0.0 0.00 0.00000 8-214 1.5 3.0 30.5 40.2 9.7 13.8 0.0 30.0 69.2 13.8 83.0 0.0 0.00 0.00000
8-215 3.0 3.0 27.2 36.9 9.7 19.6 0.0 16.0 36.9 19.6 56.5 1.3 118.04 0.00011 8-215 7.0 3.0 27.2 36.9 9.7 19.6 0.0 30.0 69.2 19.6 88.8 7.1 402.65 0.00039 8-215 4.0 3.0 27.2 36.9 9.7 19.6 0.0 16.0 36.9 19.6 56.5 3.4 304.42 0.00029
8-216 5.0 3.0 20.0 29.7 9.7 17.0 0.0 20.0 46.2 17.0 63.2 0.9 73.08 0.00007 8-216 3.0 50.0 59.7 9.7 17.0 0.0 NO PRESSURE TEST PERFORMED 8-216 2.0 3.0 60.0 69.7 9.7 17.0 0.0 30.0 69.2 17.0 86.2 0.0 0.00 0.00000 8-216 2.0 3.0 60.0 69.7 9.7 17.0 0.0 60.0 138.5 17.0 155.5 0.0 0.00 0.00000 8-216 3.0 86.0 95.7 9.7 17.0 0.0 PACKERS WONIT SEAL 8-216 3.0 96.0 105.7 9.7 17.0 0.0 PACKERS WONIT SEAL 8-216 1.0 3.0 106.0 115.7 9.7 17.0 0.0 50.0 115.4 17.0 132.4 0.0 0.00 0.00000 8-216 1.0 3.0 106.0 115.7 9.7 17.0 0.0 100.0 230.8 17.0 247.8 0.2 4.05 0.00000 8-216 2.0 3.0 120.0 129.7 9.7 17.0 0.0 60.0 138.5 17.0 155.5 0.1 3.23 0.00000
8-217 5.0 3.0 23.0 32.7 9.7 19.9 0.0 15.0 34.6 19.9 54.5 8.8 813.46 0.00079 8-217 5.0 3.0 23.0 32.7 9.7 19.9 0.0 30.0 69.2 19.9 89.1 13.5 759.82 0.00073 8-217 3.0 36.0 45.7 9.7 19.9 0.0 PACKERS WONIT SEAL 8-217 3.0 53.0 62.7 9.7 19.9 0.0 NO PRESSURE TEST PERFORMED 8-217 3.0 67.0 76.7 9.7 19.9 0.0 NO PRESSURE TEST PERFORMED 8-217 6.0 3.0 94.0 103.7 9.7 19.9 0.0 50.0 115.4 19.9 135.3 4.9 182.81 0.00018 8-217 3.0 94.0 103.7 9.7 19.9 0.0 100.0 PACKERS WONIT SEAL 8-217 5.0 3.0 111.0 120.7 9.7 19.9 0.0 30.0 69.2 19.9 89.1 15.6 878.01 0.00085
-----------------------------------------------------------------------------------------------------------------------------------------------------NOTES: 1. PRESSURE TEST NOT PERFORMED - indicates that only a holding test was performed at that interval.
2. PACKERS WON'T SEAL - indicates that. pressure test could not be performed because packers would not completely seal the interval of interest.
3. HT = H1+P1 (H1 < H7+L1/2)
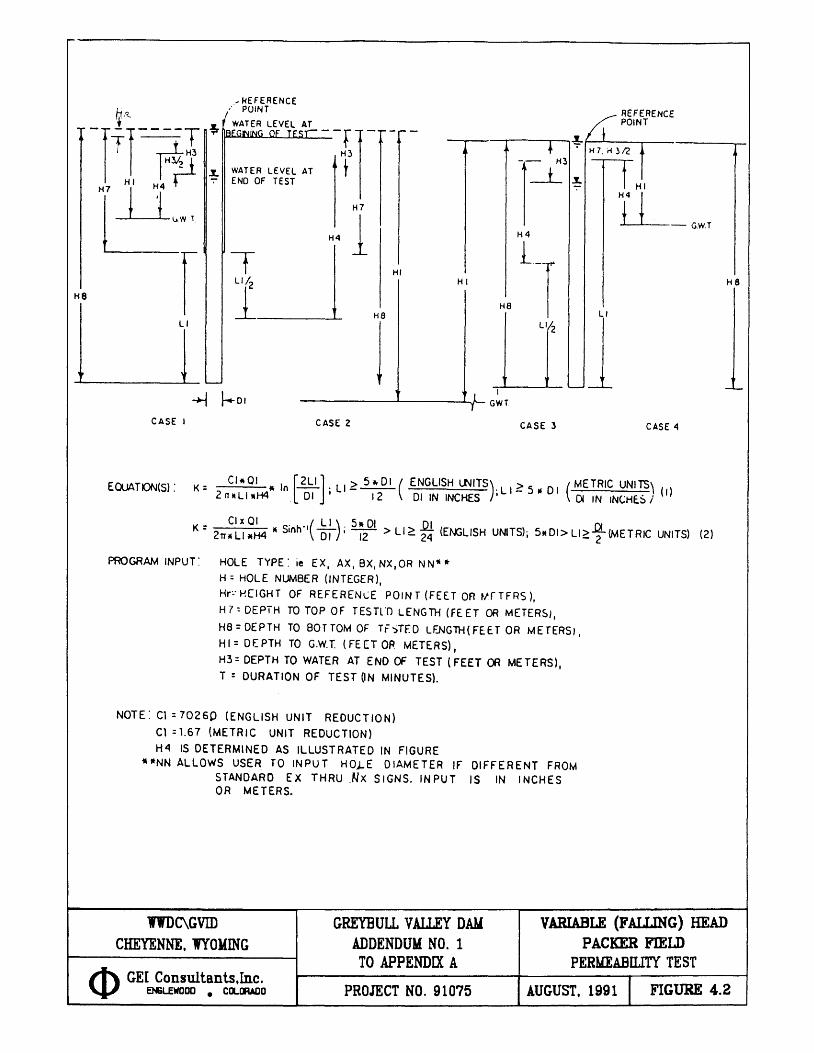
, REFERENCE , .. PUINT ~ R.. WATER LEVEL AT
-ITHtl--~r ~ OF Tr.' It3]- r-,--
I I n~ t !- WATER LEVEL AT r END OF TEST
H~WT H41
r I~ HI
He He
H8
LI
, ~----------~-~ J
1 GWl
CASE I CASE 2 CASE 3 CASe: -4
EOJATK)N(S) : K;; CI*OI * In r.2L1] , lI? 5 .. 01 ( ENGLISH L.NITS)'lI? 5" 01 (METRIC UNITS, ( ) 2 IT IIl1ltH4 L 01' 12 01 IN INCHES ' ()( IN INCHE.S; I
ClxOI . (lI) 5,.01 .Ql Q.. K = 21TlIlI*H4 II Slnh"1 OJ ; ~ > lI~ 24 (Ef\GlISH UNITS); 5*DI>lI~ 2 (METRIC UNITS) (2)
PROGRAM INPUT: HOLE TYPE: ie EX, AX, ex, NX,OR NN'l.
H;; HOLE NUMBER (INTEGER),
Hr~'I-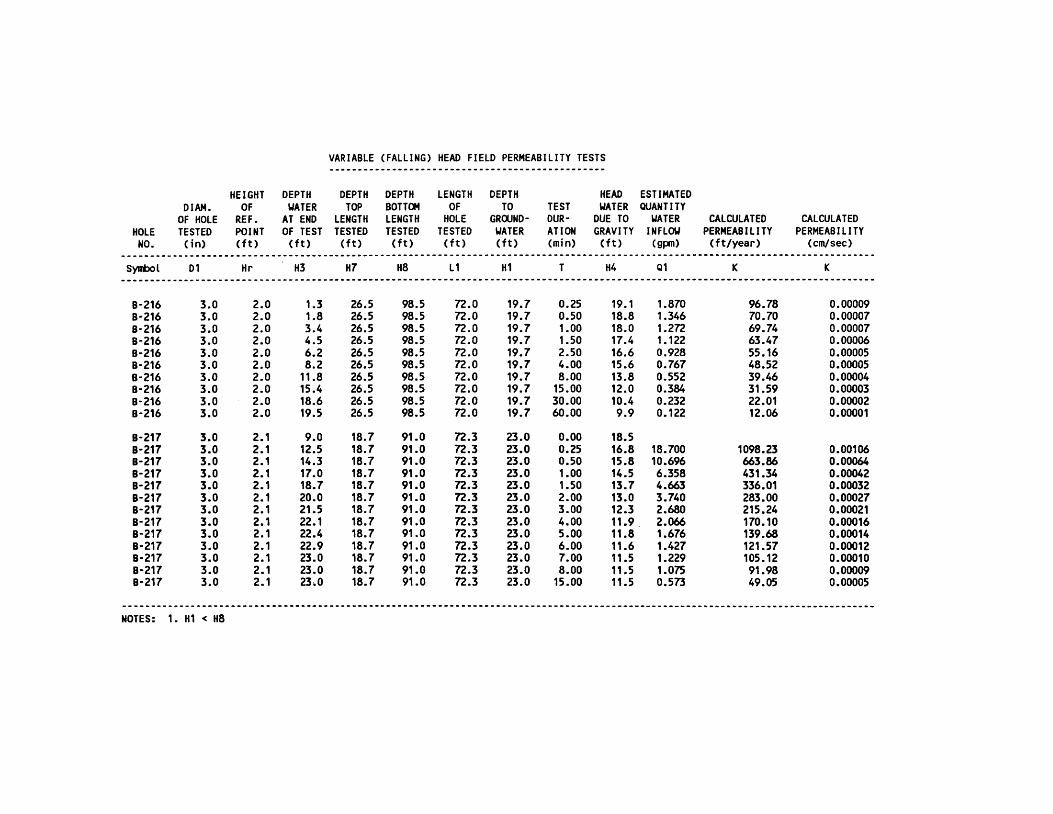
VARIABLE (FALLING) HEAD FIELD PERMEABILITY TESTS -------------------------------------------.----
HEIGHT DEPTH DEPTH DEPTH LENGTH DEPTH HEAD ESTIMATED DIAM. OF WATER TOP BOTTOM OF TO TEST WATER QUANTITY
OF HOLE REF. AT END LENGTH LENGTH HOLE GROOND- DUR- DUE TO WATER CALCULATED CALCULATED HOLE TESTED POINT OF TEST TESTED TESTED TESTED WATER ATION GRAVITY INFLOW PERMEABILITY PERMEABILITY
NO. ( in) (ft) (ft) (ft) (ft) (ft) (ft) (min) (ft) (gpn) (ftlyear) (cm/sec) --------------------------------_._-----------------------------------------------------------------.------------------------------Synbol 01 Hr H3 H7 H8 L1 H1 T H4 Q1 K K
--------------------------------------_.-------------------------------------------------------------------------------------------
B-216 3.0 2.0 1.3 26.5 98.5 72.0 19.7 0.25 19.1 1.870 96.78 0.00009 B-216 3.0 2.0 1.8 26.5 98.5 72.0 19.7 0.50 18.8 1.346 70.70 0.00007 8-216 3.0 2.0 3.4 26.5 98.5 72.0 19.7 1.00 18.0 1.272 69.74 0.00007 8-216 3.0 2.0 4.5 26.5 98.5 72.0 19.7 1.50 17.4 1.122 63.47 0.00006 8-216 3.0 2.0 6.2 26.5 98.5 72.0 19.7 2.50 16.6 0.928 55.16 0.00005 8-216 3.0 2.0 8.2 26.5 98.5 72.0 19.7 4.00 15.6 0.767 48.52 0.00005 8-216 3.0 2.0 11.8 26.5 98.5 72.0 19.7 8.00 13.8 0.552 39.46 0.00004 8-216 3.0 2.0 15.4 26.5 98.5 72.0 19.7 15.00 12.0 0.384 31.59 0.00003 8-216 3.0 2.0 18.6 26.5 98.5 72.0 19.7 30.00 10.4 0.232 22.01 0.00002 8-216 3.0 2.0 19.5 26.5 98.5 72.0 19.7 60.00 9.9 0.122 12.06 0.00001
8-217 3.0 2.1 9.0 18.7 91.0 72.3 23.0 0.00 18.5 8-217 3.0 2.1 12.5 18.7 91.0 72.3 23.0 0.25 16.8 18.700 1098.23 0.00106 8-217 3.0 2.1 14.3 18.7 91.0 72.3 23.0 0.50 15.8 10.696 663.86 0.00064 8-217 3.0 2.1 17.0 18.7 91.0 72.3 23.0 1.00 14.5 6.358 431.34 0.00042 8-217 3.0 2.1 18.7 18.7 91.0 72.3 23.0 1.50 13.7 4.663 336.01 0.00032 8-217 3.0 2.1 20.0 18.7 91.0 72.3 23.0 2.00 13.0 3.740 283.00 0.00027 8-217 3.0 2.1 21.5 18.7 91.0 72.3 23.0 3.00 12.3 2.680 215.24 0.00021 8-217 3.0 2.1 22.1 18.7 91.0 72.3 23.0 4.00 11.9 . 2.066 170.10 0.00016 8-217 3.0 2.1 22.4 18.7 91.0 72.3 23.0 5.00 11.8 1.676 139.68 0.00014 8-217 3.0 2.1 22.9 18.7 91.0 72.3 23.0 6.00 11.6 1.427 121.57 0.00012 8-217 3.0 2.1 23.0 18.7 91.0 72.3 23.0 7.00 11.5 1.229 105.12 0.00010 8-217 3.0 2.1 23.0 18.7 91.0 72.3 23.0 8.00 11.5 1.075 91.98 0.00009 8-217 3.0 2.1 23.0 18.7 91.0 72.3 23.0 15.00 11.5 0.573 49.05 0.00005
-----------------------------------------------------------------------------------------------------------------------------------NOTES: 1. H1 < H8

ENCLOSURE 2.
Addendum 1 to Appendix B
Summary Technical Memorandum
Greybull Valley Dam and Reservoir - Diurnal Streamflow Analysis

1.
2.
3.
4.
INTRODUCTION
TABLE OF CONTENTS ADDENDUM 1 TO APPENDIX B
ANALYSIS METHODOLOGY
2.1 Data Collection 2.2 Data Analysis
RESULTS
CONCLUSIONS
Page
1
3
3 3
6
7
Figure l. Figure 2. Figure 3.
Figure 4.
Figure 5. Figure 6.
List of Figures
Example of diurnal flow variation on the Greybull River. Schematic illustration of the logic for diversion analyses. Greybull River streamflow hydrograph illustrating when divertible water was available in 1982. Mean spring season flow diversion versus canal capacity for several downstream demands. An unlimited reservoir storage capacity is assumed available. Mean spring season diversion assuming an 800 cfs downstream demand. Mean spring season diversion assuming a 1200 cfs downstream demand.
ENCLOSURE 2
ADDENDUM 1 TO APPENDIX B SUMMARY TECHNICAL MEMORANDUM
DIURNAL STREAMFLOW ANALYSIS
1. INTRODUCTION
The proposed Greybull Valley Reservoir is planned as an offstream reservoir, with water supply delivery via a canal from the Greybull River. Unlike an onstream reservoir, which has the entire volume of streamflow (physically) available to it for storage, the amount of water available for storage in an offstream reservoir is limited by the capacity of its delivery canal. A delivery canal that is too small will reduce the amount of storable water, and therefore prevent the reservoir from providing the maximum yield. A canal oversized for a given size of reservoir can't divert flow into the reservoir if the reservoir is 'full. Therefore, delivery canal size becomes an important factor in an offstream reservoir project.
In general, for an offstream reservoir project, reservoir capacity and delivery canal capacity should be determined jointly so that each component (reservoir and canal) is chosen at the optimal size for the total project concept. Obviously, as the reservoir size increases and more yield is expected from the reservoir, a larger canal is needed to deliver a greater volume of storable flow. A number of factors come into play in the joint selection of canal and reservoir capacities: desired project yield, total project cost, and cost per acre-foot of yield are among the more important factors. Although hydrologic factors will place a practical upper limit on the capacities of project components and project yield, cost factors may prove more critical in the final selection of the size of project facilities.
During Phase I of this investigation, a monthly reservoir operation model was utilized to size the reservoir and delivery canal. Canal capacities of 150 cfs to 1,000 cfs were analyzed, as were reservoir capacities of 15,000 acre-feet to 46,000 acre-feet. A 150 cfs delivery canal was shown to be adequate to deliver wintertime flows, and yield about 15,000 acre-feet annually, with yield dependent upon future instream flow requirements that would be imposed by other regulatory agencies. The model illustrated that additional reservoir yield could be derived during the springtime snowmelt runoff.
Because a monthly streamflow value averages 30 distinct daily flow values, it may prove somewhat unreliable during peak runoff months having large day to day flow variations. Therefore, the Phase I analysis also included analysis based on daily streamflow data to verify the monthly analysis. Dependent upon the reservoir storage volume available for storing the springtime runoff, the Phase I analysis indicated that a canal sized between 150 cfs and 500 cfs was considered optimal. A canal sized from 800 to 1,000 cfs could be required if future instream flow requirements prevented wintertime diversion to the reservoir.
1
At the completion of Phase I, the Greybull Valley Irrigation District indicated that they felt that a daily flow analysis might be inadequate for determining the required canal capacity and may actually undersize the canal. As shown in Figure 1, the Greybull River experiences a large diurnal flow variation. Diurnal flow is defined as the variation of flows throughout a 24-hour period, therefore a diurnal streamflow analysis is based on hourly streamflow data.
This report addresses the selection of delivery canal capacity for the proposed Greybull Valley Dam and Reservoir project based on the diurnal analysis. The discharge capacity will be the basis for design of the project's delivery canal. A hydrologic evaluation was made of hourly streamflows on the Greybull River to assess the hydrologic limitations on canal size. The selection of canal capacity made during this investigation is based solely on hydrologic criteria. Cost criteria, which will likely be a major factor in determining the final project concept, are not evaluated herein.
2
2. ANALYSIS METHODOLOGY
2.1 Data Collection
A streamflow gage (U.S. Geological Survey No. 6276500) has been operated on the Greybull River at Meeteetse, 14 miles upstream of the proposed delivery canal diversion, since 1920. The station is operated by the Wyoming State Engineer's Office with records published by the U.S. Geological Survey. Because there is a limited amount of irrigation between the Meeteetse gage and the proposed diversion, streamflows at the proposed diversion were assumed to be the same as those at the gage.
Hourly river stage at the gage was derived from A-35 recorder charts provided by the Wyoming State Engineer's Office (1981 through 1986) and by the Division 3 State Water Commissioner (1987 through 1990). No records prior to 1981 were available for analysis. Stage shifts were taken primarily from charts provided by the Division 3 Commissioner; shifts were prorated between days. However, when a monthly total streamflow did not compare well with the published record, the A-35 charts were examined and shifts adjusted until a better total was achieved. River stage was converted to discharge using USGS expanded rating tables. Different rating tables applied in different years, and some years required more than one table. A difference between the published and calculated monthly total flow of less than 5% was deemed satisfactory.
2.2 Data Analysis
The amount of divertible and storable water for several canal capacities was determined using a simple accounting procedure. This analysis was performed utilizing Quattro Pro spreadsheet software on a personal computer. A flow chart depicting the analysis logic is shown in Figure 2. Terminology used in the flow chart are described below.
Streamflow: Discharge in cfs, measured at the Meeteetse gage, and assumed to be the discharge at the proposed diversion.
Downstream Demand: Amount of flow required to be in the river at the proposed canal diversion in order to satisfy downstream water rights requirements.
• Divertible Flow: The volume of flow at the gage in excess of the downstream demand. This is water that is legally available to be diverted through the canal and stored in the reservoir.
Canal Surplus: The amount of divertible flow that can not be diverted because of a too-small canal capacity; this is water that is "lost" downstream.
3

Diversion: The amount of water actually diverted through the canal into the reservoir.
Captured or %Captured: The percentage of divertible water that was actually diverted. This value is limited by both the canal size and available reservoir storage.
Reservoir Surplus: The amount of flow that could not be diverted because of a reservoir size limitation - not because of a canal capacity limitation.
Release Demand: The amount of water the reservoir needs to release in order to satisfy downstream demand. If streamflow at the diversion is less than downstream demand, there will be a release demand.
Reservoir Storage: The amount of water stored in the reservoir at a given time.
Release: The amount of water released from the reservoir to satisfy a release demand. If there is not enough stored water available, the release will be less than the release demand.
An individual spreadsheet was maintained for each year of hourly runoff data and divertible/storable flow calculations, with a linked master spreadsheet used for parameter input and data output. Three input parameters could be varied to assess the effects upon the flow volume diverted into the reservoir: downstream demand, canal capacity, and available reservoir capacity.
A general rule of the river used on the Greybull River is that if flow at Meeteetse is greater than about 800 cfs to 900 cfs, all downstream irrigators will be satisfied. Permits exist for a total of about 1,200 cfs below the supply canal diversion. However, since return flows are recycled to the river, and available to downstream irrigators, bypass of a full 1,200 cfs is not required. In this analysis, downstream demands of 800 cfs and 1,200 cfs were used to define the upper and lower limits of divertible flow. Our analyses of streamflow data indicates that the 800 cfs number is most likely the best number to use for downstream demand. Because flows exceeding 800 cfs have not been recorded in all months, the analysis was limited for the months of May through July, herein termed the spring season. Figure 3 illustrates when water could have been diverted to the reservoir during the 1982 springtime runoff, based on an 800 cfs downstream demand.
Canal capacities were varied from 150 cfs to 1,000 cfs. A minimum canal capacity of 150 cfs will be required to carry wintertime diversions. The Phase I analysis indicated that 500 cfs is about the maximum canal capacity that can be hydrologically justified. The maximum canal capacity evaluated in this investigation was set at 1,000 cfs because of the unknown effect of analyzing hourly streamflow data. To illustrate, if flow at the diversion is greater
4

than the downstream demand for a given hour, it is assumed that flow could be diverted. However, the amount or volume of diversion is limited by canal capacity. If the canal capacity is 150 cfs and downstream demand is 1,000 cfs, then only that part of the flow greater than 1,000 cfs and less than 1,150 cfs can be diverted.
Of course, the 150 cfs can be diverted into the reservoir only if there is available reservoir capacity. Available reservoir storage capacity is defined as that amount of storage capacity available for storage of runoff at the beginning of the spring season runoff. It is equal to the reservoir capacity minus the volume of water in the reservoir on May 1st. If no wintertime diversion is allowed (due to instream flow requirements or canal icing problems) and a 45,000 acre-foot reservoir is selected, then 45,000 acre-feet of storage capacity is available for storage of the springtime runoff. At the other extreme, if a 20,000 acre-foot reservoir is built, and an annual average of 15,000 acre-feet are stored during the winter, then there are only 5,000 acre-feet of reservoir capacity available for the springtime runoff. Several available reservoir storage capacities from 5,000 acre-feet to 45,000 acre-feet were evaluated.
For each combination of downstream demand, canal capacity, and available reservoir storage, a potential diversion volume was calculated. The hourly flow diversions were summed and converted to spring season diversion volume. Then, the spring season diversion volumes were averaged to provide the mean diversion volume for the given parameter combination. To assist in interpreting the numerous combination of the three parameters, canal capacity versus mean spring season diversion curves were generated for the several available reservoir storage capacities and downstream demands.
5

3. RESULTS
To be able to deliver to the proposed reservoir nearly all of the legally divertible flow would require a canal having a capacity of about 7,000 cfs. However, a large percentage of the available flow could be diverted with a much smaller canal. Figure 4 illustrates the mean spring season diversion possible for the several downstream demands and canal sizes -assuming an unlimited available reservoir storage capacity. With an 800 cfs downstream demand, nearly 90 percent of the season's divertible flow can be diverted with a 1,000 cfs canal, and about 70 percent of the divertible flow can be delivered with a 500 cfs capacity canal.
Figure 4 illustrates how much water could be delivered to the reservoir if there is an unlimited available storage capacity. This, of course, will not be the situation since the reservoir will have a finite storage capacity. The 70 years of record for the Meeteetse gage indicate that in a some years over 50,000 acre-feet could be diverted during spring runoff, and in a few years, over 100,000 acre-feet of water were available for storage. However, because of reservoir capacity limitations - not canal capacity restrictions - divertible flow would have been lost downstream.
As previously explained, available reservoir storage cap~city was one model parameter that could be adjusted with its impact on reservoir yield analyzed. Available capacities of from 5,000 acre-feet to 45,000 acre-feet were examined. Figures 5 and 6 illustrate the relationship between the mean annual volume of divertible flow and canal capacity for the five reservoir storage capacities examined in this analysis. The two figures represent the two extremes of downstream demand analyzed - 800 cfs and 1,200 cfs. As can be seen from these two figures, the downstream demand has a substantial effect on how much flow is diverted through the canal. Reservoir size limitation is best shown by Figure 5. For a downstream demand of 800 cfs and canal capacity of 1,000 cfs, a reservoir with 45,000 acre-feet of available capacity allows over 11,000 acre-feet of mean spring season diversion, while having only 5,000 acre-feet of available reservoir capacity allows just over 4,000 acre-feet of diversion.
6

4. CONCLUSIONS
For the final project configuration, diversion canal capacity and reservoir capacity will have to be chosen in tandem so that the optimum size is selected for each of these project components. Cost will be a factor in the final selection of component sizes. However, preliminary canal capacities to be used for developing cost estimates and cost estimating curves may be selected based upon hydrologic criteria.
At the lower extreme, a canal of 150 cfs could be constructed. A canal having this capacity would allow the diversion of nearly all wintertime runoff. Additionally, an average of 1,000 to 5,000 acre feet could be diverted during the springtime runoff, dependent upon downstream demand criteria and available storage capacity limitations.
A delivery canal with a capacity of 150 cfs will be undersized except for smallest of reservoirs. On the other hand, a canal sized at over 500 cfs capacity is probably oversized for all but the largest reservoir projects. The flattened slopes of the curves in Figures 5 and 6 beyond 500 cfs indicate that little is to be gained from building a canal capable of delivering more than 500 cfs. For example, with 20,000 acre-feet of available storage and a downstream demand of 800 cfs, an average of 7,900 acre-feet could be delivered annually during the springtime runoff. Increasing the canal capacity to 1,000 cfs would increase mean annual diversion to 8,800 acre-feet - an increase in delivered water of only 11 percent for a 100 percent increase in canal size.
The hourly flow analysis conducted in this investigation reinforces the findings of the previous Phase I investigation. A canal larger than about 500 cfs is not hydrologically justifiable. Flow will be lost downstream with a 500 cfs canal, and river re-regulation may be less precise. However, gains above the 500 cfs size are not substantial. If canal cost increases are minimal for enlarging the canal above 500 cfs, only then should such a larger delivery canal be considered.
7
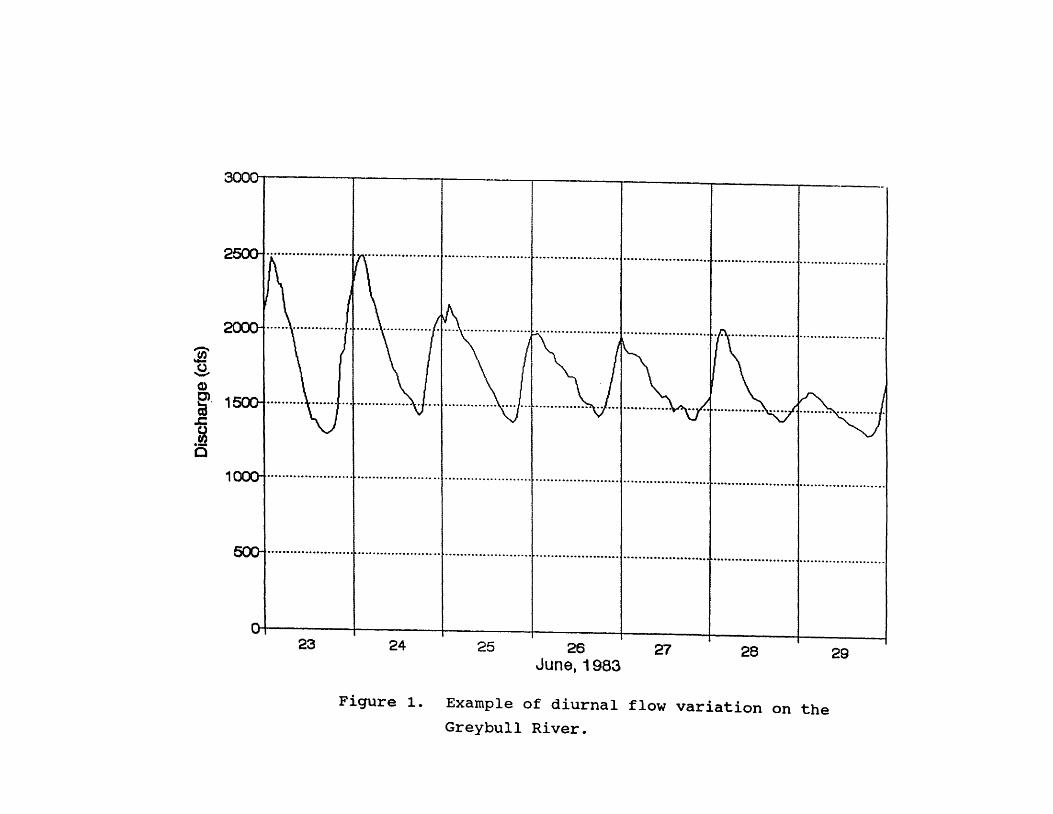
~~------~--------~---------~---------~-------~--------~---------
................................................................................................................................................................................
.................... ... ...... ..... ............ ............... .......... .. ........ ............. ....................... ...................... ... .............. ....... ..
23 24 25 26 June. 1983
27 28
Figure 1. Example of diurnal flow variation on the
Greybull River.
29

f"ILL THE RESERVOIR
DIVERSION • AVAILABLE STORAGE
RES SURPLUS • CANAL CAPACITY - AVAILABLE
STORAGE
GREYBULL RIVER HOURLY ANALYSIS ELOV CHART
YES
STORE: 'J ATER If" POSSIBLE
DIVERTIBLE FlJlV • STR£AMf1.O'w' -DD'w'NSTR£AH
DEMAND
STORE THE CANAL CN'AClTY
DIVERSION • DIVERTIBLE fLO'J CAPTURE • 100%
FILL THE RESERVDlR
DIVERSION • AVAILABLE SmRAGE
RES SURPLUS • DIVERTIBLE FlOV -AVAILABLE STORAGE
X CAPTURED • DIVERSION • 100
DIVERTIBLE
STlJRE THE DIVERIDLE fLO\I
NO
HAKE RElEASE IF' POSSIBLE
RELEASE • RELEASE DEMAND
RElEASE DEMAND • DCVNSTREAM
DEMAND -STR£AMf"LO\I
RELEASE • RESERVOIR
STORAGE
Figure 2. Schematic illustration of the logic for
diversion analyses.
RELEASE • 0
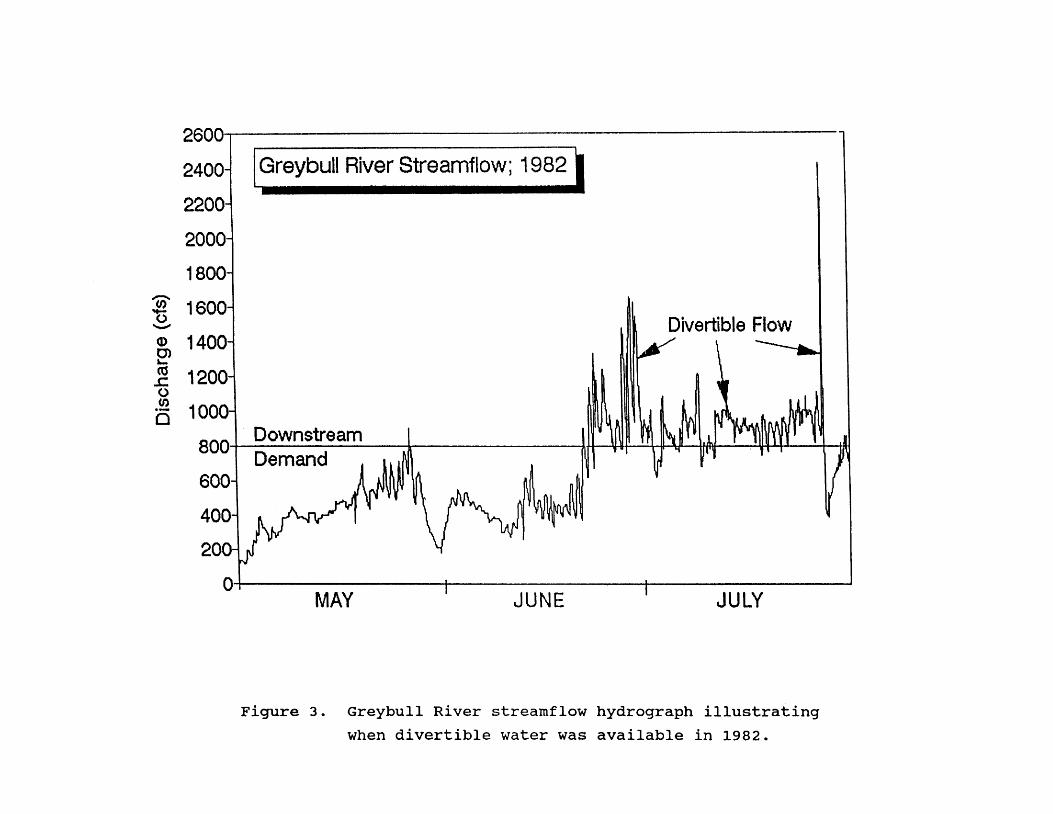
(J) 0) ....
2600~----------------------------------------------
2400
2200
Greybull River Streamflow; 1982
Divertible Flow
~ 1200 o .~ 1000 o
Downstream 800+-------------~------------~H~~~~~~~~~~
Demand 600
400
200
O+-----------------+---------------~----------------~ MAY JUNE JULY
Figure 3. Greybull River streamflow hydrograph illustrating
when divertible water was available in 1982.
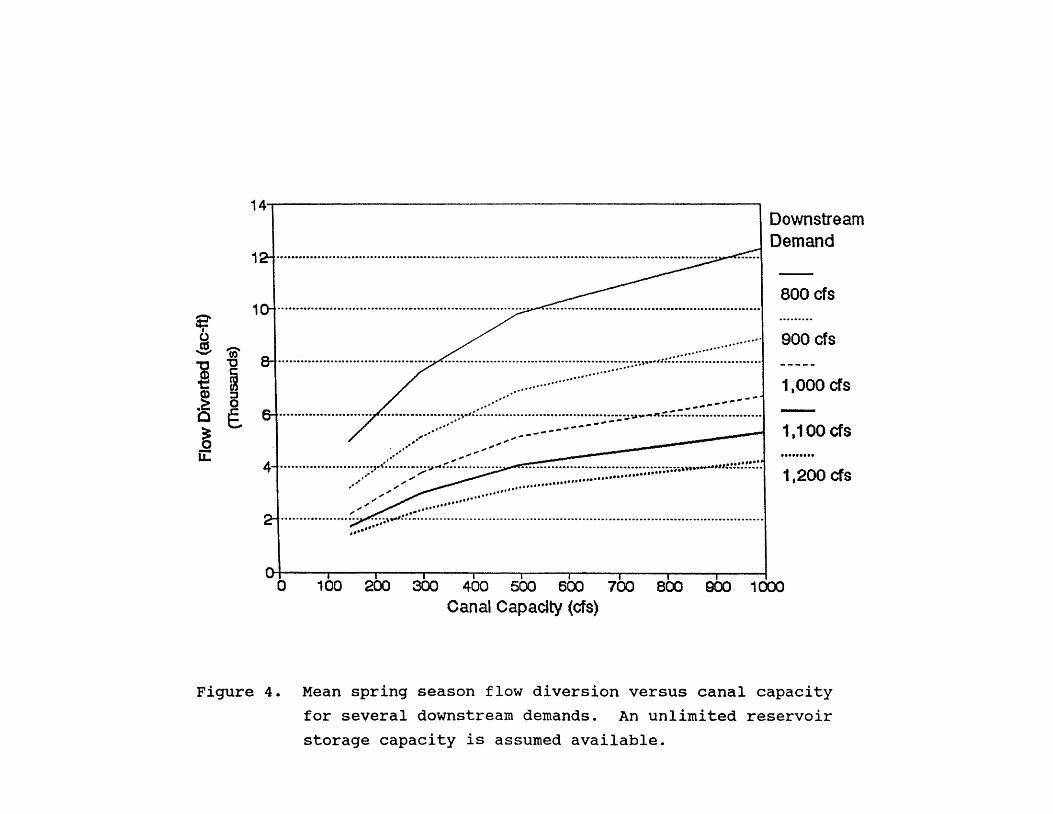
e. aJ '" 1ii"
~ '0
m .~ ::s
0 C E-~ u::
14·~------------------------------------------------'
1
1
................... ::::: .. : ...• :: .. :::::::::::::::::::: ,,,--,,,;::::::::::::::::::: :::::
4
II'·" _"", __ "".---
.. ............. ....... ... . ......... ~: .. :: .. :: .. :"~: ::::: .... ~ ~~~:.~::~::::::.;.;.., .. ~-~ ::::;: :::.:: = ............ . . ,.-,. ~".,-.... ",,,
..................................... ,.1.#: ................ ~ ... ::.::..... . ...... .. .. ..... ... ....................................................... _ .............. \,,..,, .... ~6"1::::!::: .. ,.. "'" ............. , .... . • _".,f "",'" ., •• , ••• , ••• , ••• , ••• , ••••••
,,'" .,_,.1'''''' *" ttl' '" ••••• ,.,.,.,., •
................ Ill •• ::" .... -,...",..,!!:: ...................................................................................................................... . , .. ,.-".-
Downstream Demand
800 cfs
900 cfs
1,000 cfs
1,100 cfs
1,200 cfs
a 100 200 300 400 500 600 700 800 900 1 QCX)
Canal Capacity (cfs)
Figure 4. Mean spring season flow diversion versus canal capacity
for several downstream demands. An unlimited reservoir
storage capacity is assumed available.
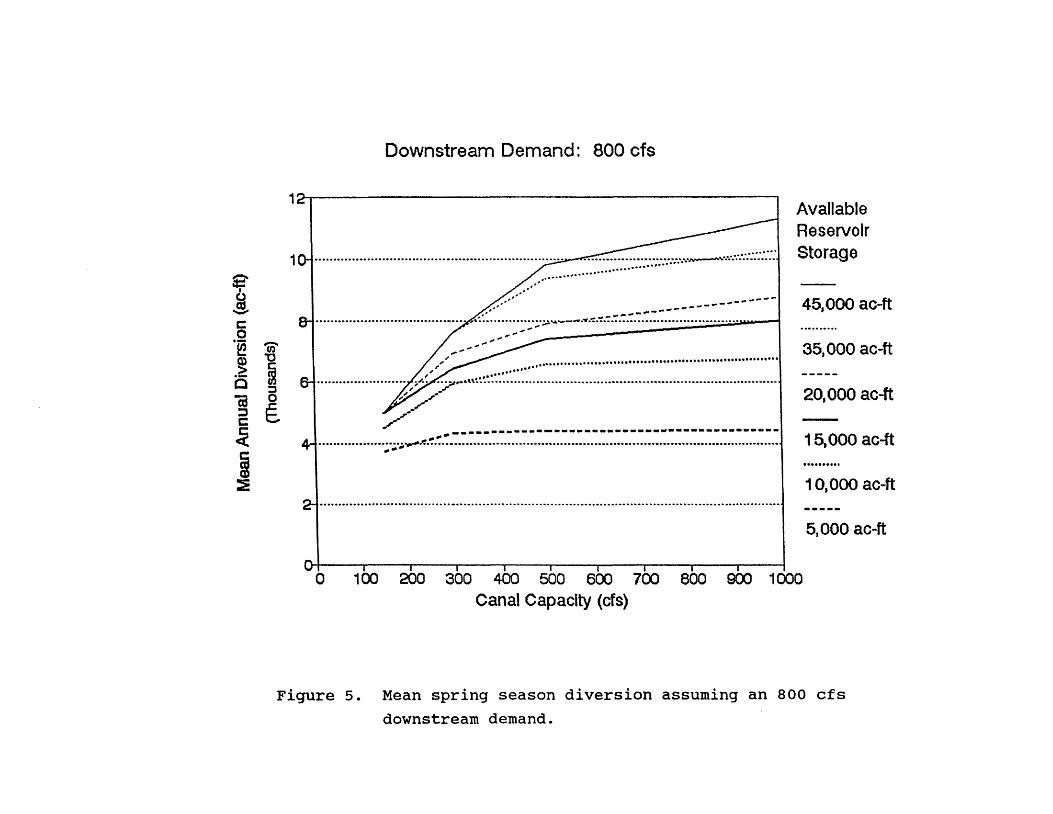
e I
~ C 0 .~
.~ C ca ::l c ~ m :e
"ii)' "'0
m :J 0
E
Downstream Demand: 800 cfs
1~------------------------------------------~ Available Reservoir Storage 1
45,000 ac-ft
35,000 ac-ft
20,000 ac-ft
.-------------------------------------------............................. ~."::: .. _._._.................................................................................. 1 5.000 ac-ft "._111
1 0,000 ac-ft
5,000 ac-ft
o 100 200 300 400 500 600 700 800 900 1000 Canal Capacity (cfs)
Figure 5. Mean spring season diversion assuming an 800 cfs downstream demand.

Downstream Demand: 1,200 cfs
1~------------------------------------------~
1 ...................................•......................................................................................
4 ................................................................................... ~.~.~.~.~.~.~.~.~.:.._ .. ___ . .: .... ---
....... , .................. , ....... , ............. . ......................... , ....... , ... ,., ...•.......•...•.....•..... ,.~!.- .•...............• ;..;,;:.;;.:..:..:..;. . .;, . .;, . .:. . .: . .;.,;,.w:. • .:. • .;.~.~ .... _._ • .:i._._._ ................... ... -_ .. ------........... --
Available Reservoir Storage
45.000 ac-ft
35.000 ac-ft
20,000 ac-ft
15, 000 ac-ft
1 0.000 ac-ft
5.000 ac-ft
o 100 200 300 400 500 600 700 800 900 1000 Canal Capacity (cfs)
Figure 6. Mean spring season diversion assuming a 1200 cfs
downstream demand.

ENCLOSURE 3.
Appendix F
Summary Technical Memorandum
Greybull Valley Dam and Reservoir .. Phase II Economic Analysis

1. BACKGROUND
2. SURVEY RESULTS
3. CONCLUSIONS
TABLE OF CONTENTS APPENDIX F
1
3
7

ENCLOSURE 3
APPENDIX F SUMMARY TECHNICAL MEMORANDUM
GREYBULL VALLEY PHASE II ECONOMIC ANALYSIS
1. BACKGROUND
The Phase I Economic Analysis for the Greybull Valley Dam and Reservoir Project was completed in January, 1991. The results of that analysis showed that, depending upon the efficiency of delivery systems, the average value of supplemental storage water to members of the Greybull Valley Irrigation District (GVID) is in the range of $30 to $40 per acre-foot. The Phase I analysis also showed that, depending upon project configuration and financing arrangements, the GVID's share of project costs would be in the range of $25 to $35 per acre-foot of annual reservoir yield. At these prices, individual irrigators would be spending a large portion of their increased income from the project to repay project costs. For that reason, it is important to know the severity of water shortages that occur in the GVID and the amount of money that GVID members are willing to pay to alleviate those shortages.
The purpose of this Phase II economic analysis of the project is thus twofold:
to determine the scope and extent of water shortages among G VID members that could be served by the project; and
to develop preliminary estimates of the demand for supplemental irrigation water at prices in the range of those needed to repay the sponsor's portion of estimated project costs.
To accomplish these objectives, Watts & Associates, Inc. (WAI) developed a survey questionnaire and conducted a scientific mail survey of GVID members served by the Farmers and Bench Canals. The 226 GVID members served by these canals would be the primary beneficiaries of the project. For purposes of the survey, a 50 percent random sample of 113 irrigators was drawn from a list of the 226 District members along the Farmers and Bench Canals. The survey was first mailed on May 20, 1991, and a follow-up postcard reminder was sent to non-respondents the week of June 3rd. A third mailing of the complete survey was sent to non-respondents on June 20th, and responses were received until July 5th.
Of the 113 surveys mailed, two were returned as non-deliverable, for a total sample size of 111. Of the 111, 76 returned the survey, for a response rate of 68 percent. This response rate is good for a mail survey. To analyze the survey results, it was necessary to adjust the sample results to estimate water needs for all GVID members. Four assumptions were made in that regard.
1
First, it was assumed that irrigators who did not respond to any of the three mailings did not have an interest in or demand for additional irrigation water. This assumption is supported by common sense and the fact that many late returns from the survey were from individuals with no interest in the project.
The second assumption involved the fact that almost 10 percent of the respondents to the survey indicated that they had retired from farming, and several mentioned that they had leased their operations to others, giving no specifics concerning whom. Rather than record their responses as indicating no interest, however, we assumed that the retirees had leased their land to irrigators with the same general demand for irrigation water as other respondents to the survey.
Third, after taking the above adjustments into account, the responses received from the 50 percent sample of irrigators along the Farmers and Bench Canals were doubled to reflect total demand for irrigation water along both canals. This approach provides a statistically unbiased estimate of total demand along the two canals.
Finally, estimates of water shortages and demand for water storage were increased by 10 percent to reflect potential demand by irrigators along the lower Greybull River who are not served by the Farmers and Bench Canals. Although the 10 percent estimate is subjective, it is in line with past sales patterns for shares in Upper and Lower Sunshine Reservoirs.
2

2. SURVEY RESULTS
The first two questions in the sUlVey dealt with irrigated acreage, cropping patterns, and yields. The primary purpose of these questions was to develop estimates of project benefits for the Phase III Economic Analysis. For that reason, responses to these questions have not been analyzed for purposes of this Technical Memorandum.
The third question in the sUlVey dealt with the frequency of water shortages among irrigators. The question was:
3. How many years out of 10 do you receive all the irrigation water you need when you need it for your irrigated crops?
On the average, respondents to this question indicated that they receive all the irrigation water they need 5 out of 10 years and need additional irrigation water 5 out of 10 years. There was a wide variation in responses, however, with approximately 11 percent of the irrigators indicating that they never receive enough irrigation water, while approximately 6 percent indicated that they have sufficient irrigation water every year. The fact that only 6 percent of the respondents reported having enough irrigation water each year is a strong indication of the need for supplemental irrigation water in the aVID.
The fourth question in the sUlVey dealt with the potential benefits of additional irrigation water to aVID members. The question was:
4. What would be the benefit to you of having additional irrigation water when you need it?
Respondents were asked to check one or more of five potential benefit categories. The responses to this question are summarized in Table 2-1. The results in Table 2-1 indicate that the primary benefits from the project would be to save crops from failure in dry years, and in terms of increased yields. Slightly over 20 percent of the respondents indicated that additional irrigation water would allow them to grow higher valued crops, and approximately 15 percent indicated they would plant additional acreage if additional water were available. Overall, however, there would apparently not be large changes in production practices in the aVID if the project were built.
3

Type of Benefit
Save crops from failure
Increased yields
Grow higher valued crops
Plant additional acreage
No benefit
Table 2-1
Potential Benefits of Increased Irrigation Water to Survey Respondents
Percentage of Survey Respondents Agreeing 1
62.4%
58.5
22.6
15.1
17.0
2
1 Percentages do not add to 100 because respondents could check more than one response.
2 Percentages based upon those who answered this question.
The fifth question in the survey dealt with the amount of additional water the irrigators needed in an average year. The question was:
5. Assume that you could contract for additional irrigation water to be delivered when you need it each year at a reasonable price. How much additional water could you use each year on the average?
The responses to that question, when adjusted up to reflect total demand in the reservoir's service area, indicate that approximately 21,000 acre-feet of additional irrigation water could be used in an average year. There was considerable variation in the amount of the supplemental water needed by individual farmers, ranging from a high of approximately 1,500 acre-feet annually to a low of approximately 50 acre-feet. Approximately two-thirds of the survey respondents who answered the question indicated a need for at least some additional irrigation water, while one-third did not.
4
The sixth survey question dealt with the value of irrigation water to individual farmers. The question was:
6. According to studies by the University of Wyoming, irrigation (storage) water increases net farm income by an average of about $40 per acre-foot in th(~ Big Horn Basin. For crops such as sugar beets and dry beans, increases in net returns can be as high as $50 per acre-foot. With respect to your farrning operation, do you believe that these estimates are: too high, about right, too low, or don't know.
Approximately 40 percent of the respondents to this question indicated that they did not know the value of irrigation water in their operations. Another 37 percent indicated that the estimate of $40 per acre-foot was about right, while about 23 percent indicated that the estimate was too high. No one responded that the estimate was too low. Overall, the responses to this question indicate that our previous (Phase I) estimate of $30 to $40 per acre-foot for irrigation water is a good average figure, although some individual operators who concentrate primarily on forage crops and irrigated pasture may experience lower overall returns.
Respondents to the survey were then given a brief description of the proposed Greybull Valley Dam and Reservoir Project and asked about their willingness to pay for storage rights in the new project. Question seven was as follows:
7. Assume that you had the opportunity to purchase storage rights in the new reservoir at $20 per acre-foot. These rights would be in addition to any storage rights you currently own in Upper and Lower Sunshine. Would you purchase any additional storage in the new reservoir at $20 per acre-foot?
If yes, how many acre-feet of additional .storage would you be willing to purchase at $20 per acre-foot?
The responses to this question, when adjusted to reflect total demand in the reservoir's service area, indicate that approximately 13,000 acre-feet of storage could be sold at $20 per acre-foot. In interpreting this figure, it should be noted that approximately 47 percent of the respondents who answered this question indicated that they would purchase additional storage, 33 percent said they would not, and 20 percent were unsure. The number of "unsure" respondents is not surprising given that 40 percent of the respondents indicated that they did not know the value of irrigation water to their operations. As more information concerning the proposed project and its potential benefits to irrigators becomes available, it is probable that some additional storage contracts could be sold among those groups who are unsure about their intentions at the present time.
The final question in the survey dealt with willingness to pay for storage at $30 per acrefoot. The format of the question was identical to question number seven, except $30 per
5
acre-foot was inserted as the cost of storage rights. Responses to that question indicate that only about 6,000 acre-feet of storage could be sold in the project at a price of $30 per acrefoot. Only about 22 percent of the respondents indicated that they would purchase storage at $30 per acre-foot, and 55 percent indicated that they would not. Twenty-four percent were unsure of whether they would purchase storage water at a cost of $30 per acre-foot. It should be noted that the percentage of respondents who were unsure whether they would purchase storage at $30 per acre-foot is higher than the percentage who indicated that they would purchase storage. Thus, there is a potential for increased demand at $30 per acrefoot as more information about the project becomes available.
6
3. CONCLUSIONS
The results of this Phase III Economic Analysis indicate that there is a need for approximately 21,000 acre-feet of additional irrigation water among GVID members in the service area of the proposed project. There is considerable uncertainty among individual irrigators, however, concerning how much they would be willing to pay for storage rights. Based upon the survey results, and given the amount of knowledge currently available to GVID members concerning the project, it appears that approximately 13,000 acre-feet of storage could be sold at $20 per acre-foot, and approximately 6,000 acre-feet at $30 per acre-foot.
About 20 to 25 percent of all irrigators, however, indicated that they were unsure about whether they would purchase additional storage at this time, and their responses are not included in the above totals. Several respondents indicated that, before making a decision, they needed more information concerning the reliability with which water could be delivered from the reservoir. Paraphrasing one respondent, if storage rights are $30 per acre-foot, but only one-half an acre-foot of water is delivered on the average, water will cost $60 an acrefoot, and that is too expensive.
Based upon the survey results, it is apparent that additional work needs to be done before a final determination can be made of the financial viability of this project. First, irrigators in the GVID need to be supplied with more information concerning the reliability with which water could be delivered from the project. When this information is available, it will be easier for those who are undecided about the project to make a decision.
Second, the survey responses indicate that some tiered pricing schedule, based upon reliability of deliveries, may enhance the financial viability of the project. For example, the survey responses indicate that a higher amount of revenue could be generated by pricing project water at $20 per acre-foot than $30 per acre-foot. If 13,000 acre-feet of storage could be sold at $20 per acre-foot, annual revenues would be approximately $260,000. If only 6,000 acre-feet of storage could be sold at $30 per acre-foot, annual revenues would drop to approximately $180,000.
If we assume, however, that 6,000 acre-feet of storage rights could be sold at $30 per acrefoot with a guaranteed delivery of one acre-foot per acre-foot of storage, and additional storage sold at a lower price without such absolute guarantees, then revenues could be increased. For example, if an additional 12,000 acre-feet of unguaranteed storage could be sold at $15 per acre-foot, then project revenues would be $360,000 annually. Some type of tiered pricing schedule of this type should be investigated during Phase III of this study.
7