Embed Size (px)
Citation preview

This is a digital document from the collections of the Wyoming Water Resources Data System (WRDS) Library.
For additional information about this document and the document conversion process, please contact WRDS at [email protected] and include the phrase
“Digital Documents” in your subject heading.
To view other documents please visit the WRDS Library online at: http://library.wrds.uwyo.edu
Mailing Address: Water Resources Data System
University of Wyoming, Dept 3943 1000 E University Avenue
Laramie, WY 82071
Physical Address: Wyoming Hall, Room 249 University of Wyoming
Laramie, WY 82071
Phone: (307) 766-6651 Fax: (307) 766-3785
Funding for WRDS and the creation of this electronic document was provided by the Wyoming Water Development Commission
(http://wwdc.state.wy.us)
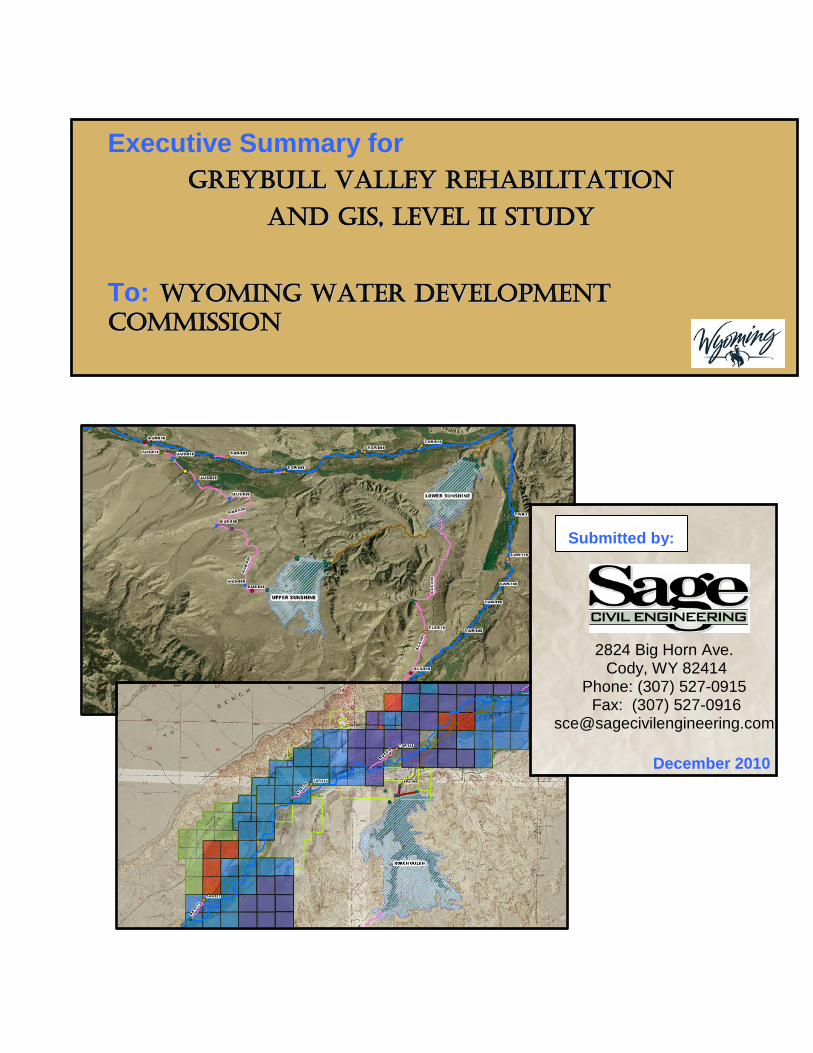
Executive Summary for GGrreeyybbuullll VVaalllleeyy rreehhaabbiilliittaattiioonn
aanndd GGiiSS,, lleeVVeell iiii SSttuuddyy
To: WWyyoommiinnGG WWaatteerr ddeeVVeellooppmmeenntt CCoommmmiiSSSSiioonn
October 2008
Submitted by:
2824 Big Horn Ave. Cody, WY 82414
Phone: (307) 527-0915 Fax: (307) 527-0916
December 2010
Executive Summary
GREYBULL VALLEY REHABILITATION AND GIS, LEVEL II
Prepared for: Wyoming Water Development Commission
6920 Yellowtail Road Cheyenne, WY 82002
Prepared by:
2824 Big Horn Ave.
Cody, WY 82414
December 2010

Final Report: Greybull Valley Rehabilitation and GIS, Level II
i
Table of Contents
1 Introduction ............................................................................................................. 1
2 GIS Development .................................................................................................... 1
3 Mapping ................................................................................................................... 2
4 Creation of GIS Search Tool ................................................................................... 3
5 GIS Training ............................................................................................................. 3
6 Map Books ............................................................................................................... 3
7 Structure Inventory and Evaluation ....................................................................... 3
8 Flow Monitoring ...................................................................................................... 3
9 Conceptual Designs and Cost Estimates .............................................................. 3
10 Summary ................................................................................................................ 10

Final Report: Greybull Valley Rehabilitation and GIS, Level II
ii
List of Figures
Figure 2.1 GIS Framework ..................................................................................................................................... 2
List of Tables
Table 9.1 Upper Sunshine Canal Outlet Structure Cost Estimate ......................................................................... 4 Table 9.2 Lower Sunshine Canal Grate Cost Estimate ......................................................................................... 4
Table 9.3 Summary Flow Monitoring Cost Estimates ............................................................................................ 5
Table 9.4 Upper, Lower Outlet Control Cost Estimates ......................................................................................... 6
Table 9.5 Cost Savings of Automation ................................................................................................................... 6
Table 9.6 Cost Savings of Upper Sunshine Diversion Rehabilitation .................................................................... 6
Table 9.7 Cash Flow Summary - All Projects – WWDC Financing......................................................................... 8 Table 9.8 Cash Flow Summary – All Projects Private Financing ............................................................................ 9
1.1

Final Report: Greybull Valley Rehabilitation and GIS, Level II
1
1 Introduction The Sponsor - Greybull Valley Irrigation District (GVID) was organized as an irrigation district in 1920 and provides water to irrigate approximately 80,000 acres. The District operates three off-channel storage reservoirs to store water from the Greybull River – Upper Sunshine, Lower Sunshine and Roach Gulch Reservoir (See Figure 1.1). Three supply canals and their associated diversions from the Greybull and Wood Rivers are also maintained by the District. Water released from these reservoirs is delivered to the various ditches via the Greybull River. The receiving diversions themselves are privately maintained by individuals or canal companies.
Purpose
This study had the following goals.
After completion of the project, the District will have a functional GIS and a clear picture of the District’s ongoing projects and future commitments.
• GIS Development - Creation of a GIS based on the various components.
• Mapping – This portion of the project entailed all of the work required to map the following components of the GVID:
o Canals diverting water from the Wood and Greybull Rivers to Upper Sunshine, Lower Sunshine and Roach Gulch Reservoirs.
o Reservoir Facilities
o Diversion points of the receiving ditches
o Water Shares for each reservoir.
• Structural Inventory – Inventory the facilities owned and maintained by the GVID.
• Flow Monitoring Plan – Create a flow monitoring plan to collect data on the inflows and outflows from selected reaches within the Greybull River used for delivery of reservoir water.
• Conceptual Designs, Cost Estimates and Financial Review – Produce conceptual designs to replace/rehabilitate the various structures in poor condition and implement the flow monitoring plan.
• Review Districts Project Schedule – Based on cost estimates, review and compare the District’s current and future project schedule to its income to determine feasibility of the proposed improvement.
2 GIS Development The first step in any GIS project is to identify the design constraints and create the database framework for the project. This framework will form the foundation for the data collection and field mapping. Two components of the District were identified by the Wyoming Water Development Commission (WWDC) and the Sponsor for inclusion in the GIS. These are:
• Storage and Supply System
• Water Share (Water Rights) Mapping
Each component has unique data associated with it that are incorporated into the database. Data from other sources – referred to as Base Mapping was included. This information consisted of:
• Aerial Photography
• 7.5 Minute USGS Quadrangle Maps
Final Report: Greybull Valley Rehabilitation and GIS, Level II
2
• County Parcel Data
GIS Framework
With the base mapping requirements identified, the basic framework of the remainder of the GIS needed to be created. This framework is dependent upon the types of features that make up each component and the amount of data the District needs on each feature to effectively meet its needs. For this project, the water share mapping is the most important. The District has three main canals and reservoirs under their responsibility, but is not responsible for the infrastructure required to deliver water to each field. Therefore, they have a limited amount of infrastructure requiring mapping.
All of the mapping data generated by SCE is stored in the “GVID_GIS” database, which consists of two separate components:
• Storage and Delivery System GIS
• Water Share “Water Rights” GIS
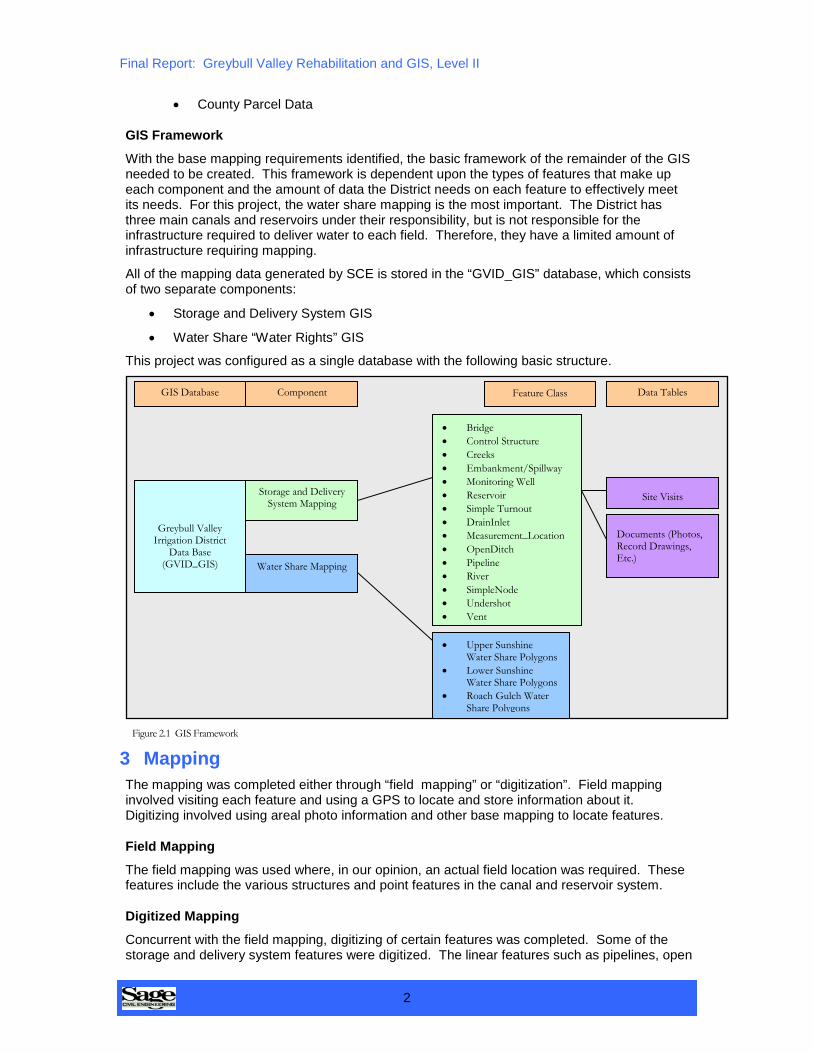
This project was configured as a single database with the following basic structure.
Figure 2.1 GIS Framework
3 Mapping The mapping was completed either through “field mapping” or “digitization”. Field mapping involved visiting each feature and using a GPS to locate and store information about it. Digitizing involved using areal photo information and other base mapping to locate features.
Field Mapping
The field mapping was used where, in our opinion, an actual field location was required. These features include the various structures and point features in the canal and reservoir system.
Digitized Mapping
Concurrent with the field mapping, digitizing of certain features was completed. Some of the storage and delivery system features were digitized. The linear features such as pipelines, open
Greybull Valley Irrigation District
Data Base (GVID_GIS)
Storage and Delivery System Mapping
Water Share Mapping
• Upper Sunshine Water Share Polygons
• Lower Sunshine Water Share Polygons
• Roach Gulch Water Share Polygons
• Bridge • Control Structure • Creeks • Embankment/Spillway • Monitoring Well • Reservoir • Simple Turnout • DrainInlet • Measurement_Location • OpenDitch • Pipeline • River • SimpleNode • Undershot • Vent
GIS Database
Component
Data Tables
Documents (Photos, Record Drawings, Etc.)
Site Visits
Feature Class
Final Report: Greybull Valley Rehabilitation and GIS, Level II
3
ditches and closed drain pipelines were digitized based on the aerial photos. This process involved using a combination of existing maps and aerial photos to locate the linear features such as the canals, reservoir boundaries, etc. Since the point features on either end were field located, any descrepancies were corrected there.
The second component of the GIS digitized was the Water Share Mapping. The purpose of this mapping was to provide a GIS containing the information on the water shares for each reservoir. This is essentially the filing system used by the District to track and organize the amount of storage in each reservoir attached to each piece of property within the District.
4 Creation of GIS Search Tool To aid the District in the use of the GIS, a GIS search tool was created. The User’s Manual and Installation Manual are included in the report.
5 GIS Training SCE provided training to the District on an as-needed basis. Our personnel met with the District on several occasions to illustrate basic tasks and how best the GIS could benefit them. Since the on-site meetings, we have provided support and answers to questions over the phone, and will continue to aid the District if required.
6 Map Books Two hard copies of the map book were provided. They consist of three-ring binders with plastic slip sleeves containing maps 11X17 in size. Substitute maps in the books can be reprinted from Adobe pdf files contained with the project files. These map book pages can also be accessed using ArcGIS.
7 Structure Inventory and Evaluation The structures owned by the Greybull Valley Irrigation District display a wide range of physical conditions. Concurrent with the GIS mapping, the structures were inventoried and evaluated. The information collected was used to make recommendations for rehabilitation, replacement, or upgrades. Two structures, in addition to those currently being rehabilitated by previous projects, were identified.
1. Upper Sunshine Canal Outlet Structure.
2. Lower Sunshine Canal Diversion Structure (Add screening)
8 Flow Monitoring GVID is interested in improving their understanding of flows within their system. To this end a flow monitoring task was added to the project. SCE has proposed a long-term monitoring system to track inflows and outflows from Meeteetse to Otto. Data from these flow recording stations could be used in the future to more accurately quantify conveyance losses from reservoir release.
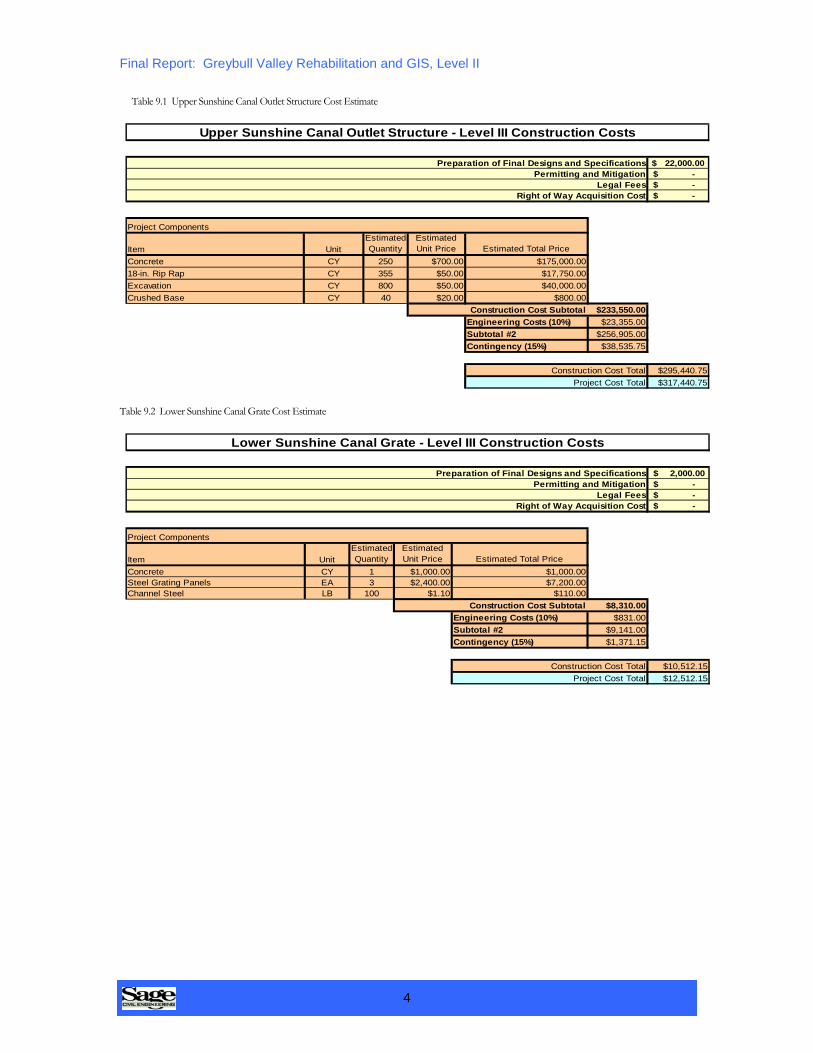
9 Conceptual Designs and Cost Estimates The GVID has several projects in progress. Previous studies have dealt with the Upper Sunshine Diversion and hydropower generation at several sites. The projects are either in Level III, or about to enter their Level III, phases. Designs were prepared for the two structures listed above. Estimates were also prepared for the flow monitoring stations and the costs to retrofit automation to the Upper and Lower Sunshine Reservoir Canal Outlets. The cost estimates for these projects are summarized below.
In addition to the cost estimates for construction, the savings due to lower O&M Costs was estimated for the automation and the current Upper Sunshine Diversion Project (currently in design as a Level III).
Final Report: Greybull Valley Rehabilitation and GIS, Level II
4
Table 9.1 Upper Sunshine Canal Outlet Structure Cost Estimate
22,000.00$ -$ -$ -$
Project Components
Item UnitEstimated Quantity
Estimated Unit Price Estimated Total Price
Concrete CY 250 $700.00 $175,000.0018-in. Rip Rap CY 355 $50.00 $17,750.00Excavation CY 800 $50.00 $40,000.00Crushed Base CY 40 $20.00 $800.00
Construction Cost Subtotal $233,550.00Engineering Costs (10%) $23,355.00Subtotal #2 $256,905.00Contingency (15%) $38,535.75
$295,440.75$317,440.75Project Cost Total
Upper Sunshine Canal Outlet Structure - Level III Construction Costs
Construction Cost Total
Preparation of Final Designs and SpecificationsPermitting and Mitigation
Legal FeesRight of Way Acquisition Cost
Table 9.2 Lower Sunshine Canal Grate Cost Estimate
2,000.00$ -$ -$ -$
Project Components
Item UnitEstimated Quantity
Estimated Unit Price Estimated Total Price
Concrete CY 1 $1,000.00 $1,000.00Steel Grating Panels EA 3 $2,400.00 $7,200.00Channel Steel LB 100 $1.10 $110.00
Construction Cost Subtotal $8,310.00Engineering Costs (10%) $831.00Subtotal #2 $9,141.00Contingency (15%) $1,371.15
$10,512.15$12,512.15Project Cost Total
Lower Sunshine Canal Grate - Level III Construction Costs
Construction Cost Total
Preparation of Final Designs and SpecificationsPermitting and Mitigation
Legal FeesRight of Way Acquisition Cost

Final Report: Greybull Valley Rehabilitation and GIS, Level II
5
Table 9.3 Summary Flow Monitoring Cost Estimates
Description Type of Measurement
Preparation of Final Designs and
SpecificationsPermitting and
Mitigation Legal FeesRight of Way
Acquisition CostConstruction Cost Subtotal
Engineering Costs10%
Construction Cost Subtotal
2Contingency
15%Construction
Cost Total
Project Component Cost Total
Base Station Base Station/Computer/SCADA $ 800.00 $ - $ - $ 69,000.00 $ 6,900.00 $ 75,900.00 $ 11,385.00 $ 87,285.00 $ 88,085.00 Repeater Repeater Station $ 800.00 $ 1,000.00 $ - $ 12,150.00 $ 1,215.00 $ 13,365.00 $ 2,004.75 $ 15,369.75 $ 17,169.75
Repeater Repeater Station $ 800.00 $ 1,000.00 $ - $ 12,150.00 $ 1,215.00 $ 13,365.00 $ 2,004.75 $ 15,369.75 $ 17,169.75
USGS Station 06276500 Natural $ - $ - $ - $ - $ - $ - $ - $ - $ -
TL Ditch 2 ft Parshall $ 800.00 $ - $ 1,000.00 $ 2,155.79 $ 8,850.00 $ 885.00 $ 9,735.00 $ 1,460.25 $ 11,195.25 $ 15,151.04
Spring Creek Natural $ - $ - $ - $ - $ - $ - $ - $ - $ -
Dotterer Ditch 18 inch Parshall $ 800.00 $ - $ 1,000.00 $ 2,370.86 $ 8,850.00 $ 885.00 $ 9,735.00 $ 1,460.25 $ 11,195.25 $ 15,366.11
Meeteetse Creek Natural $ 800.00 $ - $ 1,000.00 $ 1,390.00 $ 14,850.00 $ 1,485.00 $ 16,335.00 $ 2,450.25 $ 18,785.25 $ 21,975.25
Wyoming Ditch 18 inch Parshall $ 800.00 $ - $ 1,000.00 $ 2,508.18 $ 8,850.00 $ 885.00 $ 9,735.00 $ 1,460.25 $ 11,195.25 $ 15,503.43
Winkle Benbrooke Ditch 18 inch Parshall $ 800.00 $ - $ 1,000.00 $ 1,390.00 $ 8,850.00 $ 885.00 $ 9,735.00 $ 1,460.25 $ 11,195.25 $ 14,385.25
Dyer Ditch 3 ft Parshall $ 800.00 $ - $ 1,000.00 $ 1,390.00 $ 8,850.00 $ 885.00 $ 9,735.00 $ 1,460.25 $ 11,195.25 $ 14,385.25 Long Hollow Natural $ - $ - $ - $ - $ - $ - $ - $ - $ -
Cottonw ood Creek Natural $ - $ - $ - $ - $ - $ - $ - $ - $ -
Cheeseman Ditch 3 ft Parshall $ 800.00 $ - $ 1,000.00 $ 4,182.53 $ 8,850.00 $ 885.00 $ 9,735.00 $ 1,460.25 $ 11,195.25 $ 17,177.78
Dodge Ditch 3 ft Parshall $ 800.00 $ - $ 1,000.00 $ 1,390.00 $ 8,850.00 $ 885.00 $ 9,735.00 $ 1,460.25 $ 11,195.25 $ 14,385.25
Arnold Ditch 4 ft Parshall $ 800.00 $ - $ 1,000.00 $ 2,077.67 $ 8,850.00 $ 885.00 $ 9,735.00 $ 1,460.25 $ 11,195.25 $ 15,072.92
Boone Ditch 2 ft Parshall $ 800.00 $ - $ 1,000.00 $ 2,343.47 $ 8,850.00 $ 885.00 $ 9,735.00 $ 1,460.25 $ 11,195.25 $ 15,338.72 Roach Gulch Supply Ramp Flume $ 800.00 $ - $ - $ 8,850.00 $ 885.00 $ 9,735.00 $ 1,460.25 $ 11,195.25 $ 11,995.25
Roach Gulch Diversion Radial Gate/Ramp Flume $ 800.00 $ - $ - $ 8,850.00 $ 885.00 $ 9,735.00 $ 1,460.25 $ 11,195.25 $ 11,995.25
Keystone Ditch 4 ft Parshall $ 800.00 $ - $ 1,000.00 $ 1,945.09 $ 8,850.00 $ 885.00 $ 9,735.00 $ 1,460.25 $ 11,195.25 $ 14,940.34
Jimmerfield Ditch 4 ft Parshall $ 800.00 $ - $ 1,000.00 $ 1,390.00 $ 8,850.00 $ 885.00 $ 9,735.00 $ 1,460.25 $ 11,195.25 $ 14,385.25
Old Smith Ditch 18 inch Parshall $ 800.00 $ - $ 1,000.00 $ 2,078.50 $ 8,850.00 $ 885.00 $ 9,735.00 $ 1,460.25 $ 11,195.25 $ 15,073.75
Avent Ditch 3 ft Parshall $ 800.00 $ - $ 1,000.00 $ 2,094.53 $ 8,850.00 $ 885.00 $ 9,735.00 $ 1,460.25 $ 11,195.25 $ 15,089.78
Bench Canal 20 ft Parshall $ 800.00 $ - $ 1,000.00 $ 1,390.00 $ 8,850.00 $ 885.00 $ 9,735.00 $ 1,460.25 $ 11,195.25 $ 14,385.25
Farmers Canal 20 ft Parshall $ 800.00 $ - $ 1,000.00 $ 1,390.00 $ 8,850.00 $ 885.00 $ 9,735.00 $ 1,460.25 $ 11,195.25 $ 14,385.25
German Ditch 3 ft Parshall 800.00$ -$ 1,000.00$ 1,390.00$ 8,850.00$ 885.00$ 9,735.00$ 1,460.25$ 11,195.25$ 14,385.25$
St. Joe Ditch 7 ft Rectangular w eir 800.00$ -$ 1,000.00$ 1,390.00$ 8,850.00$ 885.00$ 9,735.00$ 1,460.25$ 11,195.25$ 14,385.25$ Erickson Ditch 2 ft Parshall 800.00$ -$ 1,000.00$ 1,390.00$ 8,850.00$ 885.00$ 9,735.00$ 1,460.25$ 11,195.25$ 14,385.25$ Greybull River at Road 8 5 ft Parshall $ 800.00 $ - $ 1,000.00 $ - $ 14,850.00 $ 1,485.00 $ 16,335.00 $ 2,450.25 $ 18,785.25 $ 20,585.25
Brow n Ditch 5 ft Parshall 800.00$ -$ 1,000.00$ 2,622.85$ 8,850.00$ 885.00$ 9,735.00$ 1,460.25$ 11,195.25$ 15,618.10$
Fairview Canal 8 ft Parshall $ 800.00 $ - $ 1,000.00 $ 4,054.97 $ 8,850.00 $ 885.00 $ 9,735.00 $ 1,460.25 $ 11,195.25 $ 17,050.22
Wood and Burnett Ditch 3 ft Parshall $ 800.00 $ - $ 1,000.00 $ 2,344.75 $ 8,850.00 $ 885.00 $ 9,735.00 $ 1,460.25 $ 11,195.25 $ 15,340.00 Sandstone Ditch 6 ft Parshall $ 800.00 $ - $ 1,000.00 $ 1,390.00 $ 8,850.00 $ 885.00 $ 9,735.00 $ 1,460.25 $ 11,195.25 $ 14,385.25
Greybull River at Road 16 Natural $ 800.00 $ - $ 1,000.00 $ 1,390.00 $ 14,850.00 $ 1,485.00 $ 16,335.00 $ 2,450.25 $ 18,785.25 $ 21,975.25 Subtotal $ 24,000.00 $ 2,000.00 $ 25,000.00 $ 47,459.20 $ 350,250.00 $ 35,025.00 $ 385,275.00 $ 57,791.25 $ 443,066.25 $ 541,525.45
Summary of Flow Monitoring Cost Estimates
Rea
ch 3
Rea
ch 2
Rea
ch 1
Design Costs Construction Costs

Final Report: Greybull Valley Rehabilitation and GIS, Level II
6
Table 9.4 Upper, Lower Outlet Control Cost Estimates
20,000.00$
-$ -$ -$
Project Components
Item UnitEstimated Quantity
Estimated Unit Price Estimated Total Price
Upper Sunshine ReservoirPressure Transducer EA 1 $1,100.00 $1,100.00SRTU EA 1 $15,000.00 $15,000.00Mounting Pole EA 1 $350.00 $350.00Radio/Antenna EA 1 $2,500.00 $2,500.00Trench Excavation, Backfill and Conduit - Antenna ft 300 $20.00 $6,000.00Installation EA 1 $5,000.00 $5,000.00Lower Sunshine ReservoirValve Actuator - Lower EA 1 $8,500.00 $8,500.00Valve Actuator - Lower EA 1 $9,500.00 $9,500.00Pressure Transducer EA 2 $1,100.00 $2,200.00SRTU EA 1 $15,000.00 $15,000.00Mounting Pole EA 1 $350.00 $350.00Radio/Antenna EA 1 $2,500.00 $2,500.00Trench Excavation, Backfill and Conduit - Antenna ft 300 $20.00 $6,000.00Installation EA 1 $2,500.00 $2,500.00
Construction Cost Subtotal $76,500.00Engineering Costs (10%) $7,650.00Subtotal #2 $84,150.00Contingency (15%) $12,622.50
$96,772.50$116,772.50
Upper, Lower Outlet Control - Level III
Construction Cost TotalProject Cost Total
Preparation of Final Designs and Specifications
Permitting and MitigationLegal Fees
Right of Way Acquisition Cost
Table 9.5 Cost Savings of Automation
Table 9.6 Cost Savings of Upper Sunshine Diversion Rehabilitation
3 hrs/day 18.00$ Hour 54.00$ 9,882.00$ 100 miles/day 0.55$ Mile 55.00$ 10,065.00$
Totals 109.00$ 19,947.00$
Cost Savings of AutomationOperation - May through October
(183 days)Cost per
dayUnitCost per
UnitSavings
Assumptions
16 hrs/day 18.00$ Hour 288.00$ 6,048.00$ 8 hrs/day 27.00$ Hour 216.00$ 4,536.00$ 6 hrs/day - Loader Time 120.00$ Hour 720.00$ 15,120.00$
1,890CY Assumed 2,520 CY Stockpiled/year and 50% is given away and hauled by others, leaving 1,260 CY to be removed by the District.
1.50$ CY N/A 2,835.00$
Totals 1,224.00$ 28,539.00$
Cost Savings of Upper Sunshine Diversion Rehabilitation
Savings AssumptionsCost per
Unit Unit Cost per day
Runoff Duration - Average 21 Days/year

Final Report: Greybull Valley Rehabilitation and GIS, Level II
7
Financing
Several options exist for financing. Two of these methods were evaluated to bracket the available options. These options are briefly summarized below:
• WWDC Loan
• Private Financing – Tax Exempt Status
• Private Financing – Non-tax Exempt
• Clean Renewable Energy Bonds
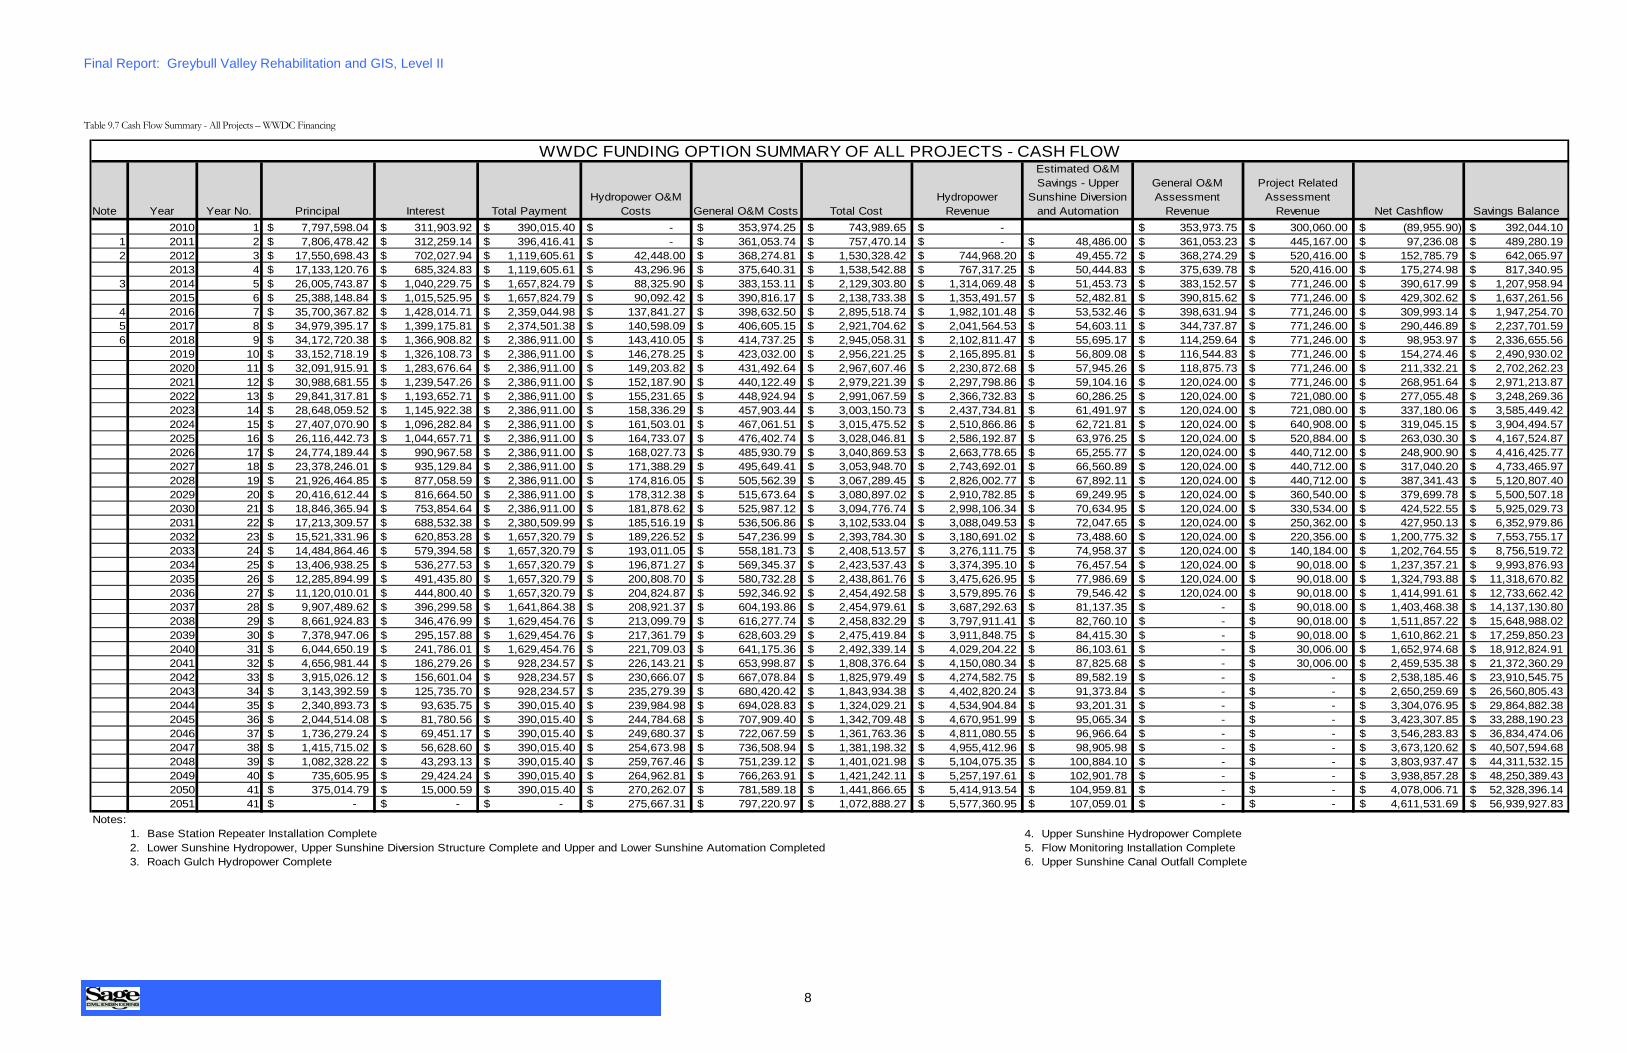
Two of these methods were investigated in the report. The first was the WWDC loan. A summary of this method is shown in Table 9.7 Cash Flow Summary - All Projects – WWDC Financing below. The second method for which payment calculations were completed was the Private Financing – Non-tax Exempt shown in Table 9.8 Cash Flow Summary – All Projects Private Financing. These two methods were chosen because they represented a reasonable financing assumption (WWDC method) and the most costly financing option (Private Financing Non-tax Exempt). The remaining options were either similar to or less expensive than these two methods. The primary difference between the two is the interest rate. GVID apportions all expenses individually to the three reservoirs. Separate tabulations for each reservoir’s share of the projects is contained in the reports.
A rate of 4% was used for the WWDC method. A variable rate starting at 6.5% was used for the Private Financing method. From an overall GVID perspective, the projects become profitable in 2032. Prior to that time, the hydropower revenue is funding a larger and larger portion of the debt service, not only from the hydropower generation projects themselves, but also the other improvement projects, such as the Upper Sunshine Diversion and Flow Monitoring projects. It just takes until 2032 to begin generating revenue in excess of the debt service and O&M expenses.
Final Report: Greybull Valley Rehabilitation and GIS, Level II
8
Table 9.7 Cash Flow Summary - All Projects – WWDC Financing
Note Year Year No. Principal Interest Total PaymentHydropower O&M
Costs General O&M Costs Total CostHydropower
Revenue
Estimated O&M Savings - Upper
Sunshine Diversion and Automation
General O&MAssessment
Revenue
Project RelatedAssessment
Revenue Net Cashflow Savings Balance2010 1 7,797,598.04$ 311,903.92$ 390,015.40$ -$ 353,974.25$ 743,989.65$ -$ 353,973.75$ 300,060.00$ (89,955.90)$ 392,044.10$
1 2011 2 7,806,478.42$ 312,259.14$ 396,416.41$ -$ 361,053.74$ 757,470.14$ -$ 48,486.00$ 361,053.23$ 445,167.00$ 97,236.08$ 489,280.19$ 2 2012 3 17,550,698.43$ 702,027.94$ 1,119,605.61$ 42,448.00$ 368,274.81$ 1,530,328.42$ 744,968.20$ 49,455.72$ 368,274.29$ 520,416.00$ 152,785.79$ 642,065.97$
2013 4 17,133,120.76$ 685,324.83$ 1,119,605.61$ 43,296.96$ 375,640.31$ 1,538,542.88$ 767,317.25$ 50,444.83$ 375,639.78$ 520,416.00$ 175,274.98$ 817,340.95$ 3 2014 5 26,005,743.87$ 1,040,229.75$ 1,657,824.79$ 88,325.90$ 383,153.11$ 2,129,303.80$ 1,314,069.48$ 51,453.73$ 383,152.57$ 771,246.00$ 390,617.99$ 1,207,958.94$
2015 6 25,388,148.84$ 1,015,525.95$ 1,657,824.79$ 90,092.42$ 390,816.17$ 2,138,733.38$ 1,353,491.57$ 52,482.81$ 390,815.62$ 771,246.00$ 429,302.62$ 1,637,261.56$ 4 2016 7 35,700,367.82$ 1,428,014.71$ 2,359,044.98$ 137,841.27$ 398,632.50$ 2,895,518.74$ 1,982,101.48$ 53,532.46$ 398,631.94$ 771,246.00$ 309,993.14$ 1,947,254.70$ 5 2017 8 34,979,395.17$ 1,399,175.81$ 2,374,501.38$ 140,598.09$ 406,605.15$ 2,921,704.62$ 2,041,564.53$ 54,603.11$ 344,737.87$ 771,246.00$ 290,446.89$ 2,237,701.59$ 6 2018 9 34,172,720.38$ 1,366,908.82$ 2,386,911.00$ 143,410.05$ 414,737.25$ 2,945,058.31$ 2,102,811.47$ 55,695.17$ 114,259.64$ 771,246.00$ 98,953.97$ 2,336,655.56$
2019 10 33,152,718.19$ 1,326,108.73$ 2,386,911.00$ 146,278.25$ 423,032.00$ 2,956,221.25$ 2,165,895.81$ 56,809.08$ 116,544.83$ 771,246.00$ 154,274.46$ 2,490,930.02$ 2020 11 32,091,915.91$ 1,283,676.64$ 2,386,911.00$ 149,203.82$ 431,492.64$ 2,967,607.46$ 2,230,872.68$ 57,945.26$ 118,875.73$ 771,246.00$ 211,332.21$ 2,702,262.23$ 2021 12 30,988,681.55$ 1,239,547.26$ 2,386,911.00$ 152,187.90$ 440,122.49$ 2,979,221.39$ 2,297,798.86$ 59,104.16$ 120,024.00$ 771,246.00$ 268,951.64$ 2,971,213.87$ 2022 13 29,841,317.81$ 1,193,652.71$ 2,386,911.00$ 155,231.65$ 448,924.94$ 2,991,067.59$ 2,366,732.83$ 60,286.25$ 120,024.00$ 721,080.00$ 277,055.48$ 3,248,269.36$ 2023 14 28,648,059.52$ 1,145,922.38$ 2,386,911.00$ 158,336.29$ 457,903.44$ 3,003,150.73$ 2,437,734.81$ 61,491.97$ 120,024.00$ 721,080.00$ 337,180.06$ 3,585,449.42$ 2024 15 27,407,070.90$ 1,096,282.84$ 2,386,911.00$ 161,503.01$ 467,061.51$ 3,015,475.52$ 2,510,866.86$ 62,721.81$ 120,024.00$ 640,908.00$ 319,045.15$ 3,904,494.57$ 2025 16 26,116,442.73$ 1,044,657.71$ 2,386,911.00$ 164,733.07$ 476,402.74$ 3,028,046.81$ 2,586,192.87$ 63,976.25$ 120,024.00$ 520,884.00$ 263,030.30$ 4,167,524.87$ 2026 17 24,774,189.44$ 990,967.58$ 2,386,911.00$ 168,027.73$ 485,930.79$ 3,040,869.53$ 2,663,778.65$ 65,255.77$ 120,024.00$ 440,712.00$ 248,900.90$ 4,416,425.77$ 2027 18 23,378,246.01$ 935,129.84$ 2,386,911.00$ 171,388.29$ 495,649.41$ 3,053,948.70$ 2,743,692.01$ 66,560.89$ 120,024.00$ 440,712.00$ 317,040.20$ 4,733,465.97$ 2028 19 21,926,464.85$ 877,058.59$ 2,386,911.00$ 174,816.05$ 505,562.39$ 3,067,289.45$ 2,826,002.77$ 67,892.11$ 120,024.00$ 440,712.00$ 387,341.43$ 5,120,807.40$ 2029 20 20,416,612.44$ 816,664.50$ 2,386,911.00$ 178,312.38$ 515,673.64$ 3,080,897.02$ 2,910,782.85$ 69,249.95$ 120,024.00$ 360,540.00$ 379,699.78$ 5,500,507.18$ 2030 21 18,846,365.94$ 753,854.64$ 2,386,911.00$ 181,878.62$ 525,987.12$ 3,094,776.74$ 2,998,106.34$ 70,634.95$ 120,024.00$ 330,534.00$ 424,522.55$ 5,925,029.73$ 2031 22 17,213,309.57$ 688,532.38$ 2,380,509.99$ 185,516.19$ 536,506.86$ 3,102,533.04$ 3,088,049.53$ 72,047.65$ 120,024.00$ 250,362.00$ 427,950.13$ 6,352,979.86$ 2032 23 15,521,331.96$ 620,853.28$ 1,657,320.79$ 189,226.52$ 547,236.99$ 2,393,784.30$ 3,180,691.02$ 73,488.60$ 120,024.00$ 220,356.00$ 1,200,775.32$ 7,553,755.17$ 2033 24 14,484,864.46$ 579,394.58$ 1,657,320.79$ 193,011.05$ 558,181.73$ 2,408,513.57$ 3,276,111.75$ 74,958.37$ 120,024.00$ 140,184.00$ 1,202,764.55$ 8,756,519.72$ 2034 25 13,406,938.25$ 536,277.53$ 1,657,320.79$ 196,871.27$ 569,345.37$ 2,423,537.43$ 3,374,395.10$ 76,457.54$ 120,024.00$ 90,018.00$ 1,237,357.21$ 9,993,876.93$ 2035 26 12,285,894.99$ 491,435.80$ 1,657,320.79$ 200,808.70$ 580,732.28$ 2,438,861.76$ 3,475,626.95$ 77,986.69$ 120,024.00$ 90,018.00$ 1,324,793.88$ 11,318,670.82$ 2036 27 11,120,010.01$ 444,800.40$ 1,657,320.79$ 204,824.87$ 592,346.92$ 2,454,492.58$ 3,579,895.76$ 79,546.42$ 120,024.00$ 90,018.00$ 1,414,991.61$ 12,733,662.42$ 2037 28 9,907,489.62$ 396,299.58$ 1,641,864.38$ 208,921.37$ 604,193.86$ 2,454,979.61$ 3,687,292.63$ 81,137.35$ -$ 90,018.00$ 1,403,468.38$ 14,137,130.80$ 2038 29 8,661,924.83$ 346,476.99$ 1,629,454.76$ 213,099.79$ 616,277.74$ 2,458,832.29$ 3,797,911.41$ 82,760.10$ -$ 90,018.00$ 1,511,857.22$ 15,648,988.02$ 2039 30 7,378,947.06$ 295,157.88$ 1,629,454.76$ 217,361.79$ 628,603.29$ 2,475,419.84$ 3,911,848.75$ 84,415.30$ -$ 90,018.00$ 1,610,862.21$ 17,259,850.23$ 2040 31 6,044,650.19$ 241,786.01$ 1,629,454.76$ 221,709.03$ 641,175.36$ 2,492,339.14$ 4,029,204.22$ 86,103.61$ -$ 30,006.00$ 1,652,974.68$ 18,912,824.91$ 2041 32 4,656,981.44$ 186,279.26$ 928,234.57$ 226,143.21$ 653,998.87$ 1,808,376.64$ 4,150,080.34$ 87,825.68$ -$ 30,006.00$ 2,459,535.38$ 21,372,360.29$ 2042 33 3,915,026.12$ 156,601.04$ 928,234.57$ 230,666.07$ 667,078.84$ 1,825,979.49$ 4,274,582.75$ 89,582.19$ -$ -$ 2,538,185.46$ 23,910,545.75$ 2043 34 3,143,392.59$ 125,735.70$ 928,234.57$ 235,279.39$ 680,420.42$ 1,843,934.38$ 4,402,820.24$ 91,373.84$ -$ -$ 2,650,259.69$ 26,560,805.43$ 2044 35 2,340,893.73$ 93,635.75$ 390,015.40$ 239,984.98$ 694,028.83$ 1,324,029.21$ 4,534,904.84$ 93,201.31$ -$ -$ 3,304,076.95$ 29,864,882.38$ 2045 36 2,044,514.08$ 81,780.56$ 390,015.40$ 244,784.68$ 707,909.40$ 1,342,709.48$ 4,670,951.99$ 95,065.34$ -$ -$ 3,423,307.85$ 33,288,190.23$ 2046 37 1,736,279.24$ 69,451.17$ 390,015.40$ 249,680.37$ 722,067.59$ 1,361,763.36$ 4,811,080.55$ 96,966.64$ -$ -$ 3,546,283.83$ 36,834,474.06$ 2047 38 1,415,715.02$ 56,628.60$ 390,015.40$ 254,673.98$ 736,508.94$ 1,381,198.32$ 4,955,412.96$ 98,905.98$ -$ -$ 3,673,120.62$ 40,507,594.68$ 2048 39 1,082,328.22$ 43,293.13$ 390,015.40$ 259,767.46$ 751,239.12$ 1,401,021.98$ 5,104,075.35$ 100,884.10$ -$ -$ 3,803,937.47$ 44,311,532.15$ 2049 40 735,605.95$ 29,424.24$ 390,015.40$ 264,962.81$ 766,263.91$ 1,421,242.11$ 5,257,197.61$ 102,901.78$ -$ -$ 3,938,857.28$ 48,250,389.43$ 2050 41 375,014.79$ 15,000.59$ 390,015.40$ 270,262.07$ 781,589.18$ 1,441,866.65$ 5,414,913.54$ 104,959.81$ -$ -$ 4,078,006.71$ 52,328,396.14$ 2051 41 -$ -$ -$ 275,667.31$ 797,220.97$ 1,072,888.27$ 5,577,360.95$ 107,059.01$ -$ -$ 4,611,531.69$ 56,939,927.83$
Notes:1. Base Station Repeater Installation Complete 4. Upper Sunshine Hydropower Complete2. Lower Sunshine Hydropower, Upper Sunshine Diversion Structure Complete and Upper and Lower Sunshine Automation Completed 5. Flow Monitoring Installation Complete3. Roach Gulch Hydropower Complete 6. Upper Sunshine Canal Outfall Complete
WWDC FUNDING OPTION SUMMARY OF ALL PROJECTS - CASH FLOW

Final Report: Greybull Valley Rehabilitation and GIS, Level II
9
Table 9.8 Cash Flow Summary – All Projects Private Financing
Note Year Year No. Principal Interest Total PaymentHydropower O&M
Costs General O&M Costs Total CostHydropower
Revenue
Estimated O&M Savings - Upper
Sunshine Diversion and Automation
General O&MAssessment
Revenue
Project RelatedAssessment
Revenue Net Cashflow Savings Balance2010 1 7,797,598.04$ 311,903.92$ 390,015.40$ -$ 353,974.25$ 743,989.65$ -$ 353,973.75$ 480,096.00$ 90,080.10$ 572,080.10$
1 2011 2 7,806,478.42$ 312,259.14$ 396,416.41$ -$ 361,053.74$ 757,470.14$ -$ 48,486.00$ 361,053.23$ 772,074.00$ 424,143.08$ 996,223.19$ 2 2012 3 17,550,698.43$ 911,220.37$ 1,307,679.27$ 42,448.00$ 368,274.81$ 1,718,402.08$ 744,968.20$ 49,455.72$ 368,274.29$ 847,323.00$ 291,619.13$ 1,287,842.31$
2013 4 17,154,239.53$ 888,864.93$ 1,307,679.27$ 43,296.96$ 375,640.31$ 1,726,616.54$ 767,317.25$ 50,444.83$ 375,639.78$ 847,323.00$ 314,108.32$ 1,601,950.63$ 3 2014 5 26,042,329.09$ 1,470,141.73$ 2,128,518.59$ 88,325.90$ 383,153.11$ 2,599,997.60$ 1,314,069.48$ 51,453.73$ 383,152.57$ 1,211,283.00$ 359,961.19$ 1,961,911.82$
2015 6 25,383,952.22$ 1,431,040.24$ 2,128,518.59$ 90,092.42$ 390,816.17$ 2,609,427.18$ 1,353,491.57$ 52,482.81$ 390,815.62$ 1,208,070.00$ 395,432.82$ 2,357,344.64$ 4 2016 7 35,640,991.69$ 2,101,588.53$ 3,168,395.63$ 137,841.27$ 398,632.50$ 3,704,869.39$ 1,982,101.48$ 53,532.46$ 398,631.94$ 1,458,900.00$ 188,296.49$ 2,545,641.13$ 5 2017 8 34,784,242.22$ 2,305,951.95$ 3,183,852.04$ 140,598.09$ 406,605.15$ 3,731,055.27$ 2,041,564.53$ 54,603.11$ 406,604.58$ 1,458,900.00$ 230,616.94$ 2,776,258.07$ 6 2018 9 34,074,992.91$ 2,252,918.15$ 3,196,261.65$ 143,410.05$ 414,737.25$ 3,754,408.96$ 2,102,811.47$ 55,695.17$ 305,288.16$ 1,458,900.00$ 168,285.84$ 2,944,543.91$
2019 10 33,131,649.41$ 2,188,670.80$ 3,196,261.65$ 146,278.25$ 423,032.00$ 3,765,571.90$ 2,165,895.81$ 56,809.08$ 311,393.92$ 1,458,900.00$ 227,426.90$ 3,171,970.81$ 2020 11 32,124,058.56$ 2,119,865.04$ 3,196,261.65$ 149,203.82$ 431,492.64$ 3,776,958.11$ 2,230,872.68$ 57,945.26$ 269,375.11$ 1,458,900.00$ 240,134.95$ 3,412,105.75$ 2021 12 31,047,661.94$ 2,046,169.38$ 3,196,261.65$ 152,187.90$ 440,122.49$ 3,788,572.04$ 2,297,798.86$ 59,104.16$ 271,752.63$ 1,338,876.00$ 178,959.62$ 3,591,065.37$ 2022 13 29,897,569.67$ 2,187,606.52$ 3,196,261.65$ 155,231.65$ 448,924.94$ 3,800,418.25$ 2,366,732.83$ 60,286.25$ 148,761.54$ 1,338,876.00$ 114,238.37$ 3,705,303.74$ 2023 14 28,888,914.54$ 2,111,652.64$ 3,196,261.65$ 158,336.29$ 457,903.44$ 3,812,501.38$ 2,437,734.81$ 61,491.97$ 126,151.87$ 1,202,112.00$ 14,989.28$ 3,720,293.02$ 2024 15 27,804,305.52$ 2,029,633.95$ 3,196,261.65$ 161,503.01$ 467,061.51$ 3,824,826.17$ 2,510,866.86$ 62,721.81$ 128,674.91$ 1,172,106.00$ 49,543.41$ 3,769,836.43$ 2025 16 26,637,677.82$ 1,941,050.60$ 3,196,261.65$ 164,733.07$ 476,402.74$ 3,837,397.46$ 2,586,192.87$ 63,976.25$ 131,248.41$ 1,142,100.00$ 86,120.06$ 3,855,956.48$ 2026 17 25,382,466.77$ 1,845,360.86$ 3,196,261.65$ 168,027.73$ 485,930.79$ 3,850,220.18$ 2,663,778.65$ 65,255.77$ 133,873.38$ 1,061,928.00$ 74,615.62$ 3,930,572.10$ 2027 18 24,031,565.98$ 1,915,469.85$ 3,196,261.65$ 171,388.29$ 495,649.41$ 3,863,299.35$ 2,743,692.01$ 66,560.89$ 136,550.84$ 1,061,928.00$ 145,432.39$ 4,076,004.50$ 2028 19 22,750,774.17$ 1,808,340.37$ 3,196,261.65$ 174,816.05$ 505,562.39$ 3,876,640.10$ 2,826,002.77$ 67,892.11$ 139,281.86$ 981,756.00$ 138,292.63$ 4,214,297.13$ 2029 20 21,362,852.89$ 1,691,615.42$ 3,196,261.65$ 178,312.38$ 515,673.64$ 3,890,247.67$ 2,910,782.85$ 69,249.95$ 142,067.50$ 951,750.00$ 183,602.63$ 4,397,899.76$ 2030 21 19,858,206.65$ 1,564,406.70$ 3,196,261.65$ 181,878.62$ 525,987.12$ 3,904,127.39$ 2,998,106.34$ 70,634.95$ 144,908.85$ 871,578.00$ 181,100.74$ 4,579,000.50$ 2031 22 18,226,351.70$ 1,425,742.47$ 3,189,860.64$ 185,516.19$ 536,506.86$ 3,911,883.69$ 3,088,049.53$ 72,047.65$ 147,807.02$ 871,578.00$ 267,598.51$ 4,846,599.00$ 2032 23 16,462,233.53$ 1,386,874.98$ 2,278,597.78$ 189,226.52$ 547,236.99$ 3,015,061.29$ 3,180,691.02$ 73,488.60$ 150,763.16$ 811,566.00$ 1,201,447.49$ 6,048,046.49$ 2033 24 15,570,510.73$ 1,306,739.99$ 2,278,597.78$ 193,011.05$ 558,181.73$ 3,029,790.56$ 3,276,111.75$ 74,958.37$ 153,778.43$ 761,400.00$ 1,236,457.98$ 7,284,504.47$ 2034 25 14,598,652.94$ 1,218,730.67$ 2,278,597.78$ 196,871.27$ 569,345.37$ 3,044,814.42$ 3,374,395.10$ 76,457.54$ 156,854.00$ 681,228.00$ 1,244,120.22$ 8,528,624.69$ 2035 26 13,538,785.83$ 1,122,041.80$ 2,278,597.78$ 200,808.70$ 580,732.28$ 3,060,138.75$ 3,475,626.95$ 77,986.69$ 159,991.08$ 601,056.00$ 1,254,521.97$ 9,783,146.66$ 2036 27 12,382,229.86$ 1,015,784.49$ 2,278,597.78$ 204,824.87$ 592,346.92$ 3,075,769.57$ 3,579,895.76$ 79,546.42$ 163,190.90$ 520,884.00$ 1,267,747.51$ 11,050,894.17$ 2037 28 11,119,416.57$ 968,854.44$ 2,263,141.37$ 208,921.37$ 604,193.86$ 3,076,256.60$ 3,687,292.63$ 81,137.35$ 166,454.72$ 440,712.00$ 1,299,340.10$ 12,350,234.27$ 2038 29 9,825,129.64$ 837,798.18$ 2,250,731.75$ 213,099.79$ 616,277.74$ 3,080,109.28$ 3,797,911.41$ 82,760.10$ 169,783.81$ 440,712.00$ 1,411,058.04$ 13,761,292.31$ 2039 30 8,412,196.07$ 692,878.30$ 2,250,731.75$ 217,361.79$ 628,603.29$ 3,096,696.83$ 3,911,848.75$ 84,415.30$ 173,179.49$ 380,700.00$ 1,453,446.71$ 15,214,739.01$ 2040 31 6,854,342.62$ 531,995.34$ 2,250,731.75$ 221,709.03$ 641,175.36$ 3,113,616.14$ 4,029,204.22$ 86,103.61$ 176,643.08$ 300,528.00$ 1,478,862.76$ 16,693,601.78$ 2041 32 5,135,606.21$ 353,341.65$ 1,210,854.71$ 226,143.21$ 653,998.87$ 2,090,996.78$ 4,150,080.34$ 87,825.68$ 180,175.94$ 120,024.00$ 2,447,109.18$ 19,140,710.95$ 2042 33 4,278,093.14$ 288,270.67$ 1,210,854.71$ 230,666.07$ 667,078.84$ 2,108,599.62$ 4,274,582.75$ 89,582.19$ 183,779.46$ 90,018.00$ 2,529,362.78$ 21,670,073.73$ 2043 34 3,355,509.10$ 196,239.33$ 1,210,854.71$ 235,279.39$ 680,420.42$ 2,126,554.52$ 4,402,820.24$ 91,373.84$ 187,455.05$ 90,018.00$ 2,645,112.59$ 24,315,186.32$ 2044 35 2,340,893.73$ 93,635.75$ 390,015.40$ 239,984.98$ 694,028.83$ 1,324,029.21$ 4,534,904.84$ 93,201.31$ -$ -$ 3,304,076.95$ 27,619,263.27$ 2045 36 2,044,514.08$ 81,780.56$ 390,015.40$ 244,784.68$ 707,909.40$ 1,342,709.48$ 4,670,951.99$ 95,065.34$ -$ -$ 3,423,307.85$ 31,042,571.12$ 2046 37 1,736,279.24$ 69,451.17$ 390,015.40$ 249,680.37$ 722,067.59$ 1,361,763.36$ 4,811,080.55$ 96,966.64$ -$ -$ 3,546,283.83$ 34,588,854.95$ 2047 38 1,415,715.02$ 56,628.60$ 390,015.40$ 254,673.98$ 736,508.94$ 1,381,198.32$ 4,955,412.96$ 98,905.98$ -$ -$ 3,673,120.62$ 38,261,975.57$ 2048 39 1,082,328.22$ 43,293.13$ 390,015.40$ 259,767.46$ 751,239.12$ 1,401,021.98$ 5,104,075.35$ 100,884.10$ -$ -$ 3,803,937.47$ 42,065,913.04$ 2049 40 735,605.95$ 29,424.24$ 390,015.40$ 264,962.81$ 766,263.91$ 1,421,242.11$ 5,257,197.61$ 102,901.78$ -$ -$ 3,938,857.28$ 46,004,770.32$ 2050 41 375,014.79$ 15,000.59$ 390,015.40$ 270,262.07$ 781,589.18$ 1,441,866.65$ 5,414,913.54$ 104,959.81$ -$ -$ 4,078,006.71$ 50,082,777.03$ 2051 41 -$ -$ -$ 275,667.31$ 797,220.97$ 1,072,888.27$ 5,577,360.95$ 107,059.01$ -$ -$ 4,611,531.69$ 54,694,308.72$
Notes:1. Base Station Repeater Installation Complete 4. Upper Sunshine Hydropower Complete2. Lower Sunshine Hydropower, Upper Sunshine Diversion Structure Complete and Upper and Lower Sunshine Automation Completed 5. Flow Monitoring Installation Complete3. Roach Gulch Hydropower Complete 6. Upper Sunshine Canal Outfall Complete
PRIVATE FINANCING OPTION - SUMMARY OF ALL PROJECTS - CASH FLOW
Final Report: Greybull Valley Rehabilitation and GIS, Level II
10
10 Summary The GVID Rehabilitation and GIS, Level II Study resulted in a combination of products and conclusions for consideration by the District and the WWDC.
• A Geographic Information System (GIS) consisting of two distinct parts was created for use by the District. These parts were: Storage and Delivery System mapping and Water Share mapping.
• The GIS includes a variety of base mapping, such as USGS Quadrangles, aerial photography from various years obtained by SCE, or other maps provided by the District and geo-referenced by SCE.
• An interface tool was provided to facilitate use of the GIS.
• Map Books were provided for use by the District.
• A flow monitoring plan suitable for determining conveyance losses was proposed. Several irrigation seasons of data will be necessary to calculate the conveyance loss.
• Conceptual designs and cost estimates were prepared for each project reviewed as part of this study.
• The replacement/rehabilitation of structures was prioritized based on their relative condition.
• The District’s budgets and project list were reviewed and summarized.
The District’s ongoing hydropower and rehabilitation projects are feasible. It is anticipated that within a few years the projects will become self sufficient and energy revenues will become large enough to service the debt on all of the proposed projects, fund O&M budgets and provide excess income to the District for future projects.