Embed Size (px)
Citation preview
Third Sector Trends in North West England
1
Third Sector Trends in the North West 2016
Tony Chapman St Chad’s College, Durham University August 2017
Third Sector Trends in North West England
2
Front and back covers: Reflections (Blackpool), Photo credit: DrewRawcliffe via iStock
Third Sector Trends Study
The Third Sector Trends study was conceived and originally commissioned by Northern Rock Foundation with research conducted by the Universities of Southampton, Teesside and Durham. The Community Foundation Tyne & Wear and Northumberland was a co-funder of the research and is now responsible for its legacy. The Community Foundation is now collaborating with partners including St Chad’s College at the University of Durham, Joseph Rowntree Foundation and IPPR North to expand and continue the research.
Future of Civil Society in the North
This report is part of a three-year programme of work by IPPR North on the state of civil society and the voluntary sector in the North of England.
Published by Policy & Practice St Chad’s College Durham University 18 North Bailey Durham DH1 3RH
August 2017
Third Sector Trends in North West England
3
Contents Acknowledgements 4
1 Introduction and key findings 5
2 The Third Sector Trends Study 11
3 Employment in the Third Sector 18
4 Volunteers in the Third Sector 20
5 Spatial area of operation of Third Sector organisations 24
6 Purpose and beneficiaries of Third Sector organisations 27
7 Income of Third Sector organisations 32
8 Organisational assets and use of reserves 41
9 Factors affecting Third Sector organisations financial wellbeing 46
10 Delivery of public services by contract 54
11 Routes to grant funding 59
12 Relationships within and between sectors 64
13 Expectations of and preparation for the future 75
14 Conclusions: implications of continuity and change 85
Appendix 1: Publications from the Third Sector Trends study 92
Third Sector Trends in North West England
4
i Acknowledgements IPPR North and Garfield Weston commissioned this study in the North West of England and I would like to thank, Ed Cox and Jack Hunter for their advice and support throughout the project.
In 2016, the study also ran in North East England (funded by Community Foundation Tyne & Wear and Northumberland) and Yorkshire and the Humber (funded by Joseph Rowntree Foundation).
These studies were undertaken in parallel and therefore I also extend my thanks to all funders for making that work possible and for allowing me to use statistics from across the North of England in this report.
Many organisations have helped to promote the study in both the public sector and the third sector. Several local councils, health authorities and the Big Lottery Fund helped to promote the study by sending details to their lists of contacts. Support was also given by the regional and sub-regional infrastructure bodies and community foundations, together with most local Councils for Voluntary Services and Rural Community Councils.
I am immensely grateful to the many people in Third Sector organisations who have contributed to this study by completing our questionnaires. I hope that our findings will be useful for them and for the whole sector.
Stephanie Rich, Research Associate at St Chad’s College, provided support in garnering the large sample of respondents by contacting organisations and individuals for the duration of the fieldwork and assisted with the recoding of free text answers on the survey questionnaires.
I also acknowledge the role of my fellow research colleagues: Professor Fred Robinson at St Chad’s College and Dr Victoria Bell and Dr Peter van der Graaf at Teesside University who were heavily involved in undertaking fieldwork and preliminary analysis in the Third Sector Trends studies from 2008 to 2014 and upon which the current research was built.
Third Sector Trends in North West England
5
1 Introduction and key findings
This report provides a digest of findings from the Third Sector Trends study. The report focuses on the situation in North West England and provides headline statistics for each of its five sub-regions: Greater Manchester, Merseyside, Cheshire, Lancashire and Cumbria.
This report sits alongside similar statistical digests produced for North East England and Yorkshire and the Humber. The three regional studies collectively cover the whole of the North of England using the same research methodology, so there is scope for more in-depth analysis in the coming months.
This process began with the publication of a summary of key findings and their implications in March 2017.1 Future lines of analysis, drawing upon Third Sector Trends data, will include:
How the Third Sector is addressing issues surrounding poverty and social disadvantage in Northern England.
The role of business in supporting the work of the Third Sector in Northern England.
How local public sector organisations and grant-making charitable foundations can work together in complementary ways to support the work of the Third Sector in Northern England.
Making sense of ‘added value’ produced by the Third Sector through formal and informal intra-sector relationships in Northern England.
The role of infrastructure organisations in supporting the Third Sector (conducted by IPPR North).
This report produces a digest of headline findings for North West England and, as such, provides a broad overview of the structure and dynamics of the Third Sector. The principal statistical findings from this report on Third Sector in North West England are as follows:
Sector size and structure
It is estimated that in 2016 there were 110,000 FTE employees in North West England, 85,000 in Yorkshire and the Humber and 37,500 in North East England. Across the North there were 233,000 FTE employees.
Comparable data from North East England since 2010 strongly suggests that there has been a progressive shift from full-time to part-time employment – with the percentage of part-time staff rising from 35% to 45% over the last eight years. This is also likely to be the case in North West England.
The Third Sector workforce accounts for between 3-4% of regional employment.2
The economic value, by salaries, of employees is estimated across the North at £4.7bn. Regional estimates are as follows, North West £2.2bn, Yorkshire and the Humber £1.8bn and North East England £750m.3
1 See Chapman, T. and Hunter, J. (2017) Third Sector Trends in the North of England, Manchester: IPPR North:
http://www.ippr.org/files/publications/pdf/third-sector-trends-in-the-north-of-England_Mar2017.pdf?noredirect=1 The three regional digests will be available at this web address: http://www.communityfoundation.org.uk/third-sector-trends-study. 2 For details of regional employment and method of calculating the Third Sector contribution, see Appendix 1 3 Estimate range for third sector employees earning on average 80% of average weekly wages in each region using ONS 2016 estimates.
Third Sector Trends in North West England
6
In North West England, it is estimated that there are 440,400 volunteers who deliver 31,709,800 hours of work. The replacement value of such work by employees would be between £228m (at national minimum wage) and £385m (at 80% of average wages).
Volunteers’ journeys into the sector are shaped by local knowledge and relationships: 84% of TSOs state that most volunteers arrive by ‘word of mouth’ and only half of TSOs make a big effort to recruit volunteers by holding events or advertising. Only 21% of TSOs rely on other organisations, such as a CVS or volunteer bureau, to find volunteers for them.
The Third Sector in North West England is very much a ‘local’ sector: 30% of TSOs work solely at the neighbourhood or village level and 62% work within the boundaries of one local authority. Only 9% work at national or international level.
In North West England, the sector is dominated by small (6,306) and medium sized TSOs (4,425). There are only about 835 charities which have income above £500,000.
Income
In North West England, 68% of TSOs experienced income stability over the previous two years. Income stability is most clearly pronounced in the largely rural county of Cumbria (77%), but was also higher in Cheshire (71%) and Lancashire (69%).
About 15% of TSOs had significantly rising income in the last two years across North West England. Rising income was most common in Greater Manchester (19%) and Cheshire (16%).
Significantly falling income was most prevalent in Merseyside (30%) and very considerably higher than Cumbria (12%) and Cheshire (13%) and significantly higher than in Greater Manchester (17%) and Lancashire (17%).
64% of TSOs in North West England rely to some extent upon earned income (from trading or contracts). Fewer TSOs earn income in the more rural county of Cumbria (56%), in Merseyside, the highest percentage of TSOs earn income (73%).
The highest income earning areas is focused in Merseyside (where 35% of TSOs earned above 61% of their income).
Only 14% of all TSOs state that grants are of ‘no importance’ to them and a further 6% state that grants are the ‘least important’ source of income. The remaining 80% of TSOs clearly rely upon grants to sustain their activity and 39% state that grants are ‘a most important’ source of income.
For TSOs which earn no income from trading or contracts, grants are very important indeed: over 50% of such TSOs state that grants are ‘a most important’ or ’important’ source of income.
Even amongst TSOs which earn over 81% of their income, grants are still essential to them: 23% state that grants are ‘a most important’ source of income and a further 52% state that they are ‘important’ or of ‘some importance’.
Just 13% of TSOs which earn more than 81% of their income from trading or contracts state that grants are of ‘no importance’ to them.
Assets and reserves
The percentage of TSOs with property assets rises as organisations become larger in size: from 31% of smaller TSOs to 58% of the largest TSOs.
Only 6% of small TSOs have property valued at over £250,000 compared with 15% of medium sized TSOs and 37% of larger TSOs.
About 60% of TSOs in North West England have no investment assets. Those TSOs which do have assets rises from 30% of the smallest TSOs to 61% of the largest TSOs.
Third Sector Trends in North West England
7
Relatively few TSOs have investments above £50,000 (16%), although larger TSOs are much more likely to hold such levels of investment (43%) when compared with the smallest TSOs (5%).
Only 13% of TSOs in North West England have no current account reserves. Just 5% of the largest TSOs have no current account reserves compared with 18% of the smallest TSOs.
The level of reserves held is closely related to the size of organisation: 60% of the largest TSOs have current account reserves above £50,000 compared with 13% of medium sized TSOs and just 2% of the smallest TSOs.
it may be surprising to note that 15% of larger TSOs have none or fewer than £10,000 current account reserves. 45% of medium sized TSOs find themselves in this financially precarious situation.
About 47% of TSOs have not used their reserves over the last financial year; smaller TSOs were more likely not to have used reserves (56%) when compared with medium (40%) and larger TSOs (38%).
Relatively few TSOs (17%) have used reserves for development purposes (such as taking on a new member of staff, planning a new service, buying property or other fixed assets). Only 2% of TSOs have invested ‘heavily’ in such things.
Larger TSOs are much more likely to have invested in development (26%) when compared with the smallest (13%), but only 3% of the largest TSOs have invested heavily in development – which seems to be a very low percentage.
Organisational strength and vulnerability
TSOs in the poorest areas are twice as likely to be financially vulnerable (30%) when compared with the richest areas (14%).
The likelihood of TSOs being in a strong or very strong financial position is not affected by the relative affluence or wealth of areas across the North of England (30%).
TSOs which are funded mainly by the public sector are much more likely to be in a weaker position than those funded mainly by either the private or community sectors.
The situation in the North West of England appears to be the most severe with 33% of TSOs funded mainly by the public sector being in a weak position compared with 30% in Yorkshire and the Humber and 27% in North East England.
TSOs serving people from minority ethnic groups or of racial origins are the most likely to be in a weak financial position (33%), followed by TSOs tackling concerns about gender and sexuality (32%).
TSOs serving people in general (23%) and people in rural areas (21%) are the least likely to be in a vulnerable financial situation.
27% of TSOs have used their reserves for essential costs (such as wages, utility bills or rent) but only 6% have made ‘heavy’ use of their reserves in this way.
Medium sized TSOs were the most likely to have drawn on their reserves for essential costs (37%), and 11% drew heavily upon their reserves – suggesting that medium sized organisations are the most financially vulnerable.
TSOs in Merseyside were the most likely to have drawn on reserves for essential costs (31%) whereas in other areas the average was around 20%, except for Cumbria where only 12% of TSOs used reserves for essential costs.
Third Sector Trends in North West England
8
Contracts to deliver public services
Only a relatively small proportion of TSOs are currently delivering public sector contracts in Northern England (14%) while a further 5% are bidding to do such work.
The proportion of TSOs undertaking contracts is highest in Yorkshire and the Humber (18%) and to a lesser extent in North West England (14%) and North East England (11%).
Many TSOs are unaware of such opportunities (18%) but many more which are aware will not deliver public service contracts because it is not relevant to their objectives.
Many TSOs perceive barriers to the delivery of contracts – the percentage of TSOs which believe this to be the case is similar across regions with 5-6% stating that they need more information, 7-9% stating they would need support, and 8-11% perceiving barriers.
Medium sized TSOs tend to identify barriers to them getting involved in the delivery of contracts (37%) or state that this is contrary to their mission (28%); 23% bid for or are delivering contracts.
Larger TSOs are the most likely to be delivering or bidding for contracts (57%), but 19% of TSOs state that such work is contrary to their mission or that they perceive barriers to doing such work (20%).
Grant funding
63% of TSOs have made applications for a grant from local foundations in the last two years. Small TSOs were the least likely to have made an application (45%) while medium and larger sized TSOs were the most likely to have done so (78%).
Of those TSOs which have made applications to a local grant making foundation in the last two years, 85% were successful in winning at least one grant.
Levels of applications to national grant making foundations are generally lower (49%) than to local grant makers (55%). Smaller TSOs were the least likely to make such grant applications (32%) whilst the largest organisations were most likely to do so (73%).
Success rates for at least one application to national grant making foundations are considerably lower (72% compared with 85% for local grant making foundations). The success rates of smaller TSOs are 66% compared with 80% for the largest TSOs.
Having a good relationship with the funder is regarded as an important factor by most TSOs (68%); medium sized organisations were more likely to feel that this is important (73%).
The simplicity of the grant application process is much more important to small TSOs (68%) than for the largest organisations (33%).
Knowing that a grant funder makes a lot of awards in the area is an important consideration for 60% of TSOs, smaller (64%) and medium (58%) sized organisations tend to feel that this factor is of greater importance than the larger TSOs (53%).
Relatively few TSOs think it is important that a grant funder will allow them to work on their own when receiving grants rather than working with partners. Independent working seems to be of more importance to smaller TSOs (46%) than for the larger organisations (31%).
Smaller TSOs are also much more likely (48%) than larger TSOs (29%) to feel that the location of the grant funder in the region is important in their considerations.
Most small TSOs have useful informal relationships (73%) but not to the extent of medium (91%) and larger organisations (93%)
Third Sector Trends in North West England
9
Partnership and collaborative working
Smaller TSOs tend to be less inclined to working closely but informally with other TSOs (58%) when compared with medium (84%) or larger TSOs (90%).
Relatively few smaller TSOs currently work in formal partnership relationships (22%) compared with 47% of medium and 66% of larger TSOs – many more TSOs have an interest in working in such relationships in future (20%).
In North West England, 38% of TSOs state that money from business is of ‘some’ or ‘great’ importance to them, a similar percentage to neighbouring regions. The biggest TSOs in all three regions are much more likely to gain such financial support.
The provision of facilities to support TSOs is higher in North West England (28%) and Yorkshire and the Humber (31%) than in North East England (26%).
Volunteer support from business varies little between regions. Support of this kind is about twice as likely to be given to the largest TSOs when compared with the smallest.
Free expert advice is offered by business in broadly similar ways in each region (27-30%), but larger or the biggest TSOs are more likely to receive such support.
Across the North of England, medium (44%) and larger TSOs (42%) value financial support from business at similar levels when compared with smaller TSOs (32%).
Only 7% of micro TSOs have successfully been involved in bids to undertake work in partnership compared with 53% of the largest TSOs. The smallest TSOs are much less likely not to be considering such work (76%) when compared with the biggest TSOs (18%).
Expectations about the future
Optimism about increased income is most common in Yorkshire and the Humber (41%). In North East England and North West England 35% of TSOs expect that income will increase over the next two years. Only 17-18% of TSOs across the North of England expect income to decline.
50% of TSOs in Yorkshire and the Humber and 45% of TSOs in North East England and North West England expect their expenditure to increase, which lags 10% behind expectations about increased income. Only 7% of TSOs expect that expenditure will decline, a somewhat lower percentage than of those organisations which expect income to decline (17%).
Between 28-33% of TSOs expect that the numbers of paid staff will increase over the next two years, while 15-18% of TSOs expect a decline.
Expectations about increased numbers of volunteers are high, and especially in Yorkshire and the Humber where 45% of TSOs expect this to happen. Relatively few TSOs expect the numbers of volunteers to decline (in the range of 7-9%).
There is a widespread expectation that working in partnerships will increase (55%), especially in Yorkshire and the Humber (57%) and North West England (56%). Very few TSOs think that partnership working will decrease (3%).
Preparing for the future
About 36% of TSOs are acting to increase earned income – with the larger TSOs the most active in this respect (59%), that stated, about half of smaller TSOs are acting or planning to increase earned income.
A relatively small proportion of the Third Sector is acting to increase donations (21%), larger TSOs are the most active (30%) or are planning to do so (38%).

Third Sector Trends in North West England
10
Borrowing money (to invest in future developments, purchase or upgrade property or borrow working capital) is not a popular option amongst TSOs. Only 3% are acting to do so; and 85% of TSOs will not consider this possibility at present.
Fewer TSOs than may be expected are acting to change their current practices (25%), but of course many may not need to, especially amongst smaller TSOs (13%).
Larger TSOs are much more likely to be changing practices (47%) or are planning to do so (23%). 44% of medium sized TSOs (which have been shown to be amongst the most vulnerable) are taking no action in this respect at present.
For TSOs to merge is a big step as organisations tend to put a high value on their independence. Indeed, only 6% of TSOs are acting to do so, and a further 10% are planning for this possibility.
TSOs tend to put much more emphasis on building their capability to bring in more money by bidding for grants (41%) or fundraising (40%) compared with developmental capability in strategic management (22%) or financial management (20%).
Third Sector Trends in North West England
11
2 The Third Sector Trends Study
This report presents a digest of key findings from the Third Sector Trends study in 2016 in North West England as a whole and for each of its five sub-regions: Greater Manchester, Merseyside, Cheshire, Lancashire and Cumbria4.
The Third Sector Trends study was conceived and originally commissioned by Northern Rock Foundation with research conducted by the Universities of Southampton, Teesside and Durham. The Community Foundation Tyne & Wear and Northumberland was a co-funder of the research and is now responsible for its legacy. The Community Foundation is collaborating with partners including St Chad’s College at the University of Durham, Joseph Rowntree Foundation and IPPR North to expand and continue the research.
The Third Sector Trends survey was designed to examine how TSOs fare over time in the context of change.5 The findings presented in this report are based on a robust research methodology which has evolved over the last eight years to produce comparable time-series data. The sample structure has been checked against comparable national studies to ensure that findings are as reliable as possible – and especially so when making estimates about sector employment and volunteering.6
What is the Third Sector?
The terms ‘Third Sector’ and ‘TSO’ are widely recognised internationally by academics and policy makers and are therefore adopted in this study.
However, it should be noted that the present UK government uses different terminology. Following the 2010 election, the Office for the Third Sector was renamed the Office for Civil Society. Similarly, individual TSOs are sometimes referred to in government documentation as ‘Voluntary, Community and Social Enterprise Sector’ organisations (VCSEs), or as Civil Society Organisations (CSOs).7
The term ‘Third Sector’ is not always well known, recognised or understood by people who work or volunteer within civil society (or what is more commonly known as the voluntary and community sector). So, it is useful to define which organisations are included.
The National Audit Office (NAO) defines the Third Sector as follows:
“The third sector is the term used to describe the range of organisations which are neither state nor the private sector. Third sector organisations (TSOs) include small local community organisations, and large, established, national and international voluntary or charitable organisations. Some rely solely on the efforts of volunteers; others employ paid professional staff and have management structures and processes similar to those of businesses, large or small; many are registered charities whilst others operate as co-operatives, “social enterprises” or companies limited by guarantee... All share some common characteristics in the social, environmental or cultural objectives they pursue; their independence from government; and the reinvestment of surpluses for those same objectives.”8
4 For the purposes of this study, the historic sub-regional boundaries were used. In most places in the NW, these share the same boundaries as the Local Enterprise Partnerships, which form the basis of much current regional policy. However it should be noted that this study refers to ‘Merseyside’ rather than ‘Liverpool City Region’ because it includes data from organisations based in Halton as part of ‘Cumbria’. 5 Initiated in North East England and Cumbria in 2008, originally funded by the Northern Rock Foundation, the biennial survey has received the following levels of responses; 2010 n=1,055; 2012 n=1,700; 2014 n=1,318; and in 2016 n=1,369. Formerly, Cumbria data were included in North East England Reports for 2010 and 2012. In 2014 a separate report was published, funded by Cumbria Community Foundation. In 2016, Cumbria data are reported here in the first North West England study. 6 Full details on comparability checks can be found in Chapman (2017) which is available from the author. 7 For a full explanation of the use of both sets of terminology, see Alcock, P. (2010) Big society or civil society? A new policy environment for the third sector, Birmingham: Third Sector Research Centre. 8 Bourne, J. (2005) Working with the Third Sector, London, National Audit Office.
Third Sector Trends in North West England
12
As the above quotation indicates, there are several categories of Third Sector organisation (TSO). The following categories are usefully distinguished by the National Audit Office.
Voluntary and community sector
Includes registered charities, as well as non-charitable non-profit organisations, associations, self-help groups and community groups. Most involve some aspect of voluntary activity, though many are also professional organisations with paid staff. ‘Community organisations’ tend to be focused on localities or groups within the community; many are dependent entirely or almost entirely on voluntary activity.
General charities
Charities registered with the Charity Commission except those considered part of the government apparatus, such as universities, and those financial institutions considered part of the corporate sector.
Social enterprise
A business with primarily social objectives whose surpluses are principally reinvested for that purpose in the business or community, rather than being driven by the need to maximise profit for shareholders and owners.
Mutuals and co-operatives
Membership-based organisations run on a democratic basis for the benefit of their members. Members may be their employees or their consumers or be drawn from the wider community. Some employee co-operatives may be essentially private businesses but many mutuals and co-operatives consider themselves part of the social enterprise sector.
This study includes all the above organisations within its definition of the Third Sector. As is the case in the NAO definition, financial institutions, hospital trusts, for-profit cooperatives, private schools and universities are also excluded from this study of the Third Sector.
The North West England Study
Third Sector Trends research began in North East England and Cumbria in 2008. This means that there is comparative data for only one of the sub-regions of North West England. In North East England and Yorkshire and the Humber parallel baseline statistical analyses on the size and structure of the sector were undertaken by Southampton University, NCVO and the Third Sector Research Centre.9 As there are no other available data, the estimates on sector size and composition in North West England are based on these two baseline studies.
The first wave of the Third Sector Trends survey was undertaken in 2010 in North East England and Cumbria and has been repeated every two years since. In Yorkshire and the Humber, the survey was commissioned in 2012 by Involve Yorkshire & Humber and JRF. Its aim was to produce robust survey evidence using the research techniques which had been developed for the Northern Rock Foundation Third Sector Trends Study in North East England and Cumbria from 2008.10 The objective was to produce replicable evidence in Yorkshire and the Humber for comparison with North East England and Cumbria, and to produce reliable indicators of sector size and strengths.
In North West England, this is a completely new study (apart from Cumbria) which means that there are no comparable time-series data for analysis. However, parallel reports in adjacent regions can usefully inform analysis in this report.
9 Kane, D. and Mohan, J. (2010) Mapping Registered Third Sector Organisations in Yorkshire and the Humber, Newcastle: Northern Rock Foundation. www.nr-foundation.org.uk/resources/third-sector-trends. 10 Chapman, T. (2014) Third Sector Trends in Yorkshire and the Humber, Durham, St Chad’s College. The survey attracted 1,007 responses.
Third Sector Trends in North West England
13
The study collected data on the following issues:
Data on organisational characteristics: including age, geographical location, legal form, income, number of employees and volunteers and spatial range of operation.
Data on organisational purpose of TSOs: including beneficiaries, services offered, service orientation, and the ethos of organisations in relation to planning, practice and values.
Data on organisational assets: including property, investments and cash in hand reserves, importance of different sources of income, proportion of income which is earned, and the extent to which reserves have been used in the last financial year.
Data on contracting and partnership working: knowledge of contract opportunities, interest in and extent of partnership working and perceptions of public sector officers’ views of the value of TSOs.
Trends data: including changes in levels of income and numbers of employees and volunteers, expectations about future levels of contract working, expectations about future assets, sources of financial resource and opportunities to lever such resources.
Evidence on organisational foresight and capability: including possession of a training budget, training priorities, strategic priorities and action planning.
The role of volunteers in the Third Sector, identify routes to volunteering and explore how TSOs benefit from taking on volunteers.
The role of private sector business in supporting the work of the Third Sector by investing resources of money, skills, people and facility.
Routes to grant funding which TSOs take – to find out if some parts of the sector are served less well or more generously than others to inform the policies of grant makers.
Survey methodology
The survey was undertaken between July and December 2016 using an online questionnaire hosted by Bristol Online Survey. The questionnaire was based on previous studies done in Yorkshire and the Humber and North East England. An identical questionnaire was used in all three regions in 2016 (apart from listings of local authority areas and bespoke introductions for each area.
In all areas, apart from Greater Manchester, the survey was launched in September 2016. The survey was promoted positively by a wide range of organisations in the public sector and third sector including many local authorities and health authorities, the National Lottery, most local infrastructure organisations, community foundations and by Greater Manchester Centre for Voluntary Organisation (GMCVO) and Voluntary Sector North West (VSNW). Additionally, the survey was promoted via social media and by direct emails gleaned from Charity Commission Beta listings.
In Cumbria, the response rate is particularly good because, in addition to the online survey, a paper questionnaire (and subsequent postcard reminder) was distributed to 1,857 organisations from listings used in previous North East and Cumbria studies. The postal questionnaire gleaned an additional 131 responses.
In Greater Manchester, an alternative survey had already been planned by local infrastructure organisations and GMCVO which was to be undertaken by Sheffield Hallam University. Attempts were made to unify the two studies to garner the largest possible sample, but this was not ultimately possible. To avoid clashing with the Sheffield Hallam study in Greater Manchester, the Third Sector Trends survey was launched in the area in July 2016 and remained open only until early September. Once the date of the planned completion of the Sheffield Hallam study was reached, a second wave of requests to complete the Third Sector Trends study were distributed by email.
Third Sector Trends in North West England
14
Despite these difficulties, a fairly good response (n=357) was received in Greater Manchester by using Charity Commission listings of organisations and with support from Forever Manchester and some of the local authorities and local infrastructure organisations. However, as will be explained further in subsequent chapters, the structure of the sample in Manchester is skewed towards smaller TSOs and results should therefore be viewed with considerable caution.
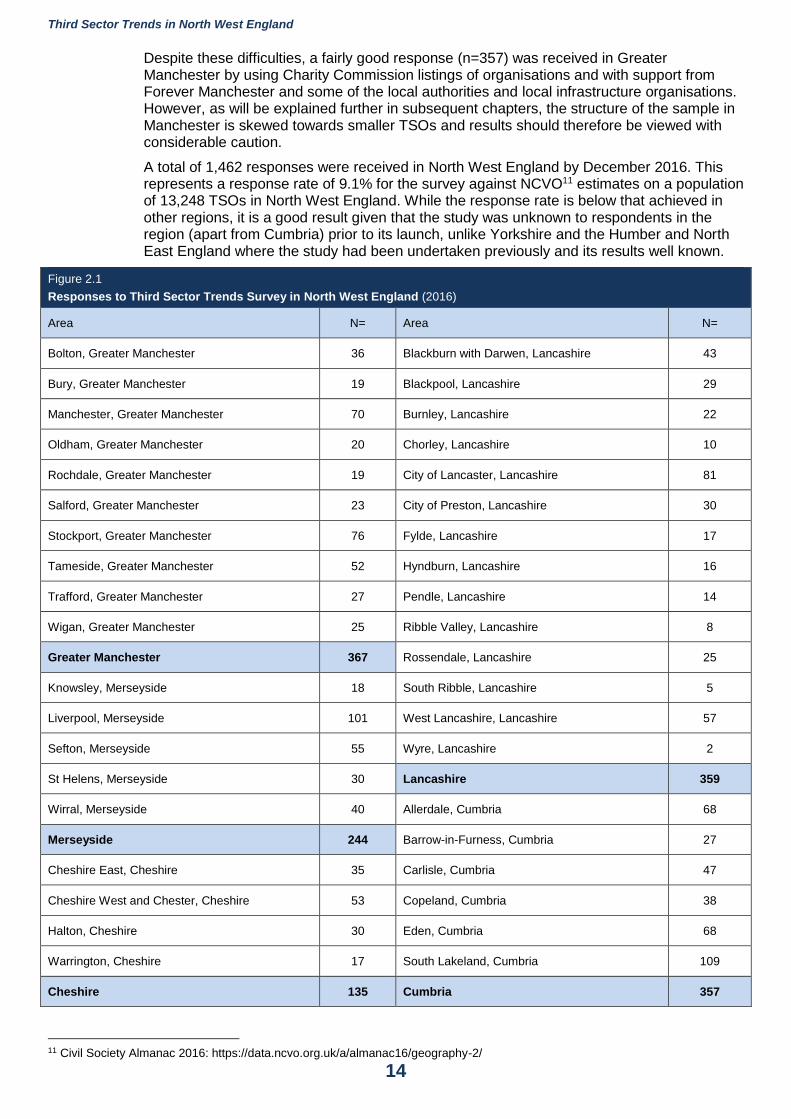
A total of 1,462 responses were received in North West England by December 2016. This represents a response rate of 9.1% for the survey against NCVO11 estimates on a population of 13,248 TSOs in North West England. While the response rate is below that achieved in other regions, it is a good result given that the study was unknown to respondents in the region (apart from Cumbria) prior to its launch, unlike Yorkshire and the Humber and North East England where the study had been undertaken previously and its results well known.
Figure 2.1
Responses to Third Sector Trends Survey in North West England (2016)
Area N= Area N=
Bolton, Greater Manchester 36 Blackburn with Darwen, Lancashire 43
Bury, Greater Manchester 19 Blackpool, Lancashire 29
Manchester, Greater Manchester 70 Burnley, Lancashire 22
Oldham, Greater Manchester 20 Chorley, Lancashire 10
Rochdale, Greater Manchester 19 City of Lancaster, Lancashire 81
Salford, Greater Manchester 23 City of Preston, Lancashire 30
Stockport, Greater Manchester 76 Fylde, Lancashire 17
Tameside, Greater Manchester 52 Hyndburn, Lancashire 16
Trafford, Greater Manchester 27 Pendle, Lancashire 14
Wigan, Greater Manchester 25 Ribble Valley, Lancashire 8
Greater Manchester 367 Rossendale, Lancashire 25
Knowsley, Merseyside 18 South Ribble, Lancashire 5
Liverpool, Merseyside 101 West Lancashire, Lancashire 57
Sefton, Merseyside 55 Wyre, Lancashire 2
St Helens, Merseyside 30 Lancashire 359
Wirral, Merseyside 40 Allerdale, Cumbria 68
Merseyside 244 Barrow-in-Furness, Cumbria 27
Cheshire East, Cheshire 35 Carlisle, Cumbria 47
Cheshire West and Chester, Cheshire 53 Copeland, Cumbria 38
Halton, Cheshire 30 Eden, Cumbria 68
Warrington, Cheshire 17 South Lakeland, Cumbria 109
Cheshire 135 Cumbria 357
11 Civil Society Almanac 2016: https://data.ncvo.org.uk/a/almanac16/geography-2/
Third Sector Trends in North West England
15
Parallel studies were undertaken using the same methodology in Yorkshire and the Humber (n=1,083) and North East England (n=1,012), producing a total survey response of 3,557 in the North of England.
Third Sector Trends in policy context
While this is the first attempt to undertake the study across North West England, it is important to understand its findings in the context of the wider study. Third Sector Trends is a longitudinal research programme which aims to explore how the sector responds to social, economic and political change. Since the research began, there have been enormous transformations in the economic and political landscape which TSOs have had to navigate.
The study began in North East England and Cumbria at the point of the demise of the Northern Rock bank in 2008 which led to economic turmoil in European and United States banking systems following a collapse in the sub-prime mortgage market.
Prior to 2008 the New Labour government invested heavily in the Third Sector to tackle social, economic and regeneration issues such as child poverty, public health, education, employability, neighbourhood renewal and so on.
Many TSOs benefitted from a long period of sustained investment though government programmes such as the Neighbourhood Renewal Fund and New Deal for Communities. Much investment in strengthening the Third Sector accompanied these initiatives, including ChangeUp, Capacitybuilders, Future Builders amongst others.12
Following the general election of 2010 the new Conservative and Liberal Democrat coalition government presided over a long and deepening commitment to reduce the public sector borrowing requirement which led to significant cuts in government spending especially at local authority level.
In 2015 the Conservatives won a surprise majority in Parliament which led to a deepening resolve to reduce public spending. In 2016, the government also observed its manifesto commitment to hold a referendum on membership of the European Community. The vote to leave the European Union led to the resignation of David Cameron and the installation of Theresa May as Prime Minister. Her decision to hold a snap election in 2017, expecting a landslide majority, concluded in the establishment of a minority government.
As this research report is published, it is simply not known whether the government will sustain its commitment to austerity measures or how Brexit negotiations with the European Union will impact on the social, economic, political or legislative landscape in the UK.
This study has, in short, taken place at a time of great uncertainty. The predictions respondents offered about their future opportunities and challenges were made without knowledge of another election or its consequences in fiscal terms or in relation to Brexit.
Commentary on the potential impact of major political and economic transformations by bodies which represent the interests of the Third Sector can often be alarmist.13 Claims that the Third Sector faces impending doom are so common that an impression is given that the sector operates in a climate of perpetual crisis.
But as the NCVO14 has recently shown, (see for further discussion in Chapter 13) the lasting impact of political and economic change over the last ten years has been less dramatic than
12 Investment in Third Sector development was not limited to government funding. Amongst others, Big Lottery committed substantial investment through, for example, the BASIS fund: http://www.biglotteryfund.org.uk/global-content/programmes/england/basis. 13 For example, identifying the extent to which the Third Sector has suffered from government cuts is not a straightforward matter. Some attempts have been made to monitor the extent of cuts by, for example, Voluntary Sector Cuts where TSOs are explicitly asked to submit evidence which is mapped nationally. In this campaign “We’re defining a cut as a statutory body (in central, local or regional government, including government agencies, local authorities, PCTs and others, or from the European Union) informing you that you will receive less money than they had previously agreed to provide, as part of a grant, a contract or another formal funding arrangement. This may include them asking you to make efficiency savings as part of an existing contract or cancelling a grant which they had previously agreed to provide. We’re not including funding applications that have been turned down, but we are interested in funding programmes that have been cancelled, or continuation funding that is withdrawn due to budget cuts.” For further details see: http://voluntarysectorcuts.org.uk/. 14 Civil Society Almanac 2017, London: NCVO.
Third Sector Trends in North West England
16
expected. There have not been wholesale cuts to sector income, but rather, there has been a good deal of continuity.
As Professor Peter Alcock, then Director of the Third Sector Research Centre observed in 2013:
“Some may see the prospects for 2013 to be more doom and gloom. However, I think such pessimism comes from a short-sighted perspective on social change. A key lesson from the past is to take the long view on the political and organisational changes that affect voluntary action. Despite the fears of cuts, mergers and closures; history will not judge this to be a time of ‘crisis’ for the sector. Patterns of individual activity and organisational development show resilience over time and general incremental growth.”15
Professor Alcock, as this report confirms, was correct in his assertion. The sky has not fallen in on the Third Sector. But this does not mean that life has necessarily been easy. TSOs have had to adapt to a changing political and economic environment and as such, this report will show who some of the winners and losers have been in this process.
North West England: the regional context
North West England is a large region covering an area of 14,100 square kilometres. It had a population of 6.9 million in 2011. Over 87 per cent of the population live in urban areas (that is, towns with a population above 10,000), the second highest population density in the UK.16
The region is, for the purposes of analysis, divided into five sub-regional areas.17
Greater Manchester is an urban Combined Authority area comprising the following unitary local authorities: Bolton, Bury, Manchester, Oldham, Rochdale, Salford, Stockport, Tameside, Trafford and Wigan.
Merseyside: is a major metropolitan area comprising the following unitary local authorities: Knowsley, Liverpool, Sefton, St Helens and Wirral. These local authorities comprise the Liverpool City Region Combined Authority, along with Halton council.
Cheshire: is a mixed urban and rural area comprising the following unitary local authorities: Cheshire East, Chester West and Chester, Halton and Warrington.
Lancashire: is largely urban but with significant rural areas, comprising the following local authorities: the district councils of Burnley, Chorley, Fylde, Hyndburn, Lancaster, Pendle, Preston, Ribble Valley, Rossendale, South Ribble, West Lancashire and Wyre, as well as Lancashire County Council, and two adjoining unitary authorities: Blackpool and Blackburn with Darwen.
Cumbria: is a largely rural area, comprising the following local authorities: the district councils of Allerdale, Barrow-in-Furness, Carlisle, Copeland, Eden and South Lakeland, as well as Cumbria County Council.
In a large region which is spatially and economically varied, it is tempting to assume that generalisations cannot easily be made about the structure and dynamics of the Third Sector, nor about the needs of its beneficiaries. However, there is much evidence drawn from the
15 Alcock, P. (2013) ‘Crisis? What crisis?’, Third Sector Online, 7th January 2013. See: http://www.thirdsector.co.uk/Governance/article/1165606/pete-alcock-crisis-crisis/. For a more detailed exposition of the media portrayal of Third Sector crises, see Taylor, R. and Alcock, P. (2012) From crisis to mixed picture to phoney war: tracing Third Sector discourse in the 2008/9 recession, Third Sector Research Centre Research Report No. 87, Birmingham: Third Sector Research Centre. 16 For a more detailed portrait of the region see ONS (2012) Regional Profiles, Key Statistics, London: ONS, http://webarchive.nationalarchives.gov.uk/20160105160709/http://www.ons.gov.uk/ons/dcp171780_275076.pdf. See also for a map of local authority areas and population profiles: Young, R and Sly, F. (2011) Portrait of the North West, London, ONS. 17 The current UK Government does not recognise these formal regional boundaries and abolished key agencies which operated at a regional level. This led to the closure of the Government Office for North West England in March 2011 and the Regional Development Agency in March 2012, see: House of Commons Library (2013) The Abolition of Regional Government, 27th March. However, the boundaries provide a useful basis for comparative measurement with other data sets on the structure and functions of the Third Sector in the region including the NSTS.
Third Sector Trends in North West England
17
previous Third Sector Trends studies in Yorkshire and the Humber and North East England and Cumbria to show that the context within which TSOs work is subject to more general social, political and economic factors and that organisations with shared characteristics tackle these issues in similar ways.
The North West is a region, however, which is also undergoing considerable change – not merely in response to the austerity policies of national government as outlined above, but also due to changes in patterns of regional governance.
Until 2011, North West England was served by a Government Office for the Region and by a Regional Development Agency until March 201218. These regional institutions were replaced with five sub-regional Local Enterprise Partnerships – local private-public partnership bodies that help determine economic priorities across a ‘functional economic area’.
More recently, and in response to the former Chancellor of the Exchequer’s ‘Northern Powerhouse’ initiative to strengthen the northern economy, Combined Authorities were set up in Greater Manchester and Liverpool City Region. Chaired by new Metro Mayors, these bodies are intended to better coordinate public sector activity across a single ‘city region’, and have taken on devolved powers over issues such as transport, housing, skills and, in the case of Greater Manchester, health.
Direct Third Sector representation in these new partnerships and authorities is somewhat limited and it is not yet known how well they will serve the interests of the sector and in turn bring advantages to the beneficiaries they serve.19 What is clear, however, is that if the Third Sector is to have an influential voice on these new regional decision-making institutions, it needs good quality intelligence to inform debates rather than relying on small-scale snap-shot studies or anecdotal evidence.
It is not the purpose of this research, however, to produce recommendations to the Third Sector in North West England on how it should attempt to shape policy or voice its claims on resources. But rather, it is to provide robust independent evidence which can be used, where appropriate, to strengthen that voice.
18 See: House of Commons Library (2013) The Abolition of Regional Government, 27th March 19 There are some indications that combined authorities are considering the value of building stronger relationships with the third sector. For example, in Merseyside, Metro Mayor Steve Rotherham has appointed advisors to support the Combined Authority including Reverend Canon Dr Ellen Loudon, Chancellor at Liverpool Cathedral, to represent the interests of the voluntary and community sector http://www.liverpoolecho.co.uk/news/liverpool-news/metro-mayor-steve-rotheram-unveils-13198277. Similarly, Greater Manchester Combined Authority’s Health and Social Care Partnership has drawn up a memorandum of understanding with the Greater Manchester Voluntary, Community and Social Enterprise Reference Group to build stronger mutually beneficial relationships: https://www.gmcvo.org.uk/mou-between-gm-heath-and-social-care-partnership-and-vcse.
Third Sector Trends in North West England
18
3 Employment in the Third Sector
It is possible to make good estimates of the number of full-time equivalent (FTE) employees in the Third Sector in North West England.
It is estimated that in 2016 there were 110,000 FTE employees in North West England, 85,000 in Yorkshire and the Humber and 37,500 in North East England. Across the North there were 233,000 FTE employees.
Comparable data from North East England since 2010 strongly suggests that there has been a progressive shift from full-time to part-time employment – with the percentage of part-time staff rising from 35% to 45% over the last eight years. This is also likely to be the case in North West England.
The Third Sector workforce accounts for between 3-4% of regional employment.20
The economic value, by salaries, of employees is estimated across the North of England at £4.7bn. Regional estimates are as follows, North West £2.2bn, Yorkshire and the Humber £1.8bn and North East England £750m.21
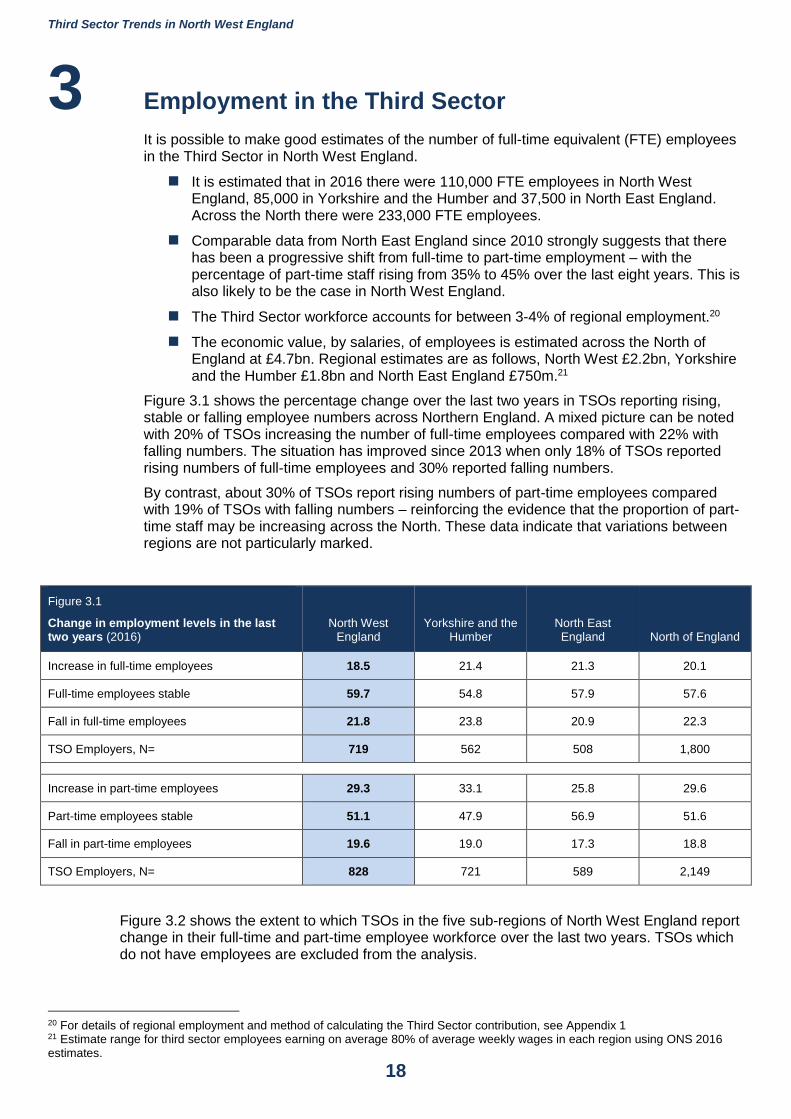
Figure 3.1 shows the percentage change over the last two years in TSOs reporting rising, stable or falling employee numbers across Northern England. A mixed picture can be noted with 20% of TSOs increasing the number of full-time employees compared with 22% with falling numbers. The situation has improved since 2013 when only 18% of TSOs reported rising numbers of full-time employees and 30% reported falling numbers.
By contrast, about 30% of TSOs report rising numbers of part-time employees compared with 19% of TSOs with falling numbers – reinforcing the evidence that the proportion of part-time staff may be increasing across the North. These data indicate that variations between regions are not particularly marked.
Figure 3.1
Change in employment levels in the last two years (2016)
North West England
Yorkshire and the Humber
North East England North of England
Increase in full-time employees 18.5 21.4 21.3 20.1
Full-time employees stable 59.7 54.8 57.9 57.6
Fall in full-time employees 21.8 23.8 20.9 22.3
TSO Employers, N= 719 562 508 1,800
Increase in part-time employees 29.3 33.1 25.8 29.6
Part-time employees stable 51.1 47.9 56.9 51.6
Fall in part-time employees 19.6 19.0 17.3 18.8
TSO Employers, N= 828 721 589 2,149
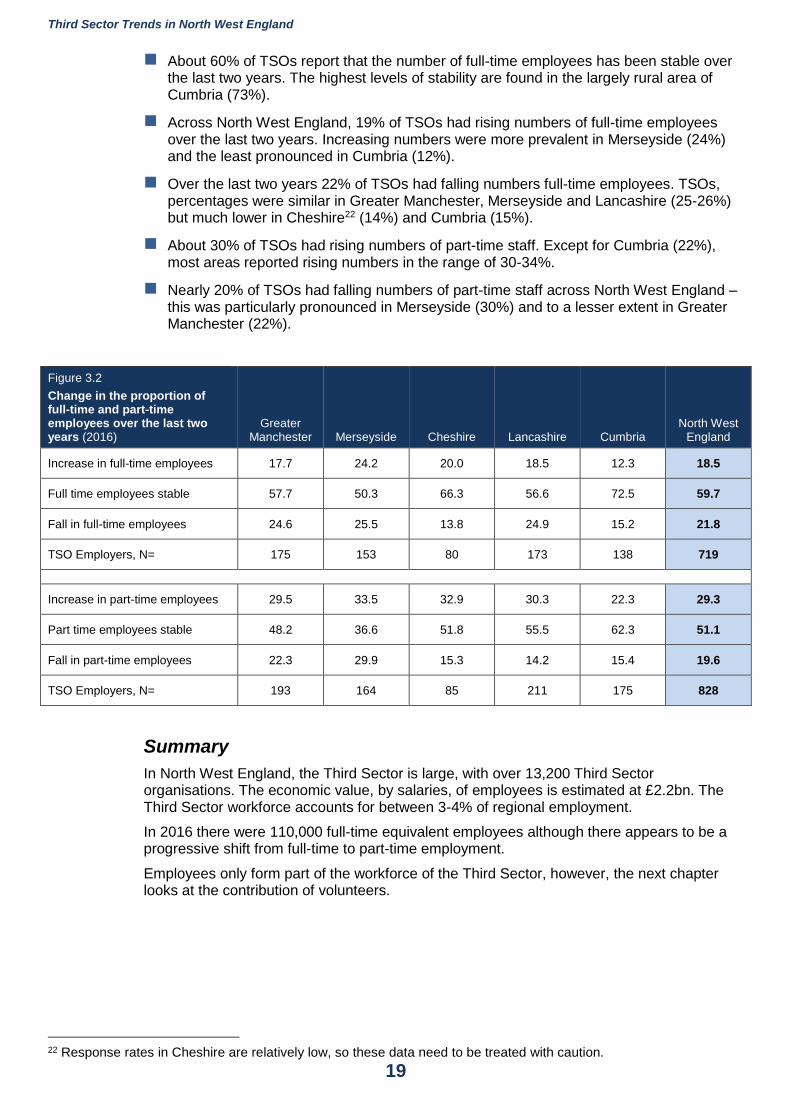
Figure 3.2 shows the extent to which TSOs in the five sub-regions of North West England report change in their full-time and part-time employee workforce over the last two years. TSOs which do not have employees are excluded from the analysis.
20 For details of regional employment and method of calculating the Third Sector contribution, see Appendix 1 21 Estimate range for third sector employees earning on average 80% of average weekly wages in each region using ONS 2016 estimates.
Third Sector Trends in North West England
19
About 60% of TSOs report that the number of full-time employees has been stable over the last two years. The highest levels of stability are found in the largely rural area of Cumbria (73%).
Across North West England, 19% of TSOs had rising numbers of full-time employees over the last two years. Increasing numbers were more prevalent in Merseyside (24%) and the least pronounced in Cumbria (12%).
Over the last two years 22% of TSOs had falling numbers full-time employees. TSOs, percentages were similar in Greater Manchester, Merseyside and Lancashire (25-26%) but much lower in Cheshire22 (14%) and Cumbria (15%).
About 30% of TSOs had rising numbers of part-time staff. Except for Cumbria (22%), most areas reported rising numbers in the range of 30-34%.
Nearly 20% of TSOs had falling numbers of part-time staff across North West England – this was particularly pronounced in Merseyside (30%) and to a lesser extent in Greater Manchester (22%).
Figure 3.2
Change in the proportion of full-time and part-time employees over the last two years (2016)
Greater Manchester Merseyside Cheshire Lancashire Cumbria
North West England
Increase in full-time employees 17.7 24.2 20.0 18.5 12.3 18.5
Full time employees stable 57.7 50.3 66.3 56.6 72.5 59.7
Fall in full-time employees 24.6 25.5 13.8 24.9 15.2 21.8
TSO Employers, N= 175 153 80 173 138 719
Increase in part-time employees 29.5 33.5 32.9 30.3 22.3 29.3
Part time employees stable 48.2 36.6 51.8 55.5 62.3 51.1
Fall in part-time employees 22.3 29.9 15.3 14.2 15.4 19.6
TSO Employers, N= 193 164 85 211 175 828
Summary
In North West England, the Third Sector is large, with over 13,200 Third Sector organisations. The economic value, by salaries, of employees is estimated at £2.2bn. The Third Sector workforce accounts for between 3-4% of regional employment.
In 2016 there were 110,000 full-time equivalent employees although there appears to be a progressive shift from full-time to part-time employment.
Employees only form part of the workforce of the Third Sector, however, the next chapter looks at the contribution of volunteers.
22 Response rates in Cheshire are relatively low, so these data need to be treated with caution.
Third Sector Trends in North West England
20
4 Volunteers in the Third Sector
The majority of TSOs are very small, have very limited income and do not employ staff. They are, therefore, entirely dependent upon freely given time to manage organisations and deliver the work needed.
As organisations become larger, they depend much more heavily upon employees – but volunteers continue to play an important role in their governance and the delivery of their work.
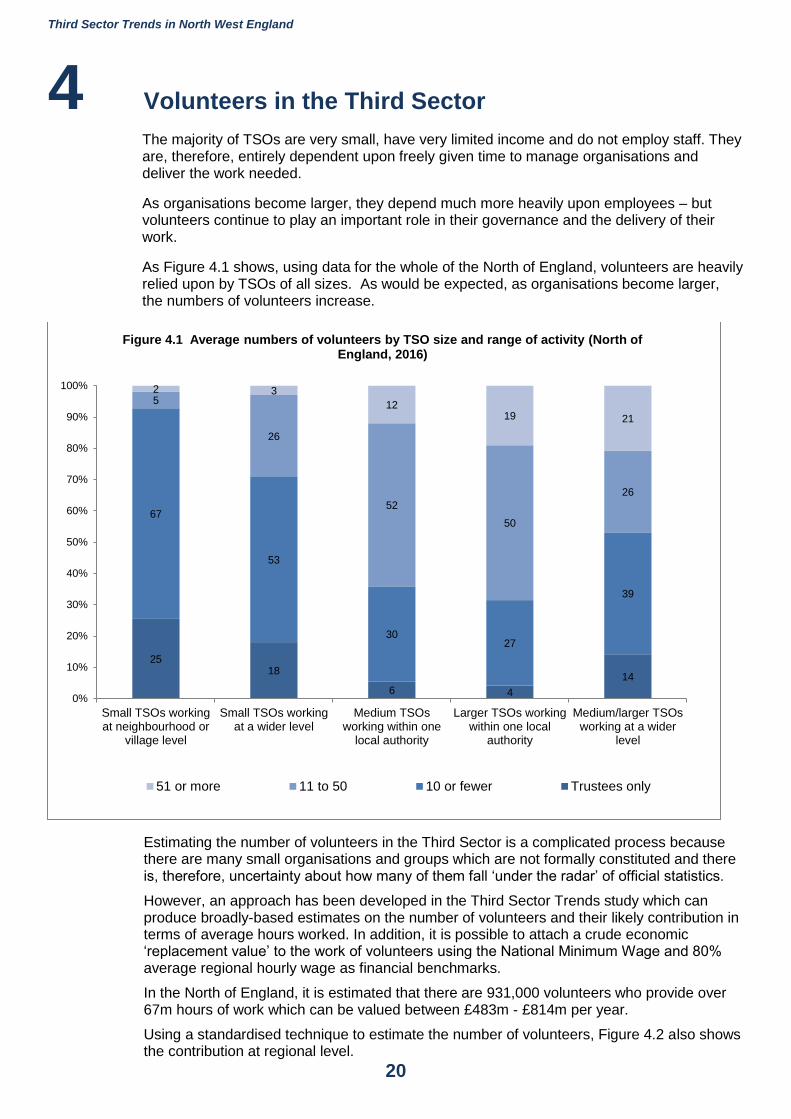
As Figure 4.1 shows, using data for the whole of the North of England, volunteers are heavily relied upon by TSOs of all sizes. As would be expected, as organisations become larger, the numbers of volunteers increase.
Estimating the number of volunteers in the Third Sector is a complicated process because there are many small organisations and groups which are not formally constituted and there is, therefore, uncertainty about how many of them fall ‘under the radar’ of official statistics.
However, an approach has been developed in the Third Sector Trends study which can produce broadly-based estimates on the number of volunteers and their likely contribution in terms of average hours worked. In addition, it is possible to attach a crude economic ‘replacement value’ to the work of volunteers using the National Minimum Wage and 80% average regional hourly wage as financial benchmarks.
In the North of England, it is estimated that there are 931,000 volunteers who provide over 67m hours of work which can be valued between £483m - £814m per year.
Using a standardised technique to estimate the number of volunteers, Figure 4.2 also shows the contribution at regional level.
2518
6 4
14
67
53
3027
39
5
26
52
50
26
2 3
1219 21
0%
10%
20%
30%
40%
50%
60%
70%
80%
90%
100%
Small TSOs workingat neighbourhood or
village level
Small TSOs workingat a wider level
Medium TSOsworking within one
local authority
Larger TSOs workingwithin one local
authority
Medium/larger TSOsworking at a wider
level
Figure 4.1 Average numbers of volunteers by TSO size and range of activity (North of England, 2016)
51 or more 11 to 50 10 or fewer Trustees only
Third Sector Trends in North West England
21
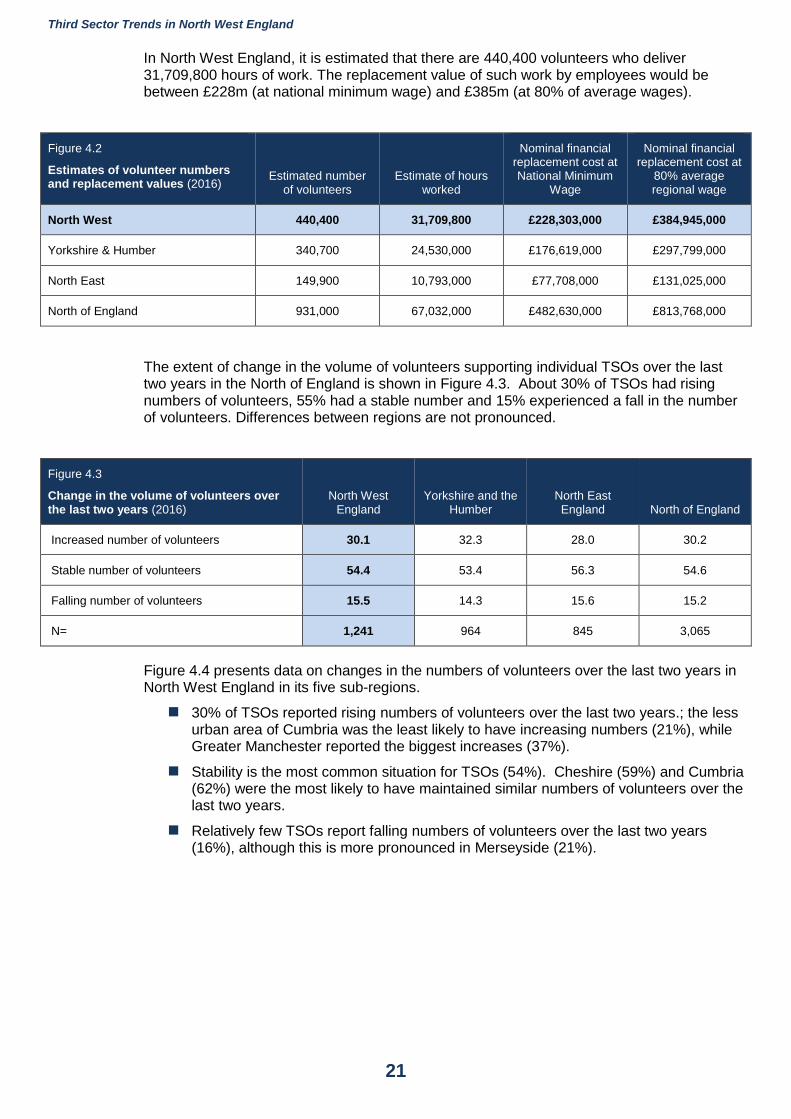
In North West England, it is estimated that there are 440,400 volunteers who deliver 31,709,800 hours of work. The replacement value of such work by employees would be between £228m (at national minimum wage) and £385m (at 80% of average wages).
Figure 4.2
Estimates of volunteer numbers and replacement values (2016)
Estimated number of volunteers
Estimate of hours worked
Nominal financial replacement cost at National Minimum
Wage
Nominal financial replacement cost at
80% average regional wage
North West 440,400 31,709,800 £228,303,000 £384,945,000
Yorkshire & Humber 340,700 24,530,000 £176,619,000 £297,799,000
North East 149,900 10,793,000 £77,708,000 £131,025,000
North of England 931,000 67,032,000 £482,630,000 £813,768,000
The extent of change in the volume of volunteers supporting individual TSOs over the last two years in the North of England is shown in Figure 4.3. About 30% of TSOs had rising numbers of volunteers, 55% had a stable number and 15% experienced a fall in the number of volunteers. Differences between regions are not pronounced.
Figure 4.3
Change in the volume of volunteers over the last two years (2016)
North West England
Yorkshire and the Humber
North East England North of England
Increased number of volunteers 30.1 32.3 28.0 30.2
Stable number of volunteers 54.4 53.4 56.3 54.6
Falling number of volunteers 15.5 14.3 15.6 15.2
N= 1,241 964 845 3,065
Figure 4.4 presents data on changes in the numbers of volunteers over the last two years in North West England in its five sub-regions.
30% of TSOs reported rising numbers of volunteers over the last two years.; the less urban area of Cumbria was the least likely to have increasing numbers (21%), while Greater Manchester reported the biggest increases (37%).
Stability is the most common situation for TSOs (54%). Cheshire (59%) and Cumbria (62%) were the most likely to have maintained similar numbers of volunteers over the last two years.
Relatively few TSOs report falling numbers of volunteers over the last two years (16%), although this is more pronounced in Merseyside (21%).
Third Sector Trends in North West England
22
Figure 4.4
Change in the proportion of volunteers over the last two years by sub-region (2016)
Greater Manchester Merseyside Cheshire Lancashire Cumbria
North West England
Increase in volunteers 36.8 30.4 30.3 30.9 20.8 30.1
Volunteers stable 51.1 48.6 59.0 53.3 62.3 54.4
Fall in volunteers 12.1 21.0 10.7 15.8 17.0 15.5
N= 323 214 122 317 265 1,241
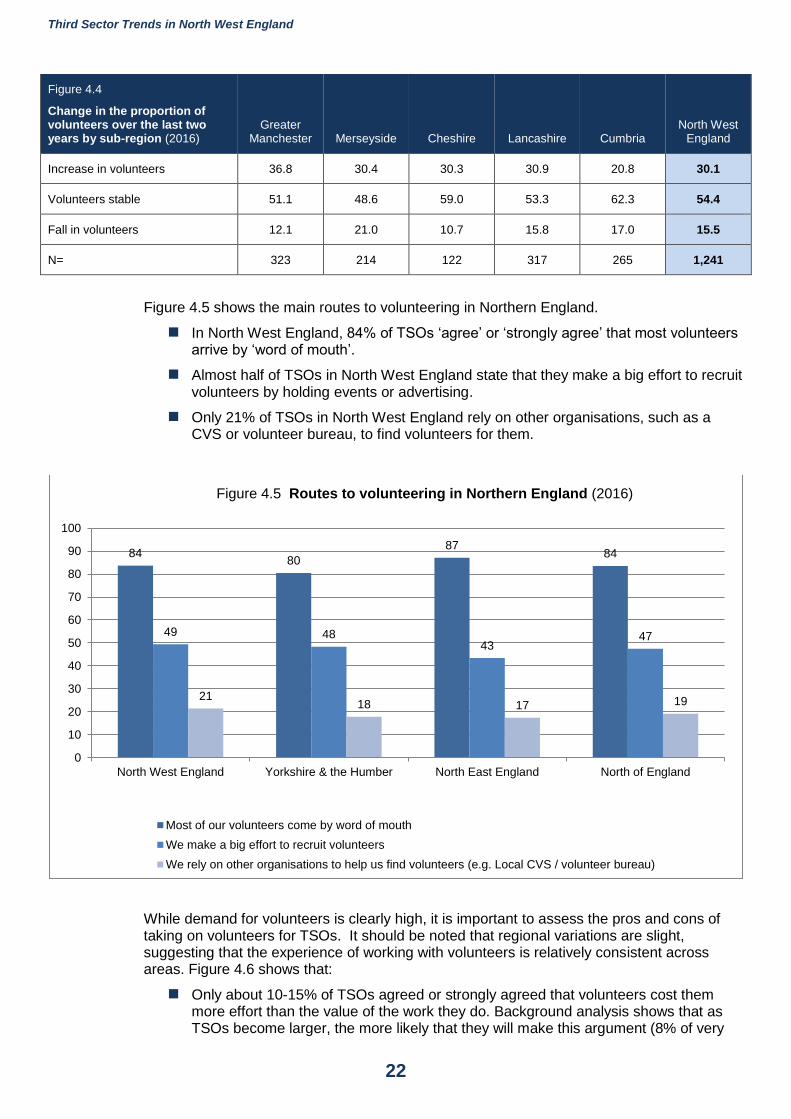
Figure 4.5 shows the main routes to volunteering in Northern England.
In North West England, 84% of TSOs ‘agree’ or ‘strongly agree’ that most volunteers arrive by ‘word of mouth’.
Almost half of TSOs in North West England state that they make a big effort to recruit volunteers by holding events or advertising.
Only 21% of TSOs in North West England rely on other organisations, such as a CVS or volunteer bureau, to find volunteers for them.
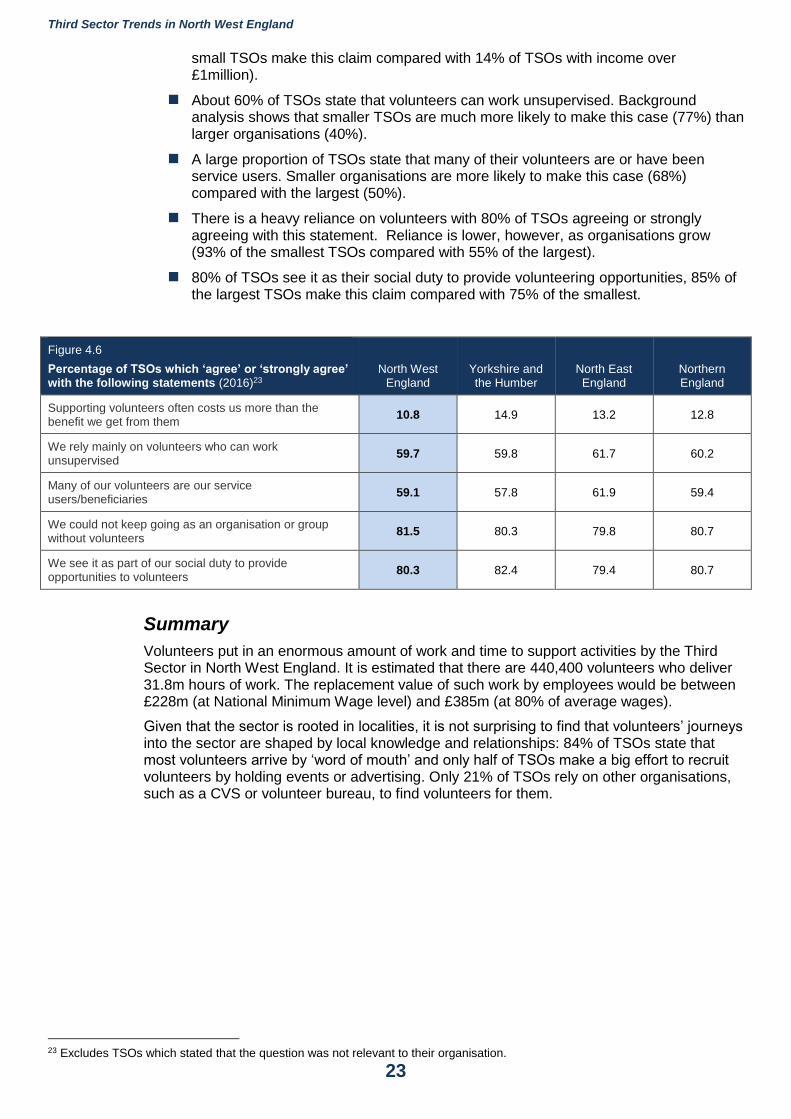
While demand for volunteers is clearly high, it is important to assess the pros and cons of taking on volunteers for TSOs. It should be noted that regional variations are slight, suggesting that the experience of working with volunteers is relatively consistent across areas. Figure 4.6 shows that:
Only about 10-15% of TSOs agreed or strongly agreed that volunteers cost them more effort than the value of the work they do. Background analysis shows that as TSOs become larger, the more likely that they will make this argument (8% of very
8480
8784
49 4843
47
2118 17 19
0
10
20
30
40
50
60
70
80
90
100
North West England Yorkshire & the Humber North East England North of England
Figure 4.5 Routes to volunteering in Northern England (2016)
Most of our volunteers come by word of mouth
We make a big effort to recruit volunteers
We rely on other organisations to help us find volunteers (e.g. Local CVS / volunteer bureau)
Third Sector Trends in North West England
23
small TSOs make this claim compared with 14% of TSOs with income over £1million).
About 60% of TSOs state that volunteers can work unsupervised. Background analysis shows that smaller TSOs are much more likely to make this case (77%) than larger organisations (40%).
A large proportion of TSOs state that many of their volunteers are or have been service users. Smaller organisations are more likely to make this case (68%) compared with the largest (50%).
There is a heavy reliance on volunteers with 80% of TSOs agreeing or strongly agreeing with this statement. Reliance is lower, however, as organisations grow (93% of the smallest TSOs compared with 55% of the largest).
80% of TSOs see it as their social duty to provide volunteering opportunities, 85% of the largest TSOs make this claim compared with 75% of the smallest.
Figure 4.6
Percentage of TSOs which ‘agree’ or ‘strongly agree’ with the following statements (2016)23
North West England
Yorkshire and the Humber
North East England
Northern England
Supporting volunteers often costs us more than the benefit we get from them
10.8 14.9 13.2 12.8
We rely mainly on volunteers who can work unsupervised
59.7 59.8 61.7 60.2
Many of our volunteers are our service users/beneficiaries
59.1 57.8 61.9 59.4
We could not keep going as an organisation or group without volunteers
81.5 80.3 79.8 80.7
We see it as part of our social duty to provide opportunities to volunteers
80.3 82.4 79.4 80.7
Summary
Volunteers put in an enormous amount of work and time to support activities by the Third Sector in North West England. It is estimated that there are 440,400 volunteers who deliver 31.8m hours of work. The replacement value of such work by employees would be between £228m (at National Minimum Wage level) and £385m (at 80% of average wages).
Given that the sector is rooted in localities, it is not surprising to find that volunteers’ journeys into the sector are shaped by local knowledge and relationships: 84% of TSOs state that most volunteers arrive by ‘word of mouth’ and only half of TSOs make a big effort to recruit volunteers by holding events or advertising. Only 21% of TSOs rely on other organisations, such as a CVS or volunteer bureau, to find volunteers for them.
23 Excludes TSOs which stated that the question was not relevant to their organisation.
Third Sector Trends in North West England
24
5 Spatial area of operation of TSOs
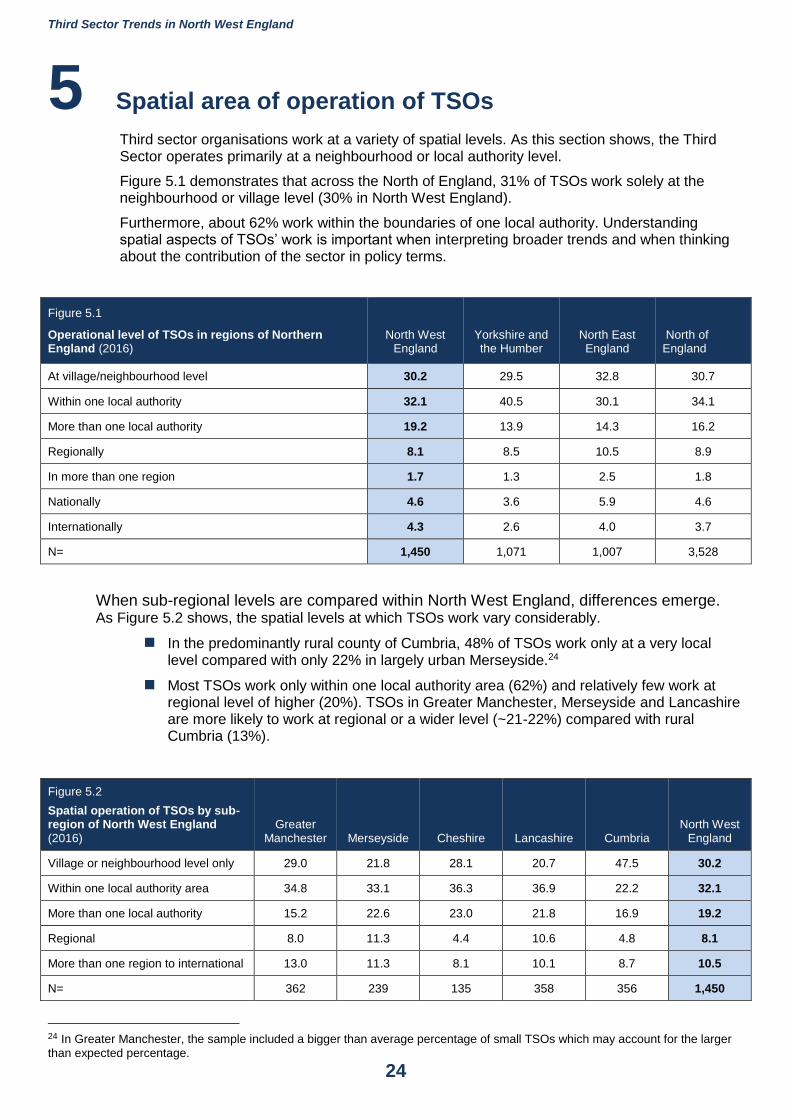
Third sector organisations work at a variety of spatial levels. As this section shows, the Third Sector operates primarily at a neighbourhood or local authority level.
Figure 5.1 demonstrates that across the North of England, 31% of TSOs work solely at the neighbourhood or village level (30% in North West England).
Furthermore, about 62% work within the boundaries of one local authority. Understanding spatial aspects of TSOs’ work is important when interpreting broader trends and when thinking about the contribution of the sector in policy terms.
Figure 5.1
Operational level of TSOs in regions of Northern England (2016)
North West England
Yorkshire and the Humber
North East England
North of England
At village/neighbourhood level 30.2 29.5 32.8 30.7
Within one local authority 32.1 40.5 30.1 34.1
More than one local authority 19.2 13.9 14.3 16.2
Regionally 8.1 8.5 10.5 8.9
In more than one region 1.7 1.3 2.5 1.8
Nationally 4.6 3.6 5.9 4.6
Internationally 4.3 2.6 4.0 3.7
N= 1,450 1,071 1,007 3,528
When sub-regional levels are compared within North West England, differences emerge. As Figure 5.2 shows, the spatial levels at which TSOs work vary considerably.
In the predominantly rural county of Cumbria, 48% of TSOs work only at a very local level compared with only 22% in largely urban Merseyside.24
Most TSOs work only within one local authority area (62%) and relatively few work at regional level of higher (20%). TSOs in Greater Manchester, Merseyside and Lancashire are more likely to work at regional or a wider level (~21-22%) compared with rural Cumbria (13%).
Figure 5.2
Spatial operation of TSOs by sub-region of North West England (2016)
Greater Manchester Merseyside Cheshire Lancashire Cumbria
North West England
Village or neighbourhood level only 29.0 21.8 28.1 20.7 47.5 30.2
Within one local authority area 34.8 33.1 36.3 36.9 22.2 32.1
More than one local authority 15.2 22.6 23.0 21.8 16.9 19.2
Regional 8.0 11.3 4.4 10.6 4.8 8.1
More than one region to international 13.0 11.3 8.1 10.1 8.7 10.5
N= 362 239 135 358 356 1,450
24 In Greater Manchester, the sample included a bigger than average percentage of small TSOs which may account for the larger
than expected percentage.
Third Sector Trends in North West England
25
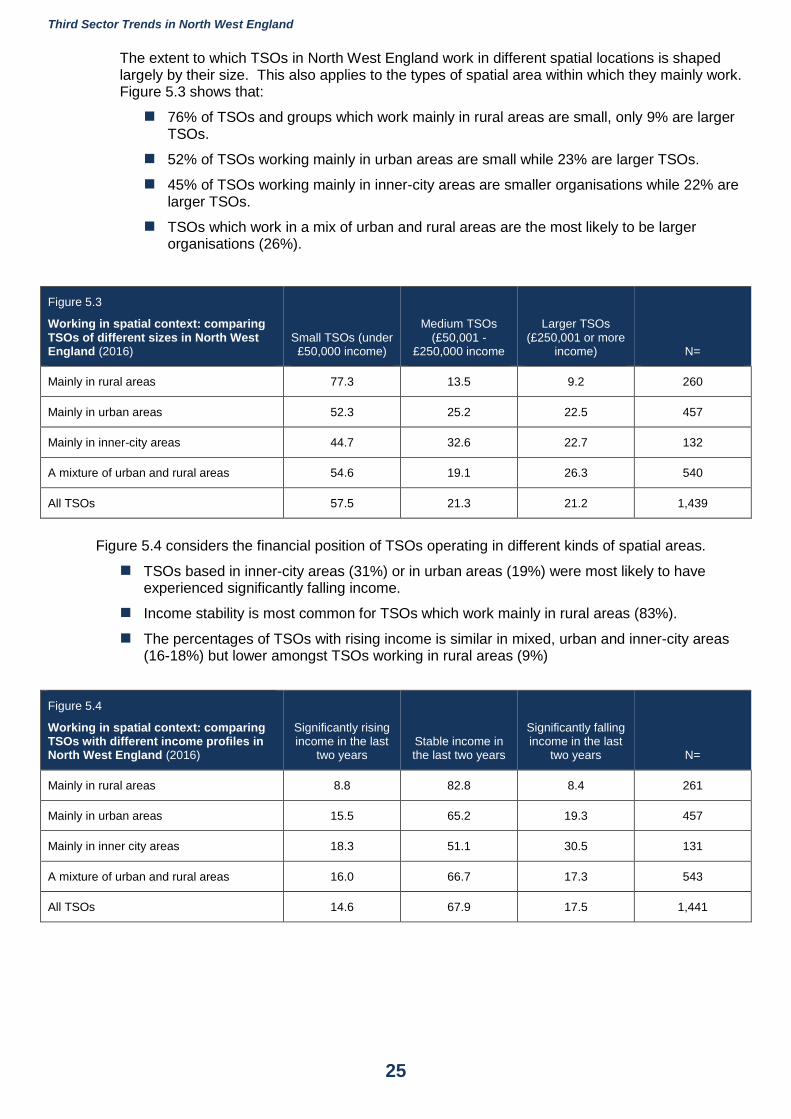
The extent to which TSOs in North West England work in different spatial locations is shaped largely by their size. This also applies to the types of spatial area within which they mainly work. Figure 5.3 shows that:
76% of TSOs and groups which work mainly in rural areas are small, only 9% are larger TSOs.
52% of TSOs working mainly in urban areas are small while 23% are larger TSOs.
45% of TSOs working mainly in inner-city areas are smaller organisations while 22% are larger TSOs.
TSOs which work in a mix of urban and rural areas are the most likely to be larger organisations (26%).
Figure 5.3
Working in spatial context: comparing TSOs of different sizes in North West England (2016)
Small TSOs (under £50,000 income)
Medium TSOs (£50,001 -
£250,000 income
Larger TSOs (£250,001 or more
income) N=
Mainly in rural areas 77.3 13.5 9.2 260
Mainly in urban areas 52.3 25.2 22.5 457
Mainly in inner-city areas 44.7 32.6 22.7 132
A mixture of urban and rural areas 54.6 19.1 26.3 540
All TSOs 57.5 21.3 21.2 1,439
Figure 5.4 considers the financial position of TSOs operating in different kinds of spatial areas.
TSOs based in inner-city areas (31%) or in urban areas (19%) were most likely to have experienced significantly falling income.
Income stability is most common for TSOs which work mainly in rural areas (83%).
The percentages of TSOs with rising income is similar in mixed, urban and inner-city areas (16-18%) but lower amongst TSOs working in rural areas (9%)
Figure 5.4
Working in spatial context: comparing TSOs with different income profiles in North West England (2016)
Significantly rising income in the last
two years Stable income in the last two years
Significantly falling income in the last
two years N=
Mainly in rural areas 8.8 82.8 8.4 261
Mainly in urban areas 15.5 65.2 19.3 457
Mainly in inner city areas 18.3 51.1 30.5 131
A mixture of urban and rural areas 16.0 66.7 17.3 543
All TSOs 14.6 67.9 17.5 1,441

Third Sector Trends in North West England
26
Summary The Third Sector in North West England is very much a locality based entity. 30% of TSOs work only at neighbourhood or village level while 62% work within the boundaries of a single local authority. Only 9% of TSOs based in North West England work nationally or internationally.
Given that the sector is rooted in localities, it is not surprising to find that volunteers’ journeys into the sector are shaped to a large extent by local knowledge and relationships: 80% of TSOs state that most volunteers arrive by ‘word of mouth’ and only half of TSOs make a big effort to recruit volunteers by holding events or advertising. Only 18% of TSOs rely on other organisations, such as a CVS or volunteer bureau, to find volunteers for them.
And as will be shown in subsequent chapters of this report, the Third Sector is characterised by its strong informal connections and working relationships amongst TSOs (see Chapter 12).
Third Sector Trends in North West England
27
6 Purpose and beneficiaries of TS0s
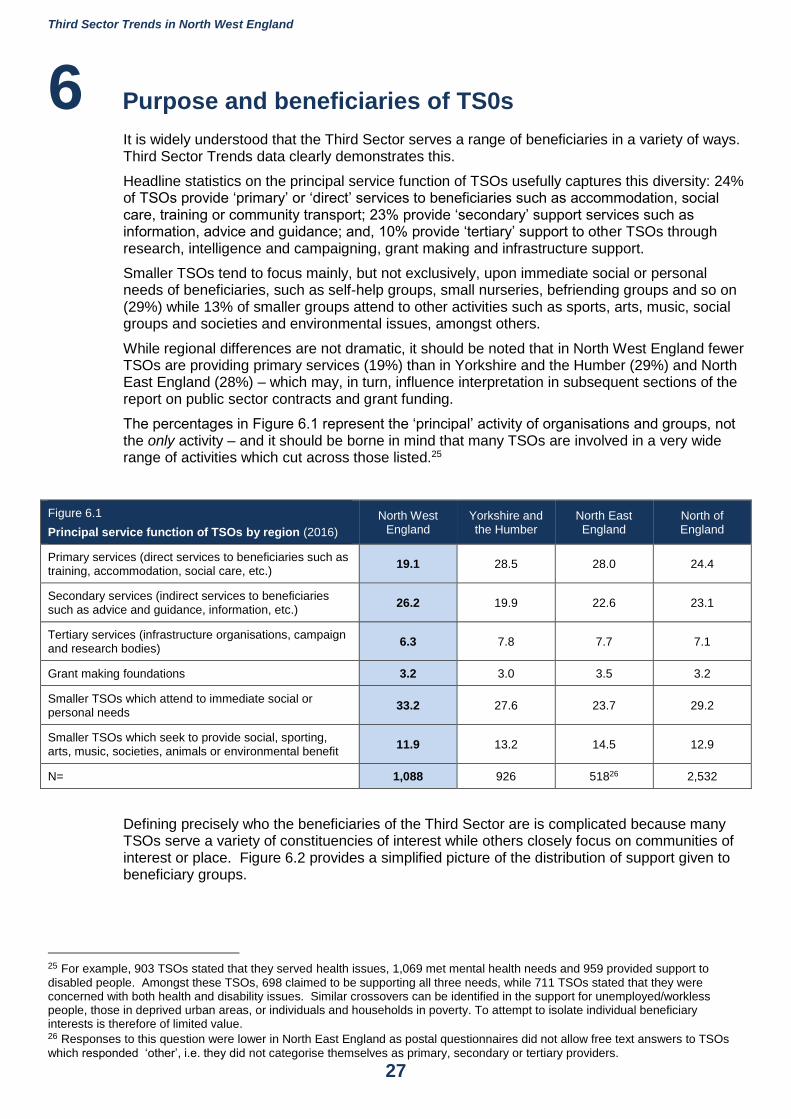
It is widely understood that the Third Sector serves a range of beneficiaries in a variety of ways. Third Sector Trends data clearly demonstrates this.
Headline statistics on the principal service function of TSOs usefully captures this diversity: 24% of TSOs provide ‘primary’ or ‘direct’ services to beneficiaries such as accommodation, social care, training or community transport; 23% provide ‘secondary’ support services such as information, advice and guidance; and, 10% provide ‘tertiary’ support to other TSOs through research, intelligence and campaigning, grant making and infrastructure support.
Smaller TSOs tend to focus mainly, but not exclusively, upon immediate social or personal needs of beneficiaries, such as self-help groups, small nurseries, befriending groups and so on (29%) while 13% of smaller groups attend to other activities such as sports, arts, music, social groups and societies and environmental issues, amongst others.
While regional differences are not dramatic, it should be noted that in North West England fewer TSOs are providing primary services (19%) than in Yorkshire and the Humber (29%) and North East England (28%) – which may, in turn, influence interpretation in subsequent sections of the report on public sector contracts and grant funding.
The percentages in Figure 6.1 represent the ‘principal’ activity of organisations and groups, not the only activity – and it should be borne in mind that many TSOs are involved in a very wide range of activities which cut across those listed.25
Figure 6.1
Principal service function of TSOs by region (2016)
North West England
Yorkshire and the Humber
North East England
North of England
Primary services (direct services to beneficiaries such as training, accommodation, social care, etc.)
19.1 28.5 28.0 24.4
Secondary services (indirect services to beneficiaries such as advice and guidance, information, etc.)
26.2 19.9 22.6 23.1
Tertiary services (infrastructure organisations, campaign and research bodies)
6.3 7.8 7.7 7.1
Grant making foundations 3.2 3.0 3.5 3.2
Smaller TSOs which attend to immediate social or personal needs
33.2 27.6 23.7 29.2
Smaller TSOs which seek to provide social, sporting, arts, music, societies, animals or environmental benefit
11.9 13.2 14.5 12.9
N= 1,088 926 51826 2,532
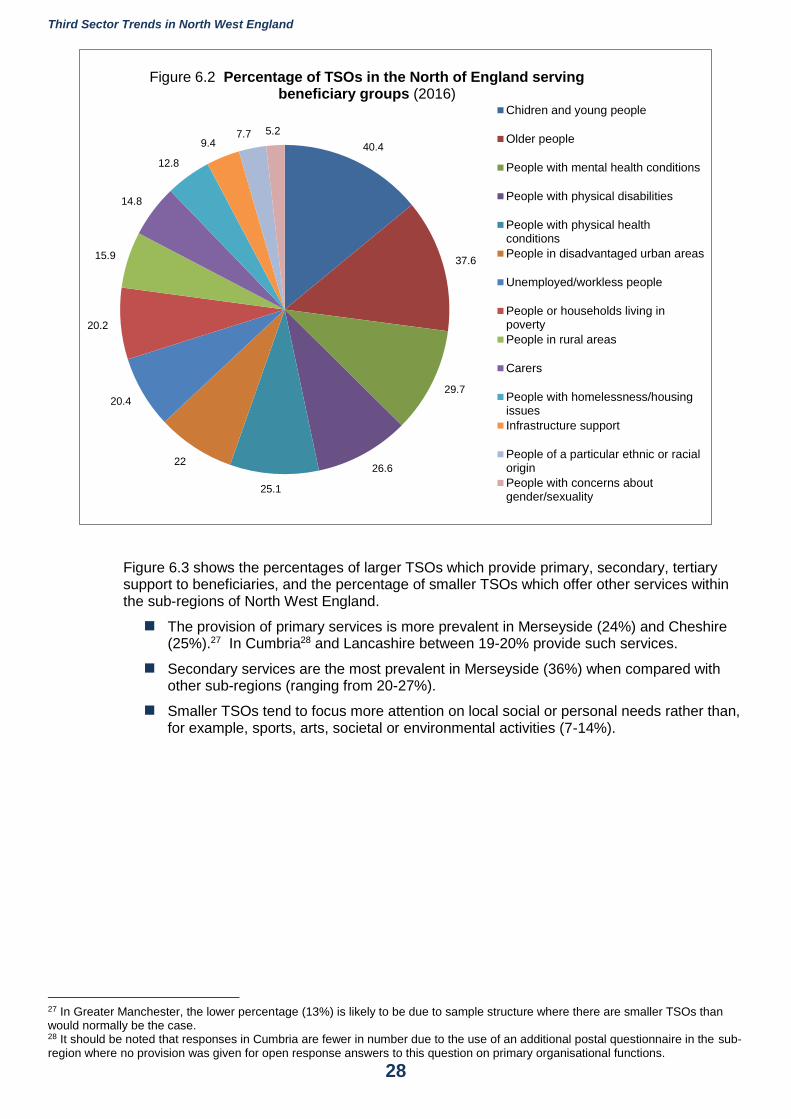
Defining precisely who the beneficiaries of the Third Sector are is complicated because many TSOs serve a variety of constituencies of interest while others closely focus on communities of interest or place. Figure 6.2 provides a simplified picture of the distribution of support given to beneficiary groups.
25 For example, 903 TSOs stated that they served health issues, 1,069 met mental health needs and 959 provided support to
disabled people. Amongst these TSOs, 698 claimed to be supporting all three needs, while 711 TSOs stated that they were concerned with both health and disability issues. Similar crossovers can be identified in the support for unemployed/workless people, those in deprived urban areas, or individuals and households in poverty. To attempt to isolate individual beneficiary interests is therefore of limited value. 26 Responses to this question were lower in North East England as postal questionnaires did not allow free text answers to TSOs
which responded ‘other’, i.e. they did not categorise themselves as primary, secondary or tertiary providers.
Third Sector Trends in North West England
28
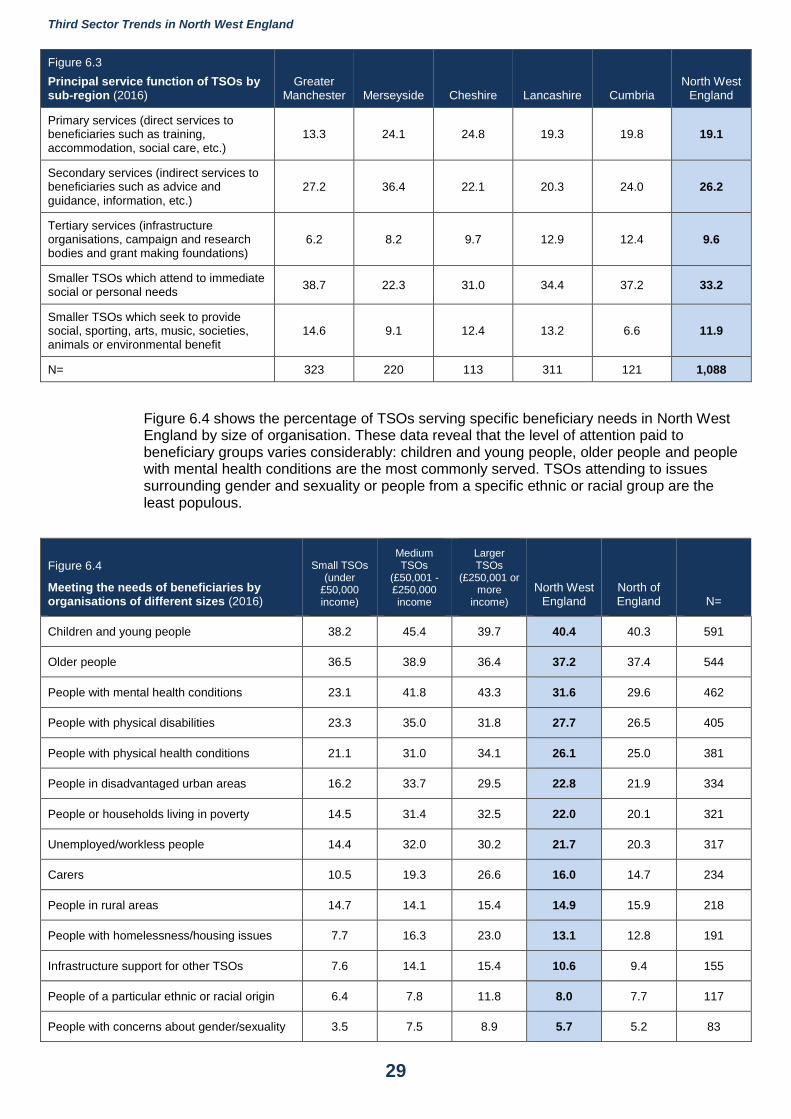
Figure 6.3 shows the percentages of larger TSOs which provide primary, secondary, tertiary support to beneficiaries, and the percentage of smaller TSOs which offer other services within the sub-regions of North West England.
The provision of primary services is more prevalent in Merseyside (24%) and Cheshire (25%).27 In Cumbria28 and Lancashire between 19-20% provide such services.
Secondary services are the most prevalent in Merseyside (36%) when compared with other sub-regions (ranging from 20-27%).
Smaller TSOs tend to focus more attention on local social or personal needs rather than, for example, sports, arts, societal or environmental activities (7-14%).
27 In Greater Manchester, the lower percentage (13%) is likely to be due to sample structure where there are smaller TSOs than would normally be the case. 28 It should be noted that responses in Cumbria are fewer in number due to the use of an additional postal questionnaire in the sub-region where no provision was given for open response answers to this question on primary organisational functions.
40.4
37.6
29.7
26.6
25.1
22
20.4
20.2
15.9
14.8
12.8
9.47.7 5.2
Figure 6.2 Percentage of TSOs in the North of England serving beneficiary groups (2016)
Chidren and young people
Older people
People with mental health conditions
People with physical disabilities
People with physical healthconditions
People in disadvantaged urban areas
Unemployed/workless people
People or households living inpoverty
People in rural areas
Carers
People with homelessness/housingissues
Infrastructure support
People of a particular ethnic or racialorigin
People with concerns aboutgender/sexuality
Third Sector Trends in North West England
29
Figure 6.3
Principal service function of TSOs by sub-region (2016)
Greater Manchester Merseyside Cheshire Lancashire Cumbria
North West England
Primary services (direct services to beneficiaries such as training, accommodation, social care, etc.)
13.3 24.1 24.8 19.3 19.8 19.1
Secondary services (indirect services to beneficiaries such as advice and
guidance, information, etc.) 27.2 36.4 22.1 20.3 24.0 26.2
Tertiary services (infrastructure organisations, campaign and research bodies and grant making foundations)
6.2 8.2 9.7 12.9 12.4 9.6
Smaller TSOs which attend to immediate social or personal needs
38.7 22.3 31.0 34.4 37.2 33.2
Smaller TSOs which seek to provide social, sporting, arts, music, societies, animals or environmental benefit
14.6 9.1 12.4 13.2 6.6 11.9
N= 323 220 113 311 121 1,088
Figure 6.4 shows the percentage of TSOs serving specific beneficiary needs in North West England by size of organisation. These data reveal that the level of attention paid to beneficiary groups varies considerably: children and young people, older people and people with mental health conditions are the most commonly served. TSOs attending to issues surrounding gender and sexuality or people from a specific ethnic or racial group are the least populous.
Figure 6.4
Meeting the needs of beneficiaries by organisations of different sizes (2016)
Small TSOs (under
£50,000 income)
Medium TSOs
(£50,001 - £250,000 income
Larger TSOs
(£250,001 or more
income)
North West England
North of England N=
Children and young people 38.2 45.4 39.7 40.4 40.3 591
Older people 36.5 38.9 36.4 37.2 37.4 544
People with mental health conditions 23.1 41.8 43.3 31.6 29.6 462
People with physical disabilities 23.3 35.0 31.8 27.7 26.5 405
People with physical health conditions 21.1 31.0 34.1 26.1 25.0 381
People in disadvantaged urban areas 16.2 33.7 29.5 22.8 21.9 334
People or households living in poverty 14.5 31.4 32.5 22.0 20.1 321
Unemployed/workless people 14.4 32.0 30.2 21.7 20.3 317
Carers 10.5 19.3 26.6 16.0 14.7 234
People in rural areas 14.7 14.1 15.4 14.9 15.9 218
People with homelessness/housing issues 7.7 16.3 23.0 13.1 12.8 191
Infrastructure support for other TSOs 7.6 14.1 15.4 10.6 9.4 155
People of a particular ethnic or racial origin 6.4 7.8 11.8 8.0 7.7 117
People with concerns about gender/sexuality 3.5 7.5 8.9 5.7 5.2 83
Third Sector Trends in North West England
30
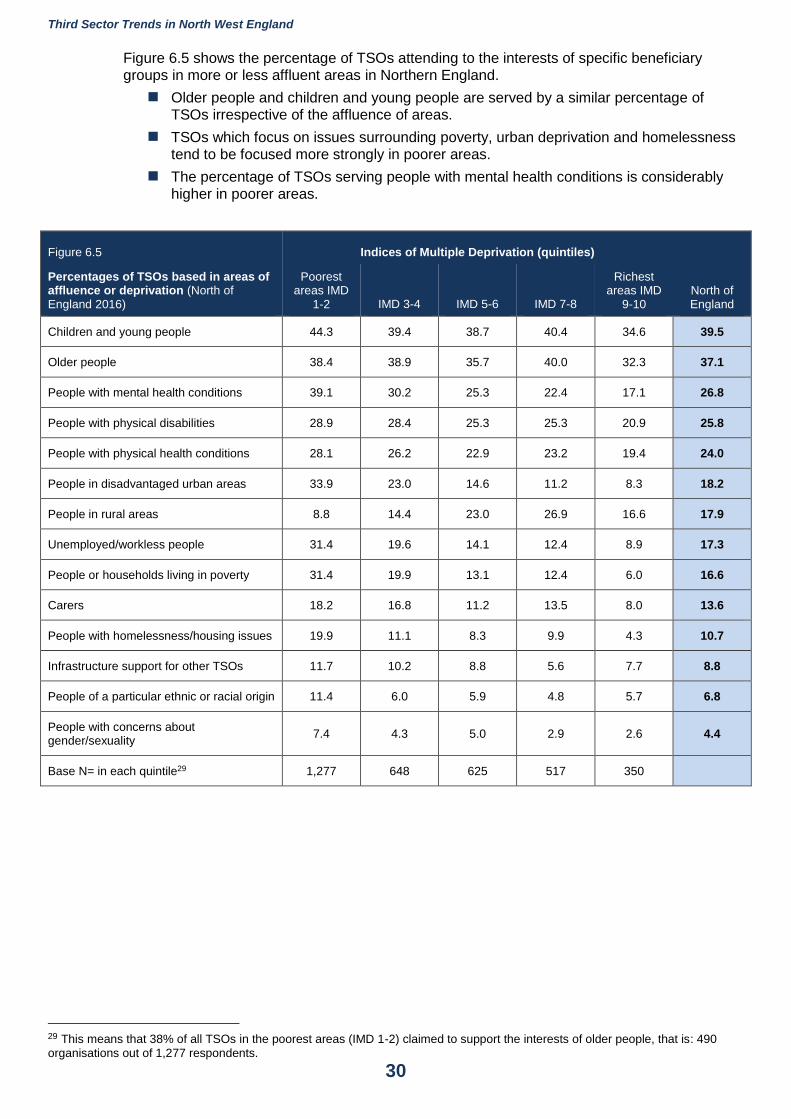
Figure 6.5 shows the percentage of TSOs attending to the interests of specific beneficiary groups in more or less affluent areas in Northern England.
Older people and children and young people are served by a similar percentage of TSOs irrespective of the affluence of areas.
TSOs which focus on issues surrounding poverty, urban deprivation and homelessness tend to be focused more strongly in poorer areas.
The percentage of TSOs serving people with mental health conditions is considerably higher in poorer areas.
Figure 6.5 Indices of Multiple Deprivation (quintiles)
Percentages of TSOs based in areas of affluence or deprivation (North of England 2016)
Poorest areas IMD
1-2 IMD 3-4 IMD 5-6 IMD 7-8
Richest areas IMD
9-10 North of England
Children and young people 44.3 39.4 38.7 40.4 34.6 39.5
Older people 38.4 38.9 35.7 40.0 32.3 37.1
People with mental health conditions 39.1 30.2 25.3 22.4 17.1 26.8
People with physical disabilities 28.9 28.4 25.3 25.3 20.9 25.8
People with physical health conditions 28.1 26.2 22.9 23.2 19.4 24.0
People in disadvantaged urban areas 33.9 23.0 14.6 11.2 8.3 18.2
People in rural areas 8.8 14.4 23.0 26.9 16.6 17.9
Unemployed/workless people 31.4 19.6 14.1 12.4 8.9 17.3
People or households living in poverty 31.4 19.9 13.1 12.4 6.0 16.6
Carers 18.2 16.8 11.2 13.5 8.0 13.6
People with homelessness/housing issues 19.9 11.1 8.3 9.9 4.3 10.7
Infrastructure support for other TSOs 11.7 10.2 8.8 5.6 7.7 8.8
People of a particular ethnic or racial origin 11.4 6.0 5.9 4.8 5.7 6.8
People with concerns about gender/sexuality
7.4 4.3 5.0 2.9 2.6 4.4
Base N= in each quintile29 1,277 648 625 517 350
29 This means that 38% of all TSOs in the poorest areas (IMD 1-2) claimed to support the interests of older people, that is: 490
organisations out of 1,277 respondents.
Third Sector Trends in North West England
31
Summary
This chapter has shown that the Third Sector serves a wide range of beneficiaries. But it has been demonstrated that it is unwise to analyse sector activity by focusing on areas of service to individual beneficiary groups because TSOs often serve a wide range of beneficiaries in the course of their work.
The approach to practice by TSOs is shaped to a large degree by their scale as organisations. Larger TSOs are more likely to deliver direct or ‘primary’ services to their beneficiaries (such as accommodation, training, social care, etc.).
There are clear variations in the extent to which TSOs serve beneficiary groups. Children and young people and older people are the most comprehensively supported by the sector in North West England.
The extent to which TSOs attend to issues is shaped to some extent by the level of affluence of areas within which they work. Attention to issues such as poverty, homelessness, urban deprivation, as would be expected, tends to be concentrated in the least affluent areas.
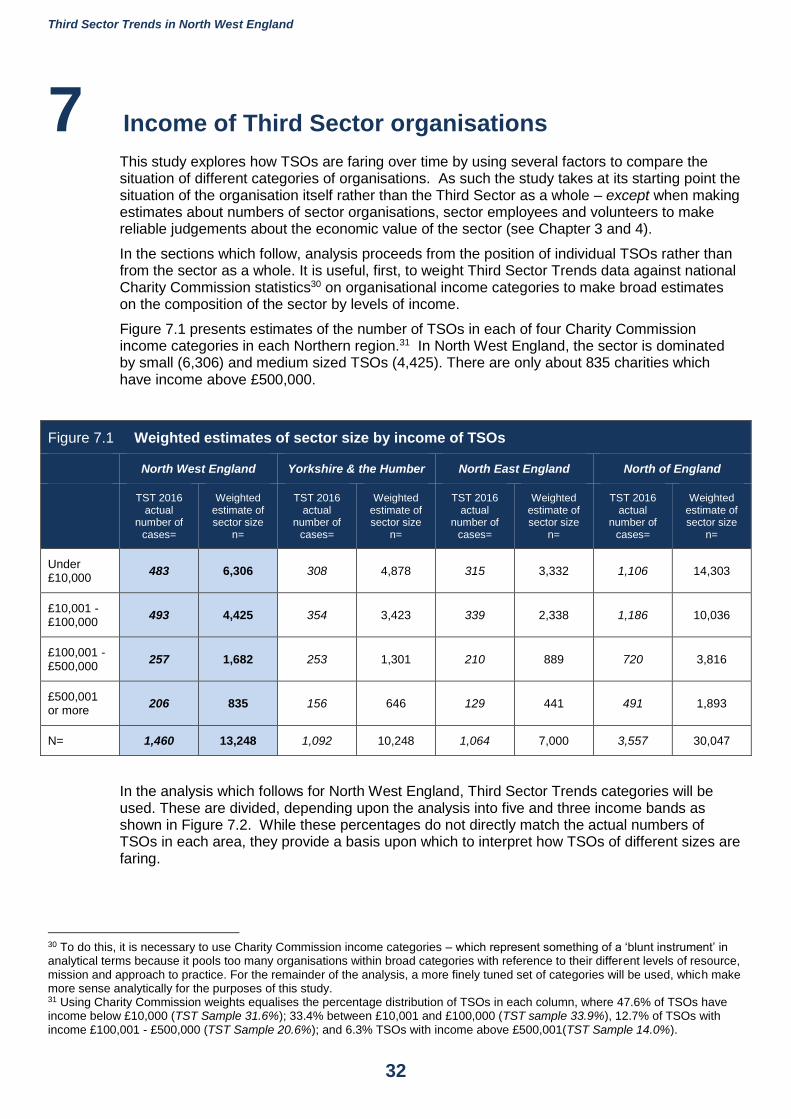
Third Sector Trends in North West England
32
7 Income of Third Sector organisations
This study explores how TSOs are faring over time by using several factors to compare the situation of different categories of organisations. As such the study takes at its starting point the situation of the organisation itself rather than the Third Sector as a whole – except when making estimates about numbers of sector organisations, sector employees and volunteers to make reliable judgements about the economic value of the sector (see Chapter 3 and 4).
In the sections which follow, analysis proceeds from the position of individual TSOs rather than from the sector as a whole. It is useful, first, to weight Third Sector Trends data against national Charity Commission statistics30 on organisational income categories to make broad estimates on the composition of the sector by levels of income.
Figure 7.1 presents estimates of the number of TSOs in each of four Charity Commission income categories in each Northern region.31 In North West England, the sector is dominated by small (6,306) and medium sized TSOs (4,425). There are only about 835 charities which have income above £500,000.
Figure 7.1 Weighted estimates of sector size by income of TSOs
North West England Yorkshire & the Humber North East England North of England
TST 2016 actual
number of cases=
Weighted estimate of sector size
n=
TST 2016 actual
number of cases=
Weighted estimate of sector size
n=
TST 2016 actual
number of cases=
Weighted estimate of sector size
n=
TST 2016 actual
number of cases=
Weighted estimate of sector size
n=
Under £10,000
483 6,306 308 4,878 315 3,332 1,106 14,303
£10,001 - £100,000
493 4,425 354 3,423 339 2,338 1,186 10,036
£100,001 - £500,000
257 1,682 253 1,301 210 889 720 3,816
£500,001 or more
206 835 156 646 129 441 491 1,893
N= 1,460 13,248 1,092 10,248 1,064 7,000 3,557 30,047
In the analysis which follows for North West England, Third Sector Trends categories will be used. These are divided, depending upon the analysis into five and three income bands as shown in Figure 7.2. While these percentages do not directly match the actual numbers of TSOs in each area, they provide a basis upon which to interpret how TSOs of different sizes are faring.
30 To do this, it is necessary to use Charity Commission income categories – which represent something of a ‘blunt instrument’ in analytical terms because it pools too many organisations within broad categories with reference to their different levels of resource, mission and approach to practice. For the remainder of the analysis, a more finely tuned set of categories will be used, which make more sense analytically for the purposes of this study. 31 Using Charity Commission weights equalises the percentage distribution of TSOs in each column, where 47.6% of TSOs have income below £10,000 (TST Sample 31.6%); 33.4% between £10,001 and £100,000 (TST sample 33.9%), 12.7% of TSOs with income £100,001 - £500,000 (TST Sample 20.6%); and 6.3% TSOs with income above £500,001(TST Sample 14.0%).
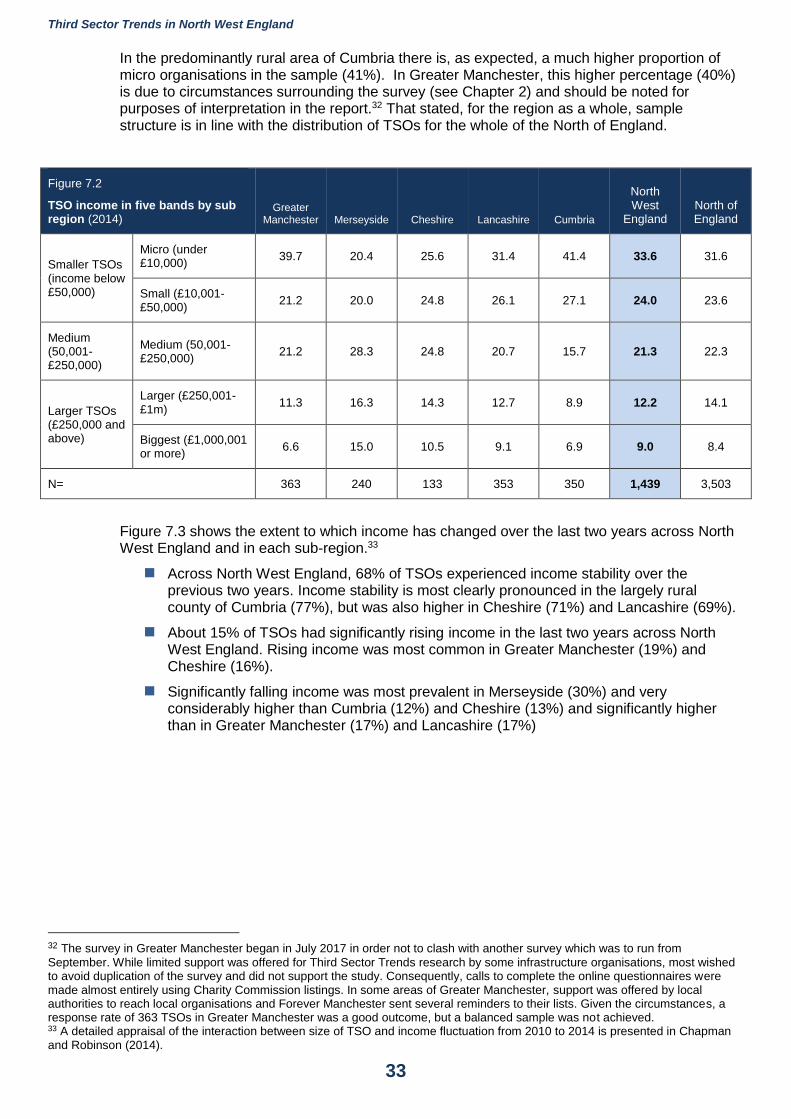
Third Sector Trends in North West England
33
In the predominantly rural area of Cumbria there is, as expected, a much higher proportion of micro organisations in the sample (41%). In Greater Manchester, this higher percentage (40%) is due to circumstances surrounding the survey (see Chapter 2) and should be noted for purposes of interpretation in the report.32 That stated, for the region as a whole, sample structure is in line with the distribution of TSOs for the whole of the North of England.
Figure 7.2
TSO income in five bands by sub region (2014)
Greater Manchester Merseyside Cheshire Lancashire Cumbria
North West
England North of England
Smaller TSOs (income below £50,000)
Micro (under £10,000)
39.7 20.4 25.6 31.4 41.4 33.6 31.6
Small (£10,001-£50,000)
21.2 20.0 24.8 26.1 27.1 24.0 23.6
Medium (50,001-£250,000)
Medium (50,001-£250,000)
21.2 28.3 24.8 20.7 15.7 21.3 22.3
Larger TSOs (£250,000 and above)
Larger (£250,001-£1m)
11.3 16.3 14.3 12.7 8.9 12.2 14.1
Biggest (£1,000,001 or more)
6.6 15.0 10.5 9.1 6.9 9.0 8.4
N= 363 240 133 353 350 1,439 3,503
Figure 7.3 shows the extent to which income has changed over the last two years across North West England and in each sub-region.33
Across North West England, 68% of TSOs experienced income stability over the previous two years. Income stability is most clearly pronounced in the largely rural county of Cumbria (77%), but was also higher in Cheshire (71%) and Lancashire (69%).
About 15% of TSOs had significantly rising income in the last two years across North West England. Rising income was most common in Greater Manchester (19%) and Cheshire (16%).
Significantly falling income was most prevalent in Merseyside (30%) and very considerably higher than Cumbria (12%) and Cheshire (13%) and significantly higher than in Greater Manchester (17%) and Lancashire (17%)
32 The survey in Greater Manchester began in July 2017 in order not to clash with another survey which was to run from
September. While limited support was offered for Third Sector Trends research by some infrastructure organisations, most wished to avoid duplication of the survey and did not support the study. Consequently, calls to complete the online questionnaires were made almost entirely using Charity Commission listings. In some areas of Greater Manchester, support was offered by local authorities to reach local organisations and Forever Manchester sent several reminders to their lists. Given the circumstances, a response rate of 363 TSOs in Greater Manchester was a good outcome, but a balanced sample was not achieved. 33 A detailed appraisal of the interaction between size of TSO and income fluctuation from 2010 to 2014 is presented in Chapman and Robinson (2014).
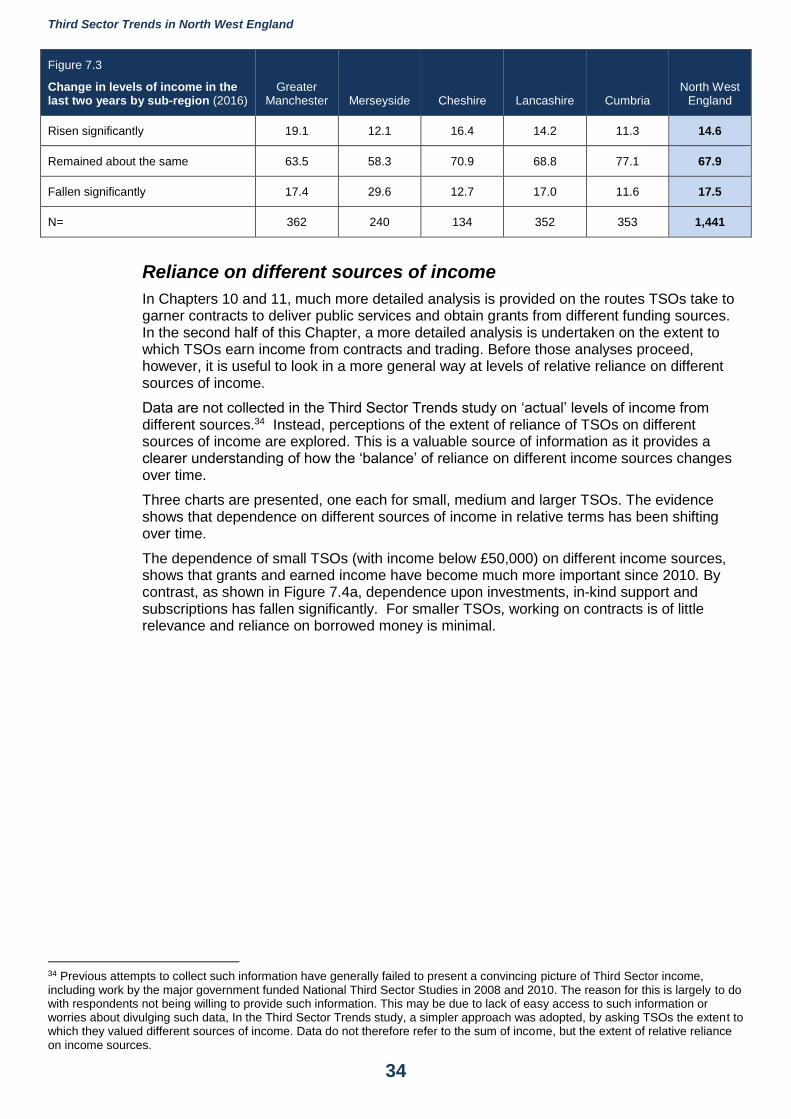
Third Sector Trends in North West England
34
Figure 7.3
Change in levels of income in the last two years by sub-region (2016)
Greater Manchester Merseyside Cheshire Lancashire Cumbria
North West England
Risen significantly 19.1 12.1 16.4 14.2 11.3 14.6
Remained about the same 63.5 58.3 70.9 68.8 77.1 67.9
Fallen significantly 17.4 29.6 12.7 17.0 11.6 17.5
N= 362 240 134 352 353 1,441
Reliance on different sources of income
In Chapters 10 and 11, much more detailed analysis is provided on the routes TSOs take to garner contracts to deliver public services and obtain grants from different funding sources. In the second half of this Chapter, a more detailed analysis is undertaken on the extent to which TSOs earn income from contracts and trading. Before those analyses proceed, however, it is useful to look in a more general way at levels of relative reliance on different sources of income.
Data are not collected in the Third Sector Trends study on ‘actual’ levels of income from different sources.34 Instead, perceptions of the extent of reliance of TSOs on different sources of income are explored. This is a valuable source of information as it provides a clearer understanding of how the ‘balance’ of reliance on different income sources changes over time.
Three charts are presented, one each for small, medium and larger TSOs. The evidence shows that dependence on different sources of income in relative terms has been shifting over time.
The dependence of small TSOs (with income below £50,000) on different income sources, shows that grants and earned income have become much more important since 2010. By contrast, as shown in Figure 7.4a, dependence upon investments, in-kind support and subscriptions has fallen significantly. For smaller TSOs, working on contracts is of little relevance and reliance on borrowed money is minimal.
34 Previous attempts to collect such information have generally failed to present a convincing picture of Third Sector income, including work by the major government funded National Third Sector Studies in 2008 and 2010. The reason for this is largely to do with respondents not being willing to provide such information. This may be due to lack of easy access to such information or worries about divulging such data, In the Third Sector Trends study, a simpler approach was adopted, by asking TSOs the extent to which they valued different sources of income. Data do not therefore refer to the sum of income, but the extent of relative reliance on income sources.
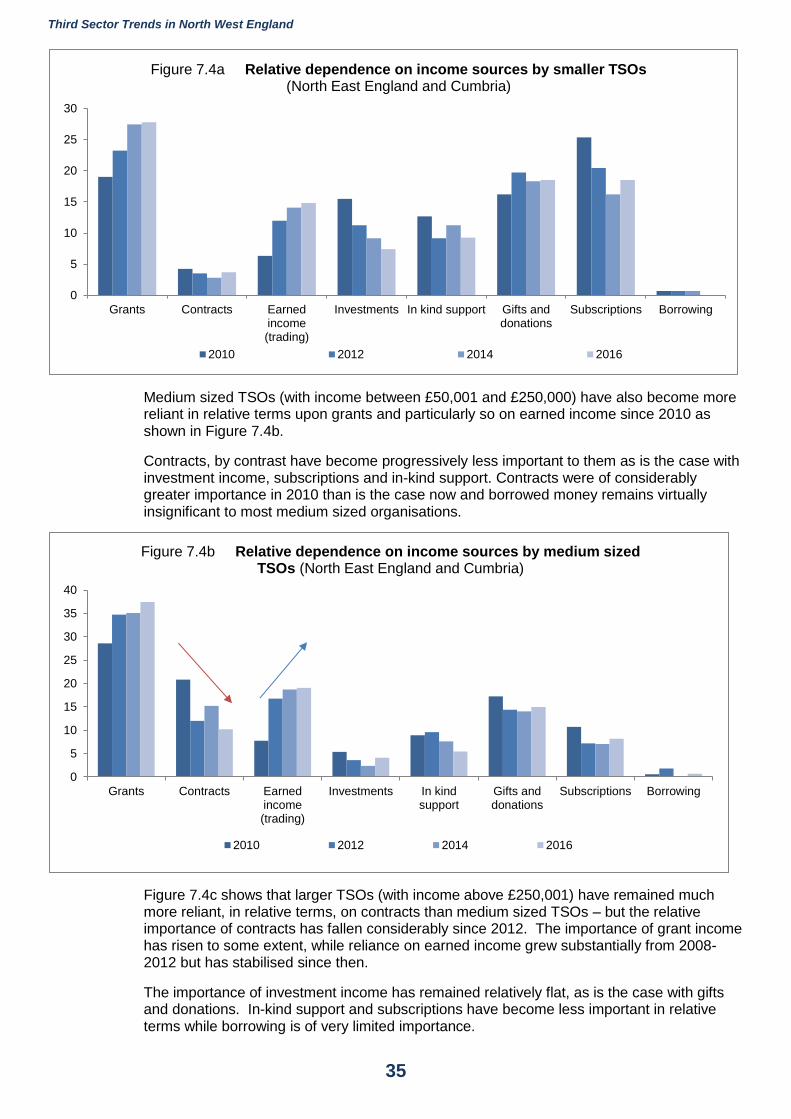
Third Sector Trends in North West England
35
Medium sized TSOs (with income between £50,001 and £250,000) have also become more reliant in relative terms upon grants and particularly so on earned income since 2010 as shown in Figure 7.4b.
Contracts, by contrast have become progressively less important to them as is the case with investment income, subscriptions and in-kind support. Contracts were of considerably greater importance in 2010 than is the case now and borrowed money remains virtually insignificant to most medium sized organisations.
Figure 7.4c shows that larger TSOs (with income above £250,001) have remained much more reliant, in relative terms, on contracts than medium sized TSOs – but the relative importance of contracts has fallen considerably since 2012. The importance of grant income has risen to some extent, while reliance on earned income grew substantially from 2008-2012 but has stabilised since then.
The importance of investment income has remained relatively flat, as is the case with gifts and donations. In-kind support and subscriptions have become less important in relative terms while borrowing is of very limited importance.
0
5
10
15
20
25
30
Grants Contracts Earnedincome(trading)
Investments In kind support Gifts anddonations
Subscriptions Borrowing
Figure 7.4a Relative dependence on income sources by smaller TSOs (North East England and Cumbria)
2010 2012 2014 2016
0
5
10
15
20
25
30
35
40
Grants Contracts Earnedincome(trading)
Investments In kindsupport
Gifts anddonations
Subscriptions Borrowing
Figure 7.4b Relative dependence on income sources by medium sized TSOs (North East England and Cumbria)
2010 2012 2014 2016
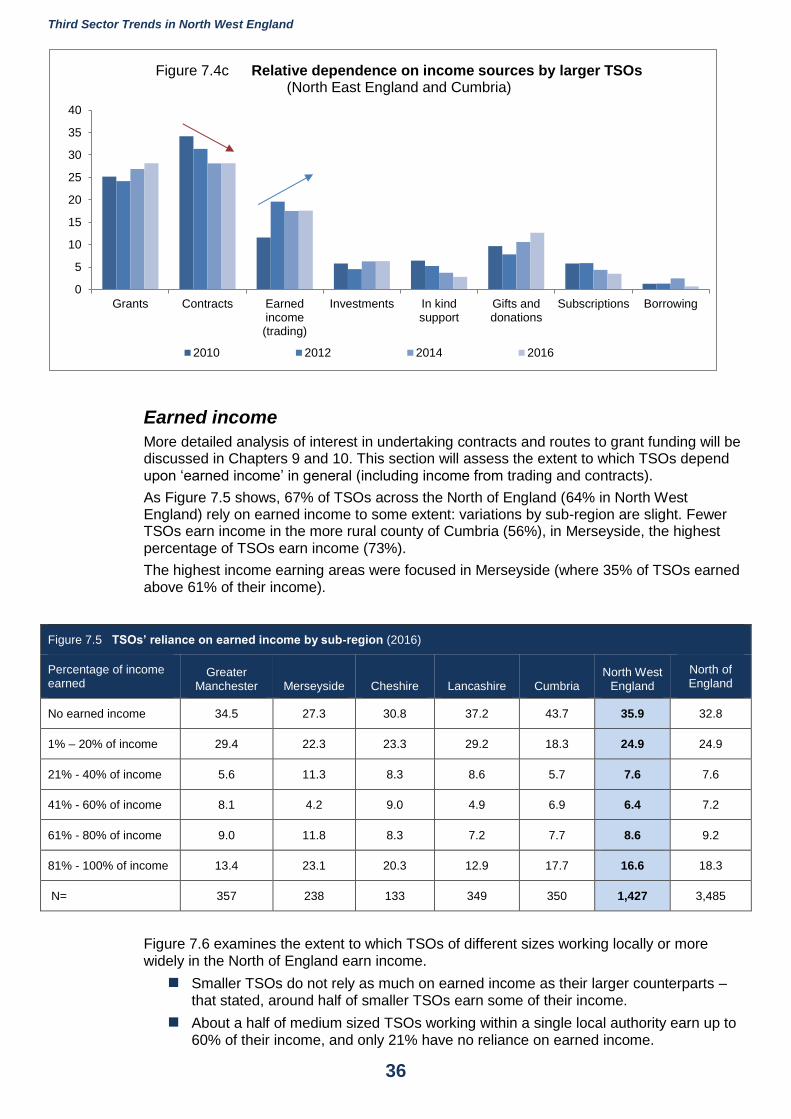
Third Sector Trends in North West England
36
Earned income
More detailed analysis of interest in undertaking contracts and routes to grant funding will be discussed in Chapters 9 and 10. This section will assess the extent to which TSOs depend upon ‘earned income’ in general (including income from trading and contracts).
As Figure 7.5 shows, 67% of TSOs across the North of England (64% in North West England) rely on earned income to some extent: variations by sub-region are slight. Fewer TSOs earn income in the more rural county of Cumbria (56%), in Merseyside, the highest percentage of TSOs earn income (73%).
The highest income earning areas were focused in Merseyside (where 35% of TSOs earned above 61% of their income).
Figure 7.5 TSOs’ reliance on earned income by sub-region (2016)
Percentage of income earned
Greater Manchester Merseyside Cheshire Lancashire Cumbria
North West England
North of England
No earned income 34.5 27.3 30.8 37.2 43.7 35.9 32.8
1% – 20% of income 29.4 22.3 23.3 29.2 18.3 24.9 24.9
21% - 40% of income 5.6 11.3 8.3 8.6 5.7 7.6 7.6
41% - 60% of income 8.1 4.2 9.0 4.9 6.9 6.4 7.2
61% - 80% of income 9.0 11.8 8.3 7.2 7.7 8.6 9.2
81% - 100% of income 13.4 23.1 20.3 12.9 17.7 16.6 18.3
N= 357 238 133 349 350 1,427 3,485
Figure 7.6 examines the extent to which TSOs of different sizes working locally or more widely in the North of England earn income.
Smaller TSOs do not rely as much on earned income as their larger counterparts – that stated, around half of smaller TSOs earn some of their income.
About a half of medium sized TSOs working within a single local authority earn up to 60% of their income, and only 21% have no reliance on earned income.
0
5
10
15
20
25
30
35
40
Grants Contracts Earnedincome(trading)
Investments In kindsupport
Gifts anddonations
Subscriptions Borrowing
Figure 7.4c Relative dependence on income sources by larger TSOs (North East England and Cumbria)
2010 2012 2014 2016
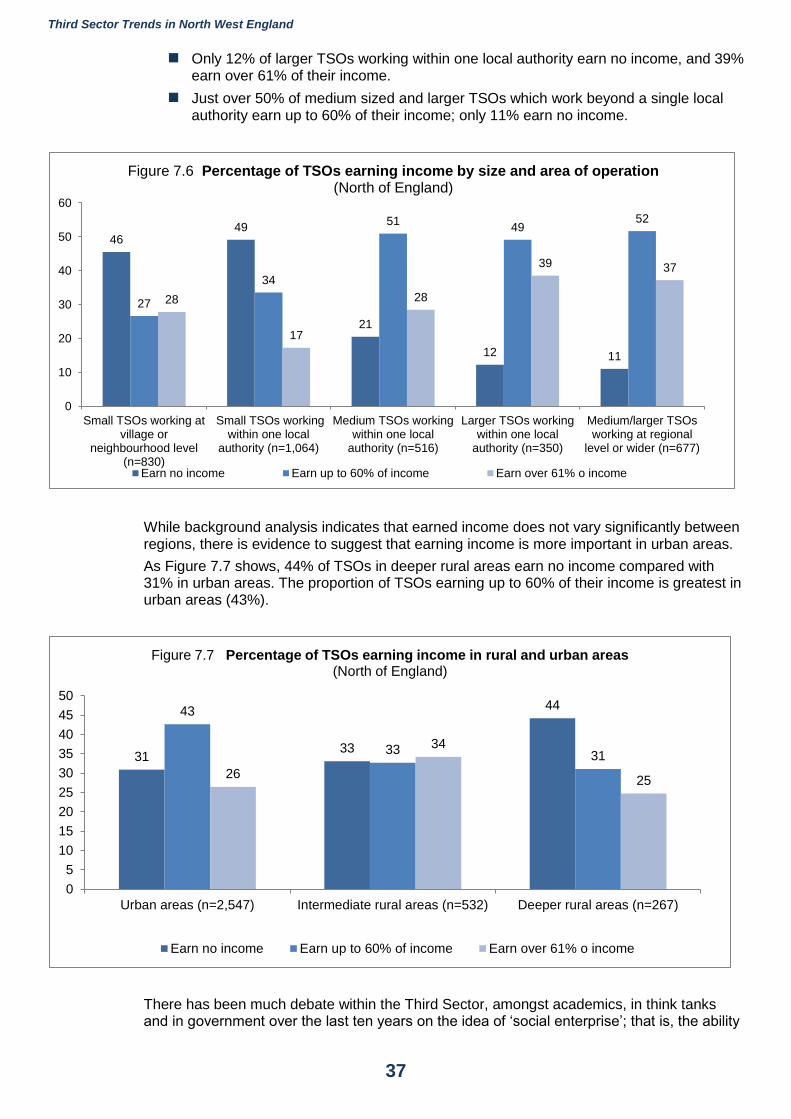
Third Sector Trends in North West England
37
Only 12% of larger TSOs working within one local authority earn no income, and 39% earn over 61% of their income.
Just over 50% of medium sized and larger TSOs which work beyond a single local authority earn up to 60% of their income; only 11% earn no income.
While background analysis indicates that earned income does not vary significantly between regions, there is evidence to suggest that earning income is more important in urban areas.
As Figure 7.7 shows, 44% of TSOs in deeper rural areas earn no income compared with 31% in urban areas. The proportion of TSOs earning up to 60% of their income is greatest in urban areas (43%).
There has been much debate within the Third Sector, amongst academics, in think tanks and in government over the last ten years on the idea of ‘social enterprise’; that is, the ability
4649
21
12 11
27
34
5149
52
28
17
28
39 37
0
10
20
30
40
50
60
Small TSOs working atvillage or
neighbourhood level(n=830)
Small TSOs workingwithin one local
authority (n=1,064)
Medium TSOs workingwithin one local
authority (n=516)
Larger TSOs workingwithin one local
authority (n=350)
Medium/larger TSOsworking at regional
level or wider (n=677)
Figure 7.6 Percentage of TSOs earning income by size and area of operation (North of England)
Earn no income Earn up to 60% of income Earn over 61% o income
3133
4443
3331
26
34
25
0
5
10
15
20
25
30
35
40
45
50
Urban areas (n=2,547) Intermediate rural areas (n=532) Deeper rural areas (n=267)
Figure 7.7 Percentage of TSOs earning income in rural and urban areas(North of England)
Earn no income Earn up to 60% of income Earn over 61% o income
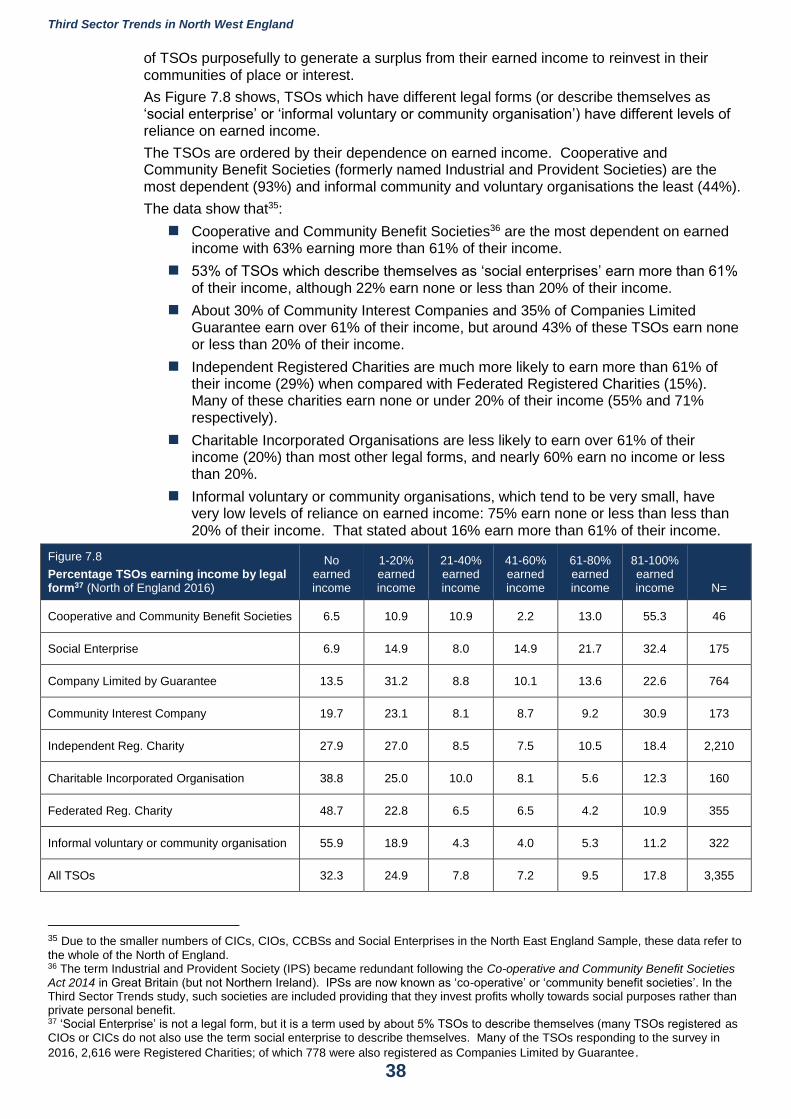
Third Sector Trends in North West England
38
of TSOs purposefully to generate a surplus from their earned income to reinvest in their communities of place or interest.
As Figure 7.8 shows, TSOs which have different legal forms (or describe themselves as ‘social enterprise’ or ‘informal voluntary or community organisation’) have different levels of reliance on earned income.
The TSOs are ordered by their dependence on earned income. Cooperative and Community Benefit Societies (formerly named Industrial and Provident Societies) are the most dependent (93%) and informal community and voluntary organisations the least (44%).
The data show that35:
Cooperative and Community Benefit Societies36 are the most dependent on earned income with 63% earning more than 61% of their income.
53% of TSOs which describe themselves as ‘social enterprises’ earn more than 61% of their income, although 22% earn none or less than 20% of their income.
About 30% of Community Interest Companies and 35% of Companies Limited Guarantee earn over 61% of their income, but around 43% of these TSOs earn none or less than 20% of their income.
Independent Registered Charities are much more likely to earn more than 61% of their income (29%) when compared with Federated Registered Charities (15%). Many of these charities earn none or under 20% of their income (55% and 71% respectively).
Charitable Incorporated Organisations are less likely to earn over 61% of their income (20%) than most other legal forms, and nearly 60% earn no income or less than 20%.
Informal voluntary or community organisations, which tend to be very small, have very low levels of reliance on earned income: 75% earn none or less than less than 20% of their income. That stated about 16% earn more than 61% of their income.
Figure 7.8
Percentage TSOs earning income by legal form37 (North of England 2016)
No earned income
1-20% earned income
21-40% earned income
41-60% earned income
61-80% earned income
81-100% earned income N=
Cooperative and Community Benefit Societies 6.5 10.9 10.9 2.2 13.0 55.3 46
Social Enterprise 6.9 14.9 8.0 14.9 21.7 32.4 175
Company Limited by Guarantee 13.5 31.2 8.8 10.1 13.6 22.6 764
Community Interest Company 19.7 23.1 8.1 8.7 9.2 30.9 173
Independent Reg. Charity 27.9 27.0 8.5 7.5 10.5 18.4 2,210
Charitable Incorporated Organisation 38.8 25.0 10.0 8.1 5.6 12.3 160
Federated Reg. Charity 48.7 22.8 6.5 6.5 4.2 10.9 355
Informal voluntary or community organisation 55.9 18.9 4.3 4.0 5.3 11.2 322
All TSOs 32.3 24.9 7.8 7.2 9.5 17.8 3,355
35 Due to the smaller numbers of CICs, CIOs, CCBSs and Social Enterprises in the North East England Sample, these data refer to
the whole of the North of England. 36 The term Industrial and Provident Society (IPS) became redundant following the Co-operative and Community Benefit Societies Act 2014 in Great Britain (but not Northern Ireland). IPSs are now known as ‘co-operative’ or ‘community benefit societies’. In the Third Sector Trends study, such societies are included providing that they invest profits wholly towards social purposes rather than private personal benefit. 37 ‘Social Enterprise’ is not a legal form, but it is a term used by about 5% TSOs to describe themselves (many TSOs registered as CIOs or CICs do not also use the term social enterprise to describe themselves. Many of the TSOs responding to the survey in
2016, 2,616 were Registered Charities; of which 778 were also registered as Companies Limited by Guarantee.
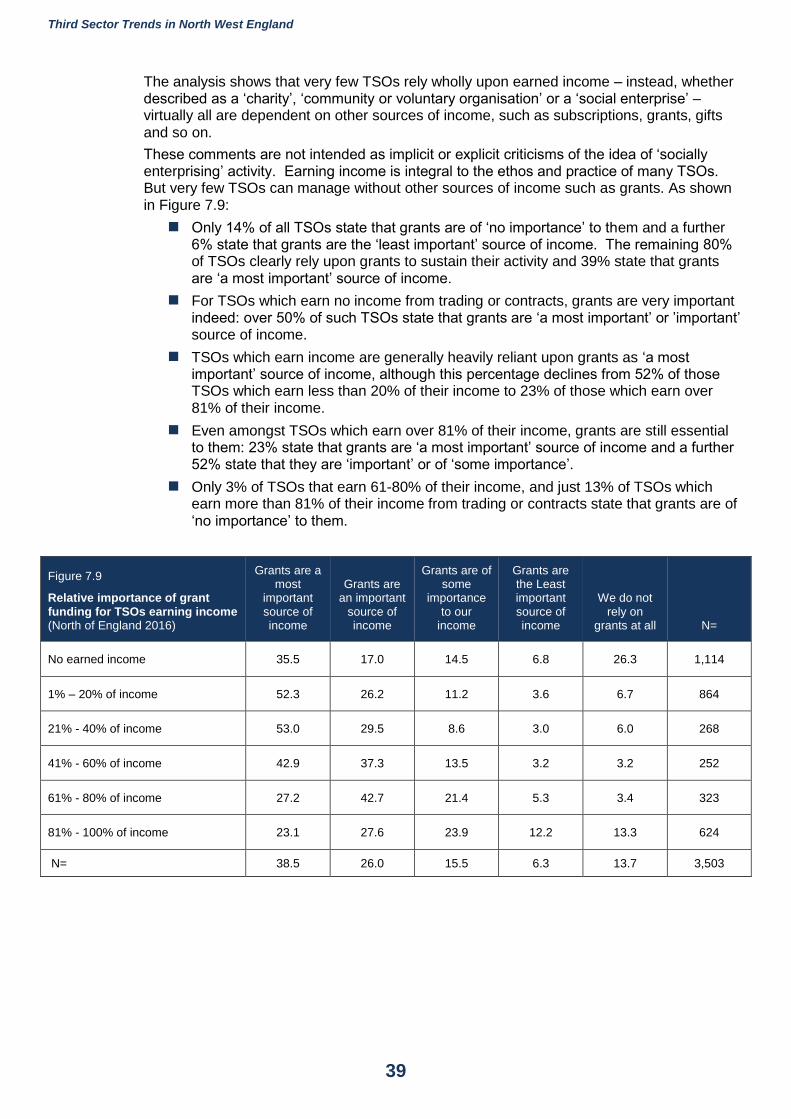
Third Sector Trends in North West England
39
The analysis shows that very few TSOs rely wholly upon earned income – instead, whether described as a ‘charity’, ‘community or voluntary organisation’ or a ‘social enterprise’ – virtually all are dependent on other sources of income, such as subscriptions, grants, gifts and so on.
These comments are not intended as implicit or explicit criticisms of the idea of ‘socially enterprising’ activity. Earning income is integral to the ethos and practice of many TSOs. But very few TSOs can manage without other sources of income such as grants. As shown in Figure 7.9:
Only 14% of all TSOs state that grants are of ‘no importance’ to them and a further 6% state that grants are the ‘least important’ source of income. The remaining 80% of TSOs clearly rely upon grants to sustain their activity and 39% state that grants are ‘a most important’ source of income.
For TSOs which earn no income from trading or contracts, grants are very important indeed: over 50% of such TSOs state that grants are ‘a most important’ or ’important’ source of income.
TSOs which earn income are generally heavily reliant upon grants as ‘a most important’ source of income, although this percentage declines from 52% of those TSOs which earn less than 20% of their income to 23% of those which earn over 81% of their income.
Even amongst TSOs which earn over 81% of their income, grants are still essential to them: 23% state that grants are ‘a most important’ source of income and a further 52% state that they are ‘important’ or of ‘some importance’.
Only 3% of TSOs that earn 61-80% of their income, and just 13% of TSOs which earn more than 81% of their income from trading or contracts state that grants are of ‘no importance’ to them.
Figure 7.9
Relative importance of grant funding for TSOs earning income (North of England 2016)
Grants are a most
important source of income
Grants are an important
source of income
Grants are of some
importance to our
income
Grants are the Least important source of income
We do not rely on
grants at all N=
No earned income 35.5 17.0 14.5 6.8 26.3 1,114
1% – 20% of income 52.3 26.2 11.2 3.6 6.7 864
21% - 40% of income 53.0 29.5 8.6 3.0 6.0 268
41% - 60% of income 42.9 37.3 13.5 3.2 3.2 252
61% - 80% of income 27.2 42.7 21.4 5.3 3.4 323
81% - 100% of income 23.1 27.6 23.9 12.2 13.3 624
N= 38.5 26.0 15.5 6.3 13.7 3,503
Third Sector Trends in North West England
40
Summary
This Chapter has shown that TSOs rely on a wide range of income resources. Grants constitute a major source of income for all sizes of organisations while contracts are generally very important only to the larger TSOs.
Earned income is of importance to many TSOs. Earned income can come from contracts to deliver public services or through other forms of trading. Smaller TSOs are less likely to earn income, which helps to explain why TSOs in rural areas are amongst the least likely to earn income (because more organisations in such areas are small).
It is an obvious point, but one which is too often overlooked in discussions about ‘socially enterprising’ activity, that if TSOs could successfully operate without any other source of income subsidy and produce a viable surplus, then private sector business would, like as not, also be in the marketplace competing for the available profits to be had from such work.
It is entirely legitimate, therefore, that TSOs which are good at earning income, but cannot be expected to survive on that income alone, should continue to seek other sources of financial support, such as grants, gifts, subscriptions and so on to pursue their social mission successfully.
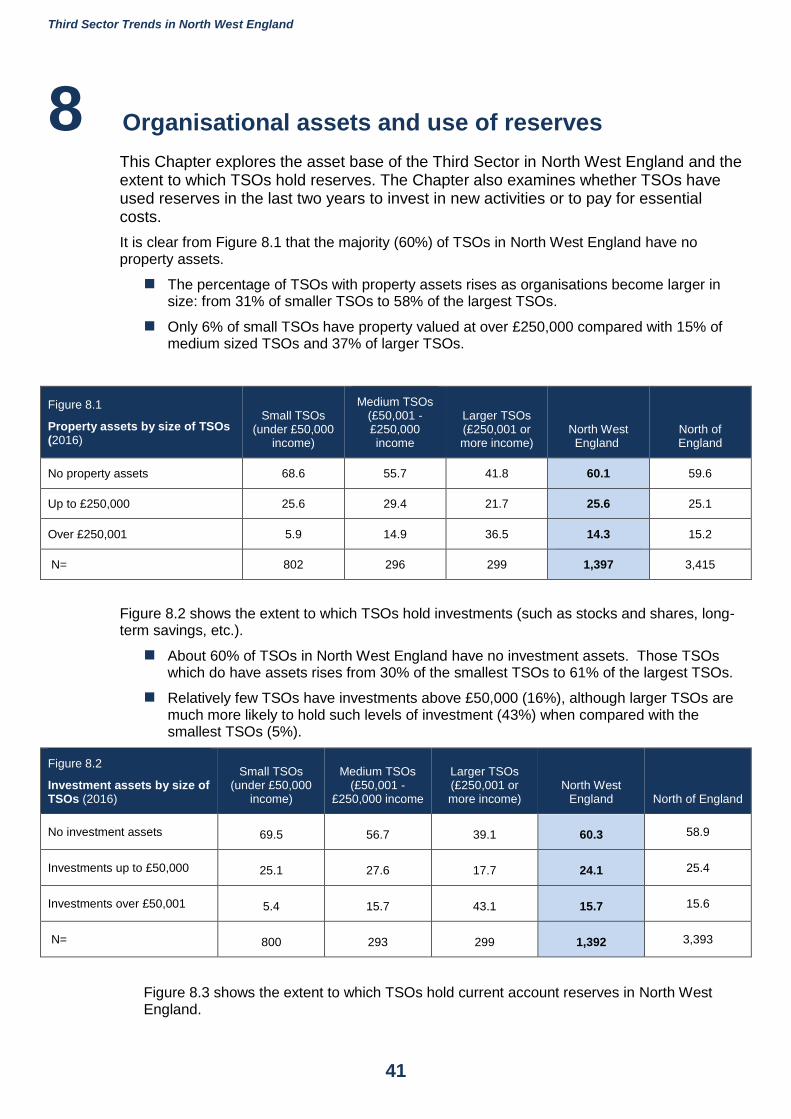
Third Sector Trends in North West England
41
8 Organisational assets and use of reserves
This Chapter explores the asset base of the Third Sector in North West England and the extent to which TSOs hold reserves. The Chapter also examines whether TSOs have used reserves in the last two years to invest in new activities or to pay for essential costs.
It is clear from Figure 8.1 that the majority (60%) of TSOs in North West England have no property assets.
The percentage of TSOs with property assets rises as organisations become larger in size: from 31% of smaller TSOs to 58% of the largest TSOs.
Only 6% of small TSOs have property valued at over £250,000 compared with 15% of medium sized TSOs and 37% of larger TSOs.
Figure 8.1
Property assets by size of TSOs (2016)
Small TSOs (under £50,000
income)
Medium TSOs (£50,001 - £250,000 income
Larger TSOs (£250,001 or more income)
North West England
North of England
No property assets 68.6 55.7 41.8 60.1 59.6
Up to £250,000 25.6 29.4 21.7 25.6 25.1
Over £250,001 5.9 14.9 36.5 14.3 15.2
N= 802 296 299 1,397 3,415
Figure 8.2 shows the extent to which TSOs hold investments (such as stocks and shares, long-term savings, etc.).
About 60% of TSOs in North West England have no investment assets. Those TSOs which do have assets rises from 30% of the smallest TSOs to 61% of the largest TSOs.
Relatively few TSOs have investments above £50,000 (16%), although larger TSOs are much more likely to hold such levels of investment (43%) when compared with the smallest TSOs (5%).
Figure 8.2
Investment assets by size of TSOs (2016)
Small TSOs (under £50,000
income)
Medium TSOs (£50,001 -
£250,000 income
Larger TSOs (£250,001 or more income)
North West England North of England
No investment assets 69.5 56.7 39.1 60.3 58.9
Investments up to £50,000 25.1 27.6 17.7 24.1 25.4
Investments over £50,001 5.4 15.7 43.1 15.7 15.6
N= 800 293 299 1,392 3,393
Figure 8.3 shows the extent to which TSOs hold current account reserves in North West England.
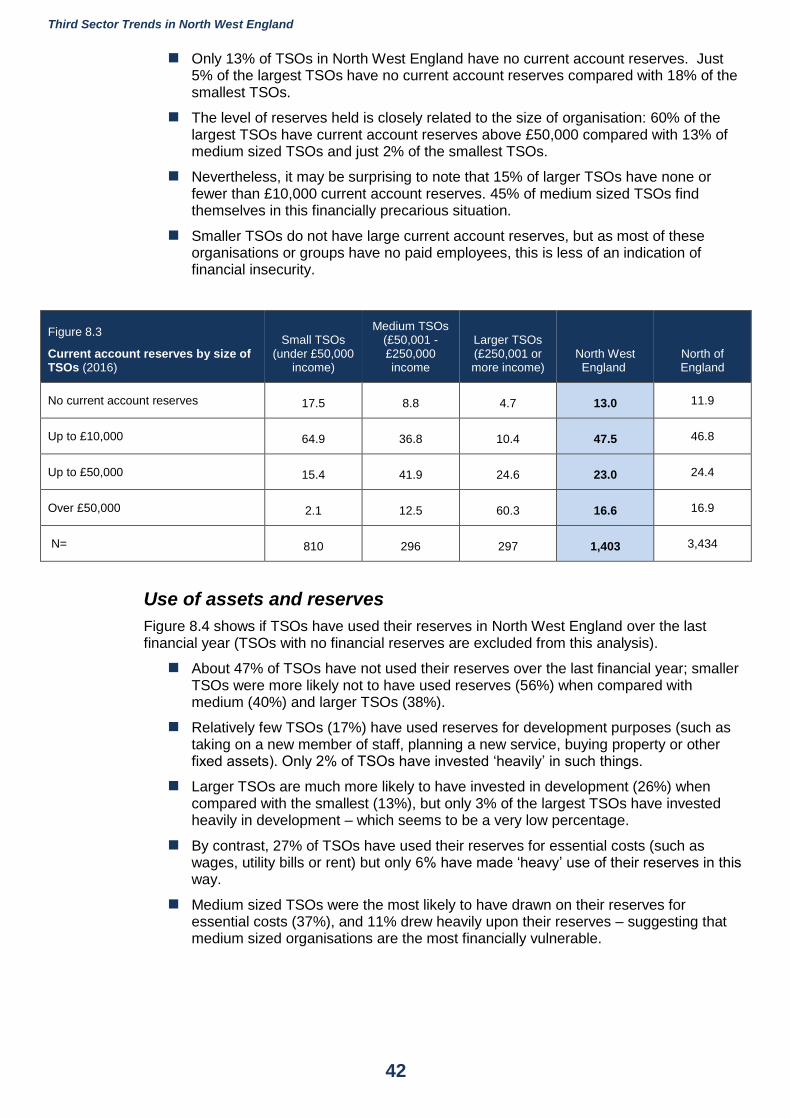
Third Sector Trends in North West England
42
Only 13% of TSOs in North West England have no current account reserves. Just 5% of the largest TSOs have no current account reserves compared with 18% of the smallest TSOs.
The level of reserves held is closely related to the size of organisation: 60% of the largest TSOs have current account reserves above £50,000 compared with 13% of medium sized TSOs and just 2% of the smallest TSOs.
Nevertheless, it may be surprising to note that 15% of larger TSOs have none or fewer than £10,000 current account reserves. 45% of medium sized TSOs find themselves in this financially precarious situation.
Smaller TSOs do not have large current account reserves, but as most of these organisations or groups have no paid employees, this is less of an indication of financial insecurity.
Figure 8.3
Current account reserves by size of TSOs (2016)
Small TSOs (under £50,000
income)
Medium TSOs (£50,001 - £250,000 income
Larger TSOs (£250,001 or more income)
North West England
North of England
No current account reserves 17.5 8.8 4.7 13.0 11.9
Up to £10,000 64.9 36.8 10.4 47.5 46.8
Up to £50,000 15.4 41.9 24.6 23.0 24.4
Over £50,000 2.1 12.5 60.3 16.6 16.9
N= 810 296 297 1,403 3,434
Use of assets and reserves
Figure 8.4 shows if TSOs have used their reserves in North West England over the last financial year (TSOs with no financial reserves are excluded from this analysis).
About 47% of TSOs have not used their reserves over the last financial year; smaller TSOs were more likely not to have used reserves (56%) when compared with medium (40%) and larger TSOs (38%).
Relatively few TSOs (17%) have used reserves for development purposes (such as taking on a new member of staff, planning a new service, buying property or other fixed assets). Only 2% of TSOs have invested ‘heavily’ in such things.
Larger TSOs are much more likely to have invested in development (26%) when compared with the smallest (13%), but only 3% of the largest TSOs have invested heavily in development – which seems to be a very low percentage.
By contrast, 27% of TSOs have used their reserves for essential costs (such as wages, utility bills or rent) but only 6% have made ‘heavy’ use of their reserves in this way.
Medium sized TSOs were the most likely to have drawn on their reserves for essential costs (37%), and 11% drew heavily upon their reserves – suggesting that medium sized organisations are the most financially vulnerable.
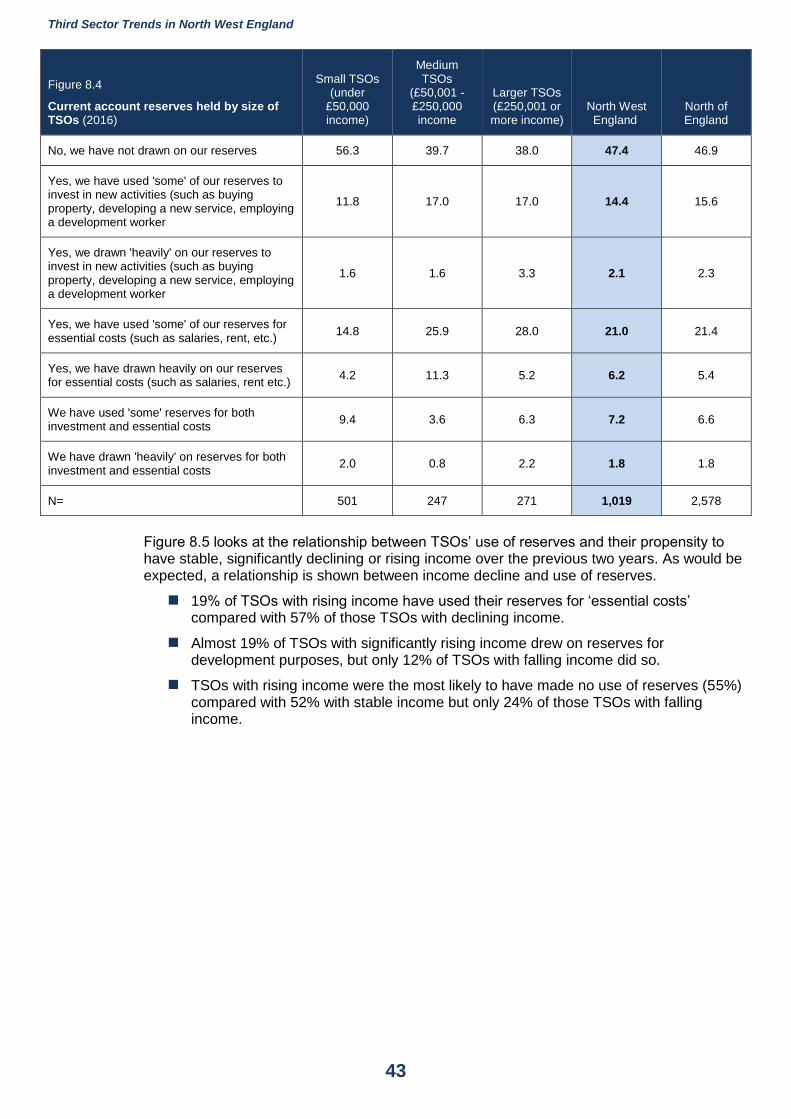
Third Sector Trends in North West England
43
Figure 8.4
Current account reserves held by size of TSOs (2016)
Small TSOs (under
£50,000 income)
Medium TSOs
(£50,001 - £250,000 income
Larger TSOs (£250,001 or more income)
North West England
North of England
No, we have not drawn on our reserves 56.3 39.7 38.0 47.4 46.9
Yes, we have used 'some' of our reserves to invest in new activities (such as buying property, developing a new service, employing a development worker
11.8 17.0 17.0 14.4 15.6
Yes, we drawn 'heavily' on our reserves to invest in new activities (such as buying property, developing a new service, employing a development worker
1.6 1.6 3.3 2.1 2.3
Yes, we have used 'some' of our reserves for essential costs (such as salaries, rent, etc.)
14.8 25.9 28.0 21.0 21.4
Yes, we have drawn heavily on our reserves for essential costs (such as salaries, rent etc.)
4.2 11.3 5.2 6.2 5.4
We have used 'some' reserves for both investment and essential costs
9.4 3.6 6.3 7.2 6.6
We have drawn 'heavily' on reserves for both investment and essential costs
2.0 0.8 2.2 1.8 1.8
N= 501 247 271 1,019 2,578
Figure 8.5 looks at the relationship between TSOs’ use of reserves and their propensity to have stable, significantly declining or rising income over the previous two years. As would be expected, a relationship is shown between income decline and use of reserves.
19% of TSOs with rising income have used their reserves for ‘essential costs’ compared with 57% of those TSOs with declining income.
Almost 19% of TSOs with significantly rising income drew on reserves for development purposes, but only 12% of TSOs with falling income did so.
TSOs with rising income were the most likely to have made no use of reserves (55%) compared with 52% with stable income but only 24% of those TSOs with falling income.
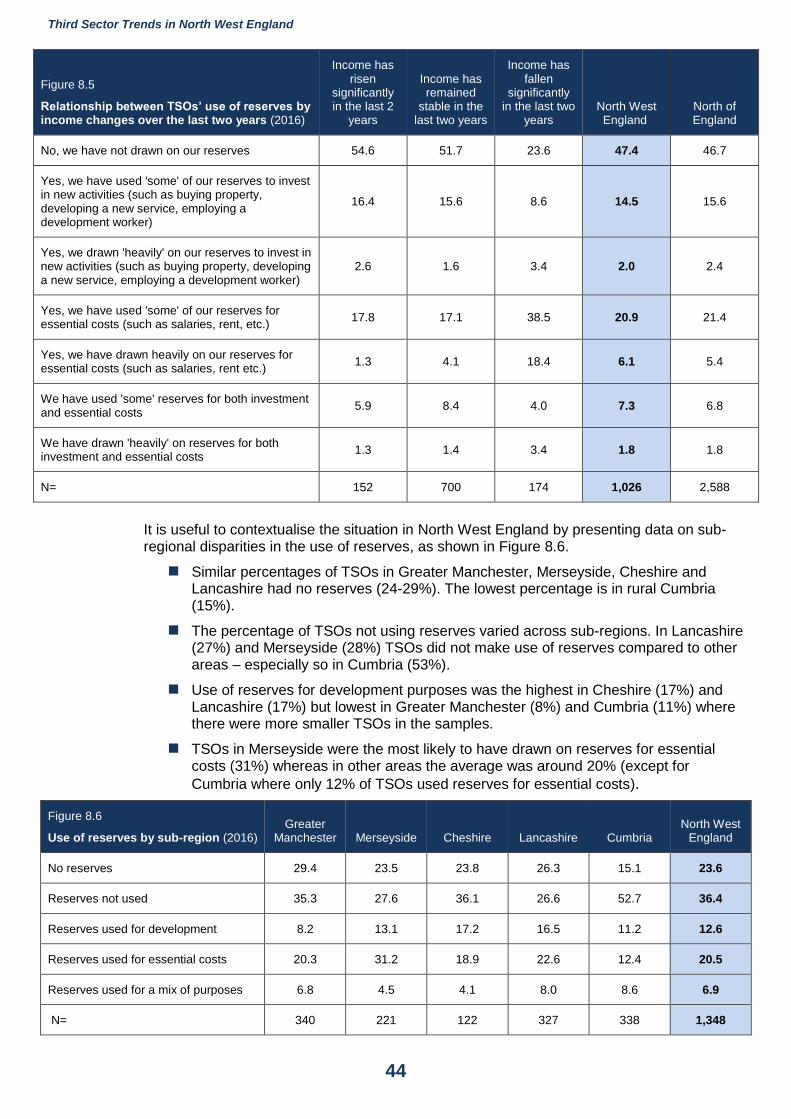
Third Sector Trends in North West England
44
Figure 8.5
Relationship between TSOs’ use of reserves by income changes over the last two years (2016)
Income has risen
significantly in the last 2
years
Income has remained
stable in the last two years
Income has fallen
significantly in the last two
years North West England
North of England
No, we have not drawn on our reserves 54.6 51.7 23.6 47.4 46.7
Yes, we have used 'some' of our reserves to invest in new activities (such as buying property, developing a new service, employing a development worker)
16.4 15.6 8.6 14.5 15.6
Yes, we drawn 'heavily' on our reserves to invest in new activities (such as buying property, developing a new service, employing a development worker)
2.6 1.6 3.4 2.0 2.4
Yes, we have used 'some' of our reserves for essential costs (such as salaries, rent, etc.)
17.8 17.1 38.5 20.9 21.4
Yes, we have drawn heavily on our reserves for essential costs (such as salaries, rent etc.)
1.3 4.1 18.4 6.1 5.4
We have used 'some' reserves for both investment and essential costs
5.9 8.4 4.0 7.3 6.8
We have drawn 'heavily' on reserves for both investment and essential costs
1.3 1.4 3.4 1.8 1.8
N= 152 700 174 1,026 2,588
It is useful to contextualise the situation in North West England by presenting data on sub-regional disparities in the use of reserves, as shown in Figure 8.6.
Similar percentages of TSOs in Greater Manchester, Merseyside, Cheshire and Lancashire had no reserves (24-29%). The lowest percentage is in rural Cumbria (15%).
The percentage of TSOs not using reserves varied across sub-regions. In Lancashire (27%) and Merseyside (28%) TSOs did not make use of reserves compared to other areas – especially so in Cumbria (53%).
Use of reserves for development purposes was the highest in Cheshire (17%) and Lancashire (17%) but lowest in Greater Manchester (8%) and Cumbria (11%) where there were more smaller TSOs in the samples.
TSOs in Merseyside were the most likely to have drawn on reserves for essential costs (31%) whereas in other areas the average was around 20% (except for
Cumbria where only 12% of TSOs used reserves for essential costs).
Figure 8.6
Use of reserves by sub-region (2016) Greater
Manchester Merseyside Cheshire Lancashire Cumbria North West
England
No reserves 29.4 23.5 23.8 26.3 15.1 23.6
Reserves not used 35.3 27.6 36.1 26.6 52.7 36.4
Reserves used for development 8.2 13.1 17.2 16.5 11.2 12.6
Reserves used for essential costs 20.3 31.2 18.9 22.6 12.4 20.5
Reserves used for a mix of purposes 6.8 4.5 4.1 8.0 8.6 6.9
N= 340 221 122 327 338 1,348
Third Sector Trends in North West England
45
Summary
This chapter has shown that the Third Sector is relatively ‘under resourced’ in capital terms. Few TSOs own property or have access to large current account reserves or longer-term investments. Larger TSOs, as would be expected, tend to have bigger stocks of reserves and assets, although about 40% of these organisations have no fixed or investment assets.
It is not, therefore, surprising that TSOs are relatively cautious about their use of reserves for investment purposes in future activity – but this may not always be beneficial for their future financial wellbeing (see Chapter 13).
It is also a matter of concern that almost 29% of TSOs which have reserves are currently drawing upon them for essential costs such as rent, wages, utility bills and so on. Medium sized organisations are the most financially vulnerable in this respect.
Third Sector Trends in North West England
46
9 Factors affecting TSOs’ financial wellbeing
In the 2016 Third Sector Trends study it has been possible to explore organisational strength, stability or vulnerability in a more sophisticated way than for previous regional level studies. This is due to the acquisition of a larger dataset which allows for variables to be created in a multi-dimensional way.
A generalised wellbeing indicator has been produced which considers three factors.
Changes in overall income over the last two years – which broadly define significantly rising or falling income or income stability.
Changes in the numbers of employees – which considers rising or falling numbers of full-time employees (or part-time employees if there are no full-time staff).
The extent to which reserves have been drawn upon for development purposes or to pay for essential costs
Only those TSOs which employ staff are included in the analysis and the majority have income above £50,000 a year.
TSOs in a very strong position: have increasing numbers of employees, have rising income and have only used reserves to invest in future developments.
TSOs in a strong position: have two of the following indicators: rising income, rising employee numbers and use of assets only for investment purposes.
TSOs in a stable position38: have steady income, levels of employment and have not used assets for essential purposes.
TSOs in a weak position: have two or more of the following indicators: falling income, falling numbers of employees and using reserves for essential costs.
TSOs in experiencing mixed fortunes: have both positive and negative indicators, such as falling employment (negative) but rising income (positive).
Figure 9.1 shows that the percentage of TSOs (which are in a strong, stable or vulnerable position) in each of the three regions of Northern England is very similar (in the range of 29-32%).
The percentage of TSOs in a strong or very strong financial position is similar across all three regions: North West England 29%, Yorkshire and the Humber 32% and North East England 29%.
The percentage of TSOs in a vulnerable financial position is also quite similar: North West England 23%, Yorkshire and the Humber 24% and North East England 21%.
Sub-regional data are less reliable because samples are smaller and sample structures differ to some extent. However, it may be noted that in major urban areas, TSOs appear to be more financially vulnerable than in other areas:
o In North West England, TSOs in Greater Manchester (29%) and Merseyside (33%) appear to be much more likely to be in a vulnerable financial position.
o In Yorkshire and the Humber, TSOs in West Yorkshire (27%) and South Yorkshire (27%) appear to be much more likely to be in a vulnerable financial position.
o In North East England, TSOs in Tyne and Wear (25%) and Tees Valley (24%) appear to be much more likely to be in a vulnerable financial position.
38 It is recognised that stability in each of these three factors does not necessarily indicate ‘security’. Many TSOs may have steady income, employee numbers and have not been using reserves, but may have taken on larger numbers of small contracts or small grants to maintain income – meaning that they must work harder to stay in the same position which may or may not be sustainable over time.
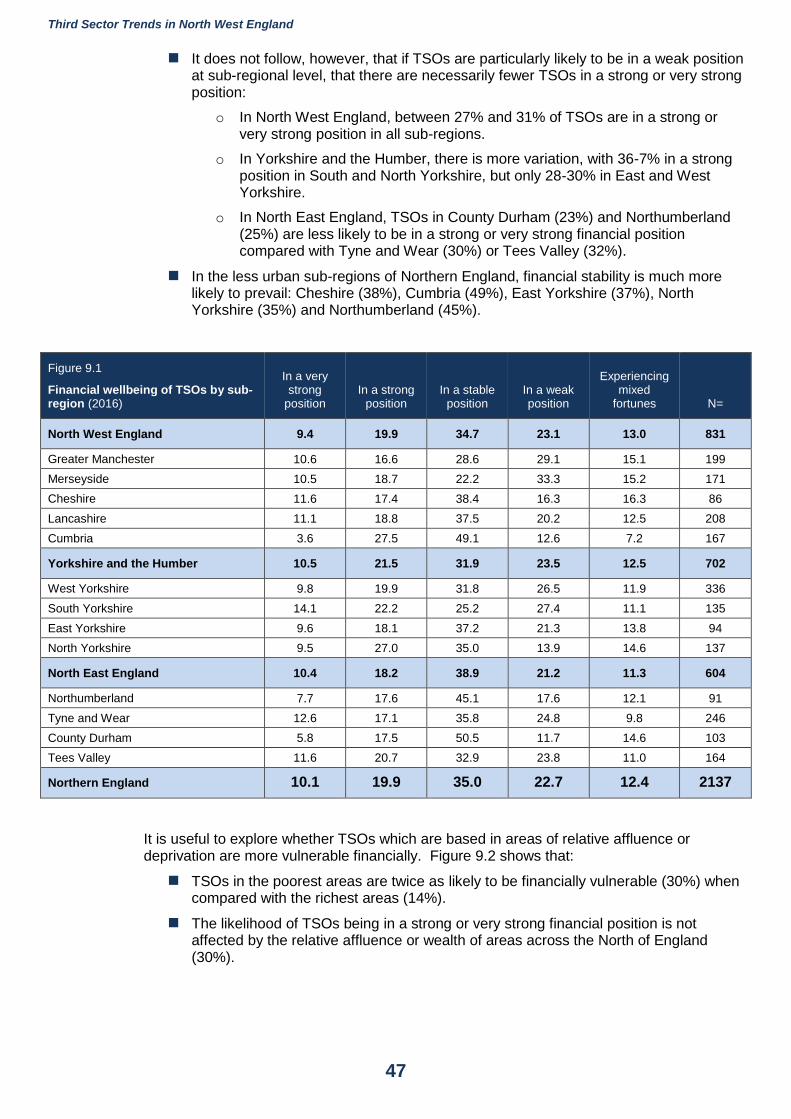
Third Sector Trends in North West England
47
It does not follow, however, that if TSOs are particularly likely to be in a weak position at sub-regional level, that there are necessarily fewer TSOs in a strong or very strong position:
o In North West England, between 27% and 31% of TSOs are in a strong or very strong position in all sub-regions.
o In Yorkshire and the Humber, there is more variation, with 36-7% in a strong position in South and North Yorkshire, but only 28-30% in East and West Yorkshire.
o In North East England, TSOs in County Durham (23%) and Northumberland (25%) are less likely to be in a strong or very strong financial position compared with Tyne and Wear (30%) or Tees Valley (32%).
In the less urban sub-regions of Northern England, financial stability is much more likely to prevail: Cheshire (38%), Cumbria (49%), East Yorkshire (37%), North Yorkshire (35%) and Northumberland (45%).
Figure 9.1
Financial wellbeing of TSOs by sub-region (2016)
In a very strong
position In a strong
position In a stable
position In a weak position
Experiencing mixed
fortunes N=
North West England 9.4 19.9 34.7 23.1 13.0 831
Greater Manchester 10.6 16.6 28.6 29.1 15.1 199
Merseyside 10.5 18.7 22.2 33.3 15.2 171
Cheshire 11.6 17.4 38.4 16.3 16.3 86
Lancashire 11.1 18.8 37.5 20.2 12.5 208
Cumbria 3.6 27.5 49.1 12.6 7.2 167
Yorkshire and the Humber 10.5 21.5 31.9 23.5 12.5 702
West Yorkshire 9.8 19.9 31.8 26.5 11.9 336
South Yorkshire 14.1 22.2 25.2 27.4 11.1 135
East Yorkshire 9.6 18.1 37.2 21.3 13.8 94
North Yorkshire 9.5 27.0 35.0 13.9 14.6 137
North East England 10.4 18.2 38.9 21.2 11.3 604
Northumberland 7.7 17.6 45.1 17.6 12.1 91
Tyne and Wear 12.6 17.1 35.8 24.8 9.8 246
County Durham 5.8 17.5 50.5 11.7 14.6 103
Tees Valley 11.6 20.7 32.9 23.8 11.0 164
Northern England 10.1 19.9 35.0 22.7 12.4 2137
It is useful to explore whether TSOs which are based in areas of relative affluence or deprivation are more vulnerable financially. Figure 9.2 shows that:
TSOs in the poorest areas are twice as likely to be financially vulnerable (30%) when compared with the richest areas (14%).
The likelihood of TSOs being in a strong or very strong financial position is not affected by the relative affluence or wealth of areas across the North of England (30%).
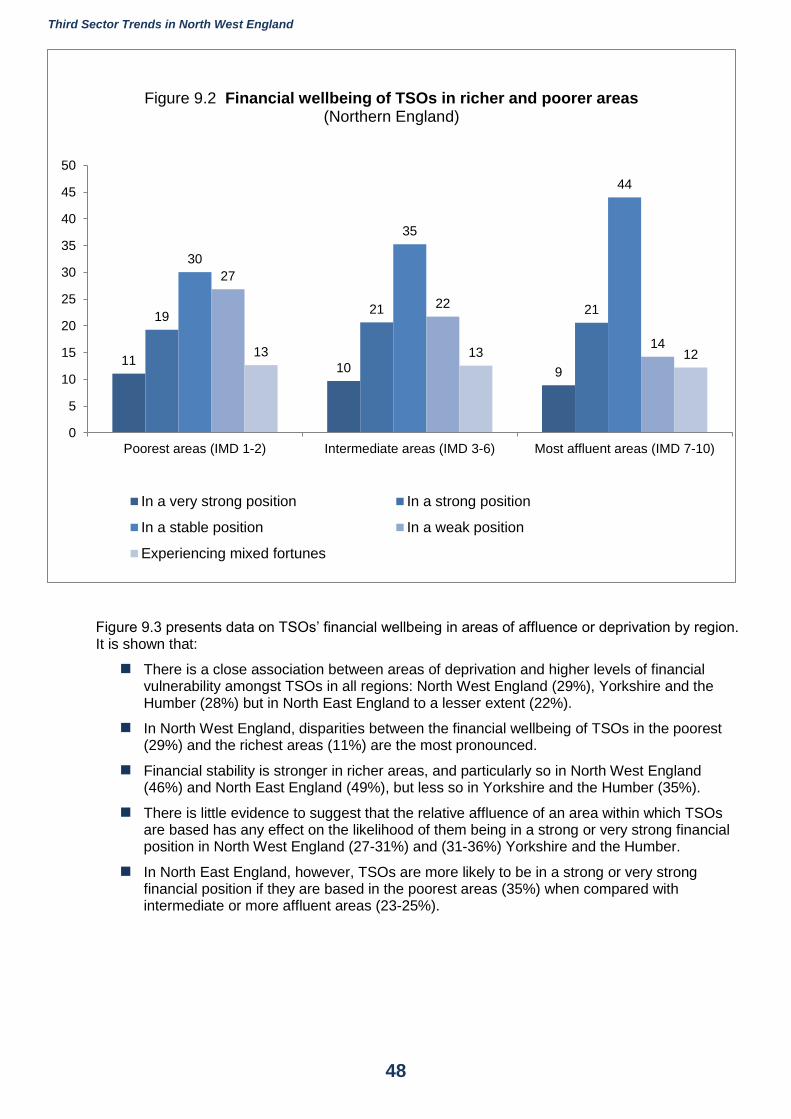
Third Sector Trends in North West England
48
Figure 9.3 presents data on TSOs’ financial wellbeing in areas of affluence or deprivation by region. It is shown that:
There is a close association between areas of deprivation and higher levels of financial vulnerability amongst TSOs in all regions: North West England (29%), Yorkshire and the Humber (28%) but in North East England to a lesser extent (22%).
In North West England, disparities between the financial wellbeing of TSOs in the poorest (29%) and the richest areas (11%) are the most pronounced.
Financial stability is stronger in richer areas, and particularly so in North West England (46%) and North East England (49%), but less so in Yorkshire and the Humber (35%).
There is little evidence to suggest that the relative affluence of an area within which TSOs are based has any effect on the likelihood of them being in a strong or very strong financial position in North West England (27-31%) and (31-36%) Yorkshire and the Humber.
In North East England, however, TSOs are more likely to be in a strong or very strong financial position if they are based in the poorest areas (35%) when compared with intermediate or more affluent areas (23-25%).
1110 9
1921 21
30
35
44
27
22
1413 13 12
0
5
10
15
20
25
30
35
40
45
50
Poorest areas (IMD 1-2) Intermediate areas (IMD 3-6) Most affluent areas (IMD 7-10)
Figure 9.2 Financial wellbeing of TSOs in richer and poorer areas (Northern England)
In a very strong position In a strong position
In a stable position In a weak position
Experiencing mixed fortunes
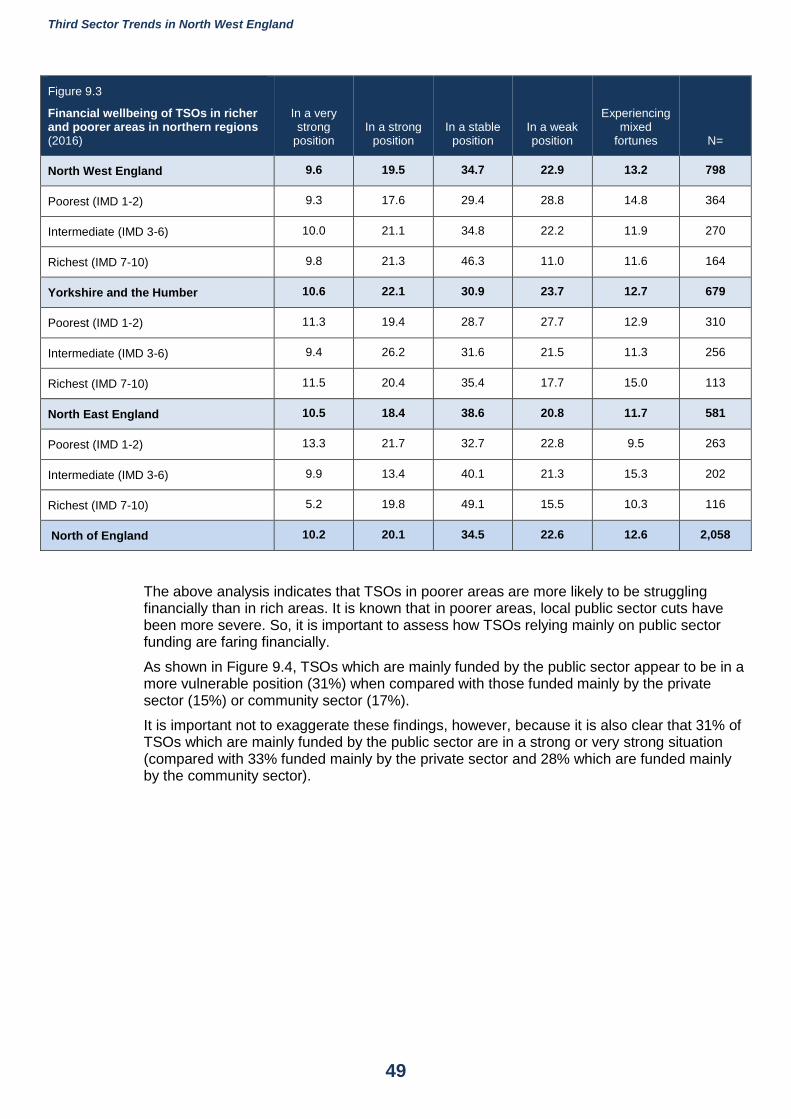
Third Sector Trends in North West England
49
Figure 9.3
Financial wellbeing of TSOs in richer and poorer areas in northern regions (2016)
In a very strong
position In a strong
position In a stable
position In a weak position
Experiencing mixed
fortunes N=
North West England 9.6 19.5 34.7 22.9 13.2 798
Poorest (IMD 1-2) 9.3 17.6 29.4 28.8 14.8 364
Intermediate (IMD 3-6) 10.0 21.1 34.8 22.2 11.9 270
Richest (IMD 7-10) 9.8 21.3 46.3 11.0 11.6 164
Yorkshire and the Humber 10.6 22.1 30.9 23.7 12.7 679
Poorest (IMD 1-2) 11.3 19.4 28.7 27.7 12.9 310
Intermediate (IMD 3-6) 9.4 26.2 31.6 21.5 11.3 256
Richest (IMD 7-10) 11.5 20.4 35.4 17.7 15.0 113
North East England 10.5 18.4 38.6 20.8 11.7 581
Poorest (IMD 1-2) 13.3 21.7 32.7 22.8 9.5 263
Intermediate (IMD 3-6) 9.9 13.4 40.1 21.3 15.3 202
Richest (IMD 7-10) 5.2 19.8 49.1 15.5 10.3 116
North of England 10.2 20.1 34.5 22.6 12.6 2,058
The above analysis indicates that TSOs in poorer areas are more likely to be struggling financially than in rich areas. It is known that in poorer areas, local public sector cuts have been more severe. So, it is important to assess how TSOs relying mainly on public sector funding are faring financially.
As shown in Figure 9.4, TSOs which are mainly funded by the public sector appear to be in a more vulnerable position (31%) when compared with those funded mainly by the private sector (15%) or community sector (17%).
It is important not to exaggerate these findings, however, because it is also clear that 31% of TSOs which are mainly funded by the public sector are in a strong or very strong situation (compared with 33% funded mainly by the private sector and 28% which are funded mainly by the community sector).
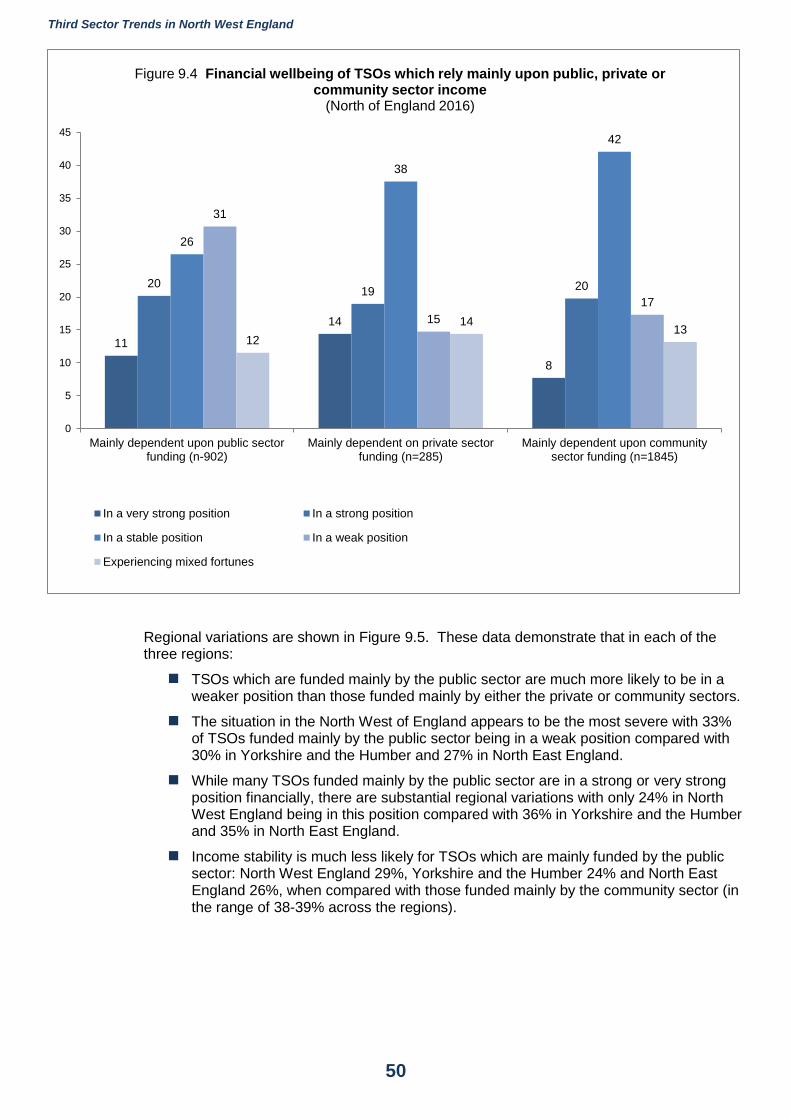
Third Sector Trends in North West England
50
Regional variations are shown in Figure 9.5. These data demonstrate that in each of the three regions:
TSOs which are funded mainly by the public sector are much more likely to be in a weaker position than those funded mainly by either the private or community sectors.
The situation in the North West of England appears to be the most severe with 33% of TSOs funded mainly by the public sector being in a weak position compared with 30% in Yorkshire and the Humber and 27% in North East England.
While many TSOs funded mainly by the public sector are in a strong or very strong position financially, there are substantial regional variations with only 24% in North West England being in this position compared with 36% in Yorkshire and the Humber and 35% in North East England.
Income stability is much less likely for TSOs which are mainly funded by the public sector: North West England 29%, Yorkshire and the Humber 24% and North East England 26%, when compared with those funded mainly by the community sector (in the range of 38-39% across the regions).
11
14
8
2019 20
26
38
42
31
15
17
12
1413
0
5
10
15
20
25
30
35
40
45
Mainly dependent upon public sectorfunding (n-902)
Mainly dependent on private sectorfunding (n=285)
Mainly dependent upon communitysector funding (n=1845)
Figure 9.4 Financial wellbeing of TSOs which rely mainly upon public, private or community sector income
(North of England 2016)
In a very strong position In a strong position
In a stable position In a weak position
Experiencing mixed fortunes
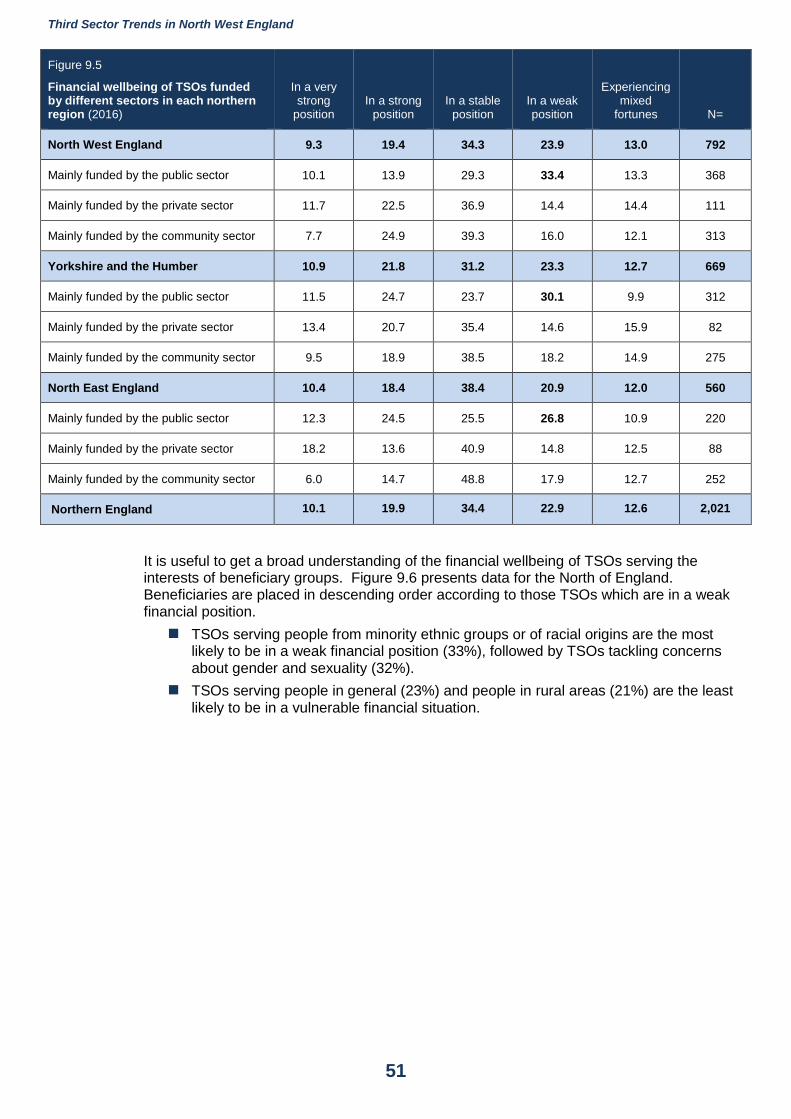
Third Sector Trends in North West England
51
Figure 9.5
Financial wellbeing of TSOs funded by different sectors in each northern region (2016)
In a very strong
position In a strong
position In a stable
position In a weak position
Experiencing mixed
fortunes N=
North West England 9.3 19.4 34.3 23.9 13.0 792
Mainly funded by the public sector 10.1 13.9 29.3 33.4 13.3 368
Mainly funded by the private sector 11.7 22.5 36.9 14.4 14.4 111
Mainly funded by the community sector 7.7 24.9 39.3 16.0 12.1 313
Yorkshire and the Humber 10.9 21.8 31.2 23.3 12.7 669
Mainly funded by the public sector 11.5 24.7 23.7 30.1 9.9 312
Mainly funded by the private sector 13.4 20.7 35.4 14.6 15.9 82
Mainly funded by the community sector 9.5 18.9 38.5 18.2 14.9 275
North East England 10.4 18.4 38.4 20.9 12.0 560
Mainly funded by the public sector 12.3 24.5 25.5 26.8 10.9 220
Mainly funded by the private sector 18.2 13.6 40.9 14.8 12.5 88
Mainly funded by the community sector 6.0 14.7 48.8 17.9 12.7 252
Northern England 10.1 19.9 34.4 22.9 12.6 2,021
It is useful to get a broad understanding of the financial wellbeing of TSOs serving the interests of beneficiary groups. Figure 9.6 presents data for the North of England. Beneficiaries are placed in descending order according to those TSOs which are in a weak financial position.
TSOs serving people from minority ethnic groups or of racial origins are the most likely to be in a weak financial position (33%), followed by TSOs tackling concerns about gender and sexuality (32%).
TSOs serving people in general (23%) and people in rural areas (21%) are the least likely to be in a vulnerable financial situation.
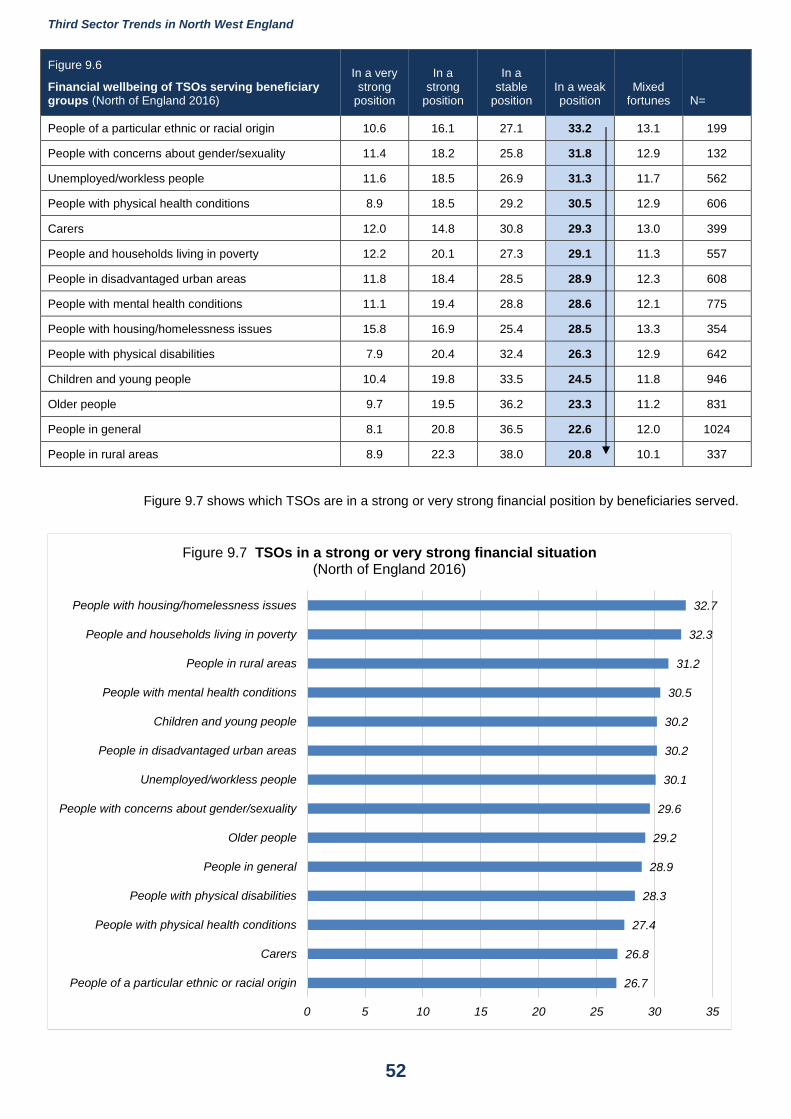
Third Sector Trends in North West England
52
Figure 9.6
Financial wellbeing of TSOs serving beneficiary groups (North of England 2016)
In a very strong
position
In a strong
position
In a stable
position In a weak position
Mixed fortunes N=
People of a particular ethnic or racial origin 10.6 16.1 27.1 33.2 13.1 199
People with concerns about gender/sexuality 11.4 18.2 25.8 31.8 12.9 132
Unemployed/workless people 11.6 18.5 26.9 31.3 11.7 562
People with physical health conditions 8.9 18.5 29.2 30.5 12.9 606
Carers 12.0 14.8 30.8 29.3 13.0 399
People and households living in poverty 12.2 20.1 27.3 29.1 11.3 557
People in disadvantaged urban areas 11.8 18.4 28.5 28.9 12.3 608
People with mental health conditions 11.1 19.4 28.8 28.6 12.1 775
People with housing/homelessness issues 15.8 16.9 25.4 28.5 13.3 354
People with physical disabilities 7.9 20.4 32.4 26.3 12.9 642
Children and young people 10.4 19.8 33.5 24.5 11.8 946
Older people 9.7 19.5 36.2 23.3 11.2 831
People in general 8.1 20.8 36.5 22.6 12.0 1024
People in rural areas 8.9 22.3 38.0 20.8 10.1 337
Figure 9.7 shows which TSOs are in a strong or very strong financial position by beneficiaries served.
26.7
26.8
27.4
28.3
28.9
29.2
29.6
30.1
30.2
30.2
30.5
31.2
32.3
32.7
0 5 10 15 20 25 30 35
People of a particular ethnic or racial origin
Carers
People with physical health conditions
People with physical disabilities
People in general
Older people
People with concerns about gender/sexuality
Unemployed/workless people
People in disadvantaged urban areas
Children and young people
People with mental health conditions
People in rural areas
People and households living in poverty
People with housing/homelessness issues
Figure 9.7 TSOs in a strong or very strong financial situation (North of England 2016)
Third Sector Trends in North West England
53
Summary
This Chapter has shown that many organisations in the Third Sector are in a strong financial position, where they have growing numbers of employees, are investing in their development as organisations and have rising income. These factors are not common only to North West England, however, the percentage of TSOs in a strong or very strong financial position is similar across all three regions: North West England 29%, Yorkshire and the Humber 32% and North East England 29%.
That stated, TSOs in the poorest areas are twice as likely to be financially vulnerable (30%) when compared with the richest areas (14%). Furthermore, many TSOs which depend mainly upon public sector funding find themselves in difficulties.
Some areas of beneficiary support seem to be struggling more than others. TSOs serving people from minority ethnic groups or of racial origins are the most likely to be in a weak financial position (33%), followed by TSOs tackling concerns about gender and sexuality (32%). By contrast, TSOs serving people in general (23%) and people in rural areas (21%) are the least likely to be in a vulnerable financial situation.
Many TSOs are in a relatively stable financial situation – but headline statistics on income stability can be misleading. It may be that many TSOs have to ‘run faster’ to stand still as access to unrestricted core funding is reduced and TSOs’ dependence on a growing number of smaller grants or contracts, many of which may be entered into in partnership, may result in more work for the same resource.
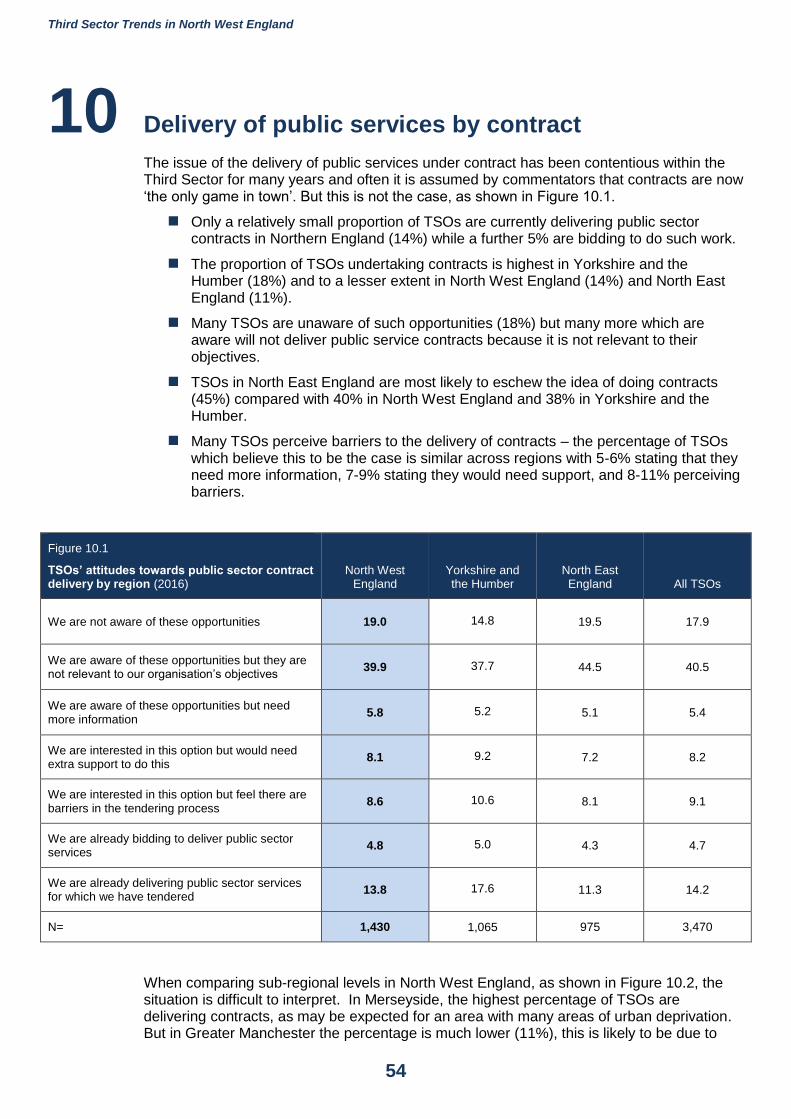
Third Sector Trends in North West England
54
10 Delivery of public services by contract
The issue of the delivery of public services under contract has been contentious within the Third Sector for many years and often it is assumed by commentators that contracts are now ‘the only game in town’. But this is not the case, as shown in Figure 10.1.
Only a relatively small proportion of TSOs are currently delivering public sector contracts in Northern England (14%) while a further 5% are bidding to do such work.
The proportion of TSOs undertaking contracts is highest in Yorkshire and the Humber (18%) and to a lesser extent in North West England (14%) and North East England (11%).
Many TSOs are unaware of such opportunities (18%) but many more which are aware will not deliver public service contracts because it is not relevant to their objectives.
TSOs in North East England are most likely to eschew the idea of doing contracts (45%) compared with 40% in North West England and 38% in Yorkshire and the Humber.
Many TSOs perceive barriers to the delivery of contracts – the percentage of TSOs which believe this to be the case is similar across regions with 5-6% stating that they need more information, 7-9% stating they would need support, and 8-11% perceiving barriers.
Figure 10.1
TSOs’ attitudes towards public sector contract delivery by region (2016)
North West England
Yorkshire and the Humber
North East England All TSOs
We are not aware of these opportunities 19.0 14.8 19.5 17.9
We are aware of these opportunities but they are not relevant to our organisation’s objectives
39.9 37.7 44.5 40.5
We are aware of these opportunities but need more information
5.8 5.2 5.1 5.4
We are interested in this option but would need extra support to do this
8.1 9.2 7.2 8.2
We are interested in this option but feel there are barriers in the tendering process
8.6 10.6 8.1 9.1
We are already bidding to deliver public sector services
4.8 5.0 4.3 4.7
We are already delivering public sector services for which we have tendered
13.8 17.6 11.3 14.2
N= 1,430 1,065 975 3,470
When comparing sub-regional levels in North West England, as shown in Figure 10.2, the situation is difficult to interpret. In Merseyside, the highest percentage of TSOs are delivering contracts, as may be expected for an area with many areas of urban deprivation. But in Greater Manchester the percentage is much lower (11%), this is likely to be due to
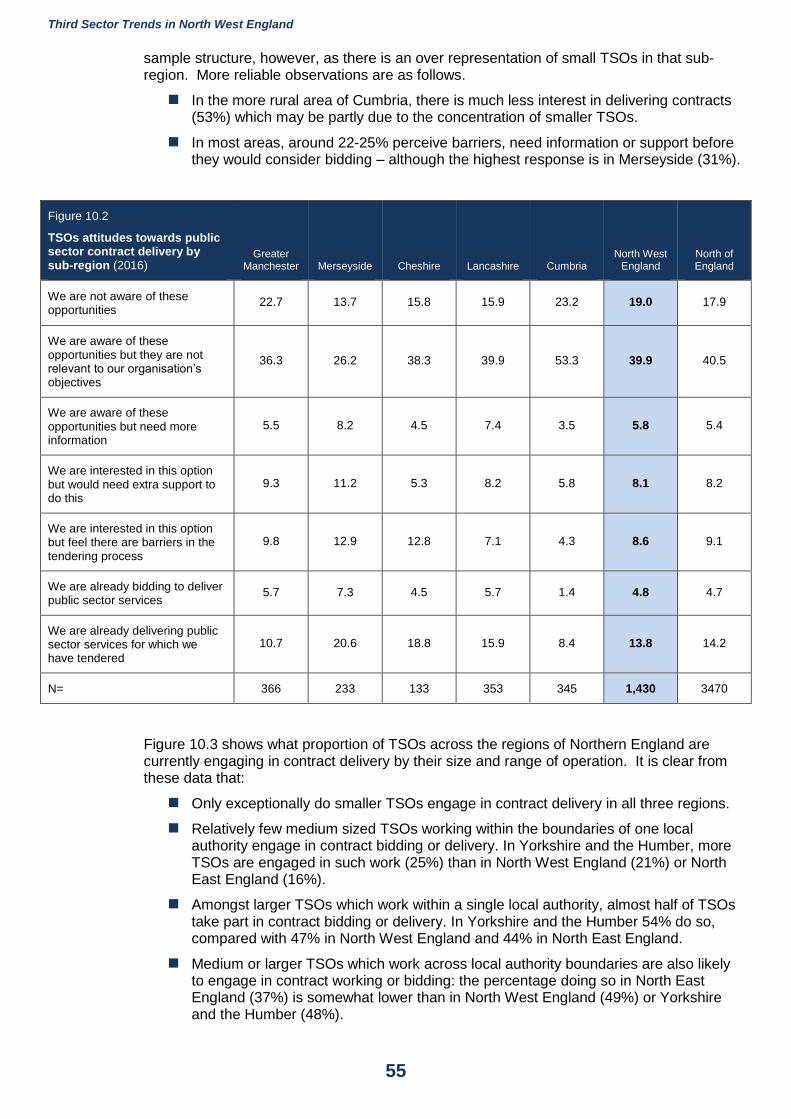
Third Sector Trends in North West England
55
sample structure, however, as there is an over representation of small TSOs in that sub-region. More reliable observations are as follows.
In the more rural area of Cumbria, there is much less interest in delivering contracts (53%) which may be partly due to the concentration of smaller TSOs.
In most areas, around 22-25% perceive barriers, need information or support before they would consider bidding – although the highest response is in Merseyside (31%).
Figure 10.2
TSOs attitudes towards public sector contract delivery by sub-region (2016)
Greater Manchester Merseyside Cheshire Lancashire Cumbria
North West England
North of England
We are not aware of these opportunities
22.7 13.7 15.8 15.9 23.2 19.0 17.9
We are aware of these opportunities but they are not relevant to our organisation’s objectives
36.3 26.2 38.3 39.9 53.3 39.9 40.5
We are aware of these opportunities but need more information
5.5 8.2 4.5 7.4 3.5 5.8 5.4
We are interested in this option but would need extra support to do this
9.3 11.2 5.3 8.2 5.8 8.1 8.2
We are interested in this option but feel there are barriers in the tendering process
9.8 12.9 12.8 7.1 4.3 8.6 9.1
We are already bidding to deliver public sector services
5.7 7.3 4.5 5.7 1.4 4.8 4.7
We are already delivering public sector services for which we have tendered
10.7 20.6 18.8 15.9 8.4 13.8 14.2
N= 366 233 133 353 345 1,430 3470
Figure 10.3 shows what proportion of TSOs across the regions of Northern England are currently engaging in contract delivery by their size and range of operation. It is clear from these data that:
Only exceptionally do smaller TSOs engage in contract delivery in all three regions.
Relatively few medium sized TSOs working within the boundaries of one local authority engage in contract bidding or delivery. In Yorkshire and the Humber, more TSOs are engaged in such work (25%) than in North West England (21%) or North East England (16%).
Amongst larger TSOs which work within a single local authority, almost half of TSOs take part in contract bidding or delivery. In Yorkshire and the Humber 54% do so, compared with 47% in North West England and 44% in North East England.
Medium or larger TSOs which work across local authority boundaries are also likely to engage in contract working or bidding: the percentage doing so in North East England (37%) is somewhat lower than in North West England (49%) or Yorkshire and the Humber (48%).
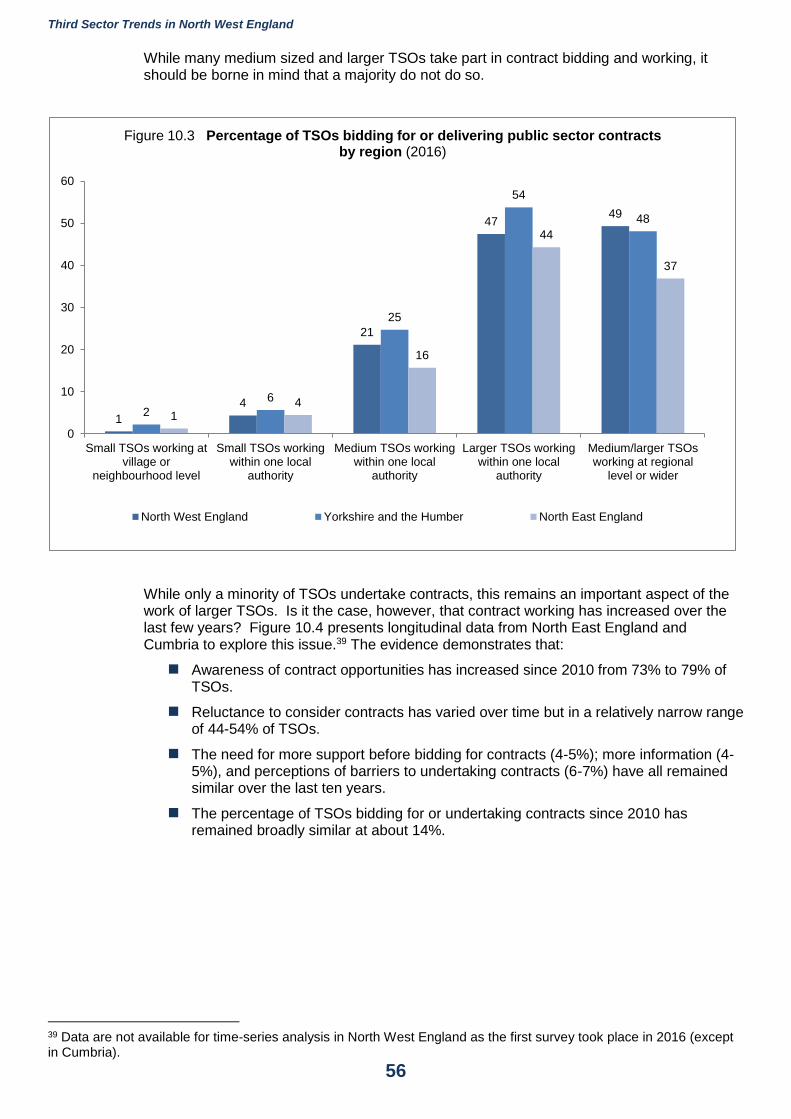
Third Sector Trends in North West England
56
While many medium sized and larger TSOs take part in contract bidding and working, it should be borne in mind that a majority do not do so.
While only a minority of TSOs undertake contracts, this remains an important aspect of the work of larger TSOs. Is it the case, however, that contract working has increased over the last few years? Figure 10.4 presents longitudinal data from North East England and Cumbria to explore this issue.39 The evidence demonstrates that:
Awareness of contract opportunities has increased since 2010 from 73% to 79% of TSOs.
Reluctance to consider contracts has varied over time but in a relatively narrow range of 44-54% of TSOs.
The need for more support before bidding for contracts (4-5%); more information (4-5%), and perceptions of barriers to undertaking contracts (6-7%) have all remained similar over the last ten years.
The percentage of TSOs bidding for or undertaking contracts since 2010 has remained broadly similar at about 14%.
39 Data are not available for time-series analysis in North West England as the first survey took place in 2016 (except in Cumbria).
1
4
21
4749
2
6
25
54
48
14
16
44
37
0
10
20
30
40
50
60
Small TSOs working atvillage or
neighbourhood level
Small TSOs workingwithin one local
authority
Medium TSOs workingwithin one local
authority
Larger TSOs workingwithin one local
authority
Medium/larger TSOsworking at regional
level or wider
Figure 10.3 Percentage of TSOs bidding for or delivering public sector contracts by region (2016)
North West England Yorkshire and the Humber North East England
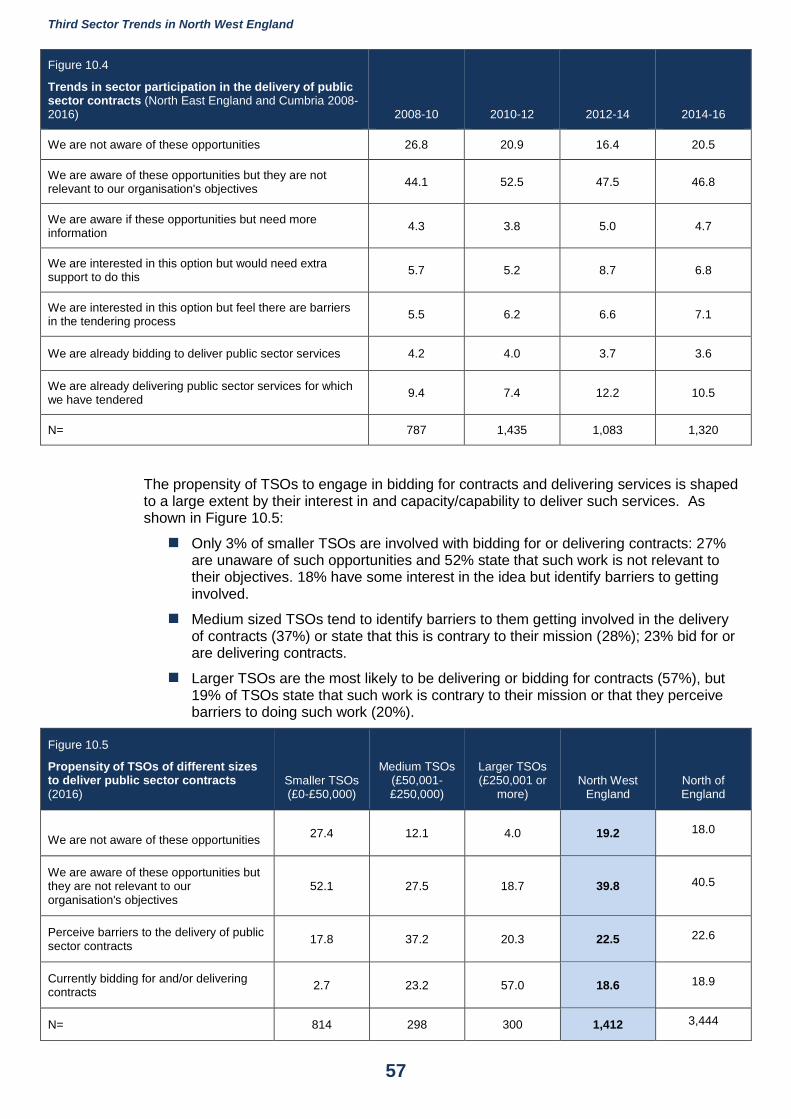
Third Sector Trends in North West England
57
Figure 10.4
Trends in sector participation in the delivery of public sector contracts (North East England and Cumbria 2008-2016) 2008-10 2010-12 2012-14 2014-16
We are not aware of these opportunities 26.8 20.9 16.4 20.5
We are aware of these opportunities but they are not relevant to our organisation's objectives
44.1 52.5 47.5 46.8
We are aware if these opportunities but need more information
4.3 3.8 5.0 4.7
We are interested in this option but would need extra support to do this
5.7 5.2 8.7 6.8
We are interested in this option but feel there are barriers in the tendering process
5.5 6.2 6.6 7.1
We are already bidding to deliver public sector services 4.2 4.0 3.7 3.6
We are already delivering public sector services for which we have tendered
9.4 7.4 12.2 10.5
N= 787 1,435 1,083 1,320
The propensity of TSOs to engage in bidding for contracts and delivering services is shaped to a large extent by their interest in and capacity/capability to deliver such services. As shown in Figure 10.5:
Only 3% of smaller TSOs are involved with bidding for or delivering contracts: 27% are unaware of such opportunities and 52% state that such work is not relevant to their objectives. 18% have some interest in the idea but identify barriers to getting involved.
Medium sized TSOs tend to identify barriers to them getting involved in the delivery of contracts (37%) or state that this is contrary to their mission (28%); 23% bid for or are delivering contracts.
Larger TSOs are the most likely to be delivering or bidding for contracts (57%), but 19% of TSOs state that such work is contrary to their mission or that they perceive barriers to doing such work (20%).
Figure 10.5
Propensity of TSOs of different sizes to deliver public sector contracts (2016)
Smaller TSOs (£0-£50,000)
Medium TSOs (£50,001-£250,000)
Larger TSOs (£250,001 or
more) North West
England North of England
We are not aware of these opportunities 27.4 12.1 4.0 19.2 18.0
We are aware of these opportunities but they are not relevant to our organisation's objectives
52.1 27.5 18.7 39.8 40.5
Perceive barriers to the delivery of public sector contracts
17.8 37.2 20.3 22.5 22.6
Currently bidding for and/or delivering contracts
2.7 23.2 57.0 18.6 18.9
N= 814 298 300 1,412 3,444
Third Sector Trends in North West England
58
Summary
There are no data available to assess changing attitudes about delivering public sector contracts in North West England. However, attitudes and behaviours surrounding the delivery of public sector services under contract have changed little over the last eight years in North East England and Cumbria. While there has been a small increase in the percentage of TSOs bidding for and delivering contracts, this is still very much a minority practice in the Third Sector except amongst the larger TSOs. The likelihood is that the situation in North West England will be similar.
When assertions are made, therefore, that ‘contracting is the only game in town’, this is unsupported by the evidence – it is a minority activity and, judging from the evidence presented in Chapter 7, is of declining importance even to larger TSOs across the North of England.
In North West England, the evidence suggests that engagement with contracts to deliver public services is more or less at the average for Northern England and that it is mainly larger TSOs that enter this field of work.
It is interesting to note that the reasons cited for not engaging in contracts, such as needing more information, perceiving barriers or needing more support have been given by quite a sizeable proportion of the Third Sector.
What is less well understood, however, is that if these barriers were lifted (such as by providing support or information or tackling barriers surrounding procurement processes) – would TSOs then engage with tendering processes?
The evidence presented from trend data in North East England and Cumbria suggests that the percentage of TSOs in his ‘liminal’ zone between those which do apply for contracts or those which refuse to consider that option has been populated by a similar percentage of organisations for nearly ten years.
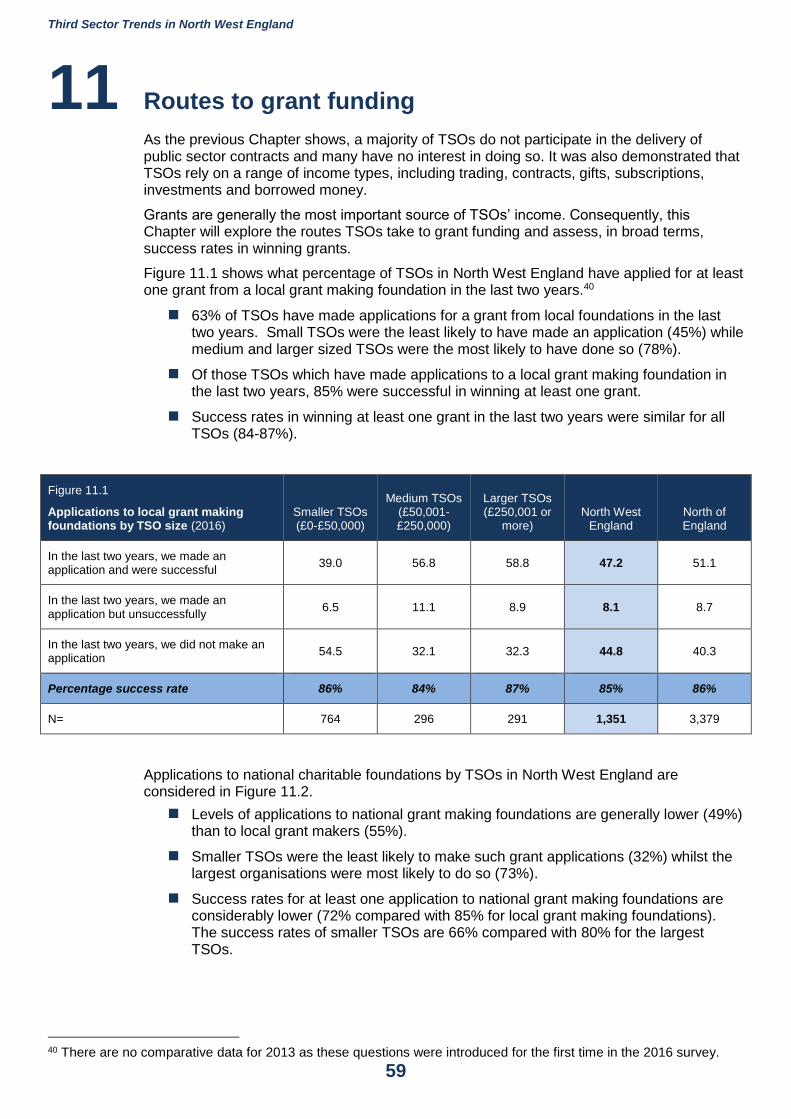
Third Sector Trends in North West England
59
11 Routes to grant funding
As the previous Chapter shows, a majority of TSOs do not participate in the delivery of public sector contracts and many have no interest in doing so. It was also demonstrated that TSOs rely on a range of income types, including trading, contracts, gifts, subscriptions, investments and borrowed money.
Grants are generally the most important source of TSOs’ income. Consequently, this Chapter will explore the routes TSOs take to grant funding and assess, in broad terms, success rates in winning grants.
Figure 11.1 shows what percentage of TSOs in North West England have applied for at least one grant from a local grant making foundation in the last two years.40
63% of TSOs have made applications for a grant from local foundations in the last two years. Small TSOs were the least likely to have made an application (45%) while medium and larger sized TSOs were the most likely to have done so (78%).
Of those TSOs which have made applications to a local grant making foundation in the last two years, 85% were successful in winning at least one grant.
Success rates in winning at least one grant in the last two years were similar for all TSOs (84-87%).
Figure 11.1
Applications to local grant making foundations by TSO size (2016)
Smaller TSOs (£0-£50,000)
Medium TSOs (£50,001-£250,000)
Larger TSOs (£250,001 or
more) North West
England North of England
In the last two years, we made an application and were successful
39.0 56.8 58.8 47.2 51.1
In the last two years, we made an application but unsuccessfully
6.5 11.1 8.9 8.1 8.7
In the last two years, we did not make an application
54.5 32.1 32.3 44.8 40.3
Percentage success rate 86% 84% 87% 85% 86%
N= 764 296 291 1,351 3,379
Applications to national charitable foundations by TSOs in North West England are considered in Figure 11.2.
Levels of applications to national grant making foundations are generally lower (49%) than to local grant makers (55%).
Smaller TSOs were the least likely to make such grant applications (32%) whilst the largest organisations were most likely to do so (73%).
Success rates for at least one application to national grant making foundations are considerably lower (72% compared with 85% for local grant making foundations). The success rates of smaller TSOs are 66% compared with 80% for the largest TSOs.
40 There are no comparative data for 2013 as these questions were introduced for the first time in the 2016 survey.
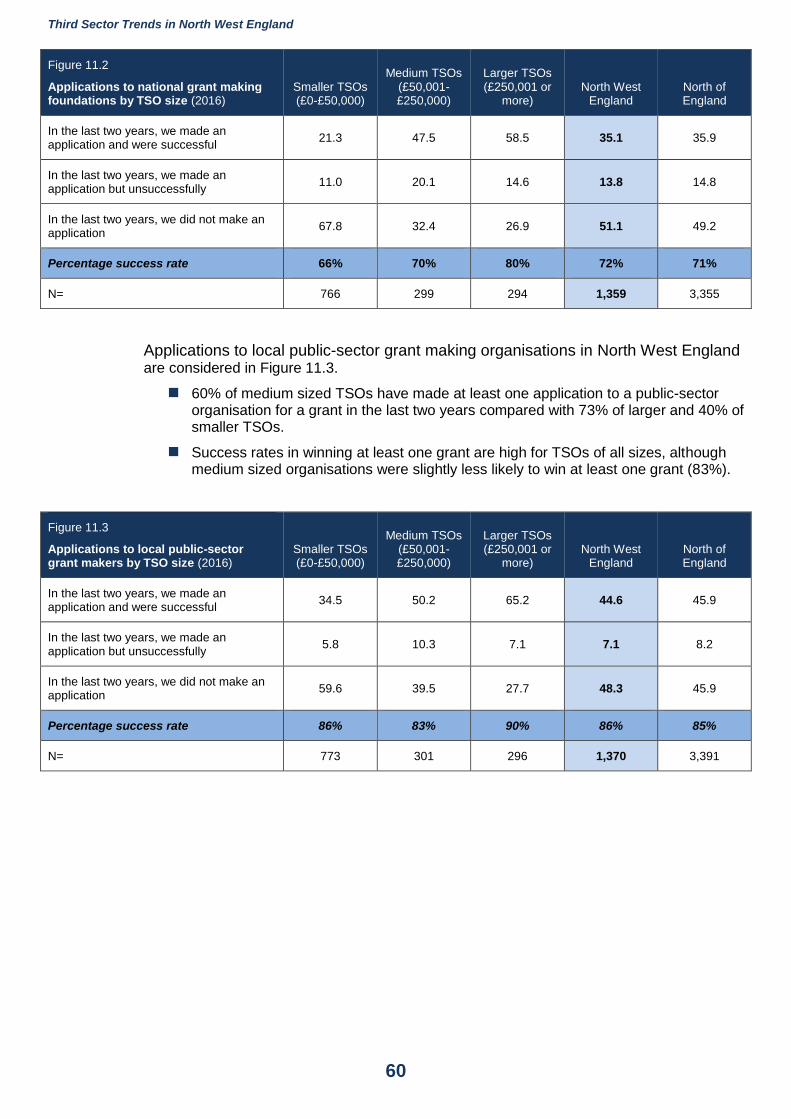
Third Sector Trends in North West England
60
Figure 11.2
Applications to national grant making foundations by TSO size (2016)
Smaller TSOs (£0-£50,000)
Medium TSOs (£50,001-£250,000)
Larger TSOs (£250,001 or
more) North West
England North of England
In the last two years, we made an application and were successful
21.3 47.5 58.5 35.1 35.9
In the last two years, we made an application but unsuccessfully
11.0 20.1 14.6 13.8 14.8
In the last two years, we did not make an application
67.8 32.4 26.9 51.1 49.2
Percentage success rate 66% 70% 80% 72% 71%
N= 766 299 294 1,359 3,355
Applications to local public-sector grant making organisations in North West England are considered in Figure 11.3.
60% of medium sized TSOs have made at least one application to a public-sector organisation for a grant in the last two years compared with 73% of larger and 40% of smaller TSOs.
Success rates in winning at least one grant are high for TSOs of all sizes, although medium sized organisations were slightly less likely to win at least one grant (83%).
Figure 11.3
Applications to local public-sector grant makers by TSO size (2016)
Smaller TSOs (£0-£50,000)
Medium TSOs (£50,001-£250,000)
Larger TSOs (£250,001 or
more) North West
England North of England
In the last two years, we made an application and were successful
34.5 50.2 65.2 44.6 45.9
In the last two years, we made an application but unsuccessfully
5.8 10.3 7.1 7.1 8.2
In the last two years, we did not make an application
59.6 39.5 27.7 48.3 45.9
Percentage success rate 86% 83% 90% 86% 85%
N= 773 301 296 1,370 3,391
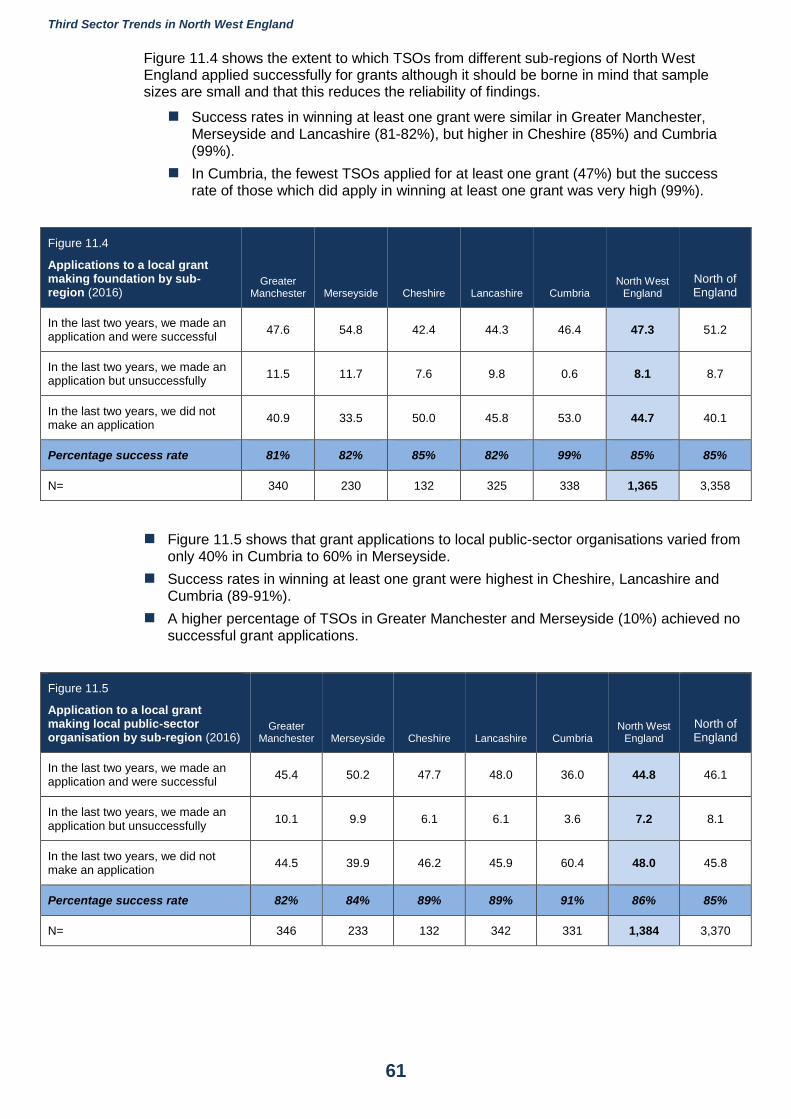
Third Sector Trends in North West England
61
Figure 11.4 shows the extent to which TSOs from different sub-regions of North West England applied successfully for grants although it should be borne in mind that sample sizes are small and that this reduces the reliability of findings.
Success rates in winning at least one grant were similar in Greater Manchester, Merseyside and Lancashire (81-82%), but higher in Cheshire (85%) and Cumbria (99%).
In Cumbria, the fewest TSOs applied for at least one grant (47%) but the success rate of those which did apply in winning at least one grant was very high (99%).
Figure 11.4
Applications to a local grant making foundation by sub-region (2016)
Greater Manchester Merseyside Cheshire Lancashire Cumbria
North West England
North of England
In the last two years, we made an application and were successful
47.6 54.8 42.4 44.3 46.4 47.3 51.2
In the last two years, we made an application but unsuccessfully
11.5 11.7 7.6 9.8 0.6 8.1 8.7
In the last two years, we did not make an application
40.9 33.5 50.0 45.8 53.0 44.7 40.1
Percentage success rate 81% 82% 85% 82% 99% 85% 85%
N= 340 230 132 325 338 1,365 3,358
Figure 11.5 shows that grant applications to local public-sector organisations varied from only 40% in Cumbria to 60% in Merseyside.
Success rates in winning at least one grant were highest in Cheshire, Lancashire and Cumbria (89-91%).
A higher percentage of TSOs in Greater Manchester and Merseyside (10%) achieved no successful grant applications.
Figure 11.5
Application to a local grant making local public-sector organisation by sub-region (2016)
Greater Manchester Merseyside Cheshire Lancashire Cumbria
North West England
North of England
In the last two years, we made an application and were successful
45.4 50.2 47.7 48.0 36.0 44.8 46.1
In the last two years, we made an application but unsuccessfully
10.1 9.9 6.1 6.1 3.6 7.2 8.1
In the last two years, we did not make an application
44.5 39.9 46.2 45.9 60.4 48.0 45.8
Percentage success rate 82% 84% 89% 89% 91% 86% 85%
N= 346 233 132 342 331 1,384 3,370
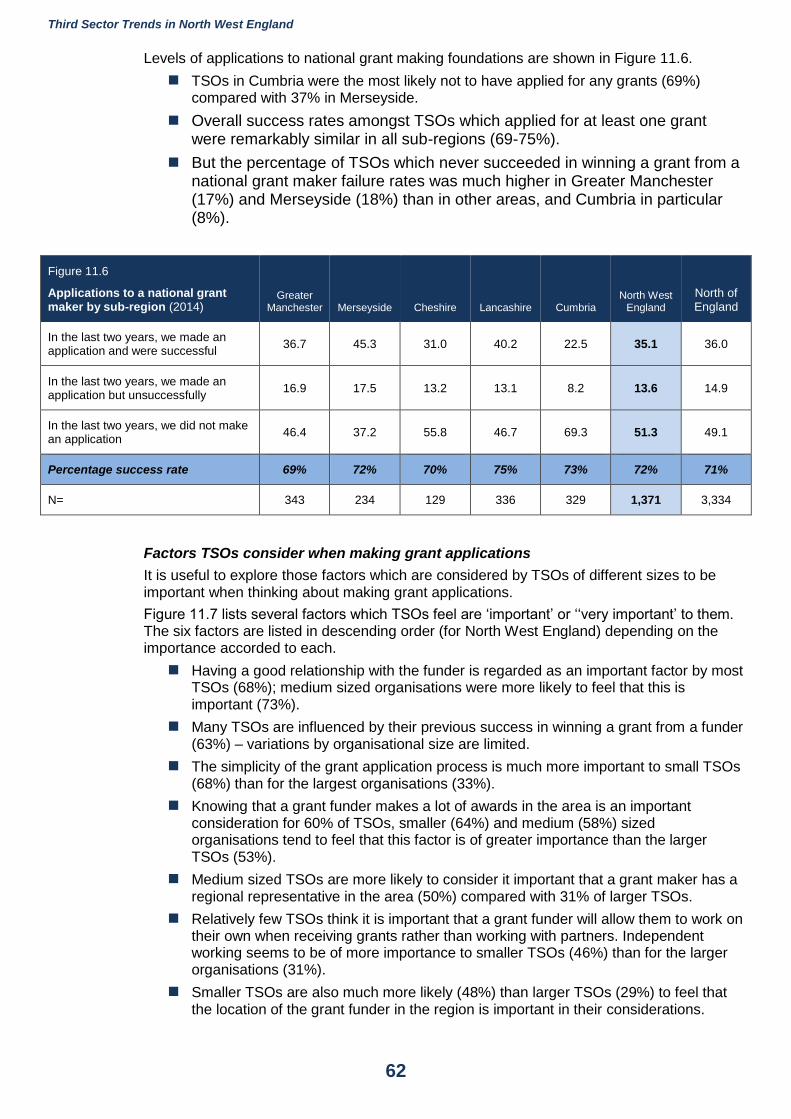
Third Sector Trends in North West England
62
Levels of applications to national grant making foundations are shown in Figure 11.6.
TSOs in Cumbria were the most likely not to have applied for any grants (69%) compared with 37% in Merseyside.
Overall success rates amongst TSOs which applied for at least one grant were remarkably similar in all sub-regions (69-75%).
But the percentage of TSOs which never succeeded in winning a grant from a national grant maker failure rates was much higher in Greater Manchester (17%) and Merseyside (18%) than in other areas, and Cumbria in particular (8%).
Figure 11.6
Applications to a national grant maker by sub-region (2014)
Greater Manchester Merseyside Cheshire Lancashire Cumbria
North West England
North of England
In the last two years, we made an application and were successful
36.7 45.3 31.0 40.2 22.5 35.1 36.0
In the last two years, we made an application but unsuccessfully
16.9 17.5 13.2 13.1 8.2 13.6 14.9
In the last two years, we did not make an application
46.4 37.2 55.8 46.7 69.3 51.3 49.1
Percentage success rate 69% 72% 70% 75% 73% 72% 71%
N= 343 234 129 336 329 1,371 3,334
Factors TSOs consider when making grant applications
It is useful to explore those factors which are considered by TSOs of different sizes to be important when thinking about making grant applications.
Figure 11.7 lists several factors which TSOs feel are ‘important’ or ‘‘very important’ to them. The six factors are listed in descending order (for North West England) depending on the importance accorded to each.
Having a good relationship with the funder is regarded as an important factor by most TSOs (68%); medium sized organisations were more likely to feel that this is important (73%).
Many TSOs are influenced by their previous success in winning a grant from a funder (63%) – variations by organisational size are limited.
The simplicity of the grant application process is much more important to small TSOs (68%) than for the largest organisations (33%).
Knowing that a grant funder makes a lot of awards in the area is an important consideration for 60% of TSOs, smaller (64%) and medium (58%) sized organisations tend to feel that this factor is of greater importance than the larger TSOs (53%).
Medium sized TSOs are more likely to consider it important that a grant maker has a regional representative in the area (50%) compared with 31% of larger TSOs.
Relatively few TSOs think it is important that a grant funder will allow them to work on their own when receiving grants rather than working with partners. Independent working seems to be of more importance to smaller TSOs (46%) than for the larger organisations (31%).
Smaller TSOs are also much more likely (48%) than larger TSOs (29%) to feel that the location of the grant funder in the region is important in their considerations.
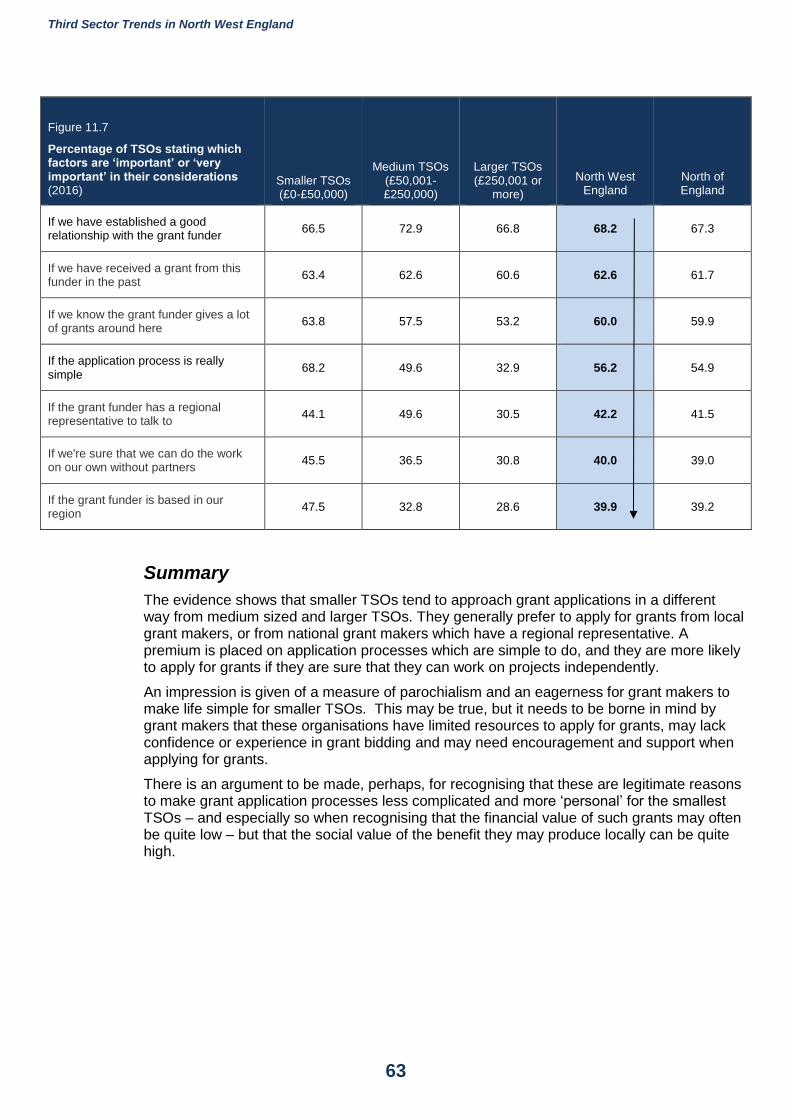
Third Sector Trends in North West England
63
Figure 11.7
Percentage of TSOs stating which factors are ‘important’ or ‘very important’ in their considerations (2016)
Smaller TSOs (£0-£50,000)
Medium TSOs (£50,001-£250,000)
Larger TSOs (£250,001 or
more)
North West England
North of England
If we have established a good relationship with the grant funder
66.5 72.9 66.8 68.2 67.3
If we have received a grant from this funder in the past
63.4 62.6 60.6 62.6 61.7
If we know the grant funder gives a lot of grants around here
63.8 57.5 53.2 60.0 59.9
If the application process is really simple
68.2 49.6 32.9 56.2 54.9
If the grant funder has a regional representative to talk to
44.1 49.6 30.5 42.2 41.5
If we're sure that we can do the work on our own without partners
45.5 36.5 30.8 40.0 39.0
If the grant funder is based in our region
47.5 32.8 28.6 39.9 39.2
Summary
The evidence shows that smaller TSOs tend to approach grant applications in a different way from medium sized and larger TSOs. They generally prefer to apply for grants from local grant makers, or from national grant makers which have a regional representative. A premium is placed on application processes which are simple to do, and they are more likely to apply for grants if they are sure that they can work on projects independently.
An impression is given of a measure of parochialism and an eagerness for grant makers to make life simple for smaller TSOs. This may be true, but it needs to be borne in mind by grant makers that these organisations have limited resources to apply for grants, may lack confidence or experience in grant bidding and may need encouragement and support when applying for grants.
There is an argument to be made, perhaps, for recognising that these are legitimate reasons to make grant application processes less complicated and more ‘personal’ for the smallest TSOs – and especially so when recognising that the financial value of such grants may often be quite low – but that the social value of the benefit they may produce locally can be quite high.
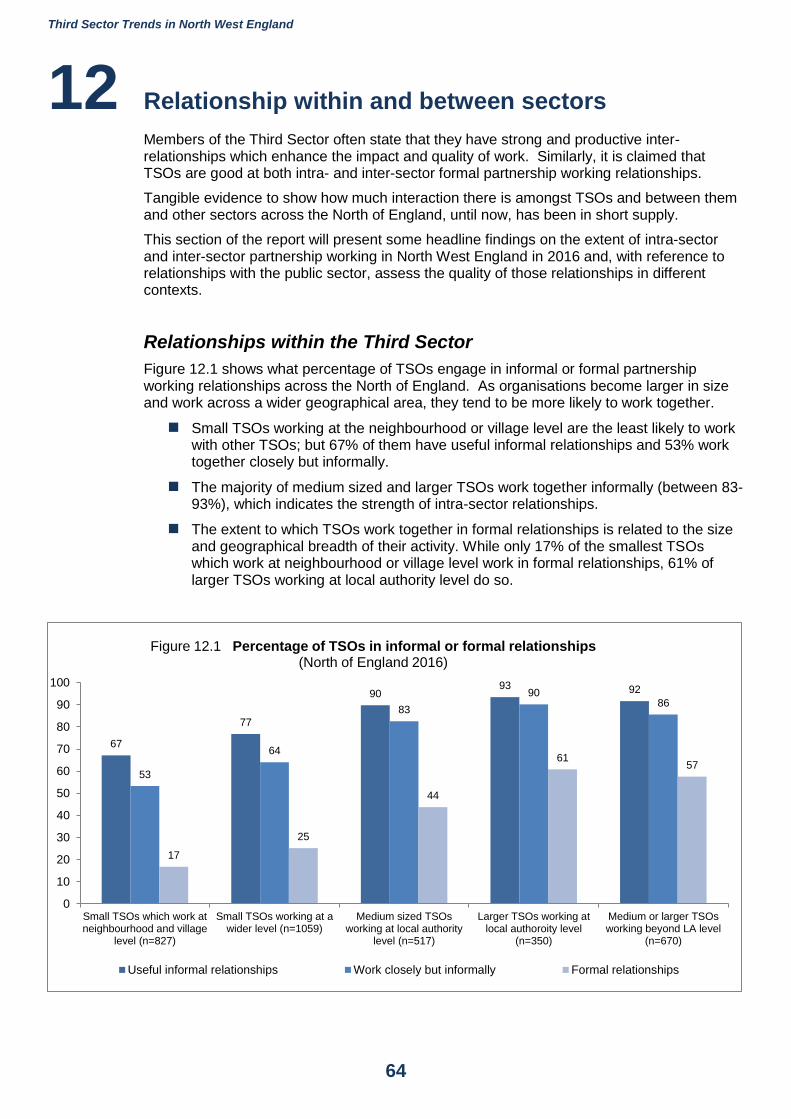
Third Sector Trends in North West England
64
12 Relationship within and between sectors
Members of the Third Sector often state that they have strong and productive inter-relationships which enhance the impact and quality of work. Similarly, it is claimed that TSOs are good at both intra- and inter-sector formal partnership working relationships.
Tangible evidence to show how much interaction there is amongst TSOs and between them and other sectors across the North of England, until now, has been in short supply.
This section of the report will present some headline findings on the extent of intra-sector and inter-sector partnership working in North West England in 2016 and, with reference to relationships with the public sector, assess the quality of those relationships in different contexts.
Relationships within the Third Sector
Figure 12.1 shows what percentage of TSOs engage in informal or formal partnership working relationships across the North of England. As organisations become larger in size and work across a wider geographical area, they tend to be more likely to work together.
Small TSOs working at the neighbourhood or village level are the least likely to work with other TSOs; but 67% of them have useful informal relationships and 53% work together closely but informally.
The majority of medium sized and larger TSOs work together informally (between 83-93%), which indicates the strength of intra-sector relationships.
The extent to which TSOs work together in formal relationships is related to the size and geographical breadth of their activity. While only 17% of the smallest TSOs which work at neighbourhood or village level work in formal relationships, 61% of larger TSOs working at local authority level do so.
67
77
9093 92
53
64
83
9086
17
25
44
6157
0
10
20
30
40
50
60
70
80
90
100
Small TSOs which work atneighbourhood and village
level (n=827)
Small TSOs working at awider level (n=1059)
Medium sized TSOsworking at local authority
level (n=517)
Larger TSOs working atlocal authoroity level
(n=350)
Medium or larger TSOsworking beyond LA level
(n=670)
Figure 12.1 Percentage of TSOs in informal or formal relationships(North of England 2016)
Useful informal relationships Work closely but informally Formal relationships
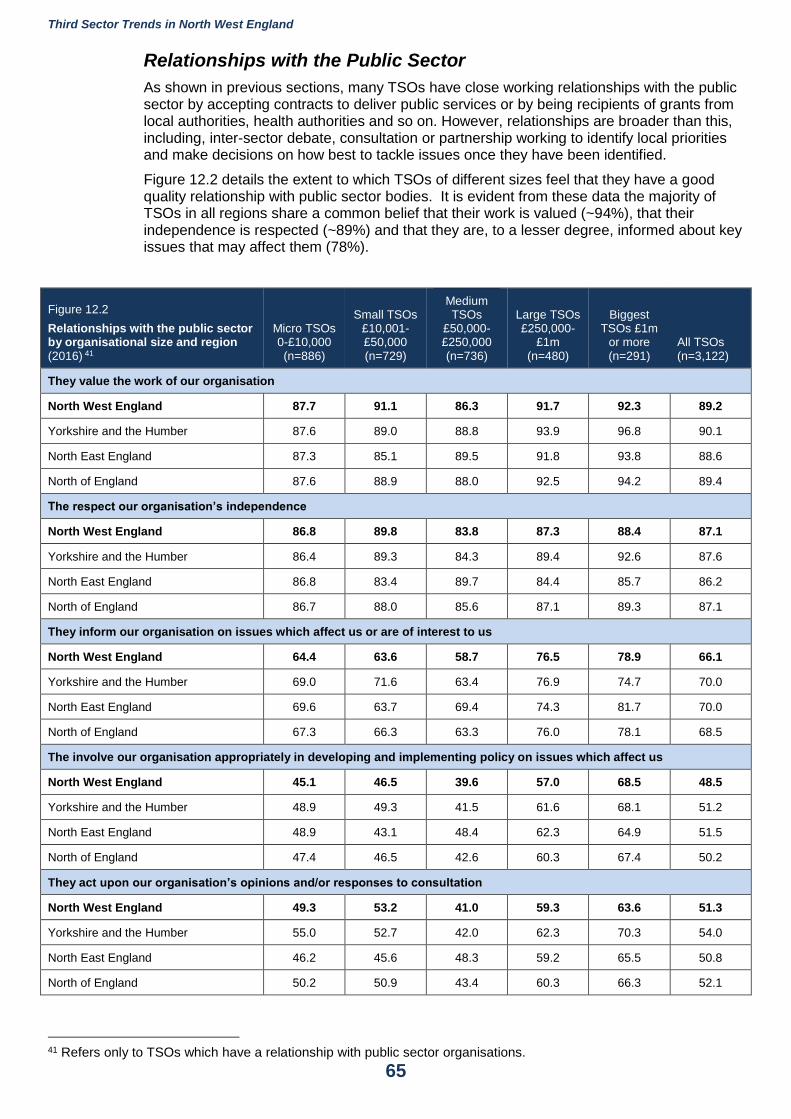
Third Sector Trends in North West England
65
Relationships with the Public Sector
As shown in previous sections, many TSOs have close working relationships with the public sector by accepting contracts to deliver public services or by being recipients of grants from local authorities, health authorities and so on. However, relationships are broader than this, including, inter-sector debate, consultation or partnership working to identify local priorities and make decisions on how best to tackle issues once they have been identified.
Figure 12.2 details the extent to which TSOs of different sizes feel that they have a good quality relationship with public sector bodies. It is evident from these data the majority of TSOs in all regions share a common belief that their work is valued (~94%), that their independence is respected (~89%) and that they are, to a lesser degree, informed about key issues that may affect them (78%).
Figure 12.2
Relationships with the public sector by organisational size and region (2016) 41
Micro TSOs 0-£10,000 (n=886)
Small TSOs £10,001-£50,000 (n=729)
Medium TSOs
£50,000-£250,000 (n=736)
Large TSOs £250,000-
£1m (n=480)
Biggest TSOs £1m
or more (n=291)
All TSOs (n=3,122)
They value the work of our organisation
North West England 87.7 91.1 86.3 91.7 92.3 89.2
Yorkshire and the Humber 87.6 89.0 88.8 93.9 96.8 90.1
North East England 87.3 85.1 89.5 91.8 93.8 88.6
North of England 87.6 88.9 88.0 92.5 94.2 89.4
The respect our organisation’s independence
North West England 86.8 89.8 83.8 87.3 88.4 87.1
Yorkshire and the Humber 86.4 89.3 84.3 89.4 92.6 87.6
North East England 86.8 83.4 89.7 84.4 85.7 86.2
North of England 86.7 88.0 85.6 87.1 89.3 87.1
They inform our organisation on issues which affect us or are of interest to us
North West England 64.4 63.6 58.7 76.5 78.9 66.1
Yorkshire and the Humber 69.0 71.6 63.4 76.9 74.7 70.0
North East England 69.6 63.7 69.4 74.3 81.7 70.0
North of England 67.3 66.3 63.3 76.0 78.1 68.5
The involve our organisation appropriately in developing and implementing policy on issues which affect us
North West England 45.1 46.5 39.6 57.0 68.5 48.5
Yorkshire and the Humber 48.9 49.3 41.5 61.6 68.1 51.2
North East England 48.9 43.1 48.4 62.3 64.9 51.5
North of England 47.4 46.5 42.6 60.3 67.4 50.2
They act upon our organisation’s opinions and/or responses to consultation
North West England 49.3 53.2 41.0 59.3 63.6 51.3
Yorkshire and the Humber 55.0 52.7 42.0 62.3 70.3 54.0
North East England 46.2 45.6 48.3 59.2 65.5 50.8
North of England 50.2 50.9 43.4 60.3 66.3 52.1
41 Refers only to TSOs which have a relationship with public sector organisations.
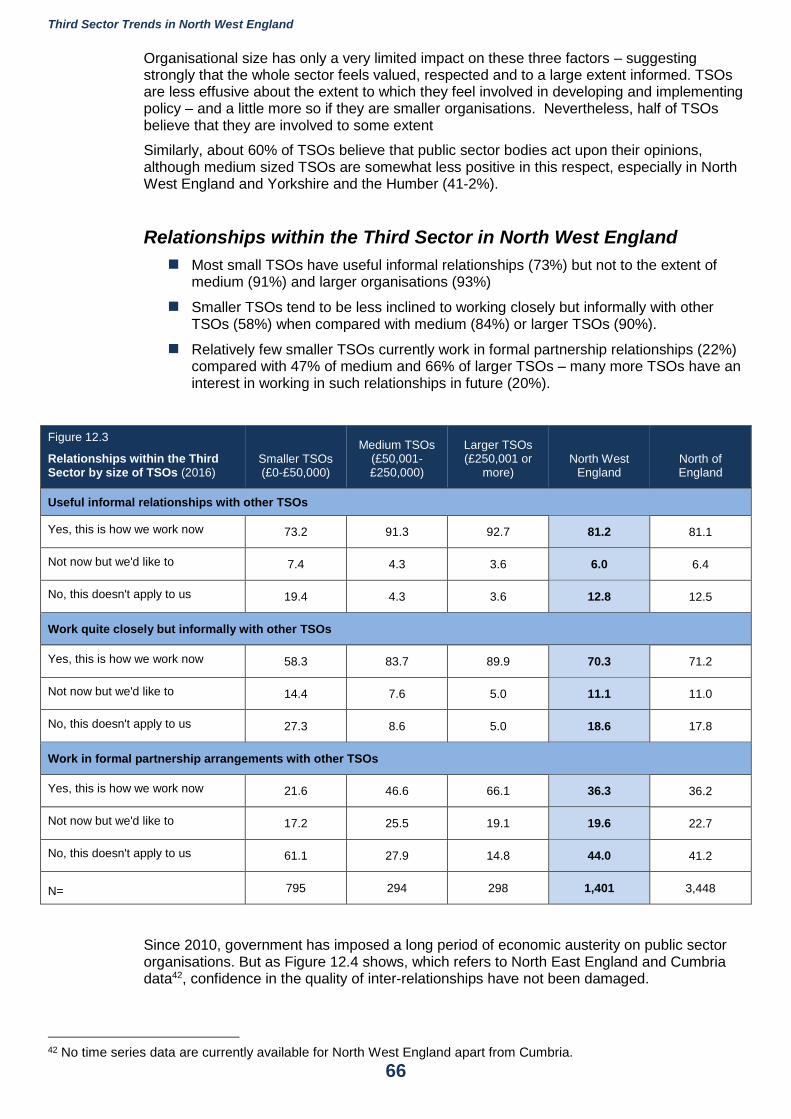
Third Sector Trends in North West England
66
Organisational size has only a very limited impact on these three factors – suggesting strongly that the whole sector feels valued, respected and to a large extent informed. TSOs are less effusive about the extent to which they feel involved in developing and implementing policy – and a little more so if they are smaller organisations. Nevertheless, half of TSOs believe that they are involved to some extent
Similarly, about 60% of TSOs believe that public sector bodies act upon their opinions, although medium sized TSOs are somewhat less positive in this respect, especially in North West England and Yorkshire and the Humber (41-2%).
Relationships within the Third Sector in North West England
Most small TSOs have useful informal relationships (73%) but not to the extent of medium (91%) and larger organisations (93%)
Smaller TSOs tend to be less inclined to working closely but informally with other TSOs (58%) when compared with medium (84%) or larger TSOs (90%).
Relatively few smaller TSOs currently work in formal partnership relationships (22%) compared with 47% of medium and 66% of larger TSOs – many more TSOs have an interest in working in such relationships in future (20%).
Figure 12.3
Relationships within the Third Sector by size of TSOs (2016)
Smaller TSOs (£0-£50,000)
Medium TSOs (£50,001-£250,000)
Larger TSOs (£250,001 or
more) North West
England North of England
Useful informal relationships with other TSOs
Yes, this is how we work now 73.2 91.3 92.7 81.2 81.1
Not now but we'd like to 7.4 4.3 3.6 6.0 6.4
No, this doesn't apply to us 19.4 4.3 3.6 12.8 12.5
Work quite closely but informally with other TSOs
Yes, this is how we work now 58.3 83.7 89.9 70.3 71.2
Not now but we'd like to 14.4 7.6 5.0 11.1 11.0
No, this doesn't apply to us 27.3 8.6 5.0 18.6 17.8
Work in formal partnership arrangements with other TSOs
Yes, this is how we work now 21.6 46.6 66.1 36.3 36.2
Not now but we'd like to 17.2 25.5 19.1 19.6 22.7
No, this doesn't apply to us 61.1 27.9 14.8 44.0 41.2
N= 795 294 298 1,401 3,448
Since 2010, government has imposed a long period of economic austerity on public sector organisations. But as Figure 12.4 shows, which refers to North East England and Cumbria data42, confidence in the quality of inter-relationships have not been damaged.
42 No time series data are currently available for North West England apart from Cumbria.
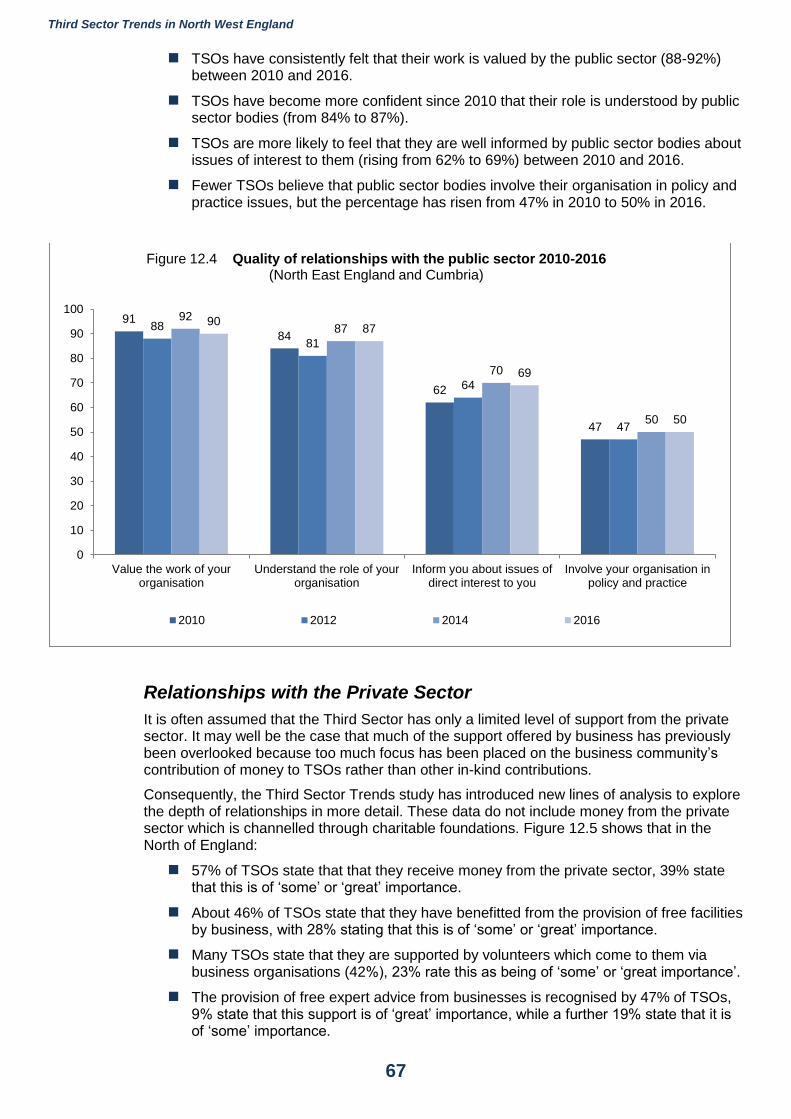
Third Sector Trends in North West England
67
TSOs have consistently felt that their work is valued by the public sector (88-92%) between 2010 and 2016.
TSOs have become more confident since 2010 that their role is understood by public sector bodies (from 84% to 87%).
TSOs are more likely to feel that they are well informed by public sector bodies about issues of interest to them (rising from 62% to 69%) between 2010 and 2016.
Fewer TSOs believe that public sector bodies involve their organisation in policy and practice issues, but the percentage has risen from 47% in 2010 to 50% in 2016.
Relationships with the Private Sector
It is often assumed that the Third Sector has only a limited level of support from the private sector. It may well be the case that much of the support offered by business has previously been overlooked because too much focus has been placed on the business community’s contribution of money to TSOs rather than other in-kind contributions.
Consequently, the Third Sector Trends study has introduced new lines of analysis to explore the depth of relationships in more detail. These data do not include money from the private sector which is channelled through charitable foundations. Figure 12.5 shows that in the North of England:
57% of TSOs state that that they receive money from the private sector, 39% state that this is of ‘some’ or ‘great’ importance.
About 46% of TSOs state that they have benefitted from the provision of free facilities by business, with 28% stating that this is of ‘some’ or ‘great’ importance.
Many TSOs state that they are supported by volunteers which come to them via business organisations (42%), 23% rate this as being of ‘some’ or ‘great importance’.
The provision of free expert advice from businesses is recognised by 47% of TSOs, 9% state that this support is of ‘great’ importance, while a further 19% state that it is of ‘some’ importance.
91
84
62
47
88
81
64
47
9287
70
50
9087
69
50
0
10
20
30
40
50
60
70
80
90
100
Value the work of yourorganisation
Understand the role of yourorganisation
Inform you about issues ofdirect interest to you
Involve your organisation inpolicy and practice
Figure 12.4 Quality of relationships with the public sector 2010-2016(North East England and Cumbria)
2010 2012 2014 2016
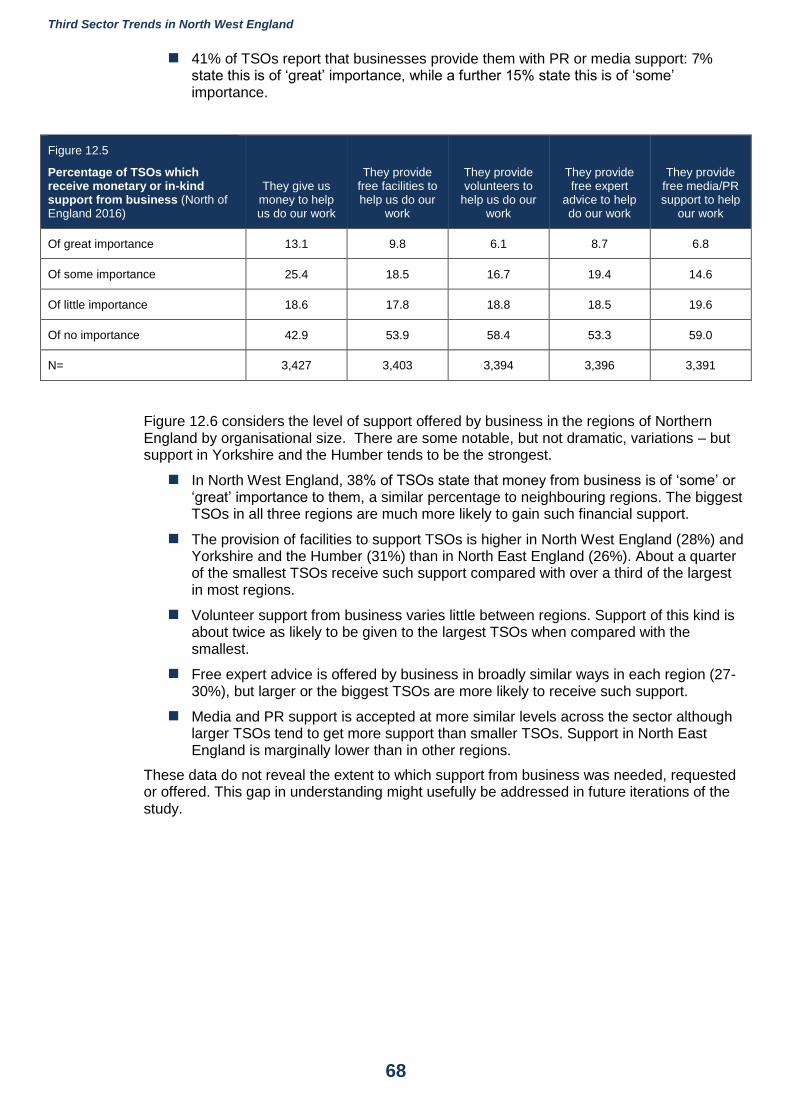
Third Sector Trends in North West England
68
41% of TSOs report that businesses provide them with PR or media support: 7% state this is of ‘great’ importance, while a further 15% state this is of ‘some’ importance.
Figure 12.5
Percentage of TSOs which receive monetary or in-kind support from business (North of England 2016)
They give us money to help us do our work
They provide free facilities to help us do our
work
They provide volunteers to
help us do our work
They provide free expert
advice to help do our work
They provide free media/PR support to help
our work
Of great importance 13.1 9.8 6.1 8.7 6.8
Of some importance 25.4 18.5 16.7 19.4 14.6
Of little importance 18.6 17.8 18.8 18.5 19.6
Of no importance 42.9 53.9 58.4 53.3 59.0
N= 3,427 3,403 3,394 3,396 3,391
Figure 12.6 considers the level of support offered by business in the regions of Northern England by organisational size. There are some notable, but not dramatic, variations – but support in Yorkshire and the Humber tends to be the strongest.
In North West England, 38% of TSOs state that money from business is of ‘some’ or ‘great’ importance to them, a similar percentage to neighbouring regions. The biggest TSOs in all three regions are much more likely to gain such financial support.
The provision of facilities to support TSOs is higher in North West England (28%) and Yorkshire and the Humber (31%) than in North East England (26%). About a quarter of the smallest TSOs receive such support compared with over a third of the largest in most regions.
Volunteer support from business varies little between regions. Support of this kind is about twice as likely to be given to the largest TSOs when compared with the smallest.
Free expert advice is offered by business in broadly similar ways in each region (27-30%), but larger or the biggest TSOs are more likely to receive such support.
Media and PR support is accepted at more similar levels across the sector although larger TSOs tend to get more support than smaller TSOs. Support in North East England is marginally lower than in other regions.
These data do not reveal the extent to which support from business was needed, requested or offered. This gap in understanding might usefully be addressed in future iterations of the study.
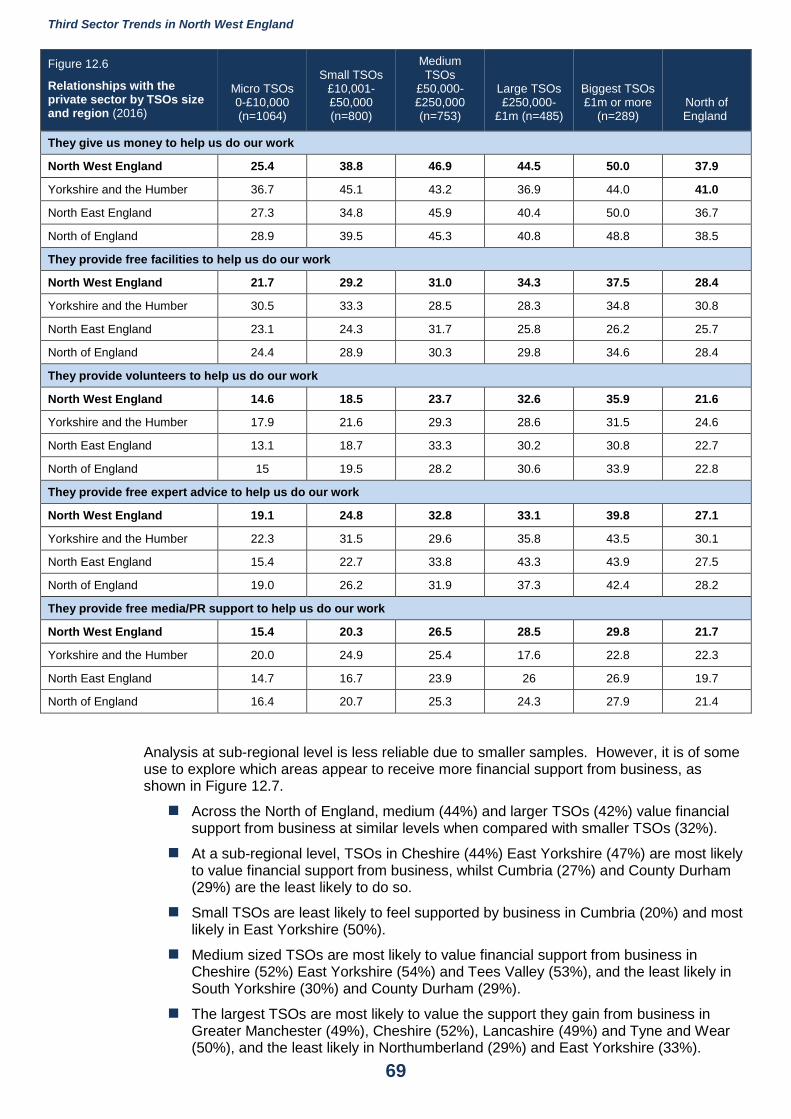
Third Sector Trends in North West England
69
Figure 12.6
Relationships with the private sector by TSOs size and region (2016)
Micro TSOs 0-£10,000 (n=1064)
Small TSOs £10,001-£50,000 (n=800)
Medium TSOs
£50,000-£250,000 (n=753)
Large TSOs £250,000-
£1m (n=485)
Biggest TSOs £1m or more
(n=289) North of England
They give us money to help us do our work
North West England 25.4 38.8 46.9 44.5 50.0 37.9
Yorkshire and the Humber 36.7 45.1 43.2 36.9 44.0 41.0
North East England 27.3 34.8 45.9 40.4 50.0 36.7
North of England 28.9 39.5 45.3 40.8 48.8 38.5
They provide free facilities to help us do our work
North West England 21.7 29.2 31.0 34.3 37.5 28.4
Yorkshire and the Humber 30.5 33.3 28.5 28.3 34.8 30.8
North East England 23.1 24.3 31.7 25.8 26.2 25.7
North of England 24.4 28.9 30.3 29.8 34.6 28.4
They provide volunteers to help us do our work
North West England 14.6 18.5 23.7 32.6 35.9 21.6
Yorkshire and the Humber 17.9 21.6 29.3 28.6 31.5 24.6
North East England 13.1 18.7 33.3 30.2 30.8 22.7
North of England 15 19.5 28.2 30.6 33.9 22.8
They provide free expert advice to help us do our work
North West England 19.1 24.8 32.8 33.1 39.8 27.1
Yorkshire and the Humber 22.3 31.5 29.6 35.8 43.5 30.1
North East England 15.4 22.7 33.8 43.3 43.9 27.5
North of England 19.0 26.2 31.9 37.3 42.4 28.2
They provide free media/PR support to help us do our work
North West England 15.4 20.3 26.5 28.5 29.8 21.7
Yorkshire and the Humber 20.0 24.9 25.4 17.6 22.8 22.3
North East England 14.7 16.7 23.9 26 26.9 19.7
North of England 16.4 20.7 25.3 24.3 27.9 21.4
Analysis at sub-regional level is less reliable due to smaller samples. However, it is of some use to explore which areas appear to receive more financial support from business, as shown in Figure 12.7.
Across the North of England, medium (44%) and larger TSOs (42%) value financial support from business at similar levels when compared with smaller TSOs (32%).
At a sub-regional level, TSOs in Cheshire (44%) East Yorkshire (47%) are most likely to value financial support from business, whilst Cumbria (27%) and County Durham (29%) are the least likely to do so.
Small TSOs are least likely to feel supported by business in Cumbria (20%) and most likely in East Yorkshire (50%).
Medium sized TSOs are most likely to value financial support from business in Cheshire (52%) East Yorkshire (54%) and Tees Valley (53%), and the least likely in South Yorkshire (30%) and County Durham (29%).
The largest TSOs are most likely to value the support they gain from business in Greater Manchester (49%), Cheshire (52%), Lancashire (49%) and Tyne and Wear (50%), and the least likely in Northumberland (29%) and East Yorkshire (33%).
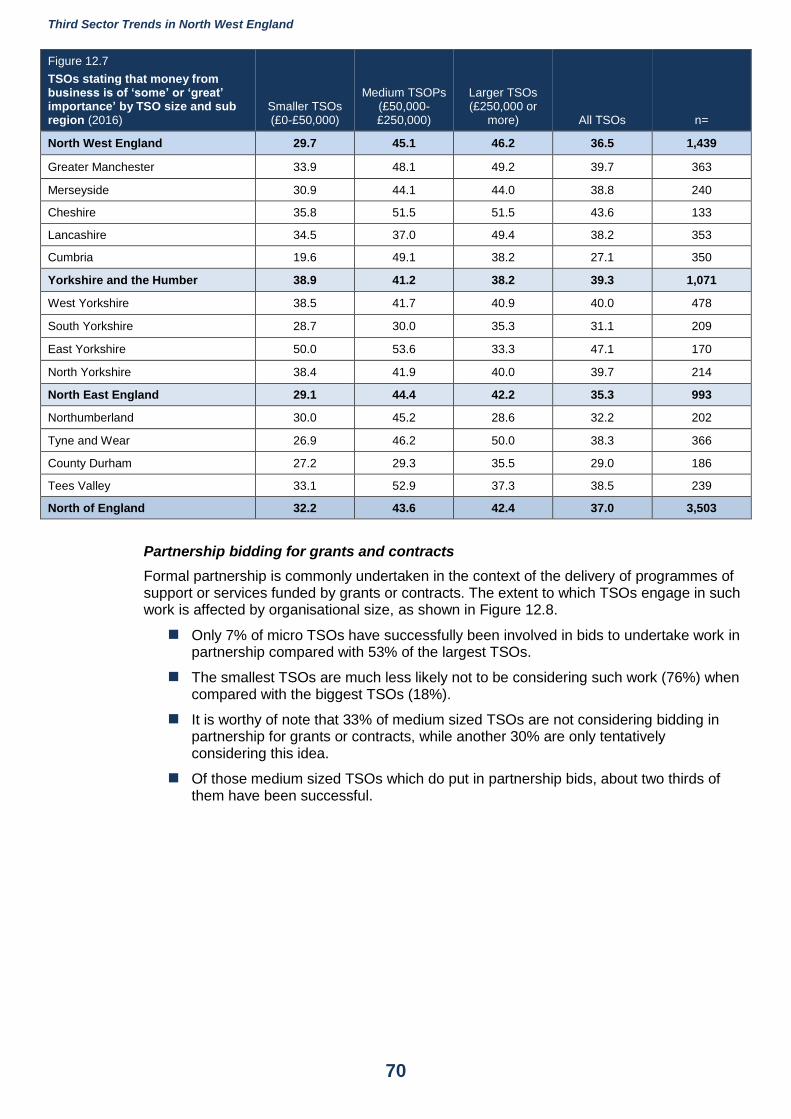
Third Sector Trends in North West England
70
Figure 12.7
TSOs stating that money from business is of ‘some’ or ‘great’ importance’ by TSO size and sub region (2016)
Smaller TSOs (£0-£50,000)
Medium TSOPs (£50,000-£250,000)
Larger TSOs (£250,000 or
more) All TSOs n=
North West England 29.7 45.1 46.2 36.5 1,439
Greater Manchester 33.9 48.1 49.2 39.7 363
Merseyside 30.9 44.1 44.0 38.8 240
Cheshire 35.8 51.5 51.5 43.6 133
Lancashire 34.5 37.0 49.4 38.2 353
Cumbria 19.6 49.1 38.2 27.1 350
Yorkshire and the Humber 38.9 41.2 38.2 39.3 1,071
West Yorkshire 38.5 41.7 40.9 40.0 478
South Yorkshire 28.7 30.0 35.3 31.1 209
East Yorkshire 50.0 53.6 33.3 47.1 170
North Yorkshire 38.4 41.9 40.0 39.7 214
North East England 29.1 44.4 42.2 35.3 993
Northumberland 30.0 45.2 28.6 32.2 202
Tyne and Wear 26.9 46.2 50.0 38.3 366
County Durham 27.2 29.3 35.5 29.0 186
Tees Valley 33.1 52.9 37.3 38.5 239
North of England 32.2 43.6 42.4 37.0 3,503
Partnership bidding for grants and contracts
Formal partnership is commonly undertaken in the context of the delivery of programmes of support or services funded by grants or contracts. The extent to which TSOs engage in such work is affected by organisational size, as shown in Figure 12.8.
Only 7% of micro TSOs have successfully been involved in bids to undertake work in partnership compared with 53% of the largest TSOs.
The smallest TSOs are much less likely not to be considering such work (76%) when compared with the biggest TSOs (18%).
It is worthy of note that 33% of medium sized TSOs are not considering bidding in partnership for grants or contracts, while another 30% are only tentatively considering this idea.
Of those medium sized TSOs which do put in partnership bids, about two thirds of them have been successful.
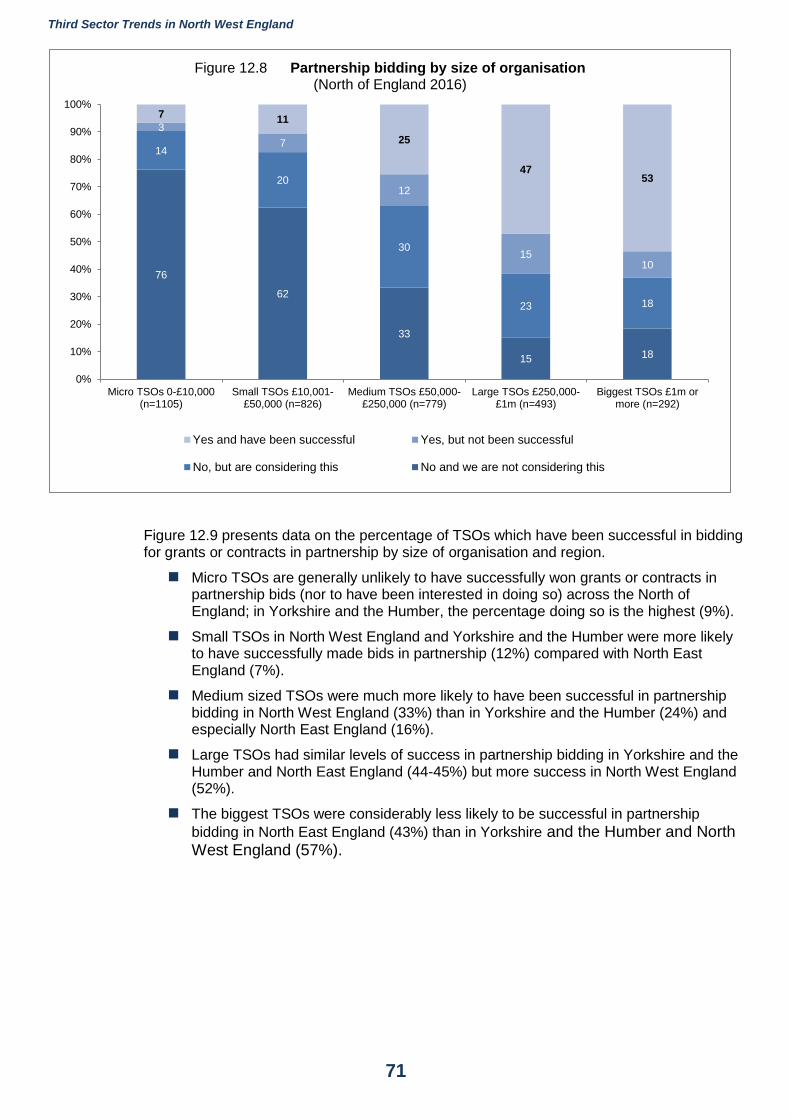
Third Sector Trends in North West England
71
Figure 12.9 presents data on the percentage of TSOs which have been successful in bidding for grants or contracts in partnership by size of organisation and region.
Micro TSOs are generally unlikely to have successfully won grants or contracts in partnership bids (nor to have been interested in doing so) across the North of England; in Yorkshire and the Humber, the percentage doing so is the highest (9%).
Small TSOs in North West England and Yorkshire and the Humber were more likely to have successfully made bids in partnership (12%) compared with North East England (7%).
Medium sized TSOs were much more likely to have been successful in partnership bidding in North West England (33%) than in Yorkshire and the Humber (24%) and especially North East England (16%).
Large TSOs had similar levels of success in partnership bidding in Yorkshire and the Humber and North East England (44-45%) but more success in North West England (52%).
The biggest TSOs were considerably less likely to be successful in partnership
bidding in North East England (43%) than in Yorkshire and the Humber and North West England (57%).
76
62
33
15 18
14
20
30
23 18
3
7
12
1510
711
25
4753
0%
10%
20%
30%
40%
50%
60%
70%
80%
90%
100%
Micro TSOs 0-£10,000(n=1105)
Small TSOs £10,001-£50,000 (n=826)
Medium TSOs £50,000-£250,000 (n=779)
Large TSOs £250,000-£1m (n=493)
Biggest TSOs £1m ormore (n=292)
Figure 12.8 Partnership bidding by size of organisation (North of England 2016)
Yes and have been successful Yes, but not been successful
No, but are considering this No and we are not considering this
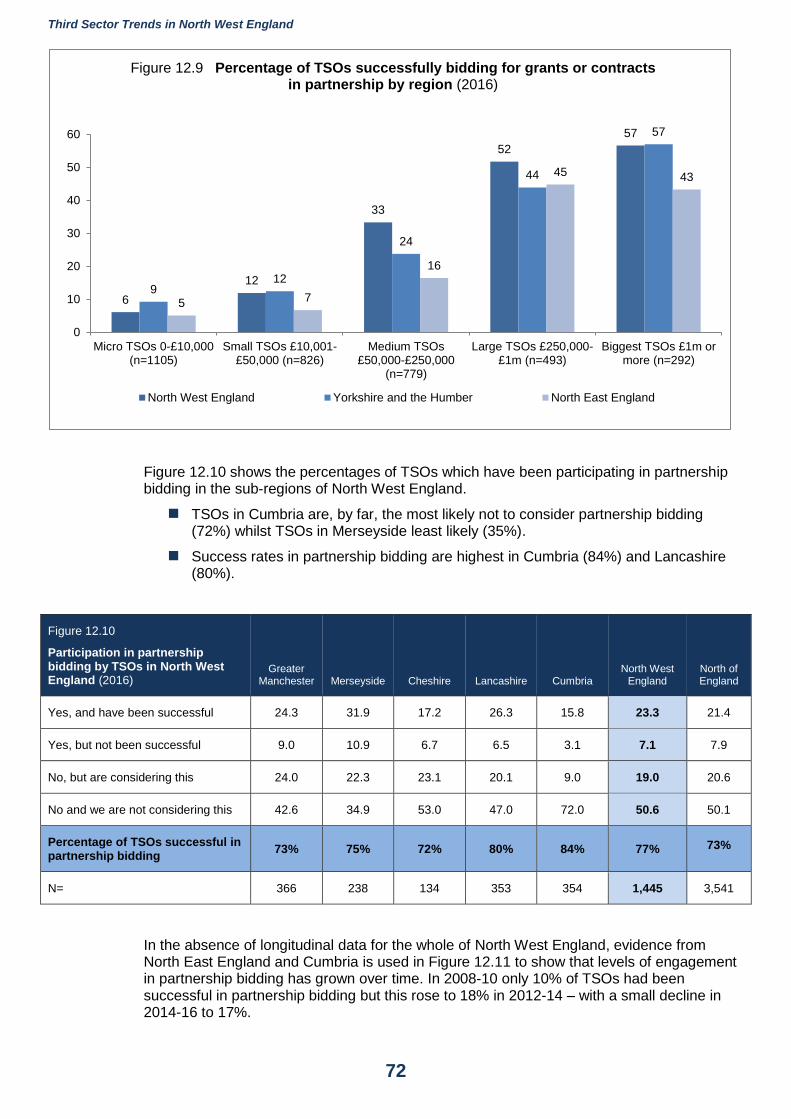
Third Sector Trends in North West England
72
Figure 12.10 shows the percentages of TSOs which have been participating in partnership bidding in the sub-regions of North West England.
TSOs in Cumbria are, by far, the most likely not to consider partnership bidding (72%) whilst TSOs in Merseyside least likely (35%).
Success rates in partnership bidding are highest in Cumbria (84%) and Lancashire (80%).
Figure 12.10
Participation in partnership bidding by TSOs in North West England (2016)
Greater Manchester Merseyside Cheshire Lancashire Cumbria
North West England
North of England
Yes, and have been successful 24.3 31.9 17.2 26.3 15.8 23.3 21.4
Yes, but not been successful 9.0 10.9 6.7 6.5 3.1 7.1 7.9
No, but are considering this 24.0 22.3 23.1 20.1 9.0 19.0 20.6
No and we are not considering this 42.6 34.9 53.0 47.0 72.0 50.6 50.1
Percentage of TSOs successful in partnership bidding
73% 75% 72% 80% 84% 77% 73%
N= 366 238 134 353 354 1,445 3,541
In the absence of longitudinal data for the whole of North West England, evidence from North East England and Cumbria is used in Figure 12.11 to show that levels of engagement in partnership bidding has grown over time. In 2008-10 only 10% of TSOs had been successful in partnership bidding but this rose to 18% in 2012-14 – with a small decline in 2014-16 to 17%.
6
12
33
52
57
912
24
44
57
5 7
16
45 43
0
10
20
30
40
50
60
Micro TSOs 0-£10,000(n=1105)
Small TSOs £10,001-£50,000 (n=826)
Medium TSOs£50,000-£250,000
(n=779)
Large TSOs £250,000-£1m (n=493)
Biggest TSOs £1m ormore (n=292)
Figure 12.9 Percentage of TSOs successfully bidding for grants or contracts in partnership by region (2016)
North West England Yorkshire and the Humber North East England
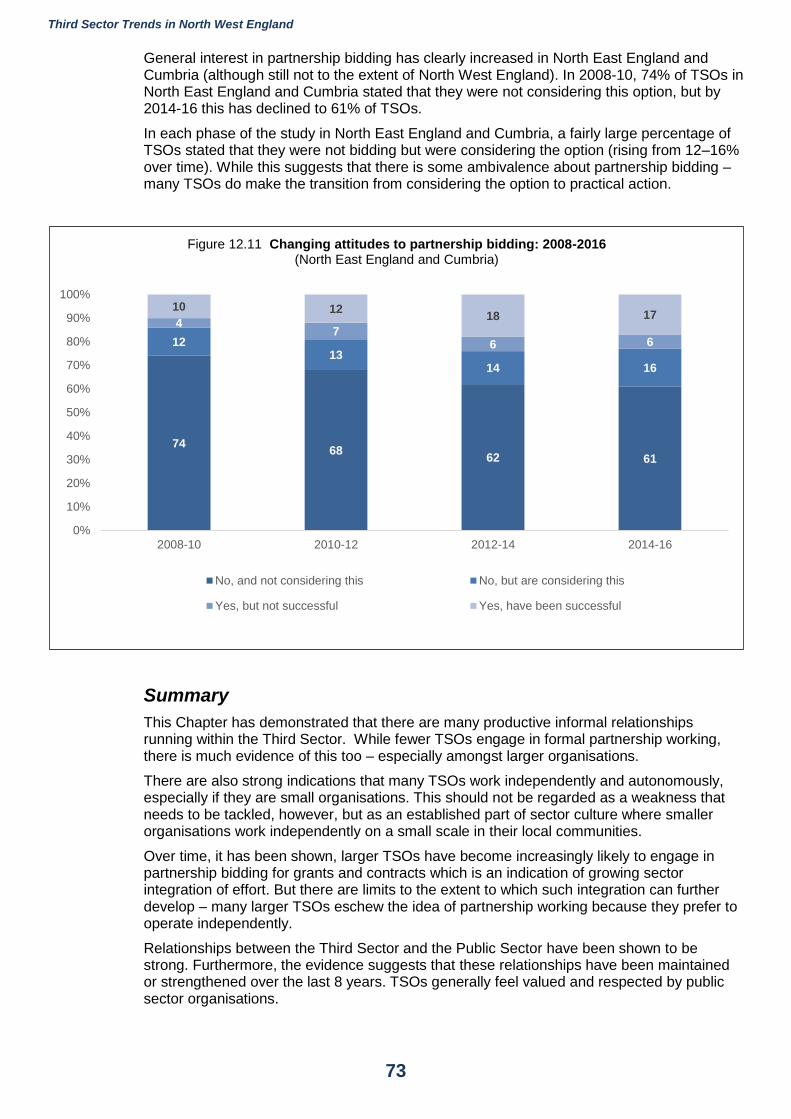
Third Sector Trends in North West England
73
General interest in partnership bidding has clearly increased in North East England and Cumbria (although still not to the extent of North West England). In 2008-10, 74% of TSOs in North East England and Cumbria stated that they were not considering this option, but by 2014-16 this has declined to 61% of TSOs.
In each phase of the study in North East England and Cumbria, a fairly large percentage of TSOs stated that they were not bidding but were considering the option (rising from 12–16% over time). While this suggests that there is some ambivalence about partnership bidding – many TSOs do make the transition from considering the option to practical action.
Summary
This Chapter has demonstrated that there are many productive informal relationships running within the Third Sector. While fewer TSOs engage in formal partnership working, there is much evidence of this too – especially amongst larger organisations.
There are also strong indications that many TSOs work independently and autonomously, especially if they are small organisations. This should not be regarded as a weakness that needs to be tackled, however, but as an established part of sector culture where smaller organisations work independently on a small scale in their local communities.
Over time, it has been shown, larger TSOs have become increasingly likely to engage in partnership bidding for grants and contracts which is an indication of growing sector integration of effort. But there are limits to the extent to which such integration can further develop – many larger TSOs eschew the idea of partnership working because they prefer to operate independently.
Relationships between the Third Sector and the Public Sector have been shown to be strong. Furthermore, the evidence suggests that these relationships have been maintained or strengthened over the last 8 years. TSOs generally feel valued and respected by public sector organisations.
7468
62 61
1213
14 16
47
6 6
10 1218 17
0%
10%
20%
30%
40%
50%
60%
70%
80%
90%
100%
2008-10 2010-12 2012-14 2014-16
Figure 12.11 Changing attitudes to partnership bidding: 2008-2016 (North East England and Cumbria)
No, and not considering this No, but are considering this
Yes, but not successful Yes, have been successful

Third Sector Trends in North West England
74
While fewer organisations think they are fully informed about policy or involved in decision making – the indications are that larger TSOs feel well informed and have a say in the generation of policy and practice in areas relevant to their interests.
It is often assumed that the Third Sector connects with the Private Sector in only a very limited way. But, until now, there has been little research available on the relationships between the local Third Sector and the Private Sector to confirm or challenge such assumptions.
It has been demonstrated in this Chapter that business makes a significant contribution to the resources of the Third Sector and perhaps more so than many observers may have expected. This contribution includes the provision of financial resources, facilities and volunteer support, and involves the provision of free professional advice.
As will be shown in the next chapter, many TSOs are not yet acting or planning to act to build stronger connections with the private sector. This may be due to a lack of awareness of how much of a contribution the private sector currently makes in resource terms.
Third Sector Trends in North West England
75
13 Expectations and preparation for the future
The final chapter of this report considers TSOs’ expectations about the future and examines what action TSOs are taking to address future developments.
Figure 13.1 shows what percentage of TSOs from each region expect that change will occur over the next two years. The responses only apply to TSOs which state that the issue in question is applicable to their organisation.
Optimism about increased income is most common in Yorkshire and the Humber (41%). In North East England and North West England 35% of TSOs expect that income will increase over the next two years. Only 17-18% of TSOs across the North of England expect income to decline.
50% of TSOs in Yorkshire and the Humber and 45% of TSOs in North East England and North West England expect their expenditure to increase, which lags 10% behind expectations about increased income. Only 7% of TSOs expect that expenditure will decline, a somewhat lower percentage than of those organisations which expect income to decline (17%).
Between 28-33% of TSOs expect that the numbers of paid staff will increase over the next two years, while 15-18% of TSOs expect a decline.
Expectations about increased numbers of volunteers are high, and especially in Yorkshire and the Humber where 45% of TSOs expect this to happen. Relatively few TSOs expect the numbers of volunteers to decline (in the range of 7-9%).
A majority of TSOs expect that demand for their services will increase in the North of England (68%); this is most pronounced in Yorkshire and the Humber (73%) but the least in North East England (62%). Virtually none of the TSOs believe that demand will fall for their services.
Expectations about statutory income are mixed: 18% expect increases in income from public sector sources, while 49% expect a decrease. TSOs in North East England are the most pessimistic about falling income (51%) and least optimistic about rising income (14%).
There is a widespread expectation that working in partnerships will increase (55%), especially in Yorkshire and the Humber (57%) and North West England (56%). Very few TSOs think that partnership working will decrease (3%).
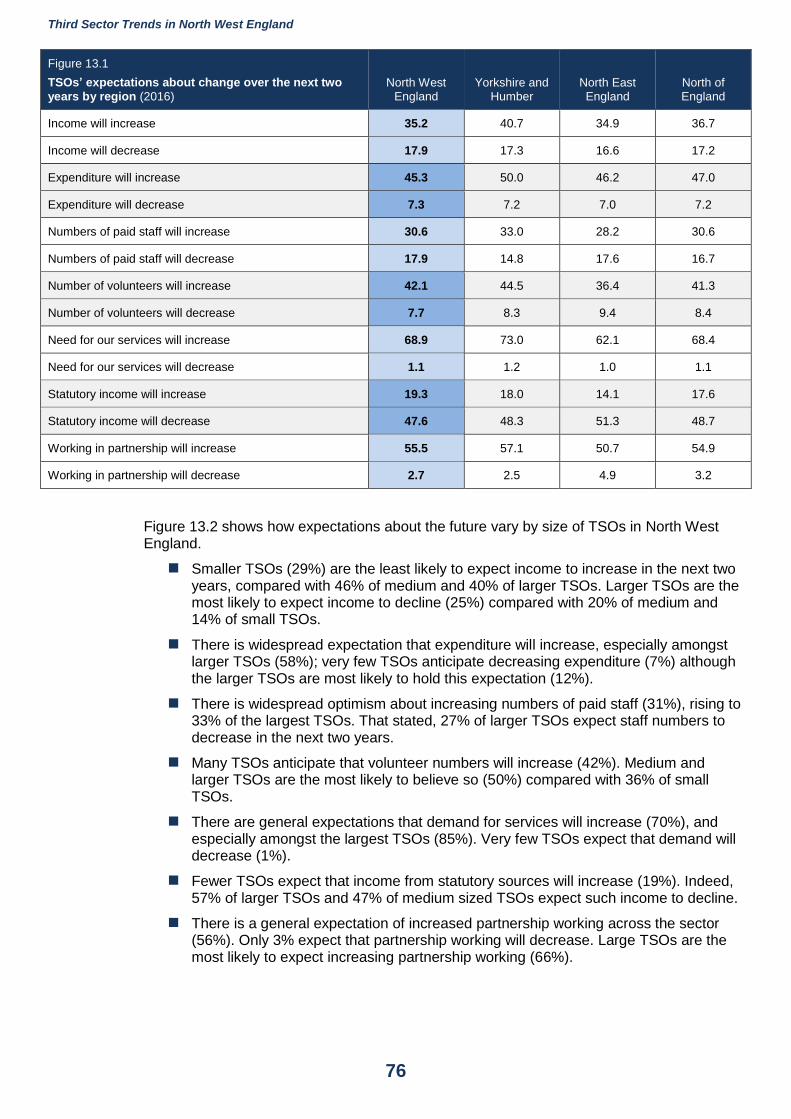
Third Sector Trends in North West England
76
Figure 13.1
TSOs’ expectations about change over the next two
years by region (2016) North West
England Yorkshire and
Humber North East England
North of England
Income will increase 35.2 40.7 34.9 36.7
Income will decrease 17.9 17.3 16.6 17.2
Expenditure will increase 45.3 50.0 46.2 47.0
Expenditure will decrease 7.3 7.2 7.0 7.2
Numbers of paid staff will increase 30.6 33.0 28.2 30.6
Numbers of paid staff will decrease 17.9 14.8 17.6 16.7
Number of volunteers will increase 42.1 44.5 36.4 41.3
Number of volunteers will decrease 7.7 8.3 9.4 8.4
Need for our services will increase 68.9 73.0 62.1 68.4
Need for our services will decrease 1.1 1.2 1.0 1.1
Statutory income will increase 19.3 18.0 14.1 17.6
Statutory income will decrease 47.6 48.3 51.3 48.7
Working in partnership will increase 55.5 57.1 50.7 54.9
Working in partnership will decrease 2.7 2.5 4.9 3.2
Figure 13.2 shows how expectations about the future vary by size of TSOs in North West England.
Smaller TSOs (29%) are the least likely to expect income to increase in the next two years, compared with 46% of medium and 40% of larger TSOs. Larger TSOs are the most likely to expect income to decline (25%) compared with 20% of medium and 14% of small TSOs.
There is widespread expectation that expenditure will increase, especially amongst larger TSOs (58%); very few TSOs anticipate decreasing expenditure (7%) although the larger TSOs are most likely to hold this expectation (12%).
There is widespread optimism about increasing numbers of paid staff (31%), rising to 33% of the largest TSOs. That stated, 27% of larger TSOs expect staff numbers to decrease in the next two years.
Many TSOs anticipate that volunteer numbers will increase (42%). Medium and larger TSOs are the most likely to believe so (50%) compared with 36% of small TSOs.
There are general expectations that demand for services will increase (70%), and especially amongst the largest TSOs (85%). Very few TSOs expect that demand will decrease (1%).
Fewer TSOs expect that income from statutory sources will increase (19%). Indeed, 57% of larger TSOs and 47% of medium sized TSOs expect such income to decline.
There is a general expectation of increased partnership working across the sector (56%). Only 3% expect that partnership working will decrease. Large TSOs are the most likely to expect increasing partnership working (66%).
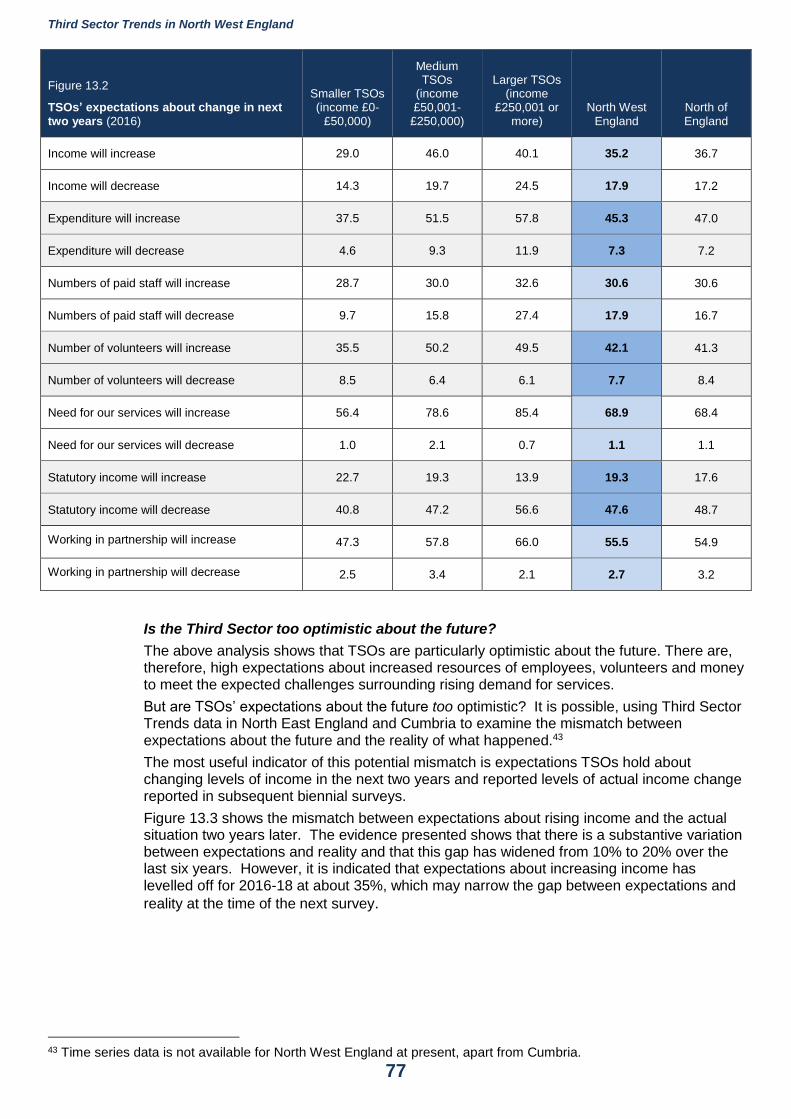
Third Sector Trends in North West England
77
Figure 13.2
TSOs’ expectations about change in next two years (2016)
Smaller TSOs (income £0-
£50,000)
Medium TSOs
(income £50,001-
£250,000)
Larger TSOs (income
£250,001 or more)
North West England
North of England
Income will increase 29.0 46.0 40.1 35.2 36.7
Income will decrease 14.3 19.7 24.5 17.9 17.2
Expenditure will increase 37.5 51.5 57.8 45.3 47.0
Expenditure will decrease 4.6 9.3 11.9 7.3 7.2
Numbers of paid staff will increase 28.7 30.0 32.6 30.6 30.6
Numbers of paid staff will decrease 9.7 15.8 27.4 17.9 16.7
Number of volunteers will increase 35.5 50.2 49.5 42.1 41.3
Number of volunteers will decrease 8.5 6.4 6.1 7.7 8.4
Need for our services will increase 56.4 78.6 85.4 68.9 68.4
Need for our services will decrease 1.0 2.1 0.7 1.1 1.1
Statutory income will increase 22.7 19.3 13.9 19.3 17.6
Statutory income will decrease 40.8 47.2 56.6 47.6 48.7
Working in partnership will increase 47.3 57.8 66.0 55.5 54.9
Working in partnership will decrease 2.5 3.4 2.1 2.7 3.2
Is the Third Sector too optimistic about the future?
The above analysis shows that TSOs are particularly optimistic about the future. There are, therefore, high expectations about increased resources of employees, volunteers and money to meet the expected challenges surrounding rising demand for services.
But are TSOs’ expectations about the future too optimistic? It is possible, using Third Sector Trends data in North East England and Cumbria to examine the mismatch between expectations about the future and the reality of what happened.43
The most useful indicator of this potential mismatch is expectations TSOs hold about changing levels of income in the next two years and reported levels of actual income change reported in subsequent biennial surveys.
Figure 13.3 shows the mismatch between expectations about rising income and the actual situation two years later. The evidence presented shows that there is a substantive variation between expectations and reality and that this gap has widened from 10% to 20% over the last six years. However, it is indicated that expectations about increasing income has levelled off for 2016-18 at about 35%, which may narrow the gap between expectations and
reality at the time of the next survey.
43 Time series data is not available for North West England at present, apart from Cumbria.
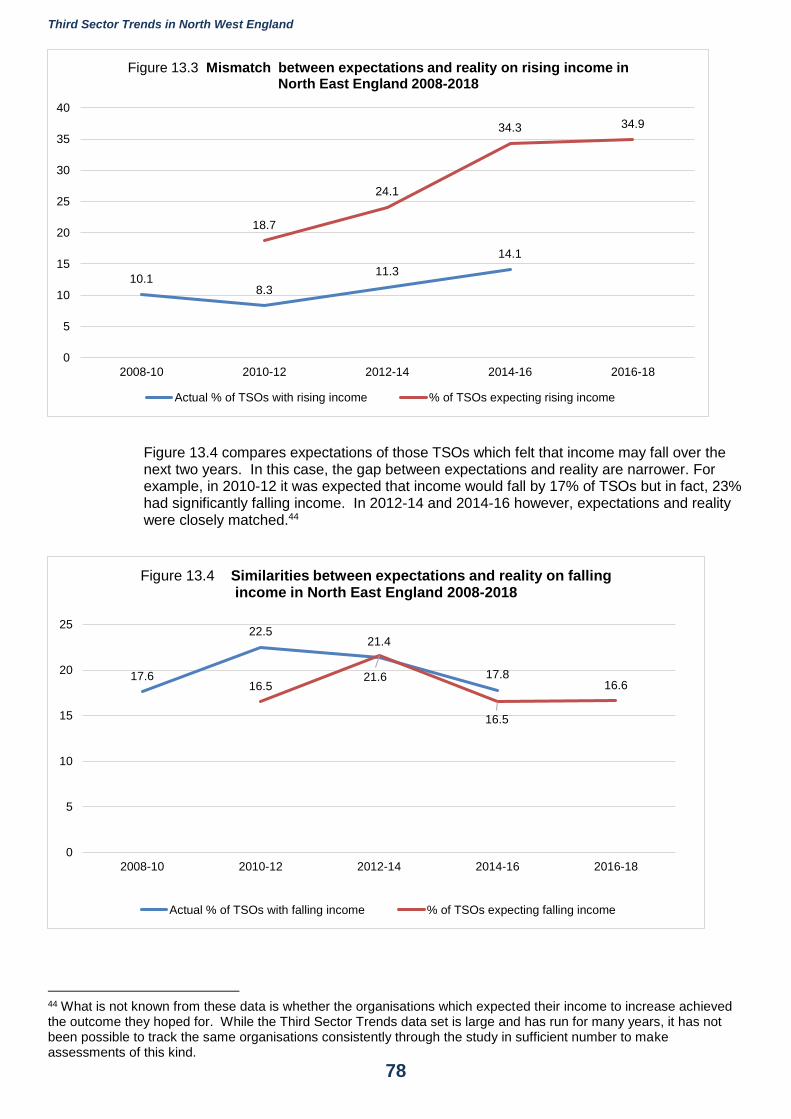
Third Sector Trends in North West England
78
Figure 13.4 compares expectations of those TSOs which felt that income may fall over the next two years. In this case, the gap between expectations and reality are narrower. For example, in 2010-12 it was expected that income would fall by 17% of TSOs but in fact, 23% had significantly falling income. In 2012-14 and 2014-16 however, expectations and reality were closely matched.44
44 What is not known from these data is whether the organisations which expected their income to increase achieved the outcome they hoped for. While the Third Sector Trends data set is large and has run for many years, it has not been possible to track the same organisations consistently through the study in sufficient number to make assessments of this kind.
10.18.3
11.3
14.1
18.7
24.1
34.3 34.9
0
5
10
15
20
25
30
35
40
2008-10 2010-12 2012-14 2014-16 2016-18
Figure 13.3 Mismatch between expectations and reality on rising income in North East England 2008-2018
Actual % of TSOs with rising income % of TSOs expecting rising income
17.6
22.521.4
17.816.5
21.6
16.5
16.6
0
5
10
15
20
25
2008-10 2010-12 2012-14 2014-16 2016-18
Figure 13.4 Similarities between expectations and reality on falling income in North East England 2008-2018
Actual % of TSOs with falling income % of TSOs expecting falling income
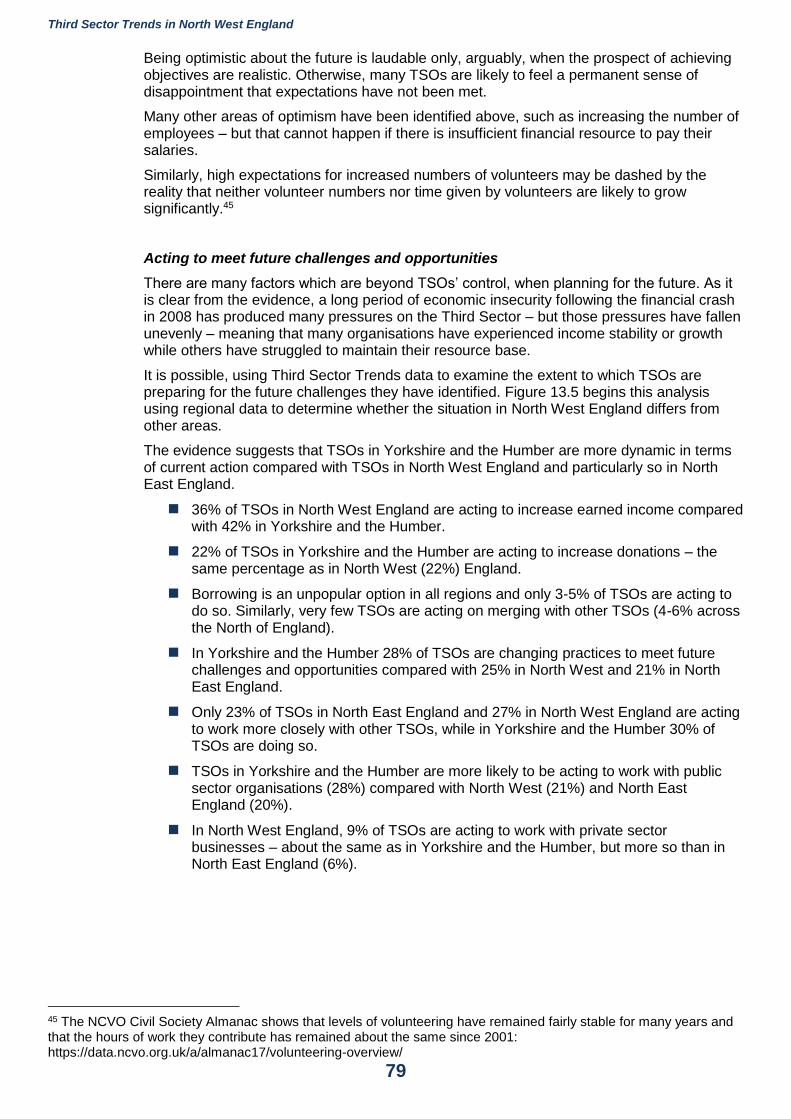
Third Sector Trends in North West England
79
Being optimistic about the future is laudable only, arguably, when the prospect of achieving objectives are realistic. Otherwise, many TSOs are likely to feel a permanent sense of disappointment that expectations have not been met.
Many other areas of optimism have been identified above, such as increasing the number of employees – but that cannot happen if there is insufficient financial resource to pay their salaries.
Similarly, high expectations for increased numbers of volunteers may be dashed by the reality that neither volunteer numbers nor time given by volunteers are likely to grow significantly.45
Acting to meet future challenges and opportunities
There are many factors which are beyond TSOs’ control, when planning for the future. As it is clear from the evidence, a long period of economic insecurity following the financial crash in 2008 has produced many pressures on the Third Sector – but those pressures have fallen unevenly – meaning that many organisations have experienced income stability or growth while others have struggled to maintain their resource base.
It is possible, using Third Sector Trends data to examine the extent to which TSOs are preparing for the future challenges they have identified. Figure 13.5 begins this analysis using regional data to determine whether the situation in North West England differs from other areas.
The evidence suggests that TSOs in Yorkshire and the Humber are more dynamic in terms of current action compared with TSOs in North West England and particularly so in North East England.
36% of TSOs in North West England are acting to increase earned income compared with 42% in Yorkshire and the Humber.
22% of TSOs in Yorkshire and the Humber are acting to increase donations – the same percentage as in North West (22%) England.
Borrowing is an unpopular option in all regions and only 3-5% of TSOs are acting to do so. Similarly, very few TSOs are acting on merging with other TSOs (4-6% across the North of England).
In Yorkshire and the Humber 28% of TSOs are changing practices to meet future challenges and opportunities compared with 25% in North West and 21% in North East England.
Only 23% of TSOs in North East England and 27% in North West England are acting to work more closely with other TSOs, while in Yorkshire and the Humber 30% of TSOs are doing so.
TSOs in Yorkshire and the Humber are more likely to be acting to work with public sector organisations (28%) compared with North West (21%) and North East England (20%).
In North West England, 9% of TSOs are acting to work with private sector businesses – about the same as in Yorkshire and the Humber, but more so than in North East England (6%).
45 The NCVO Civil Society Almanac shows that levels of volunteering have remained fairly stable for many years and that the hours of work they contribute has remained about the same since 2001: https://data.ncvo.org.uk/a/almanac17/volunteering-overview/
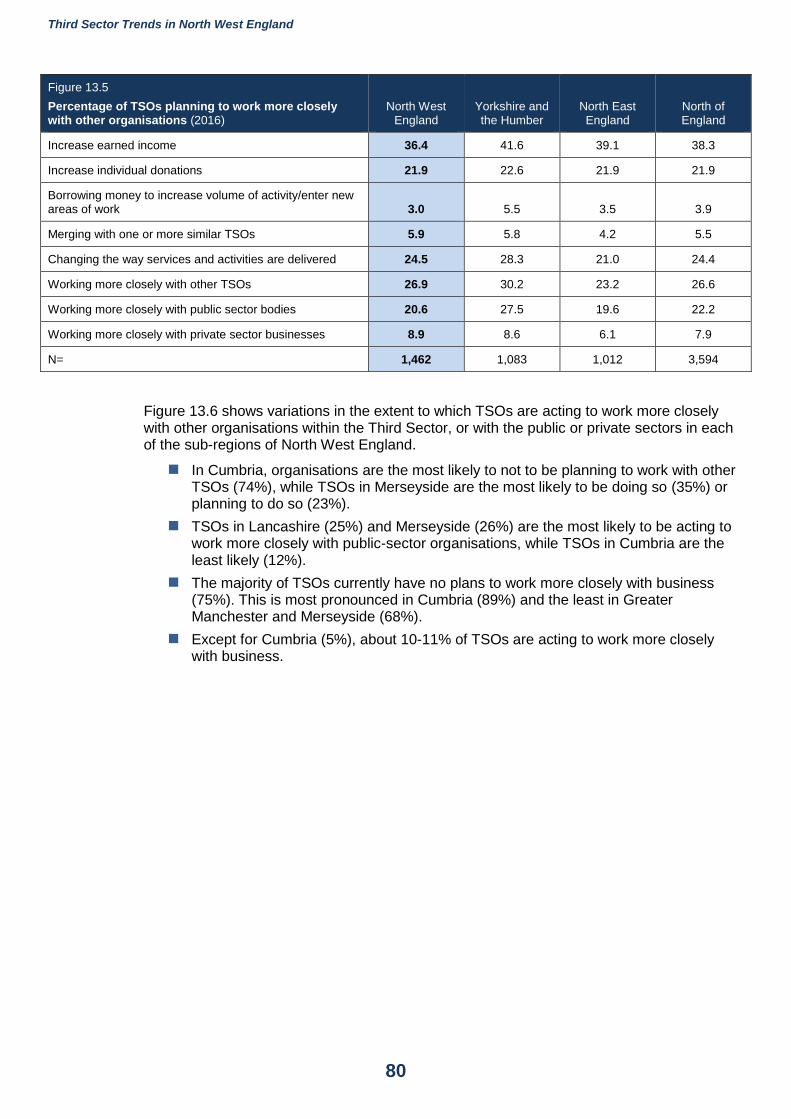
Third Sector Trends in North West England
80
Figure 13.5
Percentage of TSOs planning to work more closely with other organisations (2016)
North West England
Yorkshire and the Humber
North East England
North of England
Increase earned income 36.4 41.6 39.1 38.3
Increase individual donations 21.9 22.6 21.9 21.9
Borrowing money to increase volume of activity/enter new areas of work 3.0 5.5 3.5 3.9
Merging with one or more similar TSOs 5.9 5.8 4.2 5.5
Changing the way services and activities are delivered 24.5 28.3 21.0 24.4
Working more closely with other TSOs 26.9 30.2 23.2 26.6
Working more closely with public sector bodies 20.6 27.5 19.6 22.2
Working more closely with private sector businesses 8.9 8.6 6.1 7.9
N= 1,462 1,083 1,012 3,594
Figure 13.6 shows variations in the extent to which TSOs are acting to work more closely with other organisations within the Third Sector, or with the public or private sectors in each of the sub-regions of North West England.
In Cumbria, organisations are the most likely to not to be planning to work with other TSOs (74%), while TSOs in Merseyside are the most likely to be doing so (35%) or planning to do so (23%).
TSOs in Lancashire (25%) and Merseyside (26%) are the most likely to be acting to work more closely with public-sector organisations, while TSOs in Cumbria are the least likely (12%).
The majority of TSOs currently have no plans to work more closely with business (75%). This is most pronounced in Cumbria (89%) and the least in Greater Manchester and Merseyside (68%).
Except for Cumbria (5%), about 10-11% of TSOs are acting to work more closely with business.
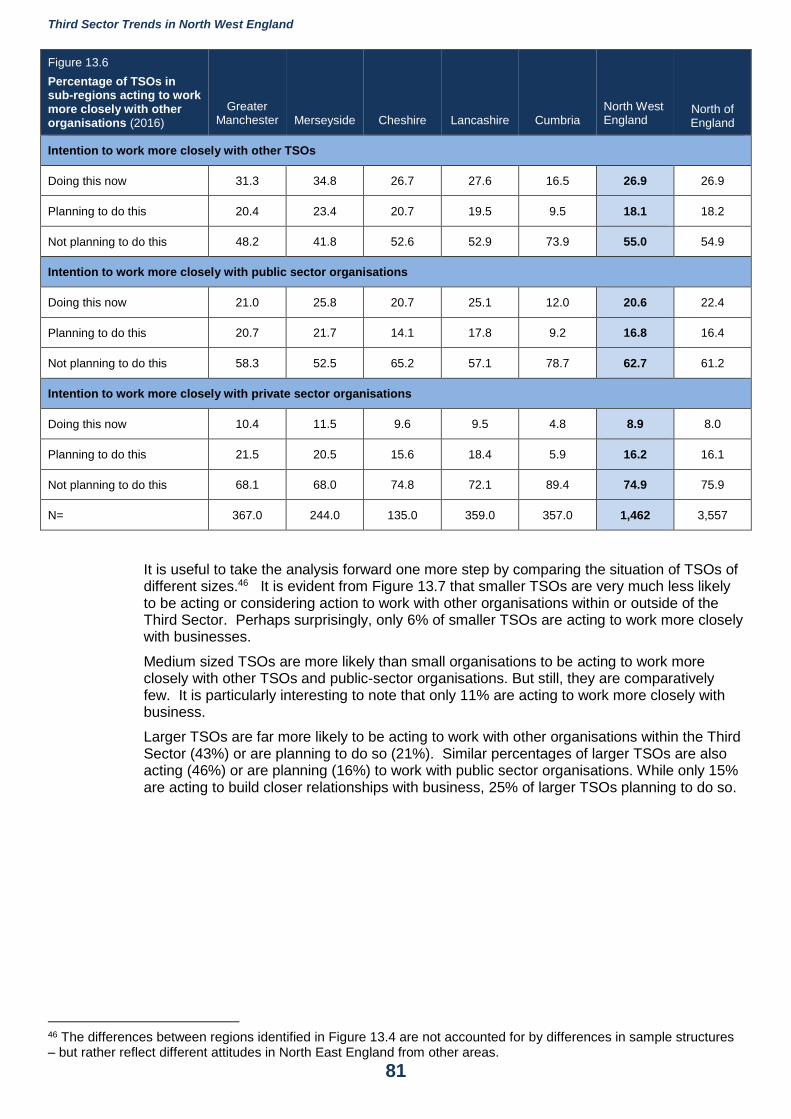
Third Sector Trends in North West England
81
Figure 13.6
Percentage of TSOs in sub-regions acting to work more closely with other organisations (2016)
Greater Manchester Merseyside Cheshire Lancashire Cumbria
North West England
North of England
Intention to work more closely with other TSOs
Doing this now 31.3 34.8 26.7 27.6 16.5 26.9 26.9
Planning to do this 20.4 23.4 20.7 19.5 9.5 18.1 18.2
Not planning to do this 48.2 41.8 52.6 52.9 73.9 55.0 54.9
Intention to work more closely with public sector organisations
Doing this now 21.0 25.8 20.7 25.1 12.0 20.6 22.4
Planning to do this 20.7 21.7 14.1 17.8 9.2 16.8 16.4
Not planning to do this 58.3 52.5 65.2 57.1 78.7 62.7 61.2
Intention to work more closely with private sector organisations
Doing this now 10.4 11.5 9.6 9.5 4.8 8.9 8.0
Planning to do this 21.5 20.5 15.6 18.4 5.9 16.2 16.1
Not planning to do this 68.1 68.0 74.8 72.1 89.4 74.9 75.9
N= 367.0 244.0 135.0 359.0 357.0 1,462 3,557
It is useful to take the analysis forward one more step by comparing the situation of TSOs of different sizes.46 It is evident from Figure 13.7 that smaller TSOs are very much less likely to be acting or considering action to work with other organisations within or outside of the Third Sector. Perhaps surprisingly, only 6% of smaller TSOs are acting to work more closely with businesses.
Medium sized TSOs are more likely than small organisations to be acting to work more closely with other TSOs and public-sector organisations. But still, they are comparatively few. It is particularly interesting to note that only 11% are acting to work more closely with business.
Larger TSOs are far more likely to be acting to work with other organisations within the Third Sector (43%) or are planning to do so (21%). Similar percentages of larger TSOs are also acting (46%) or are planning (16%) to work with public sector organisations. While only 15% are acting to build closer relationships with business, 25% of larger TSOs planning to do so.
46 The differences between regions identified in Figure 13.4 are not accounted for by differences in sample structures – but rather reflect different attitudes in North East England from other areas.
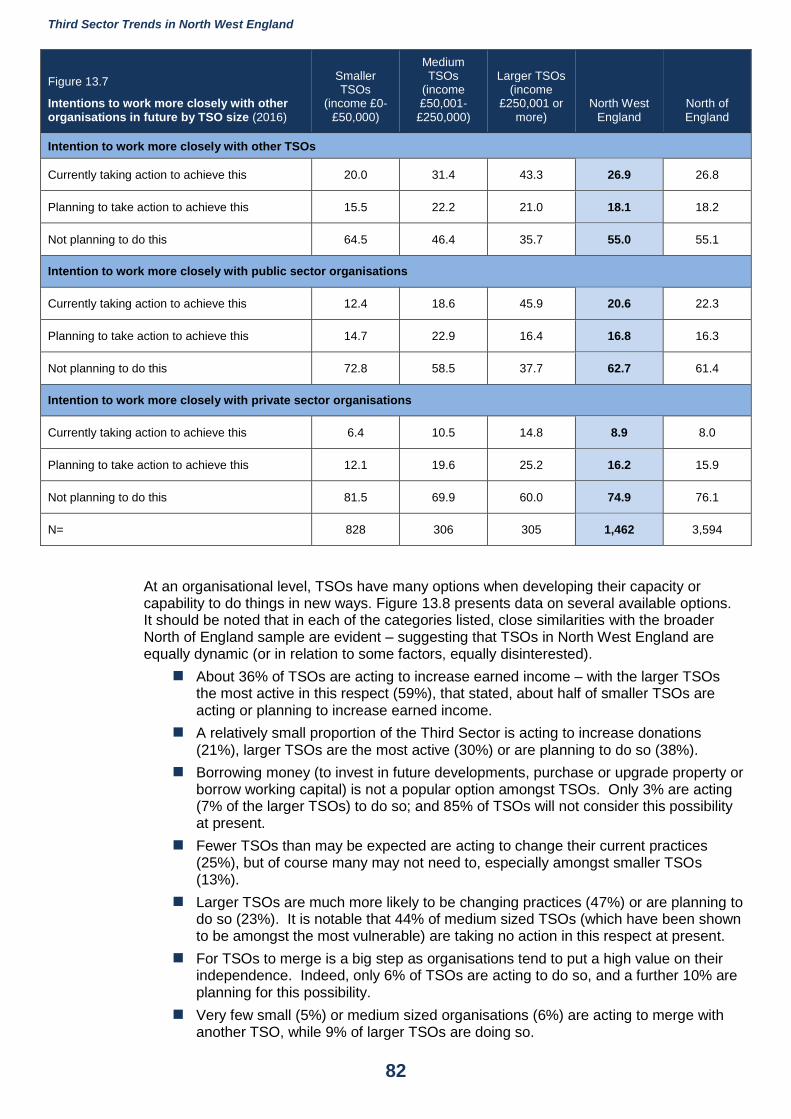
Third Sector Trends in North West England
82
Figure 13.7
Intentions to work more closely with other organisations in future by TSO size (2016)
Smaller TSOs
(income £0-£50,000)
Medium TSOs
(income £50,001-
£250,000)
Larger TSOs (income
£250,001 or more)
North West England
North of England
Intention to work more closely with other TSOs
Currently taking action to achieve this 20.0 31.4 43.3 26.9 26.8
Planning to take action to achieve this 15.5 22.2 21.0 18.1 18.2
Not planning to do this 64.5 46.4 35.7 55.0 55.1
Intention to work more closely with public sector organisations
Currently taking action to achieve this 12.4 18.6 45.9 20.6 22.3
Planning to take action to achieve this 14.7 22.9 16.4 16.8 16.3
Not planning to do this 72.8 58.5 37.7 62.7 61.4
Intention to work more closely with private sector organisations
Currently taking action to achieve this 6.4 10.5 14.8 8.9 8.0
Planning to take action to achieve this 12.1 19.6 25.2 16.2 15.9
Not planning to do this 81.5 69.9 60.0 74.9 76.1
N= 828 306 305 1,462 3,594
At an organisational level, TSOs have many options when developing their capacity or capability to do things in new ways. Figure 13.8 presents data on several available options. It should be noted that in each of the categories listed, close similarities with the broader North of England sample are evident – suggesting that TSOs in North West England are equally dynamic (or in relation to some factors, equally disinterested).
About 36% of TSOs are acting to increase earned income – with the larger TSOs the most active in this respect (59%), that stated, about half of smaller TSOs are acting or planning to increase earned income.
A relatively small proportion of the Third Sector is acting to increase donations (21%), larger TSOs are the most active (30%) or are planning to do so (38%).
Borrowing money (to invest in future developments, purchase or upgrade property or borrow working capital) is not a popular option amongst TSOs. Only 3% are acting (7% of the larger TSOs) to do so; and 85% of TSOs will not consider this possibility at present.
Fewer TSOs than may be expected are acting to change their current practices (25%), but of course many may not need to, especially amongst smaller TSOs (13%).
Larger TSOs are much more likely to be changing practices (47%) or are planning to do so (23%). It is notable that 44% of medium sized TSOs (which have been shown to be amongst the most vulnerable) are taking no action in this respect at present.
For TSOs to merge is a big step as organisations tend to put a high value on their independence. Indeed, only 6% of TSOs are acting to do so, and a further 10% are planning for this possibility.
Very few small (5%) or medium sized organisations (6%) are acting to merge with another TSO, while 9% of larger TSOs are doing so.
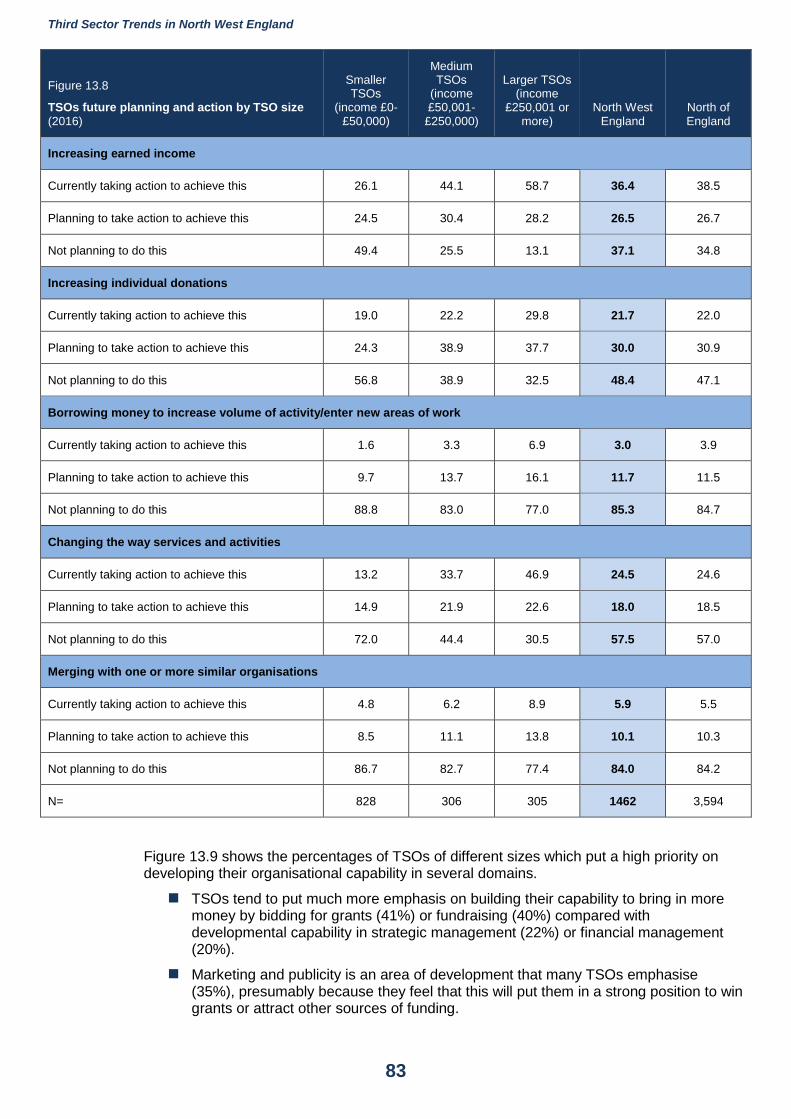
Third Sector Trends in North West England
83
Figure 13.8
TSOs future planning and action by TSO size (2016)
Smaller TSOs
(income £0-£50,000)
Medium TSOs
(income £50,001-
£250,000)
Larger TSOs (income
£250,001 or more)
North West England
North of England
Increasing earned income
Currently taking action to achieve this 26.1 44.1 58.7 36.4 38.5
Planning to take action to achieve this 24.5 30.4 28.2 26.5 26.7
Not planning to do this 49.4 25.5 13.1 37.1 34.8
Increasing individual donations
Currently taking action to achieve this 19.0 22.2 29.8 21.7 22.0
Planning to take action to achieve this 24.3 38.9 37.7 30.0 30.9
Not planning to do this 56.8 38.9 32.5 48.4 47.1
Borrowing money to increase volume of activity/enter new areas of work
Currently taking action to achieve this 1.6 3.3 6.9 3.0 3.9
Planning to take action to achieve this 9.7 13.7 16.1 11.7 11.5
Not planning to do this 88.8 83.0 77.0 85.3 84.7
Changing the way services and activities
Currently taking action to achieve this 13.2 33.7 46.9 24.5 24.6
Planning to take action to achieve this 14.9 21.9 22.6 18.0 18.5
Not planning to do this 72.0 44.4 30.5 57.5 57.0
Merging with one or more similar organisations
Currently taking action to achieve this 4.8 6.2 8.9 5.9 5.5
Planning to take action to achieve this 8.5 11.1 13.8 10.1 10.3
Not planning to do this 86.7 82.7 77.4 84.0 84.2
N= 828 306 305 1462 3,594
Figure 13.9 shows the percentages of TSOs of different sizes which put a high priority on developing their organisational capability in several domains.
TSOs tend to put much more emphasis on building their capability to bring in more money by bidding for grants (41%) or fundraising (40%) compared with developmental capability in strategic management (22%) or financial management (20%).
Marketing and publicity is an area of development that many TSOs emphasise (35%), presumably because they feel that this will put them in a strong position to win grants or attract other sources of funding.
Third Sector Trends in North West England
84
Small TSOs put a very low priority on the development of organisational managerial capability, as would be expected, given their scale. But considerable emphasis is placed on fundraising (36%) and grant bidding (38%).
Medium sized TSOs are also likely to emphasise the need to build their capability in bidding for grants (52%), fundraising (48%) and marketing themselves (49%).
Larger TSOs put more a more balanced emphasis on funding issues and other aspects of organisational capability (such as business planning, strategic management). Fundraising is regarded as the highest development priority (44%) while financial management is the lowest (24%).
Figure 13.9
TSOs putting high priority on building organisational capability by organisation size (2016)
Smaller TSOs (income £0-
£50,000)
Medium TSOs (income £50,001-
£250,000)
Larger TSOs (income
£250,001 or more)
North West England
North of England
Bidding for grants and contracts 37.8 52.3 37.4 40.6 39.1
Fundraising 35.7 48.0 44.3 39.9 38.4
marketing training 27.8 48.7 41.3 35.0 35.7
People management 14.9 36.6 31.8 23.0 21.2
Tender training 13.4 38.9 32.8 22.8 22.1
Business planning 14.6 35.6 30.2 22.3 22.5
Staff training 15.8 25.5 34.1 21.8 21.1
Financial management 15.7 27.1 24.3 19.8 17.9
Summary
This Chapter has shown that TSOs in North West England tend to be very optimistic about the future in terms of increasing income and raising the number of employees and volunteers. Longer-term trends strongly suggest that such optimism is likely to be misplaced; which, for many organisations, will lead to disappointment as their expectations are unlikely to be realised.
When planning, TSOs need to have a realistic perspective, otherwise, their emphasis on development needs may be misplaced. The evidence shows that most TSOs put the strongest emphasis on bringing in money rather than balancing this with other developmental needs such as strategic, people and financial management.
Smaller TSOs may not need to develop such skills as their organisations are less complex, but medium sized TSOs probably do need to pay more attention to such issues. Larger TSOs tend to be more able to balance the range of organisational capabilities when they set future priorities.
There is a good deal of evidence to show that action is being taken my many TSOs in North West England to develop useful informal and formal relationships within the Third Sector and with the public sector. However, the value of building links with the private sector seems to be less well recognised given the current scale of interaction between business and the Third Sector.
Third Sector Trends in North West England
85
14 Conclusions47
Sector size and structure
The Third Sector plays a large and important role in the North West of England. There are over 13,248 Third Sector organisations (TSOs) which, between them generate an economic value, by salaries of an estimated £2.2bn. The Third Sector workforce accounts for between 3-4% of all employment in the region. In 2016 there were 110,000 full-time equivalent employees although there appears to be a progressive shift from full-time to part-time employment.
Volunteers put in an enormous amount of work and time to support activities by the Third Sector in North West England. It is estimated that there are 440,000 volunteers who deliver 31.7m hours of work. The replacement value of such work by employees would be between £229m (at National Minimum Wage level) and £384m (at 80% of average wages).
Although the aggregate figures illustrate its size at a regional level, the sector is predominantly locality-based. 30% of TSOs work only at neighbourhood or village level and 62% work within the boundaries of a single local authority: only 9% of TSOs based in North West England work nationally or internationally.
Given that the sector is rooted in localities, it is not surprising to find that volunteers’ journeys into the sector are shaped by local knowledge and relationships: 84% of TSOs state that most volunteers arrive by ‘word of mouth’ and only half of TSOs make a big effort to recruit volunteers by holding events or advertising. Only 21% of TSOs rely on other organisations, such as a CVS or volunteer bureau, to find volunteers for them.
Continuity and change in the Third Sector
The overall picture is one of relative stability, although there have clearly been winners and losers in the sector over the last few years. This finding may not ‘ring true’ to many people who run TSOs however, because life in the Third Sector can often feel like a ‘struggle against all odds’ to maintain income levels. Often leaders of TSOs feel that they are ‘living on a knife edge’. This is understandable because the Third Sector is, arguably, under-capitalised in the sense that most TSOs have none or few fixed assets or investments and limited cash reserves.
Third Sector Trends research does not collect complex financial data from TSOs.48 Consequently, it is necessary to rely on NCVO data49 on income composition and examine how sector-wide income levels have changed. National level data provide a good indication of general trends which help to confirm the validity of findings drawn from Third Sector Trends income data in North West England.
As shown in Figure 14.1, UK Third Sector income has risen from £36bn - £45bn between 2003-4 and 2013-14. During this period, earned and investment income has risen substantially from £20.3bn to £28bn, while gifts and grants have remained at a similar level of £16-17bn.
Figure 14.2 shows changing levels of earned income between 2003-04 and 2014-15 as reported by NCVO. Earned income from the public sector (primarily through the delivery of public services under contract) has risen dramatically from £5.8bn to £12.4bn: although
47 This concluding section mirrors those which are published in the North East England and the Yorkshire and the Humber Third Sector Trends reports. In both areas, longitudinal data is available which produce evidence to reinforce points about sector change. There are no such data available for North West England at present, but it is likely that the situation will be similar. 48 Data are only collected on the ‘relative’ value of various sources of income and the overall volume of income. Asking TSOs to report in detail on income levels tends to dissuade respondents from returning data for several reasons including worries about confidentiality and/or not having easy access to the relevant data (resulting on non- completion of specific questions or abandonment of the survey). 49 NCVO Almanac 2017: https://data.ncvo.org.uk/category/almanac/voluntary-sector/income/
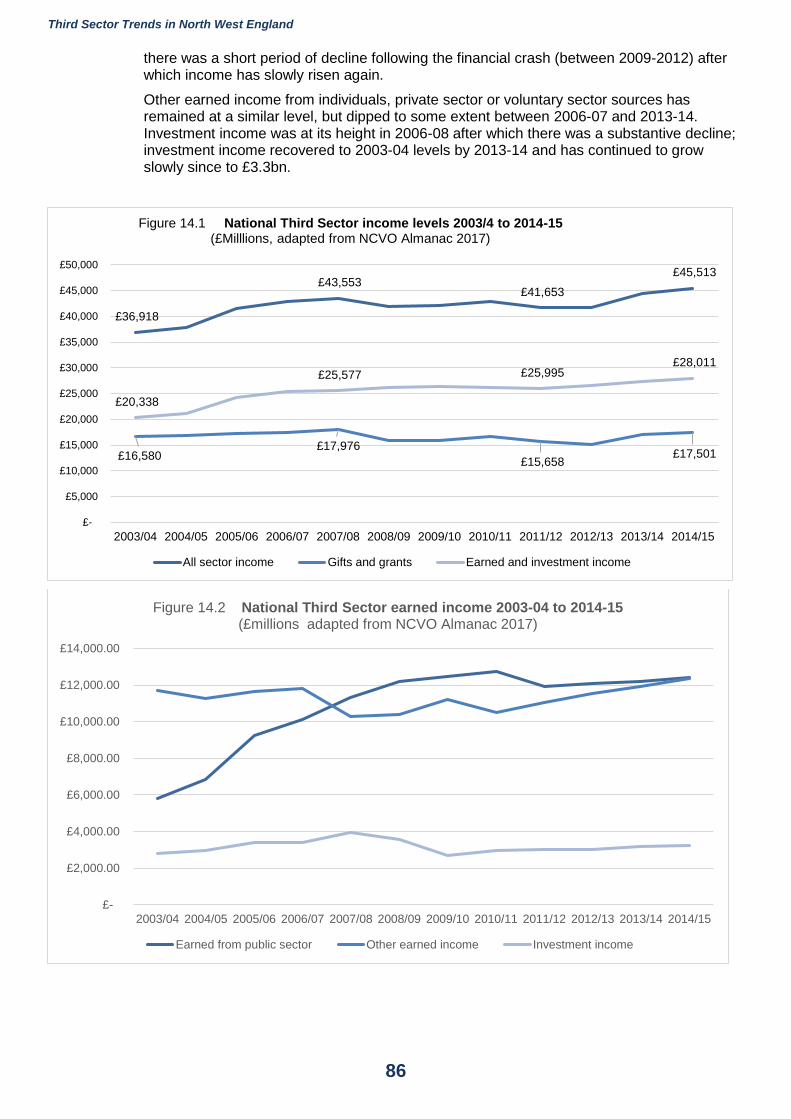
Third Sector Trends in North West England
86
there was a short period of decline following the financial crash (between 2009-2012) after which income has slowly risen again.
Other earned income from individuals, private sector or voluntary sector sources has remained at a similar level, but dipped to some extent between 2006-07 and 2013-14. Investment income was at its height in 2006-08 after which there was a substantive decline; investment income recovered to 2003-04 levels by 2013-14 and has continued to grow slowly since to £3.3bn.
£36,918
£43,553 £41,653
£45,513
£16,580 £17,976
£15,658 £17,501
£20,338
£25,577 £25,995 £28,011
£-
£5,000
£10,000
£15,000
£20,000
£25,000
£30,000
£35,000
£40,000
£45,000
£50,000
2003/04 2004/05 2005/06 2006/07 2007/08 2008/09 2009/10 2010/11 2011/12 2012/13 2013/14 2014/15
Figure 14.1 National Third Sector income levels 2003/4 to 2014-15 (£Milllions, adapted from NCVO Almanac 2017)
All sector income Gifts and grants Earned and investment income
£-
£2,000.00
£4,000.00
£6,000.00
£8,000.00
£10,000.00
£12,000.00
£14,000.00
2003/04 2004/05 2005/06 2006/07 2007/08 2008/09 2009/10 2010/11 2011/12 2012/13 2013/14 2014/15
Figure 14.2 National Third Sector earned income 2003-04 to 2014-15(£millions adapted from NCVO Almanac 2017)
Earned from public sector Other earned income Investment income
Third Sector Trends in North West England
87
The Sector as a whole is not in crisis – even if some TSOs are struggling
As the above evidence indicates, the Third Sector has experienced relatively stable income over the last ten years, although the composition of that income has changed to some extent. But often, from the perspective of individual organisations, it is felt that the Third Sector as a whole faces a perpetual financial crisis.
The evidence from Third Sector Trends research confirms that is not the case. The majority of organisations do not appear to be in financial crisis, even though a sizeable proportion clearly are. Between 2015-16, 68% of TSOs in North West England experienced income stability. Furthermore, about 15% of TSOs in North West England had significantly rising income over the last two years. That stated, 18% of TSOs reported falling income in the previous two years.
The Third Sector Trends study shows that, at the individual organisational level, fluctuations in income are very common, indeed it has been argued that short-term income instability is ‘endemic’. While this may lead to some TSOs to feel that they are constantly living on a ‘knife edge’, well governed organisations general know that they must learn to manage the consequences of continual change.50
Beneath the headline statistics about income stability, it is also recognised that, much more is going on. For example, while it is the case that the majority of TSOs have reasonable levels of income stability, this is not to say that life is easy. From associated long-term qualitative research work, it is known that many organisations can no longer access unrestricted ‘core’ funding they once relied upon and find themselves chasing smaller pots of money, which is often shared in complex partnerships to sustain their operations. Having ‘to run faster to stand still’, is a common refrain amongst TSOs which, on the surface at least, have stable income.
The Third Sector does not have a ‘contract culture’
For many years, commentators on the Third Sector have, arguably, over-egged the importance of the growing dominance of contracts to deliver pubic services as a driving force in sector economics. While the volume of money from the public sector which goes into contracts has undoubtedly grown and grant funding from the public sector declined51 (see Figures 14.1 and 14.2), the Third Sector Trends study shows that only 14% of TSOs are delivering public sector services under contract. It is not possible from current Third Sector Trends data in North West England to determine if the situation has changed over the years. But evidence from Yorkshire and the Humber and North East England and Cumbria shows that the level of bidding for or delivering contracts has changed little over the last few years.
Many TSOs which rely heavily upon public sector funding have clearly struggled to maintain income levels following a long period of government austerity policies. With falling income, lower employee numbers and reliance on reserves to keep going – times are hard for many of these TSOs, and especially so when they are based in poorer areas. This is not, however, the situation of the majority of TSOs. Indeed, many TSOs based in poorer areas which are funded mainly by the public sector are in a very strong financial position. Furthermore, these organisations are more likely to be investing in their future capability than other TSOs – which may help secure their long-term future.
In North West England, it is not known whether reliance on a wide range of income resources is changing as no trends data are currently available (apart from Cumbria). But longitudinal evidence from Yorkshire and the Humber and North East England and Cumbria indicate that grants have remained the most important source of income in the sector,
50 Chapman, T. (2017) ‘Journeys and destinations: how third sector organisations navigate their future in turbulent times’, Voluntary Sector Review, vol. 8, no, 1, pp. 25-40. 51 Declining grant funding is difficult to assess in concrete terms as, in many cases, former service level agreements or grants may have been re-defined/configured as contracts by the local public sector. It is also important not to over-generalise on the demise of grant funding. Many health authorities and local authorities in North West England have maintained the practice of awarding small grants to local voluntary and community organisations to maintain good community networks and sustain community led initiatives.
Third Sector Trends in North West England
88
reliance on contracts to deliver public services has declined to some extent while dependence on earned income from other sources of trading has increased.
Earned income is an important source of revenue
Earned income, from trading or contracts is important to many TSOs in North West England: 64% of TSOs rely on earned income to some extent. But even amongst those TSOs which earn over 81% of their income, only 13% of them state that grants are of ‘no importance’ to them.
Across the North of England, Cooperative and Community Benefit Societies are the most dependent on earned income with 63% earning more than 61% of their income. About 30% of Community Interest Companies and 35% of Companies Limited by Guarantee earn over 61% of their income. Independent Registered Charities are much more likely to earn more than 61% of their income (29%) when compared with Federated Registered Charities (15%).
Charitable Incorporated Organisations are less likely to earn over 61% of their income (20%) than most other legal forms, and nearly 60% earn none or less than 20% of their income. Informal voluntary or community organisations, which tend to be very small, have very low levels of reliance on earned income: 75% earn none or less than less than 20% of their income.
There are limits to the enterprising potential of TSOs
Many TSOs operate in ‘business-like’ ways. But being a business-like TSO is not the same as being a private sector business. This study shows clearly, for example, that most TSOs refuse to consider the option of borrowing money. Indeed, there is often reluctance to consider borrowing money even for purposes which make sound economic sense in business-planning terms if it is felt that a grant might be accessed instead.52
Reluctance to borrow money (or ‘working capital’) to engage in social investment initiatives or payment by results contracts does not just derive from cultural resistance to such practices in the sector. It is apparent to TSOs, which take the idea of borrowing more seriously, that the risks associated with borrowing are too high for one or several reasons including, for example: that the measurable outcomes of payment by results contracts are too ambitious; that the price allocated to aspects of service delivery is too low; or, that the length of contracts are too short or contracts are too insecure to justify borrowing.
Third Sector Trends research shows that some TSOs are more adept at working in business-like ways than others – but this does not mean that they can rely wholly, or in some cases even partly on such sources of income.53 Grants also remain vital even for those TSOs which earn substantive income from trading or contracts because the market place within which they work is simply not strong enough for them to survive otherwise.
Grant funding is the bedrock of Third Sector finance
When looking in more detail at income from gifts and grants, there are substantive underlying changes. Grant income from government has declined substantially from £6.1bn to £2.9bn (while earned income from public sector funding has risen from £5.8bn to £12.4bn – see Figure 14.3).
Grant income from voluntary sector sources (including the National Lottery) has grown by about a third from £2.5bn and £3.5bn, while income from the private sector has also steadily risen from £550m to £1bn. Income from individuals as gifts or legacies has fluctuated to some extent but follows a rising trend from £7bn to £10bn.
52 Chapman, T. (2017) ‘The propensity of third sector organisations to borrow money in the UK’, Policy Studies, vol. 38, no. 2, pp. 185-204.
53 Charging for services is feasible in some contexts but not in others. TSOs operating in poorer communities or with financially vulnerable groups, for example, cannot reasonably be expected to charge for services if their beneficiaries cannot contribute wholly or partly to the costs of delivery.
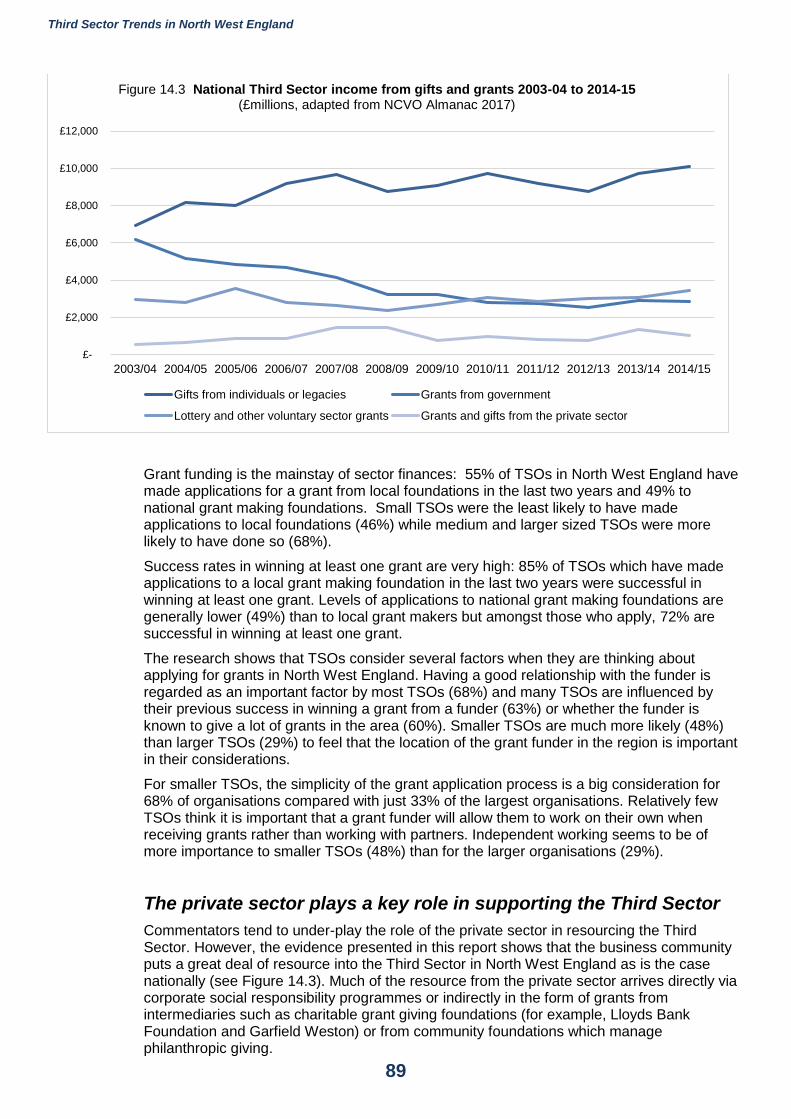
Third Sector Trends in North West England
89
Grant funding is the mainstay of sector finances: 55% of TSOs in North West England have made applications for a grant from local foundations in the last two years and 49% to national grant making foundations. Small TSOs were the least likely to have made applications to local foundations (46%) while medium and larger sized TSOs were more likely to have done so (68%).
Success rates in winning at least one grant are very high: 85% of TSOs which have made applications to a local grant making foundation in the last two years were successful in winning at least one grant. Levels of applications to national grant making foundations are generally lower (49%) than to local grant makers but amongst those who apply, 72% are successful in winning at least one grant.
The research shows that TSOs consider several factors when they are thinking about applying for grants in North West England. Having a good relationship with the funder is regarded as an important factor by most TSOs (68%) and many TSOs are influenced by their previous success in winning a grant from a funder (63%) or whether the funder is known to give a lot of grants in the area (60%). Smaller TSOs are much more likely (48%) than larger TSOs (29%) to feel that the location of the grant funder in the region is important in their considerations.
For smaller TSOs, the simplicity of the grant application process is a big consideration for 68% of organisations compared with just 33% of the largest organisations. Relatively few TSOs think it is important that a grant funder will allow them to work on their own when receiving grants rather than working with partners. Independent working seems to be of more importance to smaller TSOs (48%) than for the larger organisations (29%).
The private sector plays a key role in supporting the Third Sector
Commentators tend to under-play the role of the private sector in resourcing the Third Sector. However, the evidence presented in this report shows that the business community puts a great deal of resource into the Third Sector in North West England as is the case nationally (see Figure 14.3). Much of the resource from the private sector arrives directly via corporate social responsibility programmes or indirectly in the form of grants from intermediaries such as charitable grant giving foundations (for example, Lloyds Bank Foundation and Garfield Weston) or from community foundations which manage philanthropic giving.
£-
£2,000
£4,000
£6,000
£8,000
£10,000
£12,000
2003/04 2004/05 2005/06 2006/07 2007/08 2008/09 2009/10 2010/11 2011/12 2012/13 2013/14 2014/15
Figure 14.3 National Third Sector income from gifts and grants 2003-04 to 2014-15 (£millions, adapted from NCVO Almanac 2017)
Gifts from individuals or legacies Grants from government
Lottery and other voluntary sector grants Grants and gifts from the private sector
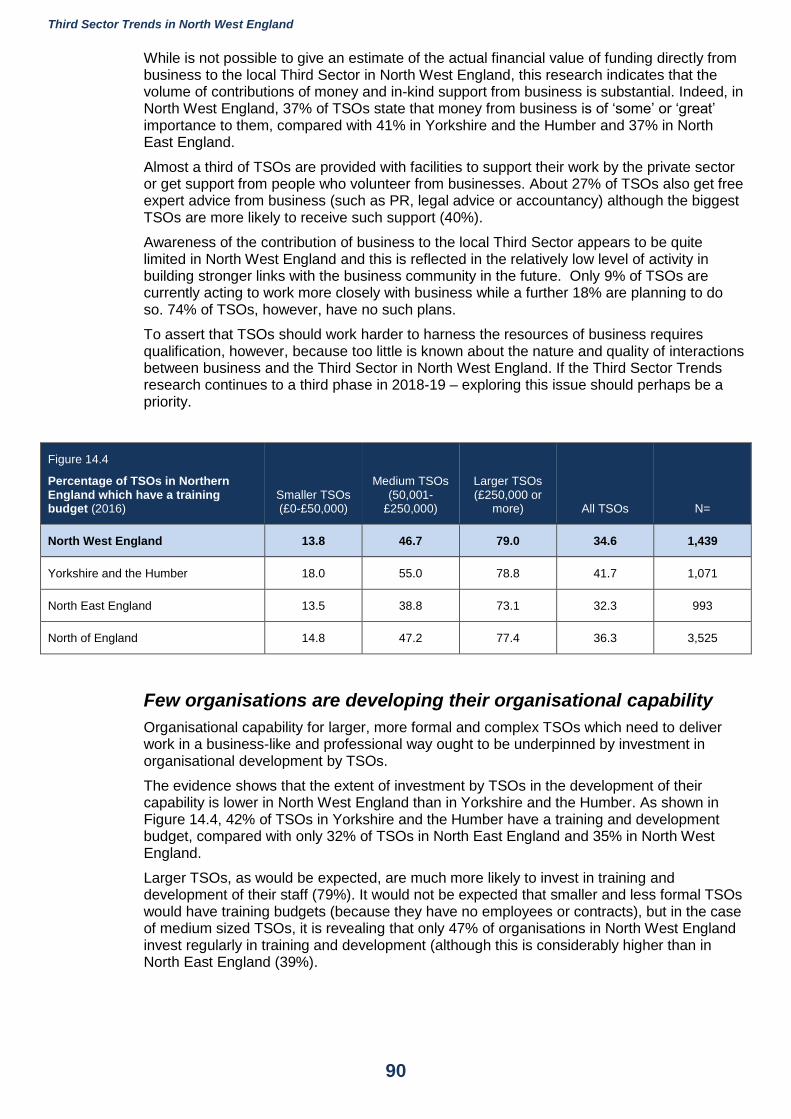
Third Sector Trends in North West England
90
While is not possible to give an estimate of the actual financial value of funding directly from business to the local Third Sector in North West England, this research indicates that the volume of contributions of money and in-kind support from business is substantial. Indeed, in North West England, 37% of TSOs state that money from business is of ‘some’ or ‘great’ importance to them, compared with 41% in Yorkshire and the Humber and 37% in North East England.
Almost a third of TSOs are provided with facilities to support their work by the private sector or get support from people who volunteer from businesses. About 27% of TSOs also get free expert advice from business (such as PR, legal advice or accountancy) although the biggest TSOs are more likely to receive such support (40%).
Awareness of the contribution of business to the local Third Sector appears to be quite limited in North West England and this is reflected in the relatively low level of activity in building stronger links with the business community in the future. Only 9% of TSOs are currently acting to work more closely with business while a further 18% are planning to do so. 74% of TSOs, however, have no such plans.
To assert that TSOs should work harder to harness the resources of business requires qualification, however, because too little is known about the nature and quality of interactions between business and the Third Sector in North West England. If the Third Sector Trends research continues to a third phase in 2018-19 – exploring this issue should perhaps be a priority.
Figure 14.4
Percentage of TSOs in Northern England which have a training budget (2016)
Smaller TSOs (£0-£50,000)
Medium TSOs (50,001-
£250,000)
Larger TSOs (£250,000 or
more) All TSOs N=
North West England 13.8 46.7 79.0 34.6 1,439
Yorkshire and the Humber 18.0 55.0 78.8 41.7 1,071
North East England 13.5 38.8 73.1 32.3 993
North of England 14.8 47.2 77.4 36.3 3,525
Few organisations are developing their organisational capability
Organisational capability for larger, more formal and complex TSOs which need to deliver work in a business-like and professional way ought to be underpinned by investment in organisational development by TSOs.
The evidence shows that the extent of investment by TSOs in the development of their capability is lower in North West England than in Yorkshire and the Humber. As shown in Figure 14.4, 42% of TSOs in Yorkshire and the Humber have a training and development budget, compared with only 32% of TSOs in North East England and 35% in North West England.
Larger TSOs, as would be expected, are much more likely to invest in training and development of their staff (79%). It would not be expected that smaller and less formal TSOs would have training budgets (because they have no employees or contracts), but in the case of medium sized TSOs, it is revealing that only 47% of organisations in North West England invest regularly in training and development (although this is considerably higher than in North East England (39%).
Third Sector Trends in North West England
91
Qualitative evidence from the Third Sector Trends study shows that leaders of these TSOs too often claim, perhaps erroneously, that a training budget is ‘a luxury they cannot afford’.54
Relatively few medium sized or larger TSOs invest in key aspects of organisational development (such as business planning; people, financial and strategic management). Indeed, longitudinal analysis shows that much of the sector is ‘consistently disinterested’ in such forms of development and puts its faith instead in building its fundraising and grant bidding skills – as if money was always the answer to all their problems.
The Third Sector is home to eternal optimists
Perhaps one of the great strengths of civil society is its ability to champion causes that have gone unrecognised or have been neglected by the state. By drawing attention to worthy causes and making successful claims about the importance of tackling such issues, the Third Sector has helped to transform society.
One of the challenges produced by sector ambition to achieve good outcomes for beneficiaries is that leaders of TSOs may be too optimistic about their prospects of garnering the resources to achieve their objectives. In North West England, it has been shown that 35% of TSOs expect to increase their income, 31% expect to increase numbers of paid staff and 42% expect to attract more volunteers over the next two years, Many TSOs will, of course, achieve their ambitions – but as previous Third Sector Trends studies have shown – many will not.
The fact that anyone, within the limits of the law, can set up an organisation or group to tackle an issue that they feel is important has undoubtedly strengthened the hand of civil society in many respects. But in so doing, claims are made implicitly or explicitly, on the comparative value of different social objectives and the beneficial outcomes of social action. In turn, these produce competing demands for resources to make good things happen, whether it is the renovation of an historic building, providing support to homeless people, fighting discrimination, alerting the medical profession to the existence of a hitherto unrecognised disabling conditions, or to any number of other good causes.
The Third Sector operates in an environment where access to the resources of people and money are finite. There will never be sufficient resource to meet every demand – no matter how strong claims may be. It is now known that the leaders of TSOs tend to be too optimistic about future access to resources. The problem with unattainable optimism is that it makes many leaders of TSOs feel disappointed that their efforts to draw in resources have not met their expectations.
Final thoughts
An attempt to dampen the sector’s ambition might seem like a sensible way of concluding this report – but it would not be good advice – and in any case, it is advice that would not be heeded. The Third Sector exists to make a difference. Its people are committed to achieving that and, without doubt, its benefactors and funders want this to continue to happen.
The downside is that competition will continue to be intense for finite resources – but this is something that the Third Sector has learned to live with – albeit with a risk of disappointment for some while others prosper. There is, in fact, much room for optimism that this robust sector will continue to go from strength to strength because, as this report shows, TSOs can flex their shape to mould to new circumstances and consequently the majority will retain their resilience and remain sustainable.
54 See Chapman, T. and Robinson, F. (2013) Walking a Tightrope: balancing critical success factors in hard times, Newcastle upon Tyne, Northern Rock Foundation.
Third Sector Trends in North West England
92
Appendix 1: Publications from the Third Sector Trends study
Bell, V., Robinson, F., Chapman, T., van der Graaf, P., Shaw, S., Brown, J. and Chinaka, G. (2010) Forearmed with Foresight: speculations on the future development of the Third Sector in North East England and Cumbria, Newcastle: Northern Rock Foundation.
Chapman, T. (2011) Smoke and Mirrors: The Influence of Cultural Inertia on Social and Economic Development in a Polycentric Urban Region, Urban Studies, Vol. 48, No. 5, pp. 1037-1058.
Chapman, T. (2013) ‘Regeneration through Social Enterprise: government-driven and community-led initiatives in Britain and Japan ‘, in M. Leary and J. McCarthy (eds.) Companion to Urban Regeneration, London: Routledge.
Chapman, T. (2014) Third Sector Trends in Yorkshire and Humber, Leeds: Involve Yorkshire and Humber.
Chapman, T. (2015) An assessment of Third Sector organisations’ willingness to borrow money: evidence from Yorkshire, North East England and Cumbria, Newcastle, Northern Rock Foundation.
Chapman, T. (2015) The situation of Third Sector organisations working in rich and poor areas: key findings from North East England and Cumbria, Newcastle, Northern Rock Foundation.
Chapman, T. (2017) ‘Journeys and destinations: how third sector organisations navigate their future in turbulent times’, Voluntary Sector Review, 8:1, 3-24.
Chapman, T. (2017) ‘The propensity of third sector organisations to borrow money in the UK’, Policy Studies, 38:2, 185-294.
Chapman, T. (2017) A digest of findings from the Third Sector Trends Study in North East England, Durham: St Chad’s College, Durham University.
Chapman, T. (2017) A digest of findings from the Third Sector Trends Study in Yorkshire and the Humber, Durham: St Chad’s College, Durham University.
Chapman, T. (2017) A digest of findings from the Third Sector Trends Study in North West England, Durham: St Chad’s College, Durham University.
Chapman, T. and Crow, R. (2008) A Thriving Third Sector: a study of North Yorkshire and City of York, Middlesbrough: Social Futures Institute.
Chapman, T. and Hunter, J. (2017) Third Sector Trends in the North of England: a summary of key findings, Manchester: IPPR North.
Chapman, T. and McGuinness, B. (2013) 'Consuming values in a social market: making choices about volunteering and non-volunteering', Social and Public Policy Review, Vol. 7: 1.
Chapman, T. and Robinson, F. (2011) Taking Stock, Moving On: a summary report on the results of the Northern Rock Foundation Third Sector Trends Study, Newcastle: Northern Rock Foundation.
Chapman, T. and Robinson, F. (2013) On the Money: how does the way Third Sector organisations think about money affect the way they work? Newcastle: Northern Rock Foundation.
Chapman, T. and Robinson, F. (2013) The Crystal Ball: how do Third Sector Organisations see their future, and what are they doing about it? Newcastle: Northern Rock Foundation.
Chapman, T. and Robinson, F. (2014) Keeping it simple: how to work effectively with the Third Sector, a discussion paper and evidence review: Durham: Institute for Local Governance.
Chapman, T. and Robinson, F. (2014) Third Sector Trends in North East England and Cumbria: headline trends 2008-2014, Newcastle, Northern Rock Foundation.
Chapman, T. and Robinson, F. (2015) Key findings from the Northern Rock Foundation Third Sector Trends Study in North East England, Newcastle, Northern Rock Foundation.
Chapman, T. Robinson, F., Brown, J. Ford, C., Shaw, S. Crow, R. and Bailey, E. (2009) A Mosaic, Jigsaw or Abstract: getting a big picture perspective on the Third Sector in North East England and Cumbria, Newcastle: Northern Rock Foundation.
Chapman, T., Brown, J., Ford, C. and Baxter, E. (2010) ‘Trouble with champions: local public sector – Third Sector partnerships and the future prospects for collaborative governance in the UK’, Policy Studies, Vol. 30, No,6, pp. 613-630.
Third Sector Trends in North West England
93
Chapman, T., Crow, R. and Brown, J. (2008) 'Entering a Brave New World? An assessment of Third Sector readiness to tender for the delivery of public services', Policy Studies, Vol. 28, No 1, pp. 1-17.
Chapman, T., Crow, R. Brown, J. and Ward, J. (2006) Facing the Future: A Study of the Impact of a Changing Funding Environment on the Voluntary and Community Sector in the North East of England, Middlesbrough: Social Futures Institute.
Chapman, T., Forbes, D. and Brown, J. (2007) 'They think they have God on their side': the impact of public sector attitudes on the development of social enterprise', Social Enterprise Journal, Vol. 2, No. 1, pp. 78-89.
Chapman, T., Robinson, F., Bell, V., Dunkerley, E., Zass-Ogilvie, I. and van der Graaf, P. (2013) Walking a Tightrope balancing critical success factors in hard times, Newcastle: Northern Rock Foundation.
Chapman, T., Robinson, F., Bell, V., Dunkerley, E., Zass-Ogilvie, I. and van der Graaf, P. (2012) Journeys and Destinations: the impact of change on Third Sector organisations, Newcastle: Northern Rock Foundation.
Chapman, T., Robinson, F., Brown, J., Crow, R., Bell, V. and Bailey, E. (2010) What makes Third Sector organisations tick? Interactions of foresight, enterprise, capability and impact’’, Newcastle: Northern Rock Foundation.
Chapman, T., van der Graaf, P. Bell, V., Robinson, F. and Crow, R. (2010) Keeping the Show on the Road: a survey of dynamics and change amongst Third Sector organisations in North East England and Cumbria, Newcastle, Northern Rock Foundation.
Kane, D. and Mohan, J. (2010a) Mapping registered Third Sector organisations in the North East, Newcastle: Northern Rock Foundation Third Sector Trends Study Working Paper.
Kane, D. and Mohan, J. (2010b) Mapping registered Third Sector organisations in Cumbria, Newcastle: Northern Rock Foundation Third Sector Trends Study Working Paper.
Kane, D. and Mohan, J. (2010c) Mapping registered Third Sector organisations in Yorkshire and the Humber, Newcastle: Northern Rock Foundation Third Sector Trends Study Working Paper.
Mohan, J., Kane, D., Wilding, K. Branson, J. and Owles, F. (2010) Beyond ‘flat earth’ maps of the Third Sector, Newcastle: Northern Rock Foundation Third Sector Trends Study Working Paper.
Mohan, J., Rajme, F.G. and Kane, D. (2011a) Paid work and volunteering in the Third Sector in North East England, Newcastle: Northern Rock Foundation Third Sector Trends Study Working Paper.
Mohan, J., Rajme, F.G. and Kane, D. (2011b) Paid work and volunteering in the Third Sector in Cumbria, Newcastle: Northern Rock Foundation Third Sector Trends Study Working Paper.
Pharoah, C., Chapman, T. and Choudhury, R. (2014) An insight into charity funding in the North East, London: Garfield Weston Foundation.
Robinson, F. and Chapman, T. (2013) The Reality Check: final report from the second phase of the Third Sector Trends Study, Newcastle: Northern Rock Foundation.
Robinson, F., Bell, V. and Chapman, T. (2011) Building Better Boards: What’s the problem? Newcastle: Northern Rock Foundation.
Robinson, F., Bell, V., Chapman, T., Dunkerley, E., Zass-Ogilvie, I. and van der Graaf, P. (2013) Taking the Temperature: how are Third Sector organisations doing? Newcastle: Northern Rock Foundation.

Third Sector Trends in North West England
94