Embed Size (px)
Citation preview
February 14, 2018
Third Quarter of FY 2017 Consolidated Financial Results
Japan Display Inc.
2
Copyright © 2018 Japan Display Inc. All Rights Reserved.
3Q-FY17 Results & FY 2017 Guidance
Takanobu Oshima
Chief Financial Officer
3
Copyright © 2018 Japan Display Inc. All Rights Reserved.
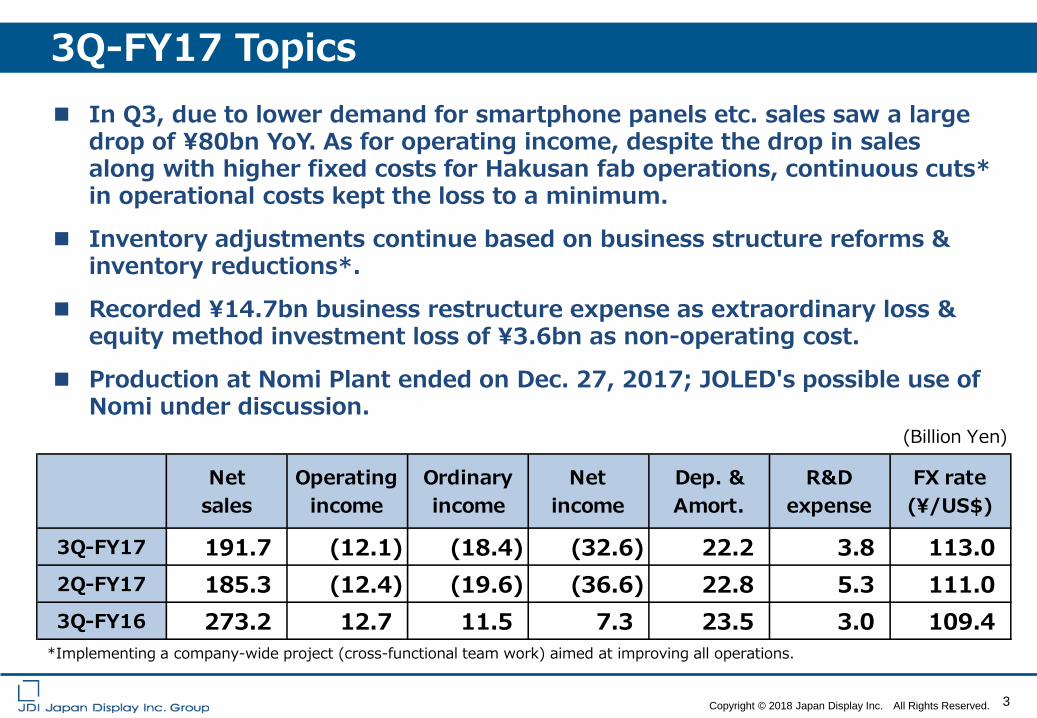
3Q-FY17 Topics In Q3, due to lower demand for smartphone panels etc. sales saw a large
drop of ¥80bn YoY. As for operating income, despite the drop in sales along with higher fixed costs for Hakusan fab operations, continuous cuts* in operational costs kept the loss to a minimum.
Inventory adjustments continue based on business structure reforms & inventory reductions*.
Recorded ¥14.7bn business restructure expense as extraordinary loss & equity method investment loss of ¥3.6bn as non-operating cost.
Production at Nomi Plant ended on Dec. 27, 2017; JOLED's possible use of Nomi under discussion.
*Implementing a company-wide project (cross-functional team work) aimed at improving all operations.
(Billion Yen)
Netsales
Operatingincome
Ordinaryincome
Netincome
Dep. &Amort.
R&Dexpense
FX rate(\/US$)
3Q-FY17 191.7 (12.1) (18.4) (32.6) 22.2 3.8 113.02Q-FY17 185.3 (12.4) (19.6) (36.6) 22.8 5.3 111.03Q-FY16 273.2 12.7 11.5 7.3 23.5 3.0 109.4
4
Copyright © 2018 Japan Display Inc. All Rights Reserved.
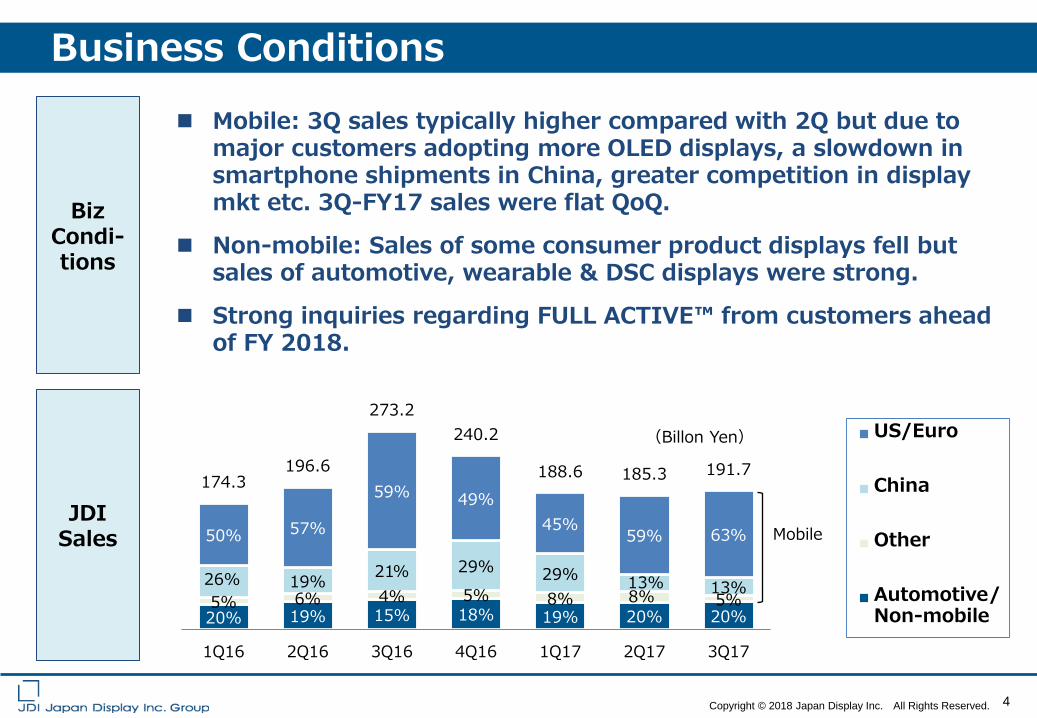
Business Conditions
20% 19% 15% 18% 19% 20% 20% 5% 6% 4% 5% 8% 8% 5%
26% 19% 21% 29% 29% 13% 13%
50% 57%
59% 49% 45% 59% 63%
174.3 196.6
273.2 240.2
188.6 185.3 191.7
1Q16 2Q16 3Q16 4Q16 1Q17 2Q17 3Q17
(Billon Yen) US/Euro
China
Other
Automotive/Non-mobile
Mobile
Mobile: 3Q sales typically higher compared with 2Q but due to major customers adopting more OLED displays, a slowdown in smartphone shipments in China, greater competition in display mkt etc. 3Q-FY17 sales were flat QoQ.
Non-mobile: Sales of some consumer product displays fell but sales of automotive, wearable & DSC displays were strong.
Strong inquiries regarding FULL ACTIVE™ from customers ahead of FY 2018.
Biz Condi- tions
JDI Sales
5
Copyright © 2018 Japan Display Inc. All Rights Reserved.
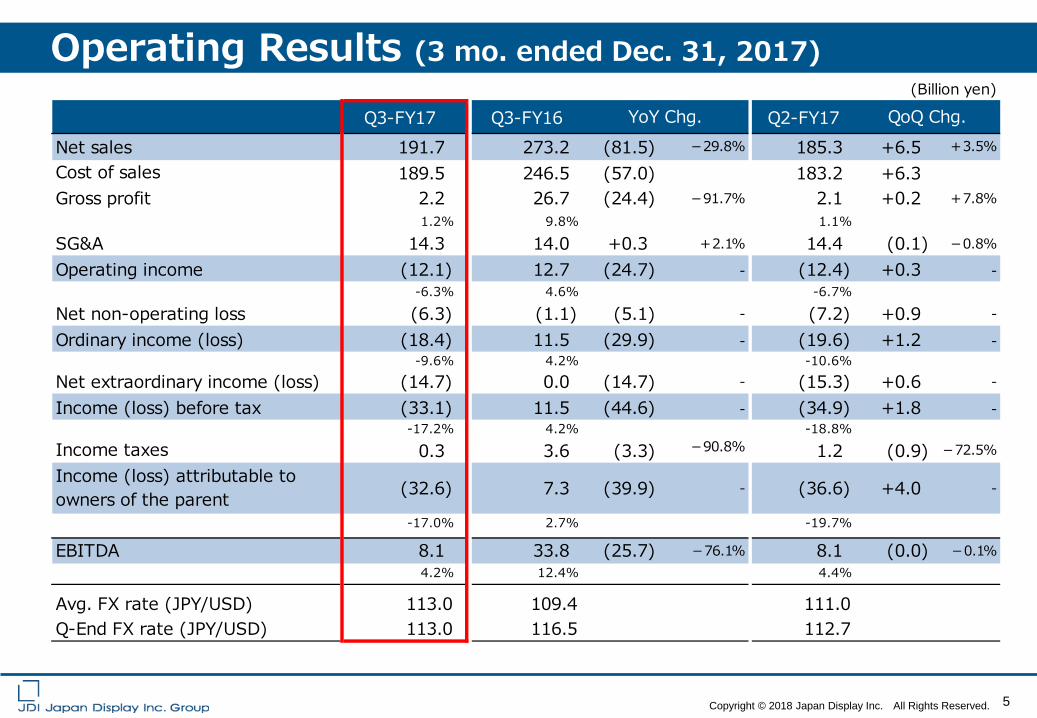
Operating Results (3 mo. ended Dec. 31, 2017) (Billion yen)
Q3-FY17 Q3-FY16 Q2-FY17Net sales 191.7 273.2 (81.5) -29.8% 185.3 +6.5 +3.5%
Cost of sales 189.5 246.5 (57.0) 183.2 +6.3Gross profit 2.2 26.7 (24.4) -91.7% 2.1 +0.2 +7.8%
1.2% 9.8% 1.1%
SG&A 14.3 14.0 +0.3 +2.1% 14.4 (0.1) -0.8%
Operating income (12.1) 12.7 (24.7) - (12.4) +0.3 --6.3% 4.6% -6.7%
Net non-operating loss (6.3) (1.1) (5.1) - (7.2) +0.9 -
Ordinary income (loss) (18.4) 11.5 (29.9) - (19.6) +1.2 --9.6% 4.2% -10.6%
Net extraordinary income (loss) (14.7) 0.0 (14.7) - (15.3) +0.6 -
Income (loss) before tax (33.1) 11.5 (44.6) - (34.9) +1.8 --17.2% 4.2% -18.8%
Income taxes 0.3 3.6 (3.3) -90.8% 1.2 (0.9) -72.5%
Income (loss) attributable toowners of the parent (32.6) 7.3 (39.9) - (36.6) +4.0 -
-17.0% 2.7% -19.7%
EBITDA 8.1 33.8 (25.7) -76.1% 8.1 (0.0) -0.1%4.2% 12.4% 4.4%
Avg. FX rate (JPY/USD) 113.0 109.4 111.0Q-End FX rate (JPY/USD) 113.0 116.5 112.7
QoQ Chg.YoY Chg.
6
Copyright © 2018 Japan Display Inc. All Rights Reserved.
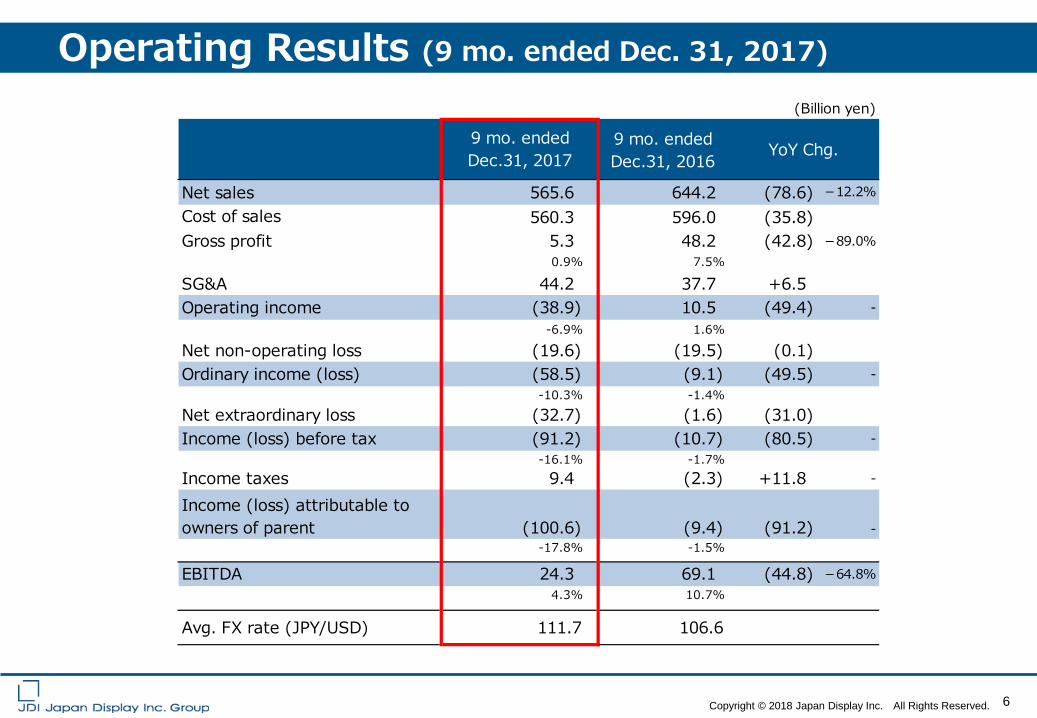
Operating Results (9 mo. ended Dec. 31, 2017)
9 mo. endedDec.31, 2016
Net sales 565.6 644.2 (78.6) -12.2%
Cost of sales 560.3 596.0 (35.8)Gross profit 5.3 48.2 (42.8) -89.0%
0.9% 7.5%
SG&A 44.2 37.7 +6.5Operating income (38.9) 10.5 (49.4) -
-6.9% 1.6%
Net non-operating loss (19.6) (19.5) (0.1)Ordinary income (loss) (58.5) (9.1) (49.5) -
-10.3% -1.4%Net extraordinary loss (32.7) (1.6) (31.0)Income (loss) before tax (91.2) (10.7) (80.5) -
-16.1% -1.7%Income taxes 9.4 (2.3) +11.8 -
Income (loss) attributable toowners of parent (100.6) (9.4) (91.2) -
-17.8% -1.5%
EBITDA 24.3 69.1 (44.8) -64.8%4.3% 10.7%
Avg. FX rate (JPY/USD) 111.7 106.6
9 mo. endedDec.31, 2017
(Billion yen)
YoY Chg.
7
Copyright © 2018 Japan Display Inc. All Rights Reserved.
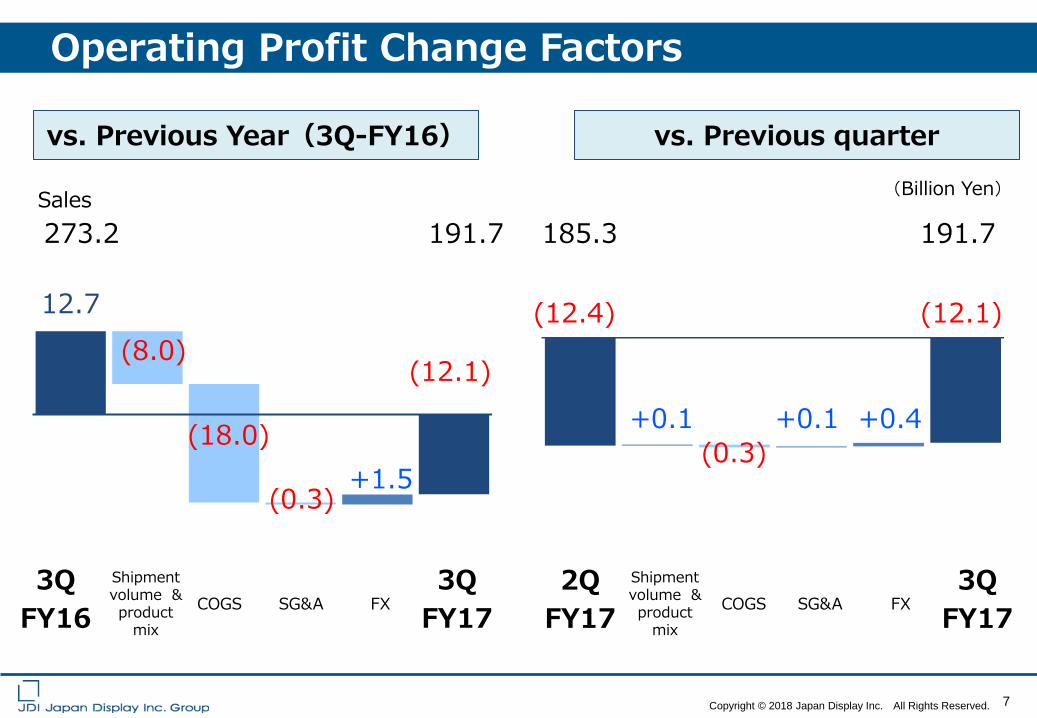
Operating Profit Change Factors
vs. Previous Year(3Q-FY16) vs. Previous quarter
3Q FY16
3Q FY17 COGS SG&A FX
Shipment volume & product
mix
2Q FY17
3Q FY17 COGS SG&A FX
Shipment volume & product
mix
Sales (Billion Yen)
(8.0) (12.1)
12.7
(0.3) +1.5
273.2 191.7
(18.0)
(12.4) (12.1)
+0.1 +0.4
185.3 191.7
+0.1 (0.3)
8
Copyright © 2018 Japan Display Inc. All Rights Reserved.
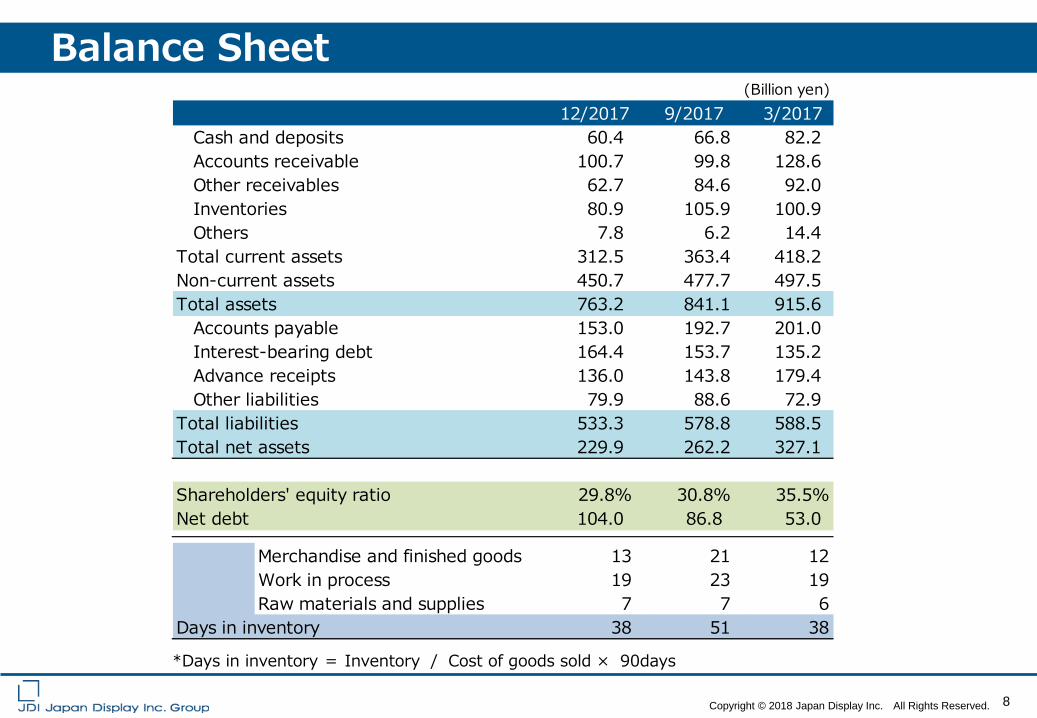
Balance Sheet
*Days in inventory = Inventory / Cost of goods sold × 90days
(Billion yen)12/2017 9/2017 3/2017
Cash and deposits 60.4 66.8 82.2 Accounts receivable 100.7 99.8 128.6 Other receivables 62.7 84.6 92.0 Inventories 80.9 105.9 100.9 Others 7.8 6.2 14.4Total current assets 312.5 363.4 418.2Non-current assets 450.7 477.7 497.5Total assets 763.2 841.1 915.6 Accounts payable 153.0 192.7 201.0 Interest-bearing debt 164.4 153.7 135.2 Advance receipts 136.0 143.8 179.4 Other liabilities 79.9 88.6 72.9Total liabilities 533.3 578.8 588.5Total net assets 229.9 262.2 327.1
Shareholders' equity ratio 29.8% 30.8% 35.5%Net debt 104.0 86.8 53.0
Merchandise and finished goods 13 21 12Work in process 19 23 19Raw materials and supplies 7 7 6
Days in inventory 38 51 38
9
Copyright © 2018 Japan Display Inc. All Rights Reserved.
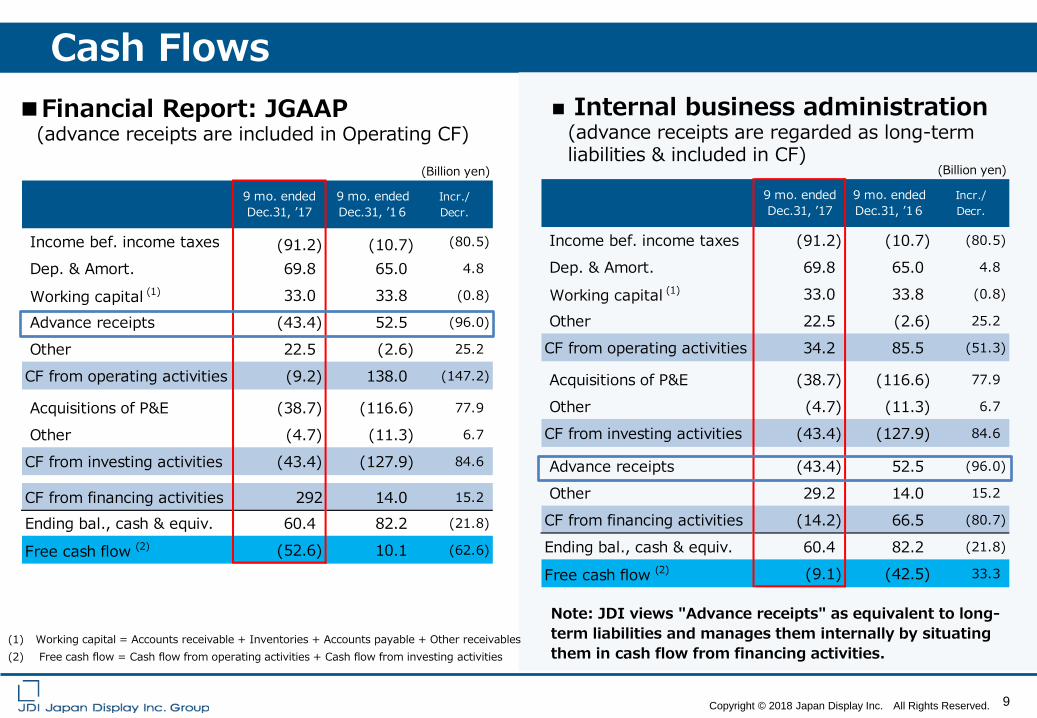
Note: JDI views "Advance receipts" as equivalent to long-term liabilities and manages them internally by situating them in cash flow from financing activities.
■ Internal business administration (advance receipts are regarded as long-term liabilities & included in CF)
Cash Flows
(1) Working capital = Accounts receivable + Inventories + Accounts payable + Other receivables (2) Free cash flow = Cash flow from operating activities + Cash flow from investing activities
■Financial Report: JGAAP (advance receipts are included in Operating CF)
(Billion yen)
9 mo. endedDec.31, ’17
9 mo. endedDec.31, ’16
Incr./Decr.
Income bef. income taxes (91.2) (10.7) (80.5)
Dep. & Amort. 69.8 65.0 4.8
Working capital (1) 33.0 33.8 (0.8)
Other 22.5 (2.6) 25.2
CF from operating activities 34.2 85.5 (51.3)
Acquisitions of P&E (38.7) (116.6) 77.9
Other (4.7) (11.3) 6.7
CF from investing activities (43.4) (127.9) 84.6
Advance receipts (43.4) 52.5 (96.0)
Other 29.2 14.0 15.2
CF from financing activities (14.2) 66.5 (80.7)
Ending bal., cash & equiv. 60.4 82.2 (21.8)
Free cash flow (2) (9.1) (42.5) 33.3
(Billion yen)
9 mo. endedDec.31, ’17
9 mo. endedDec.31, ’16
Incr./Decr.
Income bef. income taxes (91.2) (10.7) (80.5)
Dep. & Amort. 69.8 65.0 4.8
Working capital (1) 33.0 33.8 (0.8)
Advance receipts (43.4) 52.5 (96.0)
Other 22.5 (2.6) 25.2
CF from operating activities (9.2) 138.0 (147.2)
Acquisitions of P&E (38.7) (116.6) 77.9
Other (4.7) (11.3) 6.7
CF from investing activities (43.4) (127.9) 84.6
CF from financing activities 292 14.0 15.2
Ending bal., cash & equiv. 60.4 82.2 (21.8)
Free cash flow (2) (52.6) 10.1 (62.6)
10
Copyright © 2018 Japan Display Inc. All Rights Reserved.
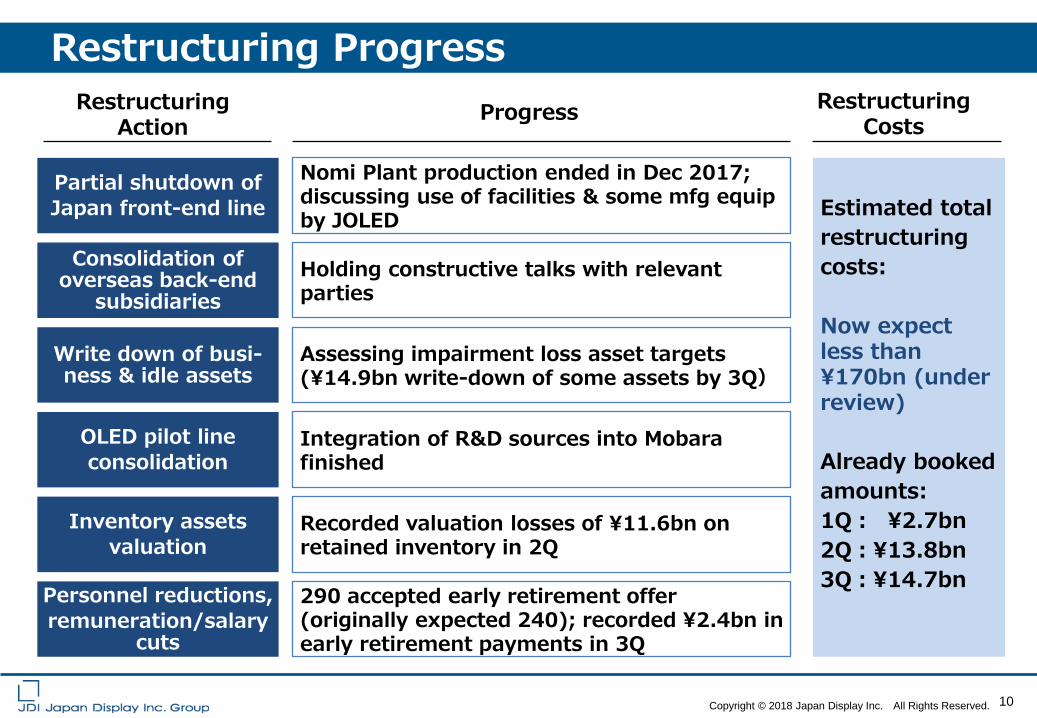
Restructuring Progress Restructuring
Action
Partial shutdown of Japan front-end line
Consolidation of overseas back-end
subsidiaries
Nomi Plant production ended in Dec 2017; discussing use of facilities & some mfg equip by JOLED
Holding constructive talks with relevant parties
Write down of busi- ness & idle assets
Assessing impairment loss asset targets (¥14.9bn write-down of some assets by 3Q)
OLED pilot line consolidation
Integration of R&D sources into Mobara finished
Progress
Estimated total restructuring costs: Now expect less than ¥170bn (under review) Already booked amounts: 1Q: ¥2.7bn 2Q:¥13.8bn 3Q:¥14.7bn
Restructuring Costs
Inventory assets valuation
Recorded valuation losses of ¥11.6bn on retained inventory in 2Q
Personnel reductions, remuneration/salary
cuts
290 accepted early retirement offer (originally expected 240); recorded ¥2.4bn in early retirement payments in 3Q
11
Copyright © 2018 Japan Display Inc. All Rights Reserved.
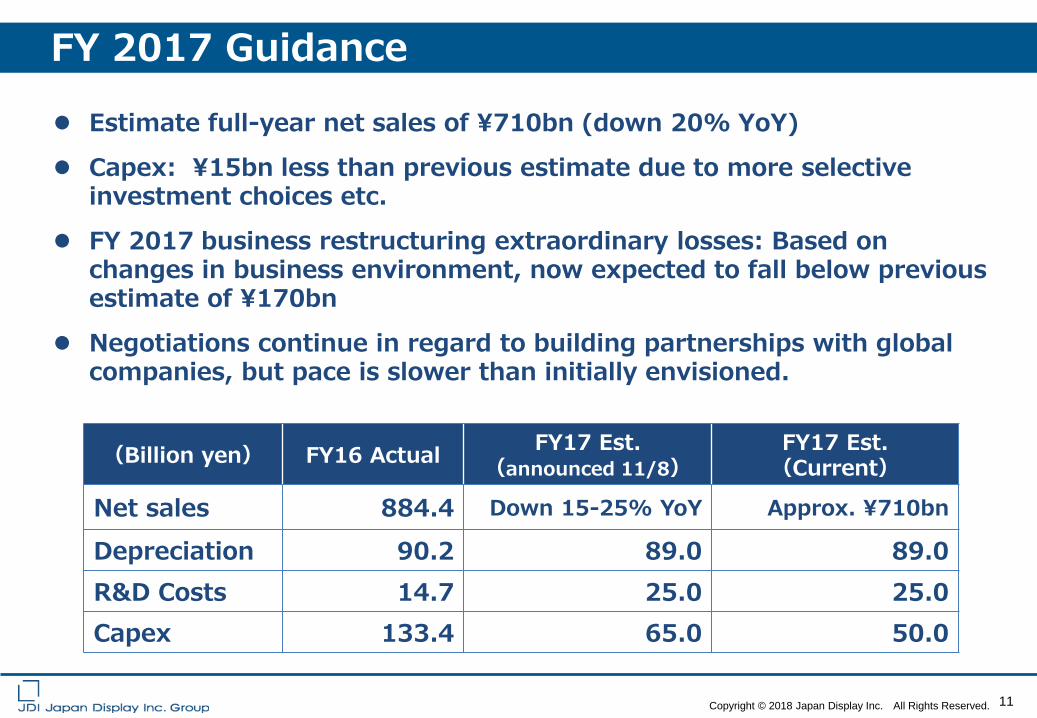
FY 2017 Guidance
Estimate full-year net sales of ¥710bn (down 20% YoY)
Capex: ¥15bn less than previous estimate due to more selective investment choices etc.
FY 2017 business restructuring extraordinary losses: Based on changes in business environment, now expected to fall below previous estimate of ¥170bn
Negotiations continue in regard to building partnerships with global companies, but pace is slower than initially envisioned.
(Billion yen) FY16 Actual FY17 Est. (announced 11/8)
FY17 Est. (Current)
Net sales 884.4 Down 15-25% YoY Approx. ¥710bn
Depreciation 90.2 89.0 89.0 R&D Costs 14.7 25.0 25.0 Capex 133.4 65.0 50.0
12 Copyright © 2018 Japan Display Inc. All Rights Reserved.
Forward Looking Statement: Any information related to market trends or industries mentioned in this document is based on information available at present and JDI does not guarantee that this information is accurate or complete. Any plan, estimation, calculation, quotation, evaluation, prediction, expectation or other forward-looking information in this document is based on the current assumptions and beliefs of JDI in light of the information currently available to it, and involves known and unknown risks, uncertainties, and other factors. Such risks, uncertainties and other factors may cause JDI’s actual results, performance, achievements or financial position to be materially different from any future results, performance, achievements or financial position expressed or implied by such forward-looking information. Such risks, uncertainties and other factors include, without limitation: economic conditions and individual consumption trends in Japan and overseas, currency exchange rate movements, trends in the market for smartphones and other electronic equipment, the management policies of our major business partners and fluctuations in the price of raw materials.