Embed Size (px)
Citation preview

Third Quarter 2011 Earnings ReviewOctober 17, 2011
Highlights
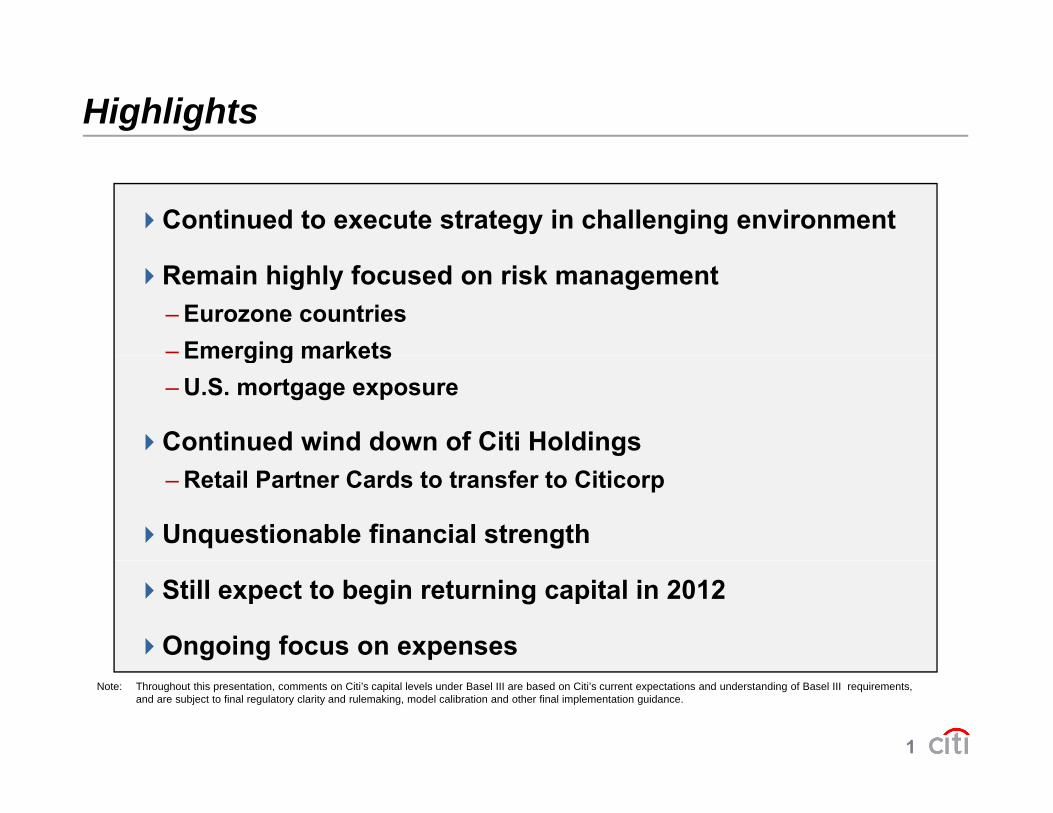
Continued to execute strategy in challenging environment
Remain highly focused on risk management– Eurozone countries– Emerging marketsEmerging markets– U.S. mortgage exposure
Continued wind down of Citi Holdings– Retail Partner Cards to transfer to Citicorp
Unquestionable financial strength
Still expect to begin returning capital in 2012
Ongoing focus on expenses
1
Note: Throughout this presentation, comments on Citi’s capital levels under Basel III are based on Citi’s current expectations and understanding of Basel III requirements, and are subject to final regulatory clarity and rulemaking, model calibration and other final implementation guidance.

Citigroup – Summary Income Statement
($MM, except EPS) 3Q'11 2Q'11 3Q'10 % QoQ % YoY
Net Revenues $20,831 $20,622 $20,738 1% 0%
Operating Expenses 12 460 12 936 11 520 (4)% 8%Operating Expenses 12,460 12,936 11,520 (4)% 8%
Net Credit Losses 4,514 5,147 7,659 (12)% (41)%Net LLR Build (Release)(1) (1,422) (1,979) (1,967) 28% 28%PB&C 259 219 227 18% 14%
Credit Losses, Claims and Benefits 3,351 3,387 5,919 (1)% (43)%
Income Taxes 1,278 967 698 32% 83%
Net Income from Cont. Ops. $3,742 $3,332 $2,601 12% 44%
Net Income $3,771 $3,341 $2,168 13% 74%
Diluted EPS $1.23 $1.09 $0.72 13% 71%
Diluted EPS (Ex-CVA)(2) $0.84 $1.06 $0.70 (21)% 20%( )
EOP Assets ($B) $1,936 $1,957 $1,983 (1)% (2)%
EOP Loans ($B) 637 648 654 (2)% (3)%EOP Deposits ($B) 851 866 850 (2)% 0%
2
Note: All per share numbers, throughout this presentation, reflect Citigroup’s 1-for-10 reverse stock split, which was effective May 6, 2011. Totals may not sum due to rounding.
(1) Includes provision for unfunded lending commitments.(2) Credit valuation adjustment (CVA) on Citigroup’s fair value option debt and derivatives, net of hedges. Citigroup pre-tax CVA recorded in Securities and Banking
and Special Asset Pool totaled $115MM, $164MM and $1,938MM in 3Q’10, 2Q’11, and 3Q’11, respectively. Assumes tax rates of 41.3%, 37.9%, and 37.9% for 3Q’10, 2Q’11, and 3Q’11, respectively.

Significant P&L Items
3Q’11:
Pre-Tax ($MM) Impact Segment
3Q’11:
Citigroup credit valuation adjustment $1,938 S&B; SAP
Net loan loss reserve release 1,422 Citicorp; Hldgs
(1)
2Q’11:
Realized gains on sale of HTM assets 511 SAP
Net loan loss reserve release 1,979 Citicorp; Hldgs
3Q’10:
Net loss on sale of Student Loan (800) Disc OpsNet loss on sale of Student Loan (800) Disc. Ops.Corporation
Net loan loss reserve release 1,967 Citicorp; Hldgs
3
Note: See footnote (2) on slide 2.(1) 3Q’11 included $1.6B of CVA on Citigroup’s fair value option debt and $0.3B of derivatives CVA, net of hedges.

Citicorp & Citi Holdings – Financial Summary
($MM) Citicorp Citi Holdings3Q'11 2Q'11 3Q'10 3Q'11 2Q'11 3Q'10
Net Revenues $17,705 $16,348 $16,289 $2,826 $4,011 $3,853
Operating Expenses 9,778 10,062 8,931 2,104 2,204 2,228
Net Credit Losses 1 933 2 153 3 020 2 581 2 995 4 640Net Credit Losses 1,933 2,153 3,020 2,581 2,995 4,640 Net LLR Build (Release)(1) (585) (914) (426) (838) (1,065) (1,541) PB&C 45 26 38 215 193 189
Credit Losses, Claims and Benefits 1,393 1,265 2,632 1,958 2,123 3,288
Income Before Taxes 6,534 5,021 4,726 (1,236) (316) (1,663)
Net Income $4,640 $3,656 $3,503 $(802) $(218) $(1,146)
EOP Assets ($B) $1 364 $1 380 $1 283 $289 $308 $421EOP Assets ($B) $1,364 $1,380 $1,283 $289 $308 $421
EOP Loans ($B) 444 440 394 194 208 261
EOP Deposits ($B) 776 788 757 71 73 82
4
Note: Corporate / Other and Discontinued Operations, which had net income of $(67)MM in 3Q’11, $(97)MM in 2Q’11 and $(189)MM in 3Q’10, are not shown. Corporate / Other assets were $283B in 3Q’11, $269B in 2Q’11, and $279B in 3Q’10 (for more details please refer to slide 18).
(1) Includes provision for unfunded lending commitments.
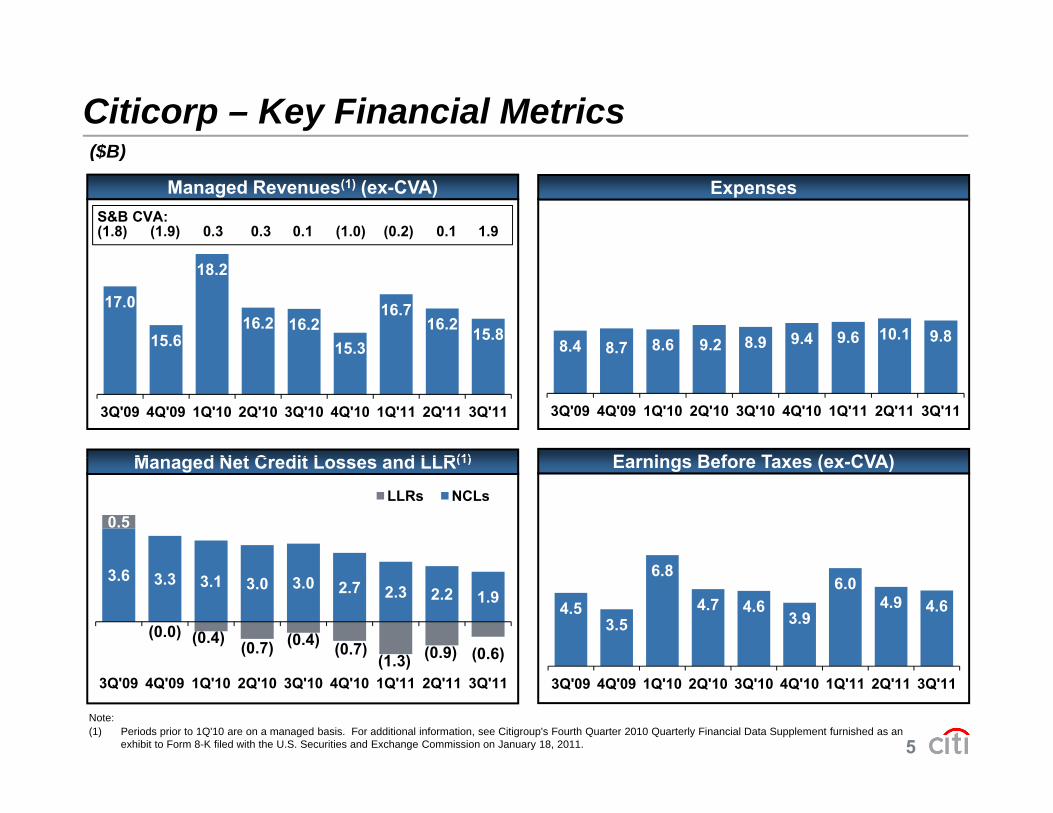
Citicorp – Key Financial Metrics ($B)($B)
ExpensesManaged Revenues(1) (ex-CVA)S&B CVA: (1.8) (1.9) 0.3 0.3 0.1 (1.0) (0.2) 0.1 1.9
17.0
15.6
18.2
16.2 16.215.3
16.716.2 15.8
8.4 8.7 8.6 9.2 8.9 9.4 9.6 10.1 9.8
M d N t C dit L d LLR(1) E i B f T ( CVA)
3Q'09 4Q'09 1Q'10 2Q'10 3Q'10 4Q'10 1Q'11 2Q'11 3Q'11 3Q'09 4Q'09 1Q'10 2Q'10 3Q'10 4Q'10 1Q'11 2Q'11 3Q'11
Managed Net Credit Losses and LLR(1) Earnings Before Taxes (ex-CVA)
0.5 LLRs NCLs
3.6 3.3 3.1 3.0 3.0 2.7 2.3 2.2 1.9
(0.0) (0.4) (0.7) (0.4) (0.7)(1 3) (0.9) (0.6)
4.53.5
6.8
4.7 4.63.9
6.04.9 4.6
5
(1.3)3Q'09 4Q'09 1Q'10 2Q'10 3Q'10 4Q'10 1Q'11 2Q'11 3Q'11 3Q'09 4Q'09 1Q'10 2Q'10 3Q'10 4Q'10 1Q'11 2Q'11 3Q'11
Note:(1) Periods prior to 1Q'10 are on a managed basis. For additional information, see Citigroup's Fourth Quarter 2010 Quarterly Financial Data Supplement furnished as an
exhibit to Form 8-K filed with the U.S. Securities and Exchange Commission on January 18, 2011.
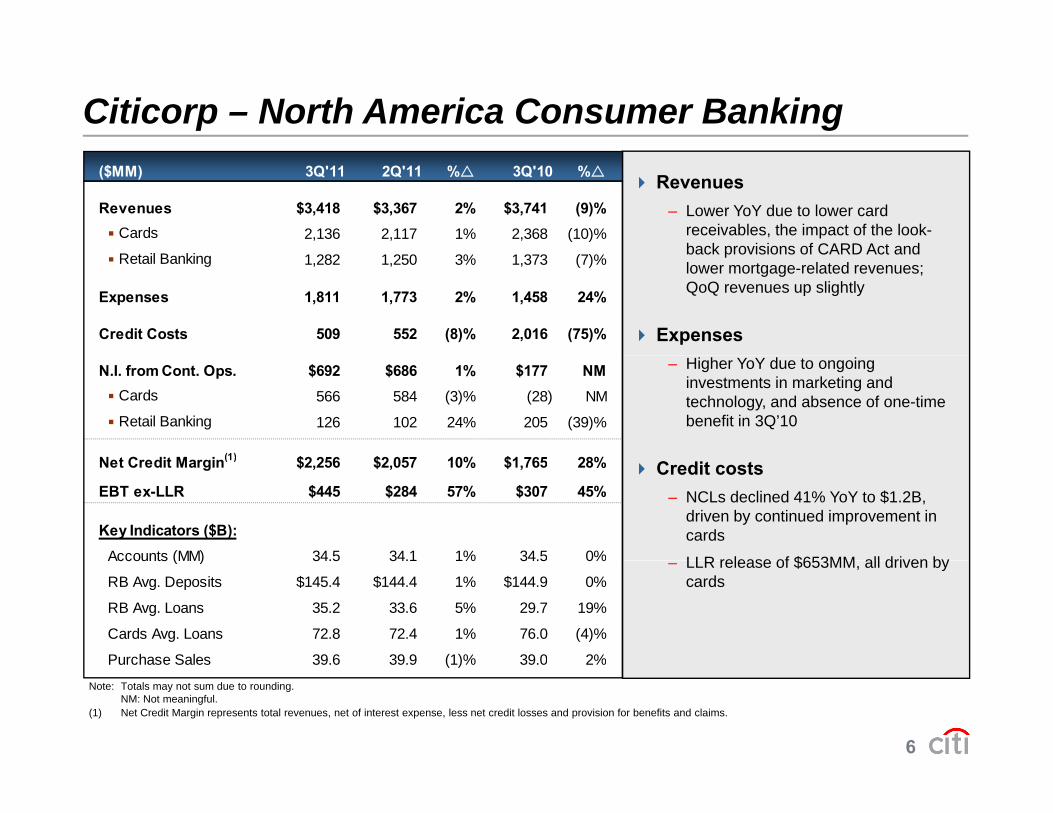
Citicorp – North America Consumer Banking
Revenues – Lower YoY due to lower card
receivables, the impact of the look-back provisions of CARD Act and
($MM) 3Q'11 2Q'11 % 3Q'10 %
Revenues $3,418 $3,367 2% $3,741 (9)% Cards 2,136 2,117 1% 2,368 (10)%
back provisions of CARD Act and lower mortgage-related revenues; QoQ revenues up slightly
Expenses
Retail Banking 1,282 1,250 3% 1,373 (7)%
Expenses 1,811 1,773 2% 1,458 24%
Credit Costs 509 552 (8)% 2,016 (75)%
– Higher YoY due to ongoing investments in marketing and technology, and absence of one-time benefit in 3Q’10
N.I. from Cont. Ops. $692 $686 1% $177 NM Cards 566 584 (3)% (28) NM
Retail Banking 126 102 24% 205 (39)%
N t C dit M i (1) $2 256 $2 057 10% $1 765 28% Credit costs – NCLs declined 41% YoY to $1.2B,
driven by continued improvement in cards
LLR release of $653MM all driven by
Net Credit Margin(1) $2,256 $2,057 10% $1,765 28%
EBT ex-LLR $445 $284 57% $307 45%
Key Indicators ($B):Accounts (MM) 34.5 34.1 1% 34.5 0% – LLR release of $653MM, all driven by
cardsAccounts (MM) 34.5 34.1 1% 34.5 0%
RB Avg. Deposits $145.4 $144.4 1% $144.9 0%
RB Avg. Loans 35.2 33.6 5% 29.7 19%
Cards Avg. Loans 72.8 72.4 1% 76.0 (4)%
Purchase Sales 39 6 39 9 (1)% 39 0 2%
6
Note: Totals may not sum due to rounding. NM: Not meaningful.
(1) Net Credit Margin represents total revenues, net of interest expense, less net credit losses and provision for benefits and claims.
Purchase Sales 39.6 39.9 (1)% 39.0 2%

Citicorp – International Consumer Banking
Revenues
– Sustained growth in business volumes across all regions and positi e FX impact YoY partl offset b
($MM) 3Q'11 2Q'11 % 3Q'10 %
Revenues $4,850 $4,826 0% $4,404 10% EMEA 363 388 (6)% 347 5% Latin America 2,420 2,412 0% 2,223 9%
positive FX impact YoY, partly offset by spread compression
– QoQ growth offset by negative FX impact
Asia 2,067 2,026 2% 1,834 13%
Expenses 2,942 2,997 (2)% 2,627 12%
Credit Costs 720 627 15% 352 NM
Expenses
– Continued investment in the franchise, FX impact YoY and increased business volumes, partially offset by
Net Income $919 $912 1% $1,049 (12)% EMEA 8 26 (69)% 18 (56)% Latin America 344 401 (14)% 535 (36)% Asia 567 485 17% 496 14%
Product Revenues:productivity savings
– Asia achieved positive operating leverage YoY
C dit t
Product Revenues: Cards $1,999 $1,977 1% $1,788 12% Retail Banking 2,851 2,849 0% 2,616 9%
Net Credit Margin(1) $4,121 $4,107 0% $3,612 14%EBT ex-LLR $1,179 $1,110 6% $985 20%
Credit costs
– YoY NCLs declined 9% despite portfolio growth
– LLR release declined to $9MM from
Key Indicators ($B):Accounts (MM) 79.1 77.9 2% 76.4 4%Avg. Deposits $167.8 $170.1 (1)% $150.7 11%RB Avg. Loans 93.4 92.9 1% 79.6 17%Investment Sales 21 5 24 5 (12)% 21 3 1%
7
LLR release declined to $9MM from $440MM in 3Q’10
Note: Totals may not sum due to rounding. NM: Not meaningful.
(1) Net Credit Margin represents total revenues, net of interest expense, less net credit losses and provision for benefits and claims.
Investment Sales 21.5 24.5 (12)% 21.3 1%Cards Avg. Loans 37.4 37.7 (1)% 33.5 12%Purchase Sales 31.8 31.4 1% 26.5 20%

Citicorp – International Consumer Banking($B)($B)
Average Loans & Deposits ($B)Accounts (MM)
79.1 157 4 163.4 170.1 167.8
Avg Loans Avg Deposits
76.6 75.9
75.2 75.1
76.4 76.5 77.0
77.9
103.5 107.5 108.3 108.9 113.1 118.7 123.8 130.6 130.8 136.6 142.4 145.0 145.9 150.7 157.4
S l (12 M th T ili $B) Fi i l M t i (12 M th T ili $B)
3Q'09 4Q'09 1Q'10 2Q'10 3Q'10 4Q'10 1Q'11 2Q'11 3Q'11 3Q'09 4Q'09 1Q'10 2Q'10 3Q'10 4Q'10 1Q'11 2Q'11 3Q'11
Sales (12-Month Trailing $B) Financial Metrics (12-Month Trailing $B)
97 5100.8
105.1 109.8
116.6 121.9 Purchase Sales Investment Sales
11.8 11.9 12.3 12.9 13.6 14.3 14.8 15.4 15.9
87.0 89.7 94.1
97.5
79.7 84.8
93.6 92.0 90.4 92.5 93.8 94.9 95.1 2.6 2.6 2.8 3.1 3.5 3.9 4.0 4.1 4.3
EBT ex-LLR NCM (2)(1)
8
3Q'09 4Q'09 1Q'10 2Q'10 3Q'10 4Q'10 1Q'11 2Q'11 3Q'11 3Q'09 4Q'09 1Q'10 2Q'10 3Q'10 4Q'10 1Q'11 2Q'11 3Q'11
Note:(1) Excluding the 4Q’08 $4.3B pre-tax goodwill impairment charge. (2) Net Credit Margin represents total revenues, net of interest expense, less net credit losses and provision for benefits and claims.

Citicorp 3Q’11 International Consumer Loans($B)($B)
Loans as % of Total International RCB Total International Loans by Product
Korea21%
All Other16%
Mortgage 30%Personal
and Mexico
17%
Australia 10%
Malaysia4%
Japan 2%
16%
Cards 28%
Other 19%
Commercial Markets10%
Singapore8%Hong Kong
Brazil6%
India 6%
Taiwan 5%
Markets23%
8%Hong Kong 6%
6%
9
Total EOP Loans
Mortgage$38.1
Cards$35.6
Commercial$29.2
PIL(1)+Other$23.5
Total EOP Loans
3Q’10$116.7
2Q’11$132.7
3Q’11$126.4
Note: Totals may not sum due to rounding.(1) Personal installment loan.
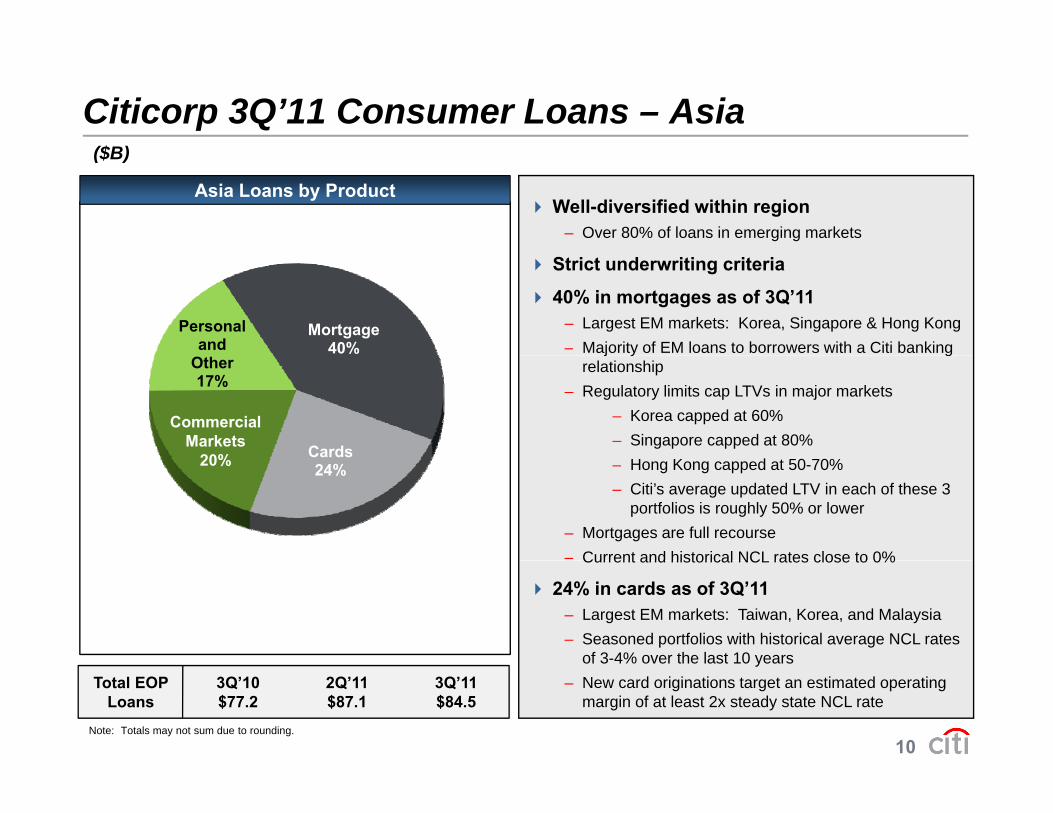
Citicorp 3Q’11 Consumer Loans – Asia($B)($B)
Asia Loans by ProductWell-diversified within region
– Over 80% of loans in emerging markets
Mortgage 40%
Personal and
Strict underwriting criteria
40% in mortgages as of 3Q’11– Largest EM markets: Korea, Singapore & Hong Kong– Majority of EM loans to borrowers with a Citi banking
Cards
Other 17%
j y grelationship
– Regulatory limits cap LTVs in major markets– Korea capped at 60%– Singapore capped at 80%
Commercial Markets
20% 24% – Hong Kong capped at 50-70%– Citi’s average updated LTV in each of these 3
portfolios is roughly 50% or lower– Mortgages are full recourse– Current and historical NCL rates close to 0%
20%
Current and historical NCL rates close to 0%
24% in cards as of 3Q’11– Largest EM markets: Taiwan, Korea, and Malaysia– Seasoned portfolios with historical average NCL rates
of 3-4% over the last 10 years
10
Total EOP Loans
3Q’10$77.2
2Q’11$87.1
3Q’11$84.5
of 3 4% over the last 10 years– New card originations target an estimated operating
margin of at least 2x steady state NCL rate
Note: Totals may not sum due to rounding.

Citicorp 3Q’11 Consumer Loans – LATAM($B)($B)
LATAM Loans by Product2 key markets
– Mexico (~62% of loans) and Brazil (~20% of loans)
37% in cards as of 3Q’11– Mexico cards portfolio ($5.2B) re-positioned over past
3 years with focus on tighter credit criteria
New vintage delinquencies at 50% of
Mortgage 12%
Personal and – New vintage delinquencies at ~50% of
2007 / 2008 vintages
– Focused on new originations through existing retail base
– Brazil cards ($4.6B) has migrated to more
Cards 37%
and Other 20%
Commercial Markets ( ) g
transactional users with higher credit quality
– Regulatory changes to minimum payment terms are impacting industry in near-term
31% in commercial markets as of 3Q’11
Markets31%
31% in commercial markets as of 3Q 11– Roughly 80% in Mexico, which has had historical
average NCL rate of <1.0% over past two years
Nearly all mortgages in Mexico
11
Total EOP Loans
3Q’10$32.2
2Q’11$37.9
3Q’11$34.9
y g g
Note: Totals may not sum due to rounding.

Citi-Branded Cards – Net Credit Margin
Asia LATAM
30%35%
30%35%
ANR 3Q’10 2Q’11 3Q’11($B) $12.3 $14.0 $13.8
ANR 3Q’10 2Q’11 3Q’11($B) $18.4 $20.7 $20.8
NCLs / ANRRevenue / ANR
%10%15%20%25%30%
%10%15%20%25%30%
12.7%
21.0%
North America EMEA
0%5%
0%5%
(1)North America EMEA
25%30%35%
25%30%35%
ANR 3Q’10 2Q’11 3Q’11($B) $76.0 $72.4 $72.8
ANR 3Q’10 2Q’11 3Q’11($B) $2.8 $3.0 $2.8
( )
0%5%
10%15%20%
0%5%
10%15%20%
20.4%5.7%
12Note:(1) Periods prior to 1Q'10 are on a managed basis. For additional information, see Citigroup's Fourth Quarter 2010 Quarterly Financial Data Supplement furnished as
an exhibit to Form 8-K filed with the U.S. Securities and Exchange Commission on January 18, 2011.

Citicorp – Securities and Banking
Revenues– Investment Banking: Lower QoQ and
YoY driven by lower activity levels across all products
($MM) 3Q'11 2Q'11 % 3Q'10 %
Product Revenues Ex-CVA: Investment Banking $736 $1,085 (32)% $930 (21)%Equity Markets 289 776 (63)% 1 062 (73)% across all products
– Equity Markets: QoQ and YoY cash equity revenues relatively stable; weak trading performance in derivatives and losses in principal strategies
Equity Markets 289 776 (63)% 1,062 (73)% Fixed Income Markets 2,271 2,922 (22)% 3,385 (33)% Lending 1,030 356 NM (11) NM Private Bank 545 555 (2)% 492 11% Other (36) (360) NM (356) 90% strategies
– Fixed Income Markets: QoQ and YoY growth in rates and currencies, offset by lower revenues in credit-related and securitized products
( ) ( ) ( )
Regional Revenues Ex-CVA: North America $1,463 $1,945 (25)% $2,140 (32)% EMEA 1,615 1,698 (5)% 1,717 (6)% Latin America 510 671 (24)% 634 (20)%
Expenses– YoY higher investment spending more
than offset by lower incentive comp and ongoing productivity savings
( ) ( ) Asia 1,247 1,020 22% 1,011 23%
Total Revenues Ex-CVA $4,835 $5,334 (9)% $5,502 (12)%
CVA 1,888 147 NM 99 NM
Credit costs – Lower NCLs, partially offset by LLR
build due to portfolio growth
Revenues 6,723 5,481 23% 5,601 20%
Expenses 3,582 3,901 (8)% 3,610 (1)%
Credit Costs 174 60 NM 279 (38)%
13
Note: Totals may not sum due to rounding. NM: Not meaningful.
Net Income $2,137 $1,185 80% $1,356 58%
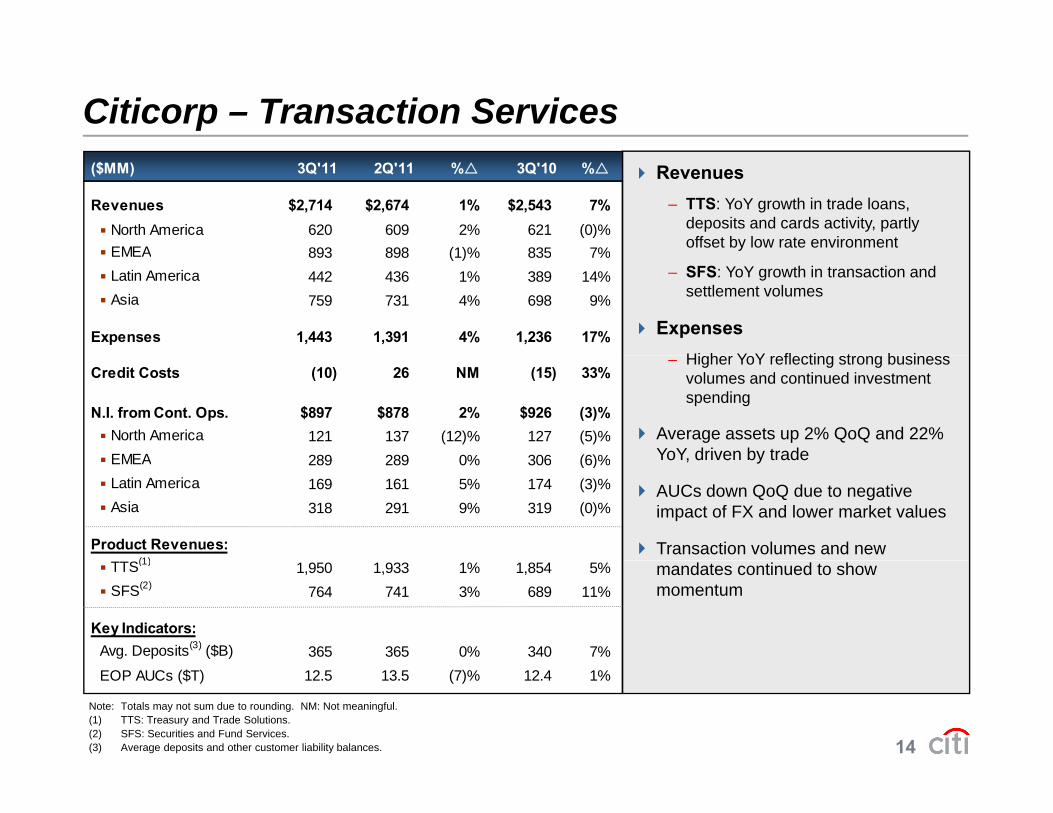
Citicorp – Transaction ServicesRevenues
– TTS: YoY growth in trade loans, deposits and cards activity, partly offset by low rate environment
($MM) 3Q'11 2Q'11 % 3Q'10 %
Revenues $2,714 $2,674 1% $2,543 7% North America 620 609 2% 621 (0)%EMEA 893 898 (1)% 835 7%
– SFS: YoY growth in transaction and settlement volumes
ExpensesHi h Y Y fl ti t b i
EMEA 893 898 (1)% 835 7% Latin America 442 436 1% 389 14% Asia 759 731 4% 698 9%
Expenses 1,443 1,391 4% 1,236 17%– Higher YoY reflecting strong business
volumes and continued investment spending
Average assets up 2% QoQ and 22% YoY driven by trade
Credit Costs (10) 26 NM (15) 33%
N.I. from Cont. Ops. $897 $878 2% $926 (3)% North America 121 137 (12)% 127 (5)%EMEA 289 289 0% 306 (6)% YoY, driven by trade
AUCs down QoQ due to negative impact of FX and lower market values
Transaction volumes and new
EMEA 289 289 0% 306 (6)% Latin America 169 161 5% 174 (3)% Asia 318 291 9% 319 (0)%
Product Revenues:(1) mandates continued to show
momentum TTS(1) 1,950 1,933 1% 1,854 5% SFS(2) 764 741 3% 689 11%
Key Indicators:Avg. Deposits(3) ($B) 365 365 0% 340 7%
14
Note: Totals may not sum due to rounding. NM: Not meaningful.(1) TTS: Treasury and Trade Solutions.(2) SFS: Securities and Fund Services.(3) Average deposits and other customer liability balances.
EOP AUCs ($T) 12.5 13.5 (7)% 12.4 1%

Citi Holdings – Key Financial Metrics ($B)($B)
ExpensesManaged Revenues(1)
Net Revenue Marks:1.5 0.2 1.4 1.0 0.5 0.4 0.6 0.9 0.1
7.25 2 6.6 4 9
M d N t C dit L d LLR(1) N t I
5.2 4.9 3.9 4.0 3.3 4.0 2.8
3Q'09 4Q'09 1Q'10 2Q'10 3Q'10 4Q'10 1Q'11 2Q'11 3Q'11
3.1 3.1 2.6 2.4 2.2 2.4 2.0 2.2 2.1
3Q'09 4Q'09 1Q'10 2Q'10 3Q'10 4Q'10 1Q'11 2Q'11 3Q'11
Managed Net Credit Losses and LLR(1) Net Income
0.3 0.80 3
LLRs NCLs
7.4 6.7 5.2 5.0 4.6 4.2 4.0 3.0 2.6
0.3
(0.8) (1.5) (1.5) (2.1) (1.1) (0.8)
(2.1) (2.6)(0.9) (1.2) (1.1) (1.0) (0.6) (0.2) (0.8)
2
15
3Q'09 4Q'09 1Q'10 2Q'10 3Q'10 4Q'10 1Q'11 2Q'11 3Q'11 3Q'09 4Q'09 1Q'10 2Q'10 3Q'10 4Q'10 1Q'11 2Q'11 3Q'11
Note:(1) Periods prior to 1Q'10 are on a managed basis. For additional information, see Citigroup's Fourth Quarter 2010 Quarterly Financial Data Supplement furnished as an
exhibit to Form 8-K filed with the U.S. Securities and Exchange Commission on January 18, 2011.

Citi Holdings – Financials
Revenues– BAM: Higher YoY due to absence of
3Q’10 private equity markets
($MM) 3Q'11 2Q'11 % 3Q'10 %
Revenues $2,826 $4,011 (30)% $3,853 (27)%
BAM 55 47 17% (8) NM– LCL: Declining loan balances
– SAP: Lower YoY due to lower interest earning assets; lower QoQ due to absence of 2Q’11 gains
LCL 2,998 2,949 2% 3,547 (15)%
SAP (227) 1,015 NM 314 NM
Expenses 2,104 2,204 (5)% 2,228 (6)%
Expenses– Down YoY due to divestitures and
overall lower assets
Credit costs
Credit Costs 1,958 2,123 (8)% 3,288 (40)%
Net Income $(802) $(218) NM $(1,146) 30%
BAM (90) (101) 11% (159) 43% Credit costs– YoY lower by $1.3B
– NCLs fell by $2.1B YoY, mainly due to continued improvement in Retail Partner Cards, NA mortgages, and
BAM (90) (101) 11% (159) 43%
LCL (585) (746) 22% (830) 30%
SAP (127) 629 NM (157) 19%
g gSAP
– LLR: Release of $0.8B; $0.7B lower YoY, mainly driven by Retail Partner Cards and SAP
Key Indicators ($B):
EOP Deposits $70.8 $73.3 (3)% $82.3 (14)%
EOP Loans 193.6 207.5 (7)% 260.8 (26)%
LCL EOP L 186 6 198 0 (6)% 237 8 (22)%
16
Note: Totals may not sum due to rounding. NM: Not meaningful.
LCL EOP Loans 186.6 198.0 (6)% 237.8 (22)%
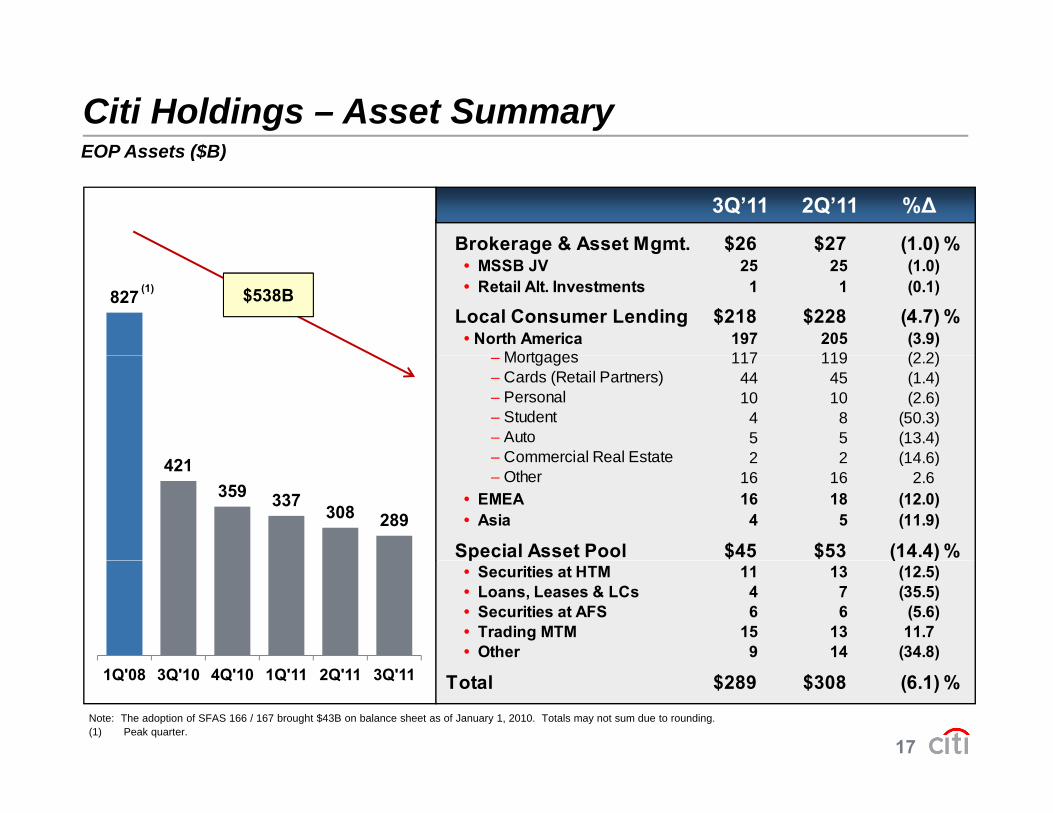
Citi Holdings – Asset SummaryEOP Assets ($B)
3Q’11 2Q’11 %∆
EOP Assets ($B)
Brokerage & Asset Mgmt. $26 $27 (1.0) %
827 $538B(1)
g g ( )• MSSB JV 25 25 (1.0)• Retail Alt. Investments 1 1 (0.1)
Local Consumer Lending $218 $228 (4.7) %• North America 197 205 (3.9)
Mortgages 117 119 (2 2)– Mortgages 117 119 (2.2)– Cards (Retail Partners) 44 45 (1.4)– Personal 10 10 (2.6)– Student 4 8 (50.3)– Auto 5 5 (13.4)– Commercial Real Estate 2 2 (14 6)421
359 337 308 289
– Commercial Real Estate 2 2 (14.6)– Other 16 16 2.6
• EMEA 16 18 (12.0)• Asia 4 5 (11.9)
Special Asset Pool $45 $53 (14.4) %p ( )• Securities at HTM 11 13 (12.5)• Loans, Leases & LCs 4 7 (35.5)• Securities at AFS 6 6 (5.6)• Trading MTM 15 13 11.7• Other 9 14 (34.8)
17
1Q'08 3Q'10 4Q'10 1Q'11 2Q'11 3Q'11
Note: The adoption of SFAS 166 / 167 brought $43B on balance sheet as of January 1, 2010. Totals may not sum due to rounding.(1) Peak quarter.
Total $289 $308 (6.1) %

Corporate / Other
Revenues: YoY decrease mainly driven by lower investment yields, lower gains on sales of AFS securities,
($MM) 3Q'11 2Q'11 % 3Q'10 %
Revenues $300 $263 14% $596 (50)%
and hedging activities
Net income: Reduction in revenues, higher legal and related expenses and infrastructure investments
N.I. from Cont. Ops. $(109) $(168) 35% $134 NM
Balance Sheet (EOP $B):
Assets $283 $269 5% $279 1%
Assets: Cash and deposits with banks plus liquid AFS investments represent 76% of Corporate / Other assets
Note: Totals may not sum due to rounding. NM: Not meaningful
Deposits 5 5 (8)% 11 (56)%
NM: Not meaningful.
18

Citigroup – Year-to-Date Expense Drivers Year over Year Change ($B)Year-over-Year Change ($B)
8.1%5.3%
2.8%
1.12.8
35.91.0
37.7
(0.2)
Macro / Episodic
34.9 (1.4) (0.4)
~~
Macro / EpisodicDriven Expenses:
+$1.8BOperating: +$1.0B
Year to date operating expenses up 2 8% vs last year
YTD2010
Invest. Efficiency Saves
All Other Operating
YTD 2011
FX Legal &Related
Other Episodic
YTD2011(2)(1)
(3)
19
Note: Totals may not sum due to rounding.(1) Includes volumes, divestitures ,and all other operational expenses.(2) Includes a $0.4B benefit from the absence of the 2Q’10 UK bonus tax.(3) Excludes macro / episodic driven expenses.
Year-to-date, operating expenses up 2.8% vs. last year ( )

Citigroup – Year-to-Date Investments($B)
Category 2011 YTDSpend
YoYVariance Examples of Key Initiatives
($B)
Spend Variance
Revenue Generating ~$1.9 ~$1.5
Cards new acquisition campaigns Branch network expansionRetail sales force expansionSecurities & Banking hiresSecurities & Banking hires
Regulatory / Compliance ~$0.6 ~$0.6
Investments related to risk management, finance, and complianceRegulatory mandates
Enhance Capabilities, Productivity & Organizational
~$0.5 ~$0.5 Technology and infrastructure Drive productivity gains
Effectiveness
Franchise-Wide ~$0.2 ~$0.2 Consumer marketing campaigns New sponsorships
T t l Citi $3 2B $2 8B
20
Total Citi ~$3.2B ~$2.8B

Citigroup – Net Credit Losses and Reserves ($B)($B)
CorporateNet Credit Losses(1)
11.0 10.0 8.4 8.0 7.7 6.9 6.3 5.1 4.5
0.8 0.4 0.3(0 5) (0.2)
(0.5) (0.1) 0.1
Consumer3Q'09 4Q'09 1Q'10 2Q'10 3Q'10 4Q'10 1Q'11 2Q'11 3Q'11
(1.4)(0.5) (0.2)
1Q'11 2Q'11 3Q'11
0 8 0 8 5.4 4.8 4 2
3.03.33.4Loan Loss Reserves(2)
3Q’11 LLR ratio = 5.1%
0.8 0.8
(0.1)(1.5) (2.0) (2.3) (3.3)
(2.0) (1.4)
3Q'09 4Q'09 1Q'10 2Q'10 3Q'10 4Q'10 1Q'11 2Q'11 3Q'11
4.8 4.2
(2.0) (1.5) (1.2)1Q'11 2Q'11 3Q'11
21
3Q 09 4Q 09 1Q 10 2Q 10 3Q 10 4Q 10 1Q 11 2Q 11 3Q 11
Note: Totals may not sum due to rounding.(1) Periods prior to 1Q'10 are on a managed basis. For additional information, see Citigroup's Fourth Quarter 2010 Quarterly Financial Data Supplement furnished as an
exhibit to Form 8-K filed with the U.S. Securities and Exchange Commission on January 18, 2011.(2) Loan Loss Reserves include provision for unfunded lending commitments and credit reserve builds / releases.

Citigroup – International Consumer Credit Trends ($B)($B)
Citicorp – Latin America Consumer BankingCiticorp – Asia Consumer Banking
2.21%1 83%
90+DPD NCL 90+DPD NCLEOP 3Q’10 2Q’11 3Q’11Loans $77.2 $87.1 $84.5
EOP 3Q’10 2Q’11 3Q’11Loans $32.2 $37.9 $34.9
0.96%0.77% 0.71% 0.63% 0.61% 0.57% 0.56% 0.59% 0.52%
1.83%1.58%
1.42% 1.30% 1.19% 1.05% 1.05% 1.08%
2.95% 2.86% 2.73% 2.59% 2.37% 1.98% 1.95% 1.90% 1 82%
8.99% 8.18%7.00% 6.07% 5.72% 5.42% 4.78% 4.59% 4.37%
Citi EMEA C B ki H ldi I t ti l LCL
3Q'09 4Q'09 1Q'10 2Q'10 3Q'10 4Q'10 1Q'11 2Q'11 3Q'11
1.98% 1.95% 1.90% 1.82%
3Q'09 4Q'09 1Q'10 2Q'10 3Q'10 4Q'10 1Q'11 2Q'11 3Q'11
Citicorp – EMEA Consumer Banking Holdings – International LCL
6.34% 6.44%5.18%4.88%
90+DPD NCL
9.79%8.74% 8.27% 7 61%
90+DPD NCLEOP 3Q’10 2Q’11 3Q’11Loans $7.3 $7.7 $7.0
EOP 3Q’10 2Q’11 3Q’11Loans $24.7 $16.6 $14.8
2.63% 2.61% 2.47% 2.74% 2.38% 2.03% 1.84% 1.69% 1.60%
4.88%3.57% 4.14%
2.76% 2.51% 2.70% 4.01% 4.22% 3.44% 2.94% 2.89% 3.00% 3.15% 3.19% 3.24%
8.27% 7.61% 7.05% 6.32%7.32%
6.41% 5.91%
22
3Q'09 4Q'09 1Q'10 2Q'10 3Q'10 4Q'10 1Q'11 2Q'11 3Q'11 3Q'09 4Q'09 1Q'10 2Q'10 3Q'10 4Q'10 1Q'11 2Q'11 3Q'11
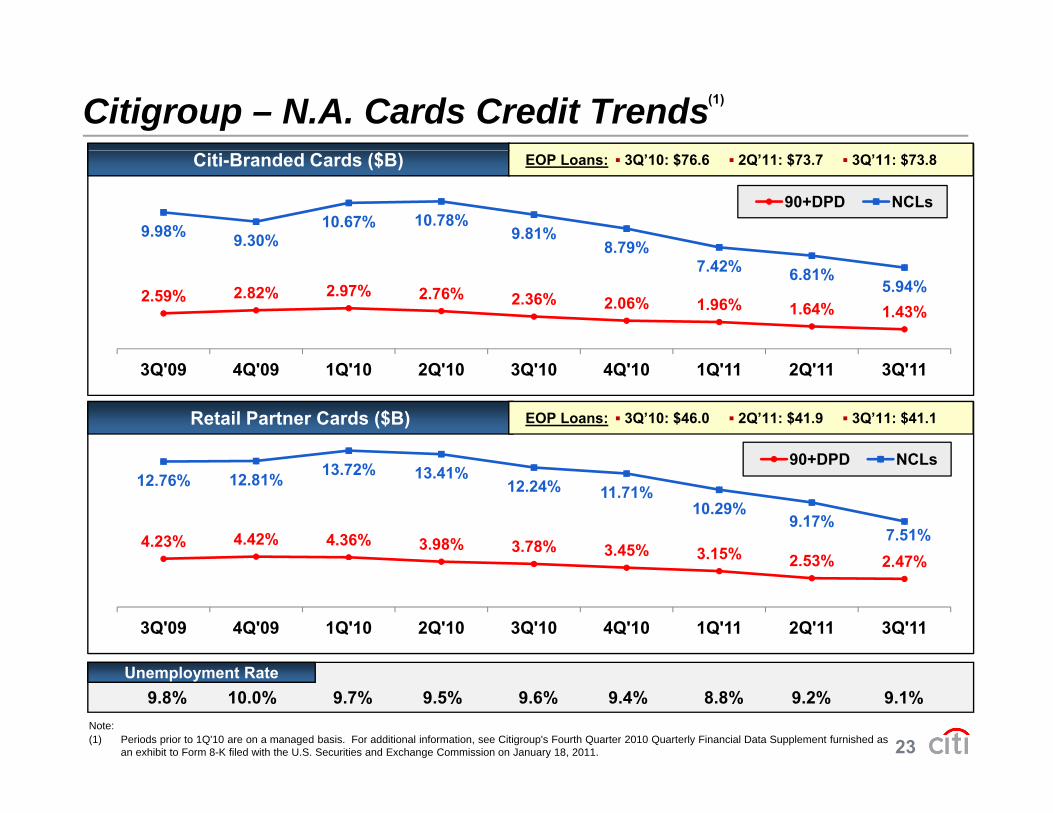
Citigroup – N.A. Cards Credit Trends(1)
9.98% 9.30%10.67% 10.78%
9.81%8.79%
90+DPD NCLs
Citi-Branded Cards ($B) EOP Loans: ▪ 3Q’10: $76.6 ▪ 2Q’11: $73.7 ▪ 3Q’11: $73.8
2.59% 2.82% 2.97% 2.76% 2.36% 2.06% 1.96% 1.64% 1.43%
8 9%7.42% 6.81%
5.94%
3Q'09 4Q'09 1Q'10 2Q'10 3Q'10 4Q'10 1Q'11 2Q'11 3Q'11
90+DPD NCLs
Retail Partner Cards ($B) EOP Loans: ▪ 3Q’10: $46.0 ▪ 2Q’11: $41.9 ▪ 3Q’11: $41.1
4.23% 4.42% 4.36% 3.98% 3.78% 3.45% 3.15% 2 53% 2 47%
12.76% 12.81% 13.72% 13.41%12.24% 11.71%
10.29%9.17%
7.51%
90+DPD NCLs
2.53% 2.47%
3Q'09 4Q'09 1Q'10 2Q'10 3Q'10 4Q'10 1Q'11 2Q'11 3Q'11
23
9.8% 10.0% 9.7% 9.5% 9.6% 9.4% 8.8% 9.2% 9.1%Unemployment Rate
Note:(1) Periods prior to 1Q'10 are on a managed basis. For additional information, see Citigroup's Fourth Quarter 2010 Quarterly Financial Data Supplement furnished as
an exhibit to Form 8-K filed with the U.S. Securities and Exchange Commission on January 18, 2011.

Citi Holdings – N.A. Mortgage Credit Trends
$10.40 $10.80$9.53
$7.92$6.90
90+DPD NCLs
EOP Loans: ▪ 3Q’10: $85.0 ▪ 2Q’11: $73.2 ▪ 3Q’11: $69.6Residential 1st Mortgages ($B)
$6.90$5.56
$4.53 $3.93 $3.82
$1.01 $0.99 $0.75 $0.69 $0.59 $0.50 $0.55 $0.46 $0.44
3Q'09 4Q'09 1Q'10 2Q'10 3Q'10 4Q'10 1Q'11 2Q'11 3Q'11
90+DPD NCLs
EOP Loans: ▪ 3Q’10: $47.5 ▪ 2Q’11: $42.8 ▪ 3Q’11: $41.3Home Equity Loans ($B)
$1.68 $1.60$1.40 $1.37 $1.33 $1.30
$1.17$1.04 $1.01
$1.24$1.10
$0.95 $0.86 $0 79 $0 77
90+DPD NCLs
$0.86 $0.79 $0.77 $0.71 $0.63 $0.54
3Q'09 4Q'09 1Q'10 2Q'10 3Q'10 4Q'10 1Q'11 2Q'11 3Q'11
24
(8.6)% (2.4)% 2.3% 3.8% (1.3)% (3.7)% (5.0)% (5.9)% n/aS&P / Case-Shiller Home Price Index(1)
Note: Loans 90+ Days Past Due exclude U.S. mortgage loans that are guaranteed by U.S. government-sponsored agencies, because the potential loss predominantly resides with the U.S. agencies, and loans recorded at fair value since 1Q’10.
(1) Year-over-year change in the S&P / Case-Shiller U.S. National Home Price Index. Third Quarter 2011 not yet available.

Citigroup – N.A. Consumer Residential Mortgages($B)
(1)
Holdings (EOP) Citicorp (EOP) 90+DPD Ratio NCL Ratio
($B)
6.93%7.50%
6.84%6.33% 5.96%
5.08%4 34%
$183 $176 $172 $163 $155
4.34%3.87% 3.88%
4.82% 4.62%3.91% 3.69% 3.47% 3.35% 3.51% 3.08% 2.81%
157 151 148 140 133 126 120 116 111
$163 $155 $149 $146 $143 $140
27 25 24 23 22 23 26 27 29
111
3Q'09 4Q'09 1Q'10 2Q'10 3Q'10 4Q'10 1Q'11 2Q'11 3Q'11
25
3Q 09 4Q 09 1Q 10 2Q 10 3Q 10 4Q 10 1Q 11 2Q 11 3Q 11
Note: 90+DPD ratio exclude loans recorded at fair value since 1Q’10. The 90+ Days Past Due ratio excludes loans that are guaranteed by U.S. government-sponsored agencies since the potential loss predominantly resides with the U.S. agencies.Totals may not sum due to rounding.
(1) Includes Citicorp and Citi Holdings consumer residential mortgage portfolios.

Citigroup – 3Q’11 Additional Mortgage Details
Third party servicing portfolio: $421B– Retained rep & warranty liability for an additional $27B of sold servicing
– $1.1B repurchase reserve for rep & warranty claims as of 3Q’11
Private label RMBS: $91B of total issuance during 2005-2008– CitiMortgage: $25B of issuance g g
Reduced by $13B of repayments and recoveries and $1B of cumulative losses
Remaining $11B has 90+ day delinquency rate of 12.5%
– S&B: $66B of issuance
(1)
S&B: $66B of issuanceReduced by $34B of repayments and recoveries and $8B of cumulative losses
Remaining $24B has 90+ day delinquency rate of 26.6%
FHA i i ti t i ifi tl t 3
(2)
FHA origination cut significantly over past 3 years– In 2005-2008, Citi originated ~7% of industry volume
– Reduced to ~3% by 2009, and <1% for 2010-2011
26
Note:(1) The $11B of outstanding CitiMortgage issuance is included in the $421B servicing portfolio above.(2) For Securities and Banking, fewer than 2% of mortgages outstanding were originated by Citi; fewer than 10% of mortgages outstanding are serviced by Citi (such
mortgages are included in the $421B servicing portfolio above).
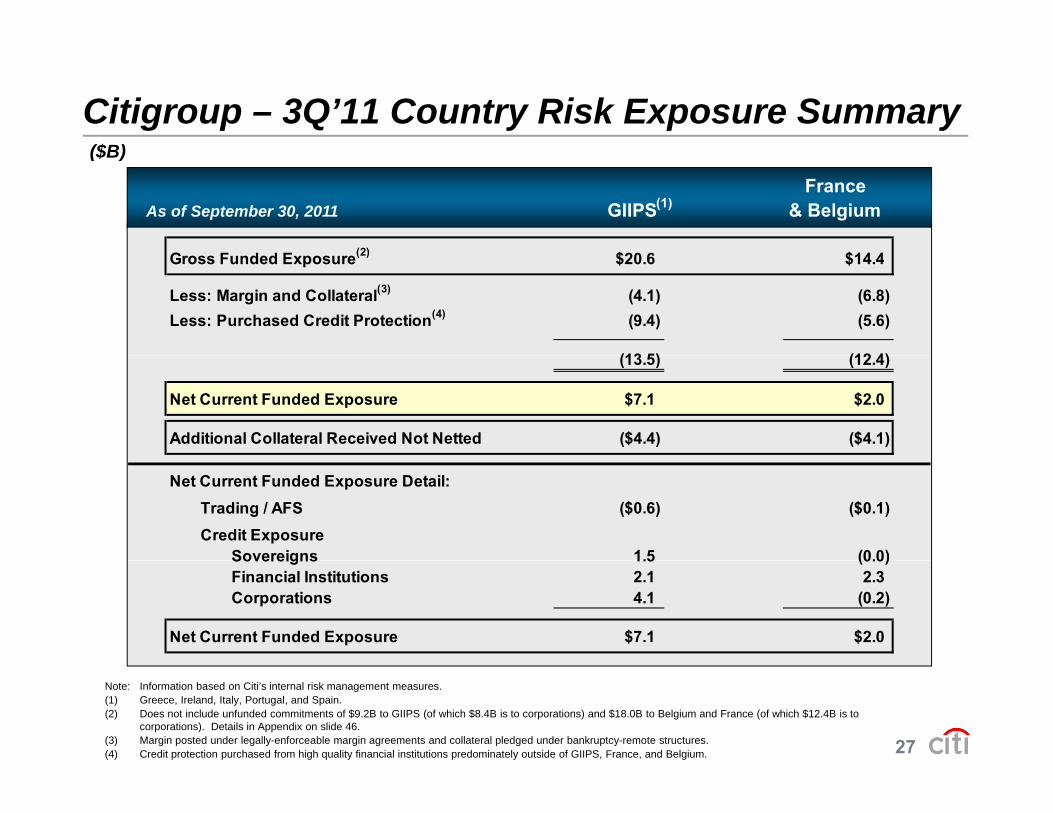
Citigroup – 3Q’11 Country Risk Exposure Summary ($B)($B)
France As of September 30, 2011 GIIPS & Belgium(1)
G F d d E (2) $20 6 $14 4Gross Funded Exposure(2) $20.6 $14.4
Less: Margin and Collateral(3) (4.1) (6.8)Less: Purchased Credit Protection(4) (9.4) (5.6)
(13 5) (12 4)(13.5) (12.4)
Net Current Funded Exposure $7.1 $2.0
Additional Collateral Received Not Netted ($4.4) ($4.1)
Net Current Funded Exposure Detail:Trading / AFS ($0.6) ($0.1)Credit Exposure
Sovereigns 1.5 (0.0)Sovereigns 1.5 (0.0)Financial Institutions 2.1 2.3Corporations 4.1 (0.2)
Net Current Funded Exposure $7.1 $2.0
27
Note: Information based on Citi’s internal risk management measures.(1) Greece, Ireland, Italy, Portugal, and Spain.(2) Does not include unfunded commitments of $9.2B to GIIPS (of which $8.4B is to corporations) and $18.0B to Belgium and France (of which $12.4B is to
corporations). Details in Appendix on slide 46. (3) Margin posted under legally-enforceable margin agreements and collateral pledged under bankruptcy-remote structures.(4) Credit protection purchased from high quality financial institutions predominately outside of GIIPS, France, and Belgium.

Conclusions
Continued growth in Regional Consumer Banking and Transaction Services – Growth in underlying drivers for international RCB – Sequential growth in North America RCB revenues and card driversq g– Strong GTS revenue growth despite continued low rate environment
Continued expense discipline, while executing on investment strategy – Asia RCB achieved positive operating leverage in 3Q'11 p p g g Q– Currently expect Latin America RCB to follow in 4Q'11
Effective risk management– Emerging markets loan growth applying strict underwriting standardsg g g pp y g g– Citi Holdings at 15% of total Citi assets as of 3Q'11 – Citi Holdings mortgage portfolio down 16% YoY– Carefully managing European exposures
Strong balance sheet– Tangible book value per share of $49.50(1)
– LLR ratio of 5.1%
28
– Tier 1 Common ratio of 11.7%
Note:(1) Tangible book value per share is a non-GAAP measure. For a reconciliation of this measure to the most directly comparable GAAP measure, see slide 47.
APPENDIXT bl f C t tTable of Contents
30. Citigroup – Key Capital Metrics
31 Citigroup Net Interest Margin
39. Citi Holdings – N.A. Residential 1st Mortgage Delinquencies 31. Citigroup – Net Interest Margin
32. Citigroup – Consumer Mortgage Reps & Warranties
33 Citigroup N A Consumer
g g
40. Citi Holdings – N.A. Home Equity Loan Delinquencies
41. Citi Holdings – SAP Assets33. Citigroup – N.A. Consumer Mortgage Credit Trends
34. Citigroup – International Consumer Credit
g
42. Citi Holdings – SAP AFS / HTM Assets
43. Citicorp – Drivers in Constant $
35. Citicorp – EM / DM KeyFinancial Metrics
36. Citicorp RCB – EM / DM Key
p
44. Citicorp – Drivers in Constant $ (cont’d)
45. Citigroup – Estimated FX Impact p yFinancial Metrics
37. Citicorp ICG – EM / DM KeyFinancial Metrics
g p pon Key P&L Metrics
46. Citigroup – 3Q’11 Country Risk Exposure Summary
29
38. Citi Holdings – LCL EBT by Business
47. Non-GAAP Financial Measures

Citigroup – Key Capital Metrics
Tier 1 Capital Total Capital Tier 1 Common
12.8%12 0% 12.5% 12.9% 13.3% 13.6% 13.5%
16.6%15.3% 14.9%
15.6% 16.1% 16.6% 17.0% 17.2% 16.9%
11.7% 11.3%12.0%
9.1% 9.6% 9.1% 9.7% 10.3% 10.8% 11.3% 11.6% 11.7%
3Q'09 4Q'09 1Q'10 2Q'10 3Q'10 4Q'10 1Q'11 2Q'11 3Q'11 (1)
Risk-Weighted Assets ($B)
30
$990 $1,089 $1,064 $1,025 $1,004 $978 $992 $993 $982Note: The adoption of SFAS 166 / 167 in 1Q'10 reduced Tier 1 Common, Tier 1 Capital and Total Capital ratios by 138, 141 and 142 basis points, respectively, and increased
risk-weighted assets by $24B. The exiting of the loss-sharing agreement with the U.S. Government increased 4Q’09 risk-weighted assets by approximately $136B.(1) Preliminary.
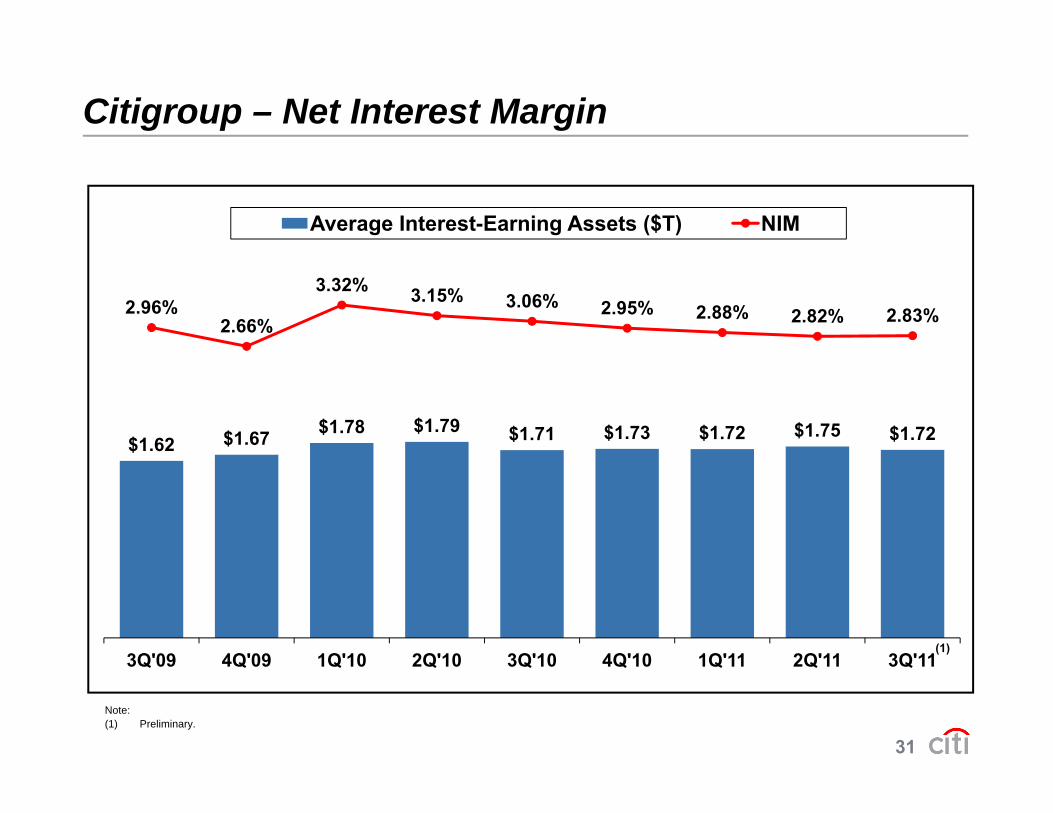
Citigroup – Net Interest Margin
Average Interest-Earning Assets ($T) NIM
2.96%2.66%
3.32% 3.15% 3.06% 2.95% 2.88% 2.82% 2.83%
$1.62 $1.67 $1.78 $1.79 $1.71 $1.73 $1.72 $1.75 $1.72
3Q'09 4Q'09 1Q'10 2Q'10 3Q'10 4Q'10 1Q'11 2Q'11 3Q'11(1)
31
3Q 09 4Q 09 1Q 10 2Q 10 3Q 10 4Q 10 1Q 11 2Q 11 3Q 11
Note:(1) Preliminary.

Citigroup – Consumer Mortgage Reps & Warranties
$ $969 $1 001 $1,076
Repurchase Reserve Balance ($MM)
(Number of Loans ‘000)
Claims Repurchases(1)
$727 $952 $969 $944 $1,001 $1,076
13.0 12.5
GSEsPrivate Investors
38.9
2Q'10 3Q'10 4Q'10 1Q'11 2Q'11 3Q'111.2 1.4
8.3
12.5
12.4$MM 2Q’11 3Q’11
Beginning balance $944 $1,001
Additions for new sales(2) 4 511.8 11.1 0.8
1.2
5.1 0.2
0.1
2.5
3.7
4.9
Additions for new sales 4 5
Change in estimate(2) 224 296
Losses realized (171) (226)
4.3 7.1
1.2 2.3
3.5 4.8
0.2 0.2 1.3
2.5
32
Ending balance $1,001 $1,0762008 2009 2010 2011
YTD2008 2009 2010 2011
YTDNote: Totals may not sum due to rounding.(1) Includes loans repurchased and make-whole payments.(2) Flows through the profit and loss statement (contra-revenue item).
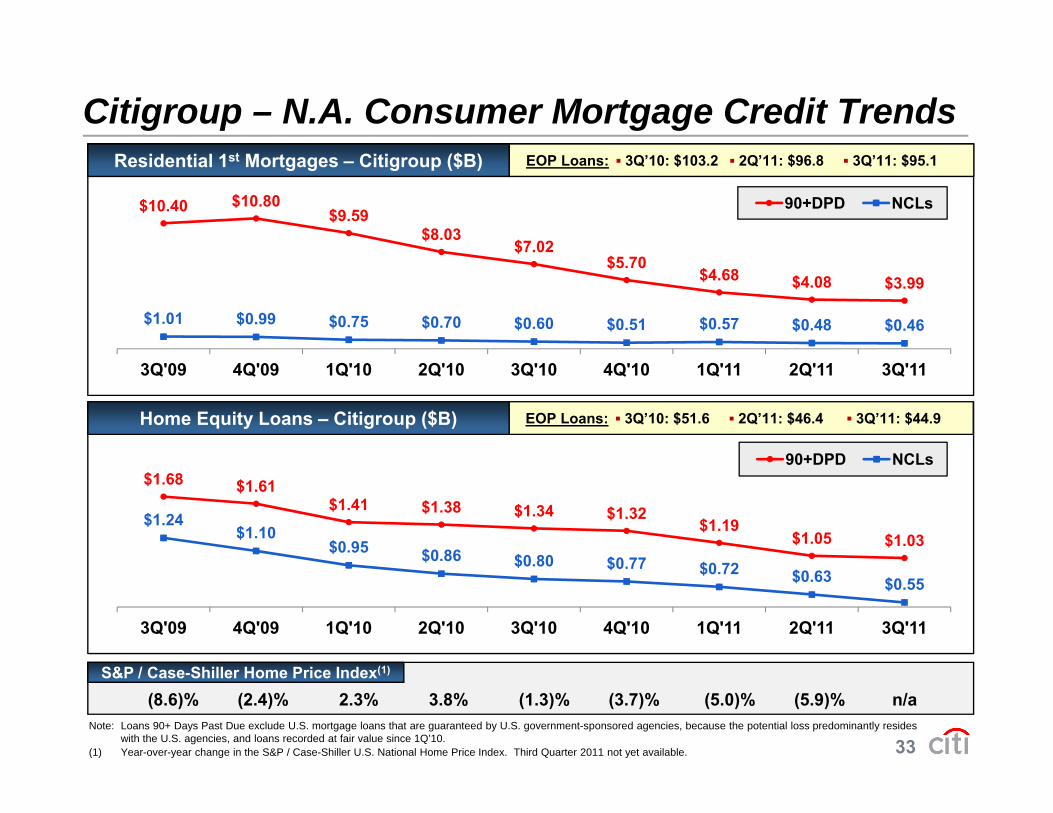
Citigroup – N.A. Consumer Mortgage Credit Trends
$10.40 $10.80$9.59
$8.03$7.02
90+DPD NCLs
EOP Loans: ▪ 3Q’10: $103.2 ▪ 2Q’11: $96.8 ▪ 3Q’11: $95.1Residential 1st Mortgages – Citigroup ($B)
$$5.70
$4.68 $4.08 $3.99
$1.01 $0.99 $0.75 $0.70 $0.60 $0.51 $0.57 $0.48 $0.46
3Q'09 4Q'09 1Q'10 2Q'10 3Q'10 4Q'10 1Q'11 2Q'11 3Q'11
90+DPD NCLs
EOP Loans: ▪ 3Q’10: $51.6 ▪ 2Q’11: $46.4 ▪ 3Q’11: $44.9Home Equity Loans – Citigroup ($B)
$1.68 $1.61$1.41 $1.38 $1.34 $1.32
$1.19$1.05 $1.03
$1.24$1.10
$0.95 $0.86 $0 80 $0 77
90+DPD NCLs
$0.86 $0.80 $0.77 $0.72 $0.63 $0.55
3Q'09 4Q'09 1Q'10 2Q'10 3Q'10 4Q'10 1Q'11 2Q'11 3Q'11
33
(8.6)% (2.4)% 2.3% 3.8% (1.3)% (3.7)% (5.0)% (5.9)% n/aS&P / Case-Shiller Home Price Index(1)
Note: Loans 90+ Days Past Due exclude U.S. mortgage loans that are guaranteed by U.S. government-sponsored agencies, because the potential loss predominantly resides with the U.S. agencies, and loans recorded at fair value since 1Q’10.
(1) Year-over-year change in the S&P / Case-Shiller U.S. National Home Price Index. Third Quarter 2011 not yet available.
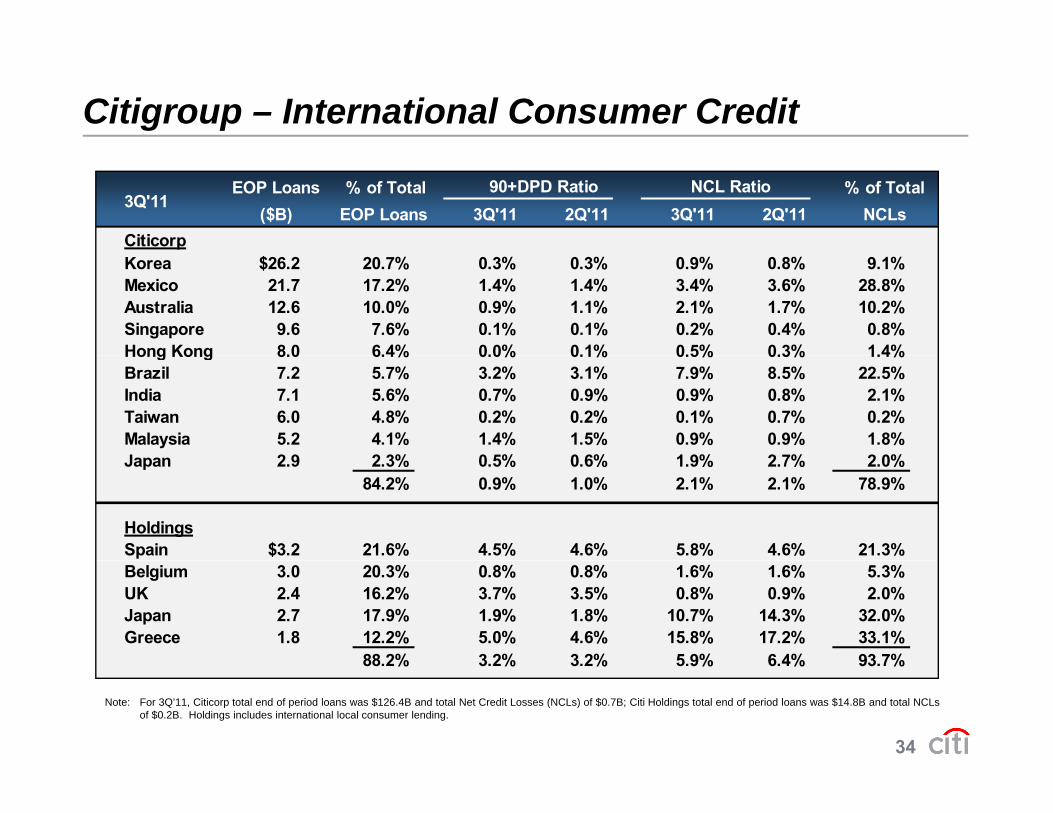
Citigroup – International Consumer Credit
EOP Loans % of Total % of Total ($B) EOP Loans 3Q'11 2Q'11 3Q'11 2Q'11 NCLs
Citicorp
3Q'11 90+DPD Ratio NCL Ratio
Korea $26.2 20.7% 0.3% 0.3% 0.9% 0.8% 9.1%Mexico 21.7 17.2% 1.4% 1.4% 3.4% 3.6% 28.8%Australia 12.6 10.0% 0.9% 1.1% 2.1% 1.7% 10.2%Singapore 9.6 7.6% 0.1% 0.1% 0.2% 0.4% 0.8%Hong Kong 8.0 6.4% 0.0% 0.1% 0.5% 0.3% 1.4%Hong Kong 8.0 6.4% 0.0% 0.1% 0.5% 0.3% 1.4%Brazil 7.2 5.7% 3.2% 3.1% 7.9% 8.5% 22.5%India 7.1 5.6% 0.7% 0.9% 0.9% 0.8% 2.1%Taiwan 6.0 4.8% 0.2% 0.2% 0.1% 0.7% 0.2%Malaysia 5.2 4.1% 1.4% 1.5% 0.9% 0.9% 1.8%Japan 2 9 2 3% 0 5% 0 6% 1 9% 2 7% 2 0%Japan 2.9 2.3% 0.5% 0.6% 1.9% 2.7% 2.0%
84.2% 0.9% 1.0% 2.1% 2.1% 78.9%
HoldingsSpain $3.2 21.6% 4.5% 4.6% 5.8% 4.6% 21.3%Belgium 3.0 20.3% 0.8% 0.8% 1.6% 1.6% 5.3%UK 2.4 16.2% 3.7% 3.5% 0.8% 0.9% 2.0%Japan 2.7 17.9% 1.9% 1.8% 10.7% 14.3% 32.0%Greece 1.8 12.2% 5.0% 4.6% 15.8% 17.2% 33.1%
88 2% 3 2% 3 2% 5 9% 6 4% 93 7%
34
Note: For 3Q’11, Citicorp total end of period loans was $126.4B and total Net Credit Losses (NCLs) of $0.7B; Citi Holdings total end of period loans was $14.8B and total NCLs of $0.2B. Holdings includes international local consumer lending.
88.2% 3.2% 3.2% 5.9% 6.4% 93.7%

Citicorp – EM / DM Key Financial Metrics ($B) E i M k t D l d M k t($B) Emerging Markets Developed Markets
Earnings Before Taxes (ex-CVA)Managed Revenues(1) (ex-CVA)
18 2
10.1 8.5 11.2 9.2 8.8 7.8 9.3 8.4 7.9
17.0 15.618.2
16.2 16.2 15.3 16.7 16.2 15.8
2 63.9 1.7 1.2 1 0
2.9 1.9 1.54.5 3.5
6.84.7 4.6 3.9
6.04.9 4.6
6.9 7.1 7.0 7.0 7.4 7.5 7.4 7.8 7.9
3Q'09 4Q'09 1Q'10 2Q'10 3Q'10 4Q'10 1Q'11 2Q'11 3Q'11
1.9 2.3 3.0 3.0 3.4 2.9 3.2 3.0 3.12.6 1.2 1.7 1.2 1.0 1.9 1.5
3Q'09 4Q'09 1Q'10 2Q'10 3Q'10 4Q'10 1Q'11 2Q'11 3Q'11
A D it A M d L (1)Average Deposits Average Managed Loans(1)
427 434 436
713 745 725 724 743 760 768 788 783
224 227
361 362 379 378 384 396 408 431 441
298 314 315 312 316 332 341 353 347
415 431 410 412 427 428 427 434 436
154 157 159 163 172 183 192 207 214
207 204 220 215 212 213 216 224 227
35
3Q'09 4Q'09 1Q'10 2Q'10 3Q'10 4Q'10 1Q'11 2Q'11 3Q'11 3Q'09 4Q'09 1Q'10 2Q'10 3Q'10 4Q'10 1Q'11 2Q'11 3Q'11
Note: Totals may not sum due to rounding.(1) Periods prior to 1Q'10 are on a managed basis For additional information, see Citigroup's Fourth Quarter 2010 Quarterly Financial Data Supplement furnished as
an exhibit to Form 8-K filed with the U.S. Securities and Exchange Commission on January 18, 2011.
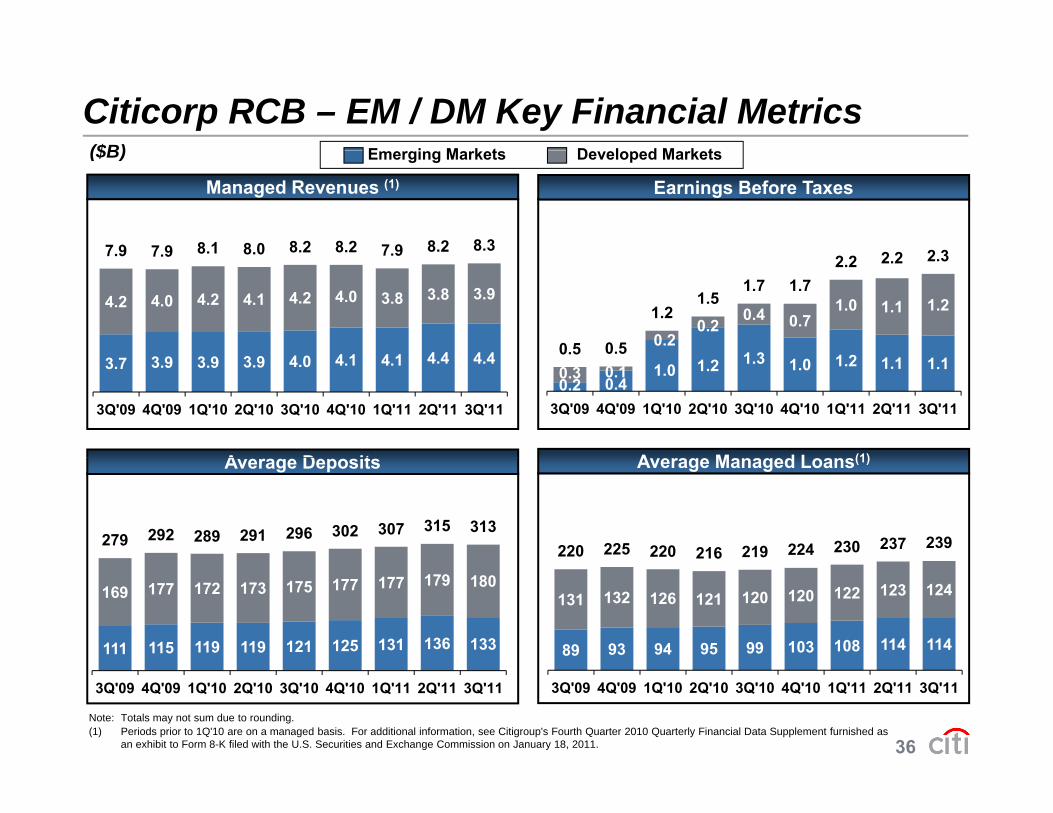
Citicorp RCB – EM / DM Key Financial Metrics ($B) E i M k t D l d M k t($B) Emerging Markets Developed Markets
Earnings Before TaxesManaged Revenues (1)
7 9 7 9 8.1 8.0 8.2 8.2 7 9 8.2 8.32 2 2 3
4 1 4 1 4 4 4 4
4.2 4.0 4.2 4.1 4.2 4.0 3.8 3.8 3.9
7.9 7.9 8.1 8.0 7.9
1 3 1 20.2
0.20.4 0.7
1.0 1.1 1.2
0.5 0.5
1.21.5
1.7 1.72.2 2.2 2.3
A D it A M d L (1)
3.7 3.9 3.9 3.9 4.0 4.1 4.1 4.4 4.4
3Q'09 4Q'09 1Q'10 2Q'10 3Q'10 4Q'10 1Q'11 2Q'11 3Q'110.2 0.4
1.0 1.2 1.3 1.0 1.2 1.1 1.10.3 0.1
3Q'09 4Q'09 1Q'10 2Q'10 3Q'10 4Q'10 1Q'11 2Q'11 3Q'11
Average Deposits Average Managed Loans(1)
279 292 289 291 296 302 307 315 313220 225 220 216 219 224 230 237 239
111 115 119 119 121 125 131 136 133
169 177 172 173 175 177 177 179 180
89 93 94 95 99 103 108 114 114
131 132 126 121 120 120 122 123 124
36
3Q'09 4Q'09 1Q'10 2Q'10 3Q'10 4Q'10 1Q'11 2Q'11 3Q'11 3Q'09 4Q'09 1Q'10 2Q'10 3Q'10 4Q'10 1Q'11 2Q'11 3Q'11
Note: Totals may not sum due to rounding.(1) Periods prior to 1Q'10 are on a managed basis. For additional information, see Citigroup's Fourth Quarter 2010 Quarterly Financial Data Supplement furnished as
an exhibit to Form 8-K filed with the U.S. Securities and Exchange Commission on January 18, 2011.
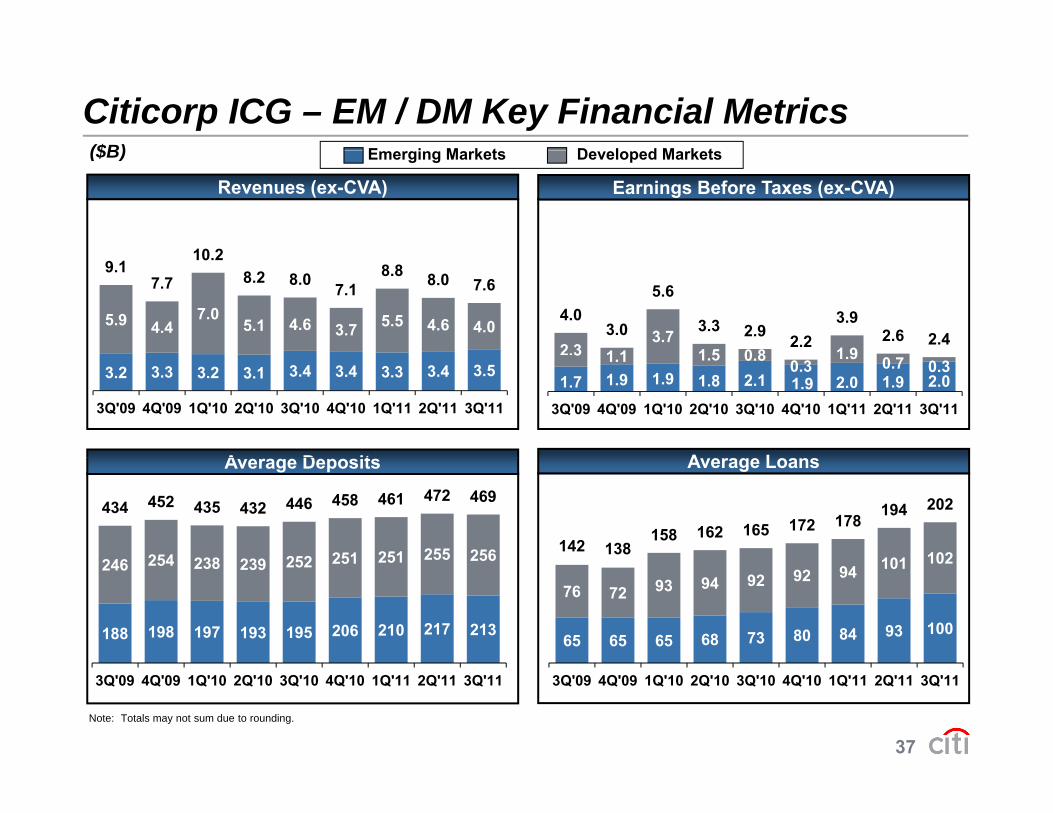
Citicorp ICG – EM / DM Key Financial Metrics ($B) E i M k t D l d M k t($B) Emerging Markets Developed Markets
Earnings Before Taxes (ex-CVA)Revenues (ex-CVA)
10 2
5.9 4.47.0
5.1 4.6 3.7 5.5 4.6 4.0
9.1 7.7
10.2 8.2 8.0 7.1
8.8 8.0 7.6
2.3 1 13.7
1 5 0 8 1 9
4.0 3.0
5.6
3.3 2.9 2.2 3.9
2.6 2.4
A D it A L
3.2 3.3 3.2 3.1 3.4 3.4 3.3 3.4 3.5
3Q'09 4Q'09 1Q'10 2Q'10 3Q'10 4Q'10 1Q'11 2Q'11 3Q'11
1.7 1.9 1.9 1.8 2.1 1.9 2.0 1.9 2.0
3 1.1 1.5 0.8 0.3 1.9 0.7 0.3
3Q'09 4Q'09 1Q'10 2Q'10 3Q'10 4Q'10 1Q'11 2Q'11 3Q'11
Average Deposits Average Loans
246 254 238 239 252 251 251 255 256
434 452 435 432 446 458 461 472 469
101 102142 138
158 162 165 172 178 194 202
188 198 197 193 195 206 210 217 213
246 254 238 239 252 251 251 256
65 65 65 68 73 80 84 93 100
76 72 93 94 92 92 94 101 102
37
3Q'09 4Q'09 1Q'10 2Q'10 3Q'10 4Q'10 1Q'11 2Q'11 3Q'11 3Q'09 4Q'09 1Q'10 2Q'10 3Q'10 4Q'10 1Q'11 2Q'11 3Q'11
Note: Totals may not sum due to rounding.

Citi Holdings – LCL EBT by Business $
3Q'11 2Q'11 1Q'11 4Q'10 3Q'10 2Q'10
Earnings Before Taxes
($MM)
3Q 11 2Q 11 1Q 11 4Q 10 3Q 10 2Q 10
Local Consumer Lending- Retail Partner Cards $778 $769 $697 $168 $605 $155- CitiFinancial N.A. 20 75 40 (70) (73) (228) - Real Estate Lending (1,360) (1,615) (1,162) (1,060) (1,391) (1,790) - Commercial Real Estate (25) (84) (90) (157) (394) (152) - Auto (24) 69 78 30 58 128 - Student Loans (15) (73) (34) (33) (106) 14
P i i 140 31 170 143 145 214- Primerica 140 31 170 143 145 214 - LCL NA Other (193) (198) (183) (222) (138) (115)
North America (678) (1,027) (483) (1,202) (1,294) (1,773) EMEA (196) (160) (23) (114) (5) (129) Asia (49) (34) (475) (282) (207) (220) Latin America 0 (5) (6) 3 2 (1)
Local Consumer Lending $(922) $(1,226) $(987) $(1,594) $(1,505) $(2,123)
38
Note: Totals may not sum due to rounding.

Citi Holdings – N.A. Mortgage Delinquencies
Days Past Due: 180+ 90 179 30 89 30+ DPD
Residential 1st Mortgage Delinquencies(1) ($B)
Days Past Due:
16.91 16.74
14 40
180+ 90-179 30-89 30+ DPD
5.82 6.14
5.785 05
14.40
12.46 11.43
9.75
4.59 4.663.75
2.87 2.66 2.061 61 1 39 1.43
5.05 4.253.50
2.92 2.54 2.39
7.84 7.38 7.32
6.50 5.93 4.87 4.54 4.53 4.18 3.30 3.45 3.49
1.61 1.39 1.43
3Q'09 4Q'09 1Q'10 2Q'10 3Q'10 4Q'10 1Q'11 2Q'11 3Q'11
39
Note: Totals may not sum due to rounding.(1) Days Past Due exclude U.S. mortgage loans that are guaranteed by U.S. government-sponsored agencies, because the potential loss predominantly resides with the U.S.
agencies, and loans recorded at fair value since 1Q’10.

Citi Holdings – N.A. Mortgage Delinquencies
Days Past Due: 180+ 90 179 30 89 30+ DPD
Home Equity Loan Delinquencies(1) ($B)
Days Past Due:
3.04 3.11
180+ 90-179 30-89 30+ DPD
1.37 1.281 12
0.31 0.330.28
0.32 0.31 0.330 32
2.812.61 2.56 2.49
2.151.93 1.92
1 50
1.37 1.121.05 1.01 0.97
0.86 0.72 0.71
0.320.32 0.31
1.36 1.50 1.41 1.24 1.24 1.19 0.97 0.90 0.91
3Q'09 4Q'09 1Q'10 2Q'10 3Q'10 4Q'10 1Q'11 2Q'11 3Q'11
40
Note: Totals may not sum due to rounding.(1) Days Past Due exclude U.S. mortgage loans that are guaranteed by U.S. government-sponsored agencies, because the potential loss predominantly resides with the U.S.
agencies, and loans recorded at fair value since 1Q’10.

Citi Holdings – SAP Assets
EOP Assets 3Q’11($B) Face EOP Assets
3Q’11 2Q’11 1Q’11 4Q’10 Value (% of Face)
Total Securities at AFS / HTM $17 1 $19 4 $22 1 $35 9 $22 2 77%Total Securities at AFS / HTM $17.1 $19.4 $22.1 $35.9 $22.2 77%
Loan, leases & LC at HFI / HFS(1) $4.4 $6.9 $8.1 $11.6 $5.2 86%Corporates 2.6 4.1 5.0 8.1 2.8 93%Commercial Real Estate 1.7 2.3 2.8 3.6 1.7 99%Other(2) 0.8 1.2 1.3 1.7 0.7 109%Loan Loss Reserves (0.6) (0.6) (1.0) (1.8) - NM
Trading Mark-to-Market $14.9 $13.3 $28.7 $20.0 NM NM Subprime Securities 0.1 0.1 0.2 0.2 1.0 9%Other Securities(3) 4.0 4.4 18.8 7.3 15.6 25%D i ti 6 7 4 2 4 0 4 6 NM NMDerivatives 6.7 4.2 4.0 4.6 NM NM Loans, Leases and Letters of Credit 1.7 2.2 2.3 2.4 4.1 42%Repurchase Agreements 2.4 2.4 3.3 5.5 NM NM
Highly Lev. Fin. Commitments 0.2 0.5 0.8 1.9 0.2 82%
Equities (excludes ARS at AFS) 4 8 7 3 8 4 5 7 NM NMEquities (excludes ARS at AFS) 4.8 7.3 8.4 5.7 NM NM
Monolines - - - 0.4 NM NM
Consumer and Other(4) 3.9 5.5 4.7 4.9 NM NM
Total $45.3 $52.9 $72.8 $80.4
41
Note: Totals may not sum due to rounding. NM: Not meaningful. SAP had total CRE assets of $3.6B and Subprime assets of $0.9B as of 3Q’11. Assets in the SIVs have been allocated to their corresponding asset categories. Excludes Discontinued Operations.
(1) HFS accounts for approximately $0.7B of the 3Q’11 total. (2) Includes $0.3B of Leases and $0.1B of Subprime in 3Q’11. (3) Includes $0.7B of Corporates, $2.1B of ARS, $0.3B of Equities, $0.4B of Subprime and $0.3B of CLOs in 3Q’11. (4) Includes $0.9B of Small Business Banking & Finance loans and $0.6B of personal loans in 3Q’11.

Citi Holdings – SAP AFS / HTM Assets
EOP Assets 3Q’11($B) Face EOP Assets
3Q’11 2Q’11 1Q’11 4Q’10 Value (% of Face)3Q 11 2Q 11 1Q 11 4Q 10 Value (% of Face)
Securities at AFS $5.7 $6.1 $8.3 $9.1 $6.2 93%Corporates 4.2 4.4 5.0 5.4 4.2 100%Prime and Non-U.S. MBS 0.0 0.0 1.4 1.4 0.0 0%Auction Rate Securities 1 5 1 6 1 8 2 0 1 9 79%Auction Rate Securities 1.5 1.6 1.8 2.0 1.9 79%Alt-A mortgages - - - - - NMGovernment Agencies - - 0.0 0.0 - NMOther Securities 0.1 0.1 0.1 0.1 0.1 63%
Securities at HTM $11.3 $13.3 $13.9 $26.9 $16.1 71%Corporates 2.1 2.4 2.6 6.1 2.2 97%Prime and Non-U.S. MBS 3.5 4.7 4.8 8.0 4.2 83%Auction Rate Securities - 0.0 0.0 0.9 - -Alt-A mortgages 3.8 4.0 4.2 8.8 7.4 52%Government Agencies - - - - - NM
Note: Totals may not sum due to rounding. NM: Not meaningful. A i h SIV h b ll d h i di i
gOther Securities(1) 1.9 2.2 2.3 3.0 2.3 82%
Total Securities at AFS / HTM $17.1 $19.4 $22.1 $35.9 $22.2 77%
42
Assets in the SIVs have been allocated to their corresponding asset categories. (1) 3Q’11 includes assets previously held by SIVs ($1.7B of ABS, CDOs / CLOs and government bonds).

Citicorp – Drivers In Constant Dollars(1)
($B)($B)
3Q’11Asia RCB 3Q’11 2Q’11 1Q’11 4Q’10 3Q’10 YoY QoQCards Avg Loans 20.5 20.3 20.4 20.0 19.7 4% 1%Cards EOP Loans 20 0 19 9 19 4 20 1 19 0 5% 0%Cards EOP Loans 20.0 19.9 19.4 20.1 19.0 5% 0%RB Avg Loans 64.7 64.1 62.5 60.5 59.8 8% 1%RB EOP Loans 64.5 62.3 61.1 59.4 57.8 12% 3%
Real Estate Lending 33.6 32.6 31.9 30.8 29.9 12% 3%Commercial Markets 16.7 15.8 15.5 14.8 14.2 18% 6%Personal and Other 14.2 13.9 13.7 13.8 13.7 3% 2%
Average Deposits 110 9 111 3 109 9 108 1 107 1 4% (0%)Average Deposits 110.9 111.3 109.9 108.1 107.1 4% (0%)EOP Deposits 109.3 108.8 107.9 106.7 106.0 3% 0%Cards Purchase Sales 18.6 18.4 17.4 18.5 17.2 8% 1%RB Investment Sales 8.4 10.5 11.4 13.1 10.6 (21%) (20%)RB Investment AUMs 45.0 50.3 50.3 49.8 47.8 (6%) (10%)
3Q’11LATAM 3Q’11 2Q’11 1Q’11 4Q’10 3Q’10 YoY QoQCards Avg Loans 13.1 13.0 12.7 12.6 12.2 8% 1%Cards EOP Loans 12.9 12.3 12.0 12.3 11.7 11% 5%RB Avg Loans 21.9 21.2 19.9 19.2 18.8 16% 4%RB EOP L 22 0 20 4 19 4 18 4 18 0 22% 8%RB EOP Loans 22.0 20.4 19.4 18.4 18.0 22% 8%
Real Estate Lending 4.3 4.1 4.0 3.8 3.6 20% 5%Commercial Markets 10.9 10.2 9.6 9.5 9.1 19% 7%Personal and Other 6.8 6.1 5.7 5.2 5.3 29% 11%
Average Deposits 44.2 45.0 43.4 41.2 40.4 9% (2%)EOP Deposits 43.7 43.7 44.0 42.8 39.4 11% 0%
43Note:(1) Constant dollars based on September 30, 2011 foreign exchange rates.
Cards Purchase Sales 9.8 9.2 8.7 9.2 8.3 18% 6%RB Investment Sales 11.5 12.0 12.4 9.6 10.5 9% (4%)RB Investment AUMs 44.3 44.3 42.3 41.1 40.0 11% 0%
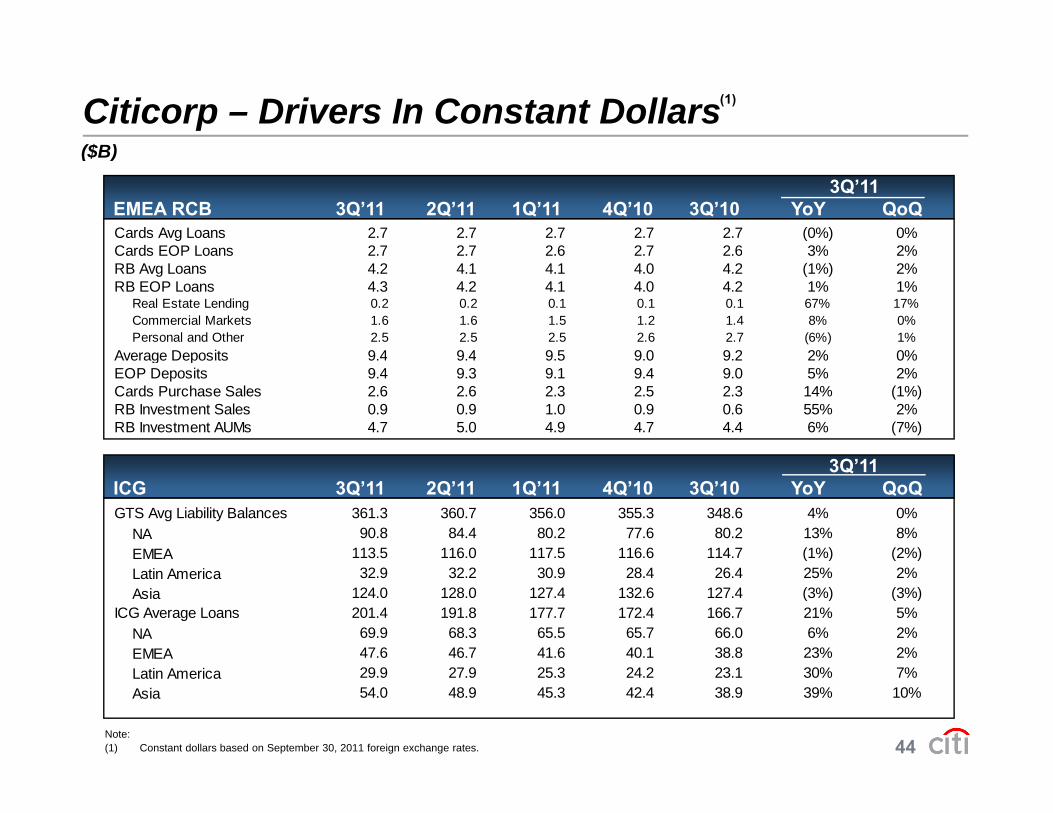
Citicorp – Drivers In Constant Dollars(1)
($B)($B)
3Q’11EMEA RCB 3Q’11 2Q’11 1Q’11 4Q’10 3Q’10 YoY QoQCards Avg Loans 2.7 2.7 2.7 2.7 2.7 (0%) 0%Cards EOP Loans 2 7 2 7 2 6 2 7 2 6 3% 2%Cards EOP Loans 2.7 2.7 2.6 2.7 2.6 3% 2%RB Avg Loans 4.2 4.1 4.1 4.0 4.2 (1%) 2%RB EOP Loans 4.3 4.2 4.1 4.0 4.2 1% 1%
Real Estate Lending 0.2 0.2 0.1 0.1 0.1 67% 17%Commercial Markets 1.6 1.6 1.5 1.2 1.4 8% 0%Personal and Other 2.5 2.5 2.5 2.6 2.7 (6%) 1%
Average Deposits 9 4 9 4 9 5 9 0 9 2 2% 0%Average Deposits 9.4 9.4 9.5 9.0 9.2 2% 0%EOP Deposits 9.4 9.3 9.1 9.4 9.0 5% 2%Cards Purchase Sales 2.6 2.6 2.3 2.5 2.3 14% (1%)RB Investment Sales 0.9 0.9 1.0 0.9 0.6 55% 2%RB Investment AUMs 4.7 5.0 4.9 4.7 4.4 6% (7%)
3Q’11ICG 3Q’11 2Q’11 1Q’11 4Q’10 3Q’10 YoY QoQGTS Avg Liability Balances 361.3 360.7 356.0 355.3 348.6 4% 0%
NA 90.8 84.4 80.2 77.6 80.2 13% 8%EMEA 113.5 116.0 117.5 116.6 114.7 (1%) (2%)( ) ( )Latin America 32.9 32.2 30.9 28.4 26.4 25% 2%Asia 124.0 128.0 127.4 132.6 127.4 (3%) (3%)
ICG Average Loans 201.4 191.8 177.7 172.4 166.7 21% 5%NA 69.9 68.3 65.5 65.7 66.0 6% 2%EMEA 47.6 46.7 41.6 40.1 38.8 23% 2%
44
Latin America 29.9 27.9 25.3 24.2 23.1 30% 7%Asia 54.0 48.9 45.3 42.4 38.9 39% 10%
Note:(1) Constant dollars based on September 30, 2011 foreign exchange rates.

Citigroup – Estimated FX Impact on Key P&L Metrics
Year-over-Year Impact ($B) 1Q’11 2Q’11 3Q’11 YTD’11
Revenues $0.3 $0.7 $0.4 $1.4
Expenses 0.2 0.5 0.3 1.0
C t f C dit 0 1 0 1 0 1 0 3Cost of Credit 0.1 0.1 0.1 0.3
Earnings Before Taxes $(0.0) $0.1 $0.1 $0.1
Note: Totals may not sum due to rounding.Note: Totals may not sum due to rounding.
45

Citigroup – 3Q’11 Country Risk Exposure Summary ($B)($B)
As of September 30, 2011 FranceUnfunded Commitments GIIPS & Belgium
(1)
S i $0 4 $1 4Sovereigns $0.4 $1.4Financial Institutions 0.4 4.2Corporations 8.4 12.4
Unfunded Commitments $9.2 $18.0
Note: Information based on Citi’s internal risk management measures.(1) Greece, Ireland, Italy, Portugal, and Spain.
46

Non-GAAP Financial MeasuresRECONCILIATION OF NON GAAP FINANCIAL MEASURESRECONCILIATION OF NON-GAAP FINANCIAL MEASURES
($ i illi t h t ) P li i($ in millions, except per share amounts) Preliminary9/30/2011
Citigroup's Total Stockholders' Equity $177,372 Less: Preferred Stock 312Common Stockholders' Equity 177,060Less: Goodwill 25,496 Intangible Assets (other than Mortgage Servicing Rights) 6,800 Net Deferred Tax Assets Related to Goodwill and Intangible Assets 47Tangible Common Equity (TCE) $144,717
Common Shares Outstanding at Quarter-end 2,923.7
Tangible Book Value Per Share $ 49.50 (Tangible Common Equity / Common Shares Outstanding)
47

Certain statements in this document are “forward-looking statements”
within the meaning of the rules and regulations of the U S Securities andwithin the meaning of the rules and regulations of the U.S. Securities and
Exchange Commission. These statements are based on management’s
current expectations and are subject to uncertainty and changes incurrent expectations and are subject to uncertainty and changes in
circumstances. Actual results and capital and other financial condition
diff t i ll f th i l d d i th t t t d tmay differ materially from those included in these statements due to a
variety of factors, including the precautionary statements included in this
C ’ f Sdocument and those contained in Citigroup’s filings with the U.S.
Securities and Exchange Commission, including without limitation the
48
“Risk Factors” section of Citigroup’s 2010 Form 10-K.


![1420790(E) - UNECE · Web viewD 4,640 kg 231 03.1-06 1 kmol ideal gas = 24 m3 at 1 bar and 25 C, quantity of substance = M *mass [kg]1 kmol ideal gas = M kg = 24 m3 at 1 bar and 15](https://img.pdfslide.us/doc/110x75/60fa7d554dcc8d42f0657eb2/1420790e-unece-web-view-d-4640-kg-231-031-06-1-kmol-ideal-gas-24-m3-at-1.jpg)