Embed Size (px)
Citation preview

May 2nd, 2013
Doha, Qatar
Q1 2013 Financials Conference Call
1
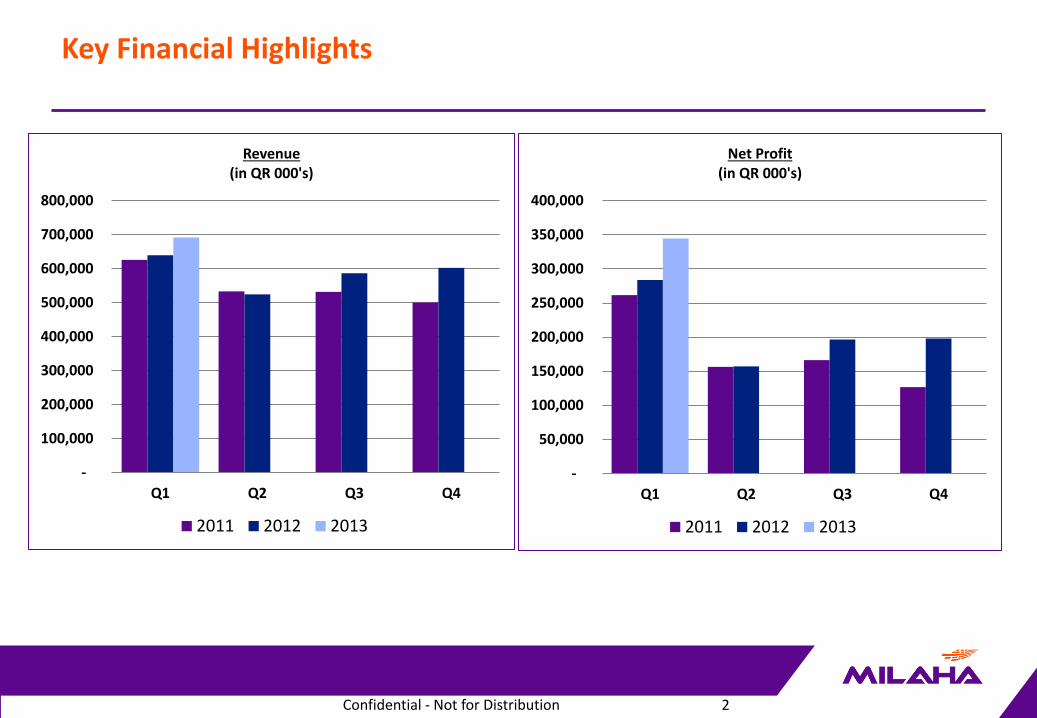
Key Financial Highlights
Confidential - Not for Distribution 2
-
100,000
200,000
300,000
400,000
500,000
600,000
700,000
800,000
Q1 Q2 Q3 Q4
Revenue (in QR 000's)
2011 2012 2013
-
50,000
100,000
150,000
200,000
250,000
300,000
350,000
400,000
Q1 Q2 Q3 Q4
Net Profit (in QR 000's)
2011 2012 2013

Q1 2013 vs Q1 2012 - Comparison (All amounts in QR 000’s, unless otherwise noted)
3
Revenue Up +9%
Operating Profit Up +22%
Net Profit Up +21%
2013 2012 Variance
OPERATING REVENUE 691,605 631,614 59,991
Salaries, Wages & Benefits (153,726) (128,783) (24,943)
Operating Supplies & Expenses (145,535) (161,642) 16,107
Rent Expense (15,186) (14,280) (906)
Depreciation & Amortization (58,706) (63,052) 4,346
Other Operating Expenses (35,674) (31,441) (4,233)
OPERATING EXPENSES (408,827) (399,198) (9,629)
OPERATING PROFIT 282,778 232,416 50,362
Finance Costs (8,487) (6,852) (1,635)
Finance Income 13,433 11,545 1,888
Profit on disposal of Property,
Vessels & Equip 4,544 10 4,534
Share Results of Associates 51,429 46,789 4,640
Misc Income 318 3,211 (2,893)
Impairment of AFS Investments (206) (4,073) 3,867
NON-OPERATING INCOME/(EXPENSE) 61,031 50,630 10,401
NET INCOME 343,809 283,046 60,763
Non-Controlling Interest 776 702 74
PROFIT FOR THE PERIOD 344,585 283,748 60,837

Milaha Maritime & Logistics • Port Services • Container Shipping • Logistics • Bulk Shipping • Asset Management • Shipyard • Shipping Agencies
Milaha Offshore • Halul Offshore Services
Milaha Gas & Petrochem • 30% Share of Nakilat • Qatar Shipping (maritime
activities only)
Milaha Trading • Travel & Tourism • Equipment Trading Agency • Marine Equipment Sales & Service • Bunker Sales • Service/Repair Center
Milaha Capital • Equities Portfolio • Real Estate Investments • 50% Share of Qatar Quarries
Pillar Overview
4

Consolidated Statement of Income, by Pillar – Q1 2013 (All amounts in QR 000’s, unless otherwise noted)
5
Maritime &
Logistics Offshore
Gas &
Petrochem Trading Capital Corporate
Eliminations/
Adjustments Consolidated
Operating Revenue 216,034 132,196 42,671 74,656 282,168 - (56,120) 691,605
Salaries, Wages and Benefits (54,127) (45,244) (11,765) (4,056) (3,880) (35,745) 1,092 (153,726)
Operating Supplies and Expenses (82,569) (20,946) (6,308) (62,248) (28,014) (1,190) 55,740 (145,535)
Rent Expenses (368) (1,667) (153) (300) (12,010) (2,985) 2,297 (15,186)
Depreciation and Amortisation (15,937) (18,842) (15,254) (249) (7,883) (542) - (58,706)
Other Operating Expenses (16,166) (8,088) (1,739) (791) (4,322) (1,560) (3,009) (35,675)
OPERATING PROFIT 46,866 37,409 7,452 7,013 226,060 (42,022) 0 282,777
Finance Costs (1,722) (1,452) (1,013) - (4,300) - - (8,487)
Finance Income 3 - 5,619 2 7,809 - - 13,433
Gain on Disposal of Property, Vessels and
Equipment 4,518 26 - - - - - 4,544
Share of Results of Associates - - 51,022 - 407 - - 51,429
Miscellaneous Income - 49 - - 268 - - 318
Impairment of Available-for-Sale Investments - - - - (206) - - (206)
Expense Allocation from Milaha Corporate (22,887) (6,652) (5,256) (3,440) (3,787) 42,022 - (0)
PROFIT FOR THE PERIOD 26,778 29,380 57,824 3,575 226,250 - 0 343,807
Non-controlling interest 776 776
NET PROFIT ATTRIBUTABLE TO SHAREHOLDERS 26,778 29,380 57,824 3,575 227,026 - 0 344,583

Consolidated Statement of Income, by Pillar – Q1 2012 (All amounts in QR 000’s, unless otherwise noted)
6
Maritime &
Logistics Offshore
Gas &
Petrochem Trading Capital Corporate
Eliminations/
Adjustments Consolidated
Operating Revenue 180,547 122,968 43,798 86,162 280,518 - (82,379) 631,614
Salaries, Wages and Benefits (46,491) (41,287) (15,009) (2,970) (3,897) (19,130) - (128,783)
Operating Supplies and Expenses (63,308) (25,233) (24,473) (77,492) (47,180) (857) 76,901 (161,642)
Rent Expenses (1,535) (1,820) (863) (350) (12,078) (3,112) 5,478 (14,280)
Depreciation and Amortisation (17,708) (18,328) (14,594) (290) (11,515) (617) - (63,052)
Other Operating Expenses (16,702) (7,997) (1,526) (559) (2,415) (2,243) - (31,442)
OPERATING PROFIT 34,803 28,303 (12,666) 4,502 203,433 (25,959) 0 232,416
Finance Costs (2,746) (1,027) (116) (27) (2,937) - - (6,852)
Finance Income - 760 6,992 - 3,795 - - 11,547
Gain on Disposal of Property, Vessels and
Equipment - - - - 10 - - 10
Share of Results of Associates (58) - 46,848 - (0) - - 46,789
Miscellaneous Income 872 204 (35) 1,395 775 - - 3,211
Impairment of Available-for-Sale Investments - - - - (4,073) - - (4,073)
Expense Allocation from Milaha Corporate (16,275) (2,909) (2,640) (1,996) (2,139) 25,959 - 0
PROFIT FOR THE PERIOD 16,596 25,332 38,382 3,873 198,864 0 0 283,048
Non-controlling interest - - - - 702 - - 702
NET PROFIT ATTRIBUTABLE TO SHAREHOLDERS 16,596 25,332 38,382 3,873 199,566 0 0 283,749

20% Revenue Growth and 61% Net Profit Growth vs. Q1 2012
o Driven largely by port services and container shipping activities
o Ports: o Strong volume growth o Significant focus on efficiency and process improvement initiatives (hand-in-hand with
Mwani) in Doha Port
o Increase in Container Shipping revenues, driven by: o growth in container shipping volumes o better management & utilization of our NVOCC assets
o Better utilization of Logistics’ assets, including selling under-utilized & aged equipment
Pillar Performance
7

8% Growth in Revenues and 16% Growth in Net Profit vs. Q1 2012
o One new vessel in the fleet
o One-time operational issues from Q1 2012 rectified; 2 vessels that were off-hire in Q1 2012 now deployed profitably
Pillar Performance
3% Decline in Revenues and 51% Growth in Net Profit vs. Q1 2012
o Weaker rates for 2 tankers operating in a pool in the crude trade
o Weak VLGC rates in Q1 2013
o Improved rates for gas tankers (handy) relative to Q1 2012
o QR 15.5M 1st Qtr 2012 adjustment for prior period dry docking did not recur, so this drove most of Op Profit Growth
o Increased profit for LNG JVs due to one-time costs in Q1 2012 that did not recur
8

13% Decline in Revenues and 8% Decline in Net Profit vs. Q1 2012
o Increased equipment & marine sales tied in large part to infrastructure development in Qatar
o Bunker revenues declined, but so did associated Cost of Goods Sold; margins are razor thin so little impact on bottom line
Pillar Performance
1% Growth in Revenues and 14% Growth in Net Profit vs. Q1 2012
o Q1 2012 had QR 73M benefit from liquidation of 1 fund, which did not recur. o Q1 2013 had similar liquidation
amounting to QR 30M profit
o Dividend growth substantial
o Profit from market trades & revaluations grew
o Qatar Quarries Revenue dropped QR 19M; associated drop can be seen in Cost of Goods Sold
9

Overall outlook for the pillar is positive as infrastructure projects take off
Port and container volumes showing upward trend, although expect the ride to be bumpy
Increased trade volumes expected to have trickle-down effect on other activities such as shipping agency, logistics and shipyard
Significant emphasis on operational efficiency and yield management initiatives across the pillar:
Process excellence at Doha Port
Yield management in logistics
Customer initiatives for shipyard
Outlook for Q2-Q4 2013
10
Expected to perform better in 2013 as operational issues from 2012 have mostly been rectified
Will assume delivery of 2 Anchor Handling Tug Supply Vessels (DP2) in Q2/3 timeframe; actively pursuing tenders
Will continue to invest in strategic fleet expansion and/or study M&A opportunities / new markets
Outlook for Q2-Q4 2013
Cautiously optimistic about rates for Medium Range (MR) and Handy vessels
4 vessels coming off charter or being removed from pools in Q2 and Q3
Weakness in crude tanker rates expected to continue
New ship building prices are enticing; management closely monitoring for opportunities
11

Expected moderate growth, particularly in trucks and heavy equipment sales, which is tied to infrastructure growth
Outlook for Q2-Q4 2013
Expect investment portfolio to benefit from robust economy
Some major IPOs in Qatar on the horizon
We will continue real estate development projects in pipeline in a carefully phased manner
12