Embed Size (px)
Citation preview
Innovations for Greenhouse Gas
Reductions
-Life Cycle Analysis of Chemical Products
in Japan and around the World-
carbon-Life Cycle Analysis (cLCA)
Third Edition - Summary
March 2014
Japan Chemical Industry Association (general incorporated association)
Table of Contents
Introduction ........................................................................................................................................... 1
Executive summary ............................................................................................................................... 3
1. Overview and conclusions ............................................................................................................. 3
1-1 ICCA Report (July 2009) ....................................................................................................... 3
1-2 Japan Chemical Industry Association (JCIA) Report (July 2011) .......................................... 3
1-3 JCIA Guidelines (February 2012) .......................................................................................... 4
1-4 Second edition of the JCIA Report (October 2012) ............................................................... 4
1-5 JCIA Guidelines (October 2013) ............................................................................................ 5
1-6 Third edition of the JCIA Report (March 2014) ..................................................................... 7
1.7 Conclusion ............................................................................................................................ 7
2. The chemical industry in Japan ..................................................................................................... 7
3. Concept of cLCA (extracted from the ICCA Report) .................................................................... 8
4. Summary of the examples of assessment of products to be manufactured in Japan in 2020 ........ 9
5. Summary of the examples of assessment in the world concerning products that are
expected to be manufactured in 2020 .......................................................................................... 14
1. About the chemical industry ........................................................................................................ 15
1.1 Features of the chemical industry ......................................................................................... 15
1.2 Features of the chemical industry in Japan (overview as of 2011) ....................................... 15
1.3 Approach taken by the chemical industry in Japan concerning the prevention of
global warming ..................................................................................................................... 16
2. Concerning cLCA (carbon Life Cycle Analysis) ......................................................................... 24
2.1 Concept of cLCA (carbon Life Cycle Analysis) .......................................................................... 24
2.2 cLCA Report of ICCA .......................................................................................................... 25
1
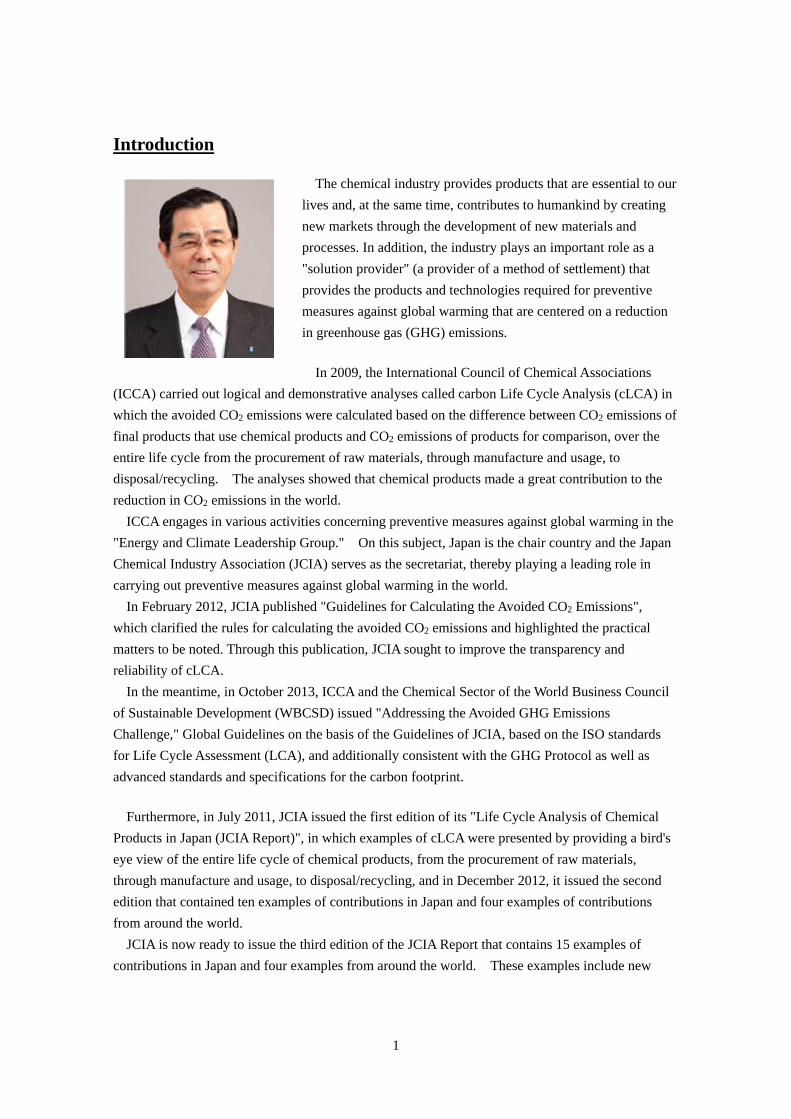
Introduction
The chemical industry provides products that are essential to our
lives and, at the same time, contributes to humankind by creating
new markets through the development of new materials and
processes. In addition, the industry plays an important role as a
"solution provider" (a provider of a method of settlement) that
provides the products and technologies required for preventive
measures against global warming that are centered on a reduction
in greenhouse gas (GHG) emissions.
In 2009, the International Council of Chemical Associations
(ICCA) carried out logical and demonstrative analyses called carbon Life Cycle Analysis (cLCA) in
which the avoided CO2 emissions were calculated based on the difference between CO2 emissions of
final products that use chemical products and CO2 emissions of products for comparison, over the
entire life cycle from the procurement of raw materials, through manufacture and usage, to
disposal/recycling. The analyses showed that chemical products made a great contribution to the
reduction in CO2 emissions in the world.
ICCA engages in various activities concerning preventive measures against global warming in the
"Energy and Climate Leadership Group." On this subject, Japan is the chair country and the Japan
Chemical Industry Association (JCIA) serves as the secretariat, thereby playing a leading role in
carrying out preventive measures against global warming in the world.
In February 2012, JCIA published "Guidelines for Calculating the Avoided CO2 Emissions",
which clarified the rules for calculating the avoided CO2 emissions and highlighted the practical
matters to be noted. Through this publication, JCIA sought to improve the transparency and
reliability of cLCA.
In the meantime, in October 2013, ICCA and the Chemical Sector of the World Business Council
of Sustainable Development (WBCSD) issued "Addressing the Avoided GHG Emissions
Challenge," Global Guidelines on the basis of the Guidelines of JCIA, based on the ISO standards
for Life Cycle Assessment (LCA), and additionally consistent with the GHG Protocol as well as
advanced standards and specifications for the carbon footprint.
Furthermore, in July 2011, JCIA issued the first edition of its "Life Cycle Analysis of Chemical
Products in Japan (JCIA Report)", in which examples of cLCA were presented by providing a bird's
eye view of the entire life cycle of chemical products, from the procurement of raw materials,
through manufacture and usage, to disposal/recycling, and in December 2012, it issued the second
edition that contained ten examples of contributions in Japan and four examples of contributions
from around the world.
JCIA is now ready to issue the third edition of the JCIA Report that contains 15 examples of
contributions in Japan and four examples from around the world. These examples include new
2
examples in addition to the examples included in the second edition of the report that have been
re-evaluated according to the Global Guidelines.
It is our hope that this report and the range of JCIA initiatives concerning the problem of global
warming will lead to a renewed understanding that the chemical industry is a "solution provider" that
contributes to society through the reduction in CO2 emissions and that it is important to strive for a
real reduction in CO2 emissions as a preventive measure against global warming by understanding
the state of CO2 emissions through a product's life cycle.
March 2014 Kyohei Takahashi, Chairperson, Japan Chemical Industry Association
3
Fig. 1. ICCA Report
Fig. 2. JCIA Report
Executive summary
1. Overview and conclusions The Japan Chemical Industry Association has been soliciting parties engaged in discussions
related to GHG1 emissions from products and technologies to understand the importance of
evaluating GHG emissions in the life cycle of chemical products.
This report is the third edition following "Life Cycle Analysis of Chemical Products in Japan -
carbon Life Cycle Analysis (cLCA)" issued in 2011 and "Life Cycle Analysis of Chemical Products in
Japan and around the World - carbon Life Cycle Analysis (cLCA)" issued in 2012, and addresses
reduction in GHG emissions. Sections 1-1, 1-2, 1-3 and 1-4 describe the main points of the products
of the chemical industry that were published before, while Section 1-5 outlines newly issued products,
and 1-6 outlines the revisions made. The remainder of the report summarizes the conclusions.
1-1 ICCA Report (July 2009)
The chemical industry (which includes plastic and rubber, but does
not include metal, glass or cement)2contributes to the reduction of
GHG emissions in other industries and throughout society as a whole
through the use of products. From this viewpoint, ICCA
(International Council of Chemical Association) prepared a cLCA
report by investigating the GHG emissions from chemical products in
the world in their life cycle, with a perspective that provides a bird's
eye view of the entire life cycle from the procurement of raw
materials, through manufacture and usage, to disposal. The report
makes comparisons of the GHG emissions from chemical products in
specific applications with those produced through the second-best alternative measures that are
employed in industries other than the chemical industry.
1-2 Japan Chemical Industry Association (JCIA) Report
(July 2011)
The first edition issued by JCIA in July 2011 evaluated the
avoided CO2 emissions when the products that were expected to be
manufactured during the one year under assessment would have
been used until the end of their life. The year 2020 was taken as
the year under assessment. Nine examples were analyzed
1 Greenhouse Gases: Six types of gases, i.e. carbon dioxide (CO2), methane (CH4), nitrous oxide (N2O = dinitrogen
monoxide), hydrofluorocarbons (HFCs), perfluorocarbons (PFCs) and sulfur hexafluoride (SF6). 2 Website of the Ministry of Economy, Trade and Industry, "Statistical Investigation of Industries, Material Related to
Classification, Industrial Classification Code File" http://www.meti.go.jp/statistics/tyo/kougyo/result-4.html#menu08 In the Subsection of Industrial Classification (2
digits), 16, 18 and 19 are being considered.
4
Fig. 3. JCIA Guidelines
Fig. 4. JCIA Report Second Edition
quantitatively in the fields of renewable energy and energy saving, concerning the avoided CO2
emissions throughout society resulting from the use of specific chemical products in Japan. The
report compares the emissions of finished products that incorporate chemical products over their life
cycle with the emissions of finished products that incorporate the products for comparison over their
life cycle. As a result of these analyses, it has been made clear that the chemical products described
in the report are key materials that contribute to the reduction of CO2 emissions by about 110 million
tons on a finished-product basis.
Note that, as stated in the "Guidelines for Calculating the Avoided CO2 emissions" issued by JCIA
(described later), no allocation was made for the degree of contribution to the emission abatement.
The details of the description are given below.
“If a certain product being evaluated achieved a reduction in CO2 emissions, it is rare that the effect
is solely due to the individual product. In almost all cases, multiple constituent elements contribute
to the effect. In such cases, if the degree of contribution according to that for each constituent
element can be obtained, then it can be expected that the effect of solicitation will be increased as the
avoided CO2 emissions by chemical products and technologies. However, no technique for the
objective and reasonable calculation of the degree of contribution has been established and it is
difficult to obtain the degree of contribution. For these reasons, no technique for calculating the
degree of contribution has been defined.”
1-3 JCIA Guidelines (February 2012)
After the issuance of the first edition, JCIA devised the
"Guidelines for Calculating the Avoided CO2 Emissions" to
ensure transparency and reliability of cLCA. The guidelines
were issued as a booklet in February 2012.
The guidelines were prepared with a view to [1] presenting
consistent criteria for the method of calculating the avoided CO2
emissions by the chemical industry by means of the cLCA
technique, thereby identifying and organizing the practical matters
to be noted; and [2] preventing any irregularities in the results as
caused by differences in technique or the method of calculation,
thereby increasing the transparency and reliability of cLCA.
1-4 Second edition of the JCIA Report (October 2012)
Based on the guidelines devised in February 2012, it was
recently decided that the second edition would be issued, in
which more examples are presented by conducting
assessments on ten examples of contribution to the reduction
in greenhouse gases in Japan and four examples from around
the world by [1] revising the results of assessment using
cLCA for the examples given in the first edition and [2] by
including new examples.
5
Fig. 5. Global Guidelines
(Details of the revisions)
[1] Review of numerical values for calculation by means of continued investigation into sources
As a result of continued investigations into the sources, the numerical values for motor
efficiency and the service lives of the products have been reviewed and re-evaluated with
regard to the examples of Hall effect devices and Hall effect ICs.
[2] Inclusion of new examples
Japan: Materials for fuel-efficient tires; materials for high-durability apartments
World: Automotive materials (carbon fiber); materials for aircraft (carbon fiber); materials
for air conditioners (Hall effect devices; Hall effect ICs)
1-5 JCIA Guidelines (October 2013)
ICCA and the Chemical Sector of the World Business
Council for Sustainable Development (WBCSD) devised "Main
title: Addressing the Avoided GHG Emissions Challenge;
Subtitle: Guidelines from the chemical industry for accounting
for and reporting greenhouse gas (GHG) emissions avoided
along the value chain based on comparative studies," Global
Guidelines prepared on the basis of the "Guidelines for
Calculating the Avoided CO2 Emissions" devised by JCIA, and
issued the guidelines in October 2013. The guidelines are the
first international guidelines for calculating avoided GHG
emissions enabled by chemical products.
The Global Guidelines provide guidelines for calculating avoided GHG emissions enabled by
chemical products, by comparing two products with the same user benefit. The guidelines also
give guidance on how to communicate the results.
Relationship to existing standards and guidelines
The Global Guidelines build on internationally accepted requirements and guidelines (found in the
ISO 14040 (1) and ISO 14044 (2) related to LCA) and are inspired by the "Guideline for Calculating
the Avoided CO2 Emission (2012)" devised by JCIA. In addition, the guidelines aim to be
consistent with leading standards and specifications for the product carbon footprint (including the
GHG Protocol "Product Life Cycle Accounting and Reporting Standard (2011)," "PAS2050 (2011),"
and ISO/TS 14067 (2013). The guidelines provide a step-by-step procedure to estimate the
differences in GHG emissions between products. They focus on common challenges of LCA
practitioners (people and organizations carrying out studies) in the chemical industry. In particular,
they take into account the upstream position of chemical products in the value chain and provide a
way to reliably quantify the effect a chemical product can have on environmental impacts of
downstream activities. Accordingly, the guidelines go beyond existing standards. Table 1 gives
an overview of the extra guidelines provided in the guidelines compared to ISO 14040/44.
The guidelines have been devised for all chemical companies worldwide and for their stakeholders.
Companies that seek to measure, manage and communicate the avoided GHG emissions of their
6
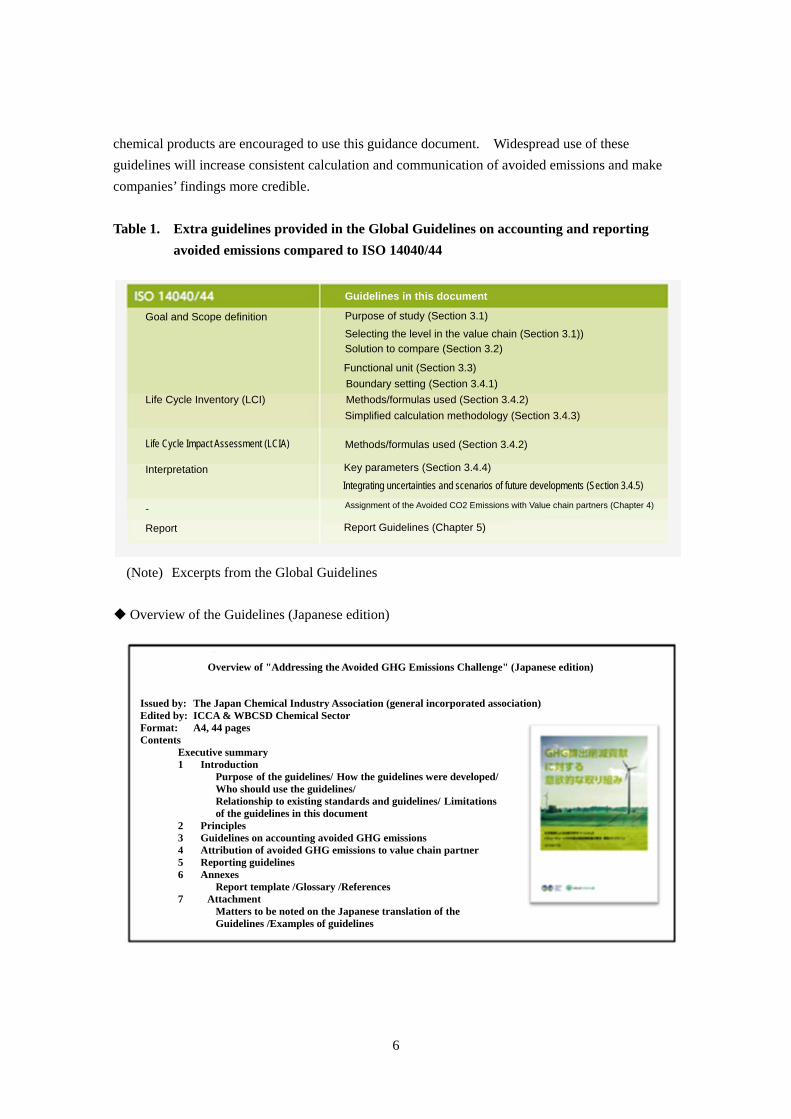
chemical products are encouraged to use this guidance document. Widespread use of these
guidelines will increase consistent calculation and communication of avoided emissions and make
companies’ findings more credible.
Table 1. Extra guidelines provided in the Global Guidelines on accounting and reporting
avoided emissions compared to ISO 14040/44
(Note) Excerpts from the Global Guidelines
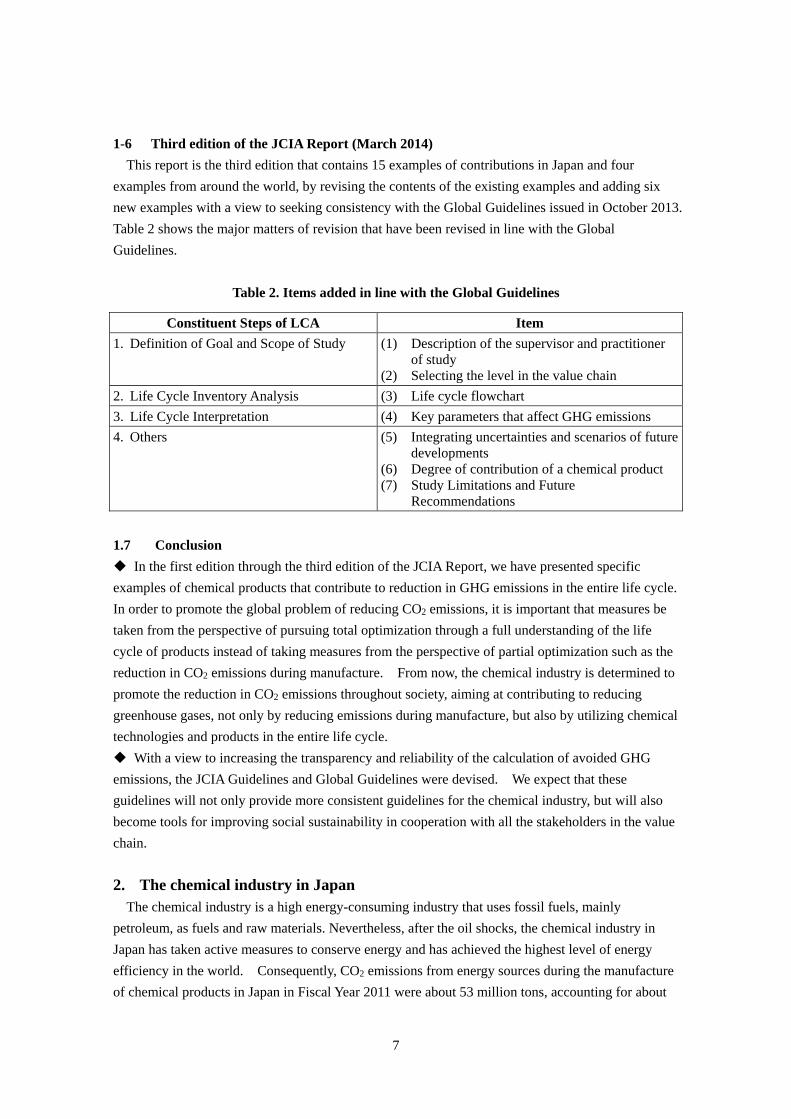
Overview of the Guidelines (Japanese edition)
Overview of "Addressing the Avoided GHG Emissions Challenge" (Japanese edition)
Issued by: The Japan Chemical Industry Association (general incorporated association) Edited by: ICCA & WBCSD Chemical Sector Format: A4, 44 pages Contents
Executive summary 1 Introduction
Purpose of the guidelines/ How the guidelines were developed/ Who should use the guidelines/ Relationship to existing standards and guidelines/ Limitations of the guidelines in this document
2 Principles 3 Guidelines on accounting avoided GHG emissions 4 Attribution of avoided GHG emissions to value chain partner 5 Reporting guidelines 6 Annexes
Report template /Glossary /References 7 Attachment
Matters to be noted on the Japanese translation of the Guidelines /Examples of guidelines
Guidelines in this document
Purpose of study (Section 3.1)
Selecting the level in the value chain (Section 3.1))
Solution to compare (Section 3.2)
Functional unit (Section 3.3)
Boundary setting (Section 3.4.1)
Methods/formulas used (Section 3.4.2)
Simplified calculation methodology (Section 3.4.3)
Methods/formulas used (Section 3.4.2)
Key parameters (Section 3.4.4)
Integrating uncertainties and scenarios of future developments (Section 3.4.5)
Assignment of the Avoided CO2 Emissions with Value chain partners (Chapter 4)
Report Guidelines (Chapter 5)
Goal and Scope definition
Life Cycle Inventory (LCI)
Life Cycle Impact Assessment (LCIA)
Interpretation
Report
-
7
1-6 Third edition of the JCIA Report (March 2014)
This report is the third edition that contains 15 examples of contributions in Japan and four
examples from around the world, by revising the contents of the existing examples and adding six
new examples with a view to seeking consistency with the Global Guidelines issued in October 2013.
Table 2 shows the major matters of revision that have been revised in line with the Global
Guidelines.
Table 2. Items added in line with the Global Guidelines
Constituent Steps of LCA Item
1. Definition of Goal and Scope of Study (1) Description of the supervisor and practitioner of study
(2) Selecting the level in the value chain
2. Life Cycle Inventory Analysis (3) Life cycle flowchart
3. Life Cycle Interpretation (4) Key parameters that affect GHG emissions
4. Others (5) Integrating uncertainties and scenarios of future developments
(6) Degree of contribution of a chemical product (7) Study Limitations and Future
Recommendations
1.7 Conclusion
In the first edition through the third edition of the JCIA Report, we have presented specific
examples of chemical products that contribute to reduction in GHG emissions in the entire life cycle.
In order to promote the global problem of reducing CO2 emissions, it is important that measures be
taken from the perspective of pursuing total optimization through a full understanding of the life
cycle of products instead of taking measures from the perspective of partial optimization such as the
reduction in CO2 emissions during manufacture. From now, the chemical industry is determined to
promote the reduction in CO2 emissions throughout society, aiming at contributing to reducing
greenhouse gases, not only by reducing emissions during manufacture, but also by utilizing chemical
technologies and products in the entire life cycle.
With a view to increasing the transparency and reliability of the calculation of avoided GHG
emissions, the JCIA Guidelines and Global Guidelines were devised. We expect that these
guidelines will not only provide more consistent guidelines for the chemical industry, but will also
become tools for improving social sustainability in cooperation with all the stakeholders in the value
chain.
2. The chemical industry in Japan The chemical industry is a high energy-consuming industry that uses fossil fuels, mainly
petroleum, as fuels and raw materials. Nevertheless, after the oil shocks, the chemical industry in
Japan has taken active measures to conserve energy and has achieved the highest level of energy
efficiency in the world. Consequently, CO2 emissions from energy sources during the manufacture
of chemical products in Japan in Fiscal Year 2011 were about 53 million tons, accounting for about
8
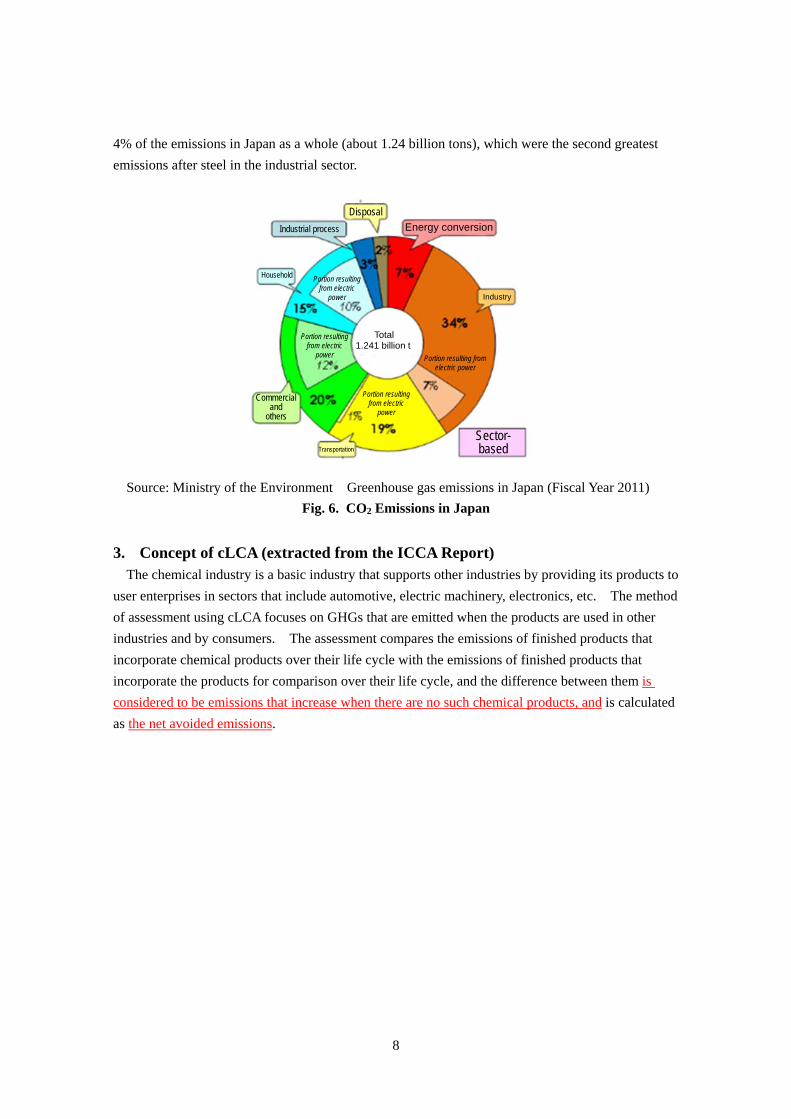
4% of the emissions in Japan as a whole (about 1.24 billion tons), which were the second greatest
emissions after steel in the industrial sector.
Source: Ministry of the Environment Greenhouse gas emissions in Japan (Fiscal Year 2011)
Fig. 6. CO2 Emissions in Japan
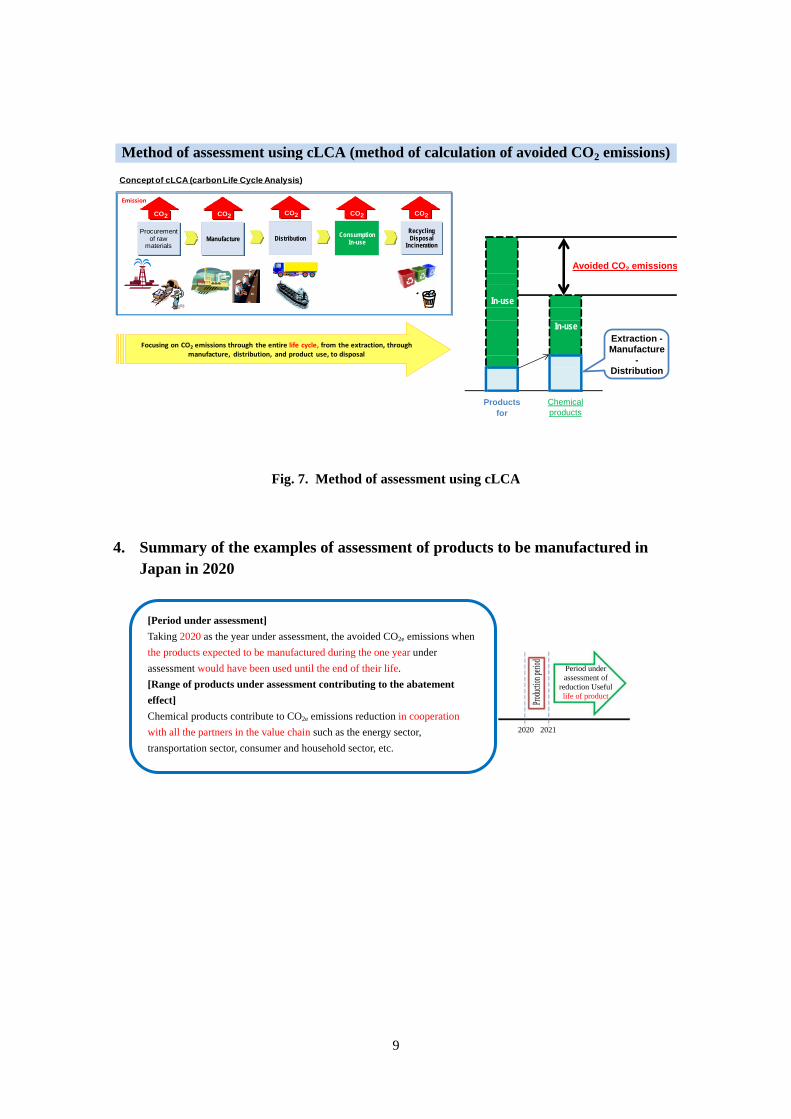
3. Concept of cLCA (extracted from the ICCA Report) The chemical industry is a basic industry that supports other industries by providing its products to
user enterprises in sectors that include automotive, electric machinery, electronics, etc. The method
of assessment using cLCA focuses on GHGs that are emitted when the products are used in other
industries and by consumers. The assessment compares the emissions of finished products that
incorporate chemical products over their life cycle with the emissions of finished products that
incorporate the products for comparison over their life cycle, and the difference between them is
considered to be emissions that increase when there are no such chemical products, and is calculated
as the net avoided emissions.
Portion resulting from electric power
Industrial process
Disposal Energy conversion
Household
Industry
Transportation
Sector- based
Portion resultingfrom electric
power
Portion resulting from electric
power
Portion resulting from electric
power
Commercial and
others
Total 1.241 billion t
9
Avoided CO2 emissions
Method of assessment using cLCA (method of calculation of avoided CO2 emissions)
In-use
In-use
Productsfor
Chemicalproducts
Extraction -Manufacture
-Distribution
Fig. 7. Method of assessment using cLCA
4. Summary of the examples of assessment of products to be manufactured in Japan in 2020
[Period under assessment]
Taking 2020 as the year under assessment, the avoided CO2e emissions when
the products expected to be manufactured during the one year under
assessment would have been used until the end of their life.
[Range of products under assessment contributing to the abatement
effect]
Chemical products contribute to CO2e emissions reduction in cooperation
with all the partners in the value chain such as the energy sector,
transportation sector, consumer and household sector, etc.
Produ
ction
perio
d
Period under assessment of
reduction Useful life of product
2020 2021
CO2
CO2Emission
Procurement of raw
materials
Recycling Disposal
IncinerationDistributionManufacture
Consumption In-use
CO2CO2 CO2CO2CO2
Focusing on CO2 emissions through the entire life cycle, from the extraction, through manufacture, distribution, and product use, to disposal
Concept of cLCA (carbon Life Cycle Analysis)
10
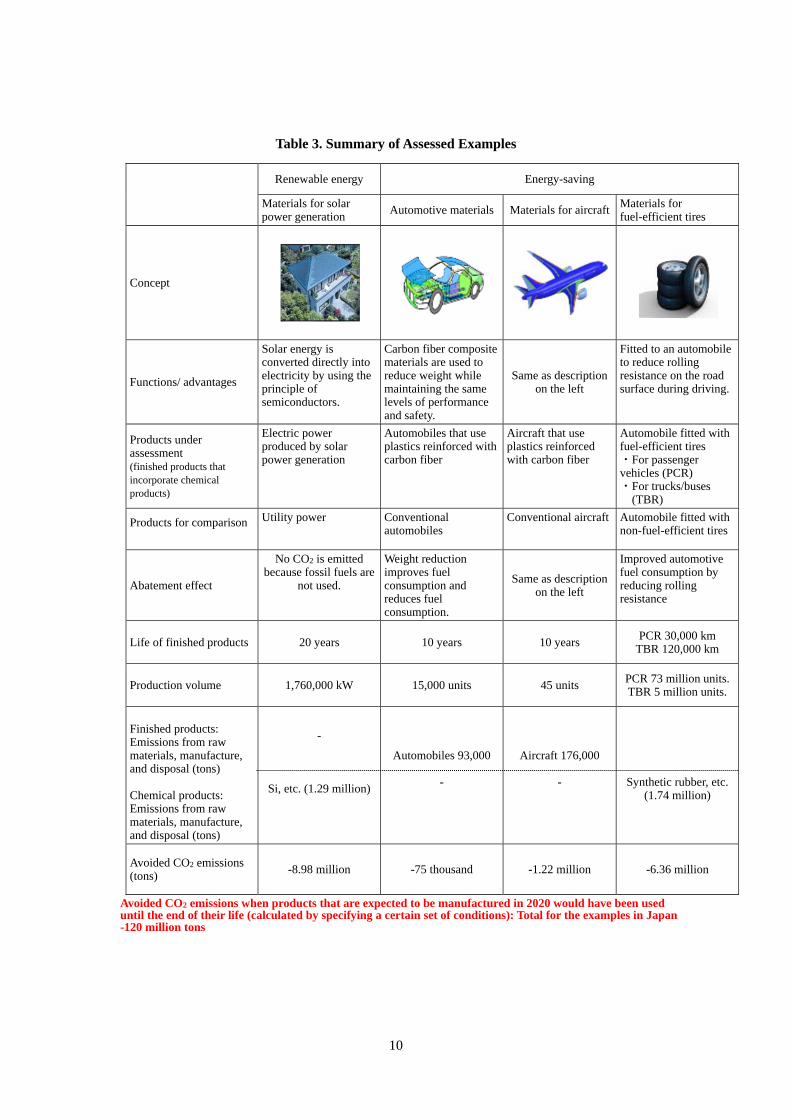
Table 3. Summary of Assessed Examples
Renewable energy Energy-saving
Materials for solar power generation
Automotive materials Materials for aircraft Materials for fuel-efficient tires
Concept
Functions/ advantages
Solar energy is converted directly into electricity by using the principle of semiconductors.
Carbon fiber composite materials are used to reduce weight while maintaining the same levels of performance and safety.
Same as description on the left
Fitted to an automobile to reduce rolling resistance on the road surface during driving.
Products under assessment (finished products that incorporate chemical products)
Electric power produced by solar power generation
Automobiles that use plastics reinforced with carbon fiber
Aircraft that use plastics reinforced with carbon fiber
Automobile fitted with fuel-efficient tires ・For passenger vehicles (PCR) ・For trucks/buses
(TBR)
Products for comparison
Utility power Conventional automobiles
Conventional aircraft Automobile fitted with non-fuel-efficient tires
Abatement effect
No CO2 is emitted because fossil fuels are
not used.
Weight reduction improves fuel consumption and reduces fuel consumption.
Same as description on the left
Improved automotive fuel consumption by reducing rolling resistance
Life of finished products 20 years 10 years 10 years PCR 30,000 km
TBR 120,000 km
Production volume 1,760,000 kW 15,000 units 45 units PCR 73 million units.TBR 5 million units.
Finished products: Emissions from raw materials, manufacture, and disposal (tons) Chemical products: Emissions from raw materials, manufacture, and disposal (tons)
-
Si, etc. (1.29 million)
Automobiles 93,000 -
Aircraft 176,000 -
Synthetic rubber, etc.(1.74 million)
Avoided CO2 emissions (tons) -8.98 million -75 thousand -1.22 million -6.36 million
Avoided CO2 emissions when products that are expected to be manufactured in 2020 would have been used until the end of their life (calculated by specifying a certain set of conditions): Total for the examples in Japan -120 million tons
11
1) Reference: CO2 emissions in Japan in Fiscal Year 2009 1.15 billion tons (Fig. 6)
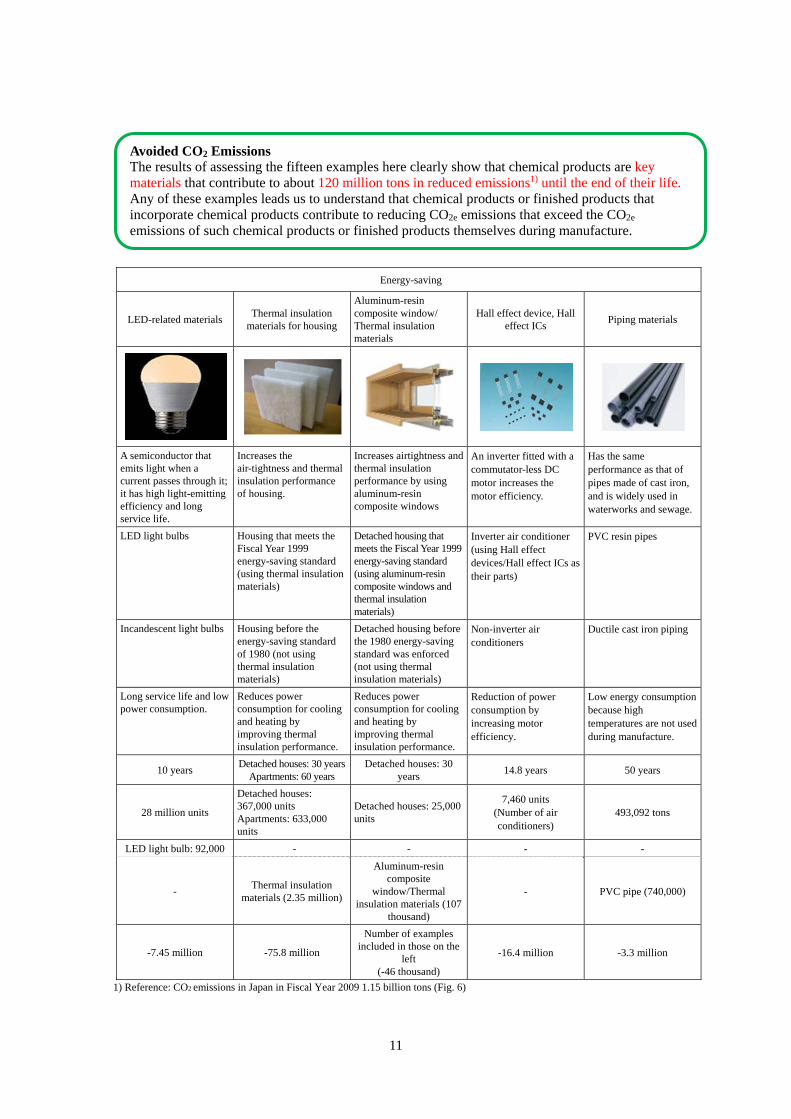
Energy-saving
LED-related materials Thermal insulation
materials for housing
Aluminum-resin composite window/ Thermal insulation materials
Hall effect device, Hall effect ICs
Piping materials
A semiconductor that emits light when a current passes through it; it has high light-emitting efficiency and long service life.
Increases the air-tightness and thermal insulation performance of housing.
Increases airtightness and thermal insulation performance by using aluminum-resin composite windows
An inverter fitted with a commutator-less DC motor increases the motor efficiency.
Has the same performance as that of pipes made of cast iron, and is widely used in waterworks and sewage.
LED light bulbs Housing that meets the Fiscal Year 1999 energy-saving standard (using thermal insulation materials)
Detached housing that meets the Fiscal Year 1999 energy-saving standard (using aluminum-resin composite windows and thermal insulation materials)
Inverter air conditioner (using Hall effect devices/Hall effect ICs as their parts)
PVC resin pipes
Incandescent light bulbs
Housing before the energy-saving standard of 1980 (not using thermal insulation materials)
Detached housing before the 1980 energy-saving standard was enforced (not using thermal insulation materials)
Non-inverter air conditioners
Ductile cast iron piping
Long service life and low power consumption.
Reduces power consumption for cooling and heating by improving thermal insulation performance.
Reduces power consumption for cooling and heating by improving thermal insulation performance.
Reduction of power consumption by increasing motor efficiency.
Low energy consumption because high temperatures are not used during manufacture.
10 years Detached houses: 30 years
Apartments: 60 yearsDetached houses: 30
years14.8 years 50 years
28 million units
Detached houses: 367,000 units Apartments: 633,000 units
Detached houses: 25,000 units
7,460 units (Number of air conditioners)
493,092 tons
LED light bulb: 92,000 - - - -
- Thermal insulation
materials (2.35 million)
Aluminum-resin composite
window/Thermal insulation materials (107
thousand)
- PVC pipe (740,000)
-7.45 million -75.8 million
Number of examples included in those on the
left (-46 thousand)
-16.4 million -3.3 million
Avoided CO2 Emissions The results of assessing the fifteen examples here clearly show that chemical products are key materials that contribute to about 120 million tons in reduced emissions1) until the end of their life. Any of these examples leads us to understand that chemical products or finished products that incorporate chemical products contribute to reducing CO2e emissions that exceed the CO2e emissions of such chemical products or finished products themselves during manufacture.
12
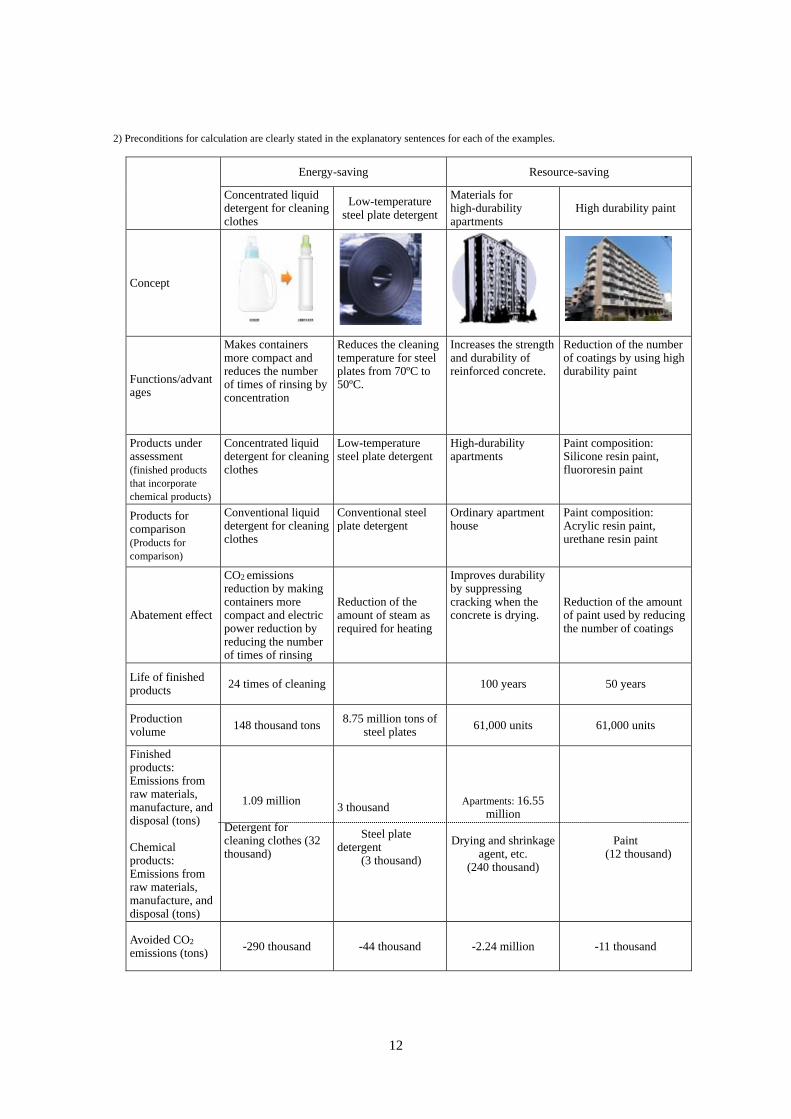
2) Preconditions for calculation are clearly stated in the explanatory sentences for each of the examples.
Energy-saving Resource-saving
Concentrated liquid detergent for cleaning clothes
Low-temperature steel plate detergent
Materials for high-durability apartments
High durability paint
Concept
Functions/advantages
Makes containers more compact and reduces the number of times of rinsing by concentration
Reduces the cleaning temperature for steel plates from 70ºC to 50ºC.
Increases the strength and durability of reinforced concrete.
Reduction of the number of coatings by using high durability paint
Products under assessment (finished products that incorporate chemical products)
Concentrated liquid detergent for cleaning clothes
Low-temperature steel plate detergent
High-durability apartments
Paint composition: Silicone resin paint, fluororesin paint
Products for comparison (Products for comparison)
Conventional liquid detergent for cleaning clothes
Conventional steel plate detergent
Ordinary apartment house
Paint composition: Acrylic resin paint, urethane resin paint
Abatement effect
CO2 emissions reduction by making containers more compact and electric power reduction by reducing the number of times of rinsing
Reduction of the amount of steam as required for heating
Improves durability by suppressing cracking when the concrete is drying.
Reduction of the amount of paint used by reducing the number of coatings
Life of finished products 24 times of cleaning 100 years 50 years
Production volume 148 thousand tons
8.75 million tons of steel plates 61,000 units 61,000 units
Finished products: Emissions from raw materials, manufacture, and disposal (tons) Chemical products: Emissions from raw materials, manufacture, and disposal (tons)
1.09 million Detergent for cleaning clothes (32 thousand)
3 thousand
Steel plate detergent
(3 thousand)
Apartments: 16.55 million
Drying and shrinkage
agent, etc. (240 thousand)
Paint (12 thousand)
Avoided CO2 emissions (tons) -290 thousand -44 thousand -2.24 million -11 thousand

13
Recyclable resource Suppression of N2Oemission
Shampoo container Feed additives
Concept
Functions/ advantages
Manufacturing of polyethylene by using sugar cane that is a renewable bio resource as a raw material
Adjustment of essential amino acids balance by adding methionine
Products under assessment (finished products that incorporate chemical products)
Biopolyethylene container
Assorted feedcontaining DL-methionine as an additive
Products for comparison (Products for comparison)
Fossil resource polyethylene container
Additive-free assorted feed
Abatement effect Biomass is carbon-neutral
Reduction of the amount of nitrogen in broiler chicken feces
Life of finished products
Number of uses 100 times
Breeding period 48 days
Production volume 1 million containers 3.96 million tons
Finished products: emissions from raw materials, manufacture, and disposal (tons) "( )" shows emissions
from chemical products*
300
(0.03)
1.09 million
(850 thousand)
Avoided CO2 emissions (tons) -100 -160 thousand
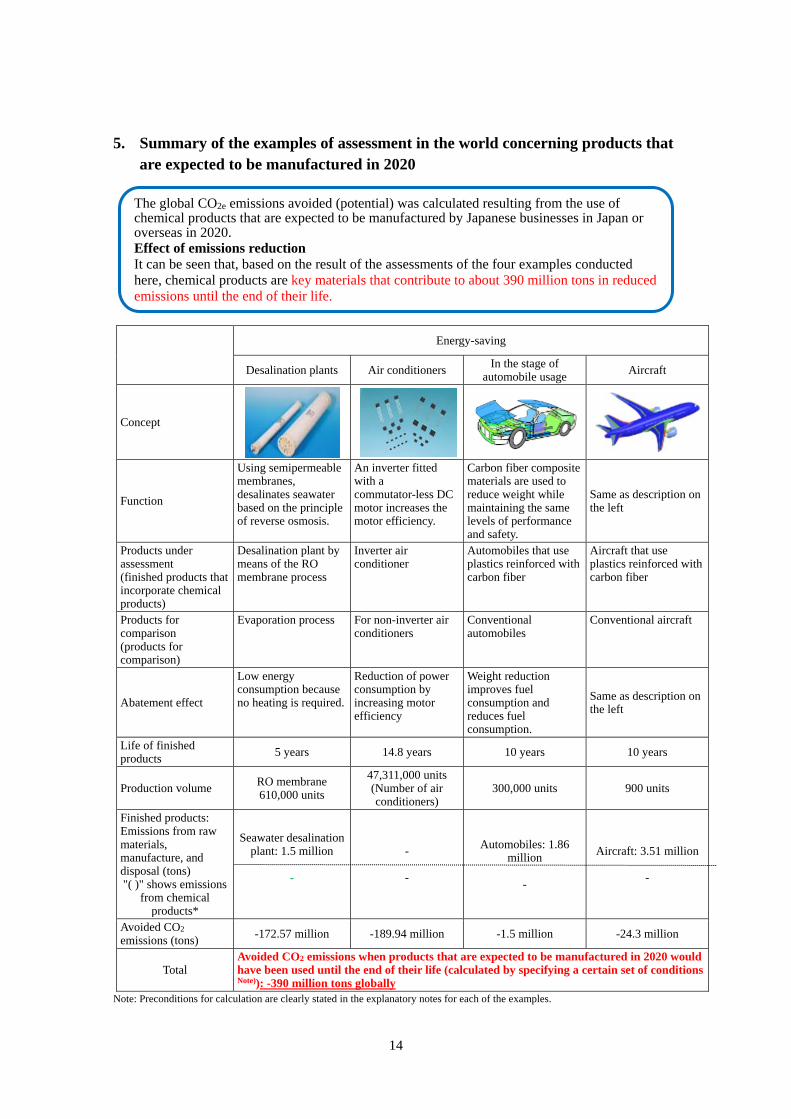
14
5. Summary of the examples of assessment in the world concerning products that are expected to be manufactured in 2020
Energy-saving
Desalination plants Air conditioners In the stage of automobile usage
Aircraft
Concept
Function
Using semipermeable membranes, desalinates seawater based on the principle of reverse osmosis.
An inverter fitted with a commutator-less DC motor increases the motor efficiency.
Carbon fiber composite materials are used to reduce weight while maintaining the same levels of performance and safety.
Same as description on the left
Products under assessment (finished products that incorporate chemical products)
Desalination plant by means of the RO membrane process
Inverter air conditioner
Automobiles that use plastics reinforced with carbon fiber
Aircraft that use plastics reinforced with carbon fiber
Products for comparison (products for comparison)
Evaporation process For non-inverter air conditioners
Conventional automobiles
Conventional aircraft
Abatement effect
Low energy consumption because no heating is required.
Reduction of powerconsumption by increasing motor efficiency
Weight reduction improves fuel consumption and reduces fuel consumption.
Same as description on the left
Life of finished products 5 years 14.8 years 10 years 10 years
Production volume RO membrane 610,000 units
47,311,000 units(Number of air conditioners)
300,000 units 900 units
Finished products: Emissions from raw materials, manufacture, and disposal (tons) "( )" shows emissions
from chemical products*
Seawater desalination plant: 1.5 million
-
- -
Automobiles: 1.86 million
-
Aircraft: 3.51 million -
Avoided CO2 emissions (tons) -172.57 million -189.94 million -1.5 million -24.3 million
Total Avoided CO2 emissions when products that are expected to be manufactured in 2020 would have been used until the end of their life (calculated by specifying a certain set of conditions Note)): -390 million tons globally
Note: Preconditions for calculation are clearly stated in the explanatory notes for each of the examples.
The global CO2e emissions avoided (potential) was calculated resulting from the use of chemical products that are expected to be manufactured by Japanese businesses in Japan or overseas in 2020. Effect of emissions reduction It can be seen that, based on the result of the assessments of the four examples conducted here, chemical products are key materials that contribute to about 390 million tons in reduced emissions until the end of their life.
15
1. About the chemical industry
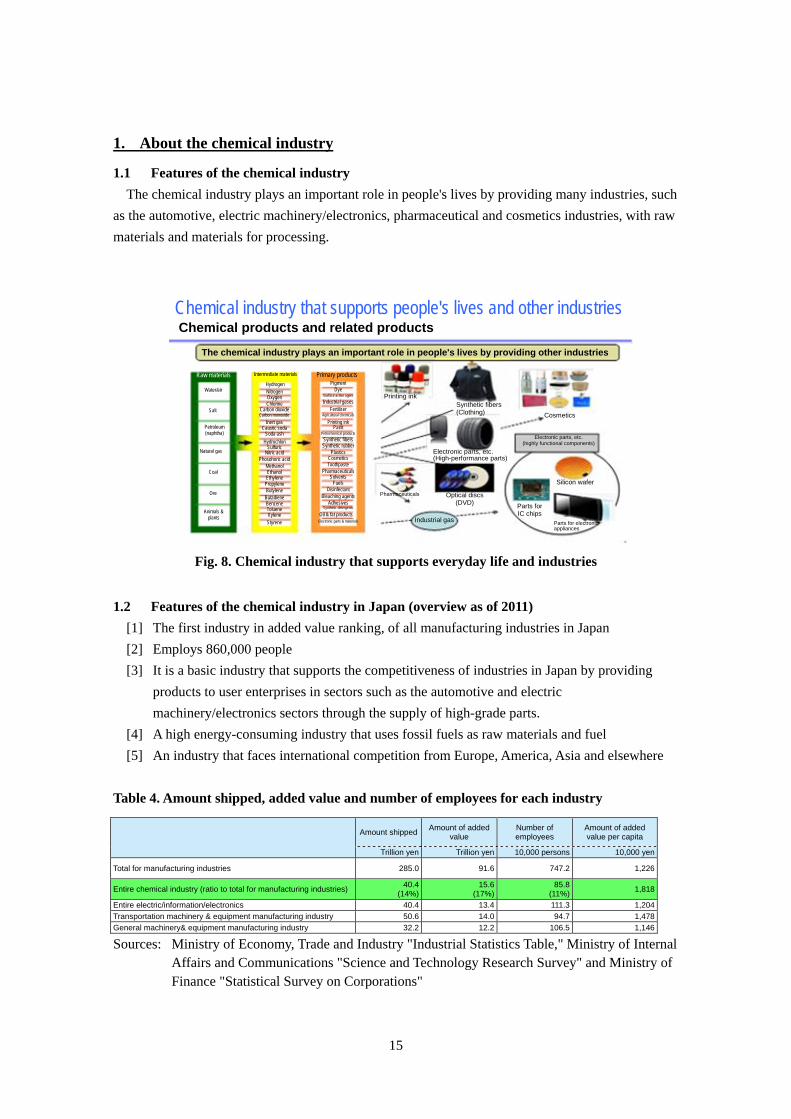
1.1 Features of the chemical industry
The chemical industry plays an important role in people's lives by providing many industries, such
as the automotive, electric machinery/electronics, pharmaceutical and cosmetics industries, with raw
materials and materials for processing.
Fig. 8. Chemical industry that supports everyday life and industries
1.2 Features of the chemical industry in Japan (overview as of 2011)
[1] The first industry in added value ranking, of all manufacturing industries in Japan
[2] Employs 860,000 people
[3] It is a basic industry that supports the competitiveness of industries in Japan by providing
products to user enterprises in sectors such as the automotive and electric
machinery/electronics sectors through the supply of high-grade parts.
[4] A high energy-consuming industry that uses fossil fuels as raw materials and fuel
[5] An industry that faces international competition from Europe, America, Asia and elsewhere
Table 4. Amount shipped, added value and number of employees for each industry
Amount shipped
Amount of added value
Number of employees
Amount of added value per capita
Trillion yen Trillion yen 10,000 persons 10,000 yen
Total for manufacturing industries 285.0 91.6 747.2 1,226
Entire chemical industry (ratio to total for manufacturing industries)40.4
(14%)15.6
(17%)85.8
(11%) 1,818
Entire electric/information/electronics 40.4 13.4 111.3 1,204
Transportation machinery & equipment manufacturing industry 50.6 14.0 94.7 1,478
General machinery& equipment manufacturing industry 32.2 12.2 106.5 1,146
Sources: Ministry of Economy, Trade and Industry "Industrial Statistics Table," Ministry of Internal Affairs and Communications "Science and Technology Research Survey" and Ministry of Finance "Statistical Survey on Corporations"
Chemical industry that supports people's lives and other industries Chemical products and related products
Raw materials
Water/air
Salt
Petroleum (naphtha)
Natural gas
Coal
Ore
Animals & plants
Intermediate materials
Hydrogen NitrogenOxygenChlorine
Carbon dioxideCarbon monoxide
Inert gas Caustic soda
Soda ash
HydrochloriSulfuric
Nitric acidPhosphoric acid
MethanolEthanol Ethylene
Propylene Butylene
Butadiene BenzeneToluene Xylene Styrene
Primary products Pigment
Dye Surface active agent
Industrial gasesFertilizer
Agricultural chemicals
Printing ink Paint
Petrochemical products
Synthetic fibersSynthetic rubber
Plastics Cosmetics Toothpaste
PharmaceuticalsSolvents
FuelsDisinfectant
Bleaching agents Adhesives
Synthetic detergents
Oil & fat products Electronic parts & materials
Printing ink Synthetic fibers(Clothing) Cosmetics
Electronic parts, etc. (High-performance parts)
Electronic parts, etc. (highly functional components)
Pharmaceuticals Optical discs (DVD)
Silicon wafer
Parts for IC chips
Parts for electronic appliances
Industrial gas
The chemical industry plays an important role in people's lives by providing other industries
16
1.3 Approach taken by the chemical industry in Japan concerning the prevention of global
warming
(1) Current situation of CO2 emissions
Proportion of CO2 emissions in each sector
CO2 emissions in the industrial field account for 34% of the total emissions in Japan, with the
remaining 66% being emitted by the commercial, transportation, household sectors, etc. The
emissions resulting from chemical products were the second greatest after steel in the industrial
sector, accounting for 4% of the emissions in Japan as a whole.
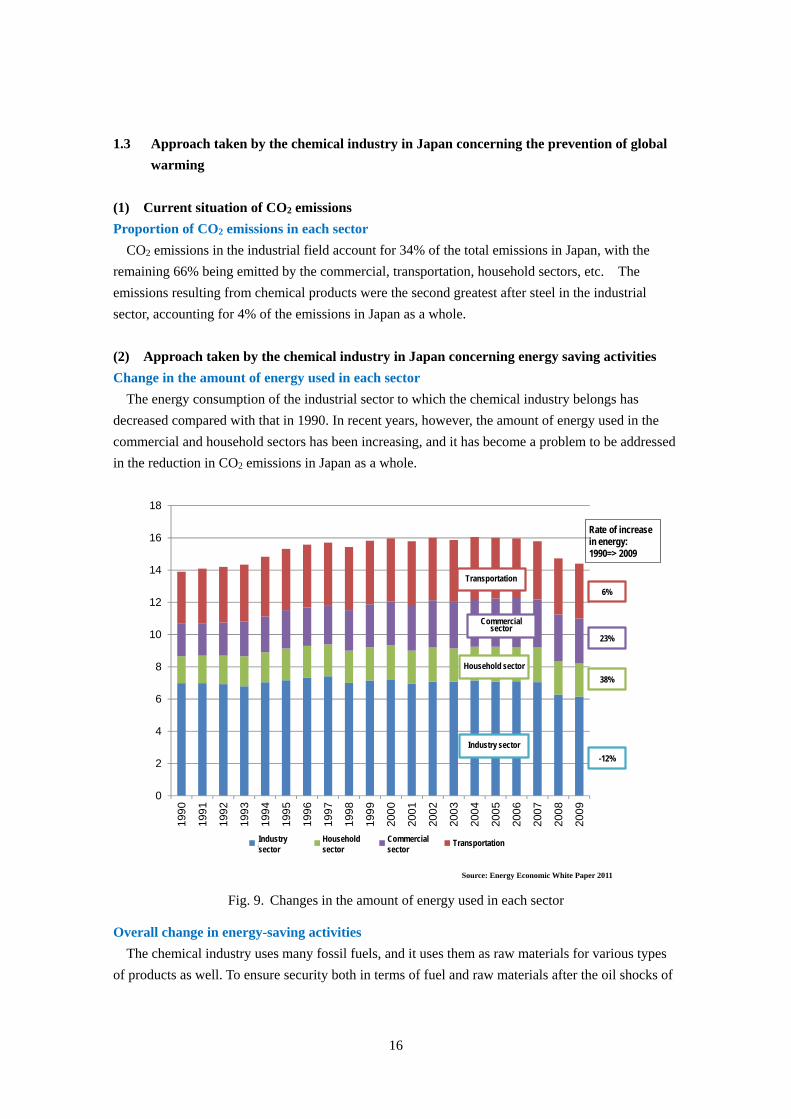
(2) Approach taken by the chemical industry in Japan concerning energy saving activities
Change in the amount of energy used in each sector
The energy consumption of the industrial sector to which the chemical industry belongs has
decreased compared with that in 1990. In recent years, however, the amount of energy used in the
commercial and household sectors has been increasing, and it has become a problem to be addressed
in the reduction in CO2 emissions in Japan as a whole.
0
2
4
6
8
10
12
14
16
18
199
0
199
1
199
2
199
3
199
4
199
5
199
6
199
7
199
8
199
9
200
0
200
1
200
2
200
3
200
4
200
5
200
6
200
7
200
8
200
9
産業部門 家庭部門 業務部門 運輸部門
Industry sector
Transportation
Household sector
Commercial sector
-12%
6%
38%
23%
Rate of increase in energy:1990=> 2009
Industry sector
Householdsector
Commercial sector
Transportation
Source: Energy Economic White Paper 2011
Fig. 9. Changes in the amount of energy used in each sector
Overall change in energy-saving activities
The chemical industry uses many fossil fuels, and it uses them as raw materials for various types
of products as well. To ensure security both in terms of fuel and raw materials after the oil shocks of
17
the 1970s, a proactive approach to energy saving was adopted and substantial energy saving was
pursued until the latter half of the 1980s.
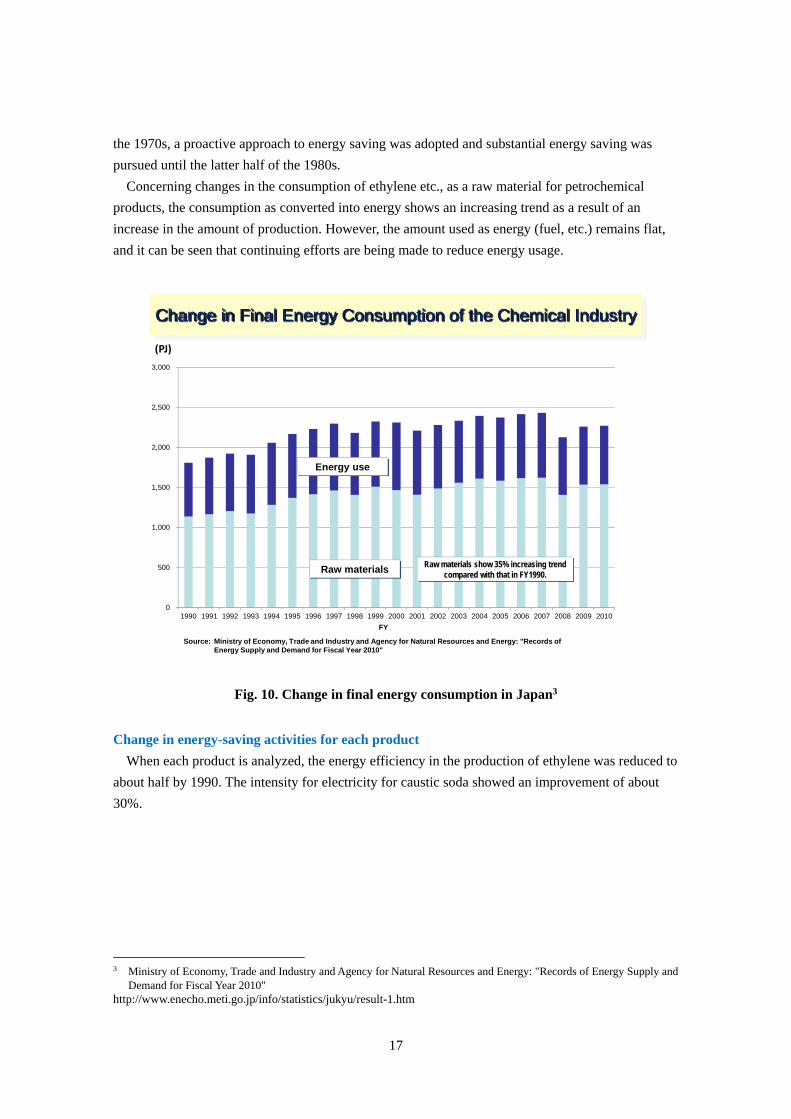
Concerning changes in the consumption of ethylene etc., as a raw material for petrochemical
products, the consumption as converted into energy shows an increasing trend as a result of an
increase in the amount of production. However, the amount used as energy (fuel, etc.) remains flat,
and it can be seen that continuing efforts are being made to reduce energy usage.
0
500
1,000
1,500
2,000
2,500
3,000
1990 1991 1992 1993 1994 1995 1996 1997 1998 1999 2000 2001 2002 2003 2004 2005 2006 2007 2008 2009 2010
FY
(PJ)
Raw materials
Energy use
Source: Ministry of Economy, Trade and Industry and Agency for Natural Resources and Energy: "Records of Energy Supply and Demand for Fiscal Year 2010"
Change in Final Energy Consumption of the Chemical Industry
Raw materials show 35% increasing trend compared with that in FY1990.
Fig. 10. Change in final energy consumption in Japan3
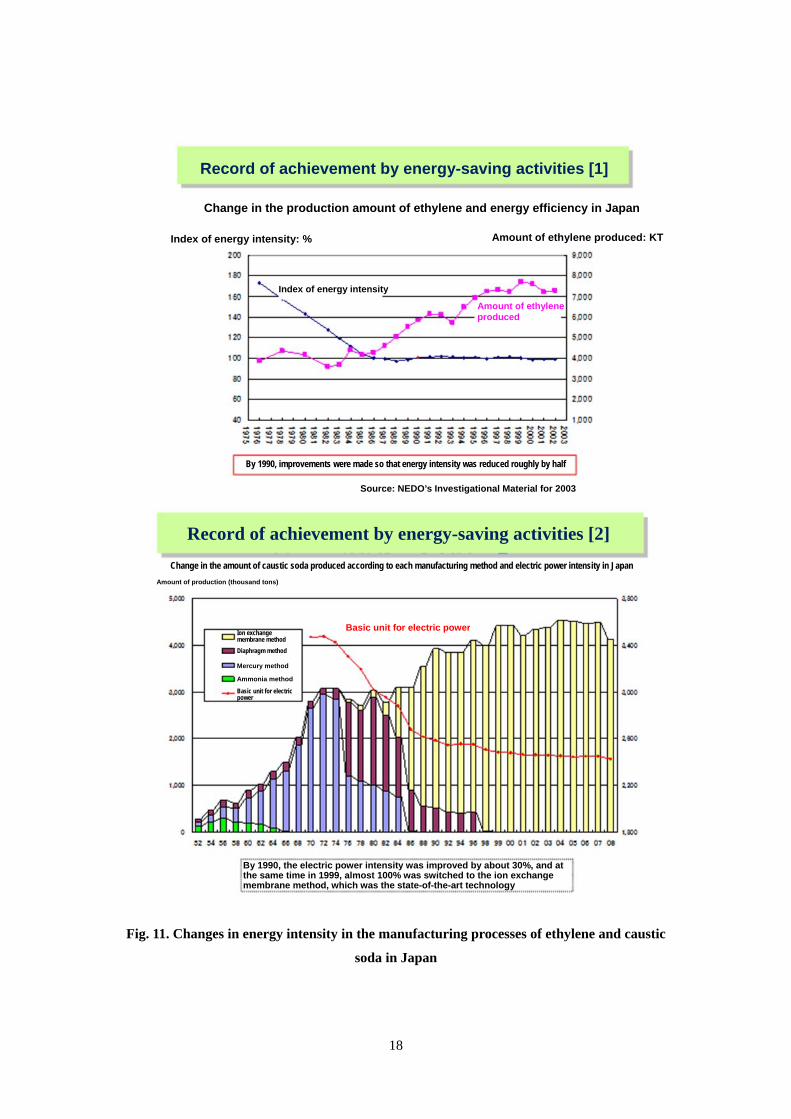
Change in energy-saving activities for each product
When each product is analyzed, the energy efficiency in the production of ethylene was reduced to
about half by 1990. The intensity for electricity for caustic soda showed an improvement of about
30%.
3 Ministry of Economy, Trade and Industry and Agency for Natural Resources and Energy: "Records of Energy Supply and
Demand for Fiscal Year 2010" http://www.enecho.meti.go.jp/info/statistics/jukyu/result-1.htm
18
Fig. 11. Changes in energy intensity in the manufacturing processes of ethylene and caustic
soda in Japan
Record of achievement by energy-saving activities [1]
Change in the production amount of ethylene and energy efficiency in Japan
Index of energy intensity: % Amount of ethylene produced: KT
Index of energy intensity
Amount of ethylene produced
By 1990, improvements were made so that energy intensity was reduced roughly by half
Source: NEDO’s Investigational Material for 2003
Record of achievement by energy-saving activities [2]
Ion exchange membrane method
Diaphragm method
Mercury method
Ammonia method
Basic unit for electric power
Basic unit for electric power
Amount of production (thousand tons)
By 1990, the electric power intensity was improved by about 30%, and at the same time in 1999, almost 100% was switched to the ion exchange membrane method, which was the state-of-the-art technology
Change in the amount of caustic soda produced according to each manufacturing method and electric power intensity in Japan
19
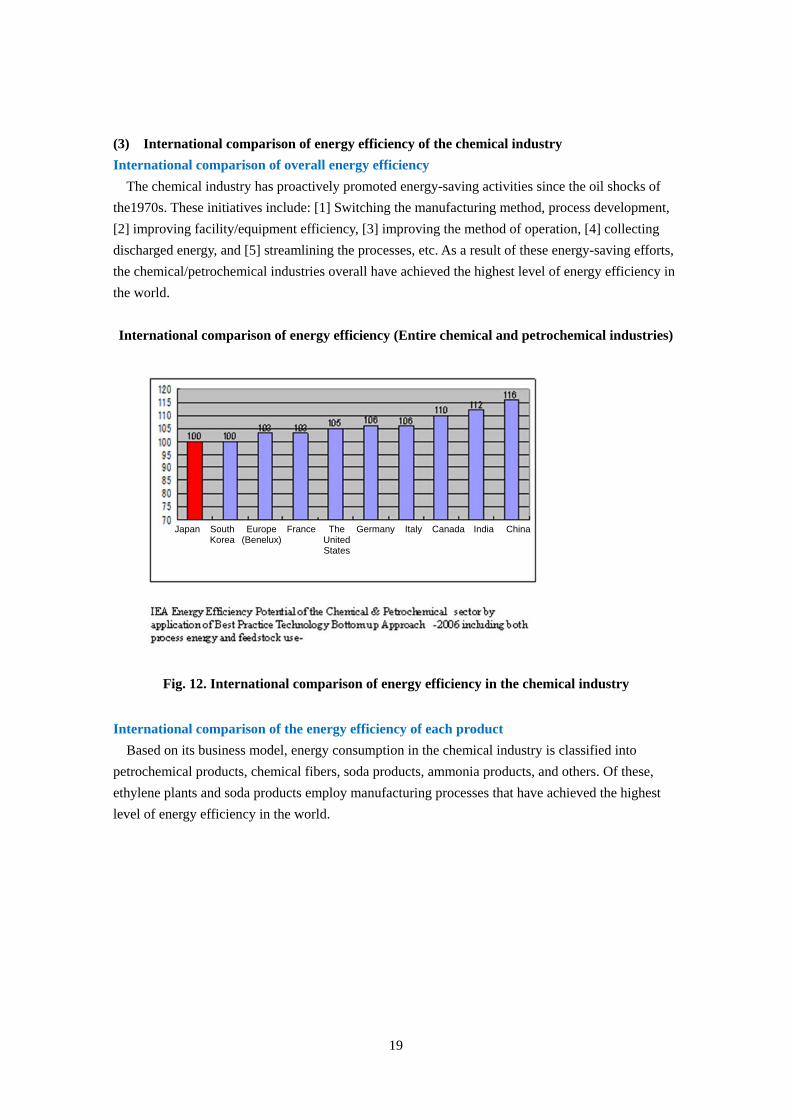
(3) International comparison of energy efficiency of the chemical industry
International comparison of overall energy efficiency
The chemical industry has proactively promoted energy-saving activities since the oil shocks of
the1970s. These initiatives include: [1] Switching the manufacturing method, process development,
[2] improving facility/equipment efficiency, [3] improving the method of operation, [4] collecting
discharged energy, and [5] streamlining the processes, etc. As a result of these energy-saving efforts,
the chemical/petrochemical industries overall have achieved the highest level of energy efficiency in
the world.
International comparison of energy efficiency (Entire chemical and petrochemical industries)
Fig. 12. International comparison of energy efficiency in the chemical industry
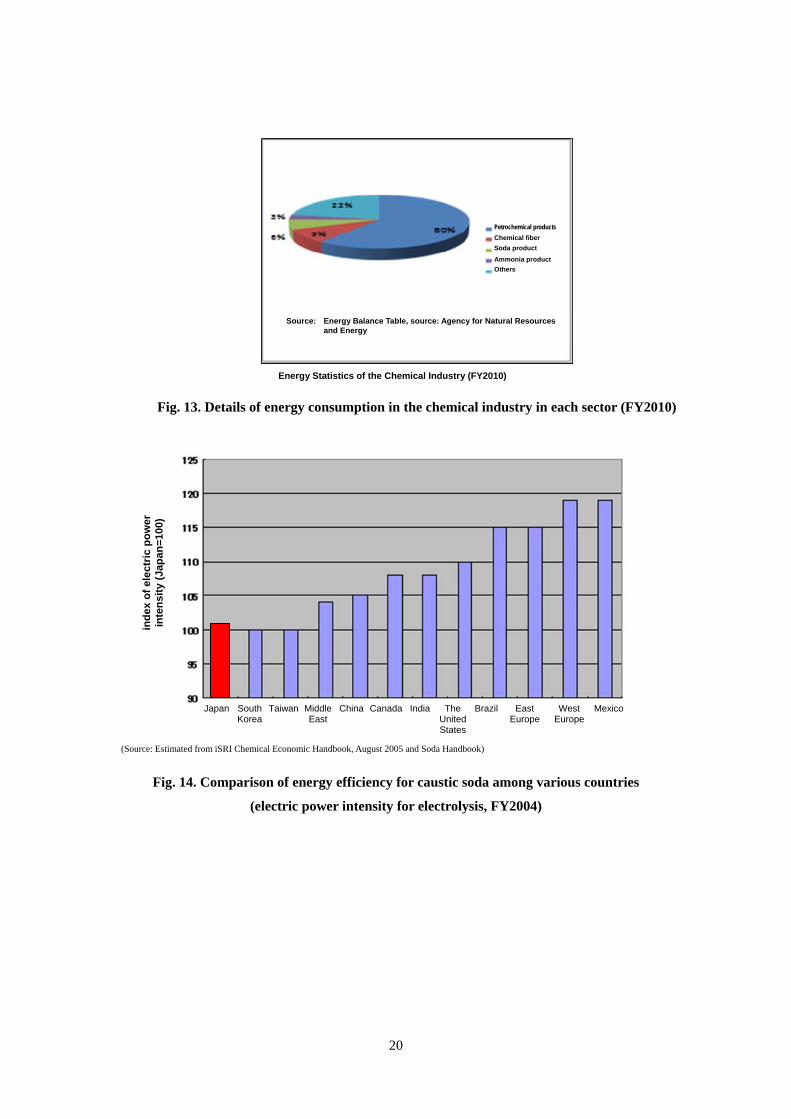
International comparison of the energy efficiency of each product
Based on its business model, energy consumption in the chemical industry is classified into
petrochemical products, chemical fibers, soda products, ammonia products, and others. Of these,
ethylene plants and soda products employ manufacturing processes that have achieved the highest
level of energy efficiency in the world.
Japan South Korea
Europe (Benelux)
France The United States
Germany Italy Canada India China
20
Fig. 13. Details of energy consumption in the chemical industry in each sector (FY2010)
Fig. 14. Comparison of energy efficiency for caustic soda among various countries
(electric power intensity for electrolysis, FY2004)
ind
ex o
f el
ect
ric
po
wer
in
ten
sity
(Ja
pan
=10
0)
Japan South Korea
Taiwan Middle East
China Canada India The United States
Brazil East Europe
West Europe
Mexico
(Source: Estimated from iSRI Chemical Economic Handbook, August 2005 and Soda Handbook)
Source: Energy Balance Table, source: Agency for Natural Resources and Energy
Energy Statistics of the Chemical Industry (FY2010)
Petrochemical products
Chemical fiber
Soda product
Ammonia product
Others
Japan South KoreaTaiwan Middle EastChina Canada India The United StatesBrazil East EuropeWest EuropeMexico
(Source: Estimation based on the SRI Chemical Economic Handbook, August 2005 and the Soda Handbook)
21
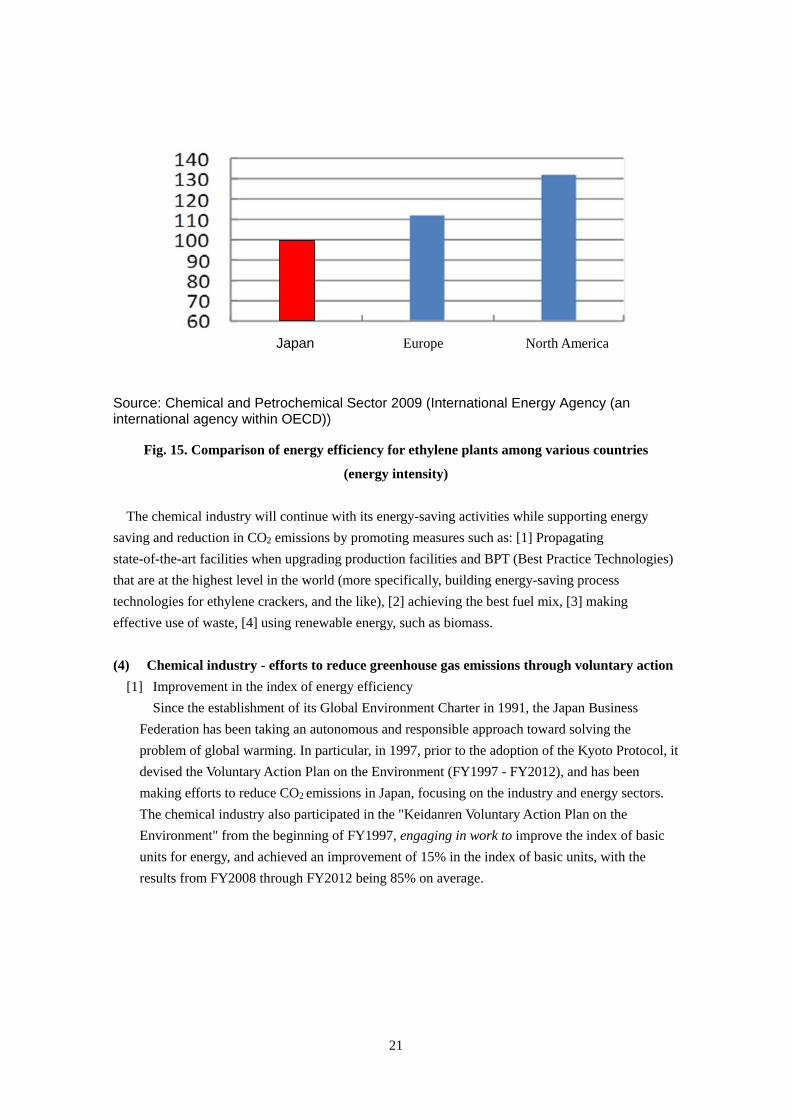
Source: Chemical and Petrochemical Sector 2009 (International Energy Agency (an international agency within OECD))
Fig. 15. Comparison of energy efficiency for ethylene plants among various countries
(energy intensity)
The chemical industry will continue with its energy-saving activities while supporting energy
saving and reduction in CO2 emissions by promoting measures such as: [1] Propagating
state-of-the-art facilities when upgrading production facilities and BPT (Best Practice Technologies)
that are at the highest level in the world (more specifically, building energy-saving process
technologies for ethylene crackers, and the like), [2] achieving the best fuel mix, [3] making
effective use of waste, [4] using renewable energy, such as biomass.
(4) Chemical industry - efforts to reduce greenhouse gas emissions through voluntary action
[1] Improvement in the index of energy efficiency
Since the establishment of its Global Environment Charter in 1991, the Japan Business
Federation has been taking an autonomous and responsible approach toward solving the
problem of global warming. In particular, in 1997, prior to the adoption of the Kyoto Protocol, it
devised the Voluntary Action Plan on the Environment (FY1997 - FY2012), and has been
making efforts to reduce CO2 emissions in Japan, focusing on the industry and energy sectors.
The chemical industry also participated in the "Keidanren Voluntary Action Plan on the
Environment" from the beginning of FY1997, engaging in work to improve the index of basic
units for energy, and achieved an improvement of 15% in the index of basic units, with the
results from FY2008 through FY2012 being 85% on average.
Japan Europe North America
Japan Europe North America
22
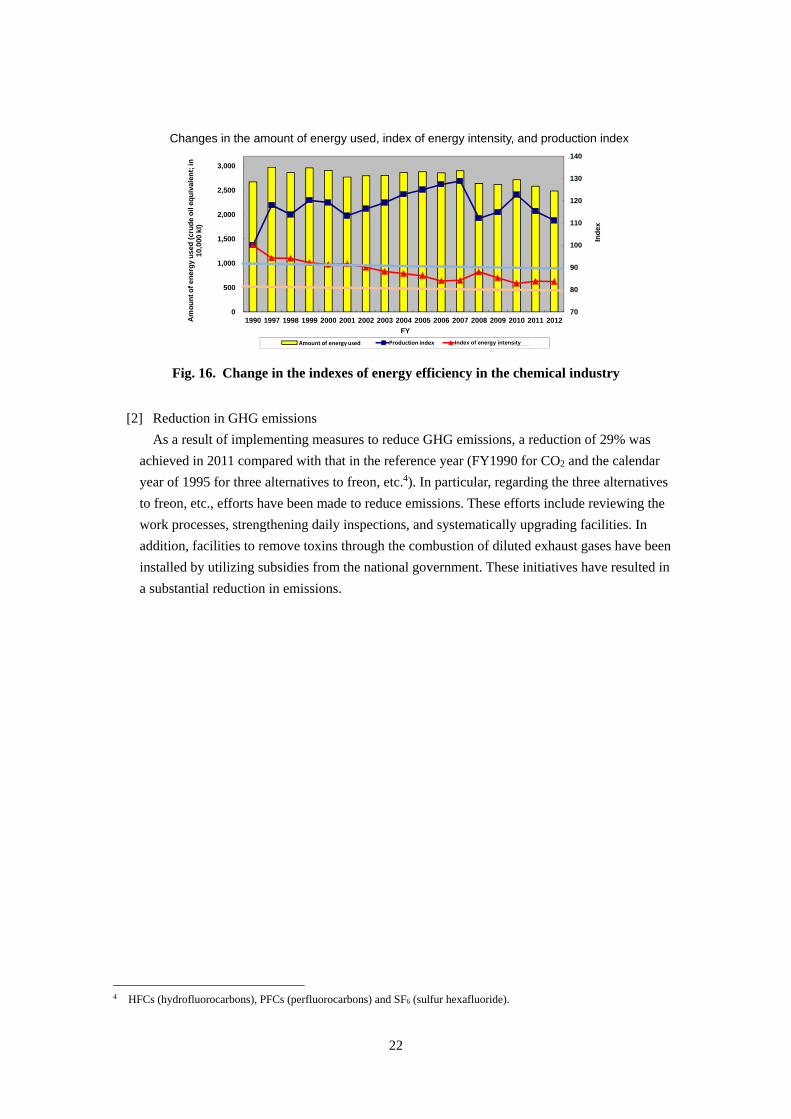
Changes in the amount of energy used, index of energy intensity, and production index
70
80
90
100
110
120
130
140
0
500
1,000
1,500
2,000
2,500
3,000
1990 1997 1998 1999 2000 2001 2002 2003 2004 2005 2006 2007 2008 2009 2010 2011 2012
Ind
ex
Am
ou
nt o
f e
ner
gy
use
d (
cru
de
oil
eq
uiv
ale
nt;
in
10,
000
kl)
FY
エネルギー使用量 生産指数 エネルギー原単位指数Index of energy intensityProduction indexAmount of energy used
Fig. 16. Change in the indexes of energy efficiency in the chemical industry
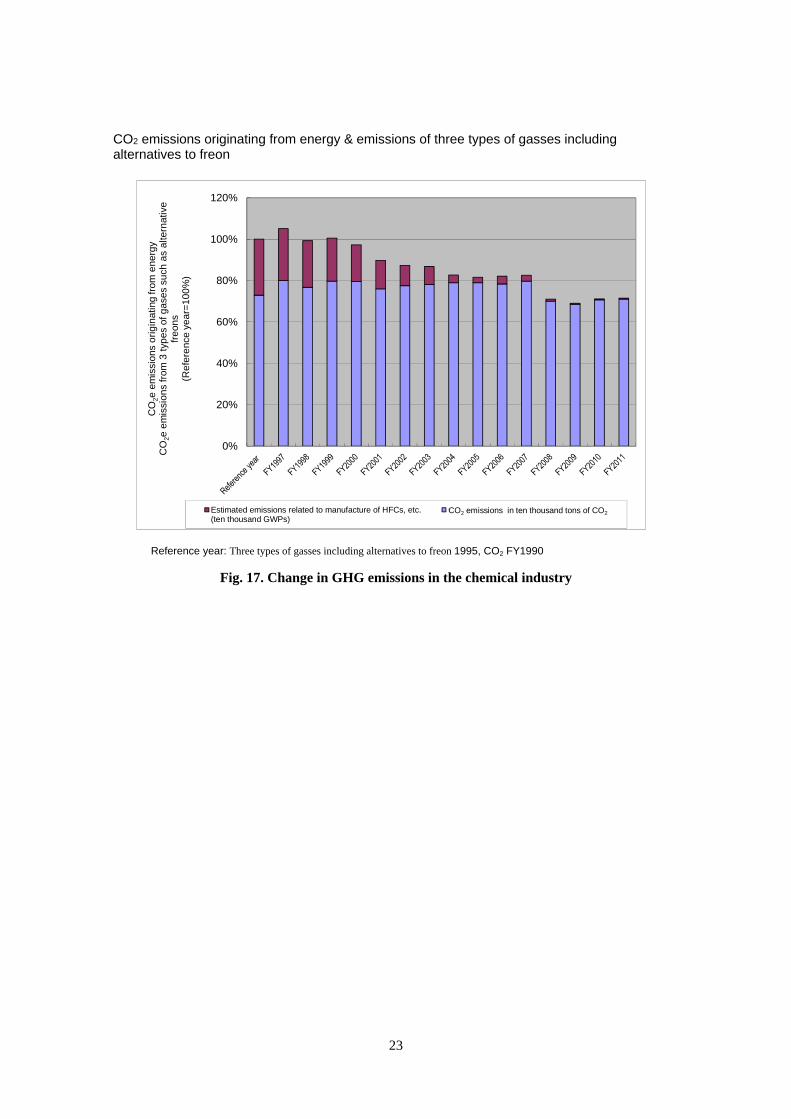
[2] Reduction in GHG emissions
As a result of implementing measures to reduce GHG emissions, a reduction of 29% was
achieved in 2011 compared with that in the reference year (FY1990 for CO2 and the calendar
year of 1995 for three alternatives to freon, etc.4). In particular, regarding the three alternatives
to freon, etc., efforts have been made to reduce emissions. These efforts include reviewing the
work processes, strengthening daily inspections, and systematically upgrading facilities. In
addition, facilities to remove toxins through the combustion of diluted exhaust gases have been
installed by utilizing subsidies from the national government. These initiatives have resulted in
a substantial reduction in emissions.
4 HFCs (hydrofluorocarbons), PFCs (perfluorocarbons) and SF6 (sulfur hexafluoride).
23
CO2 emissions originating from energy & emissions of three types of gasses including alternatives to freon
0%
20%
40%
60%
80%
100%
120%
CO
2e e
mis
sion
s o
rig
inat
ing
from
ene
rgy
CO
2e e
mis
sio
ns
fro
m 3
typ
es o
f gas
es
such
as
alte
rna
tive
fre
ons
(Re
fere
nce
ye
ar=
10
0%
)
Estimated emissions related to manufacture of HFCs, etc.(ten thousand GWPs)
CO2 emissions in ten thousand tons of CO2CO2 emissions in ten thousand tons of CO2
Reference year: Three types of gasses including alternatives to freon 1995, CO2 FY1990
Fig. 17. Change in GHG emissions in the chemical industry
24
2. Concerning cLCA (carbon Life Cycle Analysis)
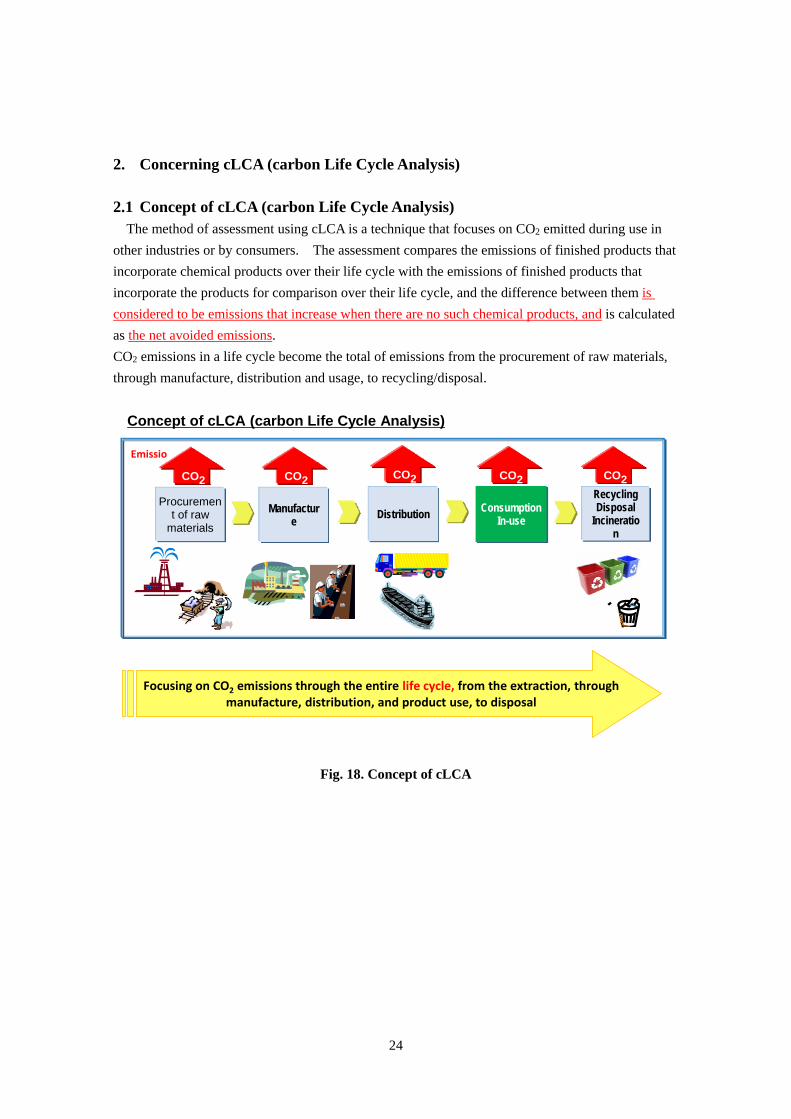
2.1 Concept of cLCA (carbon Life Cycle Analysis) The method of assessment using cLCA is a technique that focuses on CO2 emitted during use in
other industries or by consumers. The assessment compares the emissions of finished products that
incorporate chemical products over their life cycle with the emissions of finished products that
incorporate the products for comparison over their life cycle, and the difference between them is
considered to be emissions that increase when there are no such chemical products, and is calculated
as the net avoided emissions. CO2 emissions in a life cycle become the total of emissions from the procurement of raw materials,
through manufacture, distribution and usage, to recycling/disposal.
CO2
CO2Emissio
Procurement of raw
materials
Recycling Disposal
Incineration
DistributionManufacture
Consumption In-use
CO2CO2 CO2CO2CO2
Focusing on CO2 emissions through the entire life cycle, from the extraction, through manufacture, distribution, and product use, to disposal
Concept of cLCA (carbon Life Cycle Analysis)
Fig. 18. Concept of cLCA
25
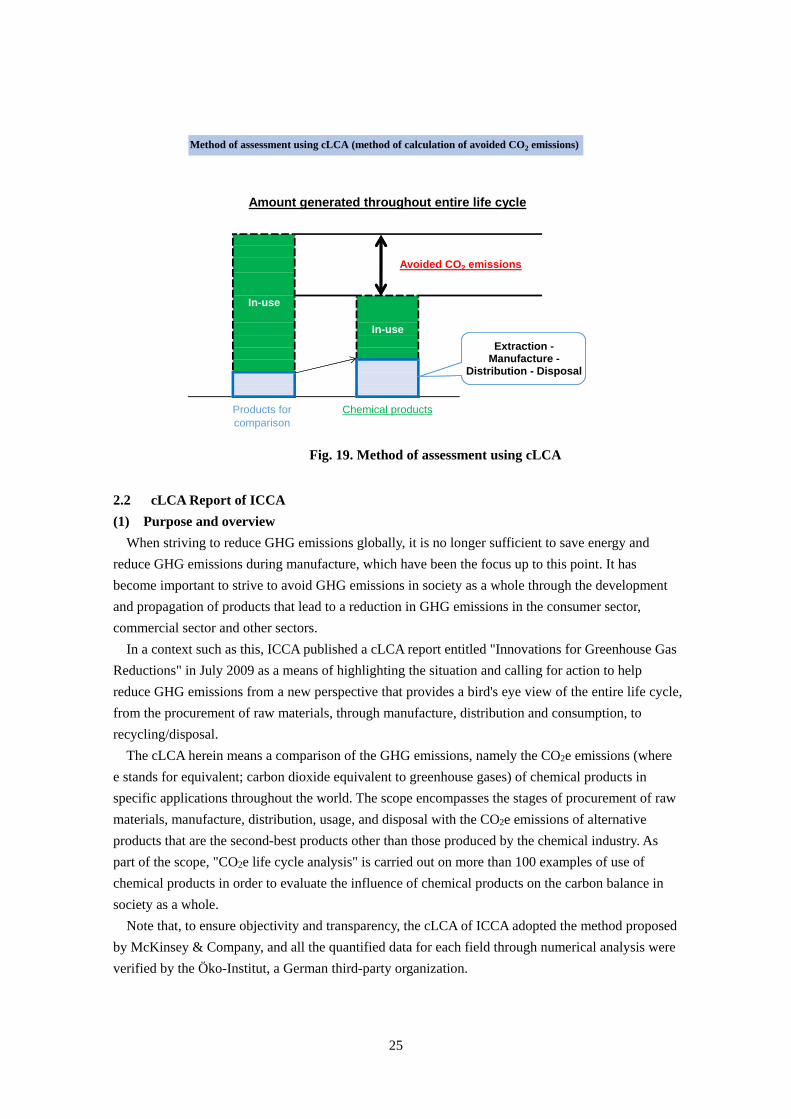
Method of assessment using cLCA (method of calculation of avoided CO2 emissions)
Avoided CO2 emissions
In-use
In-use
Amount generated throughout entire life cycle
Chemical productsProducts forcomparison
Extraction -Manufacture -
Distribution - Disposal
Fig. 19. Method of assessment using cLCA
2.2 cLCA Report of ICCA
(1) Purpose and overview
When striving to reduce GHG emissions globally, it is no longer sufficient to save energy and
reduce GHG emissions during manufacture, which have been the focus up to this point. It has
become important to strive to avoid GHG emissions in society as a whole through the development
and propagation of products that lead to a reduction in GHG emissions in the consumer sector,
commercial sector and other sectors.
In a context such as this, ICCA published a cLCA report entitled "Innovations for Greenhouse Gas
Reductions" in July 2009 as a means of highlighting the situation and calling for action to help
reduce GHG emissions from a new perspective that provides a bird's eye view of the entire life cycle,
from the procurement of raw materials, through manufacture, distribution and consumption, to
recycling/disposal.
The cLCA herein means a comparison of the GHG emissions, namely the CO2e emissions (where
e stands for equivalent; carbon dioxide equivalent to greenhouse gases) of chemical products in
specific applications throughout the world. The scope encompasses the stages of procurement of raw
materials, manufacture, distribution, usage, and disposal with the CO2e emissions of alternative
products that are the second-best products other than those produced by the chemical industry. As
part of the scope, "CO2e life cycle analysis" is carried out on more than 100 examples of use of
chemical products in order to evaluate the influence of chemical products on the carbon balance in
society as a whole.
Note that, to ensure objectivity and transparency, the cLCA of ICCA adopted the method proposed
by McKinsey & Company, and all the quantified data for each field through numerical analysis were
verified by the Öko-Institut, a German third-party organization.

26
Fig. 20. ICCA Report
cLCA Report
"Innovations for Greenhouse Gas Reductions"
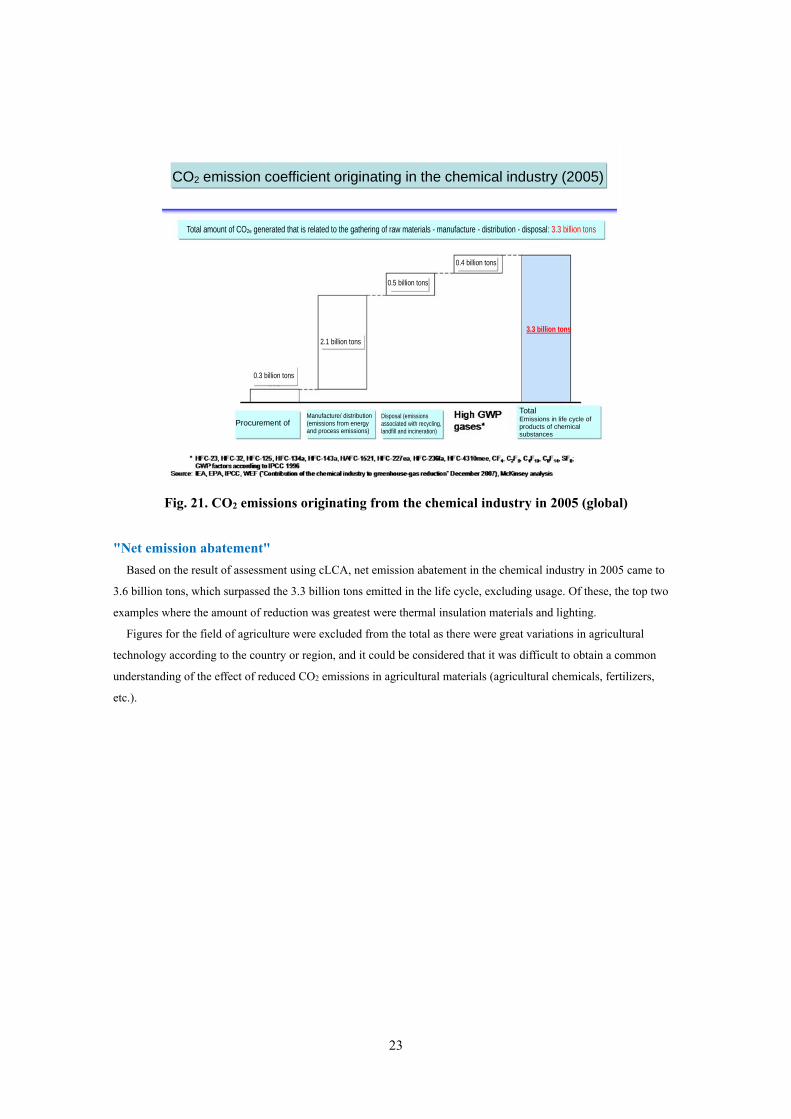
(2) Result of assessment for 2005
Global CO2e emissions in the chemical industry
As a result of cLCA, global GHG emissions related to the chemical
industry in 2005 were 3.3 billion tons. Of this volume, 2.1 billion tons,
more than half of the figure, were produced as a result of purchasing raw materials and
manufacturing chemical products by the chemical industry. Also, the figure includes 400 million
tons of three alternatives to freon, which has a strong greenhouse effect.
23
Fig. 21. CO2 emissions originating from the chemical industry in 2005 (global)
"Net emission abatement"
Based on the result of assessment using cLCA, net emission abatement in the chemical industry in 2005 came to
3.6 billion tons, which surpassed the 3.3 billion tons emitted in the life cycle, excluding usage. Of these, the top two
examples where the amount of reduction was greatest were thermal insulation materials and lighting.
Figures for the field of agriculture were excluded from the total as there were great variations in agricultural
technology according to the country or region, and it could be considered that it was difficult to obtain a common
understanding of the effect of reduced CO2 emissions in agricultural materials (agricultural chemicals, fertilizers,
etc.).
CO2 emission coefficient originating in the chemical industry (2005)
Total amount of CO2e generated that is related to the gathering of raw materials - manufacture - distribution - disposal: 3.3 billion tons
Procurement of Manufacture/ distribution (emissions from energy and process emissions)
Disposal (emissions associated with recycling, landfill and incineration)
Total Emissions in life cycle of products of chemical substances
2.1 billion tons
0.4 billion tons
0.3 billion tons
3.3 billion tons
0.5 billion tons

24
Fig. 22. Net emission abatement in 2005
(3) Result of assessment for 2030
Expected global CO2e emissions in the chemical industry
Emissions in the BAU case (business-as-usual: a case in which the present regulations and
lifestyle remain unchanged and efforts to reduce energy consumption remain at the current level) for
2030 originating from the chemical industry and emissions on a best-effort basis incorporating the
use of innovative technologies that are expected to emerge and possible regulations in 2030 are
shown below. In the BAU case for 2030, with the year 2005 being used as the starting point, the
portion of improvements in production efficiency was excluded from the portion of increased
production based on BAU, and the portion of increase in emissions associated with moving
production bases was added. As a result, it is expected that emissions will nearly double to 6.5
billion tons.
In the case of the best-effort basis, calculation was made by taking account of the effect of
reducing CO2 emissions through measures such as the proactive adoption of functional products as
compared to the BAU case and emissions that will increase as a result of producing such functional
materials themselves. As a result, it is expected that a nearly twofold increase in emissions (from 3.3
to 6.5 billion tons) will be able to be controlled to 1.5 times (from 3.3 to 5 billion tons).
Net reduction in GHG emissions
Result of assessment using cLCA in 2005 (excluding agriculture)
Net amount of reduction Unit: Million tons of CO2
Unit: Million tons
Thermal insulation Lighting Packaging Anti-fouling of ships Synthetic fibers Automobile weight reduction Solar power Low-temperature synthetic detergentImprovement in engine efficiency Piping Wind turbine Regional heating Green tires Others Subtotal Fertilizer and plant protection Total
Products for which calculation cannot be made accurately Products that have no substituteproducts
When there is neither fertilizer nor crop protection
Net amount of reduction: 5160 - 1 600 = 35 6 0 million tons-> 3.6 billion tons
25
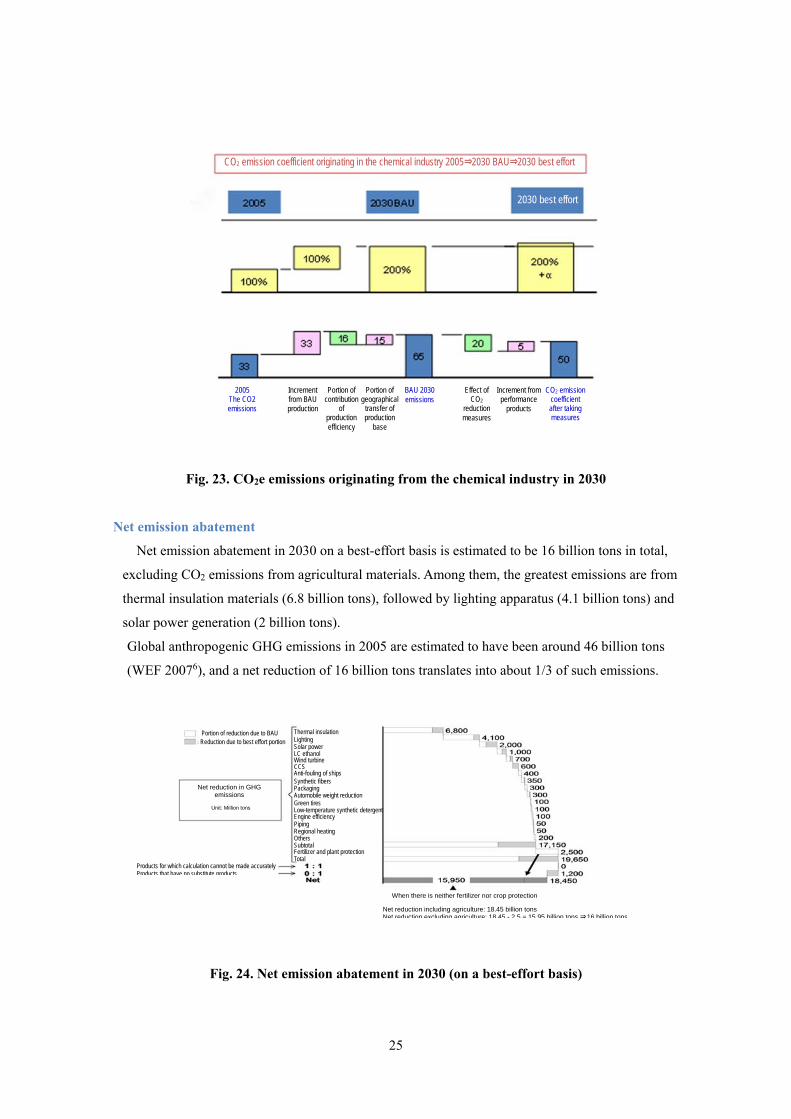
Fig. 23. CO2e emissions originating from the chemical industry in 2030
Net emission abatement
Net emission abatement in 2030 on a best-effort basis is estimated to be 16 billion tons in total,
excluding CO2 emissions from agricultural materials. Among them, the greatest emissions are from
thermal insulation materials (6.8 billion tons), followed by lighting apparatus (4.1 billion tons) and
solar power generation (2 billion tons).
Global anthropogenic GHG emissions in 2005 are estimated to have been around 46 billion tons
(WEF 20076), and a net reduction of 16 billion tons translates into about 1/3 of such emissions.
Fig. 24. Net emission abatement in 2030 (on a best-effort basis)
Products for which calculation cannot be made accurately Products that have no substitute products
Portion of reduction due to BAU Reduction due to best effort portion
Net reduction including agriculture: 18.45 billion tons Net reduction excluding agriculture: 18.45 - 2.5 = 15.95 billion tons ⇒16 billion tons
When there is neither fertilizer nor crop protection
Net reduction in GHG emissions
Unit: Million tons
Thermal insulation Lighting Solar powerLC ethanolWind turbine
Anti-fouling of ships Synthetic fibers PackagingAutomobile weight reduction Green tires Low-temperature synthetic detergent Engine efficiency PipingRegional heating Others SubtotalFertilizer and plant protection Total
CCS
CO2 emission coefficient originating in the chemical industry 2005⇒2030 BAU⇒2030 best effort
2030 best effort
Global production enlargement (assumption)
Unit: 100 million tons
2005 The CO2 emissions
Increment from BAU production
Portion of contribution
of production efficiency
Portion of geographical
transfer of production
base
BAU 2030 emissions
Effect of CO2
reduction measures
Increment from performance
products
CO2 emission coefficient after taking measures
26
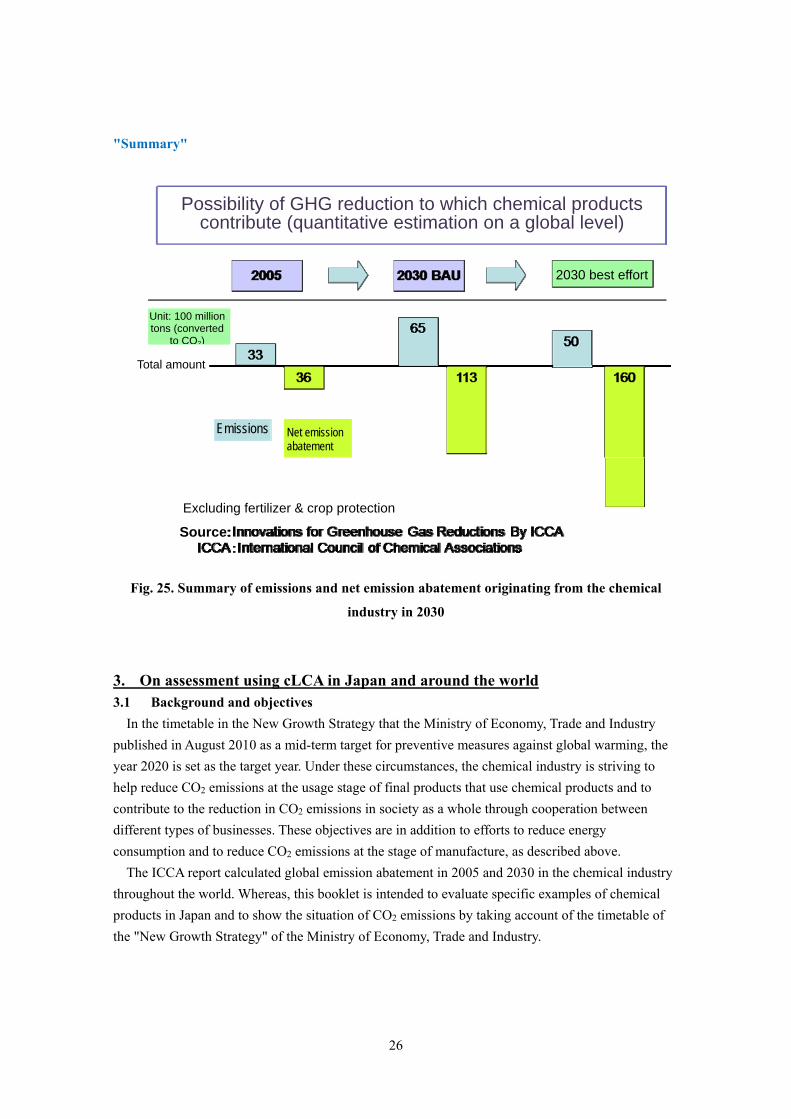
"Summary"
Fig. 25. Summary of emissions and net emission abatement originating from the chemical
industry in 2030
3. On assessment using cLCA in Japan and around the world 3.1 Background and objectives
In the timetable in the New Growth Strategy that the Ministry of Economy, Trade and Industry
published in August 2010 as a mid-term target for preventive measures against global warming, the
year 2020 is set as the target year. Under these circumstances, the chemical industry is striving to
help reduce CO2 emissions at the usage stage of final products that use chemical products and to
contribute to the reduction in CO2 emissions in society as a whole through cooperation between
different types of businesses. These objectives are in addition to efforts to reduce energy
consumption and to reduce CO2 emissions at the stage of manufacture, as described above.
The ICCA report calculated global emission abatement in 2005 and 2030 in the chemical industry
throughout the world. Whereas, this booklet is intended to evaluate specific examples of chemical
products in Japan and to show the situation of CO2 emissions by taking account of the timetable of
the "New Growth Strategy" of the Ministry of Economy, Trade and Industry.
Possibility of GHG reduction to which chemical products contribute (quantitative estimation on a global level)
2030 best effort
Unit: 100 million tons (converted
to CO2)
Total amount
Emissions Net emission abatement
Excluding fertilizer & crop protection
Source:
27
1. Paying attention to the timetable of the New Growth Strategy of the Ministry of Economy,
Trade and Industry, the year 2020, which is the period considered in the timetable, has been
adopted as the target fiscal year.
2. Net avoided CO2 emissions by the use of specific chemical products in Japan and around
the world in 2020 have been quantified.
The first edition dealt with eight examples in Japan and one example from around the world, for
which LCI7 data were published and of which data sources were clear. In the third edition, the
number of examples has been increased to include 15 examples in Japan and four examples from
around the world. We are determined to continue to contribute to industry as a whole hereafter as
well, in order to realize a low-carbon society through the provision of chemical products and
technologies, thereby providing information proactively for the policies on emissions reduction.
3.2 Selecting the level in the value chain The objectives of studies on avoided emissions in the chemical industry can be grouped into the
following two categories, according to the level in the value chain (see Fig. 26).
1. Chemical product level: Make a comparison between the emissions of a certain product with
those of a (chemical) product for comparison or the industry average value concerning how
small the former is as compared to the latter. Commonly reported reasons for making such a
calculation include in-house purposes (for instance, product benchmarking) and product
differentiation, and the like.
2. End-use level: Assess the contribution of a chemical product to emissions avoided by the use of
a specific low-carbon technology that makes use of the chemical product in place of the
currently implemented product (product composition). Commonly reported reasons for
making such a calculation include in-house purposes (for instance, portfolio planning),
exchanges with partners in the value chain, and communications with stakeholders (investors,
policy planners, general citizens, etc.) on the roles of the chemical industry, and the like.
Each of the levels is exemplified below.
● Chemical product level:
If the study is carried out at the chemical product level, the definition of the functional unit takes
into account the performance of the chemical product and the alternative product. In this case the
avoided emissions calculation is equal to the comparative assertion according to ISO 14040/44,
except that the avoided emissions calculation focuses on greenhouse gas emissions only.
Examples of functional units specified in studies that place emphasis on chemical product level
Production and disposal of 1,000 intake manifolds having thermal resistance of yxz
Production, use and disposal of a resin hardening agent for hardening resin XYZ that is used
when manufacturing 10 wind turbine rotating blades in 30 - 60 seconds
7 Life Cycle Inventory:Environmental load from manufacture to disposal
28
● End-use level:
Chemical products are often intermediate products integrated in technologies that are
manufactured downstream in the value chain. Chemical products may influence the performance
of technologies in such a way that emissions are avoided compared to a specific reference case. To
assess how a chemical product influences an end-user technology, the functional unit of the study is
chosen based on the end-use technology and taking into account the function of the chemical product
in the technology. Examples for definition of functional unit in studies that focus on the end-use level:
Running a medium-sized gasoline automobile for 200,000 kilometers with fuel-efficient tires
using special chemicals vs. regular tires.
Living in an existing single-family detached house in Germany (building year: 1964) with an
average temperature of 19°C for 50 years, with polystyrene insulation and without.
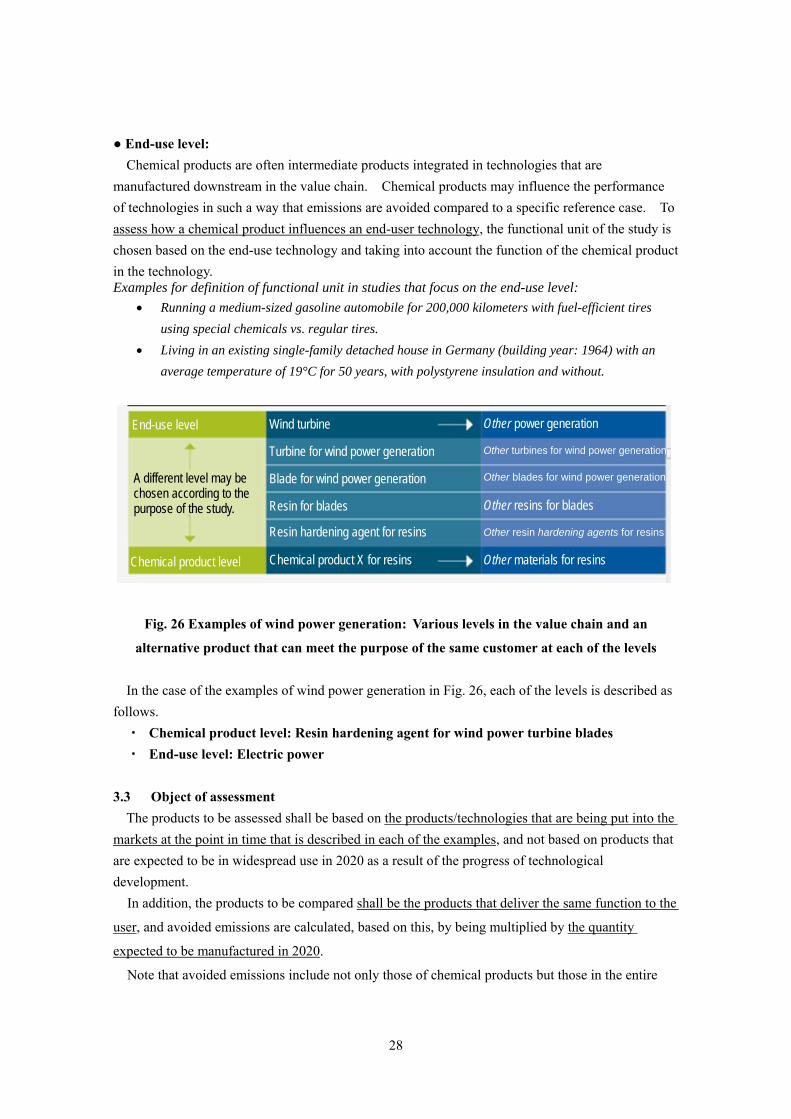
Fig. 26 Examples of wind power generation: Various levels in the value chain and an
alternative product that can meet the purpose of the same customer at each of the levels
In the case of the examples of wind power generation in Fig. 26, each of the levels is described as
follows.
・ Chemical product level: Resin hardening agent for wind power turbine blades
・ End-use level: Electric power
3.3 Object of assessment
The products to be assessed shall be based on the products/technologies that are being put into the
markets at the point in time that is described in each of the examples, and not based on products that
are expected to be in widespread use in 2020 as a result of the progress of technological
development.
In addition, the products to be compared shall be the products that deliver the same function to the
user, and avoided emissions are calculated, based on this, by being multiplied by the quantity
expected to be manufactured in 2020.
Note that avoided emissions include not only those of chemical products but those in the entire
End-use level
A different level may be chosen according to the purpose of the study.
Chemical product level
Wind turbine
Turbine for wind power generation
Resin hardening agent for resins
Chemical product X for resins
Blade for wind power generation
Resin for blades
Other power generation
Other turbines for wind power generation
Other blades for wind power generation
Other resins for blades
Other resin hardening agents for resins
Other materials for resins
29
value chain as well, but at the present point in time no technique is available that quantitatively sorts
out avoided emissions resulting from chemical products and those from non-chemical products, and
therefore no attribution of avoided emissions has been performed.
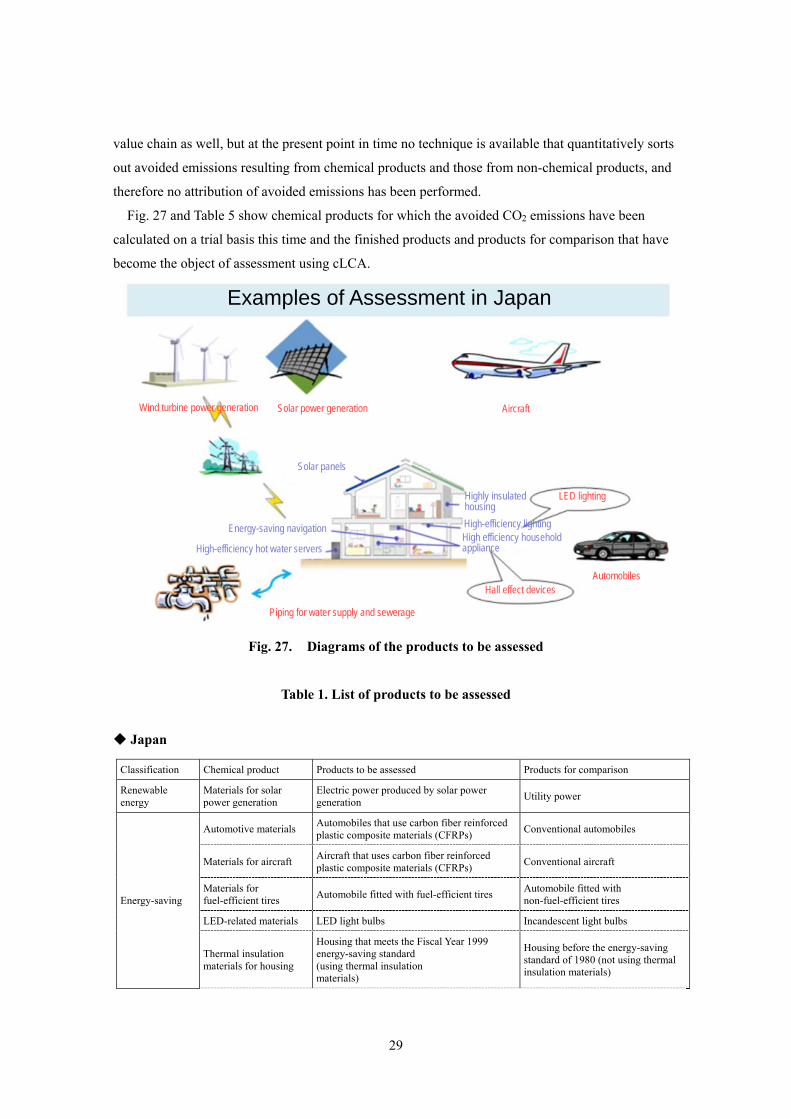
Fig. 27 and Table 5 show chemical products for which the avoided CO2 emissions have been
calculated on a trial basis this time and the finished products and products for comparison that have
become the object of assessment using cLCA.
Fig. 27. Diagrams of the products to be assessed
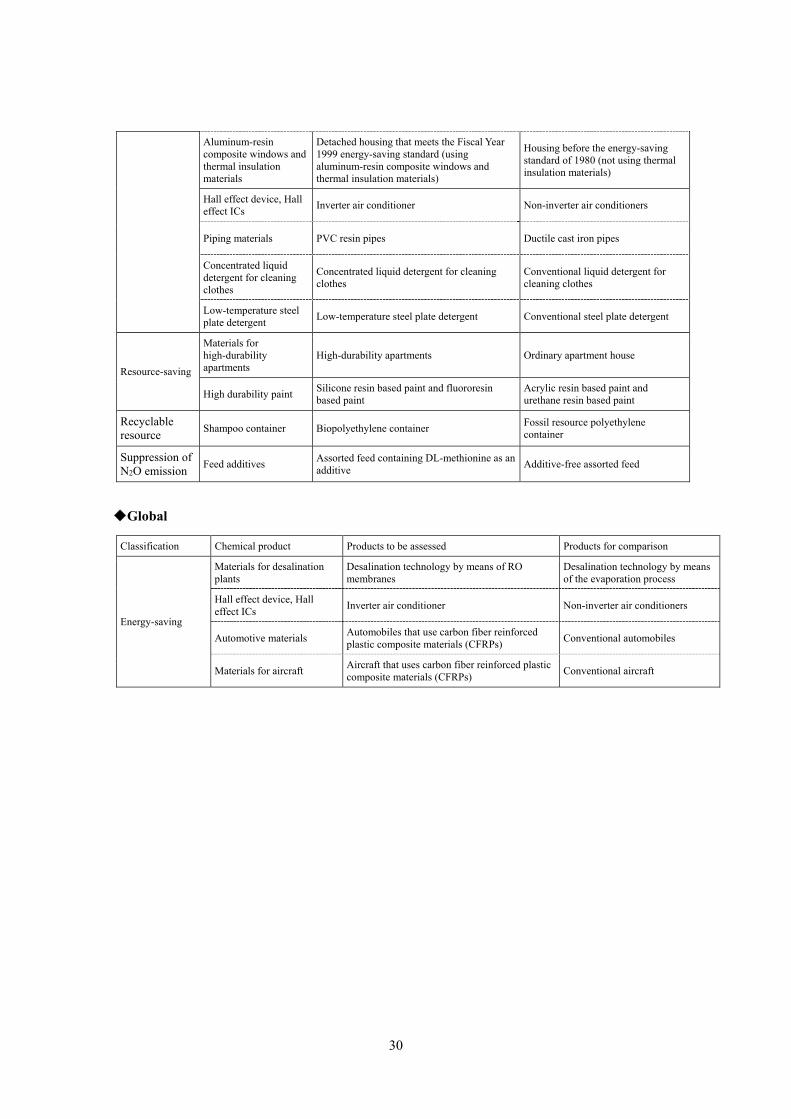
Table 1. List of products to be assessed
Japan
Classification Chemical product Products to be assessed Products for comparison
Renewable energy
Materials for solar power generation
Electric power produced by solar power generation
Utility power
Energy-saving
Automotive materials Automobiles that use carbon fiber reinforced plastic composite materials (CFRPs)
Conventional automobiles
Materials for aircraft Aircraft that uses carbon fiber reinforced plastic composite materials (CFRPs)
Conventional aircraft
Materials for fuel-efficient tires
Automobile fitted with fuel-efficient tires Automobile fitted with non-fuel-efficient tires
LED-related materials LED light bulbs Incandescent light bulbs
Thermal insulation materials for housing
Housing that meets the Fiscal Year 1999 energy-saving standard (using thermal insulation materials)
Housing before the energy-saving standard of 1980 (not using thermal insulation materials)
Examples of Assessment in Japan
Wind turbine power generation Solar power generation Aircraft
Solar panels
Energy-saving navigation
High-efficiency hot water servers
Piping for water supply and sewerage
Highly insulated housing
High-efficiency lightingHigh efficiency household appliance
LED lighting
Automobiles Hall effect devices
30
Aluminum-resin composite windows and thermal insulation materials
Detached housing that meets the Fiscal Year 1999 energy-saving standard (using aluminum-resin composite windows and thermal insulation materials)
Housing before the energy-saving standard of 1980 (not using thermal insulation materials)
Hall effect device, Hall effect ICs
Inverter air conditioner Non-inverter air conditioners
Piping materials PVC resin pipes Ductile cast iron pipes
Concentrated liquid detergent for cleaning clothes
Concentrated liquid detergent for cleaning clothes
Conventional liquid detergent for cleaning clothes
Low-temperature steel plate detergent
Low-temperature steel plate detergent Conventional steel plate detergent
Resource-saving
Materials for high-durability apartments
High-durability apartments Ordinary apartment house
High durability paint Silicone resin based paint and fluororesin based paint
Acrylic resin based paint and urethane resin based paint
Recyclable resource
Shampoo container Biopolyethylene container Fossil resource polyethylene container
Suppression of N2O emission
Feed additives Assorted feed containing DL-methionine as an additive
Additive-free assorted feed
Global
Classification Chemical product Products to be assessed Products for comparison
Energy-saving
Materials for desalination plants
Desalination technology by means of RO membranes
Desalination technology by means of the evaporation process
Hall effect device, Hall effect ICs
Inverter air conditioner Non-inverter air conditioners
Automotive materials Automobiles that use carbon fiber reinforced plastic composite materials (CFRPs)
Conventional automobiles
Materials for aircraft Aircraft that uses carbon fiber reinforced plastic composite materials (CFRPs)
Conventional aircraft
31
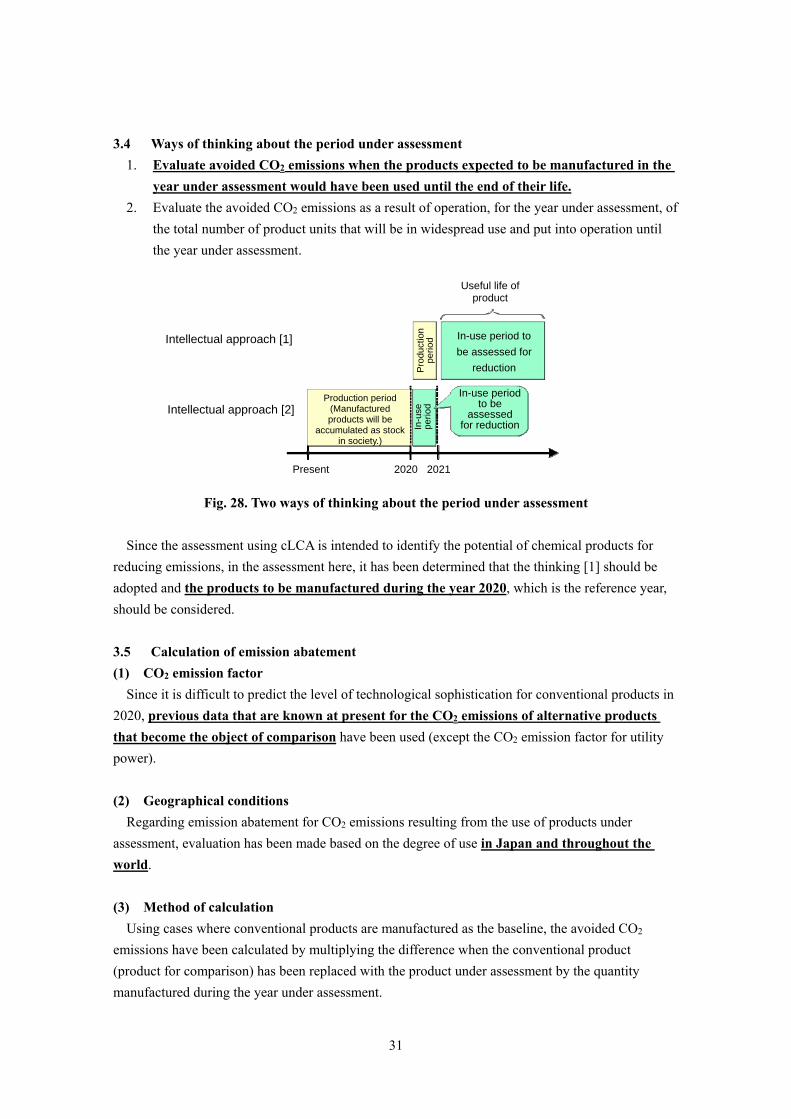
3.4 Ways of thinking about the period under assessment
1. Evaluate avoided CO2 emissions when the products expected to be manufactured in the
year under assessment would have been used until the end of their life.
2. Evaluate the avoided CO2 emissions as a result of operation, for the year under assessment, of
the total number of product units that will be in widespread use and put into operation until
the year under assessment.
Fig. 28. Two ways of thinking about the period under assessment
Since the assessment using cLCA is intended to identify the potential of chemical products for
reducing emissions, in the assessment here, it has been determined that the thinking [1] should be
adopted and the products to be manufactured during the year 2020, which is the reference year,
should be considered.
3.5 Calculation of emission abatement
(1) CO2 emission factor
Since it is difficult to predict the level of technological sophistication for conventional products in
2020, previous data that are known at present for the CO2 emissions of alternative products
that become the object of comparison have been used (except the CO2 emission factor for utility
power).
(2) Geographical conditions
Regarding emission abatement for CO2 emissions resulting from the use of products under
assessment, evaluation has been made based on the degree of use in Japan and throughout the
world.
(3) Method of calculation
Using cases where conventional products are manufactured as the baseline, the avoided CO2
emissions have been calculated by multiplying the difference when the conventional product
(product for comparison) has been replaced with the product under assessment by the quantity
manufactured during the year under assessment.
Useful life of product
Pro
duct
ion
perio
d In-use period to
be assessed for
reduction
In-u
se
perio
d Intellectual approach [2]
Intellectual approach [1]
Production period (Manufactured products will be
accumulated as stockin society.)
In-use periodto be
assessed for reduction
Present 2020 2021
32
Step 1: Calculate the avoided CO2 emissions per unit quantity (e.g. kg, piece) of the product under
assessment.
CO2 emissions over the life cycle per unit quantity of the product for comparison
- CO2 emissions over the life cycle per unit quantity of the product being assessed = A
Step 2: Calculate the avoided CO2 emissions by multiplying A by the quantity of the products
under assessment that are expected to be manufactured in 2020.
Emission abatement of A × Quantity of the products under assessment that are
expected to be manufactured in 2020 (one year)
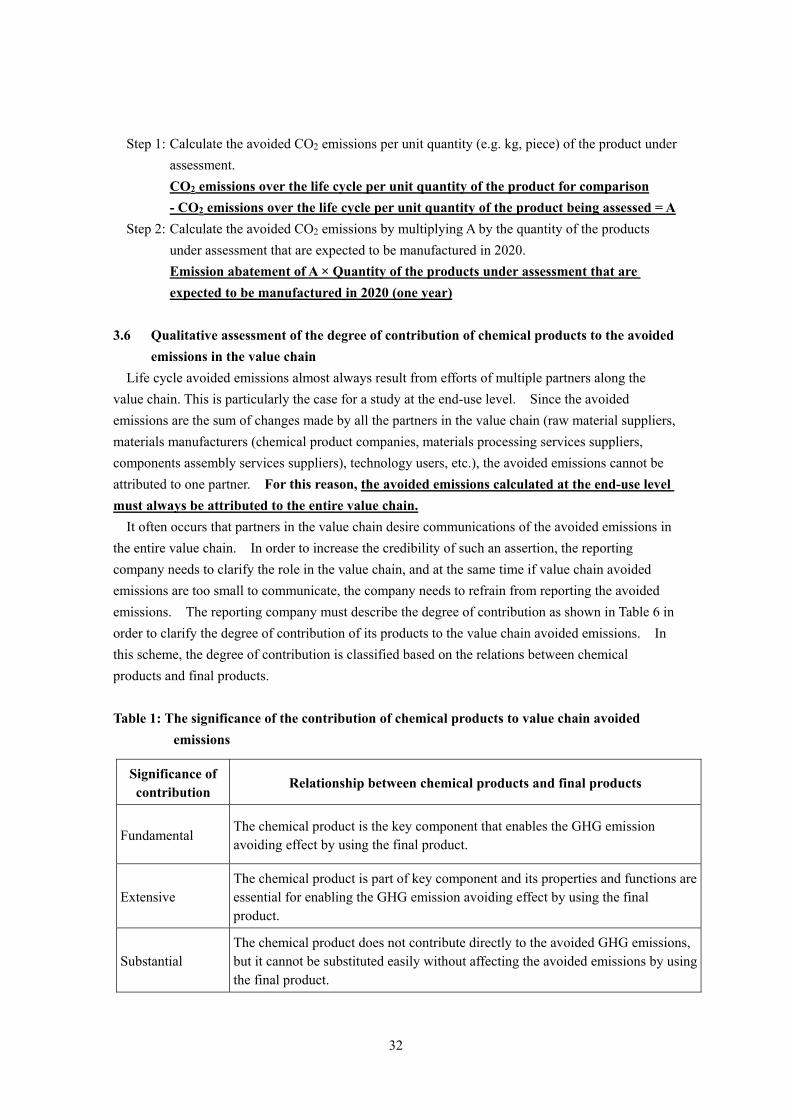
3.6 Qualitative assessment of the degree of contribution of chemical products to the avoided
emissions in the value chain
Life cycle avoided emissions almost always result from efforts of multiple partners along the
value chain. This is particularly the case for a study at the end-use level. Since the avoided
emissions are the sum of changes made by all the partners in the value chain (raw material suppliers,
materials manufacturers (chemical product companies, materials processing services suppliers,
components assembly services suppliers), technology users, etc.), the avoided emissions cannot be
attributed to one partner. For this reason, the avoided emissions calculated at the end-use level
must always be attributed to the entire value chain. It often occurs that partners in the value chain desire communications of the avoided emissions in
the entire value chain. In order to increase the credibility of such an assertion, the reporting
company needs to clarify the role in the value chain, and at the same time if value chain avoided
emissions are too small to communicate, the company needs to refrain from reporting the avoided
emissions. The reporting company must describe the degree of contribution as shown in Table 6 in
order to clarify the degree of contribution of its products to the value chain avoided emissions. In
this scheme, the degree of contribution is classified based on the relations between chemical
products and final products.
Table 1: The significance of the contribution of chemical products to value chain avoided
emissions
Significance of contribution
Relationship between chemical products and final products
Fundamental The chemical product is the key component that enables the GHG emission avoiding effect by using the final product.
Extensive The chemical product is part of key component and its properties and functions are essential for enabling the GHG emission avoiding effect by using the final product.
Substantial The chemical product does not contribute directly to the avoided GHG emissions, but it cannot be substituted easily without affecting the avoided emissions by using the final product.
33
Minor The chemical product does not contribute directly to the avoided GHG emissions, but it is used in the manufacturing process of a fundamentally or essentially contributing product.
Too small to communicate
The chemical product can be substituted without changing the avoided GHG emissions by using the final product.
3.7 Name and description of the organization(s) commissioning the study and that
performing it ("the practitioner")
・ Organization commissioning the study for 19 assessed examples: Japan Chemical Industry
Association (general incorporated association)
・ Practitioner: Japan Chemical Industry Association (general incorporated association)
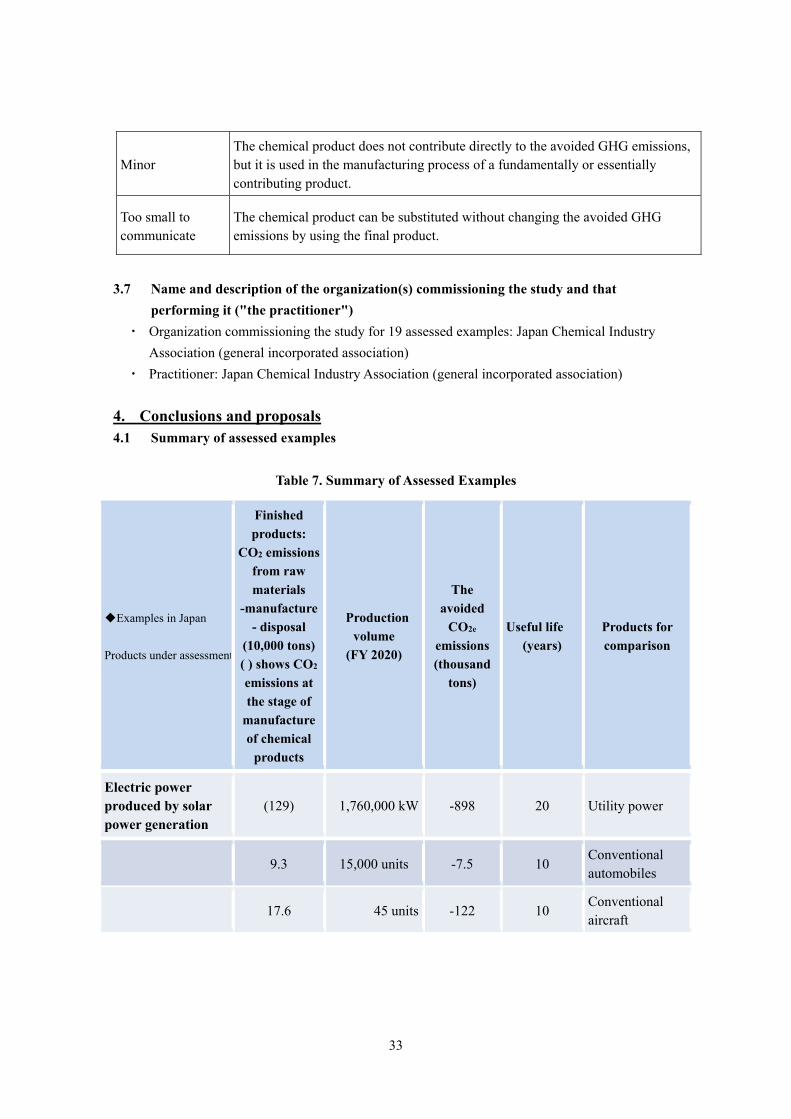
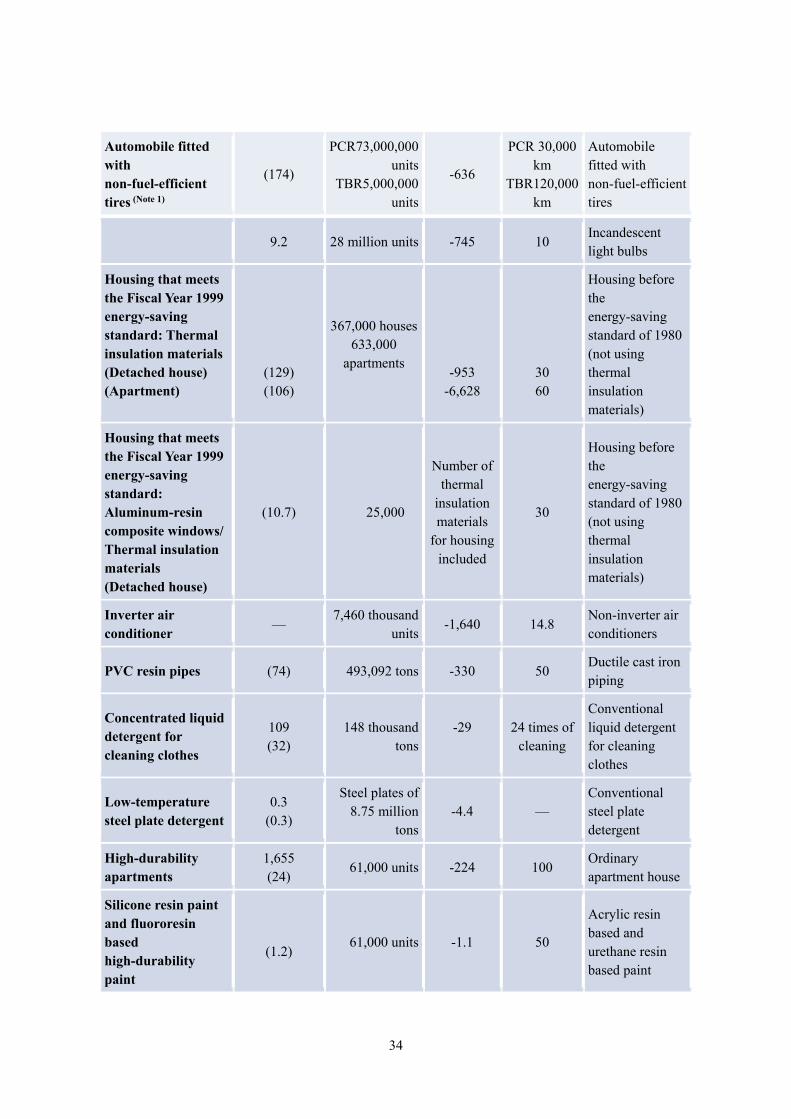
4. Conclusions and proposals 4.1 Summary of assessed examples
Table 7. Summary of Assessed Examples
◆Examples in Japan
Products under assessment
Finished
products:
CO2 emissions
from raw
materials
-manufacture
- disposal
(10,000 tons)
( ) shows CO2
emissions at
the stage of
manufacture
of chemical
products
Production
volume
(FY 2020)
The
avoided
CO2e
emissions
(thousand
tons)
Useful life
(years)
Products for
comparison
Electric power produced by solar power generation
(129) 1,760,000 kW -898 20 Utility power
9.3 15,000 units -7.5 10
Conventional automobiles
17.6 45 units -122 10
Conventional aircraft
34
Automobile fitted with non-fuel-efficient tires (Note 1)
(174)
PCR73,000,000 units
TBR5,000,000 units
-636
PCR 30,000 km
TBR120,000 km
Automobile fitted with non-fuel-efficient tires
9.2 28 million units -745 10
Incandescent light bulbs
Housing that meets the Fiscal Year 1999 energy-saving standard: Thermal insulation materials (Detached house) (Apartment)
(129) (106)
367,000 houses633,000
apartments
-953 -6,628
30 60
Housing before the energy-saving standard of 1980 (not using thermal insulation materials)
Housing that meets the Fiscal Year 1999 energy-saving standard: Aluminum-resin composite windows/ Thermal insulation materials (Detached house)
(10.7) 25,000
Number of thermal
insulation materials
for housing included
30
Housing before the energy-saving standard of 1980 (not using thermal insulation materials)
Inverter air conditioner
— 7,460 thousand
units-1,640 14.8
Non-inverter air conditioners
PVC resin pipes (74) 493,092 tons -330 50 Ductile cast iron piping
Concentrated liquid detergent for cleaning clothes
109 (32)
148 thousand tons
-29
24 times of cleaning
Conventional liquid detergent for cleaning clothes
Low-temperature steel plate detergent
0.3 (0.3)
Steel plates of 8.75 million
tons-4.4 —
Conventional steel plate detergent
High-durability apartments
1,655 (24)
61,000 units -224 100 Ordinary apartment house
Silicone resin paint and fluororesin based high-durability paint
(1.2)
61,000 units -1.1 50
Acrylic resin based and urethane resin based paint
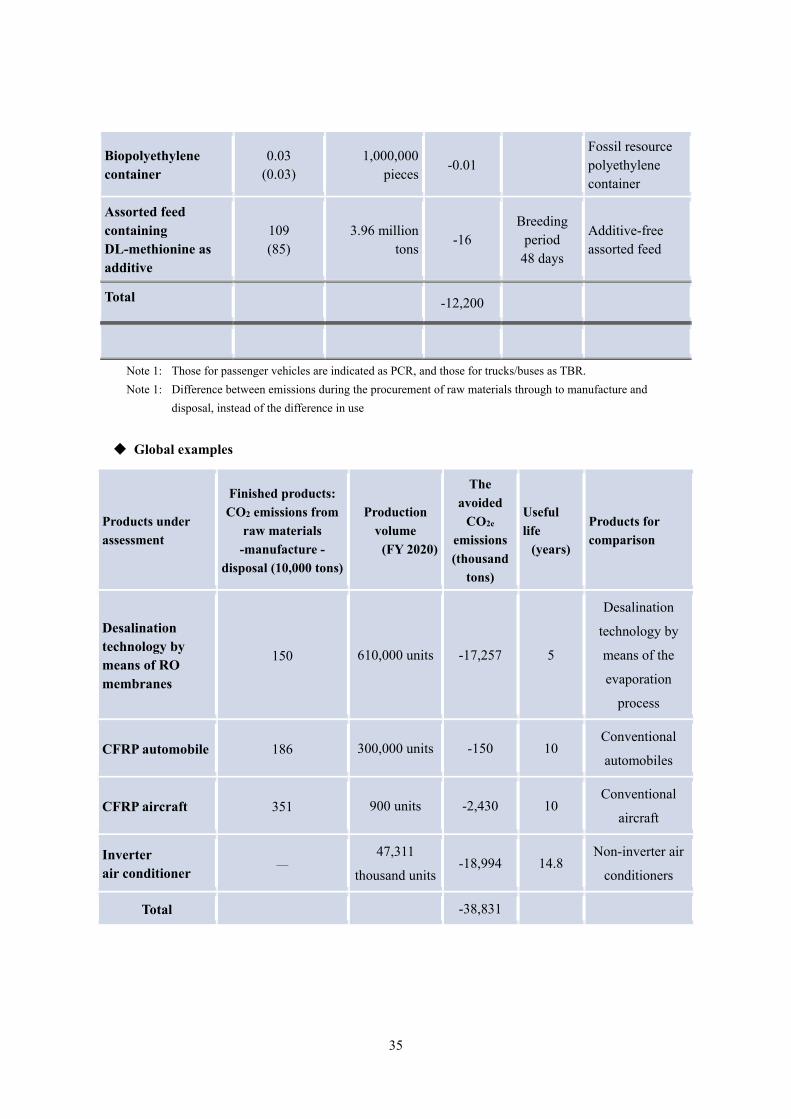
35
Biopolyethylene container
0.03 (0.03)
1,000,000 pieces
-0.01 Fossil resource polyethylene container
Assorted feed containing DL-methionine as additive
109 (85)
3.96 million tons
-16 Breeding
period 48 days
Additive-free assorted feed
Total -12,200
Note 1: Those for passenger vehicles are indicated as PCR, and those for trucks/buses as TBR.
Note 1: Difference between emissions during the procurement of raw materials through to manufacture and
disposal, instead of the difference in use
Global examples
Products under
assessment
Finished products:
CO2 emissions from
raw materials
-manufacture -
disposal (10,000 tons)
Production
volume
(FY 2020)
The
avoided
CO2e
emissions
(thousand
tons)
Useful
life
(years)
Products for
comparison
Desalination technology by means of RO membranes
150 610,000 units -17,257 5
Desalination
technology by
means of the
evaporation
process
CFRP automobile 186 300,000 units -150 10 Conventional
automobiles
CFRP aircraft 351 900 units -2,430 10 Conventional
aircraft
Inverter air conditioner
— 47,311
thousand units-18,994 14.8
Non-inverter air
conditioners
Total -38,831
36
4.2 Conclusions and proposals
It can be seen from the total for the examples, chemical products are a key material in reducing
CO2e emissions by about 120 million tons in Japan and by about 390 million tons globally. Note that
the avoided CO2e emissions include not only those from chemical products but those from other
products related to raw materials and parts as well. Life cycle avoided emissions almost always
result from efforts of multiple partners along the value chain, and therefore no attribution of avoided
emissions to each constituent product has been performed.
Also, it can be inferred from the examples that chemical products contribute to the reduction in
GHG emissions for finished products in various fields, such as the energy sector (solar power
generation), consumer and home sector (LED light bulbs, housing, air conditioners, piping,
automobiles, detergents, shampoos), transportation sector (automobiles, aircraft), etc., in cooperation
with products that are related to other materials for processing and parts.
5. Plans to be pursued by the chemical industry hereafter In the "Keidanren’s Commitment to a Low Carbon Society," "Contribution to reduction
through the spreading of low-carbon products," "Promotion of international contributions"
and "Development of innovative technologies" were regarded as principal areas of activities, in
addition to the efforts for the reduction in CO2 emissions produced during the manufacture of
chemical products, and the activities were started in Fiscal Year 2013.
5.1 Contribution to reduction through the spreading of low-carbon products: Increasing the
number of examples of assessment using cLCA in Japan and around the world
In order to promote CO2 emissions reduction, it is important that measures be taken from the
perspective of pursuing total optimization that provides a bird's eye view of the entire life cycle,
from the procurement of raw materials, through manufacture, distribution and consumption, to
recycling/disposal, rather than from the perspective of partial optimization such as the reduction in
CO2 emissions in the manufacturing sector.
The role of the chemical industry is to contribute to CO2 emissions reduction in society as a whole
through the supply chain by the development and spreading of chemical products and technologies.
It can be said that the implementation of cLCA here, as shown in the fifteen examples in Japan
and four international examples, is very significant in view of the magnitude of the avoided CO2
emissions that has been shown will be achieved by the contribution of the chemical industry in Japan.
However, final products that are low in carbon, with which chemical products help to reduce CO2
emissions, are not limited to those in the 19 examples here. There are plans to expand that examples
of cLCA to include those of materials for the next generation of automobiles (materials for weight
reduction, materials for secondary batteries, materials for fuel cells, etc.), thermal insulation
members for high-efficiency architecture, materials for wind turbine power generation, etc.
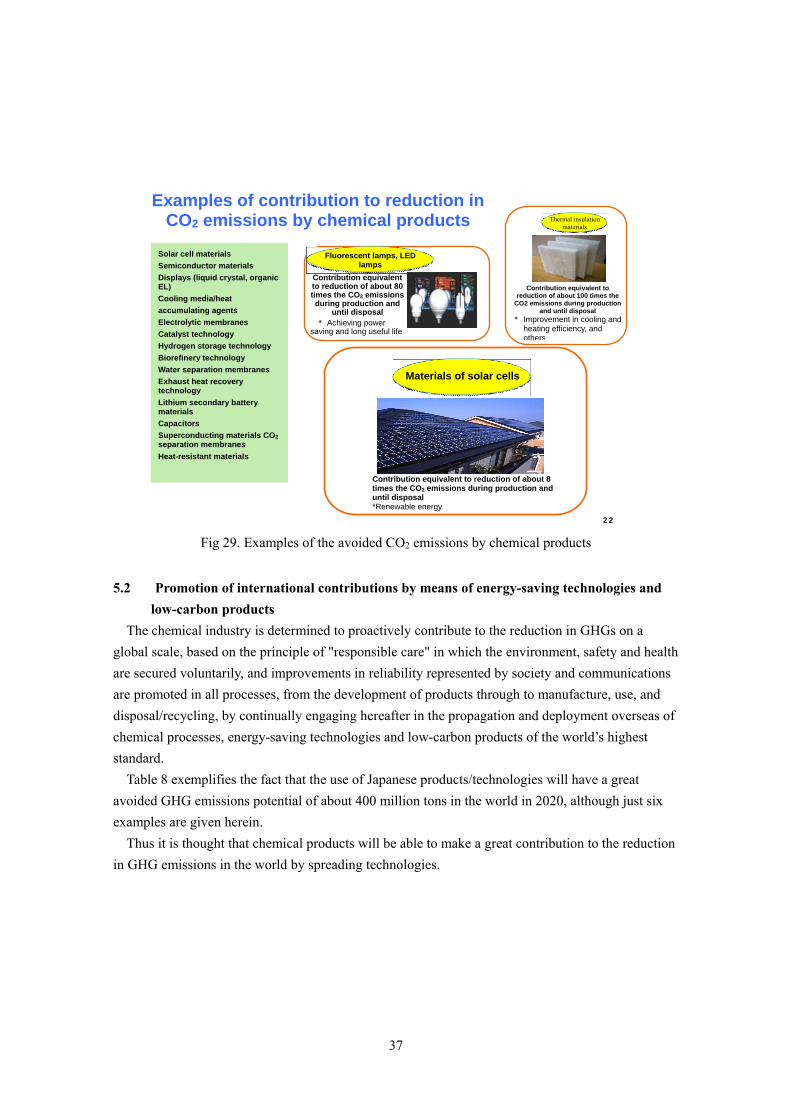
37
Fig 29. Examples of the avoided CO2 emissions by chemical products
5.2 Promotion of international contributions by means of energy-saving technologies and
low-carbon products
The chemical industry is determined to proactively contribute to the reduction in GHGs on a
global scale, based on the principle of "responsible care" in which the environment, safety and health
are secured voluntarily, and improvements in reliability represented by society and communications
are promoted in all processes, from the development of products through to manufacture, use, and
disposal/recycling, by continually engaging hereafter in the propagation and deployment overseas of
chemical processes, energy-saving technologies and low-carbon products of the world’s highest
standard.
Table 8 exemplifies the fact that the use of Japanese products/technologies will have a great
avoided GHG emissions potential of about 400 million tons in the world in 2020, although just six
examples are given herein.
Thus it is thought that chemical products will be able to make a great contribution to the reduction
in GHG emissions in the world by spreading technologies.
22
Contribution equivalent to reduction of about 8 times the CO2 emissions during production and until disposal *Renewable energy
Solar cell materials
Semiconductor materials
Displays (liquid crystal, organic EL)
Cooling media/heat
accumulating agents
Electrolytic membranes
Catalyst technology
Hydrogen storage technology
Biorefinery technology
Water separation membranes
Exhaust heat recovery technology
Lithium secondary battery materials
Capacitors
Superconducting materials CO2 separation membranes
Heat-resistant materials
Examples of contribution to reduction in CO2 emissions by chemical products
Fluorescent lamps, LED lamps
Contribution equivalent to reduction of about 80 times the CO2 emissions during production and
until disposal * Achieving power
saving and long useful life
Contribution equivalent to reduction of about 100 times the
CO2 emissions during production and until disposal
* Improvement in cooling andheating efficiency, and others
Materials of solar cells
Thermal insulation materials
Thermal insulation materials
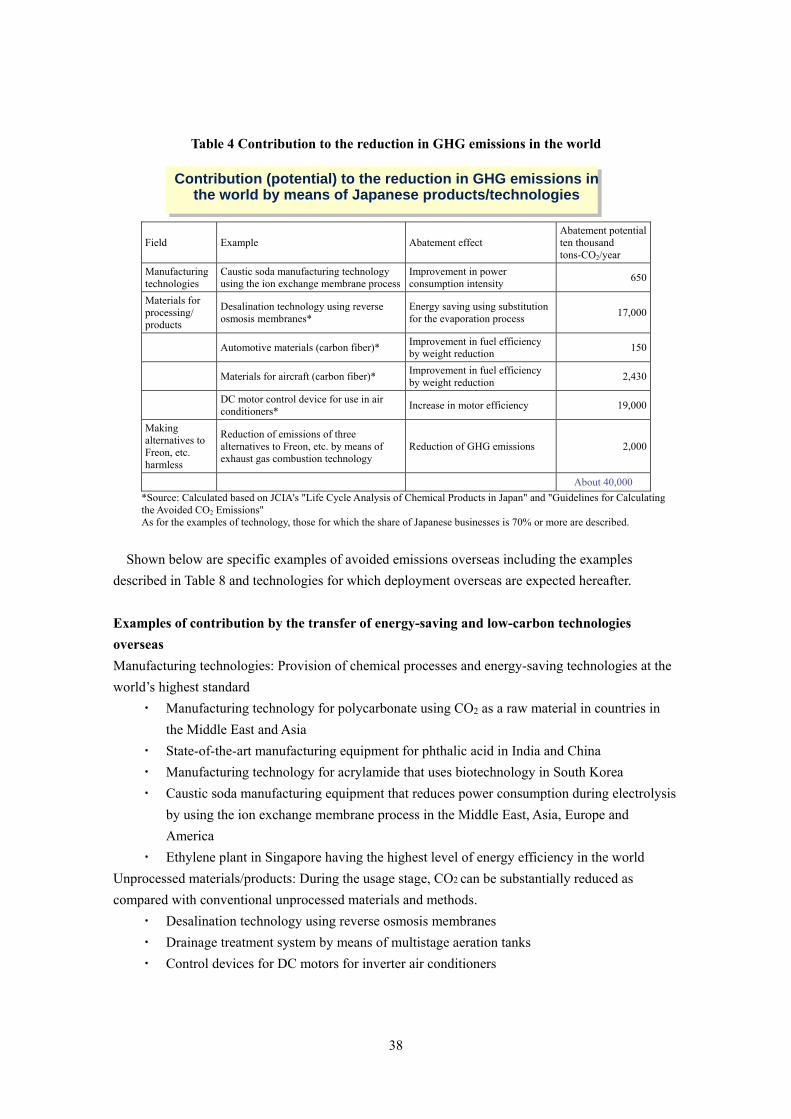
38
Table 4 Contribution to the reduction in GHG emissions in the world
Field Example Abatement effect Abatement potential ten thousand tons-CO2/year
Manufacturing technologies
Caustic soda manufacturing technology using the ion exchange membrane process
Improvement in power consumption intensity
650
Materials for processing/ products
Desalination technology using reverse osmosis membranes*
Energy saving using substitution for the evaporation process
17,000
Automotive materials (carbon fiber)* Improvement in fuel efficiency by weight reduction
150
Materials for aircraft (carbon fiber)* Improvement in fuel efficiency by weight reduction
2,430
DC motor control device for use in air conditioners*
Increase in motor efficiency 19,000
Making alternatives to Freon, etc. harmless
Reduction of emissions of three alternatives to Freon, etc. by means of exhaust gas combustion technology
Reduction of GHG emissions 2,000
About 40,000
*Source: Calculated based on JCIA's "Life Cycle Analysis of Chemical Products in Japan" and "Guidelines for Calculating the Avoided CO2 Emissions" As for the examples of technology, those for which the share of Japanese businesses is 70% or more are described.
Shown below are specific examples of avoided emissions overseas including the examples
described in Table 8 and technologies for which deployment overseas are expected hereafter.
Examples of contribution by the transfer of energy-saving and low-carbon technologies
overseas
Manufacturing technologies: Provision of chemical processes and energy-saving technologies at the
world’s highest standard
・ Manufacturing technology for polycarbonate using CO2 as a raw material in countries in
the Middle East and Asia
・ State-of-the-art manufacturing equipment for phthalic acid in India and China
・ Manufacturing technology for acrylamide that uses biotechnology in South Korea
・ Caustic soda manufacturing equipment that reduces power consumption during electrolysis
by using the ion exchange membrane process in the Middle East, Asia, Europe and
America
・ Ethylene plant in Singapore having the highest level of energy efficiency in the world
Unprocessed materials/products: During the usage stage, CO2 can be substantially reduced as
compared with conventional unprocessed materials and methods.
・ Desalination technology using reverse osmosis membranes
・ Drainage treatment system by means of multistage aeration tanks
・ Control devices for DC motors for inverter air conditioners
Contribution (potential) to the reduction in GHG emissions in the world by means of Japanese products/technologies
39
Treatment for making three alternatives to Freon harmless:
・ Reduction in the emissions of three alternatives to Freon by the installation of exhaust gas
combustion equipment
For the results in 2012, achieved substantial reduction in PFCs to 92% and in SF6 to 95%,
using the basic unit for emissions relative to that in the reference year. From now on,
reduction in greenhouse gas emissions through transfer of technologies overseas will be
promoted in cooperation with the national government as well, through the use of
production technologies for reducing the emissions of alternatives to Freon and through the
use of exhaust gas combustion equipment that is possessed by businesses.
5.3 Development of innovative technologies
The chemical industry uses fossil fuel both as fuel and as raw materials, and the development of
innovative technologies both in terms of raw materials and fuel is an important problem to be
addressed on a mid to long-term basis.
For this reason, considering the situation in 2020 and thereafter, we will promote development by
sharing the roadmap and cooperating with the national government regarding the technical problems
and barriers to be overcome in development. It is also important that information concerning the
contribution to such environmental aspects be transmitted by implementing quantitative assessments,
such as that carried out by using cLCA with regard to such technical development.
Major mid and long-term technical development in the chemical industry is shown below.
[1] Innovative process development
・ Development of innovative processes that reduce waste and byproducts
・ Development of innovative processes for naphtha decomposition
・ Development of distillation and separation technology by means of precision separation
membranes
・ Development of high-efficiency separation and refining processes for byproduct gases by
means of high-performance porous materials
[2] Development of chemical product manufacturing processes that do not use fossil fuels
・ Development of chemical product manufacturing processes that use CO2 as raw materials
・ Development of processes for manufacturing propylene from cellulose-based biomass
ethanol
[3] Development of the next generation of high-performance materials that contribute to
reduction in GHG emissions in terms of LCA
・ Thermal insulation materials for high efficiency construction
・ Solar cell materials (high efficiency compound semiconductors, organic based solar cells,
etc.)
・ Next-generation automobiles
・ Materials for weight reduction (engineering plastics, etc.)
・ Parts for secondary batteries (positive electrode materials, negative electrode materials,
electrolytic fluids, separators, etc.)
40
・ Parts for fuel cells (catalysts, solid electrolytes)
・ Next-generation high-efficiency lighting (high efficiency LEDs, organic EL, etc.)
・ Materials for flat panel displays (organic EL, etc.)
・ Materials for high-efficiency heat pumps (cooling medium, heat accumulating agent)
・ CO2 separation membranes, hydrogen manufacturing, and storage technologies, etc.
[4] Development of chemical technologies and creation of new parts, materials and products in
line with the "Cool Earth Innovative Energy Technology Plan"
41
6. Review for cLCA Report (Third Edition) 6.1 Overview of the review
During the period from December 2013 through January 2014, the "cLCA Report - Third Edition"
was presented to a panel of experts and their opinions were solicited. Four people expressed their
opinions: Masahiko Hirao (committee chairperson, Professor, Department of Chemical System
Engineering, School of Engineering, the University of Tokyo), Atsushi Inaba (Professor, Department
of Environmental and Energy Chemistry, Kogakuin University), Yasunari Matsuno (Associate
Professor, Department of Materials Engineering, School of Engineering, the University of Tokyo),
and Yuki Hondo (Professor, Graduate School of Environment and Information Sciences, Yokohama
National University).
Note that the four people in charge of the review were not concerned with obtaining the data used
in the investigation, and did not directly verify the completeness, representativeness, accuracy, etc.
of the data given in the report. Hence, the data used for calculation and the values themselves
obtained as the result of calculation are outside the scope of the review.
The matters pointed out are described below by itemizing them as the "Overview of the result of
review."
6.2 Opinions and response of the panel of experts on the cLCA Report (third edition)
(1) Opinions of the experts
1) Levels in the value chain
・ It is felt that regarding the selection of levels in the value chain, all the examples given are
those at the end-use level. Assuming that the stage of chemical products being used (the
stage after cleaning in the case of a steel plate detergent; the stage after coating in the case
of a paint) is the end-use level, it can also be said that both the steel plate detergent and the
paint are not at the chemical product level, but are at the end-use level. Also, if a
consumer is given the status of being at the end-use level, such examples can also be
regarded as being at the chemical product level, and in this respect it is difficult to make a
judgment on the status of the value chain level. Concerning the terms to be used,
classification of the terms such as the unprocessed material level, final product level, and
process level might also be necessary.
・ Explanations based on the chemical product level and end-use level only are not easy to
understand. The grouping of levels into unprocessed material level, part level, and
process level could also be required.
・ ・All the examples given appear to be those at the end-use level. The explanations given
in page 15 of the Global Guidelines ("Addressing the Avoided GHG Emissions Challenge")
based on the chemical product level and the end-use level are not easy to understand. In
addition, in the case of the chemical product level, it is thought that the comparison may
also be equal to comparative assertion if the provisions of ISO 14040/44 are to be followed,
and so measures for addressing such a comparison will be required.
・ In the example of a shampoo container, it appears to be at the end-use level if the study is
focused on the shampoo container.
42
・ If it is said that the study focuses on the chemical product level, perhaps the name should
be changed to a resin for shampoo containers.
・ Regarding the value chain level and system boundary, methods of representation vary
between those at the end-use level and those at the chemical product level for the topic of
the entire value chain and for the system boundary part. In particular, differences in
representation at the chemical product level between those for the topic of the entire value
chain and those for the system boundary part might be perplexing.
・ It is better to clearly indicate the selected level in the diagram of the value chain.
2) Degree of contribution
[1] About Table 2 in the Global Guidelines
・ In the case of the chemical product level, if "Fundamental" is selected as the degree of
contribution, a mismatch may occur with the specific contents of description of the degree
of contribution ("The chemical product is the key component that enables the GHG
emission avoiding effect by using the final product."), which might cause
misunderstanding.
・ Also, the translation into Japanese "Kansetsu Koken" (which means "indirect contribution"
in Japanese) of the term "minor" may be regarded as indirect contribution that is used for
an effect obtained by recycling, and the like. Also, in the English language as well, a term
corresponding to indirect contribution exists ("Indirect") aside from "minor," and the
Japanese translation may also be regarded as the term corresponding to it, which might
result in misunderstanding that "indirect contribution" is small.
・ The Japanese translation should elaborate on expressions. For example, the term
"Hitsuyo Fukaketsu" (which means indispensable in Japanese) may also be construed as
having the meaning of fundamental or essential. Another possible way of thinking might
be that the portions indicating the degree of contribution shall not be translated, but shall be
represented by numbers or the alphabet, thereby giving an indication that shows the order
of priority to some extent.
・ The term "Contribution" has two different meanings: (1) Contribution to reduction in CO2
emissions; (2) Contribution for realizing the product to be assessed that enables reduction
in CO2 emissions (essential product/technology), and therefore it is thought that ways of
using expressions that prevent confusion between them are important.
[2] About the judgment criteria for the degree of contribution
・ The degree of contribution involves factors such that the portion to be marked with "○"
may vary with the perspective. It becomes a problem if a different judgment is reached
by each perspective.
・ How about representing the evaluation of the degree of contribution of products by using
two axes? Specifically, how about depicting the intermediate product through final
product on the horizontal axis and describing the degree of contribution to emissions
reduction on the vertical axis?
Also, how about depicting contribution enabled by processes separately?
43
3) Others
[1] The Global Guidelines state in 3.3.4 that the typical duration of a reference period is one year.
Perhaps the calculation of avoided emissions for each of the examples should be made on a
per-year basis.
[2] About assessed examples overseas
Not only in the chemical industry, Japanese technologies and products play a very large role
overseas, and therefore it is desirable that assessment should not be limited to that in Japan
only, and more examples of chemical products that are in widespread use overseas/in the
world as well as of Japanese chemical technologies should be described.
4) Individual matters
[1] Materials for solar power generation
・ There is no diagram for the system boundary for utility power which is the product for
comparison, and it is not clear whether an evaluation of equipment required for power
generation has been made. In addition, in all the other examples the system boundary for
products for comparison is stated clearly, and it needs to be stated clearly for solar power
generation as well.
・ In solar power generation, it is appropriate to assess the equipment required for the
manufacture of electric power as well. This is also true of power generation such as
thermal power generation, hydropower generation, nuclear power generation, etc. While
on the other hand, in general, manufacturing equipment (plant and equipment for producing
products) is not included in the object of assessment in LCA, although it may depend on
the product to be assessed, or its assessment is often omitted. Actually in the other
examples included in this report, manufacturing equipment is not included in the object of
assessment. Hence, it is desirable that power generation should be regarded as a special
case and this point should be clearly stated.
・ In the sentence in 3. Product comparison, the following description is necessary, but it is
appropriate that the description should not be included in 3., but should be included in
some other place. "If the rate of electric power production by solar power generation
increases, which is a mode of power generation that is likely to be affected by weather
conditions, there may be a possibility that preparatory equipment and facilities will
additionally be required in order to realize stable electric power supply. At the present
stage, there are no examples of assessment of CO2 emissions which was carried out bearing
in mind such a mode of electric power supply in the future, and therefore in this example
the comparison has been restricted to that of CO2 emissions in the life cycles of solar power
generation and utility power."
[2] Aluminum-resin composite window and thermal insulation materials
In the preceding chapter 1.6 for thermal insulation materials for housing, cLCA of housing
that uses thermal insulation materials was carried out. Perhaps relations with this report
should be described.
44
Regarding the examples of thermal insulation materials only and the examples of composite
window & thermal insulation materials, partly because their chapters are provided
successively, confusion may occur as to whether the effect of the window has been added to
the effect of thermal insulation materials or whether evaluations were made independently
from each other, and therefore it is better to avoid any possibility of misunderstanding.
For example, differences such as those given below, need to be described.
• Difference in boundary between the two (Tokyo and the entire Japan)
• Whether the effect of thermal insulation materials is incorporated into the calculation in
the cLCA for the window frame (explanations should be made in an easy-to-understand
way).
[3] Concentrated liquid detergent for cleaning clothes
・ In order to realize contribution to reduction, cooperation from consumers is necessary, such
as ensuring that the setting of "rinsing with water once" will be put into practice. Perhaps
this point should also be described as a factor of uncertainty.
・ Regarding the matters related to the stage of disposal of containers, calculation is made by
referring to the PCR of the CFP system. Although it may depend on the unprocessed
materials of containers, the ratio of incineration has increased in the PCR, and this is also a
method of calculation in which the effect given by the recycling of container packages is
not sufficiently reflected. Fundamentally, when carrying out life cycle assessment, the
effect given by recycling should also be reflected.
However, in this example, there is no problem because the result gives conservative values
and transparency of the data is also ensured.
[4] Low-temperature steel plate detergent
"Fundamental" is selected as 6. Degree of contribution. On the other hand, in the column
for the "Relations between chemical products and final products" in the table, the words "that
enables the GHG emission avoiding effect by using the final product" are stated, but what is
the final product?
[5] Shampoo container
Perhaps the calculation boundary for the amount of consumption of water resources in 11.
should be different from the calculation boundary for GHG emissions.
How about describing the amount of water consumption at the container level by also
creating a new item, if possible?
For example, it is better to include the item in Appendix, thereby stating clearly that such an
item is evaluated separately from the evaluation of the calculation of GMG emissions.
(2) Response to the opinions
1) Level in the value chain
The level in the value chain was described in the 16 examples and presented to the experts.
On the basis of the opinions given by reviewers, it has been decided to examine the following
points as the problems to be addressed hereafter, and not to clearly state the level this time.
45
・ Examination will be implemented so that reasonable explanations can be made on a wide
range of examples, not only using the concept of the chemical product level and end-use
level, but also giving explanations, etc. in the classification into unprocessed materials,
parts, and processes.
・ When the selection criteria for the level in the value chain have been clarified, the selected
level will be clearly indicated in the value chain diagram.
2) Degree of contribution
The degree of contribution was described by using 16 examples and presented to the experts.
On the basis of the opinions given by reviewers, it has been decided to examine the following
points as the problems to be addressed hereafter, and not to clearly state the degree of
contribution this time.
[1] Portion of the Japanese translation in Table 2 of the Global Guidelines
Expressions that match the contents of the "Degree of contribution of chemical products to
value chain avoided emissions" will be reexamined.
[2] Judgment criteria for the degree of contribution
Judgment criteria will be clarified including the examination of the methods of indication of
the degree of contribution in products and processes, and explanations will also be elaborated
on so that the judgment criteria are easy to understand.
3) Others
[1] In the examples, avoided CO2 emissions when the products expected to be manufactured in
the year (2020) under assessment would have been used until the end of their life are
evaluated. A description is given to that effect in 4.4 "Temporal and geographical
standards" in each of the examples.
[2] From now on, efforts will be made to expand the examples that have already been published.
The chemical industry has participated in the "Keidanren’s Commitment to a Low-Carbon
Society" that started in Fiscal Year 2013, and is engaging in work for the "Promotion of
international contributions" as one of the four principal areas of activities. It is planned that
examples of reduction in GHG emissions in the world by using Japanese products and
technologies will also be reported in the " Commitment to a Low-Carbon Society."
4) Individual matters
[1] Materials for solar power generation
・ Whether or not evaluation has been carried out concerning the equipment required for
power generation has been stated clearly.
・ The following has been described in the item of "10. Problems to be addressed."
"If the rate of electric power production by solar power generation increases, which is a
mode of power generation that is likely to be affected by weather conditions, there may be
a possibility that preparatory equipment and facilities will additionally be required in order
to realize stable electric power supply. At the present stage, there are no examples of
46
assessment of CO2 emissions which was carried out bearing in mind such a mode of
electric power supply in the future, and therefore in this example the comparison has been
restricted to that of CO2 emissions in the life cycles of solar power generation and utility
power."
[2] Aluminum-resin composite window and thermal insulation materials
1.7 Added sentences that describe the relations with 1.6 "thermal insulation materials for
housing" as 10. in 1.7 "Aluminum-resin composite window and thermal insulation materials."
[3] Concentrated liquid detergent for cleaning clothes
In "9. Study Limitations and Future Recommendations," sentences concerning cooperation to
be given by consumers have been added.
[4] Low-temperature steel plate detergent
Steel plate is assumed to be the final product. Note that with regard to the term "final
product," "solution" is used in the original English text, and the "final product" has been used
when translating the text into Japanese.
[5] Shampoo container
The calculation of the amount of consumption of water resources in the life cycle of
shampoos has been described in Appendix.
6-3. Pending problems since the issuance of the first and second editions
(Opinions of the experts)
Concerning the avoided CO2 emissions in 2020
The calculation of the avoided CO2 emissions in 2020 was made on condition that the products
under assessment were excluded. This method may be good for product comparison, but with regard
to emission abatement as of 2020, it is thought that the present scenario is insufficient. How about
examining a new scenario as a problem to be addressed hereafter?
(Response to the opinions)
Considering this issue as the problem to be addressed hereafter in JCIA's LCA WG, work will be
performed while soliciting guidance from the experts as well.
7. Acknowledgements We would like to express our gratitude to Mizuho Information & Research Institute, Inc., K.K.
Industrial Information Research Center, K.K. Etisa, and the experts of the Review Committee
(Committee chairperson Mr. Hirao, Committee member Mr. Inaba, Committee member Mr. Matsuno,
and Committee member Mr. Hondo) for the guidance and support provided by them in the issuance
of this report.