Embed Size (px)
Citation preview

Thinking Science Australia: Improving teaching and learning through
science activities and reasoning
Mary Oliver, Grady Venville & Philip Adey*
University of Western Australia
* King‟s College London
Abstract
„Thinking skills‟ is one of the eight general capabilities explicitly included in the content
description and achievement standards of the recently released draft Australian Curriculum:
Science. Unfortunately, it is often not clear to teachers how they can successfully teach
thinking skills to students and make a difference to their achievement. The significance of
this research is that it is providing science teachers and students an opportunity to participate
in a program of science activities that has the potential to enhance the students‟ reasoning
capacity. The aim of this paper is to outline the „Thinking Science Australia‟ project and to
examine some of the initial data from this project. Teachers from eleven schools in WA were
provided with two days professional development on Thinking Science, a program initially
developed in the UK. Data collection involved observation of the implementation of the
thinking activities in Year 8 and focus group interviews with teachers about how best to adapt
the activities to the Australian school environment. A baseline cognitive test was
administered to participating students. Findings from the focus group interviews and the
classroom observations (including short video clips) will be presented as well as an overview
of the baseline test results.
Words – 199 (200 limit)
Paper presented at the Australasian Science Education Research Association Annual
Conference, Shoal Bay, NSW, June 30th
– July 3rd
2010

Oliver, Venville & Adey 1
Thinking Science Australia: Improving teaching and learning
through science activities and reasoning
Thinking Science Australia is an ARC funded research project between The
University of Western Australia and King‟s College, London to develop a cognitive
acceleration program suitable for Australian schools.
Positive impact of cognitive acceleration (CA) programs have been shown to confer
considerable benefits upon students in several peer reviewed studies (Adey & Shayer,
1990, 1993, 1994; Adey, Robertson & Venville, 2002; Shayer & Adhama, 2007;
(General Teaching Council for England, 2001; Higgins, Baumfield and Hall, 2007).
Systematic reviews of data, called meta analyses, are used to determine policy and
practice in medicine and have been undertaken to examine the effect of thinking
skills. Data show that the Thinking Science program has a demonstrable impact on
student cognition.
„Thinking‟ lessons can be taught and since they have such far-reaching consequences
in terms of raising the achievement of students across the curriculum, then it seems
reasonable to suggest that some long-term improvement to intelligence has occurred.
So how are these cognitive acceleration programs different from other thinking
lessons?
Renowned educators such as De Bono, Gardner and Lane Clarke have contributed to
the general discussion about raising awareness of the need for critical thinkers and of
the role schools play in facilitating change and development in student thinking.
Teachers are urged to encourage their students to use „thinking hats‟ to solve
problems, spiral different „thinking types‟ and ensure that various different
intelligences are addressed in students through the design of the curriculum. The „feel
good‟ factor does not necessarily translate into improved cognition or improved
achievement. Howard Gardner commented in a keynote paper at the World
Conference on Science and Technology Education recently held in Perth that even
though he feels there is much value in the classroom interpretations of his theory of
multiple intelligence, “the major scientific work on the plurality of intellect remains to
be done” (Gardner, 2007, p. 3).
So, however strong the claims may initially appear, there is no or little evidence for
many of the popular approaches used by teachers to encourage students to think in the
classroom.
Evidence-based program
The evidence of the effect of the cognitive acceleration through science education
(CASE) on students‟ cognitive growth and academic achievement has been published
in a number of forms over the years. The original experiment, with only about 130
students (Adey & Shayer, 1994), as well as more recent work, with over 2000
students from 11 schools (Shayer, 1999; Shayer & Adey, 2002), both demonstrated
that students participating in CASE during Year 7 and Year 8 showed improved
cognition on Piagetian-based reasoning tasks compared with students in control
schools. Moreover, the improvement was sustained and impacted on performance at
the (UK) General Certificate of Secondary Education (GCSE) results three years after
the intervention program had ended, not only in science, but also in mathematics and

Oliver, Venville & Adey 2
English. The value-added effect translated into an average whole grade improvement
in science at GCSE (1.05 grades; 0.6 standard deviations) and similar improvements
in mathematics (0.95 grades; 0.5 standard deviations) and English (0.90 grades; 0.57
standard deviations) (Adey & Shayer, 1994).
Figure 1 (provided by Philip Adey, King's College London) shows the results from
the larger CASE research project (Shayer, 1999) in graphical form. The horizontal
axis is the mean student score on a cognitive development test when students entered
the school in Year 7. The vertical axis represents the mean science grade for the same
students for GCSE, three years after participating in CASE. The CASE schools'
value-added can be seen as the vertical distance between the school's point and the
regression line for the control schools which runs through the national average.
The cognitive acceleration through science education intervention program is carried
out in 30 science lessons over a two-year period (ideally in Years 7 and 8). The
program was designed to accelerate students‟ level of thinking so they would be better
able to cope with the demands of the curriculum. Thinking Science runs parallel to,
but does not replace, other science lessons which give curriculum coverage. The
materials are available as a CD or file (Adey, Shayer & Yates, 1995).
Once the early research on Thinking Science had been completed a particular
methodology and set of curriculum materials were developed and applied to other
programs. Currently there are several programs under the auspices of cognitive
acceleration including Cognitive Acceleration through Mathematics Education
(CAME) and Cognitive Acceleration through Technology Education (CATE) as well
as programs for younger children in the early childhood and middle primary years
(Shayer & Adey, 2002).
The theory underpinning the cognitive acceleration programs embraces both Piagetian
and Vygotskian schools of thought in detailing the stages of cognitive development
and specifically targeting problems and requiring „thinking‟ to problem-solve in the
„zone of proximal development‟ so learning as a result of cognitive conflict occurs.
Reasoning patterns specifically addressed through the Thinking Science activities

Oliver, Venville & Adey 3
include: controlling variables, ratio and proportionality, compensation and
equilibrium to analyse process, correlation, probability, determining criteria for
classification, using formal models of thinking and understanding compound
variables. Thinking Science is structured in such a way that the lessons spiral through
increasing levels of complexity of these reasoning patterns.
Thinking Science has at its core 5 principles or pillars. The first pillar is concrete
preparation that involves the teacher establishing a problem for the students to
consider and to negotiate any associated ideas and terminology needed to understand
the problem. The second pillar, cognitive conflict is a process whereby students are
encouraged to think about the problem in a way that challenges their conventional
ways of thinking. Students are encouraged to consider a range of possible
explanations for the problem. The third pillar, social construction is the shared
development of explanations of and understandings about the problem and potential
solutions. Teachers play a role in asking probing questions of students but not
offering solutions. Active participation by all students is required, as all are expected
to negotiate explanations and solve problems. These processes resonate well with the
current interest by educators in pedagogy: group work, problem-solving and
challenging teaching. The fourth pillar, metacognition, involves students reflecting on
their thinking and articulating their approaches taken to problem solving thus enabling
other students to access other ways of thinking and evaluating. Finally, the fifth pillar,
bridging, involves applying the ideas developed to other problems in the real world.
Associated science lessons can be used to help reinforce and remind students about
the range of problem-solving strategies and ways of thinking they develop during
Thinking Science lessons.
What does a Thinking Science lesson look like?
The early part of a Thinking Science lesson involves introducing the problem and
related vocabulary. For example, in the „Treatments and Effects‟ lesson from
Thinking Science (Adey, Shayer & Yates, 1995), correlation reasoning is used to
assess the strength of a relationship between two variables. A concrete experience is
provided and students examine pictorial data about carrot plants grown in soil and
grown in soil with a treatment. Some control group carrots are larger than treated
carrots even though a strong positive correlation exists between the treatment and the
size of the carrots. The cognitive conflict is then presented: will all carrots be bigger if
we use the treatment? Clearly, understanding correlation depends on an understanding
of probability. Other activities in the lesson include examples of negative correlations
or where no correlation exists at all. Bridging to everyday life can include use of
medication for pain relief etc. Much of this lesson involves whole class discussion,
with some time for paired or small group discussion to determine the relationships
between variables: teacher input is through specific and Socratic questioning such as
„how do I know?‟
Establishing Thinking Science Australia in schools
Preparation, delivery and evaluation of thinking lessons need to be well supported.
The effective establishment of specific thinking lessons outside the „normal‟ curricula
depends on a good theoretical understanding and acceptance of the rationale for
implementing such lessons into classrooms. For teachers prepared to take on the
additional task of delivering lessons which may appear to have little to do with the

Oliver, Venville & Adey 4
normal skills, processes and knowledge of everyday curricula, considerable support
and „coaching‟ in methodology is required. Ideally, this has to be a whole-school
agreement, whereby teachers, administrators in schools, technical support and parents
are included in the decision to promote thinking in students. To be able to
successfully incorporate a program like Thinking Science into a school curriculum
requires science teachers to be trained in the materials and methodology as well as the
underpinning philosophy. At present, we estimate that two days training can
successfully cover the underpinning theory as well as address the practical know-how
for experienced teachers and this is followed up by PD during the two years. One-off
PD sessions do not result in sustained impact and the interactive sessions in this
project ensure teachers contribute to, reflect on, try out activities and learn from each
other.
One school in regional Western Australia, Pinjarra Senior High School, is identified
as an exemplar for the Thinking Science Australia program using the cognitive
acceleration materials developed at Kings College, London (Adey, Shayer & Yates,
1995). Another school in northern WA adopted the program but delivered this in
three terms instead of over two years. Ten other schools in WA, QLD are into their
second term of implementing the program with Year Seven, Eight or Nine students.
Methodology
Research Design
The research follows a sequential exploratory design (Cresswell, 2009) with three
sequential phases. In 2010 we are in the first phase of conceptualisation. There are
three main research questions in this phase.
o how a cognitive acceleration program can best be implemented
iterative and primarily qualitative detailed classroom
observations and focus group interviews
trial and gather feedback about the effectiveness, utility and
level of engagement of the cognitive acceleration activities
pilot test instruments and analytical procedures
give preliminary feedback about the impact of the trialled
lessons on thinking ability and science achievement
o how the CA program can complement the new national science
curriculum
can this be used to inform the schemata and science contexts in
which the activities are developed.
o how cutting edge science and modern ICTs can be incorporated into
the CA program
can (and how?) modern ICTs such as three-D computer-based
models, simulations and data loggers be used as tools in the
cognitive acceleration activities?
In this paper, we will present quantitative data from baseline tests administered to
Year Eight students and qualitative data in the form of transcribed interviews with

Oliver, Venville & Adey 5
teachers as a focus group to review and reflect on the activities and the cognitive
acceleration program.
Participants
The participants in this research included 1318 Year Eight students from ten high
schools in Western Australia and Queensland. Details about the schools and
participants are given in Table 1.
Table 1: Information about the schools involved in the research
School type Location Number of
students
Government Suburban 98
Government Regional 172
Catholic Remote 171
Government Regional 117
Government Regional 134
Independent Suburban 106
Government Suburban 94
Independent Suburban 159
Independent Suburban 97
Government Suburban 170
Quantitative data on the cognitive level of students
Data have been collected prior to the implementation of the cognitive acceleration
program on students‟ level of cognitive development using a Piagetian Science
Reasoning Task (SRT) as developed by Shayer (1978) and a further SRT will be
administered to students at the conclusion of the two-year program in December
2010.
The first baseline test is one of a series developed by the team „Concepts in Secondary
Maths & Science‟ at Chelsea College, University of London some years ago. These
were used to investigate the relationship between the optimum Piagetian level (at
which students can function) and the understanding of science (which he or she can
achieve). Developmental psychologists such as Piaget have identified the change in
thinking about „size‟ as each of the component parts become more clearly understood
by children as they develop.
The baseline test
The baseline task is based on volume and heaviness, with questions from the
conservation of volume (Piagetian stage 2A) to calculations of density (3A). The

Oliver, Venville & Adey 6
theory behind this task is that the components of „size‟ - mass, weight, volume and
density - are not differentiated clearly from each other. These terms seems to mean
the same thing for young children. The first to „crystallise out‟ is mass – conservation
of substance. A little later (Stage 2A/2B) weight is conserved, and a global, intuitive
concept of density it differentiated from weight. Later, volume is conserved, and
differentiated from mass and weight (Stage 2B/3A). Finally, with volume and weight
consistently differentiated, students demonstrate an understanding of the concept of
density as a weight/volume ratio (3A). So, for example, an individual can see that
whether something floats is governed by its weight compared with the weight of the
same volume of water.
The task is hierarchically constructed, with the questions starting off being at early
concrete operations (2A) and progressing with increasing challenge until the last
questions which can only be solved using more advanced thinking. Teacher
instructions and guidelines are provided with copies of the student answer sheet
which has diagrams of the apparatus used and questions. The whole task takes about
50 minutes and is a tiring experience for students.
For example, one of the early questions which tests conservation of volume is pitched
at the Piagetian level (2A). Four measuring cylinders are set up at the front of the
class as shown in Figure 2.
Figure 2. Representation of the apparatus on the student baseline test: question 2
Teacher instructions: Fill A at the tap. Pour into D. Refill A. Pour into C. Refill A.
Pour into B. Refill A. Put all 4 together in line so they can be seen.
Then put the question to the students:
Do these cylinders all have the same amount of water? YES /.NO
If you answered “NO” write down which has most
Nearly 80% of students in Year Eight scored this correctly.
Another question requires students to make some simple calculations, to consider
both mass and volume in thinking about whether a box will float or not. The teacher
has a clear box with the dimensions shown as 10cm by 10cm by 10cm.

Oliver, Venville & Adey 7
Figure 3. Representation of the apparatus on the student baseline test: question 12
Teacher instructions: Say this box is so light that you can
forget about its own weight and the box is filled with a dry
cleaning fluid so that it weighs 1500g. Another box, twice
as tall as shown in the diagram, has water and this one
weighs 2000g.
Would the small box sink or float when out in water?
SINK / FLOAT
How did you work out your answer?
Teacher instructions: Emphasise that it is very important to
show the working or reasoning being used – no credit
otherwise – when they have finished show the box again
and read the next question. Now imagine what happens
when the dry cleaning fluid is emptied out and is filled with
alcohol. Now it weighs 850g.
Would the small box sink or float when out in water?
SINK / FLOAT
How did you work out your answer?
For a mark, students need to both choose the correct sink / float option and to justify
their answers correctly.
Qualitative survey: teacher focus group
During term two of the implementation of the Thinking Science Australia program in
schools, teachers were brought together to form a focus group. Representatives from
eight schools participated in the focus group discussions. With permission from all
participants, interviews were recorded and transcribed. In this paper, we present a
snapshot of teachers‟ responses to three sets of focus group questions.
Do you feel that you have learnt something through the PD process? What did you
learn? What (if anything) has changed about your teaching approach?
Have you been able to make connections between what students are doing in the
Thinking Science lessons and what you have been teaching them in your regular
science lessons?
The draft national curriculum has „thinking skills‟ as one of ten general capabilities.
Do you think that these lessons would be appropriate to achieve this general
capability? Why? Why not?

Oliver, Venville & Adey 8
Findings
Quantitative data: the baseline test
All the baseline tests were scored by two independent markers ad the data entered into
an excel spreadsheet. The scoring rules use a 2/3rd success rate as a criterion for
being at a particular Piagetian stage and an algorithm is used to compute the final task
„score‟ which determines the Piagetian level of thinking for each student. Statistical
analyses of the data include determining the mean score and standard deviation for
each school year group.
Figure 4. Item facilities on the baseline test: the Science Reasoning Task (SRT) II
The data show that more students had correct responses to the questions which were
easier, demanding a lower level of reasoning.
Figure 5. The percentage of correct responses for questions of varying difficulty
(Years 8 and 9) in one school
0
0.1
0.2
0.3
0.4
0.5
0.6
0.7
0.8
0.9
1
1 3a 5 7 9 11 13a 14
Pro
po
rtio
n o
f co
rre
ct r
ep
on
ses
to e
ach
it
em
Baseline test questions
Regional government
Remote private
0
10
20
30
40
50
60
70
80
90
2A 2B 2B/3A 3A
% c
orr
ect
re
spo
nse
s
level of difficulty of questions
Year 8
Year 9

Oliver, Venville & Adey 9
The reasons students gave for their choice of floating and sinking were used to score
the answer. For a wholly correct answer students had to correctly choose floating or
sinking and then provide a valid justification. A selection of student responses is
given below.
The sealed box should have air in it
Water can‟t get in the box
The chemicals in the dry cleaning fluid will keep it afloat. Or the water
pressure will force the smaller box to float.
Cleaning fluid does not [sink] because cleaning don‟t weigh much
The box needs air to float
Water isn‟t that strong and wouldn‟t be able to hold the alcohol
Because the alcohol is heavy in the box
It will sink because alcohol is more thicker and plus a box it will sink to the
bottom
It will sink as there is no air in the box making it impossible to float as you
need air seeking the surface
Because liquid and liquid apart from water doesn‟t float
Schools reports were generated based on the data gather from scoring task II and
included reference to activities to address students‟ misconceptions.
Sustained professional development over two years
The model of professional development recognises the importance of ongoing support
as teachers implement a new program in their classrooms. Yoon et al., (2007)
examined nine controlled studies of professional development efforts to determine
how much time is necessary for an impact. Yoon and colleagues noted that when
efforts were less than 30 hours, they showed no significant effects on student learning.
Efforts that ranged between 30 and 100 hours, with an average of 49 hours, showed
positive and significant effects on student achievement. The model used for PD for all
teachers extends for two years, involves university and school based sessions of
examining activities and data, planning improvements and reflecting on pedagoagy.
Figure 6. The professional development model for Thinking Science Australia.
The purposes of the professional development days are centred around key issues to
meet the needs of teachers working with students. The researchers have been
gathering information and data about implementation, the activities and student
performance. The main purposes of the professional development are technical,
theoretical, managerial, administrative, research and social.
•baseline test
• lessons 1-6
•plan for TSA
T4
2 days PD
• lessons 7-14
•social construction
T2
PD
• lessons 15-21
•metacognition
T4
PD
• lessons 22-30
•bridging
T2
PD
• cognitive test
•making 'thinking' lessons
•collecting data
•ongoing PD
T4
PD

Oliver, Venville & Adey 10
A summary of the professional development day for the first day is shown below.
1. Technical Structure of the materials and of the programme.
Going through the first lot of Thinking Science Activities.
Gaining familiarity with Task II, Volume and Heaviness.
2. Theoretical The nature of intelligent thinking: formal operations.
Cognitive conflict as a spur to cognitive development.
3. Managerial Planning a two-year development in science departments;
strategies and tactics for managing professional development.
4. Administrative Recording who will be involved; roles.
Setting up visits; who will visit and when.
5. Research Effects of cognitive acceleration. Growth of the programme
6. Social Building a community of shared enterprise. A TSA network.
We do not underestimate the value of teachers having the opportunity to talk about
teaching, reflect on their practice and consider the value of changing practice.
Changing professional practice takes commitment, personal and administrative,
accountability ongoing support. Change is difficult, implementing a program is
challenging.
Qualitative findings from the focus group
Mid way through term 2, after working with the Thinking Science activities for 15
weeks, teachers from each of the 11 schools were invited to participate in focus group
debrief. This enabled researchers to gather information about their experiences, the
ease or difficulty with the activities, the structure of the lessons and lesson guides and
how their students were finding the lessons. This paper presents a selection of
responses to questions about the professional development.
Do you feel that you have learnt something through the PD process? What did you
learn? What (if anything) has changed about your teaching approach?
a lot of other things that I‟ve been to, PD, they‟re trying to teach you the sort
of things that are well out of your normal teaching practice, and it‟s very hard
for them to convince me that they‟re worthwhile. What I‟ve seen in this case, it
really does mirror the way I teach anyway, it just really hones it in with great
activities and focuses even more on the thinking, so it‟s very similar to the way
I teach science. and that‟s, I like that.
I love that at least once a fortnight there is time away from the curriculum and
the students get to do the hands-on, and it doesn‟t really matter if they‟re right
or wrong at the end of the lesson, but that they‟ve had the opportunity to
attempt, um, rather than, you know, just read the text and answer the
questions, or, you know, do a prac, and... I find that my practicals are a lot
more thorough too with going from the aims through to the conclusion, um,
and I think they are understanding it a little bit more too, so...
I think they‟re able to, you know, especially with the fair testing, um, and the
ways these lessons are designed, as far as what‟s introduced and the value
that something has and the relationship that it has ...I think all of that
reinforces the investigative work that they do, but in a very, you know, hands-

Oliver, Venville & Adey 11
on practical way that they probably don‟t even know that they‟re sort of
learning it.
Have you been able to make connections between what students are doing in the
Thinking Science lessons and what you have been teaching them in your regular
science lessons?
Um, again, it works really well with, you know, the investigation side of things
... but, you know, it also covers, well we‟re doing, you know, classification at
the moment, so it covers a lot of different sort of content that it ties in with so
that it‟s not so, „OK, this is a Thinking Science lesson, and it‟s really
separated from, you know, what we do in class‟, so, yes, I think so.
Do you think that these lessons would be appropriate to achieve this general
capability [of thinking as identified in the new national curriculum]?
I think problem-solving is really important, you know, and not just in science
but in life in general, and the more, you know, opportunities you have to
problem-solve, and especially in that sort of environment because you‟re not
sort of like, „shh, keep your voice down‟, you know, it‟s not sort of um, limiting
them. There‟s discussion going on in their groups, you know, even with the
pantry you know, well, „that doesn‟t go there‟, and „why doesn‟t that go
there‟, „oh because I think it goes…‟, so they‟re talking to one another and
working out those problems and sort of like readjusting their own thinking.
... teachers in general find teaching thinking and generating resources for
thinking lessons quite hard. It‟s out of the box. And having these lessons
prepared for them really, really helps, yeah. Teaching a thinking lesson is a
hard lesson to plan.
... as we all know, to be safe and stick to the textbook and, you know, to
actually ask teachers to get out of the box, out of their comfort zone, is hard.
Having these generated in advance really helps. And they‟re all such good
activities, the resources, you don‟t need, you know, super expensive
equipment.
What the data tell us The original data about students‟ thinking were collected some thirty years ago and a
more recent survey shows that the level of reasoning has fallen in the same age groups
measured (Shayer, Ginsburg Coe, 2007) in the UK.
Oliver, Venville & Adey 12
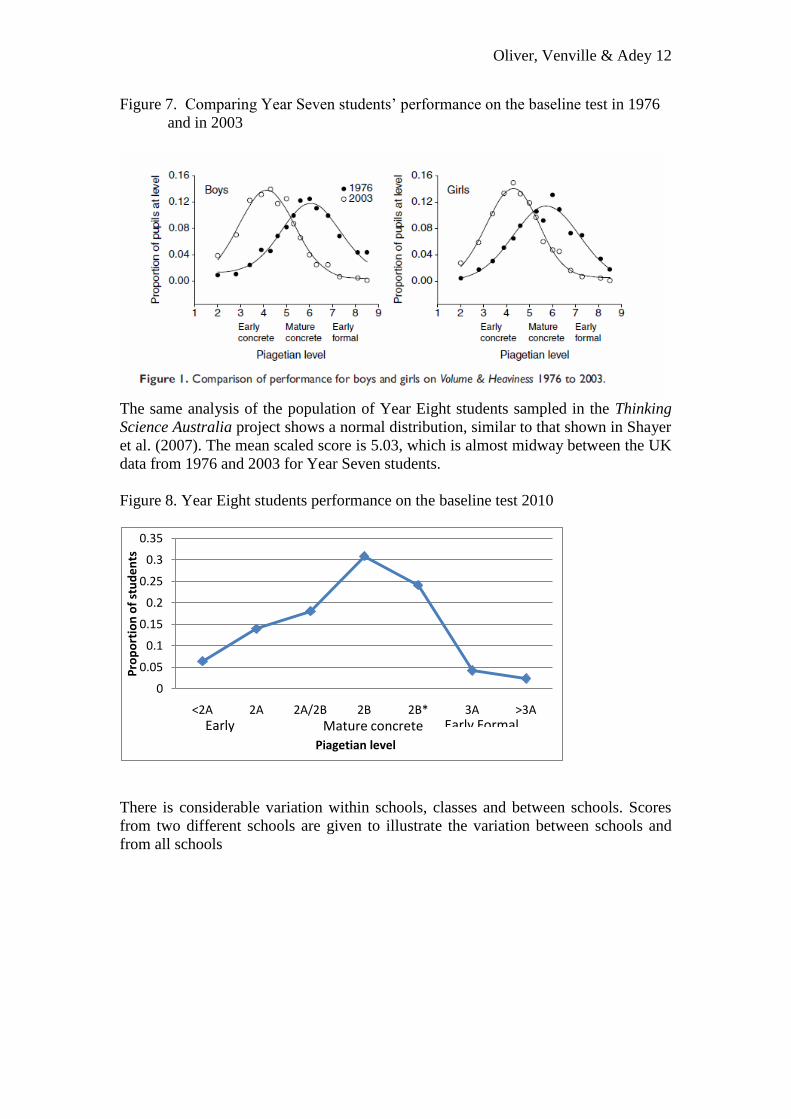
Figure 7. Comparing Year Seven students‟ performance on the baseline test in 1976
and in 2003
The same analysis of the population of Year Eight students sampled in the Thinking
Science Australia project shows a normal distribution, similar to that shown in Shayer
et al. (2007). The mean scaled score is 5.03, which is almost midway between the UK
data from 1976 and 2003 for Year Seven students.
Figure 8. Year Eight students performance on the baseline test 2010
There is considerable variation within schools, classes and between schools. Scores
from two different schools are given to illustrate the variation between schools and
from all schools
0
0.05
0.1
0.15
0.2
0.25
0.3
0.35
<2A 2A 2A/2B 2B 2B* 3A >3A
Pro
po
rtio
n o
f st
ud
en
ts
Piagetian level
Early Mature concrete Early Formal

Oliver, Venville & Adey 13
Figure 9. How Year Eight students in a low ICSEA school (n = 98) performed. Mean
scaled score 4.3, early concrete Piagetian level.
Figure 10. How Year Eight students in a high ICSEA (n = 170) performed. Selective
school: high ISCEA. Mean scaled score 6.22, concrete generalization.
0
5
10
15
20
25
30
35
40
NR <2A 2A 2A/2B 2B 2B* 3A >3A
Nu
mb
er
of
stu
de
nts
Piagetian level of development
Low ICSEA school
0
10
20
30
40
50
60
70
80
90
100
NR <2A 2A 2A/2B 2B 2B* 3A >3A
Nu
mb
er
of
stu
de
nts
Piagetian level of development
High ICSEA school

Oliver, Venville & Adey 14
Table 2. Data from all twelve cohorts of Year Eight students showing the mean scaled
score, SD and the ICSEA value.
School type Index of
Community Socio-
Educational
Advantage
(ICSEA)
Student
number
Mean score SD
City government 947 a 98 4.328 0.9757
Regional government 962 b 59 4.638 1.3922
Regional government 962 b 113 4.667 1.02551750
7
Remote private 979 c 79 4.71 1.193
Regional government 1001 d 117 4.72 1.0599
Regional government 990 e 134 4.725 1.288
City private 1003 f 106 4.934 1.18
City government 1051 a 94 5.052 1.227
Remote private 979 c 92 5.201 1.2099
City private 1190 g 159 5.56 1.1923
City private 1044 h 97 5.71 1.122
City selective 1065 i 170 6.221 0.903
1318 5.0388 1.1474
a Below average of similar schools for all measures: reading, writing, spelling,
grammar and punctuation and numeracy b Below all schools for reading, writing, grammar and punctuation and numeracy;
substantially below all schools for spelling. c Above average of similar and all schools for reading, writing, spelling, grammar and
punctuation d Below average of similar and all schools for all measures: reading, writing, spelling,
grammar and punctuation and numeracy e Below average for spelling and numeracy
f Above similar schools for writing and for grammar and punctuation
g Substantially below similar schools (though above all schools) for numeracy in
Years 7 and 9; below similar schools for reading, writing, spelling, grammar and
punctuation and numeracy in Year 9 and above in all measures compared with all
schools; substantially above in Years 7 in reading and grammar and punctuation. h
Above average for grammar and punctuation and for numeracy in Year 7 and 9 i Substantially above average for all measures
Data from My School website http://www.myschool.edu.au/ accessed 25 June 2010
The data suggest a correlation between the Index of Community Socio-Educational
Advantage (ICSEA) and levels of students‟ cognitive development. The average
ICSEA value is 1000. Most schools have an ICSEA score between 900 and 1100.

Oliver, Venville & Adey 15
Figure 11. The relationship between the mean scaled score on the baseline test and the
ICSEA value.
n = 1318
r =0.696907202
A recent report from the Organisation for Economic Co-operation and Development
(OECD) used economic modelling to suggest that even small increases in cognitive
skills impact a nation‟s economic growth (OECD, 2010). Poland is cited as an
example which improved reading scores between 2000 and 2006 with an economic
benefit calculated to be over 2 billion USD.
One school completed the 30 lessons in three terms, so affording us an opportunity to
measure levels of cognition over an eight month period. This data is shown in Figure
12.
Figure 12. Matched students in Year Nine (n = 57) after 30 lessons in three terms.
A general shift is seen with more students performing at a higher level in the second
test. A control study is planned for 2011.
4
4.5
5
5.5
6
6.5
900 1000 1100 1200 1300
Mean
sco
re f
or
Year
8
Index of Community Socio-Educational Advantage (ICSEA)
0
2
4
6
8
10
12
14
16
18
20
<2A 2B- 2B 2B* 3A 3A/3B
Nu
mb
er
of
stu
de
nts
at
leve
l
Piagetian level
April
December

Oliver, Venville & Adey 16
Thinking Science Australia and the new national science curriculum
The recently published National Science Curriculum structures the proposed
curriculum around schemata similar to those of Inhelder and Piaget including
comparing, sorting and classifying for Stage 1 (typically 5-8 year olds); cause and
effect, patterns, and evidence and explanations for Stage 2 (8-12 year olds); and,
equilibrium and interdependence, as well as evidence, models and theories for the
Stage 3 (12 to 15 year olds). The consistencies between the proposed structure for the
Australian national science curriculum and the schemata used for the UK cognitive
acceleration programs highlights the appropriateness and importance of explicit
teaching and learning of thinking skills through Piagetian-based schemata. Thinking
skills comprises one of ten general capabilities of the new national curriculum as
described below.
By the end of Year 7, students are able to formulate questions and predictions
to be investigated. They can select, with guidance, an appropriate method to
investigate their questions (eg designing a fair test, survey, information
research, use of secondary sources) and conduct investigations safely in
groups or individually. They record accurate observations (including some
use of repeat trials), show results in tables or simple graphs and make
conclusions which are largely consistent with their results. They can apply the
idea of fair testing in relation to controlling, changing and measuring
variables
By the end of Year 8, students ... distinguish between types of variables in
designing investigations and routinely record data using correct units,
construct graphs to show trends and patterns in their results including using
ICT with minimal guidance and draw conclusions based on scientific
understanding. They use repeat trials in some investigations (eg in force and
motion experiments) and suggest alternative methods if required
(http://www.australiancurriculum.edu.au/Explore/Science)
The Thinking Science Australia program supports the development of process skills in
science, fosters uncertainty and metacognition in students and provides a framework
for teachers to develop other thinking lessons.
With respect to the third research question, we are in the infancy of considering the
use of IT to support the activities
Phase Two
The purpose of the second phase of the research will be to conduct a quasi-experiment
to evaluate the effect of the Thinking Science Australia cognitive acceleration
program. During this phase the research will focus on the effect of the Thinking
Science Australia program on students‟ cognitive development and science
achievement.
In order to work with a broad spectrum of Australian school contexts, schools will be
selected from all school jurisdictions (government, Catholic, independent) and include
both city and country schools and from across Australia. Ten high schools, their

Oliver, Venville & Adey 17
science teachers and one cohort of high school students (either Year 7 or Year 8
depending on the school system), (n≈2000) will form the experimental group. Schools
will be selected from those whose science teachers have already participated in
cognitive acceleration professional development so that they are familiar with the
theory and pedagogy required for teaching a cognitive acceleration program. Ten
different high schools whose teachers have not participated in the professional
development program and a similar cohort of students (n≈2000) will form the control
group. The equivalence of the groups will be strengthened as much as possible by
matching variables such as year of participating students, size of school, school
jurisdiction, location and socio-economic status of the student catchment. The
experimental group will implement the Thinking Science Australia program within
the timeframe of the normal science curriculum for two years. The control group will
implement their normal science curriculum for the two year period without the
Thinking Science Australia intervention. These control schools will be given the
option of implementing the Thinking Science Australia program after the completion
of the research.
References
Adey, P.S. & Shayer, M. (1990). Accelerating the Development of Formal Thinking
in Middle and High School Students. Journal of Research in Science
Teaching, 27(31), 267 – 285.
Adey, P.S.; Shayer, M. (1993). An Exploration of Long-Term Far-Transfer Effects
Followin an Extended Intervention Programme in the High School Science
Curriculum Cognition and instruction (Mahwah, NJ), vol. 11, no. 1, p. 1–29.
Adey, P., Robertson, A. & Venville, G. (2002) Effects of a Cognitive Stimulation
Programme on Year 1 Pupils. British Journal of Educational Psychology 72,
1-25
Adey, P. & Shayer, M. (1994) Really raising standards: Cognitive intervention and
academic achievement. London: Routledge.
Adey, P., Shayer, M., & Yates, C. (1995). Thinking science: Student and teachers‟
materials for the CASE intervention (2nd
edn). London: Nelson. 3rd
edn.
Published 2001, Nelson Thornes.
The Australian National Curriculum at
http://www.australiancurriculum.edu.au/Explore/Science accessed 28 June
2010
Cresswell, J. W. (2009). Research design: Qualitative, quantitative, and mixed
methods approaches. Thousand Oaks, CA: Sage.
Gardner, H. (2007). Multiple intelligences, the first 25 years, the next 25 years. In G.
Venville & V. Dawson (Eds.), Proceedings of CONASTA 56 and ICASE
2007 World Conference on Science and Technology Education (pp. 2-15).

Oliver, Venville & Adey 18
Perth: Science Teachers‟ Association of Western Australia. ISBN: 978-0-
9803703-0-0
General Teaching Council for England (2001) Improved learning through cognitive
intervention
http://www.gtce.org.uk/research/romtopics/rom_teachingandlearning/case_jun
01/study accessed 21 June 2010
Higgins, S., Baumfield, V., Hall, E. (2007) Learning Skills and the development of
learning capabilities. In: Research Evidence in Education Library. London:
EPPI-Centre, Social Science Research Unit, Institute of Education, University
of London. http://eppi.ioe.ac.uk/cms/Default.aspx?tabid=1851 accessed 21
June 2010
My School website http://www.myschool.edu.au/ accessed 25 June 2010
OECD. (2010). The High Cost of Low Educational Performance: OECD Publishing.
Shayer, M., et al. (1978). Science Reasoning Tasks. Slough, UK, National Foundation
for Educational Research.
Shayer, M. (1999). Cognitive acceleration thought science education II: Its effects and
scope. International Journal of Science Education, 21(8), 883-902.
Shayer, M. & Adey, P. (2002). Learning intelligence: Cognitive acceleration across
the curriculum from 5 to 15 Years. Buckingham, Open University Press.
Shayer, M., & Adhama, M. (2007). Fostering Cognitive Development Through the
Context of Mathematics: Results of the CAME Project. Educational Studies in
Mathematics, 64(3), 265-291.
Shayer, M., Ginsburg D, & Coe, R. (2007). Thirty years on - a large anti-Flynn
effect? The Piagetian test Volume & Heaviness norms 1975-2003. British
Journal of Educational Psychology, 77, 25-41.
Yoon, K. S., Duncan, T., Lee, S. W., Scarloss, B., & Shapley, K. L. (2007).
Reviewing the evidence on how teacher professional development affects
student achievement. Washington, DC: US Department of Education, Institute
of Education Sciences, National Center for Education Evaluation and
Regional Assistance, Regional Educational Laboratory Southwest

![Improving Students’ Van Hiele Level Of Geometric Thinking ... · Improving Students’ Van Hiele Level Of Geometric Thinking Using Geometer’s Sketchpad Poh Geik Tieng [1], Leong](https://img.pdfslide.us/doc/110x75/5ceb300f88c9931e1e8e0d13/improving-students-van-hiele-level-of-geometric-thinking-improving-students.jpg)