Embed Size (px)
Citation preview
CRC for Rail Innovation [insert date] Page i
Improving Rail Station
Access in Australia
Improving Rail Station Access in Australia
CRC for Rail Innovation August 2013 Page ii
DOCUMENT CONTROL SHEET
CRC for Rail Innovation Old Central Station, 290 Ann St. Brisbane Qld 4000 GPO Box 1422 Brisbane Qld 4001 Tel: +61 7 3221 2536 Fax: +61 7 3235 2987 www.railcrc.net.au
Document:
Title: Improving Rail Station Access in Australia Project Leader: Phil Charles Authors: Ronald Galiza and Phil Charles Project No.: R1.133 Project Name: Station Access
Synopsis: This document on improving rail station access in Australia is the main document for the CRC project on Station Access. The document reviews Australian and international planning guides to identify key elements important in planning for station access. Best practice elements were identified for inclusion in an access planning methodology for the Australian context. An evaluation framework featuring a checklist of station access principles associated with each access mode is provided to assess existing station access. Case studies are presented from Brisbane, Perth, and Sydney so as to illustrate the framework. This document presents a new perspective for Australian rail agencies, including access in the overall design process and provides a best practice approach, building on available station access-related planning in Australia and developments in Europe and North America.
REVISION/CHECKING HISTORY
REVISION NUMBER
DATE ACADEMIC REVIEW (PROGRAM LEADER)
INDUSTRY REVIEW (PROJECT CHAIR)
APPROVAL (RESEARCH DIRECTOR)
0 23 September 2013
DISTRIBUTION
DESTINATION
REVISION
0
1
2
3
4
5
6
7
8
9
10
Industry Participant for Review
x
Established and supported under the Australian Government’s cooperative Research Centres Programme
Copyright © 2013
This work is copyright. Apart from any use permitted under the Copyright Act 1968, no part may be reproduced by any process, nor may any other exclusive right be exercised, without the permission of The Universityof Queensland.
Improving Rail Station Access in Australia
CRC for Rail Innovation August 2013 Page iii
Table of Contents
Summary Report ................................................................................................................................................ iv Approach ............................................................................................................................................................ v Executive Summary .......................................................................................................................................... vii List of Figures ................................................................................................................................................... viii List of Tables .................................................................................................................................................... viii Abbreviations and Acronyms ............................................................................................................................ ix 1. Introduction ................................................................................................................................................... 1 2. Review of Station Access Practice ................................................................................................................. 3
2.1 International Guidelines ........................................................................................................................ 3 2.2 Local Guidelines .................................................................................................................................... 5 2.3 Comparison of Important Station Access Elements .............................................................................. 7
3. Station Access in Australia: A Quick Look ...................................................................................................... 9 3.1 Planning ................................................................................................................................................. 9 3.2 Access Mode Share ............................................................................................................................. 10 3.3 Future/Target Mode Share ................................................................................................................. 14
4. Station Access Planning Guide .................................................................................................................... 15 4.1 Access Hierarchy ................................................................................................................................. 15 4.2 Station Access-Related Zones of Influence ......................................................................................... 16 4.3 Access Facilities’ Location ................................................................................................................... 17 4.4 Station Categories and Access Modes ................................................................................................ 19 4.5 Station Formation and Access Modes ................................................................................................. 20
5. Station Access Principles by Mode .............................................................................................................. 23 5.1 Walking to the Station ........................................................................................................................ 23 5.2 Cycling to the Station .......................................................................................................................... 35 5.3 Feeder Bus Access ............................................................................................................................... 43 5.4 Kiss-and-Ride (KnR) Access ................................................................................................................. 53 5.5 Park-and-Ride (PnR) Access ................................................................................................................ 58
6. Proposed Station Access Evaluation Framework ........................................................................................ 68 7. Illustrative Case Study ................................................................................................................................. 70
7.1 Case Study Profiles .............................................................................................................................. 70 7.2 Case Study Analysis ............................................................................................................................. 71
8. Findings ....................................................................................................................................................... 73 References ........................................................................................................................................................ 74 Appendix A: Detailed Access Principles by Mode ............................................................................................ 77 Appendix B: QUT Papers ................................................................................................................................... 80 Appendix C: UQ Papers .................................................................................................................................... 81
Improving Rail Station Access in Australia
CRC for Rail Innovation August 2013 Page iv
Summary Report
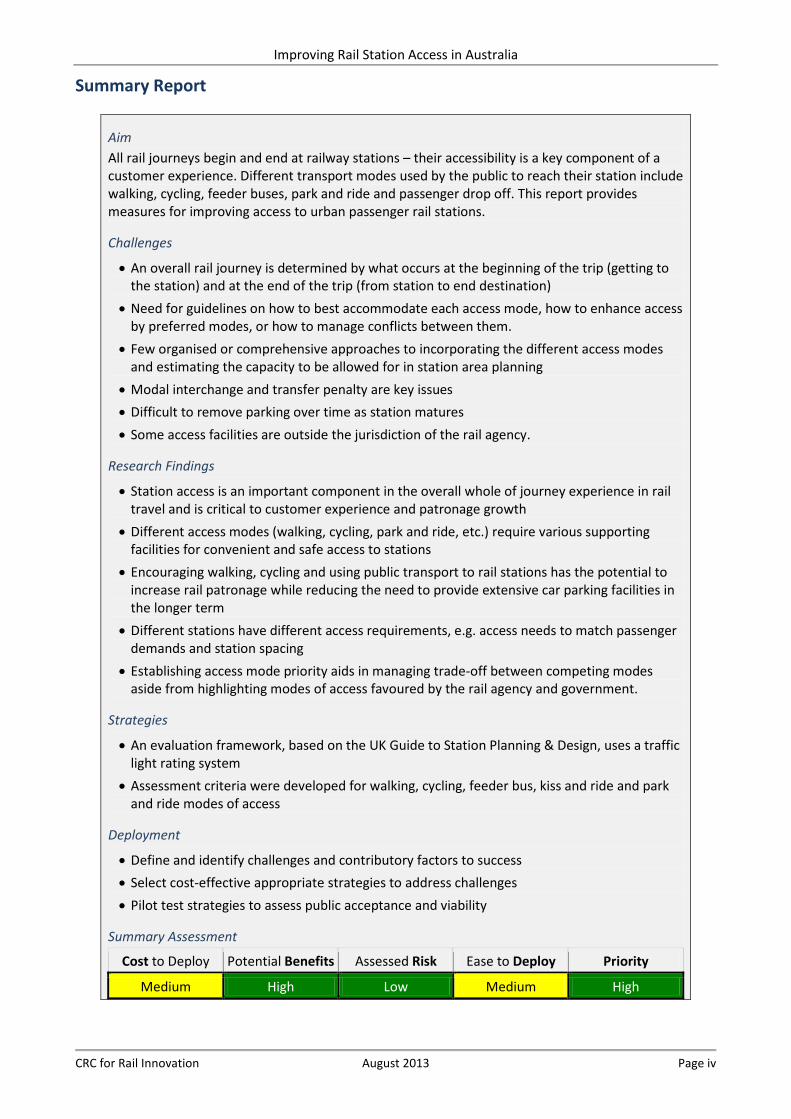
Aim All rail journeys begin and end at railway stations – their accessibility is a key component of a customer experience. Different transport modes used by the public to reach their station include walking, cycling, feeder buses, park and ride and passenger drop off. This report provides measures for improving access to urban passenger rail stations.
Challenges
• An overall rail journey is determined by what occurs at the beginning of the trip (getting to the station) and at the end of the trip (from station to end destination)
• Need for guidelines on how to best accommodate each access mode, how to enhance access by preferred modes, or how to manage conflicts between them.
• Few organised or comprehensive approaches to incorporating the different access modes and estimating the capacity to be allowed for in station area planning
• Modal interchange and transfer penalty are key issues • Difficult to remove parking over time as station matures • Some access facilities are outside the jurisdiction of the rail agency.
Research Findings
• Station access is an important component in the overall whole of journey experience in rail travel and is critical to customer experience and patronage growth
• Different access modes (walking, cycling, park and ride, etc.) require various supporting facilities for convenient and safe access to stations
• Encouraging walking, cycling and using public transport to rail stations has the potential to increase rail patronage while reducing the need to provide extensive car parking facilities in the longer term
• Different stations have different access requirements, e.g. access needs to match passenger demands and station spacing
• Establishing access mode priority aids in managing trade-off between competing modes aside from highlighting modes of access favoured by the rail agency and government.
Strategies
• An evaluation framework, based on the UK Guide to Station Planning & Design, uses a traffic light rating system
• Assessment criteria were developed for walking, cycling, feeder bus, kiss and ride and park and ride modes of access
Deployment
• Define and identify challenges and contributory factors to success • Select cost-effective appropriate strategies to address challenges • Pilot test strategies to assess public acceptance and viability
Summary Assessment
Cost to Deploy Potential Benefits Assessed Risk Ease to Deploy Priority
Medium High Low Medium High
Improving Rail Station Access in Australia
CRC for Rail Innovation August 2013 Page v
Approach This project aimed to determine measures and strategies for improving access to urban passenger rail stations resulting in enhanced customer experience, increased access and egress capacity and improved overall ease-of-use.
Project Steering Committee Project Chair: Chris Watts, Public Transport Authority of Western Australia Project Leader: Prof Phil Charles, The University of Queensland
Members: Nerida Morgan, Transport for NSW; Matthias Schlotterbach and Liam Scanlan, Department of Transport and Main Roads Qld; Michael Luxton, Metro Trains Melbourne; John O’Connell, Public Transport Victoria; Phil Saunders, Department of Planning, Transport and Infrastructure South Australia
University Partner Researcher: A/Prof Jonathan Bunker, Queensland University of Technology The research methodology commenced with undertaking a literature review, in both domestic and international contexts, addressing a series of research questions:
• How does effective access planning improve the overall customer experience? • What are the key metrics and fields of analysis for evaluating access to urban passenger rail
stations by different modes (i.e., walking, cycling, feeder bus, kiss-and-ride, and park-and-ride)? • How do we prioritise investment choices for different access modes and address community
expectations? • What does a selection of Australian case studies tell us about improving station access, and refining
our newly developed evaluation tool?
The policy frameworks for delivering better access outcomes most appropriate for the Australian context were identified in close collaboration with industry partners. This involved industry surveys, seminars and workshops to present the findings of the various stages of the research and industry input was sought.
The key components of the research involved: • Review of local and international access planning policy frameworks and case studies • Industry questionnaires, workshops and seminars • Developed principles for improved planning and policy frameworks for station access, in close
collaboration with industry partners • Developed and refined criteria and metrics for evaluating each station access mode • Developed an access evaluation and planning framework, in close collaboration with industry
partners • Applied evaluation framework to Australian case study stations.
A series of research reports and working papers were produced and circulated to the project steering committee for review:
Station Access: a literature review, by R Galiza & P Charles (UQ), March 2012 Research Synthesis and User Perceptions from Pilot Focus Group Survey, by Y Liu, K Zuniga, J Bunker & P McGurren (QUT) March 2012 Station Access Planning Guide Comparison, by R Galiza & P Charles (UQ), June 2012 Station Access Planning Process, Working Paper 1, by R Galiza & P Charles (UQ), August 2012 Station Access – Station Categories, Mode Share and Hierarchy, Working Paper 2, by R Galiza & P Charles (UQ), August 2012 Station Access – Demand Estimation Methodology, Component List and Detailed Principles for Each Mode, Working paper 3, by R Galiza & P Charles (UQ), August 2012 Station Access – Transit Oriented Development; Provision for Redevelopment; and Access Treatment at Constrained Stations, Working Paper 4, by R Galiza & P Charles (UQ), September 2012
Improving Rail Station Access in Australia
CRC for Rail Innovation August 2013 Page vi
Draft Chapters of Final Research Report by R Galiza & P Charles (UQ) 1. Walking to the Station, March 2013 2. Cycling to the Station, April 2013 3. Feeder Bus Access, April 2013
The Project Steering Committee held a series of teleconferences and was involved in industry workshops to review progress and provide research direction. A project wiki was maintained providing a portal for all reports.
Industry workshops were held: Series 1: 23 March 2012: Brisbane; 28 March 2012: Perth; 30 March 2012: Melbourne and Series 2: 4 Dec 2012: Brisbane; 6 Dec 2012: Melbourne; 7 Dec 2012: Sydney
Improving Rail Station Access in Australia
CRC for Rail Innovation August 2013 Page vii
Executive Summary Station access is a key component of the overall passenger experience and rail journey. Station access bridges the gap between origin (destination) and transit stations making rail service more comparable to door-to-door car travel. In order to sway more travellers to patronise public transport as their main mode of transport, this segment of the trip needs to be improved. Important questions that need to be considered include: how to best accommodate each access mode, how to enhance access by preferred modes, and how to manage conflicts between them? However, planning for station access is currently addressed in many different ways across Australia and in a relatively ad-hoc manner. An analysis of Australian station access and a review of international planning guides identified key elements important in planning for station access for inclusion in the proposed access planning methodology for the Australian context. The evaluation framework proposed for adaptation for station access is based on a ‘traffic light’ system. The principles relating to station access are listed and rated as ‘green’, ‘amber’ or ‘red’ depending on how the principle has been considered and addressed. Each criterion under each principle can be rated based on how they are addressed in the station under study. The ratings will give a good indication of where improvements can be implemented. For each of the access modes considered on a particular type of station, a table of principles was generated. The complete list of evaluation principles covering all access modes is included in Appendix A. Case studies of stations from Brisbane, Perth, and Sydney were used to illustrate the proposed approach. The access modes checklist identified areas of improvement in providing adequate access facilities. More detailed analysis would be required to be able to identify specific areas of improvement. The analysis served to illustrate how the elements and principles can be used as a tool for evaluation and planning for station access. Decision makers and the community can readily understand the visual rating approach. This document presents a new perspective for Australian rail agencies, including access in the overall design process and provides a best practice approach, building on available station access-related planning in Australia and developments in Europe and North America.
Improving Rail Station Access in Australia
CRC for Rail Innovation August 2013 Page viii
List of Figures Figure 1 Rail as part of the door-to-door journey .............................................................................................. 2 Figure 2 Suggested 8-step station planning process flow chart ......................................................................... 3 Figure 3 Modes used for train station access and egress in Sydney ................................................................ 11 Figure 4 Access mode by station - Sydney ....................................................................................................... 12 Figure 5 Density's effect on access mode choice ............................................................................................. 12 Figure 6 Comparison of city centre stations in NSW and QLD ......................................................................... 13 Figure 7 Comparison of PnR stations in QLD and WA ...................................................................................... 13 Figure 8 Comparison of end-of-line stations in QLD and WA ........................................................................... 14 Figure 9 Suggested station access hierarchy .................................................................................................... 15 Figure 10 Rail door-to-door travel zones and zones of influence .................................................................... 17 Figure 11 Walking Access Facility Location ...................................................................................................... 18 Figure 12 Typical layout of a city centre station............................................................................................... 19 Figure 13 Potential and actual walking catchment at 400 or 800 metres around a station ............................ 25 Figure 14 Relationship between street pattern and catchment efficiency ...................................................... 26 Figure 15 Potential trip numbers calculated in a GIS package ......................................................................... 27 Figure 16 Examples of footpath zones ............................................................................................................. 32 Figure 17 Cycling catchment routes feeding a transit station .......................................................................... 38 Figure 18 Bike sharing schemes near stations.................................................................................................. 42 Figure 19 Individual bus route catchment ........................................................................................................ 45 Figure 20 Overall feeder bus catchment .......................................................................................................... 46 Figure 21 Exclusive bus lanes and signal priority ............................................................................................. 48 Figure 22 Desired bus drop-off location as a function of access hierarchy ..................................................... 49 Figure 23 One-way bus lane circulation – Joondalup Station, Joondalup, WA ................................................ 50 Figure 24 Bus passenger Access ....................................................................................................................... 50 Figure 25 Bus drop-off transfer configurations ................................................................................................ 51 Figure 26 KnR on-street vehicular drop-off stacking ........................................................................................ 56 Figure 27 Licence plate survey to determine station PnR catchment .............................................................. 61 Figure 28 PnR elliptical catchment definition .................................................................................................. 62 Figure 29 Example of a visible and secure PnR facility ..................................................................................... 65 Figure 30 Case study stations' access mode proportions ................................................................................ 70 Figure 31 Station access facilities’ layout ......................................................................................................... 71 List of Tables Table 1 Relative importance of rail journey dimensions .................................................................................... 1 Table 2 Important elements of station access planning .................................................................................... 8 Table 3 Station typology for various Australian agencies .................................................................................. 9 Table 4 Access mode hierarchy across station categories ............................................................................... 10 Table 5 Overall access hierarchy for all station types ...................................................................................... 10 Table 6 Access and egress mode of outward rail journeys .............................................................................. 11 Table 7 Mode share targets for various state governments ............................................................................ 14 Table 8 Select Australian station categorisation and corresponding access modes ........................................ 19 Table 9Suggested station categorisation and access mode list ....................................................................... 20 Table 10 TransLink's PTIM generic station access component list ................................................................... 21 Table 11 PTA WA Architectural Guide access-related facilities by station category ....................................... 22 Table 12 Guide for the selection of crossing facilities according to road classification ................................... 33 Table 13 Bicycle parking classification based on level of security offered ....................................................... 41 Table 14 Typical area radius of local bus service .............................................................................................. 45 Table 15 Station access mode principles evaluation format ............................................................................ 68 Table 16 Walking access detailed evaluation principles .................................................................................. 69 Table 17 Case study station profiles ................................................................................................................. 70 Table 18 Case studies access mode principles checklist preliminary evaluation results ................................. 72
Improving Rail Station Access in Australia
CRC for Rail Innovation August 2013 Page ix
Abbreviations and Acronyms AGRD Austroads Guide to Road Design AGTEP Austroads Guide to Traffic Engineering Practice AGTM Austroads Guide to Traffic Management APTA American Public Transportation Association AS Australian Standards BA Bus-Arrival Zone BART Bay Area Rapid Transit BC Bus-Catchment Zone BD Bus-Demand Analysis CA Cycling-Arrival Zone CBD Central Business District CC Cycling-Catchment Zone CCTV Closed Circuit Television CD Cycling-Demand Analysis CPTED Crime Prevention through Environmental Design DDA Disability Discrimination Act DSAPT Disability Standards for Accessible Public Transport DTMR-QLD Department of Transport and Main Roads Queensland FDOT Florida Department of Transportation FRA Federal Railway Administration GIS Geographic Information System KA KnR-Arrival Zone KC KnR-Catchment Zone KD KnR-Demand Analysis KnR Kiss-and-Ride NZTA New Zealand Transport Agency PA PnR-Arrival Zone PC PnR-Catchment Zone PD PnR-Demand Analysis PnR Park-and-Ride PPN Principal Pedestrian Network PTIM Public Transport Infrastructure Manual PTA WA Public Transport Authority of Western Australia RA Rail Agency RTA NSW Road and Traffic Authority New South Wales SFECC South Florida East Coast Corridor SP/RP Stated Preference / Revealed Preference SSAPM Site and Station Access Planning Manual TCQSM Transit Capacity and Quality of Service Manual TCRP Transit Cooperative Research Program TFF Transit Friendliness Factor TfNSW Transport for New South Wales TGSI Tactile Ground Surface Indicator TOI Transit Orientation Index TPDC-NSW Transport and Population Data Centre New South Wales VRIOGS Victorian Rail Industry Operators Group Standards WA Walking-Arrival Zone WAPC Western Australia Planning Commission WA DoT Western Australia Department of Transport WC Walking-Catchment Zone WD Walking-Demand Analysis WMATA Washington Metropolitan Area Transit Authority
Improving Rail Station Access in Australia
CRC for Rail Innovation August 2013 Page 1
1. Introduction Public transport use has been frequently put forward as one of the key transport system management measures to alleviate the worsening problem of road congestion caused by increasing car travel. This measure, however, will only be successful if public transport can provide a better overall benefit in comparison with car travel. As the famous urbanist Wilfred Owens puts it:
The basic reason why most urban trips are made by automobile is that the family car is superior to any other method of transportation. It offers comfort, privacy, limited walking, minimum waiting, and freedom from schedules or routing. It guarantees a seat; protects the traveller from heat, cold and rain; provides space and baggage; carries extra passengers; and for most trips, gets there faster and cheaper. The transit rider confronts an entirely different situation. He must walk, wait, stand, and be exposed to the elements. The ride is apt to be costly, slow, and uncomfortable because of antiquated equipment, poor ventilation, infrequent during any other time of day, inoperative at night, and non-existent in suburbia.(Owens 1950, pp.204-205)
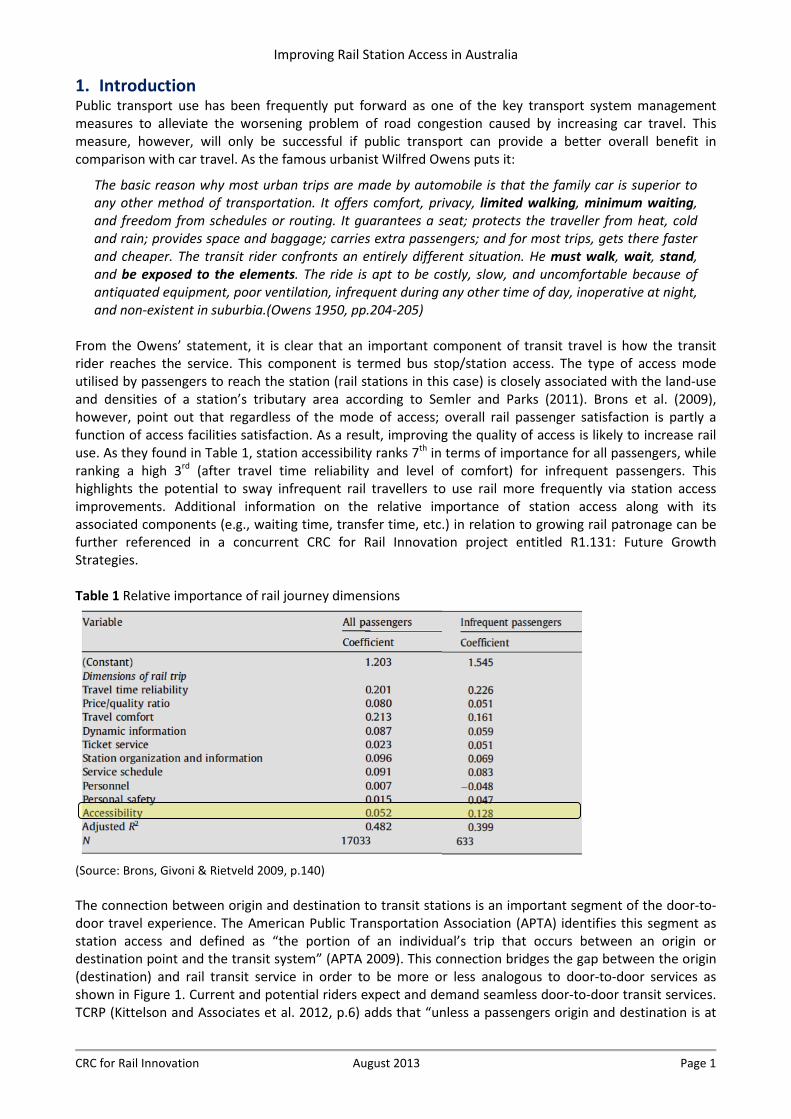
From the Owens’ statement, it is clear that an important component of transit travel is how the transit rider reaches the service. This component is termed bus stop/station access. The type of access mode utilised by passengers to reach the station (rail stations in this case) is closely associated with the land-use and densities of a station’s tributary area according to Semler and Parks (2011). Brons et al. (2009), however, point out that regardless of the mode of access; overall rail passenger satisfaction is partly a function of access facilities satisfaction. As a result, improving the quality of access is likely to increase rail use. As they found in Table 1, station accessibility ranks 7th in terms of importance for all passengers, while ranking a high 3rd (after travel time reliability and level of comfort) for infrequent passengers. This highlights the potential to sway infrequent rail travellers to use rail more frequently via station access improvements. Additional information on the relative importance of station access along with its associated components (e.g., waiting time, transfer time, etc.) in relation to growing rail patronage can be further referenced in a concurrent CRC for Rail Innovation project entitled R1.131: Future Growth Strategies. Table 1 Relative importance of rail journey dimensions
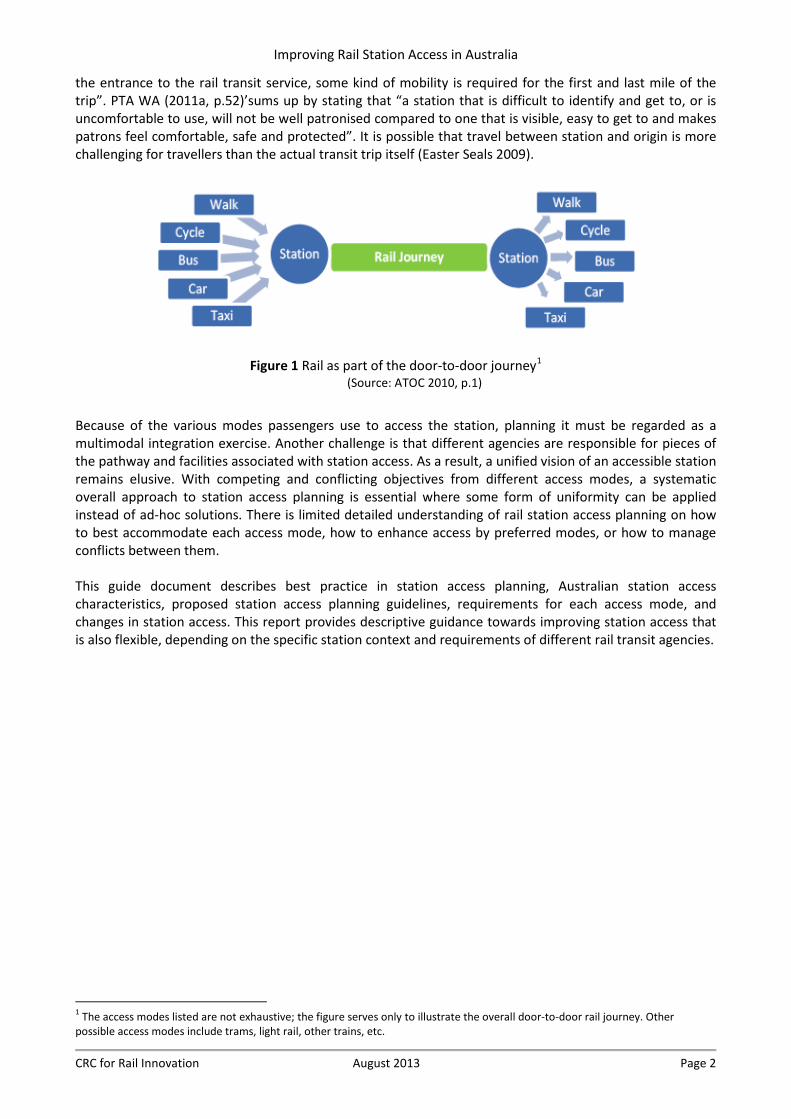
(Source: Brons, Givoni & Rietveld 2009, p.140) The connection between origin and destination to transit stations is an important segment of the door-to-door travel experience. The American Public Transportation Association (APTA) identifies this segment as station access and defined as “the portion of an individual’s trip that occurs between an origin or destination point and the transit system” (APTA 2009). This connection bridges the gap between the origin (destination) and rail transit service in order to be more or less analogous to door-to-door services as shown in Figure 1. Current and potential riders expect and demand seamless door-to-door transit services. TCRP (Kittelson and Associates et al. 2012, p.6) adds that “unless a passengers origin and destination is at
Improving Rail Station Access in Australia
CRC for Rail Innovation August 2013 Page 2
the entrance to the rail transit service, some kind of mobility is required for the first and last mile of the trip”. PTA WA (2011a, p.52)’sums up by stating that “a station that is difficult to identify and get to, or is uncomfortable to use, will not be well patronised compared to one that is visible, easy to get to and makes patrons feel comfortable, safe and protected”. It is possible that travel between station and origin is more challenging for travellers than the actual transit trip itself (Easter Seals 2009).
Figure 1 Rail as part of the door-to-door journey1
(Source: ATOC 2010, p.1)
Because of the various modes passengers use to access the station, planning it must be regarded as a multimodal integration exercise. Another challenge is that different agencies are responsible for pieces of the pathway and facilities associated with station access. As a result, a unified vision of an accessible station remains elusive. With competing and conflicting objectives from different access modes, a systematic overall approach to station access planning is essential where some form of uniformity can be applied instead of ad-hoc solutions. There is limited detailed understanding of rail station access planning on how to best accommodate each access mode, how to enhance access by preferred modes, or how to manage conflicts between them. This guide document describes best practice in station access planning, Australian station access characteristics, proposed station access planning guidelines, requirements for each access mode, and changes in station access. This report provides descriptive guidance towards improving station access that is also flexible, depending on the specific station context and requirements of different rail transit agencies.
1 The access modes listed are not exhaustive; the figure serves only to illustrate the overall door-to-door rail journey. Other possible access modes include trams, light rail, other trains, etc.
Improving Rail Station Access in Australia
CRC for Rail Innovation August 2013 Page 3
2. Review of Station Access Practice Station access planning should be an integral part of the station development effort, especially for improving existing facilities and for designing new facilities. Some rail agencies plan for multi-modal access to their stations, but few have an organised or comprehensive approach to incorporating the different access modes in their station area planning. In fact, many agencies do little to actively measure and analyse access mode data. This is perhaps surprising given the key role that access plays in attracting passengers and generating ridership to rail at a particular location. Most station design guides focus on the physical design requirements of the station environment. In recent times, research has focused on the ever-growing importance of a standardised station access planning process (Kittelson and Associates et al. 2012). This guideline is detailed in the next section including other guides that incorporate access modes in the planning process. Australian station design guides are also explored in order to determine how access modes are integrated in the local context. 2.1 International Guidelines 2.1.1 TCRP Report 153: Guidelines for Providing Access to Public Transportation Stations 2012
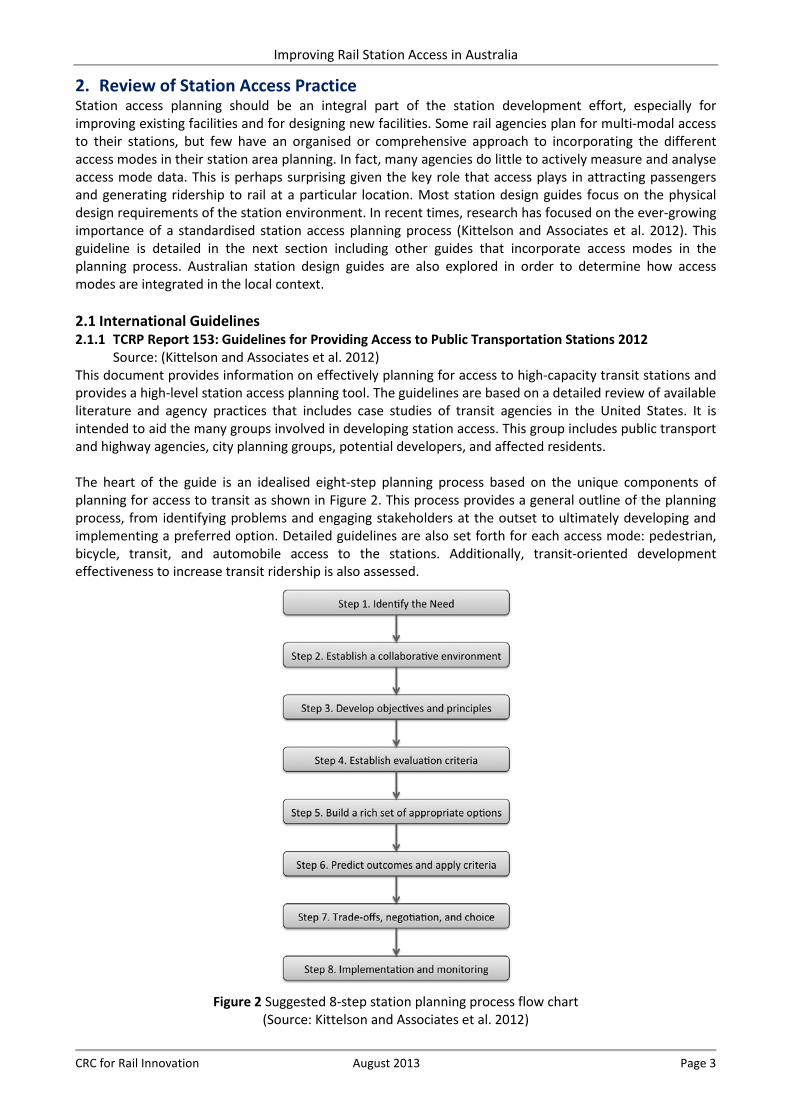
Source: (Kittelson and Associates et al. 2012) This document provides information on effectively planning for access to high-capacity transit stations and provides a high-level station access planning tool. The guidelines are based on a detailed review of available literature and agency practices that includes case studies of transit agencies in the United States. It is intended to aid the many groups involved in developing station access. This group includes public transport and highway agencies, city planning groups, potential developers, and affected residents. The heart of the guide is an idealised eight-step planning process based on the unique components of planning for access to transit as shown in Figure 2. This process provides a general outline of the planning process, from identifying problems and engaging stakeholders at the outset to ultimately developing and implementing a preferred option. Detailed guidelines are also set forth for each access mode: pedestrian, bicycle, transit, and automobile access to the stations. Additionally, transit-oriented development effectiveness to increase transit ridership is also assessed.
Figure 2 Suggested 8-step station planning process flow chart
(Source: Kittelson and Associates et al. 2012)
Improving Rail Station Access in Australia
CRC for Rail Innovation August 2013 Page 4
A station access planning tool in the form of a spreadsheet was designed for the estimation and evaluation of ridership and access mode splits, testing of alternatives, and a rough cost-benefit evaluation. Data input for the tool include: transit and station (within 800-metre radius) related data, census, and employment data. The default values were obtained from a variety of different sources (e.g., literature review, stakeholder interviews, and case studies). Other built-in values in the tool were derived from an analysis of over 600 high-capacity transit stations. Station typologies were also developed from the analysis. The tool is set up to be a step-wise process, with each step on a separate tab in the spreadsheet. In addition, the cells were colour-coded so as to indicate which cells require user input, which are calculations, and which represent output values. The 5th step in the process lists how well each access mode is performing relative to other stations of the same type. This step also evaluates the impact of changes to the access provision. The final step of the process evaluates the fiscal impacts of the option by subtracting costs from the revenues. 2.1.2 Network Rail, UK – Guide to Station Planning and Design 2011
Source: (Network Rail 2011) The guide helps designers to see whether the plans delivered will improve the stations by making them more accessible and easy to use, well integrated with their adjacent communities, and make a positive economic, social and environmental impact. A section of the guide discusses how to coordinate modal integration. Efficient connection between transport modes and services is a core function of stations. Design of connections should balance modal and functional priorities by using safe, direct routes that minimise conflict with other passengers or vehicles. Not only does this minimise passenger journey times, but it also ensures efficient connections that allow passengers to make their onward journey as easily and as logically as possible. Design of inter-modal connections should be consistent with any appropriate relevant local authority guidelines and standards. General best practice principles by mode are included in the guide. As part of the guide, a systematic approach to evaluation using a ‘traffic light’ system to rate each principle was devised, including those mentioned in the previous paragraph related to station access. A ‘green’ light rating shows that all criteria under that principle are met, an ‘amber’ light signifies that some are addressed, while a ‘red’ light shows that only a few (if any) have been considered. Principles having ratings of ‘red’ or ‘amber’ require further improvements to meet best practice. 2.1.3 BART Station Access Guideline 2003
Source: (BART 2003) The guidelines are designed to provide a clear framework to assist in designing facilities at both new and existing stations. It is also intended as a resource to provide a ‘seamless journey’ that can compete with the private automobile, and offer a high level of customer satisfaction to riders who do not have an alternative means of transportation. The guide calls for improvements to station access with the aim of increasing ridership and promoting alternatives to the car by other modes. System-wide targets for individual access modes are defined. These targets were defined by estimating how mode of access will change with expected ridership increases and by considering how BART can influence access modes. By providing facilities (including station access-related) that accommodate favourable modes, these targets can be achieved. The access target is to generally reduce the share of driving alone to the station and increase the proportion of kiss and ride, walk, bike and transit access to the station. 2.1.4 WMATA Station Site and Access Planning Manual 2008
Source: (WMATA 2008) The purpose of the manual is to provide clear, concise design guidelines for station site and access planning for use by the agency, local jurisdictional planners, related government agencies, and joint development partners with interests in planning transit facilities at both new and existing stations, or proposing development at stations. The primary objective of the manual is to illustrate how station site facilities
Improving Rail Station Access in Australia
CRC for Rail Innovation August 2013 Page 5
should be planned so as to optimise pedestrian and vehicular access to the station for all modes of arrival, with a strong focus on physical design and operational issues. To support station access needs, the guidelines are intended to illustrate key transit access principles, approaches, and parameters in enough detail to support effective station access planning, but with enough flexibility to allow individualised solutions at each station and to accommodate the evolution of a station from one typology to another (i.e., terminus to mid-line to urban). It can be helpful in station planning to classify these station types for the purpose of determining which transit site facilities may be expected for a particular geographical area. The station type may change over time as a result of local or regional growth or changes in the transportation system. Typical station types include:
1) Core Stations. These are stations located in high density, downtown areas. These stations are accessible primarily by walking, bicycling, and bus.
2) Mid-Line Stations. Mid-line stations are typically located in areas with low to medium density and are usually accessed by Park & Ride, Kiss & Ride, bus, bicycling, and walking modes. Mid-line stations are located in areas where other Metrorail stations are further away and serve a greater area. Many customers must rely on the non-walking mode to access the station.
3) Terminus Stations. Terminus stations are located at the end of Metrorail lines. Terminus stations are typically accessed by Park & Ride, bus, Kiss & Ride, then walking.
2.2 Local Guidelines 2.2.1 NSW Customer Focused Transport Interchange Design Handbook 2011 (Draft)2 This handbook primarily targets the planning and design of interchanges of which rail stations represent a major type. Interchange is a place where passengers are provided with the opportunity to connect with the public transport network. The train station is a form of interchange where people join or leave the public transport system or transfer between modes. Quick and easy interchange is critical to achieving a fully-integrated transport network. If people are to use an alternative to the private car, interchanges between services need to be efficient, safe, accessible, and welcoming. Furthermore, the interchanges themselves need to be better integrated with their surrounding town centres and suburbs. Interchanges are key parts of the local scene in any town centre. They are – thoroughfares, meeting places, and focal points. Access to the transport network means access to jobs, to education, and to health and other community facilities. By helping people get to these key services and activities, public transport can provide a viable alternative to the private car, while also helping to reduce congestion and improving the region’s liveability. Interchanges play a key role in the transport network by bringing modes together and improving the integration of services. They are the gateways where people join and leave the public transport system, or transfer between services. This handbook provides more detail and guidance on the needs of passengers using transport interchanges (including access needs). It also identifies and considers the needs of other interchange users. Interchange users identified are: pedestrians, cyclists, train passengers, bus passengers, ferry passengers, tram passengers, coach passengers, taxi users, Kiss-and-Ride (KnR) users, and Park-and-Ride (PnR) users. Where conflict arises between interchange users, the access mode priority principles are employed so that the most efficient and sustainable modes are prioritised. 2.2.2 QLD TransLink Public Transport Infrastructure Manual 2012
Source: (TransLink 2012) This manual provides guidelines for the planning and design of public transport infrastructure to support passenger movement and safety within the TransLink network. The manual encourages the use of best
2 Note: This document was drafted by the NSW Department of Transport, predecessor to Transport for NSW (TfNSW). TfNSW is developing the NSW Interchange Strategy as part of its Long Term Transport Master Plan. The Strategy will set a framework for Interchanges in NSW, how they are planned, designed, delivered, operated and maintained. New design guidelines, categorisation and prioritisation of interchanges will be developed as part of this process.
Improving Rail Station Access in Australia
CRC for Rail Innovation August 2013 Page 6
practice and provides guidance to ensure that consistency is maintained with respect to the delivery of high-quality customer access, convenience, safety and comfort of public transport infrastructure. The manual also outlines preferred requirements of infrastructure design so as to comply with all pertinent standards and regulations. It also encourages collaboration between key stakeholders and delivery partners. Principles of station planning and design, environment, formation and design are detailed in Chapter 3, followed by principles relating to supporting access infrastructure in Chapter 4. Access modes and hierarchy are defined (decreasing priority) as walk, cycle, bus feeder, KnR and PnR. The use of the guide and its guiding principles are employed early on in the interchange planning process. In particular, station access requirements and principles are tackled early on in the design process. Requirements for each station access mode are further broken down into components dealing with integration of supporting access infrastructure, demand analysis, other supporting components, design considerations, and approval process. The most important components relating to station access are supporting access infrastructure and demand analysis. Supporting access infrastructure is further divided into requirements on the broader network, network integration, design integration, internal network, location, need identification, crossings, staging, accessibility and land uses, and hazards. Demand analysis prescribes methodologies, tools, and sources of data in order to estimate passenger demand (by access mode). 2.2.3 Victoria’s VRIOGS-002.1 Railway Station Design and Guidelines 2011
Source: (State Government of Victoria 2011) This guide stipulates the criteria required for new, upgrade or refurbishment of passenger rail stations for both the regional and metropolitan networks in Victoria. The standard identifies key requirements and considerations for the station and other essential facilities. The standard ensures uniformity and compatibility for future stations and that the stations are accessible, safe and convenient for all users (including staff). The document details key functional areas but is flexible enough to allow for context-specific adjustments. Chapter 16 of the standard describes the external areas of the station allotted for access, particularly facilities associated with bicycle parking, car parking and waste disposal. The access facilities catered for include: bus stops (from single on-street bus stop to dedicated bus bays or off-street bus/rail interchanges); Tram zones; Taxi zones; Bicycle parking; Car parking (from off-street to large multi-storey structures); and KnR. Detailed design requirements for bicycle parking and storage and station car parking are discussed in the same chapter. 2.2.4 PTA WA Architectural Design Guide for Stations 2011
Source: (PTA-WA 2011a) The purpose of the guide is to provide design consultants with a framework when designing and refurbishing public transport infrastructure buildings such as bus and train stations. The guide identifies the type of station on the urban rail system depending on their location, function and connectivity to other transport systems and routes, and their patronage. On the basis of this categorisation, facilities and amenities provided at stations are generally determined. However, all stations are different and there will be exceptions to the general rules. The general guiding principles for a stations function on the guide are: to provide for local walk on and cycle patrons, to provide attractive and convenient inter-modal transfer for feeder buses, and intercept and encourage automobile users to shift to public transport by providing PnR, pay-and-display, and KnR facilities. Also, the general principles of patronage hierarchy are aimed to reward pedestrian, cycle and bus users with shorter distances, higher convenience and higher comfort levels than private car users. Short term (KnR) and accessible parking is encouraged over long term parking. The fundamental principles considered in ‘the planning and design of stations in the guide are: patronage hierarchy; function-planning to suit patronage; vehicle and pedestrian access to the station precinct; position of station forecourt and entry building; security/visibility/passive surveillance; emergency egress;
Improving Rail Station Access in Australia
CRC for Rail Innovation August 2013 Page 7
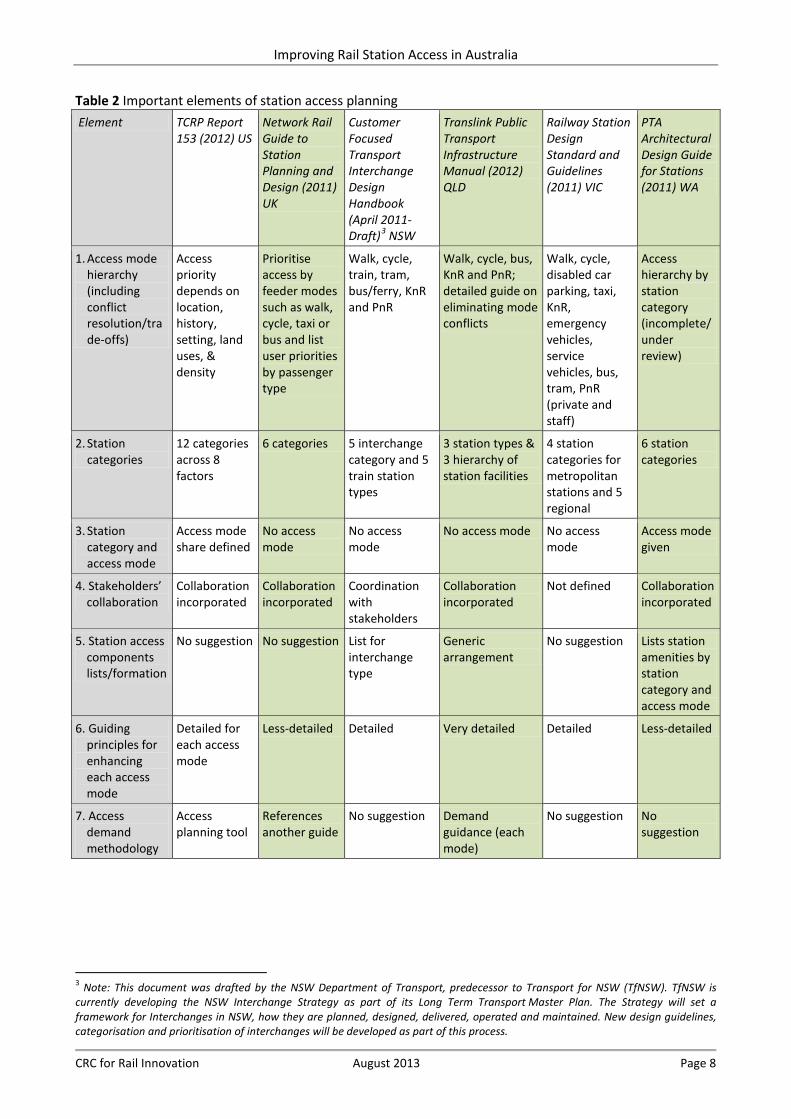
and access for emergency vehicles. A detailed discussion and lists of requirements to satisfy the principles listed above are specified in the guide. 2.3 Comparison of Important Station Access Elements Table 2 lists a comparison of six rail station/interchange guides which are evaluated across important station access planning elements. Ideal components described and identified in the guides are listed in order to develop a satisfactory station access guide.
1) Access mode hierarchy (including conflict resolution/trade-offs). A well-defined access mode hierarchy reflects the mode most favoured (e.g., more environmentally sustainable modes) by the transit agency. In addition, hierarchies aid in managing and resolving trade-offs between competing and/or conflicting modes. Guidance on the resolution of conflicts between all competing modes should be incorporated. Having access hierarchies for each station category (PTA-WA Guide) may be more appropriate and robust, but adds to the complexity of the analysis.
2) Station categories. A comprehensive station category based on several important factors (patronage, revenue, density, etc.), including access mode characteristics is essential in the station planning process. Depending on the size of the network and the type of services provided, the number of station categories can be defined. The 12 categories identified in TCRP Report 153 is a comprehensive listing of station types in the United States. The number of categories reflects the diversity and number of stations involved in the investigation. This categorisation may not be appropriate for smaller rail networks such as those found in Australia. Based on a review of guides from Australia, a maximum of 8 station categories seems sufficient.
3) Station category and access mode. Data collection of access mode share for each station can be utilised to monitor changes in demand for redevelopment purposes. This information can be also used to estimate access demands of new stations having similar characteristics. The new station may not be exactly the same, but this can serve as a baseline guide as to the type and quantity of access-related facilities required.
4) Stakeholders’ collaboration. Because of the multi-modal nature of station access and location of essential access components, collaboration (of the RAs) with other stakeholders is a necessity. Almost all guides identify the importance of collaboration in providing access to stations.
5) Station access components lists/formation. There are two prevailing practices on access components formation, namely: generic list after which specific components are added (TransLink’s PTIM) and very detailed components’ list (PTA-WA Guide). Both practices have their advantages and disadvantages depending on the policies implemented by the RAs. A generic list and adding components based on local requirements has greater flexibility; however, other components may be overlooked. A comprehensive list of access facilities across modes and station categories is an ideal way of identifying basic access facilities, but some form of customisation is still necessary. With respect to station access components arrangement, only TransLink’s PTIM prescribes guidelines on locating access facilities.
6) Guiding principles for enhancing each access mode. TCRP Report 153 and TransLink’s PTIM provide the most comprehensive principles with respect to enhancing the various access modes.
7) Access demand estimation methodology. A station access model can be an ideal tool for estimating demand for each access mode for new and redeveloped stations. In developing the model, a comprehensive data collection task needs to be undertaken. This model may need to be updated regularly. TransLink’s PTIM identifies factors that need to be considered in estimating demands for each access mode and recommends appropriate tools for the estimation. Access demands are estimated individually rather than in combination.
Improving Rail Station Access in Australia
CRC for Rail Innovation August 2013 Page 8
Table 2 Important elements of station access planning Element TCRP Report
153 (2012) US Network Rail Guide to Station Planning and Design (2011) UK
Customer Focused Transport Interchange Design Handbook (April 2011-Draft)3 NSW
Translink Public Transport Infrastructure Manual (2012) QLD
Railway Station Design Standard and Guidelines (2011) VIC
PTA Architectural Design Guide for Stations (2011) WA
1. Access mode hierarchy (including conflict resolution/trade-offs)
Access priority depends on location, history, setting, land uses, & density
Prioritise access by feeder modes such as walk, cycle, taxi or bus and list user priorities by passenger type
Walk, cycle, train, tram, bus/ferry, KnR and PnR
Walk, cycle, bus, KnR and PnR; detailed guide on eliminating mode conflicts
Walk, cycle, disabled car parking, taxi, KnR, emergency vehicles, service vehicles, bus, tram, PnR (private and staff)
Access hierarchy by station category (incomplete/ under review)
2. Station categories
12 categories across 8 factors
6 categories 5 interchange category and 5 train station types
3 station types & 3 hierarchy of station facilities
4 station categories for metropolitan stations and 5 regional
6 station categories
3. Station category and access mode
Access mode share defined
No access mode
No access mode
No access mode No access mode
Access mode given
4. Stakeholders’ collaboration
Collaboration incorporated
Collaboration incorporated
Coordination with stakeholders
Collaboration incorporated
Not defined Collaboration incorporated
5. Station access components lists/formation
No suggestion No suggestion List for interchange type
Generic arrangement
No suggestion Lists station amenities by station category and access mode
6. Guiding principles for enhancing each access mode
Detailed for each access mode
Less-detailed Detailed Very detailed Detailed Less-detailed
7. Access demand methodology
Access planning tool
References another guide
No suggestion Demand guidance (each mode)
No suggestion No suggestion
3 Note: This document was drafted by the NSW Department of Transport, predecessor to Transport for NSW (TfNSW). TfNSW is currently developing the NSW Interchange Strategy as part of its Long Term Transport Master Plan. The Strategy will set a framework for Interchanges in NSW, how they are planned, designed, delivered, operated and maintained. New design guidelines, categorisation and prioritisation of interchanges will be developed as part of this process.
Improving Rail Station Access in Australia
CRC for Rail Innovation August 2013 Page 9
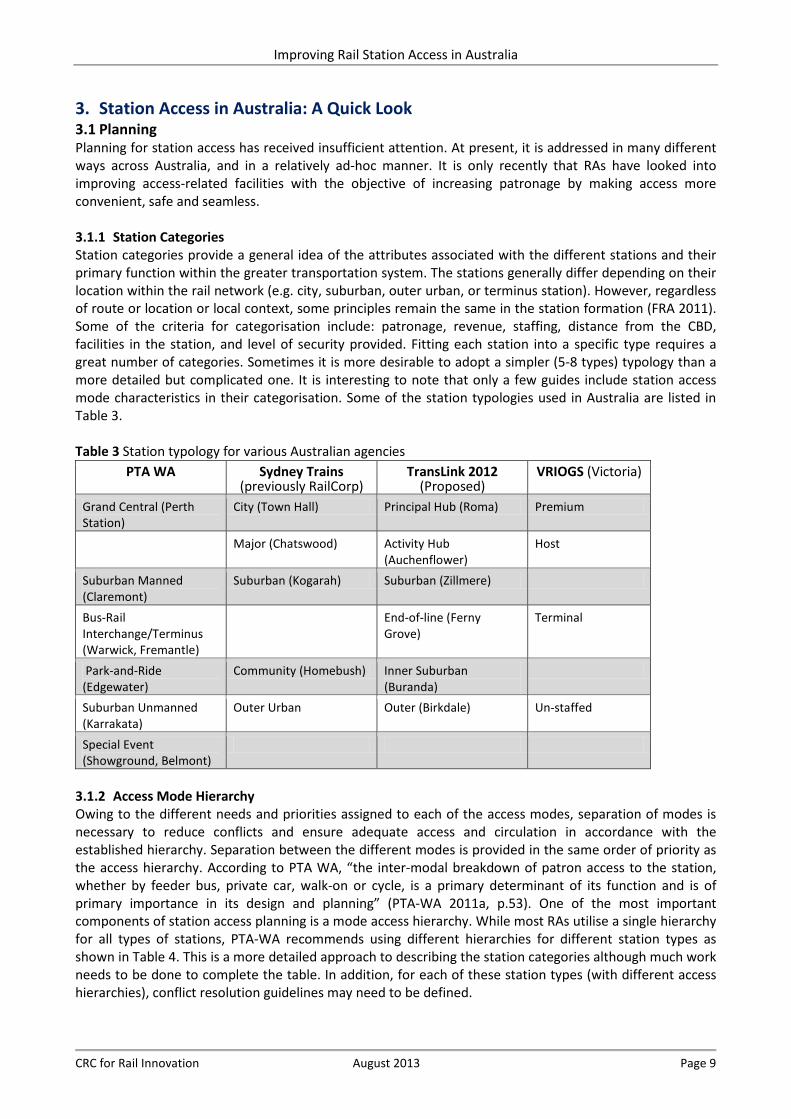
3. Station Access in Australia: A Quick Look 3.1 Planning Planning for station access has received insufficient attention. At present, it is addressed in many different ways across Australia, and in a relatively ad-hoc manner. It is only recently that RAs have looked into improving access-related facilities with the objective of increasing patronage by making access more convenient, safe and seamless. 3.1.1 Station Categories Station categories provide a general idea of the attributes associated with the different stations and their primary function within the greater transportation system. The stations generally differ depending on their location within the rail network (e.g. city, suburban, outer urban, or terminus station). However, regardless of route or location or local context, some principles remain the same in the station formation (FRA 2011). Some of the criteria for categorisation include: patronage, revenue, staffing, distance from the CBD, facilities in the station, and level of security provided. Fitting each station into a specific type requires a great number of categories. Sometimes it is more desirable to adopt a simpler (5-8 types) typology than a more detailed but complicated one. It is interesting to note that only a few guides include station access mode characteristics in their categorisation. Some of the station typologies used in Australia are listed in Table 3. Table 3 Station typology for various Australian agencies
PTA WA Sydney Trains (previously RailCorp)
TransLink 2012 (Proposed)
VRIOGS (Victoria)
Grand Central (Perth Station)
City (Town Hall) Principal Hub (Roma) Premium
Major (Chatswood) Activity Hub (Auchenflower)
Host
Suburban Manned (Claremont)
Suburban (Kogarah) Suburban (Zillmere)
Bus-Rail Interchange/Terminus (Warwick, Fremantle)
End-of-line (Ferny Grove)
Terminal
Park-and-Ride (Edgewater)
Community (Homebush) Inner Suburban (Buranda)
Suburban Unmanned (Karrakata)
Outer Urban Outer (Birkdale) Un-staffed
Special Event (Showground, Belmont)
3.1.2 Access Mode Hierarchy Owing to the different needs and priorities assigned to each of the access modes, separation of modes is necessary to reduce conflicts and ensure adequate access and circulation in accordance with the established hierarchy. Separation between the different modes is provided in the same order of priority as the access hierarchy. According to PTA WA, “the inter-modal breakdown of patron access to the station, whether by feeder bus, private car, walk-on or cycle, is a primary determinant of its function and is of primary importance in its design and planning” (PTA-WA 2011a, p.53). One of the most important components of station access planning is a mode access hierarchy. While most RAs utilise a single hierarchy for all types of stations, PTA-WA recommends using different hierarchies for different station types as shown in Table 4. This is a more detailed approach to describing the station categories although much work needs to be done to complete the table. In addition, for each of these station types (with different access hierarchies), conflict resolution guidelines may need to be defined.
Improving Rail Station Access in Australia
CRC for Rail Innovation August 2013 Page 10
In a bus-rail interchange station, for example, buses are given primacy of access with set-down areas located as close as possible to the station entry building, with covered access ways for weather protection. Next in line are walk-on and cycle facilities planned around the station entry building, with convenient access paths as part of the forecourt approach. KnR on the other hand is placed adjacent to the bus transfer but without disadvantaging bus transfer. Covered access ways are provided for Kiss and Ride users at park and ride stations only. The PnR parking facility is placed further from the station building forecourt. The pay and display parking facility is generally the furthest from the station forecourt, although it is often placed in residual land between access roads so as to maximise land use. Table 4 Access mode hierarchy across station categories
Access Hierarchy Grand Central Bus-Rail Interchange Park-n-Ride Stations 1 Under review Bus users Walk/cycle users 2 Walk/cycle users KnR & disabled 3 KnR & disabled Long term PnR 4 Long term PnR Long term Pay & Display 5 Long term Pay & Display
(Source: PTA-WA 2011a, p.65) Conversely, other Australian agencies use a more traditional approach to access hierarchy with a single pecking order across the station categories as shown in Table 5. A shared characteristic among the hierarchies listed is that the walking mode is given the highest priority, while PnR is given the least precedence. Regardless of the given hierarchies, further details are needed on how to best accommodate each access mode, how to enhance access by preferred modes, and how to manage conflicts between them resulting from the hierarchies. Table 5 Overall access hierarchy for all station types
Access Rank NSW Qld Vic 1 Pedestrian/bicycle Walk Pedestrian 2 Train Cycle Informal bike storage 3 Tram Feeder public transport Bike cages 4 Bus/Ferry KnR Disabled car parking 5 KnR PnR Taxi ranks 6 PnR KnR 7 Emergency service vehicles 8 Service vehicles 9 Bus
10 Tram 11 Private car parking
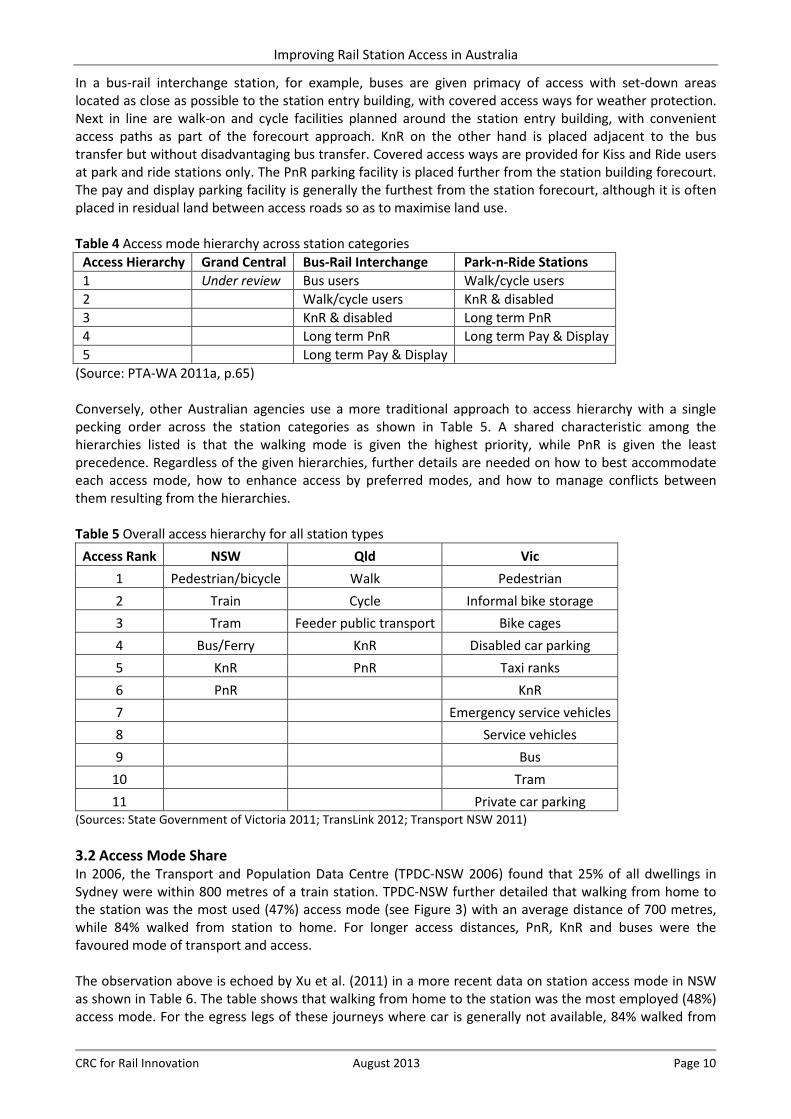
(Sources: State Government of Victoria 2011; TransLink 2012; Transport NSW 2011) 3.2 Access Mode Share In 2006, the Transport and Population Data Centre (TPDC-NSW 2006) found that 25% of all dwellings in Sydney were within 800 metres of a train station. TPDC-NSW further detailed that walking from home to the station was the most used (47%) access mode (see Figure 3) with an average distance of 700 metres, while 84% walked from station to home. For longer access distances, PnR, KnR and buses were the favoured mode of transport and access. The observation above is echoed by Xu et al. (2011) in a more recent data on station access mode in NSW as shown in Table 6. The table shows that walking from home to the station was the most employed (48%) access mode. For the egress legs of these journeys where car is generally not available, 84% walked from
Improving Rail Station Access in Australia
CRC for Rail Innovation August 2013 Page 11
station to destination. For most people, car is an important mode for the access part of the journey however, for the egress legs of these journeys, car is generally not available.
Access Egress
Figure 3 Modes used for train station access and egress in Sydney (Source: TPDC-NSW 2006, p.3-4)
Table 6 Access and egress mode of outward rail journeys
Mode Access, % Egress, % PnR 18.8 0.3 KnR 18.6 2.2 Bus 13.5 11.7 Bicycle 0.7 0.5 Walk 48.0 83.7 Taxi 0.4 0.4 Other 0.1 1.2
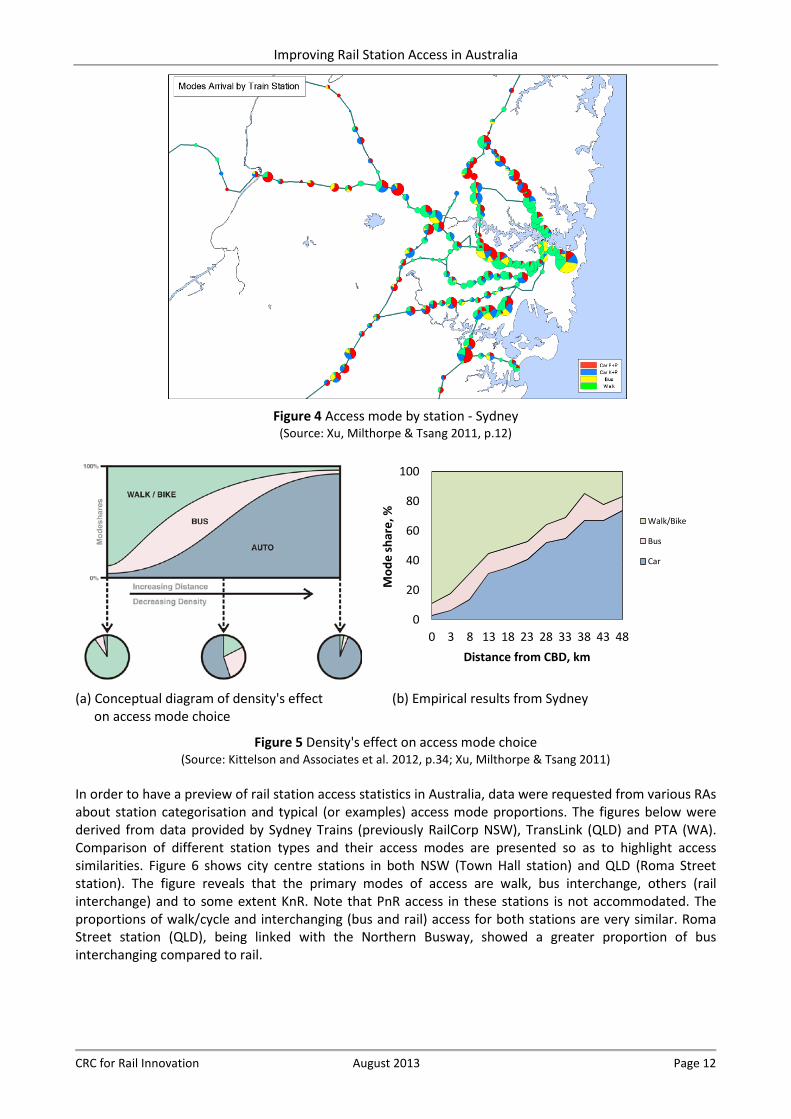
(Source: Xu, Milthorpe & Tsang 2011, p.9) Figure 4 presents the access mode by station along the NSW rail network. Xu, Milthorpe & Tsang (2011) found that walking is the preferred access mode for inner station locations, while car access was the mode of choice for passengers living further away from the CBD. As hypothesised, the type access mode to train stations is affected by development density, as illustrated in Figure 5(a). This is corroborated by empirical results from the plot of access mode shares versus distance from the CBD in Sydney shown in Figure 5(b). What can be learned here is that, even though car access is the least desirable mode, there will be conditions where it can be the only viable mode of access for passengers. As a result, providing for this mode in such situations is essential for continued and/or increasing patronage.
Walking84%
Car2%
Bus12%
Other2%
Walking 48%
Car-park and ride
16%
Car-kiss and ride
19%
Bus 16%
Other 1%
Improving Rail Station Access in Australia
CRC for Rail Innovation August 2013 Page 12
Figure 4 Access mode by station - Sydney
(Source: Xu, Milthorpe & Tsang 2011, p.12)
(a) Conceptual diagram of density's effect (b) Empirical results from Sydney
on access mode choice
Figure 5 Density's effect on access mode choice (Source: Kittelson and Associates et al. 2012, p.34; Xu, Milthorpe & Tsang 2011)
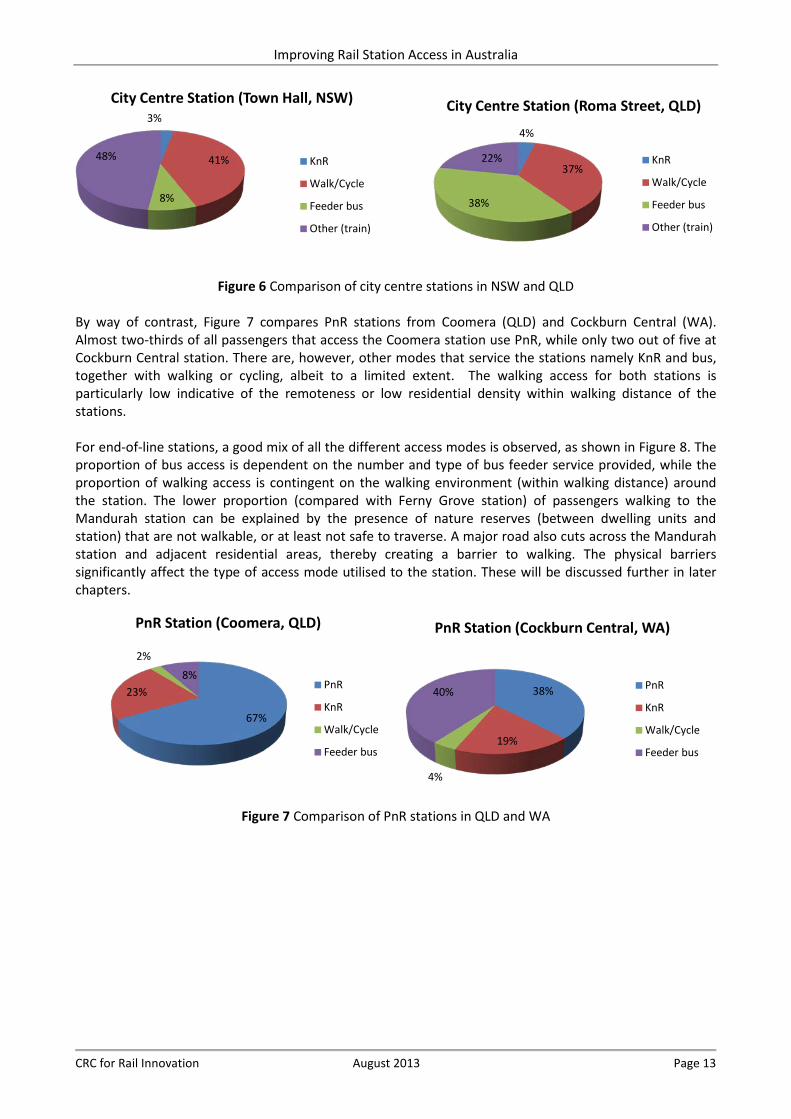
In order to have a preview of rail station access statistics in Australia, data were requested from various RAs about station categorisation and typical (or examples) access mode proportions. The figures below were derived from data provided by Sydney Trains (previously RailCorp NSW), TransLink (QLD) and PTA (WA). Comparison of different station types and their access modes are presented so as to highlight access similarities. Figure 6 shows city centre stations in both NSW (Town Hall station) and QLD (Roma Street station). The figure reveals that the primary modes of access are walk, bus interchange, others (rail interchange) and to some extent KnR. Note that PnR access in these stations is not accommodated. The proportions of walk/cycle and interchanging (bus and rail) access for both stations are very similar. Roma Street station (QLD), being linked with the Northern Busway, showed a greater proportion of bus interchanging compared to rail.
0
20
40
60
80
100
0 3 8 13 18 23 28 33 38 43 48
Mod
e sh
are,
%
Distance from CBD, km
Walk/Bike
Bus
Car
Improving Rail Station Access in Australia
CRC for Rail Innovation August 2013 Page 13
Figure 6 Comparison of city centre stations in NSW and QLD
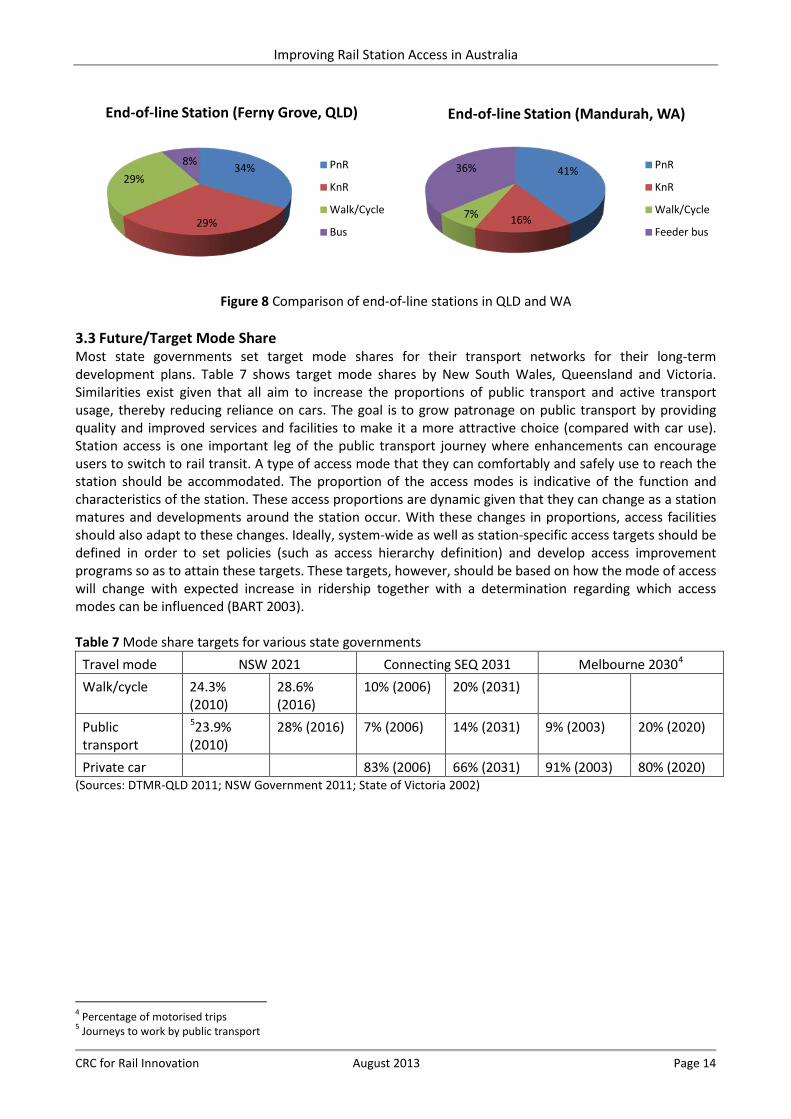
By way of contrast, Figure 7 compares PnR stations from Coomera (QLD) and Cockburn Central (WA). Almost two-thirds of all passengers that access the Coomera station use PnR, while only two out of five at Cockburn Central station. There are, however, other modes that service the stations namely KnR and bus, together with walking or cycling, albeit to a limited extent. The walking access for both stations is particularly low indicative of the remoteness or low residential density within walking distance of the stations. For end-of-line stations, a good mix of all the different access modes is observed, as shown in Figure 8. The proportion of bus access is dependent on the number and type of bus feeder service provided, while the proportion of walking access is contingent on the walking environment (within walking distance) around the station. The lower proportion (compared with Ferny Grove station) of passengers walking to the Mandurah station can be explained by the presence of nature reserves (between dwelling units and station) that are not walkable, or at least not safe to traverse. A major road also cuts across the Mandurah station and adjacent residential areas, thereby creating a barrier to walking. The physical barriers significantly affect the type of access mode utilised to the station. These will be discussed further in later chapters.
Figure 7 Comparison of PnR stations in QLD and WA
3%
41%
8%
48%
City Centre Station (Town Hall, NSW)
KnR
Walk/Cycle
Feeder bus
Other (train)
4%
37%
38%
22%
City Centre Station (Roma Street, QLD)
KnR
Walk/Cycle
Feeder bus
Other (train)
67%
23%
2%
8%
PnR Station (Coomera, QLD)
PnR
KnR
Walk/Cycle
Feeder bus
38%
19%
4%
40%
PnR Station (Cockburn Central, WA)
PnR
KnR
Walk/Cycle
Feeder bus
Improving Rail Station Access in Australia
CRC for Rail Innovation August 2013 Page 14
Figure 8 Comparison of end-of-line stations in QLD and WA
3.3 Future/Target Mode Share Most state governments set target mode shares for their transport networks for their long-term development plans. Table 7 shows target mode shares by New South Wales, Queensland and Victoria. Similarities exist given that all aim to increase the proportions of public transport and active transport usage, thereby reducing reliance on cars. The goal is to grow patronage on public transport by providing quality and improved services and facilities to make it a more attractive choice (compared with car use). Station access is one important leg of the public transport journey where enhancements can encourage users to switch to rail transit. A type of access mode that they can comfortably and safely use to reach the station should be accommodated. The proportion of the access modes is indicative of the function and characteristics of the station. These access proportions are dynamic given that they can change as a station matures and developments around the station occur. With these changes in proportions, access facilities should also adapt to these changes. Ideally, system-wide as well as station-specific access targets should be defined in order to set policies (such as access hierarchy definition) and develop access improvement programs so as to attain these targets. These targets, however, should be based on how the mode of access will change with expected increase in ridership together with a determination regarding which access modes can be influenced (BART 2003). Table 7 Mode share targets for various state governments
Travel mode NSW 2021 Connecting SEQ 2031 Melbourne 20304 Walk/cycle 24.3%
(2010) 28.6% (2016)
10% (2006) 20% (2031)
Public transport
523.9% (2010)
28% (2016) 7% (2006) 14% (2031) 9% (2003) 20% (2020)
Private car 83% (2006) 66% (2031) 91% (2003) 80% (2020) (Sources: DTMR-QLD 2011; NSW Government 2011; State of Victoria 2002)
4 Percentage of motorised trips 5 Journeys to work by public transport
34%
29%
29% 8%
End-of-line Station (Ferny Grove, QLD)
PnR
KnR
Walk/Cycle
Bus
41%
16% 7%
36%
End-of-line Station (Mandurah, WA)
PnR
KnR
Walk/Cycle
Feeder bus
Improving Rail Station Access in Australia
CRC for Rail Innovation August 2013 Page 15
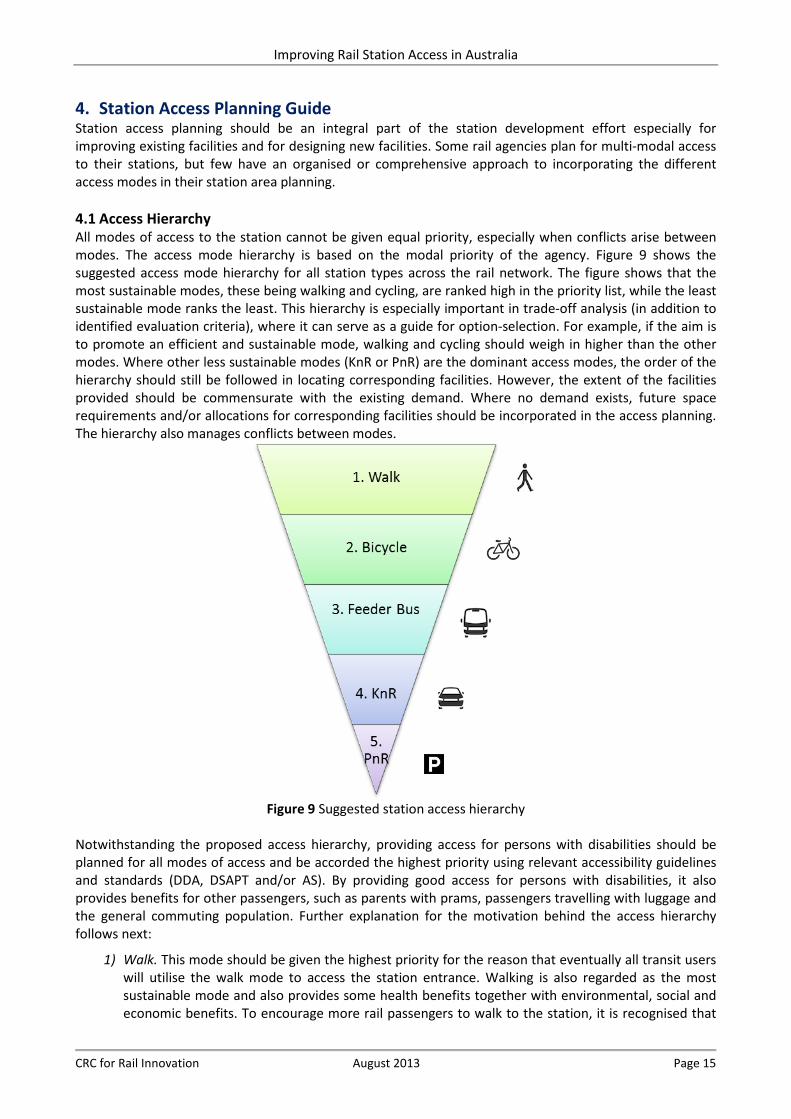
4. Station Access Planning Guide Station access planning should be an integral part of the station development effort especially for improving existing facilities and for designing new facilities. Some rail agencies plan for multi-modal access to their stations, but few have an organised or comprehensive approach to incorporating the different access modes in their station area planning. 4.1 Access Hierarchy All modes of access to the station cannot be given equal priority, especially when conflicts arise between modes. The access mode hierarchy is based on the modal priority of the agency. Figure 9 shows the suggested access mode hierarchy for all station types across the rail network. The figure shows that the most sustainable modes, these being walking and cycling, are ranked high in the priority list, while the least sustainable mode ranks the least. This hierarchy is especially important in trade-off analysis (in addition to identified evaluation criteria), where it can serve as a guide for option-selection. For example, if the aim is to promote an efficient and sustainable mode, walking and cycling should weigh in higher than the other modes. Where other less sustainable modes (KnR or PnR) are the dominant access modes, the order of the hierarchy should still be followed in locating corresponding facilities. However, the extent of the facilities provided should be commensurate with the existing demand. Where no demand exists, future space requirements and/or allocations for corresponding facilities should be incorporated in the access planning. The hierarchy also manages conflicts between modes.
Figure 9 Suggested station access hierarchy
Notwithstanding the proposed access hierarchy, providing access for persons with disabilities should be planned for all modes of access and be accorded the highest priority using relevant accessibility guidelines and standards (DDA, DSAPT and/or AS). By providing good access for persons with disabilities, it also provides benefits for other passengers, such as parents with prams, passengers travelling with luggage and the general commuting population. Further explanation for the motivation behind the access hierarchy follows next:
1) Walk. This mode should be given the highest priority for the reason that eventually all transit users will utilise the walk mode to access the station entrance. Walking is also regarded as the most sustainable mode and also provides some health benefits together with environmental, social and economic benefits. To encourage more rail passengers to walk to the station, it is recognised that
Improving Rail Station Access in Australia
CRC for Rail Innovation August 2013 Page 16
providing a safe and convenient walking environment between the passengers’ origin and the station entrance cannot be overemphasised. These walking environments should be separate from vehicular traffic wherever possible. Catering to the needs of this access mode can generally increase rail ridership with minimal capital investment.
2) Bicycle. Another efficient and environmentally friendly mode is cycling. This mode should be given priority next to the walk mode. On shared zones, cyclists should give-way (dismount) to pedestrians to avoid conflicts, especially in heavy pedestrian traffic areas. Within the station area, motorised modes (buses and cars) should give-way to bicycles. Bicycle lanes should be provided and clearly marked on access roads.
3) Feeder bus. Buses carry large numbers of passengers, thereby making it the most efficient motorised access mode. As a result, it should be given access priority over other motorised modes. Other motorised modes should not interfere with bus feeder access. Wherever possible, bus flow should be separated from other traffic and a one-way flow is preferred.
4) KnR. A more efficient mode of access than PnR is when passengers are being dropped-off or picked-up at stations via car because the former requires less space within the station precinct. As a result, pick-up/drop-off is given higher priority than PnR and thus closer proximity to station entrance (but farther than bus feeder drop-off). Pick-up/drop-off access routes should not pass through PnR areas where possible.
5) PnR. Park-and-ride is given the lowest priority because it is the least sustainable mode and requires greater capital investment to be accommodated. Despite this, PnR still plays an important role in station access as it enables the expansion of the catchment to areas beyond the walking and cycling catchments, where another driver is not available to drop-off/pick-up passengers and where bus feeder service is nonexistent. PnR also shifts parking demands from central areas, extends the reach of terminal stations, provides access for widely-spaced stations, and removes motorists from congested corridors (Kittelson and Associates et al. 2012).
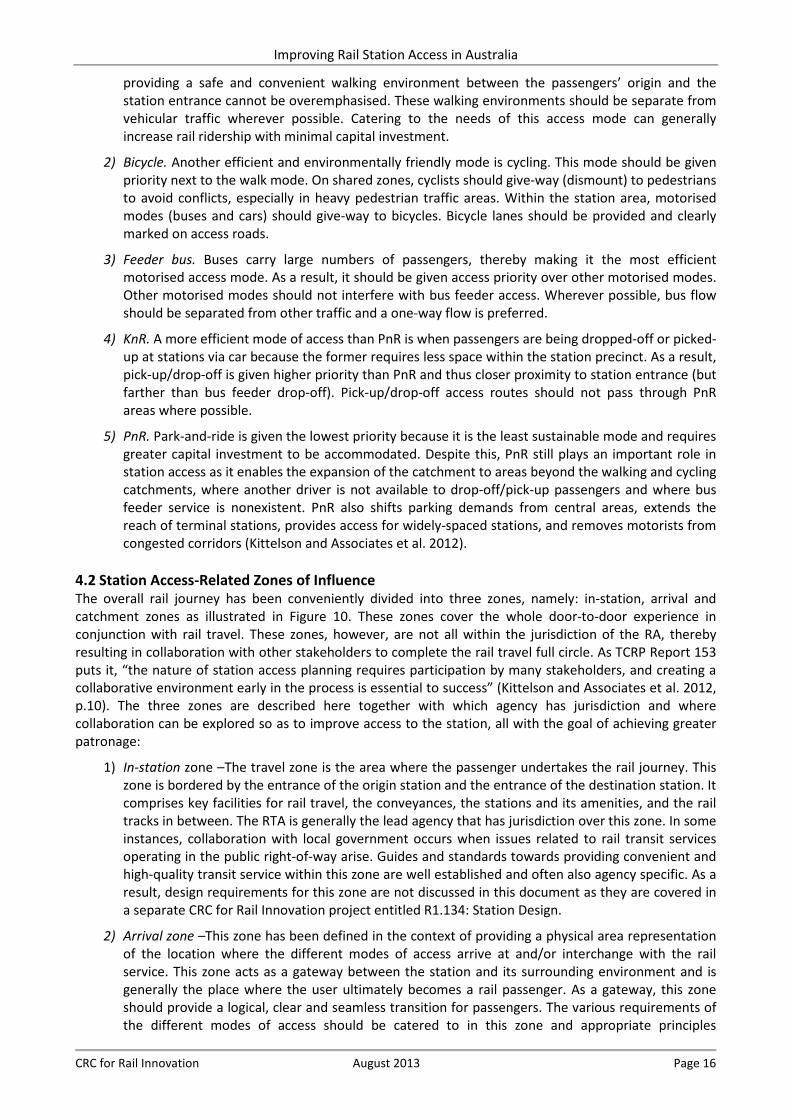
4.2 Station Access-Related Zones of Influence The overall rail journey has been conveniently divided into three zones, namely: in-station, arrival and catchment zones as illustrated in Figure 10. These zones cover the whole door-to-door experience in conjunction with rail travel. These zones, however, are not all within the jurisdiction of the RA, thereby resulting in collaboration with other stakeholders to complete the rail travel full circle. As TCRP Report 153 puts it, “the nature of station access planning requires participation by many stakeholders, and creating a collaborative environment early in the process is essential to success” (Kittelson and Associates et al. 2012, p.10). The three zones are described here together with which agency has jurisdiction and where collaboration can be explored so as to improve access to the station, all with the goal of achieving greater patronage:
1) In-station zone –The travel zone is the area where the passenger undertakes the rail journey. This zone is bordered by the entrance of the origin station and the entrance of the destination station. It comprises key facilities for rail travel, the conveyances, the stations and its amenities, and the rail tracks in between. The RTA is generally the lead agency that has jurisdiction over this zone. In some instances, collaboration with local government occurs when issues related to rail transit services operating in the public right-of-way arise. Guides and standards towards providing convenient and high-quality transit service within this zone are well established and often also agency specific. As a result, design requirements for this zone are not discussed in this document as they are covered in a separate CRC for Rail Innovation project entitled R1.134: Station Design.
2) Arrival zone –This zone has been defined in the context of providing a physical area representation of the location where the different modes of access arrive at and/or interchange with the rail service. This zone acts as a gateway between the station and its surrounding environment and is generally the place where the user ultimately becomes a rail passenger. As a gateway, this zone should provide a logical, clear and seamless transition for passengers. The various requirements of the different modes of access should be catered to in this zone and appropriate principles
Improving Rail Station Access in Australia
CRC for Rail Innovation August 2013 Page 17
implemented (e.g., access hierarchy as discussed above). Principles of access for each access mode will be described in greater detail in Chapter 5. With regard to the agency in charge of the design and maintenance of this zone, the RTA should take the lead in providing and improving facilities. Collaboration with the relevant local jurisdiction, road authorities, other transit agencies and private developers involve ensuring that the arrival zone links well with other access elements and services for the different modes within the catchment zone.
3) Catchment zone – This zone is the area between each mode’s origin and the arrival zone and is beyond the confines of the travel and arrival zones. These zones vary in size and elements of access depending on the mode in question. For example, the catchment zone for walking access generally consists of links (streets and pedestrian paths) within walking distance (distance people are willing to walk) around the station. Local jurisdictions in general are responsible for constructing and maintaining walking pathways on local roads, while private developers are required to incorporate walkability in their developments. Where pathways are under state jurisdiction, state transport departments are in charge. Similarly for bicycle access, the catchment is defined by the bicycle-accessible routes around the station. This coverage is detailed in Chapter 5. Responsibility for these access routes falls within local and state transport departments’ jurisdiction. Further details on the other access mode catchments are discussed in the next chapter. The role that RAs play within the catchment zones is to effect measures (through collaboration with relevant jurisdictions) to improve and market the different access modes to their stations, thereby increasing visibility and market share.
Figure 10 Rail door-to-door travel zones and zones of influence
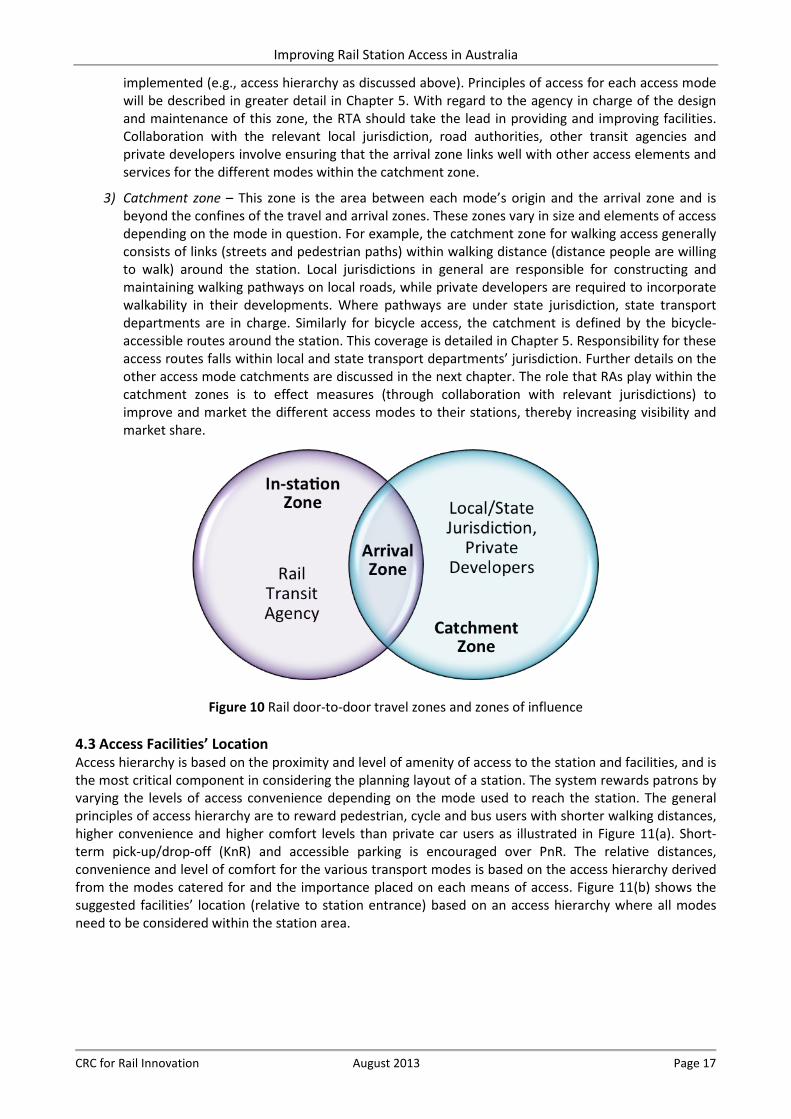
4.3 Access Facilities’ Location Access hierarchy is based on the proximity and level of amenity of access to the station and facilities, and is the most critical component in considering the planning layout of a station. The system rewards patrons by varying the levels of access convenience depending on the mode used to reach the station. The general principles of access hierarchy are to reward pedestrian, cycle and bus users with shorter walking distances, higher convenience and higher comfort levels than private car users as illustrated in Figure 11(a). Short-term pick-up/drop-off (KnR) and accessible parking is encouraged over PnR. The relative distances, convenience and level of comfort for the various transport modes is based on the access hierarchy derived from the modes catered for and the importance placed on each means of access. Figure 11(b) shows the suggested facilities’ location (relative to station entrance) based on an access hierarchy where all modes need to be considered within the station area.
Improving Rail Station Access in Australia
CRC for Rail Innovation August 2013 Page 18
Station Entrance
PnRCatchment up to 10km
WalkCatchment up to 1200m
BicycleCatchment up to 2.5km
KnRCatchment up to 10km
Bus feederCatchment depends on service
max 150m
max 180m
max 450m
House
House
House
House
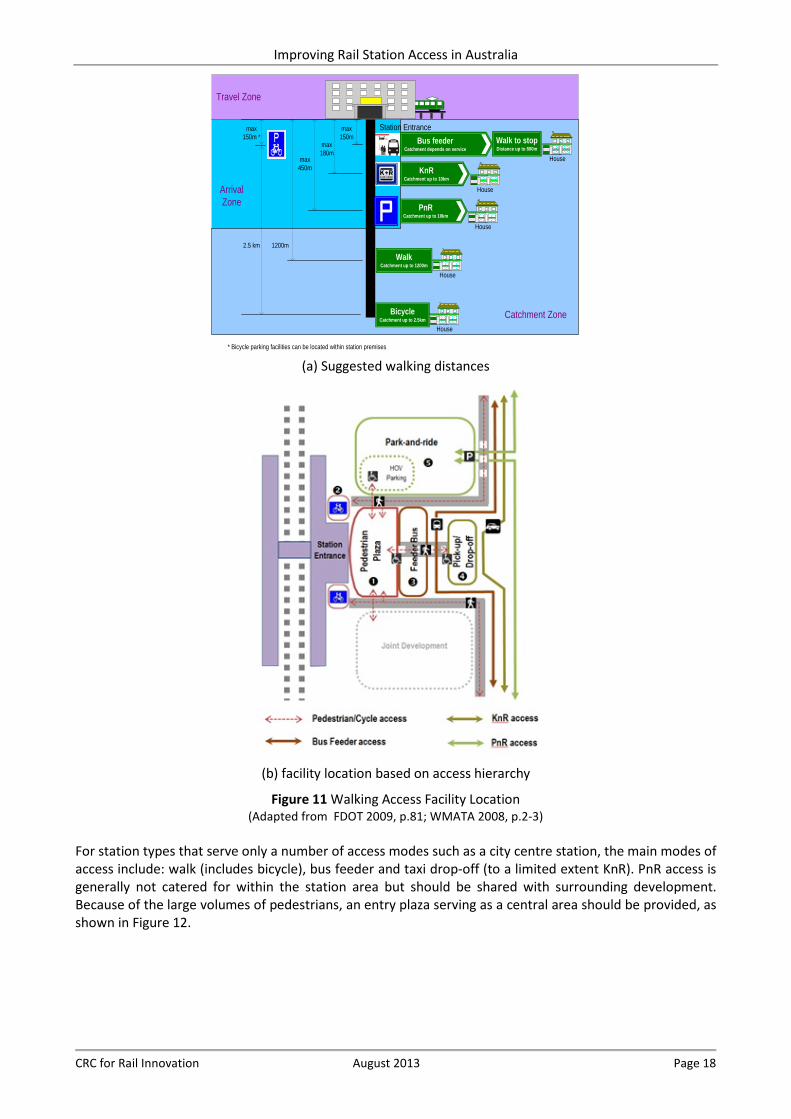
House
Walk to stopDistance up to 800m
1200m2.5 km
max 150m *
* Bicycle parking facilities can be located within station premises
Travel Zone
Arrival Zone
Catchment Zone
(a) Suggested walking distances
(b) facility location based on access hierarchy
Figure 11 Walking Access Facility Location (Adapted from FDOT 2009, p.81; WMATA 2008, p.2-3)
For station types that serve only a number of access modes such as a city centre station, the main modes of access include: walk (includes bicycle), bus feeder and taxi drop-off (to a limited extent KnR). PnR access is generally not catered for within the station area but should be shared with surrounding development. Because of the large volumes of pedestrians, an entry plaza serving as a central area should be provided, as shown in Figure 12.
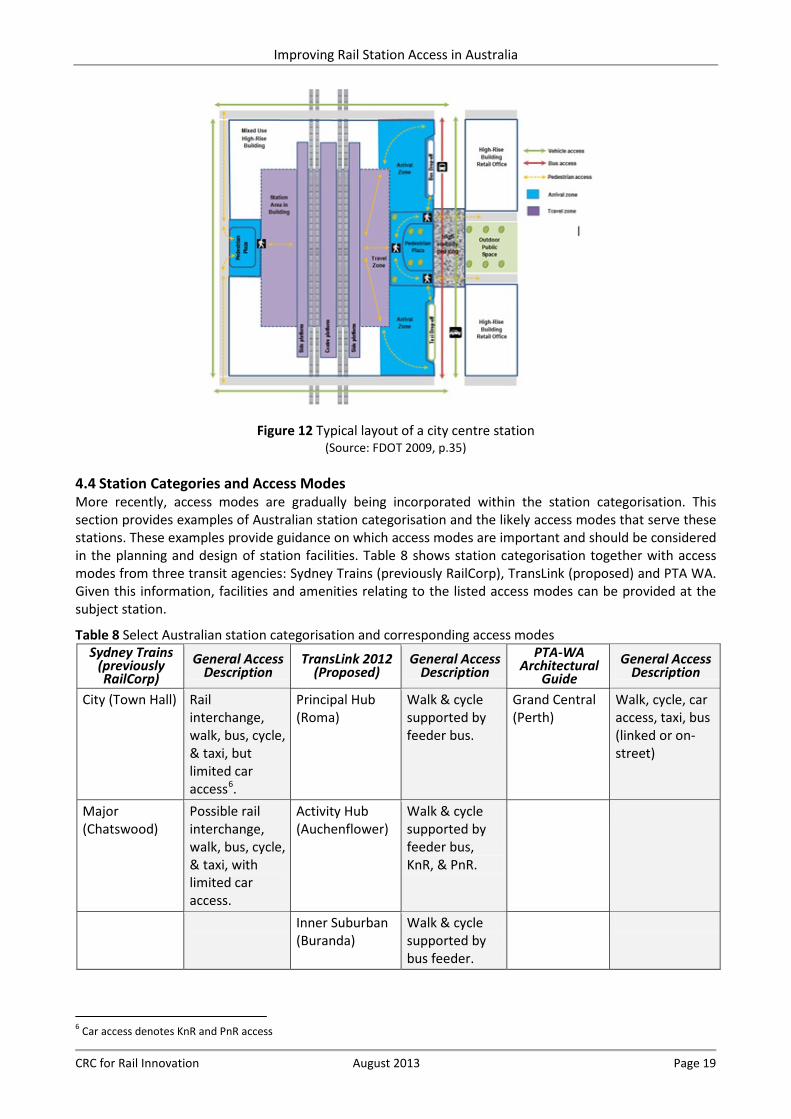
Improving Rail Station Access in Australia
CRC for Rail Innovation August 2013 Page 19
Figure 12 Typical layout of a city centre station
(Source: FDOT 2009, p.35)
4.4 Station Categories and Access Modes More recently, access modes are gradually being incorporated within the station categorisation. This section provides examples of Australian station categorisation and the likely access modes that serve these stations. These examples provide guidance on which access modes are important and should be considered in the planning and design of station facilities. Table 8 shows station categorisation together with access modes from three transit agencies: Sydney Trains (previously RailCorp), TransLink (proposed) and PTA WA. Given this information, facilities and amenities relating to the listed access modes can be provided at the subject station.
Table 8 Select Australian station categorisation and corresponding access modes Sydney Trains
(previously RailCorp)
General Access Description
TransLink 2012 (Proposed)
General Access Description
PTA-WA Architectural
Guide General Access
Description
City (Town Hall) Rail interchange, walk, bus, cycle, & taxi, but limited car access6.
Principal Hub (Roma)
Walk & cycle supported by feeder bus.
Grand Central (Perth)
Walk, cycle, car access, taxi, bus (linked or on-street)
Major (Chatswood)
Possible rail interchange, walk, bus, cycle, & taxi, with limited car access.
Activity Hub (Auchenflower)
Walk & cycle supported by feeder bus, KnR, & PnR.
Inner Suburban (Buranda)
Walk & cycle supported by bus feeder.
6 Car access denotes KnR and PnR access
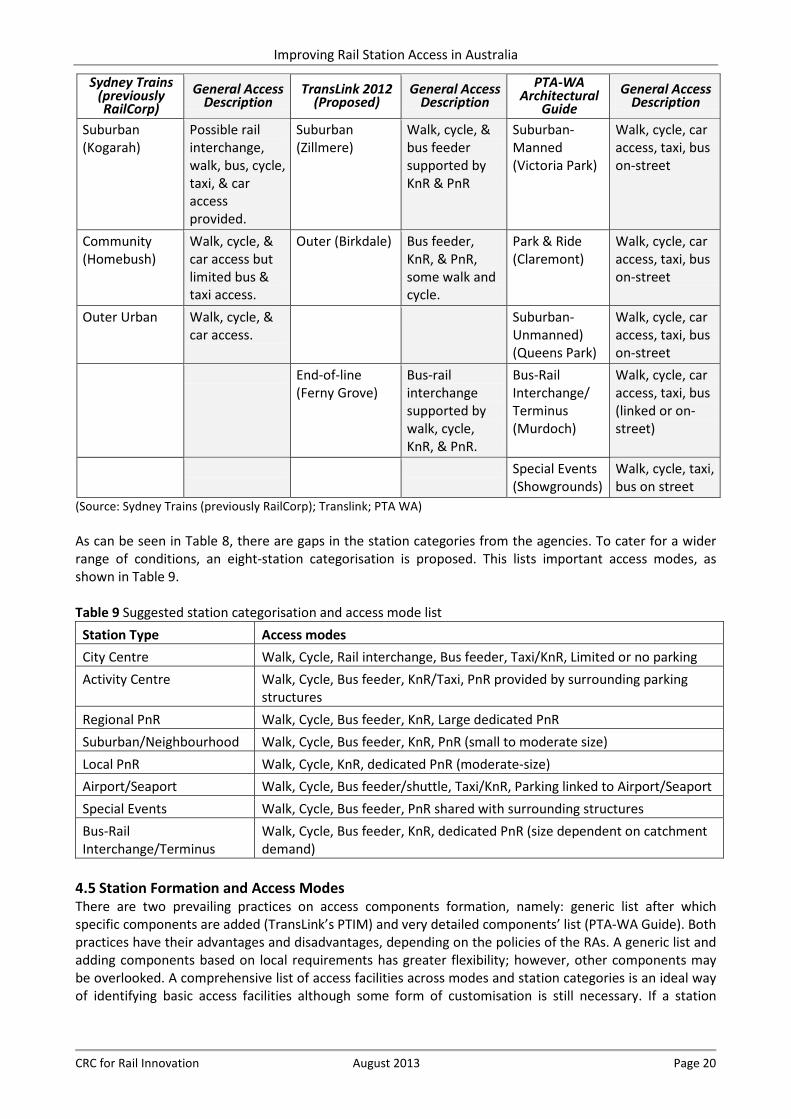
Improving Rail Station Access in Australia
CRC for Rail Innovation August 2013 Page 20
Sydney Trains (previously RailCorp)
General Access Description
TransLink 2012 (Proposed)
General Access Description
PTA-WA Architectural
Guide General Access
Description
Suburban (Kogarah)
Possible rail interchange, walk, bus, cycle, taxi, & car access provided.
Suburban (Zillmere)
Walk, cycle, & bus feeder supported by KnR & PnR
Suburban-Manned (Victoria Park)
Walk, cycle, car access, taxi, bus on-street
Community (Homebush)
Walk, cycle, & car access but limited bus & taxi access.
Outer (Birkdale) Bus feeder, KnR, & PnR, some walk and cycle.
Park & Ride (Claremont)
Walk, cycle, car access, taxi, bus on-street
Outer Urban Walk, cycle, & car access.
Suburban-Unmanned) (Queens Park)
Walk, cycle, car access, taxi, bus on-street
End-of-line (Ferny Grove)
Bus-rail interchange supported by walk, cycle, KnR, & PnR.
Bus-Rail Interchange/ Terminus (Murdoch)
Walk, cycle, car access, taxi, bus (linked or on-street)
Special Events (Showgrounds)
Walk, cycle, taxi, bus on street
(Source: Sydney Trains (previously RailCorp); Translink; PTA WA) As can be seen in Table 8, there are gaps in the station categories from the agencies. To cater for a wider range of conditions, an eight-station categorisation is proposed. This lists important access modes, as shown in Table 9. Table 9 Suggested station categorisation and access mode list
Station Type Access modes City Centre Walk, Cycle, Rail interchange, Bus feeder, Taxi/KnR, Limited or no parking Activity Centre Walk, Cycle, Bus feeder, KnR/Taxi, PnR provided by surrounding parking
structures Regional PnR Walk, Cycle, Bus feeder, KnR, Large dedicated PnR Suburban/Neighbourhood Walk, Cycle, Bus feeder, KnR, PnR (small to moderate size) Local PnR Walk, Cycle, KnR, dedicated PnR (moderate-size) Airport/Seaport Walk, Cycle, Bus feeder/shuttle, Taxi/KnR, Parking linked to Airport/Seaport Special Events Walk, Cycle, Bus feeder, PnR shared with surrounding structures Bus-Rail Interchange/Terminus
Walk, Cycle, Bus feeder, KnR, dedicated PnR (size dependent on catchment demand)
4.5 Station Formation and Access Modes There are two prevailing practices on access components formation, namely: generic list after which specific components are added (TransLink’s PTIM) and very detailed components’ list (PTA-WA Guide). Both practices have their advantages and disadvantages, depending on the policies of the RAs. A generic list and adding components based on local requirements has greater flexibility; however, other components may be overlooked. A comprehensive list of access facilities across modes and station categories is an ideal way of identifying basic access facilities although some form of customisation is still necessary. If a station
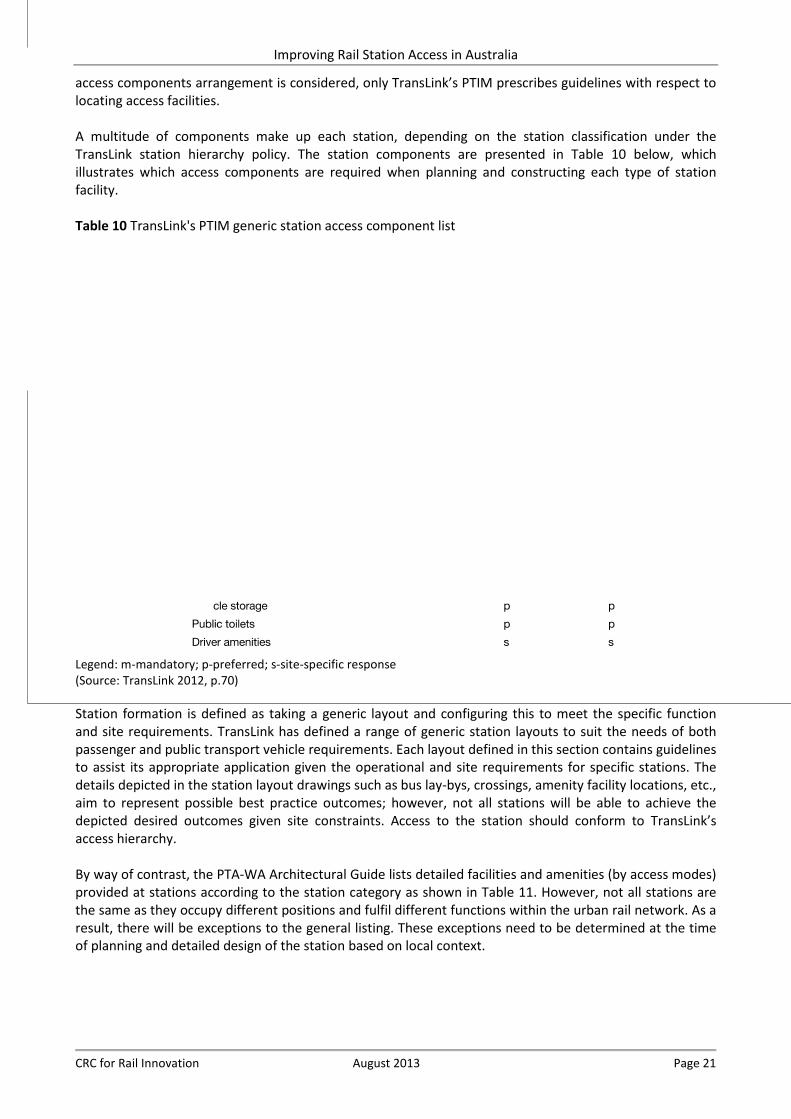
Improving Rail Station Access in Australia
CRC for Rail Innovation August 2013 Page 21
access components arrangement is considered, only TransLink’s PTIM prescribes guidelines with respect to locating access facilities. A multitude of components make up each station, depending on the station classification under the TransLink station hierarchy policy. The station components are presented in Table 10 below, which illustrates which access components are required when planning and constructing each type of station facility. Table 10 TransLink's PTIM generic station access component list
Legend: m-mandatory; p-preferred; s-site-specific response (Source: TransLink 2012, p.70) Station formation is defined as taking a generic layout and configuring this to meet the specific function and site requirements. TransLink has defined a range of generic station layouts to suit the needs of both passenger and public transport vehicle requirements. Each layout defined in this section contains guidelines to assist its appropriate application given the operational and site requirements for specific stations. The details depicted in the station layout drawings such as bus lay-bys, crossings, amenity facility locations, etc., aim to represent possible best practice outcomes; however, not all stations will be able to achieve the depicted desired outcomes given site constraints. Access to the station should conform to TransLink’s access hierarchy. By way of contrast, the PTA-WA Architectural Guide lists detailed facilities and amenities (by access modes) provided at stations according to the station category as shown in Table 11. However, not all stations are the same as they occupy different positions and fulfil different functions within the urban rail network. As a result, there will be exceptions to the general listing. These exceptions need to be determined at the time of planning and detailed design of the station based on local context.
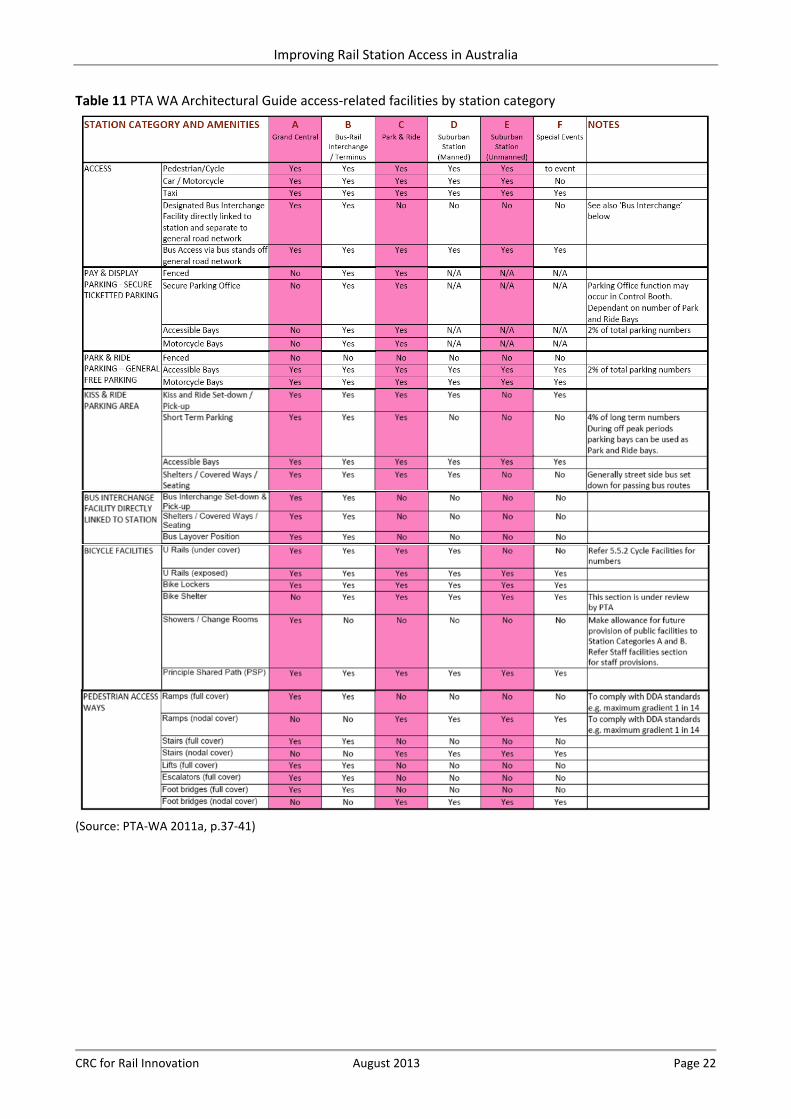
Improving Rail Station Access in Australia
CRC for Rail Innovation August 2013 Page 22
Table 11 PTA WA Architectural Guide access-related facilities by station category
(Source: PTA-WA 2011a, p.37-41)
Improving Rail Station Access in Australia
CRC for Rail Innovation August 2013 Page 23
5. Station Access Principles by Mode One of the most important considerations in locating a station is to be able to maximise potential patronage by integrating other means of transport and providing facilities so as to ease transfer or access. A clear understanding of what modes passengers employ to gain access to the station and what associated facilities are required is essential in the planning of new stations or the refurbishment of existing ones. Each mode has unique requirements and characteristics that need to be considered carefully in the planning process (Semler & Hale 2010). This section considers the requirements and principles for providing facilities for the following modes with respect to improving access to the station: walking; cycling; bus feeder; KnR; and PnR. Demand analysis guidance is discussed first to provide context on the principles to be presented. These principles are next presented divided into considerations within the arrival zone and catchment zone. After each principle, a list of key reference documents follows for further consultation and guidance.
5.1 Walking to the Station All forms of travel regardless of the main mode of transport employed have a walking component. Walking is regarded as the most basic travel mode and indeed the most sustainable way of accessing the station. Walking also produces some health benefits together with environmental, social and economic benefits.
Studies show that walking can be the primary access mode, especially if the station is within one kilometre of the departure point. However, short proximity does not guarantee patronage. In some locations, walking can be inconvenient, unpleasant or unsafe especially with circuitous routes, poor footpath conditions, heavy traffic, and dark or isolated corridors (Dantas 2005). Hendricks (2005) further found that walking share decreases rapidly even within 400 metres of the station if considerable physical, symbolic, or psychological barriers are present. According to Loutzenheiser (1997), distance to the station, physical quality of the environment, transportation facility conditions, time, cost, and characteristics of travellers affects the choice to walk to a transit station. With regard to a station’s proximity to the CBD, Xu et al. (2011) established that walking is an important access mode for inner-city locations while at more distant stations, car access becomes increasingly important. This highlights the importance of this mode of access and further highlights the value for designing walkways to cater for all types of pedestrians.
The following summarises important demand analysis guidance followed by principles that are essential for enhancing the walking access within the arrival zone and catchment zone:
Demand Analysis Guidance7: WD1: Factors affecting walking access demand. WD2: Catchment area definition based on actual walking distance. WD3: Methods for estimating walking access demand. WD4: Measuring walking access.
Arrival Zone Principles8: WA1: Pedestrian paths within the arrival zone should be direct and designed to minimise conflicts with
other modes. WA2: Pedestrian arrival zones should be inviting, safe and provide protection from the elements. WA3: Pedestrians should be able to easily orient themselves toward the station entrance. WA4: Pedestrian paths linking the station entrance to the surrounding catchment area should be wide,
free from obstructions and suitable for wheelchairs and prams.
Catchment Zone Principles9: WC1: Work with local jurisdictions and road authorities to promote traffic-calming techniques on local
streets especially around stations. WC2: Work with local jurisdictions and road authorities in making sure that footpaths are continuous,
clear, safe, and direct. WC3: Work with local jurisdictions and road authorities to provide safe and convenient pedestrian
crossings within the walking catchment area.
7 Referred to as Walking-Demand analysis (WD) 8 Referred to as Walking-Arrival (WA) zone 9 Referred to as Walking-Catchment (WC) zone
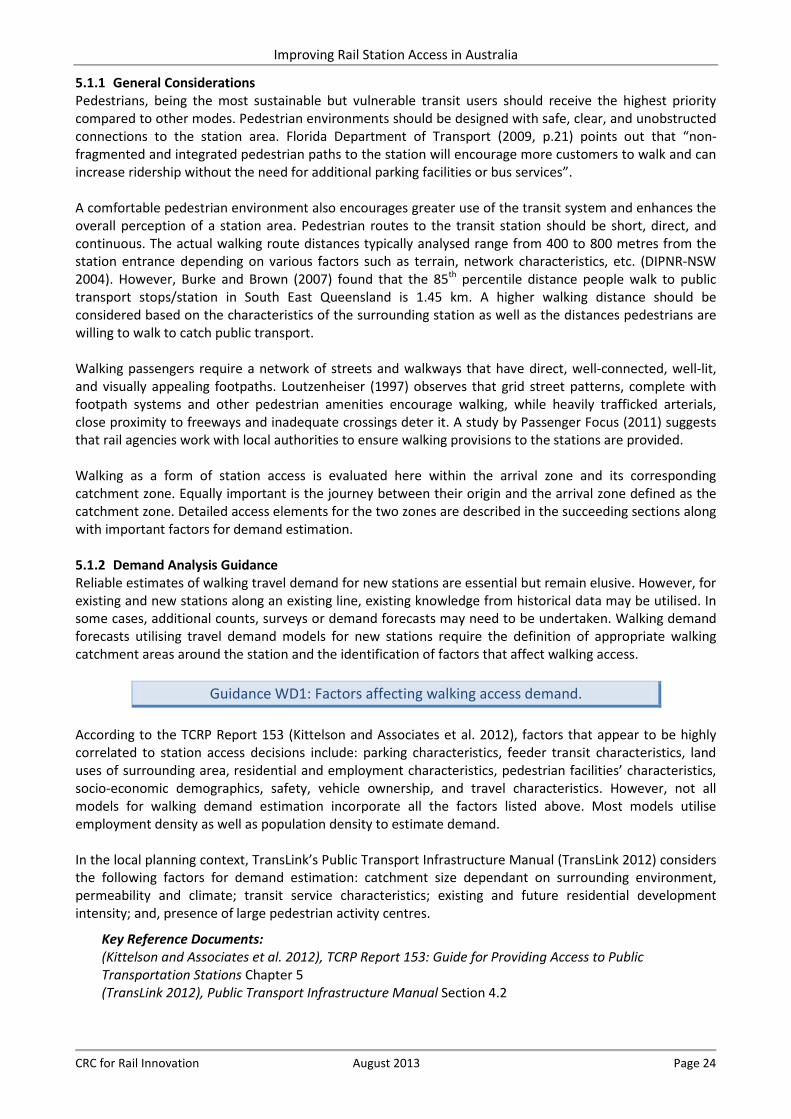
Improving Rail Station Access in Australia
CRC for Rail Innovation August 2013 Page 24
5.1.1 General Considerations Pedestrians, being the most sustainable but vulnerable transit users should receive the highest priority compared to other modes. Pedestrian environments should be designed with safe, clear, and unobstructed connections to the station area. Florida Department of Transport (2009, p.21) points out that “non-fragmented and integrated pedestrian paths to the station will encourage more customers to walk and can increase ridership without the need for additional parking facilities or bus services”. A comfortable pedestrian environment also encourages greater use of the transit system and enhances the overall perception of a station area. Pedestrian routes to the transit station should be short, direct, and continuous. The actual walking route distances typically analysed range from 400 to 800 metres from the station entrance depending on various factors such as terrain, network characteristics, etc. (DIPNR-NSW 2004). However, Burke and Brown (2007) found that the 85th percentile distance people walk to public transport stops/station in South East Queensland is 1.45 km. A higher walking distance should be considered based on the characteristics of the surrounding station as well as the distances pedestrians are willing to walk to catch public transport. Walking passengers require a network of streets and walkways that have direct, well-connected, well-lit, and visually appealing footpaths. Loutzenheiser (1997) observes that grid street patterns, complete with footpath systems and other pedestrian amenities encourage walking, while heavily trafficked arterials, close proximity to freeways and inadequate crossings deter it. A study by Passenger Focus (2011) suggests that rail agencies work with local authorities to ensure walking provisions to the stations are provided. Walking as a form of station access is evaluated here within the arrival zone and its corresponding catchment zone. Equally important is the journey between their origin and the arrival zone defined as the catchment zone. Detailed access elements for the two zones are described in the succeeding sections along with important factors for demand estimation. 5.1.2 Demand Analysis Guidance Reliable estimates of walking travel demand for new stations are essential but remain elusive. However, for existing and new stations along an existing line, existing knowledge from historical data may be utilised. In some cases, additional counts, surveys or demand forecasts may need to be undertaken. Walking demand forecasts utilising travel demand models for new stations require the definition of appropriate walking catchment areas around the station and the identification of factors that affect walking access.
Guidance WD1: Factors affecting walking access demand. According to the TCRP Report 153 (Kittelson and Associates et al. 2012), factors that appear to be highly correlated to station access decisions include: parking characteristics, feeder transit characteristics, land uses of surrounding area, residential and employment characteristics, pedestrian facilities’ characteristics, socio-economic demographics, safety, vehicle ownership, and travel characteristics. However, not all models for walking demand estimation incorporate all the factors listed above. Most models utilise employment density as well as population density to estimate demand. In the local planning context, TransLink’s Public Transport Infrastructure Manual (TransLink 2012) considers the following factors for demand estimation: catchment size dependant on surrounding environment, permeability and climate; transit service characteristics; existing and future residential development intensity; and, presence of large pedestrian activity centres.
Key Reference Documents: (Kittelson and Associates et al. 2012), TCRP Report 153: Guide for Providing Access to Public Transportation Stations Chapter 5 (TransLink 2012), Public Transport Infrastructure Manual Section 4.2
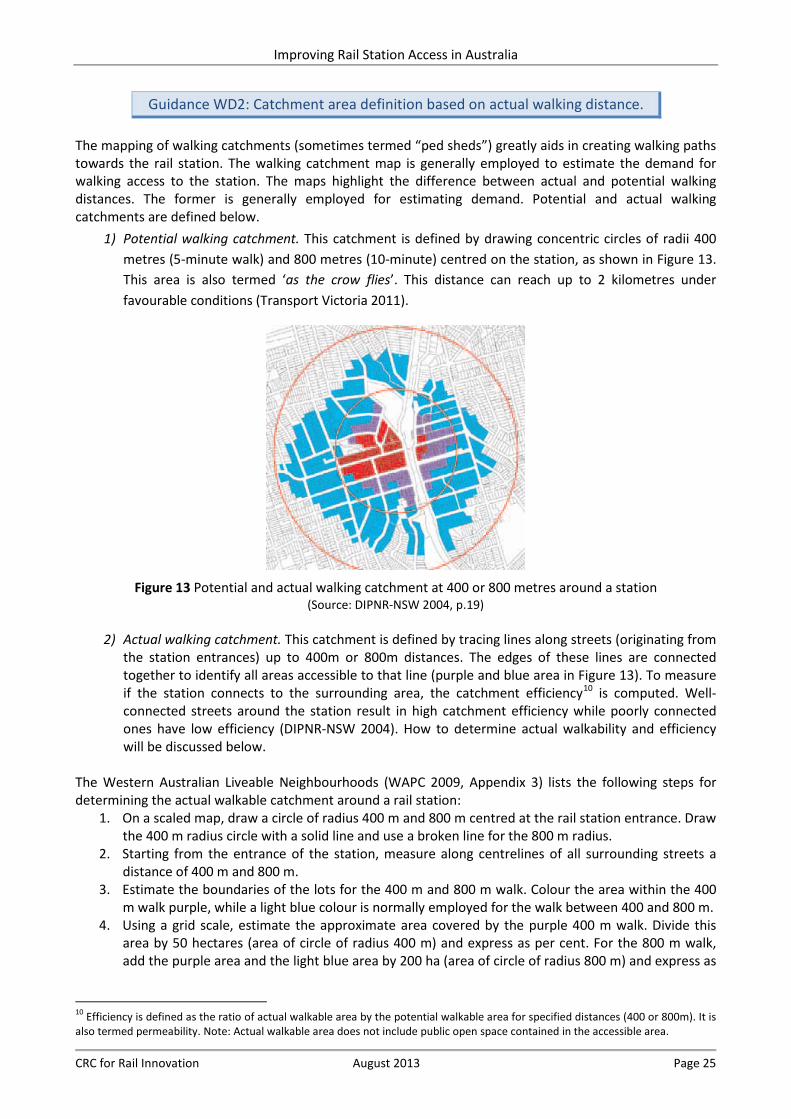
Improving Rail Station Access in Australia
CRC for Rail Innovation August 2013 Page 25
Guidance WD2: Catchment area definition based on actual walking distance.
The mapping of walking catchments (sometimes termed “ped sheds”) greatly aids in creating walking paths towards the rail station. The walking catchment map is generally employed to estimate the demand for walking access to the station. The maps highlight the difference between actual and potential walking distances. The former is generally employed for estimating demand. Potential and actual walking catchments are defined below.
1) Potential walking catchment. This catchment is defined by drawing concentric circles of radii 400 metres (5-minute walk) and 800 metres (10-minute) centred on the station, as shown in Figure 13. This area is also termed ‘as the crow flies’. This distance can reach up to 2 kilometres under favourable conditions (Transport Victoria 2011).
Figure 13 Potential and actual walking catchment at 400 or 800 metres around a station
(Source: DIPNR-NSW 2004, p.19)
2) Actual walking catchment. This catchment is defined by tracing lines along streets (originating from the station entrances) up to 400m or 800m distances. The edges of these lines are connected together to identify all areas accessible to that line (purple and blue area in Figure 13). To measure if the station connects to the surrounding area, the catchment efficiency10 is computed. Well-connected streets around the station result in high catchment efficiency while poorly connected ones have low efficiency (DIPNR-NSW 2004). How to determine actual walkability and efficiency will be discussed below.
The Western Australian Liveable Neighbourhoods (WAPC 2009, Appendix 3) lists the following steps for determining the actual walkable catchment around a rail station:
1. On a scaled map, draw a circle of radius 400 m and 800 m centred at the rail station entrance. Draw the 400 m radius circle with a solid line and use a broken line for the 800 m radius.
2. Starting from the entrance of the station, measure along centrelines of all surrounding streets a distance of 400 m and 800 m.
3. Estimate the boundaries of the lots for the 400 m and 800 m walk. Colour the area within the 400 m walk purple, while a light blue colour is normally employed for the walk between 400 and 800 m.
4. Using a grid scale, estimate the approximate area covered by the purple 400 m walk. Divide this area by 50 hectares (area of circle of radius 400 m) and express as per cent. For the 800 m walk, add the purple area and the light blue area by 200 ha (area of circle of radius 800 m) and express as
10 Efficiency is defined as the ratio of actual walkable area by the potential walkable area for specified distances (400 or 800m). It is also termed permeability. Note: Actual walkable area does not include public open space contained in the accessible area.
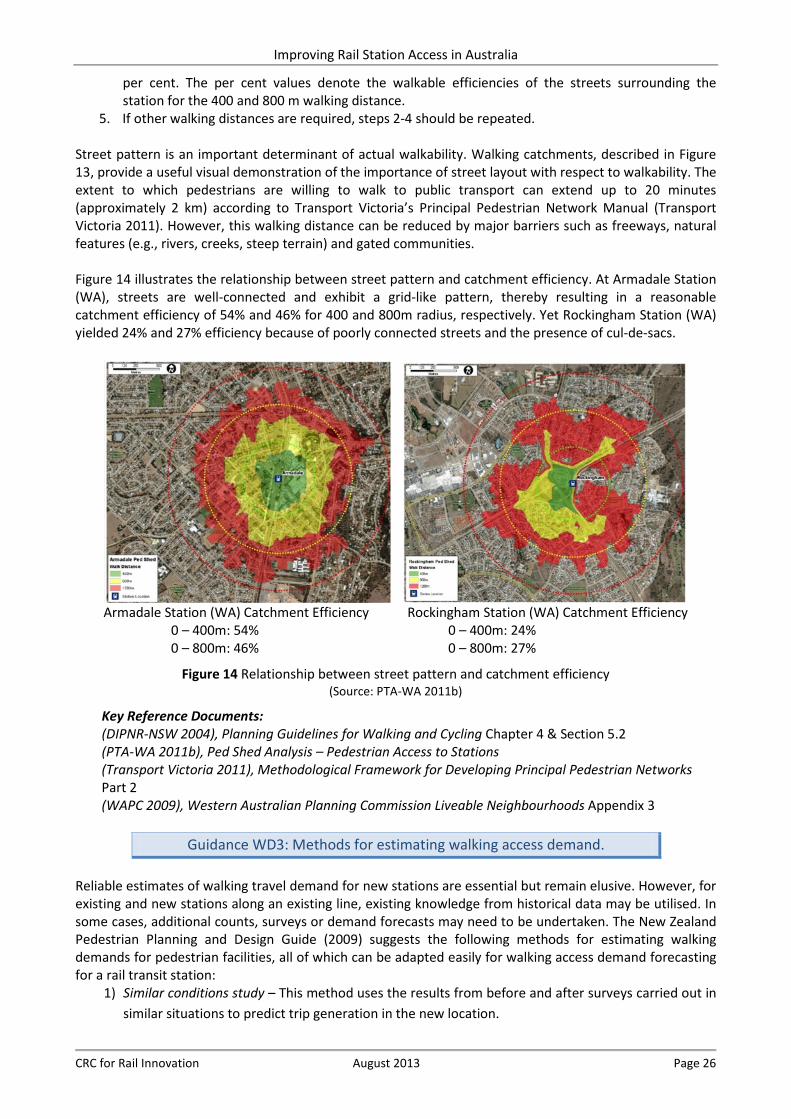
Improving Rail Station Access in Australia
CRC for Rail Innovation August 2013 Page 26
per cent. The per cent values denote the walkable efficiencies of the streets surrounding the station for the 400 and 800 m walking distance.
5. If other walking distances are required, steps 2-4 should be repeated. Street pattern is an important determinant of actual walkability. Walking catchments, described in Figure 13, provide a useful visual demonstration of the importance of street layout with respect to walkability. The extent to which pedestrians are willing to walk to public transport can extend up to 20 minutes (approximately 2 km) according to Transport Victoria’s Principal Pedestrian Network Manual (Transport Victoria 2011). However, this walking distance can be reduced by major barriers such as freeways, natural features (e.g., rivers, creeks, steep terrain) and gated communities.
Figure 14 illustrates the relationship between street pattern and catchment efficiency. At Armadale Station (WA), streets are well-connected and exhibit a grid-like pattern, thereby resulting in a reasonable catchment efficiency of 54% and 46% for 400 and 800m radius, respectively. Yet Rockingham Station (WA) yielded 24% and 27% efficiency because of poorly connected streets and the presence of cul-de-sacs.
Armadale Station (WA) Catchment Efficiency Rockingham Station (WA) Catchment Efficiency
0 – 400m: 54% 0 – 400m: 24% 0 – 800m: 46% 0 – 800m: 27%
Figure 14 Relationship between street pattern and catchment efficiency (Source: PTA-WA 2011b)
Key Reference Documents: (DIPNR-NSW 2004), Planning Guidelines for Walking and Cycling Chapter 4 & Section 5.2 (PTA-WA 2011b), Ped Shed Analysis – Pedestrian Access to Stations (Transport Victoria 2011), Methodological Framework for Developing Principal Pedestrian Networks Part 2 (WAPC 2009), Western Australian Planning Commission Liveable Neighbourhoods Appendix 3
Guidance WD3: Methods for estimating walking access demand.
Reliable estimates of walking travel demand for new stations are essential but remain elusive. However, for existing and new stations along an existing line, existing knowledge from historical data may be utilised. In some cases, additional counts, surveys or demand forecasts may need to be undertaken. The New Zealand Pedestrian Planning and Design Guide (2009) suggests the following methods for estimating walking demands for pedestrian facilities, all of which can be adapted easily for walking access demand forecasting for a rail transit station:
1) Similar conditions study – This method uses the results from before and after surveys carried out in similar situations to predict trip generation in the new location.
Improving Rail Station Access in Australia
CRC for Rail Innovation August 2013 Page 27
2) Aggregate behaviour – A model is developed by relating known population characteristics to observed walking trips. The model is then applied to other areas to predict walking trips.
3) Sketch plan – Regression models are developed using physical factors such as adjacent land uses and other trip generation indicators and are applied to the study area.
4) Discrete choice models – Predicting an individual’s likely probability of walking to the station based on socio-demographic characteristics and preference data (from stated- and/or revealed preference surveys) conducted within the study area.
5) Traditional four-step model – Utilising existing land use conditions and transport network characteristics to predict walking travel patterns.
A more recent method for estimating walking demand is the use of geographical information systems (GIS). Geographical boundaries (zones or parcels) as well as other characteristics (socio-demographic, land use, transport network, etc) can be plotted around the defined catchment area. Land-use-specific walking access rates can be multiplied to particular zones or parcelled to arrive at walking access demand. Transport Victoria’s Methodological Framework for Developing Principal Pedestrian Network (Transport Victoria 2011) provides one of the most detailed methodologies for estimating walking demands for a pedestrian activity area (e.g., transit station). The framework covers catchment definition and potential trip estimation up to future scenario estimation plotted on a GIS map. An example of potential trips estimated using their methodology is shown in Figure 15.
Figure 15 Potential trip numbers calculated in a GIS package
(Source: Transport Victoria 2011, p.42)
Key Reference Documents: (NZTA 2009), New Zealand Transport Agency Pedestrian Planning and Design Guide Chapter 10 (Transport Victoria 2011), Methodological Framework for Developing Principal Pedestrian Networks Part 2
Guidance WD4: Measuring walking access.
Walking passengers require a network of streets and walkways having direct, well-connected, safe, and visually appealing sidewalks. Being able to measure how walking facilities sufficiently accommodate demand (existing and future) is essential. These measures give an indication of the state of operation of the
Improving Rail Station Access in Australia
CRC for Rail Innovation August 2013 Page 28
pedestrian network and can be used for trade-off analysis. Station accessibility is measured based on pedestrian network characteristics around the station. Network connectivity index is recommended by TCRP Report 88 (Kittelson and Associates 2003a) to measure of how easily pedestrians can access a transit stop or station. This measure is computed by counting the number of links (i.e., street segments between intersections within the one kilometre radius) and divided by the number of nodes (i.e., intersections) in a roadway system. Values range from 1.7 for a well-connected grid pattern to 1.2 for a cul-de-sac network. This measure does not consider though the presence of sidewalk, sidewalk condition, sidewalk width, terrain, street widths, amount and type of separation between traffic lanes and pedestrian or bicycle facilities, traffic volumes, type of traffic control provided at intersections, and land development patterns. A multi-modal pedestrian level-of-service (LOS) meanwhile evaluates quality of the pedestrian environment based on density, segment, intersection, and crossing measures (Landis et al. 2001). Attributes include geometry, vehicle volumes, vehicle speeds, separation from traffic, and intersection delay. A measure introduced by Evans et al. (1997) called transit friendliness factor (TFF) aims to describe the characteristics of the area surrounding a transit stop/station. A rating system was developed representing transit accessibility for incorporation in travel forecasting models. Elements of transit friendliness include sidewalks, street crossings, transit amenities, and proximity to destinations. The overall TFF score is the sum of the individual scores from the elements. A pedestrian-friendly environment will have a high TFF score. Another important measure of the quality of walking access is walking distance to and from the stations. This can be measured in two ways: Isochrones and radial (air) distances. An ‘isochrone’ measures the actual walking route, based on available streets and paths, whereas a radial distance is as the crow flies (PTA-WA 2011b). Olszewski and Wibowo (2005) used equivalent walking distance to reflect the actual walking effort to the station. Equivalent walking distances were computed for crossing a road (signalised or unsignalised), ascending a stair step, and crossing a car park or access road.
Key Reference Documents: (Kittelson and Associates 2003a), TCRP Report 88: A Guidebook for Developing a Transit Performance-Measurement System (Landis et al. 2001), Modeling the roadside walking environment: Pedestrian level of service. Transportation Research Record 1773 (Evans, Perincherry & Douglas 1997), Transit friendliness factor: approach to quantifying transit access environment in a transportation planning model. Transportation Research Record 1604 (PTA-WA 2011b), Ped Shed Analysis - Pedestrian Access to Stations (Interactive report). (Olszewski & Wibowo 2005), Using equivalent walking distance to assess pedestrian accessibility to transit stations in Singapore. Transportation Research Record 1927
5.1.3 Arrival Zone Principles Walking as a form of station access is evaluated here within the arrival zone. This zone more often is within the jurisdiction of the rail transit agency. Where facilities are not in agency property, some form of collaboration may be needed.
Principle WA1: Pedestrian paths within the arrival zone should be direct and designed to minimise conflicts with other modes.
It is critical that all pedestrian circulation networks are compliant with all state and federal statutes on accessible design (e.g., DDA and DSAPT). Pedestrian paths should be direct and conflicts with other modes should be minimised. The following two objectives are essential to achieve that goal.
1) Provide direct path to station entrance • Walking distances can be minimised by providing multiple station entrances where possible. • Provide paths from different directions towards station entrance(s). • Crosswalks should be considered to provide more direct paths.
Improving Rail Station Access in Australia
CRC for Rail Innovation August 2013 Page 29
• Sufficient width of walking path for expected demand should be provided. 2) Minimising conflict
• Paths should not cross vehicular access roads and bus lanes unless unavoidable. • Clearly marked crosswalks provided if crossing is unavoidable and grade separation is
impractical. • When pedestrian and/or vehicle volumes are significant (delays for either are excessive),
signalisation or grade separation should be explored. • Bicyclist should be required to dismount when using shared paths. • Pedestrian-pedestrian conflicts can be minimised by providing sufficient circulation area,
especially where cross-flows occur. • Where appropriate, clearly mark paths dedicated for arriving and departing passengers. • Where stations are near schools, students should be guided on appropriate walking routes to
minimise conflicts with other traffic.
Key Reference Documents: (Austroads 2009d), Guide to Traffic Management Part 7: Traffic Management in Activity Centres Section 2.3 (NZTA 2009), New Zealand Transport Agency Pedestrian Planning and Design Guide Chapters 4 & 5 (DIPNR-NSW 2004), Planning Guidelines for Walking and Cycling Chapter 5 (Queensland Transport 2005), Easy Steps: A Toolkit for Planning, Designing and Promoting Safe Walking Sections C2 & C3 (WAPC 2009), Western Australian Planning Commission Liveable Neighbourhoods Element 1: Community Design
Principle WA2: Pedestrian arrival zone should be inviting, safe
and provide protection from the elements. The pedestrian arrival zone also needs to provide a sense of place and fit into the surrounding context. The zone consists of a network of street-level pathways where pedestrians congregate and pre-travel activities are conducted. A pedestrian arrival is the part of the arrival zone that collects passengers arriving from other modes (bicyclists, bus passengers, KnR passengers, and PnR users) before proceeding to the station entrance. The following are important considerations for this principle:
• Landscaping (as well as a public art area) and outdoor dining areas should be considered to create a more inviting environment. More visible pedestrians also provide passive security.
• Staff presence provides a sense of security for the passengers, otherwise closed circuit television (CCTV) surveillance should be provided to address security issues.
• Cover should be provided where pedestrians congregate towards the station. Waiting areas for bus and vehicle pick-up points also require canopies for weather protection.
Key Reference Documents: (DIPNR-NSW 2004), Planning Guidelines for Walking and Cycling Section 5.5 (Queensland Government 2007), Crime Prevention through Environmental Design (CPTED): Guidelines for Queensland Part A Chapter 6 (Queensland Transport 2005), Easy Steps: A Toolkit for Planning, Designing and Promoting Safe Walking Section C6
Principle WA3: Passengers should be able to easily orient themselves
toward the station entrance. Upon arriving at the pedestrian arrival zone, passengers should be able to orient themselves without difficulty towards the station entrance. This is particularly important for occasional or unfamiliar users. Logical paths, signage and maps greatly facilitate finding the target entrance.
Improving Rail Station Access in Australia
CRC for Rail Innovation August 2013 Page 30
• Facilities should be arranged in a logical manner. Information and paths should generally direct pedestrians to their desired locations (station entrance, waiting areas, etc.).
• With so many activities and various modes coming together within the pedestrian arrival zone, signs pointing to the station entrance are essential. This signage, however, should be clear and minimal so as not to cause more pedestrian confusion.
• Plans or station vicinity maps showing important locations are equally important for disembarking passengers.
• Real-time next train electronic displays should also be considered in key areas where walking passengers converge.
Key Reference Documents: (Austroads 1995), Guide to Traffic Engineering Practice: Pedestrians Chapter 4 (Austroads 2007b), Guide to Traffic Management Part 10: Traffic Control and Communication Devices Section 4 (NZTA 2009), New Zealand Transport Agency Pedestrian Planning and Design Guide Chapter 16 (Queensland Government 2012), Manual of Uniform Traffic Control Devices Part 10 (Department of Transport-WA 2011a), Planning and Designing for Pedestrians: Guidelines Chapter 10
Principle WA4: Pedestrian paths linking the station entrance to the
surrounding catchment area should be wide, free from obstructions and suitable for wheelchairs and prams.
With the funnelling effect of the approach towards the station entrance, wider footpaths are needed to accommodate the pedestrian demand. This is particularly important in city centre stations where volumes are significant.
• The minimum effective path width (excluding signs, street furniture and overhanging vegetation) should be based on demand and mix of users (including wheelchair users, motorised scooters, prams, school children, etc.) using the path. Appropriate local or federal legislation such as DDA, DSAPT, and Australian Standards (AS) should be consulted so as to satisfy social inclusion requirements.
• Paths should be kept clear of signs, street furniture, other access facilities and vegetation. Clear paths also denote the absence of conflicts with other modes and pedestrians.
• Where stations are located near schools, walking facilities should be able to accommodate the AM and PM flow demands of students utilising the station.
Key Reference Documents: (Attorney-General's Department 2002), Disability Standards for Accessible Public Transport as amended (May 2011) (Austroads 2009c), Guide to Road Design Part 6B: Roadside Design, Safety and Barriers Sections 6.2.1 and 6.2.2 (Austroads 2008a), Guide to Traffic Management Part 5: Road Management Table 5.2 (Austroads 1995), Guide to Traffic Engineering Practice Part 13: Pedestrians Chapter 2 (Standards Association of Australia 1988), AS 1428 Design for access and mobility (as amended) (Department of Transport-WA 2011a), Planning and Designing for Pedestrians: Guidelines 2011 Chapter 7
5.1.4 Catchment Zone Principles Equally important is the journey between the pedestrian’s origin and the arrival zone, which is designated as the catchment zone. This zone, however, may not be within the rail transit agencies’ jurisdiction. Collaboration with other relevant stakeholders is essential with respect to implementing access-related improvements within this zone.
Principle WC1: Work with local jurisdiction and road authorities to promote
Improving Rail Station Access in Australia
CRC for Rail Innovation August 2013 Page 31
traffic calming techniques on local streets especially around stations. Streets that are safe and pleasant for pedestrians are typically characterised by calm traffic and a limited amount of space dedicated for automobiles. Techniques for calming traffic that can be considered include:
• On-street parking helps slow-down vehicular traffic by creating greater friction between moving traffic and parked cars. The parked cars provide a buffer between moving traffic and the sidewalk, thereby offering protection to pedestrian traffic. This scheme also narrows the carriageway significantly.
• Narrow lanes discourage drivers from driving fast. Minimising lane widths helps slow traffic and at the same time shortens crossing distances for pedestrians.
• To slow down vehicle turning traffic at intersections, the turning radius of the kerb can be reduced. As an added result, an additional kerb waiting area is created, as are shortened crossing distances.
• Raised crosswalk can function as speed bumps or speed tables, thereby slowing traffic while providing the additional benefit of placing pedestrian crossings at the same elevation as the footpath.
Key Reference Documents: (Austroads 2009d), Guide to Traffic Management Part 7: Traffic Management in Activity Centres Section 3.6 (Austroads 2008b), Guide to Traffic Management Part 8: Local Area Traffic Management (NZTA 2009), New Zealand Transport Agency Pedestrian Planning and Design Guide Section 6.3
Principle WC2: Work with local jurisdiction and road authorities in making sure
that footpaths are continuous, clear, safe, and direct. The station design should focus on prioritising pedestrian connections into the station site by ensuring that footpaths from neighbouring areas are continuous and offer direct access into the station area. Footpaths should also offer a clear network of connectivity to and from station arrival zone and origin/destination areas such as neighbourhoods, employment centres, open spaces/parks, civic buildings, etc.
1) Paths should be highly visible. • Changes in directions and dead-end paths reduce the visibility and line-of-sight. • Paths should be well-lit or located in areas where ample illumination is provided so as to
enhance safety. • Footpath greens should be maintained regularly to create a pleasant as well as clear path. • Avoid locating paths behind structures or in low visibility areas as passive security will be
reduced. • Where possible, provide connections to surrounding streets without having to cross parking
areas or high-volume traffic facilities. • Tactile ground surface indicators (TGSI) should be provided for persons with disabilities where
dangerous situations are located. 2) Clear from obstructions.
• Furniture and other fixtures should be located outside the accessible path. • Grates should be avoided along accessible paths as this may represent a significant barrier for
persons with disabilities. • Sufficient head room should also be provided within the pedestrian envelope. • Footpaths should be of sufficient width to accommodate expected volume and accessibility
requirements. 3) Avoid grade-level changes.
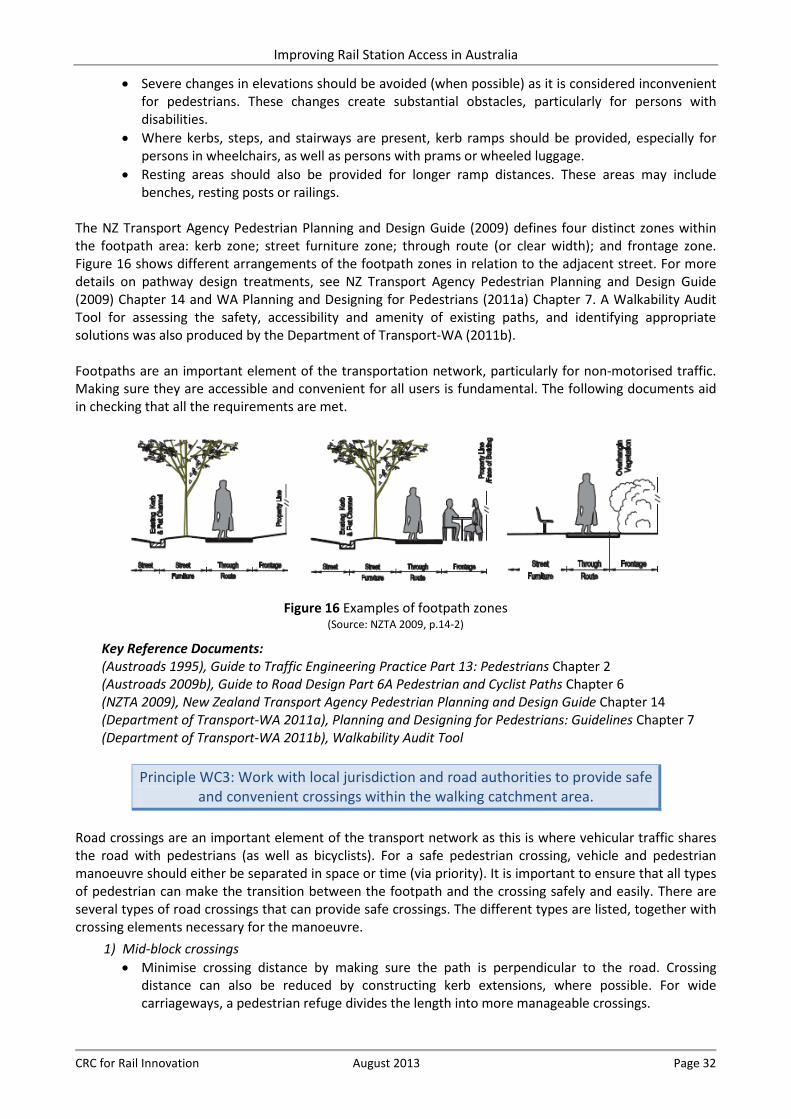
Improving Rail Station Access in Australia
CRC for Rail Innovation August 2013 Page 32
• Severe changes in elevations should be avoided (when possible) as it is considered inconvenient for pedestrians. These changes create substantial obstacles, particularly for persons with disabilities.
• Where kerbs, steps, and stairways are present, kerb ramps should be provided, especially for persons in wheelchairs, as well as persons with prams or wheeled luggage.
• Resting areas should also be provided for longer ramp distances. These areas may include benches, resting posts or railings.
The NZ Transport Agency Pedestrian Planning and Design Guide (2009) defines four distinct zones within the footpath area: kerb zone; street furniture zone; through route (or clear width); and frontage zone. Figure 16 shows different arrangements of the footpath zones in relation to the adjacent street. For more details on pathway design treatments, see NZ Transport Agency Pedestrian Planning and Design Guide (2009) Chapter 14 and WA Planning and Designing for Pedestrians (2011a) Chapter 7. A Walkability Audit Tool for assessing the safety, accessibility and amenity of existing paths, and identifying appropriate solutions was also produced by the Department of Transport-WA (2011b). Footpaths are an important element of the transportation network, particularly for non-motorised traffic. Making sure they are accessible and convenient for all users is fundamental. The following documents aid in checking that all the requirements are met.
Figure 16 Examples of footpath zones
(Source: NZTA 2009, p.14-2)
Key Reference Documents: (Austroads 1995), Guide to Traffic Engineering Practice Part 13: Pedestrians Chapter 2 (Austroads 2009b), Guide to Road Design Part 6A Pedestrian and Cyclist Paths Chapter 6 (NZTA 2009), New Zealand Transport Agency Pedestrian Planning and Design Guide Chapter 14 (Department of Transport-WA 2011a), Planning and Designing for Pedestrians: Guidelines Chapter 7 (Department of Transport-WA 2011b), Walkability Audit Tool
Principle WC3: Work with local jurisdiction and road authorities to provide safe
and convenient crossings within the walking catchment area. Road crossings are an important element of the transport network as this is where vehicular traffic shares the road with pedestrians (as well as bicyclists). For a safe pedestrian crossing, vehicle and pedestrian manoeuvre should either be separated in space or time (via priority). It is important to ensure that all types of pedestrian can make the transition between the footpath and the crossing safely and easily. There are several types of road crossings that can provide safe crossings. The different types are listed, together with crossing elements necessary for the manoeuvre.
1) Mid-block crossings • Minimise crossing distance by making sure the path is perpendicular to the road. Crossing
distance can also be reduced by constructing kerb extensions, where possible. For wide carriageways, a pedestrian refuge divides the length into more manageable crossings.
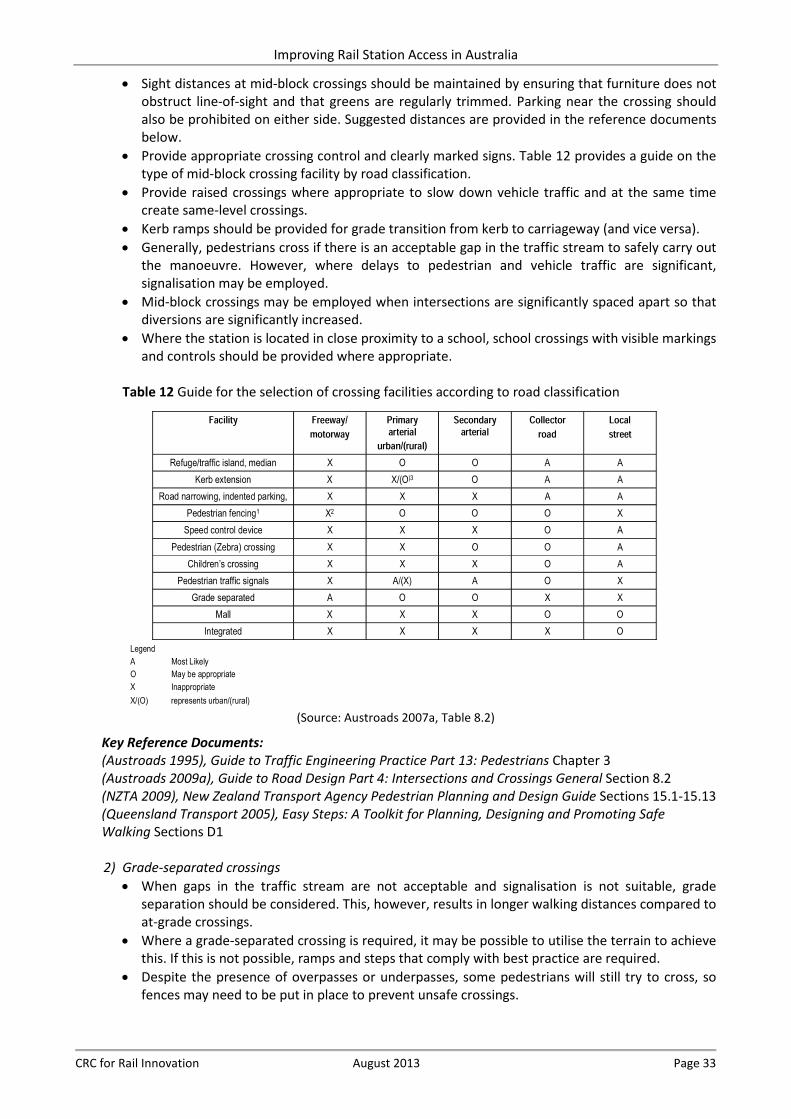
Improving Rail Station Access in Australia
CRC for Rail Innovation August 2013 Page 33
• Sight distances at mid-block crossings should be maintained by ensuring that furniture does not obstruct line-of-sight and that greens are regularly trimmed. Parking near the crossing should also be prohibited on either side. Suggested distances are provided in the reference documents below.
• Provide appropriate crossing control and clearly marked signs. Table 12 provides a guide on the type of mid-block crossing facility by road classification.
• Provide raised crossings where appropriate to slow down vehicle traffic and at the same time create same-level crossings.
• Kerb ramps should be provided for grade transition from kerb to carriageway (and vice versa). • Generally, pedestrians cross if there is an acceptable gap in the traffic stream to safely carry out
the manoeuvre. However, where delays to pedestrian and vehicle traffic are significant, signalisation may be employed.
• Mid-block crossings may be employed when intersections are significantly spaced apart so that diversions are significantly increased.
• Where the station is located in close proximity to a school, school crossings with visible markings and controls should be provided where appropriate.
Table 12 Guide for the selection of crossing facilities according to road classification
(Source: Austroads 2007a, Table 8.2)
Key Reference Documents: (Austroads 1995), Guide to Traffic Engineering Practice Part 13: Pedestrians Chapter 3 (Austroads 2009a), Guide to Road Design Part 4: Intersections and Crossings General Section 8.2 (NZTA 2009), New Zealand Transport Agency Pedestrian Planning and Design Guide Sections 15.1-15.13 (Queensland Transport 2005), Easy Steps: A Toolkit for Planning, Designing and Promoting Safe Walking Sections D1
2) Grade-separated crossings
• When gaps in the traffic stream are not acceptable and signalisation is not suitable, grade separation should be considered. This, however, results in longer walking distances compared to at-grade crossings.
• Where a grade-separated crossing is required, it may be possible to utilise the terrain to achieve this. If this is not possible, ramps and steps that comply with best practice are required.
• Despite the presence of overpasses or underpasses, some pedestrians will still try to cross, so fences may need to be put in place to prevent unsafe crossings.
Improving Rail Station Access in Australia
CRC for Rail Innovation August 2013 Page 34
• Overpasses are preferred over underpasses because of personal security concerns regarding the latter.
Key Reference Documents: (Austroads 2007a), Guide to Traffic Management Part 6 Intersections, Interchanges and Crossings Chapter 8 (NZTA 2009), New Zealand Transport Agency Pedestrian Planning and Design Guide Section 15.14 (Department of Transport-WA 2011a), Planning and Designing for Pedestrians: Guidelines Section 9.7 3) Non-signalised intersections
• Provide sufficient sight distance so that pedestrians can assess the risk before crossing the intersection.
• Vehicles turning into the street should give way to crossing pedestrians. Reducing kerb radii will help to reduce vehicle turning speed so that crossing pedestrians can make appropriate evasive manoeuvres.
• Pedestrian refuges divide wide roads into more manageable crossing distances, even when traffic is significant.
• Kerb ramps provide a smooth transition from footpath to road as well as direct pedestrians towards the crossing path. For people with vision impairment, tactile cues (TGSI) should be provided to direct them towards the correct crossing paths.
• Slip lanes separated by islands may be appropriate if large kerb radii are required; however, this creates additional crossing lanes that pedestrians need to negotiate.
• Pedestrian crossings should be located further away from an intersection to improve visibility, shorten the crossing distance, and allow for easier ramp construction. However, pedestrians will not tolerate deviations that are too long so a balance should be reached.
Key Reference Documents: (NZTA 2009), New Zealand Transport Agency Pedestrian Planning and Design Guide Section 15.15 (Department of Transport-WA 2011a), Planning and Designing for Pedestrians: Guidelines Section 9.7
4) Signalised intersections
• Traffic signals provide separation in time for crossing pedestrians and vehicle traffic. This separation protects pedestrians although it can result in significant delays for both motorists and pedestrians.
• Pedestrians have priority crossing a signalised intersection over vehicles turning into the street where they are crossing.
• The time allotted for pedestrians crossing should be sufficient based on the slowest pedestrian clearing the roadway. Staged crossing can be employed for wide intersections.
• Traffic signals at intersections adjoining a footpath or shared path should incorporate symbolic pedestrian signals and audible tactile facilities.
• Similar to non-signalised intersections, if large kerb radii are required for left-turning vehicles, slip lanes with zebra crossing markings for pedestrians are suggested.
• In busier pedestrian areas, pedestrian scramble phase can be utilised where all pedestrians in the intersection can cross in all directions (parallel or diagonal).
Key Reference Documents: (NZTA 2009), New Zealand Transport Agency Pedestrian Planning and Design Guide Section 15.16 (Department of Transport-WA 2011a), Planning and Designing for Pedestrians: Guidelines Section 9.5
5) Roundabouts
• Good roundabout design reduces vehicle speeds, thereby resulting in decreased pedestrian crash fatalities. However, priority is surrendered to vehicles (vehicles are not required to give way to pedestrians) unless zebra crossings are provided.
• Large multi-lane roundabouts create crossing barriers for pedestrians because of smaller gaps in traffic, wider carriageway and higher vehicle speeds. If pedestrian and/or cyclist volumes are also significantly high, signalisation is preferred.
Improving Rail Station Access in Australia
CRC for Rail Innovation August 2013 Page 35
• Provide good sight distances between pedestrians and motorists so that more reaction time for appropriate manoeuvres is allotted.
• Pedestrian ramps and splitter islands in the median should be set back on the entry and exit of the roundabout. Zebra crossings should be considered if pedestrian volumes are high, vehicle speeds are low, and there is a high proportion of vulnerable pedestrians (children, elderly, or people with a disability).
Key Reference Documents: (NZTA 2009), New Zealand Transport Agency Pedestrian Planning and Design Guide Sections 15.17 (Department of Transport-WA 2011a), Planning and Designing for Pedestrians: Guidelines Sections 9.6
6) Railway crossings
• Treatment is dependent on location (near level crossings, at stations or neither of the two) and pedestrian crossing volumes.
• Footpaths should be on the same level as the top of the rails to prevent pedestrians from tripping over.
• Warning signs should be provided to warn pedestrians and inform pedestrians on how to cross safely.
• Physical guidance leading towards the crossing point may also be employed. • Lockable gates can also be used (where allowed) to prevent pedestrians from crossing the tracks
before and during train crossing, if necessary.
Key Reference Documents: (NZTA 2009), New Zealand Transport Agency Pedestrian Planning and Design Guide Sections 15.19 (Department of Transport-WA 2011a), Planning and Designing for Pedestrians: Guidelines Sections 9.8
5.2 Cycling to the Station Cycling is another healthy and sustainable access mode to the station. Many stations are within convenient cycling distance of surrounding neighbourhoods and destinations. Cycling plays an important role in station access, especially for access trips of intermediate distance, meaning distances that are inconvenient for walking but too near for public transport (Martens 2007). Walking becomes impractical for distances beyond one kilometre under unfavourable conditions and cycling can be an alternative mode choice that extends the station catchment area beyond five kilometres (Transport NSW 2011). Cycling not only helps reduce road congestion and vehicle emissions but also has the potential to free up car park capacity at stations (Passenger Focus 2011). In addition, relatively smaller levels of investment in infrastructure are required in encouraging more passengers to cycle to the station rather than drive. Green and Hall (2009) suggest that adequate provisions (e.g. parking spaces) for bicycles need to be provided both at stations and on the approaches to convince people to cycle to the station. In addition, rail agencies need to work with local jurisdictions to enhance bicycle access to the station. Arrangements include slower vehicle speeds and low traffic volumes, appropriate lane widths along local streets to allow cyclists to share travel lanes with cars, marked cycle lanes on busy streets, and shared paths and routes parallel to arterials with less traffic (WAPC 2009). The following summarises key demand analysis guidance followed by principles that are essential for enhancing the cycling access mode towards the station divided according to arrival zone and catchment zone:
Demand Analysis Guidance11: CD1: Factors that impact cycle access based on local context. CD2: Cycling catchment definition based on relevant factors identified. CD3: Methods for cycling demand estimation. CD4: Measuring bicycle access.
11 Referred to as Cycling-Demand analysis (CD)
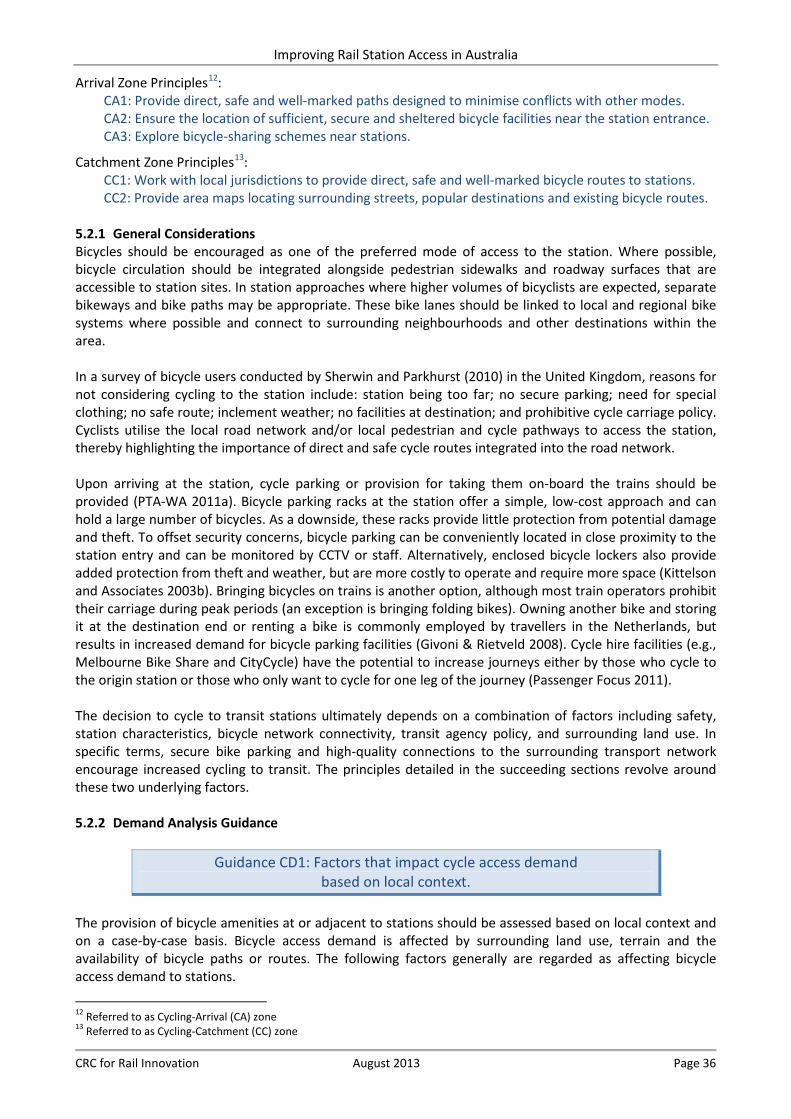
Improving Rail Station Access in Australia
CRC for Rail Innovation August 2013 Page 36
Arrival Zone Principles12: CA1: Provide direct, safe and well-marked paths designed to minimise conflicts with other modes. CA2: Ensure the location of sufficient, secure and sheltered bicycle facilities near the station entrance. CA3: Explore bicycle-sharing schemes near stations.
Catchment Zone Principles13: CC1: Work with local jurisdictions to provide direct, safe and well-marked bicycle routes to stations. CC2: Provide area maps locating surrounding streets, popular destinations and existing bicycle routes.
5.2.1 General Considerations Bicycles should be encouraged as one of the preferred mode of access to the station. Where possible, bicycle circulation should be integrated alongside pedestrian sidewalks and roadway surfaces that are accessible to station sites. In station approaches where higher volumes of bicyclists are expected, separate bikeways and bike paths may be appropriate. These bike lanes should be linked to local and regional bike systems where possible and connect to surrounding neighbourhoods and other destinations within the area. In a survey of bicycle users conducted by Sherwin and Parkhurst (2010) in the United Kingdom, reasons for not considering cycling to the station include: station being too far; no secure parking; need for special clothing; no safe route; inclement weather; no facilities at destination; and prohibitive cycle carriage policy. Cyclists utilise the local road network and/or local pedestrian and cycle pathways to access the station, thereby highlighting the importance of direct and safe cycle routes integrated into the road network. Upon arriving at the station, cycle parking or provision for taking them on-board the trains should be provided (PTA-WA 2011a). Bicycle parking racks at the station offer a simple, low-cost approach and can hold a large number of bicycles. As a downside, these racks provide little protection from potential damage and theft. To offset security concerns, bicycle parking can be conveniently located in close proximity to the station entry and can be monitored by CCTV or staff. Alternatively, enclosed bicycle lockers also provide added protection from theft and weather, but are more costly to operate and require more space (Kittelson and Associates 2003b). Bringing bicycles on trains is another option, although most train operators prohibit their carriage during peak periods (an exception is bringing folding bikes). Owning another bike and storing it at the destination end or renting a bike is commonly employed by travellers in the Netherlands, but results in increased demand for bicycle parking facilities (Givoni & Rietveld 2008). Cycle hire facilities (e.g., Melbourne Bike Share and CityCycle) have the potential to increase journeys either by those who cycle to the origin station or those who only want to cycle for one leg of the journey (Passenger Focus 2011). The decision to cycle to transit stations ultimately depends on a combination of factors including safety, station characteristics, bicycle network connectivity, transit agency policy, and surrounding land use. In specific terms, secure bike parking and high-quality connections to the surrounding transport network encourage increased cycling to transit. The principles detailed in the succeeding sections revolve around these two underlying factors. 5.2.2 Demand Analysis Guidance
Guidance CD1: Factors that impact cycle access demand based on local context.
The provision of bicycle amenities at or adjacent to stations should be assessed based on local context and on a case-by-case basis. Bicycle access demand is affected by surrounding land use, terrain and the availability of bicycle paths or routes. The following factors generally are regarded as affecting bicycle access demand to stations.
12 Referred to as Cycling-Arrival (CA) zone 13 Referred to as Cycling-Catchment (CC) zone
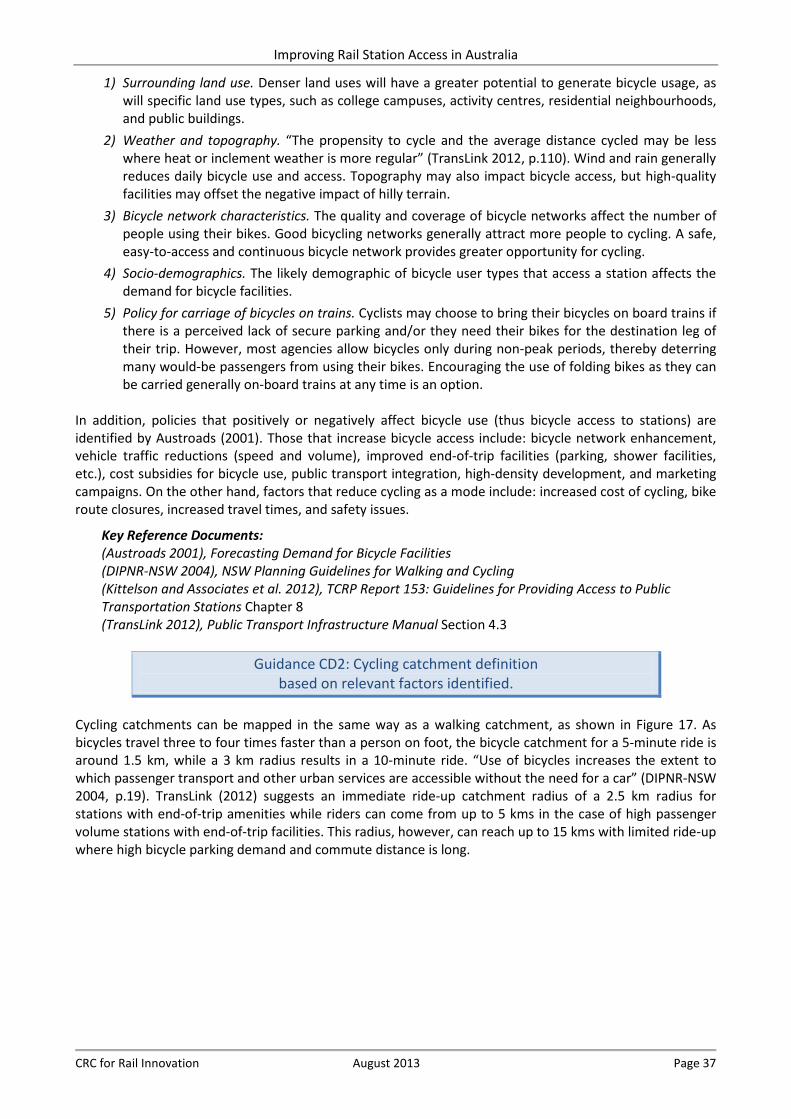
Improving Rail Station Access in Australia
CRC for Rail Innovation August 2013 Page 37
1) Surrounding land use. Denser land uses will have a greater potential to generate bicycle usage, as will specific land use types, such as college campuses, activity centres, residential neighbourhoods, and public buildings.
2) Weather and topography. “The propensity to cycle and the average distance cycled may be less where heat or inclement weather is more regular” (TransLink 2012, p.110). Wind and rain generally reduces daily bicycle use and access. Topography may also impact bicycle access, but high-quality facilities may offset the negative impact of hilly terrain.
3) Bicycle network characteristics. The quality and coverage of bicycle networks affect the number of people using their bikes. Good bicycling networks generally attract more people to cycling. A safe, easy-to-access and continuous bicycle network provides greater opportunity for cycling.
4) Socio-demographics. The likely demographic of bicycle user types that access a station affects the demand for bicycle facilities.
5) Policy for carriage of bicycles on trains. Cyclists may choose to bring their bicycles on board trains if there is a perceived lack of secure parking and/or they need their bikes for the destination leg of their trip. However, most agencies allow bicycles only during non-peak periods, thereby deterring many would-be passengers from using their bikes. Encouraging the use of folding bikes as they can be carried generally on-board trains at any time is an option.
In addition, policies that positively or negatively affect bicycle use (thus bicycle access to stations) are identified by Austroads (2001). Those that increase bicycle access include: bicycle network enhancement, vehicle traffic reductions (speed and volume), improved end-of-trip facilities (parking, shower facilities, etc.), cost subsidies for bicycle use, public transport integration, high-density development, and marketing campaigns. On the other hand, factors that reduce cycling as a mode include: increased cost of cycling, bike route closures, increased travel times, and safety issues.
Key Reference Documents: (Austroads 2001), Forecasting Demand for Bicycle Facilities (DIPNR-NSW 2004), NSW Planning Guidelines for Walking and Cycling (Kittelson and Associates et al. 2012), TCRP Report 153: Guidelines for Providing Access to Public Transportation Stations Chapter 8 (TransLink 2012), Public Transport Infrastructure Manual Section 4.3
Guidance CD2: Cycling catchment definition
based on relevant factors identified. Cycling catchments can be mapped in the same way as a walking catchment, as shown in Figure 17. As bicycles travel three to four times faster than a person on foot, the bicycle catchment for a 5-minute ride is around 1.5 km, while a 3 km radius results in a 10-minute ride. “Use of bicycles increases the extent to which passenger transport and other urban services are accessible without the need for a car” (DIPNR-NSW 2004, p.19). TransLink (2012) suggests an immediate ride-up catchment radius of a 2.5 km radius for stations with end-of-trip amenities while riders can come from up to 5 kms in the case of high passenger volume stations with end-of-trip facilities. This radius, however, can reach up to 15 kms with limited ride-up where high bicycle parking demand and commute distance is long.
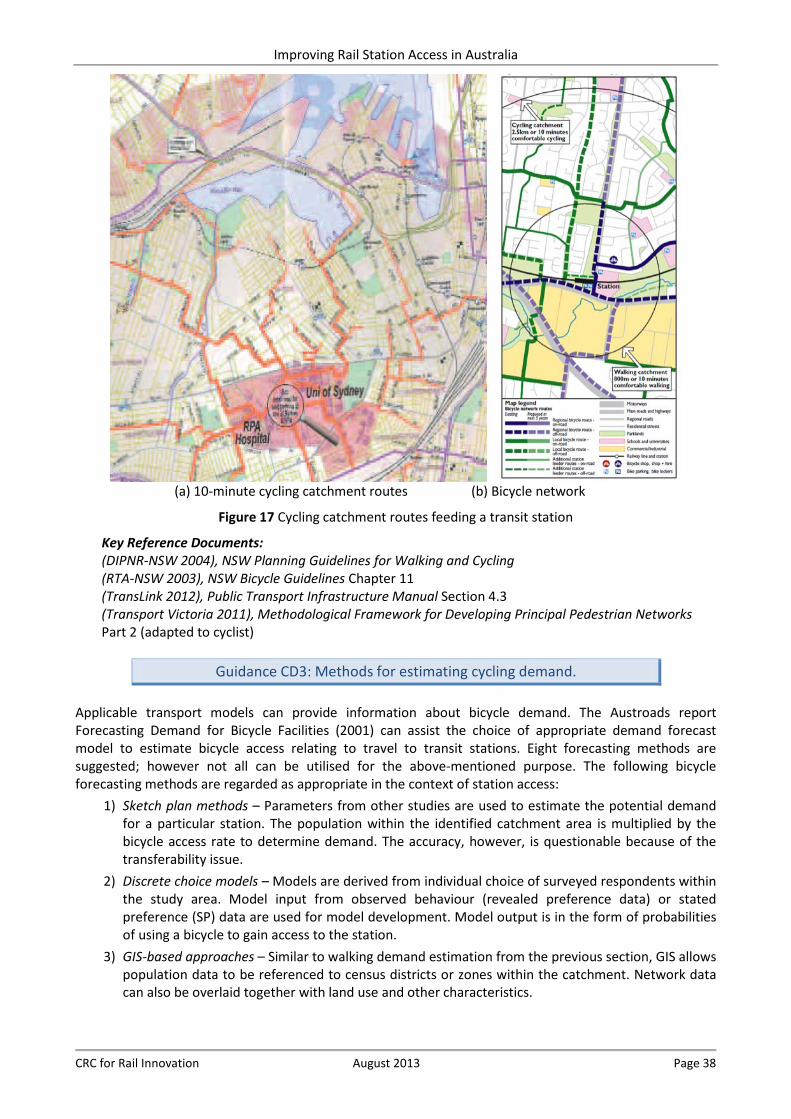
Improving Rail Station Access in Australia
CRC for Rail Innovation August 2013 Page 38
(a) 10-minute cycling catchment routes (b) Bicycle network
Figure 17 Cycling catchment routes feeding a transit station
Key Reference Documents: (DIPNR-NSW 2004), NSW Planning Guidelines for Walking and Cycling (RTA-NSW 2003), NSW Bicycle Guidelines Chapter 11 (TransLink 2012), Public Transport Infrastructure Manual Section 4.3 (Transport Victoria 2011), Methodological Framework for Developing Principal Pedestrian Networks Part 2 (adapted to cyclist)
Guidance CD3: Methods for estimating cycling demand.
Applicable transport models can provide information about bicycle demand. The Austroads report Forecasting Demand for Bicycle Facilities (2001) can assist the choice of appropriate demand forecast model to estimate bicycle access relating to travel to transit stations. Eight forecasting methods are suggested; however not all can be utilised for the above-mentioned purpose. The following bicycle forecasting methods are regarded as appropriate in the context of station access:
1) Sketch plan methods – Parameters from other studies are used to estimate the potential demand for a particular station. The population within the identified catchment area is multiplied by the bicycle access rate to determine demand. The accuracy, however, is questionable because of the transferability issue.
2) Discrete choice models – Models are derived from individual choice of surveyed respondents within the study area. Model input from observed behaviour (revealed preference data) or stated preference (SP) data are used for model development. Model output is in the form of probabilities of using a bicycle to gain access to the station.
3) GIS-based approaches – Similar to walking demand estimation from the previous section, GIS allows population data to be referenced to census districts or zones within the catchment. Network data can also be overlaid together with land use and other characteristics.
Improving Rail Station Access in Australia
CRC for Rail Innovation August 2013 Page 39
Key Reference Documents: (Austroads 2001), Forecasting Demand for Bicycle Facilities (Ortuzar, Iacobelli & Valeze 1999), Estimating demand for a cycle-way network, Transportation Research Part A: Policy and Practice, Vol. 34 pp. 353-373
Guidance CD4: Measuring bicycle access.
Bicycle LOS is employed to evaluate bicyclists’ experience at intersections and on street segments. The measure is based on traffic volumes, traffic speeds, intersection delay, roadway geometry, facilities, grades, and presence of on-street parking. Utilisation is measured using number of bicycle rack spaces/bicycle lockers available at the station throughout the day. This gives an indication of the opportunity to park a bicycle once a passenger arrives at a station. Many of the factors that influence station accessibility are not under the direct control of transit agencies (e.g., presence of sidewalks or bicycle lanes) or, in some cases, any agency (traffic volumes). These measures generally involve some level of field data collection.
Key Reference Documents: (Kittelson and Associates 2003a), TCRP Report 88: A Guidebook for Developing a Transit Performance-Measurement System
5.2.3 Arrival Zone Principles Principles essential for bicycle access within the arrival zone are discussed in this section. These include provision for safe path transition, secure parking facilities, way-finding aids, and bike sharing at destination stations.
Principle CA1: Provide direct, safe and well-marked paths designed to minimise conflicts with other modes.
The internal bicycle network within the arrival zone should meet all applicable standards and guidelines for the design of bicycle infrastructure consistent with the approach used within the station area, with additional focus on accessibility and continuity. Bicycle paths through station property should be as direct as possible and should minimise conflicts with other modes, including fellow cyclists. While some level of conflict between bicyclists and other modes may occur, options should be evaluated to reduce them. Making the path clear, safe and convenient for cyclists communicates the importance that the rail agency places on bicycle access to the station.
1) Direct paths to bicycle parking • Where possible, provide dedicated bikeways or bike paths towards the bicycle parking facility. • Paths shall conform to all local and state planning and design regulations. • Where bicycle traffic is alongside vehicular traffic, marked bicycle lanes should be clearly
designated. • For elevation changes, stairs should be avoided. If unavoidable, stair channels should be
provided. • Bicycle parking should be equally accessible on either side of the railway track. • Cyclists should be required to dismount in shared paths.
2) Minimise conflict with other modes • Appropriate signage should be provided in designated bicycle paths (bicycles have priority over
pedestrians and vehicles). • On shared paths, pedestrians have priority, thus cyclists have to dismount. • As with motorised vehicles on the road, this priority does not negate the need for care towards
pedestrians intruding into designated bicycle areas. 3) Bicycle way-finding and signage
• Preferred bike routes through the arrival zone should be clearly marked through signage. • Clearly visible signs directing cyclists towards bicycle parking should be provided.
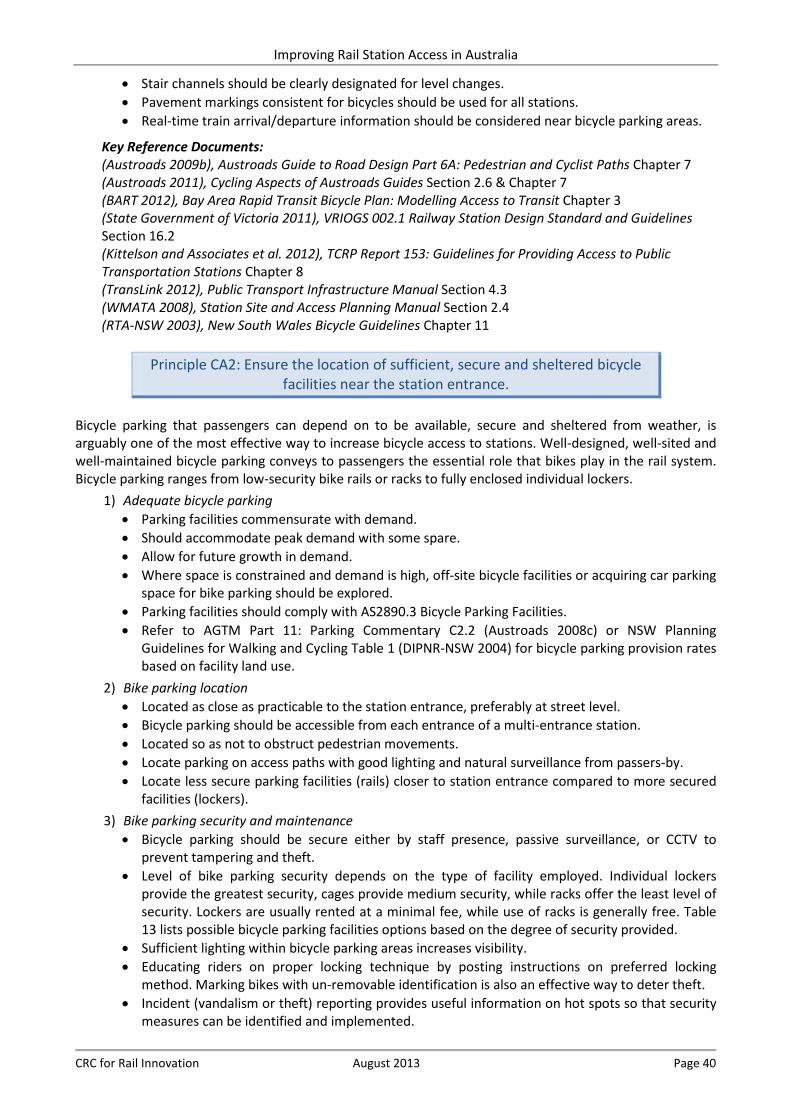
Improving Rail Station Access in Australia
CRC for Rail Innovation August 2013 Page 40
• Stair channels should be clearly designated for level changes. • Pavement markings consistent for bicycles should be used for all stations. • Real-time train arrival/departure information should be considered near bicycle parking areas.
Key Reference Documents: (Austroads 2009b), Austroads Guide to Road Design Part 6A: Pedestrian and Cyclist Paths Chapter 7 (Austroads 2011), Cycling Aspects of Austroads Guides Section 2.6 & Chapter 7 (BART 2012), Bay Area Rapid Transit Bicycle Plan: Modelling Access to Transit Chapter 3 (State Government of Victoria 2011), VRIOGS 002.1 Railway Station Design Standard and Guidelines Section 16.2 (Kittelson and Associates et al. 2012), TCRP Report 153: Guidelines for Providing Access to Public Transportation Stations Chapter 8 (TransLink 2012), Public Transport Infrastructure Manual Section 4.3 (WMATA 2008), Station Site and Access Planning Manual Section 2.4 (RTA-NSW 2003), New South Wales Bicycle Guidelines Chapter 11
Principle CA2: Ensure the location of sufficient, secure and sheltered bicycle
facilities near the station entrance. Bicycle parking that passengers can depend on to be available, secure and sheltered from weather, is arguably one of the most effective way to increase bicycle access to stations. Well-designed, well-sited and well-maintained bicycle parking conveys to passengers the essential role that bikes play in the rail system. Bicycle parking ranges from low-security bike rails or racks to fully enclosed individual lockers.
1) Adequate bicycle parking • Parking facilities commensurate with demand. • Should accommodate peak demand with some spare. • Allow for future growth in demand. • Where space is constrained and demand is high, off-site bicycle facilities or acquiring car parking
space for bike parking should be explored. • Parking facilities should comply with AS2890.3 Bicycle Parking Facilities. • Refer to AGTM Part 11: Parking Commentary C2.2 (Austroads 2008c) or NSW Planning
Guidelines for Walking and Cycling Table 1 (DIPNR-NSW 2004) for bicycle parking provision rates based on facility land use.
2) Bike parking location • Located as close as practicable to the station entrance, preferably at street level. • Bicycle parking should be accessible from each entrance of a multi-entrance station. • Located so as not to obstruct pedestrian movements. • Locate parking on access paths with good lighting and natural surveillance from passers-by. • Locate less secure parking facilities (rails) closer to station entrance compared to more secured
facilities (lockers). 3) Bike parking security and maintenance
• Bicycle parking should be secure either by staff presence, passive surveillance, or CCTV to prevent tampering and theft.
• Level of bike parking security depends on the type of facility employed. Individual lockers provide the greatest security, cages provide medium security, while racks offer the least level of security. Lockers are usually rented at a minimal fee, while use of racks is generally free. Table 13 lists possible bicycle parking facilities options based on the degree of security provided.
• Sufficient lighting within bicycle parking areas increases visibility. • Educating riders on proper locking technique by posting instructions on preferred locking
method. Marking bikes with un-removable identification is also an effective way to deter theft. • Incident (vandalism or theft) reporting provides useful information on hot spots so that security
measures can be identified and implemented.
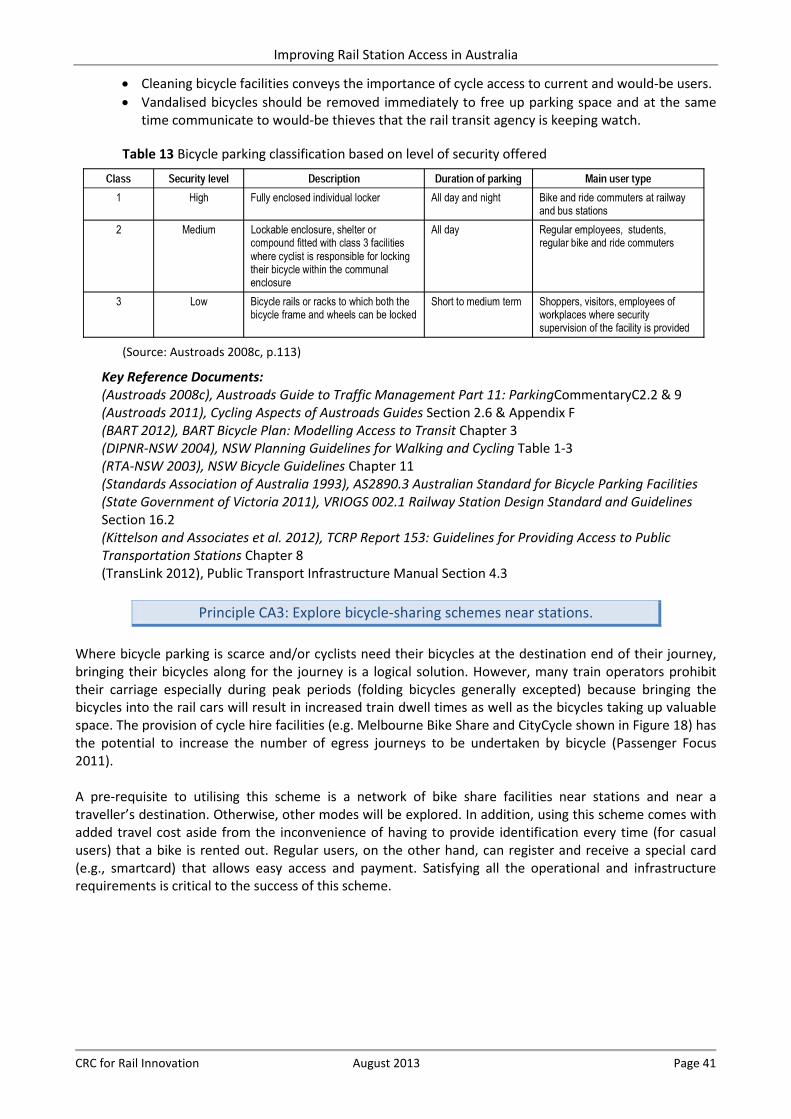
Improving Rail Station Access in Australia
CRC for Rail Innovation August 2013 Page 41
• Cleaning bicycle facilities conveys the importance of cycle access to current and would-be users. • Vandalised bicycles should be removed immediately to free up parking space and at the same
time communicate to would-be thieves that the rail transit agency is keeping watch.
Table 13 Bicycle parking classification based on level of security offered
(Source: Austroads 2008c, p.113)
Key Reference Documents: (Austroads 2008c), Austroads Guide to Traffic Management Part 11: ParkingCommentaryC2.2 & 9 (Austroads 2011), Cycling Aspects of Austroads Guides Section 2.6 & Appendix F (BART 2012), BART Bicycle Plan: Modelling Access to Transit Chapter 3 (DIPNR-NSW 2004), NSW Planning Guidelines for Walking and Cycling Table 1-3 (RTA-NSW 2003), NSW Bicycle Guidelines Chapter 11 (Standards Association of Australia 1993), AS2890.3 Australian Standard for Bicycle Parking Facilities (State Government of Victoria 2011), VRIOGS 002.1 Railway Station Design Standard and Guidelines Section 16.2 (Kittelson and Associates et al. 2012), TCRP Report 153: Guidelines for Providing Access to Public Transportation Stations Chapter 8 (TransLink 2012), Public Transport Infrastructure Manual Section 4.3
Principle CA3: Explore bicycle-sharing schemes near stations.
Where bicycle parking is scarce and/or cyclists need their bicycles at the destination end of their journey, bringing their bicycles along for the journey is a logical solution. However, many train operators prohibit their carriage especially during peak periods (folding bicycles generally excepted) because bringing the bicycles into the rail cars will result in increased train dwell times as well as the bicycles taking up valuable space. The provision of cycle hire facilities (e.g. Melbourne Bike Share and CityCycle shown in Figure 18) has the potential to increase the number of egress journeys to be undertaken by bicycle (Passenger Focus 2011). A pre-requisite to utilising this scheme is a network of bike share facilities near stations and near a traveller’s destination. Otherwise, other modes will be explored. In addition, using this scheme comes with added travel cost aside from the inconvenience of having to provide identification every time (for casual users) that a bike is rented out. Regular users, on the other hand, can register and receive a special card (e.g., smartcard) that allows easy access and payment. Satisfying all the operational and infrastructure requirements is critical to the success of this scheme.
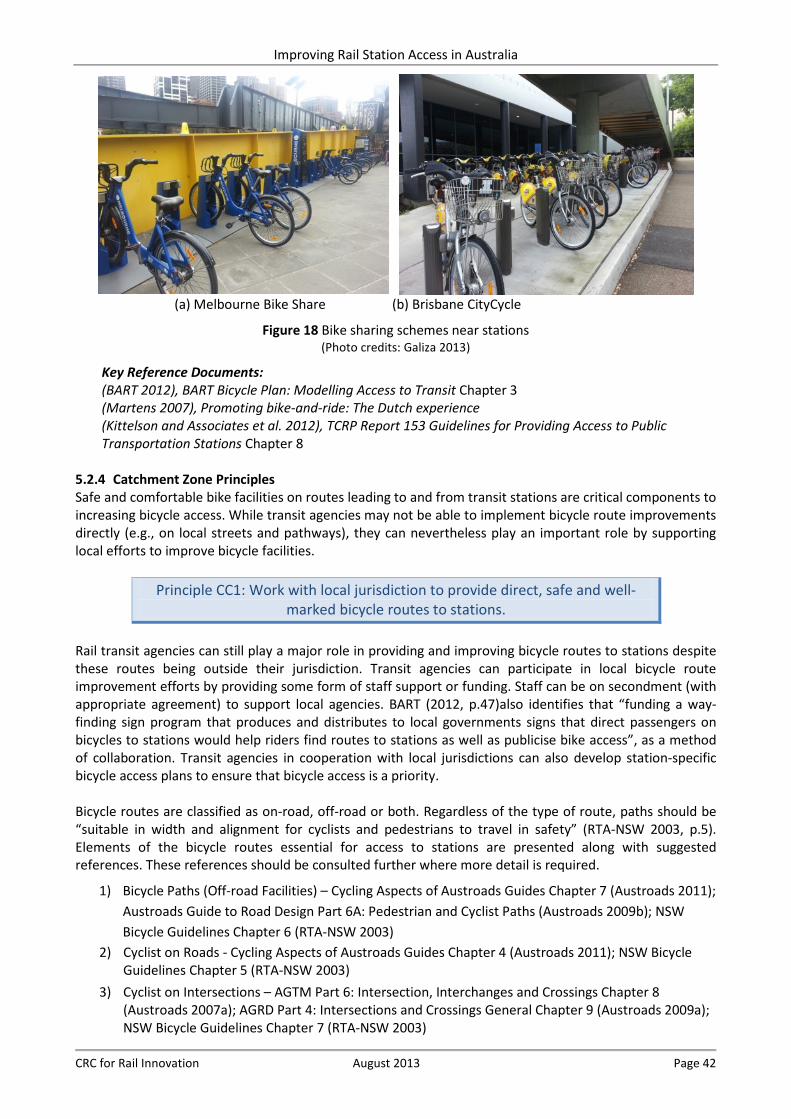
Improving Rail Station Access in Australia
CRC for Rail Innovation August 2013 Page 42
(a) Melbourne Bike Share (b) Brisbane CityCycle
Figure 18 Bike sharing schemes near stations (Photo credits: Galiza 2013)
Key Reference Documents: (BART 2012), BART Bicycle Plan: Modelling Access to Transit Chapter 3 (Martens 2007), Promoting bike-and-ride: The Dutch experience (Kittelson and Associates et al. 2012), TCRP Report 153 Guidelines for Providing Access to Public Transportation Stations Chapter 8
5.2.4 Catchment Zone Principles Safe and comfortable bike facilities on routes leading to and from transit stations are critical components to increasing bicycle access. While transit agencies may not be able to implement bicycle route improvements directly (e.g., on local streets and pathways), they can nevertheless play an important role by supporting local efforts to improve bicycle facilities.
Principle CC1: Work with local jurisdiction to provide direct, safe and well-marked bicycle routes to stations.
Rail transit agencies can still play a major role in providing and improving bicycle routes to stations despite these routes being outside their jurisdiction. Transit agencies can participate in local bicycle route improvement efforts by providing some form of staff support or funding. Staff can be on secondment (with appropriate agreement) to support local agencies. BART (2012, p.47)also identifies that “funding a way-finding sign program that produces and distributes to local governments signs that direct passengers on bicycles to stations would help riders find routes to stations as well as publicise bike access”, as a method of collaboration. Transit agencies in cooperation with local jurisdictions can also develop station-specific bicycle access plans to ensure that bicycle access is a priority. Bicycle routes are classified as on-road, off-road or both. Regardless of the type of route, paths should be “suitable in width and alignment for cyclists and pedestrians to travel in safety” (RTA-NSW 2003, p.5). Elements of the bicycle routes essential for access to stations are presented along with suggested references. These references should be consulted further where more detail is required.
1) Bicycle Paths (Off-road Facilities) – Cycling Aspects of Austroads Guides Chapter 7 (Austroads 2011); Austroads Guide to Road Design Part 6A: Pedestrian and Cyclist Paths (Austroads 2009b); NSW Bicycle Guidelines Chapter 6 (RTA-NSW 2003)
2) Cyclist on Roads - Cycling Aspects of Austroads Guides Chapter 4 (Austroads 2011); NSW Bicycle Guidelines Chapter 5 (RTA-NSW 2003)
3) Cyclist on Intersections – AGTM Part 6: Intersection, Interchanges and Crossings Chapter 8 (Austroads 2007a); AGRD Part 4: Intersections and Crossings General Chapter 9 (Austroads 2009a); NSW Bicycle Guidelines Chapter 7 (RTA-NSW 2003)
Improving Rail Station Access in Australia
CRC for Rail Innovation August 2013 Page 43
4) Cyclist on Railway Crossings - AGTM Part 6: Intersection, Interchanges and Crossings Chapter 7 (Austroads 2007a); AGRD Part 4: Intersections and Crossings General Section 10.6 (Austroads 2009a)
Principle CC2: Provide bicycle network and route mapping
in relation to nearest rail stations. Bicycle route maps and network maps are an important tool to aid bicycle riders find their way around the network and to assist them to arrive safely at their destinations. Route and network mapping is also a good means to promote use of the system and to encourage cycling within the community. From the RTA NSW Bicycle Guidelines:
“Network maps should be made available in a number of easily accessible formats: sign boards can be erected at key route intersections, where a number of routes converge or at a prominent destination; maps can be downloaded in electronic format from web sites; and maps can be made available from bicycle shops, cafes and other prominent points of interest located along network routes” (RTA-NSW 2003, p.74).
Key Reference Documents: (BART 2012), BART Bicycle Plan: Modelling Access to Transit Chapter 3 (RTA-NSW 2003), NSW Bicycle Guidelines Section 9.2
5.3 Feeder Bus Access Feeder bus is a major alternative to driving especially for passengers living a good distance away from the rail station. This mode of access can significantly expand the station catchment area as well as provide a means of access for the elderly, persons with disabilities, and riders who do not have access to a car, all of whom may find it difficult to walk or cycle to the station. Buses carry large numbers of passengers, thereby making bus the most efficient motorised access mode. It should therefore be given access priority over other motorised modes. This large carrying-capacity highlights the importance of a seamless integration and requires the transfer to be short, convenient and comfortable (PTA-WA 2011a). Essential to this mode being utilised for station access is the availability of the service near trip origins (e.g., home or work). Not all areas outside of the walking and cycling catchment areas can be serviced by bus feeder to the station, as will be discussed in the factors affecting bus demand and illustrated in the bus catchment definition. A good example of a streamlined interchange between bus, tram and private railway is Switzerland’s public transport system. The public transport timetable has been designed to converge with timetables at interchange stations along with seamless ticketing (Green & Hall 2009). Real-time bus information is also displayed inside the train station as well as train service information in the bus drop-off areas. This results in better coordination between rail and bus timetables so that transfer and waiting times are reduced. According to a survey by Passenger Focus (2011), passengers will likely to switch to bus (as an access mode) if there is better connection times and if there is increased bus service frequency. The following summarises critical demand analysis guidance followed by principles and requirements essential for enhancing access by feeder bus towards the station segregated according to the arrival zone and catchment zone:
Demand Analysis Guidance14: BD1: Factors that impact on bus access demand. BD2: Feeder bus catchment area definition. BD3: Methods for bus demand estimation. BD4: Measuring feeder bus access.
Arrival Zone Principles15: 14 Referred to as Bus-Demand analysis (CD)
Improving Rail Station Access in Australia
CRC for Rail Innovation August 2013 Page 44
BA1: Provide direct bus routes to drop-off areas. BA2: Provide passengers with safe, short and seamless transfer. BA3: Provide adequate transfer facilities.
Catchment Zone Principles16: BC1: Work with local jurisdiction and bus operators to provide convenient walking paths and bus stops. BC2: Explore shuttle services to complement regular bus services.
5.3.1 General Considerations Bus-rail interchanging can occur where their routes intersect and can significantly improve the overall journey. TCRP Report 153 (Kittelson and Associates et al. 2012) suggests that a savings of at least 5 minutes of the overall travel time (compared to direct trip) can persuade passengers to interchange. However, this minimum savings additionally is affected by other factors such as type of interchange and facilities, socio-demographic characteristics, transport network characteristics, etc. To aid in saving travel time, timetables between bus and trains should be coordinated so as to minimise inter-journey wait times while allowing for sufficient time for passengers for interchange between services. Multi-modal ticketing should also be considered to reduce the time expended paying fares (for both access and alighting). In addition, bus stops at the interchange station should be sufficient and situated at the shortest possible distance to the entrance. Walking paths between them should also be clearly signed, secured and well-lit. On the return journey, sufficient seating and shelter from the elements should be provided for waiting passengers especially for long waits. Bus timetables should be provided together with clearly marked stops for each route. Other amenities, including rubbish bins, public telephones, etc., should also be provided in the waiting area. For the remaining leg of the journey, adequate capacity should be provided, especially during peak periods. Bus stop to home access should also be safe and convenient. It is also important to have adequate comfortable waiting space at the stops. These should also be well-lit wherever possible. 5.3.2 Demand Analysis Guidance
Guidance BD1: Factors that impact on bus access demand. Transit agencies have utilised a broad range of factors to estimate bus ridership including bus transfers. TCRP (2007) classified these into internal (factors within the agency’s control) and external (beyond their control) factors. Bus service characteristics, including fare, service frequency, timetable, etc. are internal factors that the agency can influence to increase ridership. On the flipside, these factors include socio-demographic, travel patterns, alternative form of transport, etc. In addition, ’population and employment growth in a region can raise transit demand while certain factors (e.g., fuel prices, parking availability and prices, and regional development patterns) affect ridership by influencing the relative attractiveness of other modes’ (TranSystems, Planners Collaborative & Tom Crikelair Associates 2007, p. 6). Of the internal factors where transit agencies can have a direct influence on bus demand levels, the following service adjustments are deemed to affect bus transfers at rail transit stations according to TCRP 2007: change in route coverage; timetable and service frequency adjustments; amenities improvements; better information provision; and fare integration. For more details on how the preceding adjustments affect bus demands, see key reference document.
Key Reference Documents: (TranSystems, Planners Collaborative & Tom Crikelair Associates 2007), TCRP Report 111: Elements Needed to Create High Ridership Transit Systems
15 Referred to as Bus-Arrival (BA) zone 16 Referred to as Bus-Catchment (BC) zone
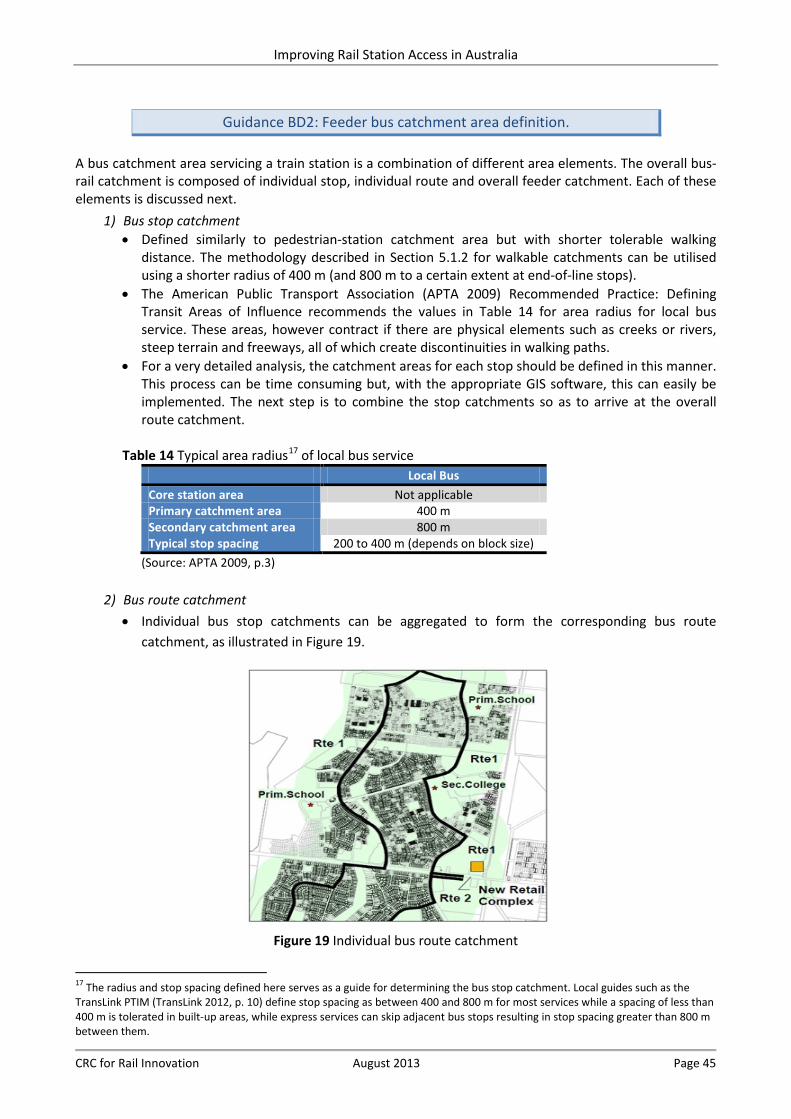
Improving Rail Station Access in Australia
CRC for Rail Innovation August 2013 Page 45
Guidance BD2: Feeder bus catchment area definition. A bus catchment area servicing a train station is a combination of different area elements. The overall bus-rail catchment is composed of individual stop, individual route and overall feeder catchment. Each of these elements is discussed next.
1) Bus stop catchment • Defined similarly to pedestrian-station catchment area but with shorter tolerable walking
distance. The methodology described in Section 5.1.2 for walkable catchments can be utilised using a shorter radius of 400 m (and 800 m to a certain extent at end-of-line stops).
• The American Public Transport Association (APTA 2009) Recommended Practice: Defining Transit Areas of Influence recommends the values in Table 14 for area radius for local bus service. These areas, however contract if there are physical elements such as creeks or rivers, steep terrain and freeways, all of which create discontinuities in walking paths.
• For a very detailed analysis, the catchment areas for each stop should be defined in this manner. This process can be time consuming but, with the appropriate GIS software, this can easily be implemented. The next step is to combine the stop catchments so as to arrive at the overall route catchment.
Table 14 Typical area radius17 of local bus service
Local Bus Core station area Not applicable Primary catchment area 400 m Secondary catchment area 800 m Typical stop spacing 200 to 400 m (depends on block size)
(Source: APTA 2009, p.3)
2) Bus route catchment • Individual bus stop catchments can be aggregated to form the corresponding bus route
catchment, as illustrated in Figure 19.
Figure 19 Individual bus route catchment
17 The radius and stop spacing defined here serves as a guide for determining the bus stop catchment. Local guides such as the TransLink PTIM (TransLink 2012, p. 10) define stop spacing as between 400 and 800 m for most services while a spacing of less than 400 m is tolerated in built-up areas, while express services can skip adjacent bus stops resulting in stop spacing greater than 800 m between them.
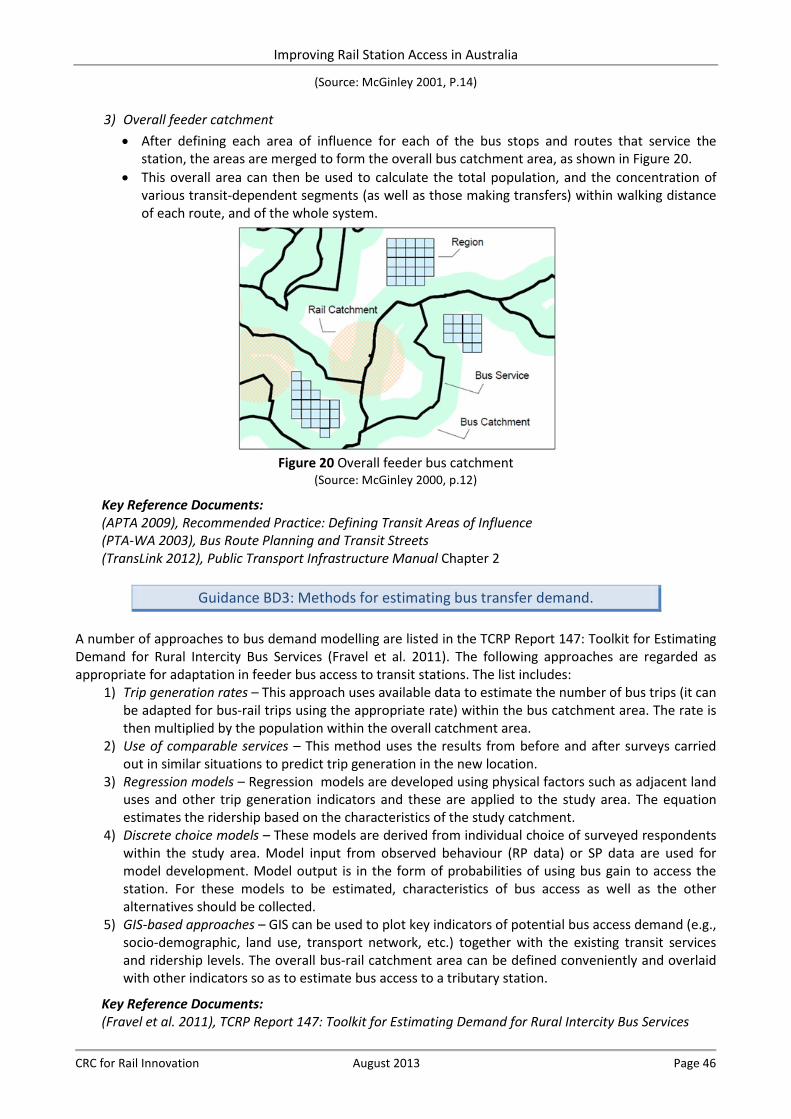
Improving Rail Station Access in Australia
CRC for Rail Innovation August 2013 Page 46
(Source: McGinley 2001, P.14)
3) Overall feeder catchment • After defining each area of influence for each of the bus stops and routes that service the
station, the areas are merged to form the overall bus catchment area, as shown in Figure 20. • This overall area can then be used to calculate the total population, and the concentration of
various transit-dependent segments (as well as those making transfers) within walking distance of each route, and of the whole system.
Figure 20 Overall feeder bus catchment
(Source: McGinley 2000, p.12)
Key Reference Documents: (APTA 2009), Recommended Practice: Defining Transit Areas of Influence (PTA-WA 2003), Bus Route Planning and Transit Streets (TransLink 2012), Public Transport Infrastructure Manual Chapter 2
Guidance BD3: Methods for estimating bus transfer demand.
A number of approaches to bus demand modelling are listed in the TCRP Report 147: Toolkit for Estimating Demand for Rural Intercity Bus Services (Fravel et al. 2011). The following approaches are regarded as appropriate for adaptation in feeder bus access to transit stations. The list includes:
1) Trip generation rates – This approach uses available data to estimate the number of bus trips (it can be adapted for bus-rail trips using the appropriate rate) within the bus catchment area. The rate is then multiplied by the population within the overall catchment area.
2) Use of comparable services – This method uses the results from before and after surveys carried out in similar situations to predict trip generation in the new location.
3) Regression models – Regression models are developed using physical factors such as adjacent land uses and other trip generation indicators and these are applied to the study area. The equation estimates the ridership based on the characteristics of the study catchment.
4) Discrete choice models – These models are derived from individual choice of surveyed respondents within the study area. Model input from observed behaviour (RP data) or SP data are used for model development. Model output is in the form of probabilities of using bus gain to access the station. For these models to be estimated, characteristics of bus access as well as the other alternatives should be collected.
5) GIS-based approaches – GIS can be used to plot key indicators of potential bus access demand (e.g., socio-demographic, land use, transport network, etc.) together with the existing transit services and ridership levels. The overall bus-rail catchment area can be defined conveniently and overlaid with other indicators so as to estimate bus access to a tributary station.
Key Reference Documents: (Fravel et al. 2011), TCRP Report 147: Toolkit for Estimating Demand for Rural Intercity Bus Services
Improving Rail Station Access in Australia
CRC for Rail Innovation August 2013 Page 47
(TranSystems, Planners Collaborative & Tom Crikelair Associates 2007), TCRP Report 111: Elements Needed to Create High Ridership Transit Systems
Guidance BD4: Measuring feeder bus access.
The availability of bus to access rail stations can be measured in a variety of ways. Service coverage assesses how much area has access to the bus service and can be calculated as either a number or percentage (Kittelson and Associates 2003a). The TCQSM uses percent transit-supportive area served as its measure and uses ¼-mile air distances from bus stops. The manual uses the following LOS thresholds for percent transit-supportive area served: “A”= 90-100%, “B”= 80-89%, “C”= 70-79%, “D”= 60-69%, “E”= 50-59%, “F”= <50%. Stop accessibility can also be measured using the network connectivity index in Section 5.1.2. Service frequency describes the number of transit vehicles per hour or day. Frequency measures how often transit service is provided at a location. Service frequency is defined in terms of transit vehicles per hour and its reciprocal, headway (time interval between transit vehicles). Service frequency can be variable depending on temporal demands throughout the day. It is more important that service be available when needed although a maximum headway is also desirable. Headways for the following LOS ranges are defined by TCQSM: urban fixed-route service: “A” = <10 minutes, “B” = 10-14 minutes, “C” = 15-20 minutes, “D” =21-30 minutes, “E” = 31-60 minutes, “F” = >60 minutes. For intercity service, the ranges are: “A” = >15 trips/day, “B” = 12-15 trips/day, “C” = 8-11 trips/day, “D” = 4-7 trips/day, “E” = 2-3 trips/day, “F” = 0-1 trips/day. The maximum allowable policy headway might range from 30 minutes to two hours. A planning-level measure for determining how much feeder service should be provided is transit orientation index (TOI). TOI is a scored estimate of ridership in an area that is based on a locally developed regression model that relates ridership to employment, housing, and retail employment densities (Kittelson and Associates 2003a). It is an availability measure in the sense that it evaluates whether and how much transit service should be available to an area. The higher the TOI, the greater the potential demand for transit in a zone. Major factors that affect TOI in a particular area includes: level of population and employment data aggregation, population and employment density. To aid in saving travel time, frequencies between buses and trains should be coordinated so as to minimise inter-journey transfer times while allowing for sufficient time for passengers for interchange between services. Transfer time is a measure of how long a passenger waits while transferring between vehicles (e.g., bus and rail). This measure can be easily calculated based on service schedules of both services; however, on-time performance can make the measurement difficult. Transfers are a significant part of perceived service quality, making measuring transfer quality very important. According to TCRP Report 88 (Kittelson and Associates 2003a), passengers prefer organised transfers in which walk and wait times are less than 2 and 3 minutes, respectively.
Key Reference Documents: (Kittelson and Associates et al. 2003), TCRP Report 100: Transit Capacity and Quality of Service Manual (Kittelson and Associates 2003a), TCRP Report 88: A Guidebook for Developing a Transit Performance-Measurement System
5.3.3 Arrival Zone Principles Principles essential for feeder bus access within the arrival zone are discussed in this section. These include provision for direct route to drop-off areas, seamless, short and conflict-free transfer, and adequate transfer facilities.
Principle BA1: Provide direct bus routes to drop-off areas.
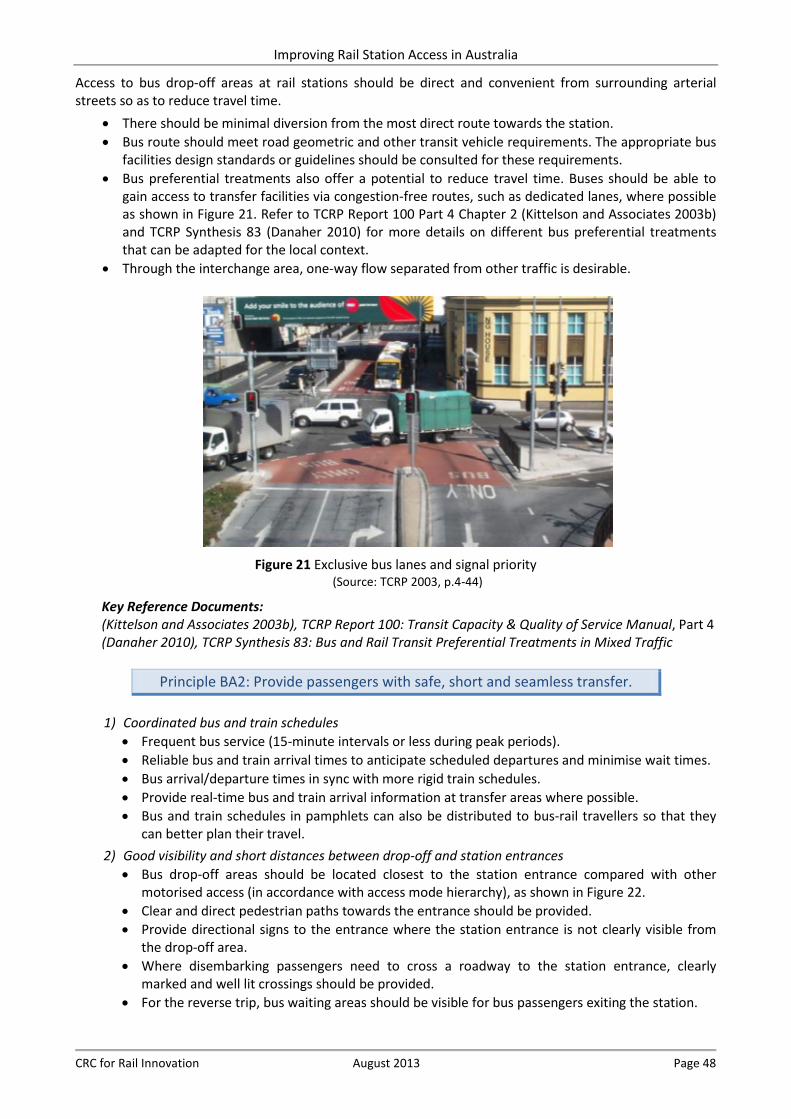
Improving Rail Station Access in Australia
CRC for Rail Innovation August 2013 Page 48
Access to bus drop-off areas at rail stations should be direct and convenient from surrounding arterial streets so as to reduce travel time.
• There should be minimal diversion from the most direct route towards the station. • Bus route should meet road geometric and other transit vehicle requirements. The appropriate bus
facilities design standards or guidelines should be consulted for these requirements. • Bus preferential treatments also offer a potential to reduce travel time. Buses should be able to
gain access to transfer facilities via congestion-free routes, such as dedicated lanes, where possible as shown in Figure 21. Refer to TCRP Report 100 Part 4 Chapter 2 (Kittelson and Associates 2003b) and TCRP Synthesis 83 (Danaher 2010) for more details on different bus preferential treatments that can be adapted for the local context.
• Through the interchange area, one-way flow separated from other traffic is desirable.
Figure 21 Exclusive bus lanes and signal priority
(Source: TCRP 2003, p.4-44)
Key Reference Documents: (Kittelson and Associates 2003b), TCRP Report 100: Transit Capacity & Quality of Service Manual, Part 4 (Danaher 2010), TCRP Synthesis 83: Bus and Rail Transit Preferential Treatments in Mixed Traffic
Principle BA2: Provide passengers with safe, short and seamless transfer.
1) Coordinated bus and train schedules
• Frequent bus service (15-minute intervals or less during peak periods). • Reliable bus and train arrival times to anticipate scheduled departures and minimise wait times. • Bus arrival/departure times in sync with more rigid train schedules. • Provide real-time bus and train arrival information at transfer areas where possible. • Bus and train schedules in pamphlets can also be distributed to bus-rail travellers so that they
can better plan their travel. 2) Good visibility and short distances between drop-off and station entrances
• Bus drop-off areas should be located closest to the station entrance compared with other motorised access (in accordance with access mode hierarchy), as shown in Figure 22.
• Clear and direct pedestrian paths towards the entrance should be provided. • Provide directional signs to the entrance where the station entrance is not clearly visible from
the drop-off area. • Where disembarking passengers need to cross a roadway to the station entrance, clearly
marked and well lit crossings should be provided. • For the reverse trip, bus waiting areas should be visible for bus passengers exiting the station.
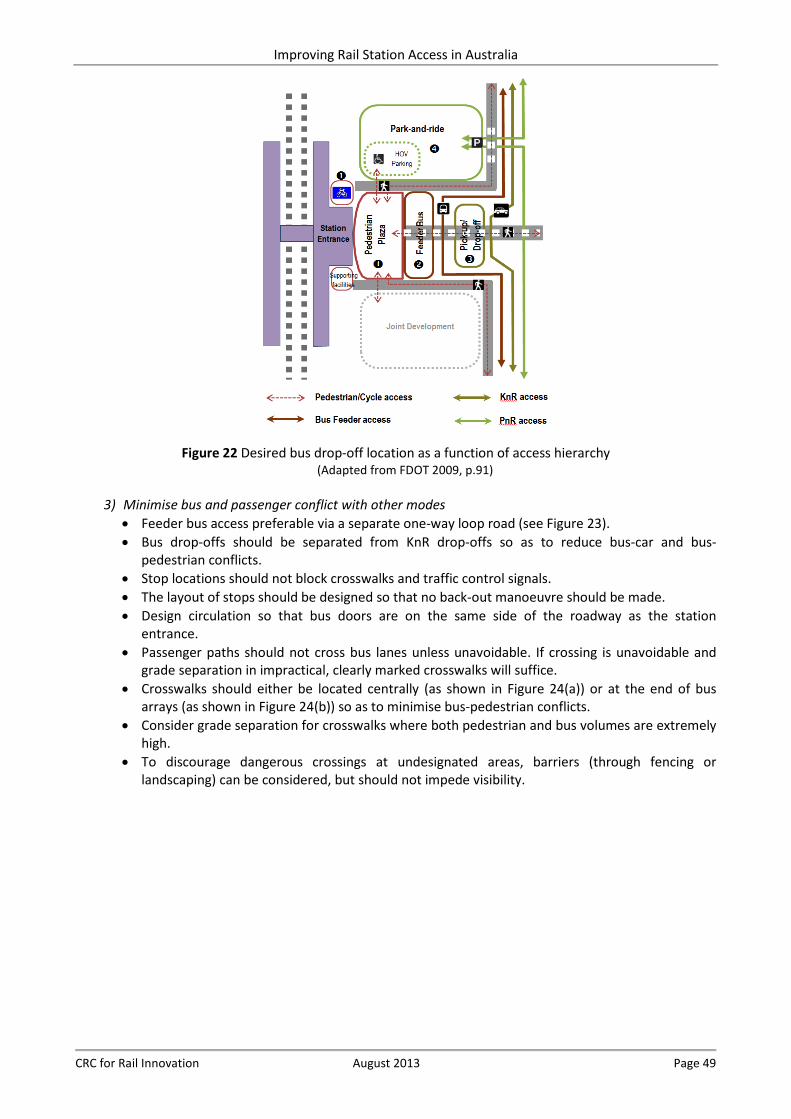
Improving Rail Station Access in Australia
CRC for Rail Innovation August 2013 Page 49
Figure 22 Desired bus drop-off location as a function of access hierarchy
(Adapted from FDOT 2009, p.91)
3) Minimise bus and passenger conflict with other modes • Feeder bus access preferable via a separate one-way loop road (see Figure 23). • Bus drop-offs should be separated from KnR drop-offs so as to reduce bus-car and bus-
pedestrian conflicts. • Stop locations should not block crosswalks and traffic control signals. • The layout of stops should be designed so that no back-out manoeuvre should be made. • Design circulation so that bus doors are on the same side of the roadway as the station
entrance. • Passenger paths should not cross bus lanes unless unavoidable. If crossing is unavoidable and
grade separation in impractical, clearly marked crosswalks will suffice. • Crosswalks should either be located centrally (as shown in Figure 24(a)) or at the end of bus
arrays (as shown in Figure 24(b)) so as to minimise bus-pedestrian conflicts. • Consider grade separation for crosswalks where both pedestrian and bus volumes are extremely
high. • To discourage dangerous crossings at undesignated areas, barriers (through fencing or
landscaping) can be considered, but should not impede visibility.
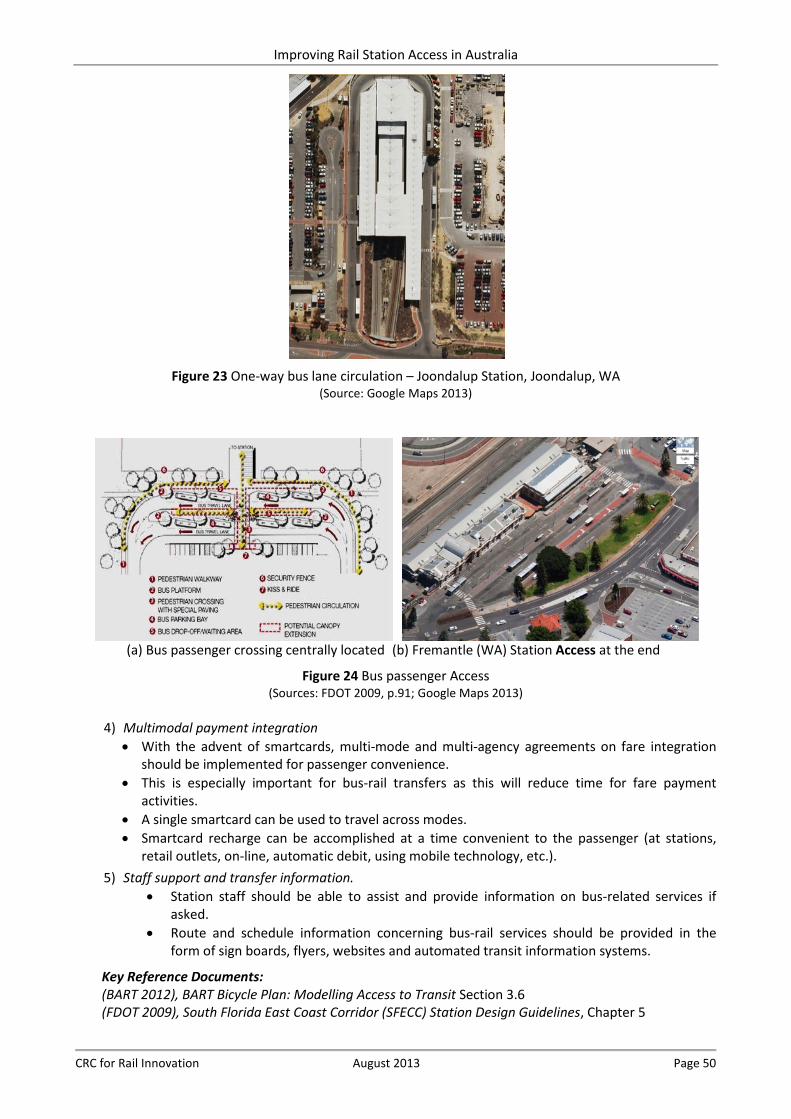
Improving Rail Station Access in Australia
CRC for Rail Innovation August 2013 Page 50
Figure 23 One-way bus lane circulation – Joondalup Station, Joondalup, WA
(Source: Google Maps 2013)
(a) Bus passenger crossing centrally located (b) Fremantle (WA) Station Access at the end
Figure 24 Bus passenger Access (Sources: FDOT 2009, p.91; Google Maps 2013)
4) Multimodal payment integration
• With the advent of smartcards, multi-mode and multi-agency agreements on fare integration should be implemented for passenger convenience.
• This is especially important for bus-rail transfers as this will reduce time for fare payment activities.
• A single smartcard can be used to travel across modes. • Smartcard recharge can be accomplished at a time convenient to the passenger (at stations,
retail outlets, on-line, automatic debit, using mobile technology, etc.). 5) Staff support and transfer information.
• Station staff should be able to assist and provide information on bus-related services if asked.
• Route and schedule information concerning bus-rail services should be provided in the form of sign boards, flyers, websites and automated transit information systems.
Key Reference Documents: (BART 2012), BART Bicycle Plan: Modelling Access to Transit Section 3.6 (FDOT 2009), South Florida East Coast Corridor (SFECC) Station Design Guidelines, Chapter 5
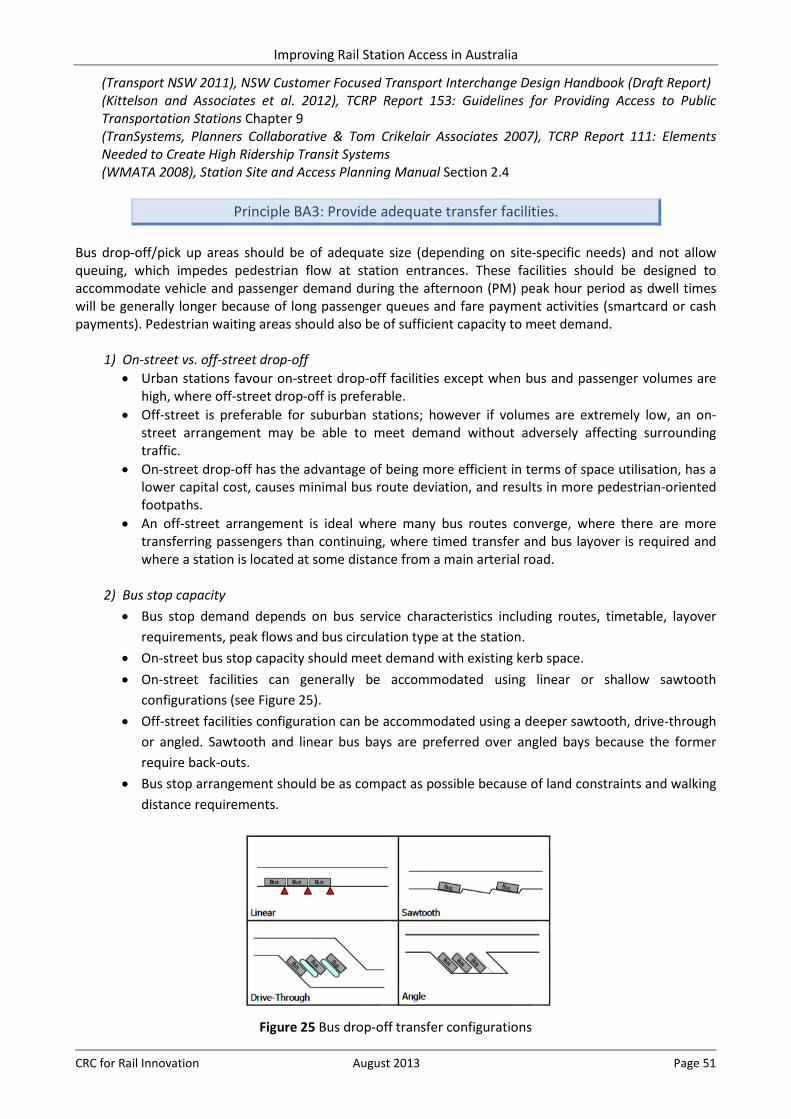
Improving Rail Station Access in Australia
CRC for Rail Innovation August 2013 Page 51
(Transport NSW 2011), NSW Customer Focused Transport Interchange Design Handbook (Draft Report) (Kittelson and Associates et al. 2012), TCRP Report 153: Guidelines for Providing Access to Public Transportation Stations Chapter 9 (TranSystems, Planners Collaborative & Tom Crikelair Associates 2007), TCRP Report 111: Elements Needed to Create High Ridership Transit Systems (WMATA 2008), Station Site and Access Planning Manual Section 2.4
Principle BA3: Provide adequate transfer facilities.
Bus drop-off/pick up areas should be of adequate size (depending on site-specific needs) and not allow queuing, which impedes pedestrian flow at station entrances. These facilities should be designed to accommodate vehicle and passenger demand during the afternoon (PM) peak hour period as dwell times will be generally longer because of long passenger queues and fare payment activities (smartcard or cash payments). Pedestrian waiting areas should also be of sufficient capacity to meet demand.
1) On-street vs. off-street drop-off
• Urban stations favour on-street drop-off facilities except when bus and passenger volumes are high, where off-street drop-off is preferable.
• Off-street is preferable for suburban stations; however if volumes are extremely low, an on-street arrangement may be able to meet demand without adversely affecting surrounding traffic.
• On-street drop-off has the advantage of being more efficient in terms of space utilisation, has a lower capital cost, causes minimal bus route deviation, and results in more pedestrian-oriented footpaths.
• An off-street arrangement is ideal where many bus routes converge, where there are more transferring passengers than continuing, where timed transfer and bus layover is required and where a station is located at some distance from a main arterial road.
2) Bus stop capacity
• Bus stop demand depends on bus service characteristics including routes, timetable, layover requirements, peak flows and bus circulation type at the station.
• On-street bus stop capacity should meet demand with existing kerb space. • On-street facilities can generally be accommodated using linear or shallow sawtooth
configurations (see Figure 25). • Off-street facilities configuration can be accommodated using a deeper sawtooth, drive-through
or angled. Sawtooth and linear bus bays are preferred over angled bays because the former require back-outs.
• Bus stop arrangement should be as compact as possible because of land constraints and walking distance requirements.
Figure 25 Bus drop-off transfer configurations
Improving Rail Station Access in Australia
CRC for Rail Innovation August 2013 Page 52
(Source: Kittelson and Associates 2003b, p.4-13) 3) Other supporting transfer facilities.
• Provide overhead canopy for paths connecting the drop-off area to the station where possible. Canopies crossing bus lanes may, however, be constrained by the minimum bus height clearance.
• Appropriate signage, lighting and landscape treatments along these paths should also be provided, but should not impede pedestrian flow.
• Provide sufficient shelter, seating, lighting and rubbish bins at all bus waiting areas. • Provide sufficient circulation space in waiting areas to meet PM peak pedestrian demands.
Key Reference Documents: (Transport NSW 2011), NSW Customer Focused Transport Interchange Design Handbook (Draft Report) (Kittelson and Associates et al. 2012), TCRP Report 153: Guidelines for Providing Access to Public Transportation Stations Chapter 9 (Kittelson and Associates 2003b), TCRP Report 100: Transit Capacity and Quality of Service Manual, Part 4 (TransLink 2012), TransLink Public Transport Infrastructure Manual Chapter 3
5.3.4 Catchment Zone Principles
Principle BC1: Work with local jurisdiction and bus operators to provide convenient walking paths and bus stops.
Rail agencies should work closely with local governments and bus operators to improve access to bus stops on routes that service a train station. While RAs may not be able to effect improvements on local streets and pathways and on bus stops, they can still play an important role by supporting local efforts.
• Support can be in the form of funding signage and information dissemination of bus-rail services. • Staff with expertise on access can be placed on secondment (with appropriate agreement) to
support local agencies in their efforts to improve walking access to local bus stops. • It is also important to have high-quality bus waiting facilities located so as to allow as much passive
surveillance as possible. • Where shelters are provided, they should be well lit or sited in order to take advantage of local
street lights. • Refer to appropriate bus facilities and infrastructure guidelines such as Chapter 2 of TransLink
Public Transport Infrastructure Manual (2012), PTA WA Bus Route Planning and Transit Streets (PTA-WA 2003), Victoria DoT Public Transport Guidelines for Land Use and Development (State Government of Victoria 2008), or relevant state bus planning guideline for more details on bus stop placements and other relevant facilities.
Key Reference Documents: (NZTA 2009), New Zealand Transport Agency Pedestrian Planning and Design Guide, Section 6-7 (PTA-WA 2003), Bus Route Planning and Transit Streets (Queensland Transport 2005), Easy Steps: A Toolkit for Planning, Designing and Promoting Safe Walking, Section C3.2 (TransLink 2012), TransLink Public Transport Infrastructure Manual Chapter 2 (State Government of Victoria 2008), Public Transport Guidelines for Land Use and development
Principle BC2: Explore shuttle services to complement regular bus services.
Improving Rail Station Access in Australia
CRC for Rail Innovation August 2013 Page 53
Large residential subdivision areas and large employment areas such as schools, shopping districts, office parks and hospitals may explore the possibility of providing shuttle services in partnership with transit agencies where public transit is not available.
• A shuttle service between the rail station and the high-passenger demand area can be sustainable if employers are willing to subsidise or sponsor such a service, or at least contribute to it in their funding.
• Large remote parking facilities can also be catered for via a shuttle service. • Frequent and reliable service is essential to the success of this strategy.
Key Reference Documents: (Kittelson and Associates et al. 2012), TCRP Report 153: Guidelines for Providing Access to Public Transportation Stations Chapter 9 (TranSystems, Planners Collaborative & Tom Crikelair Associates 2007), TCRP Report 111: Elements Needed to Create High Ridership Transit Systems Chapter 6
5.4 Kiss-and-Ride (KnR) Access A more efficient mode of access than PnR is when passengers are being dropped-off or picked-up at stations via car because the former requires less space within the station precinct (Transport NSW 2011). It requires no parking manoeuvre and therefore, a sufficient number of kerb spaces (based on existing demands) can handle the drop-off (Kittelson and Associates 2003b). KnR provides a convenient access mode, particularly where parking capacity may be limited. Schank (2002) also found that parking lot design and regulation can increase KnR usage. His findings show that larger and more accessible drop-off points tended to have a higher mode share. On the downside, KnR journeys tend to double the number of car journeys around the vicinity of the station in comparison to PnR (Passenger Focus 2011). KnR facilities function similarly to bus drop-off except that the former cater to smaller-capacity vehicles (FDOT 2009). Two important components are pre-requisite for station access via KnR: availability of a driver and a car. This access mode revolves around the two components being available to make a dedicated passenger drop-off to the station. The following summarises key demand analysis guidance followed by principles and requirements essential for enhancing KnR access to the station classified according to the arrival zone and catchment zone:
Demand Analysis Guidance18: KD1: Factors that impact KnR access demand. KD2: KnR catchment area definition. KD3: Methods for KnR demand estimation.
Arrival Zone Principles19: KA1: Locate KnR facilities to minimise both passenger walking distance and conflict with other traffic. KA2: Provide adequately sized drop-off/pick-up facilities. KA3: Provide clear way-finding signage and information towards and within KnR facilities for both drivers and passengers.
Catchment Zone Principles20: KC1: Work with local jurisdictions and road transport authorities to provide information about KnR
facilities. 5.4.1 General Considerations KnR facilities provide an efficient and low-cost means of access to stations. This mode provides the added advantage of auto access so as to increase the station’s catchment area without the need for large space requirements for vehicle parking. Vehicle drop-offs function similarly to bus drop-offs, but service only
18 Referred to as KnR-Demand analysis (KD) 19 Referred to as KnR-Arrival (KA) zone 20 Referred to as KnR-Catchment (KC) zone
Improving Rail Station Access in Australia
CRC for Rail Innovation August 2013 Page 54
smaller-capacity vehicles. It could be noted that KnR access involves a large number of movements resulting in a greater number of conflicts than any other access mode per passenger. There are also two users that need to be taken into consideration when designing KnR facilities: the driver of the vehicle and the interchanging passenger. Both will need a different set of facilities in order to make this type of access seamless and convenient. The driver has to be directed easily into the drop-off area and leave quickly after dropping-off the passenger/s. In addition, space is required for the vehicle to stop safely while the passenger alights. Alighting passengers require short and safe access paths towards the station entrance. According to the TransLink Public Transport Infrastructure Manual (TransLink 2012), these infrastructures primarily refer to: passenger set-down/pick-up bays that are either shared or dedicated, kerbside or off-street, and; associated pedestrian and vehicle waiting areas and supporting elements (including parking for waiting vehicles, waiting area amenities, way-finding signage, pedestrian access paths, etc.). Good way-finding signs ensure that drivers are directed into the KnR kerb space and leave the vicinity quickly and efficiently. The drop off bays should be parallel (where possible) so as to ease vehicle manoeuvring in and out of the bays without having to do a reverse manoeuvre (PTA-WA 2011a). Drop-off facilities can be incorporated along streets as simple pull-in facilities, or as loop roads with short-term parking. It is also desirable to configure the kerb space so that the passenger door is close to the footpath so as to reduce having to cross or walk on roadways when being dropped off or picked up (Transport NSW 2011). Drop-off locations should, whenever possible, have sheltered seating, appropriate lighting and telephone access for passengers waiting to be picked up. The size of KnR facilities should be able to accommodate the expected demand given the physical constraints of the site. Taxi access is also an important component of KnR and should be provided separately where demand is significant. In summary, KnR facilities that are too far from the station entrance, too congested or have poor visibility will discourage use and may force drivers to drop-off passengers in dangerous locations (WMATA 2008, p.2-18). 5.4.2 Demand Analysis Guidance
Guidance KD1: Factors that impact KnR access demand. The need for KnR facilities is generally a function of the type of station and various factors such as surrounding land uses, socio-demographics, trip characteristics, etc. TransLink’s PTIM (2012) lists the following variables as demanding consideration when analysing demand for KnR facilities in a rail station: present and future surrounding land use and development; location of activity centres; surrounding traffic characteristics; and socio-demographic characteristics of travellers within the catchment area. AM peak period behaviour is different from PM peak given that dwell times are longer in the PM peak because of more unpredictable pick-up times. In addition, the need for dedicated or shared KnR bays for people with disabilities should be estimated based on local characteristics and should satisfy disability guides and standards (DDA, DSAPT, and/or AS). Provision for taxi drop-off/pick-up should also be considered where demand exists. If analysis of future demand factors suggests increased patronage, future expansion should be taken into consideration with regard to the design of the KnR facility. Where space is constrained, other traffic management strategies may be explored.
Key Reference Documents: (Kittelson and Associates et al. 2012), TCRP Report 153: Guidelines for Providing Access to Public Transportation Stations Chapter 10 (TransLink 2012), TransLink Public Transport Infrastructure Manual Section 4.5
Guidance KD2: KnR catchment area definition.
Improving Rail Station Access in Australia
CRC for Rail Innovation August 2013 Page 55
KnR demand catchment areas are very much similar to PnR catchment and its definition will be deferred to the PnR section of this document.
Guidance KD3: Methods for estimating KnR demand. More often than not, KnR needs identification and is included in the PnR demand forecasting methodology because of the similarity in demographics of KnR and PnR users. Furthermore, both KnR and PnR have the mutual effect of reducing central area trips by car. Thus, the methodologies for estimating PnR demands can also be adapted for KnR estimation (see demand estimation methodologies for PnR). Taxi demands can also be estimated using similar methods.
Key Reference Documents: (LTSA-NZ 2004), Land Transport Safety Authority New Zealand, Park-and-ride: Characteristics and demand forecasting Research Report 328 (TransLink 2012), TransLink Public Transport Infrastructure Manual Section 4.5
5.4.3 Arrival Zone Principles Principles essential for KnR access within the arrival zone are discussed in this section. These include principles for locating and sizing KnR facilities, together with way-finding information.
Principle KA1: Locate KnR facilities to minimise both passenger walking distance and conflict with other traffic.
Passenger drop-offs and pick-ups should be located to avoid conflicts with bus, auto, and pedestrian movements in the station area. Dedicated KnR areas are to be provided at stations to reduce illegal or disruptive KnR activity. These areas should be located to promote safe and convenient movement (of both vehicles and passengers) by providing direct connections and minimising intermodal conflict.
1) Minimising conflict with other modes • Identify vehicle flows into and out of station area for KnR facilities considerations. • Passenger drop-offs and their through lanes should be segregated (where possible) from other
traffic. • KnR and PnR may use the same access roads as long as adequate functionality is maintained. • KnR drivers should be able to stop without impeding through traffic flow by car stacking, as
shown in Figure 26. • Kerbside drop-off should be located on the left side of the road to alight passengers directly on
the kerb, away from through traffic. • Good visibility for through traffic should be provided to minimise conflicts with re-joining cars
after dropping off their passengers. • A parallel drop-off configuration should be considered to avoid increased vehicle-pedestrian
conflicts as a result of cars reversing to return to the main traffic. • Roads leading to the drop-off area should be single lane with a minimum width that allows
another vehicle space to manoeuvre around stopped vehicles.
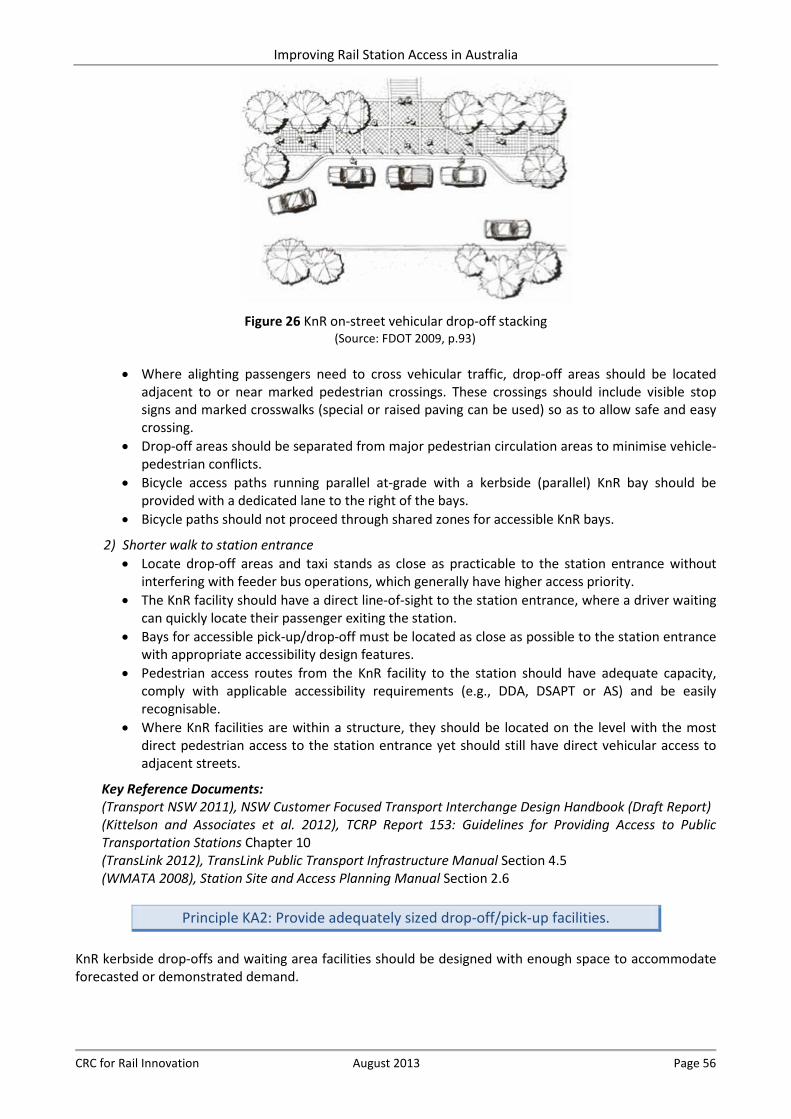
Improving Rail Station Access in Australia
CRC for Rail Innovation August 2013 Page 56
Figure 26 KnR on-street vehicular drop-off stacking
(Source: FDOT 2009, p.93)
• Where alighting passengers need to cross vehicular traffic, drop-off areas should be located adjacent to or near marked pedestrian crossings. These crossings should include visible stop signs and marked crosswalks (special or raised paving can be used) so as to allow safe and easy crossing.
• Drop-off areas should be separated from major pedestrian circulation areas to minimise vehicle-pedestrian conflicts.
• Bicycle access paths running parallel at-grade with a kerbside (parallel) KnR bay should be provided with a dedicated lane to the right of the bays.
• Bicycle paths should not proceed through shared zones for accessible KnR bays.
2) Shorter walk to station entrance • Locate drop-off areas and taxi stands as close as practicable to the station entrance without
interfering with feeder bus operations, which generally have higher access priority. • The KnR facility should have a direct line-of-sight to the station entrance, where a driver waiting
can quickly locate their passenger exiting the station. • Bays for accessible pick-up/drop-off must be located as close as possible to the station entrance
with appropriate accessibility design features. • Pedestrian access routes from the KnR facility to the station should have adequate capacity,
comply with applicable accessibility requirements (e.g., DDA, DSAPT or AS) and be easily recognisable.
• Where KnR facilities are within a structure, they should be located on the level with the most direct pedestrian access to the station entrance yet should still have direct vehicular access to adjacent streets.
Key Reference Documents: (Transport NSW 2011), NSW Customer Focused Transport Interchange Design Handbook (Draft Report) (Kittelson and Associates et al. 2012), TCRP Report 153: Guidelines for Providing Access to Public Transportation Stations Chapter 10 (TransLink 2012), TransLink Public Transport Infrastructure Manual Section 4.5 (WMATA 2008), Station Site and Access Planning Manual Section 2.6
Principle KA2: Provide adequately sized drop-off/pick-up facilities.
KnR kerbside drop-offs and waiting area facilities should be designed with enough space to accommodate forecasted or demonstrated demand.
Improving Rail Station Access in Australia
CRC for Rail Innovation August 2013 Page 57
1) Sufficient kerbside space • KnR bays should meet appropriate Australian Standards including accessibility requirements for
people with disabilities (DDA, DSAPT, etc.). • KnR drop-off points should have lay backs in kerbing for persons with disabilities to access
paving at kerbside with sufficient landing area to allow for manoeuvring space. • Kerb space needs should be governed by afternoon peak demands as cars generally need more
time and space to wait for passengers to arrive. • Dedicated taxi ranks should be provided where demand exists and there is likely to be conflict
between taxi and general KnR demand. • Taxi stands should be highly visible from the station entrance.
2) Appropriate waiting area facilities. • The waiting area should be designed in a manner consistent with applicable agency station
design guidelines and should have sufficient lighting, seating, weather protection, means of communication (e.g., pay phones) and other amenities.
• Other amenities include: security camera infrastructure, rubbish bins, drinking fountains, advertising, vending machines, etc.
• Pay phones within the waiting area or a taxi call point (for dedicated taxi ranks) should be provided for the purpose of communicating pick-up arrangements. Regardless of the widespread use of personal mobile devices, it is still necessary to provide communication facilities for passengers without mobile devices.
Key Reference Documents: (Transport NSW 2011), NSW Customer Focused Transport Interchange Design Handbook (Draft Report) (Kittelson and Associates et al. 2012), TCRP Report 153: Guidelines for Providing Access to Public Transportation Stations Chapter 10 (TransLink 2012), TransLink Public Transport Infrastructure Manual Section 4.5 (WMATA 2008), Station Site and Access Planning Manual Section 2.6
Principle KA3: Provide way-finding signage and information towards and within
KnR facilities for both drivers and passengers.
• Providing sufficient but minimal way-finding information for KnR users helps pick-up/drop-off activities to proceed comfortably and in an orderly manner.
• Signage and way-finding towards the KnR drop-off should be designed with the vehicle driver in mind.
• All information relevant to the use of a KnR needs to be imparted on the approaching roadway. • A one-way traffic flow that allows for recirculation within the facility is preferred over a two-way
flow. • Dropped-off passengers should be able to conveniently locate the station entrance from the drop-
off area; if not, directional signage should be provided. • Real-time information about the connecting transit service should also be provided at the drop-off
area (where possible). • Vehicles waiting to pick-up passengers should be conveniently located so that drivers can see
passengers exiting the station. • Passengers exiting the station should be able to locate the pick-up area with ease.
Key Reference Documents: (Transport NSW 2011), NSW Customer Focused Transport Interchange Design Handbook (Draft Report) (Kittelson and Associates et al. 2012), TCRP Report 153: Guidelines for Providing Access to Public Transportation Stations Chapter 10 (TransLink 2012), TransLink Public Transport Infrastructure Manual Section 4.5
Improving Rail Station Access in Australia
CRC for Rail Innovation August 2013 Page 58
5.4.4 Catchment Zone Principles
Principle KC1: Work with local jurisdictions and road transport authorities to provide information about KnR facilities.
Rail transit agencies should work closely with local governments and road transport authorities in improving routes towards KnR facilities. KnR drop-off areas near stations that are difficult to access and with poor visibility can exhibit reduced patronage compared with facilities that have convenient and visible access. The rail agency should be proactive in collaborating with local jurisdictions so as to make sure that KnR access is publicised.
• A review of off-site directional signage-needs related to KnR in cooperation with local jurisdictions and road transport agencies should be undertaken.
• Consultation with KnR users regarding the quality and extent of these directional signage provisions should also be carried out.
• Landmarks should be used as reference points to help unfamiliar KnR drivers towards drop-off areas.
TransLink’s PTIM (2012) identifies the following considerations when integrating KnR with the broader transport network: direct access to/from arterial roads is preferred; local street drop-off areas should be avoided (wherever possible); KnR should be accommodated within a formal KnR facility; on-street KnR is preferred for low flows (KnR demand and passing vehicles) while off-street is preferred for high flows; sufficient footpath width is required to avoid vehicle-pedestrian conflict; and conflict with bicycle flows must be minimised.
Key Reference Documents: (Transport NSW 2011), NSW Customer Focused Transport Interchange Design Handbook (Draft Report) (TransLink 2012), TransLink Public Transport Infrastructure Manual Section 4.5
5.5 Park-and-Ride (PnR) Access PnR facilities within or near transit stations provide points of transfer for passengers with cars to access and transfer onto rail for the rest of their trip. PnR access enables the expansion of the catchment to areas beyond the walking and cycling catchments and where feeder bus services are nonexistent. Rail transit PnR facilities are primarily focused on stations where the tributary area is characterized by low population densities that could not economically support a feeder bus service. These are typically exclusive facilities designed, constructed and operated as an integral part of the overall system and feature stations, passenger waiting areas, and often other amenities (Turnbull et al. 2004). PnR is also generally provided to shift parking demand from central areas, extend the reach of terminal stations, provide station access for widely-spaced stations, and remove motorists from congested corridors (Kittelson and Associates et al. 2012). On arrival, commuters want to park as quickly as possible (if there is still space available) and gain access to the station as directly as possible in order to board their desired train service. Ensuring that PnR access and egress is direct and with minimal complexity is essential with respect to reducing total travel time. PnR commuters require secure, safe parking with a preferred walking distance of less than 400 metres (Transport NSW 2011). When demand exceeds parking capacity, PnR users may have to walk much further from other formal (e.g., private parking lots and infrastructures, parking at shopping centres located near stations, etc.) and informal (parking on local roads) parking. Car movements should be configured so as to avoid conflict with movements by pedestrians and other access modes. The TCQSM (Kittelson and Associates et al. 2003) suggests that key characteristics for a successful PnR facility near a station include: located at least 7 to 10 km (preferably 16 km) from a major destination, frequent transit service, visibility of PnR from surrounding arterials, convenient access to PnR, and round-
Improving Rail Station Access in Australia
CRC for Rail Innovation August 2013 Page 59
trip transit fare (including parking) is typically less than car parking cost at destination. If most of the preceding conditions are met, the PnR facility will be well patronised. The following summarises important demand analysis guidance followed by principles and requirements essential for enhancing PnR access within the context of the arrival zone and catchment zone:
Demand Analysis Guidance21: PD1: Factors affecting PnR access. PD2: PnR catchment area definition. PD3: Methods for PnR demand estimation. PD4: Measuring PnR access.
Arrival Zone Principles22: PA1: Minimise PnR conflict with other traffic. PA2: Provide adequately sized and secure PnR facilities. PA3: Provide clear way-finding signage and information towards and within PnR facilities. PA4: Provide safe walk paths to and from PnR facilities.
Catchment Zone Principles23: PC1: Work with local jurisdiction and road transport authorities to provide routes that are direct and
safe towards the PnR facility.
5.5.1 General Considerations Despite PnR access being generally ranked below all other modes (in the access hierarchy), it is regarded as an important access mode that should be accommodated where required. The availability of PnR facilities enables car users to switch to public transport, at least for the remainder of their journey into the city or town centre. PnR takes advantage of the characteristics of both car and public transport combined with an efficient and effective parking facility to replace the car-only travel. Parking facilities are linked to the CBD with an efficient rail transit service. For PnR to be viable, the overall time and cost of the PnR journey must be perceived as being less than a car-only journey. Austroads Guide to Traffic Management Part 11: Parking (2008c) identifies that the following conditions need to be in place for PnR to be viable: high parking costs in the central areas; a fast, reliable and frequent public transport service (e.g., rail and BRT); a competitive fare for the PnR journey; secure PnR facilities located within a short walking distance to the station; and congested road conditions along routes leading to the central area. In summary, ’the basic requirement for success is that access to the CBD via PnR needs to be competitive with the use of the car for the whole trip in terms of perceived generalised costs’ (Vincent 2007, p.41). BART (2003) summarises four key design features that should generally be considered for PnR facilities: ability to find a parking space; moderate travel time approaching station; safety and security (driving to station and parking, from car parking to station entrance, and parked car is secure); and convenient walk to the station entrance. Satisfactorily providing the preceding PnR access design features may mean the success or failure of the PnR facility. 5.5.2 Demand Analysis Guidance
Guidance PD1: Factors affecting PnR access. The amount of parking space required at any given location depends on its traffic potentials, street system capabilities, compatibility with adjacent land use and the location of reasonably priced land. The Transit Capacity and Quality of Service Manual (TCQSM) describes key characteristics of PnR users as: choice riders, have significantly higher incomes than local bus riders, majority (more than 60%) travelled to the CBD for
21 Referred to as PnR-Demand analysis (TPDC-NSW) 22 Referred to as PnR-Arrival (PA) zone 23 Referred to as PnR-Catchment (WAPC) zone
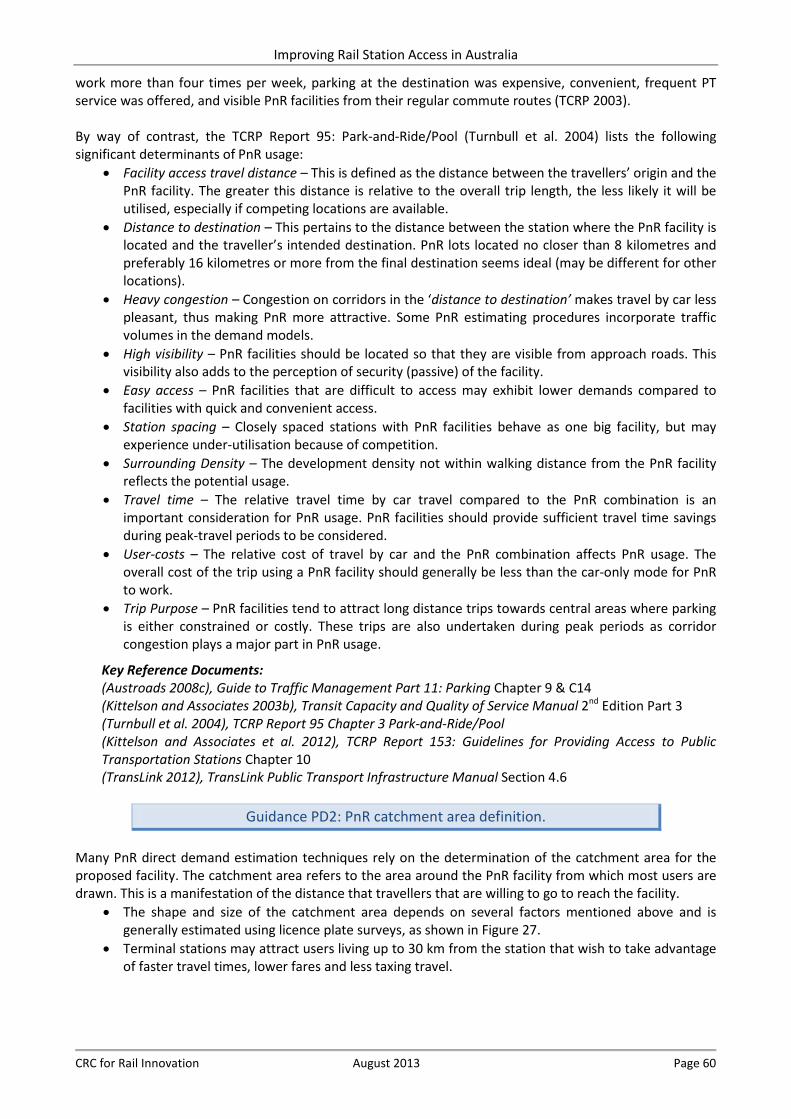
Improving Rail Station Access in Australia
CRC for Rail Innovation August 2013 Page 60
work more than four times per week, parking at the destination was expensive, convenient, frequent PT service was offered, and visible PnR facilities from their regular commute routes (TCRP 2003). By way of contrast, the TCRP Report 95: Park-and-Ride/Pool (Turnbull et al. 2004) lists the following significant determinants of PnR usage:
• Facility access travel distance – This is defined as the distance between the travellers’ origin and the PnR facility. The greater this distance is relative to the overall trip length, the less likely it will be utilised, especially if competing locations are available.
• Distance to destination – This pertains to the distance between the station where the PnR facility is located and the traveller’s intended destination. PnR lots located no closer than 8 kilometres and preferably 16 kilometres or more from the final destination seems ideal (may be different for other locations).
• Heavy congestion – Congestion on corridors in the ‘distance to destination’ makes travel by car less pleasant, thus making PnR more attractive. Some PnR estimating procedures incorporate traffic volumes in the demand models.
• High visibility – PnR facilities should be located so that they are visible from approach roads. This visibility also adds to the perception of security (passive) of the facility.
• Easy access – PnR facilities that are difficult to access may exhibit lower demands compared to facilities with quick and convenient access.
• Station spacing – Closely spaced stations with PnR facilities behave as one big facility, but may experience under-utilisation because of competition.
• Surrounding Density – The development density not within walking distance from the PnR facility reflects the potential usage.
• Travel time – The relative travel time by car travel compared to the PnR combination is an important consideration for PnR usage. PnR facilities should provide sufficient travel time savings during peak-travel periods to be considered.
• User-costs – The relative cost of travel by car and the PnR combination affects PnR usage. The overall cost of the trip using a PnR facility should generally be less than the car-only mode for PnR to work.
• Trip Purpose – PnR facilities tend to attract long distance trips towards central areas where parking is either constrained or costly. These trips are also undertaken during peak periods as corridor congestion plays a major part in PnR usage.
Key Reference Documents: (Austroads 2008c), Guide to Traffic Management Part 11: Parking Chapter 9 & C14 (Kittelson and Associates 2003b), Transit Capacity and Quality of Service Manual 2nd Edition Part 3 (Turnbull et al. 2004), TCRP Report 95 Chapter 3 Park-and-Ride/Pool (Kittelson and Associates et al. 2012), TCRP Report 153: Guidelines for Providing Access to Public Transportation Stations Chapter 10 (TransLink 2012), TransLink Public Transport Infrastructure Manual Section 4.6
Guidance PD2: PnR catchment area definition.
Many PnR direct demand estimation techniques rely on the determination of the catchment area for the proposed facility. The catchment area refers to the area around the PnR facility from which most users are drawn. This is a manifestation of the distance that travellers that are willing to go to reach the facility.
• The shape and size of the catchment area depends on several factors mentioned above and is generally estimated using licence plate surveys, as shown in Figure 27.
• Terminal stations may attract users living up to 30 km from the station that wish to take advantage of faster travel times, lower fares and less taxing travel.
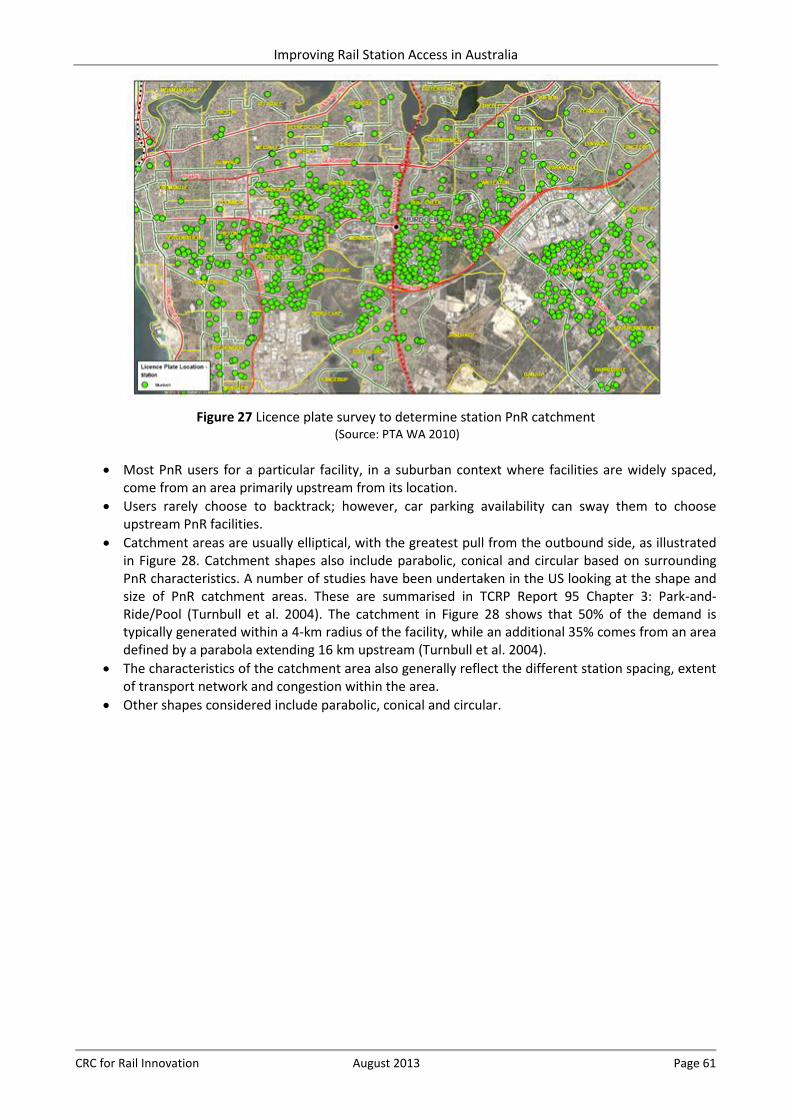
Improving Rail Station Access in Australia
CRC for Rail Innovation August 2013 Page 61
Figure 27 Licence plate survey to determine station PnR catchment
(Source: PTA WA 2010)
• Most PnR users for a particular facility, in a suburban context where facilities are widely spaced, come from an area primarily upstream from its location.
• Users rarely choose to backtrack; however, car parking availability can sway them to choose upstream PnR facilities.
• Catchment areas are usually elliptical, with the greatest pull from the outbound side, as illustrated in Figure 28. Catchment shapes also include parabolic, conical and circular based on surrounding PnR characteristics. A number of studies have been undertaken in the US looking at the shape and size of PnR catchment areas. These are summarised in TCRP Report 95 Chapter 3: Park-and-Ride/Pool (Turnbull et al. 2004). The catchment in Figure 28 shows that 50% of the demand is typically generated within a 4-km radius of the facility, while an additional 35% comes from an area defined by a parabola extending 16 km upstream (Turnbull et al. 2004).
• The characteristics of the catchment area also generally reflect the different station spacing, extent of transport network and congestion within the area.
• Other shapes considered include parabolic, conical and circular.
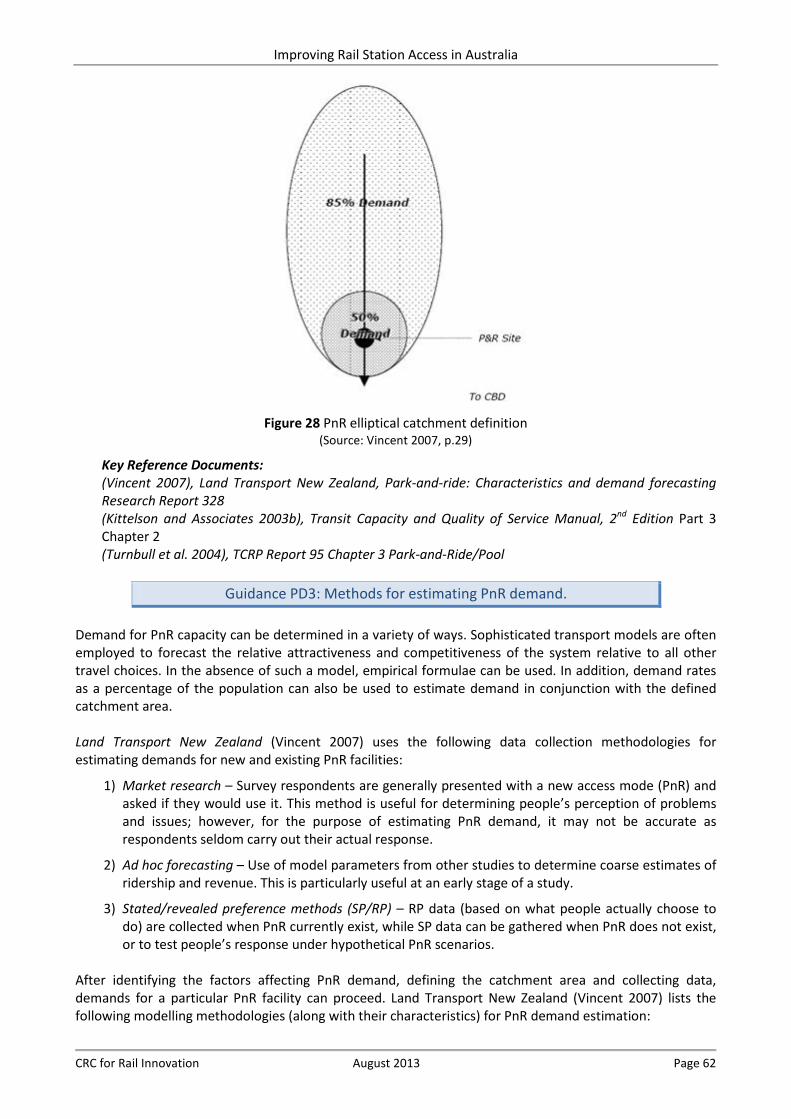
Improving Rail Station Access in Australia
CRC for Rail Innovation August 2013 Page 62
Figure 28 PnR elliptical catchment definition
(Source: Vincent 2007, p.29)
Key Reference Documents: (Vincent 2007), Land Transport New Zealand, Park-and-ride: Characteristics and demand forecasting Research Report 328 (Kittelson and Associates 2003b), Transit Capacity and Quality of Service Manual, 2nd Edition Part 3 Chapter 2 (Turnbull et al. 2004), TCRP Report 95 Chapter 3 Park-and-Ride/Pool
Guidance PD3: Methods for estimating PnR demand.
Demand for PnR capacity can be determined in a variety of ways. Sophisticated transport models are often employed to forecast the relative attractiveness and competitiveness of the system relative to all other travel choices. In the absence of such a model, empirical formulae can be used. In addition, demand rates as a percentage of the population can also be used to estimate demand in conjunction with the defined catchment area. Land Transport New Zealand (Vincent 2007) uses the following data collection methodologies for estimating demands for new and existing PnR facilities:
1) Market research – Survey respondents are generally presented with a new access mode (PnR) and asked if they would use it. This method is useful for determining people’s perception of problems and issues; however, for the purpose of estimating PnR demand, it may not be accurate as respondents seldom carry out their actual response.
2) Ad hoc forecasting – Use of model parameters from other studies to determine coarse estimates of ridership and revenue. This is particularly useful at an early stage of a study.
3) Stated/revealed preference methods (SP/RP) – RP data (based on what people actually choose to do) are collected when PnR currently exist, while SP data can be gathered when PnR does not exist, or to test people’s response under hypothetical PnR scenarios.
After identifying the factors affecting PnR demand, defining the catchment area and collecting data, demands for a particular PnR facility can proceed. Land Transport New Zealand (Vincent 2007) lists the following modelling methodologies (along with their characteristics) for PnR demand estimation:
Improving Rail Station Access in Australia
CRC for Rail Innovation August 2013 Page 63
1) Regional-modelling • Multi-modal model with PnR as one of the modes. • Uses relative costs (car and public transport) within a multi-model context. • Responsive to changes in cost attributes of transport but do not include more local (and
perceived) factors such as safety and local accessibility. • Parameters for these models rely on SP or RP data.
2) Site-specific models • PnR usage as a function of local site characteristics and facilities (catchment size and
characteristics, transport costs). • Do not require detailed transport modelling and site-choice modelling is usually not included. • Ignore other modes. • Can give better estimates for individual sites because more local site characteristics can be
included. • Cannot estimate the impact of other sites nearby.
3) Post modelling • Simplest approach and may give reasonable and approximate figures. • Easy to implement, but ignores implicit changes in transport supply and station/site choice. • In order to give an indication of car versus PT users, it must be used in conjunction with a multi-
modal transport model or observed travel mode split data. • Adjustment factors are applied to PT users to estimate the proportion of PnR users based on
international experience or observed data where available. • Relies on the experience of the modeller.
By way of contrast, TCRP Report 153 (TCRP 2012) recommends the following methods to estimate demand:
1) Similar conditions (within a given urban area or in other areas) study. 2) Targeted survey (RP or SP) of residents within the estimated PnR catchment area of a station. 3) Using observed relationships (rates) between boardings and corresponding PnR users. 4) Using a dedicated station access model.
Key Reference Documents: (Austroads 2008c), Guide to Traffic Management Part 11: Parking Appendix C14 (Vincent 2007), Land Transport New Zealand, Park-and-ride: Characteristics and demand forecasting Research Report 328 (Turnbull et al. 2004), TCRP Report 95 Chapter 3 Park-and-Ride/Pool (Kittelson and Associates et al. 2012), TCRP Report 153: Guidelines for Providing Access to Public Transportation Stations Chapter 10 (TransLink 2012), TransLink Public Transport Infrastructure Manual Section 4.6
Guidance PD4: Measuring PnR access.
The percentage of PnR lot spaces filled gives an indication of utilisation to assess demand with respect to capacity throughout the day. The required number of PnR spaces at a transit station typically involves identifying the demand, and relating it to the ability to physically provide such a facility within cost constraints. Parking spaces in PnR facilities typically have a low turnover during the day, as most persons parking at transit stations are commuters who are elsewhere most of the day. In larger urban areas, the regional transportation model will have a mode split component which will help identify PnR demand at transit station locations. This information is particularly applicable for new rail line development. Where the regional model does not have the level of sophistication to provide such demand estimates, then PnR demand estimation through user surveys and an assessment of the ridership sheds for different station areas would be appropriate (Kittelson and Associates 2003a).
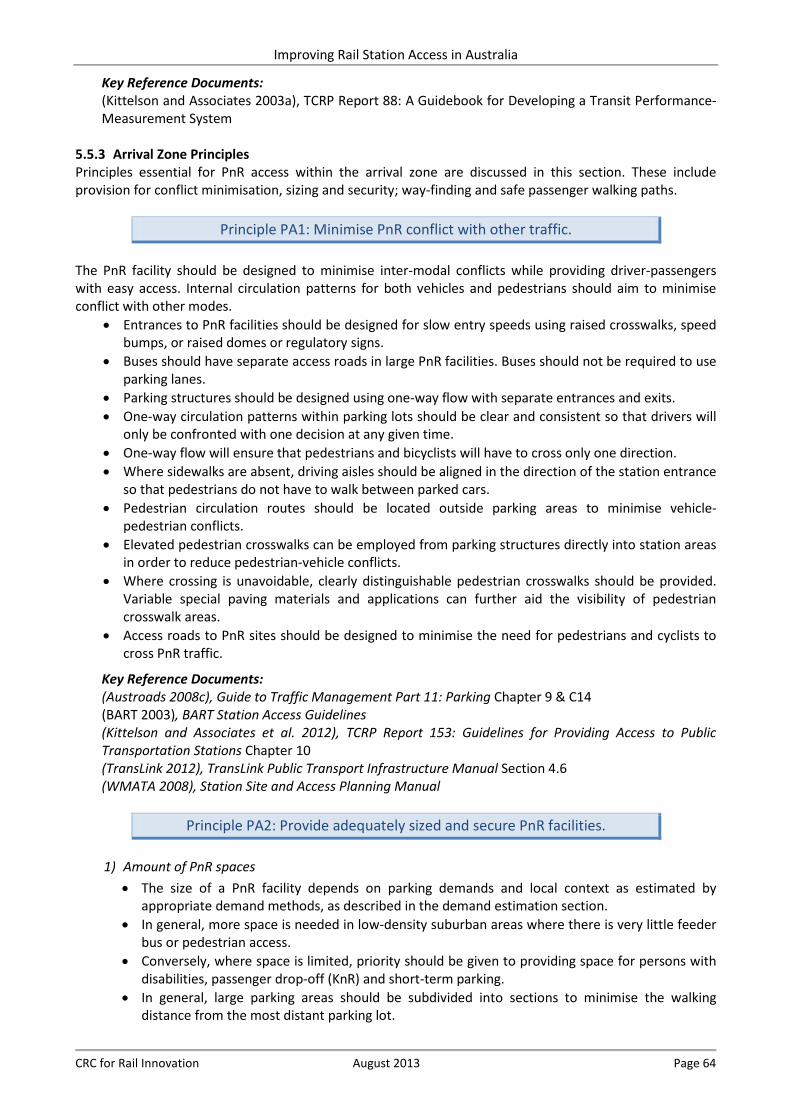
Improving Rail Station Access in Australia
CRC for Rail Innovation August 2013 Page 64
Key Reference Documents: (Kittelson and Associates 2003a), TCRP Report 88: A Guidebook for Developing a Transit Performance-Measurement System
5.5.3 Arrival Zone Principles Principles essential for PnR access within the arrival zone are discussed in this section. These include provision for conflict minimisation, sizing and security; way-finding and safe passenger walking paths.
Principle PA1: Minimise PnR conflict with other traffic. The PnR facility should be designed to minimise inter-modal conflicts while providing driver-passengers with easy access. Internal circulation patterns for both vehicles and pedestrians should aim to minimise conflict with other modes.
• Entrances to PnR facilities should be designed for slow entry speeds using raised crosswalks, speed bumps, or raised domes or regulatory signs.
• Buses should have separate access roads in large PnR facilities. Buses should not be required to use parking lanes.
• Parking structures should be designed using one-way flow with separate entrances and exits. • One-way circulation patterns within parking lots should be clear and consistent so that drivers will
only be confronted with one decision at any given time. • One-way flow will ensure that pedestrians and bicyclists will have to cross only one direction. • Where sidewalks are absent, driving aisles should be aligned in the direction of the station entrance
so that pedestrians do not have to walk between parked cars. • Pedestrian circulation routes should be located outside parking areas to minimise vehicle-
pedestrian conflicts. • Elevated pedestrian crosswalks can be employed from parking structures directly into station areas
in order to reduce pedestrian-vehicle conflicts. • Where crossing is unavoidable, clearly distinguishable pedestrian crosswalks should be provided.
Variable special paving materials and applications can further aid the visibility of pedestrian crosswalk areas.
• Access roads to PnR sites should be designed to minimise the need for pedestrians and cyclists to cross PnR traffic.
Key Reference Documents: (Austroads 2008c), Guide to Traffic Management Part 11: Parking Chapter 9 & C14 (BART 2003), BART Station Access Guidelines (Kittelson and Associates et al. 2012), TCRP Report 153: Guidelines for Providing Access to Public Transportation Stations Chapter 10 (TransLink 2012), TransLink Public Transport Infrastructure Manual Section 4.6 (WMATA 2008), Station Site and Access Planning Manual
Principle PA2: Provide adequately sized and secure PnR facilities.
1) Amount of PnR spaces
• The size of a PnR facility depends on parking demands and local context as estimated by appropriate demand methods, as described in the demand estimation section.
• In general, more space is needed in low-density suburban areas where there is very little feeder bus or pedestrian access.
• Conversely, where space is limited, priority should be given to providing space for persons with disabilities, passenger drop-off (KnR) and short-term parking.
• In general, large parking areas should be subdivided into sections to minimise the walking distance from the most distant parking lot.
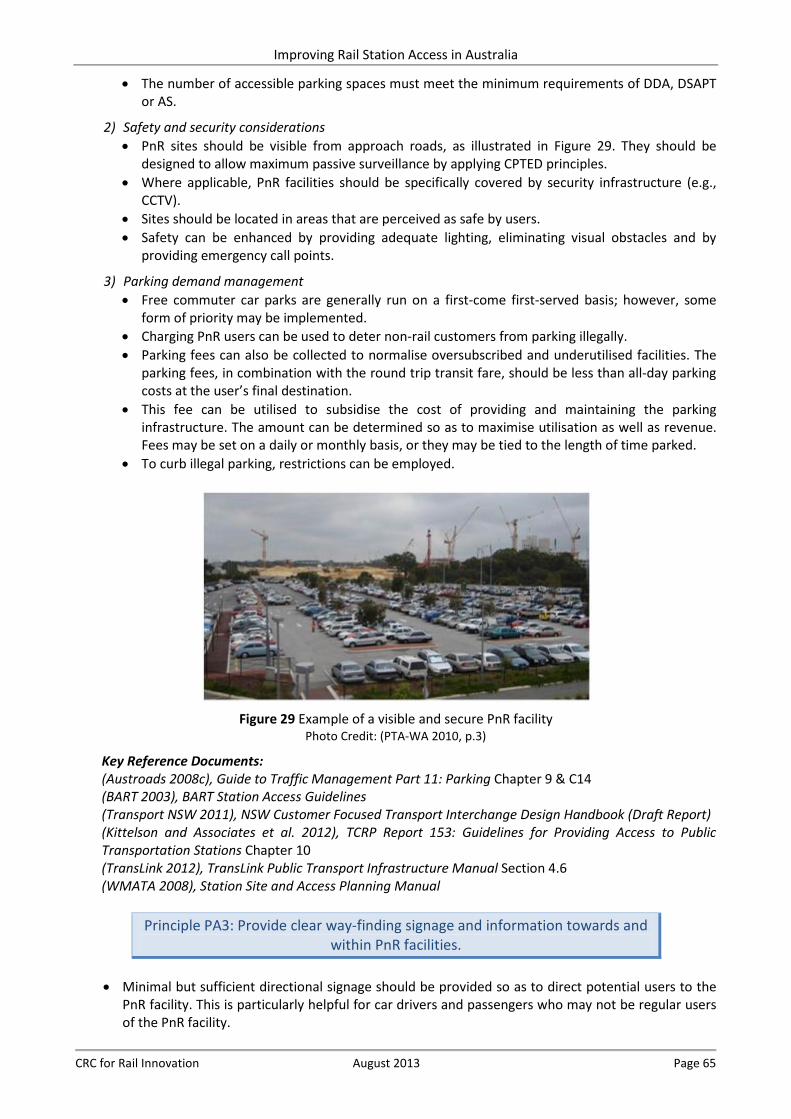
Improving Rail Station Access in Australia
CRC for Rail Innovation August 2013 Page 65
• The number of accessible parking spaces must meet the minimum requirements of DDA, DSAPT or AS.
2) Safety and security considerations • PnR sites should be visible from approach roads, as illustrated in Figure 29. They should be
designed to allow maximum passive surveillance by applying CPTED principles. • Where applicable, PnR facilities should be specifically covered by security infrastructure (e.g.,
CCTV). • Sites should be located in areas that are perceived as safe by users. • Safety can be enhanced by providing adequate lighting, eliminating visual obstacles and by
providing emergency call points.
3) Parking demand management • Free commuter car parks are generally run on a first-come first-served basis; however, some
form of priority may be implemented. • Charging PnR users can be used to deter non-rail customers from parking illegally. • Parking fees can also be collected to normalise oversubscribed and underutilised facilities. The
parking fees, in combination with the round trip transit fare, should be less than all-day parking costs at the user’s final destination.
• This fee can be utilised to subsidise the cost of providing and maintaining the parking infrastructure. The amount can be determined so as to maximise utilisation as well as revenue. Fees may be set on a daily or monthly basis, or they may be tied to the length of time parked.
• To curb illegal parking, restrictions can be employed.
Figure 29 Example of a visible and secure PnR facility
Photo Credit: (PTA-WA 2010, p.3)
Key Reference Documents: (Austroads 2008c), Guide to Traffic Management Part 11: Parking Chapter 9 & C14 (BART 2003), BART Station Access Guidelines (Transport NSW 2011), NSW Customer Focused Transport Interchange Design Handbook (Draft Report) (Kittelson and Associates et al. 2012), TCRP Report 153: Guidelines for Providing Access to Public Transportation Stations Chapter 10 (TransLink 2012), TransLink Public Transport Infrastructure Manual Section 4.6 (WMATA 2008), Station Site and Access Planning Manual
Principle PA3: Provide clear way-finding signage and information towards and
within PnR facilities.
• Minimal but sufficient directional signage should be provided so as to direct potential users to the PnR facility. This is particularly helpful for car drivers and passengers who may not be regular users of the PnR facility.
Improving Rail Station Access in Australia
CRC for Rail Innovation August 2013 Page 66
• Internal signage should delineate commuter parking, passenger drop-off and pick-up areas and bus passenger loading areas.
• Additional regulatory signs should be provided to control traffic flow, particularly at pedestrian/bicycle/vehicle conflict points, and at parking entrances.
• Information about the next rail service can also be provided at strategic locations within the PnR facility.
Key Reference Documents: (Austroads 2008c), Guide to Traffic Management Part 11: Parking Chapter 9 & C14 (TransLink 2012), TransLink Public Transport Infrastructure Manual Section 4.6 (WMATA 2008), Station Site and Access Planning Manual
Principle PA4: Provide safe walk paths to and from PnR facilities.
PnR facilities should be located within easy walking distance of the station entrance. The generally accepted walking distance from the station entrance to the most distant parking space in a PnR facility is 450 m (some guides use 400 m). This is measured along the actual pedestrian route of travel. Walking distances in excess of this threshold can be tolerated, especially when users employ informal parking facilities. The following key elements contribute to providing safe and direct connections to and from the PnR facility.
• Pedestrian pathways through the parking lots should be indicated with sidewalks, trees, and/or surface markings.
• Pathway widths should be sufficient, especially on shared access paths. • Physical barriers (e.g., fences, bollards) should be minimised except where path corridor width is
constrained. • DDA-accessible parking in the PnR areas should be located closest to the entrance and should
ensure that users do not have to walk or ride behind parked cars. • An accessible path towards the entrance should be provided for persons with disabilities. • Sufficient lighting that meets applicable standards for public transport and parking facilities should
be provided at all pedestrian areas and walkways.
Key Reference Documents: (BART 2003), BART Station Access Guidelines (Kittelson and Associates et al. 2012), TCRP Report 153: Guidelines for Providing Access to Public Transportation Stations Chapter 10 (TransLink 2012), TransLink Public Transport Infrastructure Manual Section 4.6 (WMATA 2008), Station Site and Access Planning Manual
5.5.4 Catchment Zone Principles
Principle PC1: Work with local jurisdiction and road transport authorities to provide routes that are direct and safe towards the PnR facility.
Rail agencies should work closely with local jurisdiction and road transport authorities to improve access to rail station PnR facilities. Where PnR demands exceed capacity, informal parking lots and local street parking can be explored in collaboration with local jurisdiction and road transport authorities. Conversely, parking restrictions should be employed in order to curb illegal parking. The following considerations can also be areas of collaboration between key stakeholders beyond the jurisdiction of the rail agency, as suggested by TCRP (2012):
• Ramps and roadways leading to PnR facilities from major commuter routes should avoid excessive interruptions (from traffic signals, kerb parking interferences, or frequent commercial kerb cuts). Grade-separation may be desirable in major parking facilities.
Improving Rail Station Access in Australia
CRC for Rail Innovation August 2013 Page 67
• It may be more convenient to locate PnR lots on the left side to eliminate the need for right-turn entering movements. Access from the opposite direction on a two-way arterial requires adequate right-turn storage to minimise through traffic disruption.
• Entrances and exit locations to/from PnR facilities should avoid spillback from nearby interchanges or intersections. These entrances and exits should be located a good distance away from the latter locations.
• Directional and informational signs along major highway routes leading to the PnR facility should make it easy to reach.
Key Reference Documents: (Austroads 2008c), Guide to Traffic Management Part 11: Parking Chapter 9 & C14 (Kittelson and Associates et al. 2012), TCRP Report 153: Guidelines for Providing Access to Public Transportation Stations Chapter 10 (TransLink 2012), TransLink Public Transport Infrastructure Manual Section 4.6
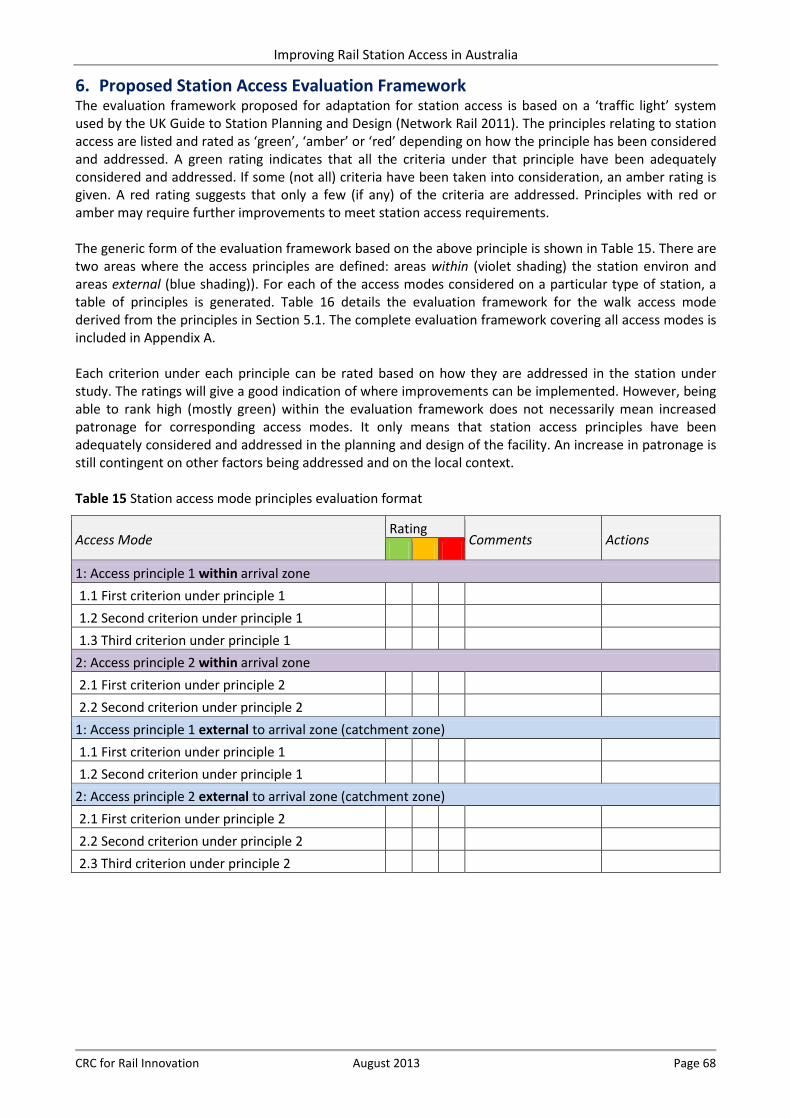
Improving Rail Station Access in Australia
CRC for Rail Innovation August 2013 Page 68
6. Proposed Station Access Evaluation Framework The evaluation framework proposed for adaptation for station access is based on a ‘traffic light’ system used by the UK Guide to Station Planning and Design (Network Rail 2011). The principles relating to station access are listed and rated as ‘green’, ‘amber’ or ‘red’ depending on how the principle has been considered and addressed. A green rating indicates that all the criteria under that principle have been adequately considered and addressed. If some (not all) criteria have been taken into consideration, an amber rating is given. A red rating suggests that only a few (if any) of the criteria are addressed. Principles with red or amber may require further improvements to meet station access requirements. The generic form of the evaluation framework based on the above principle is shown in Table 15. There are two areas where the access principles are defined: areas within (violet shading) the station environ and areas external (blue shading)). For each of the access modes considered on a particular type of station, a table of principles is generated. Table 16 details the evaluation framework for the walk access mode derived from the principles in Section 5.1. The complete evaluation framework covering all access modes is included in Appendix A. Each criterion under each principle can be rated based on how they are addressed in the station under study. The ratings will give a good indication of where improvements can be implemented. However, being able to rank high (mostly green) within the evaluation framework does not necessarily mean increased patronage for corresponding access modes. It only means that station access principles have been adequately considered and addressed in the planning and design of the facility. An increase in patronage is still contingent on other factors being addressed and on the local context. Table 15 Station access mode principles evaluation format
Access Mode Rating
Comments Actions
1: Access principle 1 within arrival zone 1.1 First criterion under principle 1 1.2 Second criterion under principle 1 1.3 Third criterion under principle 1
2: Access principle 2 within arrival zone 2.1 First criterion under principle 2 2.2 Second criterion under principle 2
1: Access principle 1 external to arrival zone (catchment zone) 1.1 First criterion under principle 1 1.2 Second criterion under principle 1
2: Access principle 2 external to arrival zone (catchment zone) 2.1 First criterion under principle 2 2.2 Second criterion under principle 2 2.3 Third criterion under principle 2
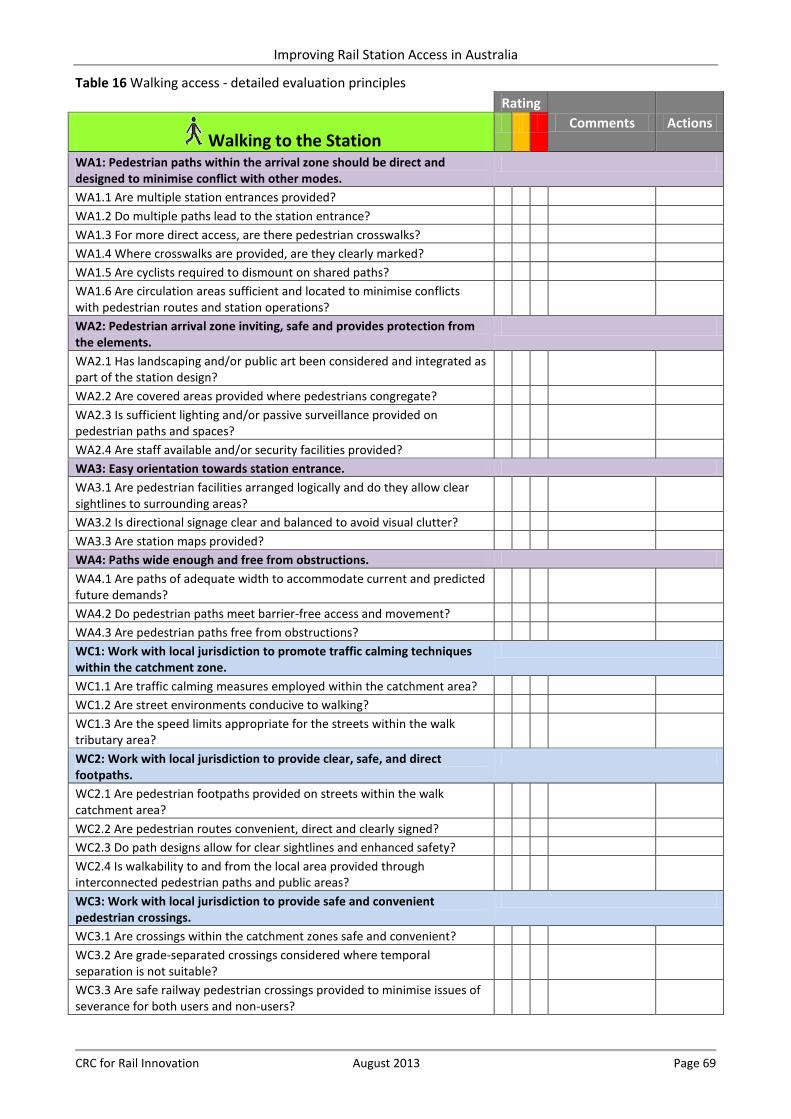
Improving Rail Station Access in Australia
CRC for Rail Innovation August 2013 Page 69
Table 16 Walking access - detailed evaluation principles Rating
Comments Actions Walking to the Station
WA1: Pedestrian paths within the arrival zone should be direct and designed to minimise conflict with other modes.
WA1.1 Are multiple station entrances provided?
WA1.2 Do multiple paths lead to the station entrance?
WA1.3 For more direct access, are there pedestrian crosswalks?
WA1.4 Where crosswalks are provided, are they clearly marked?
WA1.5 Are cyclists required to dismount on shared paths?
WA1.6 Are circulation areas sufficient and located to minimise conflicts with pedestrian routes and station operations?
WA2: Pedestrian arrival zone inviting, safe and provides protection from the elements.
WA2.1 Has landscaping and/or public art been considered and integrated as part of the station design?
WA2.2 Are covered areas provided where pedestrians congregate?
WA2.3 Is sufficient lighting and/or passive surveillance provided on pedestrian paths and spaces?
WA2.4 Are staff available and/or security facilities provided?
WA3: Easy orientation towards station entrance.
WA3.1 Are pedestrian facilities arranged logically and do they allow clear sightlines to surrounding areas?
WA3.2 Is directional signage clear and balanced to avoid visual clutter?
WA3.3 Are station maps provided?
WA4: Paths wide enough and free from obstructions.
WA4.1 Are paths of adequate width to accommodate current and predicted future demands?
WA4.2 Do pedestrian paths meet barrier-free access and movement?
WA4.3 Are pedestrian paths free from obstructions?
WC1: Work with local jurisdiction to promote traffic calming techniques within the catchment zone.
WC1.1 Are traffic calming measures employed within the catchment area?
WC1.2 Are street environments conducive to walking?
WC1.3 Are the speed limits appropriate for the streets within the walk tributary area?
WC2: Work with local jurisdiction to provide clear, safe, and direct footpaths.
WC2.1 Are pedestrian footpaths provided on streets within the walk catchment area?
WC2.2 Are pedestrian routes convenient, direct and clearly signed?
WC2.3 Do path designs allow for clear sightlines and enhanced safety?
WC2.4 Is walkability to and from the local area provided through interconnected pedestrian paths and public areas?
WC3: Work with local jurisdiction to provide safe and convenient pedestrian crossings.
WC3.1 Are crossings within the catchment zones safe and convenient?
WC3.2 Are grade-separated crossings considered where temporal separation is not suitable?
WC3.3 Are safe railway pedestrian crossings provided to minimise issues of severance for both users and non-users?
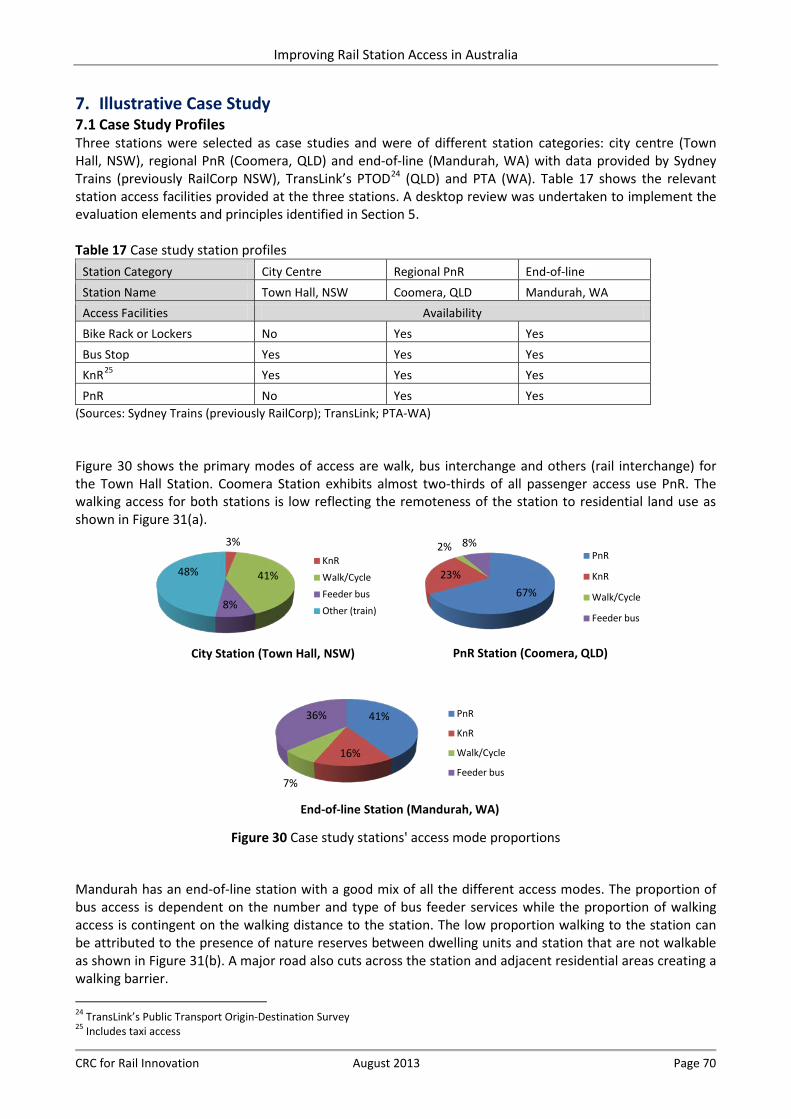
Improving Rail Station Access in Australia
CRC for Rail Innovation August 2013 Page 70
7. Illustrative Case Study 7.1 Case Study Profiles Three stations were selected as case studies and were of different station categories: city centre (Town Hall, NSW), regional PnR (Coomera, QLD) and end-of-line (Mandurah, WA) with data provided by Sydney Trains (previously RailCorp NSW), TransLink’s PTOD24 (QLD) and PTA (WA). Table 17 shows the relevant station access facilities provided at the three stations. A desktop review was undertaken to implement the evaluation elements and principles identified in Section 5. Table 17 Case study station profiles
Station Category City Centre Regional PnR End-of-line Station Name Town Hall, NSW Coomera, QLD Mandurah, WA Access Facilities Availability Bike Rack or Lockers No Yes Yes Bus Stop Yes Yes Yes KnR25 Yes Yes Yes PnR No Yes Yes
(Sources: Sydney Trains (previously RailCorp); TransLink; PTA-WA) Figure 30 shows the primary modes of access are walk, bus interchange and others (rail interchange) for the Town Hall Station. Coomera Station exhibits almost two-thirds of all passenger access use PnR. The walking access for both stations is low reflecting the remoteness of the station to residential land use as shown in Figure 31(a).
Figure 30 Case study stations' access mode proportions
Mandurah has an end-of-line station with a good mix of all the different access modes. The proportion of bus access is dependent on the number and type of bus feeder services while the proportion of walking access is contingent on the walking distance to the station. The low proportion walking to the station can be attributed to the presence of nature reserves between dwelling units and station that are not walkable as shown in Figure 31(b). A major road also cuts across the station and adjacent residential areas creating a walking barrier. 24 TransLink’s Public Transport Origin-Destination Survey 25 Includes taxi access
3%
41%
8%
48%
City Station (Town Hall, NSW)
KnR Walk/Cycle Feeder bus Other (train)
67% 23%
2% 8%
PnR Station (Coomera, QLD)
PnR
KnR
Walk/Cycle
Feeder bus
41%
16%
7%
36%
End-of-line Station (Mandurah, WA)
PnR
KnR
Walk/Cycle
Feeder bus
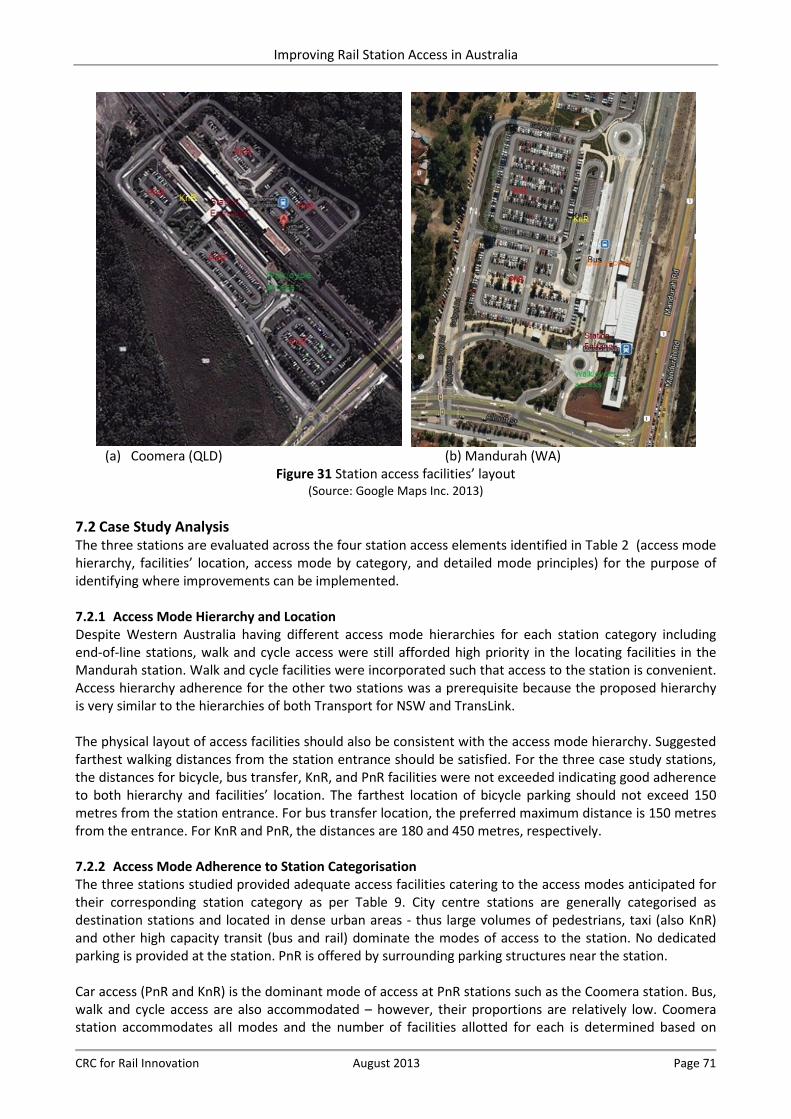
Improving Rail Station Access in Australia
CRC for Rail Innovation August 2013 Page 71
(a) Coomera (QLD) (b) Mandurah (WA)
Figure 31 Station access facilities’ layout (Source: Google Maps Inc. 2013)
7.2 Case Study Analysis The three stations are evaluated across the four station access elements identified in Table 2 (access mode hierarchy, facilities’ location, access mode by category, and detailed mode principles) for the purpose of identifying where improvements can be implemented. 7.2.1 Access Mode Hierarchy and Location Despite Western Australia having different access mode hierarchies for each station category including end-of-line stations, walk and cycle access were still afforded high priority in the locating facilities in the Mandurah station. Walk and cycle facilities were incorporated such that access to the station is convenient. Access hierarchy adherence for the other two stations was a prerequisite because the proposed hierarchy is very similar to the hierarchies of both Transport for NSW and TransLink. The physical layout of access facilities should also be consistent with the access mode hierarchy. Suggested farthest walking distances from the station entrance should be satisfied. For the three case study stations, the distances for bicycle, bus transfer, KnR, and PnR facilities were not exceeded indicating good adherence to both hierarchy and facilities’ location. The farthest location of bicycle parking should not exceed 150 metres from the station entrance. For bus transfer location, the preferred maximum distance is 150 metres from the entrance. For KnR and PnR, the distances are 180 and 450 metres, respectively. 7.2.2 Access Mode Adherence to Station Categorisation The three stations studied provided adequate access facilities catering to the access modes anticipated for their corresponding station category as per Table 9. City centre stations are generally categorised as destination stations and located in dense urban areas - thus large volumes of pedestrians, taxi (also KnR) and other high capacity transit (bus and rail) dominate the modes of access to the station. No dedicated parking is provided at the station. PnR is offered by surrounding parking structures near the station. Car access (PnR and KnR) is the dominant mode of access at PnR stations such as the Coomera station. Bus, walk and cycle access are also accommodated – however, their proportions are relatively low. Coomera station accommodates all modes and the number of facilities allotted for each is determined based on
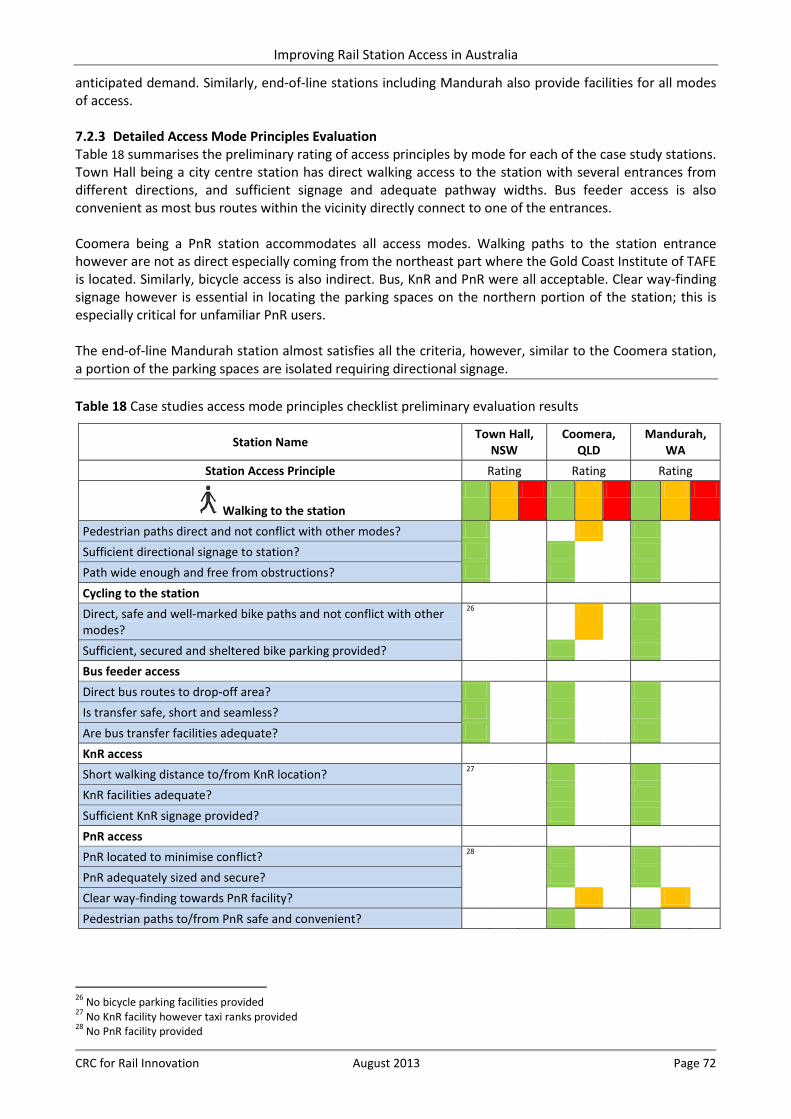
Improving Rail Station Access in Australia
CRC for Rail Innovation August 2013 Page 72
anticipated demand. Similarly, end-of-line stations including Mandurah also provide facilities for all modes of access. 7.2.3 Detailed Access Mode Principles Evaluation Table 18 summarises the preliminary rating of access principles by mode for each of the case study stations. Town Hall being a city centre station has direct walking access to the station with several entrances from different directions, and sufficient signage and adequate pathway widths. Bus feeder access is also convenient as most bus routes within the vicinity directly connect to one of the entrances. Coomera being a PnR station accommodates all access modes. Walking paths to the station entrance however are not as direct especially coming from the northeast part where the Gold Coast Institute of TAFE is located. Similarly, bicycle access is also indirect. Bus, KnR and PnR were all acceptable. Clear way-finding signage however is essential in locating the parking spaces on the northern portion of the station; this is especially critical for unfamiliar PnR users. The end-of-line Mandurah station almost satisfies all the criteria, however, similar to the Coomera station, a portion of the parking spaces are isolated requiring directional signage. Table 18 Case studies access mode principles checklist preliminary evaluation results
Station Name Town Hall, NSW
Coomera, QLD
Mandurah, WA
Station Access Principle Rating Rating Rating
Walking to the station
Pedestrian paths direct and not conflict with other modes?
Sufficient directional signage to station?
Path wide enough and free from obstructions?
Cycling to the station
Direct, safe and well-marked bike paths and not conflict with other modes?
26
Sufficient, secured and sheltered bike parking provided?
Bus feeder access
Direct bus routes to drop-off area?
Is transfer safe, short and seamless?
Are bus transfer facilities adequate?
KnR access
Short walking distance to/from KnR location? 27
KnR facilities adequate?
Sufficient KnR signage provided?
PnR access
PnR located to minimise conflict? 28
PnR adequately sized and secure?
Clear way-finding towards PnR facility?
Pedestrian paths to/from PnR safe and convenient?
26 No bicycle parking facilities provided 27 No KnR facility however taxi ranks provided 28 No PnR facility provided
Improving Rail Station Access in Australia
CRC for Rail Innovation August 2013 Page 73
8. Findings Station access is a key component of the overall passenger experience and bridges the gap between origin or destination and transit stations making rail service more comparable to door-to-door car travel. An analysis of Australian station access and a review of international planning guides identified key elements important in planning for station access for inclusion in the proposed access planning methodology for the Australian context. The evaluation framework proposed for adaptation for station access is based on a ‘traffic light’ system. The principles relating to station access are listed and rated as ‘green’, ‘amber’ or ‘red’ depending on how the principle has been considered and addressed. Each criterion under each principle can be rated based on how they are addressed in the station under study. The ratings will give a good indication of where improvements can be implemented. For each of the access modes considered for a particular type of station, a table of principles was generated. The complete list of evaluation principles covering all access modes is included in Appendix A. Case studies of stations from Brisbane, Perth, and Sydney were used to illustrate the proposed approach. The access modes checklist identified areas of improvement in providing adequate access facilities. More detailed analysis would be required to be able to identify specific areas of improvement. The analysis served to illustrate how the elements and principles can be used as a tool for evaluation and planning for station access. Decision makers and the community can readily understand the visual rating approach.
Improving Rail Station Access in Australia
CRC for Rail Innovation August 2013 Page 74
References APTA 2009, Recommended Practice: Defining Transit Areas of Influence, Washington, DC. ATOC 2010, Integrated Travel, <http://www.atoc.org/clientfiles/File/Policydocuments/Integrated_travel_position_paper_sept_2010.pdf>. Attorney-General's Department 2002, Disability Standards for Accessible Public Transport (amended May 2011), Canberra, ACT. Austroads 1995, Guide to Traffic Engineering Practice Part 13: Pedestrians, Sydney, NSW. Austroads 2001, Forecasting Demand for Bicycle Facilities, Sydney, NSW. Austroads 2007a, Guide to Traffic Management Part 6: Intersections, Interchanges and Crossings, Sydney, NSW. Austroads 2007b, Guide to Traffic Management Part 10: Traffic Control and Communication Devices, Sydney, NSW. Austroads 2008a, Guide to Traffic Management Part 5: Road Management, Sydney, NSW. Austroads 2008b, Guide to Traffic Management Part 8: Local Area Traffic Management, Sydney, NSW. Austroads 2008c, Guide to Traffic Management Part 11: Parking, Sydney, NSW. Austroads 2009a, Guide to Road Design Part 4: Intersections and Crossing - General, Sydney, NSW. Austroads 2009b, Guide to Road Design Part 6A: Pedestrian and Cyclist Paths, Sydney, NSW. Austroads 2009c, Guide to Road Design Part 6B: Roadside Environment, Sydney, NSW. Austroads 2009d, Guide to Traffic Management Part 7: Traffic Management in Activity Centres, Sydney, NSW. Austroads 2011, Cycling Aspects of Austroads Guides, Sydney, NSW. BART 2003, BART Station Access Guideline, Bay Area Rapid Transit, San Francisco. BART 2012, BART Bicycle Plan: Modelling Access to Transit, Bay Area Rapid Transit District, Oakland, CA. Brons, M, Givoni, M & Rietveld, P 2009, 'Access to railway stations and its potential in increasing rail use', Transportation Research Part A: Policy and Practice, vol. 43, no. 2, pp. 136-49. Burke, M & Brown, AL 2007, 'Distances people walk for transport', Road & Transport Research, vol. 16, no. 3, pp. 16-29. Danaher, A 2010, TCRP Synthesis 83: Bus and Rail Transit Preferential Treatments in Mixed Traffic, Washington, DC. Dantas, L 2005, Improving Pedestrian and Bicyclists Access to Selected Transit Stations, Massachusetts Highway Department, Boston. Department of Transport-WA 2011a, Planning and designing for pedestrians: guidelines, Perth, WA. Department of Transport-WA 2011b, Walkability Audit Tool, Perth, WA. DIPNR-NSW 2004, Planning guidelines for walking and cycling, Sydney, NSW. DTMR-QLD 2011, Connecting SEQ 2031 – An Integrated Regional Transport Plan for South East Queensland, Brisbane, QLD. Easter Seals 2009, Accessible Pathways to Bus Stops and Transit Facilities: A Process Guide, Washington, DC. Evans, JE, Perincherry, V & Douglas, GB 1997, 'Transit friendliness factor: approach to quantifying transit access environment in a transportation planning model', Transportation Research Record: Journal of the Transportation Research Board, vol. 1604, pp. 32-9. FDOT 2009, South Florida East Coast Corridor Transit Analysis: Station Design Guidelines. FRA 2011, Station Area Planning for High-Speed and Intercity Passenger Rail, Federal Railway Administration, US Department of Transportation, , Washington, DC. Fravel, F, Barboza, R, Quan, J & Sartori, J 2011, TCRP Report 147: Toolkit for Estimating Demand for Rural Intercity Bus Services, Washington, DC.
Improving Rail Station Access in Australia
CRC for Rail Innovation August 2013 Page 75
Givoni, M & Rietveld, P 2008, 'Bicycle parking facilities at railway stations - is it worth investing in?', paper presented to 48th Congress of the European Regional Science Association (ERSA), Liverpool, UK. Green, C & Hall, P 2009, Better Rail Stations, Department for Transport, UK, London. Hendricks, S 2005, Impacts of Transit Oriented Development on Public Transport Ridership, Tampa, Florida. Kittelson and Associates 2003a, TCRP Report 88: A Guidebook for Developing a Transit Performance-Measurement System, Washington, DC. Kittelson and Associates 2003b, Transit Capacity and Quality of Service Manual - 2nd Edition, TCRP Report 100, Washington, DC. Kittelson and Associates, KFH Group, Parsons Brinckerhoff Quade & Douglas & Hunter-Zaworski, K 2003, TCRP Report 100: Transit Capacity and Quality of Service Manual, TCRP Report 100, Washington, DC. Kittelson and Associates, Sampson, D, Kachadoorian, C, Levinson, H & Schofer, J 2012, TCRP Report 153: Guidelines for Providing Access to Public Transportation Stations, Washington, DC. Landis, BW, Vattikuti, VR, Ottenberg, RM, McLeod, DS & Guttenplan, M 2001, Modeling the roadside walking environment: Pedestrian level of service, <http://www.scopus.com/inward/record.url?eid=2-s2.0-0035730111&partnerID=40>. Loutzenheiser, D 1997, 'Pedestrian Access to Transit', Transportation Research Record: Journal of the Transportation Research Board, vol. 1604, pp. 40-9. Loutzenheiser, D 1997, 'Pedestrian Access to Transit', Transportation Research Record, vol. 1604, pp. 40-9. LTSA-NZ 2004, Cycle Network and Route Planning Guide, Wellington, NZ. Martens, K 2007, 'Promoting bike-and-ride: The Dutch experience', Transport Research Part A, vol. 41, pp. 326-38. McGinley, F 2001, 'A GIS Approach to Bus Service Planning: A Methodology for Evaluating Bus Service Proposals', paper presented to 24th Australasian Transport Research Forum, Hobart, Tasmania. Network Rail 2011, Guide to Station Planning and Design, Network Rail, London. NSW Government 2011, NSW 2021: A Plan to Make NSW Number One, Sydney, NSW. NZTA 2009, Pedestrian planning and design guide, Wellington, NZ. Olszewski, P & Wibowo, SS 2005, 'Using equivalent walking distance to assess pedestrian accessibility to transit stations in Singapore', Transportation Research Record: Journal of the Transportation Research Board, vol. 1927, no. -1, pp. 38-45. Ortuzar, JdD, Iacobelli, A & Valeze, C 1999, 'Estimating demand for a cycle-way network', Transportation Research Part A: Policy and Practice, Transportation Research Part A: Policy and Practice pp. 353-73. Owens, W 1950, 'Automotive Transportation: Trends and Problems', Land Economics, vol. 26, no. 2. Passenger Focus 2011, The challenge of getting to the station passenger experiences, Passengers' Council, Manchester. PTA WA 2003, Bus Route Planning and Transit Streets, Perth, WA. PTA WA 2010, Site observations during Murdoch, Cockburn and Bull Creek station car park surveys, Public Transport Authority - Western Australia, Perth, Australia. PTA WA 2011a, Architectural Design Guide for Stations, Perth, Australia. PTA WA 2011b, Ped Shed Analysis - Pedestrian Access to Stations (Interactive report), Public Transport Authority-Western Australia, Perth, Australia. Queensland Government 2007, Crime Prevention through Environmental Design: Guidelines for Queensland Part A, Brisbane, QLD. Queensland Government 2012, Manual of Uniform Traffic Control Devices Part 10: Pedestrian Control and Protection, Brisbane, QLD. Queensland Transport 2005, Easy Steps: A toolkit for planning, designing and promoting safe walking, Brisbane, QLD.
Improving Rail Station Access in Australia
CRC for Rail Innovation August 2013 Page 76
RTA-NSW 2003, NSW Bicycle Guidelines, Sydney, NSW. Schank, J 2002, 'Encouraging Kiss-and-Ride at Commuter Railroad Stations', Transportation Research Record, vol. 1793, pp. 7-14. Semler, C & Hale, C 2010, 'Rail station access – an assessment of options', paper presented to Australasian Transport Research Forum, Canberra, Australia. Semler, C & Parks, J 2011, 'Planning for Access to Public Transport Stations', paper presented to AITPM National Conference 2011, Melbourne. Sherwin, H & Parkhurst, G 2010, 'The promotion of bicycle access to the rail network as a way of making better use of the existing network and reducing car dependence', paper presented to European Transport Conference, Glasgow, UK, October 2010. Standards Association of Australia 1988, Australian Standard 1428 Design for access and mobility, Sydney, NSW. Standards Association of Australia 1993, AS2890.3 Australian Standard for Bicycle Parking Facilities. State Government of Victoria 2008, Public transport guidelines for land use and development, Melbourne, Victoria. State Government of Victoria 2011, Railway Station Design Standard and Guidelines, Melbourne, Victoria. State of Victoria 2002, Melbourne 2030: Planning for sustainable growth, Melbourne, Victoria. TPDC-NSW 2006, Transfigures, Transport and Population Data Centre, NSW Department of Planning, Sydney. TransLink 2012, Public Transport Infrastructure Manual, Queensland Transport, Queensland Government, Brisbane. Transport NSW 2011, Customer Focused Transport Interchange Design Handbook (draft), Sydney, Australia. Transport Victoria 2011, Methodological Framework for Developing Principal Pedestrian Networks, Melbourne. TranSystems, Planners Collaborative & Tom Crikelair Associates 2007, TCRP Report 111: Elements Needed to Create High Ridership Transit Systems, Washington, DC. Turnbull, K, Pratt, R, Evans, J & Levinson, H 2004, TCRP Report 95: Traveler Response to Transportation System Changes: Chapter 3 - Park-and-ride/Pool, Washington, DC. Vincent, M 2007, Park and ride: Characteristics and demand forecasting, Wellington, NZ. WAPC 2009, Liveable Neighbourhoods: a Western Australian Government sustainable cities initiative, Perth, WA. WMATA 2008, Station Site and Access Planning Manual, Washington DC. Xu, M, Milthorpe, F & Tsang, K 2011, 'Detailed Analysis of the Travel Patterns of Rail Users in Sydney', in Australasian Transport Research Forum 2011, Adelaide.
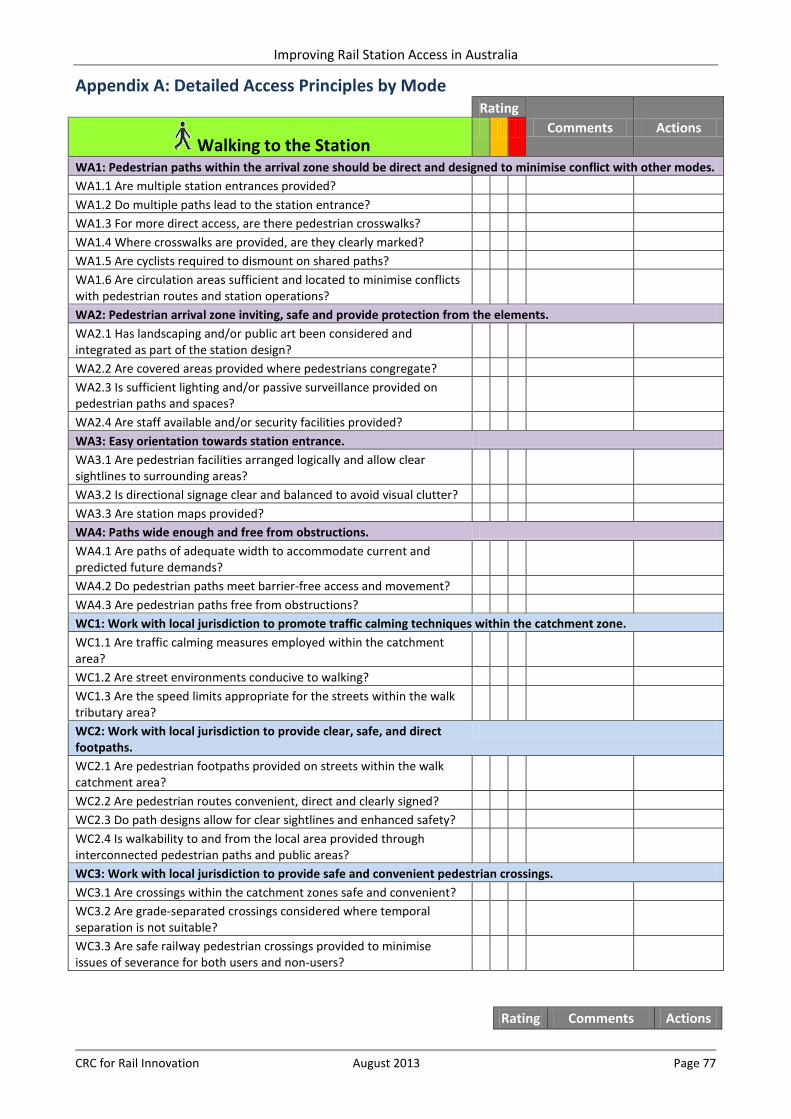
Improving Rail Station Access in Australia
CRC for Rail Innovation August 2013 Page 77
Appendix A: Detailed Access Principles by Mode Rating
Comments Actions Walking to the Station
WA1: Pedestrian paths within the arrival zone should be direct and designed to minimise conflict with other modes. WA1.1 Are multiple station entrances provided?
WA1.2 Do multiple paths lead to the station entrance?
WA1.3 For more direct access, are there pedestrian crosswalks?
WA1.4 Where crosswalks are provided, are they clearly marked?
WA1.5 Are cyclists required to dismount on shared paths?
WA1.6 Are circulation areas sufficient and located to minimise conflicts with pedestrian routes and station operations?
WA2: Pedestrian arrival zone inviting, safe and provide protection from the elements. WA2.1 Has landscaping and/or public art been considered and integrated as part of the station design?
WA2.2 Are covered areas provided where pedestrians congregate?
WA2.3 Is sufficient lighting and/or passive surveillance provided on pedestrian paths and spaces?
WA2.4 Are staff available and/or security facilities provided?
WA3: Easy orientation towards station entrance.
WA3.1 Are pedestrian facilities arranged logically and allow clear sightlines to surrounding areas?
WA3.2 Is directional signage clear and balanced to avoid visual clutter?
WA3.3 Are station maps provided?
WA4: Paths wide enough and free from obstructions.
WA4.1 Are paths of adequate width to accommodate current and predicted future demands?
WA4.2 Do pedestrian paths meet barrier-free access and movement?
WA4.3 Are pedestrian paths free from obstructions?
WC1: Work with local jurisdiction to promote traffic calming techniques within the catchment zone. WC1.1 Are traffic calming measures employed within the catchment area?
WC1.2 Are street environments conducive to walking?
WC1.3 Are the speed limits appropriate for the streets within the walk tributary area?
WC2: Work with local jurisdiction to provide clear, safe, and direct footpaths.
WC2.1 Are pedestrian footpaths provided on streets within the walk catchment area?
WC2.2 Are pedestrian routes convenient, direct and clearly signed?
WC2.3 Do path designs allow for clear sightlines and enhanced safety?
WC2.4 Is walkability to and from the local area provided through interconnected pedestrian paths and public areas?
WC3: Work with local jurisdiction to provide safe and convenient pedestrian crossings. WC3.1 Are crossings within the catchment zones safe and convenient?
WC3.2 Are grade-separated crossings considered where temporal separation is not suitable?
WC3.3 Are safe railway pedestrian crossings provided to minimise issues of severance for both users and non-users?
Rating Comments Actions
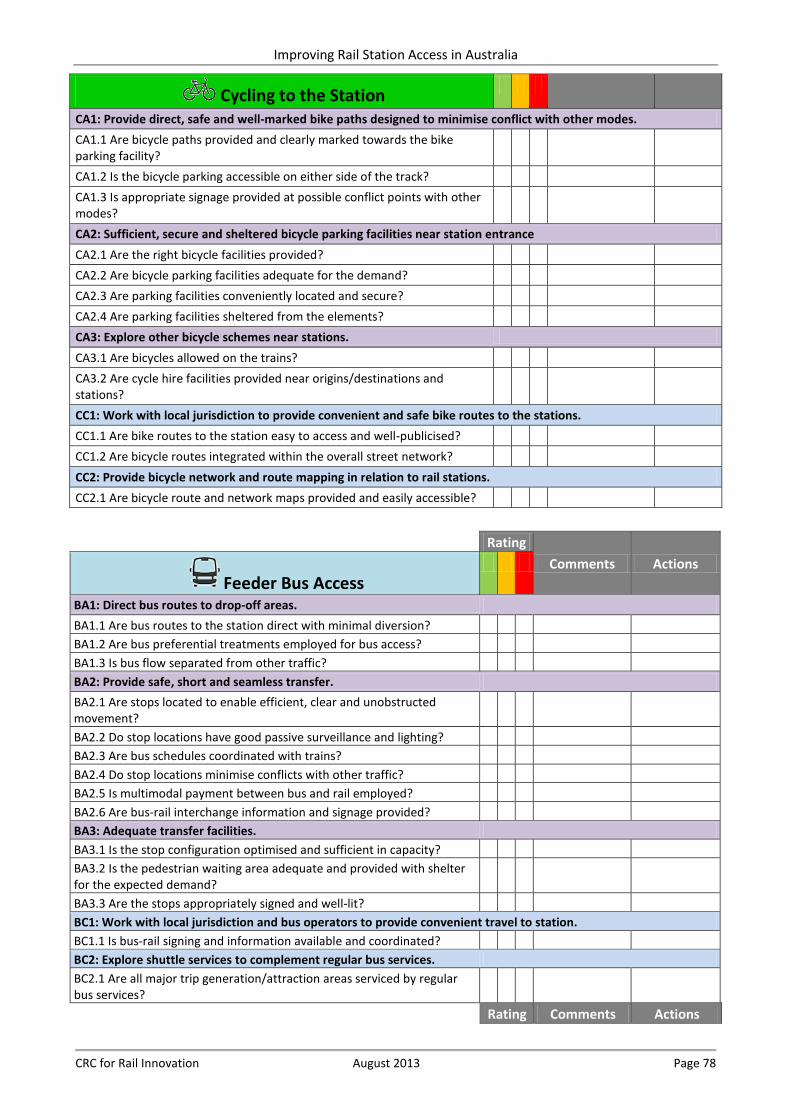
Improving Rail Station Access in Australia
CRC for Rail Innovation August 2013 Page 78
Cycling to the Station
CA1: Provide direct, safe and well-marked bike paths designed to minimise conflict with other modes. CA1.1 Are bicycle paths provided and clearly marked towards the bike parking facility?
CA1.2 Is the bicycle parking accessible on either side of the track?
CA1.3 Is appropriate signage provided at possible conflict points with other modes?
CA2: Sufficient, secure and sheltered bicycle parking facilities near station entrance CA2.1 Are the right bicycle facilities provided?
CA2.2 Are bicycle parking facilities adequate for the demand?
CA2.3 Are parking facilities conveniently located and secure?
CA2.4 Are parking facilities sheltered from the elements?
CA3: Explore other bicycle schemes near stations.
CA3.1 Are bicycles allowed on the trains?
CA3.2 Are cycle hire facilities provided near origins/destinations and stations?
CC1: Work with local jurisdiction to provide convenient and safe bike routes to the stations. CC1.1 Are bike routes to the station easy to access and well-publicised?
CC1.2 Are bicycle routes integrated within the overall street network?
CC2: Provide bicycle network and route mapping in relation to rail stations. CC2.1 Are bicycle route and network maps provided and easily accessible?
Rating
Comments Actions Feeder Bus Access
BA1: Direct bus routes to drop-off areas. BA1.1 Are bus routes to the station direct with minimal diversion?
BA1.2 Are bus preferential treatments employed for bus access?
BA1.3 Is bus flow separated from other traffic?
BA2: Provide safe, short and seamless transfer. BA2.1 Are stops located to enable efficient, clear and unobstructed movement?
BA2.2 Do stop locations have good passive surveillance and lighting?
BA2.3 Are bus schedules coordinated with trains?
BA2.4 Do stop locations minimise conflicts with other traffic?
BA2.5 Is multimodal payment between bus and rail employed?
BA2.6 Are bus-rail interchange information and signage provided?
BA3: Adequate transfer facilities.
BA3.1 Is the stop configuration optimised and sufficient in capacity?
BA3.2 Is the pedestrian waiting area adequate and provided with shelter for the expected demand?
BA3.3 Are the stops appropriately signed and well-lit?
BC1: Work with local jurisdiction and bus operators to provide convenient travel to station. BC1.1 Is bus-rail signing and information available and coordinated?
BC2: Explore shuttle services to complement regular bus services.
BC2.1 Are all major trip generation/attraction areas serviced by regular bus services?
Rating Comments Actions
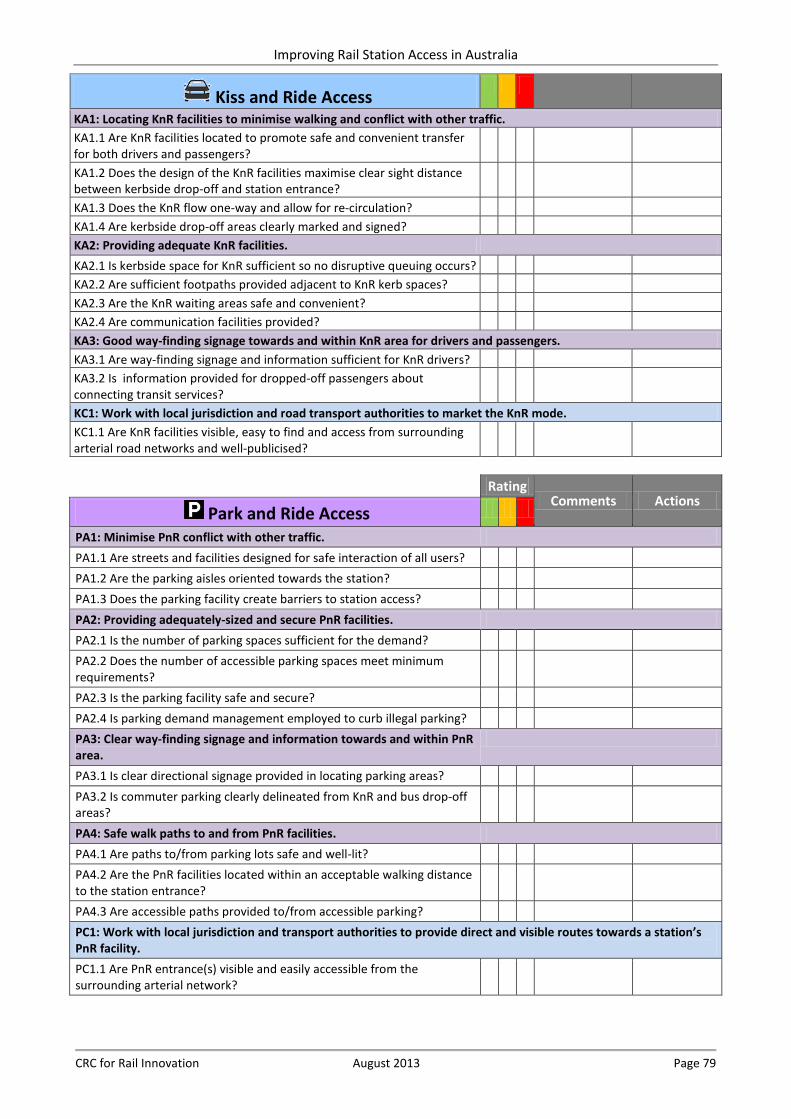
Improving Rail Station Access in Australia
CRC for Rail Innovation August 2013 Page 79
Kiss and Ride Access
KA1: Locating KnR facilities to minimise walking and conflict with other traffic. KA1.1 Are KnR facilities located to promote safe and convenient transfer for both drivers and passengers?
KA1.2 Does the design of the KnR facilities maximise clear sight distance between kerbside drop-off and station entrance?
KA1.3 Does the KnR flow one-way and allow for re-circulation?
KA1.4 Are kerbside drop-off areas clearly marked and signed?
KA2: Providing adequate KnR facilities. KA2.1 Is kerbside space for KnR sufficient so no disruptive queuing occurs?
KA2.2 Are sufficient footpaths provided adjacent to KnR kerb spaces?
KA2.3 Are the KnR waiting areas safe and convenient?
KA2.4 Are communication facilities provided?
KA3: Good way-finding signage towards and within KnR area for drivers and passengers. KA3.1 Are way-finding signage and information sufficient for KnR drivers?
KA3.2 Is information provided for dropped-off passengers about connecting transit services?
KC1: Work with local jurisdiction and road transport authorities to market the KnR mode. KC1.1 Are KnR facilities visible, easy to find and access from surrounding arterial road networks and well-publicised?
Rating
Comments Actions Park and Ride Access
PA1: Minimise PnR conflict with other traffic. PA1.1 Are streets and facilities designed for safe interaction of all users? PA1.2 Are the parking aisles oriented towards the station? PA1.3 Does the parking facility create barriers to station access? PA2: Providing adequately-sized and secure PnR facilities. PA2.1 Is the number of parking spaces sufficient for the demand? PA2.2 Does the number of accessible parking spaces meet minimum requirements?
PA2.3 Is the parking facility safe and secure? PA2.4 Is parking demand management employed to curb illegal parking? PA3: Clear way-finding signage and information towards and within PnR area.
PA3.1 Is clear directional signage provided in locating parking areas? PA3.2 Is commuter parking clearly delineated from KnR and bus drop-off areas?
PA4: Safe walk paths to and from PnR facilities. PA4.1 Are paths to/from parking lots safe and well-lit? PA4.2 Are the PnR facilities located within an acceptable walking distance to the station entrance?
PA4.3 Are accessible paths provided to/from accessible parking? PC1: Work with local jurisdiction and transport authorities to provide direct and visible routes towards a station’s PnR facility. PC1.1 Are PnR entrance(s) visible and easily accessible from the surrounding arterial network?
Improving Rail Station Access in Australia
CRC for Rail Innovation August 2013 Page 80
Appendix B: QUT Papers Making the train: An examination of five perspectives of rail access and how they resonate with existing and potential passengers by Kelly D Zuniga, Kaveh Bevrani, Jonathan M Bunker, Queensland University of Technology, submitted for publication at the Australasian Transport Research Forum 2013.
Abstract: Rail operators recognize a need to increase ridership in order to improve the economic viability of rail service, and to magnify the role that rail travel plays in making cities feel liveable. This study extends previous research that used cluster analysis with a small sample of rail passengers to identify five salient perspectives of rail access (Zuniga et al, 2013). In this project stage, we used correlation techniques to determine how those perspectives would resonate with two larger study populations, including a relatively homogeneous sample of university students in Brisbane, Australia and a diverse sample of rail passengers in Melbourne, Australia. Findings from Zuniga et al. (2013) described a complex typology of current passengers that was based on respondents’ subjective attitudes and perceptions rather than socio-demographic or travel behaviour characteristics commonly used for segmentation analysis. The typology included five qualitative perspectives of rail travel. Based on the transport accessibility literature, we expected to find that perspectives from that study emphasizing physical access to rail stations would be shared by current and potential rail passengers who live further from rail stations. Other perspectives might be shared among respondents who live nearby, since the relevance of distance would be diminished. The population living nearby would thus represent an important target group for increasing ridership, since making rail travel accessible to them does not require expansion of costly infrastructure such as new lines or stations. By measuring the prevalence of each perspective in a larger respondent pool, results from this study provide insight into the typical socio-demographic and travel behaviour characteristics that correspond to each perspective of intra-urban rail travel. In several instances, our quantitative findings reinforced Zuniga et al.’s (2013) qualitative descriptions of passenger types, further validating the original research. This work may directly inform rail operators’ approach to increasing ridership through marketing and improvements to service quality and station experience. Operators in other parts of Australia and internationally may also choose to replicate the study locally, to fine-tune understanding of diverse customer bases. Developing regional and international collaboration would provide additional opportunities to evaluate and benchmark service and station amenities as they address the various access dimensions.
Making the train: Re-conceptualising accessibility for intra-urban rail travel, by Kelly D Zuniga, Yulin Liu, Jonathan M Bunker, Civil Engineering and Built Environment School, Queensland University of Technology, submitted for publication at the Australasian Transport Research Forum 2013.
Abstract: Ambitious policy objectives and substantial investment plans have been set by Australian authorities to transfer Australia’s current transport profile of heavy reliance on private motor cars to sustainable modes. Encouraging mode shift to public transport, particularly to rail transit, is a vital component to achieve the policy goal. Improving accessibility of public transport is key to attracting people from their cars. Past studies on accessibility to public transport focus on walking time and/or waiting time. However, travellers’ perceptions of the interface leg journeys may depend not only on these direct and tangible factors but also on social and psychological factors. This paper extends previous research that identified five salient perspectives of rail access by means of a statement sorting activity and cluster analysis with a small sample of rail passengers in three Australian cities (Zuniga et al, 2013). This study collects a new data set including 144 responses from Brisbane and Melbourne to an online survey made up of a Likert-scaled statement sorting exercise and questionnaire. It employs factor analysis to examine the statement rankings and uncovers seven underlying factors in the exploratory manner, i.e., station, safety, access, transfer, service attitude, traveller’s physical activity levels, and environmental concern. Respondents from groups stratified by rail use frequency are compared in terms of their scores of those factors. Findings from this study indicate a need to re-conceptualize accessibility to intra-urban rail travel in agreement with current policy agenda, and to target behavioural intervention to multiple dimensions of accessibility influencing passengers’ travel choices. Arguments in this paper are not limited to intra-urban rail transit, but may also be relevant to public transport in general.
Intra-Urban Rail ‘Access’: Policy Implications of Five Revealed Perspectives from a Q Sorting Exercise in Three Australian Cities, by Kelly Zuniga, Jonathan Bunker and Kaveh Bevrani, Queensland University of Technology accepted for publication in the Journal of Transport Research Record.
Abstract: This project advances current understanding of intra-urban rail passengers and their travel experiences in order to help rail industry leaders tailor policy approaches to fit specific, relevant segments of their target population. Using a Q sorting technique and cluster analysis, our preliminary research identified five perspectives occurring in a small sample of rail passengers, who varied in their frequency and location of rail travel as well as certain socio-demographic characteristics. Revealed perspectives (named to capture the gist of their content) included: ‘Rail Travel is About the Destination, Not the Journey’; ‘Despite Challenges, Public Transport is Still the Best Option’; ‘Rail Travel is Fine’; ‘Rail Travel? So Far, So Good’; and ‘Bad Taste for Rail Travel’. This paper discusses each of the perspectives in detail, and considers them in terms of tailored policy implications. An overarching finding from this study is that improving railway travel ‘access’ requires attention to physical, psychological, financial, and social facets of accessibility. For example, designing waiting areas to be more socially functional and comfortable has the potential to increase ridership by addressing social forms of access, decreasing perceived wait times, and making time at the station feel like time well spent. Even at this preliminary stage, the Q sorting technique promises to provide a valuable, holistic albeit fine-grained analysis of passenger attitudes and experiences that will assist industry efforts to increase ridership.
Improving Rail Station Access in Australia
CRC for Rail Innovation August 2013 Page 81
Appendix C: UQ Papers
Station Access and the Modern Transit System, by C Hale, The University of Queensland, Australasian Transport Research Forum 2011.
Abstract: Station access planning is re-emerging as a vital component of the overall suite of initiatives needed to make public transport systems work effectively. Without proactive access planning and access infrastructure improvement, the overall travel experience for public transport users is invariably diminished, and it may be that significant ridership potential is also forgone. It is only through a view that supports and enhances the “total journey” (including access and egress) that transit can compete with private travel alternatives. The paper analyses figures for station access and egress in the BART network (of the San Francisco Bay Area) – and uses these figures to develop station access “typologies” or “categories”. Interpretation from the figures and the categories is then delivered with a view to informing new efforts in access assessment, planning, design, and infrastructure provision. Advanced station access planning approaches would look at multi-modal and transit transfer questions, but also address pedestrian and bike access elements. But a first step may be to clearly understand actual access/egress usage, in order to then determine how planning and infrastructure development should proceed, based on preferred outcomes.
Employing Best Practice in Station Access to Bridge the Door-to-Door Divide, by Professor Phil Charles and Dr Ronald John Galiza, The University of Queensland, submitted for publication at Australasian Transport Research Forum 2013.
Abstract: Station access is a key component of the overall passenger experience and rail journey. Station access bridges the gap between origin (destination) and transit stations, thus making rail service more comparable to door-to-door automobile travel. In order to sway more travellers to patronise public transit as their main mode of transport, this segment of the trip need to be improved. Important questions that need to be considered include: how to best accommodate each access mode, how to enhance access by preferred modes, and how to manage conflicts between them? However, planning for station access has received insufficient attention and currently addressed in many different ways across Australia and in a relatively ad-hoc manner. In contrast, many advanced western nations employ mature planning principles to improve access to stations. The research involved an analysis of Australian station access and a review of international planning guides to identify the key elements important in planning for station access. Best practice elements were identified for inclusion in the proposed access planning methodology for the Australian context. A checklist of station principles associated with each access mode is referenced to assess existing station access conditions from case studies in Brisbane, Perth, and Melbourne. Results of the analysis identify deficiencies and recommendations for improvement in order to meet existing and future access demands. This paper presents a new perspective for Australian rail agencies in including access in the overall design process and provides a best practice approach, building on developments in Europe and North America.
Improving Access to Urban Passenger Rail Stations in Australia, by Professor Phil Charles and Dr Ronald John Galiza, The University of Queensland, submitted for publication at World Congress on Rail Research 2013. Abstract: Station access is a key component of customer experience of an overall rail journey. Planning access to rail stations, whether by walking, cycling, feeder bus, kiss-and-ride and park-and-ride, needs a more systematic approach to encourage patronage and improve customer experience. Rail station access is currently addressed in many different ways across Australia. Important questions that need to be considered include: how to best accommodate each access mode, how to enhance access by preferred modes, and how to manage conflicts between them? An analysis of Australian international planning guides identified the key elements important in planning for station access. Best practice elements were identified for inclusion in a proposed access evaluation methodology for the Australian context and a case study illustrated the proposed approach. An effective policy and planning framework for delivering better access for urban passenger rail stations outcomes on a network basis is described. Best practice planning for station access extends the sphere of interest beyond typical right-of-way boundaries, enabling a range of solutions to assist agencies with building patronage, increasing customer and community satisfaction and prioritising investment as well as collaboration with appropriate stakeholders.