Embed Size (px)
Citation preview

Thin Slab Continuous Casting Mould Taper Design
Prepared for:
Nucor Steel RR #2, Box 311
County Road 400 East Crawfordsville, Indiana 47933-9450
Steve Wigman
Meltshop Metallurgist
Prepared by:
UNDERGRAD Consulting 2009 Mechanical Engineering Lab
105 S. Mathews Urbana, IL 61801
Consulting Team
Jay Paidipati Brad Sharos
Christina Slayton Jennifer Wood
Advisor
Professor Brian Thomas
i
TABLE OF CONTENTS
Page
Abstract ………………………….………………………...………………………………… ii
List of Illustrations …………………………………………………………………………... iii
Introduction
Background …………………………………………………………………………. 1
Problem Statement ………………………………………………………………….. 3
Project Goals and Objectives ……………………………………………………….. 5
Discussion
Literature Review …………………………………………………………………… 6
Theoretical Background …………………………………………………………….. 8
Data Collection ……………………………………………………………………… 12
CON1D ……………………………………………………………………………... 16
Narrow Face Taper Control and Measurement …………………………………….. 23
Ideal Narrow Face Taper ……………………………………………………………. 28
Conclusion
Alternative Designs Not Pursued …………………………………………………… 37
Accomplishments and Conclusions ………………………………………………… 37
Recommendations …………………………………………………………………... 39
References …………………………………………………………………………………... 42
Appendices .…………………………….……………………………………………………… 44
ii
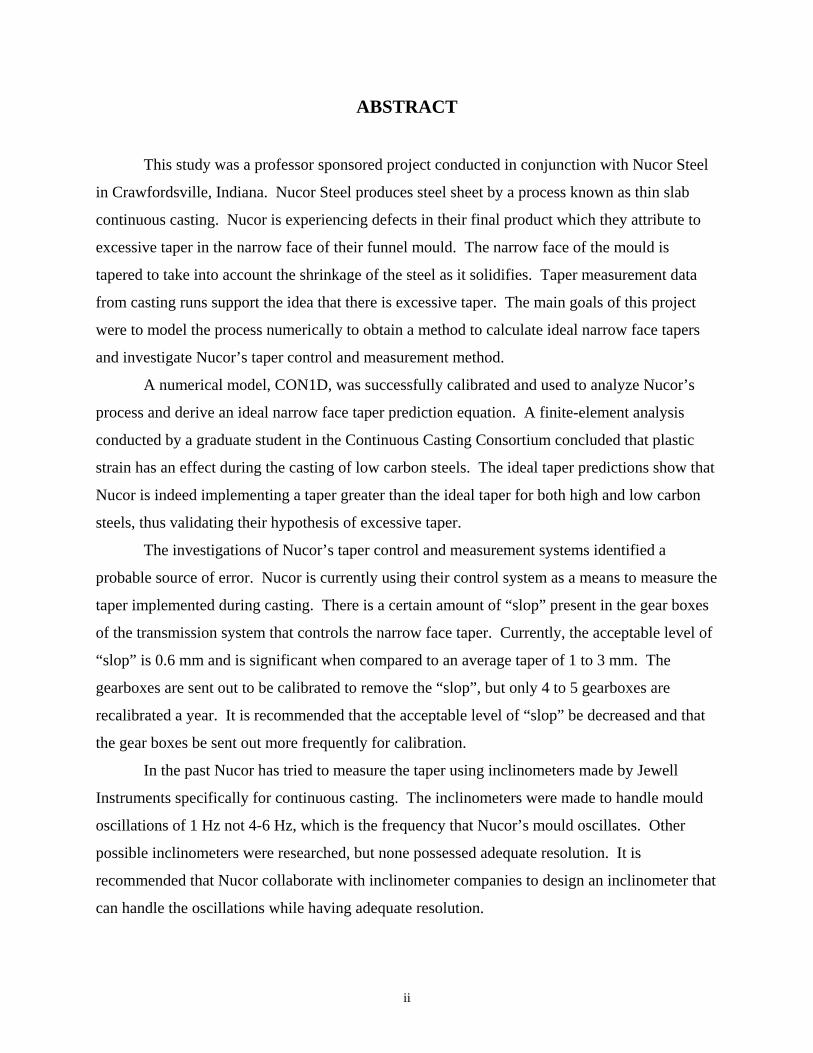
ABSTRACT
This study was a professor sponsored project conducted in conjunction with Nucor Steel
in Crawfordsville, Indiana. Nucor Steel produces steel sheet by a process known as thin slab
continuous casting. Nucor is experiencing defects in their final product which they attribute to
excessive taper in the narrow face of their funnel mould. The narrow face of the mould is
tapered to take into account the shrinkage of the steel as it solidifies. Taper measurement data
from casting runs support the idea that there is excessive taper. The main goals of this project
were to model the process numerically to obtain a method to calculate ideal narrow face tapers
and investigate Nucor’s taper control and measurement method.
A numerical model, CON1D, was successfully calibrated and used to analyze Nucor’s
process and derive an ideal narrow face taper prediction equation. A finite-element analysis
conducted by a graduate student in the Continuous Casting Consortium concluded that plastic
strain has an effect during the casting of low carbon steels. The ideal taper predictions show that
Nucor is indeed implementing a taper greater than the ideal taper for both high and low carbon
steels, thus validating their hypothesis of excessive taper.
The investigations of Nucor’s taper control and measurement systems identified a
probable source of error. Nucor is currently using their control system as a means to measure the
taper implemented during casting. There is a certain amount of “slop” present in the gear boxes
of the transmission system that controls the narrow face taper. Currently, the acceptable level of
“slop” is 0.6 mm and is significant when compared to an average taper of 1 to 3 mm. The
gearboxes are sent out to be calibrated to remove the “slop”, but only 4 to 5 gearboxes are
recalibrated a year. It is recommended that the acceptable level of “slop” be decreased and that
the gear boxes be sent out more frequently for calibration.
In the past Nucor has tried to measure the taper using inclinometers made by Jewell
Instruments specifically for continuous casting. The inclinometers were made to handle mould
oscillations of 1 Hz not 4-6 Hz, which is the frequency that Nucor’s mould oscillates. Other
possible inclinometers were researched, but none possessed adequate resolution. It is
recommended that Nucor collaborate with inclinometer companies to design an inclinometer that
can handle the oscillations while having adequate resolution.

iii
LIST OF ILLUSTRATIONS page
Figure 1: Top View of Solidifying Steel Shell near Meniscus………………………………. 2
Figure 2: Top View of Solidifying Steel Shell near Bottom of Mould……………………… 2
Figure 3: Side view schematic of mould to show the narrow face taper (left) and a top view of
the funnel mould (right)……………………………………………………………… 2
Figure 4: Schematic of interface between solidifying steel and mould……………………… 8
Figure 5: Diagrams related to equations for extra length and funnel depth…………………. 12
Figure 6: CON1D output - heat flux vs. distance below meniscus…………………………… 17
Figure 7: CON1D output- Shell surface temperature vs. distance below meniscus………….. 17
Figure 8: CON1D output- Shell thickness vs. distance below meniscus………………….….. 18
Figure 9: CON1D output- Shell shrinkage vs. distance below meniscus…………………….. 18
Figure 10: CON1D output- Instantaneous taper vs. distance below meniscus………………. 19
Figure 11: CON1D output- Cumulative taper vs. distance below meniscus………………… 20
Figure 12: Simple schematic of the linear screw system…………………………....………. 24
Figure 13: Schematic of Jewell Inclinometer……………………………………………….. 27
Figure 14: Schematic showing effect of oscillations on Jewell Inclinometer……………….. 27
Figure 15: Ideal taper graph for high carbon steel…………………………………………… 30
Figure 16: Ideal taper graph for common low carbon steel………………………………….. 31
Figure 17: Ideal taper graph for common low carbon steel, plasticity included……………... 32
Figure 18: Ideal taper graph for difficult low carbon steel…………………………………… 33
Figure 19: Ideal taper graph for difficult low carbon, plasticity included……………………. 34
Figure 20: Ideal taper graph for ~peritectic steel…………………………………………….. 35
Figure 21: Ideal taper graph for ~peritectic steel, plasticity included………………………... 36
1
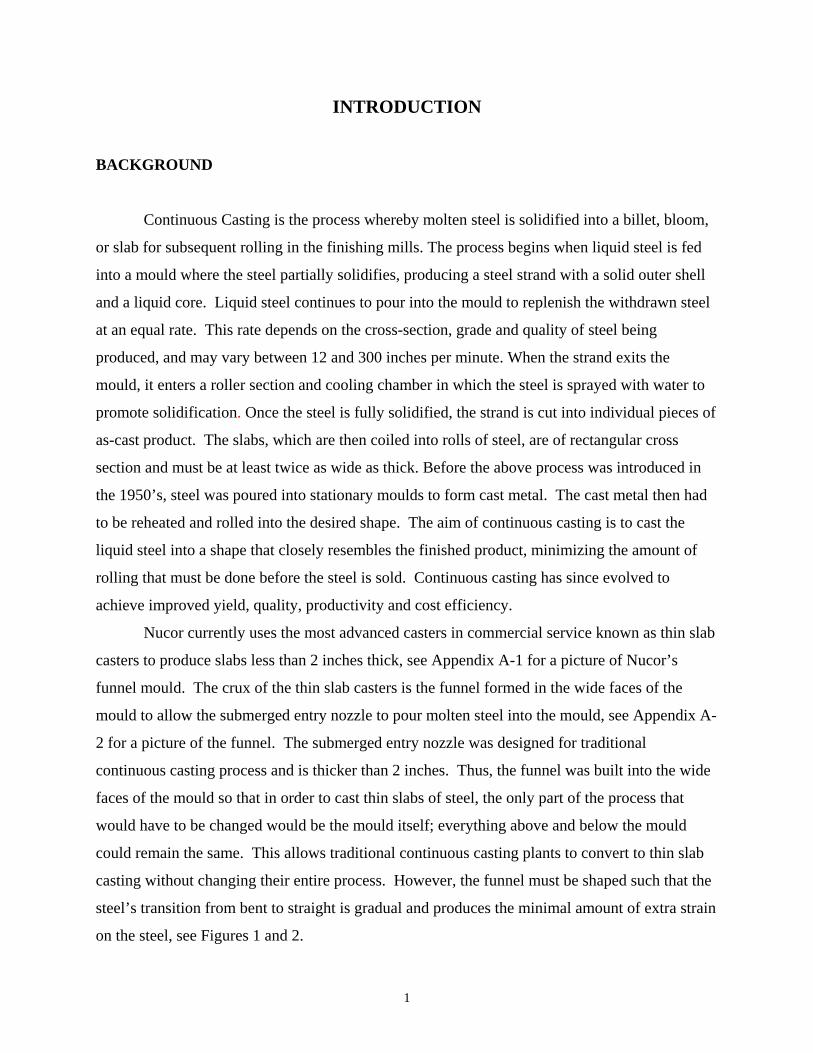
INTRODUCTION
BACKGROUND
Continuous Casting is the process whereby molten steel is solidified into a billet, bloom,
or slab for subsequent rolling in the finishing mills. The process begins when liquid steel is fed
into a mould where the steel partially solidifies, producing a steel strand with a solid outer shell
and a liquid core. Liquid steel continues to pour into the mould to replenish the withdrawn steel
at an equal rate. This rate depends on the cross-section, grade and quality of steel being
produced, and may vary between 12 and 300 inches per minute. When the strand exits the
mould, it enters a roller section and cooling chamber in which the steel is sprayed with water to
promote solidification. Once the steel is fully solidified, the strand is cut into individual pieces of
as-cast product. The slabs, which are then coiled into rolls of steel, are of rectangular cross
section and must be at least twice as wide as thick. Before the above process was introduced in
the 1950’s, steel was poured into stationary moulds to form cast metal. The cast metal then had
to be reheated and rolled into the desired shape. The aim of continuous casting is to cast the
liquid steel into a shape that closely resembles the finished product, minimizing the amount of
rolling that must be done before the steel is sold. Continuous casting has since evolved to
achieve improved yield, quality, productivity and cost efficiency.
Nucor currently uses the most advanced casters in commercial service known as thin slab
casters to produce slabs less than 2 inches thick, see Appendix A-1 for a picture of Nucor’s
funnel mould. The crux of the thin slab casters is the funnel formed in the wide faces of the
mould to allow the submerged entry nozzle to pour molten steel into the mould, see Appendix A-
2 for a picture of the funnel. The submerged entry nozzle was designed for traditional
continuous casting process and is thicker than 2 inches. Thus, the funnel was built into the wide
faces of the mould so that in order to cast thin slabs of steel, the only part of the process that
would have to be changed would be the mould itself; everything above and below the mould
could remain the same. This allows traditional continuous casting plants to convert to thin slab
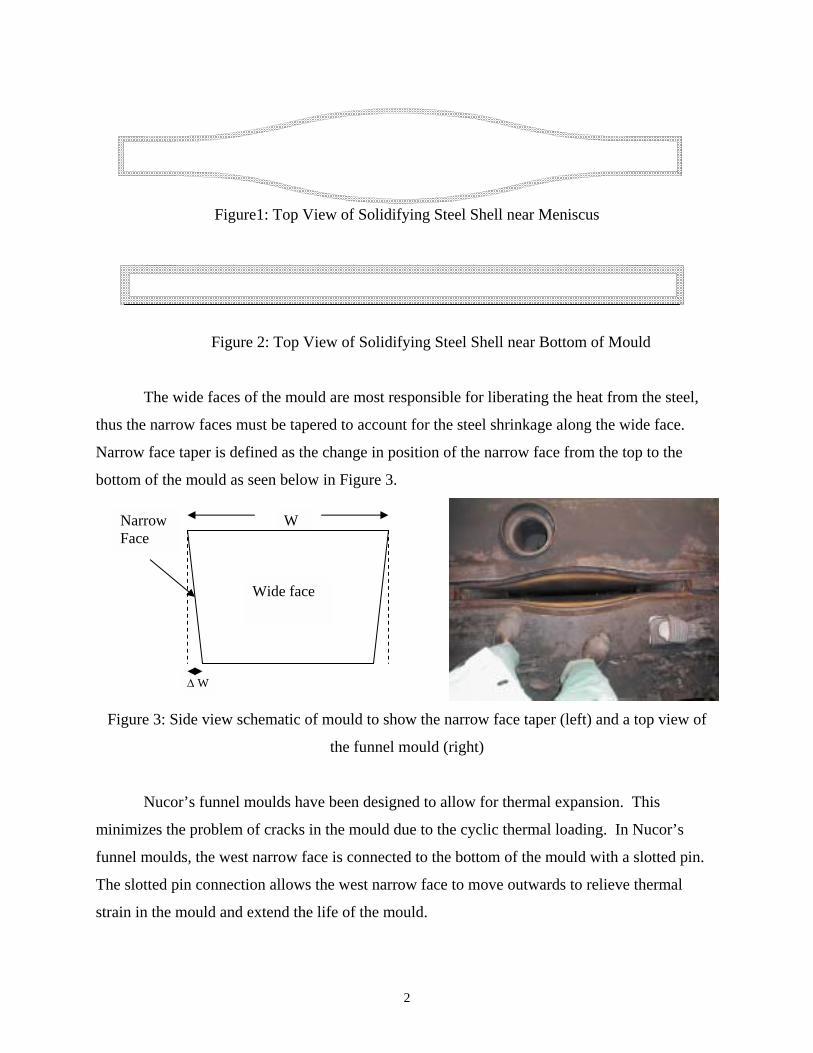
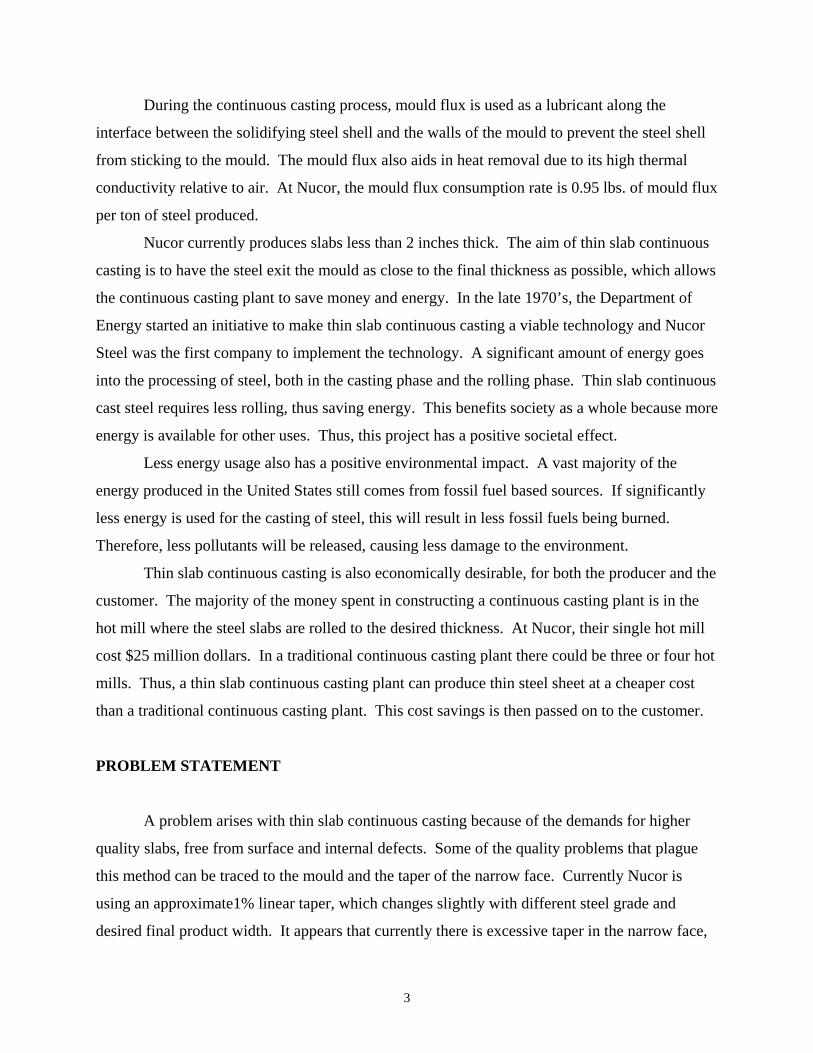
casting without changing their entire process. However, the funnel must be shaped such that the
steel’s transition from bent to straight is gradual and produces the minimal amount of extra strain
on the steel, see Figures 1 and 2.
2
Figure1: Top View of Solidifying Steel Shell near Meniscus
Figure 2: Top View of Solidifying Steel Shell near Bottom of Mould
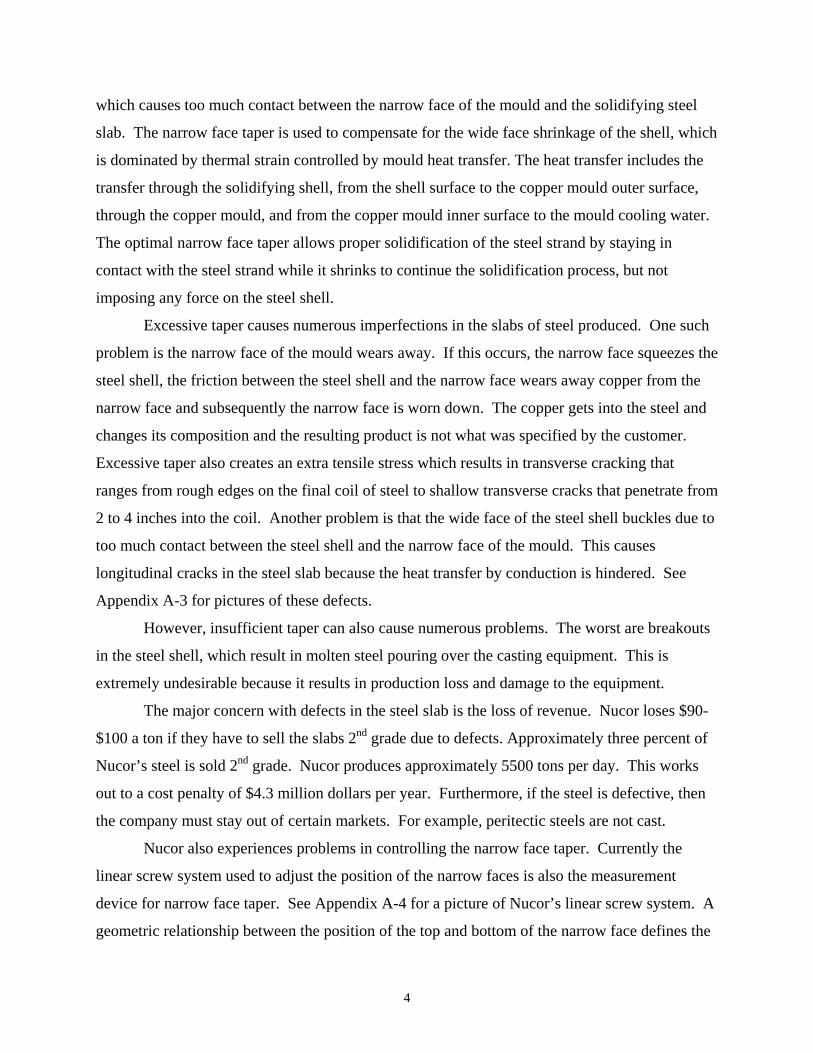
The wide faces of the mould are most responsible for liberating the heat from the steel,
thus the narrow faces must be tapered to account for the steel shrinkage along the wide face.
Narrow face taper is defined as the change in position of the narrow face from the top to the
bottom of the mould as seen below in Figure 3.
Figure 3: Side view schematic of mould to show the narrow face taper (left) and a top view of
the funnel mould (right)
Nucor’s funnel moulds have been designed to allow for thermal expansion. This
minimizes the problem of cracks in the mould due to the cyclic thermal loading. In Nucor’s
funnel moulds, the west narrow face is connected to the bottom of the mould with a slotted pin.
The slotted pin connection allows the west narrow face to move outwards to relieve thermal
strain in the mould and extend the life of the mould.
W
∆ W
Wide face
Narrow Face
3
During the continuous casting process, mould flux is used as a lubricant along the
interface between the solidifying steel shell and the walls of the mould to prevent the steel shell
from sticking to the mould. The mould flux also aids in heat removal due to its high thermal
conductivity relative to air. At Nucor, the mould flux consumption rate is 0.95 lbs. of mould flux
per ton of steel produced.
Nucor currently produces slabs less than 2 inches thick. The aim of thin slab continuous
casting is to have the steel exit the mould as close to the final thickness as possible, which allows
the continuous casting plant to save money and energy. In the late 1970’s, the Department of
Energy started an initiative to make thin slab continuous casting a viable technology and Nucor
Steel was the first company to implement the technology. A significant amount of energy goes
into the processing of steel, both in the casting phase and the rolling phase. Thin slab continuous
cast steel requires less rolling, thus saving energy. This benefits society as a whole because more
energy is available for other uses. Thus, this project has a positive societal effect.
Less energy usage also has a positive environmental impact. A vast majority of the
energy produced in the United States still comes from fossil fuel based sources. If significantly
less energy is used for the casting of steel, this will result in less fossil fuels being burned.
Therefore, less pollutants will be released, causing less damage to the environment.
Thin slab continuous casting is also economically desirable, for both the producer and the
customer. The majority of the money spent in constructing a continuous casting plant is in the
hot mill where the steel slabs are rolled to the desired thickness. At Nucor, their single hot mill
cost $25 million dollars. In a traditional continuous casting plant there could be three or four hot
mills. Thus, a thin slab continuous casting plant can produce thin steel sheet at a cheaper cost
than a traditional continuous casting plant. This cost savings is then passed on to the customer.
PROBLEM STATEMENT
A problem arises with thin slab continuous casting because of the demands for higher
quality slabs, free from surface and internal defects. Some of the quality problems that plague
this method can be traced to the mould and the taper of the narrow face. Currently Nucor is
using an approximate1% linear taper, which changes slightly with different steel grade and
desired final product width. It appears that currently there is excessive taper in the narrow face,
4
which causes too much contact between the narrow face of the mould and the solidifying steel
slab. The narrow face taper is used to compensate for the wide face shrinkage of the shell, which
is dominated by thermal strain controlled by mould heat transfer. The heat transfer includes the
transfer through the solidifying shell, from the shell surface to the copper mould outer surface,
through the copper mould, and from the copper mould inner surface to the mould cooling water.
The optimal narrow face taper allows proper solidification of the steel strand by staying in
contact with the steel strand while it shrinks to continue the solidification process, but not
imposing any force on the steel shell.
Excessive taper causes numerous imperfections in the slabs of steel produced. One such
problem is the narrow face of the mould wears away. If this occurs, the narrow face squeezes the
steel shell, the friction between the steel shell and the narrow face wears away copper from the
narrow face and subsequently the narrow face is worn down. The copper gets into the steel and
changes its composition and the resulting product is not what was specified by the customer.
Excessive taper also creates an extra tensile stress which results in transverse cracking that
ranges from rough edges on the final coil of steel to shallow transverse cracks that penetrate from
2 to 4 inches into the coil. Another problem is that the wide face of the steel shell buckles due to
too much contact between the steel shell and the narrow face of the mould. This causes
longitudinal cracks in the steel slab because the heat transfer by conduction is hindered. See
Appendix A-3 for pictures of these defects.
However, insufficient taper can also cause numerous problems. The worst are breakouts
in the steel shell, which result in molten steel pouring over the casting equipment. This is
extremely undesirable because it results in production loss and damage to the equipment.
The major concern with defects in the steel slab is the loss of revenue. Nucor loses $90-
$100 a ton if they have to sell the slabs 2nd grade due to defects. Approximately three percent of
Nucor’s steel is sold 2nd grade. Nucor produces approximately 5500 tons per day. This works
out to a cost penalty of $4.3 million dollars per year. Furthermore, if the steel is defective, then
the company must stay out of certain markets. For example, peritectic steels are not cast.
Nucor also experiences problems in controlling the narrow face taper. Currently the
linear screw system used to adjust the position of the narrow faces is also the measurement
device for narrow face taper. See Appendix A-4 for a picture of Nucor’s linear screw system. A
geometric relationship between the position of the top and bottom of the narrow face defines the
5
taper of the narrow face. Preliminary evidence, to be presented later in the Data Collection
section of this paper, shows evidence of this problem. Optimal narrow face taper is only half the
solution; in order to effectively use the desired taper, the narrow face control system has to be
accurate enough to implement it.
PROJECT GOALS AND OBJECTIVES
The major goal of this project is to recommend the proper taper designs to eliminate the
problems in thin slab continuous casting. In order to accomplish this, a finite-difference code
written to analyze traditional continuous casting, CON1D, must be calibrated and altered to
account for thin slab conditions including the funnel present in the mould. In the process of
doing so, the user-friendliness of the program will be evaluated and appropriate changes will be
made. CON1D was originally written for traditional continuous casting, moulds that had flat,
parallel wide faces. Thus, a procedure must be defined to use the outputs from CON1D and the
relationship between the shape of the funnel and the extra perimeter in the wide face in order to
make an educated prediction of the optimal narrow face taper. In addition to altering CON1D, it
must be calibrated to simulate the casting conditions at Nucor’s facility. Thus, data will be
collected from plant measurements including heat flux data, temperature gradients, dimensions
of the mould, specifications of the cooling water, etc. to be used as inputs for CON1D. To
validate CON1D results, a different taper prediction model created by Rob Nunnington, a steel
industry consultant, will be studied and used. Along with the numerical analysis, the effect of
plastic strain on the taper will be investigated. The plastic strain imparted by the shape change of
going from a funnel to a flat wall, see Figures 1 and 2 above, will also be considered in our
analysis.
The second goal is to help improve the method in which the narrow face taper is
controlled and measured. After the proper taper has been found, it must be implemented
accurately to find whether or not the predictions are correct. The taper is currently controlled
with a linear screw configuration for which the linear distance of travel per rotation has been
calculated. This system, however, is believed to be inaccurate and Nucor is unsure if they are
actually implementing the target taper. Nucor has tried to measure the taper with inclinometers,
see Appendix A-5 for a picture of the Jewell Inclinometer previously used by Nucor, but their
6
efforts have proved unsuccessful. Thus, the goal is to gain an understanding of Nucor’s
procedures for setup and operation, and to find areas of improvement. If a new system could be
devised to control and measure the taper, it could improve the quality of the final product.
In achieving these goals, two positive effects will result for Nucor. The first is that they
will have an increased profit because they will be able to sell less of their steel at 2nd grade. The
second effect is that it will enhance their manufacturing capabilities. As previously mentioned,
Nucor only casts high and low carbon steels. They currently do not cast peritectic or stainless
steels. If meeting these goals can improve their casting process, Nucor could move into those
markets and grow as a company.
DISCUSSION
LITERATURE REVIEW
In order to understand the phenomena and current state of continuous casting, it was
necessary to conduct a thorough literature search.
Thomas, Ho, and Li [1] discuss the theory and formulation of the CON1D program used
in this analysis. They present the phenomena occurring in continuous casting and the equations
and assumptions used in CON1D to analyze traditional continuous casting. Most importantly,
the paper discusses how comparing outputs and computations with actual plant data validated the
code. It provides proof that the CON1D program is an adequate tool for analyzing continuous
casting.
Lait, Brimacombe, and Weinberg’s [2] paper, which discusses the use of a one-
dimensional finite-difference model to analyze continuous casting, again demonstrates the
usefulness and effectiveness of creating a numerical model to better understand a complex
process. They examine in-depth the temperature profiles and pool profiles that develop in
continuous casting.
In a paper by Won and Thomas [3], the method by which the program CON1D calculates
steel properties as a function of composition is presented. Several equations and tables are
included to explain the theory behind the model. Thus, in CON1D, the user inputs the chemical
composition of the steel and CON1D calculates such quantities as the steel liquidus temperature
and the steel density.
7
Park, Thomas, and Samarasekara [4] present a rigorous analysis of thin slab casting, for
both parallel and funnel moulds, and present a thermal-elastic-plastic-creep finite-element model
that is validated. They provide an analysis of funnel geometry that is rederived in the
Theoretical Background section of this paper and utilized in this project. This funnel analysis
was used to examine the effect of the funnel shape on several parameters in the mould. The
paper also included several plots of variables such as thermal expansion and mould flux
thickness that were used to check the numerical model, CON1D, used in this project. In
addition, this paper offered a comprehensive literature review of work done to model traditional
and thin slab continuous casting.
Park, Thomas, Samarasekera, and Yoon [5] and [6] wrote a two part paper on the thermal
and mechanical behavior of copper moulds during thin slab casting. The first part discusses a
three-dimensional finite-element thermal-stress model developed to predict the phenomena
occurring in funnel and parallel moulds during casting. The second part discusses crack
formation in the moulds. Several important ideas and concepts about thin slab continuous
casting were gained from these papers.
The copper mould is also the subject of a paper by Thomas, Moitra, and Habing[7]. A
three-dimensional finite-element thermal-stress model is presented to examine what factors
effect the distortion of the mould. Another significant finding from the paper is what factors do
not effect mould distortion. These are mould clamping forces, bolt pre-stress, friction, and
ferrostatic pressure.
Several studies have suggested that non-linear taper would improve the overall heat
transfer and solve some of the problems associated with taper. A report from the billet casting
industry [8] says a parabolic taper can improve product quality by decreasing defects and
increasing casting speed. Cristallini, et al [9] also presented the benefits of implementing non-
linearity in mold design.
Stone and Thomas [10] conducted an investigation into measuring and modeling heat
transfer across the mould flux layer. This paper discusses the previous work in this area and the
uncertainty surrounding the value of the thermal conductivity of the flux layer. The study
provides a justification for the alteration of this value for calibration purposes in CON1D.
8
THEORETICAL BACKGROUND
CON1D
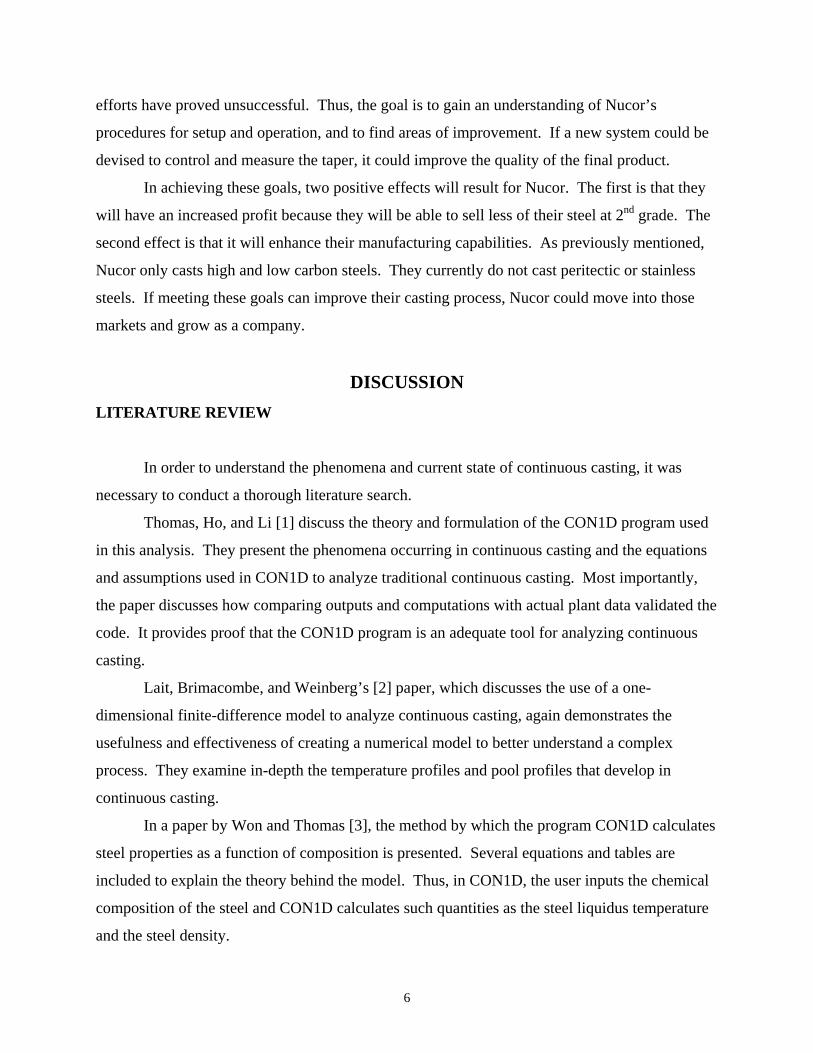
A complex mix of heat transfer, mass transfer, and fluid mechanics are present in
continuous casting and dictate how the steel solidifies. Figure 4, from reference 1, is a close up
view of what is occurring at the steel-mould interface.
Figure 4: Schematic of interface between solidifying steel and mould.
In order to do a complete analysis of Nucor’s casting process, the mechanics of how the steel is
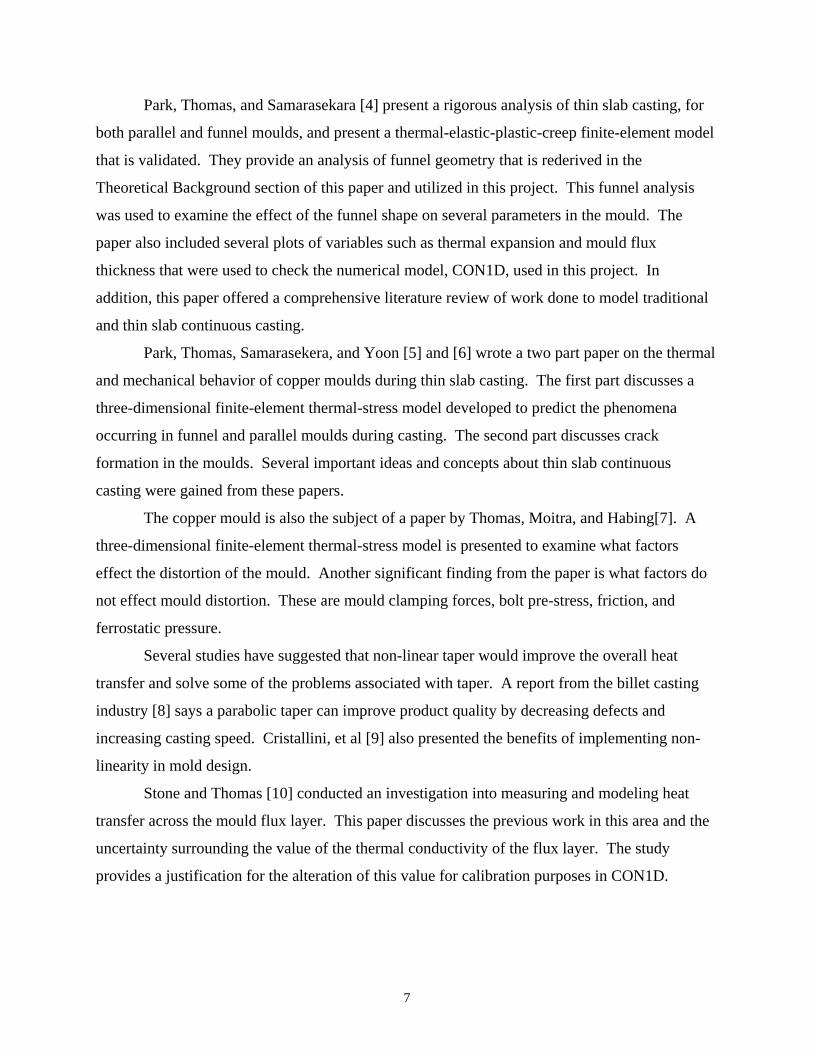
forming must be understood and be able to be modeled. Several pertinent equations must be
solved for this analysis. The first is the transient heat conduction equation that governs the
temperature in the thin solidifying shell. The equation is
(1)
ρ = Density Cp = Specific heat k = Thermal conductivity t = Time T = Temperature
2
2
2
∂∂
∂∂
+∂∂
=∂∂
xT
Tk
xTk
xTCpρ

9
The two dimensional, steady state temperature within a rectangular vertical section of the mould
is governed by the equation,
0)( 2
2
2
2
=∂∂
+∂∂
yT
xTkm (2)
km = Mould thermal conductivity
Also, mass and momentum balances must be performed on the material moving through the
funnel.
During the casting process, Nucor measures the heat removal from each face
independently by monitoring the change in temperature of the mould cooling water and using the
equation,
TCQq p∆= ρ.
(3)
q = Heat removal in units of energy per time Q = Cooling water flow rate ρ = Density of water Cp = Specific heat of water This heat removal needs to be converted to a heat flux. The equation used is
))1000/_(*)1000/)__((
.".
WidthMouldDepthMeniscusLengthMouldqq
−= (4)
q(dot)” = Heat flux q(dot) = Heat removal from Equation 3 Mould_Length = Entire mould length, 1100 mm in mould analyzed in this study Meniscus_Depth = Instantaneous meniscus depth as recorded by Nucor (mm) Mould_Width = Instantaneous mould width as recorded by Nucor (mm)

10
Narrow Face Taper
As previously stated in the Background section of this paper, taper in Nucor’s funnel
mould is defined as the change in position of the narrow face from the top to the bottom of the
mould. Narrow face taper can be represented in three ways. The first is by percent taper per
meter (%taper/m), the second is by percent taper per mould (%taper/mould), and the third is by a
distance value in millimeters. The first two representations of taper can be used to acquire the
third, which is the most useful during the casting operation. There is a difference however
between %taper/m and %taper/mould in terms of calculating taper in millimeters. The %taper/m
can be used to find the change in narrow face position anywhere along the narrow face. Whereas
the %taper/mould only gives the absolute change in narrow face position between the top and the
bottom of the mould. At Nucor, %taper/mould is the common value used to calculate taper.
Below are the equations in which %taper/m and %taper/mould are used to calculate taper.
)_(*)__(*)/(%)( WidthBottomMeniscusBelowPositionmtapermmNFT = (5)
)_(*)/(%)( WidthBottommouldtapermmNFT = (6)
NFT = narrow face taper
%taper/m = the percent taper per meter based on the grade of steel that is cast
Position_Below_Menisucs = vertical distance from the meniscus (mm)
Bottom_Width = Exit mould width (in meters for Equation 5 and millimeters in Equation 6)
The numerical model, CON1D which is used in this study, calculates a suggested linear
narrow face taper with the following equation,
m
exitmouldssol
ZTTLETTLE
mTP)()(
)/(% )_(,−= (7)
Tsol = Solidus temperature of the steel, Zm = Mould length TLE = Thermal linear function of the steel grade that is calculated from weighted averages of the phases present Ts,(mould_exit) = Surface temperature of the steel at mould exit
11
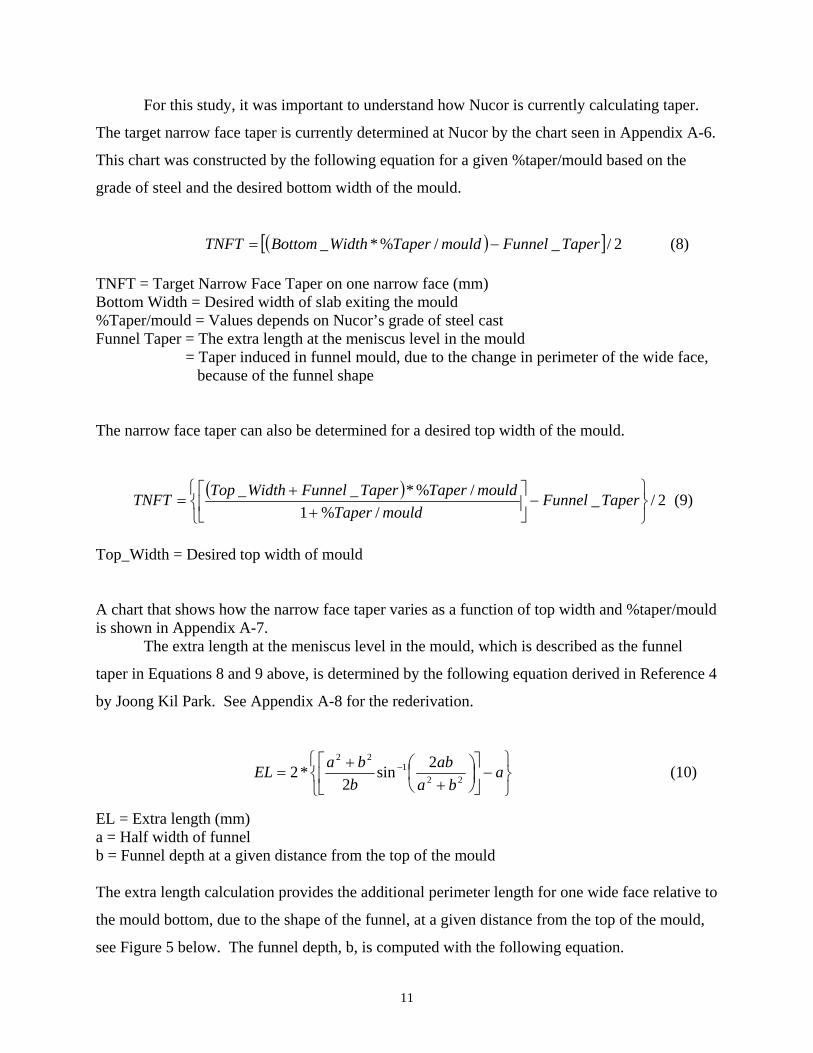
For this study, it was important to understand how Nucor is currently calculating taper.
The target narrow face taper is currently determined at Nucor by the chart seen in Appendix A-6.
This chart was constructed by the following equation for a given %taper/mould based on the
grade of steel and the desired bottom width of the mould.
( )[ ] 2/_/%*_ TaperFunnelmouldTaperWidthBottomTNFT −= (8)
TNFT = Target Narrow Face Taper on one narrow face (mm) Bottom Width = Desired width of slab exiting the mould %Taper/mould = Values depends on Nucor’s grade of steel cast Funnel Taper = The extra length at the meniscus level in the mould = Taper induced in funnel mould, due to the change in perimeter of the wide face,
because of the funnel shape The narrow face taper can also be determined for a desired top width of the mould.
( ) 2/_/%1
/%*__
−
+
+= TaperFunnel
mouldTapermouldTaperTaperFunnelWidthTopTNFT (9)
Top_Width = Desired top width of mould A chart that shows how the narrow face taper varies as a function of top width and %taper/mould is shown in Appendix A-7.
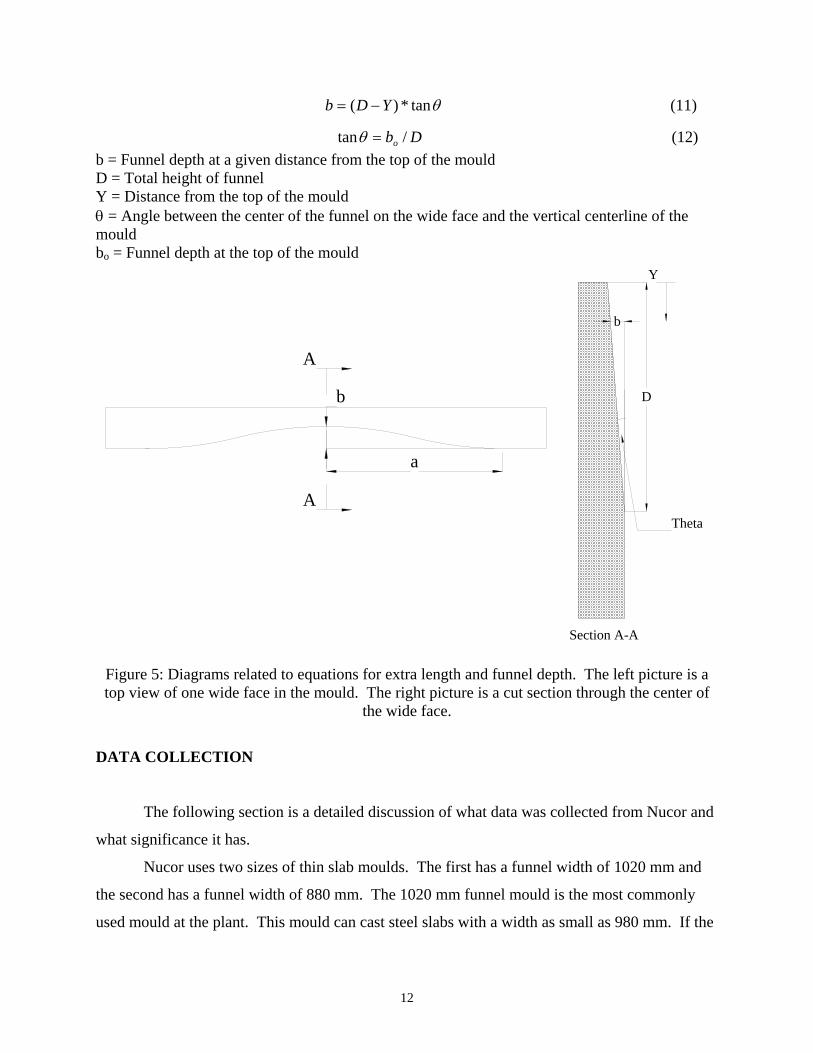
The extra length at the meniscus level in the mould, which is described as the funnel
taper in Equations 8 and 9 above, is determined by the following equation derived in Reference 4
by Joong Kil Park. See Appendix A-8 for the rederivation.
−
++
= − aba
abbbaEL 22
122 2sin
2*2 (10)
EL = Extra length (mm) a = Half width of funnel b = Funnel depth at a given distance from the top of the mould The extra length calculation provides the additional perimeter length for one wide face relative to
the mould bottom, due to the shape of the funnel, at a given distance from the top of the mould,
see Figure 5 below. The funnel depth, b, is computed with the following equation.
12
θtan*)( YDb −= (11)
Dbo /tan =θ (12) b = Funnel depth at a given distance from the top of the mould D = Total height of funnel Y = Distance from the top of the mould θ = Angle between the center of the funnel on the wide face and the vertical centerline of the mould bo = Funnel depth at the top of the mould
Figure 5: Diagrams related to equations for extra length and funnel depth. The left picture is a top view of one wide face in the mould. The right picture is a cut section through the center of
the wide face.
DATA COLLECTION
The following section is a detailed discussion of what data was collected from Nucor and
what significance it has.
Nucor uses two sizes of thin slab moulds. The first has a funnel width of 1020 mm and
the second has a funnel width of 880 mm. The 1020 mm funnel mould is the most commonly
used mould at the plant. This mould can cast steel slabs with a width as small as 980 mm. If the
b
a
A
A
D
Section A-A
b
Theta
Y
13
customer wants a smaller width, the 880 mm funnel mould is used. The funnel is necessary to
allow the submerged entry nozzle (SEN) to enter the mould. The SEN is responsible for pouring
the molten steel into the mould, which extends down 175 mm from the top of the mould.
Uniform heat removal is an important aspect of the continuous casting mould. In
Nucor’s funnel moulds, the inlet cooling water temperature is kept at a constant 100 oF. The
1020 mm funnel mould has water channels running the length of the wide and narrow faces in
which the cooling water flows through to remove heat from the steel. The 880 mm funnel mould
has rifle drilled holes through the length of the wide and narrow faces for the cooling water to
flow through. The cooling water flow rate on the wide face is 1200 gal/min while on the narrow
face it is 30 gal/min.
The sequence data from several casting runs was obtained from Nucor. The spreadsheets
obtained are attached electronically to this report, but a sample of the sequence data in
graphically from can be found in Appendix A-9. The sequence data contains all the parameters
that Nucor measures and records during casting. Also included in the sequence data are several
calculations Nucor performs for monitoring purposes. One such calculation is finding the heat
removal by Equation 3.
Currently, Nucor is implementing a linear screw system, see Appendix A-4 for a
photograph, to control the position of the narrow faces and the amount of taper. In the past,
Nucor has attempted to use inclinometers attached to the narrow faces to measure and control the
taper, but the inclinometers failed to produce accurate and consistent measurements. Nucor’s
mould oscillates at a frequency between 4 to 6 Hz during the casting operation. The oscillations
were detrimental to the inclinometer readings and thus it was never clear exactly at what value
the narrow face taper had been set.
The narrow face positions as well as the narrow face taper are continuously recorded by
computer during the continuous casting operation. At the end of a casting run the casting
operators measure the narrow face taper using a hand inclinometer, see Appendix A-10 for a
picture of the hand inclinometer, and this measurement is compared to the final narrow face taper
displayed on the computer screen. These two final narrow face taper values are then compared
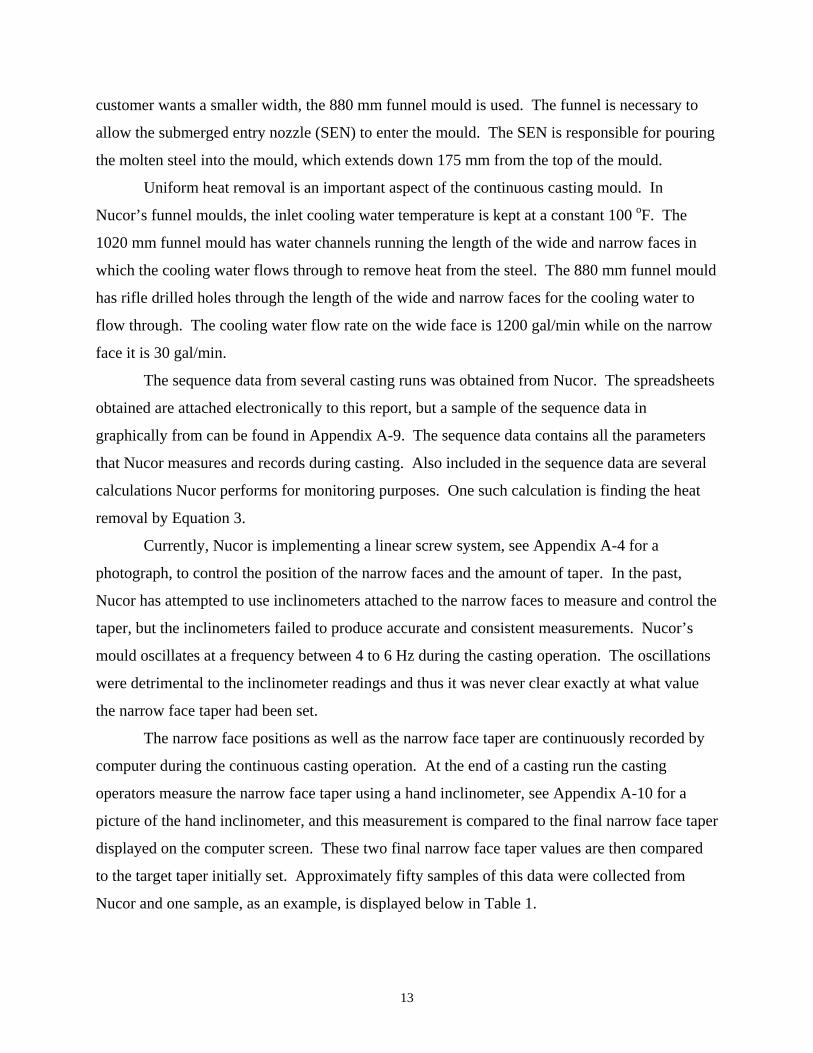
to the target taper initially set. Approximately fifty samples of this data were collected from
Nucor and one sample, as an example, is displayed below in Table 1.
14
Table 1: A comparison of two narrow face taper measurements to the initially set target taper
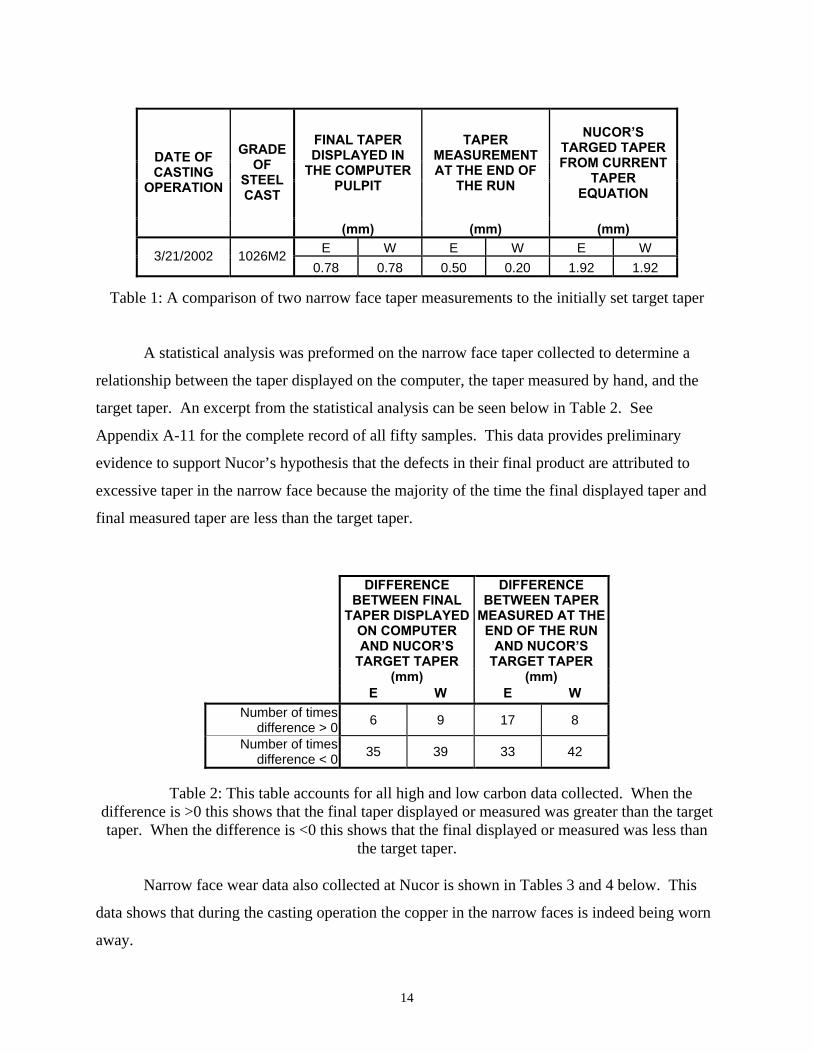
A statistical analysis was preformed on the narrow face taper collected to determine a
relationship between the taper displayed on the computer, the taper measured by hand, and the
target taper. An excerpt from the statistical analysis can be seen below in Table 2. See
Appendix A-11 for the complete record of all fifty samples. This data provides preliminary
evidence to support Nucor’s hypothesis that the defects in their final product are attributed to
excessive taper in the narrow face because the majority of the time the final displayed taper and
final measured taper are less than the target taper.
Table 2: This table accounts for all high and low carbon data collected. When the difference is >0 this shows that the final taper displayed or measured was greater than the target taper. When the difference is <0 this shows that the final displayed or measured was less than
the target taper.
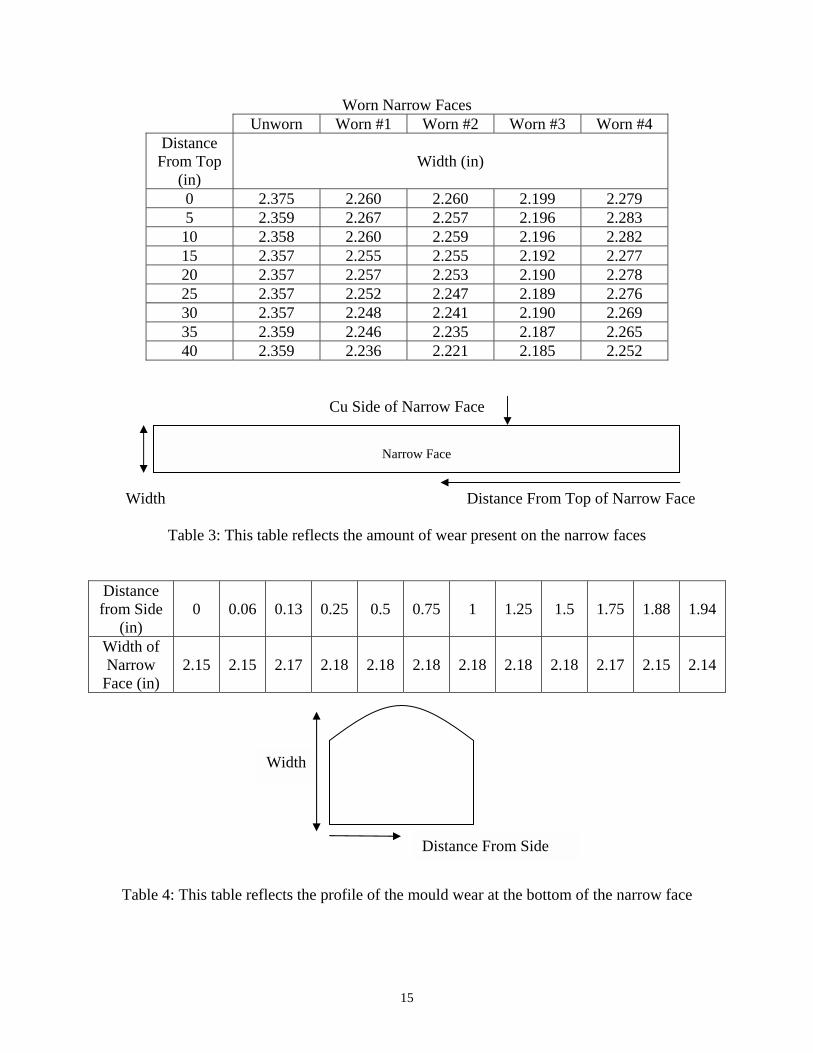
Narrow face wear data also collected at Nucor is shown in Tables 3 and 4 below. This
data shows that during the casting operation the copper in the narrow faces is indeed being worn
away.
FINAL TAPER DISPLAYED IN
THE COMPUTER PULPIT
TAPER MEASUREMENT AT THE END OF
THE RUN
NUCOR�S TARGED TAPER FROM CURRENT
TAPER EQUATION
DATE OF CASTING
OPERATION
GRADE OF
STEEL CAST
(mm) (mm) (mm) E W E W E W 3/21/2002 1026M2
0.78 0.78 0.50 0.20 1.92 1.92
DIFFERENCE BETWEEN FINAL
TAPER DISPLAYED ON COMPUTER AND NUCOR�S
TARGET TAPER
DIFFERENCE BETWEEN TAPER
MEASURED AT THE END OF THE RUN
AND NUCOR�S TARGET TAPER
(mm) (mm) E W E W
Number of times difference > 0 6 9 17 8
Number of times difference < 0 35 39 33 42
15
Worn Narrow Faces Unworn Worn #1 Worn #2 Worn #3 Worn #4
Distance From Top
(in) Width (in)
0 2.375 2.260 2.260 2.199 2.279 5 2.359 2.267 2.257 2.196 2.283 10 2.358 2.260 2.259 2.196 2.282 15 2.357 2.255 2.255 2.192 2.277 20 2.357 2.257 2.253 2.190 2.278 25 2.357 2.252 2.247 2.189 2.276 30 2.357 2.248 2.241 2.190 2.269 35 2.359 2.246 2.235 2.187 2.265 40 2.359 2.236 2.221 2.185 2.252
Cu Side of Narrow Face
Width Distance From Top of Narrow Face
Table 3: This table reflects the amount of wear present on the narrow faces
Distance from Side
(in) 0 0.06 0.13 0.25 0.5 0.75 1 1.25 1.5 1.75 1.88 1.94
Width of Narrow
Face (in) 2.15 2.15 2.17 2.18 2.18 2.18 2.18 2.18 2.18 2.17 2.15 2.14
Table 4: This table reflects the profile of the mould wear at the bottom of the narrow face
Distance From Side
Narrow Face
Width
16
CON1D
A previously created Fortran program called CON1D solves Equations 1, 2, and many
others related to continuous casting. CON1D utilizes a 1-D transient finite-difference calculation
of heat conduction within the solidifying steel shell coupled with 2-D steady-state heat
conduction within the mold wall. CON1D also handles heat transfer across the interfaces of the
copper, mould flux and solidifying steel, while simultaneously performing mass and momentum
balances on the flux layers. It also takes into account radiation phenomena. For more
information regarding the formulation and theory employed in CON1D, refer to the user manual
for CON1D or to Reference 1. This code has been employed in the Continuous Casting
Consortium for the past several years, and has been proved an accurate tool for analyzing
continuous casting.
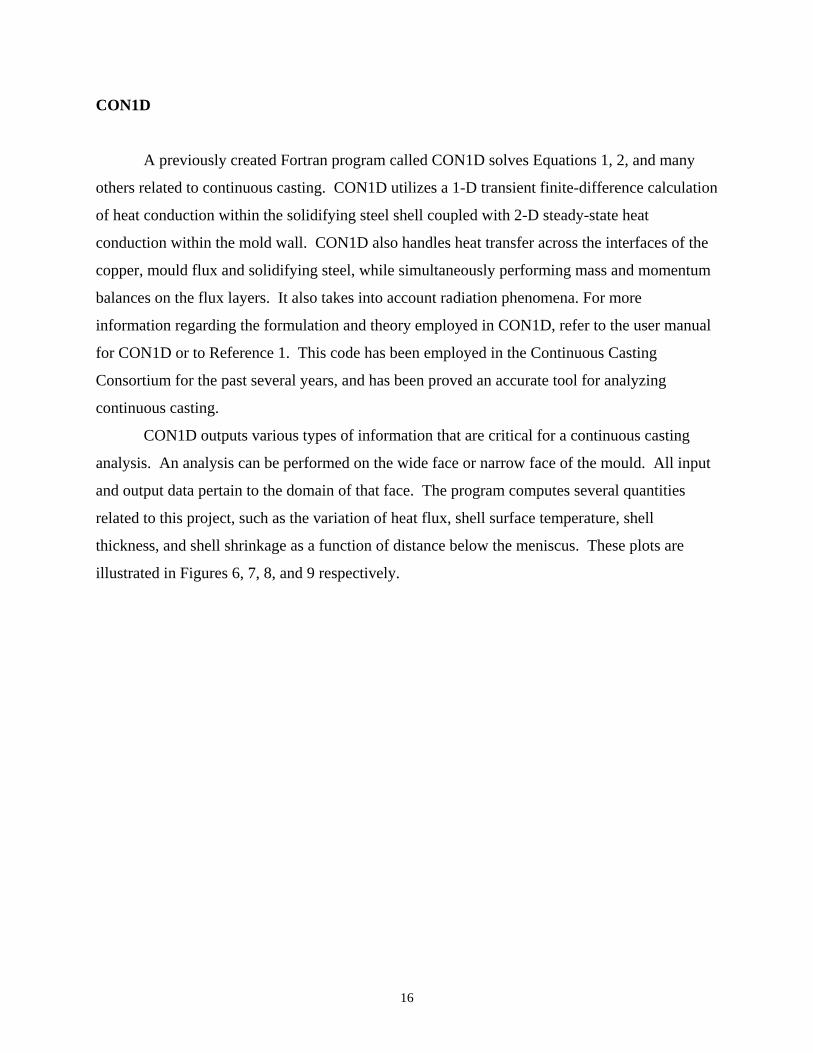
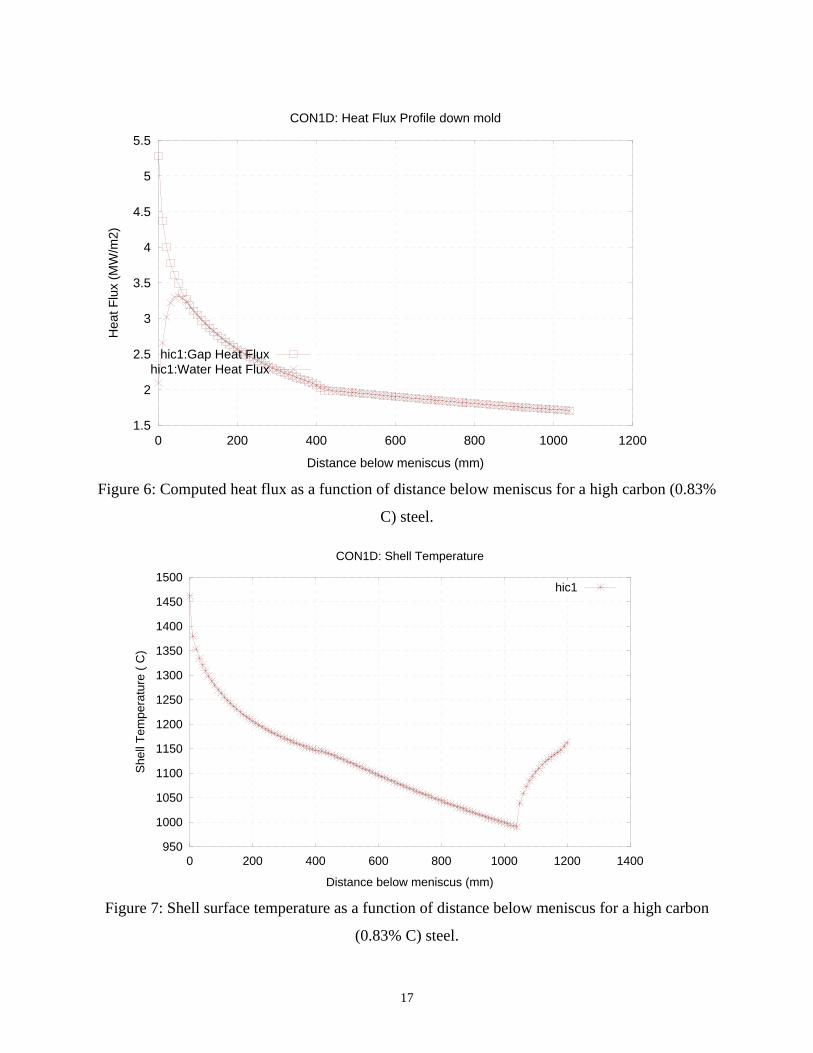
CON1D outputs various types of information that are critical for a continuous casting
analysis. An analysis can be performed on the wide face or narrow face of the mould. All input
and output data pertain to the domain of that face. The program computes several quantities
related to this project, such as the variation of heat flux, shell surface temperature, shell
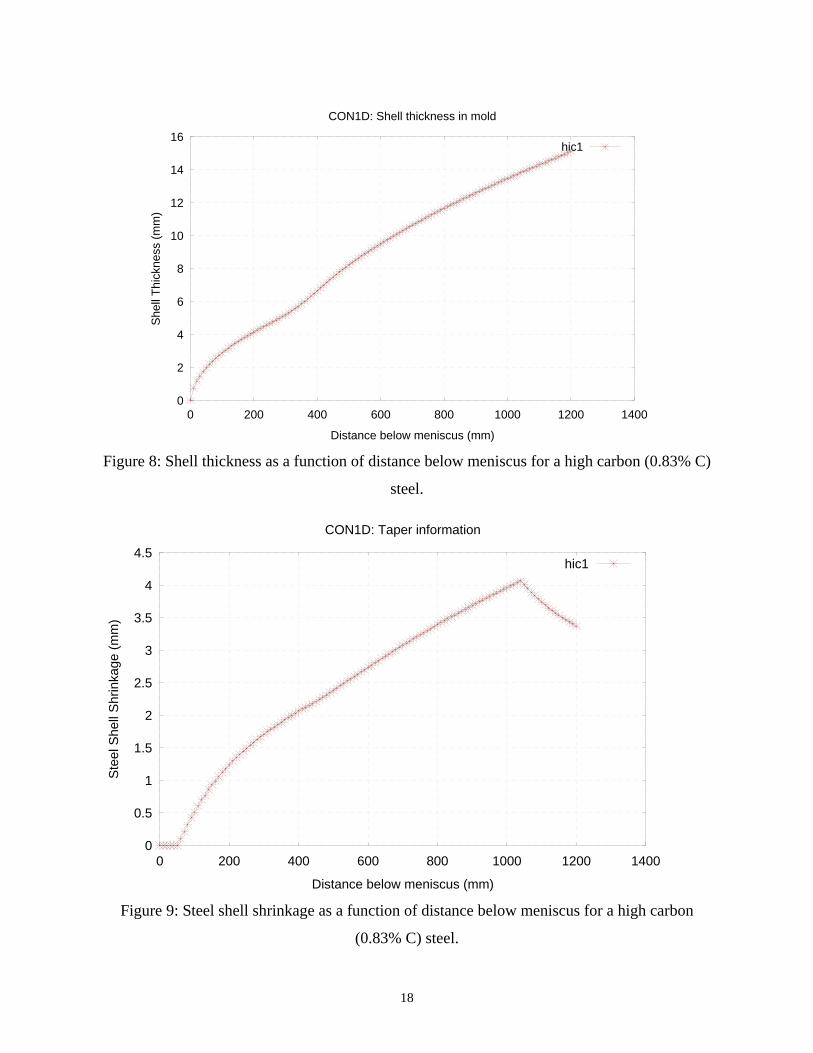
thickness, and shell shrinkage as a function of distance below the meniscus. These plots are
illustrated in Figures 6, 7, 8, and 9 respectively.
17
1.5
2
2.5
3
3.5
4
4.5
5
5.5
0 200 400 600 800 1000 1200
Hea
t Flu
x (M
W/m
2)
Distance below meniscus (mm)
CON1D: Heat Flux Profile down mold
hic1:Gap Heat Fluxhic1:Water Heat Flux
Figure 6: Computed heat flux as a function of distance below meniscus for a high carbon (0.83%
C) steel.
950
1000
1050
1100
1150
1200
1250
1300
1350
1400
1450
1500
0 200 400 600 800 1000 1200 1400
She
ll Te
mpe
ratu
re (
C)
Distance below meniscus (mm)
CON1D: Shell Temperature
hic1
Figure 7: Shell surface temperature as a function of distance below meniscus for a high carbon
(0.83% C) steel.
18
0
2
4
6
8
10
12
14
16
0 200 400 600 800 1000 1200 1400
She
ll Th
ickn
ess
(mm
)
Distance below meniscus (mm)
CON1D: Shell thickness in mold
hic1
Figure 8: Shell thickness as a function of distance below meniscus for a high carbon (0.83% C)
steel.
0
0.5
1
1.5
2
2.5
3
3.5
4
4.5
0 200 400 600 800 1000 1200 1400
Ste
el S
hell
Shr
inka
ge (m
m)
Distance below meniscus (mm)
CON1D: Taper information
hic1
Figure 9: Steel shell shrinkage as a function of distance below meniscus for a high carbon
(0.83% C) steel.
19
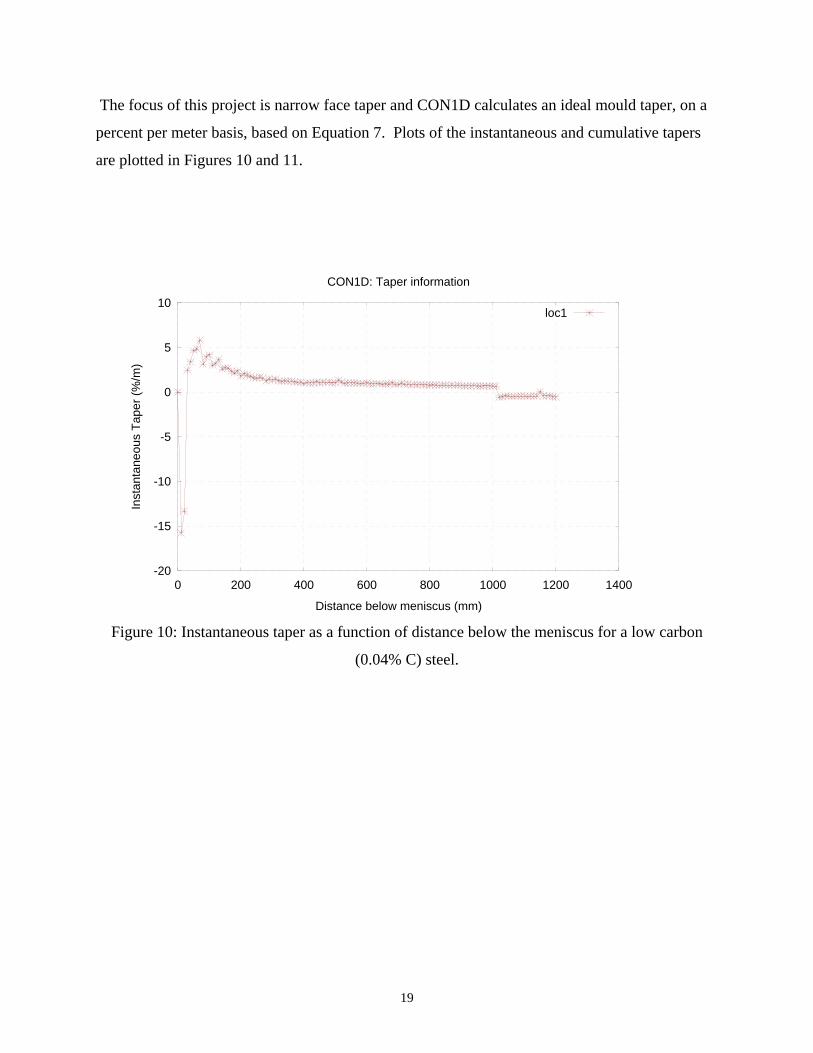
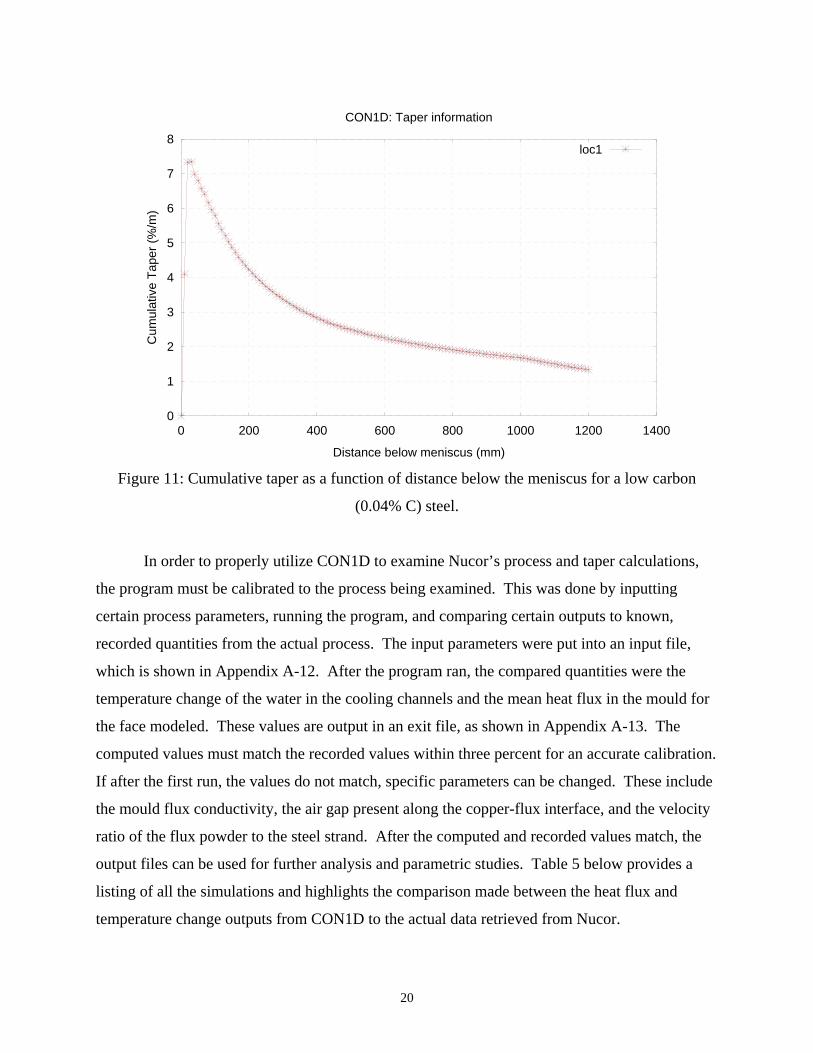
The focus of this project is narrow face taper and CON1D calculates an ideal mould taper, on a
percent per meter basis, based on Equation 7. Plots of the instantaneous and cumulative tapers
are plotted in Figures 10 and 11.
-20
-15
-10
-5
0
5
10
0 200 400 600 800 1000 1200 1400
Inst
anta
neou
s Ta
per (
%/m
)
Distance below meniscus (mm)
CON1D: Taper information
loc1
Figure 10: Instantaneous taper as a function of distance below the meniscus for a low carbon
(0.04% C) steel.
20
0
1
2
3
4
5
6
7
8
0 200 400 600 800 1000 1200 1400
Cum
ulat
ive
Tape
r (%
/m)
Distance below meniscus (mm)
CON1D: Taper information
loc1
Figure 11: Cumulative taper as a function of distance below the meniscus for a low carbon
(0.04% C) steel.
In order to properly utilize CON1D to examine Nucor’s process and taper calculations,
the program must be calibrated to the process being examined. This was done by inputting
certain process parameters, running the program, and comparing certain outputs to known,
recorded quantities from the actual process. The input parameters were put into an input file,
which is shown in Appendix A-12. After the program ran, the compared quantities were the
temperature change of the water in the cooling channels and the mean heat flux in the mould for
the face modeled. These values are output in an exit file, as shown in Appendix A-13. The
computed values must match the recorded values within three percent for an accurate calibration.
If after the first run, the values do not match, specific parameters can be changed. These include
the mould flux conductivity, the air gap present along the copper-flux interface, and the velocity
ratio of the flux powder to the steel strand. After the computed and recorded values match, the
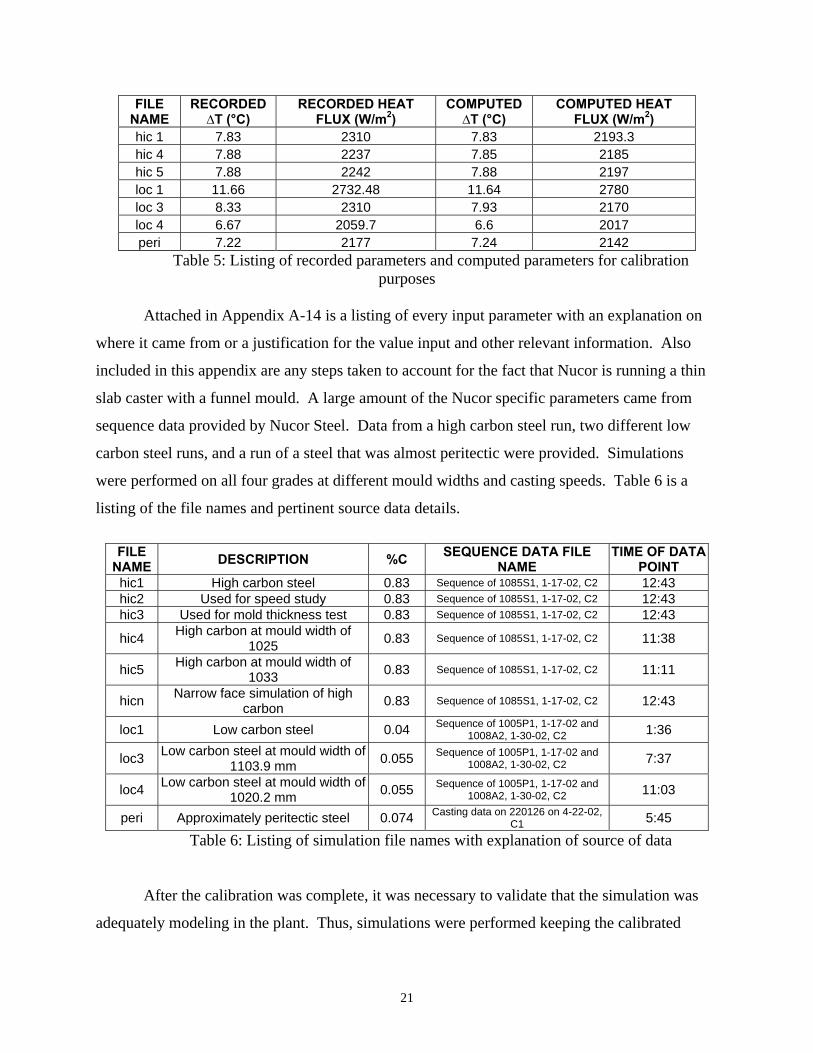
output files can be used for further analysis and parametric studies. Table 5 below provides a
listing of all the simulations and highlights the comparison made between the heat flux and
temperature change outputs from CON1D to the actual data retrieved from Nucor.
21
FILE NAME
RECORDED ∆T (°C)
RECORDED HEAT FLUX (W/m2)
COMPUTED ∆T (°C)
COMPUTED HEAT FLUX (W/m2)
hic 1 7.83 2310 7.83 2193.3 hic 4 7.88 2237 7.85 2185 hic 5 7.88 2242 7.88 2197 loc 1 11.66 2732.48 11.64 2780 loc 3 8.33 2310 7.93 2170 loc 4 6.67 2059.7 6.6 2017 peri 7.22 2177 7.24 2142
Table 5: Listing of recorded parameters and computed parameters for calibration purposes
Attached in Appendix A-14 is a listing of every input parameter with an explanation on
where it came from or a justification for the value input and other relevant information. Also
included in this appendix are any steps taken to account for the fact that Nucor is running a thin
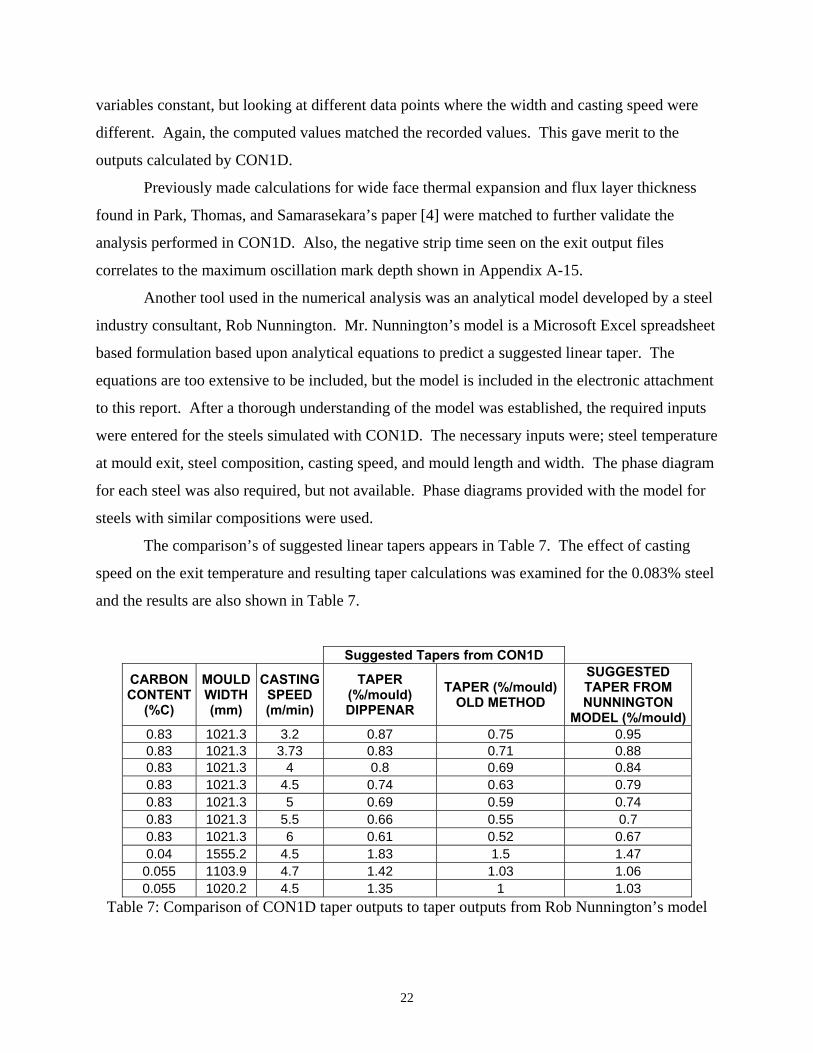
slab caster with a funnel mould. A large amount of the Nucor specific parameters came from
sequence data provided by Nucor Steel. Data from a high carbon steel run, two different low
carbon steel runs, and a run of a steel that was almost peritectic were provided. Simulations
were performed on all four grades at different mould widths and casting speeds. Table 6 is a
listing of the file names and pertinent source data details.
Table 6: Listing of simulation file names with explanation of source of data
After the calibration was complete, it was necessary to validate that the simulation was
adequately modeling in the plant. Thus, simulations were performed keeping the calibrated
FILE NAME DESCRIPTION %C SEQUENCE DATA FILE
NAME TIME OF DATA
POINT hic1 High carbon steel 0.83 Sequence of 1085S1, 1-17-02, C2 12:43 hic2 Used for speed study 0.83 Sequence of 1085S1, 1-17-02, C2 12:43 hic3 Used for mold thickness test 0.83 Sequence of 1085S1, 1-17-02, C2 12:43
hic4 High carbon at mould width of 1025 0.83 Sequence of 1085S1, 1-17-02, C2 11:38
hic5 High carbon at mould width of 1033 0.83 Sequence of 1085S1, 1-17-02, C2 11:11
hicn Narrow face simulation of high carbon 0.83 Sequence of 1085S1, 1-17-02, C2 12:43
loc1 Low carbon steel 0.04 Sequence of 1005P1, 1-17-02 and 1008A2, 1-30-02, C2 1:36
loc3 Low carbon steel at mould width of 1103.9 mm 0.055 Sequence of 1005P1, 1-17-02 and
1008A2, 1-30-02, C2 7:37
loc4 Low carbon steel at mould width of 1020.2 mm 0.055 Sequence of 1005P1, 1-17-02 and
1008A2, 1-30-02, C2 11:03
peri Approximately peritectic steel 0.074 Casting data on 220126 on 4-22-02, C1 5:45
22
variables constant, but looking at different data points where the width and casting speed were
different. Again, the computed values matched the recorded values. This gave merit to the
outputs calculated by CON1D.
Previously made calculations for wide face thermal expansion and flux layer thickness
found in Park, Thomas, and Samarasekara’s paper [4] were matched to further validate the
analysis performed in CON1D. Also, the negative strip time seen on the exit output files
correlates to the maximum oscillation mark depth shown in Appendix A-15.
Another tool used in the numerical analysis was an analytical model developed by a steel
industry consultant, Rob Nunnington. Mr. Nunnington’s model is a Microsoft Excel spreadsheet
based formulation based upon analytical equations to predict a suggested linear taper. The
equations are too extensive to be included, but the model is included in the electronic attachment
to this report. After a thorough understanding of the model was established, the required inputs
were entered for the steels simulated with CON1D. The necessary inputs were; steel temperature
at mould exit, steel composition, casting speed, and mould length and width. The phase diagram
for each steel was also required, but not available. Phase diagrams provided with the model for
steels with similar compositions were used.
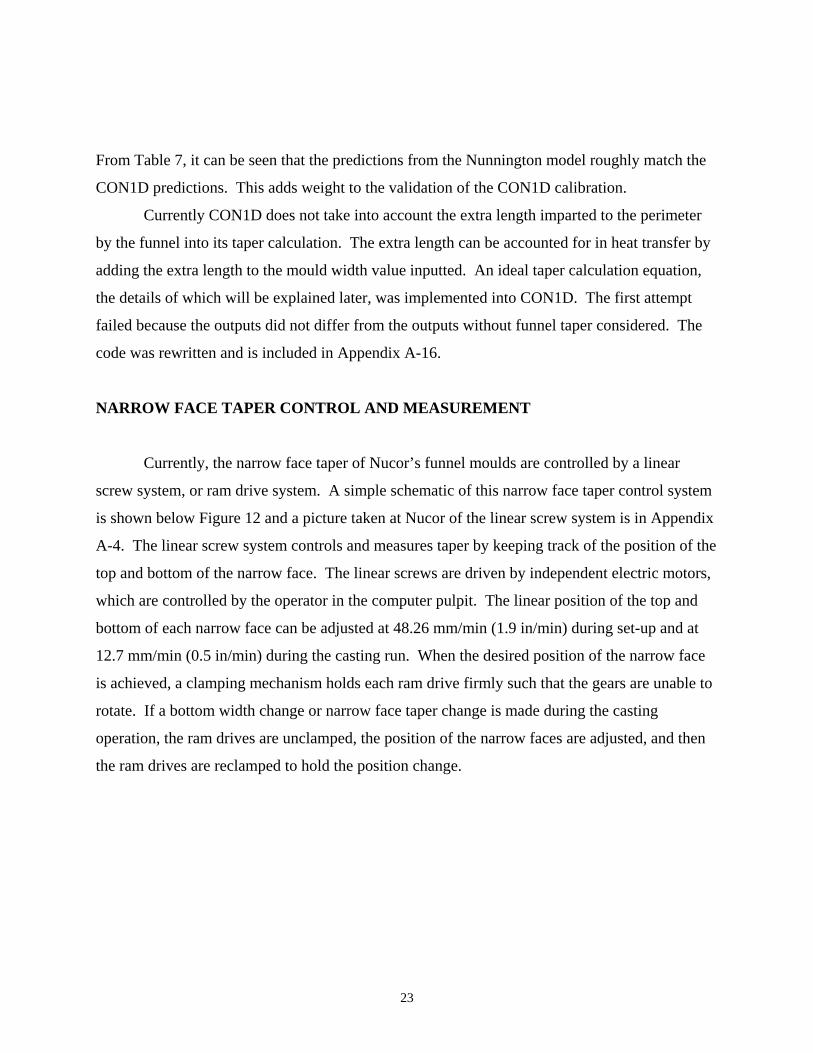
The comparison’s of suggested linear tapers appears in Table 7. The effect of casting
speed on the exit temperature and resulting taper calculations was examined for the 0.083% steel
and the results are also shown in Table 7.
Suggested Tapers from CON1D
CARBON CONTENT
(%C)
MOULD WIDTH (mm)
CASTING SPEED (m/min)
TAPER (%/mould) DIPPENAR
TAPER (%/mould) OLD METHOD
SUGGESTED TAPER FROM NUNNINGTON
MODEL (%/mould)0.83 1021.3 3.2 0.87 0.75 0.95 0.83 1021.3 3.73 0.83 0.71 0.88 0.83 1021.3 4 0.8 0.69 0.84 0.83 1021.3 4.5 0.74 0.63 0.79 0.83 1021.3 5 0.69 0.59 0.74 0.83 1021.3 5.5 0.66 0.55 0.7 0.83 1021.3 6 0.61 0.52 0.67 0.04 1555.2 4.5 1.83 1.5 1.47
0.055 1103.9 4.7 1.42 1.03 1.06 0.055 1020.2 4.5 1.35 1 1.03
Table 7: Comparison of CON1D taper outputs to taper outputs from Rob Nunnington’s model
23
From Table 7, it can be seen that the predictions from the Nunnington model roughly match the
CON1D predictions. This adds weight to the validation of the CON1D calibration.
Currently CON1D does not take into account the extra length imparted to the perimeter
by the funnel into its taper calculation. The extra length can be accounted for in heat transfer by
adding the extra length to the mould width value inputted. An ideal taper calculation equation,
the details of which will be explained later, was implemented into CON1D. The first attempt
failed because the outputs did not differ from the outputs without funnel taper considered. The
code was rewritten and is included in Appendix A-16.
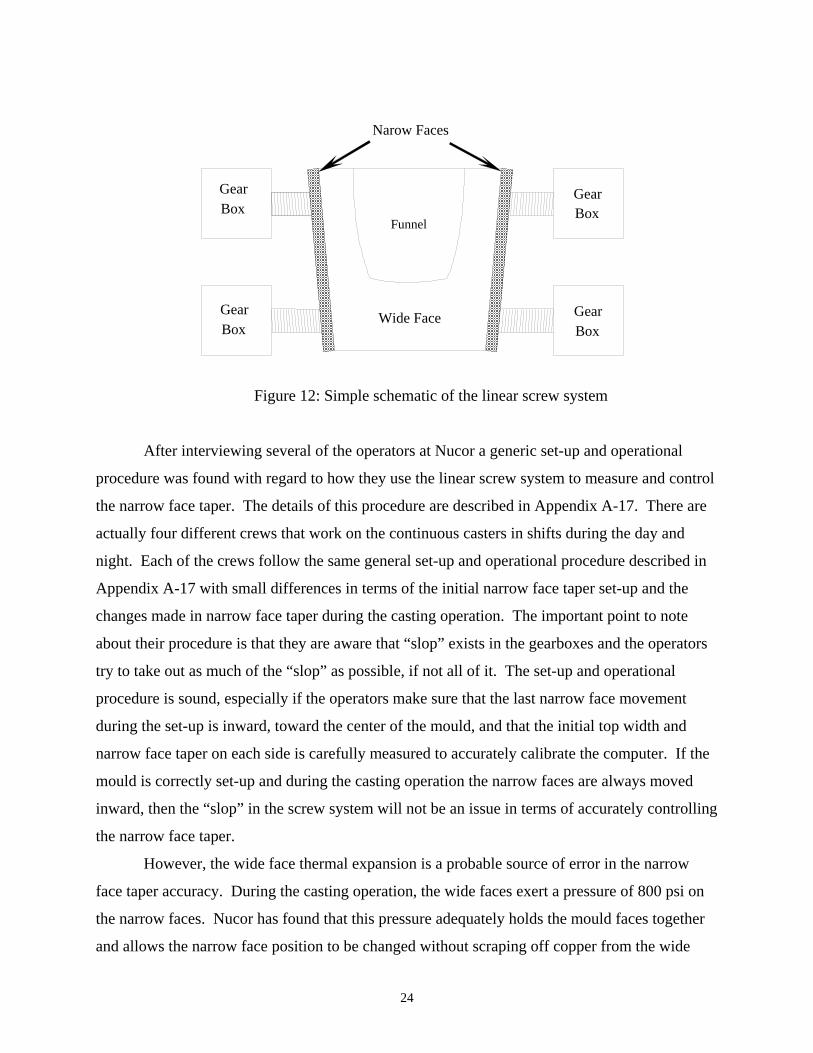
NARROW FACE TAPER CONTROL AND MEASUREMENT
Currently, the narrow face taper of Nucor’s funnel moulds are controlled by a linear
screw system, or ram drive system. A simple schematic of this narrow face taper control system
is shown below Figure 12 and a picture taken at Nucor of the linear screw system is in Appendix
A-4. The linear screw system controls and measures taper by keeping track of the position of the
top and bottom of the narrow face. The linear screws are driven by independent electric motors,
which are controlled by the operator in the computer pulpit. The linear position of the top and
bottom of each narrow face can be adjusted at 48.26 mm/min (1.9 in/min) during set-up and at
12.7 mm/min (0.5 in/min) during the casting run. When the desired position of the narrow face
is achieved, a clamping mechanism holds each ram drive firmly such that the gears are unable to
rotate. If a bottom width change or narrow face taper change is made during the casting
operation, the ram drives are unclamped, the position of the narrow faces are adjusted, and then
the ram drives are reclamped to hold the position change.
24
Figure 12: Simple schematic of the linear screw system
After interviewing several of the operators at Nucor a generic set-up and operational
procedure was found with regard to how they use the linear screw system to measure and control
the narrow face taper. The details of this procedure are described in Appendix A-17. There are
actually four different crews that work on the continuous casters in shifts during the day and
night. Each of the crews follow the same general set-up and operational procedure described in
Appendix A-17 with small differences in terms of the initial narrow face taper set-up and the
changes made in narrow face taper during the casting operation. The important point to note
about their procedure is that they are aware that “slop” exists in the gearboxes and the operators
try to take out as much of the “slop” as possible, if not all of it. The set-up and operational
procedure is sound, especially if the operators make sure that the last narrow face movement
during the set-up is inward, toward the center of the mould, and that the initial top width and
narrow face taper on each side is carefully measured to accurately calibrate the computer. If the
mould is correctly set-up and during the casting operation the narrow faces are always moved
inward, then the “slop” in the screw system will not be an issue in terms of accurately controlling
the narrow face taper.
However, the wide face thermal expansion is a probable source of error in the narrow
face taper accuracy. During the casting operation, the wide faces exert a pressure of 800 psi on
the narrow faces. Nucor has found that this pressure adequately holds the mould faces together
and allows the narrow face position to be changed without scraping off copper from the wide
BoxGear
BoxGear
BoxGear
BoxGear
Narow Faces
Wide Face
Funnel
25
face of the mould. This pressure converts to a force of ~340 kN along the length of the narrow
face. The wide face expands the most just below the meniscus where the copper reaches the
highest temperature ~400-500 oC. With a linear thermal expansion coefficient of 16*10^-5 oC-1,
Appendix A-18 shows the source of this coefficient, the linear thermal expansion of the wide
face is ~3-4mm overall. Assuming a coefficient of friction of 0.3, the friction force between the
wide and narrow face is ~100kN. Thus it is possible that the top of the narrow face is shifted
when the top of the wide face thermally expands, but the major concern is that the computer
which controls the position and taper of the narrow face is not aware of this movement. The
computer is unaware of the change in the narrow face position because the computer only uses
the number of screw rotations to determine the position of the narrow face, not the global
position of the narrow face based on a grounded reference point. So, the actual narrow face taper
is greater than the taper initially set and displayed on the computer screen.
Another possibility is that the wide face is able to slide pass the narrow face when it
expands. So, at the end of the casting run when the wide face cools it “grabs” the narrow face,
and if there is any “slop” in the screw system, pulls the top of the narrow face inward. Thus, the
narrow face taper measured at the end of the casting run using the hand inclinometer will not be
an accurate account of the final taper, and a comparison between the final taper displayed on the
screen and the final taper measured would show the final taper displayed to be higher than the
final taper measured. However, from the statistical analysis on the narrow face taper data
collected to determine a relationship between the taper displayed on the computer, the taper
measured by hand, and the target taper seen in Appendix A-11, the final taper displayed on the
computer screen was overall lower than the taper measured as shown below in Table 8.
26
Difference Between Final Taper Displayed on Computer Screen and Taper Measured at the end
of the run
(mm) E W
Number of times Final Taper Displayed > Taper Measured 22 18
Number of times Final Taper Displayed < Taper Measured 33 37
Table 8: Comparison of Final Taper Displayed on Computer Screen and Taper Measured
at the end of the run for all high and low carbon data samples collected
Five years ago, Nucor started to use the linear screw system already in place to control
the position of their narrow face taper to measure the taper of the narrow face as well. Nucor had
attempted to use inclinometers to measure the narrow face taper, however the inclinometers
proved to be inaccurate. The inclinometer that Nucor chose to implement was from Jewell
Instruments. This particular inclinometer has a very good resolution of 0.0011mm. However,
during the casting operation the entire mould is oscillating between 4 to 6 Hz. These oscillations
caused fluctuations in the readings from the inclinometer which was originally designed for
traditional continuous casting process where the frequency is generally 1 Hz, see Appendix A-19
for a schematic of the Jewell inclinometer and specifications.
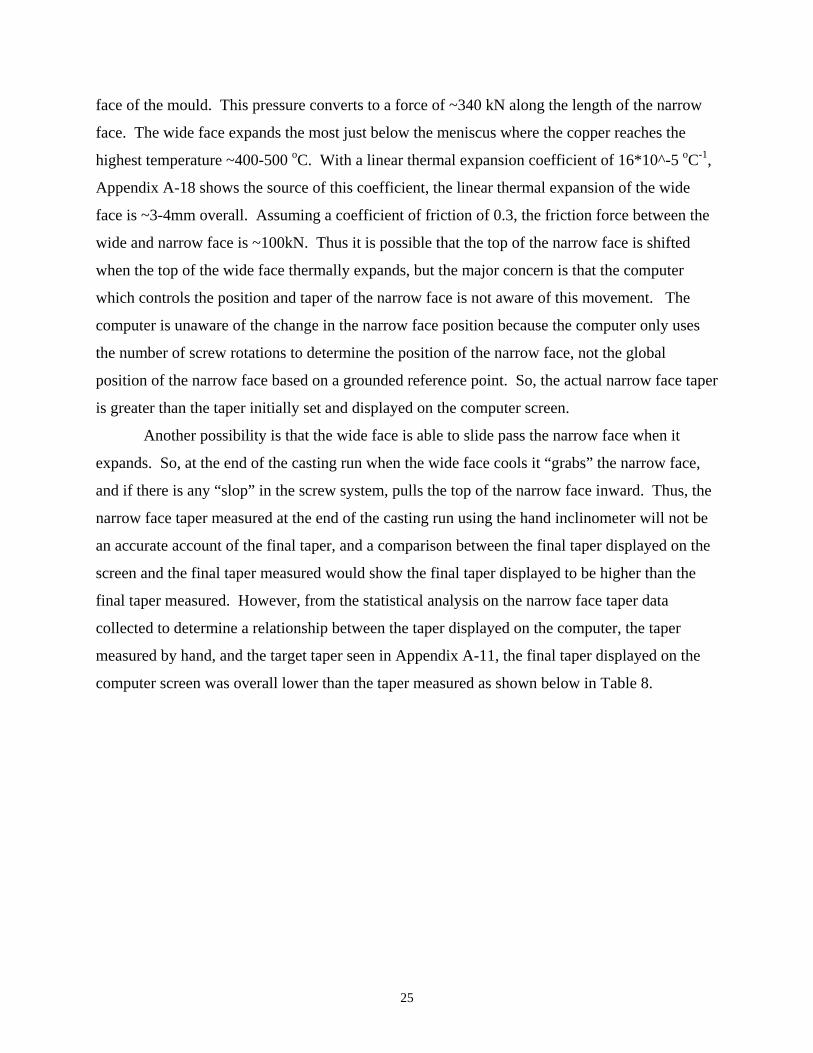
The Jewell inclinometer measures taper based on the position of a floating buoy,
connected to a potentiometer, which sits on top of a pool of oil. A change in the orientation of
the inclinometer is determined by the resistance of the potentiometer based on the position of the
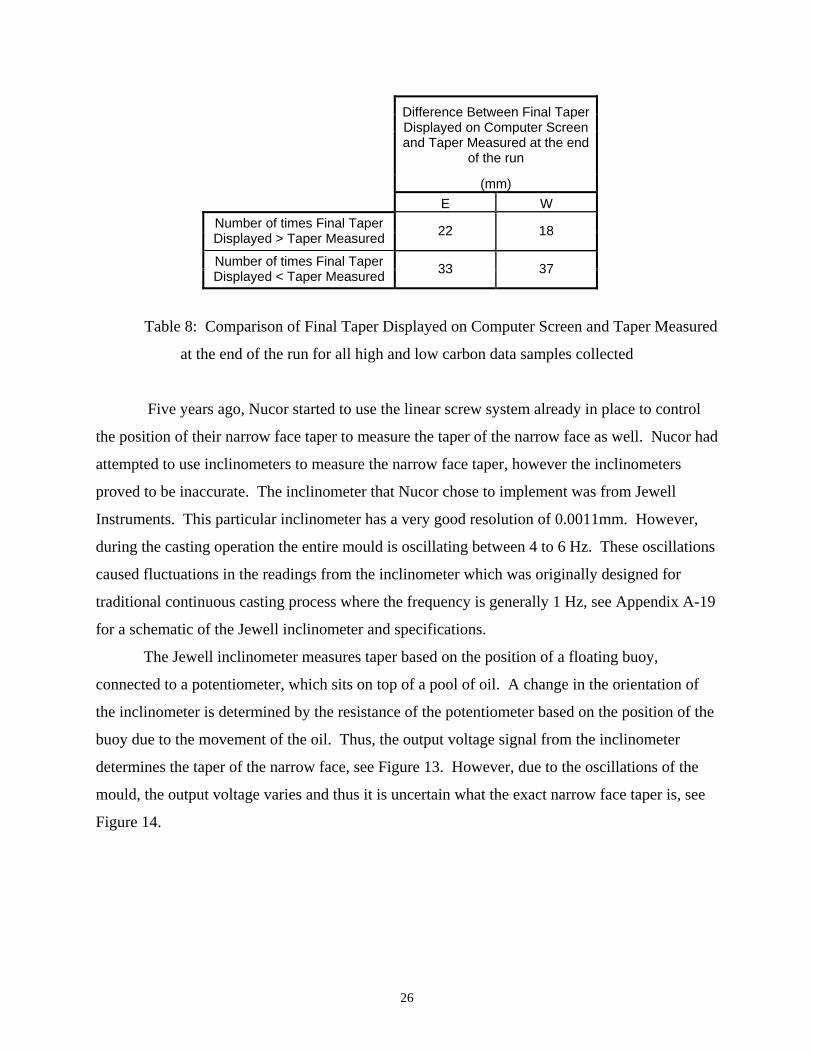
buoy due to the movement of the oil. Thus, the output voltage signal from the inclinometer
determines the taper of the narrow face, see Figure 13. However, due to the oscillations of the
mould, the output voltage varies and thus it is uncertain what the exact narrow face taper is, see
Figure 14.
27
Figure 13: A change in orientation of the Jewell Instruments Inclinometer affects the output
voltage and determines the taper of the narrow face.
Figure 14: Oscillations cause a continuously varying output voltage, thus making the actual taper
difficult to determine.
Other inclinometers from U.S. Digital, MicroStrain and Sidersistem, (see Appendix A-20
for the schematics and specifications of these inclinometers), have been researched in an attempt
to find a device that can accurately measure taper. U.S.Digital and Microstrain make general
purpose digital inclinometers that are used for: vehicles, platforms, heavy equipment,
manufacturing, etc. Sidersistem makes electronic inclinometers specifically for continuous
casting. Although these may or may not be able to withstand the oscillations, they do not possess
the desired resolution necessary to determine taper. The best, Sidersistem, had a resolution of 0.1
mm. The smallest taper change made during operation, and thus the desired resolution, is
0.05mm. Therefore, the current technology is not adequate to measure the narrow face taper.
Oil Bath Oil Bath
Oil Bath
28
IDEAL NARROW FACE TAPER
In order to alter CON1D to predict the ideal taper for a given grade of steel and a given
exit slab width, a procedure for determining the ideal taper based on outputs from CON1D had to
be formed. The main contributions to the ideal narrow face taper come from the shell shrinkage,
the thermal expansion of the wide face, the flux layer thickness, and the extra length in the
funnel. The first three are calculated by CON1D while the extra length is calculated by Equation
10. It was found the ideal narrow face taper is calculated by subtracting from the shell
shrinkage, the change in extra length, the change in wide face thermal expansion, and the change
in total flux layer thickness.
)()()()(_ 000 TFLTFLTETEELELSSmmTaperIdeal −−−−−−= (13)
SS = Steel Shell Shrinkage
EL = Extra Length at a given distance from the top of the mould
EL0 = The extra length at the distance from the top of the mould where the shell shrinkage begins
TE = Thermal Expansion of the wide face of the mould
TE0 = The thermal expansion of the wide face of the mould where the shell shrinkage begins
TFL = Total Flux Layer thickness
TFL0 = The total flux layer thickness where the shell shrinkage begins
The code for this procedure to be implemented into CON1D can be found in Appendix A-16.
Four steels were analyzed in order to determine the ideal narrow face taper: a common
high carbon, a common low carbon, a difficult low carbon to cast, and an approximately
peritectic steel. Appendix A-21 contains a sample of the spread sheets that show the analysis for
each of these steels. Each graph has a plot of the shell shrinkage, extra length from the funnel,
wide face linear thermal expansion, and the total flux layer thickness for a given distance below
the meniscus. Also shown on each graph are the narrow face target narrow face taper used by
Nucor and calculated by Equation 8, and the ideal narrow face taper as predicted by Equation 13.
CON1D does not take into account the effects of plasticity. One of the project goals was
to determine whether plastic strain in the form of creep plays a role during the solidification
process. In order to determine the importance of plasticity in high and low carbon steels,
29
CON2D, another FORTRAN program developed at the University of Illinois by Professor Brian
Thomas, was implemented. Claudio Ojeda, a graduate student of Professor Thomas, ran the
CON2D program for all four of the steels analyzed. CON2D utilizes some of the same input
parameters from CON1D including the casting speed, pour temperature, and the working mould
length, and it also utilizes the resulting wide face heat flux profile from each CON1D analysis.
See Appendix A-22 for a sample of the input files used in CON2D in order to run each analysis.
The resulting shell shrinkage calculation from CON2D for the common high carbon, the
common low carbon, the difficult to cast low carbon, and the approximate peritectic steel
provided the necessary insight to determine that plastic strain is a significant effect for low
carbon steels and a negligible effect for high carbon steels.
It was necessary to validate what CON2D had calculated. This was done by comparing
certain strains calculated by CON2D to the total strain calculated by CON1D. The flow strain
and thermal strain added together should equal the strain calculated by CON1D with Equation 7.
If they match, this adds validation to the CON2D simulation. A sample of the CON2D outputs
can be seen in Appendix A-23. This was done and for the low carbon steel, the final strain from
CON2D was -0.006 and CON1D calculated a value of -0.0068. For the high carbon steel,
CON2D gave a value of -0.013 and CON1D computed a value of -0.0132. These both helped to
validate the CON2D simulation.
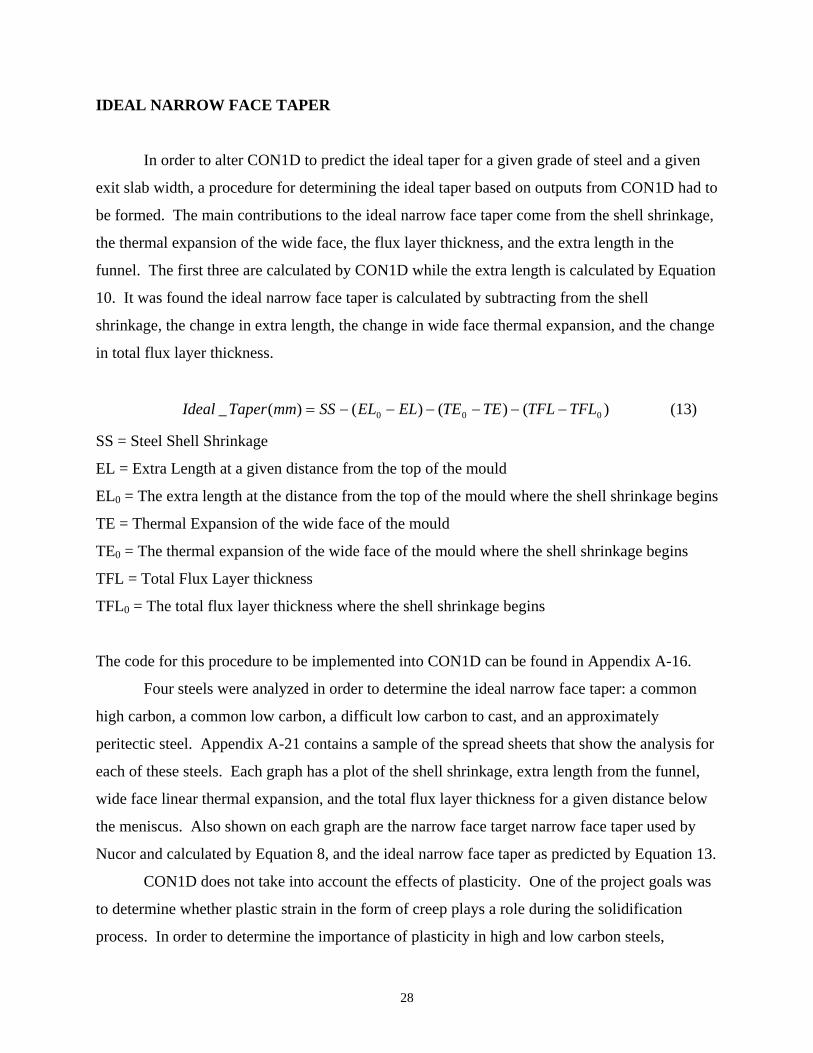
The first type of steel analyzed was Nucor’s 1085S1, a common high carbon steel cast by
Nucor, see Figure 15 below. As shown in this graph the ideal narrow face taper is significantly
less than the taper presently used by Nucor. This result correlates with the preliminary evidence
found in Table 2, which shows that during the casting operation the narrow face taper has to be
reduced in order to produce steel slabs with little or no defects. However, the graph shows that
the ideal narrow face taper is negative. This is not an uncommon phenomenon, but rare for high
carbon steels with a final product width of 1020mm according to Nucor’s experience. The
problem lies in the shell shrinkage. For this case, the extra length in the funnel greatly affects the
narrow face taper. Thus, the narrow face taper actually has to be negative because the extra
length in the funnel is too high compared to the shell shrinkage. In other words, the funnel is
accounting for more shrinkage in the steel then is necessary. Thus, to make up for the difference
in shrinkage, the analysis shows that the narrow face should have a negative taper.
30
-3
-2
-1
0
1
2
3
4
5
0 200 400 600 800 1000 1200
Position Below Meniscus (mm)
(mm
)
Mould Exit
Shell Shrinkage from CON1D
Taper of Nucor'sNarrow Face
For Nucor 's funnel mould with 1020mm funnel width1085S1, 1020mm exit slab width, 1.2% taper with current target taper58mm meniscus level, 4 m/min casting speed
Ideal NarrowFace Taper
Wide Face Thermal Expansion
Total Slag Rim Thickness
Extra Lengthfrom Funnel
Figure 15: Ideal Narrow Face Taper Prediction for a common high carbon steel cast by Nucor
with CON1D calculated shell shrinkage
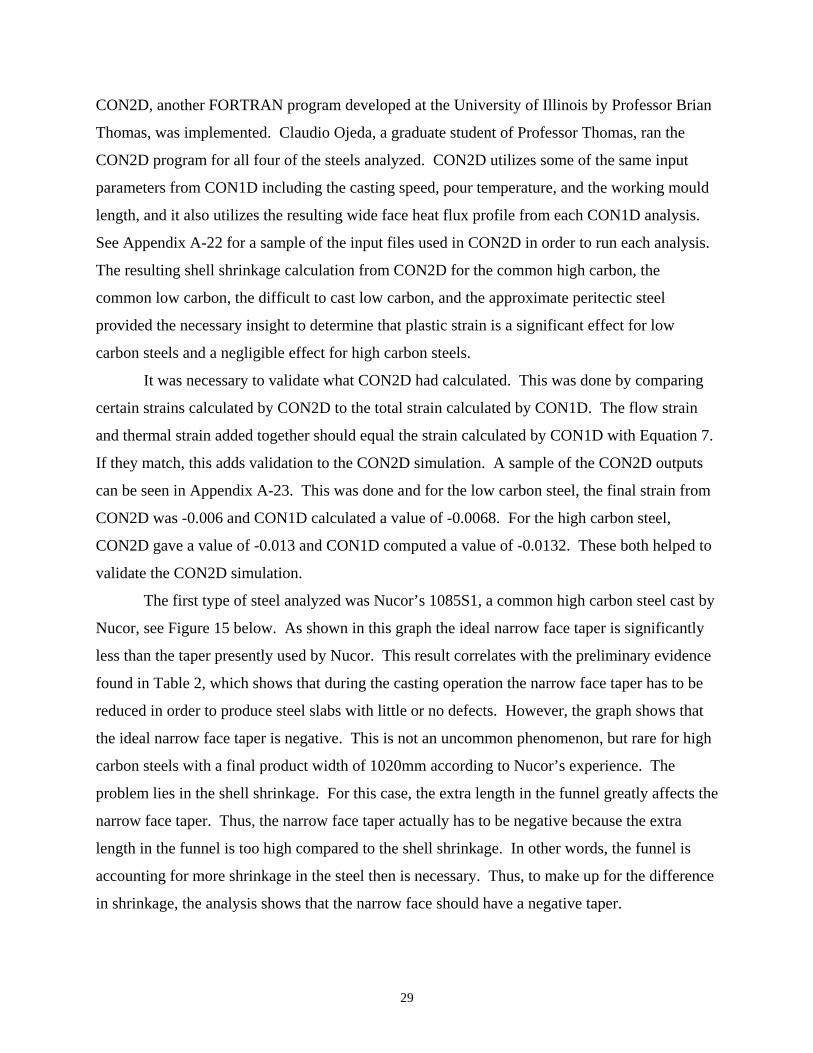
The second type of steel analyzed was Nucor’s 1008A2, a common low carbon steel cast
by Nucor, see Figure 16 below. In Figure 16, the shell shrinkage is calculated from the CON1D
analysis and the ideal narrow face taper predicted for this steel is almost exactly what is currently
used by Nucor. The low carbon steels tend to have higher amounts of shell shrinkage. As
compared to the high carbon steel, the difference between the shell shrinkage and the extra
length in the funnel allows the ideal narrow face taper to have a positive value. However, this
analysis contradicts the preliminary evidence. For high and low carbon steels, according to the
data in Table 2, Nucor is consistently using excessive narrow face taper. However, the results
for this 1008A2 steel show that the narrow face taper used by Nucor is correct.
31
-1
0
1
2
3
4
5
6
7
8
0 200 400 600 800 1000 1200
Position Below Meniscus (mm)
(mm
)
Mould Exit
Shell Shrinkage from CON1D
Extra Length from Funnel
Taper of Nucor'sNarrow Face
For Nucor 's funnel mould with 1020mm funnel width1008A2, 1105mm exit slab width, 0.95% taper with current target taper83mm meniscus level, 4.7 m/min casting speed
Ideal Narrow Face Taper
Wide Face Thermal Expansion
Total Slag Rim Thickness
Figure 16: Ideal Narrow Face Taper Prediction for a common low carbon steel cast by Nucor
with CON1D calculated shell shrinkage
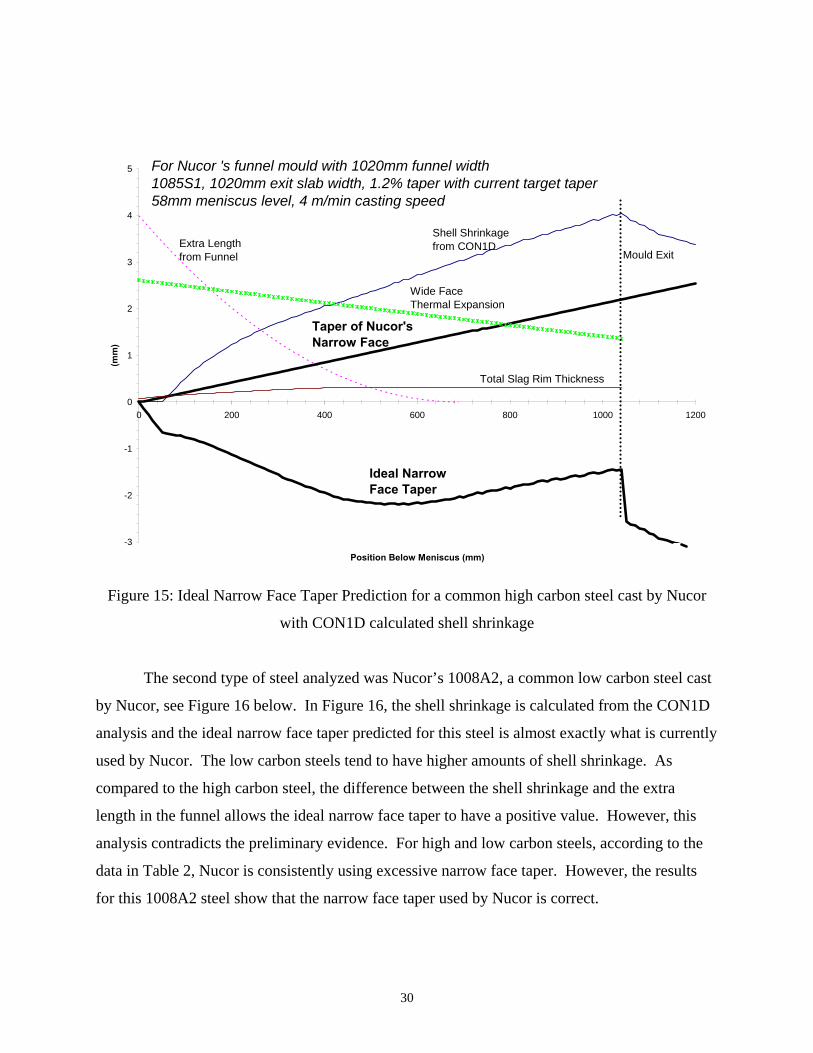
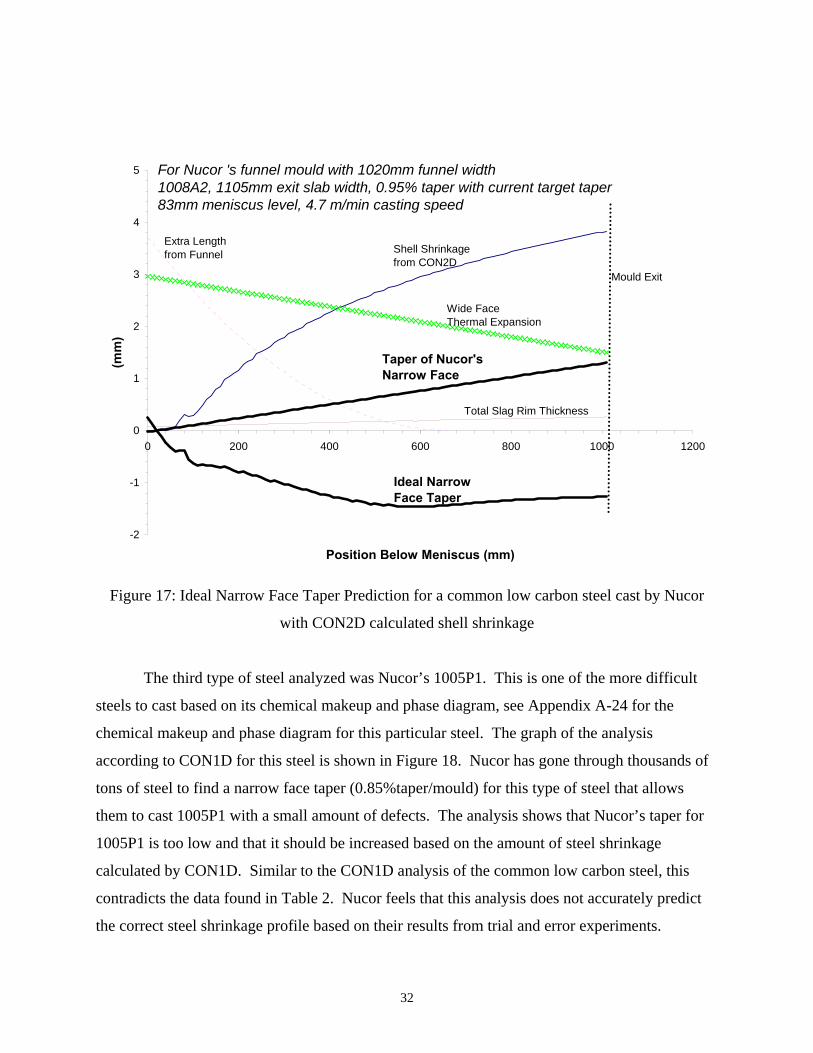
The reason for this discrepancy is the fact that plasticity is not taken into account in this
common low carbon steel analysis. In Figure 17, the shell shrinkage for this steel was calculated
using CON2D. The thermal expansion and flux layer thickness data from the CON1D analysis
were kept the same. In comparing the Figures 16 and 17, there is a noticeable change in the shell
shrinkage which correlates to the ensuing change in the ideal narrow face taper prediction in
Figure 17. This ideal narrow face taper prediction does agree with the trend present in Table 2
and is further evidence that Nucor is implementing excessive taper in both high and low carbon
steels.
32
-2
-1
0
1
2
3
4
5
0 200 400 600 800 1000 1200
Position Below Meniscus (mm)
(mm
)
Mould Exit
Shell Shrinkage from CON2D
Extra Length from Funnel
Taper of Nucor'sNarrow Face
For Nucor 's funnel mould with 1020mm funnel width1008A2, 1105mm exit slab width, 0.95% taper with current target taper83mm meniscus level, 4.7 m/min casting speed
Ideal Narrow Face Taper
Wide Face Thermal Expansion
Total Slag Rim Thickness
Figure 17: Ideal Narrow Face Taper Prediction for a common low carbon steel cast by Nucor
with CON2D calculated shell shrinkage
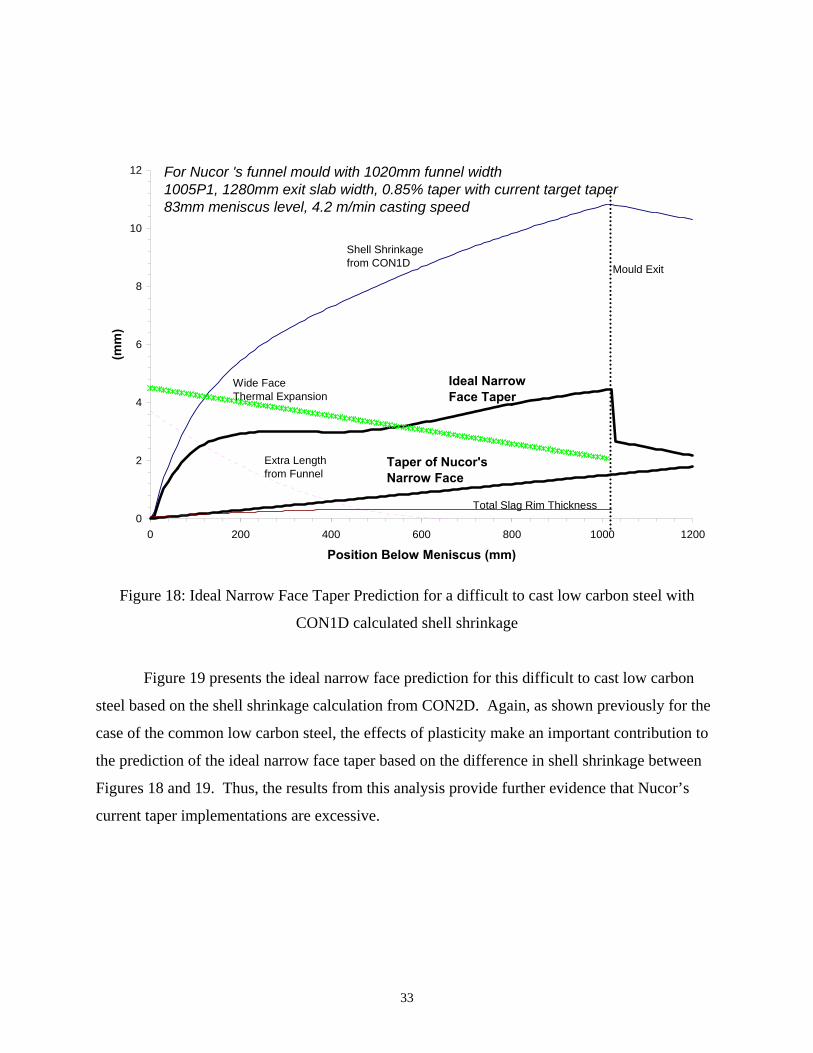
The third type of steel analyzed was Nucor’s 1005P1. This is one of the more difficult
steels to cast based on its chemical makeup and phase diagram, see Appendix A-24 for the
chemical makeup and phase diagram for this particular steel. The graph of the analysis
according to CON1D for this steel is shown in Figure 18. Nucor has gone through thousands of
tons of steel to find a narrow face taper (0.85%taper/mould) for this type of steel that allows
them to cast 1005P1 with a small amount of defects. The analysis shows that Nucor’s taper for
1005P1 is too low and that it should be increased based on the amount of steel shrinkage
calculated by CON1D. Similar to the CON1D analysis of the common low carbon steel, this
contradicts the data found in Table 2. Nucor feels that this analysis does not accurately predict
the correct steel shrinkage profile based on their results from trial and error experiments.
33
0
2
4
6
8
10
12
0 200 400 600 800 1000 1200
Position Below Meniscus (mm)
(mm
)
Mould Exit
Shell Shrinkage from CON1D
Extra Length from Funnel
Taper of Nucor'sNarrow Face
For Nucor 's funnel mould with 1020mm funnel width1005P1, 1280mm exit slab width, 0.85% taper with current target taper83mm meniscus level, 4.2 m/min casting speed
Ideal Narrow Face Taper
Wide Face Thermal Expansion
Total Slag Rim Thickness
Figure 18: Ideal Narrow Face Taper Prediction for a difficult to cast low carbon steel with
CON1D calculated shell shrinkage
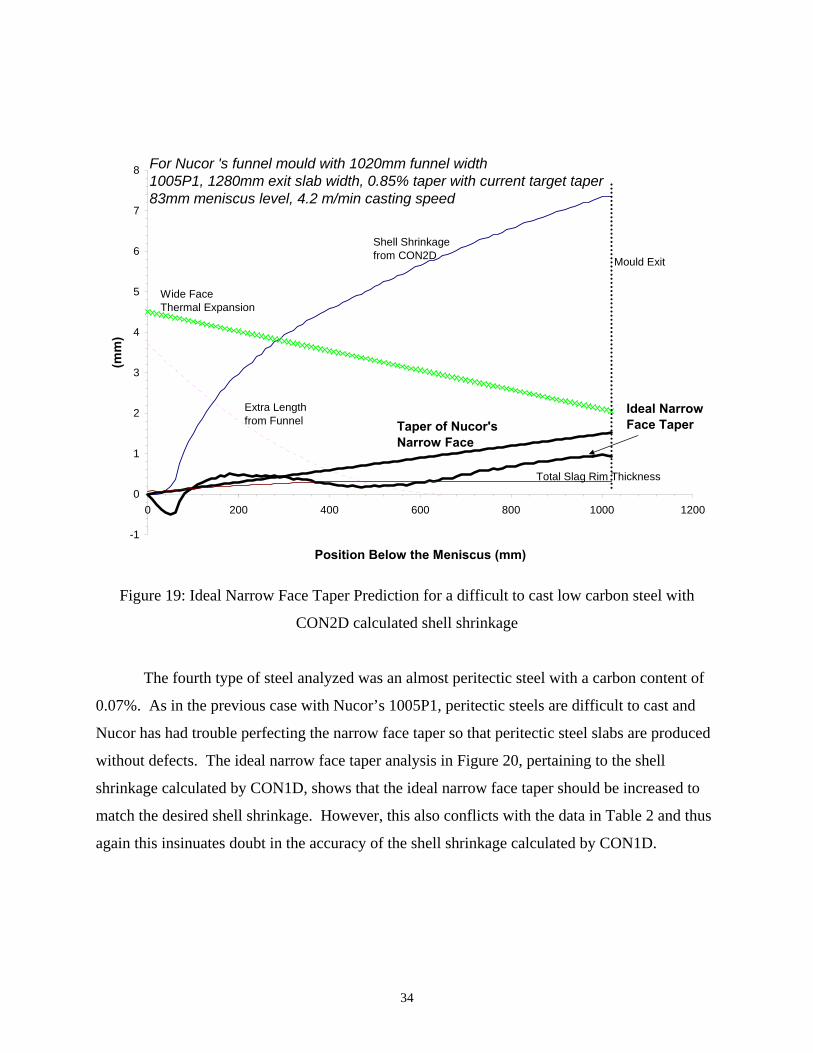
Figure 19 presents the ideal narrow face prediction for this difficult to cast low carbon
steel based on the shell shrinkage calculation from CON2D. Again, as shown previously for the
case of the common low carbon steel, the effects of plasticity make an important contribution to
the prediction of the ideal narrow face taper based on the difference in shell shrinkage between
Figures 18 and 19. Thus, the results from this analysis provide further evidence that Nucor’s
current taper implementations are excessive.
34
-1
0
1
2
3
4
5
6
7
8
0 200 400 600 800 1000 1200
Position Below the Meniscus (mm)
(mm
)
Mould Exit
Shell Shrinkage from CON2D
Extra Length from Funnel Taper of Nucor's
Narrow Face
For Nucor 's funnel mould with 1020mm funnel width1005P1, 1280mm exit slab width, 0.85% taper with current target taper83mm meniscus level, 4.2 m/min casting speed
Ideal Narrow Face Taper
Wide Face Thermal Expansion
Total Slag Rim Thickness
Figure 19: Ideal Narrow Face Taper Prediction for a difficult to cast low carbon steel with
CON2D calculated shell shrinkage
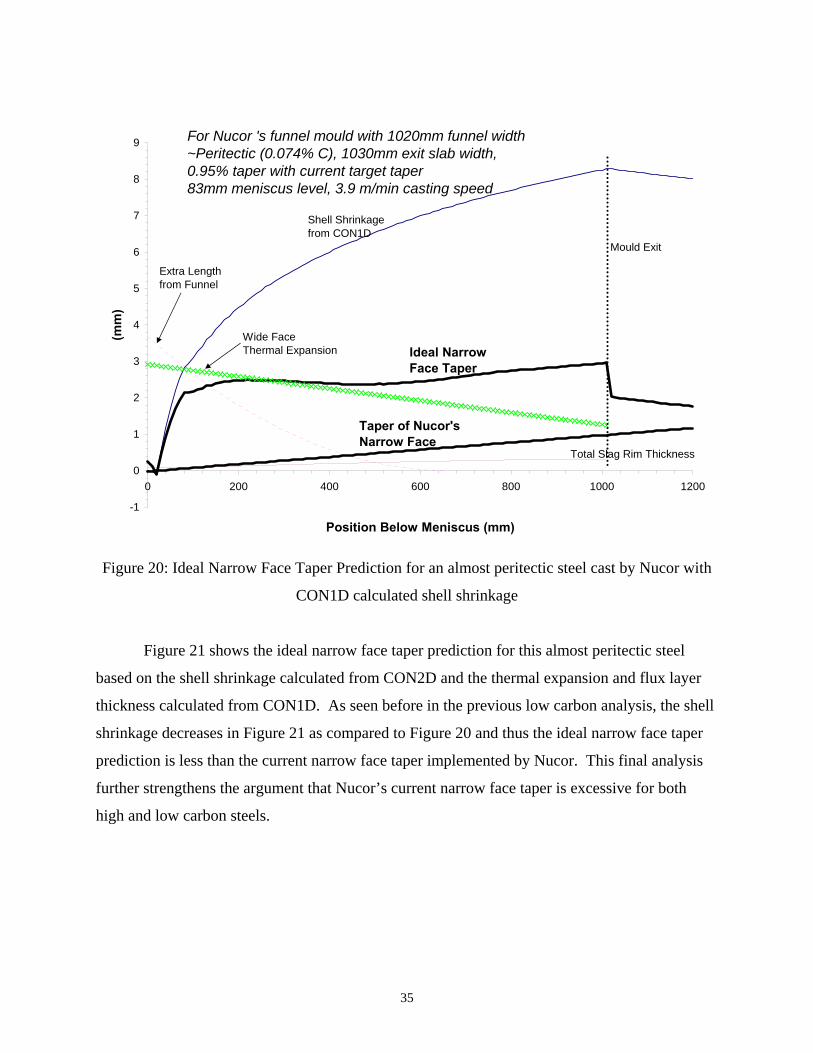
The fourth type of steel analyzed was an almost peritectic steel with a carbon content of
0.07%. As in the previous case with Nucor’s 1005P1, peritectic steels are difficult to cast and
Nucor has had trouble perfecting the narrow face taper so that peritectic steel slabs are produced
without defects. The ideal narrow face taper analysis in Figure 20, pertaining to the shell
shrinkage calculated by CON1D, shows that the ideal narrow face taper should be increased to
match the desired shell shrinkage. However, this also conflicts with the data in Table 2 and thus
again this insinuates doubt in the accuracy of the shell shrinkage calculated by CON1D.
35
-1
0
1
2
3
4
5
6
7
8
9
0 200 400 600 800 1000 1200
Position Below Meniscus (mm)
(mm
)
Mould Exit
Shell Shrinkage from CON1D
Extra Length from Funnel
Taper of Nucor'sNarrow Face
For Nucor 's funnel mould with 1020mm funnel width~Peritectic (0.074% C), 1030mm exit slab width, 0.95% taper with current target taper83mm meniscus level, 3.9 m/min casting speed
Ideal Narrow Face Taper
Wide Face Thermal Expansion
Total Slag Rim Thickness
Figure 20: Ideal Narrow Face Taper Prediction for an almost peritectic steel cast by Nucor with
CON1D calculated shell shrinkage
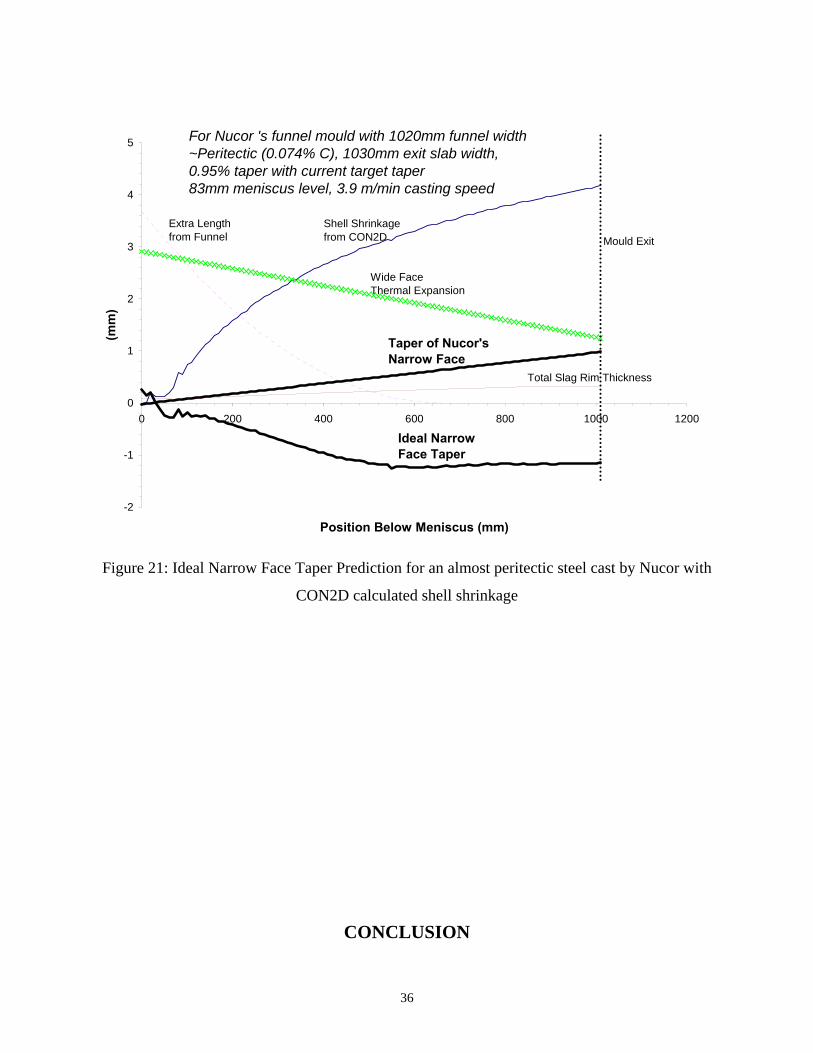
Figure 21 shows the ideal narrow face taper prediction for this almost peritectic steel
based on the shell shrinkage calculated from CON2D and the thermal expansion and flux layer
thickness calculated from CON1D. As seen before in the previous low carbon analysis, the shell
shrinkage decreases in Figure 21 as compared to Figure 20 and thus the ideal narrow face taper
prediction is less than the current narrow face taper implemented by Nucor. This final analysis
further strengthens the argument that Nucor’s current narrow face taper is excessive for both
high and low carbon steels.
36
-2
-1
0
1
2
3
4
5
0 200 400 600 800 1000 1200
Position Below Meniscus (mm)
(mm
)
Mould ExitShell Shrinkage from CON2D
Extra Length from Funnel
Taper of Nucor'sNarrow Face
For Nucor 's funnel mould with 1020mm funnel width~Peritectic (0.074% C), 1030mm exit slab width, 0.95% taper with current target taper83mm meniscus level, 3.9 m/min casting speed
Ideal Narrow Face Taper
Wide Face Thermal Expansion
Total Slag Rim Thickness
Figure 21: Ideal Narrow Face Taper Prediction for an almost peritectic steel cast by Nucor with
CON2D calculated shell shrinkage
CONCLUSION
37
ALTERNATIVE DESIGNS NOT PURSUED
During the course of the project several possible courses of action presented themselves,
but were not pursued. An original goal of the project was to possibly redesign the taper control
system. There was a problem with the control system, the “slop” present, but adequate
procedures existed to deal with it. The problem was that the procedures were not implemented
consistently. Since the current system is capable of being adequate, a redesign was not pursued.
When the problem with inclinometer technology was identified, the idea of redesigning
the technology came up. It quickly became apparent that a redesign would be a complete project
in of itself and it was not pursued.
At the outset of the project, it was thought that simply running CON1D and using the
suggested linear taper a solution would be enough. Yet, after effects such as wide face thermal
linear expansion and plastic strain were considered, it was deemed that the CON1D prediction
alone would not be enough because the CON1D software did not take these effects into
consideration in its taper calculation.
Another possible solution at the outset was to use the non-linear steel shell shrinkage
profile as a recommended taper. As indicated in references 8 and 9, implementation of non-
linear tapers had resulted in improved steel quality and the ability to cast at higher speeds. The
steel shell shrinkage profiles were not used because they did not take into account all the factors
included in the derived ideal taper equation; namely the extra length imparted by the funnel, the
thickness of the mould flux layer, and the thermal linear expansion of the wide face.
ACCOMPLISHMENTS AND CONCLUSIONS
Several of the goals of this project were not related to improving taper directly, rather
they were a series of tasks to accomplish. The first was to calibrate CON1D to Nucor’s casting
process. The second was to alter CON1D to account for the funnel mould and predict ideal taper
based upon current CON1D outputs for thin slab casting. The third was to calibrate and gain an
understanding of Rob Nunnington’s taper prediction model. In the process of completing these
tasks, the user-friendliness of the CON1D was evaluated and small improvements were made.
38
In order to calibrate CON1D, the necessary data was obtained from Nucor; this included
recorded sequence data, mould geometry, and other casting conditions. CON1D was
successfully calibrated and validated by several methods previously discussed, thus concluding
the first step in ideal taper prediction. The next step was to alter the CON1D code to account for
the funnel geometry and other effects for predicting taper from computed CON1D outputs such
as flux layer thickness and steel shell shrinkage. The funnel geometry was derived, as seen in
Equations 10, 11, and 12, along with a new equation to calculate taper, Equation 13. This code
has been written, as seen in Appendix A-16, but not yet implemented into the program.
An analytical taper prediction model was obtained from a steel industry consultant, Rob
Nunnington. The purpose of using this model was to validate and compare the current taper
prediction of CON1D. A thorough study was conducted of the model and an understanding was
gained of how it worked. The tapers suggested by the analytical model matched those output by
CON1D.
While working with CON1D, it was desired that the user-friendliness of the program be
evaluated. Several minor problems were found and corrected. The current method for
calculating the necessary time step was unclear in regards to the necessary hand calculations and
the fact that hand calculations had to be done. The code was changed to automatically calculate
the time step. In the input file template, explanations of individual input were missing and
default labels were inconsistent. These problems were identified and corrected during the course
of the project.
The main goal of this project was to formulate a method in which ideal narrow face taper
can be computed for a given steel composition and desired product width. By deriving an
equation based upon computed quantities from the CON1D program and the rederived funnel
geometry equation, this goal was accomplished and resulted in producing Figures 15 – 21.
In the course of accomplishing these tasks, several important conclusions were reached
relating to the goals of this project. From the analysis of the high carbon steel using CON1D and
the formulated ideal taper equation, Nucor’s original hypothesis of excessive taper has been
strengthened because the computed ideal taper is less than what Nucor currently uses. From the
analysis of the three different low carbon steels the same result was obtained. Nucor is also
implementing excessive taper in casting low carbon steels. However the analysis of the low
carbon steels required the additional effects of plastic strain in the ideal taper equation. The
39
motivation for this project goal came from the heat caster data which presented evidence that
excessive taper existed for high and low carbon steel because approximately 80% of the time, the
final taper measured at the end of the casting operation was less then Nucor’s target taper for the
final steel slab produced in that casting sequence as seen Appendix A-11.
A problem of “slop” was identified as a possible problem in the linear screws of the
transmission system that controls the position of the narrow faces in the mould. The current
acceptable value for the “slop” is 0.6mm, which is significant considering that the range of
implemented tapers is typically between 1 to 3 mm. Nucor also uses this system for taper
measurement and evidence collected suggests that the “slop” is also the reason for taper
measurement disparities. In the past, Nucor had tried to employ inclinometer technology for
taper measurement, but the inclinometers took inaccurate and inconsistent measurements.
Research into the inclinometer system suggests that the inclinometer was not designed to handle
the mould oscillations present in Nucor’s process. Other inclinometers from different companies
were researched, but they did not have adequate resolution to detect Nucor’s small taper changes.
RECOMMENDATIONS
The analysis performed gives Nucor confidence to decrease their narrow face taper. The
procedure used in this study can provide recommended values for what the taper should be
decreased to. The following step by step procedure to obtain an ideal narrow face taper was
constructed during this project.
1. Obtain necessary sequence data.
2. Input data into CON1D and calibrate.
3. Use inputs and CON1D outputs to run CON2D. Determine if plasticity is significant.
4. If plasticity is not significant, input the steel shell shrinkage from CON1D into the
electronically attached Microsoft Excel ideal narrow face taper spreadsheet used to solve
Equation 13. If plasticity is significant, use the steel shell shrinkage from CON2D.
5. Enter the necessary funnel mould geometry and meniscus height into the ideal taper
spreadsheet to calculate the extra length.
6. Input the mould hot face temperature distribution and mould flux layer thickness from
CON1D into the ideal taper spreadsheet.
40
7. Obtain the ideal narrow face taper from Equation 13.
8. To convert the ideal taper value from mm to %taper/mould, plug in the value obtained
from Equation 13 for the TNFT value and the initial extra length value (the extra length
at the meniscus) found from step 6 into Equation 8.
In regards to the numerical simulations, the fact that plasticity is present means analysis
with CON1D is not enough. Steps must be taken to develop a numerical model that takes into
account all of the strains present during casting. A suggestion is a full three-dimensional finite
element analysis in order to construct a complete model of the funnel mould.
Another problem contributing to the disparity between the ideal taper and current target
taper could be inadequate mould flux distribution. If the mould flux is not distributed properly,
heat transfer from the steel is hindered. Decreased heat transfer from the steel results in less
shrinkage. If the steel does not shrink as much as expected, the steel will scrape against the
narrow faces, and the taper will be excessive. It is recommended that if the above ideal narrow
face taper procedure does not yield fewer defects, then a study should be conducted to examine if
the mould flux is being distributed properly along the faces of the mould.
With regards to the “slop” present in the linear screw system; there are steps taken to
remove the “slop” before casting. The problem lies in the fact that there are four different work
crews that prepare moulds for casting. All four crews handle the problem differently. It is
recommended that the four work crews collaborate to create a formal procedure to remove “slop”
that will be followed each time. This will result in a more consistent process upon which the
effectiveness can be measured.
However, even if the formalized “slop” removing procedure is implemented, the “slop”
will still develop over time. Currently the acceptable value is 0.6 mm. This is unacceptable
considering the implemented tapers range from 1 to 3 mm. This threshold value needs to be
lowered, and a suggested value is 0.3 mm. The consequence though in increasing the frequency
of calibration is increased cost. It costs $1,000 to have a gear box calibrated. Yet, the cost
benefit of lowering the acceptable “slop” value is potentially large. Reducing the defects by as
little as one percent results in a cost savings of $43, 000.
It was concluded that inclinometer technology as it stands is inadequate. The
inclinometers that could supposedly handle the oscillations do not have enough resolution to

41
detect the smallest narrow face taper change made by Nucor. The inclinometer that did have
enough resolution could not handle the oscillations. In spite of the current problems with the
technology, it is recommended that inclinometer technology be pursued as a method of
measuring taper. Inclinometers provide a taper measurement independent of any effects due to
wide face thermal linear expansion, sticking of the narrow face, or inaccurate control of the
narrow face due to “slop”. Inclinometers will give a global reading of the taper, not a relative
reading based upon the linear screw system. Thus, it is recommended that Nucor collaborate
with the companies that make inclinometers to develop an inclinometer is capable of both
handling the oscillations present in Nucor’s casting process and detecting smallest change made
to the narrow face taper. This could be a feasible future MIE 280 design project.
42
REFERENCES
1. B.G. Thomas, B. Ho, G. Li Heat Flow Model of the Continuous Slab Casting Mold,
Interface, and Shell Presented at Alex McLean Symposium. Toronto, Ontario, Canada. July 12-
17, 1998
2. J.E. Lait, J. K. Brimacombe, and F. Weinberg, Mathematical Modelling of Heat Flow in
the Continuous Casting of Steel Ironmaking and Steelmaking (Quarterly). 1974 No 2 p 90-97
3. Won, Y -M. Thomas, B G. Simple model of microsegregation during solidification of
steels Metallurgical & Materials Transactions A-Physical Metallurgy & Materials Science. v 32
n 7 July 2001. p 1755-1767
4. J.K. Part, B.G Thomas, I.V. Samarasekera, Urbana, IL, Personal Communication. 2002
5. J.K.Park, B.G.Thomas, I.V.Samarasekera. U-Sok, Yoon, Thermal and Mechanical
Behavior of Copper Moulds During Thin Slab Casting (I): Plant trial and Mathematical
Modelling, Metal. Trans. B, Accepted. Aug. 2001
6. J.K.Park, B.G.Thomas, I.V.Samarasekera. U-Sok, Yoon Thermal and Mechanical
Behavior of Copper Moulds During Thin Slab Casting (II): Mould Crack Formation Metal.
Trans. B Accepted. Aug. 2001
7. B.G. Thomas, G. Li, A. Moitra, D. Habing. Analysis of Thermal and Mechanical Behavior
of Copper Molds During Continuous Casting of Steel Slabs ISS Transactions. Oct. 1998 p
125-134
43
8. Horbach, Ulrich. Kockentiedt, Josef. Jung, Wolfram. High-speed Billet Casting with a
Parabolic Mould Taper Metallurgical Plant & Technology International. v 22 n 1 Feb 1998. p
74-76, 78, 80, 82-83
9. A, Cristallini, A. Spaccarotella, R. Capotosi, M. Proietti, G. Flemming, J. Sucker Thin Slab
CSP Process for Specialty Steels 3RD European Conference on Continuous Casting
Proceedings. Madrid, Spain, October 20-23, 1998
10. Stone, David T. Thomas, Brian G. Measurement and Modeling of Heat Transfer Across
Interfacial Mold Flux Layers Canadian Metallurgical Quarterly. v 38 n 5 1999. p 363-375
44
APPENDICES
A-1: Photograph of Nucor’s thin slab continuous casting funnel mould
A-2: Photograph of funnel on thin slab continuous casting mould
A-3: Pictures of defects
a: Transverse cracking and rough edges
b: Longitudinal cracking
c: Copper Pickup
A-4: Photograph of linear screw system that controls narrow face position
A-5: Picture of Jewell Inclinometer attached to narrow face of mould
A-6: Nucor’s target taper chart based on bottom width of mould
A-7: Chart for narrow face taper based on the top mould width (similar to A-6)
A-8: Rederivation of funnel geometry
A-9: Sample of the sequence data obtained from Nucor in graphical form
A-10: Photograph of handheld inclinometer used by Nucor Steel
A-11: Data obtained from Nucor to compare narrow face taper measurements
a: High carbon steel data
b: Low carbon steel data
A-12: Sample input file for CON1D
A-13: Sample CON1D exit file
A-14: Listing of every input parameter with explanation or validation
A-15: Graph used to validate oscillation mark depth in CON1D
A-16: Code to implement in CON1D to calculate ideal taper
A-17: Detailed account of narrow face setup and operational procedure
A-18: Source of value used for linear thermal expansion of copper
A-19: Specifications for Jewell Instruments inclinometer
A-20: Schematics and specifications of other inclinometers researched
a: U.S. Digital
b: Microstrain
c: Sidersistem
A-21: Sample of spread sheet that shows values for the high carbon ideal taper graph

45
A-22: Sample input file from CON2D
A-23: Sample of output from CON2D
A-24: Chemical make-up and phase diagram for the difficult to cast low carbon steel
A-25: Extra length and funnel radius calculation for current 1020mm funnel mould and old
880mm funnel mould
All photographs courtesy of Nucor Steel