Embed Size (px)
Citation preview
Thin Film Coated QCM-Sensors and Pattern
Recognition Methods for Discrimination of VOCs
Omar C. Lezzar, A. Bellel*, M. Boutamine
Laboratoire des Etudes de Matériaux Electronique pour
Applications Médicales (LEMEAmed), Faculté des
Sciences de la technologie, Université Constantine 1,
Algeria
S. Sahli
Laboratoire de Microsystèmes et Instrumentation (LMI),
Faculté des Science de la technologie, Université
Constantine 1, Algeria
Y. Segui & P. Raynaud
Laboratoire Plasma et Conversion de l’Energie
(LAPLACE), Université Paul Sabatier, 118 Route de
Narbonne, 31062 Toulouse, France
Abstract—discrimination and quantification of volatile organic
compounds (VOCs) using a non-selective sensor requires a
combination of sensors followed by pattern recognition methods.
Based on this concept, this paper deals with the discrimination of
gas from the responses of several gas sensors coated with
different type of polymer. Quartz crystal microbalance (QCM)
electrodes were coated from hexamethyldisiloxane (HMDSO),
hexamethyldisilazane (HMDSN) and tetraethoxysilane (TEOS)
for the elaboration of gas sensors with different chemical affinity
towards VOC molecules. The sensitivity of the elaborated QCM-
based sensors was evaluated by monitoring the frequency shifts
of the quartz exposed to different concentrations of volatile
organic compounds, such as; ethanol, benzene and chloroform.
The sensors responses data have been used for the identification
and quantification of VOCs. The principal component analysis
(PCA) and the neural-network (NNs) pattern recognition analysis
were used for the discrimination of gas species and
concentrations. Good separation among gases has been obtained
using the principal component analysis. The feed-forward multi-
layer neural network (MLNNs) with a hidden layer and trained
by Broyden Fletcher Goldfarb Shanno (BFGS) Quasi Newton
algorithm has been implemented in order to identify and
quantify the VOCs. By increasing the number of the neuron in
the hidden layer, the precision of the estimate concentration
increases. The approach is standard, however its application on
the elaborated sensors have not been studied in depth so far.
Keywords- Discrimination of gas; pattern recognition; multi
sensors; BFGS Quasi Newton algorithm.
I. INTRODUCTION
Volatile organic compounds (VOCs) can be found in a
variety of settings, including industrial and residential sites.
These compounds can cause disastrous effects on the
environment through premature degradation of the
surrounding area and health hazards to people living around
the contaminated areas [1]. The identification and monitoring
of VOCs have become serious tasks in many countries of the
world and are important for the early control of environmental
pollution [2]. The need for an accurate, cost-effective and
objective system for detection and identification of VOCs is
therefore undisputed. In this study, the surface of the QCM
electrode is coated with organosilicon material capable of
interacting sensitively with the molecules of interest.
However, the selectivity of sensors for gas is not possible in
most cases. Instead, a multi-sensor system answering to these
VOCs in different way is used to identify. The development of
such system is based on the choice of sensors and multi-
variable analysis techniques [3]. Over the last decade, a lot of
important work has been done on developing gas recognition
systems from its smell (electronic noses) using pattern
recognition methods such as: principal component analysis
(PCA) and multi layers neural networks (MLNNs).
PCA is a very useful classification technique widely used
in the gas-sensing area [4] and the neural networks are
analogue computer systems, which are inspired by studies on
the human brain and known to be universal approximates.
Multi-layer neural networks (MLNNs) have been successfully
used in replacing conventional pattern recognition methods for
identification of chemical gases. Implementation of neural
network to analyses the response of multi gas sensor offers
several advantages over the conventional signal processing in
terms of adaptability [5]. In this study, Plasma enhanced chemical vapor deposition
(PECVD) technique has been used to produce QCM-coating with different physical and chemical structures layers. The sensing layers were elaborated from pure vapor of HMDSO, HMDSN and TEOS. The sensing properties of the elaborated QCM sensors have been evaluated towards VOCs molecules such as ethanol, chloroform and benzene. Subsequently, the data generated by these sensors are analyzed by pattern recognition methods that allow the identification and quantification of these VOCs. PCA and artificial neural networks multilayer perception (ANNMLP) are used as feature extractor using an experimentally obtained dataset.
Proceedings of the 8th International Conference on Sensing Technology, Sep. 2-4, 2014, Liverpool, UK
1
II. EXPERIMENTAL
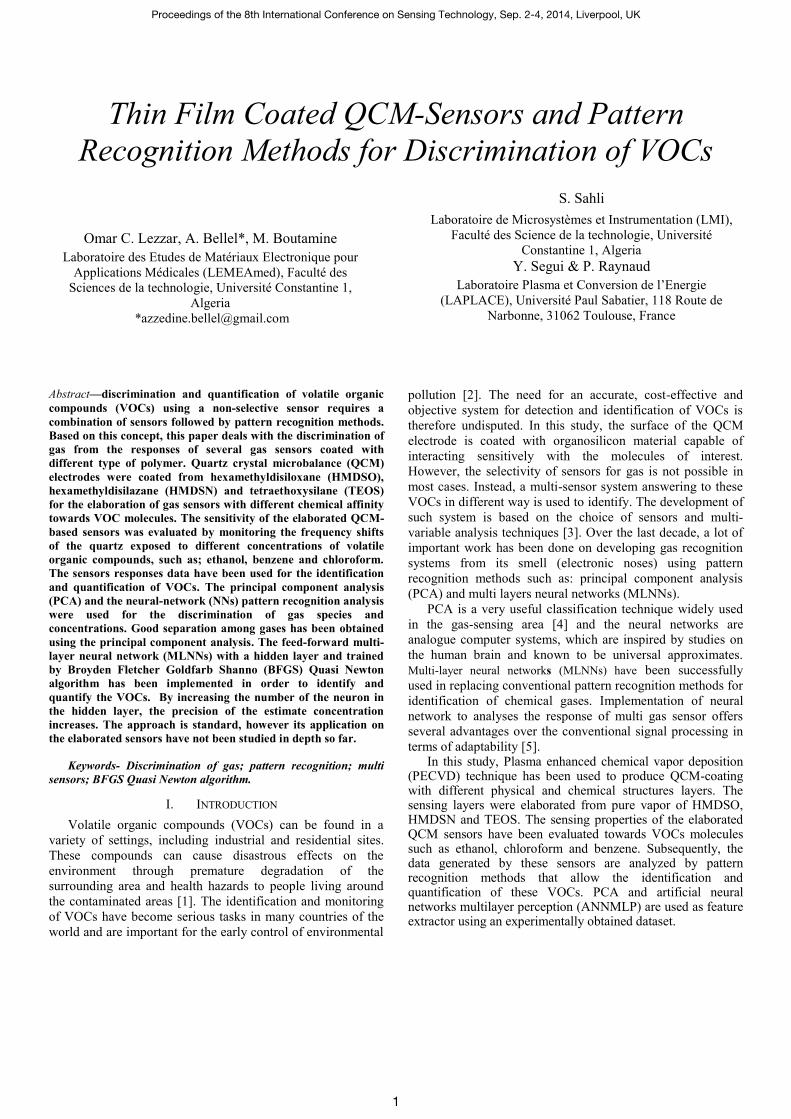
A. Thin Film Elaboration
Thin sensitive coatings were elaborated using PECVD
technique [6]. The films were deposited in low frequency
plasma reactor from vapors of HMDSO, HMDSN and TEOS
in order to obtain sensors with different chemical affinity. The
system consisted of parallel symmetrical electrodes, vacuum
system (composed of Alcatel primary pump) and a monomer
inlet system (Fig 1). The pressure in the reactor was monitored
by a pressure measurement system (Pirani).
QCM samples were placed in the grounded lower electrode and the reactor chamber was pumped down to 10 Pa. A constant partial pressure of monomers HMDSO, HMDSN and TEOS was adjusted to 30 Pa and injected to the reactor from the lower electrode. The monomers were varied in order to elaborate VOC sensors with different sensing properties and to create an impression of each VOC analyte.
B. Sensors and Measurement System
The principle of the QCM sensors is based on changes in
the fundamental oscillation frequency Δf upon sorption of
molecules from the gas phase. To a first approximation the
frequency change Δf results from an increase in the oscillating
mass Δm. This phenomenon can be described by the
Sauerbrey equation (1) [7].
Where A is the area of the sensitive layer, Cf is the mass
sensitivity constant (2.26×10⁻¹⁰
m2 s g
-1) of the quartz crystal
and f0 is the fundamental resonance frequency of the quartz
crystal.
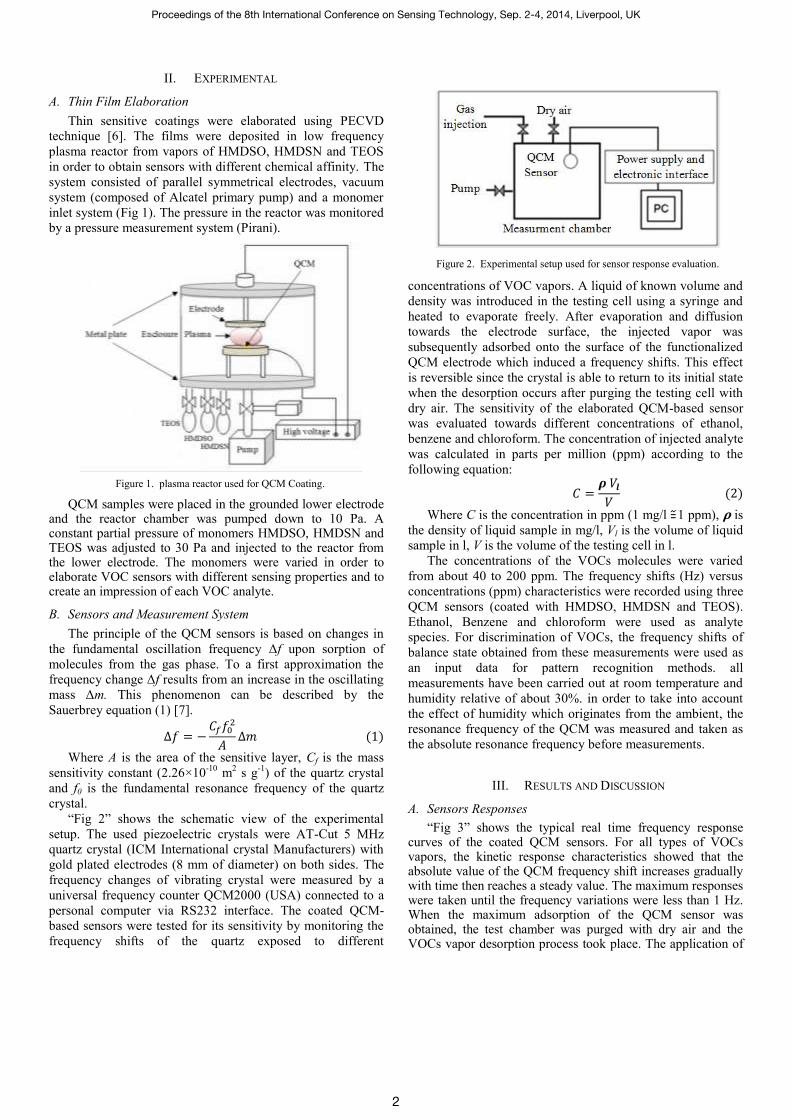
“Fig 2” shows the schematic view of the experimental
setup. The used piezoelectric crystals were AT-Cut 5 MHz
quartz crystal (ICM International crystal Manufacturers) with
gold plated electrodes (8 mm of diameter) on both sides. The
frequency changes of vibrating crystal were measured by a
universal frequency counter QCM2000 (USA) connected to a
personal computer via RS232 interface. The coated QCM-
based sensors were tested for its sensitivity by monitoring the
frequency shifts of the quartz exposed to different
concentrations of VOC vapors. A liquid of known volume and
density was introduced in the testing cell using a syringe and
heated to evaporate freely. After evaporation and diffusion
towards the electrode surface, the injected vapor was
subsequently adsorbed onto the surface of the functionalized
QCM electrode which induced a frequency shifts. This effect
is reversible since the crystal is able to return to its initial state
when the desorption occurs after purging the testing cell with
dry air. The sensitivity of the elaborated QCM-based sensor
was evaluated towards different concentrations of ethanol,
benzene and chloroform. The concentration of injected analyte
was calculated in parts per million (ppm) according to the
following equation:
Where C is the concentration in ppm (1 mg/l 1 ppm), 𝛒 is
the density of liquid sample in mg/l, Vl is the volume of liquid
sample in l, V is the volume of the testing cell in l.
The concentrations of the VOCs molecules were varied
from about 40 to 200 ppm. The frequency shifts (Hz) versus
concentrations (ppm) characteristics were recorded using three
QCM sensors (coated with HMDSO, HMDSN and TEOS).
Ethanol, Benzene and chloroform were used as analyte
species. For discrimination of VOCs, the frequency shifts of
balance state obtained from these measurements were used as
an input data for pattern recognition methods. all
measurements have been carried out at room temperature and
humidity relative of about 30%. in order to take into account
the effect of humidity which originates from the ambient, the
resonance frequency of the QCM was measured and taken as
the absolute resonance frequency before measurements.
III. RESULTS AND DISCUSSION
A. Sensors Responses
“Fig 3” shows the typical real time frequency response curves of the coated QCM sensors. For all types of VOCs vapors, the kinetic response characteristics showed that the absolute value of the QCM frequency shift increases gradually with time then reaches a steady value. The maximum responses were taken until the frequency variations were less than 1 Hz. When the maximum adsorption of the QCM sensor was obtained, the test chamber was purged with dry air and the VOCs vapor desorption process took place. The application of
Figure 1. plasma reactor used for QCM Coating.
Figure 2. Experimental setup used for sensor response evaluation.
Proceedings of the 8th International Conference on Sensing Technology, Sep. 2-4, 2014, Liverpool, UK
2
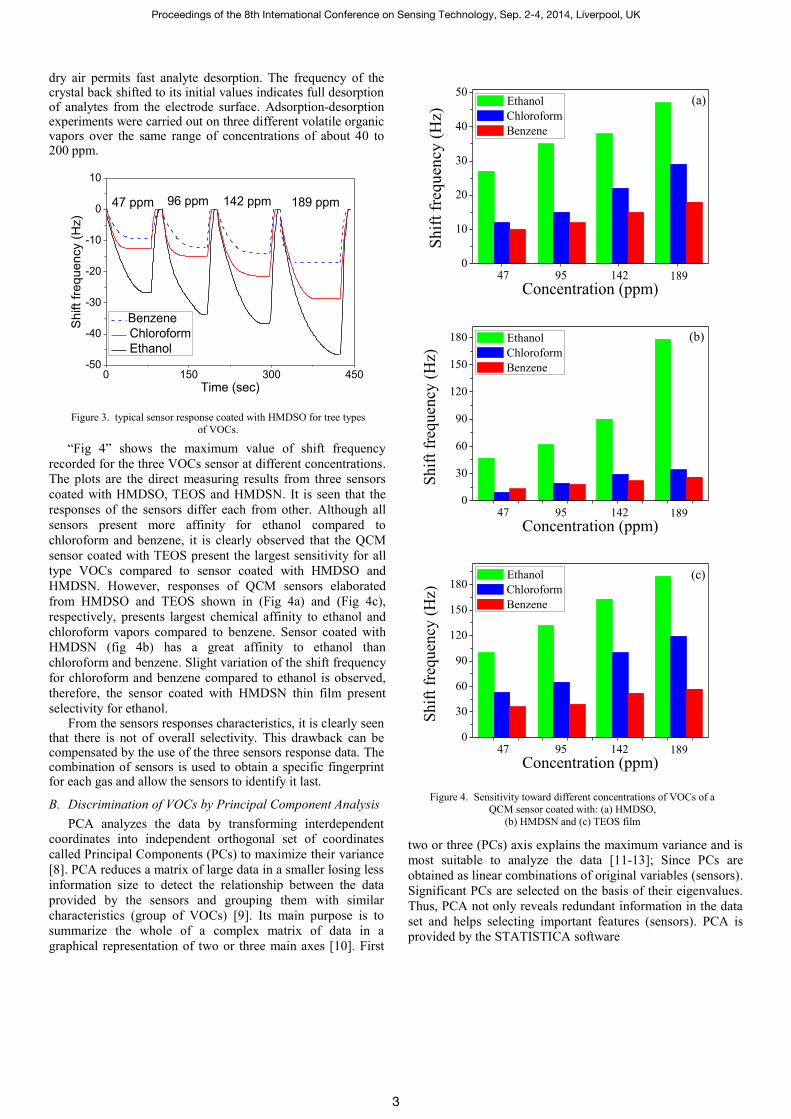
dry air permits fast analyte desorption. The frequency of the crystal back shifted to its initial values indicates full desorption of analytes from the electrode surface. Adsorption-desorption experiments were carried out on three different volatile organic vapors over the same range of concentrations of about 40 to 200 ppm.
“Fig 4” shows the maximum value of shift frequency
recorded for the three VOCs sensor at different concentrations.
The plots are the direct measuring results from three sensors
coated with HMDSO, TEOS and HMDSN. It is seen that the
responses of the sensors differ each from other. Although all
sensors present more affinity for ethanol compared to
chloroform and benzene, it is clearly observed that the QCM
sensor coated with TEOS present the largest sensitivity for all
type VOCs compared to sensor coated with HMDSO and
HMDSN. However, responses of QCM sensors elaborated
from HMDSO and TEOS shown in (Fig 4a) and (Fig 4c),
respectively, presents largest chemical affinity to ethanol and
chloroform vapors compared to benzene. Sensor coated with
HMDSN (fig 4b) has a great affinity to ethanol than
chloroform and benzene. Slight variation of the shift frequency
for chloroform and benzene compared to ethanol is observed,
therefore, the sensor coated with HMDSN thin film present
selectivity for ethanol. From the sensors responses characteristics, it is clearly seen
that there is not of overall selectivity. This drawback can be compensated by the use of the three sensors response data. The combination of sensors is used to obtain a specific fingerprint for each gas and allow the sensors to identify it last.
B. Discrimination of VOCs by Principal Component Analysis
PCA analyzes the data by transforming interdependent
coordinates into independent orthogonal set of coordinates
called Principal Components (PCs) to maximize their variance
[8]. PCA reduces a matrix of large data in a smaller losing less
information size to detect the relationship between the data
provided by the sensors and grouping them with similar
characteristics (group of VOCs) [9]. Its main purpose is to
summarize the whole of a complex matrix of data in a
graphical representation of two or three main axes [10]. First
two or three (PCs) axis explains the maximum variance and is
most suitable to analyze the data [11-13]; Since PCs are
obtained as linear combinations of original variables (sensors).
Significant PCs are selected on the basis of their eigenvalues.
Thus, PCA not only reveals redundant information in the data
set and helps selecting important features (sensors). PCA is
provided by the STATISTICA software
0 150 300 450-50
-40
-30
-20
-10
0
10
189 ppm142 ppm47 ppm
Sh
ift
fre
qu
en
cy (
Hz)
Time (sec)
Benzene
Chloroform
Ethanol
96 ppm
Figure 3. typical sensor response coated with HMDSO for tree types
of VOCs.
0
10
20
30
40
50
18914295
Shif
t fr
equency (
Hz)
Concentration (ppm)
Ethanol
Chloroform
Benzene
47
(a)
0
30
60
90
120
150
180
18914295
Shif
t fr
equen
cy (
Hz)
Concentration (ppm)
Ethanol
Chloroform
Benzene
47
(b)
0
30
60
90
120
150
180
18914295
Shif
t fr
equen
cy (
Hz)
Concentration (ppm)
Ethanol
Chloroform
Benzene
47
(c)
Figure 4. Sensitivity toward different concentrations of VOCs of a
QCM sensor coated with: (a) HMDSO,
(b) HMDSN and (c) TEOS film
.
Proceedings of the 8th International Conference on Sensing Technology, Sep. 2-4, 2014, Liverpool, UK
3
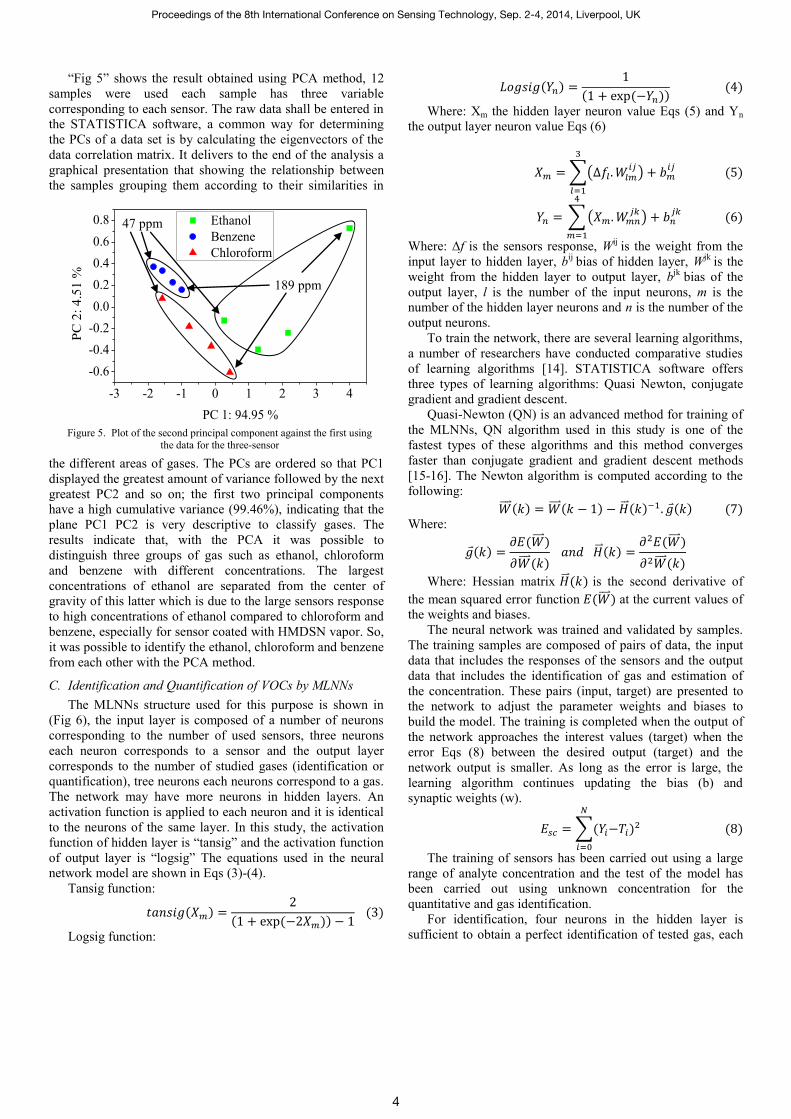
“Fig 5” shows the result obtained using PCA method, 12
samples were used each sample has three variable
corresponding to each sensor. The raw data shall be entered in
the STATISTICA software, a common way for determining
the PCs of a data set is by calculating the eigenvectors of the
data correlation matrix. It delivers to the end of the analysis a
graphical presentation that showing the relationship between
the samples grouping them according to their similarities in
the different areas of gases. The PCs are ordered so that PC1
displayed the greatest amount of variance followed by the next
greatest PC2 and so on; the first two principal components
have a high cumulative variance (99.46%), indicating that the
plane PC1 PC2 is very descriptive to classify gases. The
results indicate that, with the PCA it was possible to
distinguish three groups of gas such as ethanol, chloroform
and benzene with different concentrations. The largest
concentrations of ethanol are separated from the center of
gravity of this latter which is due to the large sensors response
to high concentrations of ethanol compared to chloroform and
benzene, especially for sensor coated with HMDSN vapor. So,
it was possible to identify the ethanol, chloroform and benzene
from each other with the PCA method.
C. Identification and Quantification of VOCs by MLNNs
The MLNNs structure used for this purpose is shown in
(Fig 6), the input layer is composed of a number of neurons
corresponding to the number of used sensors, three neurons
each neuron corresponds to a sensor and the output layer
corresponds to the number of studied gases (identification or
quantification), tree neurons each neurons correspond to a gas.
The network may have more neurons in hidden layers. An
activation function is applied to each neuron and it is identical
to the neurons of the same layer. In this study, the activation
function of hidden layer is “tansig” and the activation function
of output layer is “logsig” The equations used in the neural
network model are shown in Eqs (3)-(4).
Tansig function:
Logsig function:
Where: Xm the hidden layer neuron value Eqs (5) and Yn
the output layer neuron value Eqs (6)
∑( )
∑(
)
Where: Δf is the sensors response, Wij
is the weight from the
input layer to hidden layer, bij
bias of hidden layer, Wjk
is the
weight from the hidden layer to output layer, bjk
bias of the
output layer, l is the number of the input neurons, m is the
number of the hidden layer neurons and n is the number of the
output neurons.
To train the network, there are several learning algorithms,
a number of researchers have conducted comparative studies
of learning algorithms [14]. STATISTICA software offers
three types of learning algorithms: Quasi Newton, conjugate
gradient and gradient descent.
Quasi-Newton (QN) is an advanced method for training of
the MLNNs, QN algorithm used in this study is one of the
fastest types of these algorithms and this method converges
faster than conjugate gradient and gradient descent methods
[15-16]. The Newton algorithm is computed according to the
following:
Where:
Where: Hessian matrix is the second derivative of
the mean squared error function at the current values of
the weights and biases.
The neural network was trained and validated by samples.
The training samples are composed of pairs of data, the input
data that includes the responses of the sensors and the output
data that includes the identification of gas and estimation of
the concentration. These pairs (input, target) are presented to
the network to adjust the parameter weights and biases to
build the model. The training is completed when the output of
the network approaches the interest values (target) when the
error Eqs (8) between the desired output (target) and the
network output is smaller. As long as the error is large, the
learning algorithm continues updating the bias (b) and
synaptic weights (w).
∑
The training of sensors has been carried out using a large
range of analyte concentration and the test of the model has
been carried out using unknown concentration for the
quantitative and gas identification.
For identification, four neurons in the hidden layer is
sufficient to obtain a perfect identification of tested gas, each
-3 -2 -1 0 1 2 3 4
-0.6
-0.4
-0.2
0.0
0.2
0.4
0.6
0.8
Ethanol
Benzene
Chloroform
PC
2:
4.5
1 %
PC 1: 94.95 %
Figure 5. Plot of the second principal component against the first using the data for the three-sensor
189 ppm
47 ppm
Proceedings of the 8th International Conference on Sensing Technology, Sep. 2-4, 2014, Liverpool, UK
4
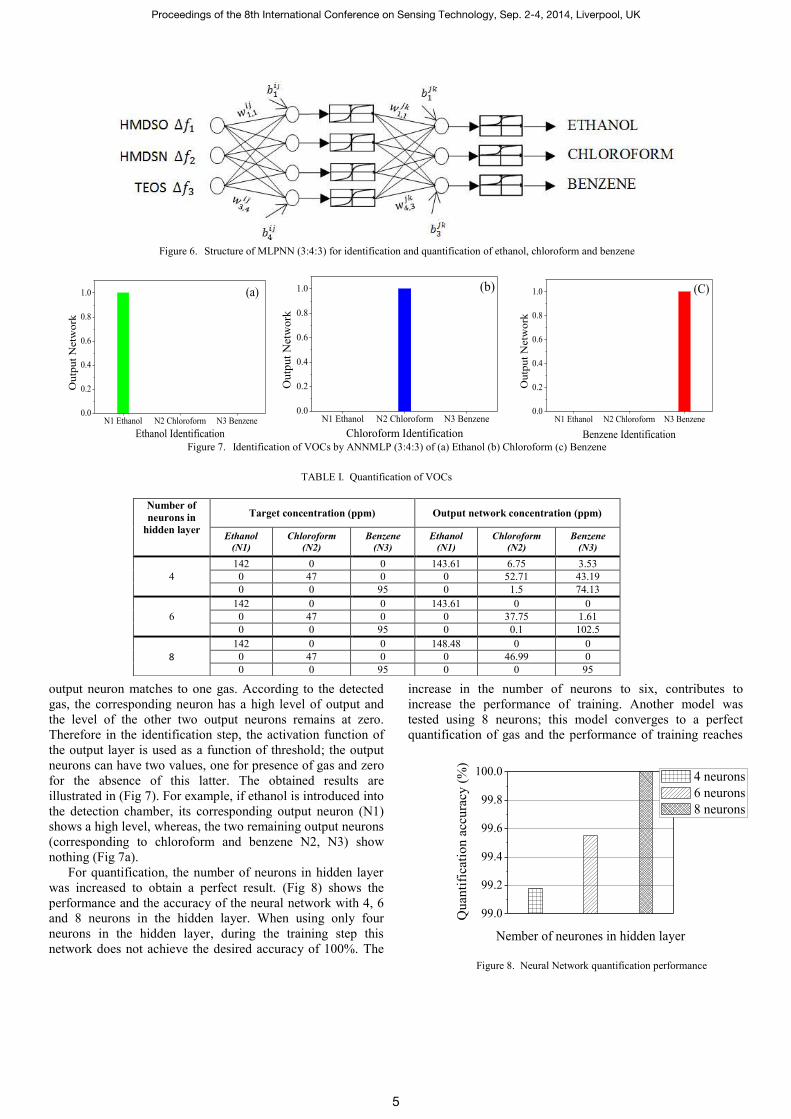
output neuron matches to one gas. According to the detected
gas, the corresponding neuron has a high level of output and
the level of the other two output neurons remains at zero.
Therefore in the identification step, the activation function of
the output layer is used as a function of threshold; the output
neurons can have two values, one for presence of gas and zero
for the absence of this latter. The obtained results are
illustrated in (Fig 7). For example, if ethanol is introduced into
the detection chamber, its corresponding output neuron (N1)
shows a high level, whereas, the two remaining output neurons
(corresponding to chloroform and benzene N2, N3) show
nothing (Fig 7a).
For quantification, the number of neurons in hidden layer
was increased to obtain a perfect result. (Fig 8) shows the
performance and the accuracy of the neural network with 4, 6
and 8 neurons in the hidden layer. When using only four
neurons in the hidden layer, during the training step this
network does not achieve the desired accuracy of 100%. The
increase in the number of neurons to six, contributes to
increase the performance of training. Another model was
tested using 8 neurons; this model converges to a perfect
quantification of gas and the performance of training reaches
99.0
99.2
99.4
99.6
99.8
100.0
Qu
an
tifi
cati
on
accu
racy
(%
)
Nember of neurones in hidden layer
4 neurons
6 neurons
8 neurons
Figure 8. Neural Network quantification performance
Figure 6. Structure of MLPNN (3:4:3) for identification and quantification of ethanol, chloroform and benzene
N1 Ethanol N2 Chloroform N3 Benzene0.0
0.2
0.4
0.6
0.8
1.0
Ou
tpu
t N
etw
ork
Ethanol Identification
(a)
N1 Ethanol N2 Chloroform N3 Benzene0.0
0.2
0.4
0.6
0.8
1.0
Outp
ut
Netw
ork
Chloroform Identification
(b)
N1 Ethanol N2 Chloroform N3 Benzene0.0
0.2
0.4
0.6
0.8
1.0
Outp
ut
Netw
ork
Benzene Identification
(C)
Figure 7. Identification of VOCs by ANNMLP (3:4:3) of (a) Ethanol (b) Chloroform (c) Benzene
TABLE I. Quantification of VOCs
Number of
neurons in
hidden layer
Target concentration (ppm) Output network concentration (ppm)
Ethanol
(N1)
Chloroform
(N2)
Benzene
(N3)
Ethanol
(N1)
Chloroform
(N2)
Benzene
(N3)
4
142 0 0 143.61 6.75 3.53
0 47 0 0 52.71 43.19
0 0 95 0 1.5 74.13
6
142 0 0 143.61 0 0
0 47 0 0 37.75 1.61
0 0 95 0 0.1 102.5
8 142 0 0 148.48 0 0
0 47 0 0 46.99 0
0 0 95 0 0 95
Proceedings of the 8th International Conference on Sensing Technology, Sep. 2-4, 2014, Liverpool, UK
5
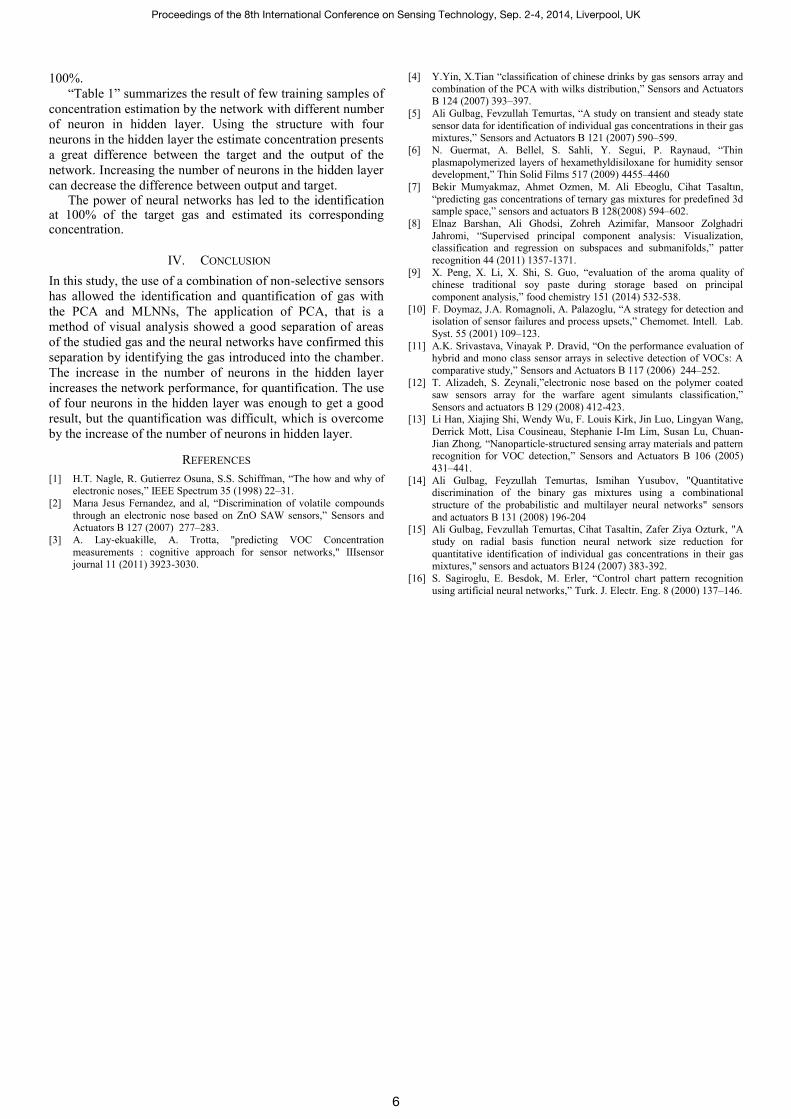
100%.
“Table 1” summarizes the result of few training samples of
concentration estimation by the network with different number
of neuron in hidden layer. Using the structure with four
neurons in the hidden layer the estimate concentration presents
a great difference between the target and the output of the
network. Increasing the number of neurons in the hidden layer
can decrease the difference between output and target. The power of neural networks has led to the identification
at 100% of the target gas and estimated its corresponding concentration.
IV. CONCLUSION
In this study, the use of a combination of non-selective sensors
has allowed the identification and quantification of gas with
the PCA and MLNNs, The application of PCA, that is a
method of visual analysis showed a good separation of areas
of the studied gas and the neural networks have confirmed this
separation by identifying the gas introduced into the chamber.
The increase in the number of neurons in the hidden layer
increases the network performance, for quantification. The use
of four neurons in the hidden layer was enough to get a good
result, but the quantification was difficult, which is overcome
by the increase of the number of neurons in hidden layer.
REFERENCES
[1] H.T. Nagle, R. Gutierrez Osuna, S.S. Schiffman, “The how and why of electronic noses,” IEEE Spectrum 35 (1998) 22–31.
[2] Marıa Jesus Fernandez, and al, “Discrimination of volatile compounds
through an electronic nose based on ZnO SAW sensors,” Sensors and Actuators B 127 (2007) 277–283.
[3] A. Lay-ekuakille, A. Trotta, "predicting VOC Concentration
measurements : cognitive approach for sensor networks," IIIsensor journal 11 (2011) 3923-3030.
[4] Y.Yin, X.Tian “classification of chinese drinks by gas sensors array and
combination of the PCA with wilks distribution,” Sensors and Actuators B 124 (2007) 393–397.
[5] Ali Gulbag, Fevzullah Temurtas, “A study on transient and steady state
sensor data for identification of individual gas concentrations in their gas mixtures,” Sensors and Actuators B 121 (2007) 590–599.
[6] N. Guermat, A. Bellel, S. Sahli, Y. Segui, P. Raynaud, “Thin
plasmapolymerized layers of hexamethyldisiloxane for humidity sensor development,” Thin Solid Films 517 (2009) 4455–4460
[7] Bekir Mumyakmaz, Ahmet Ozmen, M. Ali Ebeoglu, Cihat Tasaltın,
“predicting gas concentrations of ternary gas mixtures for predefined 3d sample space,” sensors and actuators B 128(2008) 594–602.
[8] Elnaz Barshan, Ali Ghodsi, Zohreh Azimifar, Mansoor Zolghadri
Jahromi, “Supervised principal component analysis: Visualization, classification and regression on subspaces and submanifolds,” patter
recognition 44 (2011) 1357-1371.
[9] X. Peng, X. Li, X. Shi, S. Guo, “evaluation of the aroma quality of chinese traditional soy paste during storage based on principal
component analysis,” food chemistry 151 (2014) 532-538.
[10] F. Doymaz, J.A. Romagnoli, A. Palazoglu, “A strategy for detection and isolation of sensor failures and process upsets,” Chemomet. Intell. Lab.
Syst. 55 (2001) 109–123.
[11] A.K. Srivastava, Vinayak P. Dravid, “On the performance evaluation of hybrid and mono class sensor arrays in selective detection of VOCs: A
comparative study,” Sensors and Actuators B 117 (2006) 244–252.
[12] T. Alizadeh, S. Zeynali,”electronic nose based on the polymer coated saw sensors array for the warfare agent simulants classification,”
Sensors and actuators B 129 (2008) 412-423. [13] Li Han, Xiajing Shi, Wendy Wu, F. Louis Kirk, Jin Luo, Lingyan Wang,
Derrick Mott, Lisa Cousineau, Stephanie I-Im Lim, Susan Lu, Chuan-
Jian Zhong, “Nanoparticle-structured sensing array materials and pattern recognition for VOC detection,” Sensors and Actuators B 106 (2005)
431–441.
[14] Ali Gulbag, Feyzullah Temurtas, Ismihan Yusubov, "Quantitative discrimination of the binary gas mixtures using a combinational
structure of the probabilistic and multilayer neural networks" sensors
and actuators B 131 (2008) 196-204 [15] Ali Gulbag, Fevzullah Temurtas, Cihat Tasaltin, Zafer Ziya Ozturk, "A
study on radial basis function neural network size reduction for
quantitative identification of individual gas concentrations in their gas mixtures," sensors and actuators B124 (2007) 383-392.
[16] S. Sagiroglu, E. Besdok, M. Erler, “Control chart pattern recognition
using artificial neural networks,” Turk. J. Electr. Eng. 8 (2000) 137–146.
Proceedings of the 8th International Conference on Sensing Technology, Sep. 2-4, 2014, Liverpool, UK
6