Embed Size (px)
Citation preview
Thijs Fransen, s0103381
June 2007
Master Thesis International Management
“MIS: A Management Information System or Struggle?”An analysis of the M.I.S. of ABN AMRO Private Banking Asia
Master Thesis International Management
Management Information System or Struggle Page 2 of 55
Preface This Master thesis international Management will conclude my life as a student which is actually quite
ironical since now I am writing this, I am already working for 4 months in Singapore with ABN AMRO
private banking.
Early 2006 Trough my roommate Sjoerd van der Gijp, I came in contact with Peeter Chris ‘t Hart,
regional head of marketing and sales of ABN AMRO private banking Asia. We had some brief contact
about the possibilities, and after I finished my exams, I did a proposal of what I could do for the
company. Before I knew it, I was called by the COO/CFO Samir Dewan, with the question if I could
come in three weeks. The exact project that I was going to do was not exactly determined, and there
was hardly any time to liaise with my professors about it. I always have wanted to work in a bank,
and with this internship I got the chance to do so in one of the key financial growth markets of this
time.
In the bank, the work attracted me more than writing the thesis and I spend a lot of time on other
projects that where not directly related to this research. This eventually resulted in a job offer, but
also in a slight headache, since most of the writing of the thesis still had to be done back in the
Netherlands. There was a tight deadline, because I had to be back in Singapore to start the Job in
January. This was quite a struggle, and even with the great support and encouragement of my
parents, my girlfriend Inge, and her family, I did not manage to finish it in time and I had to go to
Singapore anyway. I would recommend everyone not to end up in the same situation, because the
working life does not take into account that you have to spend evenings and weekends writing a
thesis. Those moments are necessary to socialize, find a house, decorate it and spend some quality
time with your friends and girlfriend, especially when moving into a new environment.
But finally the moment that I can graduate is there. I want to thank all the people mentioned above,
as well as my professors, Dr.ir. S.J. de Boer and Ir. C.P. Katsma who have been really patient with
me and provided me with the necessary advise and support to complete this thesis.
Thijs Fransen
Master Thesis International Management
Management Information System or Struggle Page 3 of 55
Management summary ABN AMRO Private Banking (AAPB) targets the offering of private banking services to wealthy
individuals and families with investable assets of EUR 1 Million or more. AAPB Asia has its regional
head office located in Singapore, and has branches in Singapore, Hong Kong, UAE, India, Indonesia
and Taiwan. About 75% of the assets are booked in Singapore and Hong Kong, which make those
locations the most important.
Regional management has indicated that the management information system needs to be improved
because they do not have enough adequate information about various aspects of the business to
support decision-making. Management information is not timely available, does not provide in-depth
insights and is sometimes not even accurate. This research has been conducted to find out what the
problems with the current management information system are and how these can be solved to meet
the information requirements.
I have mainly used two models to analyze the current situation: Decision based management
(Larsson and Malmsjö, 1998) combined with an Evaluation framework, (Cornford et al., 1994).
Looking at the organizational context to find the requirements and analyzing the current
management information and –system by looking at the structure, processes and outcome of the
current management information system. To indicate where the problems are, information analysis
has been performed and the results are presented in heat maps to show in which area and dimension
the most problems occur.
Management information requirements.
Management needs timely insights in various KPIs. The information has to be accurate and complete
and needs to be available in different dimensions in order to capture all aspects of the business
Current management information system
The current management information system involves lots of human participation. Raw data is being
extracted from the operational systems and in MS Excel transformed into static hardcopy reports. It
takes a lot of time and effort to prepare complete management reports, which results in delayed
decision-making. All information is stored in MS Excel files because there is no database in use.
Historical data is therefore not instantly accessible, even extremely time-consuming to retrieve and
proper data-analysis is difficult. There is a data warehouse implemented in both Singapore and Hong
Kong, but it is hardly used, although a similar DWH in other ABN AMRO locations is successfully
implemented and most reporting is fully automated and some reports are even web-based.
Master Thesis International Management
Management Information System or Struggle Page 4 of 55
Gap analysis
The gap between the current situation and the requirements is mainly the time it takes to produce
the reports, historical data that is hard to retrieve, and in-dept details that is not possible. The
problems cannot be overcome when sticking to the current processes. System technical solutions are
required. The current traditional file environment needs to be replaced by a database management
system.
Recommendations
The first step is to implement a database. Since a DWH is already implemented, and in-house support
is available (a Global DWH-team), the best solutions will be to leverage on their expertise and
experience of implementing DWH in various locations. This will be complicated, time consuming and
expensive, but a fully working DWH with BI-Tools can take over most of the current manual
processes. This cannot be delivered within a short timeframe; therefore, the best short term solutions
will be MS Access. Hire a contract staff, with MS Access knowledge, define the requirements and
create a database to store as much historical data from Hong Kong and Singapore as possible.
Custom reports can be built in MS Access, and queries can be used to extract data for ad-hoc
reporting.
Data needs to be stored on the lowest available level to enable complete and detailed overviews of
the performance. Once the database contains all the required information and the data has been
tested, a bi-tools needs to be linked to the database. The Bi-tools needs to have different levels of
user accessibility. A front end “view only” environment for management and a user environment for
the MIS team, and business analysts. Management reports will be dynamic and management will be
able to view the data from different dimensions (drill down) rather then hardcopy static reports.
Secondly, the MIS team needs to centralize all management reporting of all individual departments to
get independent overviews. Work together with the different departments, to find out exactly what
they want.
Master Thesis International Management
Management Information System or Struggle Page 5 of 55
Table of Contents
Glossary..........................................................................................................................7
1. Research plan .........................................................................................................8
1.1 Introduction and Background............................................................................ 8 1.1.1 ABN AMRO............................................................................................................. 8 1.1.2 Strategy ................................................................................................................ 8 1.1.3 ABN AMRO Private Banking (BU Private Clients) ...................................................... 10 1.1.4 ABN AMRO private clients Asia............................................................................... 10
1.2 Problem formulation and objectives................................................................. 10 1.2.1 Problem Formulation............................................................................................. 10 1.2.2 Objectives............................................................................................................ 11
1.3 Research setup .............................................................................................. 11 1.3.1 Research questions............................................................................................... 11
1.4 Research approach & methodology ................................................................. 12 2. Models and theories..............................................................................................14
2.1 Information systems....................................................................................... 14
2.2 Management information systems (MIS).......................................................... 14
2.3 Management information requirements ........................................................... 15
2.4 Current situation and gap analysis................................................................... 16
2.5 General research model.................................................................................. 19 3. Management Information Requirements .............................................................20
3.1 Introduction................................................................................................... 20
3.2 Strategic model.............................................................................................. 21
3.3 KPIs .............................................................................................................. 22
3.4 Decisions ....................................................................................................... 23
3.5 Management information requirements ........................................................... 24 3.5.1 Data requirement ................................................................................................. 25 3.5.2 System Functions and human perspectives ............................................................. 26
3.6 Conclusion ..................................................................................................... 26 4. Current Situation ..................................................................................................28
4.1 Introduction................................................................................................... 28
4.2 Information availability ................................................................................... 28
Master Thesis International Management
Management Information System or Struggle Page 6 of 55
4.3 System Functions ........................................................................................... 29 4.3.1 Structure ............................................................................................................. 29 4.3.2 Process................................................................................................................ 31 4.3.3 Outcome.............................................................................................................. 31 4.3.4 Conclusion ........................................................................................................... 31
4.4 Human perspectives (employees).................................................................... 32 4.4.1 Structure ............................................................................................................. 32 4.4.2 Process................................................................................................................ 32 4.4.3 Outcome.............................................................................................................. 34 4.4.4 Conclusion ........................................................................................................... 34
4.5 Human perspectives (management) ................................................................ 34 4.5.1 Structure ............................................................................................................. 34 4.5.2 Process................................................................................................................ 35 4.5.3 Outcome.............................................................................................................. 35 4.5.4 Conclusion ........................................................................................................... 36
4.6 Conclusion ..................................................................................................... 36 5. Gap analysis and improvements...........................................................................38
5.1 Introduction................................................................................................... 38
5.2 Heat map ...................................................................................................... 38
5.3 System Functions ........................................................................................... 40 5.3.1 Structure ............................................................................................................. 40 5.3.2 Process................................................................................................................ 41 5.3.3 Outcome.............................................................................................................. 41 5.3.4 Conclusions.......................................................................................................... 42
5.4 Human perspectives (employees).................................................................... 42 5.4.1 Structure ............................................................................................................. 42 5.4.2 Process................................................................................................................ 42 5.4.3 Outcome.............................................................................................................. 42 5.4.4 Conclusions.......................................................................................................... 42
5.5 Human perspectives (management) ................................................................ 43 5.5.1 Structure ............................................................................................................. 43 5.5.2 Process................................................................................................................ 43 5.5.3 Outcome.............................................................................................................. 43 5.5.4 Conclusions.......................................................................................................... 43
5.6 Solutions/implementation ............................................................................... 43
5.7 Conclusion ..................................................................................................... 45
Master Thesis International Management
Management Information System or Struggle Page 7 of 55
6. Conclusions and recommendations ......................................................................46
6.1 Conclusions ................................................................................................... 46
6.2 Reflection ...................................................................................................... 47
6.3 Recommendations.......................................................................................... 48 Reference list................................................................................................................50
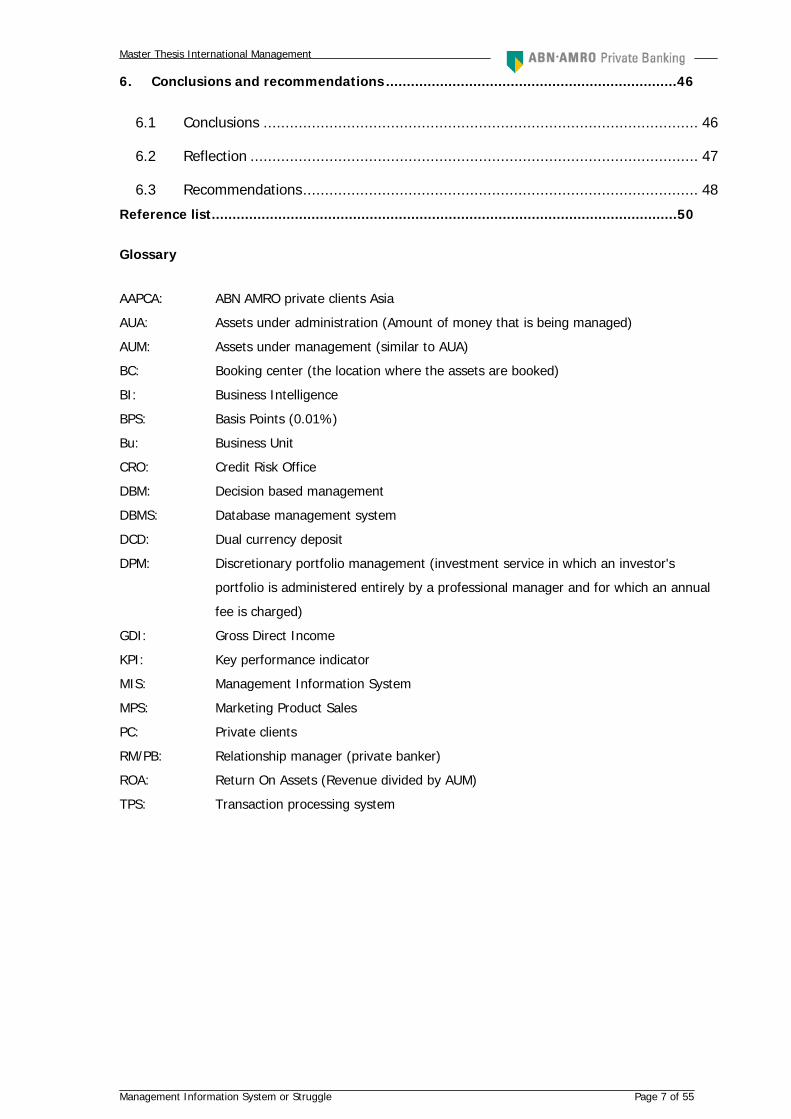
Glossary
AAPCA: ABN AMRO private clients Asia
AUA: Assets under administration (Amount of money that is being managed)
AUM: Assets under management (similar to AUA)
BC: Booking center (the location where the assets are booked)
BI: Business Intelligence
BPS: Basis Points (0.01%)
Bu: Business Unit
CRO: Credit Risk Office
DBM: Decision based management
DBMS: Database management system
DCD: Dual currency deposit
DPM: Discretionary portfolio management (investment service in which an investor's
portfolio is administered entirely by a professional manager and for which an annual
fee is charged)
GDI: Gross Direct Income
KPI: Key performance indicator
MIS: Management Information System
MPS: Marketing Product Sales
PC: Private clients
RM/PB: Relationship manager (private banker)
ROA: Return On Assets (Revenue divided by AUM)
TPS: Transaction processing system
Master Thesis International Management
Management Information System or Struggle Page 8 of 55
1. Research plan
1.1 Introduction and Background
1.1.1 ABN AMRO
The roots of ABN AMRO go back to 1824, when the Dutch King William I initiated the foundation of
the trading company Nederlandsche Handel-Maatschappij (NHM). It was not until the mid-19th
century that the NHM began its gradual transformation into a bank. In 1964, NHM merged with
Twentsche Bank to form Algemene Bank Nederland (ABN). That same year, Amsterdamsche Bank
and Rotterdamsche Bank joined forces to create Amsterdam-Rotterdam Bank (AMRO). The mergers
created two banks whose rivalry was to dominate the Dutch banking scene for more than two
decades. In 1991, ABN and AMRO merged to form ABN AMRO.
Today ABN AMRO is the 11th biggest bank in Europe and 20th in the world based on tier one capital.
ABN AMRO has over 3,500 branches in over 60 countries and territories, a staff of over 105,000 full-
time equivalents and total assets of EUR 975.1 billion (as at 31 March 2006).
1.1.2 Strategy
ABN AMRO is an international bank with European roots. The focus is on local consumer and
commercial banking relationships, strongly supported by a global network and an extensive product
suite.
The strategy is built on five elements:
1. Creating value for our clients by offering high-quality financial solutions which best meet their
current needs and long-term goals
2. Focusing on:
o consumer and commercial clients in our local markets in Europe, North America, Latin
America and Asia, and globally on:
o selected multinational corporations and financial institutions
o private clients
3. Leveraging our advantages in products and people to the benefit of all our clients
4. Sharing expertise and operational Excellence across the Group
5. Creating ‘fuel for growth’ by allocating capital and talent according to the principles of
Managing for Value, our value-based management model.” (ABN AMRO AR2005)
In order to implement this strategy, effectively 1st of January 2006, ABN AMRO changed its structure.
Different BUs have been created. These units are responsible for managing a distinct region, client
segment or product segment, while also sharing expertise and operational Excellence across the
Group.
Master Thesis International Management
Management Information System or Struggle Page 9 of 55
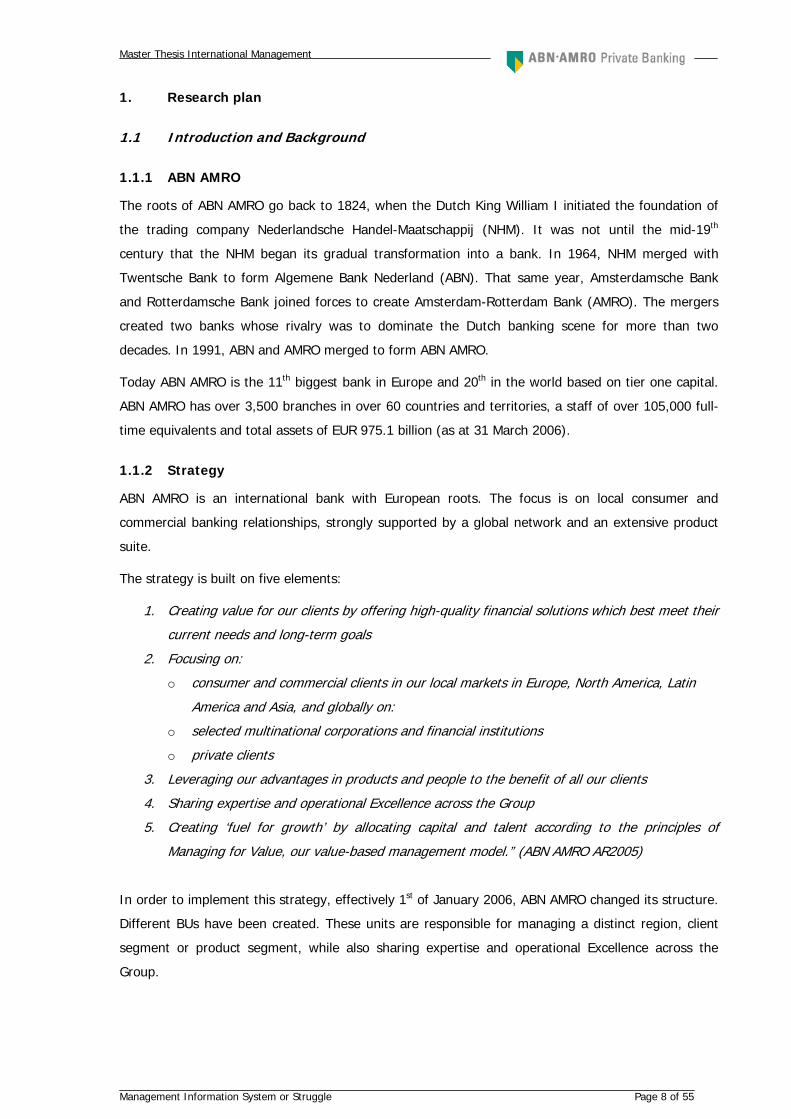
ABN AMRO today has:
• Five regional Client BUs: the Netherlands, Europe, North America, Latin America and
Asia. These BUs serve about 20 million consumer clients and small to larger businesses
worldwide. ABN AMRO is among the world’s leading players in these businesses.
• Two global Client BUs to serve clients with global needs. The BU Private Clients which
provides private banking services to wealthy individuals and families and the BU Global
Clients which serves 550 multinational clients.
• Three Product BUs: Global Markets, Asset Management and Transaction Banking.
Figure 1. Overview BUs
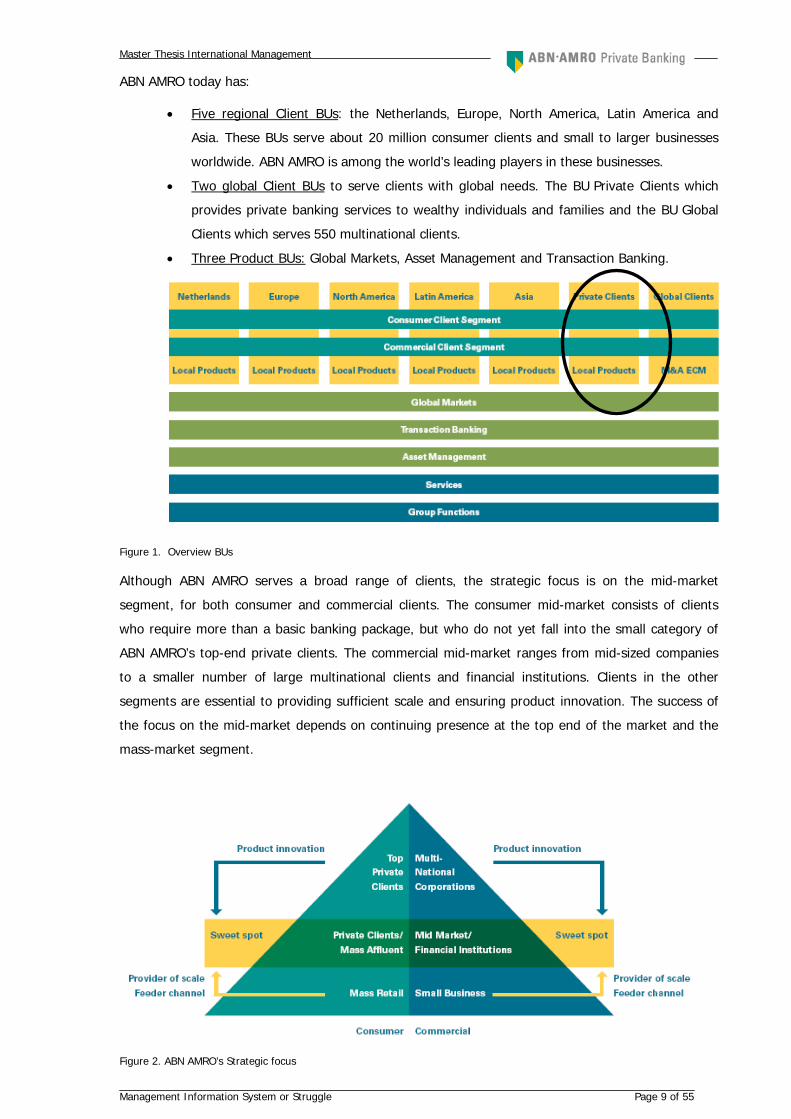
Although ABN AMRO serves a broad range of clients, the strategic focus is on the mid-market
segment, for both consumer and commercial clients. The consumer mid-market consists of clients
who require more than a basic banking package, but who do not yet fall into the small category of
ABN AMRO’s top-end private clients. The commercial mid-market ranges from mid-sized companies
to a smaller number of large multinational clients and financial institutions. Clients in the other
segments are essential to providing sufficient scale and ensuring product innovation. The success of
the focus on the mid-market depends on continuing presence at the top end of the market and the
mass-market segment.
Figure 2. ABN AMRO’s Strategic focus
Master Thesis International Management
Management Information System or Struggle Page 10 of 55
1.1.3 ABN AMRO Private Banking (BU Private Clients)
BU Private Clients (BU PC) is one of the top ten private banks worldwide and the fifth biggest in
Europe in terms of assets under administration (AuA), with year-end AuA in 2005 of EUR 131 Billion,
up from EUR 115 billion in 2004. It targets the offering of private banking services to wealthy
individuals and families with investable assets of EUR 1 Million or more. BU PC has more than 4000
employees spanning 82 branches in over 20 countries
1.1.4 ABN AMRO private clients Asia
ABN AMRO private clients Asia (AAPCA) has its two main international booking centers (which are
accountable for 80% of the total AUA) in Singapore and Hong Kong. There are smaller hubs in UAE,
Taiwan, China, India and Indonesia. The last four only serve the domestic markets; only clients from
that country.
o Singapore BC serves clients from Singapore, Malaysia int., Thailand int. and Indonesia
int.,
o Hong Kong BC serves clients from Hong Kong, Taiwan int., China int. and Korea int.
o UAE BC serves clients from various countries in the middle east.
o Taiwan, China, India and Indonesia all serve their own domestic markets.
Int. (international) mainly means two things. E.g., Indonesia int. stands for clients based in Indonesia
with holdings in a different currency than Rupiah and in a foreign country, in this case Hong Kong
and/or Singapore. Most of the time the non-local preferred currency for Asia is USD.
Although all branches have their own markets, clients can have their assets in different locations. One
client can have assets in Hong Kong and Indonesia, but only one Relationship Manager is managing
the assets of a client. AAPC earns money when clients trade securities or other investment products.
This can be in the form of upfront fees, trailer fees, commission etc. Another source of income is
interest income, e.g. the difference in interest between what ABN AMRO pays clients for their cash
holdings and the amount ABN AMRO receives from lending out money and placing interbank
deposits. There are thousands of clients who make transactions and they have thousands different
securities and cash holdings. In order to keep track of all those transactions AAPC uses a core-
banking system called Olympic. For management to take decisions and monitor results, they need
reports about those transactions and about the different types of revenues, products, clients and risk
related items (e.g. loans).
1.2 Problem formulation and objectives
1.2.1 Problem Formulation
Without information, it is impossible to make the right decisions, and without proper information
systems, it is impossible to get the right information. One of the most important contributions of
information technology and systems to business firms is the reduction in information uncertainty and
the resulting improvement in decision-making (Laudon and Laudon, 2006). Management has
indicated that they do not have enough adequate information about various aspects of the business
to support decision-making. The management reports they do currently receive are produced
Master Thesis International Management
Management Information System or Struggle Page 11 of 55
manually and are therefore delayed, not adequate and possible even not accurate. It requires
substantial effort and time of (IT) people to extract and process data for management reporting.
Data and especially historical data is not instantly accessible by management, because the data is not
stored in databases, but as individual files.
Management wants to improve the performance and efficiency of the organization by taking action
on this issue. The purpose of the assignment is to determine what activities and changes are
necessary to improve the Management Information System (MIS) in a way that it can deliver upon
the information requirements.
The problem formulation therefore is:
What are the problems with the current management information system and how can these be
solved to meet the information requirements?
1.2.2 Objectives
The following are the key objectives of this project:
- Define the information and information system needs and requirements of the different
(senior)managers
- Make an analysis of the current MIS
- Make a gap analysis of the differences in the current and desired situation
- Make recommendations about how to improve MIS
The required output is a report for ABN AMRO Private Banking Asia, with an analysis of the
management information requirements, a description of the current situation and the gap between
these two. This will lead to recommendations for improvements to ensure that management gets a
better and timelier insight in sales and business development.
1.3 Research setup
1.3.1 Research questions
The research questions have been formulated based on the steps that I have taken in order to give
an answer to the problem as formulated. In order to develop an effective information systems plan,
an organization must have a clear understanding of its information requirements (Larsson and
Malmsjö, 1998, Laudon and Laudon, 2006); this will be the first step. The next step will be an
analysis of the current management information system and the resulting available management
information. Step 3 will be an analysis of the difference between the current and desired situation
and finally, based on the results of the gap analysis, I will make a proposal of how to diminish this
Gap.
The main research questions are:
What are the management information requirements for senior management?
How is the current MIS structured, how does it process data and what is the outcome?
What is the gap between the current and the desired situation?
Master Thesis International Management
Management Information System or Struggle Page 12 of 55
1.4 Research approach & methodology
This section specifies briefly, which research methods and instruments are used to answer the
research questions.
Laudon and Laudon describe an information system as a socio-technical system. Though they are
composed of machines, devices, and physical technology, they require substantial social,
organizational, and intellectual investments to make them work properly. Therefore, the focus of this
research has been on more than just software and hardware, but also on the people and the
processes around it.
I have started with qualitative research, which is research that derives data from observation,
interviews, or verbal interactions and focuses on the meanings and interpretations of the participants
(Holloway and Wheeler, 1995), to find out what the management information requirements are and
what the desired situation is according to management. I have gathered this information mainly
through unstructured interviews with managers and by working in the MIS department. Because
AAPC Asia is part of a stock market-listed multinational company, there are also some requirements
defined by head-office. These requirements just have to be taken for granted. I have found out that
management is not aware of the availability of some data. By discussion and interaction, I indented
to help management defining their requirements. I have used a methodology described by Larsson
and Malmsjö (1998), called Decision Based Management (DBM) to systematically define the
information requirements. Starting with the decision making process required to reach organizational
goals, and using KPIs as means to determine the information requirements. These information
requirements also implicate some structural requirements of the MIS itself; the “desired situation”,
necessary to deliver upon the requirements. The next step was an examination of the current
management information system. How are the management reports being produced, what is the role
of people and systems? The focus was on the one hand on the structure of the MIS and on the other
hand on the outcome and the quality of the information/data. This part was mainly gathering
information. Inventorying with management what kind of reports they currently receive, and talking
to the people who make them to find out how they do it. I have worked actively together with the
people who are responsible for management reporting, and with the IT department. I was part of the
team and was operationally involved in management reporting. By actually participating in the daily
operations I could examine the processes, the problems people run into, and the information
availability. A part of the management information comes directly from the systems, but a large part
is manually produced. This latter part needed some more thorough investigation to find out whether
this manual work is done correctly and whether the processes in place are right.
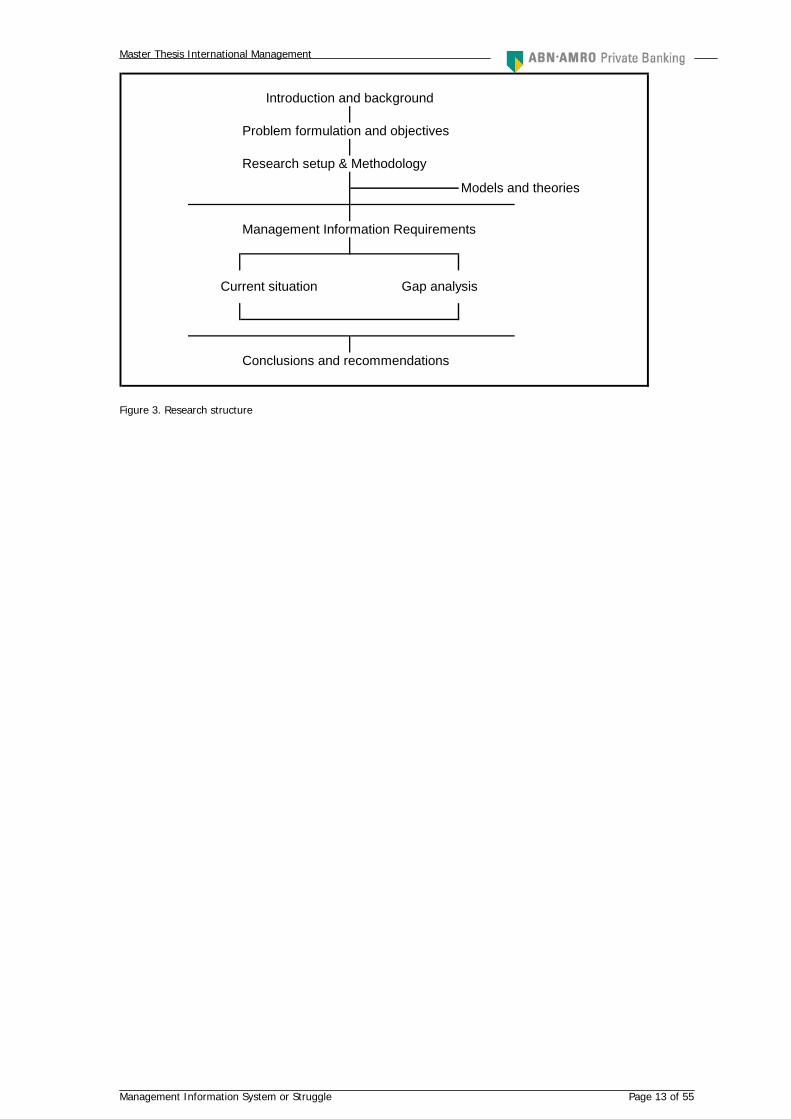
The gap-analysis has been performed using the same models and theories. Comparing the current
situation with the desired situation according to the formulated criteria, and defining what kind of
improvements are required. With the use of heat maps, I have indicated where the gaps between the
requirements and the current situation are the largest. This leads to the following research structure.
Master Thesis International Management
Management Information System or Struggle Page 13 of 55
Problem formulation and objectives
Research setup & Methodology
Management Information Requirements
Conclusions and recommendations
Introduction and background
Current situation Gap analysis
Models and theories
Figure 3. Research structure
Master Thesis International Management
Management Information System or Struggle Page 14 of 55
2. Models and theories
Based on the three main research questions, which are the three steps in the process, an outlay for
this thesis can be determined. For each of the four steps I have selected some theories and models
that have been used as a guidance to complete the steps. Each research question will be answered in
a separate chapter.
2.1 Information systems
An information system can be defined technically, as a set of interrelated components that collect (or
retrieve) process, store, and distribute information to support decision making and control in an
organization (Laudon and Laudon, 2006). Additionally, information systems may also help managers
and workers to analyze problems, visualize complex subjects, and create new products. Three
activities in an information system produce the information that organizations need to make
decisions, control operations, analyze problems, and create new products or services. These activities
are input, processing, and output. Input captures raw data from within the organization or from its
external environment. Processing converts this raw input into a more meaningful form. Output
transfers the processed information to the people who will use it or to the activities for which it will
be used. Information systems also require feedback, which is output that is returned to appropriate
members of the organization to help them evaluate or correct the stage.
(Laudon and Laudon, 2006) describe an information system as a socio-technical system. Though they
are composed of machines, devices, and physical technology, they require substantial social,
organizational, and intellectual investments to make them work properly.
2.2 Management information systems (MIS)
Definitions
A management information system is an information system used for supporting decision making in
general on all levels in an organization. (Larsson and Malmsjö, 1998)
MIS serve the management level of the organization, providing managers with reports and (online)
access to the organization’s current performance and historical records. Typically, MIS are oriented
almost exclusively to internal, not environmental or external, events. MIS primarily serve the
functions of planning, controlling, and decision making at the management level.
(Laudon and Laudon, 2006)
Lewis (1994) indicates that an information system should be seen as a servant-system to the master-
system of the whole business organization. “This form of relationship is of particular importance with
regard to information systems as this is the relationship between an organizational information-
system and the organization that it serves. An obvious consequence is that it is impossible to analyze
the operations of an information-system or design a new one without first having a clear
understanding of the activities and the objectives of the business system that it serves. One of the
failings of the past is that computer professionals, and the logic of the approaches that they employ,
Master Thesis International Management
Management Information System or Struggle Page 15 of 55
have not taken adequate notice of the importance of this relationship and viewed the creation of
information-systems to be an end in itself, rather than as a means to support the business”
The study of MIS arose in the 1970’s to focus on the use computer-based information system in
business firms and government agencies (Laudon, 1974; Davis and Olson, 1985). MIS combines the
work of computer science, management science, and operation research with a practical orientation
toward developing system solutions to real-world problems and managing information technology
resources. It is also concerned with behavioral science, and operations research with a practical
orientation toward developing system solutions to real-world problems and managing information
technology resources. Laudon and Laudon argue that no single approach effectively captures the
reality of information systems. The successes and failures of information systems are rarely all
technical or all behavioral.
2.3 Management information requirements
To evaluate and define the Management information (system) requirements, I will use a methodology
developed by Larsson and Malmsjö (1998). They use a methodology for developing management
information systems based on management information requirements. In order to design a good MIS
it seems logical, that the first step is to determine the needs and the requirements of management,
but Larsson and Malmsjö indicate that previous research is mainly focusing on data processing
technique, whereas information requirement analysis has been given less attention.
Based on their experience and the arguments of authors like Van Gigch (1978, 1991), Ackoff (1970)
and Churchman (1971) Larsson and Malmsjö argue that many of today’s problems with system
development are caused by the fact that a “system improvement” view instead of the “systems
design” view, dominates. System improvement can be seen as making improvements within the
existing boundaries of the system. The designer approach, on the other hand, is to discuss and
evaluate the goals of the organization and then analyze possible ways to reach these goals. This is
exactly what AAPC Asia needs. The current processes and available management information are
based on the boundaries of the system. Instead of changing the systems to better meet demands,
and technological possibilities, within AAPC Asia, they have chosen to adapt the people and processes
and therefore the requirements to their system. It is impossible to expect the same from a manual
process, within the same timeframe, as from a fully automated system. The current way MI is
provided and the current systems in place are about 4-6 years behind competitors in Asia (according
to employees that previously have worked for competitors). The only way to become at least a bit
closer to other banks is a complete re-design of the systems and the processes, and thus applying a
design view in the improvement process.
The design view that Larsson and Malmsjö incorporate in their methodology compromises a goal
orientation, a top down approach, and a decision perspective. They created a methodology called
Decision Based Management (DBM) (see figure 3). It concentrates on decisions and on the most
important factors (key performance indicators) influencing the goals of an organization. Laudon and
Laudon describe a similar strategy with an analysis of the critical success factors and goals to
Master Thesis International Management
Management Information System or Struggle Page 16 of 55
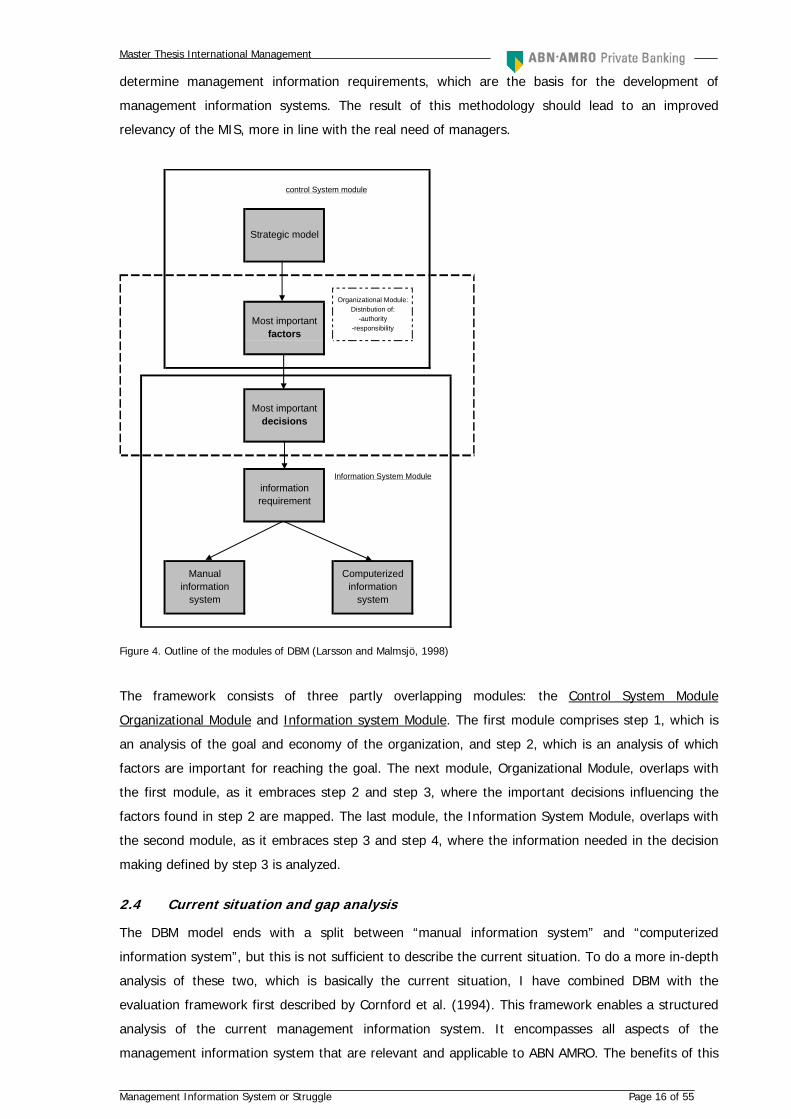
determine management information requirements, which are the basis for the development of
management information systems. The result of this methodology should lead to an improved
relevancy of the MIS, more in line with the real need of managers.
control System module
Information System Module
Organizational Module: Distribution of:
-authority -responsibility
Computerized information
system
Manual information
system
Strategic model
Most important factors
Most important decisions
information requirement
Figure 4. Outline of the modules of DBM (Larsson and Malmsjö, 1998)
The framework consists of three partly overlapping modules: the Control System Module
Organizational Module and Information system Module. The first module comprises step 1, which is
an analysis of the goal and economy of the organization, and step 2, which is an analysis of which
factors are important for reaching the goal. The next module, Organizational Module, overlaps with
the first module, as it embraces step 2 and step 3, where the important decisions influencing the
factors found in step 2 are mapped. The last module, the Information System Module, overlaps with
the second module, as it embraces step 3 and step 4, where the information needed in the decision
making defined by step 3 is analyzed.
2.4 Current situation and gap analysis
The DBM model ends with a split between “manual information system” and “computerized
information system”, but this is not sufficient to describe the current situation. To do a more in-depth
analysis of these two, which is basically the current situation, I have combined DBM with the
evaluation framework first described by Cornford et al. (1994). This framework enables a structured
analysis of the current management information system. It encompasses all aspects of the
management information system that are relevant and applicable to ABN AMRO. The benefits of this
Master Thesis International Management
Management Information System or Struggle Page 17 of 55
particular framework is that Cornford et al. use common evaluation practices as structure, process an
outcome combined with the technical, social and organizational aspects of an information system.
Since currently within AAPC Asia, the system technical part of the management information system is
rather small, this model is very usable because it also pays attention to human participation. Within
the human perspective, they distinguish the customer, actor, and owner of the system. I have made
the distinction between management and the employees using/operating the system. Since the
organizational context is already suited within the DBM, that part of the framework is not being used.
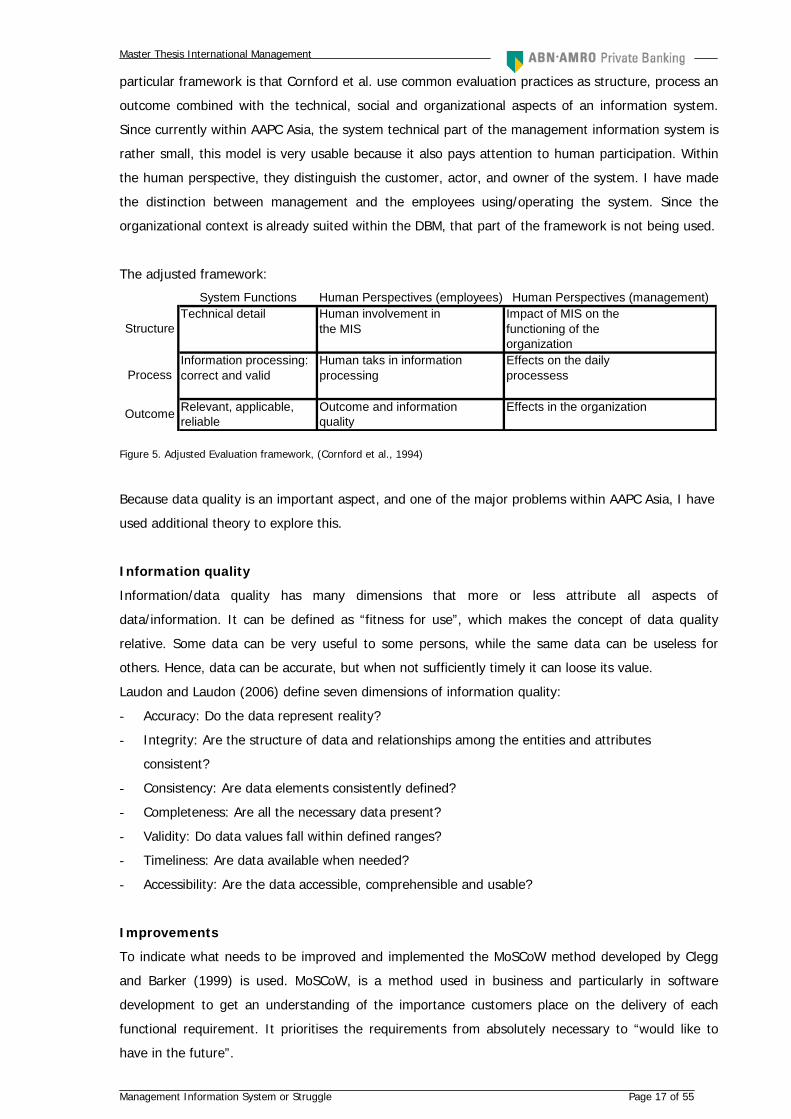
The adjusted framework:
System Functions Human Perspectives (employees) Human Perspectives (management)Technical detail Human involvement in Impact of MIS on the
the MIS functioning of theorganization
Information processing: Human taks in information Effects on the daily correct and valid processing processess
Relevant, applicable, Outcome and information Effects in the organizationreliable quality
Process
Outcome
Structure
Figure 5. Adjusted Evaluation framework, (Cornford et al., 1994)
Because data quality is an important aspect, and one of the major problems within AAPC Asia, I have
used additional theory to explore this.
Information quality
Information/data quality has many dimensions that more or less attribute all aspects of
data/information. It can be defined as “fitness for use”, which makes the concept of data quality
relative. Some data can be very useful to some persons, while the same data can be useless for
others. Hence, data can be accurate, but when not sufficiently timely it can loose its value.
Laudon and Laudon (2006) define seven dimensions of information quality:
- Accuracy: Do the data represent reality?
- Integrity: Are the structure of data and relationships among the entities and attributes
consistent?
- Consistency: Are data elements consistently defined?
- Completeness: Are all the necessary data present?
- Validity: Do data values fall within defined ranges?
- Timeliness: Are data available when needed?
- Accessibility: Are the data accessible, comprehensible and usable?
Improvements
To indicate what needs to be improved and implemented the MoSCoW method developed by Clegg
and Barker (1999) is used. MoSCoW, is a method used in business and particularly in software
development to get an understanding of the importance customers place on the delivery of each
functional requirement. It prioritises the requirements from absolutely necessary to “would like to
have in the future”.
Master Thesis International Management
Management Information System or Struggle Page 18 of 55
MoSCoW stands for:
• M - MUST have this.
• S - SHOULD have this if at all possible.
• C - COULD have this if it does not affect anything else
• W - WON'T have this time but WOULD like in the future.
Master Thesis International Management
Management Information System or Struggle Page 19 of 55
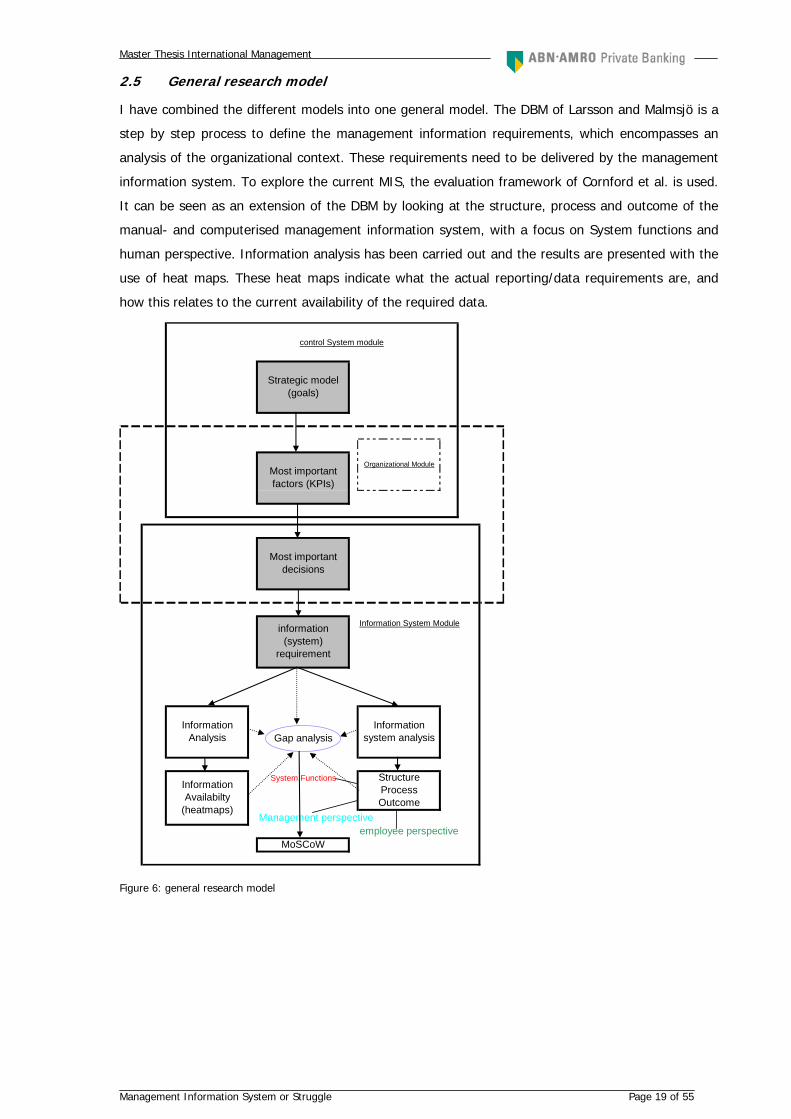
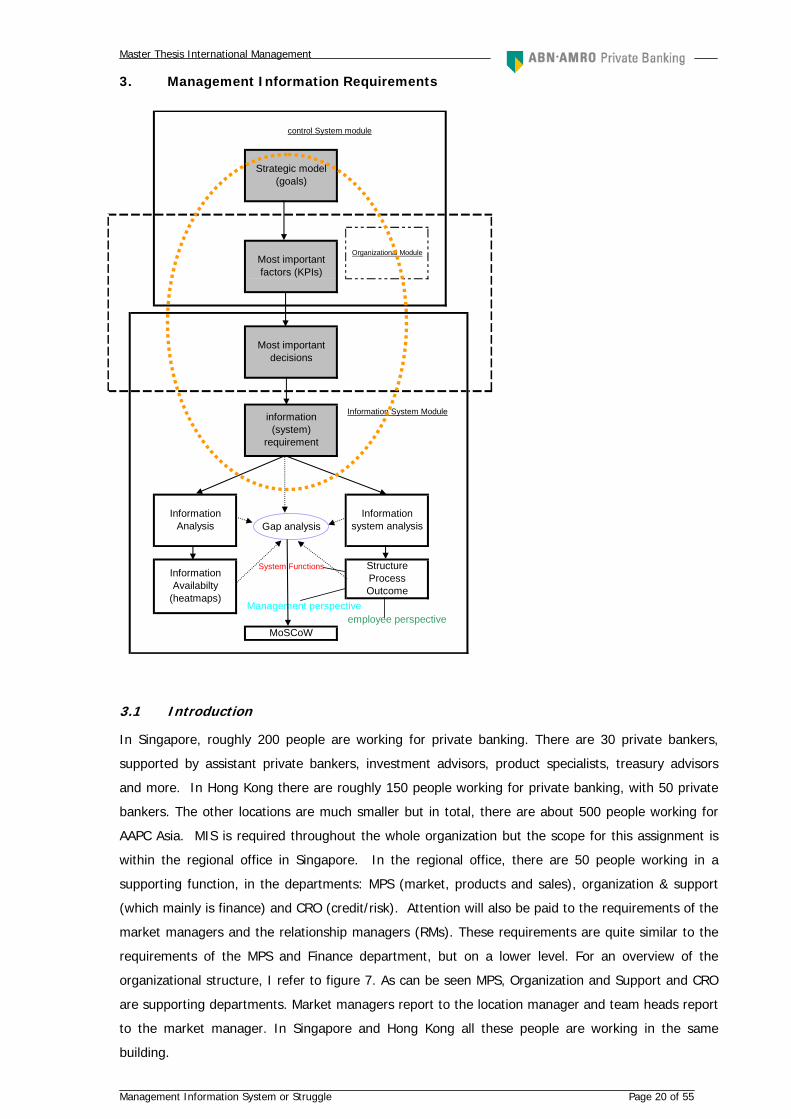
2.5 General research model
I have combined the different models into one general model. The DBM of Larsson and Malmsjö is a
step by step process to define the management information requirements, which encompasses an
analysis of the organizational context. These requirements need to be delivered by the management
information system. To explore the current MIS, the evaluation framework of Cornford et al. is used.
It can be seen as an extension of the DBM by looking at the structure, process and outcome of the
manual- and computerised management information system, with a focus on System functions and
human perspective. Information analysis has been carried out and the results are presented with the
use of heat maps. These heat maps indicate what the actual reporting/data requirements are, and
how this relates to the current availability of the required data.
control System module
Information System Module
Management perspectiveemployee perspective
MoSCoW
Information Availabilty
(heatmaps)
StructureProcessOutcome
System Functions
Strategic model (goals)
Most important factors (KPIs)
Most important decisions
information (system)
requirement
Organizational Module
Information system analysis
Information Analysis Gap analysis
Figure 6: general research model
Master Thesis International Management
Management Information System or Struggle Page 20 of 55
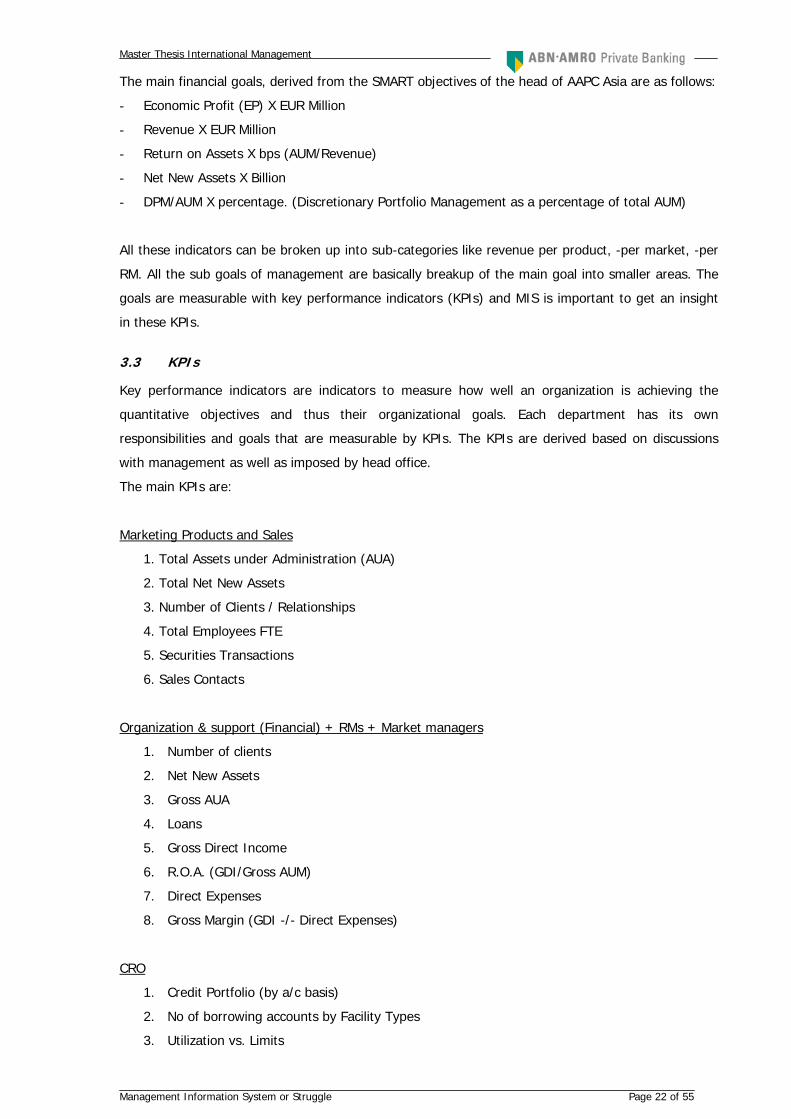
3. Management Information Requirements
control System module
Information System Module
Management perspectiveemployee perspective
MoSCoW
Information Availabilty
(heatmaps)
StructureProcessOutcome
Strategic model (goals)
Most important factors (KPIs)
Most important decisions
information (system)
requirement
Organizational Module
System Functions
Information system analysis
Information Analysis Gap analysis
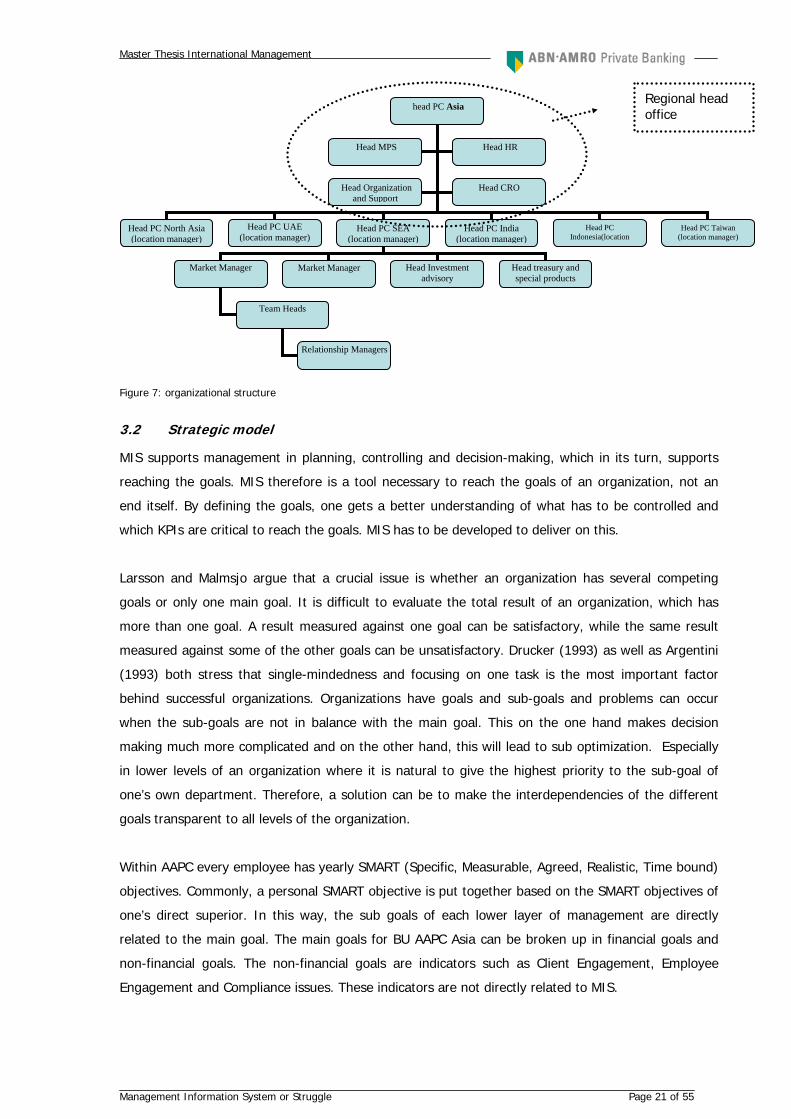
3.1 Introduction
In Singapore, roughly 200 people are working for private banking. There are 30 private bankers,
supported by assistant private bankers, investment advisors, product specialists, treasury advisors
and more. In Hong Kong there are roughly 150 people working for private banking, with 50 private
bankers. The other locations are much smaller but in total, there are about 500 people working for
AAPC Asia. MIS is required throughout the whole organization but the scope for this assignment is
within the regional office in Singapore. In the regional office, there are 50 people working in a
supporting function, in the departments: MPS (market, products and sales), organization & support
(which mainly is finance) and CRO (credit/risk). Attention will also be paid to the requirements of the
market managers and the relationship managers (RMs). These requirements are quite similar to the
requirements of the MPS and Finance department, but on a lower level. For an overview of the
organizational structure, I refer to figure 7. As can be seen MPS, Organization and Support and CRO
are supporting departments. Market managers report to the location manager and team heads report
to the market manager. In Singapore and Hong Kong all these people are working in the same
building.
Master Thesis International Management
Management Information System or Struggle Page 21 of 55
head PC Asia
Head PC North Asia (location manager)
Head PC SEA (location manager)
Head PC India (location manager)
Head MPS Head HR
Head Organization and Support
Head CRO
Head PC Indonesia(location
Head PC Taiwan (location manager)
Market Manager
Market Manager
Team Heads
Relationship Managers
Head PC UAE (location manager)
Head Investment advisory
Head treasury and special products
Regional head office
Figure 7: organizational structure
3.2 Strategic model
MIS supports management in planning, controlling and decision-making, which in its turn, supports
reaching the goals. MIS therefore is a tool necessary to reach the goals of an organization, not an
end itself. By defining the goals, one gets a better understanding of what has to be controlled and
which KPIs are critical to reach the goals. MIS has to be developed to deliver on this.
Larsson and Malmsjo argue that a crucial issue is whether an organization has several competing
goals or only one main goal. It is difficult to evaluate the total result of an organization, which has
more than one goal. A result measured against one goal can be satisfactory, while the same result
measured against some of the other goals can be unsatisfactory. Drucker (1993) as well as Argentini
(1993) both stress that single-mindedness and focusing on one task is the most important factor
behind successful organizations. Organizations have goals and sub-goals and problems can occur
when the sub-goals are not in balance with the main goal. This on the one hand makes decision
making much more complicated and on the other hand, this will lead to sub optimization. Especially
in lower levels of an organization where it is natural to give the highest priority to the sub-goal of
one’s own department. Therefore, a solution can be to make the interdependencies of the different
goals transparent to all levels of the organization.
Within AAPC every employee has yearly SMART (Specific, Measurable, Agreed, Realistic, Time bound)
objectives. Commonly, a personal SMART objective is put together based on the SMART objectives of
one’s direct superior. In this way, the sub goals of each lower layer of management are directly
related to the main goal. The main goals for BU AAPC Asia can be broken up in financial goals and
non-financial goals. The non-financial goals are indicators such as Client Engagement, Employee
Engagement and Compliance issues. These indicators are not directly related to MIS.
Master Thesis International Management
Management Information System or Struggle Page 22 of 55
The main financial goals, derived from the SMART objectives of the head of AAPC Asia are as follows:
- Economic Profit (EP) X EUR Million
- Revenue X EUR Million
- Return on Assets X bps (AUM/Revenue)
- Net New Assets X Billion
- DPM/AUM X percentage. (Discretionary Portfolio Management as a percentage of total AUM)
All these indicators can be broken up into sub-categories like revenue per product, -per market, -per
RM. All the sub goals of management are basically breakup of the main goal into smaller areas. The
goals are measurable with key performance indicators (KPIs) and MIS is important to get an insight
in these KPIs.
3.3 KPIs
Key performance indicators are indicators to measure how well an organization is achieving the
quantitative objectives and thus their organizational goals. Each department has its own
responsibilities and goals that are measurable by KPIs. The KPIs are derived based on discussions
with management as well as imposed by head office.
The main KPIs are:
Marketing Products and Sales
1. Total Assets under Administration (AUA)
2. Total Net New Assets
3. Number of Clients / Relationships
4. Total Employees FTE
5. Securities Transactions
6. Sales Contacts
Organization & support (Financial) + RMs + Market managers
1. Number of clients
2. Net New Assets
3. Gross AUA
4. Loans
5. Gross Direct Income
6. R.O.A. (GDI/Gross AUM)
7. Direct Expenses
8. Gross Margin (GDI -/- Direct Expenses)
CRO
1. Credit Portfolio (by a/c basis)
2. No of borrowing accounts by Facility Types
3. Utilization vs. Limits
Master Thesis International Management
Management Information System or Struggle Page 23 of 55
4. Overdue Credit Reviews (relationship basis)
5. No. of accounts by Collateral Types
6. AUM of borrowing & non-borrowing accounts
7. Credit income source by facility types (YTD)
8. Credit margin by facility type
9. Credit Portfolio Provisions (Special credits)
These KPIs are quite similar by nature. For MPS and Finance, these KPIs are related to the assets,
activity and profitability of clients. For CRO all KPIs are related to loans and collateral. The source
data for all this is mainly stored in Olympic and the information can be extracted in a similar way.
3.4 Decisions
Decisions are the dynamic force that can change the activities and thus the whole system. In this
methodology, Larsson and Malmsjo define a decision as a choice between alternatives expressed as
the result of the choice. MIS support decision making in general on all levels in an organization.
Decisions are not only made by management and executives but on all levels of the organization. In
the case of AAPC Asia, many important daily operational decisions are made by the RMs. They
determine the prices they charge to the client, the time they spend on clients, how often the client
will be visited/contacted and for which events the clients will be invited. Moreover, they determine
which products to sell to their clients. All these decisions have a very large influence on the (financial)
results and thus goals of AAPC.
The function of higher management as described by H. Fayol (1949) is planning, organizing,
commanding, coordinating and controlling. Decisions made by management are related to one of
these areas and therefore essential for obtaining organizational goals. Simon (1960) describes four
different stages in decision-making:
- Intelligence; discovering, identifying, and understanding the problems occurring in the
organization.
- Design; identifying and exploring various solutions to the problem
- Choice; choosing among alternative solutions
- Implementation; making the chosen alternative work and continuing to monitor how well the
solution is working.
In unstructured discussions, management has in general described the decisions that they have to
make. These decisions are impossible to make without (the right) information.
Marketing Products and Sales
- Pricing; how much to charge different clients for different products
- Service; how the service different clients
- Product development; which products to develop and sell
- Client engagement; how to make clients engaged
- Initiatives to increase sales and revenues
- Target groups; which clients to target; client segmentation
Master Thesis International Management
Management Information System or Struggle Page 24 of 55
- KYC, (know your client); how to get more insight in the clients
- CRM
Organization & support (Finance)
- Incentives; decisions about bonuses and other incentives
- Targets; determine targets for the coming years for various products, markets and countries
- Budgeting; making expectations about future revenue and costs
- Cost allocation; how to allocate fixed and overhead costs to various products, markets and
countries
- IT and MIS related decisions
- Information related decisions; what information do we need, what kind over performance related
overviews to provide to RMs.
CRO (risk)
Risk related decisions are often required on individual client level because the main responsibilities of
the risk department are related to extending of credits. Furthermore, extending of credits is bound to
authority given by head office and has an impact on the liquidity of the bank. Most decisions are
therefore related to the monitoring of the credit portfolio’s, collateral, and approval of credit limits.
There is also some general decision making about:
- Targets
- Prognoses
- Country risk related issues.
- Limit excess and collateral shortfall decisions
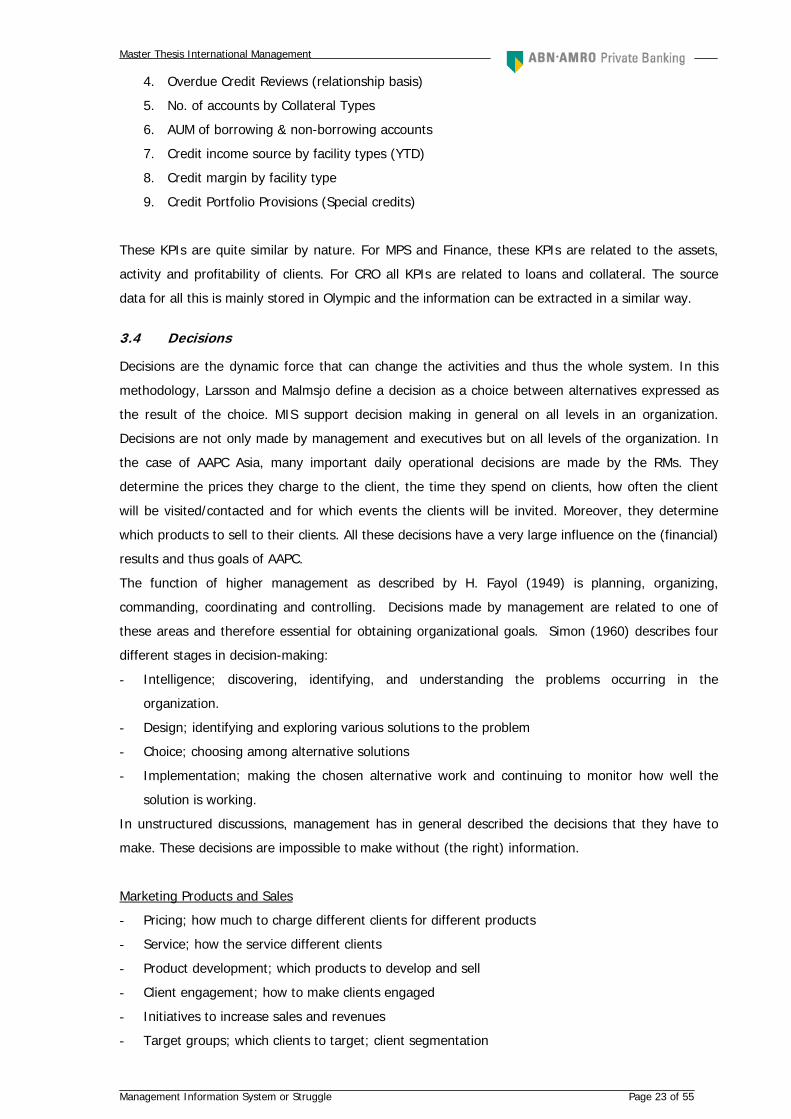
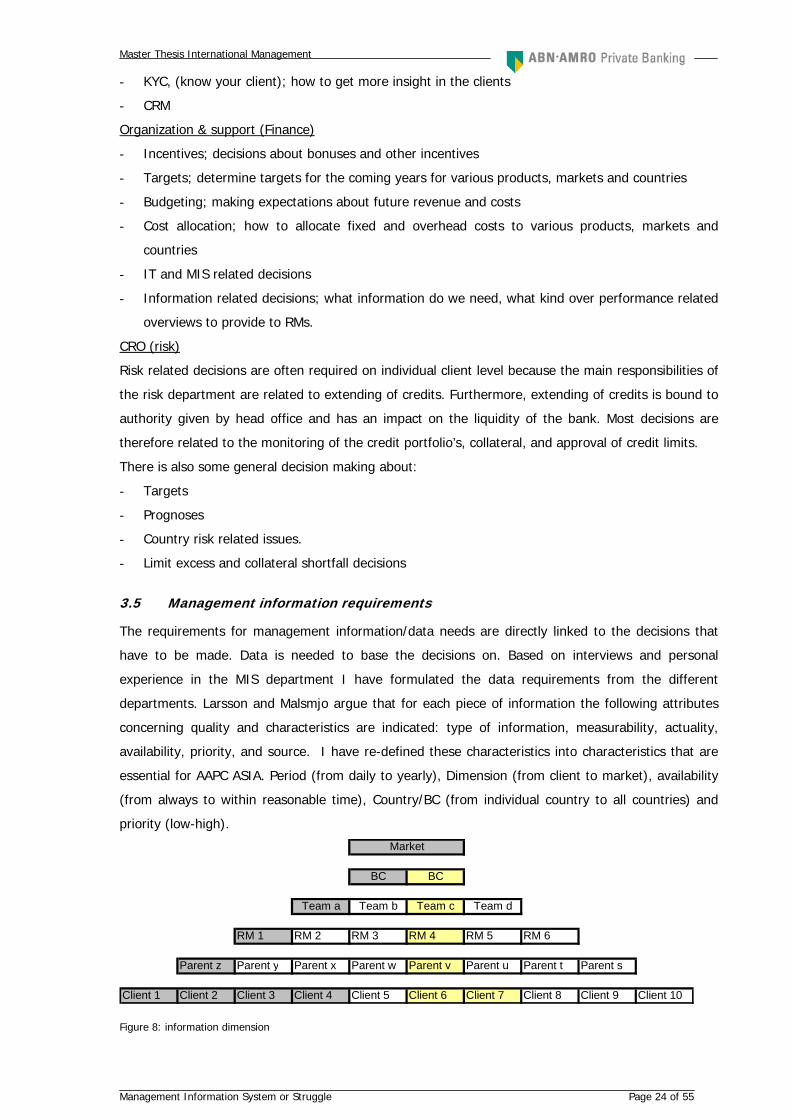
3.5 Management information requirements
The requirements for management information/data needs are directly linked to the decisions that
have to be made. Data is needed to base the decisions on. Based on interviews and personal
experience in the MIS department I have formulated the data requirements from the different
departments. Larsson and Malsmjo argue that for each piece of information the following attributes
concerning quality and characteristics are indicated: type of information, measurability, actuality,
availability, priority, and source. I have re-defined these characteristics into characteristics that are
essential for AAPC ASIA. Period (from daily to yearly), Dimension (from client to market), availability
(from always to within reasonable time), Country/BC (from individual country to all countries) and
priority (low-high).
BC BC
Team a Team b Team c Team d
RM 1 RM 2 RM 3 RM 4 RM 5 RM 6
Parent z Parent y Parent x Parent w Parent v Parent u Parent t Parent s
Client 1 Client 2 Client 3 Client 4 Client 5 Client 6 Client 7 Client 8 Client 9 Client 10
Market
Figure 8: information dimension
Master Thesis International Management
Management Information System or Struggle Page 25 of 55
Figure 8 shows the different dimensions of the information that is required. The lowest level is
information about an individual client. The highest level is market level. AAPC Asia has Booking
centers (BC) in several countries. Hong Kong and Singapore make up for about 80% of the total
AUM. In each booking center there are teams working which consist out of a market manager, team
head, Relationship managers, and assistant relationship managers. These teams serve a particular
market (country). A client (e.g. from Indonesia) can have his/her money in different BCs. He/she can
have a part of his/her money in Singapore and a part in Indonesia. In this case the market is
Indonesia, and the money is booked in booking center Singapore and booking center Indonesia.
Information requirements can differ from a single client in a particular BC to overviews on market
level, which include multiple BCs. This results in a large difference in complexity. Ideally, information
is available in click-down way, so that there is a possibility to drill down from the highest to the
lowest level.
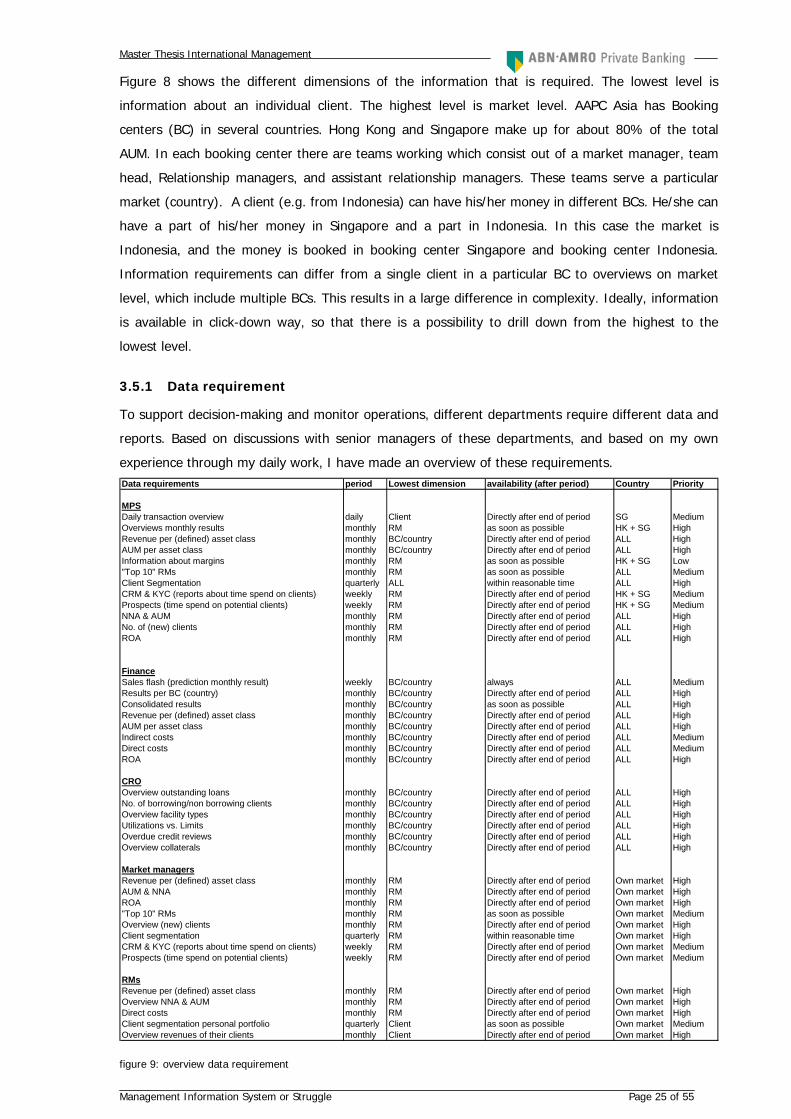
3.5.1 Data requirement
To support decision-making and monitor operations, different departments require different data and
reports. Based on discussions with senior managers of these departments, and based on my own
experience through my daily work, I have made an overview of these requirements. Data requirements period Lowest dimension availability (after period) Country Priority
MPSDaily transaction overview daily Client Directly after end of period SG MediumOverviews monthly results monthly RM as soon as possible HK + SG HighRevenue per (defined) asset class monthly BC/country Directly after end of period ALL HighAUM per asset class monthly BC/country Directly after end of period ALL HighInformation about margins monthly RM as soon as possible HK + SG Low"Top 10" RMs monthly RM as soon as possible ALL MediumClient Segmentation quarterly ALL within reasonable time ALL HighCRM & KYC (reports about time spend on clients) weekly RM Directly after end of period HK + SG MediumProspects (time spend on potential clients) weekly RM Directly after end of period HK + SG MediumNNA & AUM monthly RM Directly after end of period ALL HighNo. of (new) clients monthly RM Directly after end of period ALL HighROA monthly RM Directly after end of period ALL High
FinanceSales flash (prediction monthly result) weekly BC/country always ALL MediumResults per BC (country) monthly BC/country Directly after end of period ALL HighConsolidated results monthly BC/country as soon as possible ALL HighRevenue per (defined) asset class monthly BC/country Directly after end of period ALL HighAUM per asset class monthly BC/country Directly after end of period ALL HighIndirect costs monthly BC/country Directly after end of period ALL MediumDirect costs monthly BC/country Directly after end of period ALL MediumROA monthly BC/country Directly after end of period ALL High
CROOverview outstanding loans monthly BC/country Directly after end of period ALL HighNo. of borrowing/non borrowing clients monthly BC/country Directly after end of period ALL HighOverview facility types monthly BC/country Directly after end of period ALL HighUtilizations vs. Limits monthly BC/country Directly after end of period ALL HighOverdue credit reviews monthly BC/country Directly after end of period ALL HighOverview collaterals monthly BC/country Directly after end of period ALL High
Market managersRevenue per (defined) asset class monthly RM Directly after end of period Own market HighAUM & NNA monthly RM Directly after end of period Own market HighROA monthly RM Directly after end of period Own market High"Top 10" RMs monthly RM as soon as possible Own market MediumOverview (new) clients monthly RM Directly after end of period Own market HighClient segmentation quarterly RM within reasonable time Own market HighCRM & KYC (reports about time spend on clients) weekly RM Directly after end of period Own market MediumProspects (time spend on potential clients) weekly RM Directly after end of period Own market Medium
RMsRevenue per (defined) asset class monthly RM Directly after end of period Own market HighOverview NNA & AUM monthly RM Directly after end of period Own market HighDirect costs monthly RM Directly after end of period Own market HighClient segmentation personal portfolio quarterly Client as soon as possible Own market MediumOverview revenues of their clients monthly Client Directly after end of period Own market High
figure 9: overview data requirement
Master Thesis International Management
Management Information System or Struggle Page 26 of 55
Some data, particular detailed sales data, is required daily. MPS requires a daily overview of all the
securities transactions. This enables them to track the progress of securities that are currently being
promoted and monitor the margins the different RMs make. The CFO requires a weekly flash to get
early insight in the overall month-end results. In this way decisions can be made before the actual
results are out. In general, it can be said that everything that requires direct action, and can be
influenced directly (short term) is required on at least a weekly basis. Longer term, strategic
decisions, can be made based on monthly reports. Head office also requires monthly reports of actual
results.
In general, the higher the manager, the higher the level of information. Middle management requires
reports on individual clients or RMs, higher management is mostly interested in country or market
level. This relates to the level of decision-making, from operational to strategic.
Next to these “report requirements”, management will need more insight in, and access to historical
data to get an overview of trends and developments.
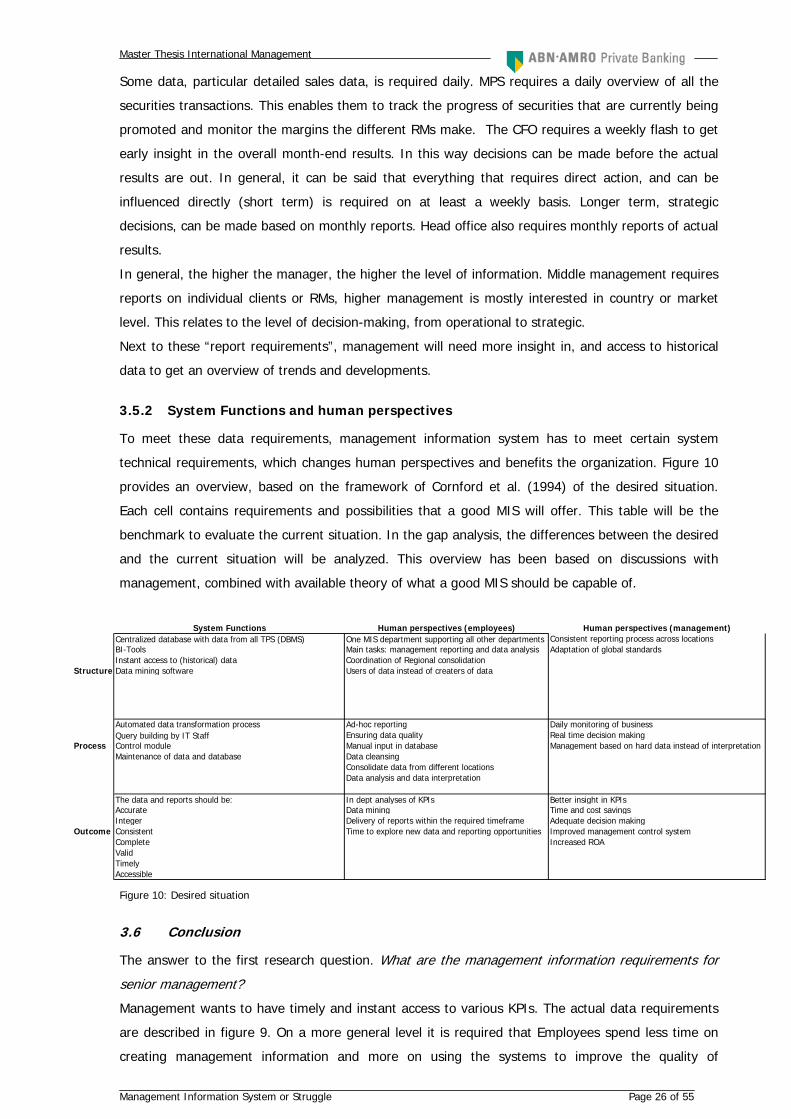
3.5.2 System Functions and human perspectives
To meet these data requirements, management information system has to meet certain system
technical requirements, which changes human perspectives and benefits the organization. Figure 10
provides an overview, based on the framework of Cornford et al. (1994) of the desired situation.
Each cell contains requirements and possibilities that a good MIS will offer. This table will be the
benchmark to evaluate the current situation. In the gap analysis, the differences between the desired
and the current situation will be analyzed. This overview has been based on discussions with
management, combined with available theory of what a good MIS should be capable of.
System Functions Human perspectives (employees) Human perspectives (management)
Centralized database with data from all TPS (DBMS) One MIS department supporting all other departments Consistent reporting process across locationsBI-Tools Main tasks: management reporting and data analysis Adaptation of global standardsInstant access to (historical) data Coordination of Regional consolidation
Structure Data mining software Users of data instead of creaters of data
Automated data transformation process Ad-hoc reporting Daily monitoring of businessQuery building by IT Staff Ensuring data quality Real time decision making
Process Control module Manual input in database Management based on hard data instead of interpretationMaintenance of data and database Data cleansing
Consolidate data from different locationsData analysis and data interpretation
The data and reports should be: In dept analyses of KPIs Better insight in KPIsAccurate Data mining Time and cost savingsInteger Delivery of reports within the required timeframe Adequate decision making
Outcome Consistent Time to explore new data and reporting opportunities Improved management control systemComplete Increased ROAValid Timely Accessible Figure 10: Desired situation
3.6 Conclusion
The answer to the first research question. What are the management information requirements for
senior management?
Management wants to have timely and instant access to various KPIs. The actual data requirements
are described in figure 9. On a more general level it is required that Employees spend less time on
creating management information and more on using the systems to improve the quality of
Master Thesis International Management
Management Information System or Struggle Page 27 of 55
management information. The required management information needs to be available in a low level
of granularity so that in-depth analysis is possible and data can be viewed from different perspectives
and dimensions and used for different purposes. Historical data should be instantly accessible. Since
manual processes cannot deliver on these requirements, a system-technical solution is necessary,
starting with a database that captures information from various system, which need to be accessible
by a BI-tool. All this leads to different human participation in the management information system.
Master Thesis International Management
Management Information System or Struggle Page 28 of 55
4. Current Situation
4.1 Introduction
Looking at the current situation involves looking at the current availability of management
information and looking at the current management information system. The structure of the system,
the processes and the outcome. This chapter has been written based on participative design. As a
team member in the finance and MIS department, producing management reports is part of the daily
job. My role, next to supporting the current reporting, was liaising with management about their
requirements and discussions about the data they currently receive. We discussed what they wanted
to have, but currently do not receive (or too late). Based on those requirements, I discussed with the
MIS team why these reports are not available, and quite often the reason was that they where not
aware of the fact that the required information is indeed currently available in the systems. Most of
the research that I did was together with the IT-department. Ask questions about particular data,
and most of the time, IT provided the required data, and processes could be set up, to automate it,
and provide it on a regular basis.
The structure, process and outcome of the current MIS is a case description, based on my own
experience, and shows how the current MIS operates and how this relates to systems, and the
influences is has on employees and management.
In this chapter, examples are described (in text boxes) of short-term solutions, I developed to solve
some of the current problems, or improve current processes.
4.2 Information availability
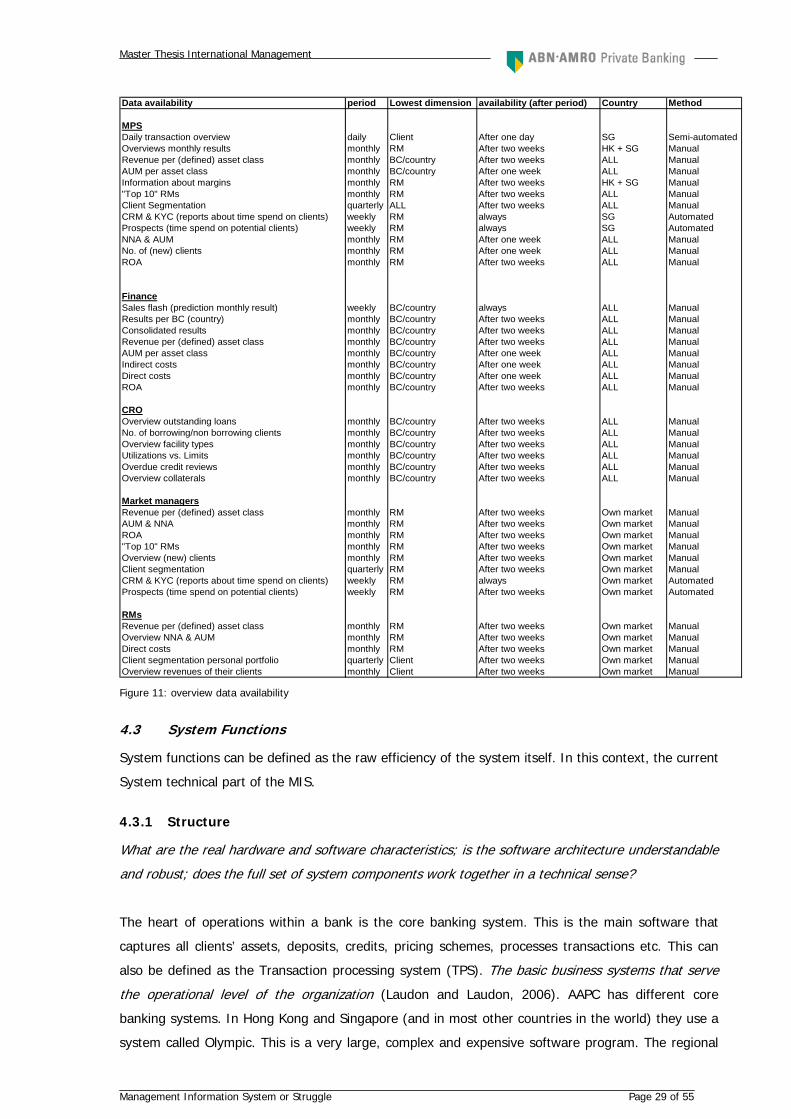
The previous chapter shows an overview of the information requirements. Figure 11 shows an
overview of which data and reports currently are available, in which dimension, in which timeframe,
and how it is produced. (Manual in this context means, raw data being transformed into reports in
MS Excel). This overview shows that most of the information/data is currently available, but it also
shows that it takes a long time to produce, because of the manual way of creating this management
information. This makes the information a lot less valuable. That the information is available, does
not mean that management also gets it. As briefly described in the introduction, quite some
information is available, but people where not aware of it. This directly shows one of the current
problems: communication between departments. Management does not know what is available, and
IT does not know what management wants to have.
Master Thesis International Management
Management Information System or Struggle Page 29 of 55
Data availability period Lowest dimension availability (after period) Country Method
MPSDaily transaction overview daily Client After one day SG Semi-automatedOverviews monthly results monthly RM After two weeks HK + SG ManualRevenue per (defined) asset class monthly BC/country After two weeks ALL ManualAUM per asset class monthly BC/country After one week ALL ManualInformation about margins monthly RM After two weeks HK + SG Manual"Top 10" RMs monthly RM After two weeks ALL ManualClient Segmentation quarterly ALL After two weeks ALL ManualCRM & KYC (reports about time spend on clients) weekly RM always SG AutomatedProspects (time spend on potential clients) weekly RM always SG AutomatedNNA & AUM monthly RM After one week ALL ManualNo. of (new) clients monthly RM After one week ALL ManualROA monthly RM After two weeks ALL Manual
FinanceSales flash (prediction monthly result) weekly BC/country always ALL ManualResults per BC (country) monthly BC/country After two weeks ALL ManualConsolidated results monthly BC/country After two weeks ALL ManualRevenue per (defined) asset class monthly BC/country After two weeks ALL ManualAUM per asset class monthly BC/country After one week ALL ManualIndirect costs monthly BC/country After one week ALL ManualDirect costs monthly BC/country After one week ALL ManualROA monthly BC/country After two weeks ALL Manual
CROOverview outstanding loans monthly BC/country After two weeks ALL ManualNo. of borrowing/non borrowing clients monthly BC/country After two weeks ALL ManualOverview facility types monthly BC/country After two weeks ALL ManualUtilizations vs. Limits monthly BC/country After two weeks ALL ManualOverdue credit reviews monthly BC/country After two weeks ALL ManualOverview collaterals monthly BC/country After two weeks ALL Manual
Market managersRevenue per (defined) asset class monthly RM After two weeks Own market ManualAUM & NNA monthly RM After two weeks Own market ManualROA monthly RM After two weeks Own market Manual"Top 10" RMs monthly RM After two weeks Own market ManualOverview (new) clients monthly RM After two weeks Own market ManualClient segmentation quarterly RM After two weeks Own market ManualCRM & KYC (reports about time spend on clients) weekly RM always Own market AutomatedProspects (time spend on potential clients) weekly RM After two weeks Own market Automated
RMsRevenue per (defined) asset class monthly RM After two weeks Own market ManualOverview NNA & AUM monthly RM After two weeks Own market ManualDirect costs monthly RM After two weeks Own market ManualClient segmentation personal portfolio quarterly Client After two weeks Own market ManualOverview revenues of their clients monthly Client After two weeks Own market Manual Figure 11: overview data availability
4.3 System Functions
System functions can be defined as the raw efficiency of the system itself. In this context, the current
System technical part of the MIS.
4.3.1 Structure
What are the real hardware and software characteristics; is the software architecture understandable
and robust; does the full set of system components work together in a technical sense?
The heart of operations within a bank is the core banking system. This is the main software that
captures all clients’ assets, deposits, credits, pricing schemes, processes transactions etc. This can
also be defined as the Transaction processing system (TPS). The basic business systems that serve
the operational level of the organization (Laudon and Laudon, 2006). AAPC has different core
banking systems. In Hong Kong and Singapore (and in most other countries in the world) they use a
system called Olympic. This is a very large, complex and expensive software program. The regional
Master Thesis International Management
Management Information System or Struggle Page 30 of 55
Communication problem: Management repeatedly requested a daily overview of all security transactions. IT department said that this was not possible. After discussion with IT, it did turn out to be possible. The problem was that management had defined their requirements too specifically. That particular format, containing that particular data, was indeed not available. But slightly different, still meeting all basic requirements, the data has been available for years. Management did not know the possibilities and IT did not know what management needed.
office in Singapore uses this already for a couple
of years. Since early 2006 Olympic is also
implemented in Hong Kong (but a newer version
that has some differences with the Singapore
version). Because of the costs of this system, it is
not remunerative to use Olympic in the smaller
AAPC Asia locations. There they use a core
banking system called Score. Recently there have
been some discussions within AAPC to upgrade all
locations to one multi-center version of Olympic,
but the decision has been made not to do this, because of the cost aspect.
Besides Olympic, there are other systems in use. There is a system called Murex, which captures the
dual currency deposits (dcds) and options. They use SAP software to capture the costs and recently
they have implemented a CRM system in Singapore and Hong Kong. Before that, there was no CRM
system. With this new system, RMs have to keep record of all their (telephone) meetings with clients
and capture information about clients (interest, hobbies, investment profile etc.).
There is no connection between the systems in the different locations. They all operate independently
and separately. Even within a location, the different systems, like Olympic, Murex and SAP work
independently.
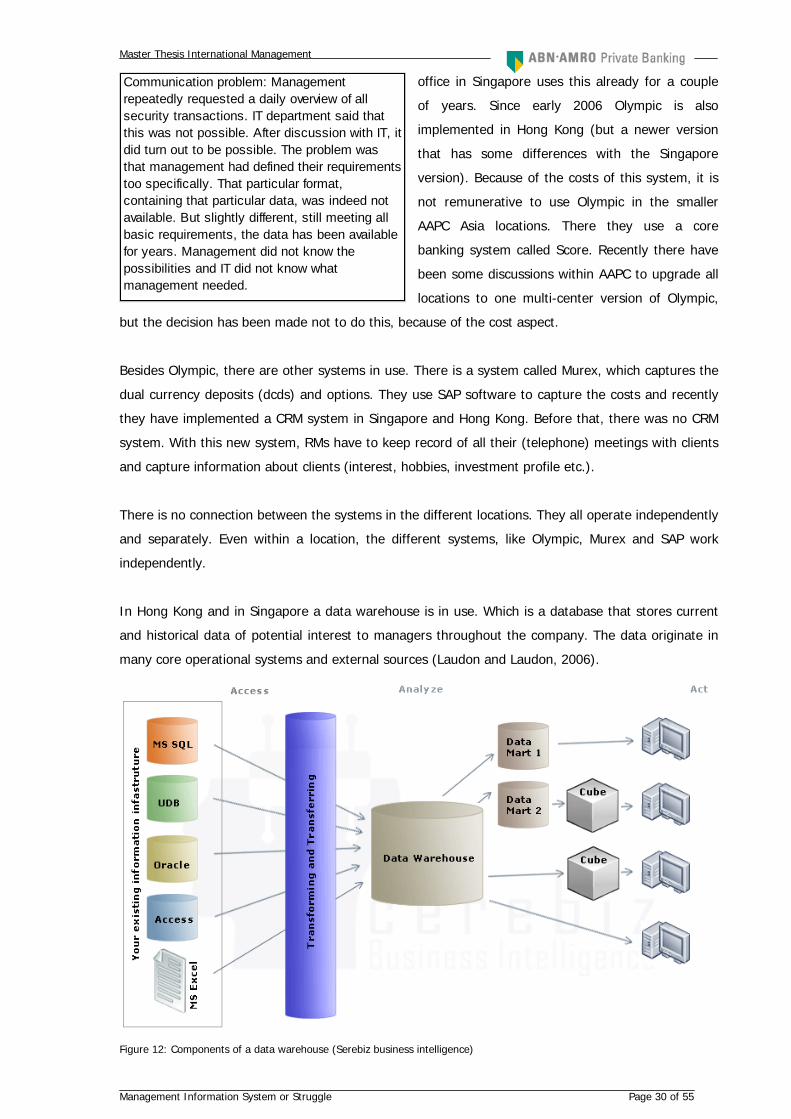
In Hong Kong and in Singapore a data warehouse is in use. Which is a database that stores current
and historical data of potential interest to managers throughout the company. The data originate in
many core operational systems and external sources (Laudon and Laudon, 2006).
Figure 12: Components of a data warehouse (Serebiz business intelligence)
Master Thesis International Management
Management Information System or Struggle Page 31 of 55
In practice, it does not work this way within AAPC Asia. Currently, AAPC Asia has a separate DWH for
Singapore and for Hong Kong and it extracts only data from Olympic, not from the other systems.
(there is no DWH in the other locations) It stores historical data, but since most of this data needs
extensive manipulation to meet requirements, the data stored in its current form is of not much use
and it gives far from a complete picture.
Laudon and Laudon define four major types of information systems that correspond to different
organizational levels. TPS on the operational level, MIS and DSS (decision support systems) on the
management level and ESS (Executive support
systems) on the strategic level. To summarize,
AAPC Asia only has a TPS, and none of the above
mentioned other systems. There is no system that
generates reports for management. The
management information “system” within AAPC
Asia, are people who use MS Excel to transform
raw data into management reports.
The monthly performance overviews for the RM's where created manually in Excel every month. The process of transforming the raw data into the final reports is the same every month. By creating some formula based basic templates wn
ith Macro's in Excel, the time that is saved ow is about 2 whole days a month, which
means that the results can be presented 2 days earlier.
4.3.2 Process
Is the method by which the system transforms its data, the information processing, correct and valid? The system technical processing of information in the core banking systems is beyond the scope of
this project. As described the only real system technical information transformation is from the core
banking system into the DWH. The systems in use do not have reporting functions that meet
requirements. There are possibilities to run queries, but this is only being used to generate particular
raw data, which is exported to MS Excel and thereafter manually adjusted and transformed into
management reports.
4.3.3 Outcome
Are the results relevant, applicable and reliable? Does it meet the requirement specifications? The system technical results/the output of the system in the current situation is still raw data, that is
of no use for management reporting. Except from the DWH (which is only used for data
transformation), the TPS is the end stage of information processing. This causes that requirement in
terms of timeliness can never be met in the current situation. Since all current management reporting
requires manual involvement, information is not available “on demand”.
4.3.4 Conclusion
There is currently no computerized management information system. The different TPS are producing
data, which is manually transformed into management reports. Systems are not linked to each other,
which leads to data inconsistency and data redundancy. There are no BI-tools in use. An expensive
DWH is in place but it is hardly used; hence, the same results could be achieved without using it at
all.
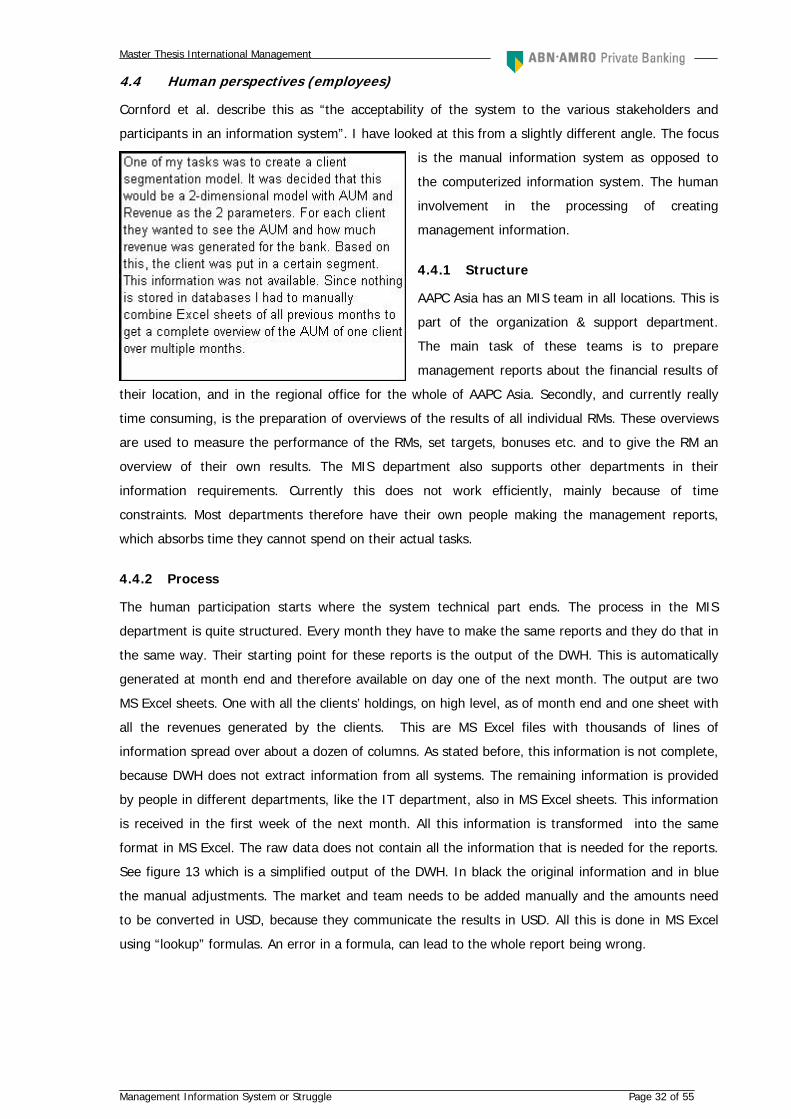
Master Thesis International Management
Management Information System or Struggle Page 32 of 55
4.4 Human perspectives (employees)
Cornford et al. describe this as “the acceptability of the system to the various stakeholders and
participants in an information system”. I have looked at this from a slightly different angle. The focus
is the manual information system as opposed to
the computerized information system. The human
involvement in the processing of creating
management information.
4.4.1 Structure
AAPC Asia has an MIS team in all locations. This is
part of the organization & support department.
The main task of these teams is to prepare
management reports about the financial results of
their location, and in the regional office for the whole of AAPC Asia. Secondly, and currently really
time consuming, is the preparation of overviews of the results of all individual RMs. These overviews
are used to measure the performance of the RMs, set targets, bonuses etc. and to give the RM an
overview of their own results. The MIS department also supports other departments in their
information requirements. Currently this does not work efficiently, mainly because of time
constraints. Most departments therefore have their own people making the management reports,
which absorbs time they cannot spend on their actual tasks.
4.4.2 Process
The human participation starts where the system technical part ends. The process in the MIS
department is quite structured. Every month they have to make the same reports and they do that in
the same way. Their starting point for these reports is the output of the DWH. This is automatically
generated at month end and therefore available on day one of the next month. The output are two
MS Excel sheets. One with all the clients’ holdings, on high level, as of month end and one sheet with
all the revenues generated by the clients. This are MS Excel files with thousands of lines of
information spread over about a dozen of columns. As stated before, this information is not complete,
because DWH does not extract information from all systems. The remaining information is provided
by people in different departments, like the IT department, also in MS Excel sheets. This information
is received in the first week of the next month. All this information is transformed into the same
format in MS Excel. The raw data does not contain all the information that is needed for the reports.
See figure 13 which is a simplified output of the DWH. In black the original information and in blue
the manual adjustments. The market and team needs to be added manually and the amounts need
to be converted in USD, because they communicate the results in USD. All this is done in MS Excel
using “lookup” formulas. An error in a formula, can lead to the whole report being wrong.
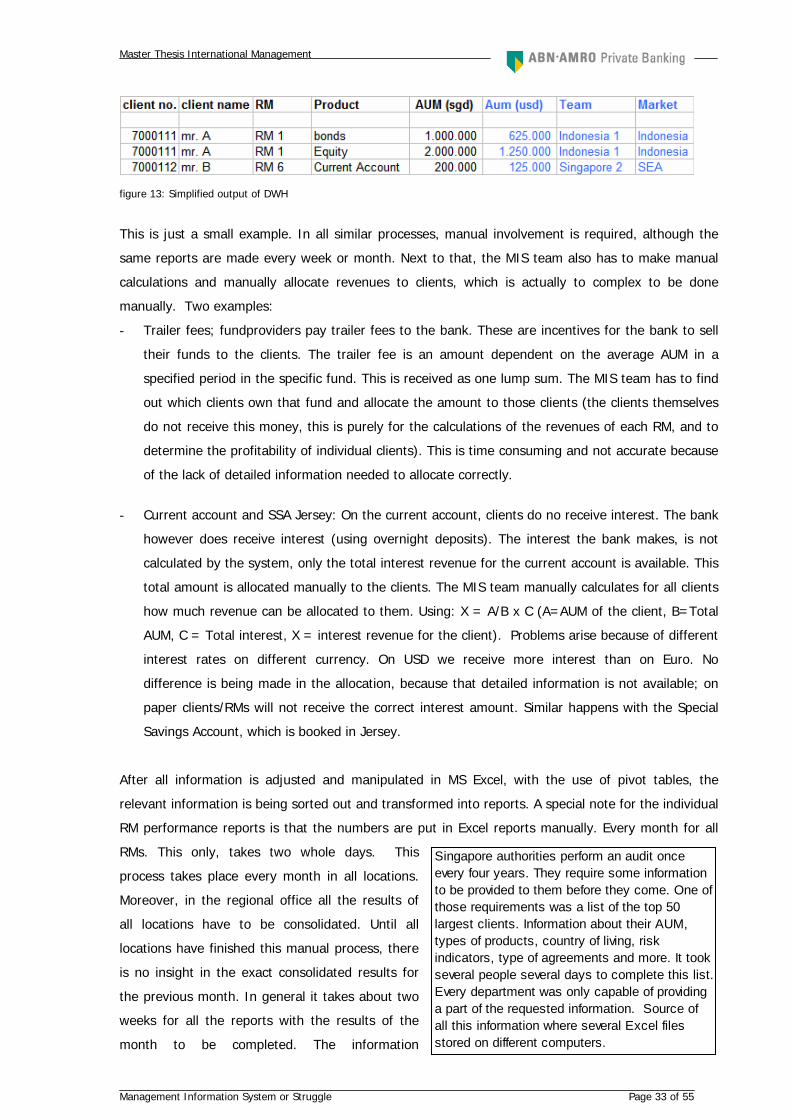
Master Thesis International Management
Management Information System or Struggle Page 33 of 55
figure 13: Simplified output of DWH
This is just a small example. In all similar processes, manual involvement is required, although the
same reports are made every week or month. Next to that, the MIS team also has to make manual
calculations and manually allocate revenues to clients, which is actually to complex to be done
manually. Two examples:
- Trailer fees; fundproviders pay trailer fees to the bank. These are incentives for the bank to sell
their funds to the clients. The trailer fee is an amount dependent on the average AUM in a
specified period in the specific fund. This is received as one lump sum. The MIS team has to find
out which clients own that fund and allocate the amount to those clients (the clients themselves
do not receive this money, this is purely for the calculations of the revenues of each RM, and to
determine the profitability of individual clients). This is time consuming and not accurate because
of the lack of detailed information needed to allocate correctly.
- Current account and SSA Jersey: On the current account, clients do no receive interest. The bank
however does receive interest (using overnight deposits). The interest the bank makes, is not
calculated by the system, only the total interest revenue for the current account is available. This
total amount is allocated manually to the clients. The MIS team manually calculates for all clients
how much revenue can be allocated to them. Using: X = A/B x C (A=AUM of the client, B=Total
AUM, C = Total interest, X = interest revenue for the client). Problems arise because of different
interest rates on different currency. On USD we receive more interest than on Euro. No
difference is being made in the allocation, because that detailed information is not available; on
paper clients/RMs will not receive the correct interest amount. Similar happens with the Special
Savings Account, which is booked in Jersey.
After all information is adjusted and manipulated in MS Excel, with the use of pivot tables, the
relevant information is being sorted out and transformed into reports. A special note for the individual
RM performance reports is that the numbers are put in Excel reports manually. Every month for all
RMs. This only, takes two whole days. This
process takes place every month in all locations.
Moreover, in the regional office all the results of
all locations have to be consolidated. Until all
locations have finished this manual process, there
is no insight in the exact consolidated results for
the previous month. In general it takes about two
weeks for all the reports with the results of the
month to be completed. The information
Singapore authorities perform an audit once every four years. They require some information to be provided to them before they come. One of those requirements was a list of the top 50 largest clients. Information about their AUM, types of products, country of living, risk indicators, type of agreements and more. It took several people several days to complete this list. Every department was only capable of providing a part of the requested information. Source of all this information where several Excel files stored on different computers.
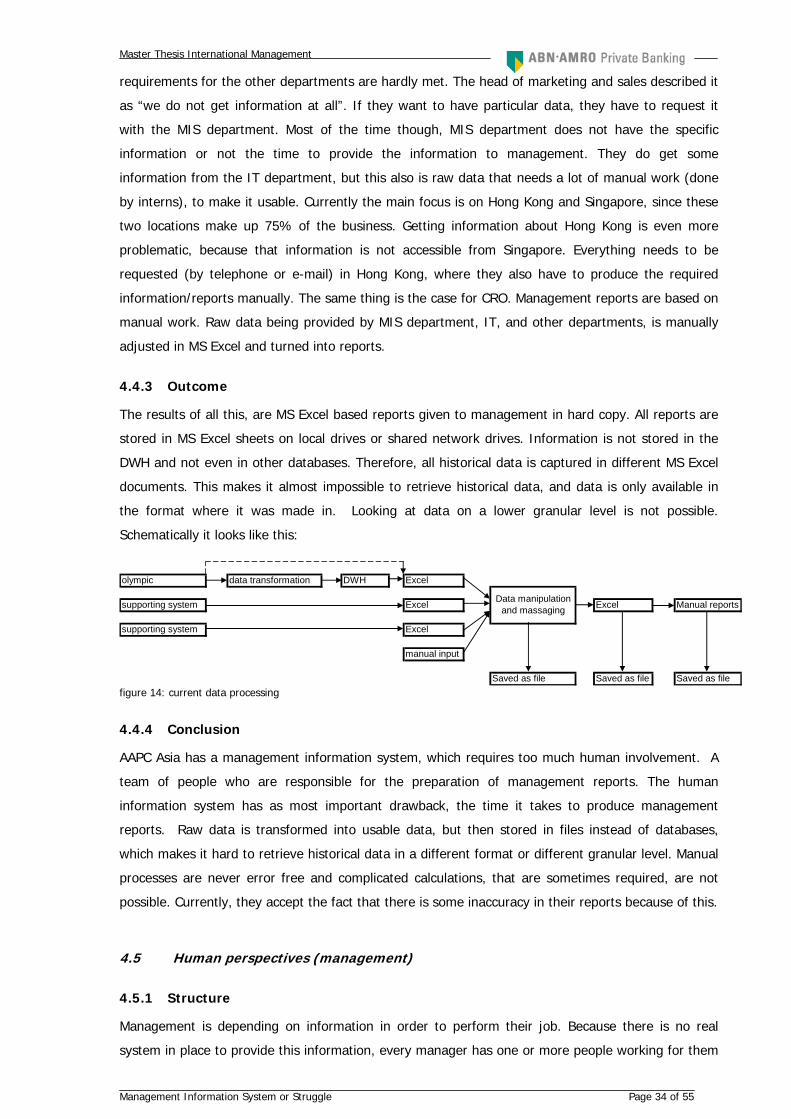
Master Thesis International Management
Management Information System or Struggle Page 34 of 55
requirements for the other departments are hardly met. The head of marketing and sales described it
as “we do not get information at all”. If they want to have particular data, they have to request it
with the MIS department. Most of the time though, MIS department does not have the specific
information or not the time to provide the information to management. They do get some
information from the IT department, but this also is raw data that needs a lot of manual work (done
by interns), to make it usable. Currently the main focus is on Hong Kong and Singapore, since these
two locations make up 75% of the business. Getting information about Hong Kong is even more
problematic, because that information is not accessible from Singapore. Everything needs to be
requested (by telephone or e-mail) in Hong Kong, where they also have to produce the required
information/reports manually. The same thing is the case for CRO. Management reports are based on
manual work. Raw data being provided by MIS department, IT, and other departments, is manually
adjusted in MS Excel and turned into reports.
4.4.3 Outcome
The results of all this, are MS Excel based reports given to management in hard copy. All reports are
stored in MS Excel sheets on local drives or shared network drives. Information is not stored in the
DWH and not even in other databases. Therefore, all historical data is captured in different MS Excel
documents. This makes it almost impossible to retrieve historical data, and data is only available in
the format where it was made in. Looking at data on a lower granular level is not possible.
Schematically it looks like this:
olympic data transformation DWH Excel
supporting system Excel Excel Manual reports
supporting system Excel
manual input
Saved as file Saved as file Saved as file
Data manipulation and massaging
figure 14: current data processing
4.4.4 Conclusion
AAPC Asia has a management information system, which requires too much human involvement. A
team of people who are responsible for the preparation of management reports. The human
information system has as most important drawback, the time it takes to produce management
reports. Raw data is transformed into usable data, but then stored in files instead of databases,
which makes it hard to retrieve historical data in a different format or different granular level. Manual
processes are never error free and complicated calculations, that are sometimes required, are not
possible. Currently, they accept the fact that there is some inaccuracy in their reports because of this.
4.5 Human perspectives (management)
4.5.1 Structure
Management is depending on information in order to perform their job. Because there is no real
system in place to provide this information, every manager has one or more people working for them
Master Thesis International Management
Management Information System or Struggle Page 35 of 55
whose main task is to provide information. This has resulted in a highly unstructured situation. As
described, the core banking system is the source for almost all data management needs. Since every
manager has different job responsibilities, they are interested in different data. It is like a large
puzzle and every manager has one piece of this puzzle. They do not know exactly who has what and
in some cases multiple people want the same piece of the puzzle, because there is also overlap in
data requirements. The current situation can be described as a traditional file environment. Every
department (in each country) develops and maintains its own files. The resulting problems are data
redundancy and inconsistency, program-data dependence inflexibility, poor data security, and an
inability to share data among applications. (Laudon and Laudon, 2006). Data redundancy is the
presence of duplicate data in multiple data files so that the same data are stored in more than one
place or location, which obviously is the case within AAPC Asia. This has resulted in data
inconsistency, because different departments independently manipulate the data. One department
can update or adjust certain data, while another department does not do this, or for instance use a
different currency rate. Moreover, in the different countries, products are categorized differently;
clients are numbered differently and so on, which makes it more complicated to get consolidated
overviews. The file system cannot deliver ad hoc reports or respond to unanticipated information
requirements in a timely fashion. The information is somewhere in the systems but is very time-
consuming and therefore expensive to retrieve.
4.5.2 Process
Because of the fact that AAPC Asia works in the described way already for many years, the whole
organization has adapted itself to this way of working. There is a certain routine in the processes of
providing management information that everyone seems to understand and in the end, accept. Based
on discussions with management, and from my own experience, an interesting point came up. The
employee turnover within AAPC is quite high, so often new employees and managers are hired. All
new employees (managerial and operational) are the first couple of weeks to months, extremely
surprised by the current way of working. The CFO said, “when I was in consumer banking, I had a p
& l every single day, and here it is not even possible to get it within two weeks after month end”. I
personally had the same feeling of unbelief, but in the end, u get used to in and adjust to the
situation. You learn to live and work with it. The daily operations are not really affected by the
current situation. RMs do their work, sell products, visit clients etc. Nevertheless, the effects on a
strategic level and on planning, controlling, and decision-making are huge. When there is a certain
drop in sales for a product, a large increase in costs, or other exceptions in results, management will
notice this after month end. Measures can be taken to adjust the situations, but management will not
find out whether the situation has improved after the next monthly report or the one after that.
Therefore, it can take up to a month between an abnormality and when it becomes visible, a certain
time to solve the problem not able to see the results before another month’s end.
4.5.3 Outcome
The outcome for the organization is that management has a hard time controlling results and making
adequate decisions to improve the results of the organization. As described in the previous chapter
the decision making process starts with “intelligence”. Discovering, identifying, and understanding the
Master Thesis International Management
Management Information System or Struggle Page 36 of 55
problems occurring in the organization. This first step is currently the main problem. The lack of
(timely) adequate and accurate management information in almost every department within AAPC
Asia, because of the file environment. There is no real insight in historical data, except for the data
that was reported during a previous period. Ad hoc reporting about historical data is extremely time-
consuming if not impossible.
4.5.4 Conclusion
With data spread all over the organization in different formats and without pre-defined standards it is
hard to get insights in the business. Delayed management information, leads to problems being
recognized too late which leads to decision making being delayed. Currently it is like driving a car
with one blind eye. You can see everything, but much narrower and without in-depth sight.
4.6 Conclusion
The answer to the second research question. How is the current MIS structured, how does it process
data and what is the outcome?
Structure
- Core banking system (Olympic) and some supporting banking systems (TPS) produce raw data
- Data warehouse implemented but hardly used, no other database in use
- No BI-tools or reporting tools implemented
- MIS team, responsible for management reporting: manual information system
- Data is not instantly available
Process
- (IT) people have to run queries to extract raw data from the TPS
- MIS Team manually transforms this raw data into management reports
- Because of the times these processes require, MIS team has hardly time to support all
management. Most departments therefore have their own people for management reporting.
- All data manipulation is done in MS Excel
- Individual files are stored on (network) drives
- All departments have there own files, often with duplicate data (data redundancy) which leads to
data inconsistency
Outcome
- Tens of thousands different MS Excel files stored on hard drives
- Management not getting timely reports which negatively influences decision-making
- Data quality not optimal:
o Accuracy: complex calculations are sometimes required to allocate revenues to individual
clients an RMs. This is too complex to do manually and therefore done in a simplified way
which is not always accurate.
o Integrity and Consistency: the structure of data and relationships is not consistent across
departments and locations.
Master Thesis International Management
Management Information System or Struggle Page 37 of 55
o Completeness: almost all required data is available but very time-consuming to retrieve
o Timeliness: Data is not instantly available, and not available when needed
o Accessibility: Data is not directly accessible by management, since it is stored as
individual files and not stored in a database. Everything has to be requested from
employees and they have to provide it to management.
Master Thesis International Management
Management Information System or Struggle Page 38 of 55
5. Gap analysis and improvements
5.1 Introduction
Based on the management requirements and the analysis of the current situation the gap between
these two can be determined. A comparison between the required information and the available
information has been made. The results are presented in heat maps, where different colors represent
the gap. The gap is explained by the structure, process and outcome of the MIS, and solutions to
diminish the gap are suggested.
5.2 Heat map
Based on the data requirements two heat maps have been made to indicate where the problems are
and where the requirements are met. Green indicates that the indicator is available as requested, red
means that there is a serious problem. Orange indicates that the current situation is not optimal.
When the data requirement is green, but one of the other indicators is red or orange, it means that
the data is currently available, but not in the correct timeframe or dimension. When it takes two
weeks to have certain data available while it is needed directly after the end of period, the indicator
“availability” will be red. When looking at this heat map, one thing is clear. None of the requirements
is met in the required time frame. Most data is available, somewhere and somehow, but only
accessible with a lot of effort. (Figure 15)
The reasons for not meeting the data requirements can be analyzed by looking at the management
information system. This is a heat map based on the desired situation. As can be seen, every cell is
red. This is because of the fact that the desired situation is a DBMS with reporting- and BI tools. This
is a big difference with the current file environment where people are the MIS. The structure, process
and outcome in the desired situation are completely different from the current situation. (Figure 16)
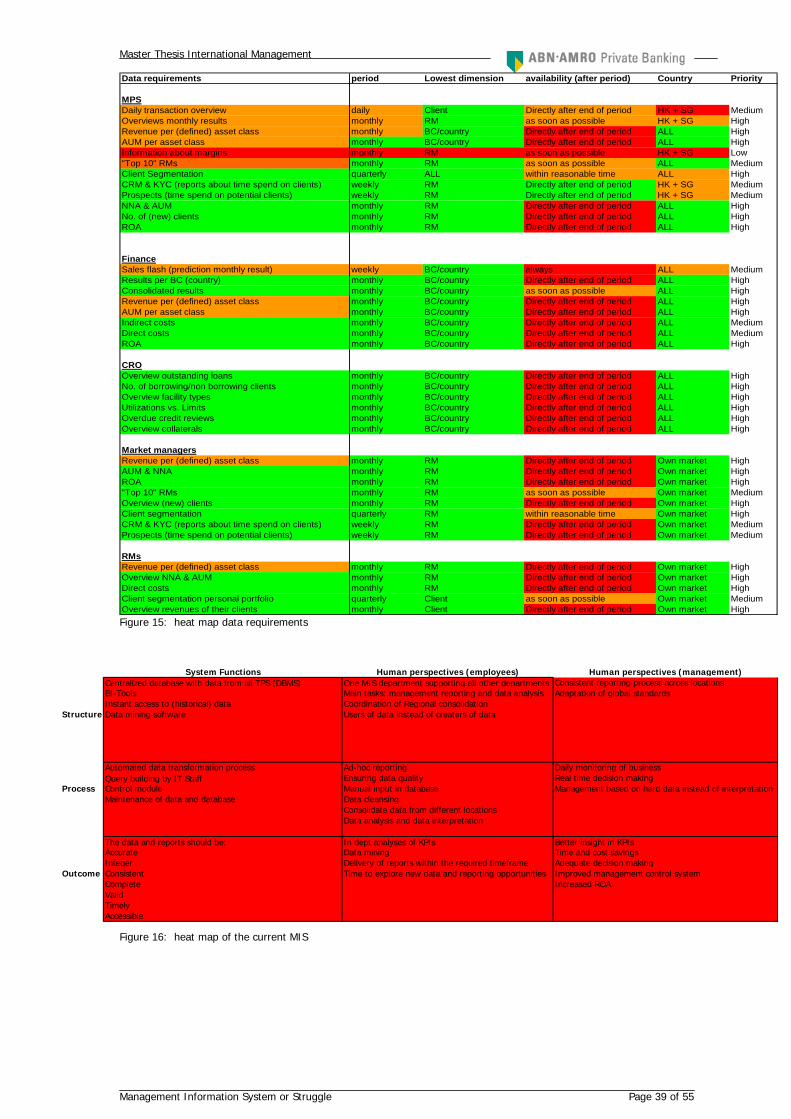
Master Thesis International Management
Management Information System or Struggle Page 39 of 55
Data requirements period Lowest dimension availability (after period) Country Priority
MPSDaily transaction overview daily Client Directly after end of period HK + SG MediumOverviews monthly results monthly RM as soon as possible HK + SG HighRevenue per (defined) asset class monthly BC/country Directly after end of period ALL HighAUM per asset class monthly BC/country Directly after end of period ALL HighInformation about margins monthly RM as soon as possible HK + SG Low"Top 10" RMs monthly RM as soon as possible ALL MediumClient Segmentation quarterly ALL within reasonable time ALL HighCRM & KYC (reports about time spend on clients) weekly RM Directly after end of period HK + SG MediumProspects (time spend on potential clients) weekly RM Directly after end of period HK + SG MediumNNA & AUM monthly RM Directly after end of period ALL HighNo. of (new) clients monthly RM Directly after end of period ALL HighROA monthly RM Directly after end of period ALL High
FinanceSales flash (prediction monthly result) weekly BC/country always ALL MediumResults per BC (country) monthly BC/country Directly after end of period ALL HighConsolidated results monthly BC/country as soon as possible ALL HighRevenue per (defined) asset class monthly BC/country Directly after end of period ALL HighAUM per asset class monthly BC/country Directly after end of period ALL HighIndirect costs monthly BC/country Directly after end of period ALL MediumDirect costs monthly BC/country Directly after end of period ALL MediumROA monthly BC/country Directly after end of period ALL High
CROOverview outstanding loans monthly BC/country Directly after end of period ALL HighNo. of borrowing/non borrowing clients monthly BC/country Directly after end of period ALL HighOverview facility types monthly BC/country Directly after end of period ALL HighUtilizations vs. Limits monthly BC/country Directly after end of period ALL HighOverdue credit reviews monthly BC/country Directly after end of period ALL HighOverview collaterals monthly BC/country Directly after end of period ALL High
Market managersRevenue per (defined) asset class monthly RM Directly after end of period Own market HighAUM & NNA monthly RM Directly after end of period Own market HighROA monthly RM Directly after end of period Own market High"Top 10" RMs monthly RM as soon as possible Own market MediumOverview (new) clients monthly RM Directly after end of period Own market HighClient segmentation quarterly RM within reasonable time Own market HighCRM & KYC (reports about time spend on clients) weekly RM Directly after end of period Own market MediumProspects (time spend on potential clients) weekly RM Directly after end of period Own market Medium
RMsRevenue per (defined) asset class monthly RM Directly after end of period Own market HighOverview NNA & AUM monthly RM Directly after end of period Own market HighDirect costs monthly RM Directly after end of period Own market HighClient segmentation personal portfolio quarterly Client as soon as possible Own market MediumOverview revenues of their clients monthly Client Directly after end of period Own market HighFigure 15: heat map data requirements
System Functions Human perspectives (employees) Human perspectives (management)Centralized database with data from all TPS (DBMS) One MIS department supporting all other departments Consistent reporting process across locationsBI-Tools Main tasks: management reporting and data analysis Adaptation of global standardsInstant access to (historical) data Coordination of Regional consolidation
Structure Data mining software Users of data instead of creaters of data
Automated data transformation process Ad-hoc reporting Daily monitoring of businessQuery building by IT Staff Ensuring data quality Real time decision making
Process Control module Manual input in database Management based on hard data instead of interpretationMaintenance of data and database Data cleansing
Consolidate data from different locationsData analysis and data interpretation
The data and reports should be: In dept analyses of KPIs Better insight in KPIsAccurate Data mining Time and cost savingsInteger Delivery of reports within the required timeframe Adequate decision making
Outcome Consistent Time to explore new data and reporting opportunities Improved management control systemComplete Increased ROAValid Timely Accessible
Figure 16: heat map of the current MIS
Master Thesis International Management
Management Information System or Struggle Page 40 of 55
5.3 System Functions
5.3.1 Structure
The gap between the current use of systems and the required use of systems is large. It can be said
that no requirements are being met, because there is no computerized information system in use. As
can be seen in the first heat map, the main problem is the time it takes to get the required data,
which is much longer than required. Most data is available in one way or another, but it takes a lot of
time and effort to obtain it. This is obviously because of the large share of human participation in the
process of management reporting. With a system technical solution, many of these problems can be
solved. A business intelligence or reporting tool should be used. Such a tool is useful when linked to
an application or database that contains all relevant data. A common saying in the computer science
is “garbage in, garbage out”. You can have a great reporting tool that creates reports containing
incorrect or incomplete information. Therefore, it is important to start at the basis. The management
information system obtains its information from the organizational TPS. In this case, the core banking
system and the supporting systems described before. A solution need to be find to handle the data
output of the TPS and to make sure the required data is available for management decision making
when needed. The current file environment therefore needs to shift towards a database management
system (DBMS). Database technology can cut through many of the problems that the current file
system has. A database centralizes the data and controls redundant data. Rather than storing data in
separate files for each application, data are stored as to appear to users as being stored in only one
location (Laudon and Laudon, 2006). When making use of a database instead of files for data
storage, it will be much easier to get access to historical data, and ad hoc reporting can be done
much faster. Since a data warehouse is already implemented, the most logical solution for the
current drawbacks is to start using it. Research shows (Watson and Haley, 1997) that the main
reasons for implementing a DWH are:
- Having better access to information
- Better and more accurate information
- Single source of data
That the Data warehouse is not being used is rather strange, because it could solve most of the
problems AAPC Asia currently has. In other locations, AAPC makes extensive and successful use of
the DWH, and BI-tools. The DWH has been implemented some years ago and currently only one
employee that was involved in this process, still works in the head office of AAPC Asia. Current
(senior) management all has come in after the DWH had been implemented. It looks like AAPC Asia
has gotten a bit on a site track in the further development of the DWH, and is not aware of the
possibilities the DWH has. There is a project, directed from AAPC global, going on, for the
implementation of “MIS cockpit reporting”, which is an advanced web-based reporting tool linked to a
cube of the data warehouse. It meets most requirements of the finance department. These cockpit
reports would enable management to get an instant insight in the financial performance on all
required levels. From markets and RMs to individual clients. (see appendix for example reports).
Moreover, it can replace the time consuming manual process of producing the RM performance
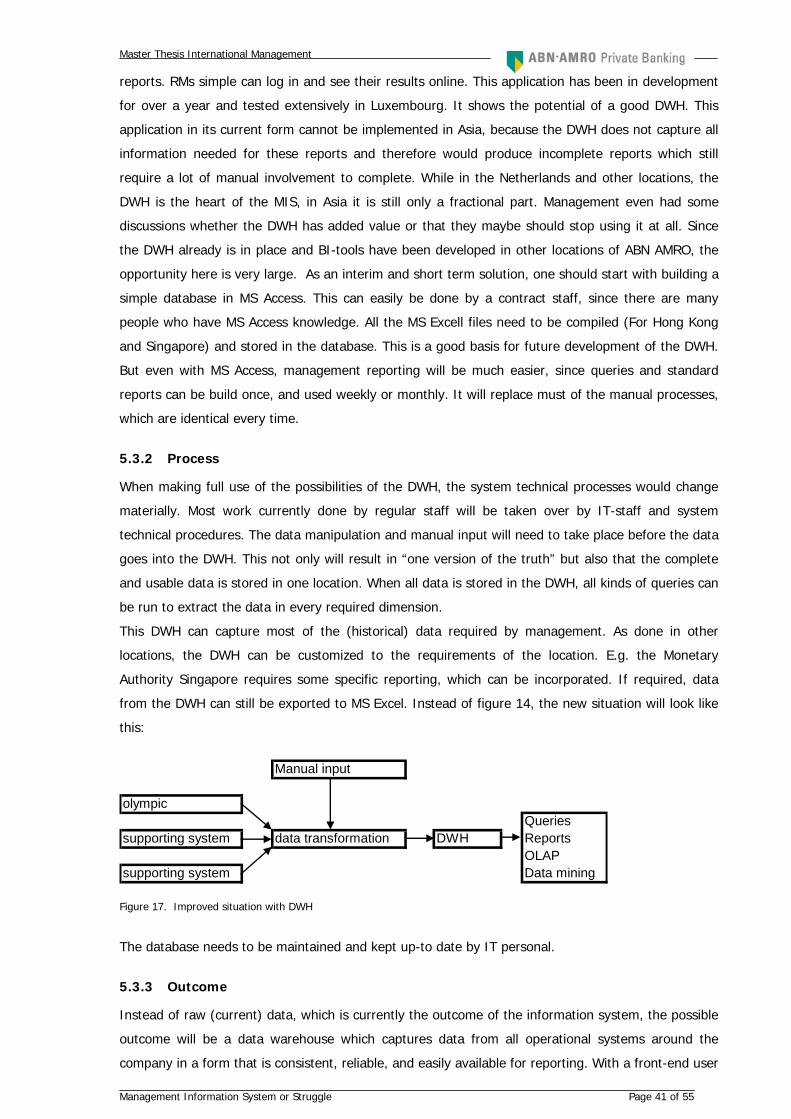
Master Thesis International Management
Management Information System or Struggle Page 41 of 55
reports. RMs simple can log in and see their results online. This application has been in development
for over a year and tested extensively in Luxembourg. It shows the potential of a good DWH. This
application in its current form cannot be implemented in Asia, because the DWH does not capture all
information needed for these reports and therefore would produce incomplete reports which still
require a lot of manual involvement to complete. While in the Netherlands and other locations, the
DWH is the heart of the MIS, in Asia it is still only a fractional part. Management even had some
discussions whether the DWH has added value or that they maybe should stop using it at all. Since
the DWH already is in place and BI-tools have been developed in other locations of ABN AMRO, the
opportunity here is very large. As an interim and short term solution, one should start with building a
simple database in MS Access. This can easily be done by a contract staff, since there are many
people who have MS Access knowledge. All the MS Excell files need to be compiled (For Hong Kong
and Singapore) and stored in the database. This is a good basis for future development of the DWH.
But even with MS Access, management reporting will be much easier, since queries and standard
reports can be build once, and used weekly or monthly. It will replace must of the manual processes,
which are identical every time.
5.3.2 Process
When making full use of the possibilities of the DWH, the system technical processes would change
materially. Most work currently done by regular staff will be taken over by IT-staff and system
technical procedures. The data manipulation and manual input will need to take place before the data
goes into the DWH. This not only will result in “one version of the truth” but also that the complete
and usable data is stored in one location. When all data is stored in the DWH, all kinds of queries can
be run to extract the data in every required dimension.
This DWH can capture most of the (historical) data required by management. As done in other
locations, the DWH can be customized to the requirements of the location. E.g. the Monetary
Authority Singapore requires some specific reporting, which can be incorporated. If required, data
from the DWH can still be exported to MS Excel. Instead of figure 14, the new situation will look like
this:
Manual input
olympicQueries
supporting system data transformation DWH ReportsOLAP
supporting system Data mining
Figure 17. Improved situation with DWH
The database needs to be maintained and kept up-to date by IT personal.
5.3.3 Outcome
Instead of raw (current) data, which is currently the outcome of the information system, the possible
outcome will be a data warehouse which captures data from all operational systems around the
company in a form that is consistent, reliable, and easily available for reporting. With a front-end user
Master Thesis International Management
Management Information System or Struggle Page 42 of 55
interface, the data are available for anyone to access, but they cannot alter it. Most of the problems
with data quality are a result of the human work involved. Using the DWH (potentially) makes data
instantly accessible, eliminates data redundancy and inconsistency and data will be more accurate,
because computers can perform complex calculations.
5.3.4 Conclusions
Using the DWH will solve many of the existing problems and drawbacks. As proven by the successful
use of the DWH in other locations of AAPC, the DWH does have many benefits. Since the blueprint of
the DWH is the same in different locations, same results could be achieved.
5.4 Human perspectives (employees)
5.4.1 Structure
IT personal currently spent inordinate amounts of time getting information, creating extract files or
running ad hoc queries. Users also spent considerable effort accessing needed data and processing it
meaningful. With a DWH in place the tasks of the MIS team, would change drastically. A complete
job-redesign will be required because most of their current tasks will not be required anymore. A lot
of time will therefore be saved. This time can be spent to function as MIS team for all departments,
which in theory should already be the case. This will take the burden of producing own management
reports, of other departments. Manual involvement in the information processing will still be required
but in a different way. People become users of information systems, instead of creators of
information and being the system.
5.4.2 Process
The current information processing by employees will be taken over by the system technical solution.
Employees will need to spend more time on analyzing data, than on producing it. Currently a lot of
time is absorbed by retrieving data from all the various system. With a perfectly designed data
warehouse, all this data is in one place. To retrieve it, people have to run queries or use specialized
software. Of course, not all requirements can be incorporated in systems, so there are still reports
that have to be made on an ad-hoc basis. People have to make sure that all relevant data is inputted
into the DWH. Since not all data comes directly from the systems, manual input is still required.
5.4.3 Outcome
Using the DWH with BI-tools will automatically result in the output not being MS Excel based reports
that can be used once, but data centrally stored and available at all times. In-depth analysis of
information can be performed to provide new insights in results and detect problems earlier.
5.4.4 Conclusions
The role of employees in the management information system will change a lot. There will be time
left to broaden the scope of their work. Using system to retrieve data and analyze the data to come
to new insights, highlight opportunities and exceptions will be possible. Some contract staff, who
currently are needed to manually key in many numbers can be replaced by higher skilled people. The
current work will get a new dimension, and since so many opportunities in insight will become
Master Thesis International Management
Management Information System or Struggle Page 43 of 55
available, at least half a year after implementation needs to be spend to fully utilize these
opportunities. MIS will be lifted to a higher level.
5.5 Human perspectives (management)
5.5.1 Structure
Theoretically, it will be possible to have one DWH in the head office in Singapore that not only
extracts the information from the systems in Singapore, but also from the other locations. This will
increase the scope and costs of the project but would be an ideal situation. Data would be managed
from Singapore and the locations would be end-users. Management will need to decide whether to
choose for this solution, or rather implement a smaller DWH or data mart in each location.
The change to a database environment will also require organizational change. Currently, each
department has its own files and data to fulfill their specific needs. With a database, files and
programs must be built that take into account the whole organization’s interest in data.
5.5.2 Process
Database systems require a data administration function, with the power to define information
requirements for the entire company (Laudon and Laudon, 2006). Data administration is responsible
for the specific policies and procedures through which data can be managed as an organizational
resource. The fundamental principle of data administration is that all data are the property of the
organization as a whole. Data cannot belong exclusively to one department, which is currently the
case. All data should be available to everyone who needs it to reach its goals. Therefore, an
information policy needs to be formulated, which specifies the rules for sharing, disseminating,
acquiring, standardizing, classifying, and inventorying information throughout the organization.
5.5.3 Outcome
With accurate and timely information, management will be able to monitor and control daily
operations much more efficient. With consistent data and one version of the truth better insights in
the business will be available.
5.5.4 Conclusions
Management will get many new insights in the business. When they have a BI-Tool that they can
use, they can determine their own view of the data, and drill down to a level that gives them the
information they need to take adequate decisions. Trends are always an important indicator for the
direction the business is going. Historical data instantly available will give them this opportunity.
5.6 Solutions/implementation
The solutions required to solve the current issues will be described with the use of MoSCoW. This is
to define what is absolutely necessary, what is required and what the ideal situation will be.
Master Thesis International Management
Management Information System or Struggle Page 44 of 55
M – Must have
1. No matter what kind of other systems, BI-tools or other software will be implemented, the
basis needs to be a database. This can be as simple as an MS Access database, or as
complicated as a full data warehouse. All End-data needs to be stored in the database (or
multiple). Historical data will be easy accessible, which allows comparison, trendanalysis and
progress tracking. The best short term solutions is MS Access, because it is relatively easy to
develop.
2. Data needs to be stored in the lowest level available. Most management information is
presented are on a high level(the more senior the manager the higher te level). Most of the
time the end-data is stored in the same high level. For analysis purposes, or exception
reporting, there needs to be a possibility to drill down to the lowest level. Moreover, in a
relational database, the highest level can easily be built up from the lowest level.
3. Hong Kong and Singapore run on the same platform and have a lot of cross-bookings. (RMs
with clients who have bookings in Singapore and Hong Kong). End-data from both locations
needs to be stored together. This is the only way to get a detailed and complete picture of
the total performance of an RM and thus Team, Market and Region.
4. Cross-border linking needs to take place. Clients who have bookings in both Hong Kong and
Singapore need to be linked together in the system, to get a complete picture of the
profitability and value of a client. This is important for instance for client segmentation,
pricing, CRM, and targeting clients for special products or events. This should not be a one
time event, but processes need to be put in place to ensure that every (new) client will be
linked.
5. To prevent data redundancy and inconsistency all data needs to be centrally stored and
maintained by the MIS team. Current management reporting by people from other
departments needs to be taken over. This also prevents duplicate work and thus waste of
time. Moreover, the reliability of the data will increase when an independent team reports
them, rather then people whose performance is measured based on the data, they
themselves provide.
S – Should have
6. To make data instantly accessible for management a BI-tool with front end user interface
needs to be linked to the database. Instead of multiple hardcopy reports for different
dimensions, the manager can select its own view that suits his needs.
7. Besides all the low-level data of Hong Kong and Singapore, the regional office also needs
detailed insights in the data from other locations. Since the core banking system is different
this will require some more effort. This therefore is a next step, after implementation of the
recommendations mentioned before. The data should be stored in the same database.
C – Could have
8. The data warehouse is already in place, but as described before, not being used the way it
should be used. Based on the experience of other locations and the fact that the DWH in
Master Thesis International Management
Management Information System or Struggle Page 45 of 55
Singapore and Hong Kong is the same as in those locations, the DWH needs to be further
developed. All supporting systems need to be linked to the DWH. The whole process of
datacollecting from these systems can than be automated. Complex calculations and
allocations can accurately being performed by the DWH. Manual input into the DWH should
be available, as long as the end-data is fully captured in the DWH. All this is already possible
in multiple other locations. This will not only save a lot of time, but it will also improve the
accuracy.
9. Online availability of multiple real time reports. The reports in the appendix are online
available and developed by the global team. These are linked to the DWH, and it is confirmed
by them that the same can be implemented in Singapore and Hong Kong. This is only usefull
when the DWH captures all end-data, because otherwise the reports will not be complete.
After the upgrade of DWH these cockpit reports and more can be implemented.
W - WON'T have this time but WOULD like in the future.
Basically all of the above mentioned recommendations but then with a central DWH that captures
information from all locations in Asia.
5.7 Conclusion
To answer the third research question: What is the gap between the current and the desired
situation?
The main gap is the timely availability of management information, which is caused by the lack of
automation. There is too much manual involvement required in the process of management
reporting. The different TPS are not linked to the DWH, which therefore loses its function. Instead of
Excel files, data needs to be stored in a central database. A database can be linked to BI-tools, to
make data-analysis easier and to provide management with a tool to access data from their own
desktop.
Master Thesis International Management
Management Information System or Struggle Page 46 of 55
6. Conclusions and recommendations
6.1 Conclusions
This research started with the following research question: What are the problems with the current management information system and how can these
be solved to meet the information requirements?
The question can be broken up in three parts:
- Information requirements
- (Problems with) current management information system
- Solutions.
Management information requirements.
Management information provides insights in various KPIs, which are necessary tools for
management to support planning, controlling and decision-making, which in its turn, supports
reaching the goals.
The management information requirements can best be summarized as the need for timely insights
in various KPIs. The information has to be accurate and complete and needs to be available in
different dimensions in order to capture all aspects of the business. The different senior managers of
the various departments have different KPIs and therefore different end-requirements. The basic
though, is quite similar. Almost everything required evolves around three main KPIs. AUM, Revenue
and NNA. The different managers only look at it from different dimensions. Market dimension,
booking center, RM, Individual products, margin etc.
Current management information system
The current MIS consist of people who manually transform raw data into management reports. The
core banking system (Olympic) and some supporting banking systems produce raw data. Al this data
is collected by the MIS team and manually transferred into MS Excel based static reports that are
distributed to management and to the RMs in hardcopy (paper).
The current situation can be described as a traditional file environment. Every department (in each
country) develops and maintains its own files. The resulting problems are data redundancy and
inconsistency, program-data dependence inflexibility, poor data security, and an inability to share
data among applications. Data is not stored into a database; retrieving historical data is therefore
extremely time consuming and certainly not instantly accessible or available.
The largest problems with the current MIS are the time it takes to produce reports and the fact that
reports are static which limits management in in-depth and historical analysis.
There is a data warehouse in place in the main locations: Hong Kong and Singapore, but instead of
what a DWH should do: collecting raw data from various systems and transforming this in a single
Master Thesis International Management
Management Information System or Struggle Page 47 of 55
format, do complex calculation and store historical end-data, it is only linked to one of the banking
systems, and the end stage of DWH is still pretty raw data that needs extensive manual involved to
be turned into reports.
Solutions
The solution for many of the current problems is actually quite simple and logical. When the DWH is
used the way it was meant to be used, combined with a user-friendly BI tool, end user current and
historical data will be instantly available to management. There is global support for the DWH from
out of The Netherlands, where they have a fully operating DWH, with BI-tools that make data
instantly accessible. Job-redesign will be required, because the tasks of MIS people will change.
This solution sounds simple, but it does require certain investments and considerable time and
support from the global DWH team. A much easier solution, but with already a large impact will be a
simple database management system. The correct use of MS Access databases results at least in
historical data being instantly available. Simple user interfaces can be created, and queries can be
custom built by various users without to much training.
6.2 Reflection
When choosing a subject for a thesis, general advice is to choose something that you find interesting
and have any feeling with. When I heard about the project that ABN AMRO Private Banking Asia had
for me, I had to make a choice. It was not a subject that I knew much about (basically hardly
anything), on the other hand, I knew it was going to be a great experience to go to Singapore and
work for The bank. This resulted in the fact that I started this research from scratch. It therefore took
a long time before I found some models I could use. When I came across the DBM model it was a
good basis for a structural research, but complementary theory was required to do a good analysis of
the current situation. I found this in the model of Cornford et. All. (1994). Integrating these models
gave me a hard time and I struggled with that. I do think these two models are extremely useful for
similar projects. DBM leads in a very structured way to the management requirements, but lacks in
evaluation possibilities for the current MIS. The evaluation framework therefore is a very good
complementation. Together, it covers the whole spectrum of MIS.
The objectives of this project:
- Define the information and information system needs and requirements of the different
(senior)managers
- Make an analysis of the current MIS
- Make a gap analysis of the differences in the current and desired situation
- Make recommendations about how to improve MIS
I think I succeeded very well in defining the requirements for management. It is clear what they
want, where they need it for and how they want to have it.
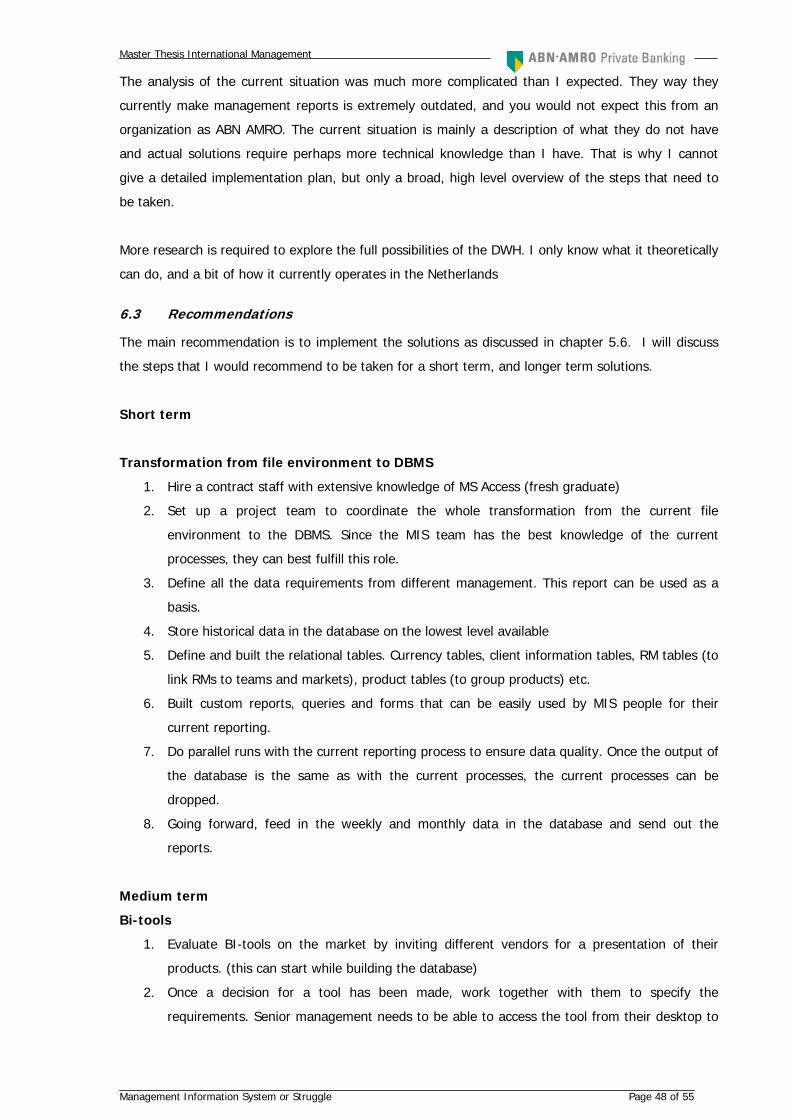
Master Thesis International Management
Management Information System or Struggle Page 48 of 55
The analysis of the current situation was much more complicated than I expected. They way they
currently make management reports is extremely outdated, and you would not expect this from an
organization as ABN AMRO. The current situation is mainly a description of what they do not have
and actual solutions require perhaps more technical knowledge than I have. That is why I cannot
give a detailed implementation plan, but only a broad, high level overview of the steps that need to
be taken.
More research is required to explore the full possibilities of the DWH. I only know what it theoretically
can do, and a bit of how it currently operates in the Netherlands
6.3 Recommendations
The main recommendation is to implement the solutions as discussed in chapter 5.6. I will discuss
the steps that I would recommend to be taken for a short term, and longer term solutions.
Short term
Transformation from file environment to DBMS
1. Hire a contract staff with extensive knowledge of MS Access (fresh graduate)
2. Set up a project team to coordinate the whole transformation from the current file
environment to the DBMS. Since the MIS team has the best knowledge of the current
processes, they can best fulfill this role.
3. Define all the data requirements from different management. This report can be used as a
basis.
4. Store historical data in the database on the lowest level available
5. Define and built the relational tables. Currency tables, client information tables, RM tables (to
link RMs to teams and markets), product tables (to group products) etc.
6. Built custom reports, queries and forms that can be easily used by MIS people for their
current reporting.
7. Do parallel runs with the current reporting process to ensure data quality. Once the output of
the database is the same as with the current processes, the current processes can be
dropped.
8. Going forward, feed in the weekly and monthly data in the database and send out the
reports.
Medium term
Bi-tools
1. Evaluate BI-tools on the market by inviting different vendors for a presentation of their
products. (this can start while building the database)
2. Once a decision for a tool has been made, work together with them to specify the
requirements. Senior management needs to be able to access the tool from their desktop to
Master Thesis International Management
Management Information System or Struggle Page 49 of 55
see their required information and the MIS team needs to be able to work with it on a daily
basis.
3. The BI-tools needs to be linked to the access database. The MIS team will feed the data into
Access. There current processes of data massaging will remain the same, but instead of
storing it in MS Excel, it will be stored in the database, and the reporting will be taken over
by the BI-Tool.
Long term
Fully operational DWH
Once previous interim solutions are implemented the possibilities for the DWH need to be explored.
This is the part that requires some additional exploration, to exactly find out what the capabilities of
the DWH are.
The global DWH team is responsible for the implementation of the DWH and they need to work
together with local IT to make the DWH fully operational. As explained, the basics are there, but it
looked like they stopped halfway the project. All supporting systems need to be linked to the DWH.
The whole process of data collecting from these systems can than be automated. Complex
calculations and allocations can accurately being performed by the DWH. Manual input into the DWH
should be available, as long as the end-data is fully captured in the DWH. All this is already possible
in multiple other locations. This will not only save a lot of time, but it will also improve the accuracy.
Master Thesis International Management
Management Information System or Struggle Page 50 of 55
Reference list
- ABN AMRO ANNUAL REPORT 2005
- Clegg, Dai and Barker Richard, (1994) Case Method Fast-Track. A RAD Approach, Addison
Wesley
- Cornford et all (1994), Experience with a Structure, Process and Outcome Framework for
Evaluating an Information System.
- Fayol, Henry., (1949), General and Industrial Management, Pitman London
- Holloway I., and Wheeler, S. (1995). Ethical issues in qualitative nursing research. Nursing
Ethics, 2(3), 223-232.
- Klecun Ela and Cornford Tony (2005), A critical approach to evaluation, European Journal of
Information Systems 14, 229-243.
- Larsson Nils O. and Malmsjö Anders, (1998), A Model for Design of Human Activity Systems,
Systemic Practice and Action Research, Vol. 11, No 4
- Laudon, Kenneth C. and Laudon Jane P., (2006) Management Information systems,
managing the digital firm, (9th edn) Pearson Prentice Hall
- Lewis, P. J. (1994), Information-Systems Development, Pitman
- Simon, H.A., (1960) The New Science of Management Decision. Harper & Row
- Tayi, G. K. and Balou, D. P., (1998), Examining data quality, Communications of the ACM,
vol. 41, no. 2
- Wang, Richard Y., (1998), A product perspective on total data quality management,
Communications of the ACM, volume 41, no. 2
- Watson, H., and Haley, B. (1997), Data warehousing: a framework and survey of current
practices. J. Data Warehousing 2, vol. 1
- Watson, H., and Haley, B. (1998), Managerial considerations. Communications of the ACM
41, no. 9
Master Thesis International Management
Management Information System or Struggle Page 51 of 55
Appendix
- Overview online reports currently available within ABN AMRO Private Banking Netherlands and various other locations.
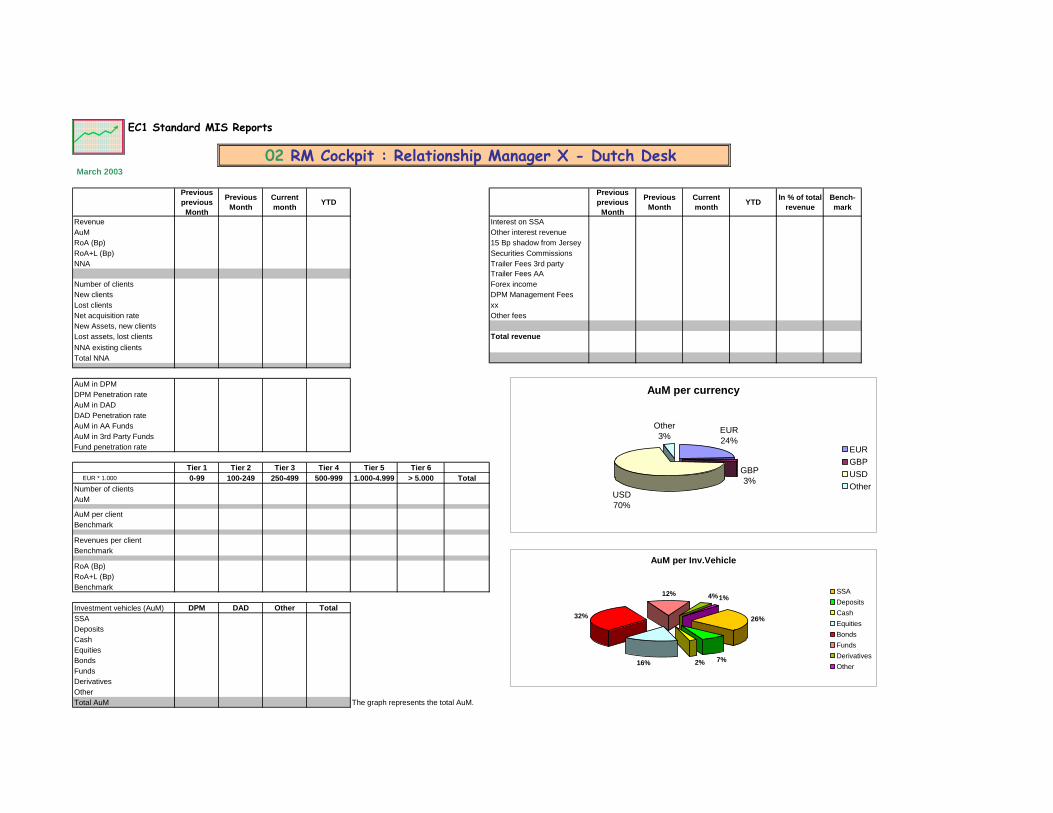
EC1 Standard MIS Reports
02 RM Cockpit : Relationship Manager X - Dutch DeskMarch 2003
Previous previous
Month
Previous Month
Current month YTD
Previous previous
Month
Previous Month
Current month YTD In % of total
revenueBench-mark
Revenue Interest on SSAAuM Other interest revenueRoA (Bp) 15 Bp shadow from JerseyRoA+L (Bp) Securities CommissionsNNA Trailer Fees 3rd party
Trailer Fees AANumber of clients Forex incomeNew clients DPM Management FeesLost clients xxNet acquisition rate Other feesNew Assets, new clientsLost assets, lost clients Total revenueNNA existing clientsTotal NNA
AuM in DPMDPM Penetration rateAuM in DADDAD Penetration rateAuM in AA FundsAuM in 3rd Party FundsFund penetration rate
Tier 1 Tier 2 Tier 3 Tier 4 Tier 5 Tier 6EUR * 1.000 0-99 100-249 250-499 500-999 1.000-4.999 > 5.000 Total
Number of clientsAuM
AuM per clientBenchmark
Revenues per clientBenchmark
RoA (Bp)RoA+L (Bp)Benchmark
Investment vehicles (AuM) DPM DAD Other TotalSSADepositsCashEquitiesBondsFundsDerivativesOtherTotal AuM The graph represents the total AuM.
AuM per Inv.Vehicle
26%
7%2%16%
32%
12% 4%1%SSADepositsCashEquitiesBondsFundsDerivativesOther
AuM per currency
EUR24%
GBP3%
USD70%
Other3%
EURGBPUSDOther
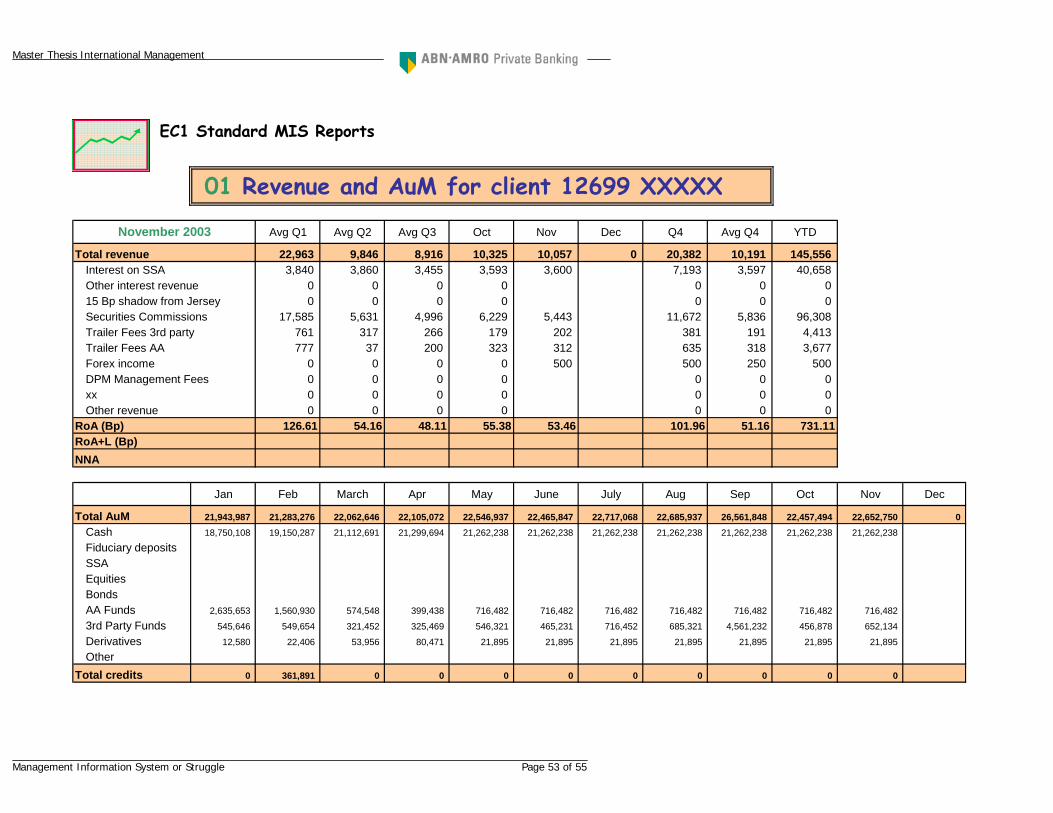
Master Thesis International Management
EC1 Standard MIS Reports
01 Revenue and AuM for client 12699 XXXXX
Avg Q1 Avg Q2 Avg Q3 Oct Nov Dec Q4 Avg Q4 YTD
22,963 9,846 8,916 10,325 10,057 0 20,382 10,191 145,5563,840 3,860 3,455 3,593 3,600 7,193 3,597 40,658
0 0 0 0 0 0 00 0 0 0 0 0 0
17,585 5,631 4,996 6,229 5,443 11,672 5,836 96,308761 317 266 179 202 381 191 4,413777 37 200 323 312 635 318 3,677
0 0 0 0 500 500 250 5000 0 0 0 0 0 00 0 0 0 0 0 00 0 0 0 0 0 0
126.61 54.16 48.11 55.38 53.46 101.96 51.16 731.11RoA+L (Bp)
Jan Feb March Apr May June July Aug Sep Oct Nov Dec
Total AuM 21,943,987 21,283,276 22,062,646 22,105,072 22,546,937 22,465,847 22,717,068 22,685,937 26,561,848 22,457,494 22,652,750 0Cash 18,750,108 19,150,287 21,112,691 21,299,694 21,262,238 21,262,238 21,262,238 21,262,238 21,262,238 21,262,238 21,262,238
Fiduciary depositsSSAEquitiesBondsAA Funds 2,635,653 1,560,930 574,548 399,438 716,482 716,482 716,482 716,482 716,482 716,482 716,482
3rd Party Funds 545,646 549,654 321,452 325,469 546,321 465,231 716,452 685,321 4,561,232 456,878 652,134
Derivatives 12,580 22,406 53,956 80,471 21,895 21,895 21,895 21,895 21,895 21,895 21,895
OtherTotal credits 0 361,891 0 0 0 0 0 0 0 0 0
Total revenue
November 2003
Interest on SSAOther interest revenue15 Bp shadow from JerseySecurities CommissionsTrailer Fees 3rd partyTrailer Fees AA
RoA (Bp)
NNA
Forex incomeDPM Management FeesxxOther revenue
Management Information System or Struggle Page 53 of 55
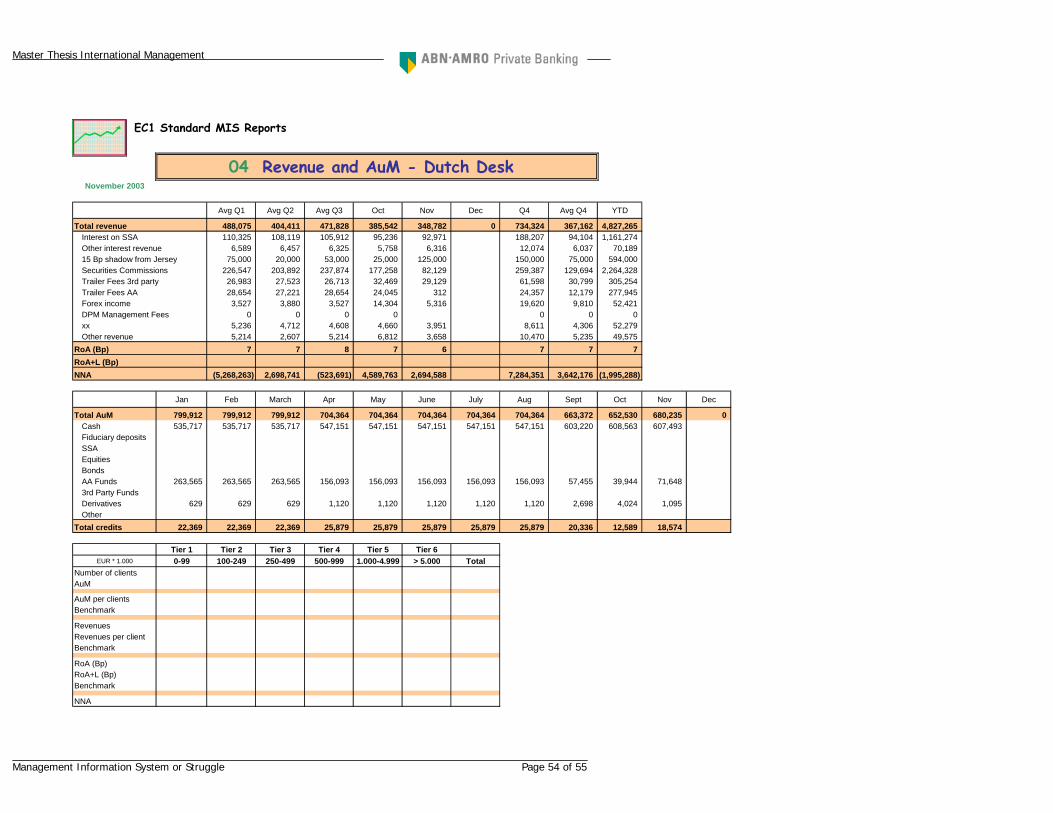
Master Thesis International Management
EC1 Standard MIS Reports
04 Revenue and AuM - Dutch DeskNovember 2003
Avg Q1 Avg Q2 Avg Q3 Oct Nov Dec Q4 Avg Q4 YTD
488,075 404,411 471,828 385,542 348,782 0 734,324 367,162 4,827,265110,325 108,119 105,912 95,236 92,971 188,207 94,104 1,161,274
6,589 6,457 6,325 5,758 6,316 12,074 6,037 70,18975,000 20,000 53,000 25,000 125,000 150,000 75,000 594,000
226,547 203,892 237,874 177,258 82,129 259,387 129,694 2,264,32826,983 27,523 26,713 32,469 29,129 61,598 30,799 305,25428,654 27,221 28,654 24,045 312 24,357 12,179 277,9453,527 3,880 3,527 14,304 5,316 19,620 9,810 52,421
0 0 0 0 0 0 05,236 4,712 4,608 4,660 3,951 8,611 4,306 52,2795,214 2,607 5,214 6,812 3,658 10,470 5,235 49,575
7 7 8 7 6 7 7 7RoA+L (Bp)
(5,268,263) 2,698,741 (523,691) 4,589,763 2,694,588 7,284,351 3,642,176 (1,995,288)
Jan Feb March Apr May June July Aug Sept Oct Nov Dec
Total AuM 799,912 799,912 799,912 704,364 704,364 704,364 704,364 704,364 663,372 652,530 680,235 0Cash 535,717 535,717 535,717 547,151 547,151 547,151 547,151 547,151 603,220 608,563 607,493Fiduciary depositsSSAEquitiesBondsAA Funds 263,565 263,565 263,565 156,093 156,093 156,093 156,093 156,093 57,455 39,944 71,6483rd Party FundsDerivatives 629 629 629 1,120 1,120 1,120 1,120 1,120 2,698 4,024 1,095Other
Total credits 22,369 22,369 22,369 25,879 25,879 25,879 25,879 25,879 20,336 12,589 18,574
Tier 1 Tier 2 Tier 3 Tier 4 Tier 5 Tier 6EUR * 1.000 0-99 100-249 250-499 500-999 1.000-4.999 > 5.000 Total
Number of clientsAuM
AuM per clientsBenchmark
RevenuesRevenues per clientBenchmark
RoA (Bp)RoA+L (Bp)Benchmark
NNA
RoA (Bp)
NNA
DPM Management FeesForex income
xxOther revenue
15 Bp shadow from JerseySecurities CommissionsTrailer Fees 3rd partyTrailer Fees AA
Total revenueInterest on SSAOther interest revenue
Management Information System or Struggle Page 54 of 55
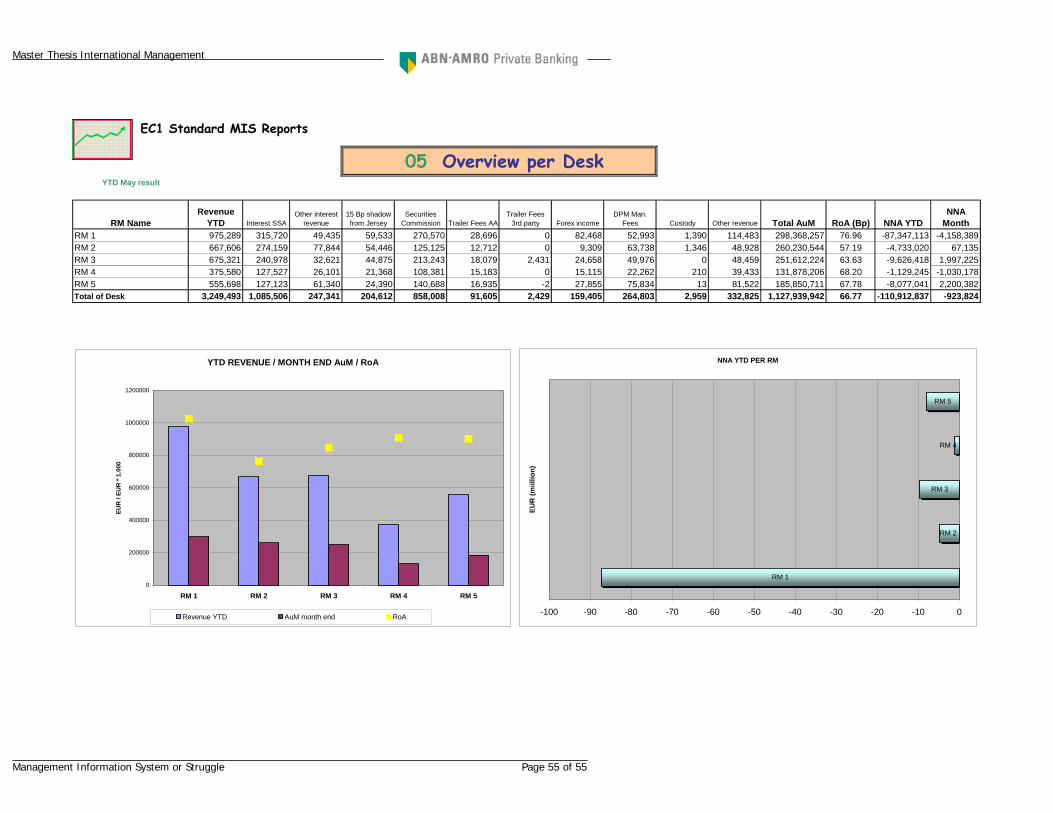
Master Thesis International Management
EC1 Standard MIS Reports
05 Overview per DeskYTD May result
RM NameRevenue
YTD Interest SSAOther interest
revenue15 Bp shadow from Jersey
Securities Commission Trailer Fees AA
Trailer Fees 3rd party Forex income
DPM Man. Fees Custody Other revenue Total AuM RoA (Bp) NNA YTD
NNA Month
RM 1 975,289 315,720 49,435 59,533 270,570 28,696 0 82,468 52,993 1,390 114,483 298,368,257 76.96 -87,347,113 -4,158,389RM 2 667,606 274,159 77,844 54,446 125,125 12,712 0 9,309 63,738 1,346 48,928 260,230,544 57.19 -4,733,020 67,135RM 3 675,321 240,978 32,621 44,875 213,243 18,079 2,431 24,658 49,976 0 48,459 251,612,224 63.63 -9,626,418 1,997,225RM 4 375,580 127,527 26,101 21,368 108,381 15,183 0 15,115 22,262 210 39,433 131,878,206 68.20 -1,129,245 -1,030,178RM 5 555,698 127,123 61,340 24,390 140,688 16,935 -2 27,855 75,834 13 81,522 185,850,711 67.78 -8,077,041 2,200,382Total of Desk 3,249,493 1,085,506 247,341 204,612 858,008 91,605 2,429 159,405 264,803 2,959 332,825 1,127,939,942 66.77 -110,912,837 -923,824
YTD REVENUE / MONTH END AuM / RoA
0
200000
400000
600000
800000
1000000
1200000
RM 1 RM 2 RM 3 RM 4 RM 5
EUR
/ EU
R *
1.00
0
Revenue YTD AuM month end RoA
NNA YTD PER RM
RM 1
RM 2
RM 3
RM 4
RM 5
-100 -90 -80 -70 -60 -50 -40 -30 -20 -10 0
EUR
(miil
lion)
Management Information System or Struggle Page 55 of 55