Embed Size (px)
Citation preview

They fought the law; the law wonFormal bargaining models and
portfolio payoffs in Western Europe
Michael LaverNew York University
Iowa: 3 February 2006

The Law
One of the strongest non-trivial empirical relationships in the social sciences is that the allocation of cabinet portfolios in European coalition cabinets is strongly proportional
That is, the number of cabinet seats assigned to each party is strictly proportional to the share of legislative seats each party contributes to the coalition
The seminal (if flawed) theoretical statement of this is by the sociologist William Gamson. Hence Gamson’s Law.
The seminal (if modestly flawed) empirical test – regularly replicated and very robust – is by the political scientists Eric Browne and Mark Franklin
Gamson, W. A. (1961). "A Theory of Coalition Formation." American Sociological Review 26: 373-382.Browne, E. and M. Franklin (1973). "Aspects of Coalition Payoffs in European Parliamentary Democracies."
American Political Science Review 67: 453-469.

The inter-ocular trauma test
0.2
.4.6
.81
Act
ual p
ort
folio
sh
are
0 .2 .4 .6 .8 1Gamson predicted portfolio share
Source: Author’s reanalysis of dataset used by: Ansolabehere, S., J. M. Snyder, A. B. Strauss, et al. (2005). "Voting weights and formateur advantages in the formation of coalition governments."
American Journal of Political Science 49(3): 550-563.

Who are “they”?
Baron and Ferejohn; Morelli; Ansolabehere, Snyder, Strauss, and Ting
All have well-published models of “bargaining in legislatures” that claim to be able to predict, inter alia, the allocation of portfolio payoffs in coalition cabinets
Indeed the B-F model is perhaps now the canonical legislative bargaining model
None of these models predicts proportional payoffs
The MIT team have tested their model on “field data” on portfolio allocation and consider the model to have passed these tests
Baron, D. and J. Ferejohn (1989). "Bargaining in legislatures." American Political Science Review 83(4): 1182-1202.
Morelli, M. (1999). "Demand competition and policy compromise in legislative bargaining." American Political Science Review 93(4): 809-820.
Ansolabehere, S., J. M. Snyder, A. B. Strauss, et al. (2005). "Voting weights and formateur advantages in the formation of coalition governments." American Journal of Political Science 49(3): 550-563.
Snyder, J. M., M. Ting and S. Ansolabehere (2005). "Legislative bargaining under weighted voting." American Economic Review 95(4): 981-1004.

What do they say? Formateur advantage
It is easiest to summarize and compare arguments thinking of three parties, none with a majority – minimum integer weights (1,1,1) though the MIT model generalizes this to any weighted voting game
The Baron-Ferejohn (BF) innovation is to consider the distinguished position of the legislative proposer of any deal in the case of coalition governments, the formateur
There is a recognition rule/process that selects a proposer
The proposer then offers some other party(ies) with which it can form a winning coalition its/their reservation price, keeping the rest for itself
In the three party case, the formateur offers 1/3 and keeps 2/3
This is the “formateur advantage” very explicitly predicted by the model in this simple case the formateur gets twice as much as the rest

What do they say? Demand bargaining (DB)
The Morelli innovation there is a recognition rule/process that selects a proposer the proposer makes a demand and sets an agenda describing the
order in which other parties are allowed to make demands demands are made in this order until:
there is a winning coalition and demands do not sum to more than the total payoff
If no winning coalition emerges from this the entire process is repeated
The equilibrium in the three-party case is that the proposer and one of the other two parties split the payoff between them More generally, parties receive payoffs proportional to their bargaining
weights – minimal integer weights – i.e. (1,1,1) for all three party cases
There is no formateur advantage

Minimum integer weights
Generalizing beyond the three-party case involves characterizing bargaining weights in a weighted voting game
This is done using minimum integer weights (MIWs) for the set of parties, find the set of smallest integers that generate
the same set of winning coalitions as the “raw” seats shares thus, legislatures (48, 48, 4), (34, 33, 33), and (40, 30, 30) all have
MIWs (1, 1, 1) and legislature (49, 17, 17, 17) has MIWs (2,1,1,1) … etc.
MIWs are VERY hard to calculate in complex cases and Aaron Strauss got an MSc in Computer Science (in part) for writing a MIW calculator – cited in the MIT papers.
They capture the core intuition that different sets of raw weights may generate the same bargaining structure In this sense they produce a typology of bargaining structures

What do they say? MIWs and payoffs
The MIT innovation is to extend the Baron-Ferejohn (BF) model to a more general weighted voting game
Essentially makes the same assumptions as BF and derives an argument that reservation prices are proportional to MIWs
Again, the formateur offers other parties forming a winning coalition their reservation price and keeps the rest
Again, therefore, a formateur advantage
This model is then tested on “field” data from portfolio allocation in western Europe
PostShare = .07 + .15 Formateur + 1.12 MIWshare (r2 = 0.72)
This is replicated precisely from the MIT dataset submitted to AER
There is a statistically significant formateur effect and a statistically significant and more or less proportional MIW effect

Let’s plot the data – oops it’s broken!
0.2
.4.6
.8A
ctua
l po
rtfo
lio s
har
e
0 .2 .4 .6 .8 1BF-predicted portfolio share

Issues: casual inference
What is going on in the previous plot is that payoffs to formateur parties are systematically over-predicted and payoffs to non-formateur parties systematically under-predicted
Note that formateur parties tend to be large
And note that the model predicts that, controlling for size, there will be a formateur bonus and, controlling for size, MIWs will fix reservation prices
So shouldn’t we we control for size in the empirical analysis?PostShare = .07 + .15 Formateur + 1.12 MIWshare (r2 = 0.72)
PostShare = .08 + .07 Formateur + 0.27 MIWshare + 0.94 SeatShare (r2 = 0.81)
All effects remain significant, but much of the formateur effect arises because formateurs are large, and much of the MIW effect arises because MIWs are related to seat share
For the record, the Gamson’s Law regression on this same dataset is:PostShare = .07 + 0.81 SeatShare_gov (r2 = 0.90)

Issues: case selection
We’ll not get into which countries are chosen for analysis, but:
All governments are analyzed, not just the minimal winning coalitions (MWCs) that are predicted by the models
A case is a “party-in-government” All parties-in-government are included, despite fact that their
payoffs sum to a constant Post shares for parties out of government are coded as missing
data, not zero – hence they are dropped from all statistical analysis
All of this creates significant issues for both data analysis techniques and the interpretation of results
Case selection: all cases or MWCs only?
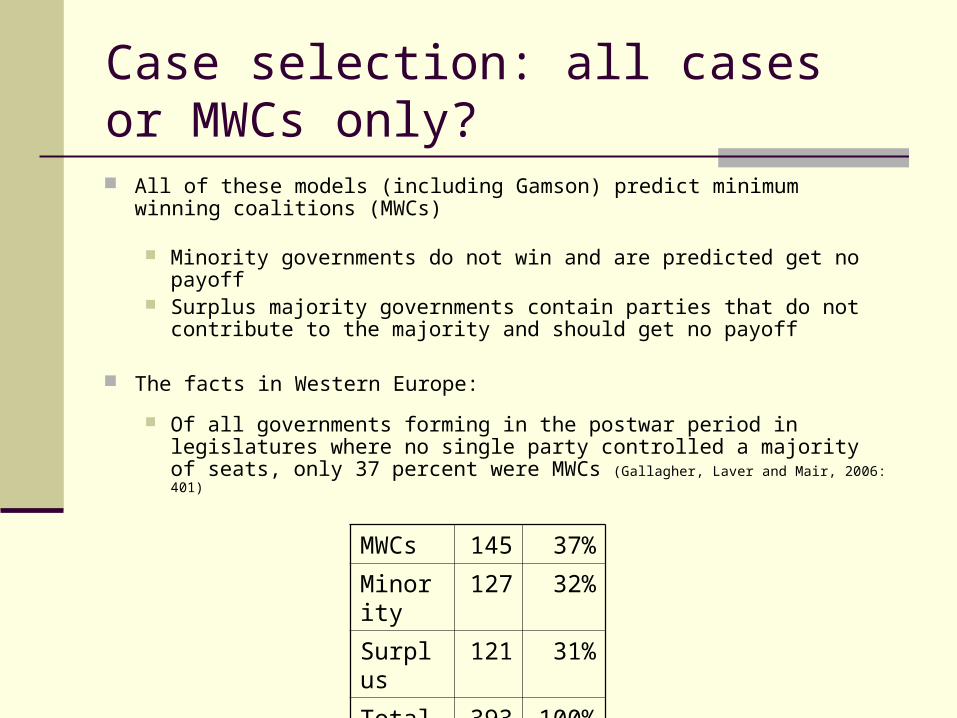
All of these models (including Gamson) predict minimum winning coalitions (MWCs)
Minority governments do not win and are predicted get no payoff Surplus majority governments contain parties that do not contribute
to the majority and should get no payoff
The facts in Western Europe:
Of all governments forming in the postwar period in legislatures where no single party controlled a majority of seats, only 37 percent were MWCs (Gallagher, Laver and Mair, 2006: 401)
MWCs 145 37%
Minority 127 32%
Surplus 121 31%
Total 393 100%

Including cases where models make no valid prediction
Perish the thought we might conclude that, since the models predict MWCs, and since MWCs form only 37% of the time, that the models are in trouble.
But what the MIT analysis does is not only to ignore this, but to analyze all cases, including minority and surplus majority governments, despite the fact that the model makes no prediction at all in these cases
It seems very odd to reward or punish a model for its predictions on cases for which it makes no valid prediction, so …..
Published regressionPostShare = .07 + .15 Formateur + 1.12 MIWshare (r2 = 0.72)
All cases controlling for seat sharePostShare = .08 + .07 Formateur + 0.27 MIWshare + 0.94 SeatShare (r2 = 0.81)
MWCs onlyPostShare = .10 + .05 Formateur + 0.19 MIWshare + 0.98 SeatShare (r2 = 0.80)

Case selection bias
Treating a case as a party-in-government biases the analysis in favor of governments with more parties (which generate more cases) and countries with more unstable governments (which generate more sets of cases) – no fixed effects appear to have been estimated
Including all government members means that all portfolio shares always sum to 1.0 across all government members, violating OLS regression assumptions
See: Fréchette, G., J. H. Kagel and M. Morelli (2005). "Comparing Gamson's law with demand bargaining as a model of legislative bargaining." Games and Economic Behavior 51: 365-390.
The cleanest solution (also adopted by Fréchette et al above) is to look at the really clear cases – “top three” legislatures in which any two of the three largest parties can form a majority This gives very different predictions for the three models: Gamson=> proportional; BF=> (.667, .333); DB => (.5, .5)

BF: MWCs in “top three” legislatures only
.2.4
.6.8
1A
ctua
l po
rtfo
lio s
har
e
.3 .4 .5 .6 .7BF predicted portfolio share

DB: MWCs in “top three” legislatures only
.2.4
.6.8
1A
ctua
l po
rtfo
lio s
har
e
-.5 1.5DB predicted portfolio share

Gamson: MWCs in “top three” legislatures only
.2.4
.6.8
1A
ctua
l po
rtfo
lio s
har
e
.2 .4 .6 .8 1Share of cabinet's legislative seats

So is there a formateur effect?
“On average, the formateur in these [(1,1,1)] cases received 65 percent and the partner received 35 percent of the cabinet posts. The prediction of the Baron-Ferejohn model is 66.7 percent for the formateur and 33.3 percent for the partner. Thus, the formateur took almost exactly the predicted share. The strong formateur effect indicates that the Baron-Ferejohn model of legislative bargaining captures an essential feature of coalition formation.” (Snyder et al 2005: 992)
Or is this just because formateurs tend strongly to be larger and payoffs are strongly proportional to size? It is indeed! There is NO formateur effect, controlling for size.
MIT format Formateurs Non formateurs
SeatShare_Gov 0.823 0.823 0.823
(0.037) (0.047) (0.047)
0.000 0.000 0.000
Formateur 0.026
(0.017)
0.138
Constant 0.076 0.102 0.076
(0.019) (0.030) (0.019)
0.000 0.001 0.000
R2 0.921 0.785 0.785
N 120 60 60
Formateur status and portfolio allocation;
legislatures for which
MIW = (1,1,1,0,0,0 …)

More problems: non-replicable data
The key independent variable in this canonical bargaining model is formateur status.
In the two main datasets on this, footnotes cite Keesing’s Contemporary Archives as the source of this information
Anyone who has used Keesings will know that it does not tell you “and the formateur was…”
These data must be coded by researchers from discursive reports on government formation
To replicate these data we need the precise coding instructions
Approached both the MIT researchers and Paul Warwick (original source) – no written coding instructions are available; they are lost
Also Diermeier and Merlo – same story; lost coding instructions
So the key empirical support for the canonical model relies on replicable results from a published dataset that is not itself replicable

It gets worse: endogenously coded formateurs
However, I have a feeling we can replicate the formateur coding … … though the consequences of this are alarming
Take a look at the table below, from the MIT dataset
It looks very much as if formateur was coded as the eventual PM A conjecture confirmed by the original source, Paul Warwick
Thus the key “independent” variable in this analysis is actually an outcome of, not an input to, the process being modeled … … and indeed appears as part of both sides of the equation
So we don’t really have any test of the formateur model since we have no independent (much less replicable) measure of formateur status
PM Not PM
Formateur 342 1
Not formateur 0 2,234

So what do we do about THIS?
0.2
.4.6
.81
Act
ual p
ort
folio
sh
are
0 .2 .4 .6 .8 1Gamson predicted portfolio share

The way forward
Gamson’s Law is based on a weak theory but a very strong non-trivial empirical regularity – but NO payoff model predicts govt membership
While it goes against the grain for the pure theorist, it does seem that the most productive way forward is to seek a theoretically satisfying explanation for the payoff allocations we actually observe
Carroll and Cox have a model leveraged on pre-electoral coalitions – essentially, when party leaders form a pre-electoral coalition without knowing their post-electoral bargaining power, they agree in advance to accept a proportional payoff
Though “pre-electoral coalitions” can also be hard to code rigorously and non co-operative game theorists hate it because of enforcement problems
My main instinct is to look inside political parties – larger parties have more people who need to be paid off if they are to be able to maintain discipline – so leaders may be constrained by the intra-party bargaining game to get proportional payoffs
Just a thought – needs work!!