Embed Size (px)
Citation preview

1
Thesis Title:
Midpregnancy Prediction of Preeclampsia
Dr Carin Letitia Black MBBS, FRANZCOG
ORCID ID: orcid.org/0000-0002-1541-106X
A thesis submitted in total fulfilment of the requirements
for the degree of Master of Philosophy (MPhil)
August 2018
Department of Maternal-Fetal Medicine
Royal Women’s Hospital
Department of Obstetrics and Gynaecology
University of Melbourne

2
3
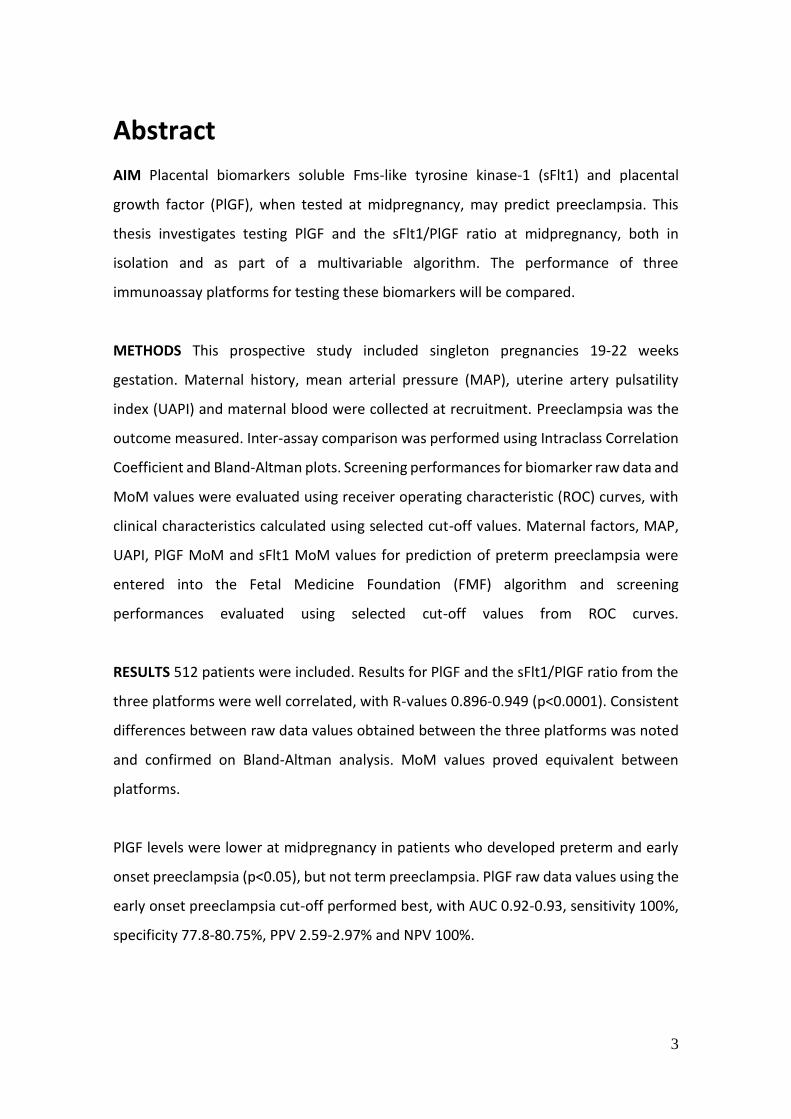
Abstract
AIM Placental biomarkers soluble Fms-like tyrosine kinase-1 (sFlt1) and placental
growth factor (PlGF), when tested at midpregnancy, may predict preeclampsia. This
thesis investigates testing PlGF and the sFlt1/PlGF ratio at midpregnancy, both in
isolation and as part of a multivariable algorithm. The performance of three
immunoassay platforms for testing these biomarkers will be compared.
METHODS This prospective study included singleton pregnancies 19-22 weeks
gestation. Maternal history, mean arterial pressure (MAP), uterine artery pulsatility
index (UAPI) and maternal blood were collected at recruitment. Preeclampsia was the
outcome measured. Inter-assay comparison was performed using Intraclass Correlation
Coefficient and Bland-Altman plots. Screening performances for biomarker raw data and
MoM values were evaluated using receiver operating characteristic (ROC) curves, with
clinical characteristics calculated using selected cut-off values. Maternal factors, MAP,
UAPI, PlGF MoM and sFlt1 MoM values for prediction of preterm preeclampsia were
entered into the Fetal Medicine Foundation (FMF) algorithm and screening
performances evaluated using selected cut-off values from ROC curves.
RESULTS 512 patients were included. Results for PlGF and the sFlt1/PlGF ratio from the
three platforms were well correlated, with R-values 0.896-0.949 (p<0.0001). Consistent
differences between raw data values obtained between the three platforms was noted
and confirmed on Bland-Altman analysis. MoM values proved equivalent between
platforms.
PlGF levels were lower at midpregnancy in patients who developed preterm and early
onset preeclampsia (p<0.05), but not term preeclampsia. PlGF raw data values using the
early onset preeclampsia cut-off performed best, with AUC 0.92-0.93, sensitivity 100%,
specificity 77.8-80.75%, PPV 2.59-2.97% and NPV 100%.
4
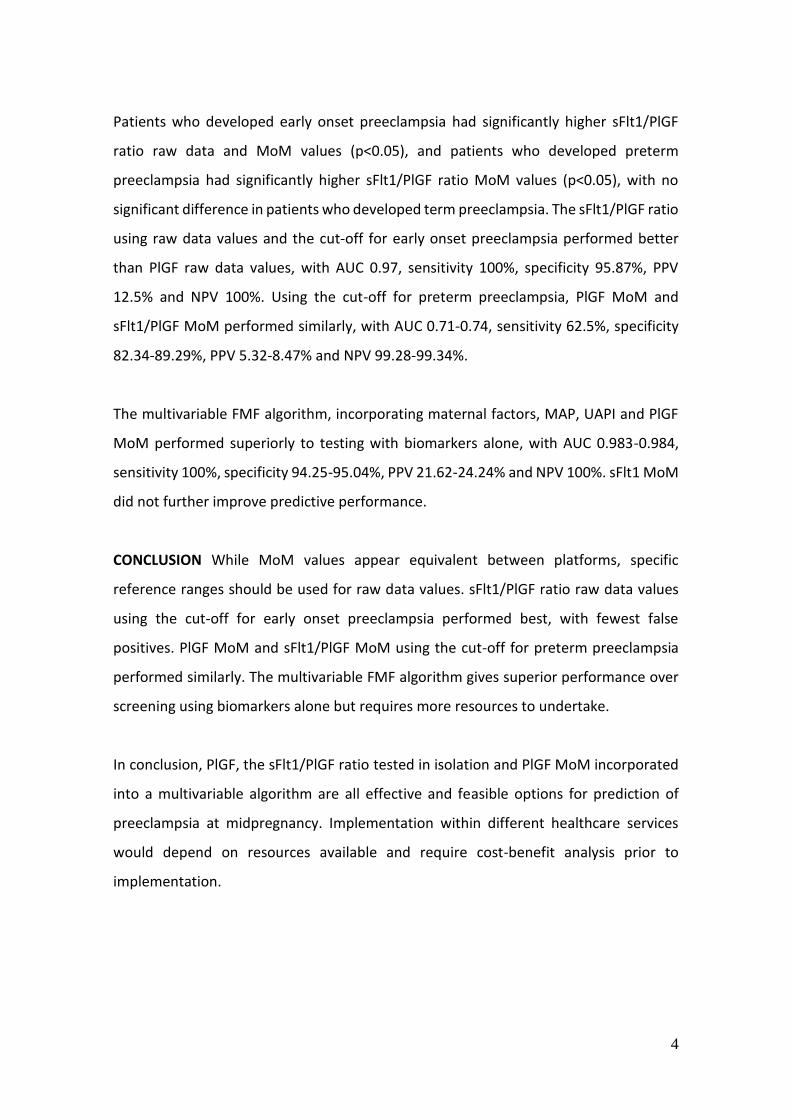
Patients who developed early onset preeclampsia had significantly higher sFlt1/PlGF
ratio raw data and MoM values (p<0.05), and patients who developed preterm
preeclampsia had significantly higher sFlt1/PlGF ratio MoM values (p<0.05), with no
significant difference in patients who developed term preeclampsia. The sFlt1/PlGF ratio
using raw data values and the cut-off for early onset preeclampsia performed better
than PlGF raw data values, with AUC 0.97, sensitivity 100%, specificity 95.87%, PPV
12.5% and NPV 100%. Using the cut-off for preterm preeclampsia, PlGF MoM and
sFlt1/PlGF MoM performed similarly, with AUC 0.71-0.74, sensitivity 62.5%, specificity
82.34-89.29%, PPV 5.32-8.47% and NPV 99.28-99.34%.
The multivariable FMF algorithm, incorporating maternal factors, MAP, UAPI and PlGF
MoM performed superiorly to testing with biomarkers alone, with AUC 0.983-0.984,
sensitivity 100%, specificity 94.25-95.04%, PPV 21.62-24.24% and NPV 100%. sFlt1 MoM
did not further improve predictive performance.
CONCLUSION While MoM values appear equivalent between platforms, specific
reference ranges should be used for raw data values. sFlt1/PlGF ratio raw data values
using the cut-off for early onset preeclampsia performed best, with fewest false
positives. PlGF MoM and sFlt1/PlGF MoM using the cut-off for preterm preeclampsia
performed similarly. The multivariable FMF algorithm gives superior performance over
screening using biomarkers alone but requires more resources to undertake.
In conclusion, PlGF, the sFlt1/PlGF ratio tested in isolation and PlGF MoM incorporated
into a multivariable algorithm are all effective and feasible options for prediction of
preeclampsia at midpregnancy. Implementation within different healthcare services
would depend on resources available and require cost-benefit analysis prior to
implementation.

5
Declaration
This is to certify that:
i. The thesis comprises only my original work towards the MPhil
except where indicated in the Preface;
ii. Due acknowledgement has been made in the text to all other
material used;
iii. The thesis is fewer than 50,000 words in length, excluding tables,
figures and bibliography.
Dr Carin Black
MPhil candidate

6
Preface
Pursuant to the regulations governing the degree of Masters of Philosophy at the
University of Melbourne, I hereby declare that:
i. Certain aspects of the work towards this thesis were undertaken through
collaboration with others in the scientific community, who will be co-
authors for the intended publications that result from the thesis. I declare
that I undertook the majority of the work towards this thesis, having
contributed at least 80% of work presented. The following table (Table 1)
outlines the contributions of all prospective co-authors for planned
future publications.
ii. This thesis contains no material that has been accepted for the award of
any other degree or diploma in any university.
iii. To the best of my knowledge, this thesis contains no material previously
published or written by another person, except where the appropriate
reference has been made.
iv. I acknowledge the award of an Australian Postgraduate Award (APA)
scholarship at the beginning of my candidature, which provided some
financial assistance.
7
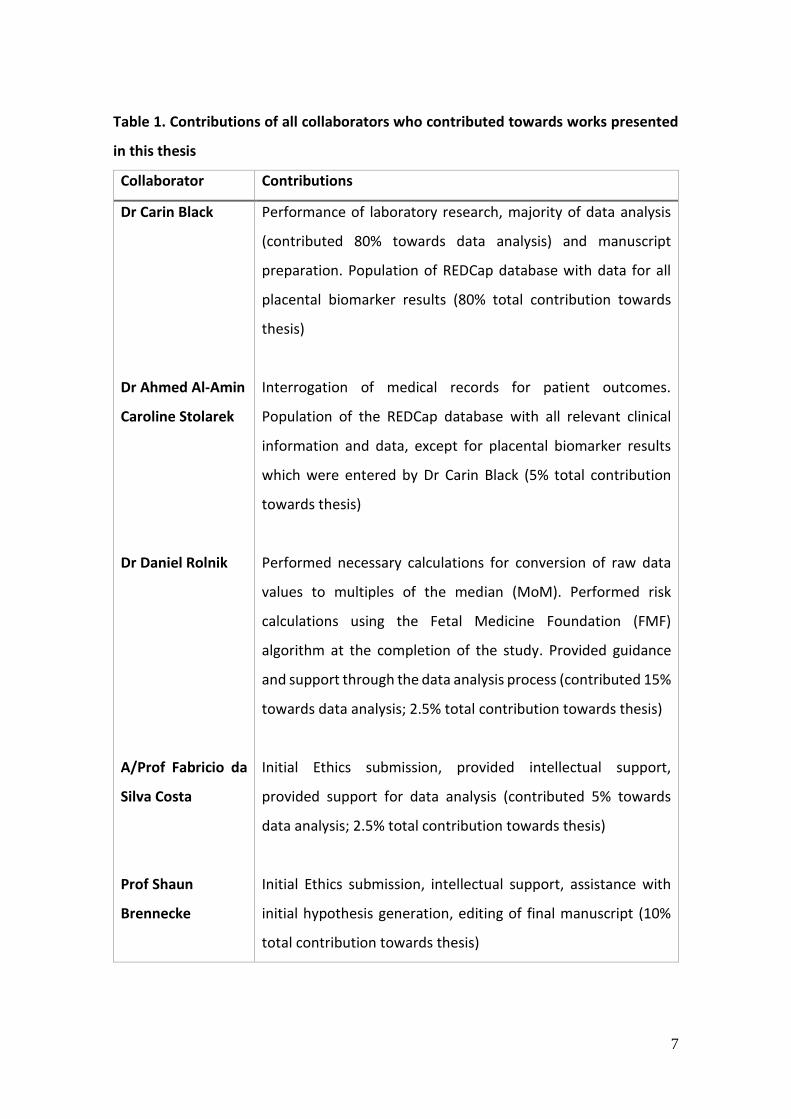
Table 1. Contributions of all collaborators who contributed towards works presented
in this thesis
Collaborator Contributions
Dr Carin Black
Dr Ahmed Al-Amin
Caroline Stolarek
Dr Daniel Rolnik
A/Prof Fabricio da
Silva Costa
Prof Shaun
Brennecke
Performance of laboratory research, majority of data analysis
(contributed 80% towards data analysis) and manuscript
preparation. Population of REDCap database with data for all
placental biomarker results (80% total contribution towards
thesis)
Interrogation of medical records for patient outcomes.
Population of the REDCap database with all relevant clinical
information and data, except for placental biomarker results
which were entered by Dr Carin Black (5% total contribution
towards thesis)
Performed necessary calculations for conversion of raw data
values to multiples of the median (MoM). Performed risk
calculations using the Fetal Medicine Foundation (FMF)
algorithm at the completion of the study. Provided guidance
and support through the data analysis process (contributed 15%
towards data analysis; 2.5% total contribution towards thesis)
Initial Ethics submission, provided intellectual support,
provided support for data analysis (contributed 5% towards
data analysis; 2.5% total contribution towards thesis)
Initial Ethics submission, intellectual support, assistance with
initial hypothesis generation, editing of final manuscript (10%
total contribution towards thesis)

8
Acknowledgements
There are numerous people who have contributed in a variety of ways to the production
of this work over the course of my candidature, to whom I express sincere gratitude.
I acknowledge the tireless efforts of the research midwives, particularly Adrienne White,
for enthusiastically recruiting patients, collecting data regarding maternal factors,
recording mean arterial pressures and meticulously collecting, cataloguing and storing
blood samples from each patient. I thank Adrienne also for assisting me to sort and
catalogue the samples at the completion of my project, to facilitate future use of the
samples by others.
For the performance and recording of uterine artery pulsatility index in patients
recruited for the study, I acknowledge the clinicians of the Pauline Gandel Imaging
Centre at the Royal Women’s Hospital, Australia.
For their extensive efforts in determining and recording patient outcomes and
assistance with populating the REDCap database, I acknowledge Dr Ahmed Al-Amin and
Caroline Stolarek.
I would like to acknowledge MCATS (Melbourne Clinical and Translational Sciences
research platform), for the administrative and technical support in the use of the
REDCap database that greatly facilitated this research, and Karen Reidy and Jo Bruhn for
their contribution as data managers onsite at the Royal Women’s Hospital Department
of Maternal-Fetal Medicine.
I am grateful for the training, support and assistance I received from the laboratory
scientists at the Royal Women’s Hospital that allowed me to complete the laboratory
component of the data analysis, in particular Janet Stevenson and Antony Borg for
generously sharing their time, expertise and assistance during blood sample analysis.
Similarly, I am grateful for the support from Dr Harry Georgiou and Dr Bill Kalionis in the

9
Department of Maternal-Fetal Medicine at the Royal Women’s Hospital, who were part
of my Advisory Committee, for their support and assistance through my laboratory
work, and for their assistance with revising the thesis manuscript prior to submission.
I acknowledge the expertise of Dr Daniel Rolnik for undertaking the necessary
calculations to convert raw data values to multiples of the median, for performing risk
calculations using the FMF multivariable algorithm and for his patience and accessibility
in providing me with training, support and guidance throughout the process of statistical
analysis.
I acknowledge the support and assistance from teams from Perkin Elmer, Roche
Diagnostics and ThermoScientific, for the provision of the immunoassay platforms,
reagents and consumables, and the provision of technical support, training and advice
necessary for the execution of this research project. I would like to declare that none of
the representatives from Perkin Elmer, Roche Diagnostics or ThermoScientific had any
input into the content of this manuscript.
I would like to thank my supervisor, Professor Shaun Brennecke for providing the
opportunity and encouragement to undertake this project, and for all your guidance,
knowledge and expertise provided along the way. Similarly, I would like to thank A/Prof
Fabricio da Silva Costa, who was integral to the original design of the project and who
has also provided much guidance throughout my candidature.
Finally, I express sincere gratitude towards my family. To my parents, for their tireless
efforts looking after baby Charlie so that I could complete the required laboratory work,
and their belief that I would succeed. Last but not least, to Aaron and Charlie, for
enduring the day to day challenges along the way, and for showing your support in every
way throughout the process. Thank you.

10
Publications, Presentations and Funding
Publications
1. Black C, Da Silva Costa F. Biomarker immunoassays in the diagnosis of
preeclampsia: calculating the sFlt1/PlGF ratio using the Cobas© e411 analyser.
Preeclampsia Methods and Protocols. Springer Protocols. Published 2018.
2. Al-Amin A, Rolnik D, Black C, White A, Stolarek C, Brennecke S and da Silva Costa,
F. Accuracy of second trimester prediction of preterm preeclampsia by three
different screening algorithms. Aust N Z J Obstet Gynaecol 2018; 58:192-96.
Presentations
1. POSTER PRESENTATION: ‘Mid-pregnancy Prediction of Preeclampsia using
Placental Biomarkers’. Presented at the SOMANZ and ADIPS Joint Scientific
Meeting, Canberra, ACT, 2017.
2. POSTER PRESENTATION: ‘Clinical Evaluation of a Second Trimester Algorithm for
Prediction of Preterm Preeclampsia’. Presented at the RANZCOG Annual
Scientific Meeting, Auckland, New Zealand, 2017.
3. ORAL PRESENTATION: ‘Midpregnancy PlGF and sFlt1/PlGF ratio testing for the
prediction of early onset preeclampsia – which test performs best in an
Australian patient population?’. Presented at the SOMANZ Annual Scientific
Meeting, Cairns, QLD 2018.
4. ORAL PRESENTATION: ‘Use of a multivariable algorithm for the prediction of
preterm preeclampsia at midpregnancy: does addition of serum sFlt1 and/or
PlGF improve predictive performance?’ Presented at the SOMANZ Annual
Scientific Meeting, Cairns, QLD 2018.
Funding
1. Australian Postgraduate Award (APA) Scholarship ($25,392 over the course of
three years, from 2015 to 2018).

11
List of all third-party copyright material
The following figures that appear throughout the thesis are classified as third-party
copyright material. I declare that I hold licenses to support the fact that permission has
been appropriately obtained, as required, to include this content in the open access
version of the thesis.
Figure 1. Development of spiral arteries during vasculogenesis. Red-Horse, K., Kapidzic,
M., Zhou, Y., Feng, K.T., Singh, H. and Fisher, S.J. (2005) 'EPHB4 regulates chemokine-
evoked trophoblast responses: a mechanism for incorporating the human placenta into
the maternal circulation', Development, 132(18), 4097-106. Reproduced with
permission from Development.
Figure 2. Representation of a chorionic villus and intervillous space. Zeldovich, V.B.,
Robbins, J.R., Kapidzic, M., Lauer, P. and Bakardjiev, A.I. (2011) ‘Invasive extravillous
trophoblasts restrict intracellular growth and spread of Listeria monocytogenes', PLoS
Pathog, 7(3), e1002005
Figure 3. Failure of physiological transformation of the spiral arteries is implicated in
preeclampsia. Moffett-King, A. (2002) 'Natural killer cells and pregnancy', Nat Rev
Immunol, 2(9), 656-63.
Figure 4. A model of pathogenesis and subclassification of preeclampsia types. Staff,
A.C., Benton, S.J., von Dadelszen, P., Roberts, J.M., Taylor, R.N., Powers, R.W., Charnock-
Jones, D.S. and Redman, C.W. (2013a) 'Redefining preeclampsia using placenta-derived
biomarkers', Hypertension, 61(5), 932-42.
Figure 5. Circulating angiogenic factors in healthy pregnancy and pregnancy
complicated by preeclampsia. Roberts, D.J. and Post, M.D. (2008) 'The placenta in pre-
eclampsia and intrauterine growth restriction', J Clin Pathol, 61(12), 1254-60. © 2018
BMJ & Association of Clinical Pathologists. All rights reserved.

12
Figure 7. Uterine artery Doppler velocimetry findings in the second trimester of
pregnancy. Chaiworapongsa, T., Chaemsaithong, P., Korzeniewski, S.J., Yeo, L. and
Romero, R. (2014a) 'Pre-eclampsia part 2: prediction, prevention and management', Nat
Rev Nephrol, 10(9), 531-40.
Figure 8. PlGF isoforms – PlGF-1, PlGF-2, PlGF-3 and PlGF-4. Takahashi H, Masabumi S.
The vascular endothelial growth factor (VEGF)/VEGF receptor system and its role under
physiological and pathological conditions. Clinical Science 2005; 109(3):227-41,
available: http://dx.doi.org/10.1042/CS20040370.
Figure 9. Soluble Fms-like tyrosine kinase 1. Kwelgan. Structural comparison of sFlt1-1
and Flt-1. Wikipedia 2018, available:
https://commons.wikimedia.org/wiki/File:Kwelgan_figure_4.tif#file

13
Table of Contents
Abstract……………………………………………………………………………………………………………………….3
Declaration………………………………………………………………………………………………………………….5
Preface…………………………………………………………………………………………………………………………6
Acknowledgements…………………………………………………………………………………………………….8
Presentations and Funding………………………………………………………………………………………..10
List of all third-party copyright material……………………………………………………………………11
Table of Contents………………………………………………………………………………………………………13
List of Tables…………………………………………………………………………………………………………..…19
List of Figures…………………………………………………………………………………………………………….22
List of Appendices……………………………………………………………………………………………………..25
Chapter 1: Introduction and Literature Review…………………………………………………………26
1.1 General introduction………………………………………………………………………………………26
1.2 Preeclampsia……………………………………………………………………………….…………………27
1.2.1 Definitions……………………………………………………………………………………….……………..27
1.2.2 Pathogenesis…………………………………………………………………………………….……………32
1.2.2.1 Normal placentation………………………………………………………………………….…………..32
1.2.2.2 Normal placental vasculogenesis and angiogenesis……………………………….……….33
1.2.2.3 Normal transformation of spiral arterioles……………………………………………….…….36
1.2.2.4 Preeclampsia – a two stage disorder…………………………………………………….………..38
1.2.3 Current management………………………………………………………………………….………….43
1.2.4 Preventative therapies………………………………………………………………………….………..44
1.2.5 The principles of screening and their applicability to preeclampsia………………..49
1.2.5.1 Justification for preeclampsia screening at midpregnancy………………..……………51
1.2.6 Current screening strategies for preeclampsia…………………………………..…………..54
1.2.7 Maternal Factors……………………………………………………………………………..…………….54
1.2.8 Mean arterial pressure…………………………………………………………………..………………55
1.2.9 Ultrasound parameters ……………………………………………………………………..…………..56
1.3 Placental biomarkers………………………………………………………………………..…………….58

14
1.3.1 Placental Growth Factor (PlGF)………………………………………………………..…………….60
1.3.2 Soluble Fms-like Tyrosine Kinase 1 (sFlt1) ………………………………………..……………63
1.3.3 Circulating angiogenic factors in normal pregnancy………………………………..………65
1.3.4 Circulating angiogenic factors in pregnancy complicated by preeclampsia……..65
1.3.5 The sFlt1/PlGF Ratio……………………………………………………………………………………….66
1.4 Multiparametric tests…………………………………………….…………………………….…………67
1.5 Research Objectives ………………………………………………………………….…………………..69
Chapter 2: Methods and validation studies……………………………………….……………………..70
2.1 Introduction……………………………………………………………………………………………………70
2.2 Study population………………………………………………………………………….…………........70
2.3 Blood sample collection and storage………………………………………………………………70
2.4 Immunoassay platforms……………………………………………………………….………………..71
2.4.1 The DELFIA® Xpress……………………………………………………………………….……………….71
2.4.2 The Roche cobas® e 411………………………………………………………………….……………..73
2.4.3 The B.R.A.H.M.S KRYPTOR compact PLUS…………………………………….…………........73
2.5 Outcome measures………………………………………………………………………………….…….74
2.6 Statistical analysis…………………………………………………………………………………………..74
2.7 Correlation of biomarker results between immunoassay platforms……………….78
2.8 Inter- and Intra- assay variability results…………………………………………………………86
2.8.1 Quality controls supplied by manufacturers……………………………………………………86
2.8.2 Quality Controls from our own samples………………………………………………………….91
2.8.3 Addition of calcium to plasma samples prior to allow compatability with the
Delfia platform……………………………………………………………………………………………….91
2.8.4 Correlation between serum and plasma results for PlGF and sFlt1 values………97
2.8.5 Correlation between fresh and thawed samples for PlGF and sFlt1 values……101
2.9 Discussion…………………………………………………………………………………………………….102
2.10 Summary………………………………………………………………………………………………………105

15
Chapter 3: Placental Growth Factor (PlGF) for the prediction for preeclampsia at
midpregnancy………………………………………………………………………………………………………….106
3.1 Introduction………………………………………………………………………………………………….106
3.2 Methods……………………………………………………………………………………………………….109
3.2.1 Study population………………………………………………………………………………………….109
3.2.2 Blood sample collection and storage……………………………………………………..…….109
3.2.3 Outcome measures………………………………………………………………………………………110
3.2.4 Statistical analysis…………………………………………………………………………………………110
3.3 Results………………………………………………………………………………………………………….112
3.3.1 Descriptive statistics……………………………………………………………………………………..112
3.3.2 Comparison studies for PlGF between patients who developed preeclampsia
and unaffected pregnancies………………………………………………………………………….117
3.3.3 Performance of PlGF for the prediction of preeclampsia………………………………121
3.3.4 Sensitivity and specificity analysis for prediction of preeclampsia using PlGF.126
3.3.5 PlGF raw data values for the prediction of early onset PE…………………………….127
3.3.6 PlGF MoM values for the prediction of preterm PE………………………………………132
3.4 Discussion…………………………………………………………………………………………………….133
3.5 Summary……………………………………………………………………………………………………...140
Chapter 4: Soluble Fms-like tyrosine kinase-1 (sFlt1) and the sFlt1/PlGF ratio for the
prediction of preeclampsia at midpregnancy………………………………………………………….142
4.1 Introduction………………………………………………………………………………………………….142
4.2 Methods……………………………………………………………………………………………………….145
4.2.1 Study population………………………………………………………………………………………….145
4.2.2 Blood sample collection and storage…………………………………………………………….146
4.2.3 Outcome measures………………………………………………………………………………………146
4.2.4 Statistical analysis…………………………………………………………………………………………146
4.3 Results………………………………………………………………………………………………………….147
4.3.1 Descriptive statistics……………………………………………………………………………………..147
16
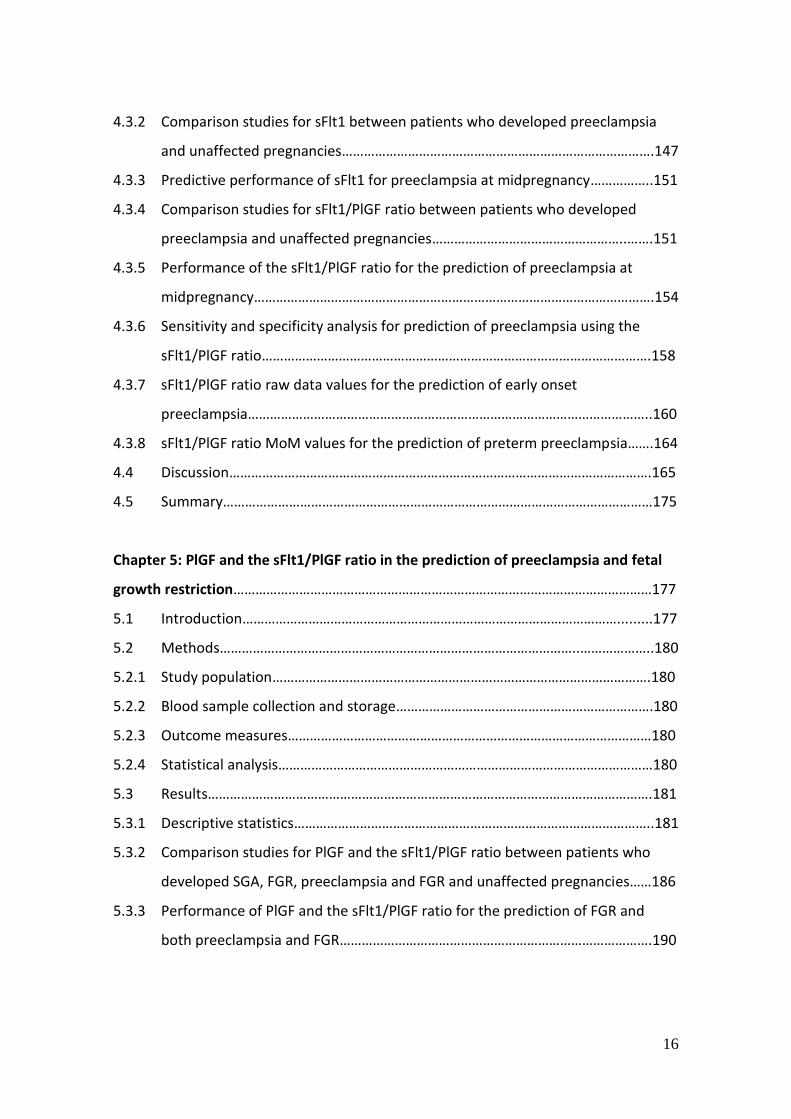
4.3.2 Comparison studies for sFlt1 between patients who developed preeclampsia
and unaffected pregnancies………………………………………………………………………….147
4.3.3 Predictive performance of sFlt1 for preeclampsia at midpregnancy……………..151
4.3.4 Comparison studies for sFlt1/PlGF ratio between patients who developed
preeclampsia and unaffected pregnancies……………………………………………..…….151
4.3.5 Performance of the sFlt1/PlGF ratio for the prediction of preeclampsia at
midpregnancy……………………………………………………………………………………………….154
4.3.6 Sensitivity and specificity analysis for prediction of preeclampsia using the
sFlt1/PlGF ratio…………………………………………………………………………………………….158
4.3.7 sFlt1/PlGF ratio raw data values for the prediction of early onset
preeclampsia………………………………………………………………………………………………..160
4.3.8 sFlt1/PlGF ratio MoM values for the prediction of preterm preeclampsia…….164
4.4 Discussion…………………………………………………………………………………………………….165
4.5 Summary………………………………………………………………………………………………………175
Chapter 5: PlGF and the sFlt1/PlGF ratio in the prediction of preeclampsia and fetal
growth restriction……………………………………………………………………………………………………177
5.1 Introduction………………………………………………………………………………………….........177
5.2 Methods……………………………………………………………………………………..………………..180
5.2.1 Study population………………………………………………………………………………………….180
5.2.2 Blood sample collection and storage…………………………………………………………….180
5.2.3 Outcome measures………………………………………………………………………………………180
5.2.4 Statistical analysis…………………………………………………………………………………………180
5.3 Results………………………………………………………………………………………………………….181
5.3.1 Descriptive statistics……………………………………………………………………………………..181
5.3.2 Comparison studies for PlGF and the sFlt1/PlGF ratio between patients who
developed SGA, FGR, preeclampsia and FGR and unaffected pregnancies……186
5.3.3 Performance of PlGF and the sFlt1/PlGF ratio for the prediction of FGR and
both preeclampsia and FGR………………………………………………………………………….190

17
5.3.3.1 PlGF, sFlt1 and sFlt1/PlGF ratio raw data and MoM for the prediction of FGR
and preeclampsia and FGR at term……………………………………………………………….190
5.3.3.2 PlGF and PlGF MoM for the prediction of preterm FGR and preterm
preeclampsia and FGR………………………………………………………………………………….190
5.3.3.3 PlGF and PlGF MoM for the prediction of early onset FGR and early onset
preeclampsia and FGR………………………………………………………………………………….195
5.3.3.4 sFlt1 and sFlt1 MoM for the prediction of early onset, preterm and term FGR
and early onset, preterm and term preeclampsia and FGR……….............……..195
5.3.3.5 sFlt1/PlGF ratio and sFlt1/PlGF ratio MoM for the prediction of preterm FGR
and preterm preeclampsia and FGR……………………………………………………………..195
5.3.3.6 sFlt1/PlGF ratio and sFlt1/PlGF ratio MoM for the prediction of early onset FGR
and early onset preeclampsia and FGR…………………………………………………………200
5.3.4 Sensitivity and specificity analysis for PlGF raw data and MoM values…………200
5.4 Discussion…………………………………………………………………………………………………….206
5.4.1 PlGF and sFlt1/PlGF ratio as a predictive test for preterm and early onset FGR
when tested at midpregnancy. …………………………………………………………………....206
5.4.2 PlGF and sFlt1/PlGF ratio as a predictive test for preterm and early onset
preeclampsia and FGR when tested at midpregnancy…………………………………..209
5.5 Summary………………………………………………………………………………………………………214
Chapter 6: Prediction of preterm preeclampsia at midpregnancy using a multivariable
screening algorithm…………………………………………………………………………………………………216
6.1 Introduction………………………………………………………………………………………………….216
6.2 Methods……………………………………………………………………………………………………….218
6.2.1 Study population………………………………………………………………………………………….219
6.2.2 Blood sample collection and storage…………………………………………………………….219
6.2.3 Outcome measures………………………………………………………………………………………219
6.2.4 Statistical analysis…………………………………………………………………………………………219
6.3 Results………………………………………………………………………………………………………….220
6.3.1 Descriptive statistics……………………………………………………………………………………..220

18
6.3.2 Performance of the full FMF screening algorithm for the prediction of
preeclampsia when tested at midpregnancy………………………………………………..220
6.3.2.1 Combined values for maternal factors, MAP, UAPI MoM and PlGF MoM for
Delfia, Cobas and Kryptor platforms……………………………………………………………..220
6.3.2.2 Combined values for maternal factors, MAP, UAPI MoM, PlGF MoM and sFlt1
MoM for Delfia, Cobas and Kryptor platforms…………………………………….………..220
6.3.3 Sensitivity and specificity analysis for prediction of preeclampsia using PlGF.223
6.4 Discussion…………………………………………………………………………………………………….228
6.5 Summary………………………………………………………………………………………………………232
Chapter 7: Discussion and Summary……………………………………………………………………….233
7.1 General Discussion………………………………………………………………………………….……233
7.2 Factors in implementation of PlGF or the sFlt1/PlGF ratio as screening tests.239
7.3 Different pathophysiology for early onset and term preeclampsia……………….244
7.4 Sources of interference with immunoassay results……………………………………….247
7.5 Future Directions………………………………………………………………………………………….248
7.6 Strengths and Limitations……………………………………………………………………………..254
7.7 Summary………………………………………………………………………………………………………255
Bibliography…………………………………………………………………………………………………………….259
Appendices………………………………………………………………………………………………………….....290
19
List of Tables
Table 1 WHO Principles of screening…….…………………………………………………………50
Table 2 Description of immunoassay platforms and reagents used…………………72
Table 3 Correlation and mean difference between raw data values for the three
different platforms………………………………………………………………..……………83
Table 4 Correlation and mean difference between MoM values for the three
different platforms……………………………………………………………………………..83
Table 5 Angiogenic marker levels for patients who developed term (≥37 weeks),
preterm (<37 weeks) and early onset (<34 weeks) preeclampsia
compared with unaffected pregnancies……………………………………………..84
Table 6 Coefficients of variation for quality controls provided by DELFIA® Xpress
a) as published in DELFIA PlGF kit inserts and b) obtained within our
laboratory……………………………………………………………………………………………88
Table 7 Coefficients of variation for quality controls provided by Roche a) as
published in kit inserts for Roche Elecsys® sFlt1 and PlGF kits and b)
obtained in our laboratory………………………………………………………………….88
Table 8 Coefficients of variation for quality controls provided by B.R.A.H.M.S
KRYPTOR compact PLUS a) as published in kit inserts for B·R·A·H·M·S
PlGF PLUS and B·R·A·H·M·S sFlt-1 KRYPTOR assays and b) obtained in
our laboratory…………………………………………………………………………………….89
Table 9 Coefficients of variation for internal quality controls obtained within our
laboratory for each of the three immunoassay platforms……………………90
Table 10 Correlation and mean difference between sFlt1 and PlGF values when
comparing serum and plasma sample results for the Delfia, Cobas and
Kryptor platforms……………………………………………….………………………………96
Table 11 Characteristics of the study population for midpregnancy prediction of
preeclampsia…………………………………………………….……………..……………….111
Table 12 Summary of patients who developed early onset and preterm
preeclampsia……………………………………………………………………………..……..114
Table 13 Summary of patients who developed term preeclampsia………………….115
20
Table 14 Composite adverse outcomes…………………………………………………………..118
Table 15 Comparison of PlGF raw data and MoM values between patients with
term, preterm and early onset preeclampsia and unaffected
pregnancies………………………………………………………………………..…………….119
Table 16 Clinical characteristics for PlGF raw data and MoM values for prediction
of early onset and preterm preeclampsia……………………………………….…125
Table 17 Clinical characteristic summary table for preterm and early onset
preeclampsia…………………………………………………………………………………….128
Table 18 True positive results for PlGF raw data and MoM values for the three
platforms………………………………………………………………………………………….129
Table 19 False positive results for PlGF raw data and MoM values for the three
platforms with preterm delivery or adverse outcome……………………….130
Table 20 Composite adverse outcomes for PlGF raw data and MoM values and
sFlt1/PlGF ratio raw data and MoM values for the three platforms…..131
Table 21 Comparison of raw data and MoM values for sFlt1 for all platforms ..148
Table 22 Comparison of sFlt1/PlGF ratio raw data and MoM values between
patients with preeclampsia and unaffected pregnancies…………………..152
Table 23 Sensitivity and specificity analysis for Delfia, Cobas and Kryptor
platforms using cut-offs from ROC curves………………………………….……..159
Table 24 True positive results for sFlt1/PlGF raw data and MoM values for the
three platforms…………………………………………………………………………………161
Table 25 False positive results with preterm delivery or poor outcomes for
sFlt1/PlGF raw data and MoM values for the three platforms…………..162
Table 26 Characteristics of the study population for midpregnancy prediction of
FGR or preeclampsia and FGR……………………………………………….………….184
Table 27 Comparison of PlGF and sFlt1/PlGF ratio raw data and MoM values
between patients who developed SGA, FGR, PE and FGR and unaffected
pregnancies………………………………………………………………………………………185
Table 28 Clinical characteristics for PlGF raw data and MoM values for prediction
of early onset and preterm FGR………………………………………………….…….201
21
Table 29 Clinical characteristics for sFlt1/PlGF ratio raw data and MoM values for
prediction of early onset and preterm FGR………………………………….......202
Table 30 Clinical characteristics for PlGF raw data and MoM values for prediction
of early onset and preterm preeclampsia and FGR………………………......203
Table 31 Clinical characteristics for sFlt1/PlGF ratio raw data and MoM values for
prediction of early onset and preterm preeclampsia and FGR…………..204
Table 32 Clinical characteristic summary table for preterm and early onset
FGR……………………………………………………………………………………………………207
Table 33 Clinical characteristic summary table for preterm and early onset
preeclampsia and FGR………………………………………………………………………210
Table 34 Prediction of preterm preeclampsia using the FMF algorithm, combining
values for maternal history, MAP, UAPI MoM, PlGF MoM +/- sFlt1 MoM
values……………………………………………………………………………………............224
Table 35 Clinical characteristic summary table using the FMF algorithm with PlGF
MoM +/- sFlt1 MoM for prediction of preterm preeclampsia…..……….225
Table 36 Screening performance according to the FMF algorithm (using cut-offs
of 1:50 and 1:100) for preeclampsia delivering before 37 weeks………226
Table 37 Performance of screening for fixed 5% and 10% false positive rates for
the FMF algorithm………………………………………………………………………......227
22
List of Figures
Figure 1 Development of spiral arteries during vasculogenesis…………………………34
Figure 2 Representation of a chorionic villus and intervillous space………………….35
Figure 3 Failure of physiological transformation of the spiral arteries is
implicated in preeclampsia………………………………………………………………….37
Figure 4 A model of pathogenesis and subclassification of preeclampsia
types………...............................................................................................39
Figure 5 Circulating angiogenic factors in healthy pregnancy and pregnancy
complicated by preeclampsia……………………………………………………………..42
Figure 6 Preeclampsia has a long asymptomatic period during which screening
could identify high-risk pregnancies……………………………………………………52
Figure 7 Uterine artery Doppler velocimetry findings in the second trimester of
pregnancy……………………………………………………………………………………………57
Figure 8 PlGF isoforms – PlGF-1, PlGF-2, PlGF-3 and PlGF-4………………………………62
Figure 9 Soluble Fms-like tyrosine kinase 1……………………………………………………….62
Figure 10 Correlation between Delfia, Cobas and Kryptor platforms for PlGF raw
data and MoM values………………………………………………………………………...75
Figure 11 Correlation between Cobas and Kryptor platforms for sFlt1 raw data and
MoM values………………………………………………………………………………………..76
Figure 12 Correlation between Cobas and Kryptor platforms for sFlt1/PlGF ratio
raw data and MoM values…………………………………………………………………..77
Figure 13 Bland Altman plots comparing PlGF raw data values between
platforms…………………………………………………………………………………………….79
Figure 14 Bland Altman plots comparing sFlt1 and sFlt1/PlGF ratio raw data values
between platforms……………………………………………………………………………..80
Figure 15 Bland Altman plots comparing PlGF MoM values between platforms…81
Figure 16 Bland Altman plots comparing sFlt1 MoM and sFlt1/PlGF ratio MoM
values between platforms…………………………………………………………………..82
23
Figure 17 Correlation between Plasma and Serum Results for PlGF using Delfia,
Cobas and Kryptor platforms and sFlt1 and the sFlt1/PlGF ratio using
Cobas and Kryptor platforms……………………………………………………………...92
Figure 18 Bland Altman plots comparing serum and plasma PlGF values for each
platform………………………………………………………………………………………………93
Figure 19 Bland Altman plots comparing serum and plasma sFlt1 values for each
platform………………………………………………………………………………………………94
Figure 20 Bland Altman plots comparing serum and plasma sFlt1/PlGF ratio values
for each platform…………………………………………………………………………..……95
Figure 21 Inter-assay control samples for PlGF Control 1………………………………..….98
Figure 22 Inter-assay control samples for sFlt1 Control 1……………………………………98
Figure 23 Inter-assay control samples for sFlt1/PlGF ratio Control 1…………………..99
Figure 24 Inter-assay control samples for PlGF Control 2………………………………..….99
Figure 25 Inter-assay control samples for sFlt1 Control 2……………………………….…100
Figure 26 Inter-assay control samples for sFlt1/PlGF ratio Control 2…………………100
Figure 27 Patients who developed preeclampsia from those included for
analysis……………………………………………………………………………………………..113
Figure 28 Comparison of PlGF raw data and MoM levels between patients with
early onset (<34 weeks), preterm (<37 weeks) and term (≥37 weeks)
preeclampsia and unaffected pregnancies…………………………………..……120
Figure 29 ROC curves for prediction of term (≥37 weeks) preeclampsia using PlGF
raw data and MoM values…………………………………………………………………122
Figure 30 ROC curves for prediction of preterm (<37weeks) preeclampsia using
PlGF raw data and MoM values…………………………………………………………123
Figure 31 ROC curves for prediction of early onset (<34weeks) preeclampsia using
PlGF raw data and MoM values…………………………………………………………124
Figure 32 Comparison of sFlt1 raw data and MoM values between patients with
early onset (<34 weeks), preterm (<37 weeks) and term (≥37 weeks)
preeclampsia and unaffected pregnancies……………………………………..…149

24
Figure 33 ROC curves for prediction of term (≥37 weeks), preterm (<37 weeks)
and early onset (<34 weeks) preeclampsia using sFlt1 raw data and
MoM values……………………………………………………………………………………...150
Figure 34 Comparison of sFlt1/PlGF ratio raw data and MoM values between
patients with preeclampsia and unaffected pregnancies………………..…153
Figure 35 ROC curves for prediction of term (≥37 weeks) preeclampsia using
sFlt1/PlGF ratio raw data and MoM values at any gestation…………..…155
Figure 36 ROC curves for prediction of preterm (<37 weeks) preeclampsia using
sFlt1/PlGF ratio raw data and MoM values……………………………………....156
Figure 37 ROC curves for prediction of early onset (<34 weeks) preeclampsia using
sFlt1/PlGF ratio raw data and MoM values……………………………………….157
Figure 38 Clinical characteristics for the tests that perform best for the prediction
of early onset and preterm preeclampsia………………………………………….170
Figure 39 Patients that developed SGA and FGR……………………………………………….183
Figure 40 Comparison of PlGF raw data and MoM values between patients with
SGA, preterm FGR and preterm preeclampsia and FGR and unaffected
pregnancies……………………………………………………………………………………...187
Figure 41 Comparison of sFlt1/PlGF ratio raw data and MoM values between
patients with SGA, preterm FGR and preterm preeclampsia and FGR and
unaffected
pregnancies………………………………………………………………………………………188
Figure 42 ROC curves for prediction of preterm FGR using PlGF raw data and MoM
values……………………………………………………………………………………………….191
Figure 43 ROC curves for prediction of preterm preeclampsia and FGR using PlGF
raw data and MoM values…………………………………………………………………192
Figure 44 ROC curves for prediction of early onset FGR using PlGF raw data and
MoM values……………………………………………………………………………………..193
Figure 45 ROC curves for prediction of early onset preeclampsia and FGR using
PlGF raw data and MoM values………………………………………………………..194

25
Figure 46 ROC curves for prediction of preterm FGR using sFlt1/PlGF ratio raw
data and MoM values……………………………………………………………………….196
Figure 47 ROC curves for prediction of preterm preeclampsia and FGR using
sFlt1/PlGF ratio raw data and MoM values………………………………….……197
Figure 48 ROC curves for prediction of early onset FGR using sFlt1/PlGF ratio raw
data and MoM values……………………………………………………………………….198
Figure 49 ROC curves for prediction of early onset preeclampsia and FGR using
sFlt1/PlGF ratio raw data and MoM values……………………………………….199
Figure 50 Distribution of gestational age at delivery for preeclampsia…………..…217
Figure 51 ROC curves using the FMF algorithm for prediction of preeclampsia
using combined values for maternal history, MAP, UAPI MoM and PlGF
MoM for Delfia, Cobas and Kryptor platforms…………………………………..221
Figure 52 ROC curves using the FMF algorithm for prediction of preeclampsia
using combined values for maternal history, MAP, UAPI MoM, PlGF
MoM and sFlt1 MoM for Cobas and Kryptor platforms…………………….222
Figure 53 Clinical characteristics for the tests that perform best for the prediction
of early onset and preterm preeclampsia………………………………………….237
Figure 54 Significance of research and future directions…………………………………..251
Appendices
Appendix 1 Clinical history, outcomes and biomarker results for patients taking low
dose aspirin antenatally………………………………………………………………….290

26
Chapter 1
Introduction and Literature Review
1.1 General Introduction
Preeclampsia is a multisystem, pregnancy specific disorder complicating 2-8% of
pregnancies (Ghulmiyyah and Sibai 2012) and is a major cause of maternal and perinatal
morbidity and mortality worldwide (Khan et al. 2006). Potentially life-threatening
maternal conditions associated with preeclampsia include cerebral encephalopathy or
haemorrhage, pulmonary oedema, hepatic failure or rupture, acute renal failure and
placental abruption with disseminated intravascular coagulopathy (Sibai et al. 2003).
The fetal effects can include preterm birth, fetal growth restriction, hypoxia, acidosis
and perinatal death (Sibai et al. 2003). Maternal deaths from complications of
preeclampsia continue to occur in developed countries, despite improvements in
antenatal care. Four maternal deaths resulting from complications of preeclampsia
occurred in Australia between 2012 and 2014 (Australian Institute of Health and Welfare
2017), accounting for 6.3% of direct maternal deaths and resulting in a maternal
mortality ratio (MMR) for hypertensive disorders of pregnancy for this period of 0.4 per
100,000 (Australian Institute of Health and Welfare 2017). Regular assessment for
preeclampsia is a key component of routine antenatal care, and much attention has
been focused towards research into screening for preeclampsia in asymptomatic
populations (O'Gorman et al. 2016; O'Gorman et al. 2017) and diagnostic testing in
patients who present with symptoms of disease (Chappell et al. 2013; Zeisler et al.
2016a).
The development of preeclampsia is widely believed to originate from impaired
placentation occurring early in pregnancy (Lyall et al. 2013). The placenta is an extremely
sophisticated and complex organ, and normal placentation is fundamental to both
maternal and fetal wellbeing, providing a vital connection between the two during all
stages of pregnancy. The placental circulation must remain dynamic and evolve to the

27
needs of the rapidly growing fetus (Kingdom et al. 2000; Kaufmann et al. 2004).
Abnormal levels of angiogenic factors in the maternal circulation can indicate placental
dysfunction during the second trimester, well before symptoms of preeclampsia
develop (Maynard et al. 2003; Levine 2004), giving an opportunity for screening with a
view to close monitoring and early diagnosis, or potentially leading to the discovery of
new prophylactic and therapeutic agents in future to ameliorate the development of
this complex condition (Roberts and Hubel 2009; Warrington et al. 2013; Kar 2014).
Despite the recent advances in our understanding of the pathophysiology and aetiology
of preeclampsia, individual clinical tests that can accurately recognise placental
dysfunction when performed during the second trimester of pregnancy are not yet
recommended for routine clinical use for screening or diagnosis of preeclampsia (Meads
et al. 2008; Henderson et al. 2017; Brown et al. 2018), and this area remains a challenge
in modern day obstetrics.
The work presented in this thesis has focused on circulating angiogenic factors and
investigation into their clinical validity and utility as screening biomarkers for the
prediction of preeclampsia at midpregnancy. The introduction to the thesis has
reviewed the current understanding of the definitions, aetiology and pathophysiology
of preeclampsia, clinical management and preventative strategies, the current
understanding and justification for the use of placental biomarkers in preeclampsia
screening during the second trimester.
1.2 Preeclampsia
1.2.1 Definitions
Consistency in the definition of preeclampsia at an international level is important to
allow appropriate diagnosis and provision of clinical care for this potentially sinister
condition (Brown et al. 2001; Tranquilli et al. 2014; Brown et al. 2018). There exists a
longstanding lack of definitive consensus regarding classification and diagnostic criteria
for both preeclampsia and hypertensive disorders of pregnancy. In 2000, the
International Society for the Study of Hypertension in Pregnancy (ISSHP) recognised this

28
lack of consensus and performed a review with the intention of specifically addressing
this issue. Following the consideration of reports from several working groups globally,
it was established that major consensus statements were essentially similar for the
diagnostic criteria for preeclampsia, hypertension and their terminology (Brown et al.
2001). The identified inconsistencies revolved around how inclusive each definition was,
with the main area of discrepancy centered around whether the presence of significant
proteinuria should be essential for the diagnosis of preeclampsia. Given the potentially
sinister nature of preeclampsia, ISSHP recommended that for clinical management, it is
safer to over diagnose preeclampsia than to miss a case, hence recommended that a
broader, more inclusive definition, not necessarily including proteinuria, should be
applied for the clinical definition of preeclampsia. In contrast, when considering criteria
for patients enrolled in scientific research, a more restricted research definition with the
inclusion of proteinuria in the diagnosis was recommended, to ensure greater specificity
around the diagnosis of preeclampsia for the purpose of identifying cases for research
studies (Brown et al. 2001).
The ISSHP guidelines have subsequently been revised and updated (Tranquilli et al.
2014; Brown et al. 2018). The ISSHP clinical definition for preeclampsia, which was most
recently revised earlier this year, is as follows (Brown et al. 2018):
Pre-eclampsia is gestational hypertension accompanied by one or more of the following
new-onset conditions at or after 20 weeks’ gestation:
1. Proteinuria
2. Other maternal organ dysfunction, including:
• Acute kidney injury (AKI) (creatinine ≥90 μmol/L; 1 mg/dL)
• Liver involvement (elevated transaminases e.g. ALT or AST >40 IU/L) with or
without right upper quadrant or epigastric abdominal pain)
• Neurological complications (examples include eclampsia, altered mental status,
blindness, stroke, clonus, severe headaches, persistent visual scotomata)

29
• Haematological complications (thrombocytopenia – platelet count below
150,000/μL, DIC, hemolysis)
3. Uteroplacental dysfunction (such as fetal growth restriction, abnormal umbilical
artery Doppler wave form analysis, or stillbirth)
As part of this revised definition, ISSHP defines hypertension and proteinuria as follows:
1. Hypertension
• Defined as systolic BP ≥140 and/or diastolic BP ≥90 mmHg
• Blood pressure should be repeated to confirm true hypertension
o if blood pressure is severe (SBP ≥160 and/or DBP ≥110 mmHg) then the blood
pressure should be confirmed within 15 min;
o for less severe blood pressure, repeated readings should be taken over a few
hours.
• Use a liquid crystal sphygmomanometer
o If this is unavailable, use a validated and appropriately calibrated automated
device
2. Proteinuria
Proteinuria should be assessed initially by automated dipstick urinalysis when possible;
if not available, careful visual dipstick urinalysis will suffice.
• If positive (≥‘1+’, 30 mg/dl) then spot urine protein/creatinine ratio (PCR) should be
performed
• Urine PCR ≥30 mg/mmol (0.3 mg/mg) is abnormal
• A negative dipstick test can usually be accepted and further PCR testing is not required
at that time
• Proteinuria is not required for a diagnosis of pre-eclampsia
• Massive proteinuria (> 5 g/24 h) is associated with more severe neonatal outcomes
30
The ISSHP research definition of preeclampsia is as follows: de novo hypertension after
20 weeks gestation and appropriately documented proteinuria, as described in the
clinical definition, above (Brown et al. 2018).
Throughout this work the research definition for preeclampsia has been used.
Classification of preeclampsia in terms of severity and timing of onset are also lacking in
consistency throughout the literature. These classifications, whilst not essential for
everyday clinical practice, are once again useful at an international level to compare
clinical data and outcomes (Tranquilli et al. 2014; Brown et al. 2018) and have been most
recently revised this year, not for clinical purposes but for scientific research and
publication purposes. Such classifications ensure that only women with the correct
disorder will be included in scientific research, reserving the more inclusive, broader
definition of preeclampsia as described above for use in everyday clinical practice.
According to the recently revised guidelines, ISSHP does not advocate for any clinical
distinction between mild and severe preeclampsia in usual clinical practice (Brown et al.
2018). Instead, all cases of preeclampsia should be treated in the knowledge that the
condition may change rapidly, and that this remains a major cause of maternal and fetal
mortality worldwide. Classification of preeclampsia as early or late onset, mild or severe
may be useful for research purposes, however, for clinical purposes, the condition
should be considered as one that is at any time capable of becoming severe and life-
threatening from both a maternal and fetal point of view (Brown et al. 2018). Clinical
findings warranting closer attention from a maternal perspective include ongoing or
recurring severe headaches, visual scotomata, nausea and vomiting, epigastric pain,
oliguria and severe hypertension as well as progressive derangements in laboratory
tests (Brown et al. 2018). From a fetal perspective, abnormal fetal biometry, amniotic
fluid assessment and fetal Doppler waveform analysis warrant closer monitoring (Brown
et al. 2018). Women with concerning features should ideally be managed within a centre
with access to both maternal and fetal high dependency or intensive care units if
possible (Brown et al. 2018).

31
The ISSHP states that relying on the magnitude of hypertension as a solitary measure is
not sufficient to predict immediate risk in preeclampsia, as individual thresholds differ
substantially and some women may develop serious organ dysfunction at relatively mild
levels of blood pressure (Brown et al. 2018). Hence, decisions to admit and monitor
should be based on having developed preeclampsia per se, regardless of initial blood
pressure levels. Having said this, blood pressure at or above 160/110 mmHg is
considered a surrogate marker for the risk of stroke, as well as a reflection of increased
severity of the overall condition of preeclampsia (Brown et al. 2018). Severe
hypertension has been associated with significantly greater likelihood of both maternal
and fetal adverse outcomes (Brown et al. 2018), however despite this, there is no
universal agreement in clinical practice guidelines regarding target blood pressure levels
to be maintained once antihypertensives are instituted in pregnancy. ISSHP endorses an
approach that reduces the likelihood of developing severe maternal hypertension, with
commencement of antihypertensives to treat any persistent hypertension, prior to
reaching levels in the magnitude of 160/110 mmHg (Brown et al. 2018). This
recommendation applies to all hypertensive disorders of pregnancy, aiming for a
diastolic blood pressure of around 85 mmHg, and a systolic blood pressure <160 mmHg
(Brown et al. 2018).
There is ongoing debate regarding the importance of the absolute quantitation of
proteinuria. Some believe that the degree of proteinuria provides little additional risk
stratification, unless there is confirmed nephrotic syndrome, and it should not enter into
consideration when determining the severity of preeclampsia (Payne et al. 2011; Brown
2012; Cade et al. 2012). Others have shown that proteinuria is associated with increased
maternal and perinatal morbidity (Homer et al. 2008), particularly massive proteinuria
(>5g/24hours on a 24 hour collection, or >900mg/mmol using spot protein/creatinine
ratio), which is associated with more severe neonatal outcomes and earlier delivery and
worse maternal outcomes (Chan et al. 2005; Mateus et al. 2017). For this reason some
units may choose to continue quantifying proteinuria after diagnosis, though there is no

32
current existing recommendation to expedite delivery based on the extent of
proteinuria.
As previously outlined, the diagnosis of preeclampsia is currently based on nonspecific
criteria including blood pressure, proteinuria and subjective patient symptomatology.
These parameters are late, end-organ effects of disease (Dekker and Sibai 2001; National
Institute for Health and Clinical Excellence 2010; World Health Organization 2011;
American College of Obstetricians and Gynecologists 2013) and they display poor test
accuracy for prediction of adverse outcomes (Zhang et al. 2001; Henderson et al. 2017),
with variable clinical presentations making risk assessment challenging. Additionally, the
differentiation of preeclampsia from other hypertensive disorders of pregnancy can
prove challenging, however these are important distinctions to make from a prognostic
perspective. This is because the increased perinatal morbidity and mortality associated
with preeclampsia does not accompany the other diagnoses to the same extent, hence
the extent of clinical surveillance and triggers for delivery for these conditions can differ
considerably (Dekker and Sibai 2001).
1.2.2 Pathogenesis
1.2.2.1 Normal placentation
Formation of the maternal-fetal interface, the primary area affected by preeclampsia, is
an extremely complex process (Maltepe et al. 2010; Carter et al. 2015). Our current
understanding of placental development is limited by the fact that it has not been
possible to date to replicate the specific microenvironmental conditions for the purpose
of meaningful in vitro studies into placental development (Kaufmann et al. 2004). Our
understanding of the development of the human fetovascular placental unit is based
mainly on descriptive structural and immunohistochemical studies and animal
experiments, at times limiting the ability to apply them directly to the human species
(Kaufmann et al. 2004). With these limitations, it is no wonder that the exact aetiology
of a condition as complex as preeclampsia is yet to be fully determined.

33
1.2.2.2 Normal placental vasculogenesis and angiogenesis
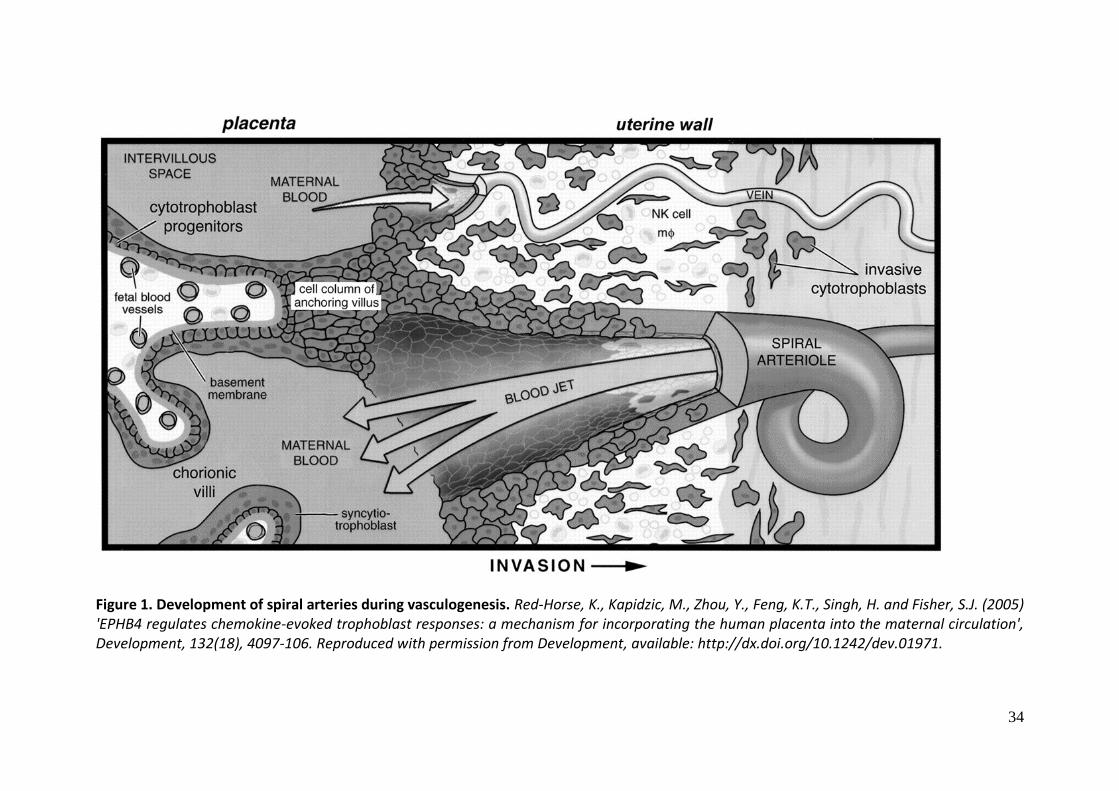
From our established body of knowledge, it appears that the bulk of the placenta
consists of copious tree-like projections called chorionic villi (Kingdom et al. 2000). These
villi, containing circulating fetal blood, project into the intervillous space, the space
between the chorionic plate on the fetal side of the placenta, and the basal plate on the
maternal side of the placenta (Red-Horse et al. 2005) (Figure 1). Maternal blood
circulating through the intervillous space comes into close contact with fetal blood from
chorionic villi, and this is the site of maternal-fetal exchange (Kingdom et al. 2000; Fisher
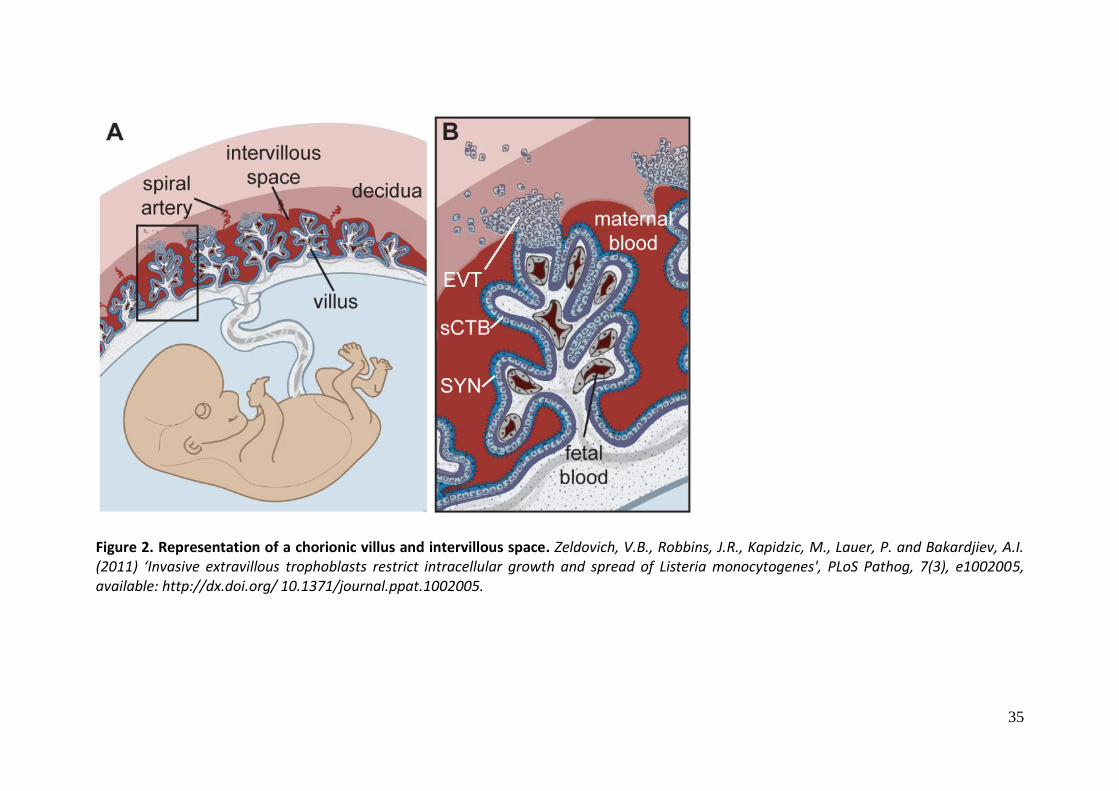
2015). Formation of placental villi at the placental side (Faas et al. 2014) (Figure 2)
commences around day 13 post conception, via a process called vasculogenesis, which
is defined as blood vessel formation occurring by a de novo production of endothelial
cells (Risau and Flamme 1995; Kingdom et al. 2000; Kaufmann et al. 2004). Placental villi
are initially primary villi, comprising finger-like outgrowths containing only trophoblast,
which proliferate laterally into the intervillous space (Kingdom et al. 2000). By around
day 21 post conception, the primary villi are invaded centrally by allantoic mesenchyme
derived from the embryo, which transforms them into secondary villi, containing both
trophoblast and mesoderm (Kingdom et al. 2000; Demir et al. 2004; Kaufmann et al.
2004). Vascular endothelial growth factor A (VEGF-A), which is responsible for the
commitment, growth and aggregation of endothelial precursors for the formation of
haemangiogenic cords, is highly expressed at this stage (Wheeler et al. 1995; Shore et
al. 1997; Vuorela et al. 1997) and has been shown in several studies to reach the area of
vasculogenesis via villous trophoblast and villous stromal macrophages (Shore et al.
1997; Vuorela et al. 1997; Demir et al. 2004).
34
Figure 1. Development of spiral arteries during vasculogenesis. Red-Horse, K., Kapidzic, M., Zhou, Y., Feng, K.T., Singh, H. and Fisher, S.J. (2005) 'EPHB4 regulates chemokine-evoked trophoblast responses: a mechanism for incorporating the human placenta into the maternal circulation', Development, 132(18), 4097-106. Reproduced with permission from Development, available: http://dx.doi.org/10.1242/dev.01971.
35
Figure 2. Representation of a chorionic villus and intervillous space. Zeldovich, V.B., Robbins, J.R., Kapidzic, M., Lauer, P. and Bakardjiev, A.I. (2011) ‘Invasive extravillous trophoblasts restrict intracellular growth and spread of Listeria monocytogenes', PLoS Pathog, 7(3), e1002005, available: http://dx.doi.org/ 10.1371/journal.ppat.1002005.

36
From day 21, de novo formation of fetoplacental blood vessels occurs, via vasculogenesis
(Risau and Flamme 1995; Kingdom et al. 2000; Kaufmann et al. 2004). The process of
vasculogenesis involves formation of endothelial tubes from haemangiogenic cords, by
focal enlargement of centrally located intercellular clefts which later fuse to form larger
lumina. This leads to resulting segments of capillaries which vascularise the villi,
classifying them as tertiary villi, containing trophoblast, mesoderm and blood vessels
(Demir et al. 1989; Kingdom et al. 2000; Kaufmann et al. 2004). By day 28 post
conception, the former haemoangiogenic cords of most villi show long lumina with
flattening of surrounding endothelial cells (Kaufmann et al. 2004). Connection between
the forming capillaries and the embryonic circulation occurs by day 35 post conception
as villous capillaries fuse with each other and larger allantoic vessels in the early
umbilical cord, finally establishing the connection between embryonic and placental
vascular beds and forming the primitive fetoplacental capillary network (Downs et al.
1998; Kaufmann et al. 2004). From this stage, formation of capillary networks continues
via angiogenesis (Castellucci et al. 2000; Pratt et al. 2015), with elongation of existing
tubes by non-branching angiogenesis, and branching of these tubes via sprouting
angiogenesis, which progresses until week 25 post conception (Kaufmann et al. 2004).
At this stage, peripheral capillary webs undergo vascular remodelling and regression and
central stem vessel formation predominates until week 32 post conception (Kaufmann
et al. 2004). Formation of terminal capillary loops by non-branching angiogenesis occurs
from week 25 until term (Kaufmann et al. 2004). In vitro experiments have shown that
expression of PlGF and sFlt-1 increase towards term, coinciding with the process of
branching angiogenesis being increasingly replaced by non-branching angiogenesis
(Clark et al. 1998a; Kumazaki et al. 2002).
1.2.2.3 Normal transformation of spiral arterioles
The uteroplacental circulation is established by cytotrophoblasts that leave the placenta
and invade the uterine wall. These cells start out at the tips of placental anchoring villi,
and migrate to form aggregates of cells, attached at one end to the placenta and at the
other end to the uterus (Red-Horse et al. 2005; Fisher 2015) (Figure 1).

37
Figure 3. Failure of physiological transformation of the spiral arteries is implicated in preeclampsia. Moffett-King, A. (2002) 'Natural killer cells and pregnancy', Nat Rev Immunol, 2(9), 656-63, available: http://dx.doi.org/10.1038/nri886.
Remodelling of spiral artery to supply low pressure, high volume blood flow
Partially remodelled spiral artery supplies pulsatile, high pressure, low volume flow causing placental stress

38
These invasive cytotrophoblasts breach uterine blood vessels, connecting both maternal
arterial and venous circulation to the intervillous space. Once this connection is made,
cytotrophoblasts migrate up the maternal spiral arterioles and replace the maternal
endothelial lining of the vessels and part of their muscular walls. This results in
progressive distension of the arterioles and thinning of their walls, resulting in loss of
the arterial structure altogether in some segments (Pijnenborg et al. 1983; Moffett-King
2002) (Figure 3).
This process extends as far as the decidual and inner third of the myometrial segments
of these vessels (Fisher 2015). The spiral arteries hence transform from narrow calibre,
high resistance to large calibre, low resistance vessels resulting in increased delivery of
blood flow at reduced velocity to the intervillous space, allowing optimal perfusion of
the placenta (Brosens et al. 1972; Burton and Tham 1992; Pijnenborg et al. 2011). In
comparison to the arterial system, once linked at the maternal-fetal interface, maternal
venous remodelling does not progress any further, limited to the extent required to
enable venous blood return (Fisher 2015).
1.2.2.4 Preeclampsia – a two stage disorder
The exact pathogenesis of preeclampsia is not entirely understood (Dekker and Sibai
2001; Redman and Sargent 2003; Lam et al. 2005; Sibai et al. 2005; Grill et al. 2009;
Wang 2009; Steegers et al. 2010; Staff et al. 2013a; Warrington et al. 2013;
Chaiworapongsa et al. 2014b; Rasmussen et al. 2015; Ngene and Moodley 2018), but is
strongly associated with deficient uterine invasion by endovascular trophoblasts and
incomplete remodelling of the uteroplacental spiral arteries during early pregnancy
(Brosens et al. 1972; Pijnenborg et al. 2006; Pijnenborg et al. 2011; Lyall et al. 2013).
Invasion and transformation of the uterine spiral arteries from small-calibre resistance
vessels into high-calibre capacitance vessels makes the placental blood supply capable
of matching placental perfusion with needs of the growing fetus. During early
pregnancy, hypoxic conditions are required to stimulate placental blood vessel
formation. Until 10 weeks gestation, the embryo lives within a hypoxic environment
with nutrients derived from endometrial glands (Burton et al. 2010). Throughout this
time the oxygen tension of the trophoblast has been shown to be far lower than after

39
STAGE 1 8-18 weeks
STAGE 2 >20 weeks
Figure 4. A model of pathogenesis and subclassification of preeclampsia types. Staff, A.C., Benton, S.J., von Dadelszen, P., Roberts, J.M., Taylor, R.N., Powers, R.W., Charnock-Jones, D.S. and Redman, C.W. (2013a) 'Redefining preeclampsia using placenta-derived biomarkers', Hypertension, 61(5), 932-42, available: http://dx.doi.org/10.1161/hypertensionaha.111.00250.

40
the spiral arteries open and perfuse the intervillous space (Rodesch et al. 1992). It has
been demonstrated that hypoxia-mediated angiogenesis during early pregnancy may
have an important role in placental development (Shweiki et al. 1992; Wheeler et al.
1995). However, prolonged or oxidative stress leads to poor placental perfusion, which
underlies the pathogenesis of preeclampsia (Sankar et al. 2013).
From what we currently understand, preeclampsia is considered a two-stage disorder
(Figure 4) (Roberts 2000; Lam et al. 2005; Levine and Karumanchi 2005; Redman and
Sargent 2009; Roberts and Hubel 2009; Steegers et al. 2010; Staff et al. 2013a; Redman
et al. 2014):
Stage 1 involves deficient placentation, with impaired trophoblast invasion and
remodelling of maternal spiral arteries during early gestation.
Stage 2 ultimately stems from structural deficiency of the spiral arteries preventing the
establishment of normal blood flow patterns to the intervillous space. Consequently,
there is decreased placental perfusion, with resulting placental damage, ischaemia and
ischaemia-reperfusion injury (Burton and Jauniaux 2004; Burton et al. 2010; Ilekis et al.
2016). This generates placental oxidative stress (Burton and Jauniaux 2004; Redman and
Sargent 2009; Redman et al. 2014), which directly affects the syncytiotrophoblast (STB)
layer covering the entire surface of the villous tree (Burton and Jauniaux 2004) (Figure
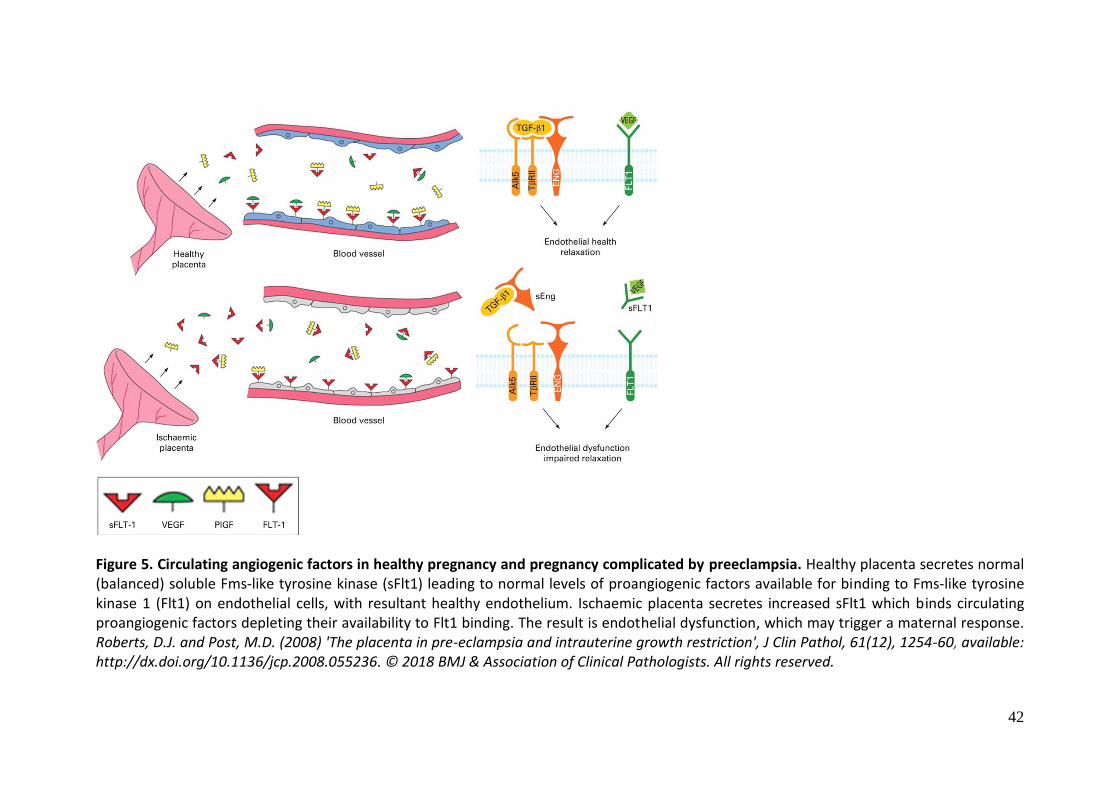
1). Consequently, there is an increased release of anti-angiogenic soluble Fms-like
tyrosine kinase-1 (sFlt1), and a decreased release of pro-angiogenic factors such as PlGF
from the placenta into the maternal circulation (Maynard et al. 2003; Levine 2004; Lam
et al. 2005; Roberts and Post 2008; Lapaire et al. 2010; Redman et al. 2014). sFlt1
additionally blocks the effects of free PlGF in the maternal circulation, preventing the
normal interaction of PlGF with endothelial cells. This creates an anti-angiogenic state
(Maynard et al. 2003; Redman and Sargent 2005; Roberts and Post 2008) (Figure 5).
These first two steps can be considered an initial placental “trigger” for the development
of preeclampsia (Redman and Sargent 2009). Systemic maternal endothelial cell
dysfunction resulting from the release of placental biomarkers may then lead to the

41
maternal syndrome of preeclampsia (Redman and Sargent 2009; Redman and Sargent
2010; Redman et al. 2014). Not all women with the potential
placental triggers develop maternal symptoms of preeclampsia, and though the reasons
for this have not been completely established (Walker 2000; Redman and Sargent 2005;
Sibai et al. 2005; Roberts and Hubel 2009), it appears that the maternal response to such
triggers are necessary for development of systemic disease (Walker 2000).
Early onset preeclampsia, requiring delivery prior to 34 weeks gestation, can be
associated with multisystemic involvement (Sibai et al. 2003; Sibai et al. 2005), a higher
frequency of neonates with fetal growth restriction (Sibai et al. 2003), and placental
vascular lesions consistent with placental under perfusion (Salafia et al. 1995; Salafia et
al. 1998; Moldenhauer et al. 2003). Late onset preeclampsia, requiring delivery at or
beyond 37 weeks gestation, is associated with more favourable neonatal outcomes than
preterm preeclampsia, requiring delivery prior to 37 weeks gestation (Sibai 2003). In
recent years, emerging knowledge supports the theory that early onset preeclampsia is
a different entity to term preeclampsia, with an entirely different pathophysiology (von
Dadelszen et al. 2003; Steegers et al. 2010; Staff et al. 2013a; Redman et al. 2014; von
Dadelszen and Magee 2014). It appears that deficient placentation is the main
mechanism behind early onset preeclampsia, also described as “placental
preeclampsia”, leading to inadequate placental perfusion and resultant release of
placental factors into the maternal circulation. The resulting maternal inflammatory
response to these factors culminates in the maternal syndrome of preeclampsia
(Roberts et al. 1989; Redman et al. 1999; Redman and Sargent 2005; Burton et al. 2009;
Staff et al. 2013a; Redman et al. 2014). Late onset preeclampsia, also described as
“maternal preeclampsia” may be characterised by predisposing maternal medical
conditions such as diabetes, obesity or autoimmune conditions. Such conditions may
increase maternal susceptibility to endothelial dysfunction and the clinical phenotype of
preeclampsia as a maternal response to factors released from a normal placenta (Ness
and Roberts 1996; Redman and Sargent 2005; Roberts and Hubel 2009; Staff et al.
2013a). Late onset preeclampsia may also be characterised by placental villous
overcrowding which can occur in any pregnancy with advancing gestation, often
associated with placental post-maturity.
42
Figure 5. Circulating angiogenic factors in healthy pregnancy and pregnancy complicated by preeclampsia. Healthy placenta secretes normal (balanced) soluble Fms-like tyrosine kinase (sFlt1) leading to normal levels of proangiogenic factors available for binding to Fms-like tyrosine kinase 1 (Flt1) on endothelial cells, with resultant healthy endothelium. Ischaemic placenta secretes increased sFlt1 which binds circulating proangiogenic factors depleting their availability to Flt1 binding. The result is endothelial dysfunction, which may trigger a maternal response. Roberts, D.J. and Post, M.D. (2008) 'The placenta in pre-eclampsia and intrauterine growth restriction', J Clin Pathol, 61(12), 1254-60, available: http://dx.doi.org/10.1136/jcp.2008.055236. © 2018 BMJ & Association of Clinical Pathologists. All rights reserved.

43
The aetiology of preeclampsia due to villous overcrowding then aligns with “placental
preeclampsia” described earlier (Redman et al. 2014). Of course, there are no methods
of distinguishing these different pathologies antenatally, and there can be overlap
across the spectrum. Ultimately, the clinical phenotype of preeclampsia is dependent
on the maternal response to these placental processes, which is dependent on different
individual thresholds to mount a response against effects of placental pathology and the
presence of potential predisposing maternal factors, with or without released circulating
placental factors (Levine and Karumanchi 2005; Redman and Sargent 2005; Redman et
al. 2014). Though late onset preeclampsia is often less severe than early onset, the
majority of cases of preeclampsia occur at or near term (Hauth et al. 2000) and these
cases constitute the bulk of the disease burden, hence accounting for a substantial
proportion of severe maternal morbidity (Sibai et al. 1993; Staff et al. 2013a) and
encompassing the majority of cases of eclampsia (Douglas and Redman 1994; Kenneth
et al. 2010). Hence the identification of predictors of both early and late preeclampsia
are clinically important. Patients who develop early onset preeclampsia have the
potential for significant maternal and perinatal morbidity and mortality (Dekker and
Sibai 2001; Sibai et al. 2003; Sibai 2003), as well as considerable healthcare expenditure
(Schnettler et al. 2013).
1.2.3 Current management
Currently, assessment and management of preeclampsia follows expert opinion-
based guidelines, which perform poorly as predictors of maternal and perinatal
outcomes. Women are often initially hospitalised until a diagnosis is established, for
close observation and monitoring with consecutive laboratory investigations and tests
of fetal wellbeing. The time frame between the first detection of hypertension and
proteinuria and the subsequent development of complications is largely unpredictable,
and women with a confirmed diagnosis warrant close monitoring until delivery (Lowe et
al. 2015). Currently the only known cure for preeclampsia is delivery of the
fetus and placenta. Whilst there have been significant advances in recent
years with regard to methods for detecting preeclampsia, from both a screening
(O'Gorman et al. 2016; O'Gorman et al. 2017) and diagnostic (Chappell et al. 2013;
Zeisler et al. 2016a) point of view, effective treatment, other than delivery, awaits
44
discovery. The lack of available interventions reflects the complexity of the disorder,
with multiple potential pathological processes resulting in lack of certainty regarding the
exact underlying pathophysiology of preeclampsia (Lam et al. 2005; Sibai 2005; Grill et
al. 2009; Wang A 2009; Steegers et al. 2010; Staff et al. 2013a; Warrington et al. 2013;
Chaiworapongsa et al. 2014b; Rasmussen et al. 2015; Ngene and Moodley 2018).
1.2.4 Preventative therapies
Prophylactic therapies for preeclampsia have been studied extensively. Moderate
benefits in outcomes have been reported in some studies. The outcome of a Cochrane
review (Duley et al. 2007) looking at antiplatelet agents for preventing preeclampsia and
its complications included 47 trials (32,891 patients) and confirmed a relative risk for
preeclampsia of 0.83 (95% confidence interval 0.77-0.89) in patients treated with
aspirin, which translated to a number needed to treat (NNT) of 72 patients to prevent
one case of preeclampsia. A subsequent meta-analysis performed by the Perinatal
Antiplatelet Review of International Studies (PARIS) group reported similar findings
(Askie et al. 2007). They included 31 randomised trials, with a total of 32,217 women
recruited in total. They reported a relative risk for preeclampsia of 0.90 (95% confidence
interval 0.84-0.97) and relative risk of having a pregnancy with a serious adverse
outcome was 0.90 (0.85-0.96). Both of these studies confirmed a significant reduction
in rates of preterm birth in women taking aspirin. A further meta-analysis by Bujold 2010
(Bujold et al. 2010) included 34 randomised trials including 11,348 women, and
confirmed that when commenced prior to 16 weeks gestation, aspirin gave a relative
risk of 0.47 (95% confidence intervals 0.34-0.65), compared with a relative risk of 0.81
(95% confidence intervals 0.63-1.03) when commenced later than 16 weeks gestation.
A significant decrease in severe preeclampsia, gestational hypertension and preterm
birth was also observed in those women that commenced aspirin prior to 16 weeks
(Duley et al. 2007; Bujold et al. 2010; Roberge et al. 2012). These findings were further
confirmed in another meta-analysis in 2013 (Roberge et al. 2013), comparing the effects
of early and late administration of low dose aspirin on the risk of perinatal death and a
range of adverse perinatal outcomes. This meta-analysis included 42 studies (27,222
women) and reported a greater reduction in preeclampsia in women who commenced
45
aspirin before or at 16 weeks gestation when compared with those who commenced
aspirin beyond 16 weeks. Relative risks for development of preeclampsia and severe
preeclampsia in those who commenced therapy prior to or at 16 weeks were 0.47 (95%
confidence intervals 0.36-0.62) and 0.18 (95% confidence intervals 0.08-0.41),
respectively, compared with 0.78 (95% confidence interval 0.61-0.99) and 0.65 (95%
confidence interval 0.0.40-1.07), respectively, in women who commenced aspirin after
16 weeks. They also confirmed significant reductions in perinatal death, fetal growth
restriction and preterm birth in women taking low dose aspirin, with those commencing
treatment prior to 16 weeks having the most significant reductions. The same group
went on to perform a further meta-analysis in 2017 investigating more specifically the
impact of aspirin dosage on preeclampsia risk (Roberge et al. 2017). In one of these
studies, the risk reduction was only applicable to preterm, not term, preeclampsia
(Roberge et al. 2012). Studies included in these analyses used aspirin doses varying
between 50 and 150mg/day. Previously, randomised control trials (Collaborative Low-
dose Aspirin Study in Pregnancy 1994; Caritis et al. 1998) did not support the routine
prophylactic administration of low dose aspirin in pregnancy to high risk women. Each
of these trials used relatively low doses of aspirin (60mg), with relatively advanced mean
gestation at enrolment, ranging between 18 and 22 weeks gestation (Collaborative Low-
dose Aspirin Study in Pregnancy 1994; ECPPA 1996; Caritis et al. 1998). By this stage,
placental development is essentially complete, with little scope for optimisation, which
needs to be taken into consideration when interpreting findings reported from these
earlier studies. Overall, there was considerable heterogeneity within the studies
performed in this area, with significant variations in definitions of preeclampsia, aspirin
doses administered, gestation of commencement and cessation of therapy and
populations studied. Similarly, in low risk pregnancies, previous studies (Golding 1998)
have reported no difference in the prevalence of preeclampsia or eclampsia between
women that took aspirin when compared with controls. As with the previously
mentioned randomised control trials, the dose of aspirin used in this trial was 60mg, and
mean gestation at enrolment was between 15 and 20 weeks. Compliance was listed as
a significant limitation of this study. A very recent systematic review (Roberge et al.
2018) included 18,907 participants with preterm and term preeclampsia and confirmed
a reduction in risk of preterm preeclampsia (RR 0.62, 95% confidence intervals 0.45-

46
0.87) and no significant effect on term preeclampsia (RR 0.92, 95% confidence intervals
0.70-1.21). This reduction in preterm preeclampsia occurred when aspirin was
commenced prior to 16 weeks gestation and at a daily dose of at least 100mg daily (RR
0.33, 95% confidence intervals 0.19-0.57). They concluded that aspirin reduces the risk
of preterm preeclampsia, but not term preeclampsia, and only if commenced prior to
16 weeks gestation at a dose of at least 100mg daily (Roberge et al. 2018). These findings
go a long way towards explaining why the previous relatively low doses of aspirin used
in older studies, when commenced at later gestations, did not demonstrate any
appreciable effect. The current accepted knowledge of abnormal placentation and its
role in the pathogenesis of preeclampsia, particularly at the key time of placental
development prior to 18 weeks gestation is consistent with the findings of these more
recent studies showing aspirin to have a greater prophylactic effect if commenced
earlier in pregnancy.
Very recently, the results of these older randomised control trials have been challenged
by a randomised control comparing aspirin with placebo in pregnancies at high risk of
preterm preeclampsia (Rolnik et al. 2017). This study used a multivariable logistic model
to screen for preeclampsia risk in early pregnancy, then randomised women to
treatment with aspirin or placebo. Results showed that preterm preeclampsia was
significantly less common in women identified to be high risk for preeclampsia who then
commenced aspirin (adjusted OR 0.38, 95% confidence interval 0.20 to 0.74, P=0.004),
with no significant difference in term preeclampsia. This trial differed from previous
randomised control trials in this area on several major fronts. Firstly, the dose of aspirin
used was 150mg, which is much higher than the 60mg used in older trials and was
administered at night. Secondly, the median gestation at recruitment was 12 weeks,
which is much earlier than the mean gestation at recruitment for the older trials. Thirdly,
women were identified as high risk for preterm preeclampsia based on combined
screening with maternal factors and biomarkers, a strategy that has been recently
shown to be more accurate at predicting preterm preeclampsia in the first trimester
compared with previously utilised methods (National Institute for Health and Clinical
Excellence 2010; American College of Obstetricians and Gynecologists 2013; O'Gorman

47
et al. 2016; O'Gorman et al. 2017). Based on this recent trial, aspirin at a dose 150mg
per day is advised in women deemed high risk for preeclampsia and should be
commenced between 11-14 weeks gestation (Rolnik et al. 2017).
Calcium supplementation has been shown to be an effective prophylactic agent for the
development of preeclampsia, according to a Cochrane Review (Hofmeyr et al. 2014).
Calcium administered at a dose of ≥1g/day showed a significant reduction in the risk of
preeclampsia according to 13 studies (15,730 women), with women who took calcium
supplementation having a relative risk of 0.45 for the development of preeclampsia
(95% confidence interval 0.31–0.65). Women with calcium deficient diets appeared to
benefit most from prophylactic calcium administration, according to eight trials (10,678
women), with a relative risk of 0.36, 95% confidence interval 0.20 to 0.65; as did women
at high risk of preeclampsia, according to five trials (587 women), with a relative risk of
0.22, 95% confidence interval 0.12-0.42.
Use of antioxidants Vitamin C and E have been explored to determine their efficacy in
the prevention of preeclampsia. A randomised control trial (Chappell et al. 1999)
involving women at high risk for preeclampsia showed that supplementation with
Vitamin C and E reduced the rate of preeclampsia compared with placebo (8% vs 17%,
OR 0.39) however Vitamin C and E were associated with worse perinatal outcomes, with
earlier mean delivery and reduced mean birthweight. A further randomised trial (Poston
et al. 2006) showed the incidence of preeclampsia was similar in treatment and placebo
groups (15% vs 16%, RR 0.97), with more low birth weight babies born to women in the
treatment group (28% vs 24%, RR 1.15), refuting the hypothesis that Vitamin C and E
prophylaxis from the second trimester reduces rates of preeclampsia in women at risk.
Based on these results, Vitamin C and E at these doses are contraindicated for
prevention of preeclampsia. A further randomised trial (Spinnato et al. 2007) showed
that antioxidant supplementation did not demonstrate a benefit in reducing the rate of
preeclampsia among high risk patients, and it was concluded that further studies in this
area were not warranted.

48
Folic acid supplementation has been previously shown to reduce rates of preeclampsia,
presumably by improving placental and systemic endothelial function and lowering
blood homocysteine levels. Plasma or serum homocysteine levels are strongly
associated with folate intake, with increased homocysteine levels associated with lower
folic acid intake (Wen et al. 2008). A large cohort study (Wen et al. 2016) confirmed that
supplementation of multivitamins containing folic acid was associated with a lower rate
of preeclampsia, and the results were statistically significant among women at high risk
for preeclampsia. This finding was consistent with previous studies (Hernandez-Diaz et
al. 2002; Bodnar et al. 2006). Extrapolating from this, risks for preeclampsia have been
shown to be greater among women taking folic acid antagonists (Wen et al. 2008).
Limitations of these studies include the fact that non-supplementation these days is
rare, which introduces confounding that is difficult to control in the absence of a
randomised control trial. Hence the results of the Folic Acid Clinical Trial (FACT) study
(Wen et al. 2013) are eagerly awaited, to ultimately prove or disprove the effect of folic
acid supplementation on preeclampsia.
It must be appreciated that trials of preventative agents have been performed in
populations who may not have been appropriately determined to be high risk for
preeclampsia, due to limitations with traditional methods of preeclampsia screening.
Most patients recruited have been determined to be at high risk of preeclampsia based
on past history and maternal factors. As previously discussed, risk stratification by these
means alone is poorly predictive of preeclampsia. Until patients at risk of preeclampsia
are able to reliably be detected, our scope for ascertaining the potential benefit of
prophylactic agents in a correctly identified high risk population is limited. The ability to
identify populations at high risk for preeclampsia, by use of sensitive and specific
screening protocols would improve the clinical validity of future trials involving
prophylactic agents. In addition, such accurate risk stratification would allow for
optimisation of the model of pregnancy care and location of antenatal care, reserving
limited tertiary resources for those at greatest risk of early onset preeclampsia.

49
1.2.5 The principles of screening and their applicability to preeclampsia
Screening tests are designed to detect early evidence of an abnormality to allow
preventative strategies or treatment to be implemented to improve the clinical
outcomes compared with diagnosing the disease at a later stage. Prior to
implementation of a population-based screening program, a range of criteria involving
evidence behind benefits, risks and costs need to be addressed and approved (Wilson
and Jungner 1968). The criteria that should be fulfilled to warrant population-based
screening for a particular medical condition were first determined in 1968 (Wilson and
Jungner 1968) and have remained essentially unchanged since then (Wilson and Jungner
1968) (Table 1).
Preeclampsia as a medical condition is yet to fulfill several of the necessary criteria to
warrant routine predictive testing. The pathophysiology behind this extremely complex
disease process is still incompletely understood. There are limited available testing
strategies (Lees 2010; Cuckle et al. 2013) that are recommended in everyday clinical
practice (Meads et al. 2008; Henderson et al. 2017; Brown et al. 2018) and as discussed
in section 1.2.4, there are extremely few prophylactic interventions that have proven to
be effective. At this stage, there is no accepted treatment for preeclampsia available
except for delivery of the fetus and placenta. Many studies in the literature relating to
preeclampsia have shown great heterogeneity as there has been no accurate way to
target a high-risk group for the development of this condition. Effective screening for
preeclampsia is paramount to the progression of knowledge in this field. Once such
screening for the condition is available, studies specifically targeting patients at high risk
of developing preeclampsia and potentially trialling different prophylactic and
therapeutic agents can be designed. Such studies would be expected to significantly
advance the current understanding of pathophysiology and management for this
disease. Such advances in understanding of this disease will hopefully then translate to
improved management protocols and optimisation of patient outcomes.

50
Condition The condition sought should be an important health problem
There should be a recognisable latent or early symptomatic stage
The natural history of the condition, including development from latent to declared disease, should be adequately
understood
Test There should be a suitable test or examination
The test should be acceptable to the population
Treatment There should be an accepted treatment for patients with recognisable disease
Screening
program
Facilities for diagnosis and treatment should be available
There should be an agreed policy on whom to treat as patients
The cost of case-finding (including diagnosis and treatment of patients diagnosed) should be economically balanced in
relation to possible expenditure on medical care as a whole
Case-finding should be a continuing process and not a ‘once and for all’ project
Table 1. WHO Principles of screening. Wilson JMG, Jungner G. Principles and practice of screening for disease. Geneva: World Health Organization; 1968.

51
Recommendations for or against population screening are influenced by the relative
strength of available evidence relating to these criteria. It is paramount that there is
sufficient evidence from well-conducted studies, preferably randomised trials, that early
detection improves clinical outcomes, and that benefits of screening outweigh any
potential harms, prior to implementing such testing into clinical practice. Ethically,
screening that is initiated by medical professionals leads to the presumption within the
general community that this test must be beneficial. Currently, regarding preeclampsia,
the only known curative treatment is delivery of the fetus and placenta. Though
initiation of aspirin prior to 16 weeks gestation in patients at high risk for developing
preeclampsia has been confirmed to lower the incidence of preeclampsia (Rolnik et al.
2017), other preventative strategies such as dietary interventions and antioxidant
therapies have not proven beneficial (Chappell et al. 1999; Poston et al. 2006; Spinnato
et al. 2007). Taking these factors into account, we are yet to clearly define the clinical
utility of placental biomarkers for prediction of preeclampsia.
1.2.5.1 Justification for preeclampsia screening at midpregnancy
The reason that the second trimester of pregnancy was chosen as the gestation for
screening for the purpose of this study, and more specifically, between 18 and 22 weeks
gestation, is that this is the average gestation at which patients at the Royal Women’s
Hospital attend their pregnancy booking visit and second trimester morphology scan,
creating a convenient opportunity for screening. Current available evidence indicates
that screening for preeclampsia during the second trimester may appear inferior to
screening during the first trimester as the window of opportunity to
administer aspirin to women considered high risk for preeclampsia will have closed
(Roberge et al. 2012; Rolnik et al. 2017). However, a significant number of patients, for
a variety of reasons, will encounter antenatal care for the first time later than 16 weeks
gestation, and screening at this stage would still be useful, at the very least to avoid
unnecessary interventions in low risk women. How could successful screening for
preeclampsia at midpregnancy improve current management? Currently, though
abnormal placentation occurs within the first 6 to 18 weeks of pregnancy, symptoms of
preeclampsia do not tend to arise until many weeks later, in the late second or third
trimester.
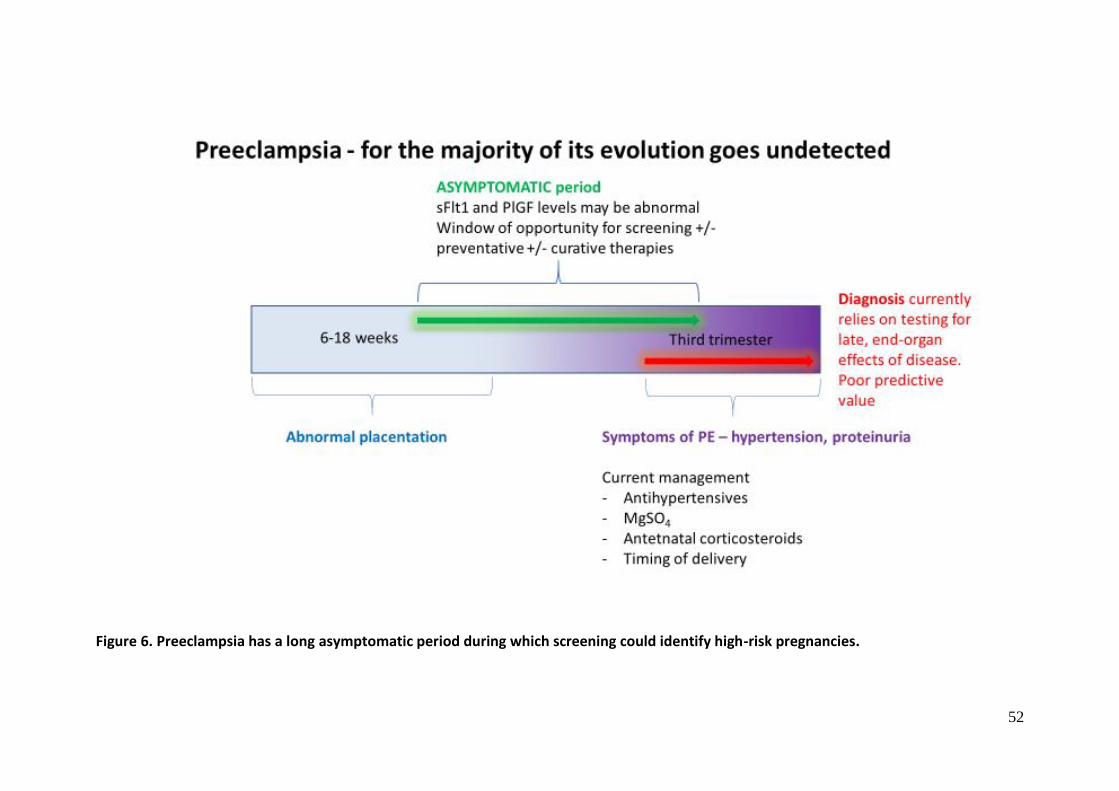
52
Figure 6. Preeclampsia has a long asymptomatic period during which screening could identify high-risk pregnancies.
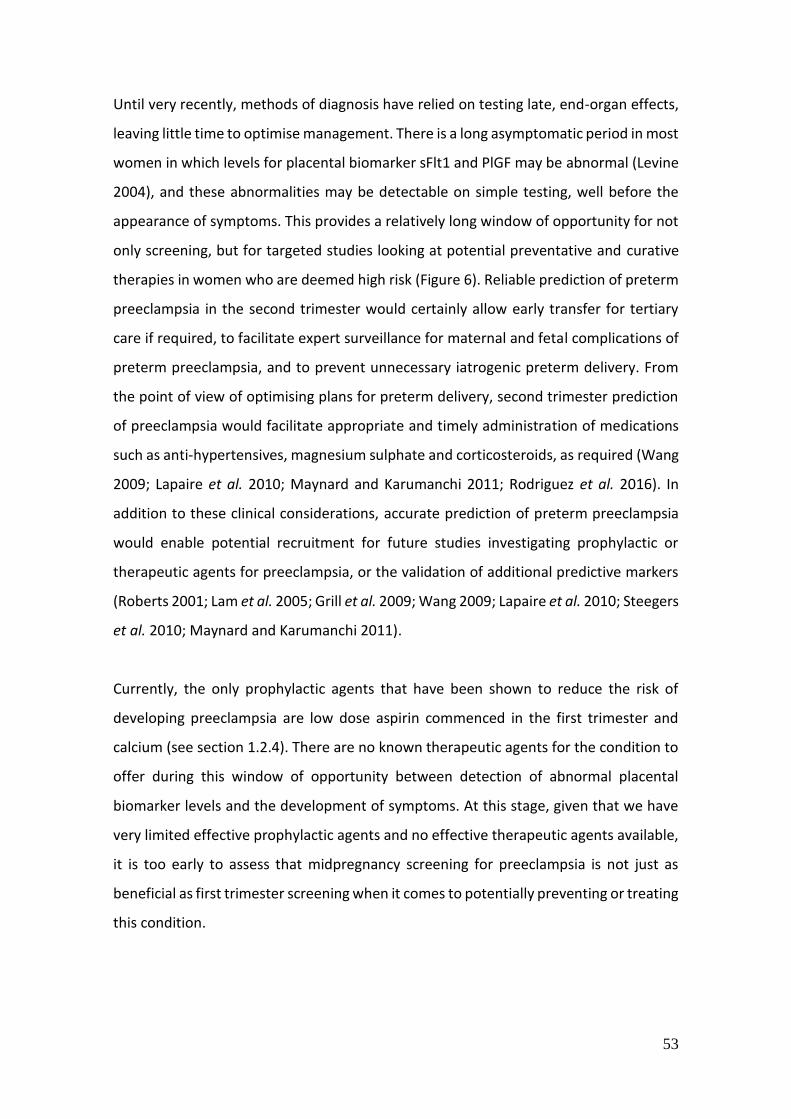
53
Until very recently, methods of diagnosis have relied on testing late, end-organ effects,
leaving little time to optimise management. There is a long asymptomatic period in most
women in which levels for placental biomarker sFlt1 and PlGF may be abnormal (Levine
2004), and these abnormalities may be detectable on simple testing, well before the
appearance of symptoms. This provides a relatively long window of opportunity for not
only screening, but for targeted studies looking at potential preventative and curative
therapies in women who are deemed high risk (Figure 6). Reliable prediction of preterm
preeclampsia in the second trimester would certainly allow early transfer for tertiary
care if required, to facilitate expert surveillance for maternal and fetal complications of
preterm preeclampsia, and to prevent unnecessary iatrogenic preterm delivery. From
the point of view of optimising plans for preterm delivery, second trimester prediction
of preeclampsia would facilitate appropriate and timely administration of medications
such as anti-hypertensives, magnesium sulphate and corticosteroids, as required (Wang
2009; Lapaire et al. 2010; Maynard and Karumanchi 2011; Rodriguez et al. 2016). In
addition to these clinical considerations, accurate prediction of preterm preeclampsia
would enable potential recruitment for future studies investigating prophylactic or
therapeutic agents for preeclampsia, or the validation of additional predictive markers
(Roberts 2001; Lam et al. 2005; Grill et al. 2009; Wang 2009; Lapaire et al. 2010; Steegers
et al. 2010; Maynard and Karumanchi 2011).
Currently, the only prophylactic agents that have been shown to reduce the risk of
developing preeclampsia are low dose aspirin commenced in the first trimester and
calcium (see section 1.2.4). There are no known therapeutic agents for the condition to
offer during this window of opportunity between detection of abnormal placental
biomarker levels and the development of symptoms. At this stage, given that we have
very limited effective prophylactic agents and no effective therapeutic agents available,
it is too early to assess that midpregnancy screening for preeclampsia is not just as
beneficial as first trimester screening when it comes to potentially preventing or treating
this condition.

54
1.2.6 Current screening strategies for preeclampsia
At this stage, no single screening test has been validated to predict maternal risk of
preeclampsia with sensitivity and specificity great enough to be useful in everyday
clinical practice (Conde-Agudelo et al. 2004; Meads et al. 2008; Henderson et al. 2017;
Brown et al. 2018). Comparisons between screening strategies for preeclampsia based
on studies in the literature can be difficult to make, given that many studies differ
significantly across multiple parameters. These include methods tested, the a priori risk
of the target group, classification and diagnostic criteria for preeclampsia and different
gestations at which screening is undertaken (Kane et al. 2014). Each of these variations
to different study protocols can directly affect results obtained and inferences drawn,
with consequent difficulty forming definitive conclusions. The following sections outline
potential components that may be used in midpregnancy screening for preeclampsia
and will be referred to in subsequent chapters.
1.2.7 Maternal Factors
Traditionally, preeclampsia screening has been based on identifying risk factors from
maternal demographic characteristics and medical and obstetric history, collectively
referred to as “maternal factors” (National Institute for Health and Clinical Excellence
2010; American College of Obstetricians and Gynecologists 2013). Published guidelines
using these traditional methods, whilst inexpensive and not requiring specific resources
to undertake, have been shown to have poor detection rates or high false positive rates,
with low positive predictive values (Poon et al. 2010b; North et al. 2011; Verghese et al.
2012). The NICE guidelines and PRECOG guidelines, both arising from the United
Kingdom, are each based on systematic reviews of risk factors for preeclampsia to
identify mothers at risk of developing the disease when screened prior to 20 weeks
gestation. A study evaluating the predictive performance of these guidelines (Verghese
et al. 2012) reported sensitivity of 77% (95% CI 65-87%) for the NICE guideline and 59%
(95% CI 46-71%) for the PRECOG guideline, respectively, with specificities of 54% (95%
CI 44-64%) and 81% (95% CI 73-88%), respectively. Positive predictive values were 7%
and 11%, respectively. It was concluded that neither guideline has a reasonable
performance and cannot be recommended for use in routine clinical practice (Verghese
et al. 2012). Another study evaluating the NICE guidelines and comparing their
55
performance with a multivariable prediction algorithm conferred a detection rate of
89.2% for early onset preeclampsia and 93% for late onset preeclampsia, however the
false positive rate was very high at 64.1% (Poon et al. 2010b). In other words, based on
these results, around two-thirds of women in this study have been falsely classified as
being at high risk for preeclampsia, and in need of increased surveillance. When the
maternal factors screened for in the NICE guidelines were combined into an algorithm
derived from multivariate analysis, they give detection rates of 37% for early onset
preeclampsia and 28.9% for late onset preeclampsia, for a 5% false positive rate (Poon
et al. 2010b). It was concluded that screening for preeclampsia using maternal history
necessitates use of multivariable algorithms in order to accurately derive the a priori risk
of preeclampsia (Poon et al. 2010b). Analysis of both the NICE and PRECOG guidelines
confirmed that a previous history of preeclampsia was the most discriminatory risk
factor, which greatly limits the applicability of such screening based on maternal factors,
as nulliparous women have the greatest incidence of preeclampsia. There is presently
no method to accurately stratify healthy nulliparous women according to their risk for
preeclampsia. The SCOPE (Screening for Pregnancy Endpoints) study, a prospective
multicentre study included healthy nulliparous women with the primary aim of
developing a predictive model to predict preeclampsia, among other pregnancy related
complications (North et al. 2011). 3529 women were included, of whom 186 (5.3%)
developed preeclampsia, with 47 (1.3%) developing preterm preeclampsia. The
algorithm showed moderate predictive performance and was shown to predict 37% and
61% of women for a 10% and 25% false positive rate, respectively and an AUC of 0.76.
The predictive performance of the algorithm was not significantly improved by addition
of uterine artery Doppler pulsatility index (AUC 0.77) (North et al. 2011). Despite using
an algorithm which was intended to determine a personalised clinical risk estimate for
preeclampsia, this study highlighted the limitations of screening using maternal factors
alone (North et al. 2011).
1.2.8 Mean Arterial Pressure
Mean arterial blood pressure, when measured during the first or second trimester, has
been shown to be a better predictor for preeclampsia than systolic blood pressure,
diastolic blood pressure or an increase in blood pressure (Cnossen et al. 2008b). Mean

56
arterial pressure (MAP) can be calculated using the simple formula MAP = [(2 x diastolic)
+ systolic] divided by 3. The National Heart Foundation of Australia has devised a
protocol for the accurate measurement of blood pressure (National Heart Foundation
of Australia 2016). A simpler protocol for the measurement of MAP has been identified
(Poon et al. 2012) that has been shown to achieve comparable performance in the
prediction of preeclampsia when compared to the NHFA protocol, using the average of
a minimum of two blood pressure measurements from each arm. This methodology
(Poon et al. 2012) was utilised for recording MAP readings for the purpose of this study.
1.2.9 Ultrasound parameters
Uterine artery doppler pulsatility index (UAPI) has been shown to accurately reflect
uterine blood flow and intervillous perfusion through recording blood velocity profiles
from the uterine vessels supplying the intervillous space (Campbell et al. 1983). In
normal pregnancies during the second trimester, these vessels have a unique profile,
with a high diastolic velocity and low pulsatility, reflective of a low-resistance vascular
system. In pregnancies complicated by preeclampsia, the profile of these vessels
changes to reflect moderately increased resistance, with an early diastolic “notch” and
reduced end-diastolic velocity (Campbell et al. 1983; Chaiworapongsa et al. 2014a)
(Figure 7). A meta-analysis undertaken in 2008 showed Doppler testing to be less
accurate in first trimester than in the second trimester (Cnossen et al. 2008a). In this
review, an increased pulsatility index with notching in the second trimester best
predicted overall preeclampsia in low risk and high-risk patients. Preeclampsia in low
risk patients was found to be best predicted by an increased pulsatility index and
diastolic notching in the second trimester, particularly greater than 16 weeks gestation
(LR 7.5, 95% confidence interval 5.4-10.2). Severe preeclampsia in low risk patients was
best predicted in the second trimester by an increased pulsatility index, with sensitivity
78% and specificity 95% (LR 15.6, 95% confidence interval 13.3-17.3) and bilateral
notching (LR 13.4, 95% confidence interval 8.5-17.4). Among high-risk patients,
preeclampsia was best predicted in the second trimester by unilateral notching (LR 20.2,
95% confidence interval 7.5-29.5) and an increased PI with notching (LR 21, 95%
confidence interval 5.5-80.5).
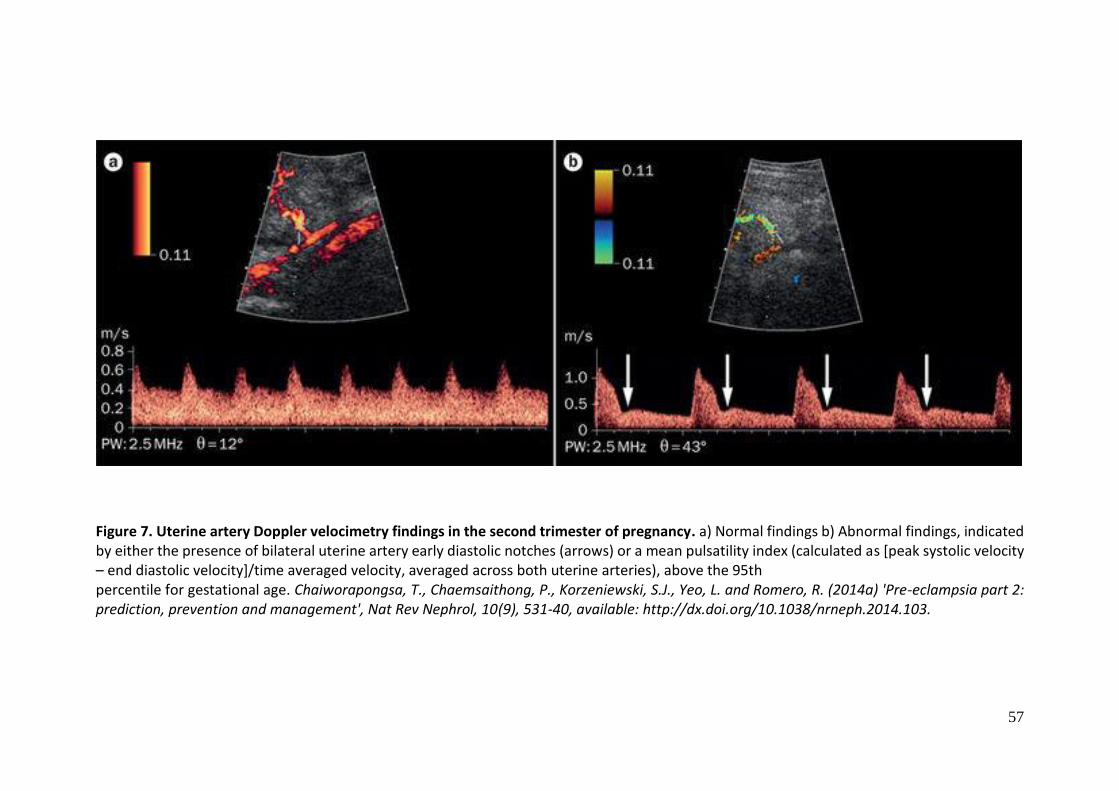
57
Figure 7. Uterine artery Doppler velocimetry findings in the second trimester of pregnancy. a) Normal findings b) Abnormal findings, indicated by either the presence of bilateral uterine artery early diastolic notches (arrows) or a mean pulsatility index (calculated as [peak systolic velocity – end diastolic velocity]/time averaged velocity, averaged across both uterine arteries), above the 95th percentile for gestational age. Chaiworapongsa, T., Chaemsaithong, P., Korzeniewski, S.J., Yeo, L. and Romero, R. (2014a) 'Pre-eclampsia part 2: prediction, prevention and management', Nat Rev Nephrol, 10(9), 531-40, available: http://dx.doi.org/10.1038/nrneph.2014.103.

58
These results are based mainly on single studies or small numbers of women. More
recently, a meta-analysis of 18 studies (55,974 women) (Velauthar et al. 2014) looking
at first trimester uterine artery dopplers for the prediction of preeclampsia found an
overall sensitivity and specificity of first-trimester uterine artery Doppler in predicting
all cases of preeclampsia of 26.4% (95% confidence interval 22.5-30.8) and 93.4% (95%
confidence interval 90.9–95.1). Sensitivity and specificity in predicting early onset
preeclampsia were 47.8% (95% confidence interval 39.0-56.8) and 92.1% (95%
confidence interval 88.6-94.6) (Velauthar et al. 2014). This method proves to be highly
specific and moderately sensitive for predicting early onset preeclampsia, and
incorporation of this test into multivariable prediction models may further improve its
predictive ability (Onwudiwe et al. 2008). This method has the advantage of being non-
invasive and hence acceptable to patients. However, it is a specialised technique,
requiring specific equipment and operator expertise. This test would be relatively
straightforward to introduce in developed countries at the time of the routine
morphology scan, however its implementation in developing countries could prove
more challenging.
1.3 Placental Biomarkers
Within the last fifteen years, both angiogenic and anti-angiogenic factors of placental
origin have been shown to contribute to the development of preeclampsia. In 2003,
Maynard made very significant inroads towards our understanding of the role that
placental sFlt1 plays in the pathogenesis of preeclampsia (Maynard et al. 2003). Using
gene expression profiling of placental tissue from women with and without
preeclampsia, his group found sFlt1 mRNA to be upregulated in preeclamptic placentas.
They then confirmed that serum sFlt1 levels are significantly increased in women with
severe preeclampsia, and that both free VEGF and free PlGF were significantly decreased
in patients with preeclampsia, with the degree of decrease proportionate to the rise in
serum sFlt1 levels in these patients. They then demonstrated in vitro that excess
circulating sFlt1 in patients with preeclampsia causes endothelial dysfunction by
inhibiting endothelial tube formation, an established in vitro model of angiogenesis (see
section 1.2.2.2)
59
Next, they demonstrated that exogenous administration of sFlt1 to pregnant rats
induced hypertension and proteinuria, with lower doses of sFlt1 administered resulting
in milder phenotypes. Finally, they demonstrated renal pathologic findings in the rats
who received sFlt1 which resembled the classic findings seen on renal biopsies in human
preeclampsia, including glomerular endotheliosis (Maynard et al. 2003). These findings
have set the foundations for subsequent research, leading to the use of maternal serum
sFlt1 as a biomarker for the prediction of preeclampsia.
Subsequently, in another landmark study in this area (Levine 2004), serum PlGF and sFlt1
levels tested at 13-21 weeks, 26-29 weeks and 36 weeks or at the development of
symptoms of preeclampsia were altered in women with clinical preeclampsia. The sFlt1
level was found to change throughout gestation. In normal pregnancy, sFlt1 levels
remained constant until between 33 and 36 weeks gestation, then increased until term.
In women who subsequently developed preeclampsia, sFlt1 concentrations began to
rise between 21 and 24 weeks gestation, with a steeper increase between 29 and 32
weeks. sFlt1 concentrations were found to increase rapidly from 5 weeks prior to
symptom onset, with increases noted from between 9 and 11 weeks prior to symptoms.
PlGF was shown to increase through the first two trimesters, peak between 29 and 32
weeks and decrease thereafter. PlGF levels in patients who developed preeclampsia
were significantly lower than in controls from between 13 and 16 weeks gestation
onwards, with mean PlGF in patients who developed preeclampsia compared with
controls being 90pg/mL and 142pg/mL, respectively. Similar to sFlt1, PlGF levels
decreased substantially from 5 weeks prior to symptom onset, with decrease in levels
from up to 9 to 11 weeks prior to the onset of symptoms. Alterations in sFlt1 and PlGF
levels were more pronounced prior to the onset of preeclampsia in women with preterm
preeclampsia than term preeclampsia. sFlt1 and PlGF levels obtained prior to the onset
of preeclampsia in women who developed preeclampsia and SGA were also significantly
different from concentrations in women who had later preeclampsia without SGA.

60
These crucial developments have not only specified precise factors secreted by
oxidatively stressed syncytiotrophoblast but have led to the discovery of potentially
useful predictive and diagnostic biomarkers for preeclampsia (Poon et al. 2010a;
Chappell et al. 2013; Park et al. 2013; Redman et al. 2014; O'Gorman et al. 2016; Zeisler
et al. 2016a). Despite these advances, at present, there is no clinically useful prediction
model for the development of preeclampsia that is currently recommended
for use in everyday practice (Meads et al. 2008; Henderson et al. 2017; Brown et al.
2018).
1.3.1 Placental Growth Factor (PlGF)
Placental growth factor (PlGF) was first isolated from the human placenta in 1991
(Maglione et al. 1991). PlGF is a member of the vascular endothelial growth factor
(VEGF) family of angiogenic growth factors, which are important regulators of early
placental vascular changes. PlGF is structurally similar to VEGF-A, and in humans,
placental expression is reduced in women with preeclampsia compared with
normotensive pregnant women (Su et al. 2001; Tidwell et al. 2001; Tjoa et al. 2001;
Polliotti et al. 2003; Taylor et al. 2003; Bersinger and Odegard 2004; Levine 2004;
Thadhani et al. 2004; Madazli et al. 2005; Espinoza et al. 2007; Stepan et al. 2007; Unal
et al. 2007; Diab et al. 2008; Kusanovic et al. 2009; Wortelboer et al. 2010; Ghosh et al.
2012; Ghosh et al. 2013; Geralyn Lambert-Messerlian 2014; Shim et al. 2015). VEGF has
been shown to induce angiogenesis in vivo (Ferrara et al. 1991) and plays a central role
in regulating vascular growth (Shore et al. 1997).
Located on chromosome 14 of the human genome and consisting of seven exons
(Maglione et al. 1993), the PlGF gene is differentially expressed in cells and tissues and
is mainly specific to trophoblast cells (Shore et al. 1997). At least four isoforms for PlGF
have been identified, denoted as PlGF-1, PlGF-2, PlGF-3 and PlGF-4 (Maglione et al.
1993; Cao et al. 1997; Yang et al. 2003) (Figure 8). These isoforms are thought to arise
from alternative mRNA splicing of the PlGF primary transcript, with each isoform
displaying slightly different secretion properties and binding affinities (Ribatti 2008).
Whether the different PlGF isoforms demonstrate different biological activity is not
certain. PlGF-1 and PlGF-3 bind to the VEGFR-1 receptor, also known as Fms-like tyrosine

61
kinase (Flt-1), which is predominantly expressed by vascular endothelial cells (Ribatti
2008). PlGF-1 and PlGF-3 are secreted in soluble form, and in the circulation, are largely
bound to the soluble form of Flt-1 (sFlt-1) and exert their effects in a paracrine manner
(Yang et al. 2003). In contrast, PlGF-2 and PlGF-4 contain additional amino acids which
provide heparin-binding sites (Yang et al. 2003). PlGF-2 and PlGF-4 are thought to remain
cell membrane bound and exert their effects in an autocrine manner (Ferrara et al. 1991;
Yang et al. 2003).
PlGF has been proposed to induce proliferation, migration and activation of endothelial
cells (Ziche et al. 1997), and controls trophoblast growth and differentiation (Maglione
et al. 1993). Hence PlGF plays an essential role in coordinating the numerous steps
involved during placental invasion into the maternal decidua and subsequent
remodelling of spiral arteries, essential to normal placental development (Vuorela et al.
1997). Placental PlGF synthesis appears localised to villous cytotrophoblast,
syncytiotrophoblast and extravillous trophoblast (Clark et al. 1998b) and levels increase
as gestation advances, in contrast to VEGF which decreases (Khaliq et al. 1999). The
gradual shift in balance from the actions of VEGF to PlGF may explain the change in
villous angiogenesis from predominantly branching to non-branching type, resulting in
the formation of tertiary villi, which constitute 40% of the placental volume and 50% of
the exchange surface of the placenta leading up to term (Gruenwald 1977). Decrease in
VEGF level with advancing gestation also allows inhibition of continuous expansion of
the fetoplacental tree which is necessary for early placental growth (Cao et al. 1996).
PlGF has been identified in several different sites within the human placenta. These
include within vasculo-syncytial membranes, within large blood vessels of the placenta
(Khaliq et al. 1996), within villous trophoblast, and human umbilical vein endothelial
cells (HUVECs) (Torry et al. 1999). Vasculo-syncytial membranes consist of fetal
capillaries which are fused with syncytiotrophoblasts. They are localised areas of the
placental villous membrane where the thickness of the barrier separating the maternal
and fetal circulations is reduced to as little as 1-2 microns. Consequently, they are
believed to be important sites for diffusional exchange (Burton and Tham 1992). The

62
Figure 8. PlGF isoforms – PlGF-1, PlGF-2, PlGF-3 and PlGF-4. Takahashi H, Masabumi S. The vascular endothelial growth factor (VEGF)/VEGF receptor system and its role under physiological and pathological conditions. Clinical Science 2005; 109(3):227-41, available: http://dx.doi.org/10.1042/CS20040370.
Figure 9. Soluble Fms-like tyrosine kinase 1. Kwelgan. Structural comparison of sFlt1-1 and Flt-1. Wikipedia 2018, available: https://commons.wikimedia.org/wiki/File:Kwelgan_figure_4.tif#file
VEGF or PlGF binding domain

63
morphological appearances suggest that they are caused by the protrusion of locally
dilated segments of the fetal capillaries into the trophoblast layer. Vasculo-syncytial
membranes have been shown to be extremely deficient in placentas of hypertensive
pregnancies (Ansari 2011), most likely due to a failure of trophoblast differentiation.
PlGF expressed in human trophoblast is postulated to act in a paracrine fashion to
modulate the more distant extensive angiogenesis, vessel remodelling and vascular
permeability during implantation and placentation, whilst directly influencing
trophoblast function via an autocrine mechanism (Shore et al. 1997; Yang et al. 2003).
PlGF expressed in human trophoblast culture has been shown to be significantly
downregulated when exposed to hypoxic conditions, implying that pregnancy
complications associated with altered oxygen tension at the maternal fetal interface,
such as preeclampsia, may result in abnormal levels of these growth factors in the
maternal circulation (Shore et al. 1997). PlGF is primarily expressed in the placenta,
heart and lungs, however has also been identified in the thyroid, skeletal muscle, and
adipose tissue (Persico et al. 1999). The physiological functions of PlGF outside of
pregnancy are not clear.
1.3.2 Soluble Fms-like Tyrosine Kinase 1 (sFlt1)
Fms-like tyrosine kinase receptor (Flt-1), also known as VEGFR-1, was first isolated in
1990 (Shibuya et al. 1990), and also belongs to the VEGF family of receptors. VEGF
receptors each carry a tyrosine kinase domain in the intracellular region (Shibuya 2001)
and seven Ig-domains in their extracellular region, which include a VEGF binding region
(Keyt et al. 1996; Tanaka et al. 1997; Shibuya 2011) and a single transmembrane domain
(Figure 9).
The extracellular region is also known as the extracellular domain (ECD), and this is the
section required for ligand binding. The Flt-1 gene is located on chromosome 13
(Maynard et al. 2005). This gene expresses 2 variants of mRNAs, one being a long form,
and the other a short form (Shibuya et al. 1990). The short mRNA is highly expressed in
normal placenta, encoding a soluble form of Flt-1 known as sFlt-1 (Shibuya et al. 1990).
sFlt-1 is expressed within monocytes and macrophages, and in trophoblasts at the fetal-

64
maternal interface of the placenta (Shibuya 2011). Trophoblast expression of sFlt-1 is
upregulated by hypoxic conditions (Gerber et al. 1998).
Placental trophoblast cells may utilise this molecule as a biochemical barrier between
the fetal and maternal circulation in the placenta by suppressing excessive angiogenesis
and abnormal vascular permeability at this important site of diffusional exchange
(Shibuya 2011). To maintain a quiescent state within the vessels throughout the
placenta, sFlt-1 levels must be controlled within a normal physiological range, to avoid
over trapping of VEGF which would negatively affect the placental circulation (Shibuya
2011). Abnormal placental overexpression of sFlt-1, along with elevated serum sFlt-1
has been observed in preeclampsia (Figure 5) (Maynard et al. 2003; Shibuya 2011). sFlt-
1 exhibits strong binding ability to both VEGF-A and PlGF and has anti-angiogenic
properties as it acts as a direct antagonist for these molecules, by inhibiting their binding
and interaction with their respective cell surface receptors, Flt-1 and KDR (Kendall and
Thomas 1993). Excess sFlt-1 causes widespread endothelial dysfunction by directly
interfering with the normal physiologic effects of VEGF and/or PlGF, with a resultant
decrease in levels of free VEGF and PlGF proportionate to the increased sFlt-1 level
(Maynard et al. 2003). The blockade of VEGF and PlGF by endogenous sFlt-1 has been
demonstrated in vitro (Maynard et al. 2003). In addition, in vitro studies have
demonstrated that while sFlt-1 does not cause vasoconstriction as such, it appears to
block the dose-dependent increase in vasodilation induced by VEGF or PlGF, suggesting
that it may oppose physiologic relaxation in patients with preeclampsia, hence
contributing to the maternal manifestations of preeclampsia (Maynard et al. 2003).
PlGF exhibits high affinity for the Fms-like tyrosine kinase (Flt-1) receptor (Park et al.
1994), with Flt-1 expression thought to be restricted exclusively to vascular endothelium
(Kaipainen et al. 1993).

65
1.3.3 Circulating angiogenic factors in normal pregnancy
Reference values for sFlt1 and PlGF in normal pregnancy have been previously well
documented (Levine 2004; Hirashima et al. 2005; Palm et al. 2011). sFlt-1 concentrations
in normal pregnancy remain constant until between 33 and 36 weeks gestation, when
they begin to increase steadily towards full term (Levine 2004). In contrast, PlGF
concentration increases during the first two trimesters, peaks between 29 and 32 weeks
gestation, then decreases towards full term (Levine 2004). The high PlGF concentration
and low sFlt1 concentration during the second trimester creates a proangiogenic state,
favouring placental health and maintenance. It has been postulated that later in
gestation, placental vascular growth may be modified as a direct result of steadily
increasing antiangiogenic sFlt1 level, which directly reduce levels of VEGF and PlGF, and
hence coincide with the corresponding decrease in PlGF levels that are observed
towards the end of pregnancy (Taylor et al. 2003).
1.3.4 Circulating angiogenic factors in pregnancy complicated by preeclampsia
Many studies have investigated maternal angiogenic imbalance reflected by placental
proteins secreted during preeclampsia. In 2004, it was demonstrated for the first time
that increased levels of sFlt1 and decreased levels of PlGF predict the subsequent onset
of preeclampsia (Levine 2004). In women with preeclampsia, sFlt1 appears to increase
earlier in gestation and reach a higher concentration than in normal pregnancy. The
increased circulating sFlt-1 associated with preeclampsia may bind to and reduce
availability of PlGF and VEGF (Maynard et al. 2003). sFlt1 concentrations in women who
develop preeclampsia appear to begin to increase from between 21 and 24 weeks
gestation, with a steeper rise occurring between 29 and 32 weeks (Levine 2004). sFlt-1
concentrations have been recorded to be significantly increased from 9 to 11 weeks
before the onset of preeclampsia, with a more rapid increase in sFlt1 levels noted within
five weeks before the onset of symptoms (Levine 2004).
As a result of increased sFlt1 levels, reduced PlGF and VEGF levels may halt placental
vascular growth much earlier in pregnancies affected by preeclampsia than in normal
pregnancy (Levine 2004) (Figure 5). Reduced PlGF production and secretion due to
cellular stress may also contribute to the observed lowered PlGF levels in patients with

66
preeclampsia (Redman et al. 2014). PlGF concentrations have been recorded to be
decreased in women with preeclampsia from 13 to 16 weeks onward, with significantly
decreased levels recorded from between 9 and 11 weeks before the onset of
preeclampsia, with substantial reductions during the 5 weeks before the onset of
symptoms. The greatest difference in levels of sFlt1 and PlGF occurred during the week
prior to the onset of preeclampsia. These changes appear most pronounced in women
with an earlier onset of preeclampsia and in women with preeclampsia associated with
small for gestational age infants (Levine 2004). These findings have been confirmed with
subsequent research (Tidwell et al. 2001; Polliotti et al. 2003; Taylor et al. 2003; Staff et
al. 2005; Kim et al. 2007; Moore Simas et al. 2007; Rana et al. 2007; Lim et al. 2008;
Shokry et al. 2010; Rohra et al. 2012; Hassan et al. 2013; Perales et al. 2016).
1.3.5 The sFlt1/PlGF Ratio
sFlt1 is not widely used in isolation as a placental biomarker and tends to be combined
with PlGF as the sFlt1/PlGF ratio. This ratio provides a useful method of highlighting the
imbalance between the angiogenic and antiangiogenic factors PlGF and sFlt1, which may
predispose certain patients to developing preeclampsia. Testing both biomarkers and
combining them as a ratio should, in theory, increase the sensitivity of this test over the
use of either biomarker alone, as derangement of one or the other should be reflected
as an abnormal ratio, with the degree of alteration from normal values of either sFlt-1
levels or PlGF levels, or both, being recorded simultaneously. An elevated sFlt1/PlGF
ratio has been shown to be a better predictor of the risk of preeclampsia than either
biomarker alone (Levine et al. 2006; Kim et al. 2007; Moore Simas et al. 2007; Lim et al.
2008; Shokry et al. 2010; Verlohren et al. 2010; Rana et al. 2012; Rohra et al. 2012;
Verlohren et al. 2012; Hassan et al. 2013; Rizos et al. 2013; Perales et al. 2016). As with
the sFlt1 and PlGF values that make up this ratio, increased sFlt1/PlGF ratios have been
shown to be significantly increased from between 9 and 11 weeks prior to the onset of
symptoms, and more dramatically increased during the 5 weeks prior to onset of
symptoms of preeclampsia (Levine 2004; Zeisler et al. 2016b).
67
1.4 Multiparametric tests
Studies in the literature in the past decade have turned away from the traditional
approach of screening for preeclampsia, based on maternal factors, with a shift in focus
towards multivariable screening algorithms. Wright (Wright et al. 2015) showed that
screening for preeclampsia by maternal characteristics and obstetric history in early
pregnancy, between 11 and 13 weeks gestation, is associated with a higher detection
rate for a given false positive rate if the maternal factors are combined into a
multivariable logistic model rather than treating each factor as an independent
screening test. This method has the advantage of adjusting for maternal characteristics
of the population under investigation, and their potential ability to affect the a priori risk
of an individual patient developing preeclampsia. At a screen positive rate of around
11%, according to the NICE guidelines, a multivariable model including maternal
characteristics and obstetric history can predict preeclampsia at any gestation, requiring
delivery at <37 weeks and requiring delivery at <34 weeks gestation at rates of 40%, 48%
and 54% of patients, respectively (Wright et al. 2015). These detection rates are
significantly higher than the respective values of 35%, 40% and 44%, respectively, that
were achieved in the patient population studied by application of the NICE guidelines
alone (Wright et al. 2015). This improvement is only modest, however when used in
conjunction with biophysical and biochemical markers such as MAP, UAPI and serum
placental biomarkers at differing gestations to derive a patient specific risk for
preeclampsia, detection rates improve dramatically (Poon et al. 2009; Wright et al.
2012; Park et al. 2013; Gallo et al. 2016; O'Gorman et al. 2016). The use of such
algorithms with the addition of biophysical and biochemical markers to maternal factors
was first described by Poon in 2009 (Poon et al. 2009).
Gallo 2015 (Gallo et al. 2016) applied this model to women at midpregnancy, including
123,406 pregnancies in total. Data from maternal factors, UAPI, MAP, serum PlGF and
sFlt1 were combined, with all values expressed as MoM values, adjusting for those
characteristics found to provide a significant contribution to their values. The full data
set was available for 7748 pregnancies, of whom 268 developed preeclampsia, with 13
(4.9%) and 62 (23.1%) of patients with preeclampsia requiring delivery before 32 weeks
and 37 weeks, respectively. They showed that in pregnancies that developed
68
preeclampsia, the values of MAP, UAPI and sFlt1 were increased and PlGF was
decreased. For all biomarkers the deviation from normal was greater for early than for
late preeclampsia, with performance of screening inversely related to the gestational
age at which delivery became necessary for maternal and/or fetal indications. Screening
by maternal factors predicted 52%, 47% and 37% of preeclampsia at <32, <37 and ≥37
weeks gestation, respectively, at a false-positive rate of 10%. The respective values for
combined screening with maternal factors and MAP, UAPI and PlGF were 99%, 85% and
46%, with performance not improved by the addition of sFlt1. The study population was
concurrently screened with the ACOG recommendations, which gave detection rates for
preeclampsia at <32, <37 and ≥37 weeks gestation of 91%, 90% and 91%, but at a screen
positive rate of 67%. It was concluded that the performance of second trimester
screening for preeclampsia is good for preterm preeclampsia, but poor for term
preeclampsia. The performance of screening using the competing risks model was far
superior to those recommended by ACOG (American College of Obstetricians and
Gynecologists 2013) or NICE (National Institute for Health and Clinical Excellence 2010).
Litwinska (Litwinska et al. 2017) similarly used a combination of maternal factors with
MoM values of MAP, UAPI, serum PlGF and serum sFlt1 to stratifiy women into high,
intermediate and low-risk management groups. They included 7748 pregnancies
including 268 (3.5%) that subsequently developed preeclampsia. Using a risk cut off of
1:100 for preeclampsia delivering <32 weeks and a risk of 1:300 for preeclampsia
delivering <36 weeks, the proportion of the population stratified into high, intermediate
and low risk groups was 0.9%, 17.2% and 81.9%, respectively. The high-risk group
contained 97% of pregnancies that developed preeclampsia less than 32 weeks and 45%
of those that developed preeclampsia between 32 and 35 weeks. The intermediate risk
group contained a further 46% of pregnancies that developed preeclampsia between 32
and 35 weeks. The low-risk group contained only 0.3% of pregnancies with preeclampsia
less than 32 weeks and 9% of those with preeclampsia between 32 and 35 weeks. This
study confirms that multivariable screening for preeclampsia at midpregnancy can
identify a group which constitutes <1% of the total population and contains >95% of
those that will develop preeclampsia prior to 32 weeks. This group would benefit from
intensive monitoring between 24 and 31 weeks. The second group identified in this
study, constituting less than 20% of the total cohort, contained 90% of those that will

69
develop preeclampsia between 32 and 35 weeks. These patients would benefit from
reassessment at 32 weeks (Litwinska et al. 2017).
1.5 Research Objectives
The purpose of this research was to investigate the clinical validity of predicting
preeclampsia using biomarkers PlGF, sFlt and the sFlt1/PlGF ratio at midpregnancy. This
gestation was chosen given this is the average gestation for antenatal booking visits at
The Royal Women’s Hospital in Melbourne, Australia.
The research objectives of this study were as follows:
1. To what extent can serum PlGF and/or serum sFlt1/PlGF ratio, or both, predict
the subsequent development of preeclampsia when tested in women at
midpregnancy?
2. Which of PlGF and sFlt1/PlGF ratio has greater clinical validity for predicting
subsequent development of preeclampsia when tested in women at
midpregnancy?
3. Is there any significant difference in the predictive performance of the three
different immunoassay platforms for the prediction of preeclampsia at
midpregnancy using PlGF or the sFlt1/PlGF ratio?
4. Do serum PlGF and/or serum sFlt1, when incorporated into a multivariable
algorithm including maternal factors, uterine artery Dopplers and MAP, improve
the clinical validity of such predictive models for the prediction of preeclampsia?

70
Chapter 2
Methods and validation studies
2.1 Introduction
The methodology used to obtain results for this work was consistent throughout the
different chapters constituting this thesis. These methods, applicable to all chapters, will
be described here, with specific deviations from this described at the beginning of
individual chapters.
2.2 Study population
This study was a prospective non-intervention study in singleton pregnancies. Women
booking for antenatal care between 18 and 22 weeks gestation at The Royal Women’s
Hospital in Melbourne, Australia, between June 2012 and January 2015 were offered
participation. Study participants were representative of the general pregnant
population. A total of 600 patients were enrolled.
Study data were collected and managed using REDCap electronic capture tools hosted
at The University of Melbourne. Pregnancy outcomes were determined and the
development of preeclampsia was confirmed or ruled out by review of individual
medical records.
Women with multiple pregnancies, major fetal anomalies, fetal aneuploidy, fetal death
or pregnancy loss prior to 24 weeks gestation were excluded, as were women with
substantial missing outcome data. The study was approved by the Royal Women’s
Hospital Research and Ethics Committee (Project approval number 11/23). All patients
involved in the study gave written informed consent.
2.3 Blood sample collection and storage
Maternal blood samples were collected at the time of recruitment. A volume of 10mL of
maternal blood was drawn and divided between non-heparinised, silicone coated tubes
71
for serum samples and EDTA tubes for plasma samples. Plasma and serum were
collected for all patients, with the exception of 85 patients who only had plasma samples
collected. Samples were centrifuged at 5000rpm (1,600 x g) for 10mins at 4oC and
carefully transferred into plain polypropylene tubes. The plasma samples were
recentrifuged at 5000rpm (1,600 x g) for 10mins at 4oC and the supernatants were
collected into fresh polypropylene tubes. Samples were stored as serum or plasma at -
80oC until the time of analysis. Prior to analysis, samples were removed from the freezer
and defrosted at room temperature over a period of 30-45 minutes. Once thawed,
samples were centrifuged at 5000rpm (1,900 x g) for 5 minutes prior to the required
sample volume being pipetted into the appropriate tube for sampling.
2.4 Immunoassay platforms
Single measurements for each patient were performed on each of three immunoassay
platforms between April 2015 and February 2017 in the following order:
1) DELFIA® Xpress (Perkin Elmer, Inc. Wallac Oy, Turku, Finland),
2) cobas® e 411 (Roche Diagnostics, GmbH) and
3) B.R.A.H.M.S KRYPTOR compact PLUS (ThermoScientific, GmbH)
Sample analysis was performed according to the manufacturer’s instructions for each
platform. Specifications for each of the three immunoassay platforms are displayed in
Table 2.
2.4.1 The DELFIA® Xpress
The DELFIA® Xpress (Delfia) is a solid phase 2-site direct sandwich assay which utilises
time-resolved fluorescence technology (DELFIA®Xpress 6000-0010, Training Manual
2015) and requires use of compatible DELFIA Xpress PlGF 1-2-3™ assay kits to measure
quantitative PlGF levels (Table 2). The assay has a limit of detection of 1.9pg/mL
(measuring range 1.9pg/mL to 4000pg/mL) and a limit of quantification, or functional
sensitivity, of 3.3pg/mL. The PlGF test requires a serum sample volume of 40µL, and
assay duration is around 30mins (DELFIA® Xpress PlGF 1-2-3 Kit Insert 2014).

72
Company Platform Assay Principle Method Measuring
Range of Assay (pg/mL)
Limit of Quantification (pg/mL)
Sample volume (µL)
Assay Duration (mins)
Perkin Elmer DELFIA® Xpress Solid phase 2-site direct sandwich assay using time-resolved fluorescence technology
DELFIA Xpress PlGF 1-2-3™ assay kits
1.9 - 4000 3.3 40 30
Roche cobas® e 411 Uses electro-chemiluminescence (ECL), based on the streptavidin-biotin technology, to generate results, utilising a sandwich immunoassay principle
Roche Elecsys® PlGF assay kits*
3 - 10,000 10 50 18
Roche Elecsys® sFlt1 assay kits*
10 - 85,000 15 20 18
ThermoScientific B.R.A.H.M.S KRYPTOR compact PLUS
Immunofluorescent sandwich assay based on TRACE technology (Time-Resolved Amplified Cryptate Emission)
B·R·A·H·M·S PlGF PLUS assay kits^
3.6 - 7,000 6.9 70 29
B·R·A·H·M·S sFlt1 KRYPTOR assay kit^
22 - 90,000 34 8 9
*The cobas® e 411 sFlt1/PlGF ratio measures the amounts of PlGF relative to sFlt1 by combining the results from the Roche Elecsys® PlGF assay and the Roche Elecsys®
sFlt1 assays. Both the individual assay values and the sFlt1/PlGF ratio are reported.
^The B.R.A.H.M.S KRYPTOR compact PLUS sFlt1/PlGF ratio measures the amounts of PlGF relative to sFlt1 by combining the results from the B·R·A·H·M·S PlGF PLUS and
B·R·A·H·M·S sFlt1 KRYPTOR assays. Both the individual assay values and the sFlt1/PlGF ratio are reported.
Table 2. Description of immunoassay platforms and reagents used. DELFIA®Xpress 6000-0010, Training Manual. Version 1.4. Perkin Elmer
GmbH. See also www.perkinelmer.com; Cobas e 411 analyser, Operator’s Manual. Version 2.1. Roche Diagnostics GmbH. Internal Data on File.
See also www.cobas.com; ThermoScientific BRAHMS Kryptor Compact Plus, User Manual. Version 6. Thermo Fisher Scientific BRAHMS GmbH. See
also thermoscientific.com/brahm

73
2.4.2 The Roche cobas® e 411
The Roche cobas® e 411 (Cobas) analyser is a commercially available, random-access
immunoassay platform which uses electro-chemiluminescence (ECL), based on the
streptavidin-biotin technology, to generate results, utilising a sandwich immunoassay
principle (Cobas e 411 analyser, Operator’s Manual 2010) (Table 2). The Cobas
sFlt1/PlGF ratio measures the amounts of PlGF relative to sFlt1 by combining the results
from the Roche Elecsys® PlGF assay and the Roche Elecsys® sFlt-1 assays, which are
compatible with the Cobas automated analyser. Both the individual assay values and the
sFlt1/PlGF ratio are reported. The Roche Elecsys® PlGF assay has a limit of detection of
3 pg/mL (measuring range 3 to 10,000 pg/mL) and a limit of quantitation, or functional
sensitivity, of 10 pg/ml. The Roche Elecsys® sFlt-1 assay has a limit of detection of 10
pg/mL (measuring range 10 to 85,000 pg/mL) and a limit of quantitation, or functional
sensitivity of 15 pg/mL. Minimum sample volume requirements are 50µL for PlGF and
20µL for sFlt-1. The turnaround time of the Roche Elecsys® sFlt-1/PlGF ratio is around
18 minutes (Elecsys® sFlt-1 and Elecsys® PlGF package inserts 2016).
2.4.3 The B.R.A.H.M.S KRYPTOR compact PLUS
The B.R.A.H.M.S KRYPTOR compact PLUS (Kryptor) is a fully automated, random access
immunofluorescent sandwich assay. The system is based on TRACE technology (Time-
Resolved Amplified Cryptate Emission) (ThermoScientific BRAHMS Kryptor Compact
Plus, User Manual 2013) (Table 2). The Kryptor sFlt1/PlGF ratio measures the amounts
of PlGF relative to sFlt1 by combining the results from the B·R·A·H·M·S PlGF PLUS and
B·R·A·H·M·S sFlt-1 KRYPTOR assays, which are compatible with the analyser. Both the
individual assay values and the sFlt1/PlGF ratio are reported. The B·R·A·H·M·S PlGF PLUS
KRYPTOR assay has a limit of detection of 3.6 pg/mL (measuring range 3.6 to 7,000
pg/ml) and a limit of quantitation of 6.9 pg/ml (B·R·A·H·M·S PlGF PLUS KRYPTOR
(Instructions for use) 2014). The B·R·A·H·M·S sFlt-1 KRYPTOR assay has a limit of
detection of 22 pg/mL (measuring range 22 to 90,000 pg/mL) and a limit of quantitation
of 34 pg/mL. Minimum sample volume requirements are 70µL for PlGF and 8µL for sFlt1
(B·R·A·H·M·S sFlt-1 KRYPTOR (Instructions for use) 2014). The turnaround time for the
B·R·A·H·M·S sFlt-1 KRYPTOR assay is 9 minutes and the turnaround time for the
B·R·A·H·M·S PlGF PLUS KRYPTOR assay is 29 minutes.

74
2.5 Outcome measures
Pregnancy outcome data was collated and checked by two independent study staff using
clearly defined criteria to verify the diagnosis of preeclampsia. Each case was confirmed
by examining individual medical records. The main outcome measured was
preeclampsia, using the International Society for the Study of Hypertension in Pregnancy
(ISSHP) research definition outlined in section 1.2.1, as de novo hypertension (systolic
BP ≥140mmHg and/or diastolic BP ≥90mmHg) after gestational week 20, plus
proteinuria (>300mg/day of urinary protein) (Brown et al. 2018).
2.6 Statistical analysis
Patient baseline characteristics were compared using the Mann-Whitney U test for
continuous variables and Fisher’s exact test for categorical variables. Data was assessed
for normality and found to be non-parametric. After logarithmic transformation, the
results for PlGF, sFlt1 and the sFlt1/PlGF ratio from each immunoassay platform were
adjusted for maternal characteristics and expressed as Multiples of the Median (MoM).
Inter-assay comparison between all three platforms was performed using Intraclass
Correlation Coefficient, to measure the reproducibility and reliability of results obtained
between platforms for PlGF, sFlt1 and the sFlt1/PlGF ratio. Bland-Altman plots were
used to assess for agreement of results between platforms. As part of our validation
studies, Pearson correlation was used to assess equivalence between plasma and serum
results for each platform, given that some patients had plasma samples only available.
Data analysis was performed using IBM Statistical Package for the Social Sciences (SPSS)
Version 24.
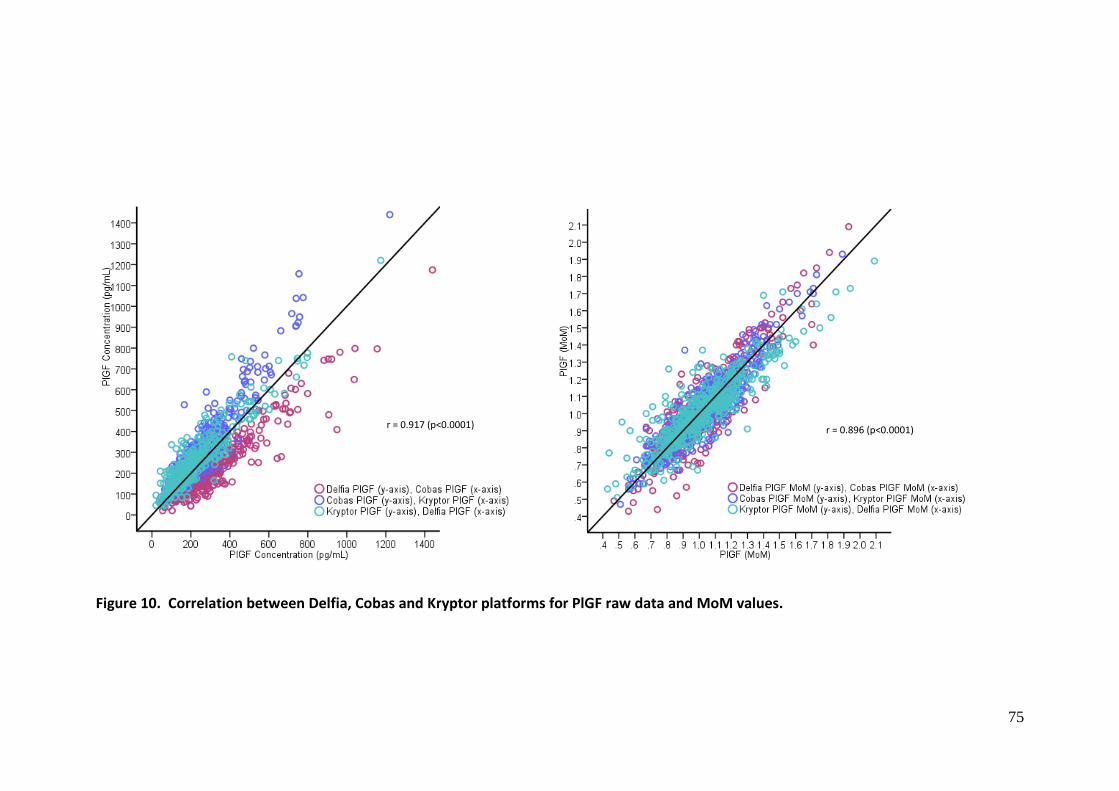
75
Figure 10. Correlation between Delfia, Cobas and Kryptor platforms for PlGF raw data and MoM values.
r = 0.917 (p<0.0001) r = 0.896 (p<0.0001)

76
Figure 11. Correlation between Cobas and Kryptor platforms for sFlt1 raw data and MoM values.
r = 0.938 (p<0.0001) r = 0.934 (p<0.0001)
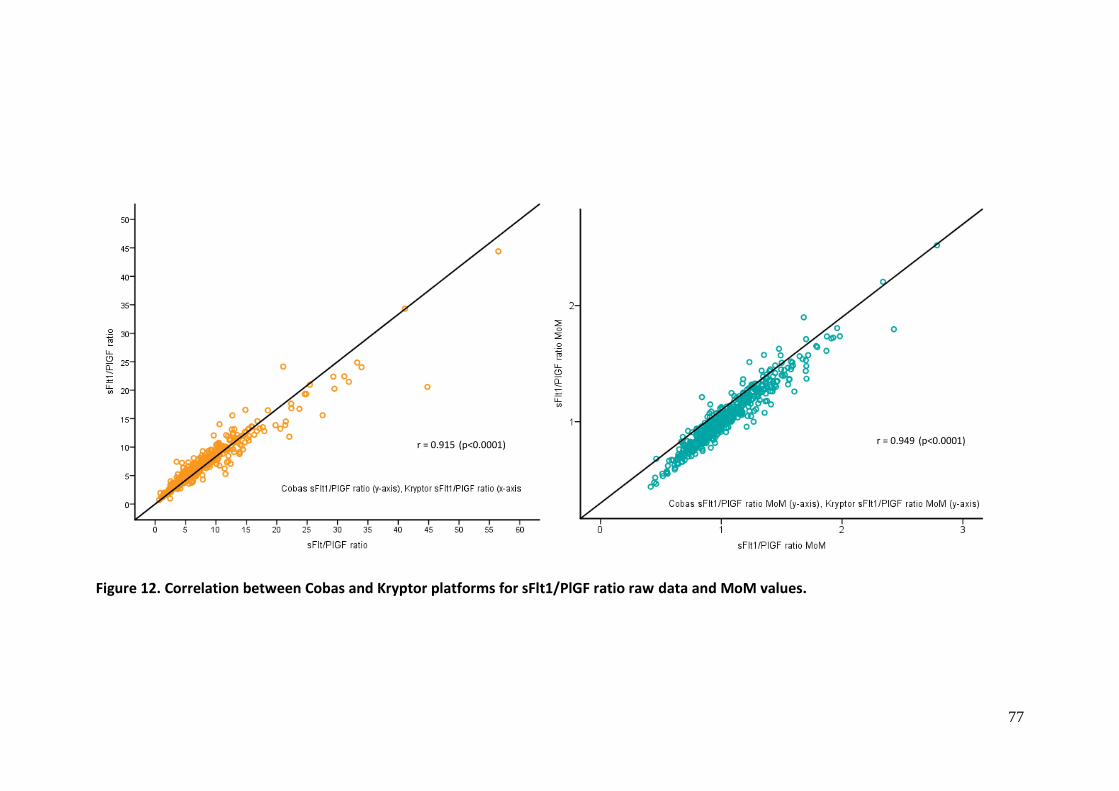
77
Figure 12. Correlation between Cobas and Kryptor platforms for sFlt1/PlGF ratio raw data and MoM values.
r = 0.915 (p<0.0001) r = 0.949 (p<0.0001)

78
2.7 Correlation of biomarker results between immunoassay platforms
Raw data values for PlGF from all three platforms and both PlGF and sFlt1 from the
Cobas and Kryptor platforms were highly correlated with each other. PlGF levels for the
three platforms gave an alpha coefficient of 0.917 (p<0.0001) for raw data values and
0.896 (p<0.0001) for MoM values (Figure 10), while sFlt1 levels for the Cobas and
Kryptor platforms gave an alpha coefficient of 0.938 (p<0.0001) for raw data values and
0.934 (p<0.0001) for MoM values (Figure 11). sFlt1/PlGF ratios were also highly
correlated between the Cobas and Kryptor platform, with an alpha coefficient 0.915
(p<0.0001) for raw data values and 0.949 (p<0.0001) for MoM values (Figure 12). It was
noted that there was variation in raw data values for PlGF and sFlt1 according to the
platform used for testing. PlGF values on average were consistently highest when
measured on the Cobas analyser, followed by the Kryptor, followed by Delfia.
Specifically, for PlGF raw data results, Cobas results were on average 16.4% higher than
Kryptor and 29.5% higher than Delfia results. Similarly, for sFlt1 and sFlt1/PlGF ratio
results, Cobas was on average 9.1% and 11.1% higher than Kryptor, respectively.
Raw data and MoM values for the immunoassays were directly compared two at a time
using Bland-Altman plots, to assess the degree of agreement in results between
platforms (Figure 13 to 16 and Tables 3 and 4).
Within the patient cohort, when looking at raw data values for PlGF, sFlt1 and the
sFlt1/PlGF ratio, there was an appreciable difference in results obtained between the
three platforms. Conversion of raw data values to MoM essentially eliminated the
consistent variation in results between platforms (Table 5), with the difference in PlGF
MoM values between Kryptor and Cobas, Delfia and Cobas and Delfia and Kryptor being
0.3%, 0.4% and 0.5% respectively. For sFlt1 MoM values, and sFlt1/PlGF ratio MoM
values, the difference between platforms was similarly inappreciable, with average
difference between Kryptor and Cobas results being 0.3% and 0.3%, respectively.

79
a. Cobas and Delfia PlGF raw values b. Cobas and Kryptor PlGF raw values c. Kryptor and Delfia PlGF raw values
Figure 13. Bland Altman plots comparing PlGF raw data values between platforms. Bland-Altman plot a shows mean difference between results
from the Cobas and Delfia platforms to be 84.25 with limits of agreement -41.56 and 210.05. Plot b shows mean difference between results from
the Cobas and Kryptor platforms to be 52.31 with limits of agreement -69.73 and 174.36. Plot c shows mean difference between results from
the Kryptor and Delfia platforms to be 31.94 with limits of agreement -66.64 and 130.51.

80
a. Cobas and Kryptor sFlt1 raw values b. Cobas and Kryptor sFlt1/PlGF raw values
Figure 14. Bland Altman plots comparing sFlt1 and sFlt1/PlGF ratio raw data values between platforms. Bland-Altman plot a shows mean
difference between sFlt1 raw data results from the Cobas and Kryptor platforms to be 137.33 with limits of agreement -492.45 and 767.12. Plot
b shows mean difference between sFlt1/PlGF ratio raw data results to be 0.99 with limits of agreement -3.24 and 5.22.
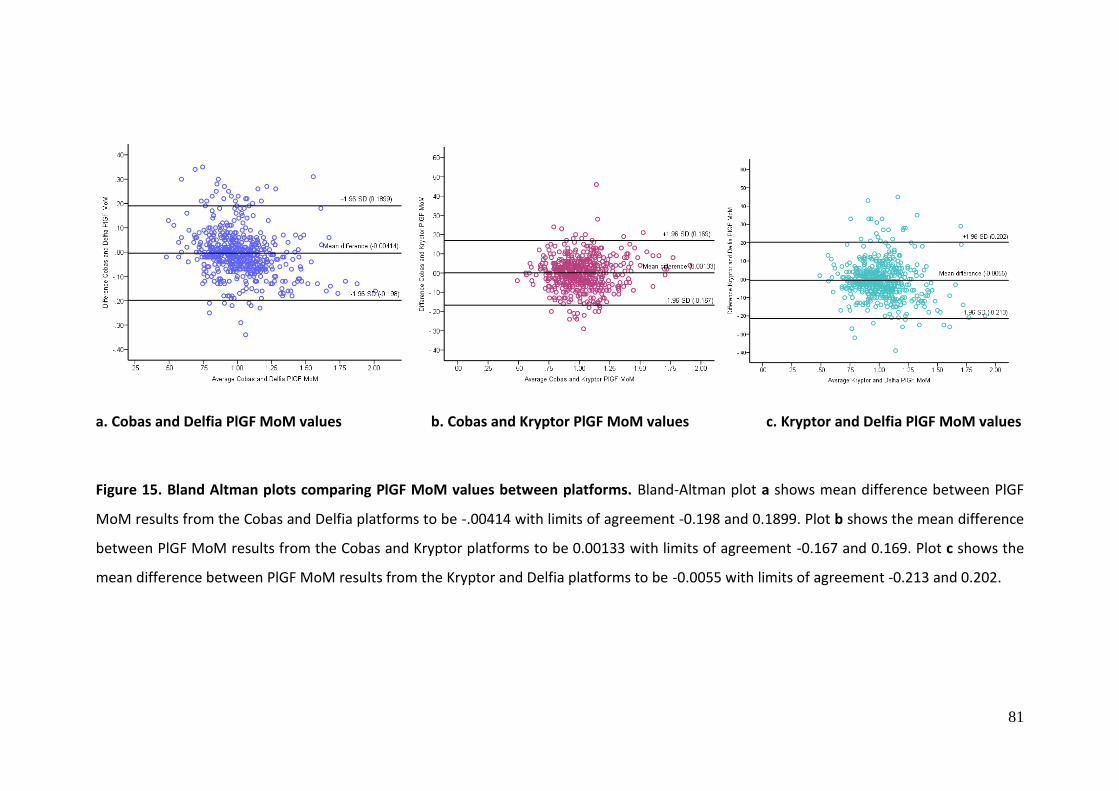
81
a. Cobas and Delfia PlGF MoM values b. Cobas and Kryptor PlGF MoM values c. Kryptor and Delfia PlGF MoM values
Figure 15. Bland Altman plots comparing PlGF MoM values between platforms. Bland-Altman plot a shows mean difference between PlGF
MoM results from the Cobas and Delfia platforms to be -.00414 with limits of agreement -0.198 and 0.1899. Plot b shows the mean difference
between PlGF MoM results from the Cobas and Kryptor platforms to be 0.00133 with limits of agreement -0.167 and 0.169. Plot c shows the
mean difference between PlGF MoM results from the Kryptor and Delfia platforms to be -0.0055 with limits of agreement -0.213 and 0.202.

82
a. Cobas and Kryptor sFlt1 MoM values b. Cobas and Kryptor sFlt1/PlGF ratio MoM values
Figure 16. Bland Altman plots comparing sFlt1 MoM and sFlt1/PlGF ratio MoM values between platforms. Bland-Altman plot a shows mean
difference between sFlt1 MoM results from the Cobas and Kryptor platforms to be 0.0039 with limits of agreement -0.0157 and 0.165. Plot b
shows mean difference between sFlt1/PlGF ratio MoM values from the Cobas and Kryptor platforms to be 0.009 with limits of agreement -0.166
and 0.184.
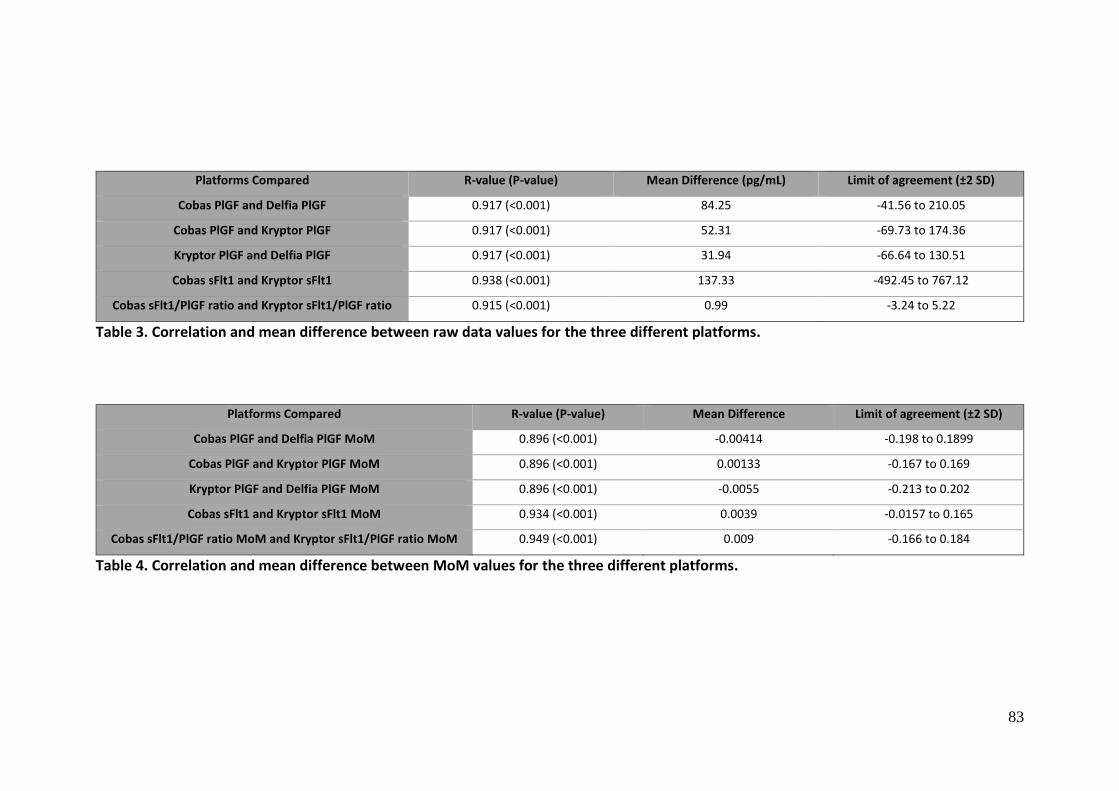
83
Platforms Compared R-value (P-value) Mean Difference (pg/mL) Limit of agreement (±2 SD)
Cobas PlGF and Delfia PlGF 0.917 (<0.001) 84.25 -41.56 to 210.05
Cobas PlGF and Kryptor PlGF 0.917 (<0.001) 52.31 -69.73 to 174.36
Kryptor PlGF and Delfia PlGF 0.917 (<0.001) 31.94 -66.64 to 130.51
Cobas sFlt1 and Kryptor sFlt1 0.938 (<0.001) 137.33 -492.45 to 767.12
Cobas sFlt1/PlGF ratio and Kryptor sFlt1/PlGF ratio 0.915 (<0.001) 0.99 -3.24 to 5.22
Table 3. Correlation and mean difference between raw data values for the three different platforms.
Platforms Compared R-value (P-value) Mean Difference Limit of agreement (±2 SD)
Cobas PlGF and Delfia PlGF MoM 0.896 (<0.001) -0.00414 -0.198 to 0.1899
Cobas PlGF and Kryptor PlGF MoM 0.896 (<0.001) 0.00133 -0.167 to 0.169
Kryptor PlGF and Delfia PlGF MoM 0.896 (<0.001) -0.0055 -0.213 to 0.202
Cobas sFlt1 and Kryptor sFlt1 MoM 0.934 (<0.001) 0.0039 -0.0157 to 0.165
Cobas sFlt1/PlGF ratio MoM and Kryptor sFlt1/PlGF ratio MoM 0.949 (<0.001) 0.009 -0.166 to 0.184
Table 4. Correlation and mean difference between MoM values for the three different platforms.

84
Angiogenic Markers Unaffected (n=487) PE ≥ 37 weeks (n=17) PE < 37 weeks (n=8) p-value PE < 34 weeks (n=3) p-value
Delfia PlGF 166.9 (125.1-231.0) 183.7 (142.6-266.0) 95.5 (42.2-171.7) * 0.018 47.9 (34.2-81.9) * 0.010
Cobas PlGF 248.5 (183.9-332.8) 273.7 (196.7-339.7) 161.3 (60.9-215.6) * 0.008 54.7 (52.2-116.4) * 0.012
Kryptor PlGF 201.4 (152.3-276.1) 204.2 (160.2-316.3) 127.9 (54.3-206.0) * 0.015 48.8 (47.4-96.7) * 0.010
Delfia PlGF MoM 1.0 (0.9-1.1) 1.1 (0.9-1.2) 0.8 (0.6-1.0) * 0.010 0.5 (0.4-0.7) * 0.020
Cobas PlGF MoM 1.0 (0.9-1.1) 1.1 (0.9-1.1) 0.8 (0.6-1.0) * 0.006 0.6 (0.5-0.8) * 0.023
Kryptor PlGF MoM 1.0 (0.9-1.1) 1.0 (0.9-1.1) 0.8 (0.7-0.9) * 0.008 0.6 (0.5-0.8) * 0.020
Cobas sFlt1 1414.0 (1030.0-1928.5) 1337.0 (1078.0-2446.0) 1170.0 (787.0-1905.0) 0.292 2429 (1562.7-2429) 0.601
Kryptor sFlt1 1264.0 (905.7-1764.5) 1164.0 (839.5-2088.0) 1027.3 (638.8-1995.0) 0.439 2293 (1405-2443) 0.581
Cobas sFlt1 MoM 1.0 (0.9-1.1) 1.0 (0.9-1.2) 1.0 (0.8-1.2) 0.982 1.3 (1.0-1.4) 0.444
Kryptor sFlt1 MoM 1.0 (0.9-1.1) 1.0 (0.8-1.2) 1.0 (0.8-1.3) 0.948 1.3 (1.0-1.4) 0.434
Cobas sFlt1/PlGF ratio 5.8 (4.0-8.1) 5.2 (3.2-10.1) 9.9 (5.3-13.8) 0.067 14.0 (13.8-29.2) * 0.005
Kryptor sFlt1/PlGF ratio 6.4 (4.1-9.3) 5.8 (3.0-11.6) 9.3 (5.6-14.3) 0.121 15.9 (13.2-36.2) * 0.012
Cobas sFlt1/PlGF ratio MoM 1.0 (0.9-1.2) 0.9 (0.8-1.2) 1.3 (1-1.5) * 0.021 1.6 (1.5-2.0) * 0.006
Kryptor sFlt1/PlGF ratio MoM 1.0 (0.8-1.2) 0.9 (0.8-1.2) 1.3 (1-1.4) * 0.046 1.4 (1.3-2.1) * 0.011
Units for PlGF and sFlt1 are in pg/mL. All values are reported as median (interquartile ranges). * p<0.05 when compared to the unaffected group PE = preeclampsia. MoM = multiples of the median
Table 5. Angiogenic marker levels for patients who developed term (≥37 weeks), preterm (<37 weeks) and early onset (<34 weeks)
preeclampsia compared with unaffected pregnancies

85
Though the three platforms were found to be highly correlated based on the Intraclass
Correlation Coefficient, correlation coefficients are designed to assess repeatability or
reliability by measuring the strength of the linear relationship between two methods.
The closer the correlation coefficient is to +1.0 or -1.0, the greater the strength of the
linear relationship. Correlation does not assess the degree of agreement, nor
comparability between two methods, does not detect bias between two measurements
and is highly influenced by the range of values being measured (Hartnack 2014). For this
reason, in addition to assessing for correlation, the agreement between results obtained
from the three different immunoassay platforms was assessed using Bland Altman plots.
Bland Altman analysis involves plotting the difference between raw values obtained for
serum and plasma, plotted on the y-axis, against the average of the two concentrations,
plotted on the x-axis. Three horizontal lines on the Bland Altman plots should be
considered. These include the middle line, which is the mean difference between results
for the two methods and indicates the bias between the two methods. If the mean
difference is small, then the bias is small, the mean difference line is close to y=0, and
the agreement on average is good. If the mean difference is large, then one method is
biased relative to the other, the mean difference line deviates far from y=0, and
agreement is likely to be poor. The upper and lower horizontal lines on the plot indicate
limits of agreement, which are values ±1.96 standard deviations (SD) of the mean
difference. To put this into clinical context, in order to indicate acceptable agreement
between platforms, the difference between measurements using these two methods
should fall within these limits of agreement approximately 95% of the time. The limits
of agreement serve as a numerical yet qualitative measure to assess for
interchangeability between two methods (Misyura et al. 2018) and require clinical
judgement to determine what constitutes acceptable agreement, and whether the two
methods are equivalent from a clinical perspective.
When looking at the Bland Altman plots comparing raw data values between the three
platforms, the average difference between values (the bias) is considerable. In addition
to this, the limits of agreement for these plots are quite wide. Though 95% of values fall
within the limits of agreement for each plot, this alone is not sufficient to determine a
86
strong agreement between the platforms. The bias and wide limits of agreement for the
Bland Altman plots comparing raw data values for PlGF, sFlt1 and the sFlt1/PlGF ratio
are likely to indicate clinically significant differences between values. Based on this lack
of agreement when directly comparing raw data values obtained between the three
platforms, values obtained on the three different platforms should not be used
interchangeably. This being said, though there was a consistent variance in values
obtained between the three platforms, there was great similarity in results for clinical
validity (see chapters 3, 4 and 5). Values obtained for each platform for sensitivity,
specificity, positive predictive value (PPV) and negative predictive value (NPV) for the
prediction of preeclampsia when different cut-off values for each platform were used
were very similar, making the clinical interpretation of tests equivalent between the
three platforms as long as the appropriate reference range was used for each. This
would need to be taken into consideration if using raw data values from these platforms
in clinical practice.
When comparing PlGF, sFlt1 and sFlt1/PlGF MoM values between platforms, the bias
and limits of agreement were far smaller compared with use of raw data values. These
narrow limits of agreement, and extremely small bias, approaching zero for each
platform, indicate that when raw data values for the three platforms are converted to
MoM, the results obtained from each platform are essentially equivalent, and can be
used interchangeably.
2.8 Inter- and Intra- assay variability results
2.8.1 Quality controls supplied by manufacturers
For each of the three immunoassay platforms, commercial quality control material was
provided for the measurement of high and low controls in the case of the Delfia and
Cobas analysers, and high, medium and low controls for the Kryptor platform.
Commercial quality controls were all lyophilised, requiring reconstitution with exact
volumes of distilled water according to manufacturer’s instructions (DELFIA® Xpress
PlGF 1-2-3 Kit Insert 2014; Elecsys® sFlt-1 and Elecsys® PlGF package inserts 2016;
B·R·A·H·M·S PlGF PLUS KRYPTOR (Instructions for use) 2014; B·R·A·H·M·S sFlt-1 KRYPTOR
(Instructions for use) 2014). Following at least 15 minutes for dissolution of the
87
lyophilisate, controls were gently mixed. Contents of each reconstituted vial were
divided into aliquots and those not used immediately for measurement were stored
frozen at -30°C and discarded if not used within one month. Any previously frozen
aliquots were prepared for measurement by thawing and gentle mixing followed by
immediate use. No previously thawed aliquots were refrozen.
Controls were run individually at least once every 24 hours whilst the platforms were
being used daily to ensure day-to-day validity of results. In addition to this, they were
run once per reagent kit, and following each calibration. Additionally, for the Delfia, a
high and low-level control was run each time the inducer bottle was changed, as per
manufacturer’s instructions (DELFIA®Xpress 6000-0010, Training Manual 2015). Control
values for each platform were required to fall within 2 standard deviations of the target
value. Patient samples were only tested if control results for the assay were within the
required range. If the control results were out of limits, an adjustment calibration was
performed prior to any patient samples being run. Each platform generated Levey-
Jennings charts for visualisation of quality control data. Westgard rules (Westgard et al.
1981) were applied to determine whether quality control results obtained were
acceptable prior to the analysis of patient samples.
For the Delfia, intra-assay and inter-assay coefficients of variation (CV) published by the
manufacturer and obtained in our laboratory for control samples are outlined in Table
6 (DELFIA® Xpress PlGF 1-2-3 Kit Insert 2014).
For the Cobas platform, for quality controls provided by the manufacturer and obtained
in our laboratory, the intra-assay and inter-assay coefficients of variation (CV) for the
Roche Elecsys® PlGF assay and the Roche Elecsys® sFlt-1 assay are outlined in Table 7
(Elecsys® sFlt-1 and Elecsys® PlGF package inserts 2016).
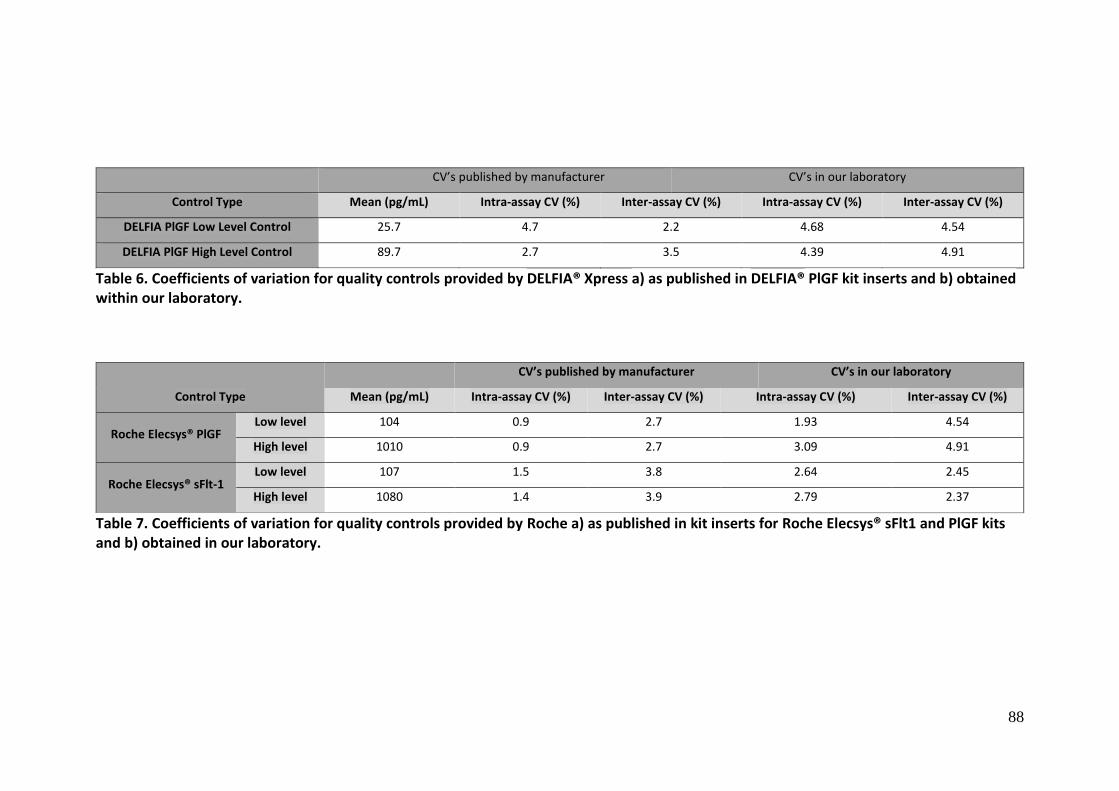
88
CV’s published by manufacturer CV’s in our laboratory
Control Type Mean (pg/mL) Intra-assay CV (%) Inter-assay CV (%) Intra-assay CV (%) Inter-assay CV (%)
DELFIA PlGF Low Level Control 25.7 4.7 2.2 4.68 4.54
DELFIA PlGF High Level Control 89.7 2.7 3.5 4.39 4.91
Table 6. Coefficients of variation for quality controls provided by DELFIA® Xpress a) as published in DELFIA® PlGF kit inserts and b) obtained within our laboratory.
CV’s published by manufacturer CV’s in our laboratory
Control Type Mean (pg/mL) Intra-assay CV (%) Inter-assay CV (%) Intra-assay CV (%) Inter-assay CV (%)
Roche Elecsys® PlGF Low level 104 0.9 2.7 1.93 4.54
High level 1010 0.9 2.7 3.09 4.91
Roche Elecsys® sFlt-1 Low level 107 1.5 3.8 2.64 2.45
High level 1080 1.4 3.9 2.79 2.37
Table 7. Coefficients of variation for quality controls provided by Roche a) as published in kit inserts for Roche Elecsys® sFlt1 and PlGF kits and b) obtained in our laboratory.
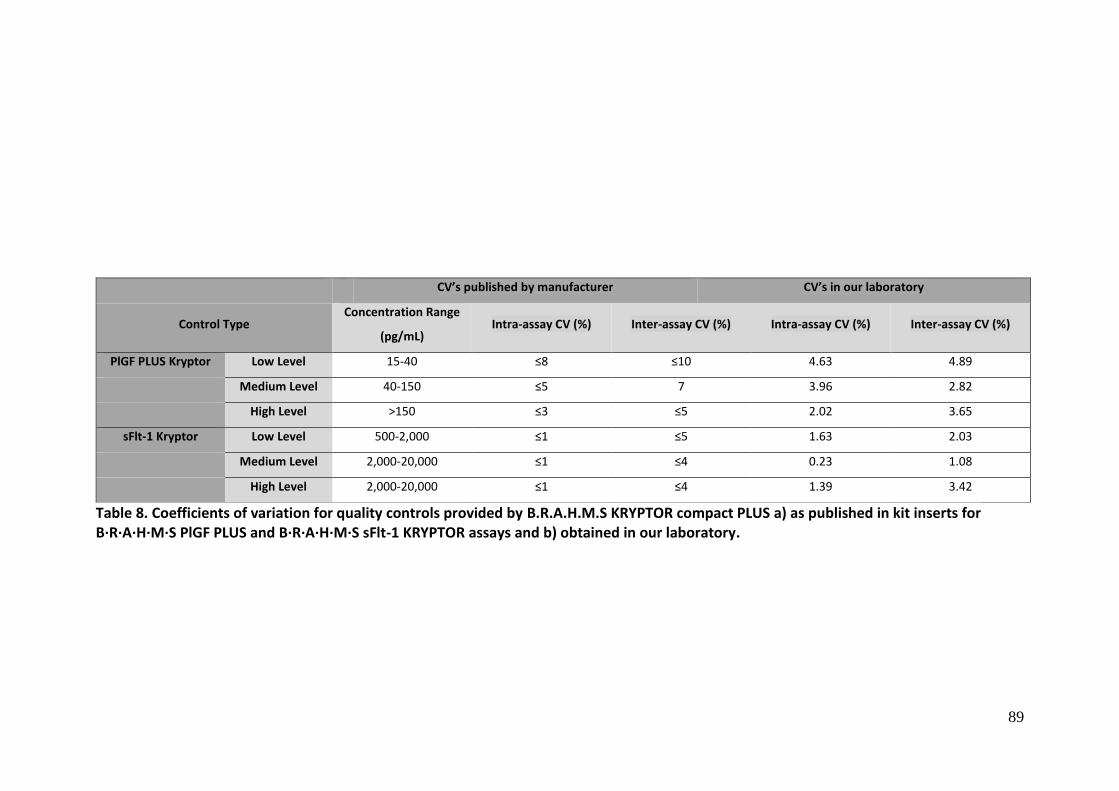
89
CV’s published by manufacturer CV’s in our laboratory
Control Type Concentration Range
(pg/mL) Intra-assay CV (%) Inter-assay CV (%) Intra-assay CV (%) Inter-assay CV (%)
PlGF PLUS Kryptor Low Level 15-40 ≤8 ≤10 4.63 4.89
Medium Level 40-150 ≤5 7 3.96 2.82
High Level >150 ≤3 ≤5 2.02 3.65
sFlt-1 Kryptor Low Level 500-2,000 ≤1 ≤5 1.63 2.03
Medium Level 2,000-20,000 ≤1 ≤4 0.23 1.08
High Level 2,000-20,000 ≤1 ≤4 1.39 3.42
Table 8. Coefficients of variation for quality controls provided by B.R.A.H.M.S KRYPTOR compact PLUS a) as published in kit inserts for B·R·A·H·M·S PlGF PLUS and B·R·A·H·M·S sFlt-1 KRYPTOR assays and b) obtained in our laboratory.

90
Control Type Mean Value (pg/mL) Intra-assay CV (%) Inter-assay CV (%)
Delfia Internal Control Low Value 90.25 8.49 8.21
Internal Control High Value 356.22 7.14 6.06
Roche Elecsys® PlGF Internal Control Low Value 123.77 3.53 7.90
Internal Control High Value 1439.70 2.89 8.81
Roche Elecsys® sFlt-1 Internal Control Low Value 706.78 9.84 8.95
Internal Control High Value 3730.33 4.56 7.56
PlGF PLUS KRYPTOR Internal Control Low Value 95.23 6.79 9.84
Internal Control High Value 1220.54 7.46 4.30
sFlt-1 KRYPTOR Internal Control Low Value 509.50 7.85 5.57
Internal Control High Value 3115.86 8.83 8.10
Table 9. Coefficients of variation for internal quality controls obtained within our laboratory for each of the three immunoassay platforms.
91
Intra-assay coefficients of variation (CV) published by the manufacturer and obtained in
our laboratory for the B·R·A·H·M·S PlGF PLUS KRYPTOR and B·R·A·H·M·S sFlt-1 KRYPTOR
assays for low, medium and high-level control samples of the assay, are outlined in Table
8 (B·R·A·H·M·S PlGF PLUS KRYPTOR (Instructions for use) 2014; B·R·A·H·M·S sFlt-1
KRYPTOR (Instructions for use) 2014).
2.8.2 Quality controls from our own samples
In addition to the quality controls supplied by each manufacturer, internal inter- and
intra-assay quality controls from within the patient cohort were regularly run across
each of the three immunoassay platforms (Table 9).
2.8.3 Addition of calcium to plasma samples prior to allow compatibility with the
Delfia platform
There were 85 patients with plasma samples only, as serum samples had not been
collected. This created a challenge, as the Delfia platform processes only serum samples,
and would not generate a result for plasma samples. The chemical
ethylenediaminetetraacetic acid (EDTA) is used to prevent clotting in blood samples
(Hadley and Larson 1953), by chelating divalent cations such as Ca2+, preventing them
from reacting with their surroundings. Calcium is an essential initiator of the
prothrombinase complex in the coagulation pathway, hence the clotting process is
inhibited in EDTA plasma (Murray 2003). In order to generate results for the plasma
samples using the Delfia, the samples were modified by the addition of calcium chloride
(CaCl2) in attempt to initiate coagulation according to a previously described technique
(Tenland and Hillman 2013). To allow analysis on the Delfia platform, stored frozen
plasma samples were prepared for analysis in the same fashion as described in section
2.3. Following this process, 2M CaCl2 was added to the samples, at a volume of 20µL
CaCl2 per mL of plasma. Samples were then refrigerated at 4oC overnight, and
centrifuged at 1,600g x g for 5 minutes. The supernatants were then pipetted into fresh
polypropylene tubes, ready for processing. The Delfia platform was able to generate
results for these modified plasma samples.
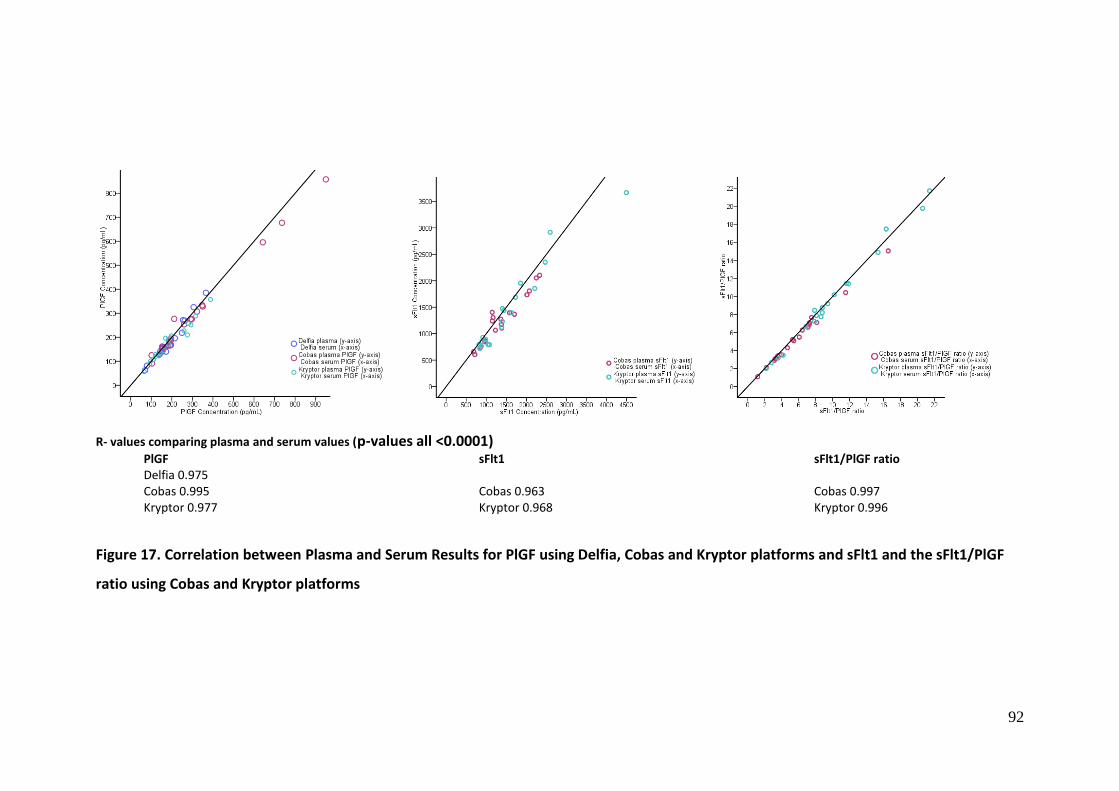
92
R- values comparing plasma and serum values (p-values all <0.0001)
PlGF sFlt1 sFlt1/PlGF ratio Delfia 0.975 Cobas 0.995 Cobas 0.963 Cobas 0.997 Kryptor 0.977 Kryptor 0.968 Kryptor 0.996
Figure 17. Correlation between Plasma and Serum Results for PlGF using Delfia, Cobas and Kryptor platforms and sFlt1 and the sFlt1/PlGF
ratio using Cobas and Kryptor platforms
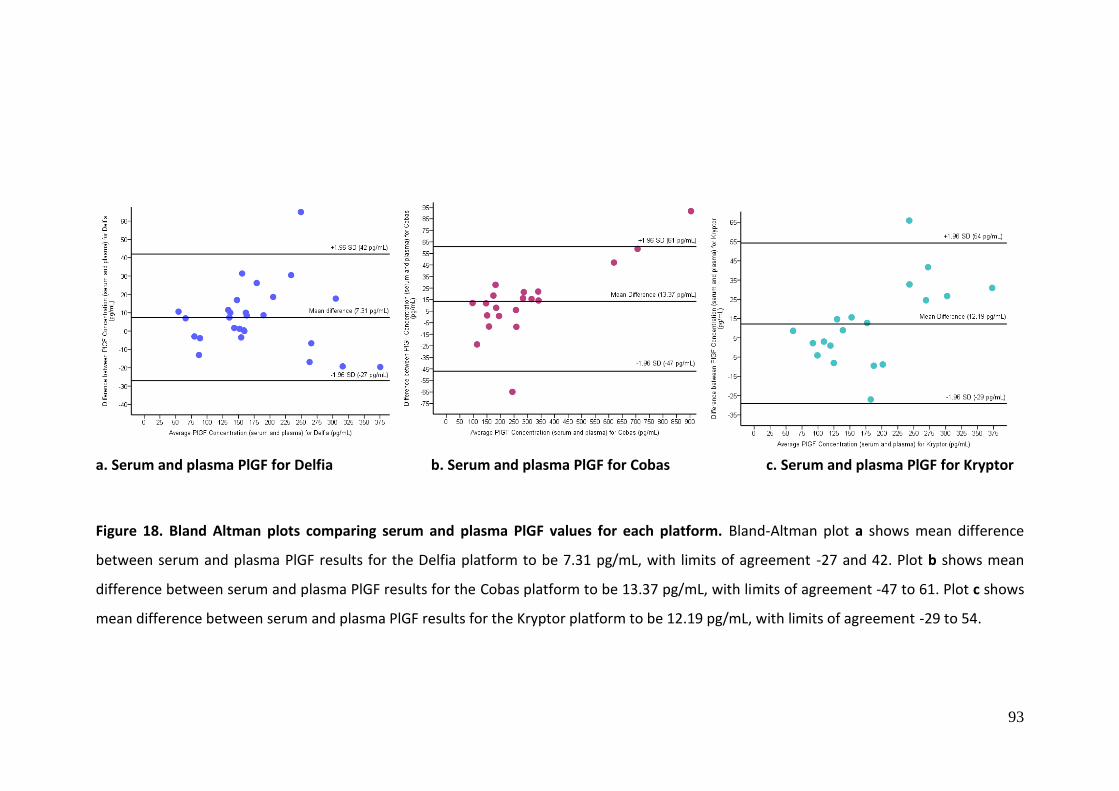
93
a. Serum and plasma PlGF for Delfia b. Serum and plasma PlGF for Cobas c. Serum and plasma PlGF for Kryptor
Figure 18. Bland Altman plots comparing serum and plasma PlGF values for each platform. Bland-Altman plot a shows mean difference
between serum and plasma PlGF results for the Delfia platform to be 7.31 pg/mL, with limits of agreement -27 and 42. Plot b shows mean
difference between serum and plasma PlGF results for the Cobas platform to be 13.37 pg/mL, with limits of agreement -47 to 61. Plot c shows
mean difference between serum and plasma PlGF results for the Kryptor platform to be 12.19 pg/mL, with limits of agreement -29 to 54.

94
a. Serum and plasma sFlt1 values for Cobas b. Serum and plasma sFlt1 values for Kryptor
Figure 19. Bland Altman plots comparing serum and plasma sFlt1 values for each platform. Bland-Altman plot 14a shows the mean difference
between serum and plasma sFlt1 results for the Cobas platform to be 118.13 pg/mL, with limits of agreement -172 to 408. Plot 14b shows the
mean difference between serum and plasma sFlt1 results for the Kryptor platform to be 127.37 pg/mL, with limits of agreement -327 to 582.

95
a. Serum and plasma sFlt1/PlGF ratio values for Cobas b. Serum and plasma sFlt1/PlGF ratio values for Kryptor
Figure 20. Bland Altman plots comparing serum and plasma sFlt1/PlGF ratio values for each platform. Bland-Altman plot 15a shows the mean difference between serum and plasma sFlt1/PlGF ratio results for the cobas platform to be 0.376, with limits of agreement -0.41 to 1.16.

96
Platforms Compared R-value (P-value) Mean Difference (pg/mL) Limit of agreement (±2 SD)
DELFIA® Xpress PlGF 0.975 (<0.0001) 7.31 -27 - 42
cobas® e 411 PlGF 0.995 (<0.0001) 13.37 -47 - 61
B.R.A.H.M.S KRYPTOR compact PLUS PlGF 0.977 (<0.0001) 12.19 -29 - 54
cobas® e 411 sFlt1 0.963 (<0.0001) 118.13 -172 - 408
B.R.A.H.M.S KRYPTOR compact PLUS sFlt1 0.968 (<0.0001) 127.37 -327 - 582
cobas® e 411 sFlt1/PlGF 0.997 (<0.0001) 0.376 -0.41 - 1.16
B.R.A.H.M.S KRYPTOR compact PLUS sFlt1/PlGF 0.996 (<0.0001) 0.207 -0.75 - 1.16
Table 10. Correlation and mean difference between sFlt1 and PlGF values when comparing serum and plasma sample results for the Delfia, Cobas and Kryptor platforms.

97
2.8.4 Correlation between serum and plasma results for PlGF and sFlt1 values
All patients, with the exception of 85 for whom there were no serum samples, had
plasma and serum samples available, and serum samples were used in preference to
plasma for testing, if available. For the Delfia, the 85 patients with only plasma samples
were processed using the technique described above (Tenland and Hillman 2013). The
Cobas analyser and Kryptor platform were both able to generate results using plasma
samples for these 85 patients. Given that not all results were able to be generated from
serum samples, it was deemed necessary to perform an analysis to assess the strength
of the relationship and hence equivalence between the plasma and serum results. For
all three platforms, as a component of the validation studies undertaken, 20 sets of
bloods with both serum and plasma samples were analysed and a Pearson correlation
analysis was performed. This showed a very high correlation between serum and plasma
samples for each platform.
R-values for PlGF plasma and serum samples for Delfia, Cobas and Kryptor platforms
were 0.975 (p<0.0001), 0.995 (p<0.0001) and 0.977 (p<0.0001), respectively. R-values
for sFlt1 plasma and serum samples for Cobas and Kryptor platforms were 0.963
(p<0.0001) and 0.968 (p<0.0001), respectively, and for the sFlt1/PlGF ratio for plasma
and serum samples were 0.997 (p<0.0001) and 0.996 (p<0.0001), respectively (Figure
17).
The mean concentrations of PlGF and sFlt1 in serum and plasma samples showed a
positive bias towards serum sample values, indicating that serum sample raw values for
PlGF and sFlt1 were consistently slightly higher than plasma values. This observation is
demonstrated in Figures 18 to 20 and Table 10.
For the comparison of results between serum and plasma, the vast majority of values
fell between the limits of agreement, as demonstrated by the Bland Altman plots. The
average difference in mean concentrations of PlGF and sFlt1 between serum and plasma
was 5.9% (2.65-9.19%), which demonstrates an acceptable degree of agreement
between plasma and serum sample values. Whilst mean PlGF and sFlt1 concentrations
in serum and plasma samples showed slightly higher values than

98
Figure 21. Inter-assay control samples for PlGF Control 1. Average percentage differences in values obtained for internal inter-assay Control 1 using the Roche Elecsys® PlGF kit and the Kryptor PlGF kit were 0.5%, and 3.66%, respectively.
Figure 22. Inter-assay control samples for sFlt1 Control 1. Average percentage differences in values obtained for internal inter-assay Control 1 using the Roche Elecsys® sFlt1 kit and the Kryptor sFlt1 kit were 0.6% and 0.89%, respectively.
129 134.65120.57 120.15 122.5 124.9
84.27100.48 98.103 92.32
0
50
100
150
0 1 2 3 4 5
Roche Elecsys® PlGF Control 1 Kryptor PlGF Control 1
2088 21821963.33 2047.5 1937 2007
1582.42
1932.041656.44 1570.93
0
500
1000
1500
2000
2500
0 1 2 3 4 5
Roche Elecsys® sFlt-1 Control 1 Kryptor sFlt1 Control 1

99
Figure 23. Inter-assay control samples for sFlt1/PlGF ratio Control 1. Average percentage differences in values obtained for internal inter-assay Control 1 values using the Roche Elecsys® sFlt1/PlGF ratio and the Kryptor sFlt1/PlGF ratio was 0.07% and 3.02%, respectively.
Figure 24. Inter-assay control samples for PlGF Control 2. Average percentage differences in values obtained for internal inter-assay Control 2 values using the Roche Elecsys® PlGF kit and the Kryptor PlGF kit were 0.94% and 2.48%, respectively.
16.19 16.18 16.74 17.09515.81 16.07
18.78 19.2316.96 17.02
0
5
10
15
20
25
0 1 2 3 4 5
Roche Elecsys® sFlt1/PlGF Control 1 Kryptor sFlt1/PlGF Control 1
1477 1548.671758
1310.5 1344.5 13421167.21 1248.02 1162.11 1233.23 1279.66
0
500
1000
1500
2000
0 1 2 3 4 5
Roche Elecsys® PlGF Control 2 Kryptor PlGF Control 2

100
Figure 25. Inter-assay control samples for sFlt1 Control 2. Average percentage differences in values obtained for internal inter-assay Control 2 values using the Roche Elecsys® sFlt1 kit and the Kryptor sFlt1 kit were 0.39%, and 1.36%, respectively.
Figure 26. Inter-assay control samples for sFlt1/PlGF ratio Control 2. Average percentage differences in values obtained for internal inter-assay Control 2 values using the Roche Elecsys® sFlt1/PlGF ratio and the Kryptor sFlt1/PlGF ratio were 0.59%, and 1.25%, respectively.
2020 2142.672412
1841.5 1875 1898
1520.371727.99
1531.28 1512.31 1579.21
0
500
1000
1500
2000
2500
3000
0 1 2 3 4 5
Roche Elecsys® sFLt1 Control 2 Kryptor sFlt1 Control 2
1.37 1.38 1.37
1.411.395
1.41
1.3
1.38
1.32
1.23 1.23
1.1
1.15
1.2
1.25
1.3
1.35
1.4
1.45
0 1 2 3 4 5
Roche Elecsys® sFlt1/PlGF Control 2 Kryptor sFlt1/PlGF Control 2

101
plasma values, correlation and agreement between serum and plasma were good, and
the difference observed between serum and plasma results was not deemed clinically
significant, indicating that serum and plasma may be considered equivalent for the
purpose of sFlt1 and PlGF testing.
2.8.5 Correlation between fresh and thawed samples for PlGF and sFlt1 values
As stated above in 2.8.2, internal quality controls from within the patient cohort were
run regularly for both sFlt1 and PlGF. The inter-assay internal controls were tested each
time a run was performed, and these same controls were used across all three
immunoassay platforms. By the time testing on the third immunoassay platform was
complete, some of these samples had undergone numerous freeze-thaw cycles. Whilst
there were too few samples with multiple freeze-thaw cycles to generate any
statistically significant results, values obtained for these samples during each freeze-
thaw cycle were compared graphically using line graphs (Figures 21 to 26).
Whilst the number of samples we had that underwent numerous freeze thaw cycles was
not large enough to draw any definitive conclusions, the average percentage differences
between values for these samples remained minimal over up to five freeze-thaw cycles.
There did not appear to be any marked difference in results obtained for these sample,
with average differences ranging from 0.07%-3.66%. This indicates that PlGF and sFlt1
are most likely stable enough molecules to undergo repetitive freeze thaw cycles
without deterioration or significant change in value.
CV’s obtained using quality controls provided by the manufacturer performed well,
indicating good precision and repeatability of results. Quality controls using samples
from within the patient cohort did not perform quite as well, ranging from 3.53-9.84%,
however some of these samples had been repeatedly thawed. These values are still
acceptable in terms of precision and repeatability of results.
Overall, results from the inter-assay controls from within the patient cohort show that
average differences in values obtained using samples that had undergone between zero
and five freeze-thaw cycles varied by an average of 1.31% (0.07%-3.66%). This difference

102
is minimal and very unlikely to be of clinical significance. With each platform used, these
inter-assay controls were thawed and refrozen, hence results from the Kryptor platform,
which was tested last, might be expected to vary quite significantly from the results from
the Delfia platform, which was tested first. However, the results were actually highly
consistent based on the CV’s from our own samples.
2.9 Discussion
Fully automated assays have only been made commercially available within the last
decade (Staff et al. 2005; Ohkuchi et al. 2010; Sunderji et al. 2010; Verlohren et al. 2010;
Benton et al. 2011; Cowans et al. 2012; Rana et al. 2012; van Helden and Weiskirchen
2015; McCarthy et al. 2018). These have taken the place of the manual enzyme-linked
immunosorbent assay (ELISA) kits that were used in earlier clinical studies (Ong et al.
2001; Su et al. 2001; Tidwell et al. 2001; Tjoa et al. 2001; Polliotti et al. 2003; Taylor et
al. 2003; Bersinger and Odegard 2004; Chaiworapongsa et al. 2004; Levine 2004;
Chaiworapongsa et al. 2005; Unal et al. 2007; Akolekar et al. 2008; Noori et al. 2010;
Ghosh et al. 2012; Ghosh et al. 2013), which were associated with disadvantages such
as higher inter-assay coefficients of variation, capacity for testing relatively limited
sample numbers for each run and requiring significant amounts of both time and
technical expertise to produce a result. The automated assays allow standardised
inexpensive measurements with high turnover, minimal handling of samples and fast
results.
When looking at raw data values for PlGF, sFlt1 and the sFlt1/PlGF ratio obtained from
this patient cohort, there was an appreciable difference in results obtained between the
three platforms. Conversion of raw data values to MoM essentially eliminated the
consistent variation in results between platforms (Table 3, 4 and 5), with the difference
in PlGF MoM values between Kryptor and Cobas, Delfia and Cobas, and Delfia and
Kryptor results being 0.3%, 0.4% and 0.5% respectively. For sFlt1 MoM values, and
sFlt1/PlGF ratio MoM values, the difference between platforms was similarly
inappreciable, with average difference between Kryptor and Cobas results being 0.3%
and 0.3%, respectively.
103
When comparing PlGF, sFlt1 and sFlt1/PlGF MoM values between platforms, the bias
and limits of agreement were much smaller compared with use of raw data values.
These narrow limits of agreement, and almost negligible biases, approaching zero for
each platform, indicate that when raw data values for the three platforms are converted
to MoM, the results obtained from each platform are essentially equivalent, and can be
used interchangeably.
Whilst it can be appreciated that the CV’s obtained within our laboratory were at times
greater than those reported by each manufacturer, they were all comfortably within an
acceptable range to demonstrate minimal variation between samples tested.
For the comparison of results between serum and plasma, most values fell between the
limits of agreement, as demonstrated by the Bland-Altman plots. The average difference
in mean concentrations of PlGF and sFlt1 between serum and plasma was 5.9% (2.65-
9.19%), demonstrating an acceptable degree of agreement between plasma and serum
sample values. Mean PlGF and sFlt1 concentrations in serum samples showed slightly
higher values than plasma values, which is consistent with other studies in the literature,
reflecting spurious elevation with the release of these substances from platelets when
blood coagulates in the non-heparinised, serum sample tubes (Polliotti et al. 2003).
Despite the slightly higher values in serum samples, correlation and agreement between
serum and plasma were good, and the difference observed between serum and plasma
raw values for these biomarkers results was not deemed clinically significant. These
results indicate that serum and plasma may be considered equivalent for sFlt1 and PlGF
testing when using these three immunoassay platforms.
Samples that had undergone up to five freeze-thaw cycles displayed minimal percentage
differences, with an average of 1.31% (0.07%-3.66%) difference between values
obtained with each thaw, for PlGF, sFlt1 and the sFlt1/PlGF ratio. This difference is
minimal and very unlikely to be of clinical significance, which is in keeping with another
study in the literature (Cowans et al. 2011). These findings indicate that PlGF and sFlt1
are most likely stable enough molecules to undergo repetitive freeze thaw cycles
without deterioration or significant changes in value.
104
It should be appreciated, as outlined in Table 1, that the Delfia, Cobas and Kryptor
platforms each rely on very different technologies to generate results. Despite this,
results from the three platforms were well correlated based on the Intraclass
Correlation Coefficient, indicating reliable and reproducible results obtained across all
three platforms. The average difference between raw data values for PlGF, sFlt1 and the
sFlt1/PlGF ratio for each platform when compared using Bland-Altman plots were
considerable, and likely to be clinically significant when comparing values directly
between platforms. Hence when reporting raw data values, reference ranges for sFlt1
and PlGF specific to each platform should be used. On the other hand, when raw data
values were converted to MoM, the MoM values were directly comparable between
platforms when compared using Bland-Altman plots, with a very small degree of bias
and narrow limits of agreement. Conversion of raw data values to MoM would allow
direct comparison of results between the three platforms rather than needing to refer
to reference ranges specific to each platform to interpret results. This would simplify
patient management in the instance that specific cut-off values for PlGF or the
sFlt1/PlGF ratio, delineating whether a patient is at high or low risk of developing
preeclampsia, based on whether their result is above or below the cut-off, become
established. Using specific cut-off points for each platform when using raw data values,
while possible, seems more cumbersome as these platform specific cut-offs would not
be applicable across all platforms.
There could be many factors contributing to the observation that the Cobas analyser
results appeared consistently higher than the Kryptor platform, which were higher than
the Delfia platform. These are outlined in Chapter 7.
The high correlation and agreement between these three platforms is a reassuring
finding. Common to all immunoassays, direct comparison of values between platforms
can be problematic as raw data values are often not equivalent. With the three
immunoassay platforms studied here, if using MoM values, direct comparison of values
between platforms is possible. If raw data values are chosen, specific reference ranges
for each platform, and specific to different labs, need to be generated. This is not

105
uncommon practice with immunoassays, and different healthcare settings would need
to become familiar with the immunoassay they are using, and its specific reference
ranges. Ultimately, comparing results directly between platforms is not paramount. It is
more important for individual health care settings to be able to draw appropriate clinical
information from the platform they have chosen to use, and make appropriate clinical
decisions based on the method of testing chosen.
2.10 Summary
The validation studies performed have confirmed the following:
• Raw data results for PlGF, sFlt1 and the sFlt1/PlGF ratio from the three platforms
are well correlated based in the Intraclass Correlation Coefficient, indicating
reliable and reproducible results.
• Raw data and MoM values for PlGF, sFlt1 and the sFlt1/PlGF ratio showed good
agreement based on Bland Altman plots. MoM values were directly comparable
between platforms, with a small degree of bias and narrow limits of agreement.
Reference ranges for raw data values need to be taken into consideration when
comparing values between platforms.
• Quality control results based on coefficients of variation were acceptable using
both QC’s supplied by the manufacturer, and inter- and intra-assay controls
using samples from within the patient cohort, with the former understandably
showing best performance.
• Correlation and agreement between serum and plasma values were both good,
and results between them appeared clinically equivalent.
• Numerous freeze-thaw cycles did not appear to significantly alter levels of PlGF,
sFlt1 or sFlt1/PlGF ratio.
106
Chapter 3
Placental Growth Factor (PlGF) for the
prediction for preeclampsia at midpregnancy
3.1 Introduction
The commercial availability of tests which may predict the later development of
preeclampsia has prompted extensive research into their validity for use in the first,
second and third trimesters of pregnancy. There have been numerous studies
performed to assess the clinical validity of PlGF in screening for preeclampsia at
midpregnancy.
Maternal serum PlGF concentration has been shown to be significantly lower in
pregnancies that subsequently develop preeclampsia compared with unaffected
pregnancies, when tested during the second trimester, both among pregnancies
deemed at increased risk of developing preeclampsia, and among the asymptomatic
general population (Su et al. 2001; Tidwell et al. 2001; Tjoa et al. 2001; Polliotti et al.
2003; Taylor et al. 2003; Krauss et al. 2004; Levine 2004; Unal et al. 2007; Shim et al.
2015). Su (Su et al. 2001) tested PlGF MoM levels between 14 and 19 weeks, including
254 patients in total. Their study included 27 patients with preeclampsia and 227 who
had normal pregnancy outcomes. They found the median (IQR) for patients who
developed preeclampsia to be 0.55 (0.33-0.85) MoM compared with normal pregnancy,
which was 1.00 (0.71-1.32) MoM. ROC curves in this study showed AUC 0.76, sensitivity
70% and specificity 70% for the prediction of preeclampsia using MoM values. They
concluded that a decreased maternal serum PlGF concentration in the early second
trimester is highly associated with subsequent development of preeclampsia, but that
larger prospective studies are required to explore its predictive value. Tidwell (Tidwell
et al. 2001) looked at changes throughout gestation of serum PlGF levels among women
who developed preeclampsia and found that women who develop preeclampsia have
lower PlGF during all three trimesters when compared with unaffected pregnancies.
107
Maternal PlGF levels were collected between 5 and 15 weeks gestation, 16 and 20 weeks
gestation and 26 and 30 weeks gestation. Among the group who had samples taken
between 16 and 20 weeks gestation, 10 developed mild preeclampsia, 4 developed
severe preeclampsia and there were 25 controls, with a total of 39 patients analysed in
total. They concluded that PlGF may be used as a preclinical indicator for preeclampsia.
Using ROC curves, the optimal cutoff to detect women with preeclampsia between 16
and 20 weeks gestation was ≤90pg/mL, with sensitivity 66.7% and specificity 88.9%.
They found that gestational age significantly influenced serum PlGF levels, with
statistically significant differences in mean PlGF levels between the three groups tested,
with patients with normal pregnancy, mild preeclampsia and severe preeclampsia
having progressively lower levels. PlGF levels were significantly reduced in patients with
preeclampsia from around 15 weeks gestation, well prior to clinical manifestations of
preeclampsia becoming evident, with levels reducing further as gestation advanced.
Tjoa (Tjoa et al. 2001) tested for PlGF between 11 and 21 weeks gestation. They divided
their patient population into three groups based on gestational age. Forty patients
between 17 and 21 weeks were analysed in total. Of these, 25 had a normal pregnancy
outcome, 10 developed preeclampsia and 5 developed intrauterine growth restriction.
They found a significantly lower PlGF level in patients who later developed preeclampsia
compared with unaffected pregnancies, when tested between 17 and 21 weeks. PlGF
levels were measured between 17 and 21 weeks across the same three outcome groups,
there was a statistically significant difference in results obtained between the three
groups (p = 0.004). These differences were not found between 14 and 17 weeks
gestation.
Polliotti (Polliotti et al. 2003) performed a case-control study including patients who
developed early onset preeclampsia requiring delivery prior to 34 weeks. Overall, they
included 20 cases with samples collected between 14 and 21 weeks gestation who went
on to develop early onset preeclampsia and compared them with 60 normal controls.
From the 25 samples collected between 18 and 21 weeks gestation, 6 developed severe
early onset preeclampsia. They found that PlGF levels were significantly lower in
patients with early onset preeclampsia compared with unaffected controls. ROC curves
demonstrated predictive performance 0.799 for PlGF.
108
When used in isolation to predict early onset preeclampsia, PlGF has been shown to be
more accurate when tested in the second trimester than the first trimester (Tjoa et al.
2001; Ghosh et al. 2013; Lambert-Messerlian 2014). Ghosh (Ghosh et al. 2013) tested
serum PlGF between 11 and 14 weeks and between 22 and 24 weeks to determine which
was more effective as a biomarker to predict early onset preeclampsia requiring delivery
prior to 32 weeks. 1244 patients had PlGF samples taken between 11 and 14 weeks,
while 1206 patients had samples taken between 22 and 24 weeks gestation. There were
19 cases of early onset preeclampsia requiring delivery before 32 weeks. They used ROC
curves to establish optimal cutoffs to determine a positive test for each gestational
group. Values for AUC, sensitivity and specificity of PlGF <144pg/mL between 22 and 24
weeks were 0.980, 84% and 78%, respectively, which were significantly higher than for
serum PlGF <228pg/mL between 11 and 14 weeks, which gave values of 0.972, 58% and
66%, respectively. It was concluded that PlGF between 22 and 24 weeks gestation was
more strongly predictive of early onset preeclampsia than PlGF testing between 11 and
14 weeks for the prediction of preeclampsia requiring delivery prior to 32 weeks.
Lambert-Messerlian (Lambert-Messerlian 2014) performed a case-control study
comparing PlGF values, which they converted to MoM, and other biomarkers collected
at 12 and 16 weeks gestation in patients who developed preeclampsia with controls.
They included 98 patients with the outcome of preeclampsia, and 620 control
pregnancies. These samples were then analysed for PlGF and a range of other
biomarkers. PlGF levels were significantly reduced in patients with preeclampsia in both
first and second trimester, and the effect was magnified when looking at early onset
preeclampsia. PlGF was strongly associated with early onset preeclampsia in the second
trimester and was also less strongly associated with other outcomes. For early onset
preeclampsia, reductions in PlGF were more pronounced in the second than in the first
trimester, a finding that is in agreement with a recent meta-analysis (Kleinrouweler et
al. 2012). Shim (Shim et al. 2015) compared PlGF levels in 37 patients who had samples
collected between 16 and 23 weeks and subsequently developed preeclampsia, with 37
matched controls. They found that midpregnancy plasma PlGF levels were significantly
lower in patients who subsequently developed preeclampsia (87.1 pg/mL [14.2-774.3],
p<0.001) compared with those that did not (148.8 pg/mL [57.2-425.6], p<0.001). They
also found that midpregnancy PlGF levels were lower in women who developed severe

109
preeclampsia (70.2 pg/mL [14.2-257.5], p<0.001) than those that had mild preeclampsia
(122.4 pg/mL [57.9-774.3], p<0.001).
PlGF has been clinically validated for confirming the diagnosis of preeclampsia in
patients who present with symptoms, and to stratify risk as to the likelihood that
delivery will be required within a fortnight (Chappell et al. 2013). The PELICAN study in
2013 (Chappell et al. 2013) demonstrated an AUC 0.87, with sensitivity 96% (95% CI 89%-
99%) and negative predictive value 98% (95 % CI 93%-99.5%) for PlGF tested in women
symptomatic for preeclampsia. Despite these very compelling findings, it has taken a
long time for PlGF testing to be implemented into clinical practice, with very few
countries in the world using the test in everyday clinical practice. With a range of
commercial automated assays being made available within the last decade, there have
been concerns from governing bodies internationally regarding the appropriate
utilisation of biomarker testing for the diagnosis and prediction of preeclampsia, with
the consensus to fully determine their clinical utility prior to implementation (Meads et
al. 2008; Henderson et al. 2017; Brown et al. 2018).
In this chapter, the intention was to determine whether PlGF, when tested using one of
three commercially available immunoassay platforms, performs well as a predictive test
for preeclampsia when tested at midpregnancy. Subsequently, the clinical validity of this
test for prediction of preeclampsia at midpregnancy was evaluated.
3.2 Methods
Methods described in Chapter 2 were followed.
3.2.1 Study population
Refer to section 2.2
3.2.2 Blood sample collection and storage
Refer to section 2.3
110
3.2.3 Outcome measures
The main outcome of interest was the development of preeclampsia, as defined by the
ISSHP (Brown et al. 2018). More specifically, preeclampsia was classified according to
gestation at the time of delivery, not the time of onset, as early onset preeclampsia
(<34weeks), preterm preeclampsia (<37weeks) and term preeclampsia (≥37weeks).
Secondary outcomes including placental abruption, fetal growth restriction (FGR) and
stillbirths greater than 24 weeks gestation were also analysed. FGR was diagnosed if one
of the following factors was present: doppler cerebroplacental ratio (CPR) less than the
5th centile, UAPI greater than the 95th centile or EFW <3rd centile (Figueras and Gratacos
2014).
3.2.4 Statistical analysis
In addition to the analyses described in Chapter 2, median raw data and MoM values for
PlGF were compared between patients with preeclampsia and unaffected pregnancies
using the Mann-Whitney U test. P-values <0.05 were deemed to be statistically
significant. Screening performances for PlGF raw data and MoM values were then
evaluated using receiver operating characteristic (ROC) curves to calculate the area
under the curve (AUC). Coordinates of the ROC curves were used to identify PlGF values
for the prediction of term (≥37 weeks), preterm (<37weeks) and early (<34weeks)
preeclampsia. Selected cut-off values were chosen for each immunoassay platform, with
biomarker values with the highest sensitivity and specificity chosen as optimal cut-off
points for a positive test. True positive and true negative results were assessed using 2
x 2 contingency tables, followed by diagnostic test evaluation using an online calculator
(MedCalc®). Sensitivity, specificity, positive predictive value (PPV) and negative
predictive value (NPV) were then determined for PlGF levels performed on each
immunoassay platform for the prediction of preeclampsia. Clinical outcomes for
patients who had true positive, false negative and false positive results were clinically
correlated with PlGF test results in order to assess the clinical utility for each platform
in our patient population.

111
Maternal Characteristics
Unaffected (n=487)
PE < 34 weeks (n=3)
PE < 37 weeks (n=8)
PE ≥ 37 weeks (n=17)
Maternal age in years 35.4 (31.2-38.3) 35.7 (33.3-36.9) 33.8 (30.0-36.0) 33.1 (29.5-35.4) Maternal weight in kg 68.2 (62.0-78.0) * 96.0 (84.0-97.0) 85.5 (70.5-97.0) * 76.0 (64.0-93.0)
Maternal height in cm 164.8 (160.0-
169.0) 164.0 (160.0-
167.3) 163.3 (157.8-
169.3) 164 (163-167)
BMI
25.2 (23.0-28.4) * 33.7 (30.3-36.6) * 32.1 (27.3-34.8) * 28.7 (23.8-34.6)
GA in weeks
20.3 (20.0-20.9) 20.7 (20.4-21.0) 20.3 (20.1-21.0) 20.6 (20.1-21.3)
GA at delivery
39.3 (38.1-40.4) * 30.1 (29.2-31.1) * 35.9 (31.1-36.3) * 38.14 (37.7-39.1)
Racial origin, n (%)
Caucasian
366 (75.2) 2 (66.6) 5.0 (62.5) 15.0 (88.2)
Afro-Caribbean
17.0 (3.5) 0.0 1.0 (12.5) 0.0
South Asian 40.0 (8.2) 0.0 1.0 (12.5) 0.0 East Asian 41.0 (8.4) 1 (33.3) 1.0 (12.5) 2.0 (11.8)
Mixed 23.0 (4.7) 0.0 0.0 0.0 Medical History, n (%) Chronic hypertension 17 (3.5) 1 (33.3) 3 (37.5) * 0.0 Diabetes Mellitus, n
(%)
Type 1 14 (2.9) 1(33.3) 1 (12.5) 3 (17.6) * Type 2 8 (1.6) 0.0 1 (12.5) 0.0
Gestational Diabetes 22 (4.5) 0.0 2 (25.0) 0.0 SLE 2 (0.4) 0.0 0.0 0.0 APS 3 (0.6) 0.0 0.0 1 (5.9)
Cigarette smokers, n (%)
33 (6.8) 0.0 1 (12.5) 2 (11.8)
Family history of PE, n (%)
33 (6.8) 0.0 0.0 1 (5.9)
Parity, n (%) Nulliparous 206 (42.3) 1 (33.3) 1 (12.5) 11 (64.7)
Parous with no previous PE
248 (50.9) 2 (66.6) 4 (50.0) 4 (23.5)
Parous with previous PE
33 (6.8) 0.0 3 (37.5) * 2 (11.8)
Infant Characteristics
Birthweight (g)* 3351.0 (3028.0-
3690.0) 1193.0 (1088.0-
1244.0) * 2114.0 (1244.0-
3161.5) * 3420.0 (3192.0-
3680.0)
\
PE = preeclampsia; GA = gestational age; BMI = body mass index; SLE = systemic lupus erythematosus; APS = antiphospholipid syndrome. Values reported in median (interquartile range) unless otherwise stated. * p<0.05 when compared to the unaffected group Table 11. Characteristics of the study population for midpregnancy prediction of preeclampsia.

112
3.3 Results
3.3.1 Descriptive statistics
The characteristics of the study population are summarised in Table 11.
When compared to women with unaffected pregnancies, women with early onset or
preterm preeclampsia had significantly higher BMI, while gestational age at delivery and
infant birthweights were significantly lower in these groups. Women with preterm
preeclampsia were more likely to have higher median maternal weight, to have
underlying chronic hypertension and to be parous with a previous history of
preeclampsia when compared with unaffected pregnancies. Patients with term
preeclampsia were more likely to have type 1 diabetes than patients with unaffected
pregnancies.
There were 600 patients recruited for the overall research study, and of these, 88 were
excluded from analysis. Seven exclusions occurred due to diagnosis of aneuploidy or
major fetal anomaly, and 81 exclusions were due to incomplete data, leaving 512
patients for inclusion in the analysis. There were 25 patients (4.9%) with preeclampsia,
including 17 patients (3.3%) with term preeclampsia (≥37 weeks), 8 patients (1.6%) with
preterm preeclampsia (<37 weeks) and 3 patients (0.6%) with early onset preeclampsia
(<34 weeks) (Figure 27). Details for the patients with early onset, preterm and term
preeclampsia are summarised in Table 12 and 13.
There were 49 cases of preterm delivery within the cohort. 39 of these were delivered
preterm (< 37 weeks), while 10 required early delivery (<34 weeks). There were 64 cases
of babies delivered who were small for gestational age (SGA). Of these, 48 were
delivered at term, 16 preterm and 4 required early onset delivery prior to 34 weeks. 13
of the 16 cases (81.3%) who were small for gestational age were confirmed to have fetal
growth restriction (FGR), discussed further in Chapter 5. Five of the 8 cases with preterm
preeclampsia (62.5%) and all 3 of the cases with early onset preeclampsia (100%) had
coexisting preterm FGR. None of the patients with term preeclampsia had FGR.

113
Figure 27. Patients who developed preeclampsia from those included for analysis.
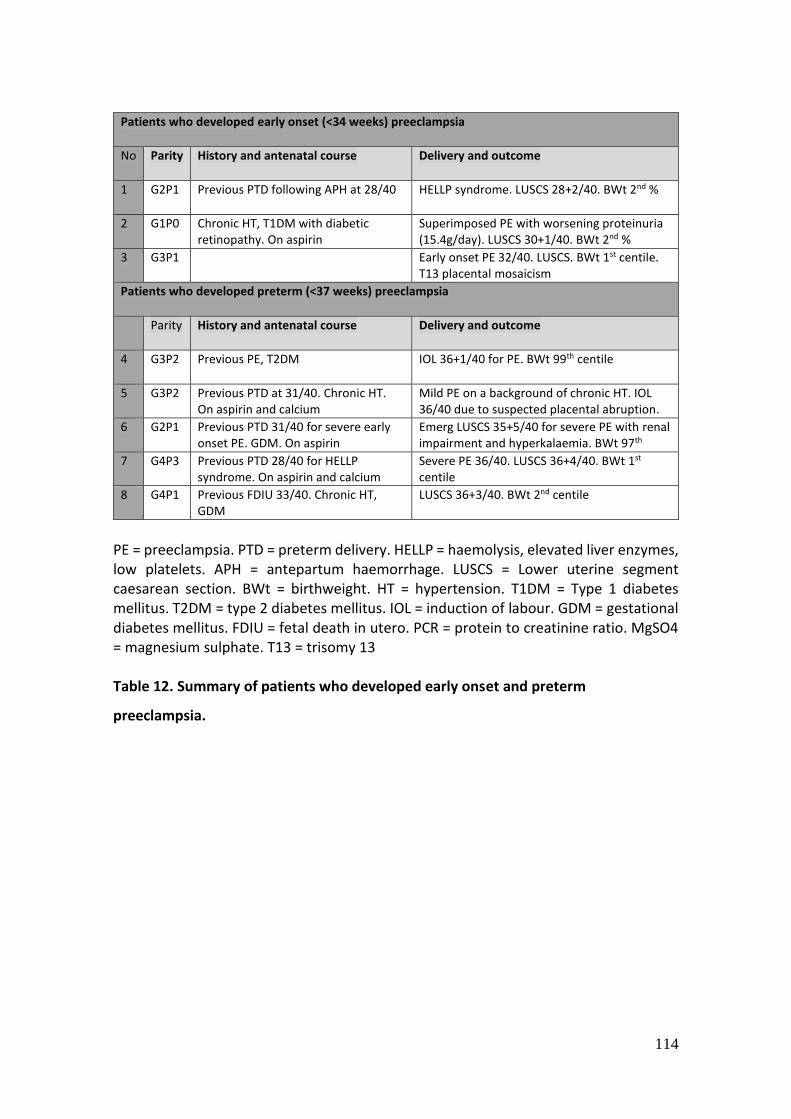
114
Patients who developed early onset (<34 weeks) preeclampsia
No Parity History and antenatal course
Delivery and outcome
1 G2P1 Previous PTD following APH at 28/40 HELLP syndrome. LUSCS 28+2/40. BWt 2nd %
2 G1P0 Chronic HT, T1DM with diabetic retinopathy. On aspirin
Superimposed PE with worsening proteinuria (15.4g/day). LUSCS 30+1/40. BWt 2nd %
3 G3P1 Early onset PE 32/40. LUSCS. BWt 1st centile. T13 placental mosaicism
Patients who developed preterm (<37 weeks) preeclampsia
Parity History and antenatal course
Delivery and outcome
4 G3P2 Previous PE, T2DM IOL 36+1/40 for PE. BWt 99th centile
5 G3P2 Previous PTD at 31/40. Chronic HT. On aspirin and calcium
Mild PE on a background of chronic HT. IOL 36/40 due to suspected placental abruption. BWt 88th centile. 6 G2P1 Previous PTD 31/40 for severe early
onset PE. GDM. On aspirin Emerg LUSCS 35+5/40 for severe PE with renal impairment and hyperkalaemia. BWt 97th centile 7 G4P3 Previous PTD 28/40 for HELLP
syndrome. On aspirin and calcium Severe PE 36/40. LUSCS 36+4/40. BWt 1st centile
8 G4P1 Previous FDIU 33/40. Chronic HT, GDM
LUSCS 36+3/40. BWt 2nd centile
PE = preeclampsia. PTD = preterm delivery. HELLP = haemolysis, elevated liver enzymes, low platelets. APH = antepartum haemorrhage. LUSCS = Lower uterine segment caesarean section. BWt = birthweight. HT = hypertension. T1DM = Type 1 diabetes mellitus. T2DM = type 2 diabetes mellitus. IOL = induction of labour. GDM = gestational diabetes mellitus. FDIU = fetal death in utero. PCR = protein to creatinine ratio. MgSO4 = magnesium sulphate. T13 = trisomy 13 Table 12. Summary of patients who developed early onset and preterm
preeclampsia.

115
Patients who developed term (≥37 weeks) preeclampsia
Parity History and antenatal course
Delivery and outcome
9 G4P2
Previous PTD 36/40 due to PE and IUGR
Late onset PE. LUSCS 37+4. BWt 23rd%
10 G2P0
Severe PE/HELLP syndrome 38+1/40 (urine PCR 0.10, low haptoglobin, ↑ ALT, ↓platelets (112). Required MgSO4. IOL. BWt 65th % 11 G4P0
Late onset PE 41/40. IOL 41/40. BWt 58th %
12 G2P0
Smoker Late onset PE. LUSCS 38+4/40. BWt 30th%
13 G1P0
T1DM. Normal urine PCR early pregnancy
Late onset PE. LUSCS 37+6. BWt 95th%
14 G4P0
Late onset PE, IOL 39+4/40. BWt 72nd%
15 G1P0
Late onset PE, LUSCS 39+5/40. BWt 95th%
16 G1P0
T1DM Late onset PE. LUSCS 38+4/40. BWt 99th%
17 G1P0
T1DM, hypothyroidism Late onset PE. Code green LUSCS for high lactate 37+5/40. BWt 99th%. Placenta: prominent syncytial knots, indicating uteroplacental ischaemia. 18 G2P1
Smoker. GDM Late onset PE. IOL 37+5/40. BWt 85th%
19 G2P0
Late onset PE. IOL 38+6/40. BWt 45th%
20 G3P2
Late onset PE. IOL 37+0/40. BWt 45th%
21 G3P0
APS. On clexane 1st trimester Late onset PE. IOL 41+4/40. BWt 17th%
22 G3P2
Grave’s disease. On carbimazole
Intrapartum PE. IOL 39+1/40. BWt 80th%
23 G2P1
Previous severe PE 38/40 requiring MgSO4. On aspirin
Late onset PE. IOL 37+1/40. BWt 70th%
24 G1P0
Epilepsy Late onset PE. BWt 62nd%
25 G3P2
Previous 21/40 loss. Elective cervical cerclage, removed 37/40.
Late onset PE. IOL 37+1/40. BWt 91st%
PE = preeclampsia. PTD = preterm delivery. HELLP = haemolysis, elevated liver enzymes, low platelets. APH – antepartum haemorrhage. LUSCS = Lower uterine segment caesarean section. BWt = birthweight. HT = hypertension. T1DM = Type 1 diabetes mellitus. T2DM = type 2 diabetes mellitus. IOL = induction of labour. GDM = gestational diabetes mellitus. FDIU = fetal death in utero. PCR = protein to creatinine ratio. MgSO4 = magnesium sulphate. APS = antiphospholipid syndrome. Table 13. Summary of patients who developed term preeclampsia.

116
There were 10 cases of placental abruption, 4 of which occurred at term, 6 occurred
prior to 37 weeks and 1 of these occurred prior to 34 weeks. There was 1 stillbirth at 39
weeks, which occurred secondary to placental abruption.
Table 14 displays patients who delivered preterm who had at least one adverse
outcome, including preterm preeclampsia, placental abruption, preterm fetal growth
restriction or stillbirth.
For patients who developed preterm preeclampsia, one also had a placental abruption
(patient 5 in Table 12), and 5 had preterm FGR, based on delivering babies with
birthweights less than the 3rd centile (see Table 12 and 14). Of the remaining 9 patients
who had a placental abruption, 1 was associated with stillbirth at 39/40 (see Table 14
and 19). 8 preterm abruptions occurred in the absence of any other complication (Table
14). Of the remaining 12 patients with preterm FGR, again these occurred in the absence
of any other complication (Table 14).
There were 52 patients (10%) within the cohort that were taking low dose aspirin
antenatally. Clinical history, outcomes and biomarker results for these patients are
outlined in Appendix 1. Patient 1 in the table went on to develop early onset
preeclampsia, while patients 2-9 developed late onset preeclampsia. Patients 10-16
delivered neonates who were either SGA (patients 13-16) or had FGR (patients 10-12).
Patients 17-26 had poor obstetric histories and had each experienced a fetal death in
utero in a previous pregnancy. These patients had normal outcomes for the current
pregnancy. Patients 27-42 had either significant risk factors for the development of
preeclampsia or for a poor pregnancy outcome. The majority of these patients had a
good outcome for the current pregnancy, except patient 32 who had a preterm delivery
(36+6 weeks) and patient 35 who developed PPROM and chorioamnionitis requiring
delivery at 25+4 weeks. Patients 43 to 51 had no significant risk factors for development
of preeclampsia and achieved good outcomes for the current pregnancy.

117
3.3.2 Comparison studies for PlGF between patients who developed preeclampsia
and unaffected pregnancies
Patients who developed preterm or early onset preeclampsia had significantly lower
PlGF values, both raw data values and MoM values at the time of testing across all three
platforms (p<0.05) when compared with unaffected pregnancies (Table 15).
This finding is demonstrated in Figure 28. When looking at results from each platform
for PlGF raw data values, patients that did not develop preeclampsia and patients who
subsequently developed preeclampsia at term had second trimester PlGF results at
around the same level. Patients who went on to develop early or preterm preeclampsia
had significantly lower second trimester PlGF levels when compared with unaffected
patients or those with term preeclampsia. Similarly, when looking at results from each
platform for PlGF MoM values, patients that did not develop preeclampsia and patients
who subsequently developed preeclampsia at term had second trimester PlGF results
around 1.0 MoM. Patients who went on to develop early or preterm preeclampsia had
significantly lower second trimester PlGF results when compared with unaffected
patients or those with term preeclampsia, with values around 0.5 MoM and 0.8 MoM,
respectively.

118
Outcome No composite outcome Preterm PE Placental abruption Preterm FGR Stillbirth
476
Preterm PE 2 1 5 0
Placental abruption 1 8 0 1
Preterm FGR 5 0 12 0
Stillbirth 0 1 0 0
TOTAL 476 (93%) 8 (1.6%) 10 (2%) 17(3.4%) 1 (0.2%)
Table 14. Composite adverse outcomes. 36 patients (7%) experienced adverse outcomes including preterm preeclampsia (PE), preterm fetal
growth restriction (FGR), placental abruption or stillbirth. 14 patients (2.7%) experienced more than one of these adverse outcomes.

119
Angiogenic Markers Unaffected (n=487) PE ≥ 37 weeks (n=17) p-value PE < 37 weeks (n=8) p-value PE < 34 weeks (n=3) p-value
Delfia PlGF
Raw data 166.9 (125.1-231.0) 183.7 (142.6-266.0) 0.457 95.5 (42.2-171.7) * 0.018 47.9 (34.2-81.9) * 0.010
MoM 1.0 (0.9-1.1) 1.1 (0.9-1.2) 0.385 0.8 (0.6-1.0) * 0.010 0.5 (0.4-0.7) * 0.020
Cobas PlGF
Raw data 248.5 (183.9-332.8) 273.7 (196.7-339.7) 0.310 161.3 (60.9-215.6) * 0.008 54.7 (52.2-116.4) * 0.012
MoM 1.0 (0.9-1.1) 1.1 (0.9-1.1) 0.215 0.8 (0.6-1.0) * 0.006 0.6 (0.5-0.8) * 0.023
Kryptor PlGF
Raw data 201.4 (152.3-276.1) 204.2 (160.2-316.3) 0.638 127.9 (54.3-206.0) * 0.015 48.8 (47.4-96.7) * 0.010
MoM 1.0 (0.9-1.1) 1.0 (0.9-1.1) 0.495 0.8 (0.7-0.9) * 0.008 0.6 (0.5-0.8) * 0.020 Units for PlGF are in pg/mL. All values are reported as median (interquartile ranges). * p<0.05 when compared to the unaffected group PE = preeclampsia. MoM = multiples of the median
Table 15. Comparison of PlGF raw data and MoM values between patients with term, preterm and early onset preeclampsia and unaffected pregnancies.

120
Figure 28. Comparison of PlGF raw data and MoM levels between patients with early onset (<34 weeks), preterm (<37 weeks) and term
(≥37 weeks) preeclampsia and unaffected pregnancies.
Pregnancies that developed PE
25 (4.9%) overall PE
17 (3.3%) term (≥37 weeks) PE
8 (1.6%) preterm (<37 weeks) PE
3 (0.6%) early onset (<34 weeks) PE
121
3.3.3 Performance of PlGF for the prediction of preeclampsia
Having established that both PlGF and PlGF MoM are significantly lowered in women
who develop early onset and preterm preeclampsia, the predictive properties of PlGF at
midpregnancy using three different commercially available platforms were compared
using ROC curve analysis. ROC curves demonstrate the ability of placental biomarkers to
differentiate patients with preeclampsia from normal pregnancies. When interpreting
results, the value 1.0 represents 100% sensitivity and specificity for a given test, and the
value 0.50 indicates that a test has no discriminatory power (Zweig and Campbell 1993).
As indicated in Figure 29, when used to predict term preeclampsia, PlGF raw data values
gave AUC values for the Delfia, Cobas and Kryptor platforms of 0.553, 0.572 and 0.534,
respectively. PlGF MoM values gave AUC values for the Delfia, Cobas and Kryptor
platforms of 0.562, 0.588 and 0.549, respectively.
When used to predict preterm preeclampsia, PlGF raw data values gave AUC values for
the Delfia, Cobas and Kryptor platforms of 0.745, 0.774 and 0.751 respectively. PlGF
MoM values gave AUC values for the Delfia, Cobas and Kryptor platforms of 0.768, 0.786
and 0.774 respectively (Figure 30).
When used to predict early onset preeclampsia, PlGF raw data values gave AUC values
for the Delfia, Cobas and Kryptor platforms of 0.929, 0.922 and 0.931 respectively. PlGF
MoM values gave AUC values for the Delfia, Cobas and Kryptor platforms of 0.889, 0.880
and 0.889 respectively (Figure 31).

122
Figure 29. ROC curves for prediction of term (≥37 weeks) preeclampsia using PlGF raw data and MoM values.
Pregnancies that developed PE
25 (4.9%) overall PE
17 (3.3%) term (≥37 weeks) PE
8 (1.6%) preterm (<37 weeks) PE
3 (0.6%) early onset (<34 weeks) PE

123
Figure 30. ROC curves for prediction of preterm (<37weeks) preeclampsia using PlGF raw data and MoM values.
Pregnancies that developed PE
25 (4.9%) overall PE
17 (3.3%) term (≥37 weeks) PE
8 (1.6%) preterm (<37 weeks) PE
3 (0.6%) early onset (<34 weeks) PE

124
Figure 31. ROC curves for prediction of early onset (<34weeks) preeclampsia using PlGF raw data and MoM values.
Pregnancies that developed PE
25 (4.9%) overall PE
17 (3.3%) term (≥37 weeks) PE
8 (1.6%) preterm (<37 weeks) PE
3 (0.6%) early onset (<34 weeks) PE

125
Assay AUC Sensitivity (95% CI) Specificity (95% CI) PPV (95% CI) NPV (95% CI)
Delfia PlGF
Early Onset PE1 0.93 100 (29.2-100) 80.75 (77.05-84.08) 2.97 (2.50-3.53) 100
Preterm PE1a
0.75 62.5 (24.5-91.5) 80.56 (76.83-83.92) 4.85 (2.82-8.24) 99.27 (98.22-99.70)
Delfia PlGF MoM
Early Onset PE2 0.89 100 (29.2-100) 68.17 (63.93-72.20) 1.82 (1.60-2.06) 100
Preterm PE2a
0.77 62.50 (24.49-91.48) 85.12 (81.71-88.11) 6.25 (3.61-10.60) 99.31 (98.32-99.72)
Cobas PlGF
Early Onset PE3 0.92 100 (29.2-100) 77.80 (73.93-81.34) 2.59 (2.21-3.03) 100
Preterm PE3a
0.77 75.00 (34.91-96.81) 73.21 (69.12-77.03) 4.26 (2.82-6.37) 99.46 (98.23-99.84)
Cobas PlGF MoM
Early Onset PE4 0.88 100 (29.2-100) 64.64 (60.31-68.79) 1.64 (1.46-1.70) 100
Preterm PE4a
0.79 62.5 (24.49-91.48) 87.10 (83.86-89.90) 7.14 (4.12-12.11) 99.32 (98.35-99.72)
Kryptor PlGF
Early Onset PE5 0.93 100 (29.24-100) 80.55 (76.84-83.90) 2.94 (2.48-3.49) 100
Preterm PE5a
0.75 75 (34.9-96.8) 71.43 (67.27-75.34) 4.00 (2.66-5.98) 99.45 (98.19-99.83)
Kryptor PlGF MoM
Early Onset PE6 0.89 100 (29.2-100) 67.78 (63.53-71.82) 1.80 (1.59-2.03) 100
Preterm PE6a
0.77 62.5 (24.5-91.5) 90.28 (87.35-92.72) 9.26 (5.31-15.67) 99.34 (98.41-92.32)
Pregnancies that developed PE
25 (4.9%) overall PE
17 (3.3%) term (≥37 weeks) PE
8 (1.6%) preterm (<37 weeks) PE
3 (0.6%) early onset (<34 weeks) PE
PlGF concentration is in pg/mL. PE = preeclampsia. Early onset = <34 weeks. Preterm = <37 weeks. AUC = area under the curve. CI = confidence intervals. PPV = positive predictive value. NPV = negative predictive value Positive test defined as 1 PlGF <115.9; 1a PlGF <115.9; 2 PlGF MoM <0.925; 2a PlGF MoM <0.815; 3 PlGF <178.2; 3a PlGF <191.2; 4 PlGF MoM <0.945; 4a PlGF MoM <0.815; 5 PlGF <144.8; 5a PlGF <161.2; 6 PlGF MoM <0.935; 6a PlGF MoM <0.795
Table 16. Clinical characteristics for PlGF raw data and MoM values for prediction of early onset and preterm preeclampsia.

126
3.3.4 Sensitivity and specificity analysis for prediction of preeclampsia using PlGF
Sensitivity and specificity for the prediction of preeclampsia were calculated for the
Delfia, Cobas and Kryptor assays using selected cut-off values from the ROC curves. Two
cut-off points were determined for each platform. The first was the point that gave the
highest sensitivity and specificity for prediction of patients with preterm preeclampsia
and will be referred to as the preterm PE cut-off. The second was the point that gave the
highest sensitivity and specificity for prediction of patients with early onset
preeclampsia and will be referred to as the early PE cut-off.
PlGF testing at midpregnancy for the prediction of term preeclampsia (Figure 29) yielded
AUC values for each platform that were close to 0.50, indicating poor discriminatory
power to predict term preeclampsia when tested at midpregnancy. Hence further
analysis for this group was not performed.
PlGF testing at midpregnancy for the prediction of early onset and preterm preeclampsia
showed much better discriminatory power for this outcome, with AUC exceeding 0.92
and 0.77, respectively, for each platform (see Table 16).
When using PlGF in isolation for the prediction of early onset preeclampsia, PlGF raw
data values performed best, with AUC for the Delfia, Cobas and Kryptor platforms at
0.93, 0.92 and 0.93, respectively. Clinical characteristics for PlGF raw data values for the
prediction of early onset preeclampsia for the Delfia, Cobas and Kryptor platforms were
as follows: sensitivity 100, 100, 100; specificity 80.75, 77.8, 80.55; positive predictive
value (PPV) 2.97, 2.59, 2.94 and negative predictive value (NPV) 100, 100, 100.
When using PlGF in isolation for the prediction of preterm preeclampsia, PlGF MoM
values performed best, with AUC for the Delfia, Cobas and Kryptor platforms at 0.77,
0.79 and 0.77, respectively. Clinical characteristics for PlGF MoM for the prediction of
preterm preeclampsia for the Delfia, Cobas and Kryptor platforms were as follows:
sensitivity 62.5, 62.5, 62.5; specificity 85.12, 87.1, 90.28; PPV 6.25, 7.14, 9.26; NPV 99.3,
99.3, 99.3.

127
3.3.5 PlGF raw data values for the prediction of early onset preeclampsia
For the prediction of early onset preeclampsia, PlGF raw data values had the highest
AUC and performed best in terms of clinical characteristics (Table 16). The prediction of
early preeclampsia using raw data values from the Delfia, Cobas and Kryptor platforms
involved different cut-offs for each platform, derived from the ROC curves, with cut-offs
chosen to maximise test sensitivity and specificity. The cut-offs for early onset
preeclampsia for each platform were as follows: <115.9pg/mL for Delfia; <178.2pg/mL
for Cobas and <144.8pg/mL for Kryptor, respectively.
The numbers of false positives, true positives, false negatives and true negatives for each
platform in the prediction of both early onset and preterm preeclampsia are
summarised in Table 17.
Looking at true positive results detected using raw data values and these cut-offs, all 3
cases with early onset preeclampsia (patients 1,2,3 in Table 18) were detected for each
platform. An additional 2 patients with preterm preeclampsia (4 and 8 in Table 18) were
also detected, resulting in 3/8 (100%) cases of early onset preeclampsia and 5/8 (62.5%)
cases of preterm preeclampsia being captured. This cut-off also detected 3 cases of term
preeclampsia for the Delfia and Kryptor platforms (patients 13,16,20 from Table 18), and
4 for the Cobas platform (patients 13,16,20 and 25 from Table 18).
Using the cut-offs for prediction of early preeclampsia using raw data values, for all three
platforms there were 3/8 cases of preterm preeclampsia that had a false negative result,
however none of these developed early onset preeclampsia (patients 5,6,7 in Table 18).
For all 3 platforms, there was one patient who developed HELLP syndrome at term
(patient 10 in Table 18) who had a negative result.

128
Using PlGF cut-off for early onset PE
Using PlGF cut-off for preterm PE
Using sFlt1/PlGF ratio cut-off for early onset PE
Using sFlt1/PlGF ratio cut-off for preterm onset PE
Delfia PlGF FP 103 TP 3 FN 0 TN 406
Delfia PlGF FP 101 TP 5 FN 3 TN 403
Cobas sFlt1/PlGF ratio FP 23 TP 3 FN 0 TN 486
Cobas sFlt1/PlGF ratio FP 174 TP 5 FN 3 TN 330
Delfia PlGF MoM FP 170 TP 3 FN 0 TN 339
Delfia PlGF MoM FP 76 TP 5 FN 3 TN 428
Cobas sFlt1/PlGF ratio MoM FP 50 TP 3 FN 0 TN 459
Cobas sFlt1/PlGF ratio MoM FP 56 TP 5 FN 3 TN 448
Cobas PlGF FP 119 TP 3 FN 0 TN 390
Cobas PlGF FP 139 TP 6 FN 2 TN 365
Kryptor sFlt1/PlGF ratio FP 92 TP 3 FN 0 TN 417
Kryptor sFlt1/PlGF ratio FP 171 TP 5 FN 3 TN 333
Cobas PlGF MoM FP 188 TP 3 FN 0 TN 321
Cobas PlGF MoM FP 65 TP 5 FN 3 TN 439
Kryptor sFlt1/PlGF ratio MoM FP 66 TP 3 FN 0 TN 443
Kryptor sFlt1/PlGF ratio MoM FP 92 TP 5 FN 3 TN 412
Kryptor PlGF FP 104 TP 3 FN 0 TN 405
Kryptor PlGF FP 149 TP 6 FN 2 TN 355
Kryptor PlGF MoM FP 173 TP 3 FN 0 TN 336
Kryptor PlGF MoM FP 49 TP 5 FN 3 TN 455
PE = preeclampsia, FP = false positive, TP = true positive, FN = false negative, TN = true negative
Table 17. Clinical characteristic summary table for preterm and early onset preeclampsia
Pregnancies that developed PE
25 (4.9%) overall PE
17 (3.3%) term (≥37 weeks) PE
8 (1.6%) preterm (<37 weeks) PE
3 (0.6%) early onset (<34 weeks) PE

129
PE = preeclampsia. PTD = preterm delivery. HELLP = haemolysis, elevated liver enzymes, low platelets. LUSCS = Lower uterine segment caesarean section. BWt = birthweight. FGR = fetal growth restriction. LGA = large for gestational age. HT = hypertension. T1DM = Type 1 diabetes mellitus. T2DM = type 2 diabetes mellitus. IOL = induction of labour. GDM = gestational diabetes mellitus. FDIU = fetal death in utero. PCR = protein to creatinine ratio. MgSO4 = magnesium sulphate ● = patient detected using cut-off for early PE (Table 16) ● = patient detected using cut-off for preterm PE (Table 16)
Table 18. True positive results for PlGF raw data and MoM values for the three platforms.
Patients who developed early onset PE
No Clinical information and outcome Positive PlGF result obtained
Delfia Cobas Kryptor
Raw data
MoM Raw data
MoM Raw data
MoM
1 G2P1, previous 28/40 delivery. HELLP syndrome 28+2/40. Emerg LUSCS. FGR 2nd centile
● ● ● ● ● ●
2 G1P0, chronic HT. T1DM, diabetic retinopathy. Superimposed PE, proteinuria 15g/d. LUSCS 30+1/40. FGR 2nd centile. On LDA.
● ● ●
3 G3P1. Early onset PE, LUSCS 32/40. FGR 1st centile ● ● ● ● ● ●
Patients who developed preterm PE
4 G3P2. previous PE, T2DM. IOL 36+1/40 for PE. LGA 99th centile ● ● ● ● ● ●
5 G3P2, previous PTD 31/40. Chronic HT. Mild PE, IOL 36+0/40. Normal BWt. On LDA and calcium.
6 G2P1, previous PTD 31/40 early onset PE. GDM. Severe PE with renal impairment. LUSCS 35+5/40. LGA 97th centile. On LDA.
7 G4P3, previous HELLP 28/40. Severe PE 36+4/40. FGR 1st centile. On LDA and calcium.
● ● ●
8 G4P1. Previous FDIU 33/40. Chronic HT, GDM. LUSCS 36+3/40. FGR 2nd centile. On LDA.
● ● ● ● ● ●
Patients who developed term PE
No Clinical information and outcome Positive PlGF result obtained
Delfia Cobas Kryptor
Raw data
MoM Raw data
MoM Raw data
MoM
9 G4P2, previous PTD 36/40 due to PE and FGR. Late onset PE, LUSCS 37+4. Normal BWt
10 G2P0. HELLP syndrome 38+1/40 (urine PCR 0.10, low haptoglobin, ↑ ALT, ↓platelets (112). Required MgSO4. IOL. Normal BWt
11 G4P0. Late onset PE 41/40, IOL. Normal BWt
12 G2P0. Late onset PE. LUSCS 38+4/40. Normal BWt
13 G1P0. T1DM. Late onset PE. LUSCS 37+6/40. LGA 95th% ● ● ● ●
14 G4P0. Late onset PE, IOL 39+4/40. Normal BWt
15 G1P0. Late onset PE, IOL 39+5/40. Normal BWt
16 G1P0. T1DM. Late onset PE, LUSCS 38+4/40. On LDA and calcium. ● ● ●
17 G1P0. T1DM. Late onset PE. Code green LUSCS 37+5/40 for high lactate. Placenta: prominent syncytial knots, indicating uteroplacental ischaemia
18 G2P1. Late onset PE. IOL 37+5/40. Normal BWt
19 G2P0. Late onset PE. IOL 38+6/40. Normal BWt
20 G3P2. Late onset PE. IOL 37+0/40. Normal BWt ● ● ●
21 G3P0. APLS, on clexane 1st trimester. Late onset PE. IOL 41+4/40. Normal BWt. On LDA.
22 G3P2. Intrapartum PE 39+1/40. Normal BWt
23 G2P1. Previous severe PE 38/40 requiring MgSO4. On LDA. Late onset PE. IOL 37+1/40. Normal BWt
24 G1P0. Late onset PE 38+4/40. Normal BWt
25 G3P2. Late onset PE. IOL 37+1/40. Normal BWt ●
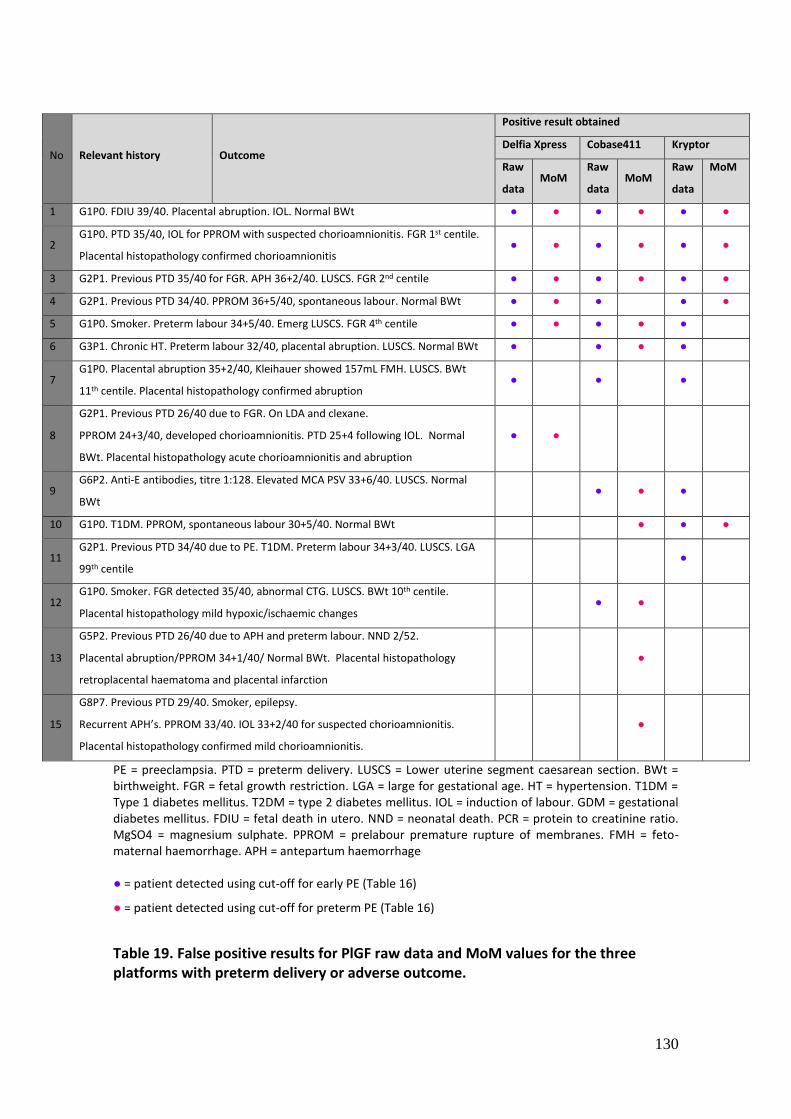
130
No Relevant history Outcome
Positive result obtained
Delfia Xpress Cobase411 Kryptor
Raw
data MoM
Raw
data MoM
Raw
data
MoM
1 G1P0. FDIU 39/40. Placental abruption. IOL. Normal BWt ● ● ● ● ● ●
2 G1P0. PTD 35/40, IOL for PPROM with suspected chorioamnionitis. FGR 1st centile.
Placental histopathology confirmed chorioamnionitis ● ● ● ● ● ●
3 G2P1. Previous PTD 35/40 for FGR. APH 36+2/40. LUSCS. FGR 2nd centile ● ● ● ● ● ●
4 G2P1. Previous PTD 34/40. PPROM 36+5/40, spontaneous labour. Normal BWt ● ● ● ● ●
5 G1P0. Smoker. Preterm labour 34+5/40. Emerg LUSCS. FGR 4th centile ● ● ● ● ●
6 G3P1. Chronic HT. Preterm labour 32/40, placental abruption. LUSCS. Normal BWt ● ● ● ●
7 G1P0. Placental abruption 35+2/40, Kleihauer showed 157mL FMH. LUSCS. BWt
11th centile. Placental histopathology confirmed abruption ● ● ●
8
G2P1. Previous PTD 26/40 due to FGR. On LDA and clexane.
PPROM 24+3/40, developed chorioamnionitis. PTD 25+4 following IOL. Normal
BWt. Placental histopathology acute chorioamnionitis and abruption
● ●
9 G6P2. Anti-E antibodies, titre 1:128. Elevated MCA PSV 33+6/40. LUSCS. Normal
BWt ● ● ●
10 G1P0. T1DM. PPROM, spontaneous labour 30+5/40. Normal BWt ● ● ●
11 G2P1. Previous PTD 34/40 due to PE. T1DM. Preterm labour 34+3/40. LUSCS. LGA
99th centile ●
12 G1P0. Smoker. FGR detected 35/40, abnormal CTG. LUSCS. BWt 10th centile.
Placental histopathology mild hypoxic/ischaemic changes ● ●
13
G5P2. Previous PTD 26/40 due to APH and preterm labour. NND 2/52.
Placental abruption/PPROM 34+1/40/ Normal BWt. Placental histopathology
retroplacental haematoma and placental infarction
●
15
G8P7. Previous PTD 29/40. Smoker, epilepsy.
Recurrent APH’s. PPROM 33/40. IOL 33+2/40 for suspected chorioamnionitis.
Placental histopathology confirmed mild chorioamnionitis.
●
PE = preeclampsia. PTD = preterm delivery. LUSCS = Lower uterine segment caesarean section. BWt = birthweight. FGR = fetal growth restriction. LGA = large for gestational age. HT = hypertension. T1DM = Type 1 diabetes mellitus. T2DM = type 2 diabetes mellitus. IOL = induction of labour. GDM = gestational diabetes mellitus. FDIU = fetal death in utero. NND = neonatal death. PCR = protein to creatinine ratio. MgSO4 = magnesium sulphate. PPROM = prelabour premature rupture of membranes. FMH = feto-maternal haemorrhage. APH = antepartum haemorrhage ● = patient detected using cut-off for early PE (Table 16)
● = patient detected using cut-off for preterm PE (Table 16)
Table 19. False positive results for PlGF raw data and MoM values for the three platforms with preterm delivery or adverse outcome.
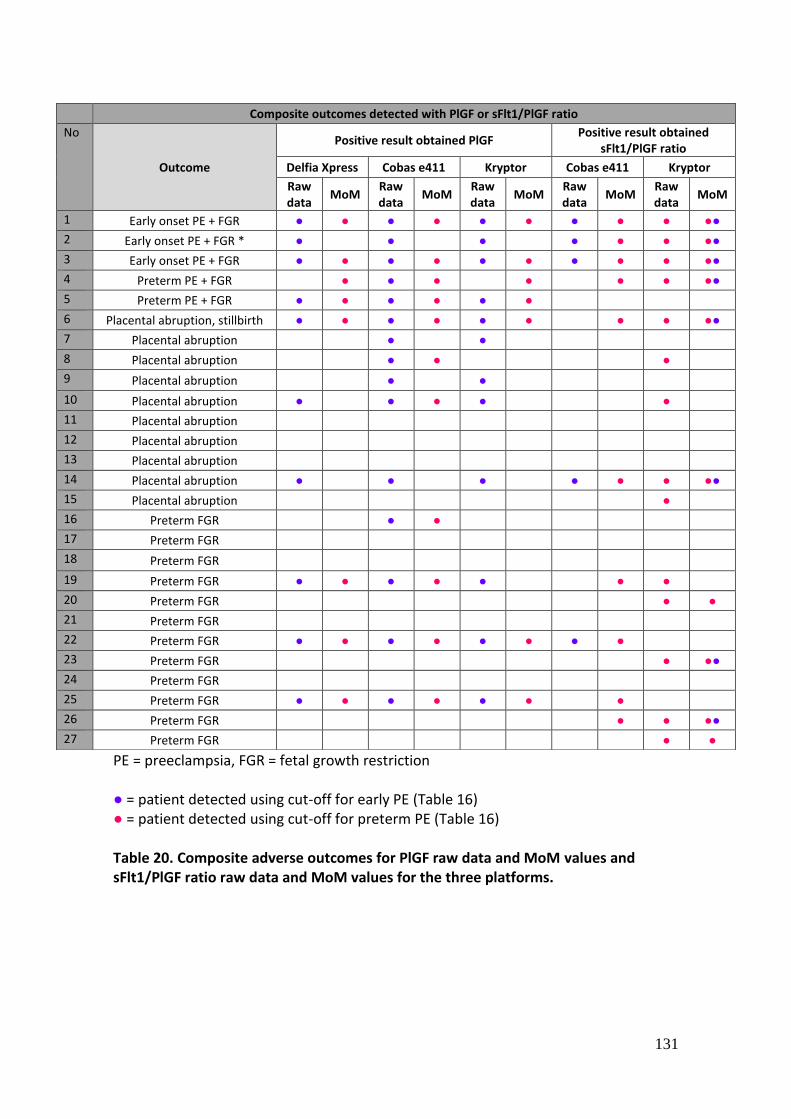
131
PE = preeclampsia, FGR = fetal growth restriction ● = patient detected using cut-off for early PE (Table 16) ● = patient detected using cut-off for preterm PE (Table 16) Table 20. Composite adverse outcomes for PlGF raw data and MoM values and sFlt1/PlGF ratio raw data and MoM values for the three platforms.
Composite outcomes detected with PlGF or sFlt1/PlGF ratio
No
Outcome
Positive result obtained PlGF Positive result obtained
sFlt1/PlGF ratio
Delfia Xpress Cobas e411 Kryptor Cobas e411 Kryptor
Raw data
MoM Raw data
MoM Raw data
MoM Raw data
MoM Raw data
MoM
1 Early onset PE + FGR ● ● ● ● ● ● ● ● ● ●●
2 Early onset PE + FGR * ● ● ● ● ● ● ●●
3 Early onset PE + FGR ● ● ● ● ● ● ● ● ● ●●
4 Preterm PE + FGR ● ● ● ● ● ● ●●
5 Preterm PE + FGR ● ● ● ● ● ●
6 Placental abruption, stillbirth ● ● ● ● ● ● ● ● ●●
7 Placental abruption ● ●
8 Placental abruption ● ● ●
9 Placental abruption ● ●
10 Placental abruption ● ● ● ● ●
11 Placental abruption
12 Placental abruption
13 Placental abruption
14 Placental abruption ● ● ● ● ● ● ●●
15 Placental abruption ●
16 Preterm FGR ● ●
17 Preterm FGR
18 Preterm FGR
19 Preterm FGR ● ● ● ● ● ● ●
20 Preterm FGR ● ●
21 Preterm FGR
22 Preterm FGR ● ● ● ● ● ● ● ●
23 Preterm FGR ● ●●
24 Preterm FGR
25 Preterm FGR ● ● ● ● ● ● ●
26 Preterm FGR ● ● ●●
27 Preterm FGR ● ●
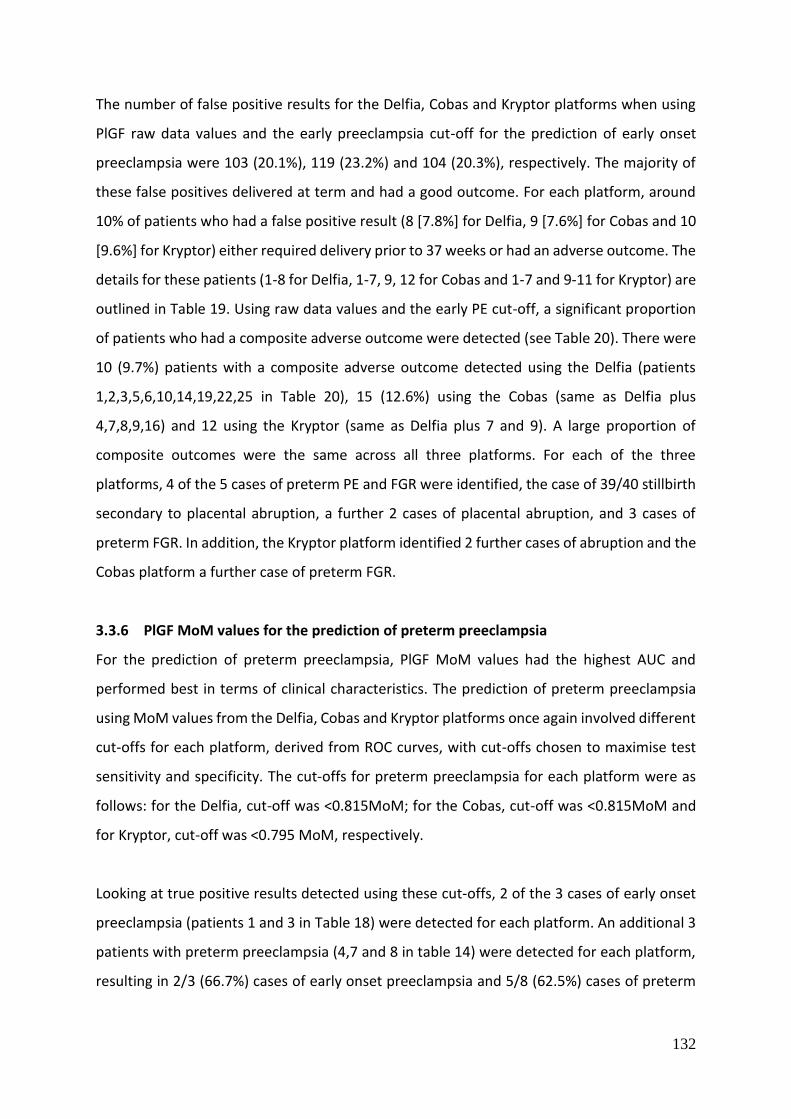
132
The number of false positive results for the Delfia, Cobas and Kryptor platforms when using
PlGF raw data values and the early preeclampsia cut-off for the prediction of early onset
preeclampsia were 103 (20.1%), 119 (23.2%) and 104 (20.3%), respectively. The majority of
these false positives delivered at term and had a good outcome. For each platform, around
10% of patients who had a false positive result (8 [7.8%] for Delfia, 9 [7.6%] for Cobas and 10
[9.6%] for Kryptor) either required delivery prior to 37 weeks or had an adverse outcome. The
details for these patients (1-8 for Delfia, 1-7, 9, 12 for Cobas and 1-7 and 9-11 for Kryptor) are
outlined in Table 19. Using raw data values and the early PE cut-off, a significant proportion
of patients who had a composite adverse outcome were detected (see Table 20). There were
10 (9.7%) patients with a composite adverse outcome detected using the Delfia (patients
1,2,3,5,6,10,14,19,22,25 in Table 20), 15 (12.6%) using the Cobas (same as Delfia plus
4,7,8,9,16) and 12 using the Kryptor (same as Delfia plus 7 and 9). A large proportion of
composite outcomes were the same across all three platforms. For each of the three
platforms, 4 of the 5 cases of preterm PE and FGR were identified, the case of 39/40 stillbirth
secondary to placental abruption, a further 2 cases of placental abruption, and 3 cases of
preterm FGR. In addition, the Kryptor platform identified 2 further cases of abruption and the
Cobas platform a further case of preterm FGR.
3.3.6 PlGF MoM values for the prediction of preterm preeclampsia
For the prediction of preterm preeclampsia, PlGF MoM values had the highest AUC and
performed best in terms of clinical characteristics. The prediction of preterm preeclampsia
using MoM values from the Delfia, Cobas and Kryptor platforms once again involved different
cut-offs for each platform, derived from ROC curves, with cut-offs chosen to maximise test
sensitivity and specificity. The cut-offs for preterm preeclampsia for each platform were as
follows: for the Delfia, cut-off was <0.815MoM; for the Cobas, cut-off was <0.815MoM and
for Kryptor, cut-off was <0.795 MoM, respectively.
Looking at true positive results detected using these cut-offs, 2 of the 3 cases of early onset
preeclampsia (patients 1 and 3 in Table 18) were detected for each platform. An additional 3
patients with preterm preeclampsia (4,7 and 8 in table 14) were detected for each platform,
resulting in 2/3 (66.7%) cases of early onset preeclampsia and 5/8 (62.5%) cases of preterm

133
preeclampsia being captured across all three platforms. This cut-off additionally identified
one case of term preeclampsia using the Delfia platform.
Using these cut-offs, for all 3 platforms there were 3/8 cases of preterm preeclampsia that
had false negative results. 2 developed preterm preeclampsia requiring delivery prior to 37
weeks (patients 5 and 6 in Table 18), while one developed early onset preeclampsia requiring
delivery at 30 weeks gestation (patient 2 in Table 18).
The number of false positive results for the Delfia, Cobas and Kryptor platforms when using
PlGF MoM values and the preterm PE cut-off were 76 (14.8%), 65 (12.7%) and 49 (9.6%),
respectively. The majority of these false positives delivered at term and had a good outcome.
For each platform, around 10% of patients who had a false positive result (6 [7.9%] for Delfia,
10 [15.4%] for Cobas and 5 [10.2%] for Kryptor) either required delivery prior to 37 weeks or
had an adverse outcome. The details for these patients (1-5 and 8 for Delfia,
1,2,3,5,6,9,10,12,13,15 for Cobas and 1-4 and 10 for Kryptor) are outlined in Table 19. Using
PlGF MoM values and the preterm PE cut-off, a significant number of patients who had a
composite adverse outcome were detected. There were 8 patients with a composite adverse
outcome detected using the Delfia platform (patient 1,3,4,5,6,19, 22, 25), 11 using the Cobas
platform (1,3,4,5,67,19,14,16,19,22,25) and 7 for the Kryptor platform (1,3-6, 22,25), outlined
in Table 20. For each of the three platforms, 4 of the 5 cases of preterm PE and FGR were
identified, the case of 39/40 stillbirth secondary to placental abruption, and two cases of
preterm FGR. The Cobas and Kryptor platforms detected a further 1 and 2 patients with
preterm FGR, respectively, and Cobas identified a further 2 patients with placental abruption.
3.4 Discussion
In this study, the performance of three commercially available immunoassay platforms, the
Delfia, Cobas and Kryptor, were compared for the purpose of prediction of preeclampsia at
midpregnancy. Clinical correlation and agreement between the three platforms, which has
been discussed in Chapter 2, was shown to be very good. Hence, we would expect similar
performance between the platforms with regard to prediction of clinical outcomes.

134
When testing PlGF in isolation for the prediction of preeclampsia at midpregnancy, PlGF raw
data values performed best for the prediction of early onset PE. For the Delfia, Cobas and
Kryptor platforms, predictive performance between the three was equivalent, based on AUC,
sensitivity and specificity for each (see 3.3.4 and Table 16), with no particular platform
performing significantly better than any other. All three platforms detected the same patients
with preterm preeclampsia as true positives, and most importantly, identified all 3 cases of
early onset preeclampsia. There were very few cases of term preeclampsia identified (3 for
Delfia and Kryptor, 4 for Cobas), which aligns with our findings, shown in Figure 29, that
predictive performance for preeclampsia using PlGF at term is poor. This finding also aligns
with the evidence for early onset preeclampsia and term preeclampsia having different
pathophysiologies, with potentially less angiogenic factor involvement in term preeclampsia,
and hence fewer patients detected using the placental biomarker PlGF. The same 3 patients
for each platform had false negative results, none of whom developed early onset
preeclampsia. The Cobas platform had slightly more false positives than the Delfia and Kryptor
platforms (119 compared with 103 and 104 for Delfia and Kryptor), respectively, displayed in
Table 17, but then identified a greater number of patients who developed a composite
adverse outcome (15 for Cobas compared with 10 for Delfia and 12 for Kryptor), as displayed
in Table 20.
PlGF MoM values performed best for prediction of preterm PE. Once again, predictive
performance between the three platforms was equivalent, based on AUC, sensitivity and
specificity (see 3.3.4 and Table 16). All three platforms detected the same 5 true positives in
patients with preterm preeclampsia (see Table 18). There was only one case of term
preeclampsia detected with the Delfia platform, however the detection of preterm
preeclampsia was the priority for this test, once again indicating the likelihood of different
pathophysiology behind preterm and term preeclampsia. The same 3 patients for each
platform had a false negative result, one of whom developed early onset preeclampsia
requiring delivery at 30 weeks gestation. Though the test overall identified 5 of 8 patients
with preterm preeclampsia, failing to detect one case of early onset preeclampsia must be
considered a significant false negative. Looking further at clinical details for this patient in
order to seek an explanation as to why her PlGF level was not below that required to obtain
a positive result using any of the three platforms for this cut-off value, the patient had type 1

135
diabetes, chronic hypertension and underlying diabetic nephropathy, and in light of her
history was taking low dose aspirin. She developed superimposed preeclampsia with
worsening proteinuria, reaching 15g/day prior to delivery. She was delivered at 30+1 weeks
gestation and had a baby with birthweight on the 2nd centile. Given her underlying chronic
hypertension and diabetic nephropathy, it could be possible that there was a much greater
maternal than placental component to her disease, making her less likely to be detected by
use of placental biomarkers. In addition to this, her clinical presentation may have been
altered given that she had been on low dose aspirin throughout the pregnancy, which is a
significant confounding factor.
The Delfia platform had slightly more false positives (76) than Cobas (65) and Kryptor (49).
From these false positives, the number of patients who developed a composite adverse
outcome was slightly higher for the Cobas platform (11) compared with the Delfia (8) and
Kryptor (7).
There were 2 patients within the preterm preeclampsia group who were not detected using
any of the platforms, using either raw data or MoM values. Patient 5 from Table 18 developed
superimposed preeclampsia on a background of chronic hypertension, indicating a significant
maternal component to her preeclampsia. She was taking low dose aspirin and calcium during
pregnancy in light of her history. Though her baby had a normal birthweight, she had
significant placental pathology, including syncytial knotting suggesting uteroplacental
hypoxia, mild chronic villitis and early changes associated with fetal thrombotic vasculopathy.
It is not possible to determine whether her being on aspirin potentially altered her clinical
presentation. Patient 6 from Table 18 had a past history of severe early onset preeclampsia,
requiring delivery at 32 weeks gestation. In her current pregnancy, she was also taking low
dose aspirin and developed preterm preeclampsia requiring delivery 35+5 weeks gestation
for severe preeclampsia with renal impairment and hyperkalaemia. She also had evidence of
placental pathology on histopathology, with ischaemic changes and retroplacental clots.
Again, it is difficult to ascertain the extent of the effect that taking aspirin had on her clinical
course. Each of these patients had babies with birthweight within the normal range, though
both had significant placental pathology on histopathology. Whilst the patient history did not
state the presence of an underlying medical condition in patient 6 that may have predisposed

136
her to renal impairment, hyperkalaemia or early onset preeclampsia, the significant maternal
component to disease in each of these patients may have reduced the extent to which
placental biomarkers were involved in their pathogenesis, making them less likely to have a
positive test result on screening. In addition to this, the fact that each of these patients was
taking aspirin antenatally is a significant confounding factor which may have affected their
clinical outcomes.
Preeclampsia has a low prevalence in the patient population studied (4.9% prevalence overall,
with 1.6% of cases having preterm preeclampsia and 0.6% of cases having early onset
preeclampsia). As positive predictive value (PPV) depends on the population prevalence of
disease, for this patient population, PPV’s overall were low. For the prediction of early onset
preeclampsia using raw data values, the PPV for the Delfia, Cobas and Kryptor platforms were
2.97, 2.59 and 2.94, respectively. This translates to a relatively high false positive rate, which
as previously stated, was 20.1% (n=103) for the Delfia, 23.2% (n=119) for Cobas and 20.3%
(n=104) for Kryptor. This low PPV translates to one in every 34 to 39 women determined high
risk for early onset preeclampsia based on screening actually developing early onset
preeclampsia. For the prediction of preterm preeclampsia using MoM values, PPV was slightly
higher for the Delfia, Cobas and Kryptor platforms, at 6.25, 7.14 and 9.26, respectively, with
consequently lower false positive rates of 14.8% (n=76), 12.7% (n=65) and 9.6% (n=49) for the
Delfia, Cobas and Kryptor platforms, respectively. These PPV’s translate to one in every 11 to
16 women determined high risk for preterm preeclampsia based on screening actually
developing preterm preeclampsia. The relatively high false positive rates associated with PlGF
testing at midpregnancy may understandably be associated with increased patient anxiety
levels and inconvenience, given that a positive test result would likely lead to increased
surveillance throughout pregnancy until a normal outcome occurs, which could incur several
months of unnecessary worry. In addition to this, increased surveillance for the patients with
false positive results undoubtably adds to the expense and resources required to monitor
them, potentially unnecessarily throughout pregnancy, and may include unnecessary
repeated testing for diagnostic purposes later in gestation. Within the patient population
studied, a significant number of patients who had a positive PlGF test at midpregnancy,
though they did not develop preeclampsia, and were listed as having “false positive results”,
actually went on to have either a preterm delivery for a variety of pathologies other than

137
preeclampsia, or an adverse outcome. For the prediction of early onset preeclampsia, using
the Delfia, Cobas and Kryptor platforms, 8.2%, 8% and 10.1% of patients with a false positive
test delivered prior to 37 weeks or had an adverse outcome, while for the prediction of
preterm preeclampsia, using the Delfia, Cobas and Kryptor platforms 8%, 17% and 10.2% of
patients with a false positive test delivered prior to 37 weeks or had an adverse outcome.
Whilst identifying excessive false positives is a downside for PlGF as a screening test for
preeclampsia, if a significant proportion of patients with false positive results go on to develop
an adverse outcome and might have benefitted from increased surveillance during
pregnancy, then the test may have a positive impact on the outcome for these patients. In
addition to this, the adverse outcomes they develop which are being detected by the
screening test may be found in time to be linked also to having abnormal PlGF levels, for
instance, placental abruption or preterm FGR. Once the clinical utility of these tests is better
established, these patients may end up falling into the true positive category, rather than
being seen as false positives.
5 cases of preterm preeclampsia also developed FGR, including all 3 of the early onset
preeclampsia cases and 2 preterm preeclampsia cases, while none of the term preeclampsia
cases developed FGR. This will be discussed further in Chapter 5 but may support a difference
in aetiology of late onset compared with early onset preeclampsia.
PlGF raw data values using the cut-off for early onset preeclampsia, when compared with
PlGF MoM values using the cut-off for preterm preeclampsia, showed the best performance
in terms of clinical characteristics, however had a lower PPV and consequently a greater
number of false positive results. PlGF MoM values using the cut-off for preterm preeclampsia
had a slightly higher PPV and fewer false positive results but missed a case of early onset
preeclampsia. A significant number of false positives required preterm delivery or developed
an adverse outcome.
In light of the missed case of early onset preeclampsia using the preterm PE cut-off, it would
seem safer to use PlGF raw data values and the cut-off for early onset PE, though this test has
a higher false positive rate, in favour of minimising false negative results. There were a
significant number of false positives detected by both cut-offs who either required preterm

138
delivery or developed an adverse outcome. These pregnancies likely had significant
underlying placental pathology and may have benefitted from increased surveillance. This
may reflect the ability of PlGF testing at midpregnancy to detect broader placental pathology
than just preeclampsia.
Overall, while PlGF shows great promise for prediction of preeclampsia, and possibly a
broader set of placental pathologies, ongoing auditing of outcomes are required to further
define the clinical utility of PlGF testing at midpregnancy, in particular the significance of false
positive results who developed adverse outcomes, and whether cut-offs should be adjusted
to include these as true positive results.
Due to less agreement between the platforms when using raw data values, relevant to testing
for early onset preeclampsia using PlGF raw data results, the cut-offs are quite different and
there would need to be different reference ranges for each platform when used in clinical
practice. Converting values to MoM almost eliminates this issue, as the agreement between
MoM values was much better, making values obtained from the three different platforms
equivalent. This translates to very similar cut-offs and reference ranges for the three
platforms in clinical practice. This needs to be taken into consideration if using raw data values
in clinical practice for these biomarkers, with appropriate lab specific reference ranges
generated. The advantage of using raw data values is that this would reduce the resources
required to implement the test, as the complex and time-consuming calculations for
conversion of raw data values to MoM are not required.
Most studies reporting the performance of PlGF for the prediction of preeclampsia at
midpregnancy used serum samples for analysis, however one study used plasma samples
(Tjoa et al. 2001). Tjoa stated that their preliminary experiments using plasma samples were
comparable to results obtained using serum samples, and this is in agreement with the results
of our validation studies comparing plasma and serum results in the patient cohort studied
(See Chapter 2).
The results presented here are in agreement with findings from previous studies showing that
maternal PlGF levels at midpregnancy appear to be significantly lower in patients who

139
subsequently develop preeclampsia, when compared with unaffected pregnancies (Su et al.
2001; Tidwell et al. 2001; Tjoa et al. 2001; Polliotti et al. 2003; Taylor et al. 2003; Levine 2004;
Unal et al. 2007; Ghosh et al. 2012; Lambert-Messerlian 2014; Shim et al. 2015). Other studies
similarly report limited clinical utility due to a high proportion of false positive results. Ghosh
(Ghosh et al. 2013) reported, among the group with PlGF below the set cut-off point between
22 and 24 weeks gestation, that 262/1206 (22%) of women had a false positive result. There
were 19 cases of early onset preeclampsia within their cohort, 16 of whom were detected on
PlGF testing. There were three patients in the cohort (0.3%) who had a false negative result.
Sensitivity and specificity obtained for preterm preeclampsia in this study is comparable to
that of Tidwell (Tidwell et al. 2001), who reported sensitivity and specificity of PlGF testing
between 16 and 20 weeks gestation as 66.7% and 88.9%, respectively. The predictive
performance for early onset preeclampsia based on AUC from our ROC curves appeared
better than that stated by Polliotti (Polliotti et al. 2003), which was AUC 0.799 for PlGF alone
for prediction of preeclampsia requiring delivery prior to 34 weeks gestation.
In other studies that had converted PlGF levels to MoM for analysis, median PlGF MoM results
were around 0.88 MoM for all preeclampsia and 0.76 MoM for severe or early preeclampsia
(Lambert-Messerlian 2014), while Su (Su et al. 2001) reported PlGF MoM levels in patients
who developed preeclampsia as 0.55 (0.33-0.85) MoM compared with normal pregnancy,
who had average PlGF levels around 1.00 (0.71-1.32) MoM. The results presented here
showed that patients who did not develop preeclampsia or who developed preeclampsia at
term had median second trimester PlGF results around 1.0 MoM, while patients who went on
to develop early or preterm preeclampsia had significantly lower second trimester PlGF
results when compared with unaffected patients or those with term preeclampsia, with
values around 0.5 MoM and 0.8 MoM, respectively, These findings are consistent with
previous reports (Su et al. 2001; Shim et al. 2015). With regard to future directions, it is
already established that women with low PlGF who subsequently develop preeclampsia tend
to have more severe, earlier onset disease that is often associated with FGR. The identification
of these women at midpregnancy with placental biomarkers that measure secondary rather
than tertiary features of disease has the potential to both improve outcomes on an individual
level (Staff et al. 2013a) and hopefully lead to greater understanding of the pathophysiology
of preeclampsia, which may allow more focused research activity into further effective tests,

140
preventative therapies or ultimately curative therapies (Roberts and Hubel 2009; Powers et
al. 2012; Warrington et al. 2013; Kar 2014).
As outlined in Section 3.3.1, the fact that 10% of patients within the cohort studied were
taking low dose aspirin due to their increased clinical risk for preeclampsia or other adverse
pregnancy outcomes is a significant confounding factor and may have affected the results
obtained. This will be discussed further in Chapter 4, Section 4.4.
3.5 Summary
PlGF levels appear to be significantly lower at midpregnancy in patients who go on to develop
preterm and early onset preeclampsia, when compared with unaffected pregnancies. As a
single test for the prediction of preeclampsia, midpregnancy PlGF displays very good
predictive performance, with good sensitivity and specificity for the development of both
preterm and early preeclampsia. The three immunoassay platforms used for testing in this
study displayed very similar sensitivity, specificity, PPV and NPV, and when clinically
correlated with patient outcomes, displayed very similar clinical performance. PlGF raw data
values using the cut-off for early onset preeclampsia, when compared with PlGF MoM values
using the cut-off for preterm preeclampsia, showed the best clinical validity in terms of
sensitivity, specificity, and NPV, however had a lower PPV and hence a greater number of
false positive results. PlGF MoM values using the cut-off for preterm preeclampsia had slightly
better PPV and fewer false positive results but missed a case of early onset preeclampsia.
Overall, until clinical utility is further defined through further studies or an ongoing clinical
audit, it would be safest to use PlGF raw data values using the cut-off for early onset
preeclampsia in favour of minimising false negative results.
It can be concluded based on results presented here and existing studies in the literature, that
PlGF when tested in isolation is a useful tool for the identification of patients at increased risk
for preeclampsia when tested at midpregnancy (Su et al. 2001; Tidwell et al. 2001; Tjoa et al.
2001; Polliotti et al. 2003; Taylor et al. 2003; Levine 2004; Unal et al. 2007; Ghosh et al. 2012;
Lambert-Messerlian 2014; Shim et al. 2015). This test satisfies several practical requirements
for a screening test, including being easily reproducible, having a high sensitivity and being
relatively noninvasive (Tidwell et al. 2001). PlGF testing as an isolated test is simple to

141
undertake and involves few resources beyond access to an appropriate immunoassay
platform and consumables. Once clinical utility for this test is further determined with
ongoing audits of pregnancy outcomes, it could serve as a useful test to help guide clinical
decision making through stratification of women as high or low risk for preeclampsia. Studies
performed to date looking at midpregnancy PlGF testing for prediction of preeclampsia,
including this one, have been limited by small numbers, and at the very least ongoing clinical
audits of patient outcomes are required to further elucidate clinical utility of PlGF as a
screening tool and how this test can be used to optimise patient outcomes in everyday clinical
management. At this stage there is little knowledge behind the clinical relevance of the
different PlGF isoforms and given that different isoforms are tested to different extents with
the commercial kits for each immunoassay platform, detailed evaluation of the functions of
the different PlGF isoforms could further elucidate the role of PlGF in pregnancy (Tjoa et al.
2001; Polliotti et al. 2003).
The low PPV for both PlGF raw data and MoM values is likely reflective of the low prevalence
of preterm and early onset preeclampsia in our population but does place limitations on the
clinical validity of PlGF testing when used in isolation as a screening test. The addition of PlGF
values to a multivariable logistic regression model may further enhance the clinical validity of
screening for preterm preeclampsia within this patient population, and this method will be
discussed in Chapter 6.

142
Chapter 4
Soluble Fms-like tyrosine kinase-1 (sFlt1) and the
sFlt1/PlGF ratio for the prediction of
preeclampsia at midpregnancy
4.1 Introduction
The multifaceted demonstration by Maynard in 2003 that placental and serum sFlt1 are both
upregulated in preeclampsia, that sFlt1 directly causes endothelial dysfunction and that
administration of sFlt1 to pregnant rats induces a phenotype consistent with preeclampsia
provided fundamental insights in terms of both our understanding of the pathophysiology of
preeclampsia and identifying potential screening and diagnostic tests for this condition
(Maynard et al. 2003). Levine in 2004 provided further clinical correlation of the predictable
alterations in both sFlt1 and PlGF levels throughout normal pregnancy compared with
pregnancies complicated by preeclampsia (Levine 2004). Subsequent research in this area has
been underpinned by these findings.
sFlt1 is not widely used in isolation as a placental biomarker and tends to be combined with
PlGF as the sFlt1/PlGF ratio, which is calculated by dividing the value obtained for sFlt1 with
the value obtained for PlGF. The sFlt1/PlGF ratio is automatically calculated by commercially
available automated immunoassay platforms, such as the Cobas and Kryptor, following
sample analysis for sFlt1 and PlGF. This ratio reflects in a combined fashion mild increases in
sFlt1 values and mild reductions in PlGF values, such that the ratio value may become
abnormal even while the individual biomarkers remain at the upper or lower limits of the
normal range, respectively. The sFlt1/PlGF ratio should, in theory increase the sensitivity for
this test over the use of either biomarker alone. An elevated sFlt1/PlGF ratio has been shown
to be a better predictor of outcomes in patients who present with symptoms of preeclampsia
than either biomarker tested in isolation (Levine et al. 2006; Verlohren et al. 2010; Rana et al.
2012; Verlohren et al. 2012) and as a result, the use of the ratio has been approved as a

143
diagnostic aid for preeclampsia in conjunction with other clinical findings. The PROGNOSIS
study (Zeisler et al. 2016a) was a prospective, multicentre study which aimed to derive and
validate an sFlt1/PlGF ratio that would predict the absence or presence of preeclampsia in
the short term in women with suspected preeclampsia, between 24+0 and 36+6 weeks
gestation. The primary objective was to assess whether low sFlt1/PlGF ratios (at or below a
derived cut-off) predict the absence of preeclampsia within 1 week, and whether elevated
ratios (above the cut-off) predict the presence of preeclampsia within 4 weeks. In the
development cohort, an sFlt1/PlGF ratio cut-off of 38 was identified as having important
predictive value. The subsequent validation study confirmed an sFlt1/PlGF ratio of 38 or lower
had a negative predictive value (i.e. no pre-eclampsia in the subsequent one week) of 99.3%
(95% confidence intervals 97.9 to 99.9) with 80% sensitivity (95% confidence intervals 51.9 to
95.7) and 78.3% specificity (95% confidence intervals 74.6-81.7).The positive predictive value
of an sFlt1/PlGF ratio above 38 for a diagnosis of preeclampsia within 4 weeks was 36.7%
(95% confidence intervals 28.4-45.7), with a 66.2% sensitivity (95% confidence intervals 54.0-
77.0) and 83.1% specificity (95% confidence intervals 79.4-86.3). The ultimate conclusion was
that an sFlt1/PlGF ratio of 38 or lower can be used to predict the short-term absence of
preeclampsia in women in whom the syndrome is clinically suspected. Despite these
compelling findings, it has taken a very long time for the sFlt1/PlGF ratio to be implemented
into clinical practice. Similar to the delay in implementing PlGF testing for the diagnosis and
prediction of preeclampsia, the same concerns from international health authorities (Meads
et al. 2008; Henderson et al. 2017; Brown et al. 2018) regarding the appropriate utilisation of
biomarker testing exist for implementation of the sFlt1/PlGF ratio.
With regard to use of the sFlt1/PlGF ratio for the second trimester prediction of preeclampsia
in asymptomatic patients, there are numerous studies confirming that mean PlGF levels are
significantly lower while mean sFlt1 levels are significantly higher when tested in patients who
go on to develop preeclampsia, compared with unaffected pregnancies (Kim et al. 2007;
Moore Simas et al. 2007; Lim et al. 2008; Shokry et al. 2010; Rohra et al. 2012; Hassan et al.
2013; Perales et al. 2016). Various individual studies, with gestation at testing ranging from
14 to 26 weeks gestation (Kim et al. 2007; Moore Simas et al. 2007; Kusanovic et al. 2009;
Shokry et al. 2010; Rohra et al. 2012; Hassan et al. 2013; Rizos et al. 2013) have consistently
reported this finding. Unal 2007 (Unal et al. 2007) performed a case control study which

144
sampled PlGF and sFlt1 levels between 16 and 20 weeks gestation, also including patients
with severe preeclampsia. They had 21 patients with severe preeclampsia, 34 controls and 9
patients with chronic hypertension. They showed that PlGF levels from patients who
developed severe preeclampsia (median 85.3 [65-134]) were significantly lower than controls
(133 [87-237]). There was no significant difference in sFlt1 levels between cases and controls.
Kim 2007 (Kim et al. 2007) included 46 women with preeclampsia and 100 matched controls
between 14 and 23 weeks gestation, with an average gestation of 17 weeks. Their results
showed AUC, sensitivity and specificity for plasma log[sFlt1/PlGF] for prediction of
preeclampsia at a cut-off value of 1.4 to be 0.833, 80.4% and 78%, respectively. Moore Simas
(Moore Simas et al. 2007) tested 94 women considered to be at increased risk for
preeclampsia, between 22 and 36 weeks gestation. In the group of 73 women analysed
between 22 and 26 weeks, 4 developed early onset and 6 late onset preeclampsia. AUC for
sFlt1/PlGF ratio for the prediction of early onset preeclampsia was 0.971. Shokry (Shokry et
al. 2010) included 240 women between 13 and 16 weeks gestation, of which 27 (11.3%)
developed preeclampsia. They reported AUC 0.954 and 0.988 for PlGF and sFlt1, respectively,
with sensitivity 81.5% and 100%, and specificity 97.2% and 98.6% respectively, PPV 78.6% and
90% respectively, and NPV 97.6% and 100%, respectively. Rohra (Rohra et al. 2012) included
611 normotensive nulliparous patients, of whom 39 (6.4%) developed preeclampsia. Patients
were tested for sFlt1 and PlGF in 5 different gestational age groups. In the group tested
between 16 and 22 weeks gestation, sFlt1 gave AUC 0.80. Sensitivity, specificity, PPV and NPV
all achieved the same value at 71.4% (95% CI 53.5-84.8), respectively. They reported that
combining sFlt1 and PlGF as the sFlt1/PlGF ratio did not further improve clinical validity above
that of using sFlt1 alone, though data supporting this was not shown. A decline in PlGF in
women with preeclampsia up until 29 weeks gestation was also reported, though AUC and
other markers of clinical validity were not reported for PlGF. Hassan (Hassan et al. 2013)
included 734 women of whom 83 developed preeclampsia and collected samples between 15
and 20 weeks gestation. They reported AUC for sFlt1, PlGF and the sFlt1/PlGF ratio for the
prediction of preeclampsia as 0.875, 0.855 and 0.917, respectively. Sensitivity, specificity, PPV
and NPV for sFlt1, PlGF and the sFlt1/PlGF ratio were reported as 91.6%, 86.4%, 69.1% and
96.9%, respectively for this patient population.

145
Other significant findings from these studies were that predictive performance for these
biomarkers was found to be higher when trying to predict early onset preeclampsia rather
than late onset or term preeclampsia (Kusanovic et al. 2009; Hassan et al. 2013), with overall
poor performance of these biomarkers for prediction of term preeclampsia (Moore Simas et
al. 2007; Kusanovic et al. 2009). Based on the evidence that concentrations of sFlt1 and PlGF
may become abnormal up to 11 weeks prior to diagnosis, at the time of midpregnancy testing,
levels may already be significantly deranged, which should be reflected in the testing. There
is agreement within the literature that predictive performance of these biomarkers for
patients at risk of developing preeclampsia generally increase with advancing gestational age
at the time of testing (Widmer et al. 2007; Kusanovic et al. 2009; McElrath et al. 2012). Studies
where testing was performed prior to 16 weeks gestation (Widmer et al. 2007; Kleinrouweler
et al. 2012; Rizos et al. 2013) found no significant difference between sFlt1 and PlGF levels in
patients who developed preeclampsia and unaffected pregnancies. Predictive performance
for the sFlt1/PlGF ratio was shown in several studies to be more accurate than either
biomarker alone (Moore Simas et al. 2007; Kusanovic et al. 2009; Hassan et al. 2013).
In this chapter, the intention was to determine whether sFlt1 and/or the sFlt1/PlGF ratio,
when tested using one of three immunoassay platforms, performs well as a predictive test for
preeclampsia when tested at midpregnancy. Subsequently, the clinical validity of these tests
for prediction of preeclampsia at midpregnancy was evaluated. The results were compared
and contrasted with results presented in Chapter 3 using PlGF as a predictive test, in order to
determine to what extent serum PlGF and/or serum sFlt1/PlGF ratio, or both, predict
subsequent development of preeclampsia when tested at midpregnancy, and which of these
tests has greater clinical validity for predicting subsequent development of preeclampsia
when tested in women at midpregnancy.
4.2 Methods
Methods described in Chapter 2, were followed.
4.2.1 Study population
Refer to Section 2.2
146
4.2.2 Blood sample collection and storage
Refer to Section 2.3
4.2.3 Outcome measures
The main outcome of interest was the development of preeclampsia, as defined by the ISSHP
(Brown et al. 2018). More specifically, preeclampsia was classified according to gestation at
the time of delivery, not the time of onset, as early onset preeclampsia (<34weeks), preterm
preeclampsia (<37weeks) and term preeclampsia (≥37weeks). Secondary outcomes including
placental abruption, fetal growth restriction (FGR), and stillbirths greater than 24 weeks
gestation were also analysed. Patients were classified as having FGR if one of the following
factors was present: doppler cerebroplacental ratio (CPR) less than the 5th centile, UAPI
greater than the 95th centile or EFW <3rd centile (Figueras and Gratacos 2014).
4.2.4 Statistical analysis
In addition to the analyses described in Chapter 2, both raw data and MoM values were
compared using the Mann-Whitney U test to assess for a statistically significant difference in
the mean sFlt1/PlGF ratio values for patients with preeclampsia compared with controls.
Mean values for sFlt1/PlGF ratio were compared between patients with preeclampsia and
unaffected pregnancies using the Mann-Whitney U test. P-values <0.05 were deemed to be
statistically significant.
Screening performances for sFlt1/PlGF ratio raw data and MoM values were then evaluated
using receiver operating characteristic (ROC) curves to calculate the area under the curve
(AUC). Coordinates of the ROC curves were used to identify predictive values for sFlt1/PlGF
ratio at term (≥37 weeks, preterm (<37weeks) and early (<34weeks) for the prediction of
preeclampsia. Selected cut-off values were chosen for each immunoassay platform, with
biomarker values with the highest sensitivity and specificity chosen as optimal cut-off points
for a positive test. True positive and negative results were assessed using 2 x 2 contingency
tables, followed by diagnostic test evaluation using an online calculator (MedCalc®).
Sensitivity, specificity, positive predictive value (PPV) and negative predictive value (NPV)
were then determined for PlGF levels performed on each immunoassay platform for the
prediction of preeclampsia. Clinical outcomes for patients who had true positive, false

147
negative and false positive results were clinically correlated with sFlt1/PlGF ratio test results
in order to better determine the clinical utility for each platform.
4.3 Results
4.3.1 Descriptive statistics
The characteristics of the study population and descriptive statistics are summarised in
Chapter 3, Table 11.
As outlined in Section 3.3.1 and displayed in Appendix 1, 52 patients (10%) within the cohort
were taking low dose aspirin antenatally.
4.3.2 Comparison studies for sFlt1 between patients who developed preeclampsia and
unaffected pregnancies
There was no significant difference in sFlt1 raw data or MoM values between patients who
developed early onset, preterm or term preeclampsia when compared with unaffected
pregnancies. (Table 21). Though sFlt1 raw data and MoM values are certainly higher in
patients who developed early onset preeclampsia compared with other groups, the
difference was not statistically significant.
This finding is demonstrated in Figure 32. When looking at results from each platform for sFlt1
raw data values, patients that did not develop preeclampsia and patients who subsequently
developed preeclampsia at <37 weeks or ≥37 weeks had second trimester sFlt1 levels at
around the same level. sFlt1 levels appeared to be slightly higher in patients who developed
early onset preeclampsia <34 weeks, however this result was not statistically significant.
Similarly, when looking at results for each platform using sFlt1 MoM values, patients that did
not develop preeclampsia and patients who subsequently developed preeclampsia at <37
weeks or ≥37 weeks had second trimester sFlt1 levels around 1.0 MoM. Again, sFlt1 MoM
results appeared slightly higher in patients who developed early onset preeclampsia <34
weeks, but again this result was not statistically significant.

148
Angiogenic
Markers
Unaffected (n=487) Term PE (≥37 weeks)
(n=17)
p-value Preterm PE (<37 weeks)
(n=8)
p-value Early onset PE (<34 weeks)
(n=3)
p-value
Cobas sFlt1
Raw data values
MoM values
1414.0 (1030-0-1928.5)
1.0 (0.9-1.1)
1337.0 (1078.0-2446.0)
1.0 (0.9-1.2)
0.885
0.872
1170.0 (787.0-1905.0)
1.0 (0.8-1.2)
0.292
0.982
2429.0 (1562.7-2429.0)
1.3 (1.0-1.4)
0.601
0.444
Kryptor sFlt1
Raw data values
MoM values
1264.0 (905.7-1764.5)
1.0 (0.9-1.1)
1164.0 (839.5-2088.0)
1.0 (0.8-1.2)
0.838
0.797
1027.3 (638.8-1995.0)
1.0 (0.8-1.3)
0.439
0.948
2293.0 (1405.0-2443.0)
1.3 (1.0-1.4)
0.581
0.434
Units for sFlt1 are in pg/mL. All values are reported as median (interquartile range).
*p<0.05 when compared with the unaffected group. PE = preeclampsia. MoM = multiples of the median
Table 21. Comparison of raw data and MoM values for sFlt1 for all platforms.

149
Figure 32. Comparison of sFlt1 raw data and MoM between patients with early onset (<34 weeks), preterm (<37 weeks) and term (≥37
weeks) preeclampsia and unaffected pregnancies.
Pregnancies that developed PE
25 (4.9%) overall PE
17 (3.3%) term (≥37 weeks) PE
8 (1.6%) preterm (<37 weeks) PE
3 (0.6%) early onset (<34 weeks) PE

150
Figure 33. ROC curves for prediction of term (≥37 weeks), preterm (<37 weeks) and early onset (<34 weeks) preeclampsia using sFlt1 raw data and MoM values.
Pregnancies that developed PE
25 (4.9%) overall PE
17 (3.3%) term (≥37 weeks) PE
8 (1.6%) preterm (<37 weeks) PE
3 (0.6%) early onset (<34 weeks) PE
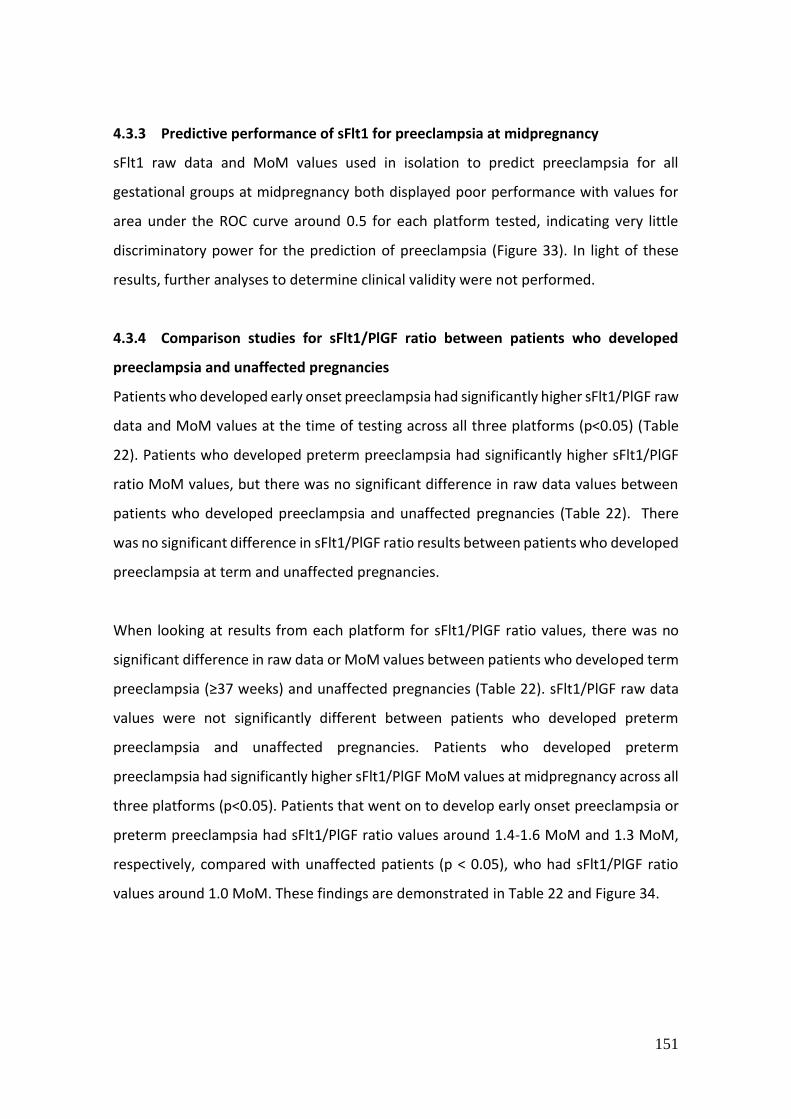
151
4.3.3 Predictive performance of sFlt1 for preeclampsia at midpregnancy
sFlt1 raw data and MoM values used in isolation to predict preeclampsia for all
gestational groups at midpregnancy both displayed poor performance with values for
area under the ROC curve around 0.5 for each platform tested, indicating very little
discriminatory power for the prediction of preeclampsia (Figure 33). In light of these
results, further analyses to determine clinical validity were not performed.
4.3.4 Comparison studies for sFlt1/PlGF ratio between patients who developed
preeclampsia and unaffected pregnancies
Patients who developed early onset preeclampsia had significantly higher sFlt1/PlGF raw
data and MoM values at the time of testing across all three platforms (p<0.05) (Table
22). Patients who developed preterm preeclampsia had significantly higher sFlt1/PlGF
ratio MoM values, but there was no significant difference in raw data values between
patients who developed preeclampsia and unaffected pregnancies (Table 22). There
was no significant difference in sFlt1/PlGF ratio results between patients who developed
preeclampsia at term and unaffected pregnancies.
When looking at results from each platform for sFlt1/PlGF ratio values, there was no
significant difference in raw data or MoM values between patients who developed term
preeclampsia (≥37 weeks) and unaffected pregnancies (Table 22). sFlt1/PlGF raw data
values were not significantly different between patients who developed preterm
preeclampsia and unaffected pregnancies. Patients who developed preterm
preeclampsia had significantly higher sFlt1/PlGF MoM values at midpregnancy across all
three platforms (p<0.05). Patients that went on to develop early onset preeclampsia or
preterm preeclampsia had sFlt1/PlGF ratio values around 1.4-1.6 MoM and 1.3 MoM,
respectively, compared with unaffected patients (p < 0.05), who had sFlt1/PlGF ratio
values around 1.0 MoM. These findings are demonstrated in Table 22 and Figure 34.
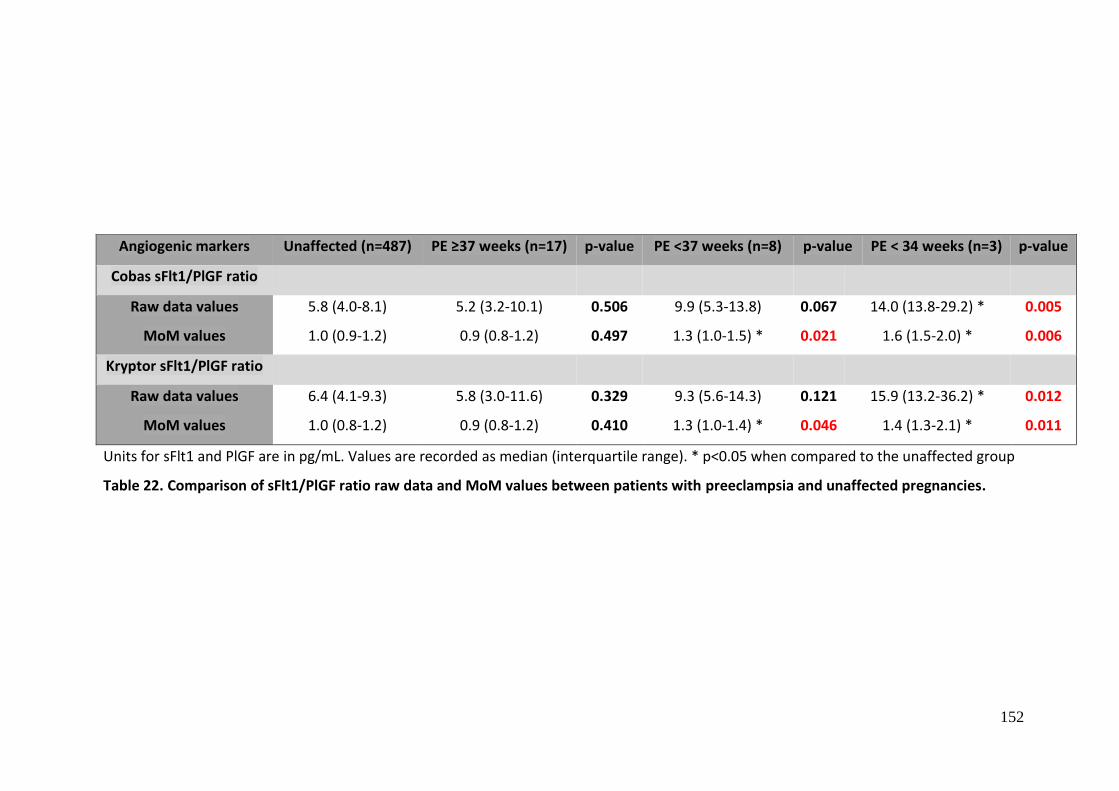
152
Angiogenic markers Unaffected (n=487) PE ≥37 weeks (n=17) p-value PE <37 weeks (n=8) p-value PE < 34 weeks (n=3) p-value
Cobas sFlt1/PlGF ratio
Raw data values
MoM values
5.8 (4.0-8.1)
1.0 (0.9-1.2)
5.2 (3.2-10.1)
0.9 (0.8-1.2)
0.506
0.497
9.9 (5.3-13.8)
1.3 (1.0-1.5) *
0.067
0.021
14.0 (13.8-29.2) *
1.6 (1.5-2.0) *
0.005
0.006
Kryptor sFlt1/PlGF ratio
Raw data values
MoM values
6.4 (4.1-9.3)
1.0 (0.8-1.2)
5.8 (3.0-11.6)
0.9 (0.8-1.2)
0.329
0.410
9.3 (5.6-14.3)
1.3 (1.0-1.4) *
0.121
0.046
15.9 (13.2-36.2) *
1.4 (1.3-2.1) *
0.012
0.011
Units for sFlt1 and PlGF are in pg/mL. Values are recorded as median (interquartile range). * p<0.05 when compared to the unaffected group
Table 22. Comparison of sFlt1/PlGF ratio raw data and MoM values between patients with preeclampsia and unaffected pregnancies.
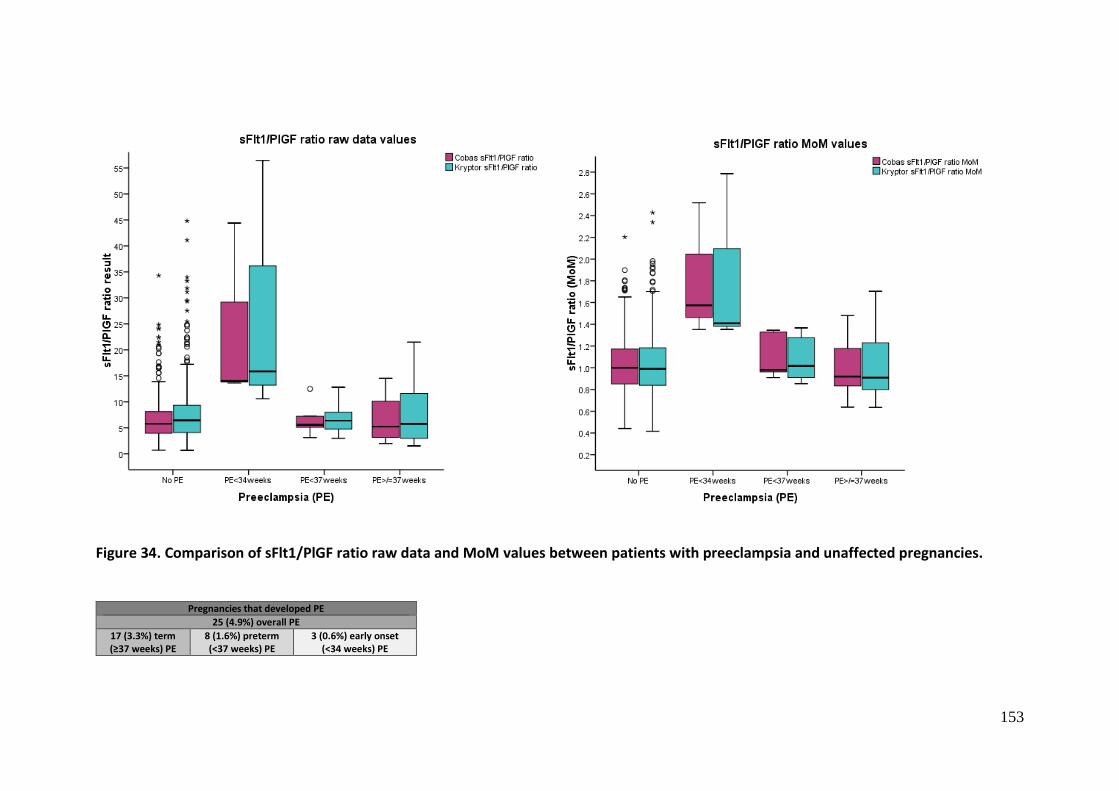
153
Figure 34. Comparison of sFlt1/PlGF ratio raw data and MoM values between patients with preeclampsia and unaffected pregnancies.
Pregnancies that developed PE
25 (4.9%) overall PE
17 (3.3%) term (≥37 weeks) PE
8 (1.6%) preterm (<37 weeks) PE
3 (0.6%) early onset (<34 weeks) PE
154
4.3.5 Performance of the sFlt1/PlGF ratio for the prediction of preeclampsia at
midpregnancy
Having established that patients who develop early onset preeclampsia have
significantly increased sFlt1/PlGF ratio raw data and MoM values, and that patients who
develop preterm preeclampsia have significantly increased sFlt1/PlGF ratio MoM values,
the predictive properties of sFlt1/PlGF at midpregnancy using the three different
platforms was compared using ROC curve analysis. When used to predict preeclampsia
at term (≥37 weeks), sFlt1/PlGF ratio raw data values gave AUC values for the Cobas and
Kryptor platforms of 0.547 and 0.548, respectively. sFlt1/PlGF ratio MoM values gave
AUC values for the Cobas and Kryptor platforms of 0.570 and 0.559, respectively (Figure
35).
When used to predict preterm preeclampsia (<37 weeks), sFlt1/PlGF ratio raw data
values gave AUC values for the Cobas and Kryptor platforms of 0.689 and 0.660,
respectively. sFlt1/PlGF MoM values gave AUC values for the Cobas and Kryptor
platforms of 0.741 and 0.707, respectively (Figure 36).
When used to predict early preeclampsia (<34 weeks), sFlt1/PlGF ratio raw data values
gave AUC values for the cobas and Kryptor platforms of 0.971 and 0.921, respectively.
sFlt1/PlGF ratio MoM values gave AUC values for the Cobas and Kryptor platforms of
0.959 and 0.925, respectively (see Figure 37).

155
Figure 35. ROC curves for prediction of term (≥37 weeks) preeclampsia using sFlt1/PlGF ratio raw data and MoM values at any gestation.
Pregnancies that developed PE
25 (4.9%) overall PE
17 (3.3%) term (≥37 weeks) PE
8 (1.6%) preterm (<37 weeks) PE
3 (0.6%) early onset (<34 weeks) PE

156
Figure 36. ROC curves for prediction of preterm (<37 weeks) preeclampsia using sFlt1/PlGF ratio raw data and MoM values
Pregnancies that developed PE
25 (4.9%) overall PE
17 (3.3%) term (≥37 weeks) PE
8 (1.6%) preterm (<37 weeks) PE
3 (0.6%) early onset (<34 weeks) PE

157
Figure 37. ROC curves for prediction of early onset (<34 weeks) preeclampsia using sFlt1/PlGF ratio raw data and MoM values
Pregnancies that developed PE
25 (4.9%) overall PE
17 (3.3%) term (≥37 weeks) PE
8 (1.6%) preterm (<37 weeks) PE
3 (0.6%) early onset (<34 weeks) PE

158
4.3.6 Sensitivity and specificity analysis for prediction of preeclampsia using the
sFlt1/PlGF ratio
Sensitivity and specificity for the prediction of preeclampsia using the sFlt1/PlGF ratio
were calculated for the Cobas and Kryptor platforms using selected cut-off values from
the ROC curves. Two cut-off points were determined for each platform. The first was the
point that gave the highest sensitivity and specificity for prediction of patients with
preterm preeclampsia and will be referred to as the preterm PE cut-off. The second was
the point that gave the highest sensitivity and specificity for prediction of patients with
early onset preeclampsia and will be referred to as the early PE cut-off.
sFlt1/PlGF ratio testing at midpregnancy for the prediction of term preeclampsia yielded
AUC values for each platform that were close to 0.50, indicating poor discriminatory
power to predict preeclampsia when tested at midpregnancy. Hence further analysis for
this group was not performed.
sFlt1/PlGF ratio testing at midpregnancy for the prediction of preterm and early onset
preeclampsia showed much better discriminatory power for this outcome. It was
previously demonstrated in Table 22 that sFlt1/PlGF ratio MoM values for preterm
preeclampsia and both raw data and MoM values for early onset preeclampsia were
significantly different when compared between patients who developed preeclampsia
and unaffected pregnancies. For sFlt1/PlGF ratio MoM values for preterm preeclampsia,
AUC exceeded 0.71 for each platform (see Table 23). For early onset preeclampsia, raw
data and MoM values exceeded 0.92 for each platform.
When using the sFlt1/PlGF ratio in isolation for the prediction of early onset
preeclampsia, sFlt1/PlGF ratio raw data values performed best for the Cobas platform,
with AUC 0.97, while sFlt1/PlGF ratio MoM values performed best for the Kryptor
platform, with AUC 0.93. Sensitivity, specificity, PPV and NPV for sFlt1/PlGF ratio MoM
for the prediction of preterm PE for the Cobas and Kryptor platforms were as follows:
sensitivity 100 and 100; specificity 95.87 and 87.82; PPV 12.5 and 4.62 and NPV 100 and
100 (Table 23).
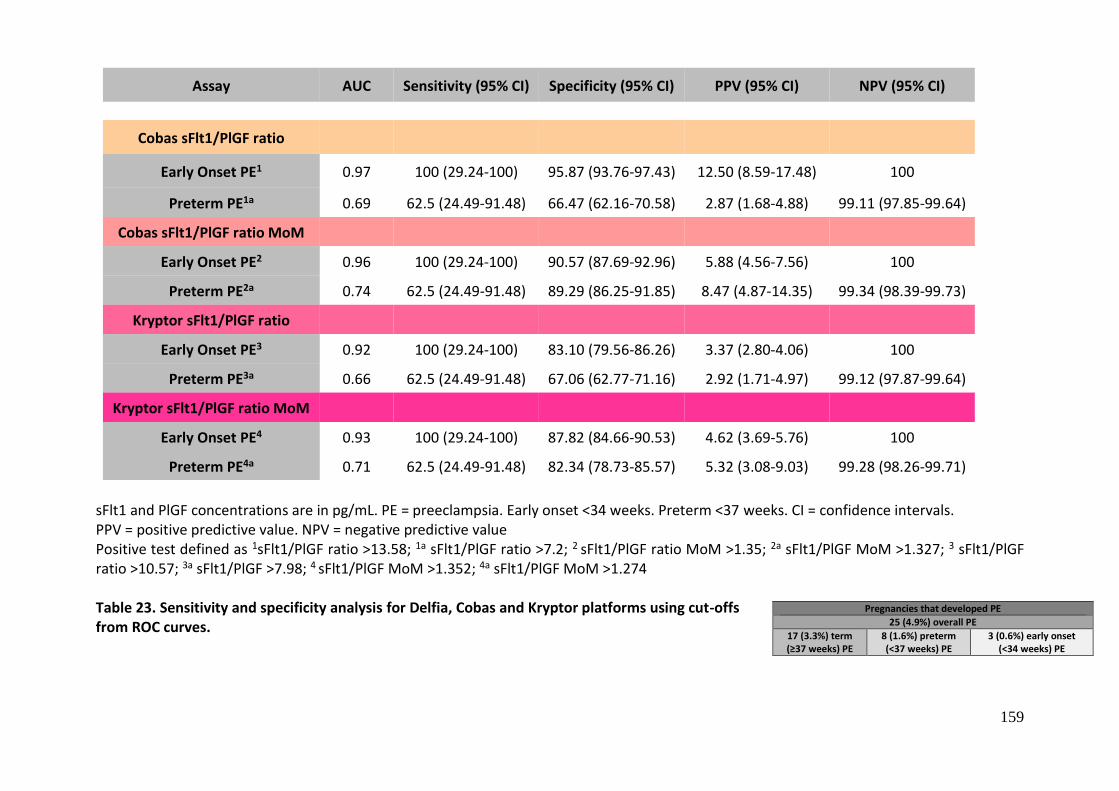
159
sFlt1 and PlGF concentrations are in pg/mL. PE = preeclampsia. Early onset <34 weeks. Preterm <37 weeks. CI = confidence intervals. PPV = positive predictive value. NPV = negative predictive value Positive test defined as 1sFlt1/PlGF ratio >13.58; 1a sFlt1/PlGF ratio >7.2; 2 sFlt1/PlGF ratio MoM >1.35; 2a sFlt1/PlGF MoM >1.327; 3 sFlt1/PlGF ratio >10.57; 3a sFlt1/PlGF >7.98; 4 sFlt1/PlGF MoM >1.352; 4a sFlt1/PlGF MoM >1.274 Table 23. Sensitivity and specificity analysis for Delfia, Cobas and Kryptor platforms using cut-offs from ROC curves.
Assay AUC Sensitivity (95% CI) Specificity (95% CI) PPV (95% CI) NPV (95% CI)
Cobas sFlt1/PlGF ratio
Early Onset PE1 0.97 100 (29.24-100) 95.87 (93.76-97.43) 12.50 (8.59-17.48) 100
Preterm PE1a 0.69 62.5 (24.49-91.48) 66.47 (62.16-70.58) 2.87 (1.68-4.88) 99.11 (97.85-99.64)
Cobas sFlt1/PlGF ratio MoM
Early Onset PE2 0.96 100 (29.24-100) 90.57 (87.69-92.96) 5.88 (4.56-7.56) 100
Preterm PE2a 0.74 62.5 (24.49-91.48) 89.29 (86.25-91.85) 8.47 (4.87-14.35) 99.34 (98.39-99.73)
Kryptor sFlt1/PlGF ratio
Early Onset PE3 0.92 100 (29.24-100) 83.10 (79.56-86.26) 3.37 (2.80-4.06) 100
Preterm PE3a 0.66 62.5 (24.49-91.48) 67.06 (62.77-71.16) 2.92 (1.71-4.97) 99.12 (97.87-99.64)
Kryptor sFlt1/PlGF ratio MoM
Early Onset PE4 0.93 100 (29.24-100) 87.82 (84.66-90.53) 4.62 (3.69-5.76) 100
Preterm PE4a 0.71 62.5 (24.49-91.48) 82.34 (78.73-85.57) 5.32 (3.08-9.03) 99.28 (98.26-99.71)
Pregnancies that developed PE
25 (4.9%) overall PE
17 (3.3%) term (≥37 weeks) PE
8 (1.6%) preterm (<37 weeks) PE
3 (0.6%) early onset (<34 weeks) PE
160
When using sFlt1/PlGF ratio in isolation for the prediction of preterm preeclampsia,
sFlt1/PlGF ratio MoM values performed best for the Cobas and Kryptor platforms, with
AUC 0.74 and 0.71, respectively. Sensitivity, specificity, PPV and NPV for sFlt1/PlGF ratio
MoM for the prediction of preterm preeclampsia for the Cobas and Kryptor platforms
were as follows: sensitivity 62.5 and 62.5; specificity 89.29 and 82.34; PPV 8.47 and 5.32
and NPV 99.34 and 99.28.
4.3.7 sFlt1/PlGF ratio raw data values for the prediction of early onset preeclampsia
For the prediction of early onset preeclampsia using the Cobas platform, raw data values
had the highest AUC and clinical characteristics, including sensitivity, specificity, NPV
and PPV. In contrast, for the prediction of early onset preeclampsia using the Kryptor
platform, sFlt1/PlGF ratio MoM values had the highest AUC and clinical characteristics.
The prediction of early preeclampsia using raw data values for the Cobas platform and
MoM values for the Kryptor platform involved different cut-offs derived from ROC
curves, with the cut-offs chosen to maximise sensitivity and specificity. The cut-off for
early onset preeclampsia using raw data values for the Cobas platform was >13.58, while
the cut-off for early onset preeclampsia using MoM values for the Kryptor platform was
>1.352 MoM.
The numbers of false positives, true positives, false negatives and true negatives for each
platform in the prediction of both early onset and preterm preeclampsia are
summarised in Table 17, Chapter 3.
Looking at true positive results detected using these cut-offs, all 3 cases of early onset
preeclampsia (patients 1,2,3 in Table 24) were detected for each platform, resulting in
3/3 (100%) detection rate for early onset preeclampsia. An additional case of preterm
preeclampsia (patient 7 from Table 24) was detected using the Kryptor platform. These
cut-offs also detected 2 cases of term preeclampsia (patients 10 and 16 from Table 24)

161
No Parity Positive sFlt1/PlGF ratio result obtained
Cobase411 Kryptor
Raw data
MoM Raw data
MoM
1 G2P1, previous 28/40 delivery. HELLP syndrome 28+2/40. Emerg LUSCS. FGR 2nd centile
● ●● ●●
2 G1P0, chronic HT. T1DM, diabetic retinopathy. Superimposed PE, proteinuria 15g/d. LUSCS 30+1/40. FGR 2nd centile. On LDA.
● ●● ●●
3 G3P1. Early onset PE, LUSCS 32/40. FGR 1st centile ● ●● ●●
Patients who developed preterm PE 4 G3P2. previous PE, T2DM. IOL 36+1/40 for PE. LGA 99th centile ● ● 5 G3P2, previous PTD 31/40. Chronic HT. Mild PE, IOL 36+0/40.
Normal BWt. On LDA and calcium.
6 G2P1, previous PTD 31/40 early onset PE. GDM. Severe PE with renal impairment. LUSCS 35+5/40. LGA 97th centile. On LDA.
7 G4P3, previous HELLP 28/40. Severe PE 36+4/40. FGR 1st centile. On LDA and calcium.
● ●●
8 G4P1. Previous FDIU 33/40. Chronic HT, GDM. LUSCS 36+3/40. FGR 2nd centile.
Patients who developed term PE No Parity History
and antenatal course
Delivery and outcome Positive sFlt1/PlGF ratio result obtained
Cobase411 Kryptor
Raw data
MoM Raw data
MoM
9 G4P2, previous PTD 36/40 due to PE and FGR. Late onset PE, LUSCS 37+4. Normal BWt
10 G2P0. HELLP syndrome 38+1/40 (urine PCR 0.10, low haptoglobin, ↑ ALT, ↓platelets (112). Required MgSO4. IOL. Normal BWt
● ●● ●●
11 G4P0. Late onset PE 41/40, IOL. Normal BWt ●●
12 G2P0. Late onset PE. LUSCS 38+4/40. Normal BWt 13 G1P0. T1DM. Late onset PE. LUSCS 37+6/40. LGA 95th% 14 G4P0. Late onset PE, IOL 39+4/40. Normal BWt 15 G1P0. Late onset PE, IOL 39+5/40. Normal BWt 16 G1P0. T1DM. Late onset PE, LUSCS 38+4/40. BWt >97th centile
(5.1kg) ● ●● ●●
17 G1P0. T1DM. Late onset PE. Code green LUSCS 37+5/40 for high lactate. Placenta: prominent syncytial knots, indicating uteroplacental ischaemia
PE = preeclampsia. PTD = preterm delivery. HELLP = haemolysis, elevated liver enzymes, low platelets. LUSCS = Lower uterine segment caesarean section. BWt = birthweight. FGR = fetal growth restriction. LGA = large for gestational age. HT = hypertension. T1DM = Type 1 diabetes mellitus. T2DM = type 2 diabetes mellitus. IOL = induction of labour. GDM = gestational diabetes mellitus. FDIU = fetal death in utero. PCR = protein to creatinine ratio. MgSO4 = magnesium sulphate. LDA = low dose aspirin.
● = patient detected using cut-off for early PE (Table 23)
● = patient detected using cut-off for preterm PE (Table 23)
Table 24. True positive results for sFlt1/PlGF raw data and MoM values for the three platforms.

162
PTD = preterm delivery. LUSCS = Lower uterine segment caesarean section. BWt = birthweight. FGR = fetal growth restriction. HT = hypertension. T1DM = Type 1 diabetes mellitus. IOL = induction of labour. FDIU = fetal death in utero. PPROM = prelabour premature rupture of membranes. APH = antepartum haemorrhage. FMH = feto-maternal haemorrhage
● = patient detected using cut-off for early PE
● = patient detected using cut-off for preterm PE
Table 25. False positive results with preterm delivery or poor outcomes for
sFlt1/PlGF raw data and MoM values for the three platforms
False positives with preterm delivery or poor outcomes using sFlt1/PlGF ratio
No Relevant history and outcome Positive result obtained
Cobase411 Kryptor
Raw data
MoM Raw data
MoM
1 G1P0. FDIU 39/40. Placental abruption. IOL. Normal BWt
●● ●●
2 G1P0. PTD 35/40, IOL for PPROM with suspected chorioamnionitis. FGR 1st centile. Placental histopathology confirmed chorioamnionitis
● ●● ●●
3 G2P1. Previous PTD 35/40 for FGR. APH 36+2/40. LUSCS. FGR 2nd centile
●● ●●
4 G1P0. Smoker. Preterm labour 34+5/40. Emerg LUSCS. FGR 4th centile
●
5 G3P1. Chronic HT. Preterm labour 32/40, placental abruption. LUSCS. Normal BWt
6 G1P0. Placental abruption 35+2/40, Kleihauer showed 157mL FMH. LUSCS. BWt 11th centile. Placental histopathology confirmed abruption
● ●● ●●
7 G1P0. T1DM. PPROM, spontaneous labour 30+5/40. Normal BWt
● ●● ●●
10 G3P1. Previous FGR. On LDA. IOL 36+4 for gestational hypertension. FGR 2nd centile
●● ●
11 PPROM 36+4/40. LUSCS. Normal BWt ● ●●

163
for both platforms and a further case of term preeclampsia (patient 11 from Table 24)
for the Kryptor platform.
Using these cut-offs, for the Cobas platform, which only identified the 3 patients who
developed early onset preeclampsia, there were 5 false negative results that all had
preterm preeclampsia (patients 4,5,6,7,8 from Table 24). These patients each delivered
between 35+5/40 and 36+4/40, and 2 also developed FGR. For the Kryptor platform,
there were 4 false negatives (patients 4,5,6,8 from Table 24), one of whom also
developed FGR.
When using the Cobas sFlt1/PlGF ratio raw data values for the prediction of early
preeclampsia, 23 (4.5%) patients within the cohort who did not go on to develop
preeclampsia had a false positive, or falsely high, sFlt1/PlGF ratio result at
midpregnancy. 3 (13.0%) of these false positives delivered a baby at ≥37 weeks with
birthweight less than the 10th percentile. 3 (13.0%) of these false positives delivered
prior to 37 weeks or had a poor pregnancy outcome. The details for these latter 3
patients are summarised in Table 25 (patients 2, 6 and 7). The Cobas sFlt1/PlGF ratio
raw data values for the prediction of early onset preeclampsia detected 5 (21.7%)
patients with composite adverse outcomes (see Table 20, Chapter 3). These included all
three cases of early onset FGR and preeclampsia, a case of placental abruption, and a
case of preterm FGR (patients 1,2,3,14,22 from Table 20).
When using Kryptor sFlt1/PlGF ratio MoM values for the prediction of early
preeclampsia, 66 (12.9%) patients within the cohort who did not go on to develop
preeclampsia had a false positive, or falsely high, sFlt1/PlGF ratio result at
midpregnancy. Eight (12.1%) of these false positives delivered a baby at ≥37 weeks with
birthweight less than the 10th percentile. Six (9.1%) of these false positives delivered
prior to 37 weeks or had a poor pregnancy outcome. The details for these latter 6
patients (1,2,3,6,7,11) are summarised in Table 25. The Kryptor sFlt1/PlGF ratio MoM
values for the prediction of early preeclampsia detected 8 (12.1%) patients with
composite adverse outcomes. These included 4 of the 5 patients with preterm
preeclampsia + FGR, the case of abruption and stillbirth at 39 weeks as well as another
164
placental abruption, and two cases of preterm FGR (patients 1,2,3,4,6,14,23,26 from
Table 20).
4.3.8 sFlt1/PlGF ratio MoM values for the prediction of preterm preeclampsia
For the prediction of preterm preeclampsia, MoM values for the Cobas and Kryptor
platforms gave the best clinical validity, including sensitivity, specificity, NPV and PPV.
The cut-off for preterm PE using MoM values for the Cobas and Kryptor platforms were
>1.327 MoM and >1.274 MoM, respectively.
Looking at true positive results detected using these cut-offs, all 3 cases of early onset
preeclampsia (patients 1,2,3 in Table 20) were detected for each platform, as well as an
additional 2 cases of preterm preeclampsia (patients 4 and 7 from Table 24) and 2 and
3 cases, respectively, of term preeclampsia (10 and 16 for both platforms and 11 for
Kryptor in Table 24). This gave a 5/8 (62.5%) detection rate for preterm preeclampsia.
Using these cut-offs, for both the Cobas and Kryptor platform using MoM values for the
prediction of preterm preeclampsia, there were 3 false negative results that all had
preterm preeclampsia (patients 5,6 and 8 from Table 24). These patients each delivered
between 35+5/40 and 36+3/40, and 1 developed FGR.
When using the Cobas sFlt1/PlGF ratio MoM values for the prediction of preterm
preeclampsia, 56 (10.9%) patients within the cohort who did not go on to develop
preeclampsia had a false positive, or falsely high, sFlt1/PlGF ratio result at
midpregnancy. Seven (12.5%) of these false positives delivered a baby at ≥37 weeks with
birthweight less than the 10th percentile. Eight (14.3%) of these false positives delivered
prior to 37 weeks or had a poor pregnancy outcome. The details for these latter 8
patients (1,2,3,4,6,7,10,11) are summarised in Table 25. The Cobas sFlt1/PlGF ratio MoM
values for the prediction of preterm preeclampsia detected 10 patients with composite
adverse outcomes. These included 4 of the 5 patients with preterm preeclampsia and
FGR, the case of abruption and stillbirth at 39 weeks as well as another placental
abruption, and 4 cases of preterm FGR (Refer to Table 20 in Chapter 3).
165
When using the Kryptor sFlt1/PlGF ratio MoM values for the prediction of preterm
preeclampsia, 92 (17.9%) patients within the cohort who did not go on to develop
preeclampsia had a false positive, or falsely high, sFlt1/PlGF ratio result at mid-
pregnancy. 9 (9.8%) of these false positives delivered a baby at ≥37 weeks with
birthweight less than the 10th percentile. Seven (7.6%) of these false positives delivered
prior to 37 weeks or had a poor pregnancy outcome. The details for these 7
(1,2,3,6,7,10,11) patients are summarised in Table 25. The Kryptor sFlt1/PlGF ratio MoM
values for the prediction of preterm preeclampsia detected 10 (10.9%) patients with
composite adverse outcomes (Table 20, Chapter 3). These included 4 of the 5 patients
with preterm preeclampsia and FGR, the case of abruption and stillbirth at 39 weeks as
well as another placental abruption (all the same patients detected by the Cobas
platform), as well as 4 cases of preterm FGR.
4.4 Discussion
In this study, the performance of two commercially available immunoassay platforms,
the Cobas and Kryptor, were compared for the purpose of prediction of preeclampsia at
midpregnancy, using the sFlt1/PlGF ratio. As previously discussed in Chapter 2, clinical
correlation and agreement between the two platforms was shown to be very good.
Hence, we would expect similar performance between the platforms with regard to
prediction of clinical outcomes.
Overall, PlGF and the sFlt1/PlGF ratio for the prediction of preterm and early onset
preeclampsia across all platforms perform very well, both in terms of clinical
characteristics and clinical correlation with patient outcomes.
sFlt1 raw data and MoM values alone were not significantly different between patients
who developed preeclampsia and unaffected pregnancies. These results are not
unexpected as though PlGF levels have been shown to decrease significantly from
between 13 and 16 weeks gestation in patients who develop preeclampsia, the increase
in sFlt1 shown to be associated with preeclampsia occurs at a later gestation, from
between 21 and 24 weeks gestation (Levine 2004). The testing undertaken for the
purpose of this study may have been slightly too early to capture this increase.

166
Similar to the use of PlGF in isolation for prediction of preeclampsia, there were 3
patients in the preterm preeclampsia group who were not detected using sFlt1/PlGF
ratio for either platform, with either raw data or MoM values. Possible reasons for
patients 5 and 6 in Table 24 testing negative across all platforms despite having
significant disease are discussed in chapter 3. Patient 8 from Table 24 had a history of
previous FDIU at 33 weeks, GDM and chronic hypertension, and was taking low dose
aspirin. She developed late onset preeclampsia and FGR requiring delivery at 36+3
weeks, and her baby’s birthweight was on the 2nd centile. It is difficult to justify her test
result being negative in light of having presumably significant placental disease,
however the fact that she was taking aspirin may have potentially altered her clinical
course.
When testing the sFlt1/PlGF ratio for the prediction of early onset preeclampsia at
midpregnancy, the Cobas sFlt1/PlGF ratio using raw data values displayed the most
favourable clinical characteristics (Table 23). sFlt1/PlGF MoM values performed best for
prediction of preterm preeclampsia for both platforms (Table 23).
For the prediction of early onset preeclampsia, the AUC for sFlt1/PlGF raw data values
for the Cobas platform and MoM values for the Cobas and Kryptor platform (0.97, 0.96
and 0.93), and clinical characteristics including sensitivity (100, 100 and 100), specificity
(95.87, 90.57 and 87.82), PPV (12.5, 5.88 and 4.62) and NPV (100, 100 and 100) indicated
effective prediction of early onset preeclampsia within this patient cohort. Each test
detected all 3 cases of early onset preeclampsia, and the Kryptor sFlt1/PlGF ratio MoM
additionally identified a case of preterm preeclampsia. Two, 2 and 3 cases of term
preeclampsia, respectively, were identified by the Cobas raw data, MoM and Kryptor
MoM cut-off, with the patient who developed HELLP syndrome at 38 weeks being
detected with each test. As previously stated, the detection of term preeclampsia was
not the primary objective of testing. The Cobas platform raw data and MoM value cut-
off had one more false negative result for preterm preeclampsia than Kryptor, at 5
compared with 4, none of whom developed early onset preeclampsia. For the prediction
of early onset preeclampsia, the Cobas sFlt1/PlGF raw data values had the least false
167
positive results (23, or 4.5%), followed by Cobas sFlt1/PlGF MoM (50, or 9.7%), followed
by Kryptor MoM (66, or 12.9%), reflecting the higher PPV observed with the Cobas
platform compared with the Kryptor. This resulted in fewer patients identified using
Cobas raw data and MoM values who delivered prior to 37 weeks or had an adverse
outcome (3 and 5 patients, respectively) than with Kryptor MoM values (6 patients).
Looking at composite adverse outcomes, the Cobas sFlt1/PlGF raw data cut-off detected
5 cases, the Cobas sFlt1/PlGF MoM cut-off detected 8 cases and the Kryptor sFlt1/PlGF
MoM values identified 8 cases. In summary, both the Cobas sFlt1/PlGF ratio using raw
data values and the early PE cut-off, the Cobas sFlt1/PlGF ratio using MoM values and
the Kryptor sFlt1/PlGF ratio using MoM values had relatively equal performance from a
clinical point of view with regard to detecting patients at risk of early onset
preeclampsia. With the knowledge we currently have, based on AUC and clinical
characteristics, and the significantly fewer false positives obtained, the Cobas sFlt1/PlGF
ratio, using raw data values, appeared to be the superior test for the prediction of early
onset preeclampsia within this patient population.
For the prediction of preterm preeclampsia, the AUC for sFlt1/PlGF MoM values for the
Cobas and Kryptor platforms (0.74 and 0.71), and clinical characteristics including
sensitivity (62.5 and 62.5), specificity (89.29 and 82.34), PPV (8.47 and 5.32) and NPV
(99.34 and 99.28) indicate good clinical validity for the prediction of preterm
preeclampsia. Both platforms detected all 3 cases of early onset preeclampsia, as well
as 2 cases of preterm preeclampsia (patients 4 and 7 from Table 24), and 2 and 3 cases,
respectively, of term preeclampsia, including patient 10. The same 3 patients for each
platform had a false negative result for preterm preeclampsia, none of whom had early
onset preeclampsia. The Cobas sFlt1/PlGF MoM cut-off for prediction of preterm
preeclampsia had fewer false positive results (56, or 10.9% compared with 92, or 17.9%),
again most likely secondary to a higher PPV observed with the Cobas platform compared
with the Kryptor. However, both platforms detected essentially the same patients with
a false positive result who required either preterm delivery or had an adverse outcome,
with Cobas detecting one additional patient to Kryptor (8 compared with 7 patients).
Similarly, both platforms identified 10 patients who developed composite adverse
outcomes, of which 4 cases developed preterm preeclampsia and FGR, the case of
168
abruption and stillbirth at 39 weeks, another case of abruption and one of preterm FGR
were identified by both platforms. In summary, both the Cobas sFlt1/PlGF ratio MoM
values using the preterm PE cut-off and Kryptor sFlt1/PlGF ratio MoM values using the
preterm PE cut-off had essentially equal performances for prediction of patients at risk
of preterm preeclampsia using sFlt1/PlGF MoM values. The Cobas had significantly
fewer false positive results, so should be considered the superior test.
When comparing the clinical characteristics using sFlt1/PlGF ratio raw data values for
the prediction of early onset preeclampsia with sFlt1/PlGF MoM values for prediction of
preterm preeclampsia, the Cobas sFlt1/PlGF ratio using raw data values displayed the
most favourable clinical characteristics and based on these characteristics and the
significantly fewer false positives for this test, it was assessed to have the best
performance overall for prediction of early onset preeclampsia. For the prediction of
preterm preeclampsia, the Cobas and Kryptor sFlt1/PlGF ratio using MoM values had
essentially equal performances. Given that once again the Cobas platform had
significantly fewer false positive results, this should be considered the superior test.
When comparing clinical validity of PlGF, described in Chapter 3, and the sFlt1/PlGF ratio
for prediction of early onset preeclampsia, PlGF raw data had a lower AUC (0.92-0.93)
than sFlt1/PlGF ratio raw data values (0.97), and clinical characteristics performed
worse. Clinically, PlGF raw values detected 3 cases of early onset preeclampsia and 2
cases of preterm preeclampsia, but had very high false positive rates (103, 119, 104 for
Delfia, Cobas and Kryptor, respectively). For the prediction of early onset preeclampsia,
the best tests were PlGF and the sFlt1/PlGF ratio using raw data results and the early
onset cut-off.
When comparing clinical validity of tests for the prediction of preterm preeclampsia,
PlGF MoM performed better than sFlt1/PlGF ratio MoM based on AUC. In terms of
clinical correlation, both tests detected 5/8 (62.5%) cases of preterm preeclampsia,
though there was a significant false negative for all platforms for PlGF MoM, with a case
of early onset preeclampsia going undetected (patient 2 in Table 18). The number of
false positive results for PlGF MoM and sFlt1/PlGF ratio MoM were similar, with 65 and

169
56 false positives for Cobas PlGF MoM and sFlt1/PlGF ratio MoM, and 49 and 92 for
Kryptor PlGF MoM and sFlt1/PlGF MoM, respectively, with a similar number of adverse
outcomes and composite adverse outcomes being detected. Overall, despite PlGF MoM
having better clinical validity based on AUC, when clinically correlated, PlGF MoM and
sFlt1/PlGF ratio MoM for the prediction of preterm preeclampsia performed very
similarly.
The most serious implications from a screening test arise from false negative results.
Within the patient cohort tested, PlGF MoM was shown to perform best for the
prediction of preterm preeclampsia, however, one patient who went on to develop early
onset preeclampsia at 30 weeks gestation was missed using this test (patient 2 in Table
18). This is a significant false negative, though she probably had a greater maternal
rather than placental component to her disease, possibly explaining why her PlGF level
was not low enough to give a positive test result. In addition to this, she was taking
aspirin during the pregnancy, which may have altered her clinical course. Of course, no
test is perfect, however optimising patient safety is paramount.
In light of the significant false negative result for PlGF MoM using the preterm
preeclampsia cut-off, and the fact that identification of cases at increased risk for early
onset preeclampsia is important to optimise perinatal morbidity and mortality, the
Cobas sFlt1/PlGF ratio using raw data values using the early preeclampsia cut-off
appears to be the superior test in terms of clinical outcomes for prediction of early onset
preeclampsia.
Positive predictive values associated with sFlt1/PlGF ratio testing for the prediction of
preeclampsia at midpregnancy, while slightly higher than those obtained with PlGF
testing, were still relatively low. When clinically correlated, PlGF raw data values using
the cut-off for early onset PE had very low PPV (2.5-3.0%) with consequently large
numbers of false positive results, translating to one in every 30 to 40 patients identified
to be high risk for preeclampsia based on screening actually developing early onset
preeclampsia. In contrast, sFlt1/PlGF ratio raw data values using the cut-off for early
onset preeclampsia had a higher PPV, with the Cobas platform having a PPV of 12.5%,
which was higher than all other tests in the study.

170
Figure 38. Clinical characteristics for the tests that perform best for the prediction of early onset and preterm preeclampsia.

171
This translated to far fewer false positive results for sFlt1/PlGF ratio raw data values
using this cut-off, and clinically means that one in every 8 patients identified to be high
risk of developing preeclampsia based on screening would actually develop early onset
preeclampsia.
When determining the most superior test for the prediction of preeclampsia at
midpregnancy, the Cobas sFlt1/PlGF ratio using raw data values and the early PE cut-off
was chosen, as it has highest AUC, sensitivity, specificity, PPV and NPV compared to the
other tests, and significantly fewer false positive results (Figure 38). Having a lower false
positive rate is desirable in several ways. Firstly, as outlined in chapter 3, fewer false
positives would prevent unnecessary patient and physician anxiety and potential effort
associated with increased surveillance. Secondly, reduction in false positives could
significantly reduce overall costs involved with testing and consequent increased
monitoring. On the other hand, PlGF raw data values using the early onset PE cut-off
and sFlt1/PlGF ratio MoM values using the preterm PE cut-off both detected all cases of
early onset preeclampsia, but had higher false positive rates, which translated to far
more adverse outcomes and composite adverse outcomes being detected (Figure 38).
The decision as to which is the most useful test requires further knowledge of the exact
clinical utility of both PlGF and the sFlt1/PlGF ratio for the prediction of conditions
arising from placental dysfunction. If the primary aim is to predict early onset
preeclampsia, at this stage it appears that the Cobas sFlt1/PlGF ratio using raw data
values and the early onset cut-off performs best and is the superior test for this purpose.
If the primary aim is to identify placental dysfunction arising from various placental
pathologies, and potentially linking preeclampsia with FGR and placental abruption,
perhaps it is more beneficial, until the clinical utilities of PlGF and sFlt1/PlGF ratio testing
are better defined, to favour inclusion of false positive results that might capture these
additional adverse pregnancy outcomes. In this case, testing with PlGF raw data values
using the early onset PE cut-off and sFlt1/PlGF ratio MoM values using the preterm PE
cut-off may be most effective. There is much knowledge yet to be attained regarding
the clinical utility of PlGF and the sFlt1/PlGF ratio in not only the detection of
preeclampsia, but more generalised placental pathologies, that may even exist on the
same spectrum. Given that our primary outcome for this study was the detection of

172
preeclampsia, the Cobas sFlt1/PlGF ratio using raw data values and the early PE cut-off
appears to be the superior test for this purpose. Given that the clinical utility of PlGF and
the sFlt1/PlGF ratio for midpregnancy screening for preeclampsia has not been fully
determined, false positive tests need to be documented and considered carefully. With
further understanding, “false positive” results linked to preterm delivery and other
adverse outcomes may be confirmed to be associated with altered placental
biomarkers, as an indicator for generalised placental pathology, and may end up being
categorised as “true positives”.
The results presented have confirmed those reported in the literature that second
trimester prediction of term preeclampsia using both sFlt1 and PlGF appears to be poor,
with predictive performance based on ROC curves for prediction of term preeclampsia
showing very little discriminatory power for this outcome. The results from this study
were also in alignment with other studies in the literature in terms of predictive ability
of sFlt1/PlGF ratio testing being higher when predicting early onset and preterm
preeclampsia rather than late onset or term preeclampsia. Using the selected cut-offs
for preterm and early onset preeclampsia, very few cases of term preeclampsia were
identified, providing further support for the widely accepted theory that early onset and
term preeclampsia result from two separate pathophysiological processes, the former
being far more likely to have significantly different maternal sFlt1 and PlGF levels than
patients who develop preeclampsia greater than 34 weeks, making them far more likely
to be identified by screening tests using placental biomarkers. As with numerous
previous studies, addition of sFlt1 as the sFlt1/PlGF ratio did improve predictive
performance for early onset preeclampsia compared with use of PlGF alone. Given the
findings of Levine in 2004 (Levine 2004), it makes sense that the cases of early onset
preeclampsia within this patient cohort had abnormal placental biomarkers when tested
at midpregnancy, as sFlt1 and PlGF levels have both been reliably noted to become
altered up to 11 weeks from development of symptoms of preeclampsia. On these
grounds patients who developed late onset preterm preeclampsia would not be
expected to display midpregnancy derangement in placental biomarkers if they did not
develop symptoms of preeclampsia until after 34 weeks gestation. As with other studies,
the majority of patients who tested positive for the sFlt1/PlGF ratio using the selected
173
cut-offs for preterm and early onset preeclampsia did not go on to develop
preeclampsia. The PPV’s reported for both platforms for sFlt1/PlGF ratio testing were all
low. Interestingly, PPV’s in studies in the literature ranged from 4.9 to 78.6, with the
higher PPV’s possibly indicating that some of these studies (Shokry et al. 2010; Hassan
et al. 2013) were performed among patients at considerably high risk for development
of preeclampsia, which differs from the population studied here. The studies that
reported high PPVs, and high incidence of preeclampsia within their patient population
(Shokry et al. 2010; Hassan et al. 2013) stated that baseline characteristics were
comparable between groups at the time of recruitment, but this data was not displayed
in any further detail. In most studies, the majority of patients with an imbalance
between angiogenic and antiangiogenic factors do not go on the develop preeclampsia
(Kleinrouweler et al. 2012; McElrath et al. 2012; Myatt et al. 2013; Myers et al. 2013).
Consequently, these tests commonly have low PPV’s, regardless of the gestation of
sample collection. Since PPV is dependent on prevalence of a condition in the general
population, with regard to preeclampsia screening, low PPV’s associated with screening
tests most likely reflect this low prevalence, which is unlikely to improve significantly
regardless of how high the sensitivity and specificity are. Hence for a disease with low
incidence, PPV should not be used in isolation to determine clinical utility
(Chaiworapongsa et al. 2014a).
Due to less agreement between the platforms when using raw data values, relevant to
testing for early onset preeclampsia using sFlt1/PlGF raw data results, the cut-offs are
quite different and there would need to be different reference ranges for each platform
when used in clinical practice. Converting values to MoM almost eliminates this issue,
as the agreement between MoM values was much better, making values obtained from
the three different platforms equivalent. This translates to very similar cut-offs and
reference ranges for the three platforms in clinical practice. This needs to be taken into
consideration if using raw data values for these biomarkers. The advantage of using raw
data values is that this would reduce the resources required to implement the test, as
the complex and time-consuming calculations for conversion of raw data values to MoM
are not required.

174
Overall, though the Cobas sFlt1/PlGF ratio using raw data values and the early PE cut-off
was assessed to be the test with greatest clinical validity for reasons described above,
the PlGF and the sFlt1/PlGF ratio for the prediction of preterm and early onset
preeclampsia across all platforms perform very well. Using PlGF raw data values and the
early PE cut-off gave ranges for clinical characteristics across the three platforms as AUC
0.92-0.93, sensitivity 100%, specificity 77.8-80.75%, PPV 2.59-2.97 and NPV 100%. Using
sFlt1/PlGF ratio for early onset PE gave ranges across the three platforms as AUC 0.93-
0.97, sensitivity 100%, specificity 87.82-95.87%, PPV 4.62-12.50 and NPV 100%. Using
PlGF MoM values and the preterm PE cut-off gave ranges across the platforms as AUC
0.77-0.79, sensitivity 62.5%, specificity 85.12-90.28%, PPV 6.25-9.26 and NPV 99.31-
99.34%. Using sFlt1/PlGF ratio MoM and the preterm PE cut-off gave ranges across the
platforms as AUC 0.71-0.74, sensitivity 62.5, specificity 82.34-89.29, PPV 5.32-8.47 and
NPV 99.28-99.34. These tests all showed high sensitivity, particularly when using the cut-
off for early onset PE, and importantly, specificity was very high for both PlGF and
sFlt1/PlGF ratio using both the early onset and preterm PE cut-offs. NPV was above 99%
across all testing modalities, likely reflective of low PPV and low prevalence of
preeclampsia in our patient population.
As outlined in Chapter 3, Section 3.3.1, 52 patients in the study (10% of the cohort in
total) were taking low dose aspirin antenatally. Nine of these patients went on to
develop preeclampsia (1 developed early onset, 8 developed late onset). Overall, the
majority of patients in this group (patients 1-42 in particular) who were taking low dose
aspirin had significant risk factors for either development of preeclampsia or other
adverse pregnancy outcomes and would be classified as high risk based on these risk
factors, with 17% of them developing preeclampsia, which is much higher than the
incidence of preeclampsia quoted overall for the study. It is not possible to determine
the effect that taking prophylactic low dose aspirin has had on the biomarker values or
clinical outcomes of these patients and this confounding factor needs to be taken into
consideration in the interpretation of results presented.
Neither PlGF nor the sFlt1/PlGF ratio were predictive of term preeclampsia. Perhaps we
can be hopeful that in being able to accurately predict preterm and early onset

175
preeclampsia, that identifying these high-risk groups may lead not only to the discovery
of effective prophylactic and therapeutic agents for preterm and early onset
preeclampsia, but perhaps through this journey additional biomarkers will be discovered
that are better predictors of term preeclampsia. This may then lead to further studies
to determine prophylactic and therapeutic agents for term preeclampsia.
4.5 Summary
Patients who developed early onset preeclampsia had significantly higher sFlt1/PlGF raw
data and MoM values at the time of testing across all three platforms, while patients
who developed preterm preeclampsia had significantly higher sFlt1/PlGF ratio MoM
values, with no significant difference in raw data values between patients who
developed preeclampsia and unaffected pregnancies. Both sFlt1/PlGF ratio raw data
values for the prediction of early onset preeclampsia and PlGF MoM for the prediction
of preterm preeclampsia showed very good predictive performance, with good
sensitivity and specificity for the development of both early onset and preterm
preeclampsia. Following comparison of testing with PlGF and the sFlt1/PlGF ratio for the
prediction of early onset preeclampsia, the sFlt1/PlGF ratio using raw data values and
the cut-off for early onset preeclampsia had the greatest clinical validity for this purpose,
with far fewer false positives compared with using PlGF in isolation as a predictive test.
Following comparison of testing with PlGF and sFlt1/PlGF ratio for the prediction of
preterm preeclampsia, PlGF MoM had better clinical validity based on AUC and clinical
characteristics when compared with sFlt1/PlGF ratio, however following clinical
correlation with analysis of true positives, false negatives and false positives for each,
their clinical performance in our patient population was actually very similar. Of course,
the conclusions drawn from this study are limited by very small numbers, highlighting
the need for further research to be performed, at the very least in the form of ongoing
audits of clinical outcomes of patients undergoing PlGF and sFlt1/PlGF ratio testing for
the prediction of preeclampsia compared with patients undergoing standard antenatal
care, to confirm and further determine the clinical validity and utility of these tests prior
to implementing them in clinical practice.

176
The low PPV for both PlGF and the sFlt1/PlGF ratio is likely reflective of the low
prevalence of preterm and early onset preeclampsia in our population and limits the
clinical validity of PlGF testing in isolation as a screening test. The addition of PlGF or
sFlt1/PlGF ratio values to a multivariable logistic regression model may further enhance
the clinical validity of screening for preterm preeclampsia in this patient population, and
this method will be discussed in Chapter 6.
177
Chapter 5
PlGF and the sFlt1/PlGF ratio in the prediction
of preeclampsia and fetal growth restriction
5.1 Introduction
Fetal growth restriction (FGR) is defined as a failure for a fetus to achieve their endorsed
growth potential (Figueras and Gratacos 2014). These small fetuses are at greater risk
for deterioration in utero, stillbirth and adverse perinatal outcomes when compared
with normally grown fetuses, often warranting active management and elective delivery
before full term (Figueras and Gratacos 2014). This differs from fetuses who are small
for gestational age (SGA), defined on the basis of having estimated fetal weight (EFW)
below a given threshold, which is commonly the 10th centile. Fetuses who are SGA are
often constitutionally small, lack the ultrasound features that are linked with risk of
adverse outcomes, and have a near normal perinatal outcome, with elective preterm
delivery offering no benefit. Unfortunately, there is not a single parameter to best
differentiate FGR from SGA (Figueras and Gratacos 2014). FGR should be diagnosed in
the presence of factors associated with a poorer perinatal outcome, including doppler
cerebroplacental ratio (CPR) less than the 5th centile, UAPI greater than the 95th centile
and EFW <3rd centile (Figueras and Gratacos 2014). The traditional approach of
identifying FGR using abdominal palpation or measurement of the symphysio-fundal
height (SFH) show poor predictive performance, with detection of less than 30% of
affected fetuses (Lindhard et al. 1990). A routine third trimester scan is certainly
superior to SFH measurement in identifying pregnancies at high risk of FGR (Souka et al.
2012; Bakalis et al. 2015), however optimal timing of this investigation is uncertain,
depending on whether the pregnancy is at risk of early onset or late onset FGR, which
there is currently no accurate or reliable method for predicting. Midpregnancy screening
to determine who might be at increased risk for FGR could help guide ongoing
monitoring, such as third trimester ultrasound, and the optimal timing for such
monitoring (Bakalis et al. 2015; Fadigas et al. 2015; Lesmes et al. 2015). As with
178
prediction of preeclampsia, accurate prediction of FGR would greatly facilitate the
execution of future studies into prophylactic and therapeutic agents for this condition.
Placental biomarkers PlGF and sFlt1 have been shown to be linked with FGR, both in
isolation and with coexisting preeclampsia present (Taylor et al. 2003; Crispi et al. 2008;
Diab et al. 2008; Romero et al. 2008; Benton et al. 2012), with recent evidence
suggesting that abnormal levels of angiogenic factors may predict a poor perinatal
outcome among small fetuses (Lobmaier et al. 2014). Levels of PlGF have been shown
to be progressively lower in pregnancies with idiopathic FGR, preeclampsia and
preeclampsia with FGR, respectively (Taylor et al. 2003), indicating increasingly
significant placental pathology. A previous case-control study at midpregnancy has
shown that in pregnancies which have developed FGR in the absence of preeclampsia,
PlGF levels are decreased and sFlt-1 levels are increased (Savvidou et al. 2006). One of
the findings in a prospective cohort study of 3348 pregnancies in 2007 was that
abnormal UAPI and decreased plasma PlGF between 22 and 26 weeks gestation was
associated with increased development of FGR, in the absence of preeclampsia
(Espinoza et al. 2007). Shim (Shim et al. 2015) tested PlGF between 16 and 23 weeks
gestation. 19 out of 37 patients who developed preeclampsia also developed FGR,
compared with one case of FGR in the control group. PlGF levels at midpregnancy were
significantly lower in the group who went on to develop FGR.
Placental biomarkers sFlt1 and PlGF may reflect the presence of various placental
pathological entities, rather than being specific to preeclampsia. PlGF levels in women
with suspected FGR diagnosed antenatally were shown by Benton (Benton et al. 2012)
to effectively differentiate patients with FGR from those with constitutionally small SGA
fetuses. A positive PlGF test in women with suspected FGR antenatally, defined as PlGF
level <5th centile for gestation at the time of diagnosis of FGR was shown to identify
women with placental FGR, as opposed to constitutional SGA with high sensitivity
(100%) and specificity (86%). PPV and NPV were 90% and 100%, respectively. These
results are in agreement with previous reports of lowered PlGF in pregnancies with
growth restricted fetuses (Taylor et al. 2003; Levine 2004; Poon et al. 2008; Romero et
al. 2008). The conclusions from Benton’s study were limited by small numbers (9
179
patients had confirmed placental FGR), however the results were very promising for an
effective antenatal test to differentiate SGA from placental FGR in patients with a
suspicion of SGA antenatally. Pregnancies at risk of FGR have been shown to have lower
PlGF levels compared with unaffected pregnancies from as early as the first trimester
and into the second trimester (Tjoa et al. 2001; Taylor et al. 2003; Poon et al. 2008;
Romero et al. 2008). Building on this finding, Lesmes (Lesmes et al. 2015) used a
multivariable algorithm to screen 9715 pregnancies between 19 and 25 weeks gestation
for fetal growth restriction. The algorithm included maternal characteristics, medical
history, estimated fetal weight on ultrasound, UAPI, MAP and serum PlGF, sFlt1, PAPP-
a, free BHCG and AFP. For SGA <3rd centile, they obtained an AUC 0.999, 0.966 and 0.760
for delivery less than 32 weeks, 32 to 36 weeks and greater than 37 weeks, respectively.
Detection rate (DR) at a 10% false positive rate (FPR) for each gestational group were
100, 88.2 and 38.3, respectively. They found that PlGF was reduced significantly but sFlt1
was not significantly different from normal pregnancies.
Placental causes of FGR are a cause for great concern clinically, as these fetuses are
exposed to the detrimental effects of reduced placental transfer of oxygen and nutrients
antenatally, with inherent risk of stillbirth, neonatal death, perinatal morbidity and
iatrogenic preterm delivery as well as delayed effects including cerebral palsy (M Kady
and Gardosi 2004; Barker 2006; Pallotto and Kilbride 2006; Leitner et al. 2007; Jacobsson
et al. 2008; Varvarigou 2010). Fetal undernutrition associated with FGR during the
gestational period has been shown to be linked with cardiovascular disease and other
long term adverse health outcomes which may continue into adult life (Barker et al.
1993; Barker 1995) due to reprogramming of relationships between glucose, insulin,
growth hormone and insulin-like growth factor (IGF). These adaptations, while
necessary in order to survive the antenatal period, are associated with potentially
serious metabolic abnormalities later in life, with substantial risk for the development
of cardiovascular disease, type 2 diabetes and hypertension (Barker et al. 2002; Barker
2006; de Jong et al. 2012). In addition to this, there is emerging evidence that these
neonates are at risk of poorer neurodevelopmental outcomes into the preschool years
(Levine et al. 2015).

180
It was observed that a significant proportion of patients in our population who
developed preterm preeclampsia had coexisting FGR, while there were no cases of FGR
in the patients who developed term preeclampsia. It was deemed valuable to explore
further the nature of the association between patients who developed preterm FGR and
patients who developed preterm preeclampsia and FGR, expecting that those with
coexisting pathologies would have PlGF and sFlt1 levels reflecting this shared pathology,
and that they would be expected to have a higher incidence of preterm delivery and low
birth weight.
5.2 Methods
Methods described in Chapter 2 were followed.
5.2.1 Study population
Refer to Section 2.2
5.2.2 Blood sample collection and storage
Refer to Section 2.3.
5.2.3 Outcome measures
The main outcome of interest was fetal growth restriction (FGR), as defined as the
presence of any of the factors associated with poorer perinatal outcome, including
Doppler cerebroplacental ratio < 5th centile, UAPI >95th centile, or EFW below the 3rd
percentile (Figueras and Gratacos 2014). The combined outcome of preterm
preeclampsia and FGR was the second outcome of interest. As in previous chapters,
preeclampsia was defined by the ISSHP (Brown et al. 2018). More specifically,
preeclampsia was classified according to gestation at the time of delivery, not the time
of onset, as early onset preeclampsia (<34weeks), preterm preeclampsia (<37weeks)
and term preeclampsia (≥37weeks).
5.2.4 Statistical Analysis
In addition to the analyses described in Chapter 2, median biomarker values for PlGF
and the sFlt1/PlGF ratio were compared between patients with unaffected pregnancies,
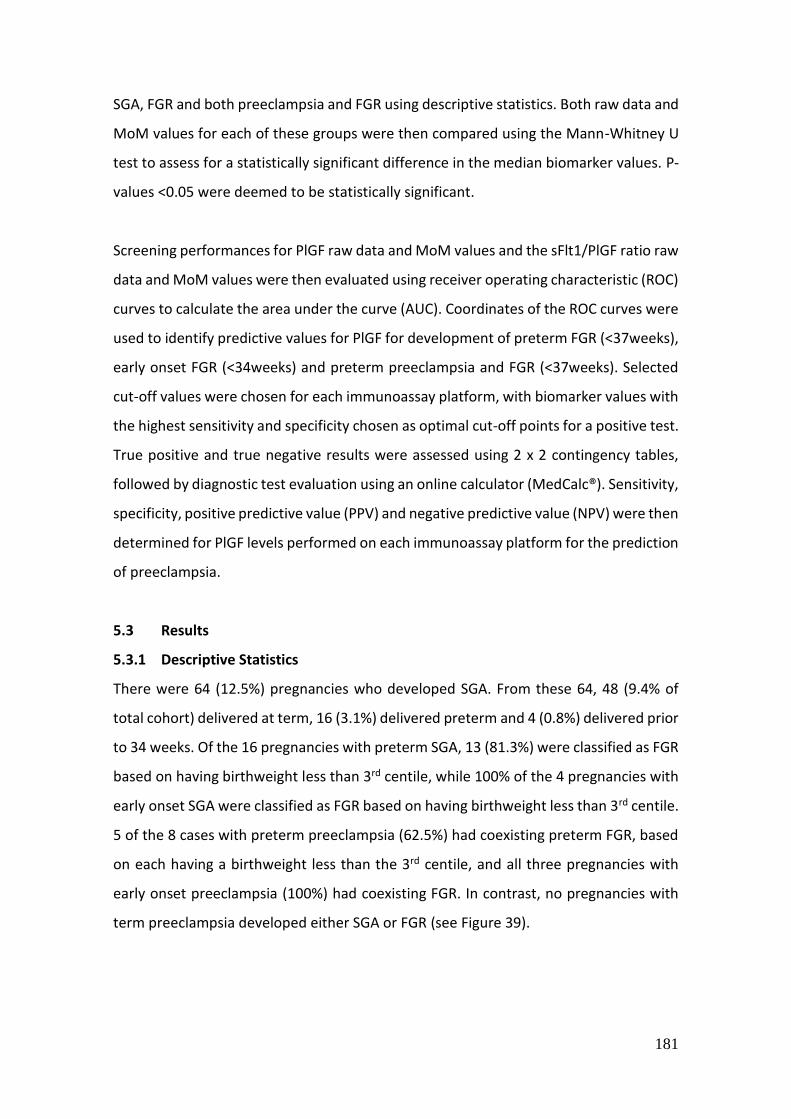
181
SGA, FGR and both preeclampsia and FGR using descriptive statistics. Both raw data and
MoM values for each of these groups were then compared using the Mann-Whitney U
test to assess for a statistically significant difference in the median biomarker values. P-
values <0.05 were deemed to be statistically significant.
Screening performances for PlGF raw data and MoM values and the sFlt1/PlGF ratio raw
data and MoM values were then evaluated using receiver operating characteristic (ROC)
curves to calculate the area under the curve (AUC). Coordinates of the ROC curves were
used to identify predictive values for PlGF for development of preterm FGR (<37weeks),
early onset FGR (<34weeks) and preterm preeclampsia and FGR (<37weeks). Selected
cut-off values were chosen for each immunoassay platform, with biomarker values with
the highest sensitivity and specificity chosen as optimal cut-off points for a positive test.
True positive and true negative results were assessed using 2 x 2 contingency tables,
followed by diagnostic test evaluation using an online calculator (MedCalc®). Sensitivity,
specificity, positive predictive value (PPV) and negative predictive value (NPV) were then
determined for PlGF levels performed on each immunoassay platform for the prediction
of preeclampsia.
5.3 Results
5.3.1 Descriptive Statistics
There were 64 (12.5%) pregnancies who developed SGA. From these 64, 48 (9.4% of
total cohort) delivered at term, 16 (3.1%) delivered preterm and 4 (0.8%) delivered prior
to 34 weeks. Of the 16 pregnancies with preterm SGA, 13 (81.3%) were classified as FGR
based on having birthweight less than 3rd centile, while 100% of the 4 pregnancies with
early onset SGA were classified as FGR based on having birthweight less than 3rd centile.
5 of the 8 cases with preterm preeclampsia (62.5%) had coexisting preterm FGR, based
on each having a birthweight less than the 3rd centile, and all three pregnancies with
early onset preeclampsia (100%) had coexisting FGR. In contrast, no pregnancies with
term preeclampsia developed either SGA or FGR (see Figure 39).

182
The characteristics of the study population are summarised in Table 26.
Pregnancies that delivered an SGA fetus in the absence of preeclampsia (n=64) had a
significantly lower maternal weight and BMI, and their babies had significantly lower
birthweights when compared with unaffected pregnancies. Pregnancies with FGR
requiring delivery prior to 37 weeks had a significantly lower gestational age at delivery
(36.3 weeks compared with 39.2 for unaffected pregnancies) lower birthweight, were
more likely to be white or South Asian, and were significantly more likely to have a
history of chronic hypertension than women with unaffected pregnancies. They were
also more likely to be smokers, be nulliparous or parous with a history of preeclampsia
than unaffected pregnancies. Pregnancies with FGR requiring delivery prior to 34 weeks
(n=4) similarly had a lower gestation at delivery (30.4 weeks compared with 39.2 weeks
for unaffected pregnancies), lower birthweight, and were more likely to have chronic
hypertension or Type 1 diabetes than unaffected pregnancies. Pregnancies with
preeclampsia and FGR requiring preterm or early delivery had significantly higher BMI,
and significantly lower gestation and birthweight at delivery compared with unaffected
pregnancies. They also were more likely to have chronic hypertension or Type 1
diabetes.
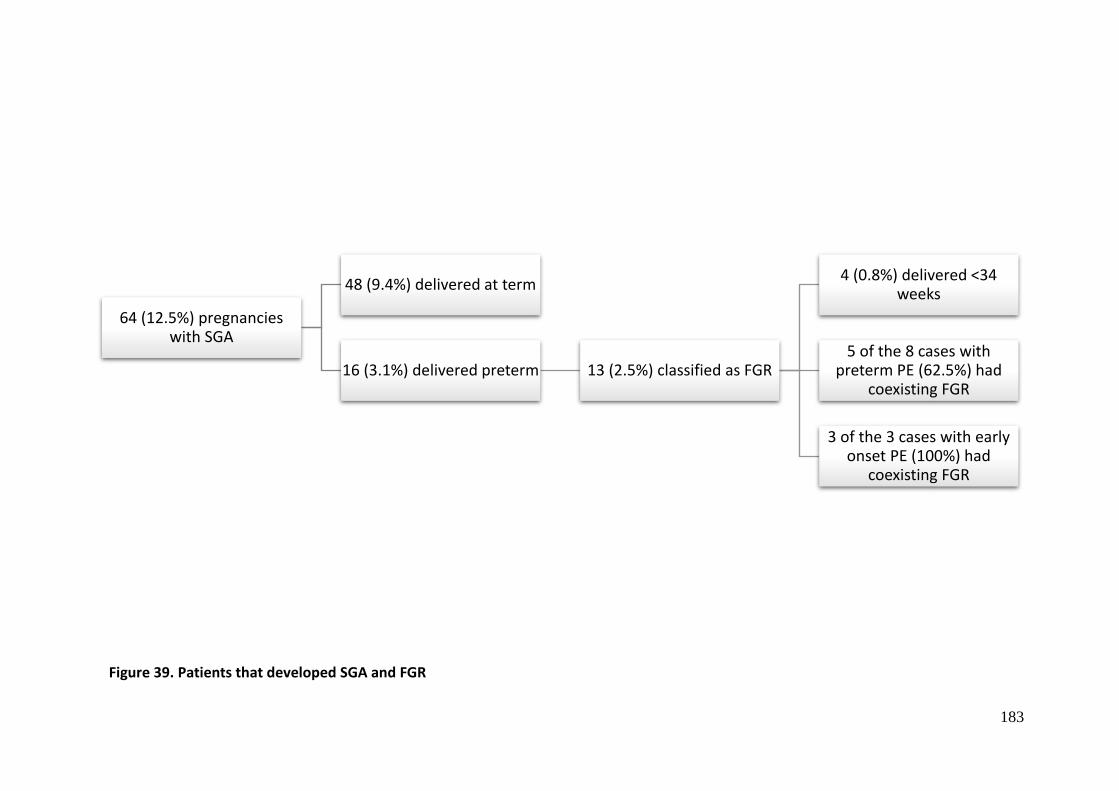
183
64 (12.5%) pregnancies with SGA
48 (9.4%) delivered at term
16 (3.1%) delivered preterm 13 (2.5%) classified as FGR
4 (0.8%) delivered <34 weeks
5 of the 8 cases with preterm PE (62.5%) had
coexisting FGR
3 of the 3 cases with early onset PE (100%) had
coexisting FGR
Figure 39. Patients that developed SGA and FGR

184
PE = preeclampsia; GA = gestational age; BMI = body mass index; GDM = gestational diabetes; SLE = systemic lupus erythematosus; APS = antiphospholipid syndrome. SGA = small for gestational age; FGR = fetal growth restriction Values reported in median (interquartile range) unless otherwise stated. * p<0.05 when compared to the unaffected group Table 26. Characteristics of the study population for midpregnancy prediction of FGR or preeclampsia and FGR.
Maternal Characteristic
s
Unaffected (n=428)
SGA any gestation
(n=64)
FGR <37weeks
(n=13)
FGR <34weeks
(n=4)
PE and FGR <37weeks
(n=5)
PE and FGR <34weeks
(n=3)
Maternal age (years)
35.2 (31.2-38.2)
34.2 (30.6-37.9)
32.9 (31.6-38.1)
36.9 (33.3-39.0)
35.7 (31.9-36.0)
35.7 (33.3-36.9)
Maternal weight (kg)
69.0 (62.0-78.5)
65.5 (56.5-72.0) *
69.0 (56.0-87.7)
84.5 (72.5-97.0)
95.0 (72.0-96.0) *
96.0 (84.0-97.0)
Maternal height (cm)
164.5 (160.0-169.0)
161.3 (156.0-167.3) *
162.0 (156.0-166.0)
167.3 (160.0-174.3)
164.0 (157.5-168.0)
164.0 (160.0-167.3)
BMI 25.3 (23.0-
169.0) 24.5 (22.5-
26.8) * 26.0 (20.9-
33.7) 30.3 (24.9-
36.6) 33.7 (27.8-
33.7) * 33.7 (30.3-
36.6) *
GA (weeks) 20.3 (20.0-
20.9) 20.4 (20.1-
21.3) 20.9 (20.1-
21.3) 20.4 (20.1-
21.0) 20.7 (20.3-
21.3) 20.7 (20.4-
21.0)
GA at delivery 39.2 (38.0-
40.3) 38.9 (36.9-
40.4) 36.3 (32.0-
36.6) * 30.4 (29.2-
31.3) * 32.0 (30.1-
36.4) * 30.1 (29.2-
31.1) * Racial origin
White 325 (75.9) 43 (67.2) 6 (46.2) * 3 (75.0) 2 (40.0) 2 (66.6) Black 16.0 (3.7) 2 (3.1) 1 (7.8) 0.0 1 (20.0) * 0.0
South Asian 32.0 (7.5) 9 (14.1) 3 (23.0) * 0.0 1 (20.0) 0.0 East Asian 35.0 (8.2) 7 (10.8) 3 (23.0) 1 (25.0) 1 (20.0) 1 (33.3)
Mixed 20.0 (4.7) 3 (4.7) 0.0 0.0 0.0 0.0 Medical History
Chronic hypertension
16.0 (3.7) 3.0 (4.7) 2.0 (15.4) * 1.0 (25.0) * 2.0 (40.0) * 1.0 (33.3) *
Diabetes Mellitus
Type 1 14.0 (3.3) 1.0 (1.6) 1.0 (7.7) 1.0 (25.0) * 1.0 (20.0) * 1.0 (33.3) * Type 2 8 (1.9) 0.0 0.0 0.0 0.0 0.0 GDM 21 (4.9) 2 (3.1) 1.0 (7.7) 0.0 1.0 (20.0) 0.0 SLE 2 (0.5) 0.0 0.0 0.0 0.0 0.0 APS 3 (0.7) 0.0 0.0 0.0 0.0 0.0
Cigarette smokers
25 (5.8) 8.0 (12.5) 1.0 (7.7) * 0.0 0.0 0.0
Family history of PE
28 (6.5) 5 (7.8) 1.0 (7.7) 0.0 0.0 0.0
Parity Nulliparous 177 (41.4) 30 (7.0) 2.0 (15.4) * 1.0 (25.0) 1.0 (20.0) 1 (33.3) Parous with no previous
PE 218 (50.1) 31 (48.4) 8.0 (61.5) 3 (75.0) 3.0 (60.0) 2.0 (66.6)
Parous with previous PE
33 (7.7) 3 (4.7) 3.0 (60) * 0.0 1.0 (20.0) 0.0
Infant Characteristic
s
Birthweight (g)
3342.0 (3026.0-3680.0)
2582.5 (2257.0-2820.0) *
1928.0 (1295.0-2088.0) *
1148.5 (1043.5-1244.0) *
1295.0 (1193.0 -2048.0) *
1193.0 (1088.0-1244.0) *

185
Angiogenic markers
Unaffected (n=428) SGA (n=64) P-
value
Preterm FGR (n=13)
P-value
Early onset FGR (n=4)
P-value
Preterm PE and FGR (n=5)
P-value
Early onset PE and FGR (n=3)
P-value
Delfia PlGF
Raw data
MoM
167.5 (126.6-234.6) 1.0 (0.9-1.2)
152.3 (97.5-213.8) 0.9 (0.8-1.1)
0.044
0.001 129.3 (74.7-158.3
0.8 (0.6-0.9)
0.018
0.001 81.9 (34.2-122.6)
0.7 (0.5-0.9)
0.010
0.023 75.1 (47.9-115.8)
0.7 (0.5-0.8)
0.005
0.002 47.9 (34.2-81.9)
0.5 (0.4-0.7)
0.010
0.020
Cobas PlGF
Raw data
MoM
249.0 (184.0-333.7) 1.0 (0.9-1.1)
215.7 (163.6-293.9) 0.9 (0.8-1.1)
0.101
0.002
191.1 (102.9-210.9) 0.8 (0.6-0.9)
0.015
0.000
116.4 (52.2-188.3) 0.8 (0.5-0.9)
0.012
0.027
144.5 (54.7-178.1) 0.8 (0.6-0.8)
0.004
0.003
54.7 (52.2-116.4) 0.6 (0.5-0.8)
0.012
0.023
Kryptor PlGF
Raw data
MoM
200.5 (153.9-276.0) 1.0 (0.9-1.1)
198.1 (146.0-271.0) 1.0 (0.9-1.1)
0.239
0.005
147.4 (104.0-203.0) 0.8 (0.7-0.9)
0.019
0.000
96.7 (47.4-146.0) 0.7 (0.5-0.9)
0.007
0.018
111.1 (48.8-144.7) 0.8 (0.6-0.8)
0.003
0.002
48.8 (47.4-96.7) 0.6 (0.5-0.7)
0.010
0.020
Cobas sFlt1/PlGF ratio
Raw data
MoM
5.8 (3.9-8.1) 1.0 (0.8-1.1)
6.0 (4.6-9.4) 1.0 (0.9-1.3)
0.153
0.043 7.3 (5.2-13.6) 1.3 (1.1-1.6)
0.038
0.001 13.8 (9.6-29.2)
1.5 (1.2-2.0)
0.017
0.020 13.6 (7.2-1.2) 1.4 (1.3-1.6)
0.023
0.008 14.0 (13.8-29.2)
1.6 (1.5-2.0)
0.005
0.006
Kryptor sFlt1/PlGF ratio
Raw data
MoM
6.5 (4.0-9.3) 1.0 (0.8-1.2)
6.5 (5.0-10.6) 1.0 (0.8-1.2)
0.142
0.107
8.0 (5.2-13.7) 1.3 (1.0-1.4)
0.088
0.022
13.2 (8.4-36.2) 1.4 (1.2-2.1)
0.033
0.026
10.6 (8.0-15.9) 1.4 (1.3-1.4)
0.051
0.018
15.9 (13.2-36.2) 1.4 (1.3-2.1)
0.012
0.011
PlGF and sFlt1 concentrations are in pg/mL. PE = preeclampsia. FGR = fetal growth restriction. SGA = small for gestational age. Early onset <34 weeks. Preterm <37 weeks. Values are recorded as median (interquartile range). PPV = positive predictive value. NPV = negative predictive value. Table 27. Comparison of PlGF and sFlt1/PlGF ratio raw data and MoM values between patients who developed SGA, FGR, preeclampsia and FGR and unaffected pregnancies.
Pregnancies that developed SGA and FGR
64 (12.5%) with SGA
13 (2.5%) preterm (<37 weeks) FGR
4 (0.8%) delivered <34 weeks
5/8 (62.5%) with preterm (<37 weeks) PE had FGR
3/3 (100%) with early onset (<34 weeks) PE had FGR
186
5.3.2 Comparison studies for PlGF and the sFlt1/PlGF ratio between patients who
developed SGA, FGR, preeclampsia and FGR and unaffected pregnancies
Pregnancies that developed SGA at any gestation (n=64) had significantly lower PlGF
levels across all platforms (p<0.05) except the Kryptor platform using raw data values
(Table 27). sFlt1/PlGF ratio values for this group were not significantly increased when
compared with unaffected pregnancies, except for the Cobas sFlt1/PlGF MoM values,
which just reached statistical significance (p=0.043). Patients who developed preterm
FGR in the absence of preeclampsia (n=13) and preterm PE and FGR (n=5) had
significantly lower PlGF levels and significantly increased sFlt1/PlGF ratio values across
all platforms (p<0.05), except for the Kryptor sFlt1/PlGF ratio raw data values, which
were not significantly different for either group (p=0.088 and p=0.051, respectively).
Patients who developed early onset FGR in the absence of preeclampsia (n=4) and early
onset preeclampsia and FGR (n=3) had significantly lower PlGF levels and significantly
increased sFlt1/PlGF ratio values across all platforms (p<0.05) (Table 27). sFlt1 raw data
and MoM values in pregnancies that developed SGA, FGR or preeclampsia and FGR,
when analysed on their own were not significantly different from values in unaffected
pregnancies (data not shown).
These findings are demonstrated in Figures 40 and 41, with significant progressive
lowering of PlGF levels for each platform as pathology increases from SGA to preterm
FGR and preterm preeclampsia and FGR (Figure 40). There is no appreciable difference
in sFlt1/PlGF ratio levels between patients with unaffected pregnancies and SGA at any
gestation, however with progressively increasing pathology, the sFlt1/PlGF ratio
increases significantly (Figure 41). Pregnancies which developed early onset FGR and
early onset preeclampsia and FGR were not displayed separately from the preterm
groups due to small numbers.

187
Figure 40. Comparison of PlGF raw data and MoM values between patients with SGA, preterm FGR and preterm preeclampsia and FGR and unaffected pregnancies.
Pregnancies that developed SGA and FGR
64 (12.5%) with SGA
13 (2.5%) preterm (<37 weeks) FGR
4 (0.8%) delivered <34 weeks
5/8 (62.5%) with preterm (<37 weeks) PE had FGR
3/3 (100%) with early onset (<34 weeks) PE had FGR

188
Figure 41. Comparison of sFlt1/PlGF ratio raw data and MoM values between patients with SGA, preterm FGR and preterm preeclampsia and FGR and unaffected pregnancies.
Pregnancies that developed SGA and FGR
64 (12.5%) with SGA
13 (2.5%) preterm (<37 weeks) FGR
4 (0.8%) delivered <34 weeks
5/8 (62.5%) with preterm (<37 weeks) PE had FGR
3/3 (100%) with early onset (<34 weeks) PE had FGR

189
When looking at results from each platform for PlGF (Table 27), pregnancies that
developed preterm FGR had median PlGF raw data values of 129.3, 191.1 and
147.4pg/mL, respectively, using the Delfia, Cobas and Kryptor platforms. Median PlGF
MoM values for these patients were 0.8 MoM for each platform. Patients who
developed early onset FGR had median PlGF raw data values of 81.97pg/mL,
116.47pg/mL and 96.7pg/mL, respectively, using the Delfia, Cobas and Kryptor
platforms. Median PlGF MoM values for these patients were 0.7, 0.8 and 0.7 MoM,
respectively. Patients who developed preterm preeclampsia and FGR had median PlGF
raw data values of 75.17pg/mL, 144.57pg/mL and 111.1pg/mL, respectively, using the
Delfia, Cobas and Kryptor platforms. Median PlGF MoM values for these patients were
0.7, 0.8 and 0.8 MoM for each platform, respectively. Finally, patients with early onset
preeclampsia and FGR had median PlGF raw data values of 47.97pg/mL, 54.77pg/mL and
48.8pg/mL, respectively, using the Delfia, Cobas and Kryptor platforms. Median PlGF
MoM values for these patients were significantly lower at 0.5, 0.6 and 0.6 MoM,
respectively for each platform.
When looking at results from each platform for sFlt1/PlGF ratio, pregnancies that
developed preterm FGR had median sFlt1/PlGF raw data values of 7.3 and 8.0 for the
Cobas and Kryptor platforms, and MoM values of 1.3 MoM for each platform. Patients
that developed early onset FGR had sFlt1/PlGF raw data values of 13.8 and 13.2 for the
Cobas and Kryptor platforms, and MoM values of 1.5 MoM and 1.4 MoM, respectively.
Patients that developed preterm preeclampsia and FGR had sFlt1/PlGF raw data values
of 13.6 and 10.6 for the Cobas and Kryptor platforms, and MoM values of 1.4 MoM for
each platform, respectively. Patients that developed early onset preeclampsia and FGR
had sFlt1/PlGF raw data values of 14.0 and 15.9 for the Cobas and Kryptor platforms,
and MoM values of 1.6 MoM and 1.4 MoM, respectively. Kryptor raw data values for
the sFlt1/PlGF ratio did not reach statistical significance for pregnancies that developed
preterm preeclampsia and preterm preeclampsia and FGR.
190
5.3.3 Performance of PlGF and the sFlt1/PlGF ratio for the prediction of FGR and both
preeclampsia and FGR
With the exception of using raw data values for the sFlt1/PlGF ratio tested on the
Kryptor platform, all biomarker values were significantly lowered in women who
developed placental pathology consisting of preterm or early onset FGR, and preterm or
early onset preeclampsia and FGR. The predictive properties of PlGF and the sFlt1/PlGF
ratio at midpregnancy using the different platforms were compared using ROC curve
analysis, similar to previous chapters.
5.3.3.1 PlGF, sFlt1 and sFlt1/PlGF ratio raw data and MoM for the prediction of FGR
and preeclampsia and FGR at term
For the prediction of FGR in the absence of preeclampsia and FGR coexisting with
preeclampsia at term, PlGF, sFlt1 and sFlt1/PlGF raw data all performed poorly, with
AUC for each platform between 0.50 and 0.60, indicating poor discriminatory power to
predict FGR or preeclampsia and FGR at term when tested at midpregnancy (ROC curves
not shown). Hence further analysis for prediction of these outcomes at term was not
performed.
5.3.3.2 PlGF and PlGF MoM for the prediction of preterm FGR and preterm
preeclampsia and FGR
When using PlGF raw data values for the prediction of preterm FGR, AUC values
obtained for the Delfia, Cobas and Kryptor platforms were 0.693, 0.698 and 0.690,
respectively. PlGF MoM values for the prediction of preterm FGR performed better at
0.781, 0.784 and 0.783 MoM, respectively (Figure 42). The AUC values obtained using
PlGF raw data values for the prediction of preterm preeclampsia and FGR performed
even better, at 0.862, 0.878 and 0.882, respectively, while PlGF MoM values gave the
best overall predictive performance, at 0.895, 0.885 and 0.898, respectively (Figure 43).
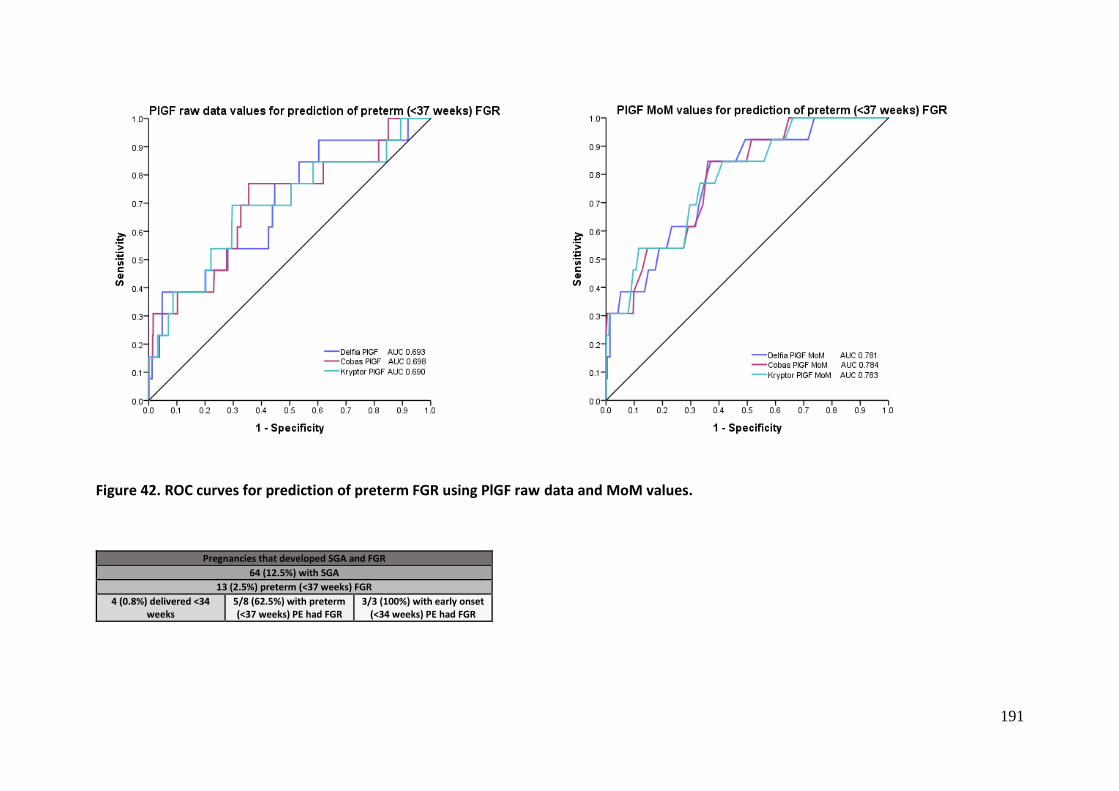
191
Figure 42. ROC curves for prediction of preterm FGR using PlGF raw data and MoM values.
Pregnancies that developed SGA and FGR
64 (12.5%) with SGA
13 (2.5%) preterm (<37 weeks) FGR
4 (0.8%) delivered <34 weeks
5/8 (62.5%) with preterm (<37 weeks) PE had FGR
3/3 (100%) with early onset (<34 weeks) PE had FGR
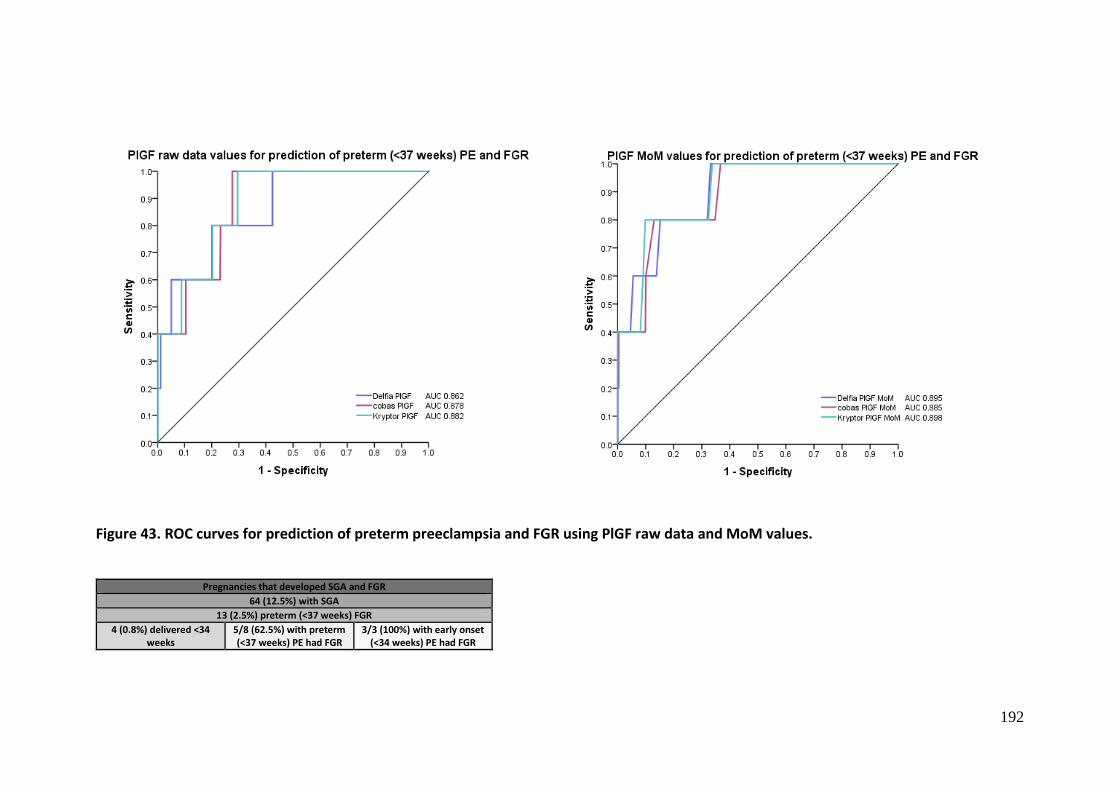
192
Figure 43. ROC curves for prediction of preterm preeclampsia and FGR using PlGF raw data and MoM values.
Pregnancies that developed SGA and FGR
64 (12.5%) with SGA
13 (2.5%) preterm (<37 weeks) FGR
4 (0.8%) delivered <34 weeks
5/8 (62.5%) with preterm (<37 weeks) PE had FGR
3/3 (100%) with early onset (<34 weeks) PE had FGR
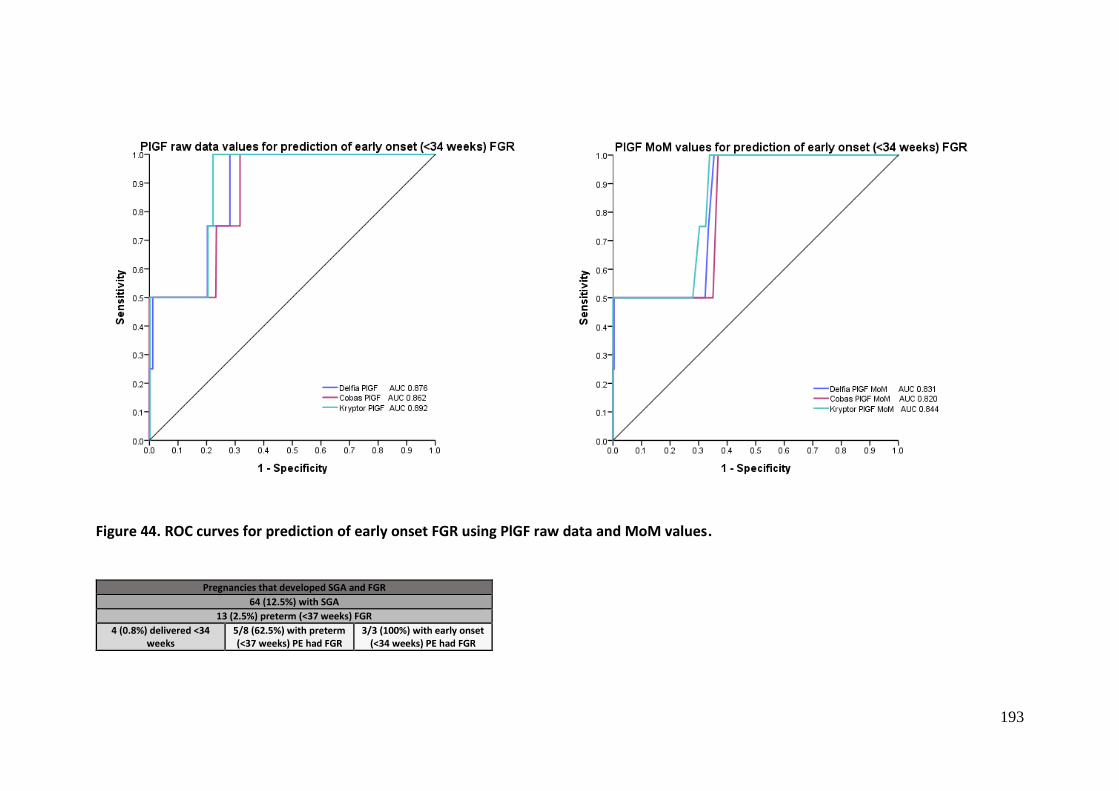
193
Figure 44. ROC curves for prediction of early onset FGR using PlGF raw data and MoM values.
Pregnancies that developed SGA and FGR
64 (12.5%) with SGA
13 (2.5%) preterm (<37 weeks) FGR
4 (0.8%) delivered <34 weeks
5/8 (62.5%) with preterm (<37 weeks) PE had FGR
3/3 (100%) with early onset (<34 weeks) PE had FGR

194
Figure 45. ROC curves for prediction of early onset preeclampsia and FGR using PlGF raw data and MoM values.
Pregnancies that developed SGA and FGR
64 (12.5%) with SGA
13 (2.5%) preterm (<37 weeks) FGR
4 (0.8%) delivered <34 weeks
5/8 (62.5%) with preterm (<37 weeks) PE had FGR
3/3 (100%) with early onset (<34 weeks) PE had FGR
195
5.3.3.3 PlGF and PlGF MoM for the prediction of early onset FGR and early onset
preeclampsia and FGR
When using PlGF raw data values for the prediction of early onset FGR, AUC values
obtained for the Delfia, Cobas and Kryptor platforms were 0.876, 0.862 and 0.892,
respectively. PlGF MoM gave values of AUC 0.831, 0.820 and 0.844, respectively (Figure
44). PlGF raw data values for the prediction of early onset preeclampsia and FGR, gave
AUC for the Delfia, Cobas and Kryptor platforms of 0.929, 0.922 and 0.931, respectively,
while PlGF MoM values gave values of 0.889, 0.880 and 0.889, respectively (Figure 45).
5.3.3.4. sFlt1 and sFlt1 MoM for the prediction of early onset, preterm and term FGR
and early onset, preterm and term preeclampsia and FGR
For the prediction of early onset and preterm FGR and the prediction of early onset,
preterm and term preeclampsia and FGR, sFlt1 raw data and MoM values at
midpregnancy yielded AUC values around 0.50, indicating poor discriminatory power to
predict FGR or preeclampsia and FGR when tested at midpregnancy (ROC curves not
shown). Hence further analysis for sFlt1 alone was not performed.
5.3.3.5 sFlt1/PlGF ratio and sFlt1/PlGF ratio MoM for the prediction of preterm FGR
and preterm preeclampsia and FGR
When using sFlt1/PlGF ratio raw data values for the prediction of preterm FGR, AUC
values obtained for the Cobas and Kryptor platforms were 0.669 and 0.638, respectively.
sFlt1/PlGF ratio MoM values for the prediction of preterm FGR gave AUC values 0.769
and 0.686, respectively (Figure 46). sFlt1/PlGF ratio raw data values for the prediction
of preterm preeclampsia and FGR for the Cobas and Kryptor platforms performed better
at 0.796 and 0.753, respectively, and sFlt1/PlGF ratio MoM values performed best, at
0.844 and 0.806, respectively (Figure 47).

196
Figure 46. ROC curves for prediction of preterm FGR using sFlt1/PlGF ratio raw data and MoM values.
Pregnancies that developed SGA and FGR
64 (12.5%) with SGA
13 (2.5%) preterm (<37 weeks) FGR
4 (0.8%) delivered <34 weeks
5/8 (62.5%) with preterm (<37 weeks) PE had FGR
3/3 (100%) with early onset (<34 weeks) PE had FGR

197
Figure 47. ROC curves for prediction of preterm preeclampsia and FGR using sFlt1/PlGF ratio raw data and MoM values.
Pregnancies that developed SGA and FGR
64 (12.5%) with SGA
13 (2.5%) preterm (<37 weeks) FGR
4 (0.8%) delivered <34 weeks
5/8 (62.5%) with preterm (<37 weeks) PE had FGR
3/3 (100%) with early onset (<34 weeks) PE had FGR

198
Figure 48. ROC curves for prediction of early onset FGR using sFlt1/PlGF ratio raw data and MoM values.
Pregnancies that developed SGA and FGR
64 (12.5%) with SGA
13 (2.5%) preterm (<37 weeks) FGR
4 (0.8%) delivered <34 weeks
5/8 (62.5%) with preterm (<37 weeks) PE had FGR
3/3 (100%) with early onset (<34 weeks) PE had FGR

199
Figure 49. ROC curves for prediction of early onset preeclampsia and FGR using sFlt1/PlGF ratio raw data and MoM values.
Pregnancies that developed SGA and FGR
64 (12.5%) with SGA
13 (2.5%) preterm (<37 weeks) FGR
4 (0.8%) delivered <34 weeks
5/8 (62.5%) with preterm (<37 weeks) PE had FGR
3/3 (100%) with early onset (<34 weeks) PE had FGR

200
5.3.3.6 sFlt1/PlGF ratio and sFlt1/PlGF ratio MoM for the prediction of early onset FGR
and early onset preeclampsia and FGR
For the prediction of early onset FGR, AUC values obtained for the Cobas and Kryptor
platforms were 0.845 and 0.810 respectively. sFlt1/PlGF ratio MoM values for the
prediction of early onset FGR gave AUC values of 0.839 and 0.824, respectively (Figure
48). When using sFlt1/PlGF ratio raw data values for the prediction of early onset
preeclampsia and FGR, values obtained for the Cobas and Kryptor platforms were 0.971
and 0.921, respectively. When using sFlt1/PlGF MoM values for the prediction of early
onset preeclampsia and FGR, AUC values were 0.959 and 0.925, respectively (Figure 49).
5.3.4 Sensitivity and specificity analysis for PlGF and sFlt1/PlGF ratio raw data and
MoM values
Sensitivity and specificity for the prediction of both FGR (Table 28 and 29) and
preeclampsia and FGR (Table 30 and 31) using PlGF and the sFlt1/PlGF ratio were
calculated for each immunoassay platform using selected cut-off values from the ROC
curves. It was not possible to isolate prediction of early onset preeclampsia from early
onset preeclampsia and FGR, as all 3 cases of early onset preeclampsia had coexisting
FGR. Hence the clinical characteristics obtained for the prediction of early onset
preeclampsia are equivalent to those for the prediction of preeclampsia and FGR,
presented in Chapters 3 and 4.
For prediction of early onset FGR using PlGF raw data values, the three immunoassay
platforms performed very similarly, with AUC 0.876, 0.862 and 0.892 for the Delfia,
Cobas and Kryptor platforms, respectively, and clinical characteristics as follows for each
platform: sensitivity 100, 100, 100; specificity 71.85, 68.31, 72.83; PPV 2.72, 2.42, 2.82
and NPV 100 for each. PlGF MoM values did not perform significantly better, with AUC
0.831, 0.820 and 0.844, with sensitivity 100 for each platform, specificity 64.57, 63.19
and 66.14, PPV 2.17, 2.09 and 2.27 and NPV 100 for each platform.
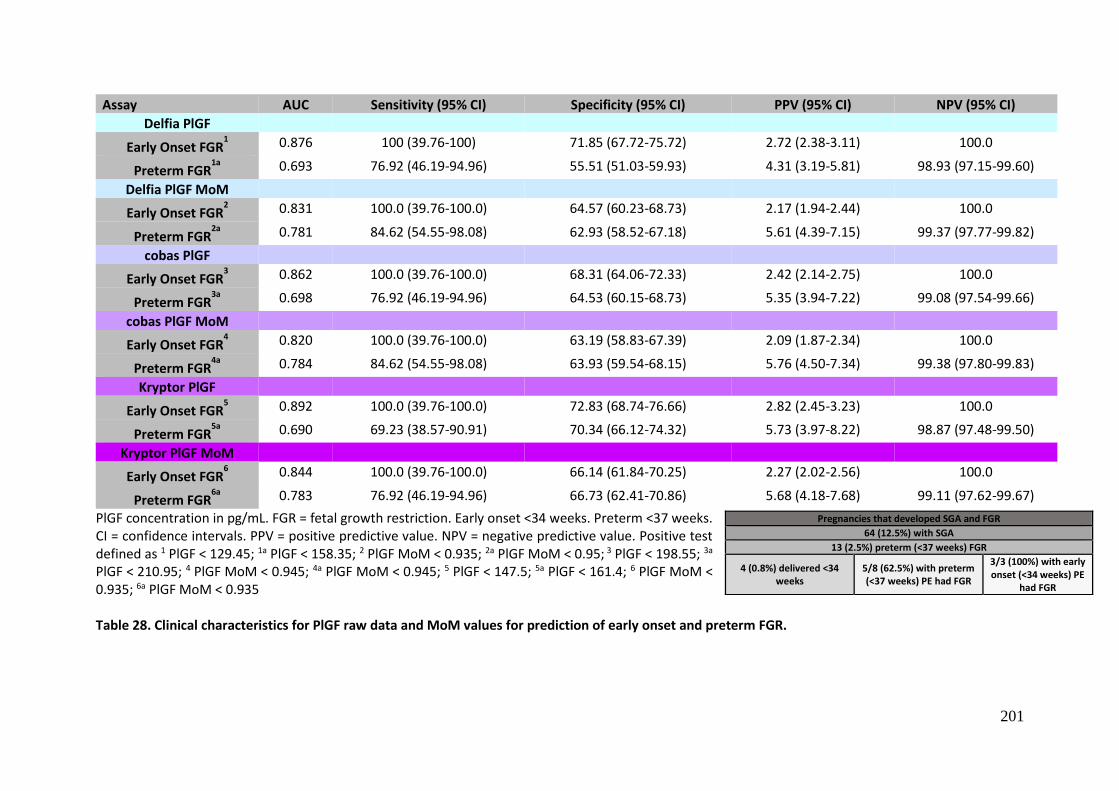
201
Assay AUC Sensitivity (95% CI) Specificity (95% CI) PPV (95% CI) NPV (95% CI)
Delfia PlGF
Early Onset FGR1 0.876 100 (39.76-100) 71.85 (67.72-75.72) 2.72 (2.38-3.11) 100.0
Preterm FGR1a
0.693 76.92 (46.19-94.96) 55.51 (51.03-59.93) 4.31 (3.19-5.81) 98.93 (97.15-99.60)
Delfia PlGF MoM
Early Onset FGR2 0.831 100.0 (39.76-100.0) 64.57 (60.23-68.73) 2.17 (1.94-2.44) 100.0
Preterm FGR2a
0.781 84.62 (54.55-98.08) 62.93 (58.52-67.18) 5.61 (4.39-7.15) 99.37 (97.77-99.82)
cobas PlGF
Early Onset FGR3 0.862 100.0 (39.76-100.0) 68.31 (64.06-72.33) 2.42 (2.14-2.75) 100.0
Preterm FGR3a
0.698 76.92 (46.19-94.96) 64.53 (60.15-68.73) 5.35 (3.94-7.22) 99.08 (97.54-99.66)
cobas PlGF MoM
Early Onset FGR4 0.820 100.0 (39.76-100.0) 63.19 (58.83-67.39) 2.09 (1.87-2.34) 100.0
Preterm FGR4a
0.784 84.62 (54.55-98.08) 63.93 (59.54-68.15) 5.76 (4.50-7.34) 99.38 (97.80-99.83)
Kryptor PlGF
Early Onset FGR5 0.892 100.0 (39.76-100.0) 72.83 (68.74-76.66) 2.82 (2.45-3.23) 100.0
Preterm FGR5a
0.690 69.23 (38.57-90.91) 70.34 (66.12-74.32) 5.73 (3.97-8.22) 98.87 (97.48-99.50)
Kryptor PlGF MoM
Early Onset FGR6 0.844 100.0 (39.76-100.0) 66.14 (61.84-70.25) 2.27 (2.02-2.56) 100.0
Preterm FGR6a
0.783 76.92 (46.19-94.96) 66.73 (62.41-70.86) 5.68 (4.18-7.68) 99.11 (97.62-99.67)
PlGF concentration in pg/mL. FGR = fetal growth restriction. Early onset <34 weeks. Preterm <37 weeks. CI = confidence intervals. PPV = positive predictive value. NPV = negative predictive value. Positive test defined as 1 PlGF < 129.45; 1a PlGF < 158.35; 2 PlGF MoM < 0.935; 2a PlGF MoM < 0.95; 3 PlGF < 198.55; 3a PlGF < 210.95; 4 PlGF MoM < 0.945; 4a PlGF MoM < 0.945; 5 PlGF < 147.5; 5a PlGF < 161.4; 6 PlGF MoM < 0.935; 6a PlGF MoM < 0.935 Table 28. Clinical characteristics for PlGF raw data and MoM values for prediction of early onset and preterm FGR.
Pregnancies that developed SGA and FGR
64 (12.5%) with SGA
13 (2.5%) preterm (<37 weeks) FGR
4 (0.8%) delivered <34 weeks
5/8 (62.5%) with preterm (<37 weeks) PE had FGR
3/3 (100%) with early onset (<34 weeks) PE
had FGR

202
Assay AUC Sensitivity (95% CI) Specificity (95% CI) PPV (95% CI) NPV (95% CI)
Cobas sFlt1/PlGF ratio
Early Onset FGR1 0.845 75.00 (19.41-99.37) 95.47 (93.28-97.11) 11.54 (6.13-20.68) 99.79 (98.89-99.96)
Preterm FGR1a
0.669 53.85 (25.13-80.78) 65.53 (61.18-69.70) 3.91 (2.37-6.39) 98.20 (96.79-98.99)
Cobas sFlt1/PlGF MoM
Early Onset FGR2 0.839 75.00 (19.41-99.37) 90.16 (87.23-92.61) 5.66 (3.11-10.07) 99.78 (98.82-99.96)
Preterm FGR2a
0.769 76.92 (46.19-94.96) 61.32 (56.89-65.62) 4.93 (3.63-6.65) 99.03 (97.42-99.64)
Kryptor sFlt1/PlGF ratio
Early Onset FGR3 0.810 75.00 (19.41-99.37) 81.89 (78.26-85.14) 3.16 (1.77-5.58) 99.76 (98.70-99.96)
Preterm FGR3a
0.638 53.85 (25.13-80.78) 66.13 (61.79-70.28) 3.98 (2.41-6.50) 98.21 (96.82-99.00)
Kryptor sFlt1/PlGF MoM
Early Onset FGR4 0.824 75.00 (19.41-99.37) 87.01 (83.77-89.81) 4.35 (2.41-7.71) 99.77 (98.78-99.96)
Preterm FGR4a
0.686 76.92 (46.19-94.96) 49.10 (44.63-53.58) 3.79 (2.81-5.09) 98.79 (96.79-99.55)
PlGF and sFlt1 concentrations are in pg/mL. FGR = fetal growth restriction. Early onset <34 weeks. Preterm <37 weeks. CI = confidence intervals. PPV = positive predictive value. NPV = negative predictive value. Positive test defined as 1 sFlt1/PlGF ratio >13.58764 1a sFlt1/PlGF ratio >7.20329; 2 sFlt1/PlGF ratio MoM > 1.35053; 2a sFlt1/PlGF ratio MoM >1.06453; 3 sFlt1/PlGF ratio >10.57995; 3a sFlt1/PlGF ratio >7.98438; 4 sFlt1/PlGF ratio MoM >1.35215; 4a sFlt1/PlGF ratio MoM >0.98058
Table 29. Clinical characteristics for sFlt1/PlGF ratio raw data and MoM values for prediction of early onset and preterm FGR.
Pregnancies that developed SGA and FGR
64 (12.5%) with SGA
13 (2.5%) preterm (<37 weeks) FGR
4 (0.8%) delivered <34 weeks
5/8 (62.5%) with preterm (<37 weeks) PE had FGR
3/3 (100%) with early onset (<34 weeks) PE had FGR
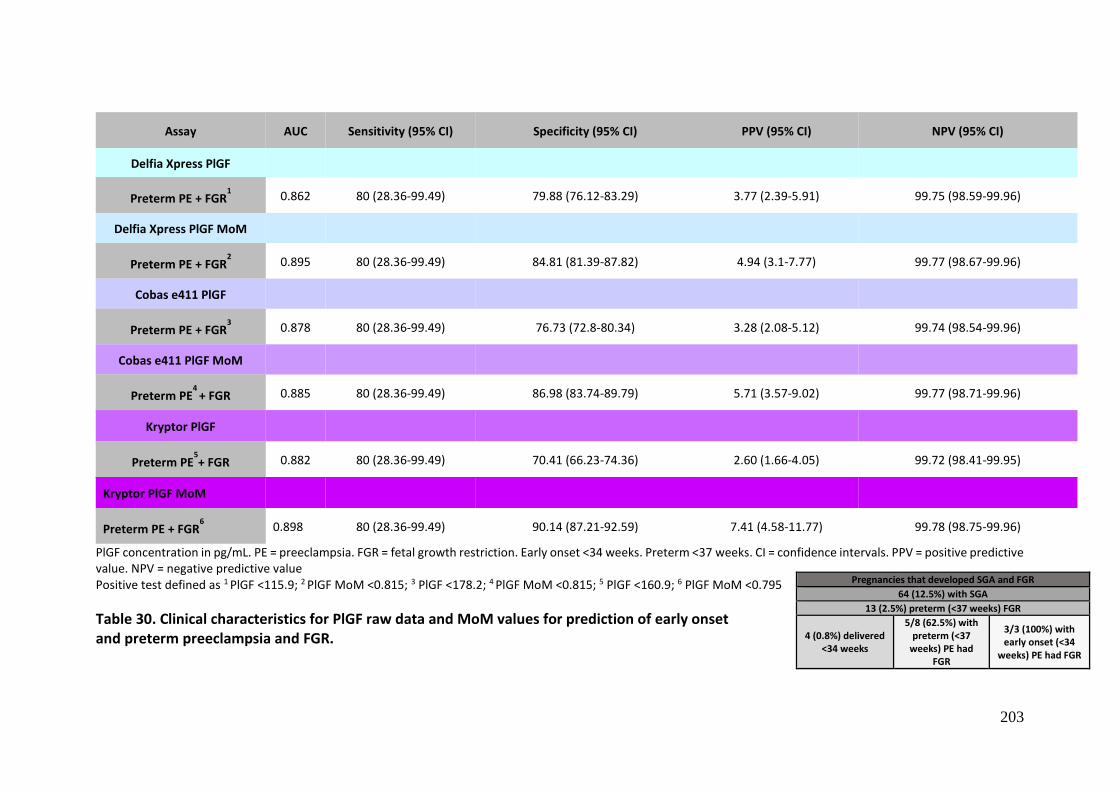
203
Assay AUC Sensitivity (95% CI) Specificity (95% CI) PPV (95% CI) NPV (95% CI)
Delfia Xpress PlGF
Preterm PE + FGR1 0.862 80 (28.36-99.49) 79.88 (76.12-83.29) 3.77 (2.39-5.91) 99.75 (98.59-99.96)
Delfia Xpress PlGF MoM
Preterm PE + FGR2 0.895 80 (28.36-99.49) 84.81 (81.39-87.82) 4.94 (3.1-7.77) 99.77 (98.67-99.96)
Cobas e411 PlGF
Preterm PE + FGR3 0.878 80 (28.36-99.49) 76.73 (72.8-80.34) 3.28 (2.08-5.12) 99.74 (98.54-99.96)
Cobas e411 PlGF MoM
Preterm PE4
+ FGR 0.885 80 (28.36-99.49) 86.98 (83.74-89.79) 5.71 (3.57-9.02) 99.77 (98.71-99.96)
Kryptor PlGF
Preterm PE5+ FGR 0.882 80 (28.36-99.49) 70.41 (66.23-74.36) 2.60 (1.66-4.05) 99.72 (98.41-99.95)
Kryptor PlGF MoM
Preterm PE + FGR6 0.898 80 (28.36-99.49) 90.14 (87.21-92.59) 7.41 (4.58-11.77) 99.78 (98.75-99.96)
PlGF concentration in pg/mL. PE = preeclampsia. FGR = fetal growth restriction. Early onset <34 weeks. Preterm <37 weeks. CI = confidence intervals. PPV = positive predictive value. NPV = negative predictive value Positive test defined as 1 PlGF <115.9; 2 PlGF MoM <0.815; 3 PlGF <178.2; 4 PlGF MoM <0.815; 5 PlGF <160.9; 6 PlGF MoM <0.795
Table 30. Clinical characteristics for PlGF raw data and MoM values for prediction of early onset and preterm preeclampsia and FGR.
Pregnancies that developed SGA and FGR
64 (12.5%) with SGA
13 (2.5%) preterm (<37 weeks) FGR
4 (0.8%) delivered <34 weeks
5/8 (62.5%) with preterm (<37
weeks) PE had FGR
3/3 (100%) with early onset (<34
weeks) PE had FGR

204
Assay AUC Sensitivity (95% CI) Specificity (95% CI) PPV (95% CI) NPV (95% CI)
Cobas e411 sFlt1/PlGF ratio
Preterm PE + FGR1 0.796 80 (28.36-99.49) 65.48 (61.17-69.62) 2.23 (1.43-3.48) 99.7 (98.29-99.95)
Cobas e411 sFlt1/PlGF ratio MoM
Preterm PE + FGR2 0.844 80 (28.36-99.49) 89.35 (86.33-91.9) 6.9 (4.28-10.94) 99.78 (98.74-99.96)
Kryptor sFlt1/PlGF ratio
Preterm PE + FGR3 0.753 80 (28.36-99.49) 66.07 (61.77-70.19) 2.27 (1.45-3.54) 99.7 (98.3-99.95)
Kryptor sFLt1/PlGF ratio MoM
Preterm PE + FGR4 0.806 80 (28.36-99.49) 86.98 (83.74-89.79) 5.71 (3.57-9.02) 99.77 (98.71-99.96)
PlGF and sFlt1 concentrations are in pg/mL. PPV = positive predictive value. NPV = negative predictive value. PE = preeclampsia. FGR = fetal growth restriction. Early onset <34 weeks. Preterm <37 weeks. CI = confidence intervals. Positive test defined as 1sFlt1/PlGF ratio >7.2; 2 sFlt1/PlGF ratio MoM >1.345; 3 sFlt1/PlGF ratio >7.97; 4 sFlt1/PlGF MoM >1.35; PlGF concentration in pg/mL. PE = preeclampsia. Early onset <34 weeks. Preterm <37 weeks. CI = confidence intervals.
Table 31. Clinical characteristics for sFlt1/PlGF ratio raw data and MoM values for prediction of early onset and preterm preeclampsia and FGR
Pregnancies that developed SGA and FGR
64 (12.5%) with SGA
13 (2.5%) preterm (<37 weeks) FGR
4 (0.8%) delivered <34 weeks
5/8 (62.5%) with preterm (<37 weeks) PE had FGR
3/3 (100%) with early onset (<34 weeks) PE had FGR

205
For prediction of preterm FGR using PlGF raw data values, again the performance for
the Delfia, Cobas and Kryptor platforms were similar, with AUC 0.693, 0.698 and 0.690
respectively, sensitivity 76.92, 76.92 and 69.23; specificity 55.51, 64.53 and 70.34; PPV
4.31, 5.35 and 5.73 and NPV 98.93, 99.08 and 98.87, respectively. PlGF MoM values
performed slightly better, with AUC 0.781, 0.784 and 0.783, sensitivity 84.62, 84.62 and
76.92, PPV 5.61, 5.76 and 5.68 and NPV 99.37, 99.38 and 99.11, respectively.
As already presented in chapter 3, when testing PlGF in isolation for prediction of early
onset preeclampsia and FGR, PlGF raw data values performed best, with AUC 0.93, 0.92
and 0.93 for the Delfia, Cobas and Kryptor platforms, with sensitivity 100 for each
platform, specificity 80.75, 77.80 and 80.55, PPV 2.97, 2.59 and 2.94 and NPV 100 for
each platform. PlGF MoM values did not perform quite as well, with AUC 0.89, 0.88 and
0.89, sensitivity 100 for each platform, specificity 68.17, 64.64 and 67.78, PPV 1.82, 1.64
and 1.80 and NPV 100 for each platform.
For prediction of preterm preeclampsia and FGR using PlGF raw data values, the Delfia
and Cobas platforms performed slightly better than the Kryptor, with AUC 0.862, 0.878
and 0.882, sensitivity 80 for each platform, PPV 3.77, 3.28 and 2.60 and NPV 99.74, 99.74
and 99.72 respectively. PlGF MoM values performed slightly better, with AUC 0.895,
0.885 and 0.898, sensitivity 80 for each platform, specificity 84.81, 86.98 and 90.14, PPV
4.94, 5.71 and 7.41, and NPV 99.77, 99.77 and 99.78, respectively. When compared with
prediction of preterm preeclampsia at midpregnancy using PlGF MoM, discussed in
Chapter 3, which gave AUC 0.77, 0.79 and 0.77 for the Delfia, Cobas and Kryptor
platforms, respectively, these AUC’s appeared to perform better.
For prediction of early onset preeclampsia and FGR using the sFlt1/PlGF ratio, the results
were equivalent to those presented in Chapter 3 for the prediction of early onset
preeclampsia, given that all 3 cases with early onset preeclampsia also had FGR. The
sFlt1/PlGF ratio raw data values using the Cobas platform performed best (see Chapter
3) for the prediction of early onset preeclampsia and FGR at the midpregnancy. Clinical
characteristics for the Cobas and Kryptor platforms were as follows: AUC 0.97 and 0.92;
sensitivity 100 for both platforms, specificity 95.87 and 83.10, PPV 12.5 and 3.37 and

206
NPV 100 for both platforms. The sFlt1/PlGF ratio MoM values for prediction of early
onset preeclampsia and FGR gave AUC 0.96 and 0.93, sensitivity 100 for both platforms,
specificity 90.57 and 87.82, PPV 5.88 and 4.62 and NPV 100 for both platforms.
For prediction of preterm preeclampsia and FGR using sFlt1/PlGF raw data values, the
Cobas and Kryptor platforms performed very similarly, with AUC 0.796 and 0.753 for
Cobas and Kryptor, respectively, sensitivities 80 for each platform, specificities 65.48
and 66.07, PPV 2.23 and 2.27 and NPV 99.7 for each platform. sFlt1/PlGF ratio
performed significantly better for the prediction of preeclampsia and FGR, with AUC
0.844 and 0.806 for the Cobas and Kryptor platforms, respectively, sensitivities 80 for
each platform, specificity 89.35 and 86.98, PPV 6.9 and 5.71 and NPV 99.78 and 99.77,
respectively.
5.4 Discussion
The results obtained, represented in Table 27 and Figures 40 and 41, demonstrate a
progressive decrease in PlGF levels and increase in sFlt1/PlGF ratio as pathology
progresses from SGA at any gestation to preterm FGR, early onset FGR, preterm
preeclampsia and FGR and early onset preeclampsia and FGR. This supports the theory
that FGR and preeclampsia both exist on the spectrum of placental dysfunction, capable
of causing abnormalities in placental angiogenic factors, such as PlGF and sFlt1, with the
extent of derangement likely proportional to the degree of placental dysfunction.
5.4.1 PlGF and sFlt1/PlGF ratio as a predictive test for preterm and early onset FGR
when tested at midpregnancy.
PlGF when tested at midpregnancy for the prediction of FGR, demonstrates good clinical
validity for this purpose (see Table 28). Using the cut-off for early onset FGR gave
sensitivities and NPV’s of 100% across all platforms, while use of the cut-off for preterm
FGR gave sensitivities 69-85%, with NPV’s above 99%. Addition of sFlt1 as the sFlt1/PlGF
ratio (Table 29) reduced sensitivity quite significantly, but improved specificity and PPV
significantly using the early FGR cut-off in particular. Using the

207
Using PlGF cut-off for early onset FGR
Using PlGF cut-off for preterm FGR
Using sFlt1/PlGF ratio cut-off for early onset FGR
Using sFlt1/PlGF ratio cut-off for preterm onset FGR
Delfia PlGF FP 143 TP 4 FN 0 TN 365
Delfia PlGF FP 223 TP 10 FN 3 TN 276
Cobas sFlt1/PlGF ratio FP 23 TP 3 FN 1 TN 485
Cobas sFlt1/PlGF ratio FP 172 TP 7 FN 6 TN 327
Delfia PlGF MoM FP 180 TP 4 FN 0 TN 316
Delfia PlGF MoM FP 185 TP 11 FN 2 TN 314
Cobas sFlt1/PlGF ratio MoM FP 50 TP 3 FN 1 TN 458
Cobas sFlt1/PlGF ratio MoM FP 193 TP 10 FN 3 TN 306
Cobas PlGF FP 161 TP 4 FN 0 TN 347
Cobas PlGF FP 177 TP 10 FN 3 TN 322
Kryptor sFlt1/PlGF ratio FP 92 TP 3 FN 1 TN 416
Kryptor sFlt1/PlGF ratio FP 169 TP 7 FN 6 TN 330
Cobas PlGF MoM FP 187 TP 4 FN 0 TN 328
Cobas PlGF MoM FP 180 TP 11 FN 2 TN 319
Kryptor sFlt1/PlGF ratio MoM FP 66 TP 3 FN 1 TN 442
Kryptor sFlt1/PlGF ratio MoM FP 254 TP 10 FN 3 TN 245
Kryptor PlGF FP 113 TP 4 FN 0 TN 395
Kryptor PlGF FP 148 TP 9 FN 4 TN 351
Kryptor PlGF MoM FP 172 TP 4 FN 0 TN 336
Kryptor PlGF MoM FP 166 TP 10 FN 3 TN 333
FGR = fetal growth restriction, FP = false positive, TP = true positive, FN = false negative, TN = true negative Table 32. Clinical characteristic summary table for preterm and early onset FGR.
Pregnancies that developed SGA and FGR
64 (12.5%) with SGA
13 (2.5%) preterm (<37 weeks) FGR
4 (0.8%) delivered <34 weeks
5/8 (62.5%) with preterm (<37
weeks) PE had FGR
3/3 (100%) with early onset (<34
weeks) PE had FGR

208
sFlt1/PlGF ratio and the cut-off for early onset FGR gave sensitivities of 75%, specificities
87-95% and NPV greater than 99% across all platforms, while use of the cut-off for
preterm FGR gave sensitivities 53-77% specificities 49-66% and NPV above 98% (Table
29).
When assessing the predictive performance of PlGF using the cut-off for early onset FGR,
conversion of raw data values to MoM did not improve predictive performance
significantly (Table 28). Raw data values performed best, and results were equivalent
across the three platforms.
False positive rates were quite high for both PlGF raw data and MoM values across all
three platforms (Table 32). Due to the 100% sensitivity, there were no false negatives
within this group. The addition of sFlt1 resulted in lower sensitivity with an increase in
false negatives (one for each platform using both raw data and MoM values), but
increased specificity for both platforms, with far fewer false positives. Until the clinical
utility of PlGF testing for the prediction of FGR is more accurately defined, it would
appear safest to have more false positives than to potentially miss a case, hence at this
stage the addition of sFlt1 is not recommended based on these results.
When assessing the predictive performance of PlGF using the cut-off for preterm FGR,
MoM values performed better than raw data values for PlGF, with similar performance
between the three platforms. The addition of sFlt1 did not improve predictive
performance, and resulted in reduced sensitivity, with a resultant increase in false
negatives, particularly for the Cobas platform, where false negatives doubled in number
with addition of sFlt1 (Table 32).
When comparing the performance of the PlGF cut-off for early onset and preterm FGR,
the most striking difference is that the sensitivity is 100% for the early onset cut-off,
resulting in no false negative results. Having said this, the cut-off for preterm FGR still
gave a very good sensitivity (77-85%) and detected a greater proportion of patients who
went on to develop both early onset and preterm FGR, without having significantly more
false positives than the early onset FGR cut-off (see Table 28). PlGF using the cut-off for

209
preterm FGR, using both raw data and MoM values, successfully detected all 4 cases of
early onset FGR. It would appear safer to be more inclusive and favour the use of the
preterm PE cut-off and PlGF MoM values. The performance of this test was very similar
between platforms. The addition of sFlt1, while it did improve the predictive
performance using the Cobas sFlt1/PlGF ratio and the early onset FGR cut-off, did not
significantly improve performance for the preterm FGR cut-off. The addition of sFlt1
increased false negatives and did not favourably alter false positive rates when
compared with the use of PlGF in isolation. Hence, overall, PlGF MoM values using the
preterm FGR cut-off appeared to perform the best for the prediction of FGR at
midpregnancy. Based on the increased false negatives with the addition of sFlt1 across
all testing, the addition of sFlt1 as the sFlt1/PlGF ratio is not beneficial for the prediction
of preterm or early onset FGR.
5.4.2 PlGF and sFlt1/PlGF ratio as a predictive test for preterm and early onset
preeclampsia and FGR when tested at midpregnancy.
PlGF when tested at midpregnancy for the prediction of preeclampsia and FGR,
demonstrated high sensitivity and NPV, with improved clinical validity when compared
with the prediction of FGR alone. Using the cut-off for early onset preeclampsia and FGR
gave sensitivities 100%, specificities 64-80% and NPV 100% across all platforms (Table
16 in Chapter 3), while using the preterm preeclampsia and FGR cut-off gave sensitivities
80%, specificities 70-90% and NPV greater than 99% across all platforms (Table 30).
When assessing the predictive performance of PlGF using the cut-off for early onset
preeclampsia and FGR, raw data values performed better than MoM values, with greater
AUC, specificity and NPV. Addition of sFlt1 in the sFlt1/PlGF ratio did improve predictive
performance significantly, particularly for the Cobas platform using raw data values,
where the addition of sFlt1 improved raw data AUC to 0.97, increasing sensitivity and
PPV to 95.87 and 12.5, respectively. This improvement significantly reduced false
positive rates from 103/512 (20%) using PlGF in isolation to 23/512 (4.49%), which was
the lowest number of false positives among any of the tests (Table 17 in Chapter 3). With
addition of sFlt1, Cobas MoM values and Kryptor raw data and MoM values also showed
significant reductions in false positive results.

210
PE = preeclampsia, FGR = fetal growth restriction, FP = false positive, TP = true positive, FN = false negative, TN = true negative Table 33. Clinical characteristic summary table for preterm and early onset preeclampsia and FGR.
Using PlGF cut-off for early onset PE + FGR
Using PlGF cut-off for preterm PE + FGR
Using sFlt1/PlGF ratio cut-off for early onset PE + FGR
Using sFlt1/PlGF ratio cut-off for preterm onset PE + FGR
Delfia PlGF FP 103 TP 3 FN 0 TN 406
Delfia PlGF FP 102 TP 4 FN 1 TN 405
Cobas sFlt1/PlGF ratio FP 23 TP 3 FN 0 TN 486
Cobas sFlt1/PlGF ratio FP 175 TP 4 FN 1 TN 332
Delfia PlGF MoM FP 170 TP 3 FN 0 TN 339
Delfia PlGF MoM FP 77 TP 4 FN 1 TN 430
Cobas sFlt1/PlGF ratio MoM FP 50 TP 3 FN 0 TN 459
Cobas sFlt1/PlGF ratio MoM FP 54 TP 4 FN 1 TN 453
Cobas PlGF FP 119 TP 3 FN 0 TN 390
Cobas PlGF FP 118 TP 4 FN 1 TN 389
Kryptor sFlt1/PlGF ratio FP 92 TP 3 FN 0 TN 417
Kryptor sFlt1/PlGF ratio FP 172 TP 4 FN 1 TN 335
Cobas PlGF MoM FP 188 TP 3 FN 0 TN 321
Cobas PlGF MoM FP 66 TP 4 FN 1 TN 441
Kryptor sFlt1/PlGF ratio MoM FP 66 TP 3 FN 0 TN 443
Kryptor sFlt1/PlGF ratio MoM FP 66 TP 4 FN 1 TN 441
Kryptor PlGF FP 104 TP 3 FN 0 TN 405
Kryptor PlGF FP 150 TP 4 FN 1 TN 357
Kryptor PlGF MoM FP 173 TP 3 FN 0 TN 336
Kryptor PlGF MoM FP 50 TP 4 FN 1 TN 457
Pregnancies that developed SGA and FGR
64 (12.5%) with SGA
13 (2.5%) preterm (<37 weeks) FGR
4 (0.8%) delivered <34 weeks
5/8 (62.5%) with preterm (<37
weeks) PE had FGR
3/3 (100%) with early onset (<34 weeks) PE had FGR
211
Whether this is beneficial prior to the clinical utility of these tests has been definitively
established is uncertain. As discussed in chapters 3 and 4, a significant number of
patients with “false positive” results went on to either deliver preterm or have an
adverse outcome in their pregnancy. Ongoing auditing of outcomes are required to
determine whether these cases should actually be considered true positives once the
full predictive capacity of PlGF and sFlt1 testing is known. Perhaps for now it is best to
stick with the test that is more inclusive, despite having a greater number of false
positives.
When comparing the predictive performance of PlGF using the cut-off for preterm
preeclampsia and FGR with that of the cut-off for early onset preeclampsia and FGR, the
preterm cut-off using MoM values gives very good AUC (0.885-0.898), sensitivity (80%
for all platforms), specificity (84-90%) and NPV (>99.7%) and detected a greater
proportion of patients who went on to develop both early onset and preterm
preeclampsia and FGR, without having significantly more false positives than the early
onset preeclampsia and FGR cut-off (Table 33). PlGF using the cut-off for preterm
preeclampsia and FGR, using both raw data and MoM values, successfully detected all 4
cases of early onset FGR. It would appear safer to be more inclusive and favour the use
of the cut-off for preterm preeclampsia and FGR, given this test detected more cases of
FGR, including all four cases of early onset FGR, without a significant difference in false
positives. The addition of sFlt1, while it did improve the predictive performance using
the Cobas sFlt1/PlGF ratio and the early onset preeclampsia and FGR cut-off, did not
significantly improve performance for the preterm preeclampsia and FGR cut-off. The
addition of sFlt1 increased false negatives and did not favourably alter false positive
rates when compared with the use of PlGF in isolation. Hence, overall, PlGF MoM values
using the preterm preeclampsia and FGR cut-off appeared to perform the best for the
prediction of preeclampsia and FGR at midpregnancy.
Patients with preterm and early onset preeclampsia and FGR were more likely to have
underlying chronic hypertension and Type 1 diabetes (Table 26). The potential for
underlying vasculopathy as a result of such conditions may make these patients more
susceptible to mounting a maternal response in the presence of deranged placental
212
biomarkers. In the preterm FGR group, patients had a lower BMI compared with those
that developed preeclampsia and FGR, and were more likely to smoke, possibly
contributing to the pathology behind their FGR. None of the patients who developed
preterm preeclampsia and FGR were smokers. Of the 8 cases with preterm
preeclampsia, 1 was nulliparous and 7 were multiparous. Three of the multiparous
women had a past history of preeclampsia, while 3 had undergone an early preterm
delivery for another indication, one of whom had an FDIU at 33 weeks gestation. Though
history of previous preterm birth was not specifically analysed, these results indicate
that possibly the patients who developed preterm preeclampsia had an underlying
predisposition to developing placental pathology.
A significant decrease in PlGF was observed for all platforms, using both raw data and
MoM values, in patients who developed preterm FGR in the absence of preeclampsia. It
is not clear as to why these patients did not mount a maternal response to the placental
biomarkers which were likely implicated in their fetal growth restriction. This finding
illustrates that significant placental pathology can exist in the absence of the symptoms
of preeclampsia. It is quite possible that advancing gestation in these cases may have
ultimately resulted in maternal manifestations of the disease, and that delivery on fetal
grounds occurred prior to this development. It certainly makes the predominance of
placental disease, rather than maternal disease seem likely in the aetiology of these
patients.
At the time of a meta-analysis in 2013 reporting the use of placental biomarkers in the
prediction of FGR, it was concluded that based on the evidence available, none of the
biomarkers evaluated was sufficiently accurate to recommend use as a predictor of FGR
in routine clinical practice (Conde-Agudelo et al. 2013). There are many potential
reasons why it is difficult to find a single marker for the prediction of FGR, the most
obvious being that FGR is both multifactorial and diverse in its presentation, making the
discovery of a single marker which identifies all cases seem unrealistic. There is
considerable variation in the definitions and terminology used for FGR in the literature,
which would affect cases recruited and potentially results obtained. Not all studies
convert biomarker levels to MoM, which makes it difficult to compare results directly,

213
as potentially significant maternal factors are not corrected for. Other factors such as
sample storage times, methods of analysis, thawing and refreezing of samples, cut-offs
chosen can all potentially affect results obtained and conclusions drawn (Conde-
Agudelo et al. 2013)
The results presented here are in alignment with existing reports of lowered placental
biomarkers in patients with growth restricted fetuses (Taylor et al. 2003; Levine 2004;
Savvidou et al. 2006; Espinoza et al. 2007; Crispi et al. 2008; Diab et al. 2008; Romero et
al. 2008; Benton et al. 2012; Lobmaier et al. 2014; Shim et al. 2015). Additionally, the
findings from this chapter add to existing evidence that preterm preeclampsia and FGR,
when they coexist, have greater consequences than when either entity occurs in
isolation (Taylor et al. 2003). Preterm and early onset preeclampsia and FGR, as
expected, resulted in significantly decreased gestation at delivery and birthweight,
factors that have been associated with both immediate and long-term risks for the
neonate. It was not possible to compare outcomes in patients who developed early
onset preeclampsia with those that developed early onset preeclampsia and FGR, purely
due to the fact that each of the patients that developed early onset preeclampsia also
developed FGR, so the two outcomes could not be isolated for the purpose of analysis.
The fact that all of our cases of early onset preeclampsia had coexisting FGR, 5 of 8 cases
of preterm preeclampsia had FGR, and none of the term cases of preeclampsia had FGR
also aligns with previous evidence that the pathophysiology behind term preeclampsia
is very different to that of preterm and early onset preeclampsia. It shows great promise
that using PlGF for the prediction of preeclampsia was able to detect cases who had
coexisting FGR, as the fetuses of these patients with coexisting serious pathology are at
the greatest risk for perinatal morbidity and potentially mortality and would
consequently benefit most from screening. Whilst sFlt1 did not improve prediction for
preterm FGR significantly, PlGF, particularly MoM values using the cut-off for preterm
preeclampsia and FGR, shows great promise as a potential marker when tested at the
midpregnancy. The results presented here provide a spring board to further determine
the clinical utility of PlGF for this subset of cases who develop either FGR in isolation or
preeclampsia and FGR. Taking this a step further, it would be worthwhile investigating
the extent to which predictive performance of PlGF and the sFlt1/PlGF for either FGR in

214
isolation or preeclampsia and FGR improves in our patient population when
incorporated into a multivariable algorithm, including maternal factors, MAP, UAPI, PlGF
and sFlt1.
The accurate diagnosis of FGR antenatally and distinction of this condition from SGA in
order to limit potential exposure to unnecessary iatrogenic preterm delivery is currently
challenging. A serum marker capable of stratifying patients into high and low risk groups,
with ongoing monitoring in the high-risk group, would aid clinicians tremendously in
optimising management for these pregnancies. Once the clinical utility for this test is
established, along with the relationship between placental dysfunction, FGR and low
PlGF, it may prove a useful clinical tool to use in conjunction with standard technologies
already used in clinical practice. Clinical care for these cases would be optimised in high
risk cases, to include early referral to appropriate tertiary units for surveillance and
timely intervention, reduction in anxiety for patients assessed to be at low risk for
placental dysfunction, and prioritisation of limited health resources towards those who
are assessed to be high risk and are subsequently most likely to be affected (Benton et
al. 2012). Though there are no preventative interventions available currently, reliable
prediction of antenatal FGR would allow testing for potential preventative interventions
for pregnancies that are deemed high risk. In addition, prevention of FGR from detection
in utero could mark the early stages of a public health strategy aimed towards avoiding
adverse health outcomes arising from FGR that may extend into adult life, including
cardiovascular disease, hypertension and Type 2 diabetes (Conde-Agudelo et al. 2013).
5.5 Summary
Within our patient cohort, PlGF levels were significantly decreased and the sFlt1/PlGF
ratio significantly increased in patients who developed preterm preeclampsia and FGR,
with levels deviating further from normal with earlier gestation of onset of disease. PlGF
MoM using the cut-off for preterm FGR or preeclampsia and FGR appeared to be the
most useful test at this point in time. PlGF appears to detect coexisting preterm
preeclampsia and FGR more reliably than preeclampsia alone, possibly due to these
patients having more significant placental disease. These results are limited by the small
number of patients in this study who developed preterm and early onset FGR or

215
preeclampsia and FGR. Further confirmation of these findings with a larger prospective
study focusing on the subset of patients with either preterm FGR or preterm
preeclampsia and FGR is required, in order to confirm these findings regarding the
clinical validity of these tests, and to further determine their clinical utility, or how the
use of these placental biomarkers could improve patient outcomes when used in
everyday practice.

216
Chapter 6
Prediction of preterm preeclampsia at
midpregnancy using a multivariable screening
algorithm
6.1 Introduction
Within the last decade, multivariable prediction algorithms have shown greater clinical
validity for prediction of preeclampsia than the traditional approach of screening with
maternal history alone (O'Gorman et al. 2017). The Fetal Medicine Foundation (FMF) in
the United Kingdom have devised a multivariable prediction algorithm for preeclampsia.
This algorithm, which is based on a competing risks model, has been validated in several
different patient populations around the world (Park et al. 2013; Oliveira et al. 2014a;
Oliveira et al. 2014b; Gallo et al. 2016; O'Gorman et al. 2016) and is available online at
www.fetalmedicine.org. Competing risks models for the prediction of preeclampsia
were first described in 2012 (Wright et al. 2012). This model, which allows estimation of
individual patient-specific risks of preeclampsia that require delivery before a specified
gestation, is based on a survival time model for the time of delivery for preeclampsia.
Bayes’ theorem is used to combine the a priori risk from maternal characteristics and
medical history with the results of various combinations of biophysical and biochemical
measurements collected at different times during pregnancy, to generate a separate a
posteriori risk for individual patients. This approach assumes that, if the pregnancy were
to continue indefinitely, all women would ultimately experience preeclampsia, and
whether or not they do so before a specified gestational age depends on competition
between delivery before or after development of preeclampsia (Figure 50). The effect
of variables from maternal characteristics and history and biomarkers is to modify the
mean of the distribution of gestational age at delivery with preeclampsia so that, in
pregnancies at low risk for preeclampsia, the gestational age distribution is shifted to

217
In pregnancies at low risk for preeclampsia, the gestational age distribution is shifted
to the right, and in most pregnancies, delivery will occur before the development of
preeclampsia. In pregnancies at high risk of preeclampsia, the distribution is shifted to
the left. The risk of preeclampsia occurring at or before a specified gestational age is
given by the area under the distribution curve (black). In the low-risk group, the risk of
preeclampsia at or before 34 weeks gestation is 0.01 or 1%, and in the high-risk group,
the risk is 0.3 or 30%.
Figure 50. Distribution of gestational age at delivery for preeclampsia. Wright, D., Syngelaki, A., Akolekar, R., Poon, L.C. and Nicolaides, K.H. (2015) 'Competing risks model in screening for preeclampsia by maternal characteristics and medical history', Am J Obstet Gynecol, 213(1), 62.e1-62.e10.
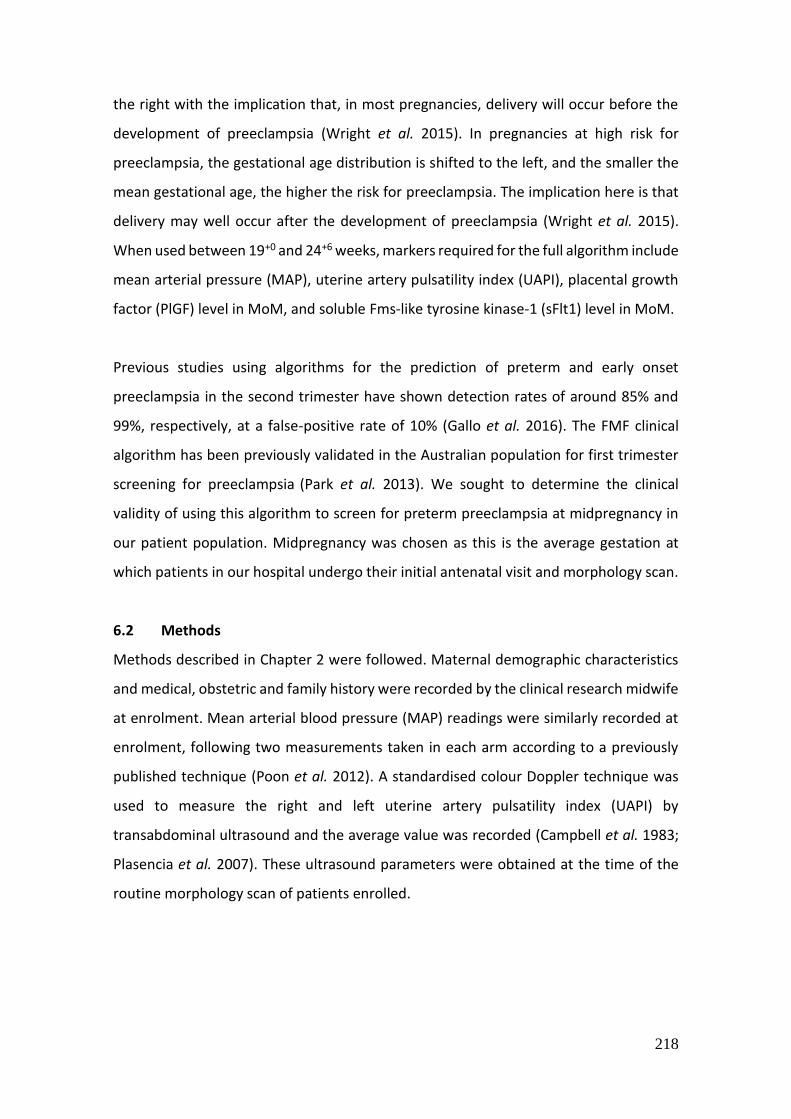
218
the right with the implication that, in most pregnancies, delivery will occur before the
development of preeclampsia (Wright et al. 2015). In pregnancies at high risk for
preeclampsia, the gestational age distribution is shifted to the left, and the smaller the
mean gestational age, the higher the risk for preeclampsia. The implication here is that
delivery may well occur after the development of preeclampsia (Wright et al. 2015).
When used between 19+0 and 24+6 weeks, markers required for the full algorithm include
mean arterial pressure (MAP), uterine artery pulsatility index (UAPI), placental growth
factor (PlGF) level in MoM, and soluble Fms-like tyrosine kinase-1 (sFlt1) level in MoM.
Previous studies using algorithms for the prediction of preterm and early onset
preeclampsia in the second trimester have shown detection rates of around 85% and
99%, respectively, at a false-positive rate of 10% (Gallo et al. 2016). The FMF clinical
algorithm has been previously validated in the Australian population for first trimester
screening for preeclampsia (Park et al. 2013). We sought to determine the clinical
validity of using this algorithm to screen for preterm preeclampsia at midpregnancy in
our patient population. Midpregnancy was chosen as this is the average gestation at
which patients in our hospital undergo their initial antenatal visit and morphology scan.
6.2 Methods
Methods described in Chapter 2 were followed. Maternal demographic characteristics
and medical, obstetric and family history were recorded by the clinical research midwife
at enrolment. Mean arterial blood pressure (MAP) readings were similarly recorded at
enrolment, following two measurements taken in each arm according to a previously
published technique (Poon et al. 2012). A standardised colour Doppler technique was
used to measure the right and left uterine artery pulsatility index (UAPI) by
transabdominal ultrasound and the average value was recorded (Campbell et al. 1983;
Plasencia et al. 2007). These ultrasound parameters were obtained at the time of the
routine morphology scan of patients enrolled.
219
6.2.1 Study population
Refer to section 2.2
6.2.2 Blood sample collection and storage
Refer to section 2.3
6.2.3 Outcome measures
The main outcome of interest was the development of preeclampsia, as defined by the
ISSHP (Brown et al. 2018). More specifically, preeclampsia was classified according to
gestation at the time of delivery, not the time of onset, as early onset preeclampsia
(<34weeks), preterm preeclampsia (<37weeks) and term preeclampsia (≥37weeks).
6.2.4 Statistical analysis
In addition to the analyses described in Chapter 2, the individual risk for preterm
preeclampsia was calculated for each patient, according to the FMF algorithm, using
data obtained from maternal demographic characteristics and medical, obstetric and
family history, which were collected at enrolment, along with MAP and UAPI indices and
PlGF MoM and sFlt1 MoM values from each of the three platforms. The risk calculations
were performed retrospectively at the completion of the study by the same clinician,
who was blinded to patient outcomes, using a previously published algorithm (Gallo et
al. 2016).
Screening performances for combined values for a) maternal factors, MAP, UAPI and
PlGF MoM for Delfia, Cobas and Kryptor platforms and b) maternal factors, MAP, UAPI,
PlGF MoM and sFlt1 MoM for the Cobas and Kryptor platforms following risk assessment
using the FMF algorithm were then evaluated using receiver operating characteristic
(ROC) curves to calculate the area under the curve (AUC). Coordinates of the ROC curves
were used to identify predictive values for the risks calculated using the FMF algorithm
for the development of preterm (<37weeks) and early onset (<34weeks) preeclampsia.
Selected cut-off values were chosen using options a) and b), outlined above, for each
immunoassay platform, with algorithm combinations with the highest sensitivity and
specificity chosen as optimal cut-off points for a positive test. True positive and negative
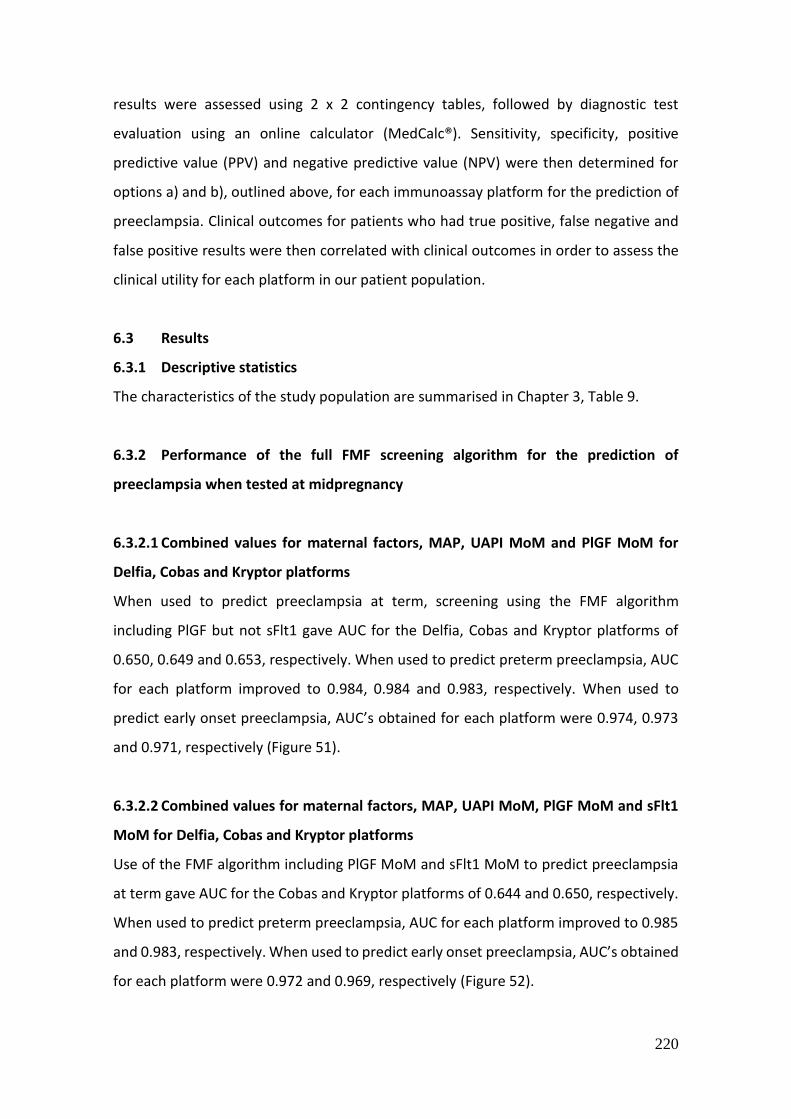
220
results were assessed using 2 x 2 contingency tables, followed by diagnostic test
evaluation using an online calculator (MedCalc®). Sensitivity, specificity, positive
predictive value (PPV) and negative predictive value (NPV) were then determined for
options a) and b), outlined above, for each immunoassay platform for the prediction of
preeclampsia. Clinical outcomes for patients who had true positive, false negative and
false positive results were then correlated with clinical outcomes in order to assess the
clinical utility for each platform in our patient population.
6.3 Results
6.3.1 Descriptive statistics
The characteristics of the study population are summarised in Chapter 3, Table 9.
6.3.2 Performance of the full FMF screening algorithm for the prediction of
preeclampsia when tested at midpregnancy
6.3.2.1 Combined values for maternal factors, MAP, UAPI MoM and PlGF MoM for
Delfia, Cobas and Kryptor platforms
When used to predict preeclampsia at term, screening using the FMF algorithm
including PlGF but not sFlt1 gave AUC for the Delfia, Cobas and Kryptor platforms of
0.650, 0.649 and 0.653, respectively. When used to predict preterm preeclampsia, AUC
for each platform improved to 0.984, 0.984 and 0.983, respectively. When used to
predict early onset preeclampsia, AUC’s obtained for each platform were 0.974, 0.973
and 0.971, respectively (Figure 51).
6.3.2.2 Combined values for maternal factors, MAP, UAPI MoM, PlGF MoM and sFlt1
MoM for Delfia, Cobas and Kryptor platforms
Use of the FMF algorithm including PlGF MoM and sFlt1 MoM to predict preeclampsia
at term gave AUC for the Cobas and Kryptor platforms of 0.644 and 0.650, respectively.
When used to predict preterm preeclampsia, AUC for each platform improved to 0.985
and 0.983, respectively. When used to predict early onset preeclampsia, AUC’s obtained
for each platform were 0.972 and 0.969, respectively (Figure 52).

221
Figure 51. ROC curves using the FMF algorithm for prediction of preeclampsia using combined values for maternal history, MAP, UAPI MoM
and PlGF MoM for Delfia, Cobas and Kryptor platforms.
Pregnancies that developed PE
25 (4.9%) overall PE
17 (3.3%) term (≥37 weeks) PE
8 (1.6%) preterm (<37 weeks) PE
3 (0.6%) early onset (<34 weeks) PE
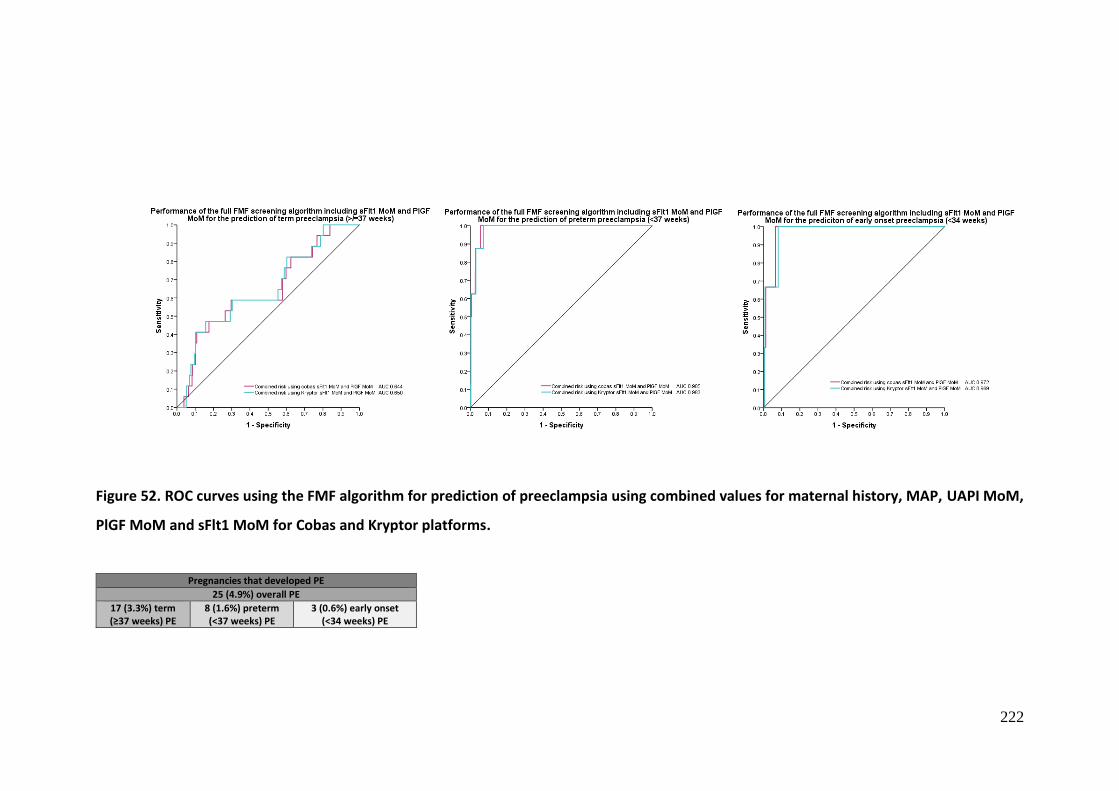
222
Figure 52. ROC curves using the FMF algorithm for prediction of preeclampsia using combined values for maternal history, MAP, UAPI MoM,
PlGF MoM and sFlt1 MoM for Cobas and Kryptor platforms.
Pregnancies that developed PE
25 (4.9%) overall PE
17 (3.3%) term (≥37 weeks) PE
8 (1.6%) preterm (<37 weeks) PE
3 (0.6%) early onset (<34 weeks) PE

223
6.3.3 Sensitivity and specificity analysis for prediction of preeclampsia using PlGF
Sensitivity and specificity for the prediction of preeclampsia using the FMF algorithm
were calculated for the Cobas and Kryptor platforms using selected cut-offs from ROC
curves.
Two cut-off points were selected for each platform. The first was the point that gave the
highest sensitivity and specificity for prediction of patients with preterm PE and will be
referred to as the preterm PE cut-off. The second was the point that gave the highest
sensitivity and specificity for prediction of patients with early onset PE and will be
referred to as the early PE cut-off.
When using the FMF algorithm including PlGF for the prediction of early onset
preeclampsia, the three platforms each performed extremely similarly, with very similar
clinical characteristics (Table 34). The cut-offs for early onset PE and preterm PE were
the same for individual platforms. For the prediction of early onset preeclampsia, the
Delfia, Cobas and Kryptor platforms gave sensitivity 100 for each platform, specificity
94.11, 94.11 and 93.32, respectively, PPV 9.09, 9.09 and 8.11, respectively and NPV 100
for each platform. For the prediction of preterm preeclampsia, the Delfia, Cobas and
Kryptor platforms gave sensitivity 100 for each platform, specificity 95.04, 95.04 and
94.25, respectively, PPV 24.24, 24.24 and 21.62, respectively and NPV 100 for each
platform. A summary of clinical characteristics using the FMF algorithm and PlGF MoM
+/- sFlt1 MoM is displayed in Table 35.
Detection rates (DR), false-positive rates (FPR) and areas under the curve at cut-off risks
of 1:50 and 1:100 for development of preeclampsia before 37 weeks are summarised in
Table 36 and 37.
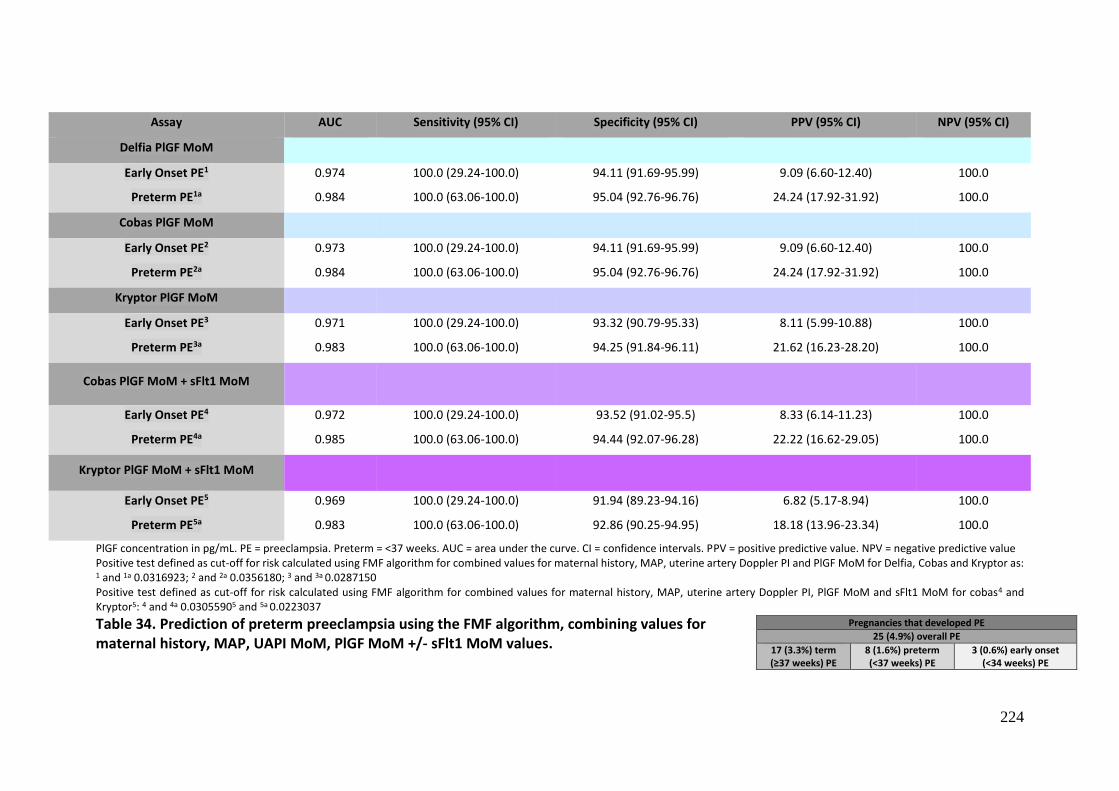
224
Assay AUC Sensitivity (95% CI) Specificity (95% CI) PPV (95% CI) NPV (95% CI)
Delfia PlGF MoM
Early Onset PE1
Preterm PE1a
0.974
0.984
100.0 (29.24-100.0)
100.0 (63.06-100.0)
94.11 (91.69-95.99)
95.04 (92.76-96.76)
9.09 (6.60-12.40)
24.24 (17.92-31.92)
100.0
100.0
Cobas PlGF MoM
Early Onset PE2
Preterm PE2a
0.973
0.984
100.0 (29.24-100.0)
100.0 (63.06-100.0)
94.11 (91.69-95.99)
95.04 (92.76-96.76)
9.09 (6.60-12.40)
24.24 (17.92-31.92)
100.0
100.0
Kryptor PlGF MoM
Early Onset PE3
Preterm PE3a
0.971
0.983
100.0 (29.24-100.0)
100.0 (63.06-100.0)
93.32 (90.79-95.33)
94.25 (91.84-96.11)
8.11 (5.99-10.88)
21.62 (16.23-28.20)
100.0
100.0
Cobas PlGF MoM + sFlt1 MoM
Early Onset PE4
Preterm PE4a
0.972
0.985
100.0 (29.24-100.0)
100.0 (63.06-100.0)
93.52 (91.02-95.5)
94.44 (92.07-96.28)
8.33 (6.14-11.23)
22.22 (16.62-29.05)
100.0
100.0
Kryptor PlGF MoM + sFlt1 MoM
Early Onset PE5
Preterm PE5a
0.969
0.983
100.0 (29.24-100.0)
100.0 (63.06-100.0)
91.94 (89.23-94.16)
92.86 (90.25-94.95)
6.82 (5.17-8.94)
18.18 (13.96-23.34)
100.0
100.0
PlGF concentration in pg/mL. PE = preeclampsia. Preterm = <37 weeks. AUC = area under the curve. CI = confidence intervals. PPV = positive predictive value. NPV = negative predictive value Positive test defined as cut-off for risk calculated using FMF algorithm for combined values for maternal history, MAP, uterine artery Doppler PI and PlGF MoM for Delfia, Cobas and Kryptor as: 1 and 1a 0.0316923; 2 and 2a 0.0356180; 3 and 3a 0.0287150 Positive test defined as cut-off for risk calculated using FMF algorithm for combined values for maternal history, MAP, uterine artery Doppler PI, PlGF MoM and sFlt1 MoM for cobas4 and Kryptor5: 4 and 4a 0.03055905 and 5a 0.0223037
Table 34. Prediction of preterm preeclampsia using the FMF algorithm, combining values for maternal history, MAP, UAPI MoM, PlGF MoM +/- sFlt1 MoM values.
Pregnancies that developed PE
25 (4.9%) overall PE
17 (3.3%) term (≥37 weeks) PE
8 (1.6%) preterm (<37 weeks) PE
3 (0.6%) early onset (<34 weeks) PE
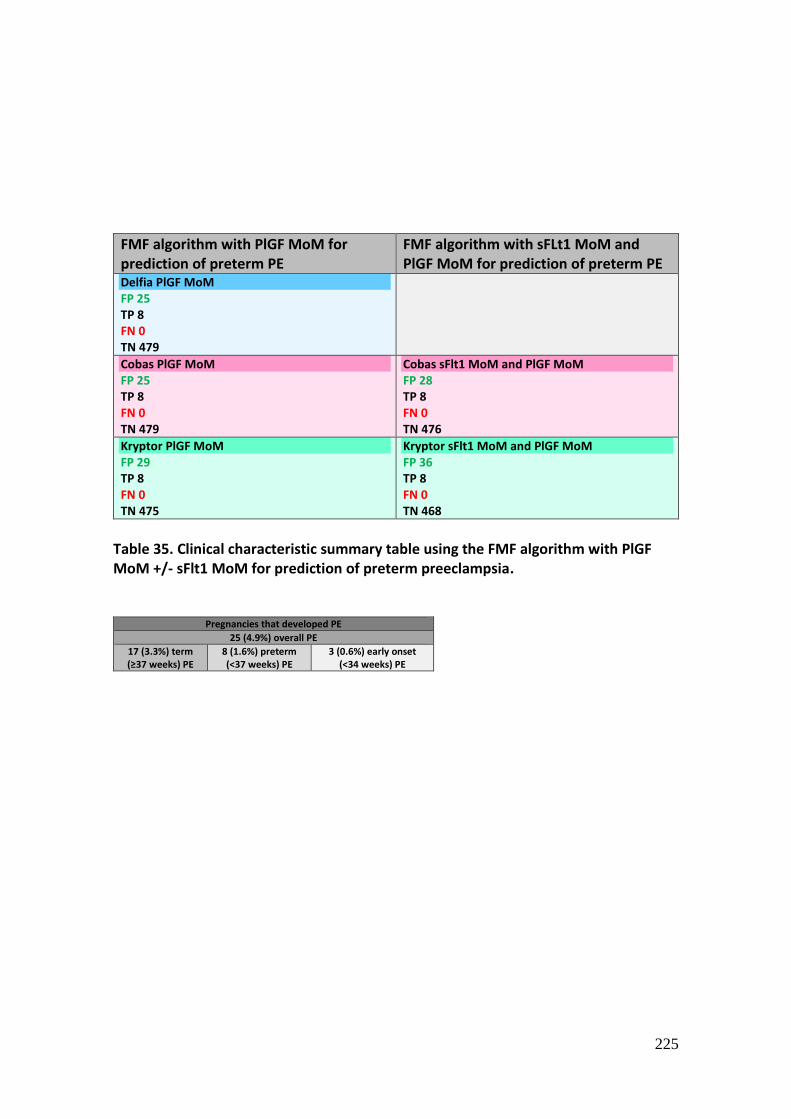
225
FMF algorithm with PlGF MoM for prediction of preterm PE
FMF algorithm with sFLt1 MoM and PlGF MoM for prediction of preterm PE
Delfia PlGF MoM FP 25 TP 8 FN 0 TN 479
Cobas PlGF MoM FP 25 TP 8 FN 0 TN 479
Cobas sFlt1 MoM and PlGF MoM FP 28 TP 8 FN 0 TN 476
Kryptor PlGF MoM FP 29 TP 8 FN 0 TN 475
Kryptor sFlt1 MoM and PlGF MoM FP 36 TP 8 FN 0 TN 468
Table 35. Clinical characteristic summary table using the FMF algorithm with PlGF MoM +/- sFlt1 MoM for prediction of preterm preeclampsia.
Pregnancies that developed PE
25 (4.9%) overall PE
17 (3.3%) term (≥37 weeks) PE
8 (1.6%) preterm (<37 weeks) PE
3 (0.6%) early onset (<34 weeks) PE

226
PlGF and sFlt1 concentrations in pg/ml. FMF = fetal medicine foundation; DR = detection rate; FPR = false-positive rate; MAP = mean arterial pressure; UAPI = uterine artery Doppler pulsatility index Table 36. Screening performance according to the FMF algorithm (using cut-offs of 1:50 and 1:100) for preeclampsia delivering before 37 weeks.
Data entered into FMF algorithm
Cut-Off 1:50 Cut-Off 1:100
DR (%) FPR (%) DR (%) FPR (%)
Maternal factors 75.0 (45.0-105.0) 14.3 (11.2-17.3) 87.5 (64.6-110.4) 29.4 (25.4-33.3)
MAP 75.0 10.5 87.5 18.7
UAPI 100 16.5 100 25.6
Delfia PlGF 87.5 6.9 87.5 15.5
Cobas PlGF 87.5 7.0 87.5 14.5
Kryptor PlGF 87.5 7.0 87.5 15.3
Cobas sFlt1 75.0 12.1 87.5 27.6
Kryptor sFlt 75.0 12.3 87.5 28.0
Cobas PlGF + sFlt1 87.5 6.9 87.5 14.3
Kryptor PlGF + sFlt1 87.5 7.0 87.5 13.9
MAP + UAPI 87.5 11.1 100 18.3
MAP + Delfia PlGF 75.0 5.8 87.5 11.3
MAP + Cobas PlGF 87.5 5.6 87.5 10.7
MAP + Kryptor PlGF 75.0 5.8 87.5 11.0
MAP + Cobas sFlt1 75.0 10.1 87.5 18.5
MAP + Kryptor sFlt1 75.0 10.1 87.5 18.5
MAP + Cobas PlGF + sFlt1 75.0 5.6 87.5 10.7
MAP + Kryptor PlGF + sFlt1 75.0 6.0 87.5 11.1
UAPI + Delfia PlGF 100 10.1 100 18.3
UAPI + Cobas PlGF 100 10.3 100 18.1
UAPI + Kryptor PlGF 100 9.9 100 18.3
UAPI + Cobas sFlt1 100 15.7 100 24.8
UAPI + Kryptor sFlt1 100 15.7 100 24.0
UAPI + Cobas PlGF + sFlt1 100 9.9 100 17.5
UAPI + Kryptor PlGF + sFlt1 100 10.1 100 17.7
MAP + UAPI + Delfia PlGF 100 8.1 100 13.5
MAP + UAPI + Cobas PlGF 100 7.9 100 13.3
MAP + UAPI + Kryptor PlGF 100 7.9 100 12.9
MAP + UAPI + Cobas sFlt1 87.5 10.9 100 17.5
MAP + UAPI + Kryptor sFlt1 87.5 10.9 100 17.7
MAP + UAPI + Cobas PlGF + sFlt1 100 8.1 100 12.7
MAP + UAPI + Kryptor PlGF + sFlt1
100 7.7 100 12.9
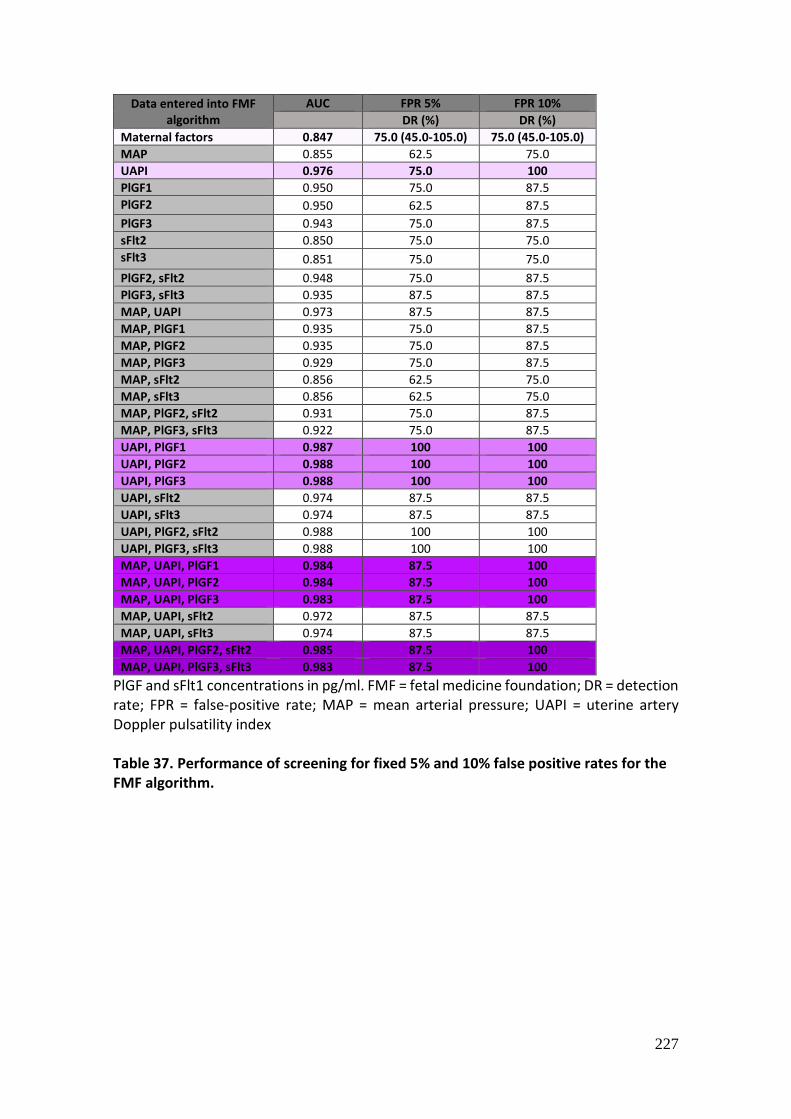
227
Data entered into FMF algorithm
AUC FPR 5% FPR 10%
DR (%) DR (%)
Maternal factors 0.847 75.0 (45.0-105.0) 75.0 (45.0-105.0)
MAP 0.855 62.5 75.0
UAPI 0.976 75.0 100
PlGF1 0.950 75.0 87.5
PlGF2 0.950 62.5 87.5
PlGF3 0.943 75.0 87.5
sFlt2 0.850 75.0 75.0
sFlt3 0.851 75.0 75.0
PlGF2, sFlt2 0.948 75.0 87.5
PlGF3, sFlt3 0.935 87.5 87.5
MAP, UAPI 0.973 87.5 87.5
MAP, PlGF1 0.935 75.0 87.5
MAP, PlGF2 0.935 75.0 87.5
MAP, PlGF3 0.929 75.0 87.5
MAP, sFlt2 0.856 62.5 75.0
MAP, sFlt3 0.856 62.5 75.0
MAP, PlGF2, sFlt2 0.931 75.0 87.5
MAP, PlGF3, sFlt3 0.922 75.0 87.5
UAPI, PlGF1 0.987 100 100
UAPI, PlGF2 0.988 100 100
UAPI, PlGF3 0.988 100 100
UAPI, sFlt2 0.974 87.5 87.5
UAPI, sFlt3 0.974 87.5 87.5
UAPI, PlGF2, sFlt2 0.988 100 100
UAPI, PlGF3, sFlt3 0.988 100 100
MAP, UAPI, PlGF1 0.984 87.5 100
MAP, UAPI, PlGF2 0.984 87.5 100
MAP, UAPI, PlGF3 0.983 87.5 100
MAP, UAPI, sFlt2 0.972 87.5 87.5
MAP, UAPI, sFlt3 0.974 87.5 87.5
MAP, UAPI, PlGF2, sFlt2 0.985 87.5 100
MAP, UAPI, PlGF3, sFlt3 0.983 87.5 100
PlGF and sFlt1 concentrations in pg/ml. FMF = fetal medicine foundation; DR = detection rate; FPR = false-positive rate; MAP = mean arterial pressure; UAPI = uterine artery Doppler pulsatility index Table 37. Performance of screening for fixed 5% and 10% false positive rates for the FMF algorithm.
228
Screening for preeclampsia using the FMF algorithm at a cut-off 1:50 using maternal
factors, MAP, UAPI and PlGF MoM values from the Delfia, Cobas and Kryptor platforms
detected 100% of cases of preterm preeclampsia for each platform, at FPR of 8.1%,
7.9% and 7.9%, respectively. Adding sFlt1 to the algorithm gave detection rate 100% for
the Cobas and Kryptor platforms, with FPR 8.1 and 7.7% respectively.
Screening for preeclampsia using the FMF algorithm at a cut-off 1:100 using maternal
factors, MAP, UAPI and PlGF MoM from the Delfia, Cobas and Kryptor platforms
detected 100% of cases of preterm preeclampsia for each platform, at FPR of 13.5%,
13.3% and 12.9%, respectively. Adding sFlt1 to the algorithm gave detection rate 100%
for the Cobas and Kryptor platforms, with FPR 12.7 and 12.9% respectively.
At a fixed FPR of 5%, the FMF algorithm using maternal factors, MAP, UAPI and PlGF
MoM from the Delfia, Cobas and Kryptor platforms gave detection rate 85%. This did
not change with addition of sFlt1.
At a fixed FPR of 10%, the FMF algorithm using maternal factors, MAP, UAPI and PlGF
MoM from the Delfia, Cobas and Kryptor platforms gave detection rate 100%. At a fixed
FPR of 10%, the FMF algorithm using maternal factors, MAP, UAPI and PlGF MoM from
the Delfia, Cobas and Kryptor platforms gave detection rate 100%.
6.4 Discussion
Given that no single screening test for preeclampsia or FGR to date has proven
sufficiently accurate for international health authorities to recommend use in everyday
clinical practice, many researchers have combined tests in attempt to improve overall
predictive value (Parra et al. 2005; Giguere et al. 2010; Poon et al. 2010a; Akolekar et al.
2011; Akolekar et al. 2013; Lai et al. 2013; Park et al. 2013; Garcia-Tizon Larroca et al.
2014; Park et al. 2014; Gallo et al. 2016; Kienast et al. 2016; O'Gorman et al. 2016;
O'Gorman et al. 2017; Al-Amin et al. 2018). By using multiple parameters, pathological
biochemical and biophysical abnormalities behind these multifactorial conditions are, in
theory, more likely to be captured and hence prove beneficial in a screening setting
(Rodriguez et al. 2016).
229
The best markers for prediction for preeclampsia that were entered into the FMF
algorithm for the patient population in this study were UAPI and PlGF MoM, and
therefore combinations that included these two markers displayed the best predictive
performance. Albaiges in 2000 (Albaiges et al. 2000) performed uterine artery Doppler
imaging on 1757 women at 23 weeks gestation and discovered that this test identified
most women who subsequently developed serious complications related to impaired
placentation, including preeclampsia and delivery of SGA infants. Papageorghiou in 2001
(Papageorghiou et al. 2001) performed uterine artery Doppler imaging on 8335 women
at 23 weeks gestation and found that abnormal results were predictive of preterm (<32
weeks) preeclampsia with FGR, preeclampsia without FGR and FGR without
preeclampsia with sensitivities of 93%, 80% and 56%, respectively.
Traditionally, preeclampsia screening has been based on maternal demographic
characteristics and medical and obstetric history, collectively referred to as maternal
factors. These traditional methods, whilst inexpensive and not requiring specific
resources to undertake, have been shown to have poor detection rates and high false
positive rates. Like NICE (National Institute for Health and Clinical Excellence 2010) and
ACOG (American College of Obstetricians and Gynecologists 2013), the US Preventative
Services Task Force (USPSTF) (Henderson et al. 2017) provides a list of risk factors to
assist clinicians in determining which patients are at elevated risk for preeclampsia.
Combining risk factors into an algorithm to provide an individualised risk assessment has
been shown to be significantly more effective than screening by maternal factors alone.
Gallo in 2016 (Gallo et al. 2016) used a competing risks model in 8079 pregnancies. They
reported that screening by maternal factors only predicted 52%, 47% and 37% of
preeclampsia at <32, <37 and ≥37 weeks gestation, respectively, for a FPR of 10%. The
respective values for combined screening with maternal factors, MAP, UAPI and PlGF
MoM were 99%, 85% and 46%, with no further improvement in performance with the
addition of sFlt1. A study performed in the same research department using the same
patient population as the results presented in this thesis compared the performance of
the NICE and ACOG guidelines for the prediction of preeclampsia with the multivariable
FMF algorithm, including maternal history, MAP and UAPI in the second trimester,
between 19 and 22 weeks gestation (Al-Amin et al. 2018). Results from this study

230
showed that the NICE (National Institute for Health and Clinical Excellence 2010)
guidelines detected 33%, 75% and 47.3% of early onset, preterm and term preeclampsia
with FPR 22.4% when used in this patient population. The ACOG (American College of
Obstetricians and Gynecologists 2013) guidelines detected 66.6%, 87.5% and 89.4% of
early onset, preterm and term preeclampsia with FPR 67.8%. Detection rates using the
FMF algorithm, including maternal factors, MAP and UAPI showed far superior
performance. At a cut-off of 1:100, 100% cases of early onset and preterm preeclampsia
and 42.1% of term preeclampsia were detected with FPR 12.9%. At a cut-off of 1:60,
100% cases of early onset and preterm preeclampsia and 26.3% of term preeclampsia
were detected with FPR 12.9%. The performance of the algorithm is certainly superior
to screening with maternal factors alone. While traditional history-based methods lead
to low detection rates (National Institute for Health and Clinical Excellence 2010) or very
high false positive rates, including more than half of the population in the high-risk group
(American College of Obstetricians and Gynecologists 2013), patient specific risk
assessment allows detection of a high proportion of the patients that will develop
preterm preeclampsia with an acceptable false positive rate.
.
Given that detection rates for preterm preeclampsia using maternal factors, MAP and
UAPI as in the study by Al-Amin (Al-Amin et al. 2018) were 100%, how then can addition
of PlGF MoM or sFlt1 MoM further improve these results? As displayed in Table 36 and
37, addition of PlGF MoM halved the FPR for any used cut-off compared to maternal
factors and UAPI alone and reduced the FPR by a further 30% compared with using
maternal factors, MAP and UAPI. PlGF MoM from the three providers using the FMF
algorithm performed very similarly, as did sFlt1 using the Cobas and Kryptor platforms.
However, in agreement with the study by Gallo in 2016 (Gallo et al. 2016), addition of
sFlt1 did not significantly improve prediction rates or lower false positive rates any
further, which was as we expected given that sFlt1 values were not significantly different
in affected and unaffected pregnancies for the prediction of preeclampsia (see Chapter
4). Hence it would be reasonable to exclude sFlt1 from the algorithm in order to save
costs and resources and recommend that screening for preterm preeclampsia with the
FMF algorithm, using maternal history, MAP, UAPI and PlGF MoM gives the best
predictive performance.
231
Screening for preterm and early onset preeclampsia using the FMF multivariable
algorithm significantly improved prediction rates when compared with use of
biomarkers alone. Prediction of preterm preeclampsia using the FMF algorithm gave the
best clinical characteristics of all the tests discussed thus far, as outlined in Table 34. PPV
using this method was significantly higher than that when using biomarkers alone, with
values between 22% and 24%. This translates to between 1 in 4 and 1 in 5 patients who
are classified as high risk based on their screening result later developing preterm
preeclampsia.
The implementation of a multivariable algorithm should prove technically feasible
within a tertiary hospital setting. Recording of necessary maternal factors required for
the multivariable algorithm may require specific proformas to be developed, but this
information should routinely be collected for all pregnancies at the first antenatal visit.
Measurement of MAP requires adherence to a specific technique but can easily be
performed by healthcare professionals after minimal training and using inexpensive
blood pressure devices (Poon et al. 2012). Measurement of mean UAPI requires specific
training for sonographers undertaking the technique but can be performed relatively
quickly as part of the routine midpregnancy morphology scan (Plasencia et al. 2007).
Conversion of raw data values obtained to MoM and preeclampsia risk calculation
requires expertise and familiarity with this technique. Of course, regular ongoing audits
for quality assurance of the risk calculation generated would need to be implemented,
and auditing of pregnancy outcomes for quality assurance would be required, however
each of these aspects should be achievable in a tertiary centre.
These findings indicate that the addition of PlGF levels to a second trimester externally
validated multivariable algorithm which includes maternal factors, MAP and UAPI for
the prediction of preterm and early onset preeclampsia does not further increase
detection rates above those when including maternal factors, MAP and UAPI alone, but
does significantly reduce false positive rates (see Table 36 and 37). The addition of PlGF
MoM levels to this algorithm in patients tested at midpregnancy would incur costs
associated with collection and analysis of blood results, commercial immunoassay
232
machines and consumables. Whilst a formal cost-benefit analysis would need to be
performed, the significantly lower false positive rate incurred with the addition of PlGF
to the model, with the subsequent reduction in costs and resources from monitoring
patients with false positive results unnecessarily could quite possibly justify any cost
involved of addition of this biomarker to the algorithm. An additional benefit would be
potentially significant reduction in anxiety associated with a positive test, given that far
fewer patients will have false positive results.
6.5 Summary
Screening for the development of preterm preeclampsia at midpregnancy using the
multivariable FMF algorithm, which incorporates maternal factors, MAP, UAPI and PlGF
MoM, is effective within an Australian population and gives superior performance when
compared with screening using PlGF or the sFlt1/PlGF ratio alone. Specificity and
positive predictive values were improved using this method, with a significant reduction
in false positives. Addition of sFlt1 did not significantly improve the predictive
performance of the algorithm. PlGF and UAPI were the most influential markers to
contribute to the algorithm, and PlGF from the three different immunoassays performed
very similarly.

233
Chapter 7
Discussion and Summary
7.1 General Discussion
Preeclampsia, fetal growth restriction and placental abruption are obstetric conditions
which all fall within the category of placental dysfunction. These conditions, either
occurring in isolation or coexisting in the same pregnancy, can necessitate iatrogenic
preterm delivery with associated neonatal morbidity and mortality (Friedman and
Cleary 2014). Though these conditions can differ significantly in their clinical
presentation, they do share some common features. They have many of the same risk
factors and each condition can recur in subsequent pregnancies or coexist within the
one pregnancy, which suggests that they may even share a common underlying
aetiology. There is no doubt that successful prediction and prevention of these disorders
could substantially improve both neonatal and maternal outcomes (Friedman and Cleary
2014).
The purpose of this research was to determine which of PlGF, sFlt1 and the sFlt1/PlGF
ratio effectively predicts preeclampsia at midpregnancy, which biomarker has the best
clinical validity for predicting this outcome, and whether the incorporation of these
biomarkers into a multivariable algorithm improves predictive performance further. In
addition, an analysis was undertaken to determine if there was any significant difference
in the predictive performance of the three immunoassay platforms used for the
prediction of preeclampsia at midpregnancy, namely the Delfia, Cobas and Kryptor
platforms.
In terms of correlation and agreement of results between the three platforms, validation
studies described in Chapter 2 confirmed that raw data values for the three platforms
were very well correlated, based on Intraclass Correlation Coefficients of 0.971 for PlGF,
0.969 for sFlt1 and 0.951 for the sFlt1/PlGF ratio. This indicates that the results obtained
using these platforms are reliable and reproducible. To assess for agreement between
234
the three platforms, Bland Altman plots showed that while PlGF, sFlt1 and sFlt1/PlGF
ratio values that had been converted to MoM were directly comparable between
platforms, laboratory specific reference ranges for raw data values would need to be
taken into consideration when comparing raw data values between platforms. Raw data
values do not take into consideration certain maternal factors that can affect an
individual’s risk of developing preeclampsia. To allow direct comparison of results, these
factors should ideally be taken into consideration and corrected for, which occurs as
part of the process of converting raw data values to MoM. The process of converting
raw data values to MoM originates from the method generated to normalise data from
laboratories analysing alpha-fetoprotein results (AFP) in the screening for neural tube
defects and has now become the established standard for reporting maternal serum
screening results (Palomaki and Neveux 2001). Converting raw data results to MoM is
not a straightforward process, involving time and expertise to undertake the necessary
calculations. This needs to be taken into consideration prior to potentially implementing
a screening test that requires MoM values.
Many similarities exist between multivariable screening for aneuploidy and
preeclampsia, including the importance of establishing the a priori risk and expressing
values that are entered into the model as MoM, allowing correction for gestation and
other significant maternal factors. Along with their similarities, differences also exist
between screening for aneuploidy and preeclampsia. For instance, a high-risk
aneuploidy screen result potentially exposes a patient to confirmation of the screening
result with an invasive procedure such as amniocentesis or chorionic-villus sampling,
with 0.5-1% chance of quoted pregnancy loss. A high false positive rate in this setting
would be unacceptable due to the risk of potential harm caused by such an invasive
diagnostic test. In contrast, a high-risk preeclampsia screen result may expose patients
to prophylactic therapy, with insignificant risk of harm, and enhanced surveillance, both
interventions currently offered to women deemed high-risk according to suboptimal
models that are currently based on preeclampsia risk estimation using maternal factors
alone. These traditional methods of screening have very high false positive rates, so
once again it can be argued that any potential increase in cost associated with screening
will likely reduce overall costs associated with unnecessary intervention and monitoring
235
for a significant number of patients who would most likely receive a negative result if
screened using a multivariable model.
For those receiving a false negative screening result for preeclampsia, harm may
potentially arise from not being commenced on early prophylactic therapy, however the
routine antenatal schedule of care provides ongoing opportunities for preeclampsia
surveillance in this case. This contrasts significantly from aneuploidy screening, where a
false negative screening result at a single screening opportunity provides false
reassurance, with the erroneous result only becoming apparent when a chromosomal
abnormality is suspected and definitively diagnosed after delivery.
It was confirmed that PlGF levels were significantly lower in patients who developed
preterm and early onset preeclampsia when tested between 18 and 22 weeks gestation,
compared with unaffected pregnancies (Table 15 and Figure 28, Chapter 3). As a single
test, PlGF showed good predictive performance for preterm and early onset
preeclampsia, with high sensitivity and NPV (Table 16, Chapter 3). When clinically
correlated with patient outcomes, the performance of the three immunoassay
platforms for the prediction of preeclampsia was very similar. High sensitivity in a
screening test for preeclampsia is paramount, as false negative results would prove
more detrimental than false positives.
There was no significant difference in sFlt1 values between patients who developed
early onset, preterm or term preeclampsia when compared with unaffected pregnancies
(Table 21, Chapter 4).
sFlt1/PlGF ratio values were significantly higher in patients with early onset
preeclampsia. For patients with preterm preeclampsia, sFlt1/PlGF ratio MoM values
were significantly higher, with no significant difference in raw data values between
patients who developed preeclampsia and unaffected pregnancies (Table 22, Chapter
4). Overall, both PlGF and the sFlt1/PlGF ratio for the prediction of preterm and early
onset preeclampsia across all platforms performed very well. Both sFlt1/PlGF ratio raw
data values using the cut-off for early onset PE and PlGF MoM values using the cut-off

236
for preterm PE showed very good predictive performance. When determining the most
superior test for the prediction of preeclampsia at midpregnancy, the Cobas sFlt1/PlGF
ratio using raw data values and the early PE cut-off was chosen, as it had the highest
AUC, sensitivity, specificity, PPV and NPV compared to the other tests, and significantly
fewer false positive results (Figure 53). For the prediction of preterm preeclampsia, PlGF
MoM had better clinical validity based on AUC and clinical characteristics compared with
sFlt1/PlGF ratio MoM, however following clinical correlation, their clinical performance
in our patient population was actually very similar. PlGF MoM using the cut-off for
preterm preeclampsia missed a case of early onset preeclampsia, which must be
considered a significant false negative. On these grounds, it may be safest to use
sFlt1/PlGF MoM values using the cut-off for preterm PE, in favour of minimising false
negative results (Figure 53). The decision as to which is the most useful test requires
further auditing of clinical outcomes to further determine clinical utility of both PlGF and
the sFlt1/PlGF ratio for the prediction of conditions arising from placental dysfunction.
If the primary aim is to predict early onset preeclampsia, at this stage it appears that the
Cobas sFlt1/PlGF ratio using raw data values and the early onset cut-off performs best
and is the superior test for this purpose. If the primary aim is to identify placental
dysfunction manifesting as various different pathologies, and potentially linking
preeclampsia with FGR and placental abruption, perhaps it is more beneficial, until the
clinical utilities of PlGF and sFlt1/PlGF ratio testing are better defined with ongoing
audits of clinical outcomes, to favour including false positive results that might capture
these additional adverse pregnancy outcomes. In this case, testing with PlGF raw data
values using the early onset PE cut-off and sFlt1/PlGF ratio MoM values using the
preterm PE cut-off may be preferred. With further understanding, “false positive”
results linked to preterm delivery and other adverse outcomes may be confirmed to be
associated with altered placental biomarkers, as an indicator for generalised placental
pathology, and may end up being labelled as “true positives”.

237
Figure 53. Clinical characteristics for the tests that perform best for the prediction of early onset and preterm preeclampsia
238
For the prediction of preterm FGR, PlGF MoM values using the preterm FGR cut-off
appeared to perform best (Table 28, Chapter 5).
It was determined that PlGF levels are significantly decreased and the sFlt1/PlGF ratio
significantly increased in patients who developed preterm preeclampsia and FGR, with
levels deviating further from normal with earlier gestation of onset of disease. For the
prediction of preterm preeclampsia and FGR, PlGF MoM values using the preterm PE
and FGR cut-off appeared to perform best (Table 30, Chapter 5).
It was not possible to isolate prediction of early onset preeclampsia from early onset
preeclampsia and FGR, as all 3 cases of early onset preeclampsia had coexisting FGR.
Hence, For the prediction of early onset preeclampsia and FGR, as with prediction of
early onset preeclampsia, the sFlt1/PlGF ratio using the early onset PE cut-off and the
Cobas platform performed best (Table 23, Chapter 4).
Screening for the development of preterm preeclampsia at midpregnancy using the
multivariable FMF algorithm, which incorporates maternal factors, MAP, UAPI and PlGF
MoM, gave superior performance when compared with screening using PlGF or the
sFlt1/PlGF ratio alone, with very high sensitivity, specificity and NPV, and a much higher
PPV than that obtained using biomarkers in isolation (Table 34, Chapter 6). In particular,
specificity and positive predictive values were improved using this method. Again,
addition of sFlt1 did not significantly improve the predictive performance of the
algorithm (Table 34, Chapter 6).
Based on these results, the use of PlGF and sFlt1/PlGF ratio in isolation for the prediction
of midpregnancy preeclampsia, and the use of PlGF MoM incorporated into a
multivariable algorithm are all effective and feasible options. The combination of
maternal factors, MAP, UAPI and PlGF MoM in the FMF multivariable algorithm had
superior performance for the prediction of preterm preeclampsia overall, however this
test requires significantly more resources to undertake, and this needs to be taken into
consideration. Use of the biomarkers in isolation, on the other hand, requires few
resources other than access to an appropriate immunoassay platform, reagents and

239
consumables, and potentially the resources to convert raw data values to MoM if
required.
The method chosen by any particular healthcare service would therefore be dependent
on their resources and would require cost-benefit analysis prior to implementation
7.2 Factors in implementation of PlGF or the sFlt1/PlGF ratio as screening tests
Preeclampsia remains a complex and multilayered syndrome that has presented many
challenges in terms of prediction, diagnosis and management for clinicians for decades.
In recent years, expansion of our knowledge and understanding regarding the
underlying pathophysiology for this condition has led to new methods of diagnostic and
screening tests aimed towards the underlying physiology of the condition rather than
testing for late end organ effects that are currently the “gold standard”. Periodic blood
pressure and proteinuria measurements are routinely collected in obstetric care.
Because of the long anecdotal history of use of blood pressure and urine protein
screening for preeclampsia screening, few studies have assessed their benefits and
harms, and there is no existing evidence to inform comparison among various screening
protocols using these tests. Blood pressure and urine protein testing have never been
validated as suitable predictive or diagnostic tests for preeclampsia, and both have low
positive predictive value for the detection of preeclampsia related adverse outcomes
(Zhang et al. 2001), yet these tests currently form the reference standard for screening
and diagnostic testing. It seems difficult to believe that currently there is no existing
evidence evaluating the effectiveness of these routine screening tests currently used in
identifying and guiding management in women with preeclampsia. There are no
proteinuria studies evaluating the accuracy of this test that have been conducted in a
general primary care setting in the screening of pregnant women (Henderson et al.
2017), with evidence regarding their performance mainly looking at their diagnostic
confirmation of patients who present with suspected preeclampsia. Results from these
studies do not translate to performance for routine screening for preeclampsia.
Similarly, currently no evidence exists evaluating the test accuracy of blood pressure
screening for identifying women at risk of preeclampsia. Partly this may hinge on the
fact that urine protein and blood pressure screening occur throughout pregnancy and
240
false positive results may lead to greater surveillance or further confirmatory testing,
which is not usually harmful. These tests are cheap and non-invasive to perform and
undertaking numerous tests over the course of pregnancy for the purpose of either
disproving a previous false positive or false negative result can occur easily and without
inconvenience or expense. Hence maximising single test performance for a cheap and
non-invasive test could be argued to have limited value (Henderson et al. 2017).
However, proteinuria is no longer essential for the diagnosis of preeclampsia, as stated
in the most recent ISSHP guidelines (Brown et al. 2018). Hence the role of urine protein
in the detection and diagnosis of preeclampsia with these new guidelines and our
understanding of the pathophysiology behind preeclampsia needs to be re-evaluated
and warrants consideration of different approaches to screening for women with
hypertension in the absence of proteinuria.
There has been great progress made in terms of establishing the clinical validity of
multivariable logistic regression models, including placental biomarkers, for the
prediction of first trimester preeclampsia (Poon et al. 2009; Wright et al. 2012; Oliveira
et al. 2014a; Oliveira et al. 2014b; O'Gorman et al. 2016; Park et al. 2013), and similarly,
the clinical validity of diagnostic testing and prognostic screening in patients
symptomatic for preeclampsia has been established (Zeisler et al. 2016a). The results
presented here support the clinical validity of using PlGF and the sFlt1/PlGF ratio for
screening for preterm and early onset preeclampsia at midpregnancy, particularly when
incorporated into the multivariable FMF algorithm. Within the last decade, a range of
fully automated immunoassay platforms which can measure sFlt1 and PlGF have
become commercially available. These machines have revolutionised testing for
placental biomarkers when compared with previous use of ELISA technology, as they
function quickly and easily, allowing standardised inexpensive measurement of samples
with high capacity and low turnaround time. Currently, use of PlGF and sFlt1/PlGF ratio
testing are not universally recommended for routine clinical use for preeclampsia
screening, but they are being used to guide clinical practice within various individual
centres throughout the world, particularly for diagnostic and prognostic testing in
patient who are symptomatic of preeclampsia. Undoubtedly their use will become
widespread among centres who have access to them, initially as a comparison to women

241
undertaking standard care, until an improvement in clinical outcomes when compared
with routine methods of screening and favourable cost-benefit analyses can be
demonstrated. Cost benefit analyses are essential prior to implementation, to ensure
that the cost of the screening test and subsequent testing and surveillance generated
from a high-risk result are balanced against the reduced costs incurred by current
methods of screening and surveillance and consequences of the primary condition.
As with many conditions that are screened for, preeclampsia is a relatively uncommon
disorder with a low pretest probability, which translates to a low positive predictive
value (PPV). The low PPV of midpregnancy screening tests for preeclampsia negatively
impacts on their clinical validity. In testing for early onset and preterm preeclampsia
within the patient population studied, the two tests with the best predictive
performance (sFlt1/PlGF ratio using Cobas platform for prediction of early onset
preeclampsia and sFlt1/PlGF MoM values using the cut-off for preterm preeclampsia
using any platform) displayed good sensitivity and specificity for the prediction of
preeclampsia, but had low PPV’s of 12.5% and 5.3-8.5%, respectively. These numbers
translate to having to perform close surveillance on 8 and between 12 and 20 patients,
respectively, in order to identify one case of early onset or preterm preeclampsia. These
numbers would need to be taken into consideration prior to implementing these tests
into clinical practice. Use of the multivariable FMF algorithm significantly improved both
specificity and PPV, with PPV’s between 22-24% for the three different platforms. This
translates to having to perform close surveillance on between 4 and 5 patients in order
to identify a case of preterm preeclampsia, which is a far more acceptable prospect.
Screening tests can be associated with harm for patients who undertake them, and
contingencies need to be made for these. When applied to patients being screened for
preeclampsia, the greatest risk is that patients receiving false negative results may
experience delays in diagnosis and treatment. In this aspect, routine antenatal care,
which requires patients to present for assessment on a regular basis, particularly in the
third trimester of pregnancy, lessens the likelihood of this, as routine screening of blood
pressure for hypertensive disorders of pregnancy occurs at each visit. Hence a false
negative screening result is not the only opportunity during the pregnancy to detect a

242
patient at increased risk for preeclampsia. Negative screening test results may lead to a
false sense of security and result in patients ignoring early symptoms, however, again,
with regular antenatal visits and objective blood pressure testing, there are ongoing
opportunities for screening. A false positive result can involve patients without disease
undergoing further testing or surveillance which may be uncomfortable, expensive,
inconvenient or potentially harmful. The increased surveillance resulting from a high-
risk screening test result would usually be in the form of increased antenatal visits,
potentially increased blood tests, fetal monitoring and ultrasound scans, none of which
should be deemed overtly unacceptable to patients. False positives may occasionally
lead to unnecessary treatment and may incur psychological consequences for patients
and family members. Significant harms stemming from preeclampsia risk assessment
have not been substantiated, and there is evidence suggesting no significant differences
in anxiety before and after risk categorisation as high or low risk based on screening
(Simeone et al. 2015).
Despite these potential risks, it is hoped that placental biomarker testing will be
integrated into clinical practice in the not too distant future, as it appears to be a simple,
effective approach that may assist clinicians in managing the risk of preeclampsia in a
better way.
Screening for preeclampsia at midpregnancy is not currently recommended by
international health authorities, such as the USPSTF, the UK National Screening
Authority and ISSHP (Meads et al. 2008; Henderson et al. 2017; Brown et al. 2018). The
USPSTF systematic review in 2017, which focused on multivariable prediction models,
had several reasons behind this recommendation. It was felt that there have been no
studies comparing the effectiveness of preeclampsia screening with that of an
unscreened population, which would better determine how screening for preeclampsia
might affect clinical outcomes. It is difficult to conceptualise that traditional methods of
screening, which have never been validated themselves for the purpose of preeclampsia
screening, are still used as the reference standard against which more recent screening
strategies are compared. Another criticism was that sensitivity of multivariable
prediction models was generally low (52-92%), with low PPVs (4-39%) (Henderson et al.

243
2017), giving no clear evidence of high performance or clinical benefits for any of the
externally validated models, with once again no randomised studies evaluating the
effects of these models in clinical practice when compared with usual care. The results
reported in this thesis using a multivariable prediction model show very good sensitivity
(100%) for the prediction of preterm preeclampsia, with PPV 22-24%, which is not an
unreasonable PPV for a condition with relatively low prevalence within the population.
The Royal Women’s Hospital, as one of the participating centres in the PROGNOSIS study
(Zeisler et al. 2016a), has recently commenced using the sFlt1/PlGF ratio to predict
preeclampsia in women who present with symptoms. A clinical audit and cost-benefit
analysis, comparing women undergoing sFlt1/PlGF testing with routine care (Jones
2017; Jones and Brennecke 2017) confirmed that this test was not only superior to
current tests for the prediction of preeclampsia, based on its very high negative
predictive value that was retained for up to three weeks after testing, but that it had a
favourable cost-benefit profile over tests that are currently performed. A similar large-
scale audit could possibly serve to justify the use of the sFlt1/PlGF ratio for the prediction
of preeclampsia from midpregnancy, prior to clinical implementation.
The USPSTF review was concerned that the predictive models they had reviewed had
not been appropriately externally validated and did not display appropriate
discrimination and calibration, with calibration referring to the relationship between
predicted probabilities and observed outcomes, used to evaluate model performance.
They also felt that the likely performance or clinical impact of these models had not been
fully determined. Concern was also expressed regarding the resource intensive nature
of using multivariable algorithms, and that a clear net benefit of using these prediction
models compared to usual practice needs to be clearly demonstrated prior to
implementation. As discussed in Chapter 6, within a large tertiary institution with access
to appropriate immunoassay platforms, sonographers who are appropriately trained in
measuring UAPI and staff who are sufficiently able to record maternal factors and MAP,
adequate resources should exist to implement this form of testing routinely. Pending
appropriate cost-benefit analyses, it seems highly likely that the costs and resources
associated with these tests which pose significantly lower false positive rates than
traditional methods of screening would prove proportional to the costs saved by

244
appropriate management of patients determined to be high-risk, with a potential
significant reduction in surveillance and monitoring in patients who have been
accurately reassured with negative screening. This sort of analysis would need to be
undertaken prior to implementation, but it is anticipated that the results would favour
the newer screening strategies over traditional ones.
Taking into account the results presented here and previous work in this field supporting
the clinical validity of sFlt1/PlGF ratio and PlGF testing for the prediction of preterm
preeclampsia, particularly when incorporated into a multivariable algorithm, it can only
be hoped that the recommendation against use of biomarkers and multivariable
screening algorithms for the prediction of preeclampsia is reviewed and changed in the
not too distant future.
7.3 Different pathophysiology for early onset and term preeclampsia
The results from this study support the belief that early onset preeclampsia appears to
be a separate disease entity to late onset preeclampsia. Within this patient cohort,
preterm and early onset preeclampsia were associated with progressively worse
outcomes in terms of gestational age and birthweight at delivery. In addition to this, the
incidence of coexisting FGR and preeclampsia in patients with early onset, preterm and
term preeclampsia was 100%, 62.5% and 0%, respectively. Early onset preeclampsia is
believed to stem from an entirely different pathophysiology to late onset preeclampsia
(Steegers et al. 2010; Staff et al. 2013a; Redman et al. 2014). Preeclampsia reflects an
underlying multisystem disorder, linked closely to maternal cardiovascular health
around the time of conception and during placental formation, with potential
consequences for the mother, fetus and placenta (von Dadelszen and Magee 2014).
Women who develop early onset preeclampsia, which is far more strongly associated
with comorbid growth restriction, predominantly do so in response to inadequate
placental perfusion, also referred to as “placental preeclampsia” (Roberts et al. 1989;
Redman et al. 1999; Redman and Sargent 2005; Burton et al. 2009; Staff et al. 2013a;
Redman et al. 2014). Placental preeclampsia is postulated to originate from the
incomplete remodelling of the placental spiral arteries, with consequent structural
deficiency and restricted uteroplacental flow leading to excessive oxidative
245
syncytiotrophoblast stress. This process results in release of placental biomarkers sFlt1
with resultant reduction in levels of PlGF into the maternal circulation which mount a
systemic inflammatory response, causing generalised endothelial dysfunction and
expression of the clinical phenotype consistent with the maternal syndrome of
preeclampsia (Redman et al. 1999; Redman and Sargent 2005; Burton et al. 2009;
Redman and Sargent 2010; Staff et al. 2013a). There is evidence confirming that women
with early onset placentally mediated preeclampsia are at increased risk of
cardiovascular disease and diabetes later in life (Staff et al. 2013a; Rasmussen et al.
2015) and in our patient cohort, women with early onset preeclampsia were more likely
to have increased BMI and a history of chronic hypertension, both risk factors for
cardiovascular disease. In addition, patients who developed coexisting preterm or early
onset preeclampsia and FGR had a significantly increased risk of Type 1 diabetes,
another risk factor for cardiovascular disease. Patients who develop preeclampsia at or
near term may do so as a result of pre-existing maternal conditions (Staff et al. 2013b).
“Maternal preeclampsia” appears to occur in the absence of significant placental
pathology, with predisposing medical conditions increasing maternal susceptibility to
endothelial dysfunction and the clinical phenotype of preeclampsia as a response to
factors released from a normal placenta (Ness and Roberts 1996; Redman and Sargent
2005; Roberts and Hubel 2009; Staff et al. 2013a). Maternal preeclampsia is more often
associated with late onset disease. Another theory behind the development of term
preeclampsia in otherwise uncomplicated pregnancies is that of increasing
syncytiotrophoblast (STB) stress as a result of the villous overcrowding, indicating that
the placental size has reached its functional limits (Redman et al. 2014). This results in
placental terminal villi becoming overcrowded with subsequent impeded intervillous
perfusion and increasing intervillous hypoxia and STB stress (Redman et al. 2014). There
is no predisposing pathology to this type of STB stress, so fetuses tend to be well grown,
typical of late onset preeclampsia. This model implies that all pregnant women may
eventually develop preeclampsia, but delivery precedes this event in the majority of
cases (Redman et al. 2014), and this pathophysiological model is consistent with patients
who developed term preeclampsia in the patient population studied here. Using
placental biomarkers to predict the development of late onset preeclampsia is hence
less effective compared to prediction of early onset preeclampsia as the occurrence of

246
STB stress is a late event. This may explain why placental biomarkers such as sFlt1 and
PlGF may have strong predictive value for early onset preeclampsia, with limited value
in predicting late onset disease (Andraweera et al. 2012). This was certainly the case
within the patient cohort studied here, with only a small proportion of term
preeclampsia cases being detected using PlGF and sFlt1/PlGF ratio testing, and none of
the patients with term preeclampsia developing placental pathology significant enough
to manifest as FGR. Of course, placental and maternal preeclampsia are on a spectrum
and there can be considerable overlap between them. Ultimately, the clinical phenotype
of preeclampsia is dependent on the maternal response to these placental processes,
which depends upon the potential presence of predisposing maternal factors and
different individual thresholds to mount a response against effects of placental
pathology, with or without released circulating placental factors (Redman et al. 2014).
Preeclampsia is a condition that appears to arise from multiple complex pathological
processes, with manifestations of the disease having extreme variation at both the
maternal and fetal level. There has been a lack of consensus until recent years regarding
definition and classification, leaving previous research in the area subject to inconsistent
results based on different criteria for diagnosis and classification. Given the advances in
understanding of the pathophysiology behind preeclampsia that has occurred in recent
decades, it remains a common aim for clinicians to have the capacity to predict and
diagnose preeclampsia based on pathophysiological processes specific to the disease,
rather than signs and symptoms of late stage end-organ manifestations. It is hoped that
once these tests are validated for routine use, we can expect not only a significant
improvement in the management of these high risk pregnancies, but in reliably
predicting who is likely to develop preeclampsia and other forms of placental
dysfunction, the knowledge gained about these conditions as a result of predictive
testing will provide valuable further insights into pathophysiology, which can then
translate to determining potential prophylactic and therapeutic remedies for this
complex and multifactorial condition.

247
7.4 Sources of interference with immunoassay results
Despite good correlation between results obtained from the three platforms, it was
observed that raw data results from the Cobas analyser appeared consistently higher
than the Kryptor, which were higher than the Delfia. Following assessment of limits of
agreement using Bland Altman plots (see Chapter 2), it was determined that since raw
data values between platforms were not directly comparable, specific reference ranges
for PlGF and sFlt1 should be generated for each platform. The reasons behind the
variation in raw data results between the platforms are most likely multifactorial.
Potential contributing factors include:
• interference from sample haemolysis, lipaemia, icterus, the effects of
anticoagulants and the effect of sample storage (Schiettecatte et al. 2012; Selby
1999).
• interferences that are analyte dependent include interaction of sample
components with reagent antibodies, with falsely elevated or lowered analyte
concentrations. This type of interference can lead to discordant results between
assay systems (Selby 1999; Tate and Ward 2004).
• slight differences in the antibodies and reagents supplied by individual
manufacturers
• interactions involving PlGF in the circulation and pericellular environment that
may alter PlGF function in vivo (Staff et al. 2013a)
• the existence of four different PlGF isoforms (PlGF 1-4) (Maglione et al. 1991;
Cao et al. 1997; Yang et al. 2003), each derived from different splicing of the
primary gene transcripts (Staff et al. 2013a). Uncertainty surrounds which of
these isoforms, if any, is most clinically relevant (Staff et al. 2013a). Local
concentrations of these molecules are extremely difficult to determine, and
subsequent local cellular consequences of binding are impossible to predict, due
to very complex interactions between free and bound PlGF molecules and other
angiogenic regulators (Staff et al. 2013a). Single-point measurement of serum or
plasma of any one of these components will be affected by all these complex
interactions.

248
• The existence of four different PlGF isoforms (PlGF 1-4) may also lead to cross
reactivity, which is the non-specific influence of substances in a sample that
structurally resemble the analyte and compete for a binding site on the antibody,
which could potentially result in over- or underestimation of analyte
concentration. Circulating PlGF in humans is predominantly PlGF 1, and the
immunoassays are mainly specific to PlGF 1, however the Delfia and Cobas
analysers both show some cross reactivity between PlGF isoforms 1 and 2, while
the Kryptor platform shows some cross reactivity between isoforms 1, 2 and 3.
Whether the different PlGF isoforms demonstrate different biological activity is
not certain and warrants further investigation.
• lower median results for the Delfia may occur as this platform is targeted best
towards first trimester testing for preeclampsia, with mean expected values
being lower on average than other platforms.
There may be more than one of these factors at play at any given time, making robust
predictions based on such assays problematic. These factors need to be taken into
consideration as a potential limitation of immunoassay-based tests.
7.5 Future Directions
There is no doubt that the complexity of preeclampsia and the variety of ways it can
present with regard to timing, signs and symptoms make it difficult to identify a highly
effective and broadly applicable risk assessment and screening strategy (Henderson et
al. 2017). The findings presented here show great promise for the use of placental
biomarkers for the effective prediction of preeclampsia when tested at midpregnancy.
Though the results indicate that clinical validity is superior when PlGF MoM values are
incorporated into the multivariable FMF algorithm, both the sFlt1/PlGF ratio and PlGF
used in isolation display robust clinical characteristics to indicate their value in screening
for preeclampsia at midpregnancy. Whilst use of multivariable algorithms might be
logistically and financially feasible in developed countries and within institutions with
plentiful resources, biomarker testing in isolation requires far fewer resources and could
be more feasible within healthcare settings with fewer resources, or within the
developing world.
249
Aligning with the shift in aneuploidy screening from the second trimester to the first
trimester in recent years, much of preeclampsia screening has now also been focused
on the first trimester. Multivariable algorithms have been validated to effectively predict
preeclampsia in the first trimester (Poon et al. 2009; Park et al. 2013; O'Gorman et al.
2016) and use of prophylactic aspirin in those deemed high risk has proven an effective
intervention to reduce preeclampsia risk in these women (Rolnik et al. 2017). However,
there is a substantial need for an effective screening strategy that can be accessed later
in pregnancy, for the vast number of women who, for a variety of reasons, do not
undergo or do not have access to first trimester screening using multivariable
algorithms.
At the Royal Women’s Hospital, antenatal bookings do not occur until 20 weeks
gestation on average, making this an appropriate time to undertake screening as part of
the first booking visit, hence midpregnancy was chosen as the gestation for screening
for this study. Identifying women that are high risk for preeclampsia at midpregnancy
has huge advantages over methods of screening currently used in everyday clinical
practice, which tend to detect preeclampsia only once symptoms arise. Relatively early
identification of pregnancies at risk would help optimise outcomes by allowing early
opportunities for transfer for tertiary care to obtain expert surveillance for maternal and
fetal complications of preterm, and particularly early onset preeclampsia, including
avoidance of unnecessary iatrogenic preterm deliveries. Early tertiary referral prior to
onset of symptoms would also facilitate appropriate and timely administration of
medications such as antihypertensives, MgSO4 and corticosteroids, as required (Wang
2009; Lapaire et al. 2010; Maynard and Karumanchi 2011; Rodriguez et al. 2016).
Antenatal care models could change quite significantly if we are able to determine
women at high risk for preeclampsia at midpregnancy in everyday practice (Litwinska et
al. 2018). For instance, those deemed to be high-risk for early onset preeclampsia could
have close surveillance arranged between 24 and 32 weeks gestation when they are at
greatest risk of developing symptoms and possibly requiring management and delivery.
Those determined to be at high-risk for preterm preeclampsia could be reassessed
around 32 weeks gestation and have a plan made for surveillance at that stage
250
(Litwinska et al. 2018). This would eliminate much of the ad hoc screening for
preeclampsia that currently occurs throughout gestation with blood pressure and urine
protein analysis. The exact timing and content of these surveillance visits would need to
be refined based on outcomes of ongoing audits of pregnancy outcomes, however
would allow the development of departmental protocols that are effective within
different patient populations. Possibly the most exciting aspect of being able to predict
who is likely to be affected by preeclampsia at midpregnancy is that future studies
looking at prophylactic and therapeutic agents, or additional predictive markers, can be
undertaken in this high-risk group (Roberts 2001; Lam et al. 2005; Grill et al. 2009; Wang
2009; Lapaire et al. 2010; Steegers et al. 2010; Maynard and Karumanchi 2011).
Outcomes of such studies have huge potential to improve our current understanding
and management of this complex disease (Figure 54).
While the manifestations of preeclampsia usually resolve within three months of
delivery, there is evidence that the condition poses a risk of long term maternal
cardiovascular consequences (Smith et al. 2009; Wang 2009; Warrington et al. 2013).
The increased cardiovascular mortality associated with preeclampsia has been observed
in both previously healthy women (Craici et al. 2008) and those with cardiovascular risk
factors, with aetiologies including the presence of preexisting risk factors, or potentially
residual vascular damage or persistent endothelial dysfunction caused by preeclampsia
in women without any underlying cardiovascular risk factors (Wang 2009). Hence
accurate screening for the condition could aid in identification of groups at greatest risk,
who would potentially benefit from public health strategies including lifestyle education
and intervention (Steegers et al. 2010) to optimise their risk following pregnancy, and
potentially facilitate further research into prophylactic and therapeutic strategies for
cardiovascular disease in these high-risk subjects (Staff et al. 2013a).
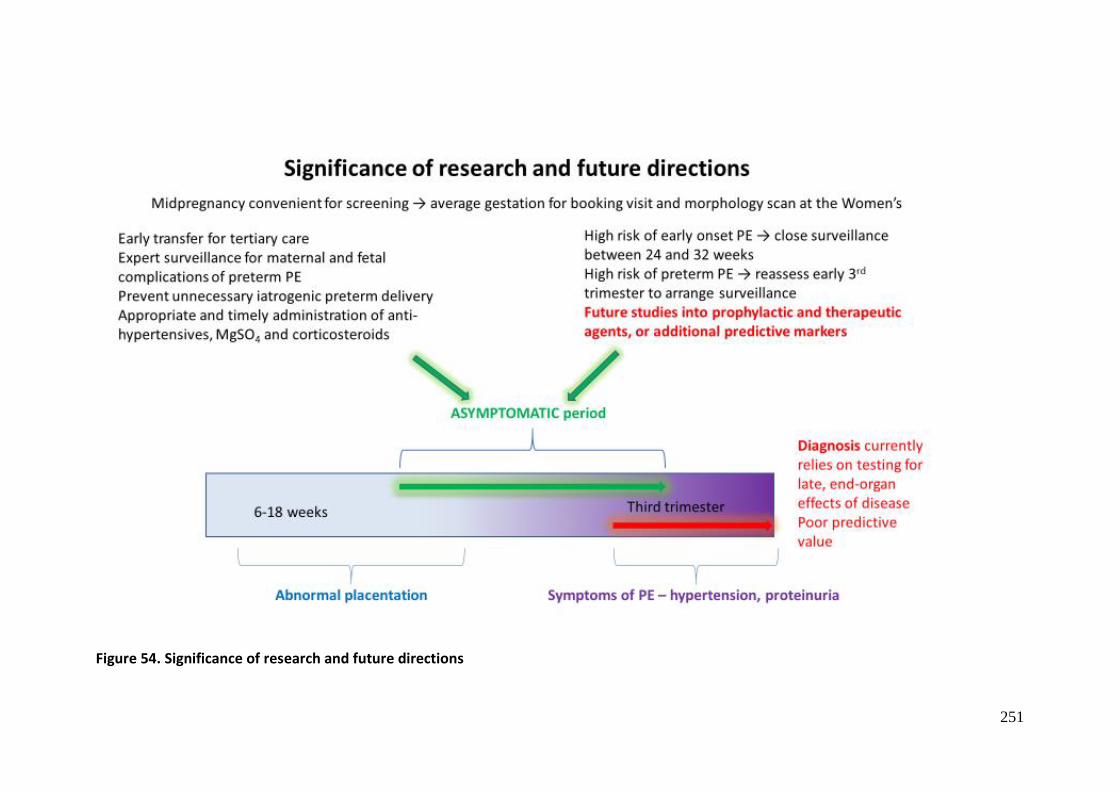
251
Figure 54. Significance of research and future directions

252
As reported in Chapter 5, it is very promising that PlGF in particular can effectively
predict women who are at increased risk of developing preterm FGR, both in the
absence of and with coexisting preeclampsia, when tested at midpregnancy. This finding
supports work on this topic from other groups in the literature and provides a jumping
board for further determination of the clinical utility of PlGF in this setting. Current
methods of screening for FGR are limited, with abdominal palpation and symphysio-
fundal height measurement both performing poorly in the prediction for FGR (Lindhard
et al. 1990). It would be extremely useful to determine whether incorporation of PlGF
into a multivariable algorithm might improve prediction rates further, with a view to
potentially screening for FGR and preeclampsia at the same time at midpregnancy
booking.
Currently, international health authorities (Meads et al. 2008; Henderson et al. 2017;
Brown et al. 2018) do not recommend screening for preeclampsia at midpregnancy
using placental biomarkers in isolation or as part of a multivariable algorithm. These
authorities each call for large prospective studies comparing patients who undergo
screening with those who undergo standard antenatal care, in order to confirm and
validate the findings from recent studies in the literature and to put into context exactly
how these tests should best be used and how they can optimise maternal and perinatal
outcomes. Should studies demonstrate that these screening methods are no worse than
the current established tests, and have advantages over current screening methods, this
evidence should be sufficient to recommend implementation into clinical practice. ISSHP
supports first trimester screening for preeclampsia when this can be integrated into the
local health system (Brown et al. 2018), although the cost effectiveness of this approach
remains to be established. ISSHP call for randomised controlled trials of “rule in” and
“rule out” tests which include a co-primary non-inferiority outcome of neonatal
morbidity because of the very real risk of earlier delivery in these women. A non-
inferiority trial should be designed to demonstrate that a new test is not worse than an
established test in terms of efficacy, and potentially preferable due to factors such as
lower cost, easier administration or less harm. These advantages can then be sufficient
to recommend implementation of the new test over its comparison. The use of co-
primary endpoints can be used when there is more than one primary endpoint

253
considered to be of equal clinical importance, with the study being declared successful
only if both primary endpoints are statistically significantly in favour of the intervention
being tested (Brown et al. 2018). ISSHP states that at this stage, no test should be used
routinely to “rule out” preeclampsia in clinical practice, though PlGF testing may prove
useful in selected groups in future studies. Taking into account the results presented
here and previous work in this field supporting the clinical validity of sFlt1/PlGF ratio and
PlGF testing for the prediction of preterm preeclampsia, particularly when incorporated
into a multivariable algorithm, it can only be hoped that this recommendation against
use of biomarkers and multivariable screening algorithms for the prediction of
preeclampsia is reviewed and changed in the not too distant future.
There is a gross lack of empiric evidence with regard to current antenatal screening
methods for preeclampsia, including blood pressure and urine protein analysis, which
form the reference standard (Zhang et al. 2001). The routine use of these tests has
continued given that they are now well established and are feasible in clinical practice
and are neither harmful nor expensive. Blood pressure and urine protein testing have
never been validated as suitable predictive or diagnostic tests for preeclampsia, and
both have low positive predictive value for the detection of preeclampsia related
adverse outcomes, yet these tests currently form the reference standard for screening
and diagnostic testing (Henderson et al. 2017). These tests have never really proven
their worth and given that there are now methods that have been proven to be more
effective, it can only be hoped that international health authorities review their
recommendations to support the newer screening strategies in everyday clinical
practice.
The recent confirmation that use of the FMF multivariable algorithm to predict preterm
preeclampsia (Al-Amin et al. 2018) performs far better than screening by maternal
factors alone according to the NICE and ACOG guidelines goes a long way towards
confirming that we are not currently optimising preeclampsia screening in light of the
knowledge we have.
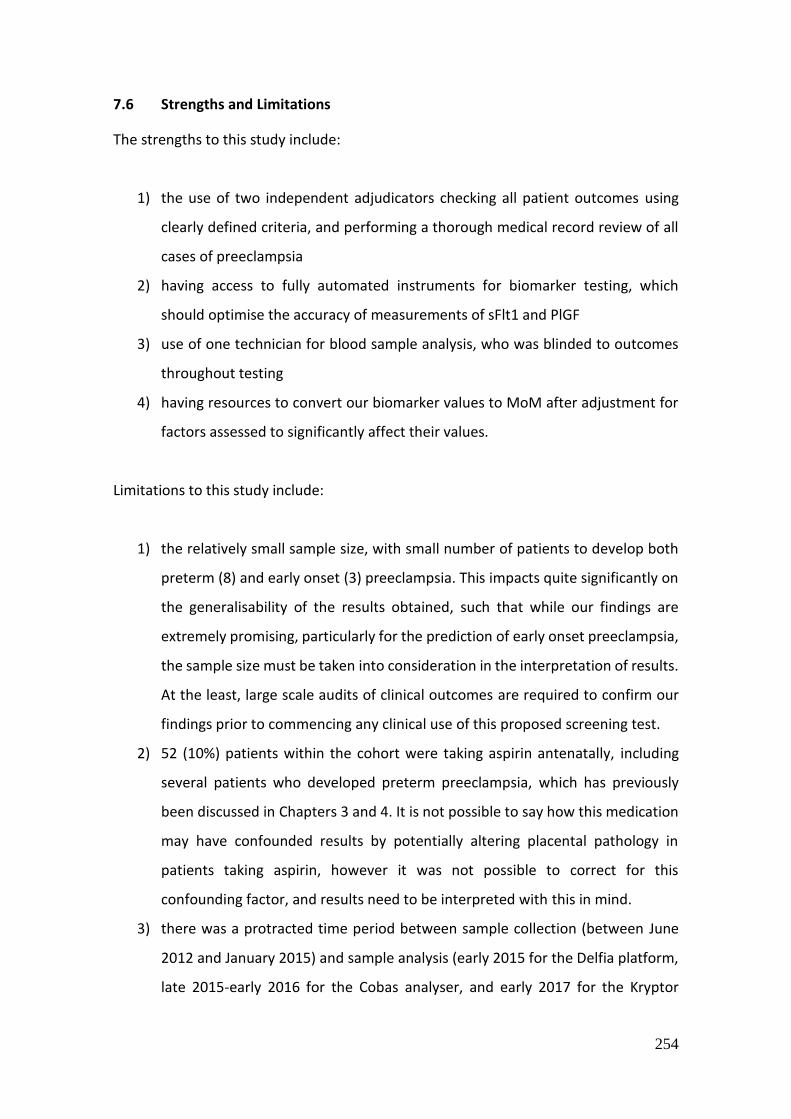
254
7.6 Strengths and Limitations
The strengths to this study include:
1) the use of two independent adjudicators checking all patient outcomes using
clearly defined criteria, and performing a thorough medical record review of all
cases of preeclampsia
2) having access to fully automated instruments for biomarker testing, which
should optimise the accuracy of measurements of sFlt1 and PlGF
3) use of one technician for blood sample analysis, who was blinded to outcomes
throughout testing
4) having resources to convert our biomarker values to MoM after adjustment for
factors assessed to significantly affect their values.
Limitations to this study include:
1) the relatively small sample size, with small number of patients to develop both
preterm (8) and early onset (3) preeclampsia. This impacts quite significantly on
the generalisability of the results obtained, such that while our findings are
extremely promising, particularly for the prediction of early onset preeclampsia,
the sample size must be taken into consideration in the interpretation of results.
At the least, large scale audits of clinical outcomes are required to confirm our
findings prior to commencing any clinical use of this proposed screening test.
2) 52 (10%) patients within the cohort were taking aspirin antenatally, including
several patients who developed preterm preeclampsia, which has previously
been discussed in Chapters 3 and 4. It is not possible to say how this medication
may have confounded results by potentially altering placental pathology in
patients taking aspirin, however it was not possible to correct for this
confounding factor, and results need to be interpreted with this in mind.
3) there was a protracted time period between sample collection (between June
2012 and January 2015) and sample analysis (early 2015 for the Delfia platform,
late 2015-early 2016 for the Cobas analyser, and early 2017 for the Kryptor
255
platform), which has meant a very long duration of frozen storage for these
samples. There is evidence in the literature that prolonged storage times do not
appear to significantly affect sFlt1 and PlGF levels (Law et al. 2010) and the
validation studies for this study, discussed in Chapter 2, confirmed this.
4) there were only plasma samples available for testing in some patients. This was
particularly an issue when using the Delfia platform, which does not accept
plasma samples, as addition of CaCl2 to these samples was required in order to
render them compatible with the Delfia platform, according to a previously
described technique (Tenland and Hillman 2013). Fortunately, correlation and
agreement between serum and plasma values was good, and results between
them appeared clinically equivalent. This aligns with other studies in the
literature (Tjoa et al. 2001), which is reassuring from the point of view of the
integrity of the results obtained, however it would have been preferable not to
have this variable involved.
5) due to having to put the samples through multiple platforms, there was an
unavoidable increase in the proportion of samples that had been previously
thawed for analysis with the second (Cobas analyser) and third (Kryptor)
immunoassay. Numerous freeze-thaw cycles did not appear to significantly alter
levels of PlGF, sFlt1 or sFlt1/PlGF ratio, consistent with a previous study (Cowans
et al. 2011). While this is reassuring, it would be preferable not to have this
variable involved.
7.7 Summary
PlGF and the sFlt1/PlGF ratio are promising markers for the prediction of early onset and
preterm preeclampsia. Within the patient cohort tested, the tests that performed best
in terms of clinical characteristics and correlation with clinical outcomes were the Cobas
sFlt1/PlGF ratio using the early PE cut-off, to predict early onset preeclampsia, and the
Cobas sFlt1/PlGF ratio MoM values using the preterm PE cut-off, to predict preterm
preeclampsia. These tests are easily reproducible, non-invasive, non-expensive and
require few resources other than access to an appropriate immunoassay platform and
consumables. These features make them feasible for a broad range of healthcare
settings. They display high sensitivities, though they are somewhat limited by low PPV

256
and relatively high false positive rates. Interestingly, a significant number of patients
with false positive results on testing underwent either preterm deliveries or adverse
outcomes, indicating that the scope of placental pathology able to be identified by these
tests needs to be defined further.
PlGF shows great promise for prediction of preterm FGR and both preeclampsia and
FGR. This is very good news as the accurate diagnosis of FGR antenatally and distinction
of this condition from SGA in order to limit potential exposure to unnecessary iatrogenic
preterm delivery is very challenging. A serum marker capable of stratifying patients into
high and low risk groups, with ongoing monitoring in the high-risk group, would aid
clinicians tremendously in optimising management for these pregnancies. Though there
are no preventative interventions available currently, reliable prediction of antenatal
FGR would allow testing for potential preventative interventions for pregnancies that
are deemed high risk. These results are limited by the small number of patients in this
study who developed preterm and early onset preeclampsia, and further studies or
large-scale audits of clinical outcomes to confirm these findings are required.
PlGF MoM values show great promise when included in a multivariable algorithm for
the prediction of preterm preeclampsia. Results here indicate that the addition of PlGF
MoM values to a multivariable algorithm which includes maternal factors, MAP and
UAPI for the prediction of preterm and early onset preeclampsia does not further
increase detection rates but does significantly reduce false positive rates. The addition
of serum PlGF MoM to this algorithm in patients tested at midpregnancy would incur
costs associated with collection and analysis of blood results, commercial immunoassay
machines and consumables. Whilst a formal cost-benefit analysis would need to be
performed, the significantly lower false positive rate incurred with the addition of PlGF
to the model, with the subsequent reduction in costs and resources from monitoring
patients with false positive results unnecessarily could quite possibly justify any cost
involved of addition of this biomarker to the algorithm.
257
As previously discussed, there was a group within our patient cohort that was high risk
for the development of preeclampsia or adverse pregnancy outcomes (see Chapter 3,
Section 3.3.1, Chapter 4, Section 4.3.1 and 4.4 and Appendix 1). The majority of these
patients (82%) had significant risk factor(s) for either the development of preeclampsia
or other adverse pregnancy outcomes. Within the scope of our current knowledge,
while it was appropriate for these patients to be taking low dose aspirin, including their
results into the study does introduce confounding factors, which need to be taken into
consideration when interpreting results from the study. There is no way of knowing how
the aspirin has ameliorated placental development in these patients, nor affected their
placental biomarker levels or clinical outcomes. It can only be presumed that there
would have been significantly more cases of preeclampsia or adverse outcomes within
our cohort had these high-risk women not taken aspirin antenatally, however there is
no benefit to speculating any further. This confounding factor would be expected to
exist in analysis of results from ongoing large-scale audits to further clarify the clinical
utility of placental biomarkers PlGF and sFlt1 for the midpregnancy prediction of
preeclampsia as with the current knowledge we have, it would not be ethically feasible
to withhold aspirin from women deemed high risk for either preeclampsia or other
adverse pregnancy outcomes outside the setting of a randomised control trial.
Second trimester pregnancy screening for preeclampsia is not currently recommended
by international health authorities (Meads et al. 2008; Henderson et al. 2017; Brown et
al. 2018). At this stage, the clinical utility of screening tests in this context in reducing
both maternal and perinatal morbidity and mortality have not yet been fully
determined. We are still in the process of defining exactly how testing for PlGF and the
sFlt1/PlGF ratio at midpregnancy should impact on clinical decision making and patient
outcomes, and how these tests may best be implemented into the everyday clinical
setting. At the least, a large-scale clinical audit comparing patients who undergo
screening for preeclampsia in midpregnancy to those undergoing standard care are
required to confirm and validate current findings and to put into context exactly how
these tests should best be used and how they can improve patient outcomes. It would
appear that if such studies are able to demonstrate that these screening methods do
not display worse performance than the current established tests, including blood

258
pressure and urine protein testing, and potentially have advantages over current
screening, this may be sufficient to recommend implementation in clinical practice. It
can be concluded that both PlGF and the sFlt1/PlGF ratio are promising markers for the
prediction of both early and preterm preeclampsia when used in isolation, and PlGF in
particular shows great promise when included in a multivariable algorithm for the
prediction of preterm preeclampsia. Ultimately the choice of test used for screening in
different healthcare settings will depend on screening performance within the patient
population screened, feasibility of implementation and cost-benefit analyses performed
prior to implementation (Gallo et al. 2016).

259
Bibliography
Akolekar, R., Syngelaki, A., Poon, L., Wright, D. and Nicolaides, K.H. (2013) 'Competing risks model in early screening for preeclampsia by biophysical and biochemical markers', Fetal Diagn Ther, 33(1), 8-15, available: http://dx.doi.org/10.1159/000341264.
Akolekar, R., Syngelaki, A., Sarquis, R., Zvanca, M. and Nicolaides, K.H. (2011)
'Prediction of early, intermediate and late pre-eclampsia from maternal factors, biophysical and biochemical markers at 11-13 weeks', Prenat Diagn, 31(1), 66-74, available: http://dx.doi.org/10.1002/pd.2660.
Akolekar, R., Zaragoza, E., Poon, L.C., Pepes, S. and Nicolaides, K.H. (2008) 'Maternal
serum placental growth factor at 11 + 0 to 13 + 6 weeks of gestation in the prediction of pre-eclampsia', Ultrasound Obstet Gynecol, 32(6), 732-39, available: http://dx.doi.org/10.1002/uog.6244.
Al-Amin, A., Rolnik, D.L., Black, C., White, A., Stolarek, C., Brennecke, S. and da Silva
Costa, F. (2018) 'Accuracy of second trimester prediction of preterm preeclampsia by three different screening algorithms', Aust N Z J Obstet Gynaecol, 58(2), 192-96, available: http://dx.doi.org/10.1111/ajo.12689.
Albaiges, G., Missfelder-Lobos, H., Lees, C., Parra, M. and Nicolaides, K.H. (2000) 'One-
stage screening for pregnancy complications by color Doppler assessment of the uterine arteries at 23 weeks' gestation', Obstet Gynecol, 96(4), 559-64, available: http://dx.doi.org/10.1016/S0029-7844(00)00946-7.
American College of Obstetricians and Gynecologists (ACOG). (2013) 'Hypertension in
pregnancy. Report of the American College of Obstetricians and Gynecologists' Task Force on Hypertension in Pregnancy', Obstet Gynecol, 122(5), 1122-31, available: http://dx.doi.org/10.1097/01.aog.0000437382.03963.88.
Andraweera, P.H., Dekker, G.A. and Roberts, C.T. (2012) 'The vascular endothelial
growth factor family in adverse pregnancy outcomes', Hum Reprod Update, 18(4), 436-57, available: http://dx.doi.org/10.1093/humupd/dms011.
Ansari, H., Singh, A., Zaidi, M.T. and Chandra, N. (2011) 'Vasculosyncytial membrane in
placental villi of normotensive and hypertensive pregnancies', J. Anat. Soc. India, 60(2), 168-70.
Askie, L.M., Duley, L., Henderson-Smart, D.J. and Stewart, L.A. (2007) 'Antiplatelet
agents for prevention of pre-eclampsia: a meta-analysis of individual patient data', Lancet, 369(9575), 1791-98, available: http://dx.doi.org/10.1016/s0140-6736(07)60712-0.

260
Australian Institute of Health and Welfare. (2017) 'Maternal deaths in Australia 2012–
2014', Cat. no. PER 92. Canberra: AIHW'. Bakalis, S., Peeva, G., Gonzalez, R., Poon, L.C. and Nicolaides, K.H. (2015) 'Prediction of
small-for-gestational-age neonates: screening by biophysical and biochemical markers at 30-34 weeks', Ultrasound Obstet Gynecol, 46(4), 446-51, available: http://dx.doi.org/10.1002/uog.14863.
Barker, D.J. (1995) 'Fetal origins of coronary heart disease', BMJ, 311(6998), 171-74. Barker, D.J. (2006) 'Adult consequences of fetal growth restriction', Clin Obstet
Gynecol, 49(2), 270-83. Barker, D.J., Eriksson, J.G., Forsen, T. and Osmond, C. (2002) 'Fetal origins of adult
disease: strength of effects and biological basis', Int J Epidemiol, 31(6), 1235-39, available:
http://dx.doi.org/10.1093/ije/31.6.1235. Barker, D.J., Gluckman, P.D., Godfrey, K.M., Harding, J.E., Owens, J.A. and Robinson,
J.S. (1993) 'Fetal nutrition and cardiovascular disease in adult life', Lancet, 341(8850), 938-41, available: http://dx.doi.org/10.1016/0140-6736(93)91224-A.
Benton, S.J., Hu, Y., Xie, F., Kupfer, K., Lee, S.W., Magee, L.A. and von Dadelszen, P.
(2011) 'Angiogenic factors as diagnostic tests for preeclampsia: a performance comparison between two commercial immunoassays', Am J Obstet Gynecol, 205(5), 469.e1-8, available: http://dx.doi.org/10.1016/j.ajog.2011.06.058.
Benton, S.J., Hu, Y., Xie, F., Kupfer, K., Lee, S.W., Magee, L.A. and von Dadelszen, P.
(2012) 'Can placental growth factor in maternal circulation identify fetuses with placental intrauterine growth restriction?', Am J Obstet Gynecol, 206(2), 163.e1-7, available: http://dx.doi.org/10.1016/j.ajog.2011.09.019.
Bersinger, N.A. and Odegard, R.A. (2004) 'Second- and third-trimester serum levels of
placental proteins in preeclampsia and small-for-gestational age pregnancies', Acta Obstet Gynecol Scand, 83(1), 37-45.
Bodnar, L.M., Tang, G., Ness, R.B., Harger, G. and Roberts, J.M. (2006)
'Periconceptional multivitamin use reduces the risk of preeclampsia', Am J Epidemiol, 164(5), 470-77, available: http://dx.doi.org/10.1093/aje/kwj218.
B·R·A·H·M·S PlGF PLUS KRYPTOR (Instructions for use). (2014) Hennigsdorf Germany:
Thermo Fisher Scientific. B·R·A·H·M·S sFlt-1 KRYPTOR (Instructions for use). (2014) Hennigsdorf Germany:
Thermo Fisher Scientific.

261
Brosens, I.A., Robertson, W.B. and Dixon, H.G. (1972) 'The role of the spiral arteries in
the pathogenesis of preeclampsia', Obstet Gynecol Annu, 1, 177-91. Brown, M.A. (2012) 'Pre-eclampsia: proteinuria in pre-eclampsia - does it matter any
more?', Nat Rev Nephrol, 8(10), 563-65, available: http://dx.doi.org/10.1038/nrneph.2012.190.
Brown, M.A., Lindheimer, M.D., de Swiet, M., Van Assche, A. and Moutquin, J.M.
(2001) 'The classification and diagnosis of the hypertensive disorders of pregnancy: statement from the International Society for the Study of Hypertension in Pregnancy (ISSHP)', Hypertens Pregnancy, 20(1), ix-xiv, available: http://dx.doi.org/10.1081/prg-100104165.
Brown, M.A., Magee, L.A., Kenny, L.C., Karumanchi, S.A., McCarthy, F.P., Saito, S., Hall,
D.R., Warren, C.E., Adoyi, G. and Ishaku, S. (2018) 'The hypertensive disorders of pregnancy: ISSHP classification, diagnosis & management recommendations for international practice', Pregnancy Hypertens, 72(1), 24-43, available: http://dx.doi.org/10.1016/j.preghy.2018.05.004.
Bujold, E., Roberge, S., Lacasse, Y., Bureau, M., Audibert, F., Marcoux, S., Forest, J.C.
and Giguere, Y. (2010) 'Prevention of preeclampsia and intrauterine growth restriction with aspirin started in early pregnancy: a meta-analysis', Obstet Gynecol, 116(2 Pt 1), 402-14, available: http://dx.doi.org/10.1097/AOG.0b013e3181e9322a.
Burton, G.J. and Jauniaux, E. (2004) 'Placental oxidative stress: from miscarriage to
preeclampsia', J Soc Gynecol Investig, 11(6), 342-52, available: http://dx.doi.org/10.1016/j.jsgi.2004.03.003.
Burton, G.J., Jauniaux, E. and Charnock-Jones, D.S. (2010) 'The influence of the
intrauterine environment on human placental development', Int J Dev Biol, 54(2-3), 303-11, available: http://dx.doi.org/10.1387/ijdb.082764gb.
Burton, G.J. and Tham, S.W. (1992) 'Formation of vasculo-syncytial membranes in the
human placenta', J Dev Physiol, 18(1), 43-47.
Burton, G.J., Yung, H.W., Cindrova-Davies, T. and Charnock-Jones, D.S. (2009) 'Placental endoplasmic reticulum stress and oxidative stress in the pathophysiology of unexplained intrauterine growth restriction and early onset preeclampsia', Placenta, 30 Suppl A, S43-48, available: http://dx.doi.org/10.1016/j.placenta.2008.11.003.
Cade, T.J., Gilbert, S.A., Polyakov, A. and Hotchin, A. (2012) 'The accuracy of spot urinary protein-to-creatinine ratio in confirming proteinuria in pre-eclampsia', Aust N Z J Obstet Gynaecol, 52(2), 179-82, available: http://dx.doi.org/10.1111/j.1479-828X.2011.01409.x.
262
Campbell, S., Diaz-Recasens, J., Griffin, D.R., Cohen-Overbeek, T.E., Pearce, J.M.,
Willson, K. and Teague, M.J. (1983) 'New doppler technique for assessing uteroplacental blood flow', Lancet, 1(8326 Pt 1), 675-77, available: http://dx.doi.org/10.1016/S0140-6736(83)91970-0.
Cao, Y., Chen, H., Zhou, L., Chiang, M.K., Anand-Apte, B., Weatherbee, J.A., Wang, Y.,
Fang, F., Flanagan, J.G. and Tsang, M.L. (1996) 'Heterodimers of placenta growth factor/vascular endothelial growth factor. Endothelial activity, tumor cell expression, and high affinity binding to Flk-1/KDR', J Biol Chem, 271(6), 3154-62, available: http://dx.doi.org/10.1074/jbc.271.6.3154.
Cao, Y., Ji, W.R., Qi, P., Rosin, A. and Cao, Y. (1997) 'Placenta growth factor:
identification and characterization of a novel isoform generated by RNA alternative splicing', Biochem Biophys Res Commun, 235(3), 493-98, available: http://dx.doi.org/10.1006/bbrc.1997.6813.
Caritis, S., Sibai, B., Hauth, J., Lindheimer, M.D., Klebanoff, M., Thom, E., VanDorsten,
P., Landon, M., Paul, R., Miodovnik, M., Meis, P. and Thurnau, G. (1998) 'Low-dose aspirin to prevent preeclampsia in women at high risk. National Institute of Child Health and Human Development Network of Maternal-Fetal Medicine Units', N Engl J Med, 338(11), 701-5, available: http://dx.doi.org/10.1056/nejm199803123381101.
Carter, A.M., Enders, A.C. and Pijnenborg, R. (2015) 'The role of invasive trophoblast in
implantation and placentation of primates', Phil Trans R Soc B, 370(1663), 20140070, available: http://dx.doi.org/10.1098/rstb.2014.0070.
Castellucci, M., Kosanke, G., Verdenelli, F., Huppertz, B. and Kaufmann, P. (2000)
'Villous sprouting: fundamental mechanisms of human placental development', Hum Reprod Update, 6(5), 485-94, available: http://dx.doi.org/10.1093/humupd/6.5.485.
Chaiworapongsa, T., Chaemsaithong, P., Korzeniewski, S.J., Yeo, L. and Romero, R.
(2014a) 'Pre-eclampsia part 2: prediction, prevention and management', Nat Rev Nephrol, 10(9), 531-40, available: http://dx.doi.org/10.1038/nrneph.2014.103.
Chaiworapongsa, T., Chaemsaithong, P., Yeo, L. and Romero, R. (2014b) 'Pre-eclampsia
part 1: current understanding of its pathophysiology', Nat Rev Nephrol, 10(8), 466-80, available: http://dx.doi.org/10.1038/nrneph.2014.102.
Chaiworapongsa, T., Romero, R., Espinoza, J., Bujold, E., Mee Kim, Y., Goncalves, L.F.,
Gomez, R. and Edwin, S. (2004) 'Evidence supporting a role for blockade of the vascular endothelial growth factor system in the pathophysiology of preeclampsia. Young Investigator Award', Am J Obstet Gynecol, 190(6), 1541-50, available: http://dx.doi.org/10.1016/j.ajog.2004.03.043.

263
Chaiworapongsa, T., Romero, R., Kim, Y.M., Kim, G.J., Kim, M.R., Espinoza, J., Bujold, E.,
Goncalves, L., Gomez, R., Edwin, S. and Mazor, M. (2005) 'Plasma soluble vascular endothelial growth factor receptor-1 concentration is elevated prior to the clinical diagnosis of pre-eclampsia', J Matern Fetal Neonatal Med, 17(1), 3-18, available: http://dx.doi.org/10.1080/14767050400028816.
Chan, P., Brown, M., Simpson, J.M. and Davis, G. (2005) 'Proteinuria in pre-eclampsia:
how much matters?', BJOG, 112(3), 280-85, available: http://dx.doi.org/10.1111/j.1471-0528.2004.00395.x.
Chappell, L.C., Duckworth, S., Seed, P.T., Griffin, M., Myers, J., Mackillop, L., Simpson,
N., Waugh, J., Anumba, D., Kenny, L.C., Redman, C.W. and Shennan, A.H. (2013) 'Diagnostic accuracy of placental growth factor in women with suspected preeclampsia: a prospective multicenter study', Circulation, 128(19), 2121-31, available: http://dx.doi.org/10.1161/circulationaha.113.003215.
Chappell, L.C., Seed, P.T., Briley, A.L., Kelly, F.J., Lee, R., Hunt, B.J., Parmar, K., Bewley,
S.J., Shennan, A.H., Steer, P.J. and Poston, L. (1999) 'Effect of antioxidants on the occurrence of pre-eclampsia in women at increased risk: a randomised trial', Lancet, 354(9181), 810-16, available: http://dx.doi.org/10.1016/s0140-6736(99)80010-5.
Clark, D.E., Smith, S.K., He, Y., Day, K.A., Licence, D.R., Corps, A.N., Lammoglia, R. and
Charnock-Jones, D.S. (1998a) 'A vascular endothelial growth factor antagonist is produced by the human placenta and released into the maternal circulation', Biol Reprod, 59(6), 1540-48, available: http://dx.doi.org/10.1095/biolreprod59.6.1540.
Clark, D.E., Smith, S.K., Licence, D., Evans, A.L. and Charnock-Jones, D.S. (1998b) 'Comparison of expression patterns for placenta growth factor, vascular endothelial growth factor (VEGF), VEGF-B and VEGF-C in the human placenta throughout gestation', J Endocrinol, 159(3), 459-67.
CLASP (Collaborative Low-dose Aspirin Study in Pregnancy) Collaborative Group. (1994)
'Collaborative Low-dose Aspirin Study in Pregnancy (CLASP): a randomised trial of low-dose aspirin for the prevention and treatment of pre-eclampsia among 9364 pregnant women', Lancet, 343(8898), 619-29.
Cnossen, J.S., Morris, R.K., ter Riet, G., Mol, B.W., van der Post, J.A., Coomarasamy, A.,
Zwinderman, A.H., Robson, S.C., Bindels, P.J., Kleijnen, J. and Khan, K.S. (2008a) 'Use of uterine artery Doppler ultrasonography to predict pre-eclampsia and intrauterine growth restriction: a systematic review and bivariable meta-analysis', CMAJ, 178(6), 701-11, available: http://dx.doi.org/10.1503/cmaj.070430.

264
Cnossen, J.S., Vollebregt, K.C., de Vrieze, N., ter Riet, G., Mol, B.W., Franx, A., Khan, K.S. and van der Post, J.A. (2008b) 'Accuracy of mean arterial pressure and blood pressure measurements in predicting pre-eclampsia: systematic review and meta-analysis', BMJ, 336(7653), 1117-20, available: http://dx.doi.org/10.1136/bmj.39540.522049.BE.
Cobas e 411 analyser, Operator’s Manual. (2010) Version 2.1. Roche Diagnostics
GmbH. Internal Data on File. See also www.cobas.com. Conde-Agudelo, A., Papageorghiou, A.T., Kennedy, S.H. and Villar, J. (2013) 'Novel
biomarkers for predicting intrauterine growth restriction: a systematic review and meta-analysis', BJOG, 120(6), 681-94, available: http://dx.doi.org/10.1111/1471-0528.12172.
Conde-Agudelo, A., Villar, J. and Lindheimer, M. (2004) 'World Health Organization
systematic review of screening tests for preeclampsia', Obstet Gynecol, 104(6), 1367-91, available: http://dx.doi.org/10.1097/01.AOG.0000147599.47713.5d.
Cowans, N.J., Alfthan, H., Stenman, U.H. and Spencer, K. (2011) 'Stability of first
trimester placental growth factor in serum and whole blood', Prenat Diagn, 31(12), 1193-97, available: http://dx.doi.org/10.1002/pd.2894.
Cowans, N.J., Kisanga, M., Khan, A. and Spencer, K. (2012) 'A comparison of two
immunoassay methods for the measurement of maternal serum placental growth factor in early pregnancy', Fetal Diagn Ther, 31(4), 254-59, available: http://dx.doi.org/10.1159/000336661.
Craici, I., Wagner, S. and Garovic, V.D. (2008) 'Preeclampsia and future cardiovascular
risk: formal risk factor or failed stress test?', Ther Adv Cardiovasc Dis, 2(4), 249-59, available: http://dx.doi.org/10.1177/1753944708094227.
Crispi, F., Llurba, E., Dominguez, C., Martin-Gallan, P., Cabero, L. and Gratacos, E. (2008) 'Predictive value of angiogenic factors and uterine artery Doppler for early- versus late-onset pre-eclampsia and intrauterine growth restriction', Ultrasound Obstet Gynecol, 31(3), 303-9, available: http://dx.doi.org/10.1002/uog.5184.
Cuckle, H., von Dadelszen, P. and Ghidini, A. (2013) 'Current controversies in prenatal
diagnosis 4: pregnancy complications due to placental vascular disease (pre-eclampsia, FGR): are we ready for prevention?', Prenat Diagn, 33(1), 17-20, available: http://dx.doi.org/10.1002/pd.4016.
de Jong, F., Monuteaux, M.C., van Elburg, R.M., Gillman, M.W. and Belfort, M.B. (2012)
'Systematic review and meta-analysis of preterm birth and later systolic blood pressure', Hypertension, 59(2), 226-34, available: http://dx.doi.org/10.1161/hypertensionaha.111.181784.
265
Dekker, G. and Sibai, B. (2001) 'Primary, secondary, and tertiary prevention of pre-eclampsia', Lancet, 357(9251), 209-15, available: http://dx.doi.org/10.1016/s0140-6736(00)03599-6.
DELFIA® Xpress PlGF 1-2-3 Kit Insert. (2014) 13907817-1 (en), PerkinElmer Inc. October
2014. DELFIA®Xpress 6000-0010, Training Manual. (2015) Version 1.4. Perkin Elmer GmbH.
See also www.perkinelmer.com. Demir, R., Kaufmann, P., Castellucci, M., Erbengi, T. and Kotowski, A. (1989) 'Fetal
vasculogenesis and angiogenesis in human placental villi', Acta Anat (Basel), 136(3), 190-203, available: http://dx.doi.org/10.1159/000146886.
Demir, R., Kayisli, U.A., Seval, Y., Celik-Ozenci, C., Korgun, E.T., Demir-Weusten, A.Y.
and Huppertz, B. (2004) 'Sequential expression of VEGF and its receptors in human placental villi during very early pregnancy: differences between placental vasculogenesis and angiogenesis', Placenta, 25(6), 560-72, available: http://dx.doi.org/10.1016/j.placenta.2003.11.011.
Diab, A.E., El-Behery, M.M., Ebrahiem, M.A. and Shehata, A.E. (2008) 'Angiogenic
factors for the prediction of pre-eclampsia in women with abnormal midtrimester uterine artery Doppler velocimetry', Int J Gynaecol Obstet, 102(2), 146-51, available: http://dx.doi.org/10.1016/j.ijgo.2008.02.016.
Douglas, K.A. and Redman, C.W. (1994) 'Eclampsia in the United Kingdom', BMJ,
309(6966), 1395-400, available: http://dx.doi.org/10.1136/bmj.309.6966.1395. Downs, K.M., Gifford, S., Blahnik, M. and Gardner, R.L. (1998) 'Vascularization in the
murine allantois occurs by vasculogenesis without accompanying erythropoiesis', Development, 125(22), 4507-20.
Duley, L., Henderson-Smart, D.J., Meher, S. and King, J.F. (2007) 'Antiplatelet agents for
preventing pre-eclampsia and its complications', Cochrane Database of Systematic Reviews, Issue 2. Art no: CD004659, available: http://dx.doi.org/10.1002/14651858.CD004659.pub2.
Elecsys® sFlt-1 and Elecsys® PlGF package inserts (2016). Roche Diagnostics
Documentation. Roche Diagnostics GmbH. Espinoza, J., Romero, R., Nien, J.K., Gomez, R., Kusanovic, J.P., Goncalves, L.F., Medina,
L., Edwin, S., Hassan, S., Carstens, M. and Gonzalez, R. (2007) 'Identification of patients at risk for early onset and/or severe preeclampsia with the use of uterine artery Doppler velocimetry and placental growth factor', Am J Obstet Gynecol, 196(4), 326.e1-13, available: http://dx.doi.org/10.1016/j.ajog.2006.11.002.

266
Faas, M.M., Spaans, F. and De Vos, P. (2014) 'Monocytes and macrophages in pregnancy and pre-eclampsia', Front Immunol, 5(298), 1-11, available: http://dx.doi.org/10.3389/fimmu.2014.00298.
Fadigas, C., Peeva, G., Mendez, O., Poon, L.C. and Nicolaides, K.H. (2015) 'Prediction of
small-for-gestational-age neonates: screening by placental growth factor and soluble fms-like tyrosine kinase-1 at 35-37 weeks', Ultrasound Obstet Gynecol, 46(2), 191-97, available: http://dx.doi.org/10.1002/uog.14862.
Ferrara, N., Houck, K.A., Jakeman, L.B., Winer, J. and Leung, D.W. (1991) 'The vascular
endothelial growth factor family of polypeptides', J Cell Biochem, 47(3), 211-18, available: http://dx.doi.org/10.1002/jcb.240470305.
Figueras, F. and Gratacos, E. (2014) 'Update on the diagnosis and classification of fetal growth restriction and proposal of a stage-based management protocol', Fetal Diagn Ther, 36(2), 86-98, available: http://dx.doi.org/10.1159/000357592.
Fisher, S.J. (2015) 'Why is placentation abnormal in preeclampsia?', Am J Obstet
Gynecol, 213(4 Suppl), S115-22, available: http://dx.doi.org/10.1016/j.ajog.2015.08.042.
Friedman, A.M. and Cleary, K.L. (2014) 'Prediction and prevention of ischemic placental
disease', Semin Perinatol, 38(3), 177-82, available: http://dx.doi.org/10.1053/j.semperi.2014.03.002.
Gallo, D.M., Wright, D., Casanova, C., Campanero, M. and Nicolaides, K.H. (2016)
'Competing risks model in screening for preeclampsia by maternal factors and biomarkers at 19-24 weeks' gestation', Am J Obstet Gynecol, 214(5), 619.e1-17, available: http://dx.doi.org/10.1016/j.ajog.2015.11.016.
Garcia-Tizon Larroca, S., Tayyar, A., Poon, L.C., Wright, D. and Nicolaides, K.H. (2014)
'Competing risks model in screening for preeclampsia by biophysical and biochemical markers at 30-33 weeks' gestation', Fetal Diagn Ther, 36(1), 9-17, available: http://dx.doi.org/10.1159/000362518.
Gerber, H.P., McMurtrey, A., Kowalski, J., Yan, M., Keyt, B.A., Dixit, V. and Ferrara, N.
(1998) 'Vascular endothelial growth factor regulates endothelial cell survival through the phosphatidylinositol 3'-kinase/Akt signal transduction pathway. Requirement for Flk-1/KDR activation', J Biol Chem, 273(46), 30336-43.
Ghosh, S.K., Raheja, S., Tuli, A., Raghunandan, C. and Agarwal, S. (2012) 'Serum PLGF as a potential biomarker for predicting the onset of preeclampsia', Arch Gynecol Obstet, 285(2), 417-22, available: http://dx.doi.org/10.1007/s00404-011-1960-4.
Ghosh, S.K., Raheja, S., Tuli, A., Raghunandan, C. and Agarwal, S. (2013) 'Is serum
placental growth factor more effective as a biomarker in predicting early onset

267
preeclampsia in early second trimester than in first trimester of pregnancy?', Arch Gynecol Obstet, 287(5), 865-73, available: http://dx.doi.org/10.1007/s00404-012-2662-2.
Ghulmiyyah, L. and Sibai, B. (2012) 'Maternal mortality from preeclampsia/eclampsia', Semin Perinatol, 36(1), 56-59, available: http://dx.doi.org/10.1053/j.semperi.2011.09.011.
Giguere, Y., Charland, M., Bujold, E., Bernard, N., Grenier, S., Rousseau, F., Lafond, J.,
Legare, F. and Forest, J.C. (2010) 'Combining biochemical and ultrasonographic markers in predicting preeclampsia: a systematic review', Clin Chem, 56(3), 361-75, available: http://dx.doi.org/10.1373/clinchem.2009.134080.
ECPPA (Estudo Colaborativo para Prevenção da Pré-eclampsia com Aspirina)
Collaborative Group. (1996) 'ECPPA: randomised trial of low dose aspirin for the prevention of maternal and fetal complications in high risk pregnant women'. BJOG, 103:39-47, available: http://dx.doi.org/10.1111/j.1471-0528.1996.tb09513.x.
Golding, J. (1998) 'A randomised trial of low dose aspirin for primiparae in pregnancy. The Jamaica Low Dose Aspirin Study Group', BJOG, 105(3), 293-99, available: http://dx.doi.org/10.1111/j.1471-0528.1998.tb10089.x.
Grill, S., Rusterholz, C., Zanetti-Dallenbach, R., Tercanli, S., Holzgreve, W., Hahn, S. and
Lapaire, O. (2009) 'Potential markers of preeclampsia - a review', Reprod Biol Endocrinol, 7, 70, available: http://dx.doi.org/10.1186/1477-7827-7-70.
Gruenwald, P. (1977) 'The development of the placental lobular pattern in the human.
Review and reinterpretation of the material', Obstet Gynecol, 49(6), 728-32.
Hadley, G.G. and Larson, N.L. (1953) 'Use of sequestrene as an anticoagulant', Am J Clin Pathol, 23(6), 613-18, available: http://dx.doi.org/10.1093/ajcp/23.6_ts.613.
Hartnack, S. (2014) 'Issues and pitfalls in method comparison studies', Vet Anaesth
Analg, 41(3), 227-32, available: http://dx.doi.org/10.1111/vaa.12143. Hassan, M.F., Rund, N.M. and Salama, A.H. (2013) 'An Elevated Maternal Plasma
Soluble fms-Like Tyrosine Kinase-1 to Placental Growth Factor Ratio at Midtrimester Is a Useful Predictor for Preeclampsia', Obstet Gynecol Int, 2013, Article ID 202346, 8 pages, available: http://dx.doi.org/10.1155/2013/202346.
Hauth, J.C., Ewell, M.G., Levine, R.J., Esterlitz, J.R., Sibai, B., Curet, L.B., Catalano, P.M.
and Morris, C.D. (2000) 'Pregnancy outcomes in healthy nulliparas who developed hypertension. Calcium for Preeclampsia Prevention Study Group', Obstet Gynecol, 95(1), 24-28, available: http://dx.doi.org/10.1016/S0029-7844(99)00462-7.

268
Henderson, J.T., Thompson, J.H., Burda, B.U., Cantor, A., Beil, T. and Whitlock, E.P. (2017) 'Screening for Preeclampsia: A Systematic Evidence Review for the U.S. Preventive Services Task Force', Evidence synthesis No. 148. AHRQ Publication No. 14-05211-EF-1. Rockville, MD: Agency for Healthcare Research and Quality.
Hernandez-Diaz, S., Werler, M.M., Louik, C. and Mitchell, A.A. (2002) 'Risk of
gestational hypertension in relation to folic acid supplementation during pregnancy', Am J Epidemiol, 156(9), 806-12, available: http://dx.doi.org/10.1093/aje/kwf129.
Hirashima, C., Ohkuchi, A., Arai, F., Takahashi, K., Suzuki, H., Watanabe, T., Kario, K.,
Matsubara, S. and Suzuki, M. (2005) 'Establishing reference values for both total soluble Fms-like tyrosine kinase 1 and free placental growth factor in pregnant women', Hypertens Res, 28(9), 727-32, available: http://dx.doi.org/10.1291/hypres.28.727.
Hofmeyr, G. J., Lawrie, T. A., Atallah, A. N., Duley, L., Torloni, M. R. (2014) ‘Calcium
supplementation during pregnancy for preventing hypertensive disorders and related problems’, Cochrane Database Syst Rev, Issue 6. Art. No.: CD001059. DOI: 10.1002/14651858.CD001059.pub4.
Homer, C.S., Brown, M.A., Mangos, G. and Davis, G.K. (2008) 'Non-proteinuric pre-
eclampsia: a novel risk indicator in women with gestational hypertension', J Hypertens, 26(2), 295-302, available: http://dx.doi.org/10.1097/HJH.0b013e3282f1a953.
Ilekis, J.V., Tsilou, E., Fisher, S., Abrahams, V.M., Soares, M.J., Cross, J.C., Zamudio, S., Illsley, N.P., Myatt, L., Colvis, C., Costantine, M.M., Haas, D.M., Sadovsky, Y., Weiner, C., Rytting, E. and Bidwell, G. (2016) 'Placental origins of adverse pregnancy outcomes: potential molecular targets: an Executive Workshop Summary of the Eunice Kennedy Shriver National Institute of Child Health and Human Development', Am J Obstet Gynecol, 215(1 Suppl), S1-S46, available: http://dx.doi.org/10.1016/j.ajog.2016.03.001.
Jacobsson, B., Ahlin, K., Francis, A., Hagberg, G., Hagberg, H. and Gardosi, J. (2008) 'Cerebral palsy and restricted growth status at birth: population-based case-control study', BJOG, 115(10), 1250-55, available: http://dx.doi.org/10.1111/j.1471-0528.2008.01827.x.
Jones, G. (2017) 'Comparing the sFlt-1/PlGF Ratio with other Biomarkers as a Predictive Test for Pre-Eclampsia: A Clinical Audit', unpublished MD Research Project, The Royal Womens Hospital Department of Maternal Fetal Medicine, Parkville, Victoria, Australia.
Jones, G., White, A. and Brennecke, S. (2017) 'Introduction of the sFlt-1/PlGF Ratio Test
for the Prediction of Preeclampsia in a Pregnancy Day Care Setting in an Australian Tertiary Perinatal Centre: A Budget Impact Assessment', Oral

269
Presentation at Society of Obstetric Medicine of Australia and New Zealand and Australasian Diabetes in Pregnancy Society Joint Scientific Meeting 2017.
Kaipainen, A., Korhonen, J., Pajusola, K., Aprelikova, O., Persico, M.G., Terman, B.I. and
Alitalo, K. (1993) 'The related FLT4, FLT1, and KDR receptor tyrosine kinases show distinct expression patterns in human fetal endothelial cells', J Exp Med, 178(6), 2077-88, available: http://dx.doi.org/10.1084/jem.178.6.2077.
Kane, S.C., Da Silva Costa, F. and Brennecke, S.P. (2014) 'New directions in the
prediction of pre-eclampsia', Aust N Z J Obstet Gynaecol, 54(2), 101-7, available: http://dx.doi.org/10.1111/ajo.12151.
Kar, M. (2014) 'Role of biomarkers in early detection of preeclampsia', J Clin Diagn Res, 8(4), BE01-04, available: http://dx.doi.org/10.7860/jcdr/2014/7969.4261.
Kaufmann, P., Mayhew, T.M. and Charnock-Jones, D.S. (2004) 'Aspects of human
fetoplacental vasculogenesis and angiogenesis. II. Changes during normal pregnancy', Placenta, 25(2-3), 114-26, available: http://dx.doi.org/10.1016/j.placenta.2003.10.009.
Kendall, R.L. and Thomas, K.A. (1993) 'Inhibition of vascular endothelial cell growth
factor activity by an endogenously encoded soluble receptor', Proc Natl Acad Sci USA, 90(22), 10705-9, available: http://dx.doi.org/10.1073/pnas.90.22.10705.
Kenneth, L., Hall, D.R., Gebhardt, S. and Grove, D. (2010) 'Late onset preeclampsia is not an innocuous condition', Hypertens Pregnancy, 29(3), 262-70, available: http://dx.doi.org/10.3109/10641950902777697.
Keyt, B.A., Nguyen, H.V., Berleau, L.T., Duarte, C.M., Park, J., Chen, H. and Ferrara, N.
(1996) 'Identification of vascular endothelial growth factor determinants for binding KDR and FLT-1 receptors. Generation of receptor-selective VEGF variants by site-directed mutagenesis', J Biol Chem, 271(10), 5638-46.
Khaliq, A., Dunk, C., Jiang, J., Shams, M., Li, X.F., Acevedo, C., Weich, H., Whittle, M.
and Ahmed, A. (1999) 'Hypoxia down-regulates placenta growth factor, whereas fetal growth restriction up-regulates placenta growth factor expression: molecular evidence for "placental hyperoxia" in intrauterine growth restriction', Lab Invest, 79(2), 151-70.
Khaliq, A., Li, X.F., Shams, M., Sisi, P., Acevedo, C.A., Whittle, M.J., Weich, H. and
Ahmed, A. (1996) 'Localisation of placenta growth factor (PIGF) in human term placenta', Growth Factors, 13(3-4), 243-50, available: http://dx.doi.org/10.3109/08977199609003225.

270
Khan, K.S., Wojdyla, D., Say, L., Gulmezoglu, A.M. and Van Look, P.F. (2006) 'WHO analysis of causes of maternal death: a systematic review', Lancet, 367(9516), 1066-74, available: http://dx.doi.org/10.1016/s0140-6736(06)68397-9.
Kienast, C., Moya, W., Rodriguez, O., Jijon, A. and Geipel, A. (2016) 'Predictive value of angiogenic factors, clinical risk factors and uterine artery Doppler for pre-eclampsia and fetal growth restriction in second and third trimester pregnancies in an Ecuadorian population', J Matern Fetal Neonatal Med, 29(4), 537-43, available: http://dx.doi.org/10.3109/14767058.2015.1012063.
Kim, S.Y., Ryu, H.M., Yang, J.H., Kim, M.Y., Han, J.Y., Kim, J.O., Chung, J.H., Park, S.Y.,
Lee, M.H. and Kim, D.J. (2007) 'Increased sFlt-1 to PlGF ratio in women who subsequently develop preeclampsia', J Korean Med Sci, 22(5), 873-77, available: http://dx.doi.org/10.3346/jkms.2007.22.5.873.
Kingdom, J., Huppertz, B., Seaward, G. and Kaufmann, P. (2000) 'Development of the
placental villous tree and its consequences for fetal growth', Eur J Obstet Gynecol Reprod Biol, 92(1), 35-43, available: http://dx.doi.org/10.1016/S0301-2115(00)00423-1.
Kleinrouweler, C.E., Wiegerinck, M.M., Ris-Stalpers, C., Bossuyt, P.M., van der Post,
J.A., von Dadelszen, P., Mol, B.W. and Pajkrt, E. (2012) 'Accuracy of circulating placental growth factor, vascular endothelial growth factor, soluble fms-like tyrosine kinase 1 and soluble endoglin in the prediction of pre-eclampsia: a systematic review and meta-analysis', BJOG, 119(7), 778-87, available: http://dx.doi.org/10.1111/j.1471-0528.2012.03311.x.
Krauss, T., Pauer, H.U. and Augustin, H.G. (2004) 'Prospective analysis of placenta
growth factor (PlGF) concentrations in the plasma of women with normal pregnancy and pregnancies complicated by preeclampsia', Hypertens Pregnancy, 23(1), 101-11, available: http://dx.doi.org/10.1081/prg-120028286.
Kumazaki, K., Nakayama, M., Suehara, N. and Wada, Y. (2002) 'Expression of vascular
endothelial growth factor, placental growth factor, and their receptors Flt-1 and KDR in human placenta under pathologic conditions', Hum Pathol, 33(11), 1069-77, available: http://dx.doi.org/10.1053/hupa.2002.129420.
Kusanovic, J.P., Romero, R., Chaiworapongsa, T., Erez, O., Mittal, P., Vaisbuch, E.,
Mazaki-Tovi, S., Gotsch, F., Edwin, S.S., Gomez, R., Yeo, L., Conde-Agudelo, A. and Hassan, S.S. (2009) 'A prospective cohort study of the value of maternal plasma concentrations of angiogenic and anti-angiogenic factors in early pregnancy and midtrimester in the identification of patients destined to develop preeclampsia', J Matern Fetal Neonatal Med, 22(11), 1021-38, available: http://dx.doi.org/10.3109/14767050902994754.

271
Lai, J., Syngelaki, A., Poon, L.C., Nucci, M. and Nicolaides, K.H. (2013) 'Maternal serum soluble endoglin at 30-33 weeks in the prediction of preeclampsia', Fetal Diagn Ther, 33(3), 149-55, available: http://dx.doi.org/10.1159/000343220.
Lam, C., Lim, K.H. and Karumanchi, S.A. (2005) 'Circulating angiogenic factors in the
pathogenesis and prediction of preeclampsia', Hypertension, 46(5), 1077-85, available: http://dx.doi.org/10.1161/01.HYP.0000187899.34379.b0.
Lambert-Messerlian, G., Eklund, E., Chien, E., Rosene-Montella, K., Neveux, L.,
Haddow, H., Palomaki, G. (2014) ‘Use of first or second trimester serum markers, or both, to predict preeclampsia’, Pregnancy Hypertens, 4(4), 271-78, available: http://dx.doi.org/10.1016/j.preghy.2014.07.001.
Lapaire, O., Shennan, A. and Stepan, H. (2010) 'The preeclampsia biomarkers soluble
fms-like tyrosine kinase-1 and placental growth factor: current knowledge, clinical implications and future application', Eur J Obstet Gynecol Reprod Biol, 151(2), 122-29, available: http://dx.doi.org/10.1016/j.ejogrb.2010.04.009.
Law, L.W., Sahota, D.S., Chan, L.W., Chen, M., Lau, T.K. and Leung, T.Y. (2010) 'Effect of long-term storage on placental growth factor and fms-like tyrosine kinase 1 measurements in samples from pregnant women', J Matern Fetal Neonatal Med, 23(12), 1475-80, available: http://dx.doi.org/10.3109/14767051003678242.
Lees, C. (2010) 'First-trimester screening for pre-eclampsia and fetal growth restriction: a test seeking both a treatment and an optimal timing', Ultrasound Obstet Gynecol, 35(6), 647-49, available: http://dx.doi.org/10.1002/uog.7686.
Leitner, Y., Fattal-Valevski, A., Geva, R., Eshel, R., Toledano-Alhadef, H., Rotstein, M.,
Bassan, H., Radianu, B., Bitchonsky, O., Jaffa, A.J. and Harel, S. (2007) 'Neurodevelopmental outcome of children with intrauterine growth retardation: a longitudinal, 10-year prospective study', J Child Neurol, 22(5), 580-87, available: http://dx.doi.org/10.1177/0883073807302605.
Lesmes, C., Gallo, D.M., Gonzalez, R., Poon, L.C. and Nicolaides, K.H. (2015) 'Prediction
of small-for-gestational-age neonates: screening by maternal serum biochemical markers at 19-24 weeks', Ultrasound Obstet Gynecol, 46(3), 341-49, available: http://dx.doi.org/10.1002/uog.14899.
Levine, R.J., Maynard, S.E., Qian, C., Lim, K.H., England, L.J., Yu, K.F., Schisterman, E.F.,
Thadhani, R., Sachs, B.P., Epstein, F.H., Sibai, B.M., Sukhatme, V.P. and Karumanchi, S.A. (2004) 'Circulating Angiogenic Factors and the Risk of Preeclampsia', N Engl J Med, 350(7), 672-83, available: http://dx.doi.org/10.1056/NEJMoa031884.

272
Levine, R.J. and Karumanchi, S.A. (2005) 'Circulating angiogenic factors in preeclampsia', Clin Obstet Gynecol, 48(2), 372-86, available: http://dx.doi.org/10.1097/01.grf.0000160313.82606.d7.
Levine, R.J., Lam, C., Qian, C., Yu, K.F., Maynard, S.E., Sachs, B.P., Sibai, B.M., Epstein,
F.H., Romero, R., Thadhani, R. and Karumanchi, S.A. (2006) 'Soluble endoglin and other circulating antiangiogenic factors in preeclampsia', N Engl J Med, 355(10), 992-1005, available: http://dx.doi.org/10.1056/NEJMoa055352.
Levine, T.A., Grunau, R.E., McAuliffe, F.M., Pinnamaneni, R., Foran, A. and Alderdice,
F.A. (2015) 'Early childhood neurodevelopment after intrauterine growth restriction: a systematic review', Pediatrics, 135(1), 126-41, available: http://dx.doi.org/10.1542/peds.2014-1143.
Lim, J.H., Kim, S.Y., Park, S.Y., Yang, J.H., Kim, M.Y. and Ryu, H.M. (2008) 'Effective
prediction of preeclampsia by a combined ratio of angiogenesis-related factors', Obstet Gynecol, 111(6), 1403-9, available: http://dx.doi.org/10.1097/AOG.0b013e3181719b7a.
Lindhard, A., Nielsen, P.V., Mouritsen, L.A., Zachariassen, A., Sorensen, H.U. and
Roseno, H. (1990) 'The implications of introducing the symphyseal-fundal height-measurement. A prospective randomized controlled trial', Br J Obstet Gynaecol, 97(8), 675-80, available: http://dx.doi.org/10.1111/j.1471-0528.1990.tb16237.
Litwinska, M., Syngelaki, A., Wright, A., Wright, D. and Nicolaides, K.H. (2018)
'Management of pregnancies after combined screening for pre-eclampsia at 19-24 weeks’gestation', Ultrasound Obstet Gynecol, Epub ahead of print, available: http://dx.doi.org/10.1002/uog.19099.
Litwinska, M., Wright, D., Efeturk, T., Ceccacci, I. and Nicolaides, K.H. (2017) 'Proposed
clinical management of pregnancies after combined screening for pre-eclampsia at 19-24 weeks' gestation', Ultrasound Obstet Gynecol, 50(3), 367-72, available: http://dx.doi.org/10.1002/uog.17418.
Lobmaier, S.M., Figueras, F., Mercade, I., Perello, M., Peguero, A., Crovetto, F., Ortiz,
J.U., Crispi, F. and Gratacos, E. (2014) 'Angiogenic factors vs Doppler surveillance in the prediction of adverse outcome among late-pregnancy small-for- gestational-age fetuses', Ultrasound Obstet Gynecol, 43(5), 533-40, available: http://dx.doi.org/10.1002/uog.13246.
Lowe, S.A., Bowyer, L., Lust, K., McMahon, L.P., Morton, M.R., North, R.A., Paech, M.J.
and Said, J.M. (2015) 'The SOMANZ Guidelines for the Management of Hypertensive Disorders of Pregnancy 2014', Aust N Z J Obstet Gynaecol, 55(1), 11-16, available: http://dx.doi.org/10.1111/ajo.12253.

273
Lyall, F., Robson, S.C. and Bulmer, J.N. (2013) 'Spiral artery remodeling and trophoblast invasion in preeclampsia and fetal growth restriction: relationship to clinical outcome', Hypertension, 62(6), 1046-54, available: http://dx.doi.org/10.1161/hypertensionaha.113.01892.
Madazli, R., Kuseyrioglu, B., Uzun, H., Uludag, S. and Ocak, V. (2005) 'Prediction of
preeclampsia with maternal mid-trimester placental growth factor, activin A, fibronectin and uterine artery Doppler velocimetry', Int J Gynecol Obstet, 89(3), 251-57, available: http://dx.doi.org/10.1016/j.ijgo.2005.02.008.
Maglione, D., Guerriero, V., Viglietto, G., Delli-Bovi, P. and Persico, M.G. (1991)
'Isolation of a human placenta cDNA coding for a protein related to the vascular permeability factor', Proc Natl Acad Sci USA, 88(20), 9267-71, available: available: http://dx.doi.org/10.1073/pnas.88.20.9267.
Maglione, D., Guerriero, V., Viglietto, G., Ferraro, M.G., Aprelikova, O., Alitalo, K., Del
Vecchio, S., Lei, K.J., Chou, J.Y. and Persico, M.G. (1993) 'Two alternative mRNAs coding for the angiogenic factor, placenta growth factor (PlGF), are transcribed from a single gene of chromosome 14', Oncogene, 8(4), 925-31.
Maltepe, E., Bakardjiev, A.I. and Fisher, S.J. (2010) 'The placenta: transcriptional,
epigenetic, and physiological integration during development', J Clin Invest, 120(4), 1016-25, available: http://dx.doi.org/10.1172/jci41211.
Mateus, J., Newman, R., Sibai, B.M., Li, Q., Barton, J.R., Combs, C.A., Guzman, E.,
Boggess, K.A., Gyamfi, C., von Dadelszen, P. and Woelkers, D. (2017) 'Massive Urinary Protein Excretion Associated with Greater Neonatal Risk in Preeclampsia', Am J Perinatol Rep, 7(1), e49-e58, available: http://dx.doi.org/10.1055/s-0037-1601866.
Maynard, S.E. and Karumanchi, S.A. (2011) 'Angiogenic factors and preeclampsia',
Semin Nephrol, 31(1), 33-46, available: http://dx.doi.org/10.1016/j.semnephrol.2010.10.004.
Maynard, S.E., Min, J.Y., Merchan, J., Lim, K.H., Li, J., Mondal, S., Libermann, T.A.,
Morgan, J.P., Sellke, F.W., Stillman, I.E., Epstein, F.H., Sukhatme, V.P. and Karumanchi, S.A. (2003) 'Excess placental soluble fms-like tyrosine kinase 1 (sFlt1) may contribute to endothelial dysfunction, hypertension, and proteinuria in preeclampsia', J Clin Invest, 111(5), 649-58, available: http://dx.doi.org/10.1172/jci17189.
Maynard, S.E., Venkatesha, S., Thadhani, R. and Karumanchi, S.A. (2005) 'Soluble Fms-
like tyrosine kinase 1 and endothelial dysfunction in the pathogenesis of preeclampsia', Pediatr Res, 57(5 Pt 2), 1R-7R, available: http://dx.doi.org/10.1203/01.Pdr.0000159567.85157.B7.

274
McCarthy, F.P., Gill, C., Seed, P.T., Bramham, K., Chappell, L.C. and Shennan, A.H. (2018) 'Performance of commercially available placental growth factor tests in women with suspected preterm pre-eclampsia; the COMPARE study', Ultrasound Obstet Gynecol, 2018/03/27. Advance online publication, available: http://dx.doi.org/10.1002/uog.19051.
McElrath, T.F., Lim, K.H., Pare, E., Rich-Edwards, J., Pucci, D., Troisi, R. and Parry, S.
(2012) 'Longitudinal evaluation of predictive value for preeclampsia of circulating angiogenic factors through pregnancy', Am J Obstet Gynecol, 207(5), 407.e1-e7, available: http://dx.doi.org/10.1016/j.ajog.2012.08.010.
Meads, C.A., Cnossen, J.S., Meher, S., Juarez-Garcia, A., ter Riet, G., Duley, L., Roberts,
T.E., Mol, B.W., van der Post, J.A., Leeflang, M.M., Barton, P.M., Hyde, C.J., Gupta, J.K. and Khan, K.S. (2008) 'Methods of prediction and prevention of pre-eclampsia: systematic reviews of accuracy and effectiveness literature with economic modelling', Health Technol Assess, 12(6), iii-xi, 1-270.
Misyura, M., Sukhai, M.A., Kulasignam, V., Zhang, T., Kamel-Reid, S. and Stockley, T.L.
(2018) 'Improving validation methods for molecular diagnostics: application of Bland-Altman, Deming and simple linear regression analyses in assay comparison and evaluation for next-generation sequencing', J Clin Pathol, 71(2), 117-24, available: http://dx.doi.org/10.1136/jclinpath-2017-204520.
M Kady, S., Gardosi, J. (2004) ‘Perinatal mortality and fetal growth restriction’, Best
Pract Res Clin Obstet Gynaecol 18(3), 397-410, available: http://dx.doi.org/10.1016/j.bpobgyn.2004.02.009
Moffett-King, A. (2002) 'Natural killer cells and pregnancy', Nat Rev Immunol, 2(9), 656-
63, available: http://dx.doi.org/10.1038/nri886. Moldenhauer, J.S., Stanek, J., Warshak, C., Khoury, J. and Sibai, B. (2003) 'The
frequency and severity of placental findings in women with preeclampsia are gestational age dependent', Am J Obstet Gynecol, 189(4), 1173-77, available: http://dx.doi.org/10.1067/S0002-9378(03)00576-3.
Moore Simas, T.A., Crawford, S.L., Solitro, M.J., Frost, S.C., Meyer, B.A. and Maynard,
S.E. (2007) 'Angiogenic factors for the prediction of preeclampsia in high-risk women', Am J Obstet Gynecol, 197(3), 244.e1-e8, available: http://dx.doi.org/10.1016/j.ajog.2007.06.030.
Murray, R. (2003) Harper's illustrated biochemistry New York: McGraw-Hill****. Myatt, L., Clifton, R.G., Roberts, J.M., Spong, C.Y., Wapner, R.J., Thorp, J.M. Jr., Mercer,
B.M., Peaceman, A.M., Ramin, S.M., Carpenter, M.W., Sciscione, A., Tolosa, J.E., Saade, G., Sorokin, Y. and Anderson, G.D. (2013) 'Can changes in angiogenic biomarkers between the first and second trimesters of pregnancy predict development of pre-eclampsia in a low-risk nulliparous patient population?',

275
BJOG, 120(10), 1183-91, available: http://dx.doi.org/10.1111/1471-0528.12128.
Myers, J.E., Kenny, L.C., McCowan, L.M., Chan, E.H., Dekker, G.A., Poston, L., Simpson, N.A. and North, R.A. (2013) 'Angiogenic factors combined with clinical risk factors to predict preterm pre-eclampsia in nulliparous women: a predictive test accuracy study', BJOG, 120(10), 1215-23, available: http://dx.doi.org/10.1111/1471-0528.12195.
National Heart Foundation of Australia. (2016) 'Guideline for the diagnosis and
management of hypertension in adults. ', National Heart Foundation of Australia.
National Institute for Health and Clinical Excellence (NICE) Clinical Guideline, No 107.
(2010) ‘Hypertension in Pregnancy: The Management of Hypertensive Disorders During Pregnancy’, National Collaborating Centre for Women’s and Children’s Health (UK), London: RCOG Press.
Ness, R.B. and Roberts, J.M. (1996) 'Heterogeneous causes constituting the single
syndrome of preeclampsia: a hypothesis and its implications', Am J Obstet Gynecol, 175(5), 1365-70, available: http://dx.doi.org/10.1016/S0002-9378(96)70056-X.
Ngene, N.C. and Moodley, J. (2018) 'Role of angiogenic factors in the pathogenesis and management of pre-eclampsia', Int J Gynecol Obstet, 141(1), 5-13, available: http://dx.doi.org/10.1002/ijgo.12424.
Noori, M., Donald, A.E., Angelakopoulou, A., Hingorani, A.D. and Williams, D.J. (2010)
'Prospective study of placental angiogenic factors and maternal vascular function before and after preeclampsia and gestational hypertension', Circulation, 122(5), 478-87, available: http://dx.doi.org/10.1161/circulationaha.109.895458.
North, R.A., McCowan, L.M., Dekker, G.A., Poston, L., Chan, E.H., Stewart, A.W., Black,
M.A., Taylor, R.S., Walker, J.J., Baker, P.N. and Kenny, L.C. (2011) 'Clinical risk prediction for pre-eclampsia in nulliparous women: development of model in international prospective cohort', BMJ, 342(d1875), 1-11, available: http://dx.doi.org/10.1136/bmj.d1875.
O'Gorman, N., Wright, D., Poon, L.C., Rolnik, D.L., Syngelaki, A., de Alvarado, M.,
Carbone, I.F., Dutemeyer, V., Fiolna, M., Frick, A., Karagiotis, N., Mastrodima, S., de Paco Matallana, C., Papaioannou, G., Pazos, A., Plasencia, W. and Nicolaides, K.H. (2017) 'Multicenter screening for pre-eclampsia by maternal factors and biomarkers at 11-13 weeks' gestation: comparison with NICE guidelines and ACOG recommendations', Ultrasound Obstet Gynecol, 49(6), 756-60, available: http://dx.doi.org/10.1002/uog.17455.
276
O'Gorman, N., Wright, D., Syngelaki, A., Akolekar, R., Wright, A., Poon, L.C. and Nicolaides, K.H. (2016) 'Competing risks model in screening for preeclampsia by maternal factors and biomarkers at 11-13 weeks gestation', Am J Obstet Gynecol, 214(1), 103.e1-e12, available: http://dx.doi.org/10.1016/j.ajog.2015.08.034.
Ohkuchi, A., Hirashima, C., Suzuki, H., Takahashi, K., Yoshida, M., Matsubara, S. and
Suzuki, M. (2010) 'Evaluation of a new and automated electrochemiluminescence immunoassay for plasma sFlt-1 and PlGF levels in women with preeclampsia', Hypertens Res, 33(5), 422-27, available: http://dx.doi.org/10.1038/hr.2010.15.
Oliveira, N., Doyle, L.E., Atlas, R.O., Jenkins, C.B., Blitzer, M.G. and Baschat, A.A.
(2014a) 'External validity of first-trimester algorithms in the prediction of pre-eclampsia disease severity', Ultrasound Obstet Gynecol, 44(3), 286-92, available: http://dx.doi.org/10.1002/uog.13433.
Oliveira, N., Magder, L.S., Blitzer, M.G. and Baschat, A.A. (2014b) 'First-trimester
prediction of pre-eclampsia: external validity of algorithms in a prospectively enrolled cohort', Ultrasound Obstet Gynecol, 44(3), 279-85, available: http://dx.doi.org/10.1002/uog.13435.
Ong, C.Y., Liao, A.W., Cacho, A.M., Spencer, K. and Nicolaides, K.H. (2001) 'First-
trimester maternal serum levels of placenta growth factor as predictor of preeclampsia and fetal growth restriction', Obstet Gynecol, 98(4), 608-11, available: http://dx.doi.org/10.1016/S0029-7844(01)01528-9.
Onwudiwe, N., Yu, C.K., Poon, L.C., Spiliopoulos, I. and Nicolaides, K.H. (2008)
'Prediction of pre-eclampsia by a combination of maternal history, uterine artery Doppler and mean arterial pressure', Ultrasound Obstet Gynecol, 32(7), 877-83, available: http://dx.doi.org/10.1002/uog.6124.
Pallotto, E.K. and Kilbride, H.W. (2006) 'Perinatal outcome and later implications of
intrauterine growth restriction', Clin Obstet Gynecol, 49(2), 257-69. Palm, M., Basu, S., Larsson, A., Wernroth, L., Akerud, H. and Axelsson, O. (2011) 'A
longitudinal study of plasma levels of soluble fms-like tyrosine kinase 1 (sFlt1), placental growth factor (PlGF), sFlt1: PlGF ratio and vascular endothelial growth factor (VEGF-A) in normal pregnancy', Acta Obstet Gynecol Scand, 90(11), 1244-51, available: http://dx.doi.org/10.1111/j.1600-0412.2011.01186.x.
Palomaki, G.E. and Neveux, L.M. (2001) 'Using multiples of the median to normalize
serum protein measurements', Clin Chem Lab Med, 39(11), 1137-45, available: http://dx.doi.org/10.1515/cclm.2001.180.
Papageorghiou, A.T., Yu, C.K., Bindra, R., Pandis, G. and Nicolaides, K.H. (2001)
'Multicenter screening for pre-eclampsia and fetal growth restriction by
277
transvaginal uterine artery Doppler at 23 weeks of gestation', Ultrasound Obstet Gynecol, 18(5), 441-49, available: http://dx.doi.org/10.1046/j.0960-7692.2001.00572.x.
Park, F.J., Leung, C.H., Poon, L.C., Williams, P.F., Rothwell, S.J. and Hyett, J.A. (2013)
'Clinical evaluation of a first trimester algorithm predicting the risk of hypertensive disease of pregnancy', Aust N Z J Obstet Gynaecol, 53(6), 532-39, available: http://dx.doi.org/10.1111/ajo.12126.
Park, H.J., Kim, S.H., Jung, Y.W., Shim, S.S., Kim, J.Y., Cho, Y.K., Farina, A., Zanello, M.,
Lee, K.J. and Cha, D.H. (2014) 'Screening models using multiple markers for early detection of late-onset preeclampsia in low-risk pregnancy', BMC Pregnancy Childbirth, 14(35), 1-11, available: http://dx.doi.org/10.1186/1471-2393-14-35.
Park, J.E., Chen, H.H., Winer, J., Houck, K.A. and Ferrara, N. (1994) 'Placenta growth
factor. Potentiation of vascular endothelial growth factor bioactivity, in vitro and in vivo, and high affinity binding to Flt-1 but not to Flk-1/KDR', J Biol Chem, 269(41), 25646-54.
Parra, M., Rodrigo, R., Barja, P., Bosco, C., Fernandez, V., Munoz, H. and Soto-Chacon,
E. (2005) 'Screening test for preeclampsia through assessment of uteroplacental blood flow and biochemical markers of oxidative stress and endothelial dysfunction', Am J Obstet Gynecol, 193(4), 1486-91, available: http://dx.doi.org/10.1016/j.ajog.2005.02.109.
Payne, B., Magee, L.A., Cote, A.M., Hutcheon, J.A., Li, J., Kyle, P.M., Menzies, J.M.,
Peter Moore, M., Parker, C., Pullar, B., von Dadelszen, P., Walters, B.N., von Dadelszen, P., Magee, L.A., Douglas, M.J., Walley, K.R., Russell, J.A., Lee, S.K., Gruslin, A., Smith, G.N., Cote, A.M., Moutquin, J.M., Brown, M.A., Davis, G., Walters, B.N., Sass, N., Duan, T., Zhou, J., Mahajan, S., Noovao, A., McCowan, L.A., Kyle, P., Moore, M.P., Bhutta, S.Z., Bhutta, Z.A., Hall, D.R., Steyn, D.W., Broughton Pipkin, F., Loughna, P., Robson, S., de Swiet, M., Walker, J.J., Grobman, W.A., Lindheimer, M.D., Roberts, J.M., Ansermino, J.M., Benton, S., Cundiff, G., Hugo, D., Joseph, K.S., Lalji, S., Li, J., Lott, P., Ouellet, A.B., Shaw, D., Still, D.K., Tawagi, G., Wagner, B., Biryabarema, C., Mirembe, F., Nakimuli, A., Tsigas, E., Merialdi, M. and Widmer, M. (2011) 'PIERS proteinuria: relationship with adverse maternal and perinatal outcome', J Obstet Gynaecol Can, 33(6), 588-97, available: http://dx.doi.org/10.1016/s1701-2163(16)34907-6.
Perales, A., Delgado, J.L., De La Calle, M., Garcia-Hernandez, J.A., Escudero, A.I.,
Campillos, J.M., Sarabia, M.D., Laiz, B., Duque, M., Navarro, M., Calmarza, P., Hund, M. and Alvarez, F.V. (2017) 'sFlt-1/PlGF for prediction of early-onset pre-eclampsia: STEPS (Study of Early Pre-eclampsia in Spain)', Ultrasound Obstet Gynecol, 50(3), 373-82, available: http://dx.doi.org/10.1002/uog.17373.
278
Persico, M.G., Vincenti, V. and DiPalma, T. (1999) 'Structure, expression and receptor-binding properties of placenta growth factor (PlGF)', Curr Top Microbiol Immunol, 237, 31-40.
Pijnenborg, R., Bland, J.M., Robertson, W.B. and Brosens, I. (1983) 'Uteroplacental
arterial changes related to interstitial trophoblast migration in early human pregnancy', Placenta, 4(4), 397-414, available: http://dx.doi.org/10.1016/S0143-4004(83)80043-5.
Pijnenborg, R., Vercruysse, L. and Hanssens, M. (2006) 'The uterine spiral arteries in
human pregnancy: facts and controversies', Placenta, 27(9-10), 939-58, available: http://dx.doi.org/10.1016/j.placenta.2005.12.006.
Pijnenborg, R., Vercruysse, L., Hanssens, M. and Brosens, I. (2011) 'Endovascular
trophoblast and preeclampsia: A reassessment', Pregnancy Hypertens, 1(1), 66-71, available: http://dx.doi.org/10.1016/j.preghy.2010.10.010.
Plasencia, W., Maiz, N., Bonino, S., Kaihura, C. and Nicolaides, K.H. (2007) 'Uterine
artery Doppler at 11 + 0 to 13 + 6 weeks in the prediction of pre-eclampsia', Ultrasound Obstet Gynecol, 30(5), 742-49, available: http://dx.doi.org/10.1002/uog.5157.
Polliotti, B.M., Fry, A.G., Saller, D.N., Mooney, R.A., Cox, C. and Miller, R.K. (2003) 'Second-trimester maternal serum placental growth factor and vascular endothelial growth factor for predicting severe, early-onset preeclampsia', Obstet Gynecol, 101(6), 1266-74, available: http://dx.doi.org/10.1016/S0029-7844(03)00338-7.
Poon, L.C., Akolekar, R., Lachmann, R., Beta, J. and Nicolaides, K.H. (2010a)
'Hypertensive disorders in pregnancy: screening by biophysical and biochemical markers at 11-13 weeks', Ultrasound Obstet Gynecol, 35(6), 662-70, available: http://dx.doi.org/10.1002/uog.7628.
Poon, L.C., Kametas, N.A., Chelemen, T., Leal, A. and Nicolaides, K.H. (2010b) 'Maternal
risk factors for hypertensive disorders in pregnancy: a multivariate approach', J Hum Hypertens, 24(2), 104-10, available: http://dx.doi.org/10.1038/jhh.2009.45.
Poon, L.C., Kametas, N.A., Maiz, N., Akolekar, R. and Nicolaides, K.H. (2009) 'First-
trimester prediction of hypertensive disorders in pregnancy', Hypertension, 53(5), 812-18, available: http://dx.doi.org/10.1161/hypertensionaha.108.127977.
Poon, L.C., Zaragoza, E., Akolekar, R., Anagnostopoulos, E. and Nicolaides, K.H. (2008)
'Maternal serum placental growth factor (PlGF) in small for gestational age pregnancy at 11(+0) to 13(+6) weeks of gestation', Prenat Diagn, 28(12), 1110-15, available: http://dx.doi.org/10.1002/pd.2143.
279
Poon, L.C., Zymeri, N.A., Zamprakou, A., Syngelaki, A. and Nicolaides, K.H. (2012) 'Protocol for measurement of mean arterial pressure at 11-13 weeks' gestation', Fetal Diagn Ther, 31(1), 42-48, available: http://dx.doi.org/10.1159/000335366.
Poston, L., Briley, A.L., Seed, P.T., Kelly, F.J. and Shennan, A.H. (2006) 'Vitamin C and
vitamin E in pregnant women at risk for pre-eclampsia (VIP trial): randomised placebo-controlled trial', Lancet, 367(9517), 1145-54, available: http://dx.doi.org/10.1016/s0140-6736(06)68433-x.
Powers, R.W., Roberts, J.M., Plymire, D.A., Pucci, D., Datwyler, S.A., Laird, D.M., Sogin,
D.C., Jeyabalan, A., Hubel, C.A. and Gandley, R.E. (2012) 'Low placental growth factor across pregnancy identifies a subset of women with preterm preeclampsia: type 1 versus type 2 preeclampsia?', Hypertension, 60(1), 239-46, available: http://dx.doi.org/10.1161/hypertensionaha.112.191213.
Pratt, A., Da Silva Costa, F., Borg, A.J., Kalionis, B., Keogh, R. and Murthi, P. (2015)
'Placenta-derived angiogenic proteins and their contribution to the pathogenesis of preeclampsia', Angiogenesis, 18(2), 115-23, available: http://dx.doi.org/10.1007/s10456-014-9452-3.
Rana, S., Karumanchi, S.A., Levine, R.J., Venkatesha, S., Rauh-Hain, J.A., Tamez, H. and
Thadhani, R. (2007) 'Sequential changes in antiangiogenic factors in early pregnancy and risk of developing preeclampsia', Hypertension, 50(1), 137-42, available: http://dx.doi.org/10.1161/hypertensionaha.107.087700.
Rana, S., Powe, C.E., Salahuddin, S., Verlohren, S., Perschel, F.H., Levine, R.J., Lim, K.H.,
Wenger, J.B., Thadhani, R. and Karumanchi, S.A. (2012) 'Angiogenic factors and the risk of adverse outcomes in women with suspected preeclampsia', Circulation, 125(7), 911-19, available: http://dx.doi.org/10.1161/circulationaha.111.054361.
Rasmussen, L.G., Lykke, J.A. and Staff, A.C. (2015) 'Angiogenic biomarkers in
pregnancy: defining maternal and fetal health', Acta Obstet Gynecol Scand, 94(8), 820-32, available: http://dx.doi.org/10.1111/aogs.12629.
Red-Horse, K., Kapidzic, M., Zhou, Y., Feng, K.T., Singh, H. and Fisher, S.J. (2005) 'EPHB4
regulates chemokine-evoked trophoblast responses: a mechanism for incorporating the human placenta into the maternal circulation', Development, 132(18), 4097-106, available: http://dx.doi.org/10.1242/dev.01971.
Redman, C.W., Sacks, G.P. and Sargent, I.L. (1999) 'Preeclampsia: an excessive
maternal inflammatory response to pregnancy', Am J Obstet Gynecol, 180(2 Pt 1), 499-506, available: http://dx.doi.org/10.1016/S0002-9378(99)70239-5.

280
Redman, C.W. and Sargent, I.L. (2003) 'Pre-eclampsia, the placenta and the maternal systemic inflammatory response--a review', Placenta, 24 (Suppl A), S21-S27, available: http://dx.doi.org/10.1053/plac.2002.0930
Redman, C.W. and Sargent, I.L. (2005) 'Latest advances in understanding
preeclampsia', Science, 308(5728), 1592-94, available: http://dx.doi.org/10.1126/science.1111726.
Redman, C.W. and Sargent, I.L. (2009) 'Placental stress and pre-eclampsia: a revised view', Placenta, 30 (Suppl A), S38-S42, available: http://dx.doi.org/10.1016/j.placenta.2008.11.021.
Redman, C.W. and Sargent, I.L. (2010) 'Immunology of pre-eclampsia', Am J Reprod
Immunol, 63(6), 534-43, available: http://dx.doi.org/10.1111/j.1600-0897.2010.00831.x.
Redman, C.W., Sargent, I.L. and Staff, A.C. (2014) 'IFPA Senior Award Lecture: making
sense of pre-eclampsia - two placental causes of preeclampsia?', Placenta, 35 (Suppl A), S20-S25, available: http://dx.doi.org/10.1016/j.placenta.2013.12.008.
Ribatti, D. (2008) 'The discovery of the placental growth factor and its role in
angiogenesis: a historical review', Angiogenesis, 11(3), 215-21, available: http://dx.doi.org/10.1007/s10456-008-9114-4.
Risau, W. and Flamme, I. (1995) 'Vasculogenesis', Annu Rev Cell Dev Biol, 11, 73-91, available: http://dx.doi.org/10.1146/annurev.cb.11.110195.000445.
Rizos, D., Eleftheriades, M., Karampas, G., Rizou, M., Haliassos, A., Hassiakos, D. and Vitoratos, N. (2013) 'Placental growth factor and soluble fms-like tyrosine kinase-1 are useful markers for the prediction of preeclampsia but not for small for gestational age neonates: a longitudinal study', Eur J Obstet Gynecol Reprod Biol, 171(2), 225-30, available: http://dx.doi.org/10.1016/j.ejogrb.2013.08.040.
Roberge, S., Bujold, E. and Nicolaides, K. (2018) 'Aspirin for the prevention of preterm
and term preeclampsia: systematic review and metaanalysis', Am J Obstet Gynecol, 218(3), 287.e1-93.e1, available: http://dx.doi.org/10.1016/j.ajog.2017.11.561
Roberge, S., Nicolaides, K., Demers, S., Hyett, J., Chaillet, N. and Bujold, E. (2017) 'The
role of aspirin dose on the prevention of preeclampsia and fetal growth restriction: systematic review and meta-analysis', Am J Obstet Gynecol, 216(2), 110.e6-20.e6, available: http://dx.doi.org/10.1016/j.ajog.2016.09.076.
Roberge, S., Nicolaides, K.H., Demers, S., Villa, P. and Bujold, E. (2013) 'Prevention of perinatal death and adverse perinatal outcome using low-dose aspirin: a meta-

281
analysis', Ultrasound Obstet Gynecol, 41(5), 491-99, available: http://dx.doi.org/10.1002/uog.12421.
Roberge, S., Villa, P., Nicolaides, K., Giguere, Y., Vainio, M., Bakthi, A., Ebrashy, A. and
Bujold, E. (2012) 'Early administration of low-dose aspirin for the prevention of preterm and term preeclampsia: a systematic review and meta-analysis', Fetal Diagn Ther, 31(3), 141-46, available: http://dx.doi.org/10.1159/000336662.
Roberts, D.J. and Post, M.D. (2008) 'The placenta in pre-eclampsia and intrauterine
growth restriction', J Clin Pathol, 61(12), 1254-60, available: http://dx.doi.org/10.1136/jcp.2008.055236.
Roberts, J.M. (2000) 'Preeclampsia: what we know and what we do not know', Semin Perinatol, 24(1), 24-28, available: http://dx.doi.org/10.1016/S0146-0005(00)80050-6.
Roberts, J.M. (2001) 'Preeclampsia: is there value in assessing before clinically evident
disease?', Obstet Gynecol, 98(4), 596-99. Roberts, J.M. and Hubel, C.A. (2009) 'The two stage model of preeclampsia: variations
on the theme', Placenta, 30 (Suppl A), S32-S37, available: http://dx.doi.org/10.1016/j.placenta.2008.11.009.
Roberts, J.M., Taylor, R.N., Musci, T.J., Rodgers, G.M., Hubel, C.A. and McLaughlin, M.K.
(1989) 'Preeclampsia: an endothelial cell disorder', Am J Obstet Gynecol, 161(5), 1200-4, available: http://dx.doi.org/10.1016/0002-9378(89)90665-0.
Rodesch, F., Simon, P., Donner, C. and Jauniaux, E. (1992) 'Oxygen measurements in endometrial and trophoblastic tissues during early pregnancy', Obstet Gynecol, 80(2), 283-5.
Rodriguez, A., Tuuli, M.G. and Odibo, A.O. (2016) 'First-, Second-, and Third-Trimester
Screening for Preeclampsia and Intrauterine Growth Restriction', Clin Lab Med, 36(2), 331-51, available: http://dx.doi.org/10.1016/j.cll.2016.01.007.
Rohra, D.K., Zeb, A., Qureishi, R.N., Azam, S.I., Khan, N.B., Zuberi, H.S. and Sikandar, R.
(2012) 'Prediction of pre-eclampsia during early pregnancy in primiparas with soluble fms-like tyrosine kinase-1 and placental growth factor', Natl Med J India, 25(2), 68-73.
Rolnik, D.L., Wright, D., Poon, L.C., O'Gorman, N., Syngelaki, A., de Paco Matallana, C.,
Akolekar, R., Cicero, S., Janga, D., Singh, M., Molina, F.S., Persico, N., Jani, J.C., Plasencia, W., Papaioannou, G., Tenenbaum-Gavish, K., Meiri, H., Gizurarson, S., Maclagan, K. and Nicolaides, K.H. (2017) 'Aspirin versus Placebo in Pregnancies at High Risk for Preterm Preeclampsia', N Engl J Med, 377(7), 613-22, available: http://dx.doi.org/10.1056/NEJMoa1704559.

282
Romero, R., Nien, J.K., Espinoza, J., Todem, D., Fu, W., Chung, H., Kusanovic, J.P., Gotsch, F., Erez, O., Mazaki-Tovi, S., Gomez, R., Edwin, S., Chaiworapongsa, T., Levine, R.J. and Karumanchi, S.A. (2008) 'A longitudinal study of angiogenic (placental growth factor) and anti-angiogenic (soluble endoglin and soluble vascular endothelial growth factor receptor-1) factors in normal pregnancy and patients destined to develop preeclampsia and deliver a small for gestational age neonate', J Matern Fetal Neonatal Med, 21(1), 9-23, available: http://dx.doi.org/10.1080/14767050701830480.
Salafia, C.M., Pezzullo, J.C., Ghidini, A., Lopez-Zeno, J.A. and Whittington, S.S. (1998)
'Clinical correlations of patterns of placental pathology in preterm pre-eclampsia', Placenta, 19(1), 67-72, available: http://dx.doi.org/10.1016/S0143-4004(98)90100-X.
Salafia, C.M., Pezzullo, J.C., Lopez-Zeno, J.A., Simmens, S., Minior, V.K. and Vintzileos, A.M. (1995) 'Placental pathologic features of preterm preeclampsia', Am J Obstet Gynecol, 173(4), 1097-105, available: http://dx.doi.org/10.1016/0002-9378(95)91333-5.
Sankar, K.D., Bhanu, P.S., Ramalingam, K., Kiran, S. and Ramakrishna, B.A. (2013) 'Histomorphological and morphometrical changes of placental terminal villi of normotensive and preeclamptic mothers', Anat Cell Biol, 46(4), 285-90, available: http://dx.doi.org/10.5115/acb.2013.46.4.285.
Savvidou, M.D., Yu, C.K., Harland, L.C., Hingorani, A.D. and Nicolaides, K.H. (2006) 'Maternal serum concentration of soluble fms-like tyrosine kinase 1 and vascular endothelial growth factor in women with abnormal uterine artery Doppler and in those with fetal growth restriction', Am J Obstet Gynecol, 195(6), 1668-73, available: http://dx.doi.org/10.1016/j.ajog.2006.03.065.
Schiettecatte, J., Anckaert, E. and Smitz, J. (2012) Interferences in Immunoassays,
Advances in Immunoassay Technology, Dr. Norman H. L. Chiu (Ed.), ISBN: 978-953-51-0440-7, InTech, Available from: http://www.intechopen.com/books/advances-in-immunoassay-technology/interference-in-immunoassays.
Schnettler, W.T., Dukhovny, D., Wenger, J., Salahuddin, S., Ralston, S.J. and Rana, S.
(2013) 'Cost and resource implications with serum angiogenic factor estimation in the triage of pre-eclampsia', BJOG, 120(10), 1224-32, available: http://dx.doi.org/10.1111/1471-0528.12259.
Selby, C. (1999) 'Interference in immunoassay', Ann Clin Biochem, 36 ( Pt 6), 704-21,
available: http://dx.doi.org/10.1177/000456329903600603. Shibuya, M. (2001) 'Structure and function of VEGF/VEGF-receptor system involved in
angiogenesis', Cell Struct Funct, 26(1), 25-35, available: http://dx.doi.org/10.1247/csf.26.25.

283
Shibuya, M. (2011) 'Vascular Endothelial Growth Factor (VEGF) and Its Receptor
(VEGFR) Signaling in Angiogenesis: A Crucial Target for Anti- and Pro-Angiogenic Therapies', Genes Cancer, 2(12), 1097-105, available: http://dx.doi.org/10.1177/1947601911423031.
Shibuya, M., Yamaguchi, S., Yamane, A., Ikeda, T., Tojo, A., Matsushime, H. and Sato,
M. (1990) 'Nucleotide sequence and expression of a novel human receptor-type tyrosine kinase gene (flt) closely related to the fms family', Oncogene, 5(4), 519-24.
Shim, S.S., Lee, C.H. and Jun, J.K. (2015) 'Midtrimester maternal plasma concentrations
of angiopoietin 1, angiopoietin 2, and placental growth factor in pregnant women who subsequently develop preeclampsia', Obstet Gynecol Sci, 58(1), 10-16, available: http://dx.doi.org/10.5468/ogs.2015.58.1.10.
Shokry, M., Bedaiwy, M.A., Fathalla, M.M., Alsemary, A., Elwakil, S. and Murphy, A.
(2010) 'Maternal serum placental growth factor and soluble fms-like tyrosine kinase 1 as early predictors of preeclampsia', Acta Obstet Gynecol Scand, 89(1), 143-46, available: http://dx.doi.org/10.3109/00016340903289892.
Shore, V.H., Wang, T.H., Wang, C.L., Torry, R.J., Caudle, M.R. and Torry, D.S. (1997)
'Vascular endothelial growth factor, placenta growth factor and their receptors in isolated human trophoblast', Placenta, 18(8), 657-65, available: http://dx.doi.org/10.1016/S0143-4004(97)90007-2.
Shweiki, D., Itin, A., Soffer, D. and Keshet, E. (1992) 'Vascular endothelial growth factor
induced by hypoxia may mediate hypoxia-initiated angiogenesis', Nature, 359(6398), 843-45, available: http://dx.doi.org/10.1038/359843a0.
Sibai, B., Caritis, S. and Hauth, J. (2003) 'What we have learned about preeclampsia',
Semin Perinatol, 27(3), 239-46, available: http://dx.doi.org/10.1016/S0146-0005(03)00022-3.
Sibai, B., Dekker, G. and Kupferminc, M. (2005) 'Pre-eclampsia', Lancet, 365(9461),
785-99, available: http://dx.doi.org/10.1016/s0140-6736(05)17987-2. Sibai, B.M. (2003) 'Diagnosis and management of gestational hypertension and
preeclampsia', Obstet Gynecol, 102(1), 181-92, available: http://dx.doi.org/
10.1016/S0029-7844(03)00475-7 Sibai, B.M. (2005) 'Diagnosis, prevention, and management of eclampsia', Obstet
Gynecol, 105(2), 402-10, available: http://dx.doi.org/10.1097/01.aog.0000152351.13671.99.
Sibai, B.M., Ramadan, M.K., Usta, I., Salama, M., Mercer, B.M. and Friedman, S.A.
(1993) 'Maternal morbidity and mortality in 442 pregnancies with hemolysis,
284
elevated liver enzymes, and low platelets (HELLP syndrome)', Am J Obstet Gynecol, 169(4), 1000-06, available: http://dx.doi.org/10.1016/0002-9378(93)90043-I
Simeone, S., Lojo, C., Garcia-Esteve, L., Triunfo, S., Crovetto, F., Arranz, A., Gratacos, E.
and Figueras, F. (2015) 'Psychological impact of first-trimester prevention for preeclampsia on anxiety', Prenat Diagn, 35(1), 60-64, available: http://dx.doi.org/10.1002/pd.4485.
Smith, G.N., Walker, M.C., Liu, A., Wen, S.W., Swansburg, M., Ramshaw, H., White,
R.R., Roddy, M. and Hladunewich, M. (2009) 'A history of preeclampsia identifies women who have underlying cardiovascular risk factors', Am J Obstet Gynecol, 200(1), 58.e1-51.e8, available: http://dx.doi.org/10.1016/j.ajog.2008.06.035.
Souka, A.P., Papastefanou, I., Pilalis, A., Michalitsi, V. and Kassanos, D. (2012)
'Performance of third-trimester ultrasound for prediction of small-for-gestational-age neonates and evaluation of contingency screening policies', Ultrasound Obstet Gynecol, 39(5), 535-42, available: http://dx.doi.org/10.1002/uog.10078.
Spinnato II, J.A., Freire, S., Pinto e Silva, J.L., Cunha Rudge, M.V., Martins-Costa, S.,
Koch, M.A., Goco, N., de Barros Santos, C., Cecatti, J.G., Costa, R., Ramos, J.G., Moss, N. and Sibai, B.M. (2007) 'Antioxidant therapy to prevent preeclampsia: a randomized controlled trial', Obstet Gynecol, 110(6), 1311-18, available: http://dx.doi.org/10.1097/01.AOG.0000289576.43441.1f.
Staff, A.C., Benton, S.J., von Dadelszen, P., Roberts, J.M., Taylor, R.N., Powers, R.W.,
Charnock-Jones, D.S. and Redman, C.W. (2013a) 'Redefining preeclampsia using placenta-derived biomarkers', Hypertension, 61(5), 932-42, available: http://dx.doi.org/10.1161/hypertensionaha.111.00250.
Staff, A.C., Braekke, K., Harsem, N.K., Lyberg, T. and Holthe, M.R. (2005) 'Circulating
concentrations of sFlt1 (soluble fms-like tyrosine kinase 1) in fetal and maternal serum during pre-eclampsia', Eur J Obstet Gynecol Reprod Biol, 122(1), 33-39, available: http://dx.doi.org/10.1016/j.ejogrb.2004.11.015.
Staff, A.C., Dechend, R. and Redman, C.W. (2013b) 'Review: Preeclampsia, acute
atherosis of the spiral arteries and future cardiovascular disease: two new hypotheses', Placenta, 34 (Suppl A), S73-S78, available: http://dx.doi.org/10.1016/j.placenta.2012.11.022.
Steegers, E.A., von Dadelszen, P., Duvekot, J.J. and Pijnenborg, R. (2010) 'Pre-
eclampsia', Lancet, 376(9741), 631-44, available: http://dx.doi.org/10.1016/s0140-6736(10)60279-6.

285
Stepan, H., Unversucht, A., Wessel, N. and Faber, R. (2007) 'Predictive value of maternal angiogenic factors in second trimester pregnancies with abnormal uterine perfusion', Hypertension, 49(4), 818-24, available: http://dx.doi.org/10.1161/01.HYP.0000258404.21552.a3.
Su, Y.N., Lee, C.N., Cheng, W.F., Shau, W.Y., Chow, S.N. and Hsieh, F.J. (2001)
'Decreased maternal serum placenta growth factor in early second trimester and preeclampsia', Obstet Gynecol, 97(6), 898-904, available: http://dx.doi.org/10.1016/S0029-7844(01)01341-2.
Sunderji, S., Gaziano, E., Wothe, D., Rogers, L.C., Sibai, B., Karumanchi, S.A. and
Hodges-Savola, C. (2010) 'Automated assays for sVEGF R1 and PlGF as an aid in the diagnosis of preterm preeclampsia: a prospective clinical study', Am J Obstet Gynecol, 202(1), 40.e1-e7, available: http://dx.doi.org/10.1016/j.ajog.2009.07.025.
Tanaka, K., Yamaguchi, S., Sawano, A. and Shibuya, M. (1997) 'Characterization of the
extracellular domain in vascular endothelial growth factor receptor-1 (Flt-1 tyrosine kinase)', Jpn J Cancer Res, 88(9), 867-76, available: http://dx.doi.org/10.1111/j.1349-7006.1997.tb00463.x
Tate, J. and Ward, G. (2004) 'Interferences in immunoassay', Clin Biochem Rev, 25(2),
105-20. Taylor, R.N., Grimwood, J., Taylor, R.S., McMaster, M.T., Fisher, S.J. and North, R.A.
(2003) 'Longitudinal serum concentrations of placental growth factor: evidence for abnormal placental angiogenesis in pathologic pregnancies', Am J Obstet Gynecol, 188(1), 177-82, available: http://dx.doi.org/10.1067/mob.2003.111
Tenland, E. and Hillman, M. (2013) 'Adding calcium to EDTA plasma samples prior to
analysis could solve the compatibility issue in commercially available ELISAs that are standardized for serum', Clin Chem Lab Med, 51(7), e145-e147, available: http://dx.doi.org/10.1515/cclm-2012-0724.
Thadhani, R., Mutter, W.P., Wolf, M., Levine, R.J., Taylor, R.N., Sukhatme, V.P., Ecker, J.
and Karumanchi, S.A. (2004) 'First trimester placental growth factor and soluble fms-like tyrosine kinase 1 and risk for preeclampsia', J Clin Endocrinol Metab, 89(2), 770-75, available: http://dx.doi.org/10.1210/jc.2003-031244.
ThermoScientific BRAHMS Kryptor Compact Plus, User Manual. (2013) Version 6. Thermo Fisher Scientific BRAHMS GmbH. See also thermoscientific.com/brahms.
Tidwell, S.C., Ho, H.N., Chiu, W.H., Torry, R.J. and Torry, D.S. (2001) 'Low maternal
serum levels of placenta growth factor as an antecedent of clinical preeclampsia', Am J Obstet Gynecol, 184(6), 1267-72, available: http://dx.doi.org/10.1067/mob.2001.113129.
286
Tjoa, M.L., van Vugt, J.M., Mulders, M.A., Schutgens, R.B., Oudejans, C.B. and van Wijk, I.J. (2001) 'Plasma placenta growth factor levels in midtrimester pregnancies', Obstet Gynecol, 98(4), 600-07, available: http://dx.doi.org/10.1016/S0029-7844(01)01497-1.
Torry, D.S., Ahn, H., Barnes, E.L. and Torry, R.J. (1999) 'Placenta growth factor: potential role In pregnancy', Am J Reprod Immunol, 41(1), 79-85, available: http://dx.doi.org/10.1111/j.1600-0897.1999.tb00078. Tranquilli, A.L., Dekker, G., Magee, L., Roberts, J., Sibai, B.M., Steyn, W., Zeeman, G.G.
and Brown, M.A. (2014) 'The classification, diagnosis and management of the hypertensive disorders of pregnancy: A revised statement from the ISSHP', Pregnancy Hypertens, 4(2), 97-104, available: http://dx.doi.org/10.1016/j.preghy.2014.02.001.
Unal, E.R., Robinson, C.J., Johnson, D.D. and Chang, E.Y. (2007) 'Second-trimester
angiogenic factors as biomarkers for future-onset preeclampsia', Am J Obstet Gynecol, 197(2), 211.e1-211.e4, available: http://dx.doi.org/10.1016/j.ajog.2007.05.022.
van Helden, J. and Weiskirchen, R. (2015) 'Analytical evaluation of the novel soluble
fms-like tyrosine kinase 1 and placental growth factor assays for the diagnosis of preeclampsia', Clin Biochem, 48(16-17), 1113-19, available: http://dx.doi.org/10.1016/j.clinbiochem.2015.06.020.
Varvarigou, A.A. (2010) 'Intrauterine growth restriction as a potential risk factor for
disease onset in adulthood', J Pediatr Endocrinol Metab, 23(3), 215-24, available: http://dx.doi.org/10.1515/JPEM.2010.23.3.215
Velauthar, L., Plana, M.N., Kalidindi, M., Zamora, J., Thilaganathan, B., Illanes, S.E.,
Khan, K.S., Aquilina, J. and Thangaratinam, S. (2014) 'First-trimester uterine artery Doppler and adverse pregnancy outcome: a meta-analysis involving 55,974 women', Ultrasound Obstet Gynecol, 43(5), 500-07, available: http://dx.doi.org/10.1002/uog.13275.
Verghese, L., Alam, S., Beski, S., Thuraisingham, R., Barnes, I. and MacCallum, P. (2012)
'Antenatal screening for pre-eclampsia: evaluation of the NICE and pre-eclampsia community guidelines', J Obstet Gynaecol, 32(2), 128-31, available: http://dx.doi.org/10.3109/01443615.2011.635224.
Verlohren, S., Galindo, A., Schlembach, D., Zeisler, H., Herraiz, I., Moertl, M.G., Pape, J.,
Dudenhausen, J.W., Denk, B. and Stepan, H. (2010) 'An automated method for the determination of the sFlt-1/PIGF ratio in the assessment of preeclampsia', Am J Obstet Gynecol, 202(2), 161.e1-161.e11, available: http://dx.doi.org/10.1016/j.ajog.2009.09.016.
287
Verlohren, S., Herraiz, I., Lapaire, O., Schlembach, D., Moertl, M., Zeisler, H., Calda, P.,
Holzgreve, W., Galindo, A., Engels, T., Denk, B. and Stepan, H. (2012) 'The sFlt-1/PlGF ratio in different types of hypertensive pregnancy disorders and its prognostic potential in preeclamptic patients', Am J Obstet Gynecol, 206(1), 58.e1-58.e8, available: http://dx.doi.org/10.1016/j.ajog.2011.07.037.
von Dadelszen, P. and Magee, L.A. (2014) 'Pre-eclampsia: an update', Curr Hypertens
Rep, 16(8), 454, p1-14, available: http://dx.doi.org/10.1007/s11906-014-0454-8.
von Dadelszen, P., Magee, L.A. and Roberts, J.M. (2003) 'Subclassification of preeclampsia', Hypertens Pregnancy, 22(2), 143-48, available: http://dx.doi.org/10.1081/prg-120021060.
Vuorela, P., Hatva, E., Lymboussaki, A., Kaipainen, A., Joukov, V., Persico, M.G., Alitalo,
K. and Halmesmaki, E. (1997) 'Expression of vascular endothelial growth factor and placenta growth factor in human placenta', Biol Reprod, 56(2), 489-94.
available: http://dx.doi.org/10.1095/biolreprod56.2.489 Walker, J.J. (2000) 'Pre-eclampsia', Lancet, 356(9237), 1260-65, available:
http://dx.doi.org/10.1016/s0140-6736(00)02800-2.
Wang, A., Rana, S. and Karumanchi, S.A. (2009) 'Preeclampsia: the role of angiogenic factors in its pathogenesis.', Physiology, 24(3), 147-58, available:
http://dx.doi.org/10.1152/physiol.00043.2008. Warrington, J.P., George, E.M., Palei, A.C., Spradley, F.T. and Granger, J.P. (2013)
'Recent advances in the understanding of the pathophysiology of preeclampsia', Hypertension, 62(4), 666-73, available: http://dx.doi.org/10.1161/hypertensionaha.113.00588.
Wen, S.W., Champagne, J., Rennicks White, R., Coyle, D., Fraser, W., Smith, G.,
Fergusson, D. and Walker, M.C. (2013) 'Effect of folic acid supplementation in pregnancy on preeclampsia: the folic acid clinical trial study', J Pregnancy, Article ID 294312, p1-9, available: http://dx.doi.org/10.1155/2013/294312.
Wen, S.W., Chen, X.K., Rodger, M., White, R.R., Yang, Q., Smith, G.N., Sigal, R.J.,
Perkins, S.L. and Walker, M.C. (2008) 'Folic acid supplementation in early second trimester and the risk of preeclampsia', Am J Obstet Gynecol, 198(1), 45.e1-45.e7, available: http://dx.doi.org/10.1016/j.ajog.2007.06.067.
Wen, S.W., Guo, Y., Rodger, M., White, R.R., Yang, Q., Smith, G.N., Perkins, S.L. and
Walker, M.C. (2016) 'Folic Acid Supplementation in Pregnancy and the Risk of Pre-Eclampsia-A Cohort Study', PLoS One, 11(2), e0149818, available: http://dx.doi.org/10.1371/journal.pone.0149818.

288
Westgard, J.O., Barry, P.L., Hunt, M.R. and Groth, T. (1981) 'A multi-rule Shewhart chart for quality control in clinical chemistry', Clin Chem, 27(3), 493-501.
Wheeler, T., Elcock, C.L. and Anthony, F.W. (1995) 'Angiogenesis and the placental
environment', Placenta, 16(3), 289-96, available: http://dx.doi.org/doi.org/10.1016/0143-4004(95)90115-9.
Widmer, M., Villar, J., Benigni, A., Conde-Agudelo, A., Karumanchi, S.A. and
Lindheimer, M. (2007) 'Mapping the theories of preeclampsia and the role of angiogenic factors: a systematic review', Obstet Gynecol, 109(1), 168-80, available: http://dx.doi.org/10.1097/01.AOG.0000249609.04831.7c.
Wilson, J. and Jungner, G. (1968) 'Principles and Practice of Screening for Disease',
Public Health Papers, No.34. World Health Organization, Geneva. World Health Organization (WHO). (2011) WHO Recommendations for Prevention and
Treatment of Pre-Eclampsia and Eclampsia, p1-38, available: www.who.int/reproductivehealth/publications/maternal_perinatal_health/9789241548335/en/index.html.
Wortelboer, E.J., Koster, M.P., Cuckle, H.S., Stoutenbeek, P.H., Schielen, P.C. and
Visser, G.H. (2010) 'First-trimester placental protein 13 and placental growth factor: markers for identification of women destined to develop early-onset pre-eclampsia', BJOG, 117(11), 1384-89, available: http://dx.doi.org/10.1111/j.1471-0528.2010.02690.x.
Wright, D., Akolekar, R., Syngelaki, A., Poon, L.C. and Nicolaides, K.H. (2012) 'A
competing risks model in early screening for preeclampsia', Fetal Diagn Ther, 32(3), 171-78, available: http://dx.doi.org/10.1159/000338470.
Wright, D., Syngelaki, A., Akolekar, R., Poon, L.C. and Nicolaides, K.H. (2015)
'Competing risks model in screening for preeclampsia by maternal characteristics and medical history', Am J Obstet Gynecol, 213(1), 62.e1-62.e10, available: http://dx.doi.org/10.1016/j.ajog.2015.02.018.
Yang, W., Ahn, H., Hinrichs, M., Torry, R.J. and Torry, D.S. (2003) 'Evidence of a novel
isoform of placenta growth factor (PlGF-4) expressed in human trophoblast and endothelial cells', J Reprod Immunol, 60(1), 53-60, available:
http://dx.doi.org/10.1016/S0165-0378(03)00082-2. Zeisler, H., Llurba, E., Chantraine, F., Vatish, M., Staff, A.C., Sennstrom, M., Olovsson,
M., Brennecke, S.P., Stepan, H., Allegranza, D., Dilba, P., Schoedl, M., Hund, M. and Verlohren, S. (2016a) 'Predictive Value of the sFlt-1:PlGF Ratio in Women with Suspected Preeclampsia', N Engl J Med, 374(1), 13-22, available: http://dx.doi.org/10.1056/NEJMoa1414838.
289
Zeisler, H., Llurba, E., Chantraine, F., Vatish, M., Staff, A.C., Sennstrom, M., Olovsson, M., Brennecke, S.P., Stepan, H., Allegranza, D., Dinkel, C., Schoedl, M., Dilba, P., Hund, M. and Verlohren, S. (2016b) 'Soluble fms-Like Tyrosine Kinase-1-to-Placental Growth Factor Ratio and Time to Delivery in Women With Suspected Preeclampsia', Obstet Gynecol, 128(2), 261-69, available: http://dx.doi.org/10.1097/aog.0000000000001525.
Zeldovich, V.B., Robbins, J.R., Kapidzic, M., Lauer, P. and Bakardjiev, A.I. (2011)
Invasive extravillous trophoblasts restrict intracellular growth and spread of Listeria monocytogenes', PLoS Pathog, 7(3), e1002005, available: http://dx.doi.org/ 10.1371/journal.ppat.1002005
Zhang, J., Klebanoff, M.A. and Roberts, J.M. (2001) 'Prediction of adverse outcomes by
common definitions of hypertension in pregnancy', Obstet Gynecol, 97(2), 261-67, available: http://dx.doi.org/10.1016/S0029-7844(00)01125-X.
Ziche, M., Maglione, D., Ribatti, D., Morbidelli, L., Lago, C.T., Battisti, M., Paoletti, I.,
Barra, A., Tucci, M., Parise, G., Vincenti, V., Granger, H.J., Viglietto, G. and Persico, M.G. (1997) 'Placenta growth factor-1 is chemotactic, mitogenic, and angiogenic', Lab Invest, 76(4), 517-31.
Zweig, M.H. and Campbell, G. (1993) 'Receiver-operating characteristic (ROC) plots: a
fundamental evaluation tool in clinical medicine', Clin Chem, 39(4), 561-77.

290
Appendices No History Outcome Biomarker values for
Delfia (D), Cobas (C) and Kryptor (K) platforms
PlGF (pg/mL)
sFlt1/PlGF ratio
1 G1P0, chronic HT, T1DM with diabetic nephropathy
Early onset PE. LUSCS 30+1. FGR BWt 2nd centile D 115.8 C 178.1 K 144.7
C 13.6 K 15.9
2 G3P2, previous PTB 31/40. Chronic HT. Taking calcium
Late onset PE. Spont labour 36/40, NVD., placental abruption and PPROM. Normal BWt
D 189.8 C 240.1 K 266
C 5.57 K 6.38
3 G2P1, previous PTB 31/40, GDM, smoker Late onset PE. LUSCS 35+5, renal impairment. LGA BWt 99th centile
D 245.6 C 320.2 K 250.7
C 3.13 K 2.98
4
G1P0, T1DM, taking calcium Late onset PE, LUSCS 38+4, LGA. BWt 99th centile
D 101.2 C 176.5 K 134.1
C 13.86 K 19.81
5
G2P1 Late onset PE, NVD 37+5, GDM. Normal BWt D 318.3 C 222.7 K 368.2
C 1.98 K 1.52
6
G4P3, previous PTB 28/40 due to PE. Taking calcium
Late onset PE. LUSCS 36+5. FGR BWt 1st centile D 153.6 C 191.1 K 161.1
C 7.23 K 8.0
7
G3P0. APS, on clexane 1st trimester Late onset PE, NVD 41+4. Normal BWt D 529.7 C 636.7 K 507.1
C 2.1 K 2.31
8
G2P1, previous PE Late onset PE. NVD 37+1. Normal BWt D 140.5 C 315.1 K 180.8
C 2.76 K 4.16
9
G4P1-1, previous FDIU 33/40. Chronic HT and GDM
Late onset PE. LUSCS 36+3. FGR BWt 2nd centile D 75.1 C 144.5 K 111.1
C 5.09 K 4.77
10 18262
G4P1-1, previous FDIU 26/40 due to FGR IOL 36+1 for suspected FGR, NVD, FGR confirmed. BWt 1st centile
D 179.0 C 210.9 K 202.98
C 6.06 K 5.16
11 18445
G3P1, previous SGA Gestational HT, NVD 36+4. FGR 2nd centile D 193.5 C 202.6 K 161.3
C 10.11 K 12.5
12 18078
G2P1, previous SGA NVD 40+3. FGR BWt 2nd centile D 304.9 C 301.1 K 399.1
C 2.72 K 2.49
13 17760
G2P1 LUSCS 37+4. SGA BWt 7th centile D 163.7 C 232.7 K 179.2
C 5.82 K 6.23
14 17880
G1P0, minimal change disease (kidney) NVD 39/40. SGA BWt 9th centile D 74.3 C 121.1 K 91.48
C 6.11 K 7.50
15 17885
G2P0, chronic HT NVD 40+3. SGA BWt 9th centile D 111.2 C 125.3 K 153.6
C 7.94 K 7.97
16 18304
G1P0 LUSCS 38+2. SGA BWt 9th centile D 138.4 C 217.7 K 165.4
C 4.33 K 4.07
17 17558
G3P2-1, previous PTB 23/40 for HELLP syndrome resulting in NND. Lupus anticoagulant positive. Chronic HT, on aldomet and clexane
LUSCS 38+3. Normal BWt D 62.2 C 74.03 K 84.72
C 15.57 K 12.70
18 18101
G9P3-2, previous two FDIU’s at 23/40. SLE and APS, GDM. On heparin
NVD 37+4, LGA, BWt 94th centile D 192.1 C 265.3 K 200.4
C 4.92 K 4.8
19 17944
G3P2-1, FGR and FDIU in 1st pregnancy, SGA 2nd baby, GDM
NVD 37+3. Normal BWt D 223.4 C 289.2 K 236.5
C 3.03 K 2.94
20 18175
G2P1-1, previous PE and PTB 28/40 FDIU due to FGR. APLS on clexane
LUSCS 38/40. LGA BWt 93rd centile D 138.4 C 193.6 K 158.8
C 3.62 K 3.31

291
21 18212
G4P2-1, previous FGR and FDIU 37/40 NVD 37+5. Normal BWt D 132.8 C 237.2 K 171
C 6.93 K 8.51
22 18300
G3P1-1, previous FDIU 20/40 NVD 40/40. Normal BWt D 209.7 C 351.0 K 297.13
C 5.61 K 5.91
23 18343
G2P1-1, previous FDIU 36/40 LUSCS 38+4. Normal BWt D 180.0 C 259.5 K 226.3
C 6.31 K 7.59
24 18354
G3P1-1, previous PE and FDIU NVD 40+2. LGA BWt 92nd centile D 116.6 C 191.6 K 147.1
C 6.28 K 6.82
25 18414
G3P1-1, previous FDIU 32/40. LUSCS 36+3. Normal BWt D 340.3 C 412.9 K 377.1
C 4.58 K 4.31
26 18456
G4P2-1, previous FDIU 36/40. FVL NVD 37/40. Normal BWt D 180.3 C 212.4 K 86.75
C 6.23 K 11.42
27 17267
G4P2, chronic HT LUSCS 37+4, HT, APH and placenta praevia. Normal BWt
D 157.8 C 222.6 K 181.3
C 7.39 K 7.82
28 17752
G4P1, previous PE and FGR. Chronic HT and SLE, on clexane
LUSCS 38+2. Normal BWt D 151.7 C 253.5 K 177.7
C 5.62 K 6.06
29 17792
G4P1, previous PTB 36/40 for PE and FGR NVD 40+1. Normal BWt D 90.1 C 154.2 K 93.06
C 8.49 K 8.78
30 17940
G2P1, previous PE. On calcium LUSCS 39+4. Normal BWt D 143.2 C 213.8 K 164
C 12.81 K 17.97
31 18145
G4P1, previous PE, on calcium Gestational HT, LUSCS 38+3. Normal BWt D 76.5 C 114.0 K 81.3
C 9.7 K 11.3
32 18157
G8P1, previous PTB 32/40 NVD 36+6, PTB due to PPROM. Normal BWt D 409.1 C 949.4 K 757.8
C 2.19 K 2.27
33 18198
G2P1. Chronic HT, IgA nephropathy. Previous late onset PE and FGR
LUSCS 38+3. Normal BWt D 127.7 C 169.8 K 148.6
C 10.49 K 10.21
34 18275
G3P1, T1DM. Previous HELLP syndrome, LUSCS 38/40
Gestational HT, LUSCS 37+5. Normal BWt D 36.2 C 63.46 K 60.65
C 24.14 K 21.07
35 18298
G2P1, previous FGR and PTB 26/40. On clexane. PPROM and chorioamnionitis, NVD 25+4. Normal BWt
D 73.7 C 189.8 K 177.71
C 3.2 K 2.79
36 18342
G8P2, previous PTB 32/40 LUSCS 37+2. Normal BWt D 223.3 C 320.8 K 248.5
C 6.02 K 7.05
37 18351
G2P1, previous PTB due to PE and FGR at 34/40. On clexane
LUSCS 38+1. Normal BWt D 163.9 C 225.4 K 167.9
C 7.74 K 8.64
38 18448
G3P1, previous PTB 36/40 NVD 39+2. Normal BWt D 607.4 C 713.2 K 601.46
C 1.97 K 1.92
39 18468
G2P1, previous PE Gestational HT. LUSCS 38+5. LGA BWt 98th centile
D 145.6 C 128.9 K 145.9
C 7.18 K 8.86
40 18002
G1P0, T2DM, mother had PE. Taking Calcium NVD 38+1. Normal BWt D 221.1 C 283.7 K 284
C 2.55 K 2.80
41 18004
G10P2, FVL and Crohn’s disease LUSCS 39+3. Normal BWt D 140.3 C 221.8 K 168
C 6.34 K 6.88
42 18094
G5P1, FVL on clexane NVD 38/40, APH. Normal BWt D 78.4 C 150.7 K 111.7
C 8.1 K 8.6
43 17954
G2P0 NVD 39+5. Normal BWt D 368.0 C 558.7 K 475.3
C 3.18 K 4.04

292
44 17979
G1P0 LUSCS 40+2, gestational HT. LGA BWt 99th centile
D 91.4 C 128.7 K 102.0
C 10.47 K 10.16
45 18100
G4P0 NVD 39+4. Normal BWt D 159.4 C 224.8 K 175.9
C 8.00 K 8.08
46 18179
G2P1, previous CVA LUSCS 39+1. Normal BWt D 344.9 C 589.5 K 279.3
C 4.3 K 7.84
47 18226
G4P0 LUSCS 40+3. Normal BWt D 200.0 C 350.2 K 286.7
C 6.42 K 7.46
48 18285
G4P1 LUSCS 37+5. Normal BWt D 204.0 C 249.0 K 219.0
C 3.63 K 3.61
49 18370
G1P0, GDM LUSCS 38+2. LGA BWt 99th centile D 123.6 C 183.7 K 166.2
C 8.29 K 8.8
50 18441
G2P0 NVD 40/40. Normal BWt D 156.1 C 326.0 K 233.8
C 5.33 K 5.67
51 18466
G4P1, GDM LUSCS 38+5. Normal BWt D 243.9 C 260.7 K 240.5
C 3.67 K 3.79
PE = preeclampsia. HT = hypertension. T1DM = Type 1 diabetes mellitus. LUSCS = lowers uterine segment caesarean section. FGR = fetal growth restriction. BWt = birthweight. D = Delfia platform. C = Cobas platform. K = Kryptor platform. PTB = preterm birth. NVD = normal vaginal delivery. PPROM = preterm prelabour rupture of membranes. BWt = birthweight. GDM = gestational diabetes mellitus. LGA = large for gestational age. APS = antiphospholipid syndrome. FDIU = fetal death in utero. SGA = small for gestational age. NND = neonatal death. FVL = Factor V Lieden deficiency. APH = antepartum haemorrhage. HELLP = haemolysis, elevated liver enzymes, low platelets. SLE = systemic lupus erythematosus. CVA = cerebrovascular accident. Patients who developed preeclampsia Patients who developed SGA or FGR Patients with poor obstetric histories including a previous FDIU Patients with other significant risk factors for the development of preeclampsia or for a poor pregnancy outcome Patients with no significant risk factors for the development of preeclampsia or an adverse pregnancy outcome
Appendix 1. Clinical history, outcomes and biomarker results for patients taking low dose aspirin antenatally

Minerva Access is the Institutional Repository of The University of Melbourne
Author/s:
Black, Carin Letitia
Title:
Midpregnancy prediction of preeclampsia
Date:
2018
Persistent Link:
http://hdl.handle.net/11343/228872
File Description:
Final thesis file
Terms and Conditions:
Terms and Conditions: Copyright in works deposited in Minerva Access is retained by the
copyright owner. The work may not be altered without permission from the copyright owner.
Readers may only download, print and save electronic copies of whole works for their own
personal non-commercial use. Any use that exceeds these limits requires permission from
the copyright owner. Attribution is essential when quoting or paraphrasing from these works.