Embed Size (px)
Citation preview
THESIS
DESIGN OF AND EXPERIMENTATION WITH A PASSIVE
VALVE–LESS FLOW–THROUGH SOLAR WATER
PASTEURIZATION SYSTEM
Submitted by
David A. Hodgson
Department of Mechanical Engineering
In partial fulfillment of the requirements
for the Degree of Masters of Science
Colorado State University
Fort Collins, Colorado
Spring 2005
COLORADO STATE UNIVERSITY
April 1, 2005
WE HEREBY RECOMMEND THAT THE THESIS PREPARED UNDER
OUR SUPERVISION BY DAVID A. HODGSON ENTITLED DESIGN OF
AND EXPERIMENTATION WITH A PASSIVE VALVE–LESS FLOW–
THROUGH SOLAR WATER PASTEURIZATION SYSTEM BE AC-
CEPTED AS FULFILLING IN PART REQUIREMENTS FOR THE DEGREE OF
MASTERS OF SCIENCE.
Committee on Graduate Work
Adviser
Department Head
ii

ABSTRACT OF THESIS
DESIGN OF AND EXPERIMENTATION WITH A PASSIVE
VALVE–LESS FLOW–THROUGH SOLAR WATER
PASTEURIZATION SYSTEM
A passive solar water pasteurization system has been designed, built, and tested.
The system is designed to heat water to 80◦C for a minimum of one minute. A review
of the available thermal inactivation data shows that this process should provide
significant protection against the most common waterborne pathogens. The system
is valve-less and regulates flow based on the density difference between the treated
and untreated water. The system uses evacuated tube heat-pipe solar collectors with
a total absorber surface area of 0.45m2. A high effectiveness heat exchanger is used
to recover heat from treated water and pre-heat untreated water. The system was
tested in Fort Collins, Colorado, during the late summer and early fall of 2004. The
daily production of treated water for the system was roughly 7.8 kg for every MJ of
total daily incident radiation above 5.4 MJ. The peak production of 152 kg occurred
on August 11, 2004, with a total daily incident radiation of 13.1 MJ.
David A. HodgsonDepartment of Mechanical EngineeringColorado State UniversityFort Collins, Colorado 80523Spring 2005
iii
ACKNOWLEDGMENTS
I would like to thank my advisor, Professor William S. Duff for his advice, assis-
tance, and patience.
I would like to thank my family for their unquestioning support and patience
during this long process.
iv

DEDICATION
For my mom
v
TABLE OF CONTENTS
1 Water Quality 1
1.1 The Need . . . . . . . . . . . . . . . . . . . . . . . . . . . . . . . . . 2
1.2 Effects of Improved Water Quality . . . . . . . . . . . . . . . . . . . 3
1.3 Conclusion . . . . . . . . . . . . . . . . . . . . . . . . . . . . . . . . . 4
2 Waterborne Pathogens 5
2.1 Bacteria . . . . . . . . . . . . . . . . . . . . . . . . . . . . . . . . . . 5
2.1.1 Campylobacter . . . . . . . . . . . . . . . . . . . . . . . . . . 6
2.1.2 Eschericha coli . . . . . . . . . . . . . . . . . . . . . . . . . . 6
2.1.3 Salmonella . . . . . . . . . . . . . . . . . . . . . . . . . . . . . 6
2.1.4 Shigella . . . . . . . . . . . . . . . . . . . . . . . . . . . . . . 7
2.1.5 Vibro cholera . . . . . . . . . . . . . . . . . . . . . . . . . . . 7
2.1.6 Yersinia enterocolitica . . . . . . . . . . . . . . . . . . . . . . 7
2.2 Viruses . . . . . . . . . . . . . . . . . . . . . . . . . . . . . . . . . . . 7
2.2.1 Adenoviruses . . . . . . . . . . . . . . . . . . . . . . . . . . . 7
2.2.2 Enteroviruses . . . . . . . . . . . . . . . . . . . . . . . . . . . 8
2.2.3 Hepatitis A . . . . . . . . . . . . . . . . . . . . . . . . . . . . 8
2.2.4 Hepatitis E . . . . . . . . . . . . . . . . . . . . . . . . . . . . 8
vi

2.2.5 non-A, non-B Hepatitis viruses . . . . . . . . . . . . . . . . . 8
2.2.6 Norovirus . . . . . . . . . . . . . . . . . . . . . . . . . . . . . 8
2.2.7 Rotavirus . . . . . . . . . . . . . . . . . . . . . . . . . . . . . 9
2.3 Protozoa . . . . . . . . . . . . . . . . . . . . . . . . . . . . . . . . . . 9
2.3.1 Cryptosporidium . . . . . . . . . . . . . . . . . . . . . . . . . 9
2.3.2 Giardia . . . . . . . . . . . . . . . . . . . . . . . . . . . . . . 9
2.3.3 Entamoeba histolytica . . . . . . . . . . . . . . . . . . . . . . . 10
2.4 Helminths . . . . . . . . . . . . . . . . . . . . . . . . . . . . . . . . . 10
2.5 Conclusion . . . . . . . . . . . . . . . . . . . . . . . . . . . . . . . . . 10
3 Water Treatment Methods 11
3.1 Process Effectiveness and Evaluation . . . . . . . . . . . . . . . . . . 11
3.2 Screening/Sedimentation . . . . . . . . . . . . . . . . . . . . . . . . . 12
3.3 Roughing Filters . . . . . . . . . . . . . . . . . . . . . . . . . . . . . 12
3.4 Slow Sand Filtration . . . . . . . . . . . . . . . . . . . . . . . . . . . 12
3.5 Chemical Treatments . . . . . . . . . . . . . . . . . . . . . . . . . . . 13
3.6 UV Radiation . . . . . . . . . . . . . . . . . . . . . . . . . . . . . . . 13
3.7 Photochemical Disinfection . . . . . . . . . . . . . . . . . . . . . . . . 13
3.8 Distillation . . . . . . . . . . . . . . . . . . . . . . . . . . . . . . . . 14
3.9 Pasteurization . . . . . . . . . . . . . . . . . . . . . . . . . . . . . . . 14
3.10 Conclusion . . . . . . . . . . . . . . . . . . . . . . . . . . . . . . . . . 14
4 Pasteurization 15
4.1 Overview and History of Pasteurization . . . . . . . . . . . . . . . . . 15
4.2 Modeling Pasteurization . . . . . . . . . . . . . . . . . . . . . . . . . 16
4.2.1 Log–Linear Idealization . . . . . . . . . . . . . . . . . . . . . . 16
4.2.2 Deviations from Linear Behavior . . . . . . . . . . . . . . . . 21
4.3 Environmental conditions that affect thermal resistance . . . . . . . . 25
vii
4.4 Milk vs. Water Pasteurization . . . . . . . . . . . . . . . . . . . . . . 26
4.5 Conclusion . . . . . . . . . . . . . . . . . . . . . . . . . . . . . . . . . 27
5 Review of Thermal Inactivation of Waterborne Pathogens at or Near
HTST Pasteurization Conditions 28
5.1 Considerations in Reviewing Thermal Inactivation Data . . . . . . . . 29
5.1.1 Media . . . . . . . . . . . . . . . . . . . . . . . . . . . . . . . 29
5.1.2 Heating Method . . . . . . . . . . . . . . . . . . . . . . . . . . 29
5.1.3 Enumeration Methods . . . . . . . . . . . . . . . . . . . . . . 30
5.1.4 Data Extrapolation . . . . . . . . . . . . . . . . . . . . . . . . 31
5.2 Existing Reviews of the Thermal Resistance of Waterborne Pathogens 32
5.3 Bacteria . . . . . . . . . . . . . . . . . . . . . . . . . . . . . . . . . . 33
5.4 Viruses . . . . . . . . . . . . . . . . . . . . . . . . . . . . . . . . . . . 37
5.5 Protozoa . . . . . . . . . . . . . . . . . . . . . . . . . . . . . . . . . . 39
5.6 Conclusion . . . . . . . . . . . . . . . . . . . . . . . . . . . . . . . . . 40
6 Review of Solar Water Pasteurization 43
6.1 Batch Systems . . . . . . . . . . . . . . . . . . . . . . . . . . . . . . . 43
6.2 Flow–Through Systems with Valves . . . . . . . . . . . . . . . . . . . 45
6.3 Density Driven Flow–Through Systems . . . . . . . . . . . . . . . . . 48
6.4 Conclusion . . . . . . . . . . . . . . . . . . . . . . . . . . . . . . . . . 49
7 Design Development 50
7.1 Valved System . . . . . . . . . . . . . . . . . . . . . . . . . . . . . . . 50
7.2 Simple Density-Difference Control . . . . . . . . . . . . . . . . . . . . 53
7.3 Conclusion . . . . . . . . . . . . . . . . . . . . . . . . . . . . . . . . . 55
8 Design of Density Driven System with an Internal Circulation Loop 56
8.1 Overview of System . . . . . . . . . . . . . . . . . . . . . . . . . . . . 56
viii
8.2 Untreated Water Reservoir . . . . . . . . . . . . . . . . . . . . . . . . 58
8.3 Heat Exchanger . . . . . . . . . . . . . . . . . . . . . . . . . . . . . . 58
8.4 Circulation Loop . . . . . . . . . . . . . . . . . . . . . . . . . . . . . 60
8.5 Holding Tube . . . . . . . . . . . . . . . . . . . . . . . . . . . . . . . 60
8.6 Treated Water Reservoir . . . . . . . . . . . . . . . . . . . . . . . . . 64
8.7 Design of the Supply Reservoir Height . . . . . . . . . . . . . . . . . 64
8.8 Conclusion . . . . . . . . . . . . . . . . . . . . . . . . . . . . . . . . . 69
9 Experimental Results and Discussion 70
9.1 Experimental Setup and Instrumentation . . . . . . . . . . . . . . . . 70
9.2 Daily Production . . . . . . . . . . . . . . . . . . . . . . . . . . . . . 71
9.3 Component Performance . . . . . . . . . . . . . . . . . . . . . . . . . 71
9.3.1 Circulation loop . . . . . . . . . . . . . . . . . . . . . . . . . . 79
9.3.2 Performance of the Heat Exchanger . . . . . . . . . . . . . . . 79
9.3.3 Temperature Profile Within the Holding Tube . . . . . . . . . 83
9.4 Conclusion . . . . . . . . . . . . . . . . . . . . . . . . . . . . . . . . . 87
10 Possible Future Research and Conclusion 91
10.1 Possible Future Research . . . . . . . . . . . . . . . . . . . . . . . . . 91
10.2 Conclusion . . . . . . . . . . . . . . . . . . . . . . . . . . . . . . . . . 92
REFERENCES 93
ix

Chapter 1
Water Quality
There is a need for cost effective water treatment methods in many underdeveloped
regions of the world. This thesis presents the design and experimental results of
a passive valve-less solar water pasteurization system. The system is intended to
be an appropriate water treatment process for rural areas, where small scale water
treatment is needed.
The effectiveness of pasteurization depends on the temperature and holding time
of the process. The system presented in this thesis was designed to have a typical
holing temperature of 80◦C and a holding time of a least one minute. These operating
conditions were chosen after a preliminary review of the available thermal inactivation
data of common waterborne pathogens.
The organization of the thesis is as follows. The rest of this chapter motivates
the study of solar water pasteurization, by providing statistics that show there is a
need for cost effective water treatment in underdeveloped regions of the world, par-
ticularly rural areas. Chapter 2 describes the waterborne pathogens that the World
Health Organization (WHO) has identified to have high health significance. Chapter
3, reviews typical water treatment processes that are appropriate for small systems.
Chapter 4 introduces pasteurization as a water treatment process and presents the
most common way to model the thermal inactivation of microorganisms. Chapter 5
reviews the available data on the thermal inactivation of the most common water-
1
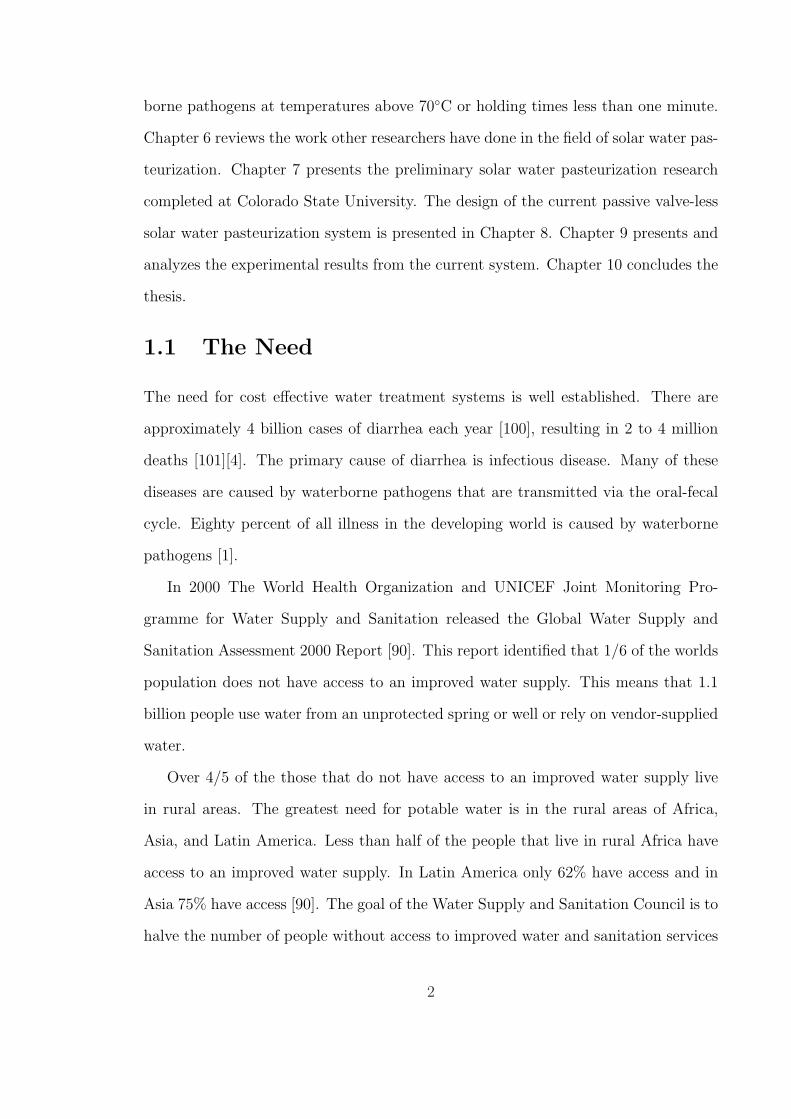
borne pathogens at temperatures above 70◦C or holding times less than one minute.
Chapter 6 reviews the work other researchers have done in the field of solar water pas-
teurization. Chapter 7 presents the preliminary solar water pasteurization research
completed at Colorado State University. The design of the current passive valve-less
solar water pasteurization system is presented in Chapter 8. Chapter 9 presents and
analyzes the experimental results from the current system. Chapter 10 concludes the
thesis.
1.1 The Need
The need for cost effective water treatment systems is well established. There are
approximately 4 billion cases of diarrhea each year [100], resulting in 2 to 4 million
deaths [101][4]. The primary cause of diarrhea is infectious disease. Many of these
diseases are caused by waterborne pathogens that are transmitted via the oral-fecal
cycle. Eighty percent of all illness in the developing world is caused by waterborne
pathogens [1].
In 2000 The World Health Organization and UNICEF Joint Monitoring Pro-
gramme for Water Supply and Sanitation released the Global Water Supply and
Sanitation Assessment 2000 Report [90]. This report identified that 1/6 of the worlds
population does not have access to an improved water supply. This means that 1.1
billion people use water from an unprotected spring or well or rely on vendor-supplied
water.
Over 4/5 of the those that do not have access to an improved water supply live
in rural areas. The greatest need for potable water is in the rural areas of Africa,
Asia, and Latin America. Less than half of the people that live in rural Africa have
access to an improved water supply. In Latin America only 62% have access and in
Asia 75% have access [90]. The goal of the Water Supply and Sanitation Council is to
halve the number of people without access to improved water and sanitation services
2
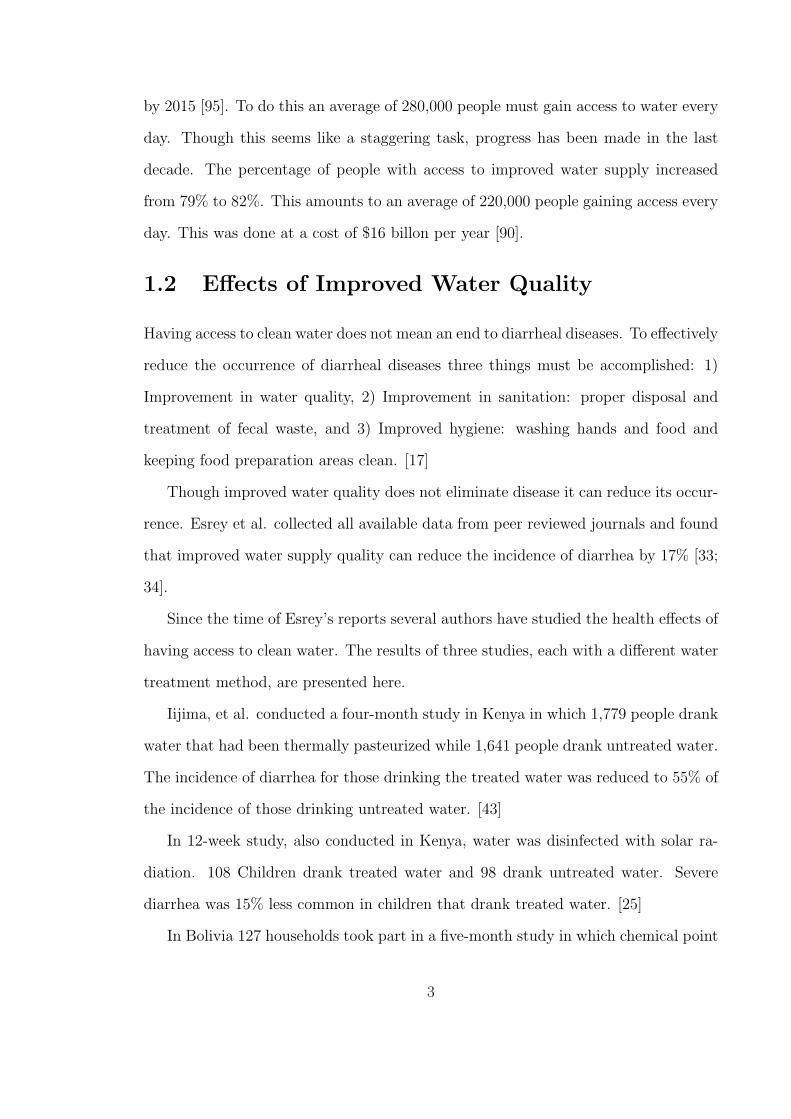
by 2015 [95]. To do this an average of 280,000 people must gain access to water every
day. Though this seems like a staggering task, progress has been made in the last
decade. The percentage of people with access to improved water supply increased
from 79% to 82%. This amounts to an average of 220,000 people gaining access every
day. This was done at a cost of $16 billon per year [90].
1.2 Effects of Improved Water Quality
Having access to clean water does not mean an end to diarrheal diseases. To effectively
reduce the occurrence of diarrheal diseases three things must be accomplished: 1)
Improvement in water quality, 2) Improvement in sanitation: proper disposal and
treatment of fecal waste, and 3) Improved hygiene: washing hands and food and
keeping food preparation areas clean. [17]
Though improved water quality does not eliminate disease it can reduce its occur-
rence. Esrey et al. collected all available data from peer reviewed journals and found
that improved water supply quality can reduce the incidence of diarrhea by 17% [33;
34].
Since the time of Esrey’s reports several authors have studied the health effects of
having access to clean water. The results of three studies, each with a different water
treatment method, are presented here.
Iijima, et al. conducted a four-month study in Kenya in which 1,779 people drank
water that had been thermally pasteurized while 1,641 people drank untreated water.
The incidence of diarrhea for those drinking the treated water was reduced to 55% of
the incidence of those drinking untreated water. [43]
In 12-week study, also conducted in Kenya, water was disinfected with solar ra-
diation. 108 Children drank treated water and 98 drank untreated water. Severe
diarrhea was 15% less common in children that drank treated water. [25]
In Bolivia 127 households took part in a five-month study in which chemical point
3
of use water treatment and safe storage techniques were used to reduce the incidence
of diarrhea by 44%. [70]
These examples indicate that drinking treated water improves health. A complete
review of this topic is beyond the scope of this paper. No attempt was made to find
all papers that report health benefits from improvements in drinking water.
In addition to health benefits there are economic benefits that occur as a result
of having access to a good water supply. The time spent being sick or caring for sick
children impacts productivity. The productivity improvements from water treatment
may develop slowly, but they should not be ignored when analyzing the effects of a
treated water supply. [49]
1.3 Conclusion
In this chapter statistics were presented that show there is a need to improve the
quality of drinking water in underdeveloped rural areas. Specifically, microorganism
caused diseases were discussed. The benefits of having higher quality drinking water
were presented.
Though chemical contaminants (whether pollutants or naturally occurring chem-
icals) also pose a health risk, microorganisms are a much more common source of
contamination. According the the World Health Organization “Infectious diseases
caused by pathogenic bacteria, viruses, and protozoa or by parasites are the most
common and widespread health risk associated with drinking-water.” [98]
4

Chapter 2
Waterborne Pathogens
Infectious diseases are commonly transmitted via the fecal-oral route. Infected hu-
mans or animals excrete viable pathogens. If there is fecal contamination of the water
supply, infection can result from drinking water or using it to bathe or wash. The cost
and relative complexity of diagnostic and detection methods make it hard to know
which microorganism is responsible for a particular episode, but some microorganisms
are more likely to be the cause of disease than others. The World Health Organi-
zation has identified several orally transmitted waterborne pathogens that have high
health significance. [98] These pathogens include bacteria, viruses, protozoa, and one
helminth. A basic description of all types microorganism can be found in many of
the introductory microbiology textbooks. Introduction to Microbiology. by John L.
Ingraham and Kathy Catherine A. Ingraham [44] was used as a reference for this
chapter. In some cases more detailed information was obtained, in which case it is
noted accordingly.
2.1 Bacteria
Bacteria are organisms that usually consist of a single prokaryotic cell. They can have
many different shapes; rods, cocci, helical, etc. They are typically small compared to
eukaryotic cells. The WHO identified six bacteria that have high health significance.
5
2.1.1 Campylobacter
Campylobacter jejuni and Campylobacter coli are gram-negative, spiral shaped, motile
bacteria. The two are closely related and share clinical and epidemiological character-
istics [62]. Campylobacter infection causes watery or sticky diarrhea that may contain
blood. Fever, abdominal pain, nausea, headache and muscle pain are also common
[21]. The infection lasts from 7-10 days. Campylobacter infects several animals.
Water contamination is commonly caused by animal feces.
2.1.2 Eschericha coli
E. coli are Gram-negative, rod-shaped bacteria belonging the family Enterobacte-
riaceae. There are four recognized classes of virulent E. coli that cause infection
in humans. The four classes are the enteroinvasive (EIEC) strains, the enteropatho-
genic (EPEC) strains, the enterotoxigenic (ETEC) strains, and the enterohemorrhagic
(EHEC) strain designated E. coli O157:H7.
E. coli infection results in mild to severe diarrhea which can lead to dehydration.
Infection of O157:H7 can cause hemolytic uremic syndrome, resulting in severe anemia
and kidney failure. Healthy cattle are a significant reservoir.
2.1.3 Salmonella
Salmonella is a rod-shaped, motile Gram-negative bacterium. There is widespread
occurrence in animals, especially in poultry and swine. S. typhi, the most virulent of
the Salmonella species, causes Typhoid fever. Symptoms include weakness, confusion,
headache, and most notably a very high fever. Other Salmonella species generally
produce milder symptoms: nausea, vomiting, abdominal cramps, mild fever, and
headache. Some strains of salmonella have developed antibiotic resistance.
6
2.1.4 Shigella
Shigella is a rod-shaped, non motile, Gram-negative bacteria. The major symptom is
watery or blood streaked diarrhea. Shigella can only grow in the intestines of humans
but can survive for a long time in water. Only a small number of organisms (200) are
needed to cause infection.
2.1.5 Vibro cholera
Vibro cholera is a Gram-negative rod. Infection causes large secretions of chloride
into the intestine. This in turn causes water and electrolytes to leave the body via
osmosis. Diarrhea can be very severe and cause death in less than a day. Humans
are the main reservoir but Vibro cholera can multiply in water.
2.1.6 Yersinia enterocolitica
Yersinia enterocolitica is a Gram-negative rod shaped bacterium. Infection causes
intense abdominal pain and possible fever. Systemic infection is also possible. No
animals are known to be significant reservoirs.
2.2 Viruses
Viruses consist of a piece of RNA or DNA, an outer coat and sometimes a membrane.
Viruses can only reproduce inside a host cell. The WHO identified seven virus or
virus families that have a high health significance.
2.2.1 Adenoviruses
Adenoviruses contain a double-stranded DNA surrounded by a protein capsid. In-
fection usually causes mild symptoms. Nausea, vomiting, diarrhea, abdominal pain,
headache, and fever are common[21].
7
2.2.2 Enteroviruses
Viruses in the enterovirus family contain a naked strand of RNA. Enteroviruses in-
clude Coxsackie virus, Echovirus, and Poliovirus. Symptoms vary greatly from virus
to virus, but include fever, meningitis, stomach cramps, and diarrhea.
2.2.3 Hepatitis A
Hepatitis A is a nonenveloped virus that consists of single-stranded RNA. Hepatitis
A enters the body in the digestion tract and then attacks the liver. The human
body produces antibodies for Hepatitis A that can be detected to provide diagnosis.
Symptoms include nausea, vomiting, fatigue, and jaundice.
2.2.4 Hepatitis E
Hepatitis E is similar to Hepatitis A in that it is an RNA virus and attacks the liver.
Unlike Hepatitis A no antibodies are produced by the host. In addition Hepatitis E is
very dangerous to pregnant women, resulting in mortality in 15-25% of infections[57].
2.2.5 non-A, non-B Hepatitis viruses
Enterically transmitted viral infections that produce Hepatitis symptoms, but do not
result in antibody production are referred to as enterically transmitted non-A, non-B
Hepatitis. Hepatitis E is a named form of non-A, non-B Hepatitis.
2.2.6 Norovirus
Norovirus is a member of a family of small round structured viruses (SRSVs). They
consist of a single strand RNA genome and a single structural protein. The family
consists of several viruses that have been named after the places where the outbreaks
occurred. The common symptoms of infection are nausea, vomiting, diarrhea, and
abdominal pain[21]. Norovirus cannot be cultured in the laboratory making it difficult
to study[50].
8
2.2.7 Rotavirus
Rotavirus consists of a double stranded RNA. The onset of infection is quick and
results in watery diarrhea lasting four to seven days that can be severe and lead to
dehydration. Mild and symptom free infections are possible Rotavirus infects many
mammals and birds[30]. Rotavirus is believed to cause 800,000 deaths a year and
infect 95% of all children by age five[67].
2.3 Protozoa
Protozoa consist of a single eukaryotic cell, many are motile and many have complex
organelles. When under stress protozoa form cysts. Cysts are resistant to UV light
and chemical treatment. The WHO identified three protozoa that have high health
significance.
2.3.1 Cryptosporidium
Cryptosporidium is a protozoa that infects many animals. Oocysts are present in
the feces of infected animals. Intestinal infection is characterized by severe watery
diarrhea. Ingestion of one organism can cause an infection. Cryptosproridium is
notoriously resistant to chlorine and other chemical disinfectants.[80] Filtration has
also been unreliable in the removal of Cryptosporidium from water supplies [53].
2.3.2 Giardia
Giardia is most commonly associated with beavers though it has several hosts. Giar-
dia is common in surface water throughout the world. Many of those infected do not
show symptoms. For those that do show symptoms the most common are diarrhea,
abdominal cramps and weight loss. Symptoms usually last six weeks.
9
2.3.3 Entamoeba histolytica
Entamoeba histolytica infects humans and other primates. Most infections cause little
or no symptoms. Severe infection is characterized by bloody stools and fever. Severe
infection is systemic and can cause liver abscess. Cysts are transmitted via feces to
new hosts.
2.4 Helminths
Helminths are multi-celled organisms commonly called worms. Only one helminth,
Dracunculus medinensis (Guinea worm) is classified by the WHO as having high
health significance in drinking water. Infection occurs when water fleas containing
juvenile D. medinensis are ingested. The worms that can reach 60 cm make their
home in connective tissues in the joints of host animals. When ready to release larvae
the worm will move toward the foot or leg and penetrate the skin. The larvae are
released into water and can survive for up to three weeks before being ingested by a
water flea to complete there life cycle.
2.5 Conclusion
In this chapter many common waterborne pathogens were described. Treatment
methods that eliminate these pathogens should result in a lower incidence of illness.
For more complete information on waterborne pathogens the reader is referred to
the United States Food and Drug Administration. The FDA has an online resource
called the Bad Bug Book, which includes descriptions of many pathogens and gives
information on recent outbreaks[21].
10
Chapter 3
Water Treatment Methods
Any water treatment system consists of one or more water treatment processes. Some
processes are effective against a particular contaminant while another process may be
more effective against different contaminants. By combining processes the effective-
ness of the system is increased beyond the level that a single process could accomplish.
This chapter describes a few of the many water treatment processes. The processes
discussed in this chapter are those that are appropriate for small scale systems. For
a more complete description of water treatment processes the reader is referred to [9]
and [31]. The process descriptions in this chapter come from those two sources as
well as [17; 19; 77].
3.1 Process Effectiveness and Evaluation
Before the discussion of particular processes it is important to understand the goal
of a water treatment system. The composition and level of contamination varies and
the system design must be sensitive to the needs of the particular situation. Each
process is generally rated on its effectiveness to remove a particular pathogen. The
effectiveness is commonly measured in ‘log’ terms. For example a process that pro-
duces a 5-log reduction in Camplyobacter would reduce the amount of Camplyobacter
present in the water by a factor of 100,000.
11
3.2 Screening/Sedimentation
Screening and sedimentation are often called pretreatment processes. Screening re-
moves lager objects from the water. A common application of screening is storm
grates. Sedimentation is the separation of suspended particles through the use of
gravity. Particles are allowed to settle to the bottom of the flow. These processes
typically do not reduce the microorganism content of the water, but they prepare the
water for further processing.
3.3 Roughing Filters
Roughing filters are often used to further reduce the amount of suspended particles in
the water. Filtration is not screening since the size of the particles removed are smaller
than the pore size of the filter. Roughing filters are commonly made with gravel.
Water is forced through several gravel layers. The size of the gravel in subsequent
layers is decreased. In addition to gravel, charcoal and sand can be used to increase
the effectiveness of the process. Roughing filters can produce a 1-log reduction in
bacteria and protozoa[17]. Wegelin et, al. give a detailed description of roughing
filters and present experimental results from several roughing filter designs [96].
3.4 Slow Sand Filtration
In slow sand filtration, water is filtered through about one meter of fine sand. A
biological film grows on the top of the sand. This film helps slow sand filtration
produce a 2-log reduction in bacteria, viruses, and protozoa [17]. The filtration rate
is much slower than that of roughing filters. Visscher gives a complete description of
slow sand filtration including performance expectations and required maintenance[94].
12
3.5 Chemical Treatments
There are many types of chemical treatment processes available. The most common
is chlorine treatment. Chlorine can be added to water in either a gaseous or solid
form. The effect of chlorination varies from microorganism to microorganism. Though
effective, chlorine treatment requires a constant supply of chemicals. In addition, over-
chlorination can be hazardous to those that consume the water. Ozone is another
chemical treatment that is commonly used. To use ozone it must be produced on
sight. This limits the use of ozone in rural undeveloped settings.
3.6 UV Radiation
Ultra violet (UV) radiation is a promising form of water treatment in underdeveloped
rural areas. UV radiation of wavelength 200nm to 280nm can be used to breakdown
DNA and RNA, making it impossible for a microorganism to multiply. The amount
of radiation needed varies from microorganism to microorganism. Nieuwstad et al.
conducted experiments with various bacteria and viruses and found that 420 J/m2
and 960 J/m2 were required to produce a 1-log reduction in the concentration of E.
coli and Reoviruses, respectively[63]. Water turbidity can affect the performance of
a UV treatment process. Highly turbid water, from high microorganism density or
other suspended particles can render UV treatment ineffective. One drawback to UV
treatment is the ability of bacteria to repair their DNA. Initially all bacteria may be
inactivated, but over time their viability returns. For this reason it is recommended
that water treated by UV radiation be consumed within 36 hours of treatment[17].
3.7 Photochemical Disinfection
In photochemical treatment a photocatalyst or photosensitizer is used. When exposed
to light a reactive species is produced. The most common catalyst is TO2. When
13
TO2 is exposed to UV light with wavelengths less than 387nm, electrons are excited
into the conduction band. The electrons and holes created react with the surrounding
liquid to produce hydroxyl and peroxyl radicals. These reactive species breakdown
the contaminants in the water. The use of a photocatalyst or photosensitizer allows
for the destruction of microorganisms or chemical contaminants that are not normally
affected by UV radiation[26; 27].
3.8 Distillation
Distillation is a process in which water is evaporated to rid it of contaminants and
then condensed for use. Typically distillation is used in desalination applications.
The large amount of energy needed for evaporation makes this process unattractive
when other process can produce similar results.
3.9 Pasteurization
In Pasteurization water is heated and held at an elevated temperature for a sufficient
amount of time to destroy pathogenic microorganisms. Pasteurization is common for
milk and other food products, but water is not commonly pasteurized. A complete
discussion of pasteurization is contained in chapter 4.
3.10 Conclusion
This chapter described several water treatment processes that are appropriate for
small scale systems in underdeveloped rural areas. By combining these processes an
effective water treatment system can often be created.
14
Chapter 4
Pasteurization
This chapter discusses the pasteurization process in detail. Section 4.1 gives a brief
history of pasteurization. Section 4.2 provides methods to model thermal inactivation
of bacteria. Section 4.3 describes the effect the environment can have on the thermal
stability of microorganisms. Section 4.4 points out some of the important differences
between milk and water pasteurization. Section 4.5 concludes the chapter with the
limitations of pasteurization as a water treatment process.
4.1 Overview and History of Pasteurization
Thermal inactivation of microorganisms was first used by Louis Pasteur in the 1860’s
to help prevent spoilage of wine[69]. Since that time pasteurization has become a
major part of the food processing industry. Pasteurization is a process in which the
temperature of a substance is raised for a designated period of time. The goal of
pasteurization is not to sterilize the substance, but rather eliminate disease causing
enteric pathogens. The time and temperature used in the process depend on the
properties of the substance being pasteurized. Pasteurization is most commonly as-
sociated with milk and other dairy products. Milk was first pasteurized in the 1870
by N.J. Fjord in Denmark. In the 1880’s milk was pasteurized on a commercial scale
in Denmark and Sweden. The large-scale pasteurization of milk began in the United
States at the start of the 20th century[83]. Milk is currently pasteurized in one of
15

three ways: 1) Low-Temperature Holding (LTH) where a temperature of 63◦C is
maintained for 30 minutes. 2) High-Temperature, Short-Time (HTST) where a tem-
perature of 71◦C is maintained for 15 seconds. 3) Ultra-High-Temperature (UHT)
where a temperature of 141◦C is maintained for 2 seconds[22]. In addition to milk,
many juices, egg products, and some meat products are pasteurized.
4.2 Modeling Pasteurization
Several mathematical models are used to describe the thermal destruction of mi-
crobes[11; 12; 72]. The simplest and most commonly used method is the log-linear
model. The use of this model is described in section 4.2.1. Section 4.2.2 discusses the
observed deviations from the log-linear model.
4.2.1 Log–Linear Idealization
When a medium that contains microorganisms is heated to an elevated temperature
the concentration of viable microorganisms is typically observed to decrease expo-
nentially with time. This behavior can be expected when each individual organism
has the same heat resistance and when each microorganism has a constant chance of
inactivation per unit time[40]. The time it takes to achieve a 1-log reduction in the
microorganism at a specified temperature in a specified medium is called the decimal
reduction time (D-value) for the microorganism at the given temperature in the given
medium. Often the notation DT0 is used to indicate the D-value at the temperature
T0. If the D-value is known the surviving fraction f of a microorganism can be found
with equation 4.1.
f = 10−t/D (4.1)
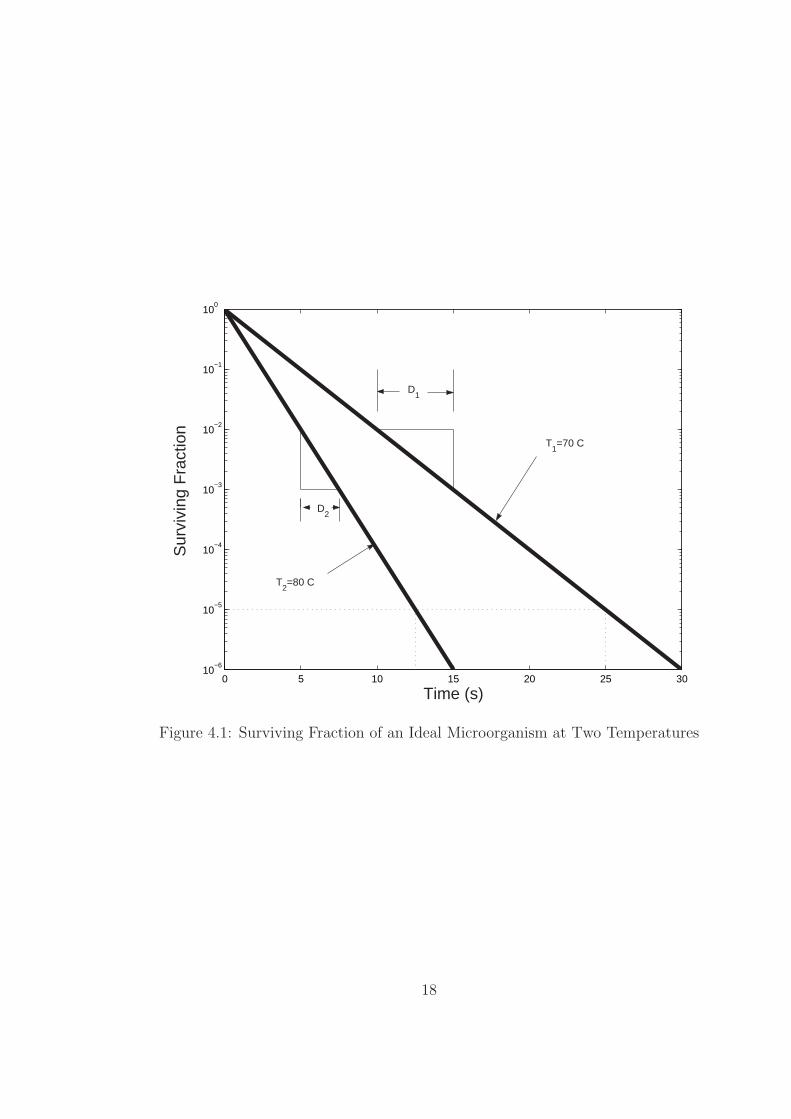
If the base ten logarithm of the surviving fraction is plotted as a function of time
a straight line is achieved with the magnitude of the slope equal to the D-value, as
shown in figure 4.1.
16

Since microorganisms are inactivated quicker at higher temperatures the D-value
of a microorganism increases with temperature. The temperature increase (drop)
needed to decrease (increase) the D-value by ten fold is called the z-value. In the
idealized case the z-value is constant for a microorganism. If the D-value is known
at one temperature T1, the z-value can be used to determine the D-value at another
temperature T2.
log(DT2) =T1 − T2
z+ log(DT1) (4.2)
Figure 4.1 shows survival curves for an ideal microorganism, ‘Ideal microorganism
A’, at two temperatures. The D-value associated for each temperature can be found
by determining the slope of each line (or equivalently, the time needed for a 1-log
reduction in survivors). In this case DT1=5 seconds and DT2=2.5 seconds. If T2 and
T1 are known then the z-value can be determined with equation 4.2. For example
if T1=70◦C and T2=80◦C then z=33.2◦C. It would take a change in temperature of
33.2◦C to cause a tenfold change in the D-value.
If there is a reduction requirement, f , for a microorganism with a know D-value,
equation 4.1 can be solved for the required time, t, resulting in equation 4.3.
t = −D log(f) (4.3)
For an ideal microorganism knowing the D-value at one temperature and the z-value
is enough to predict the effect of any thermal inactivation process. If DT0 is the
D-value of the microorganism at T0 and z is constant, equation 4.2 and equation 4.3
can be combined to find the minimum holding time required to produce the desired
reduction, f , for a constant temperature process.
t = −D0 log(f)(10)−(T−T0)/z (4.4)
For an ideal microorganism with a known reduction requirement, plotting the
minimum holding temperature as a function of the base ten logarithm of the minimum
holding time results in a straight line, sometimes called an inactivation curve. As an
17
0 5 10 15 20 25 3010
−6
10−5
10−4
10−3
10−2
10−1
100
Time (s)
Sur
vivi
ng F
ract
ion
D1
D2
T1=70 C
T2=80 C
Figure 4.1: Surviving Fraction of an Ideal Microorganism at Two Temperatures
18

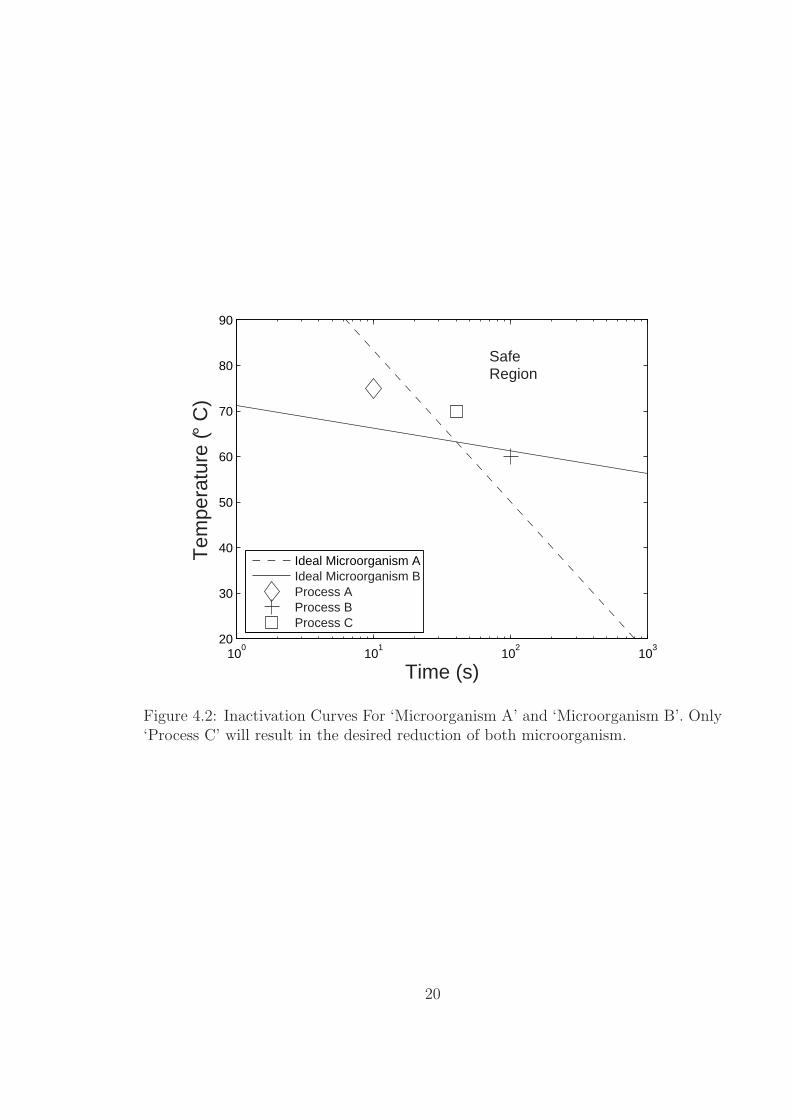
example the inactivation curve for 5-log reduction (f = 1 × 10⁻⁵ in ‘Microorganism
A’ is shown on figure 4.2 (dashed line). This line can also be constructed with the
information on figure 4.1: The survival curve for T1 = 70◦C predicts a 5-log reduction
after 25 seconds. At T2 = 80◦C a 5-log reduction occurs after 12.5 seconds. These two
points (the circles on figure 4.2) define the line of the inactivation curve. Figure 4.2
also shows the inactivation curve of ‘Microorganism B’ (solid line) which has a D60-
value of 30 seconds, a z-value of 5C◦, and a 6-log reduction requirement (f = 1×10⁻⁶).
Three constant temperature processes are also shown on figure 4.2. ‘Process A’
has a temperature of 75◦C and a holding time of 10 seconds; ‘Process B’ has a tem-
perature of 60◦C and a holding time of 100 seconds; ‘Process C’ has a temperature
of 70◦C and a holding time of 40 seconds. For a process to be effective against a
particular microorganism it must lie above and to the right of the inactivation curve.
If the inactivation curves of all target microorganisms are known a ‘Safe Region’ can
be constructed. The ‘Safe Region’ is the area above and to the right of all inacti-
vation curves. ‘Process A’ will result in the desired inactivation of ‘Microorganism
B’, but not ‘Microorganism A’. ‘Process B’ will result in the desired inactivation of
‘Microorganism A’, but not ‘Microorganism B’. ‘Process C’ will result in the desired
inactivation of both ‘Microorganism A’ and ‘Microorganism B’.
For processes that do not have a constant temperature, that is T = T (t), equation
4.3 can be solved for log(f) and then integrated, resulting in equation 4.5.
log(f) =
∫ tf
0
−dt
D(10)T (t)−T0
z
(4.5)
The integral of equation 4.5 is typically not evaluated. It is common to approximate
a temperature varying process with a series of constant temperature processes and
then apply equation 4.1 iteratively [88; 40].
A more conservative method of determining the thermal lethality of a time varying
process is to calculate the cumulative time the process is above a given temperature,
T . For example, consider the two time varying processes shown if figure 4.3 : In
19
100
101
102
103
20
30
40
50
60
70
80
90
Time (s)
Tem
pera
ture
(° C
)
Ideal Microorganism AIdeal Microorganism BProcess AProcess BProcess C
SafeRegion
Figure 4.2: Inactivation Curves For ‘Microorganism A’ and ‘Microorganism B’. Only‘Process C’ will result in the desired reduction of both microorganism.
20
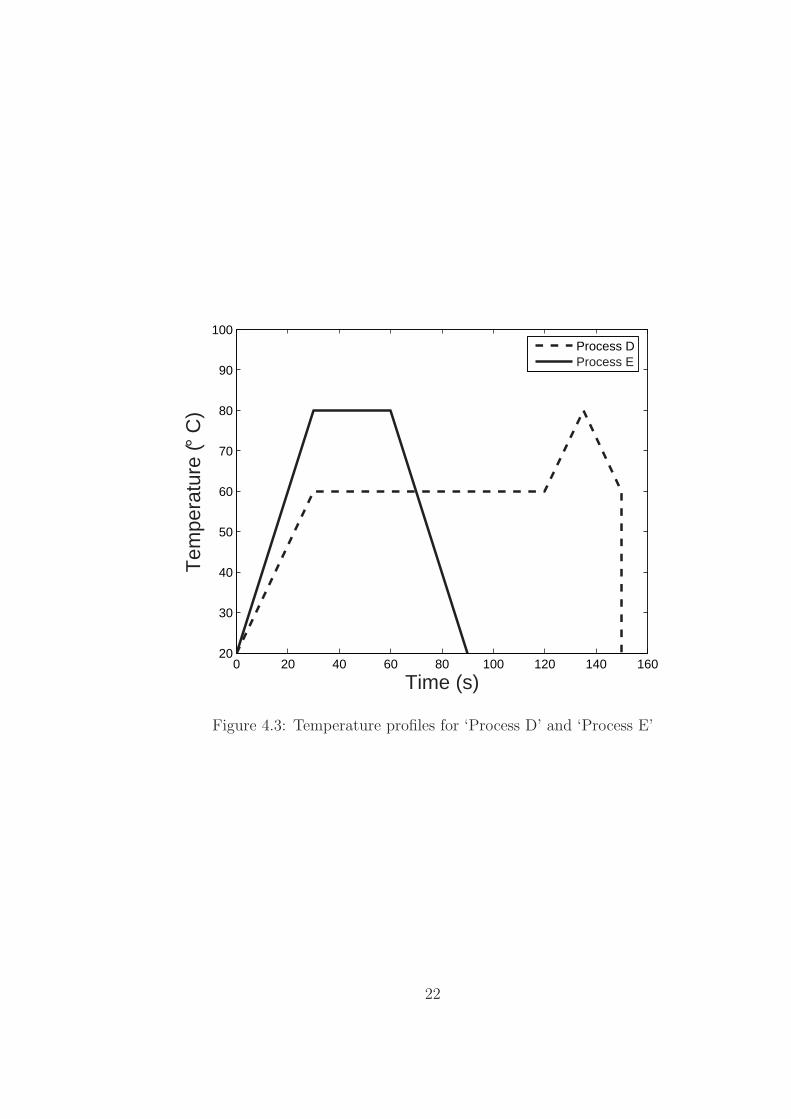
‘Process D’ (dashed line in figure 4.3) water is heated at a constant rate from 20◦C
to 60◦C in 30 seconds, held at 60◦ C for 90 seconds, heated from as a constant rate
from 60◦C to 80◦C in 15 seconds, cooled back to 60◦C in 15 seconds and then quickly
cooled to 20◦C . In ‘Process E’ (solid line in figure 4.3) water is heated at a constant
rate from 20◦C to 80◦C in 30 seconds, held at 80◦C for 20 seconds and then cooled
back down to 20◦C in in 30 seconds.
The cumulative time (in seconds) ‘Process D’, and ‘Process E’ are over tempera-
ture, T , are given by equations 4.6 and 4.7, respectively.
tD(T ) =
{34(60− T ) + 90 : 20 < T ≤ 60
32(80− T ) : T > 60
(4.6)
tE(T ) = (80− T ) + 20 : 20 < T ≤ 80 (4.7)
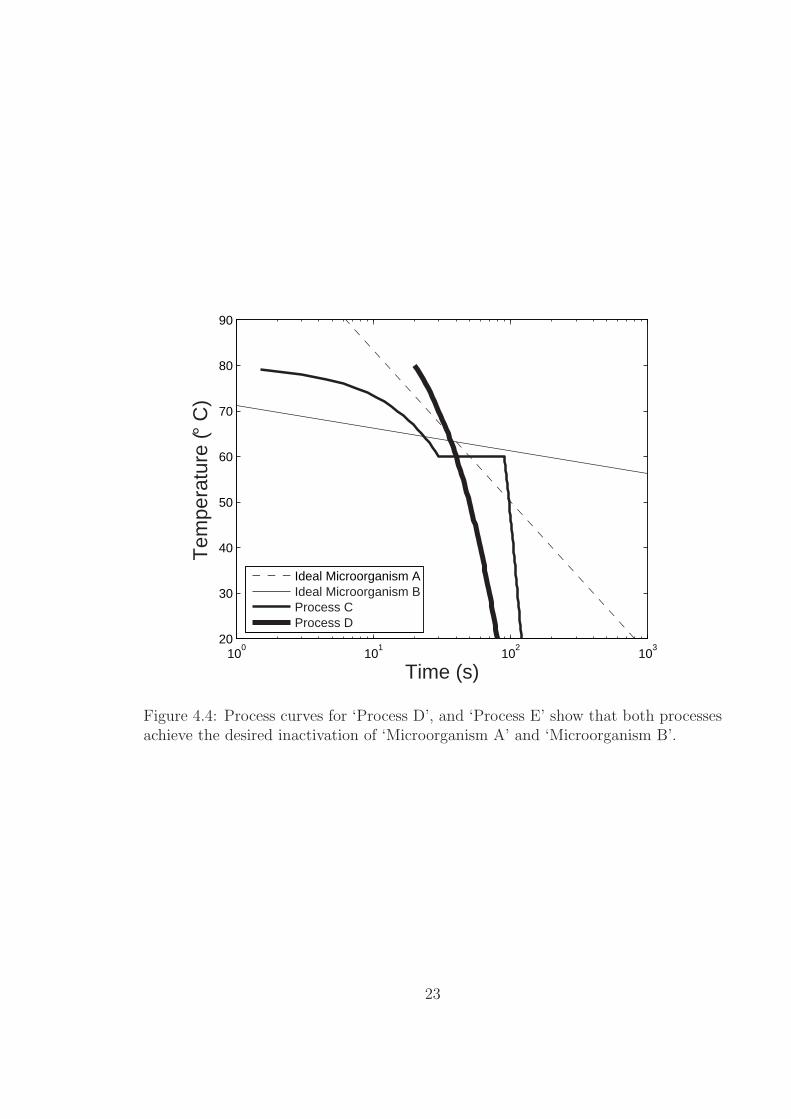
Figure 4.4 shows equation 4.6 for ‘Process D’ and equation 4.7 for ‘Process E’
overlayed on the survival curves of ‘Ideal Microorganism A’, and ‘Ideal Microorganism
B’. Since parts of both process curves lie above both inactivation curves, both process
will result in the desired inactivation of both microorganisms. Note that ‘Process D’
is not above both inactivation curves at the same time. The conservative method of
constructing a safe region from inactivation curves would reject ‘Process D’.
4.2.2 Deviations from Linear Behavior
Real microorganisms deviate from the linear behavior described in section 4.2.1 in a
few important ways.
The thermal inactivation of microorganisms in not completely exponential with
time. A typical survival curve is shown in 4.5. There are three distinct regions to this
curve, the shoulder, the linear region and the tail. At the start of heating the thermal
destruction may be slower than predicted by the D-value for the microorganism. It
is actually possible for the number of viable organisms to go up. There are a few
explications for the shoulder. First, some dormant cells may be thermally activated.
21
0 20 40 60 80 100 120 140 16020
30
40
50
60
70
80
90
100
Time (s)
Tem
pera
ture
(° C
)
Process DProcess E
Figure 4.3: Temperature profiles for ‘Process D’ and ‘Process E’
22
100
101
102
103
20
30
40
50
60
70
80
90
Time (s)
Tem
pera
ture
(° C
)
Ideal Microorganism AIdeal Microorganism BProcess CProcess D
Figure 4.4: Process curves for ‘Process D’, and ‘Process E’ show that both processesachieve the desired inactivation of ‘Microorganism A’ and ‘Microorganism B’.
23

0 5 10 15 20 25 300.00001
0.0001
0.001
0.01
0.1
1
Time (s)
Sur
vivi
ng F
ract
ion
Shoulder
Linear Region
Tail
Figure 4.5: Typical surviving fraction curve for a real microorganism. The shoulderand tail are departures from the log–linear model.
24
Second, cells clumped together or to other particles may heat up more slowly than the
fluid they are suspended in. Lastly the common method for determining the number
of viable bacteria is to grow the bacteria on auger plates and count the number of
colonies. If two or more cells are clumped together they will only form one colony.
Heating may break clumps apart and increase the number of colony forming units.
To account for the shoulder region a delay value can be used. If a delay value is
used, the D-value represents the inactivation rate after shouldering. For example the
data on figure 4.5 could be modeled with a delay of five seconds and a D-value of
approximately three seconds.
Organisms may also persist for longer than expected resulting in a tail. Tailing
is possibly caused by clumping, the existence of individual microbes with higher
than normal thermal tolerance, or from an increase in thermal resistance due to heat
stabilizing protein production triggered by the heating process itself[40]. The use of
a delay value does not correct the model for tailing.
Another way that real microorganisms deviate from ideal behavior is that the z-
values of real microorganisms are only constant for a narrow temperature range. This
means that results from experiments conducted in one temperature range should not
be extrapolated to other temperature ranges.
Because of the inaccuracies of the log–linear model other thermal inactivation
models are sometimes used[40; 88]. Since most researchers investigating the thermal
inactivation of microorganisms report results in terms of the log-linear model, other
models are not presented in this thesis.
4.3 Environmental conditions that affect thermal
resistance
The media that a microorganism lives in can affect its thermal resistance. In liquids
the amount and nature of suspended particles can change the thermal resistance of
25

microbes. Particles slow the heating process on a local level and provide thermal
protection to microbes. In solid foods the fat content can affect thermal stability.
Increasing the fat level tends to increase the thermal resistance of microbes (some
exceptions have been found [47]). Increasing the salt level has also been found to
greatly increase thermal resistance [61; 66]. The pH of the media can also affect the
thermal resistance. As a way to minimize the effect of pH microbes can be acid–
adapted. Acid–adapted microorganisms are cultured in a media that has the same
pH as the media used in the thermal inactivation test.
In addition to the media that the microorganism lives in, the thermal history
of the microorganism affects its thermal resistance. Many microorganisms produce
thermal stabilizing proteins. Microbes that have been thermally shocked (e.g. ex-
posed to a high temperature for a short amount of time) can have increased thermal
resistance[14; 40; 76].
4.4 Milk vs. Water Pasteurization
Milk has a long history of pasteurization and it may be tempting to assume that
adopting the same standards used on milk [22] would result in sufficient water treat-
ment. There are two reasons why this simple approach cannot be used. First, the
microbiological content of water and milk are different. Water has different microor-
ganisms with different contaminant concentrations . Second, and more important,
milk is treated as a perishable item. After pasteurization milk is required to be re-
frigerated and then consumed in a short amount of time or discarded[22]. Though raw
water does not contain the nutrients milk contains and microbe growth will therefore
not be nearly as rapid in water, growth is still possible in raw water. In most areas
where water treatment is needed there is no way to refrigerate water after treatment.
Water is not commonly thought of as perishable so any treatment method should
aim to give treated water a very long shelf life. This requires that any pasteurization
26
process used to treat water should aim to completely destroy all enteric pathogens.
4.5 Conclusion
This chapter has described the process of pasteurization and provided methods to
model thermal inactivation of microorganisms. Pasteurization is limited in two ways.
First, there are many microorganisms that thrive at high temperatures. So far no
pathogenic organisms have been found to be thermotolerant[17], but there is the
possibility that virulent organisms will develop thermotolerant strains or that ther-
motolerant organisms will develop virulence factors. The second limitation is that
pasteurization will not remove chemical contaminants. On a global scale microorgan-
isms are a much more common source of contamination [98], but pasteurization is not
an appropriate water treatment process in local areas where chemical contamination
is significant.
27
Chapter 5
Review of Thermal Inactivation ofWaterborne Pathogens at or NearHTST Pasteurization Conditions
This chapter reviews the thermal inactivation data for those microorganism that the
WHO has classified to have a high health significance[98]. To be consistent with
the conditions of typical flow-through solar water pasteurization systems, data was
collected from studies that had an operating temperature of at least 70◦C or showed
significant reduction in infectivity for holding times of one minute or less. Section 5.1
discusses preliminary information about thermal inactivation experiments. Section
5.2 presents the results of previous reviews of thermal inactivation data. Sections
5.3, 5.4, and 5.5 present thermal inactivation data for bacteria, viruses, and protozoa,
respectively. Section 5.6 concludes the chapter with a summary of the collected data.
In sections 5.3–5.5 data is only presented for those pathogens the WHO classified
to have a high health significance even if the original publication included other
microorganisms. In addition only data for the most pertinent suspension media,
temperature, and holding time are discussed.
Thermal inactivation data for guinea worm was not collected. Since the time
that the WHO classified the helminth to have a high health significance it has been
targeted for eradication. It is now confined to just 13 countries in Africa, with most
of the cases in Sudan where civil war and genocide have hindered the progress of
28
eradication[99].
5.1 Considerations in Reviewing Thermal Inacti-
vation Data
This section presents some important considerations when evaluating thermal inacti-
vation data. This section is not meant to be a review of microbiological techniques or
even as an introduction to microbiological techniques. This section is only intended
to give the reader sufficient background to understand the data presented in sections
5.2 through 5.5.
5.1.1 Media
As mentioned in section 4.3, the media a pathogen is suspended in during testing
can affect it’s thermal resistance. In addition, the media used for culturing or enrich-
ment as well as the temperature, length, and conditions of incubation may affect the
calculated pathogen concentration both before and after treatment.
Since the author of this thesis has no expertise in culturing waterborne pathogens
the culturing methods of individual researchers are not discussed in this chapter. The
interested reader should consult the original publications for details.
5.1.2 Heating Method
The method used to heat the test samples can greatly affect the results. In general
it is desirable to heat the samples to the process temperature as quickly as possible
and then, after the holding time, cool them as quickly as possible. There are two
classes of heating methods in thermal inactivation experiments; batch heating and
flow heating.
There are three common protocols used in thermal inactivation experiments. The
first method involves inoculating test tubes (or some other vessel) with a known
concentration of a microorganism and then submerging the sample in a constant
29
temperature water bath for a specified time. The disadvantage of this method is that
heating is not uniform and the thermal mass of the sample can create a significant
warm up period. The second method is to first place media filled test tubes in a
constant temperature water bath and then add a know concentration of the pathogen
after thermal equilibrium is established. This method results in uniform heating
without a significant warm up period. The disadvantage of this method is, if not
performed correctly, some microorganism may be deposited on the wall of the test
tube above the suspension media. The wall of the test tube may not reach the same
temperature as the rest of the sample, resulting in surviving pathogens[82; 91]. The
third batch method used is to inoculate capillary tubes and then submerge them in a
water bath. Capillary tubes have a large ratio of surface area to volume and therefore
heat much quicker than other vessels.
In all three methods it is important that the entire sample is submerged in the
water bath to ensure proper heating of all pathogens[91].
For liquids, flow heating can be accomplished with heat exchangers that rapidly
heat and then cool inoculated media. Heat exchanges can have significant thermal
mass so it is important that steady state temperatures are achieved before data is
collected. Juneja and Miller [48] provide the design for a Submerged Coil Heating
Apparatus (SCHA) in which inoculated media flows through a stainless steel coil
submerged in a water bath. From the coil the liquid is automatically dispensed into
test vials.
5.1.3 Enumeration Methods
To enumerate bacteria they are usually plated on media and then the number of
colonies is counted. For highly concentrated bacteria serial dilutions are made until a
countable number of colonies results. For low concentrations, samples can be added
to enrichment broth and incubated to increase the concentration to a measurable
30
level. By knowing the level of dilution (or enrichment) the concentration of colony
forming units (cfu) in the original sample can be calculated.
For viruses that can be cultured in the laboratory it is common to inoculate tissue
and then count the number of plaques. Plaques indicate cell infection. Through
dilution or enrichment the concentration of plaque forming units (pfu) in the original
sample can be calculated. Some viruses, most notably Norovirus cannot be cultured in
the laboratory[50]. To study these viruses either model viruses (that are expected to
have similar thermal resistance) are studied or volunteers are inoculated to determine
the effectiveness of a treatment process.
The most straight forward method to enumerate protozoa is through cytology in
which the number of viable organisms in a small sample are directly counted. Tissue
cultures can also be inoculated with samples of protozoa. Comparative analysis of
infectivity can then be used to determine the pathogen concentration.
Since the author of this paper has no expertise in enumerating waterborne
pathogens the enumeration methods of individual researchers are not discussed in
this chapter. The interested reader should consult the original publications for de-
tails.
5.1.4 Data Extrapolation
There are two ways in which thermal inactivation data is commonly extrapolated
from experiments. First, it is common to calculate z-values and then extrapolate
data to higher temperatures using the log-linear model. As mentioned in section
4.2.2, z-values are only constant over a limited range and extrapolation to different
temperature ranges may not be accurate. Second, it is common to measure the
rate of inactivation over a short time period and then assume a constant rate to
predict the inactivation level after a longer period. If the microorganism exhibits
any tailing, extrapolating to long holding times will result in large errors in the
31

predicted inactivation. Both types of extrapolation can result in an over estimate of
the effectiveness of a process. No extrapolation is reported in this chapter even if the
original author(s) included extrapolation in their results.
5.2 Existing Reviews of the Thermal Resistance of
Waterborne Pathogens
Several researches [17; 24; 85] that have investigated solar water pasteurization cite
the work of Feachem et al.[37] to establish the potential effectiveness of the pasteur-
ization process. Feachem et al. compiled the thermal inactivation studies for many
microorganisms and studied the typical contamination concentrations. From this in-
formation Feachem et al. predicted the minimum time and temperature requirements
for effective pasteurization processes and constructed a ‘Safe Region’. (The ‘Safe Re-
gion’ was constructed in in the same manner as the example in section 4.2.1 as shown
in figure 4.2.) Burch and Thomas [18] noted that of the data Feachem et al. collected
enteric viruses were the most resistant to high temperatures and proposed equation
5.1 as a way to calculate the minimum holding time, t, in hours required to effectively
inactivate viruses (and therefore all other microorganisms) as a function of the Celsius
holding temperature, T .
t = 1.47× 10⁷ × e−0.265T (5.1)
Unfortunately the data collected by Feachem et al. is for lower temperatures and
significantly longer holding times than those typical of flow-through solar water pas-
teurization processes. Equation 5.1 requires significant extrapolation and it’s validity
is not known.
In 1977 Larkin [51] completed an exhaustive review of the thermal inactivation
of viruses and concluded that heating to 71◦ C for one minute should provide ade-
quate protection. Since that time, Norovirus and Rotavirus have been identified as
important enteric pathogens.
32

5.3 Bacteria
Probably because they are the easiest microorganism to culture there is significant
information about the thermal inactivation of many waterborne bacteria. Unfortu-
nately most of the published data is for relatively low temperatures and long holding
times when compared to the typical operating conditions of a flow–through solar
water pasteurization system.
Bandres et al.[7] report thermal inactivation data for E. coli (ETEC), Shigella
sonnei, Salmonella B, and Campylobacter jejuni. For each microorganism, 100 ml of
water was initially inoculated to a concentration of 107 microorganisms per ml and
heated on a hot plate from 23◦C to 100◦C. Samples were removed after heating to
55◦C, 60◦C, 65◦C, 75◦C, and 100◦C.
The heating process was so slow that it is impossible to determine D-values. Only
very conservative estimates can be made. After heating for at least seven minutes
and reaching a temperature of 65◦C all microorganisms experienced at least a 6-
log reduction in concentration. The process of heating water from 23◦C to 65◦C is
certainly less lethal than a process with a constant temperature of 65◦C, so the lower
limit of the D65-value of all four microorganisms is 71 seconds.
Bradshaw, et al.[15] report the thermal resistance of 37 outbreak related strains
ofSalmonella typhimurium. Samples of milk were initially inoculated to a concentra-
tion of 105 cells/ml. The samples were dispensed into 13-mm by 100-mm borosilicate
glass tubes, sealed, and then heated in a water bath at 51.8◦C. In addition a represen-
tative strain, 4SCBS, was heated to four temperatures between 51.8◦C and 68.3◦C.
A D51.8-value of 24 minutes was reported for 13 strains isolated from patients
and a D51.8-value of 22.8 minutes was reported for 24 strains isolated from milk. A
D68.3-value of 0.9 seconds was reported for strain 4SCBS. The holding times and final
concentrations of the Salmonella were not reported. It is also not clear if there was
significant tailing during the heating process or if the D-values reported were adjusted
33

for shouldering[16].
D’Aoust, et al.[28] studied the thermal inactivation of 15 strains of Campylobacter,
15 strains Yersinia enterocolitica, and ten strains of Escherichia coli 0157:H7 in milk.
For each microorganism milk was initially inoculated to a level of approximately 105
cfu/ml. Samples were heated in regenerative plate pasteurizer operated from 60◦C
to 72◦C with a holding time of 16.2 seconds.
Heating to 60◦C resulted in a 2-log reduction in E. coli and a 4-log reduction in
both Yersinia enterocolitica and Camylobacter. There were no detectable survivors
for any of the microorganisms when heated to at least 64.5◦C. The detection limit
was not reported.
Evans et al.[35] used a plate heat exchanger to study the heat resistance of ten
strains of Escherichia coli, five strains of Salmonella typhosa, and five strains of
Shigella dysenteriae.
The most resistant strain of Escherichia coli went from an initial concentration
of 2 x 10⁶ cfu/ml to a final concentration of less than 10−3 cfu/ml when heated to a
maximum temperature of 76.7◦C for a total heating and cooling time of six seconds,
resulting in a D76.7-value of 0.25 seconds.
The most resistant strain of Salmonella typhosa, ATCC 9993, went from an initial
concentration of 2× 10⁶ cfu/ml to a final concentration of less than 5× 10⁻³ cfu/ml
when heated to a maximum temperature of 73.9◦C for a total heating and cooling
time of six seconds, resulting in a D73.9-value of 0.21 seconds.
The most resistant strain of Shigella dysenteriae, ATCC 9683, went from an initial
concentration of 106 cfu/ml to a final concentration of less than 5×10⁻³ cfu/ml when
heated to a maximum temperature of 71.1◦C for a total heating and cooling time of
six seconds, resulting in a D71.1-value of 0.20 seconds.
Groh et al. [41] studied the thermal resistance of Escherichia coli. Flasks of water
were heated to 50◦C, 60◦C, 70◦C, and 100◦C. Each flask was then inoculated with
34

E. coli to a concentration of approximately 5 x 10⁵ cfu/ml. 0.001 ml was removed
immediately after inoculation and again after 1 minute, 5 minutes and 10 minutes.
For water heated to 70◦C or higher no survivors were detected. Due to the methods
used the minimum detectable concentration was relatively high compared to other
studies.
Line et al. [54] studied the thermal resistance of Escherichia coli 0157:H7 in
ground beef. Beef was inoculated to a concentration of 107 cells/gram. One gram
samples were then heated to 62.7◦C for 15 seconds, 30 seconds, and 45 seconds. There
was no noticeable shouldering or tailing and D62.7-value of 18 seconds was calculated.
Lovett et al.[55] studied the thermal inactivation of three strains of Yersinia en-
terocolitica in milk. 1.5 ml samples with an initial concentration of 107 to 2 × 10⁷
cfu/ml were place in 13-mm x 100-mm Pyrex tubes and then heated in water baths.
The heating temperature varied from 51.7◦C to 68.3◦C. Samples were removed in
thirty second intervals. For the most resistant strain, C 1017, a D62.8-value and a
D68.3-value of 57.6 seconds and 5.4 seconds were calculated, respectively. The ob-
served holding time was adjusted to account for the heating and cooling process as
described in Anelliss et al.[3].
Mak et al.[56] studied the thermal inactivation of a six strain cocktail of Es-
cherichia coli O157:H7 and three strain cocktail of of Salmonella spp. in apple cider
using a plate heat exchanger. A 5-log reduction in both nonadapted and acid-adapted
E. coli was found for a process with a 14 second holding time and a temperature of
68.1◦C. 14 seconds at 71.1◦C resulted in a 6.6-log reduction of E. coli. For Salmonella
a 5-log reduction was achieved in 14 seconds with a temperature of 65.6◦C.
Mazzotta [58] studied the thermal resistance of acid-adapted Escherichia coli
O157:H7 and Salmonella enterica in fruit juices. Flasks containing 150 ml of juice
were heated in a constant temperature water bath. Once an equalibrium temperature
was reached the flasks were inoculated with the microorganism to an initial concen-
35

tration of approximately 105 cells per ml. The final concentration and holding times
wsere not reported. The D60-values of acid adapted E. coli were calculated to be
1.5 minutes, 1.7 minutes, and 1.2 minutes in apple, orange, and white grape juice,
respectively. The maximum D62-value of acid adapted Salmonella was calculated to
be 12 seconds, 30 seconds and 22 seconds in apple, orange, and white grape juice,
respectively.
Michalski et al.[61] used capillary tubes to study the thermal resistance of
Salmonella enteritidis in egg products. Liquid hole eggs were inoculated with 109
to 1010 cfu/ml. Capillary tubes were filed with 100 µm of inoculated egg and then
placed in a 64◦C water bath. Tubes were removed and immediately placed in an
ice bath after three, six, nine and twelve seconds. A D64-value of 2.4 seconds was
calculated.
Palumbo et al. [66] studied the thermal resistance of Salmonella in egg products.
0.5 ml samples with initial concentrations of 8.5× 10¹⁰ to cfu/ml were placed in 15-
mm x 60-mm glass vials and placed in a 64.4◦C water bath. Timing started when the
sample reached the bath temperature. Final concentrations and holding times were
not reported, but there was no noticeable tailing. A D64.4-value of 18 seconds was
reported.
Shultz et al. [78] studied thermal inactivation of Vibrio cholerae in peptone water.
13 mm x 100 mm tubes were filled with 6-ml samples having an initial concentration
of 106 cells/ml. The tubes were submerged in a 63◦C water bath. The tubes were
removed at fixed intervals and cooled in an ice bath. Tubes were submerged up to
2.67 minutes and a 7-log reduction was calculated to take 2.59 minutes resulting in a
D63-value of 21.6 seconds.
Sorqvist [82] investigated the thermal resistance of three strains of Yersinia en-
terocolitica two stains of Campylobacter coli, and one strain of Campylobacter je-
juni. Capillary tubes were inoculated with initial concentrations between 106 and
36

107 cfu/ml. After inoculation, the capillary tubes were placed in a 60◦C water bath.
Yersinia samples were heated for 15, 30, 60, 90, 120, and 150 seconds. Campy-
lobacter spp. samples were heated for 10, 15, 20, 25, 30, 40, and 45 seconds. After
heating the capillary tubes were cooled in ice water. For the most resistant strain of
Yersinia enterocolitica the D60-value was calculated to be 33 seconds. The D60-value
of Campylobacter jejuni and Campylobacter coli were calculated to be 7.8 and 10.2
seconds, respectively.
Toora et al. [92] studied the thermal resistance of Yersinia enterocolitica in whole
and skim milk. Two flasks, one containing 99-ml of skim milk and one containing
99-ml of whole milk were preheated in a water bath to a temperature of 62.8◦C. 1-ml
of a six strain cocktail was then added to both flasks. The initial concentration in the
flasks was 1.5 × 10⁷ cfu/ml. Small samples were then removed from the flask after
10, 20, 30, 40, 50, and 60 seconds and cooled in an ice bath. D62.8-values of 10.5 and
10.3 seconds were calculated for whole and skim milk respectively.
5.4 Viruses
There is limited information about the thermal inactivation of viruses at high tem-
peratures. Culturing viruses (when possible) is generally more complicated than
culturing bacteria. Unfortunately enteric viruses often have higher thermal resis-
tances than enteric bacteria so bacteria cannot be used as indicator organisms. An
additional complication with viruses is that it is possible to destroy a virus, but not
destroy the RNA of the virus. The liberated RNA may also be infectious[52].
Bidawid et al. [10] studied the thermal resistance of Hepatitis A (HAV) in skim
milk, whole milk, and cream. U-shaped capillary tubes were inoculated with 100-µm
of milk with an initial concentration of 2 × 10⁶ pfu/ml and then placed in constant
temperature water baths of various temperatures. Samples were exposed to 75◦C for
0.5, 1, 2, 4, 6, 8, 10, 12, 14, and 16 minutes. Samples were exposed to 80◦C for 0.5, 1,
37
1.5, 2, 2.5, 3, 3.5, 4, 5, and 6 minutes. Samples were exposed to 85◦C for 0.5, 1, 1.5,
2, 2.5, 3, 3.5, and 4 minutes. Measurement of titer levels was done by plaque assay.
The time required for a 5-log reduction in the titer of skim milk for exposure at 75◦C,
80◦C, and 85◦C was 5.45 minutes, 36 seconds, and less than 30 seconds, respectively.
Significant tailing was experienced at all temperatures. Titer reduction beyond 5-log
could not be measured.
Parry and Mortimer [68] studied the thermal inactivation of Hepatitis A Virus
in milk and phosphate-buffer saline. A tissue culture method was used to determine
the effectiveness of the process. First cells were infected with known concentrations
of HAV and the antigen production was measured. This correlation was used to
determine the titer of treated samples. Heating to at least 80◦C for at least 5 seconds
resulted in no detectable level of residual infectivity. From the reported data it
appears that the maximum detectable reduction was 3-log.
Slomka and Appleton [79] studied Feline Calicivirus as a model system for
Norovirus. Norovirus, a small round structured virus cannot be cultured in the lab-
oratory, but feline calicivirus can be cultured and has similar structure. Infected
cockles were boiled and there internal temperature was monitored. After boiling for
30 seconds the average internal temperature was under 65◦C and no inactivation
was detected, after 1 minute the average internal temperature was 78◦C and no virus
could be cultured from the cockles, but RNA was still detectable via RT-PCR (reverse
transcription polymerase chain reaction) until 2 minutes when the average internal
temperature was approximately 95◦C.
Stazynski et al.[87] studied the thermal inactivation of Poliovirus type 1 (an en-
terovirus) in water. The infectivity before and after treatment was determined by
plaque-titration. Heating to 72◦C for a holding time of 30 seconds resulted in at least
a 5-log reduction in titer.
Sullivan et al. [89] studied the thermal resistance of severl viruses including Ade-
38
novirus 12. A conservative D52-value for adenovirus is given as 20 minutes. A 12-log
reduction is predicted in 2.02 minutes at 60◦C, but it is unclear how much extrapo-
lation was done to reach that figure.
Van Donsel et al. [93] studied the thermal resistance of human and simian Ro-
taviruses. Titers were measure by plaque assay. It is not clear what holding times
were used or what the final concentration was but a D65-value of 2.5 minutes was
calculated for human Rotavirus with a z-value of 4.33C◦. In order to fit the data to
the log-linear model the initial concentration data points were ignored as suggested
by Block [12].
White et al. [97] studied the thermal resistance of the enterovirus Coxsackie
virus B-5 (Faulkner Strain). Suspensions of tissue culture maintenance medium were
sealed in capillary tubes. The initial and final titer were compared with tissue culture
methods. Heating to 80◦C resulted in over a 6-log reduction in infectivity.
5.5 Protozoa
Protozoa present a special challenge to water treatment processes for three reasons:
First, they form cysts that are resistant to chemical treatments. Second, they are
motile and able to defeat filtering efforts. Third it only takes one organism to cause
an infection in an individual[84].
Apart from Cryptosporidium there is little data on the thermal inactivation of
waterborne protozoa. Other researchers that have attempted collected thermal in-
activation data have also found little information for temperatures above 70◦C or
holding times of one minute or less [5; 6; 60; 64; 80].
Deng and Cliver [29] studied the thermal inactivation of Cryptosporidium parvum
in apple cider. 1.485 ml samples of cider were heated to 71.1◦C and then 15-µm of
oocyst stock was added, resulting in and initial concentration of 106 oocysts/ml. The
cider was heated for 5, 10 and 20 seconds and then immediately cooled in an ice bath.
39
Heating for 5 second produced a 4.8 log reduction in infectivity and heating for 10 or
20 seconds resulted in at least a 5-log reduction in infectivity.
Fayer [36] studied the thermal inactivation of Cryptosporidium parvum in water.
5-ml samples of distilled water with a oocyst concentration of 106 oocysts/ml were
heated in a metal block thermal DNA cycler to various temperatures. After heating
for 1.25 minutes the samples were cooled and then orally inoculated into mice. Steady
state temperatures were not achieved. It was found that those samples that had a
temperature of at least 72.4◦C at the end of heating had no infectivity in mice.
Harp et al. [42] studied the thermal inactivation of Cryptosporidium pavum in
water and milk. Suspensions of water and milk with oocyst concentrations of 108 per
ml were processed in an Armfield FT43A Laboratory Pasteurizer at a temperature of
71.1◦C for holding times of 5, 10, and 15 seconds. Samples were then orally inoculated
in mice. In all cases (total of 177 mice) no infectivity was found.
Ongerth et al.[65] studied the thermal resistance of Giardia lamblia and Giardia
muris. Cycst were added to water that was heated to 50◦C, 60◦C, and 70◦C for
ten minutes. Cyst viability was determined by excystation and by staining. Heating
to 50◦C and 60◦C resulted in a 95% and a 98% reduction in viability, respectively.
Heating to 70◦C resulted in no detectible survivors.
Schaefer et al.[76] studied the thermal inactivation of Giardia muris. Viable cells
were counted before and after heating to various temperatures for ten minutes. No
viable cells were found for temperatures above 54◦C.
Though no details are given and it is not clear what original work is referenced,
Feachem et al.[37], report a 5-log reduction in Entamoeba histolytica in one minute.
5.6 Conclusion
Table 5.1 summarizes the thermal inactivation data presented in sections 5.3–5.5.
Only studies that produced at least a 5-log reduction in contamination were included
40
and only if final concentration values or holding times were specified.
From the published data any process that heats water to at least 65◦C for two
minutes and at least 80◦C for more than one minute should provide a least 5-log
reduction in the infectivity of Camplylobacter spp., Escherichia coli, Salmonella spp.,
Shigella spp., Vibrio cholerae, Yersinia enterocolitica, Hepatitis A, Poliovirus type 1,
Coxsackie virus B-5, and Cryptosporidium parvum.
High temperature thermal inactivation data is needed for Vibrio cholera, many
viruses families, particularly Rotavirus which had exhibited high thermal resistance
at 65◦C, and the protozoa Entamoeba histolytica and Giardia spp..
The lack of thermal inactivation data for Rotavirus is worrisome since it is believed
to be the cause of 20% to 70% of all diarrhea associated hospitalizations in developing
countries[67].
The effectiveness of a water treatment process depends on the makeup of the wa-
ter being treated. No process can guarantee complete inactivation of all pathogens
under all circumstances. The time required for a 5-log reduction was chosen as a
baseline. For water with high concentrations of pathogens, the times indicated in
table 5.1 may not be sufficient to eliminate the infection risk. To increase the effec-
tiveness of the treatment, pasteurization should be combined with filtering (roughing
filters and/or slow sand filtration) and proper handling of treated water to avoid
recontamination[17].
41
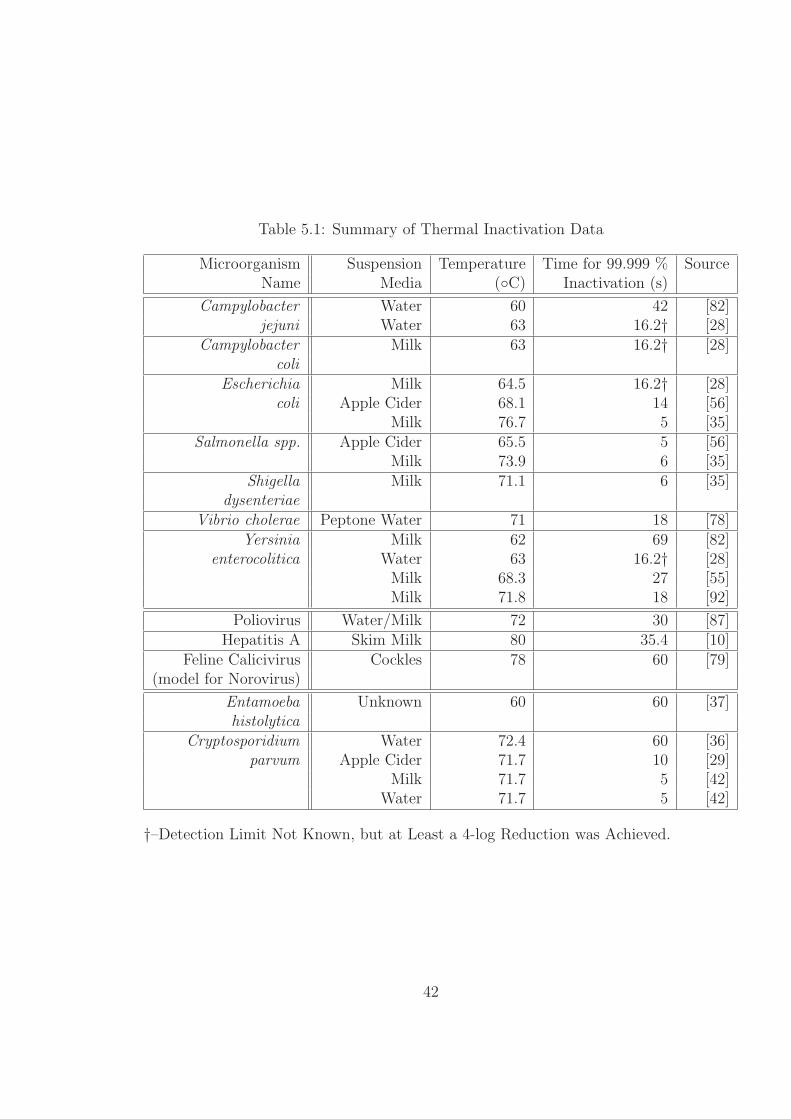
Table 5.1: Summary of Thermal Inactivation Data
Microorganism Suspension Temperature Time for 99.999 % SourceName Media (◦C) Inactivation (s)
Campylobacter Water 60 42 [82]jejuni Water 63 16.2† [28]
Campylobacter Milk 63 16.2† [28]coli
Escherichia Milk 64.5 16.2† [28]coli Apple Cider 68.1 14 [56]
Milk 76.7 5 [35]Salmonella spp. Apple Cider 65.5 5 [56]
Milk 73.9 6 [35]Shigella Milk 71.1 6 [35]
dysenteriaeVibrio cholerae Peptone Water 71 18 [78]
Yersinia Milk 62 69 [82]enterocolitica Water 63 16.2† [28]
Milk 68.3 27 [55]Milk 71.8 18 [92]
Poliovirus Water/Milk 72 30 [87]Hepatitis A Skim Milk 80 35.4 [10]
Feline Calicivirus Cockles 78 60 [79](model for Norovirus)
Entamoeba Unknown 60 60 [37]histolytica
Cryptosporidium Water 72.4 60 [36]parvum Apple Cider 71.7 10 [29]
Milk 71.7 5 [42]Water 71.7 5 [42]
†–Detection Limit Not Known, but at Least a 4-log Reduction was Achieved.
42
Chapter 6
Review of Solar WaterPasteurization
There are four ways in which solar energy is used to treat water that contains micro-
bial contaminants. These methods are: distillation, UV disinfection, photochemical
treatment, and pasteurization. Each of these processes is described in chapter 3. This
chapter will review the current research in the area of solar water pasteurization. A
review of the other methods of solar water treatment can be found in [17; 26; 39].
Pasteurization systems can be broken into three categories based on their operation.
Section 6.1 reviews batch systems. Section 6.2 reviews flow-through systems that
use a thermostatic valve to control flow. Section 6.3 reviews valve less flow-through
systems that use the density difference between two columns of water to control flow.
Section 6.4 concludes the chapter.
6.1 Batch Systems
In batch systems a fixed amount of water is placed into a container that gets heated
by the sun. After the water has reached a specified temperature for an adequate
amount of time it is emptied into a clean water storage vessel for later use. Batch
systems typically use some form of visual indicator to signal when pasteurization is
complete. One simple indicator consists of a glass tube that contains solid soybean
fat. When the pasteurization temperature is reached the fat melts and flows into the
43
lower section of the tube[2].
One way to batch heat water is to place jugs into a solar oven. Ciochetti et al.[23]
constructed a solar cooker out of an insulated cardboard box, a glass cover, and an
aluminum foil reflector attached to the lid. The inner dimensions of the cooker were
0.70 m x 0.49 m x 0.35 m. Two 3.7 liter black jugs were placed inside the cooker. By
adjusting the cooker so that it faced the sun every hour, water was heated from 20◦C
to over 68◦C in six hours.
A solar puddle can also be used to batch pasteurize water. A solar puddle consists
of a black absorbing layer of plastic covered by a small layer of water. A layer of clear
plastic covers the water to reduce thermal and evaporative losses. Water is siphoned
out of the puddle at the end of the day. Andreatta, et al. experimented with solar
puddles in Berkeley, California. They found that in full sun a solar puddle with a
depth of 21.5 mm reached a peak temperature of above 75◦C. A 2 m by 6 m puddle
can treat over 200 liters of water per day[2].
In another study reflectors were used to concentrate sunlight on glass bottles that
contained water contaminated with E. coli and bacteriophage T2. When black bottles
were used on sunny days, 1.4 liters of water reached a temperature of 70◦C in 1.5 to
2 hours. Both E. coli and T2 were fully inactivated within 1.5 hours[73].
SUN, Inc. manufactures a batch pasteurizer that consists of a 19-liter storage
tank inside an evacuated glass tube. The system generally produces one batch per
sunny day. Since the system is capable of storing energy from day to day it is possible
for it to produce two batches during one day. It will only produce two batches when
several sunny days occur consecutively[17].
When clear containers are used, pasteurization and UV disinfection occur simul-
taneously. Joyce et al.[46] experimented with clear plastic 2-liter soda bottles. Water
contaminated with E. coli was exposed to full Kenyan sunshine for at least seven
hours. No viable organisms were found at the end of the day or within twelve hours
44
of treatment.
Sommer et al.[81] report the findings of many laboratory and field investigations.
Using plastic bags is much more effective than using glass or plastic bottles. Plastic
bags transmit more UV radiation than either plastic or glass bottles. UV intensity
decreases rapidly with increasing water depth. Flat plastic bags typically have a
depth much less than water in bottles.
McGuigan et al.[59] performed controlled experiments to determine the relation-
ship between temperature, UV exposure, and microbe inactivation. Tests were per-
formed on E. coli at two turbidity levels, three temperatures and three radiation
levels. The tests showed that even small levels of UV radiation could improve the
pasteurization process. During an eight hour period clear water maintained at 45◦C
and exposed to 40mW/cm2 of radiation experienced a 4-log reduction in viable E.
coli. Water maintained at 45◦C for eight hours, but not exposed to light experienced
almost no reduction in viable E. coli.
Similar tests were performed by with a flat plate collector that had a UV transmit-
table plastic cover sheet. Rijal et al. reported 3-log reductions in the concentrations
of faecal coliform, and a 4-log reduction in FRNA virus with 2-5 hour exposure to
sun when the temperature of the water reached at least 60◦ C[71].
6.2 Flow–Through Systems with Valves
Figure 6.1 shows a schematic for a typical flow-through solar pasteurization system.
Water from a contaminated supply is preheated in a heat exchanger. A solar collector
then heats the water to the desired pasteurization temperature. Often a flow control
valve is used to make sure the water leaving the collector is at the desired temperature.
Upon leaving the collector the water enters a holding tube. The holding tube is sized
to make sure the water stays at an elevated temperature for the desired time. Once
the water has been pasteurized it enters the heat exchanger again to preheat the
45

Figure 6.1: Schematic of a Flow–Through Solar Water Pasteurization System.
incoming water. Treated water is collected in a reservoir for later use. Flow-though
systems offer advantages over batch systems. A batch process requires a fixed amount
of energy to achieve pasteurization. The amount of energy needed to raise the entire
vessel to the pasteurization temperature must be collected. If slightly less energy is
collected then no purified water is produced. Energy is lost if a vessel is allowed to heat
beyond the pasteurization temperature before it is emptied and refilled. For batch
processes to be effective one must estimate the amount of energy that will be available
[2]. In a properly designed flow-through system water is treated continuously based
on the amount of energy collected. The flow rate through the collector is regulated
by the available energy. Another advantage of flow through systems is that they
can more easily incorporate heat exchangers to preheat untreated water with treated
water. This greatly reduces the amount of solar energy needed[17].
PAX World Services produced a flow-through system that consisted of 15 to 18
meters of coiled black tubing enclosed in a glass covered solar cooker. The unit
controlled flow with an automotive thermostat set to open at 83.5◦C and produced
16 to 24 liters per day [2]. The tested unit did not contain a heat exchanger. A simple
heat exchanger has been built and independently tested. With the heat exchanger
46
the PAX system is projected to produce 80-96 liters of water[2]. This projection is
probably optimistic since it does not take into account the thermal capacity of the
heat exchanger. The thermal mass of the heat exchanger can result in production
rates much less than those predicted with a steady state model[85; 86].
Anderson et al.[1] used a parabolic trough solar concentrator to pasteurize water.
The receiver of the collector consisted of three concentric pipes. Untreated water was
fed into one the end of the pipe through the outer annulus. When the pasteurization
temperature was achieved an automotive valve at the far end of receiver opened to
allow the water to flow into the inner annulus. Solar radiation and the treated water
flowing through the inner annulus simultaneously heated water in the outer annulus.
This system produced 2500 liters per day with an aperture area of 28 m2.
Jorgensen et al.[45] used flat plate solar collectors to pasteurize water. An ad-
justable thermostat valve was used to control flow. The affect of the valve set point
on the inactivation of microorganisms was studied. A set point of 75◦C was rec-
ommended to ensure inactivation of E. coli, Streptococcus faecilis, and Salmonella
typhimurium. The collector treated about 50 l/m2 per day.
A flat plate solar water pasteurizer with an integral heat exchanger was designed
and tested by Stevens et al.[85; 86]. The system controlled flow with an automotive
thermostat that required the water to be heated to about 75◦C. After a significant
warm-up period the system was capable of treating up to 55 l/(hr-m2). The large
warm up period (as much as three hours) was caused by the large thermal mass of
the water in the system.
Safe Water Systems produces a flat plate solar pasteurization system. The system
uses a custom designed valve to pasteurize water at a temperature of 79◦C. The
collector has an area of 3.7 m2. With a heat exchanger, the system can produce up
to 95 liter per hour during steady operation and up to 760 liters per day[74]. The
effectiveness of the system in destroying several microorganisms has been tested. The
47
system tested did not include a heat exchanger and only treated 30 liters per day. The
system was able to produce over a 5-log reduction in fecal indicator bacteria as well as
Salmonella and MS2 viruses[38]. A system that incorporates a heat exchanger may
not provide the same results since the water would not be at an elevated temperature
for the same amount of time.
Like batch systems the effectiveness of flow through pasteurization systems can be
increased if they are combined with UV treatment. Sommer et al.[81] built and tested
a combined solar water treatment reactor. The system heated water in a collector
to about 50◦C and then exposed it to solar radiation. The system has been tested
and proven effective against faecal coliforms. The system produced about 100 liters
of treated water per square meter of solar collector per day.
Saitoh et al. built a solar box cooker to heat water in a glass container that
allowed exposure to UV radiation. The system incorporated a heat exchanger to
increase throughput. The system heated water to above 70◦C and produced between
8 and 10 liters of water per day for an aperture area 0.27 m2[75].
6.3 Density Driven Flow–Through Systems
In a valve-less system the flow is controlled by the density difference between a hot
and cold column of water as first proposed by Boettcher et al.[13]. The operation of
a density difference system relies on the fact that the density of water decreases with
temperature (above 4◦C). A column of warm water can be supported by a slightly
shorter column of cool water. Untreated water is fed to the system from a fixed
height. Water flows through the collector and then must pass through a riser tube
that is slightly higher than the feed water reservoir. Flow will not occur unless the
water in the riser tube is warm enough. The relative height of the water columns can
be adjusted to achieve a desired outlet water temperature.
Bansal et al. [8] conducted experiments with a density driven water treatment
48
system. One experiment was conducted with evacuated tube collectors in Juelich,
Germany. Another experiment was conducted with flat plate collectors in New Delhi,
India. The evacuated tube collector produced about 10 liters of water per kWh of
solar radiation, while the flat plate collector produced about 3.5 liters of water per
kWh of solar radiation. Both collectors had an outlet temperature of about 95◦C.
Cobb [24] constructed a simple pasteurization system out of a two concentric
copper pipes. The outer pipe was painted black and the pipes were placed under a
glazing. Water flowed from a fixed inlet reservoir through the outer pipe. When the
temperature in the outer pipe reached 85◦C it spilled over into the inner pipe. The
system reached a maximum flow rate of about 4.2 liters per hour for a collector area
of 0.56 m2.
6.4 Conclusion
This chapter has presented the work other researches have done in the field of solar
water pasteurization.
49
Chapter 7
Design Development
This chapter reviews the previous work done at Colorado State by the author and
his advisor, Professor William S. Duff. The results of the preliminary experiments
run with the systems described in this chapter led to the design of the valve-less
flow-though water pasteurization described in chapter 8. Section 7.1 describes the
experiences encountered when using a thermostatic valve to control flow in a flow–
through system. Section 7.2 presents the results of a preliminary valve–less system.
7.1 Valved System
The first flow-through system built and tested contained an off-the-shelf automotive
thermostat to control the flow of water [32]. In this system water flowed from an
upper reservoir through a heat exchanger where it was pre-heated by hot treated
water that was returning from the collector. The water then flowed through an
evacuated tube solar collector where it reached its maximum temperature of about
85◦C. If it was warm enough the water passed through the control valve and then
flowed back through the heat exchanger and into a treated water reservoir.
The automotive thermostats used were not on/off valves. Typically they went
from being fully open to fully closed over a temperature range of about 10 C◦. This
allowed the valve to regulate the flow of water for varying sunlight conditions. If
the incident radiation increased, the temperature of the water increased, and caused
50

the valve to become more open. This increased the flow rate of water through the
collector. If the incident radiation deceased the temperature dropped and the valve
closed a little to decrease the flow rate.
Though the valve was successful in controlling the temperature and flow rate of
the water for several hours during a given test day, the valve was unable to control
flow throughout an entire test day.
The valve had difficulty controlling the system flow, because the temperature of
the water in the heat exchanger would warm up throughout the day. Early in the day,
when the water in the heat exchanger was cool, the collector needed to heat the water
passing through it by more than 60 C◦. Later in the day, after the heat exchanger
had warmed up, the collector only needed to heat the water about 10 C◦. For similar
solar intensities the flow rate in the afternoon needed to be about six times higher
than the flow rate in the early morning. The valve could not satisfy both of these
conditions.
The height/pressure of the supply reservoir was adjusted to help tune the flow
of the system. When the height/pressure of the supply reservoir was too low the
flow rate in the afternoon was not high enough. With too little flow the system over
heated, and periodic boiling occurred as shown in figure 7.1.
Boiling is undesirable for two reasons: First, the system is not designed to re-
tain vapor. The energy used to evaporate water is lost and this reduces the daily
production of the system. Second, and most important, boiling may cause water to
be pushed through the system before it has been properly heated which may lead to
contamination of the treated water reservoir.
If the height/pressure of the supply reservoir was raised so that the valve could
regulate flow in the afternoon, the system performed poorly at startup. At the begin-
ning of the day the valve would start closed. As sunlight hit the collector the water
inside the collector was heated. The water surrounding the valve was heated via con-
51
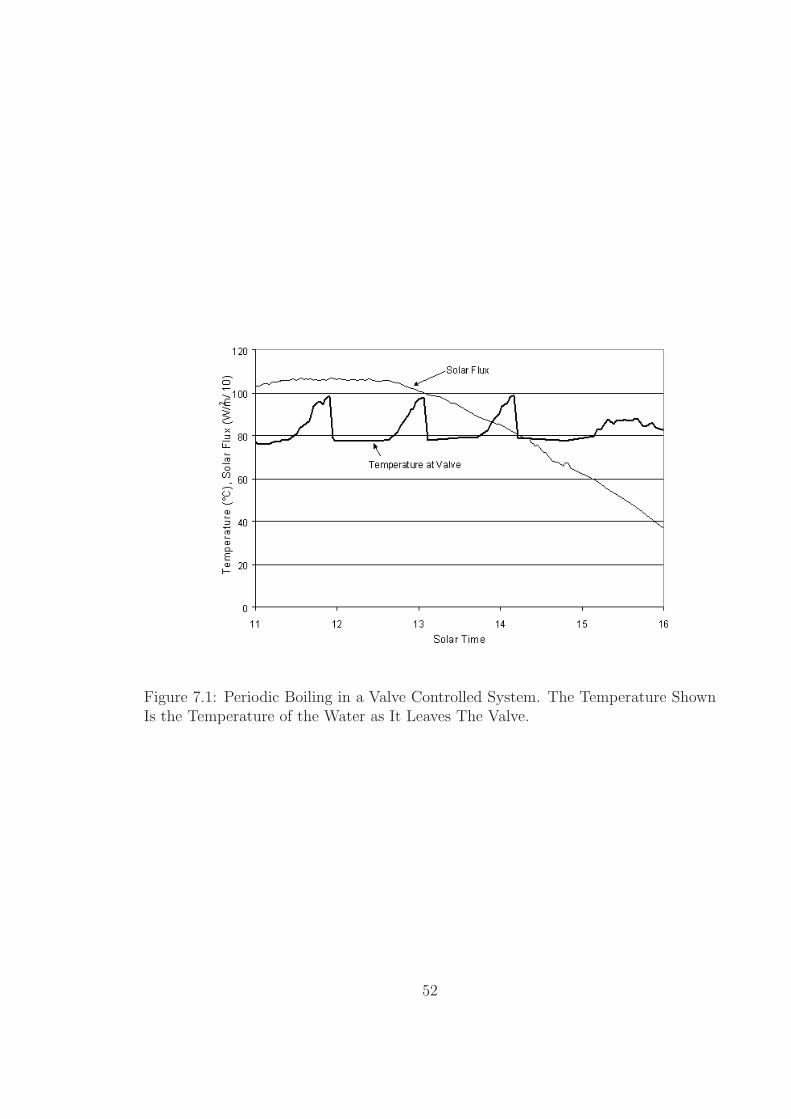
Figure 7.1: Periodic Boiling in a Valve Controlled System. The Temperature ShownIs the Temperature of the Water as It Leaves The Valve.
52
duction and convection currents by the water inside the collector. When the water
surrounding the valve reached the set-point temperature the water in the collector
was at a much higher temperature. When the valve would first open, hot water from
inside the collector would begin to pass through the valve. This caused the valve to
open even more and the flow rate would increase rapidly. As cool water from the heat
exchanger made its way through the collector the temperature at the valve would start
to drop. If the flow rate of the water was too high, the temperature would drop too
quickly for the valve to respond and water that had not been properly heated would
pass through the valve. Often as cooler water passed through the system the valve
would completely close and the cycle would repeat several times at the beginning of
the day.
Several attempts were made to find an intermediate supply reservoir
height/pressure, but on all test days the system either allowed untreated water to
flow in the morning or experienced boiling in the afternoon.
7.2 Simple Density-Difference Control
Because of the difficulties encountered with thermostatic valves a density driven sys-
tem was built and tested[32]. Figure 7.2 shows a schematic of the system. In this
system the untreated water reservoir was maintained at a height of approximately
100” (254 cm). During operation water would flow from the supply reservoir through
a pipe (the collector tube) that was clamped to the condensers of five heat pipe solar
collectors with a total absorber area of 0.45 m2. The heated water then had to flow
out of a pipe (the riser tube) that was at a height of 102 3/4” (260.9 cm). These
heights were chosen because a 20◦C column of water (with a density of 998.2 kg/m3)
can support a column of 80◦C (971.8 kg/m3) that is 1.027 times taller. The supply
water could be cooler than 20◦C, but even if the supply had the average density of
5◦C water (1000 kg/m3) the treated water would not spill over until it has the average
53
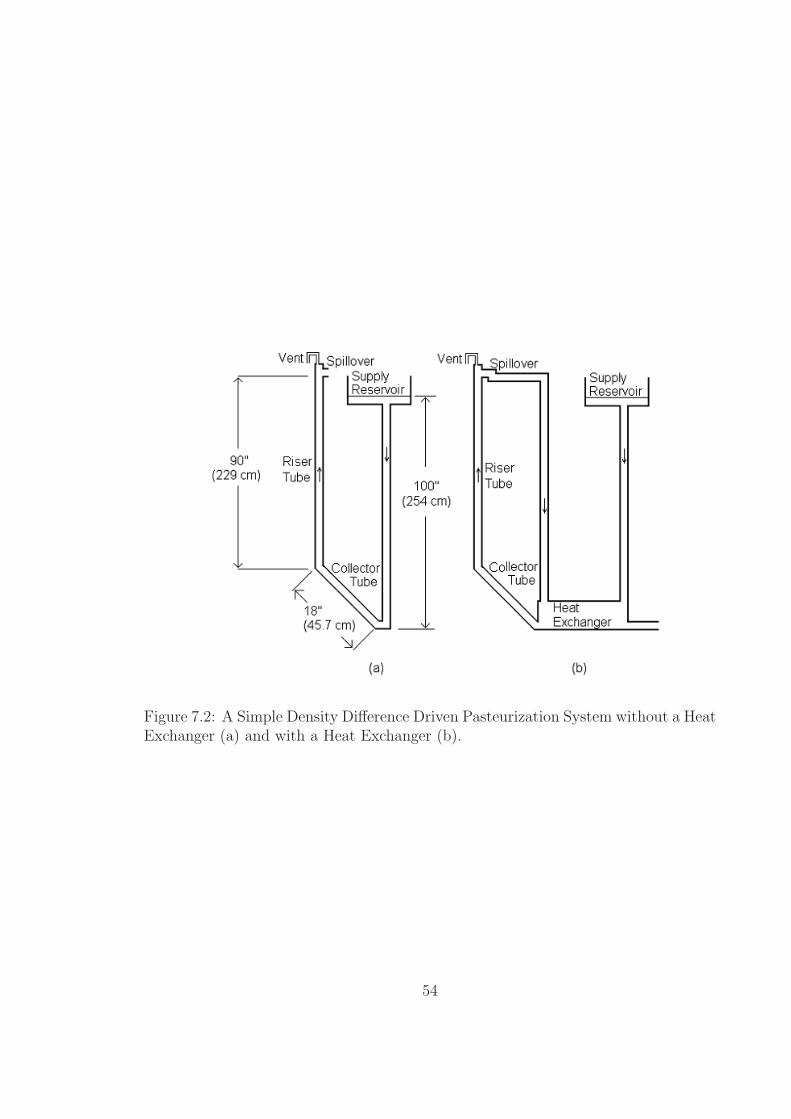
Figure 7.2: A Simple Density Difference Driven Pasteurization System without a HeatExchanger (a) and with a Heat Exchanger (b).
54
density of 78◦C water (973 kg/m3).
The collector tube was constructed at a 45◦ angle in an attempt to promote natural
convection in the riser tube. During testing it was found that there is virtually no
natural convection within the riser tube. At the start of the day the water in the
collector tube would begin to heat, but the water in the riser tube remained cool
enough so that there was no flow. Eventually the water in the collector tube began
to boil. The boiling process would heat the water in the riser tube and the system
was able to regulate flow for the rest of the day.
As with the systems that have valves, boiling is undesirable because it may allow
for untreated water to be pushed through the system. Experiments were conducted
with several different riser tube diameters and even with the entire riser tube at a 45◦
angle, but the boiling at startup could not be eliminated.
7.3 Conclusion
This chapter has presented the preliminary solar water pasteurization research con-
ducted at Colorado State University. Both the valved system and the valve-less
system experienced boiling during operation. As mentioned, boiling is a significant
problem for a solar water pasteurization system as it may result in contamination of
the treated water reservoir.
55
Chapter 8
Design of Density Driven Systemwith an Internal Circulation Loop
The chapter describes the current density driven solar water pasteurization system.
This system incorporates an internal circulation loop that ensures the collector tube
does not overheat and thus eliminates boiling. The system consists of five components:
a supply reservoir, a heat exchanger, a circulation loop, a holding tube, and a treated
water reservoir. Section 8.1 gives a brief overview of the system. Sections 8.2 to 8.6
give details about the individual components of the system. Section 8.7 describes how
the relative heights of the elements of the system were designed to create the desired
treatment temperature. Section 8.8 concludes the chapter.
8.1 Overview of System
A schematic of the system is shown in 8.1. Untreated water entered the system
from an elevated reservoir. The untreated water was then pre-heated in the heat
exchanger by hot treated water. The water then entered the circulation loop where
it was heated by five evacuated tube heat-pipe solar collectors with a total collector
area of 0.45 m2. Once properly heated, water flowed over the spill-over and into the
holding tube. After flowing through the holding tube the water re-entered the heat
exchanger were it was cooled before entering the treated water reservoir. To reach
the treated water reservoir the water had to pass over a secondary spill-over point.
56

Supply ReservoirSpill−over Point
RiserTube
Collectors Connect Here
Collector Tube
Convection Tube
Holding Tube
Shell andTubeHeatExchanger
To TreatedWater
Reservoir
1
2
3
45
6
7
8
9
10
11
12
13
Figure 8.1: Schematic of Density Driven System with an Internal Circulation Loop(Numbers Indicate Thermocouple Locations).
57

Without the secondary spill-over point there would have been no way to keep water
in the heat exchanger or the holding tube. (Note that both spill-over points were
vented. This ensured that water was not siphoned through the system.)
8.2 Untreated Water Reservoir
Tap water was supplied to a plastic container that served as the elevated supply
reservoir. A solenoid valve controled the water flow to the container. Two signal wires
were attached to the container. One was secured on the bottom of the container and
one was secured to the wall of the container. The electrical resistance between the
two signal wires was used to control the solenoid valve. When the water level dropped
below the signal wire attached to the side of the container the electrical resistance
became very large and the valve was turned on. When the water level reached the
signal wire on the side of the container the resistance dropped and the valve was
turned off. By this method the water level in the supply reservoir was maintained to
within 0.25 cm of the location of the upper control wire.
8.3 Heat Exchanger
The heat exchanger used was a single pass shell and tube set up in a counter flow
arrangement. To limit thermal losses, the hot treated water from the holding tube
entered the tube side and the cool water from the supply reservoir entered the shell
side of the heat exchanger. Untreated water left the shell side of the heat exchanger
and flowed into the circulation loop. As shown in figure 8.1, to encourage stratification
The unit contained 68, 16”, copper tubes with an inner diameter of 1/4” and an
outer diameter of 5/16”. The shell was cast iron with an inner diameter of 3.5”. The
shell was surrounded by at least 3” of extruded polystyrene on all sides.
58
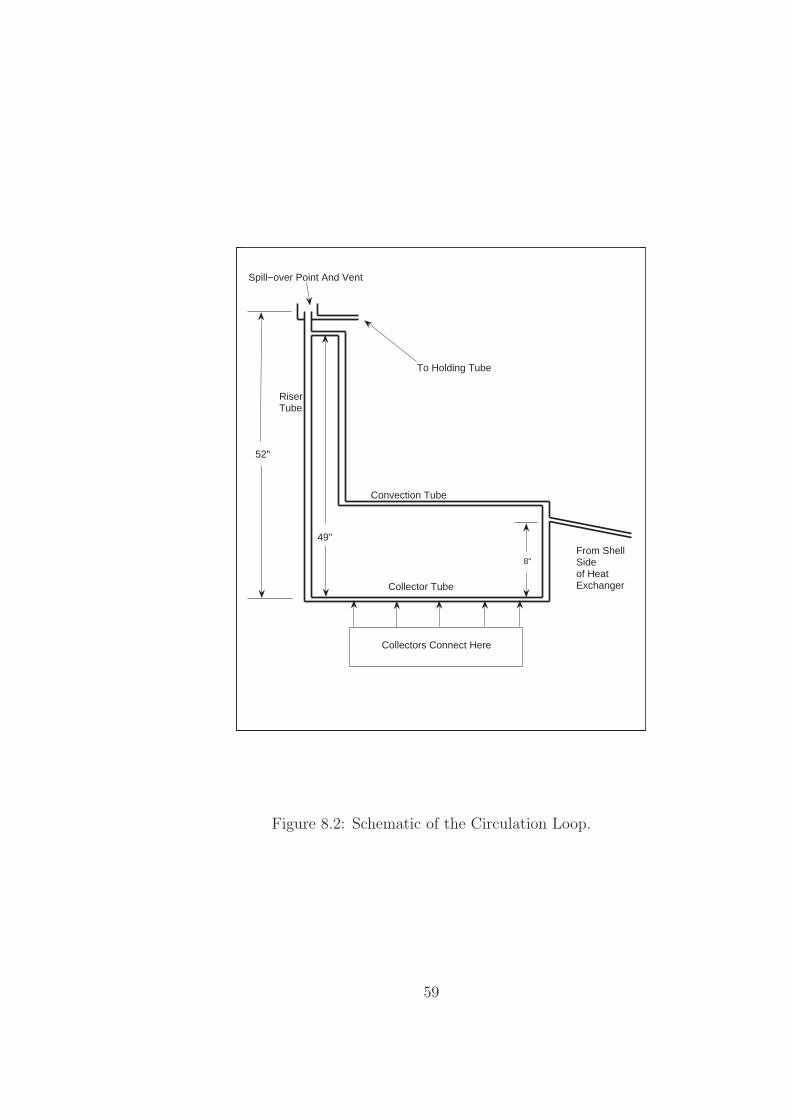
Spill−over Point And Vent
Collectors Connect Here
Collector Tube
Convection Tube
To Holding Tube
From ShellSideof HeatExchanger
RiserTube
52"
49"
8"
Figure 8.2: Schematic of the Circulation Loop.
59

8.4 Circulation Loop
The circulation loop consisted of the ‘collector tube’, the ‘riser tube’ and the ‘con-
vection tube’. As shown in figure 8.2, water from the heat exchanger entered the
circulation loop in the convection tube 8” above the collector tube. The convection
tube was connected to the riser tube 49” above the collector tube. Properly heated
water left the circulation loop and entered the holding tube via the spill-over located
52” above the collector tube.
Within the circulation loop no tubes were oriented horizontally. All tubes were
slightly sloped towards the riser tube. This was done in an attempt to make sure that
no vapor would collect in the system and all vapor bubbles would leave the system
through the vent at the top of the riser tube. The vent also ensured that water was
not siphoned through the system.
The riser tube and the convection tube were both made from nominal 1/2” type
M copper pipe, while the collector tube was made from nominal 3/4” type M diam-
eter copper pipe. The circulation loop was sandwiched between two 2.5” layers of
extruded polyurethane. As shown in figure 8.3, the five evacuated tube heat-pipe so-
lar collectors were clamped to the ‘collector tube’ by aluminum heat exchange blocks.
Heat transfer grease was used to reduce the contract resistance between the heat-pipe
and the aluminum blocks, and between the aluminum blocks and the collector tube.
The aluminum blocks were surrounded by at least 3” of extruded polyurethane.
8.5 Holding Tube
From preliminary experiments the expected peak flow of the system was 25 kg/hr.
The size of the holding tube was based on a flow rate of 30 kg/hr and a minimum
holding time of one minute.
For water at 85◦C (ρ=968.1 kg/m3) a mass flow rate of 30 kg/hr results in a
volumetric flow rate 0.516 liters/min. Based on slug flow conditions a holding time of
60

Figure 8.3: Aluminum Blocks Conduct the Energy From the Condenser of the Heat–Pipe to the Collector Tube.
61

27.5"
2"
3.5"
24"
Figure 8.4: Schematic of Holding Tube
62
one minute requires a holding tube with volume of 0.516 liters. For water flowing in
a circular pipe the centerline velocity is at most twice the bulk velocity of the fluid.
This means that the actual holding time will be at least half the holding time for slug
flow conditions. The holding tube was designed to have a volume of 1.2 liters.
Nominal 1/2” copper pipe was chosen since it is the smallest standard size for
which fittings are readily available. A small diameter holding tube is desirable because
the smaller the tube, the larger the bulk velocity. A larger bulk velocity reduces the
effects of diffusion and microorganism motility. Type-M pipe with an inner diameter
of 1.45 cm was used. To have a volume of 1.2 liters, 7.3 meters (24 ft) of tube were
required.
The holding tube consisted of ten 2-ft sections of copper tube connected in an
S-pattern. As shown in 8.4 all the tubes were sloped above horizontal. This ensured
that no air or vapor bubbles collect in the holding tube. Including the S-bends the
holding tube had a total a measured volume of 1.3 liters. The holding tube was
sandwiched between 2 2.5”- layers of extruded polystyrene.
Based on the expected flow and the pipe geometry, the Reynolds number and
entry length were calculated with equations 8.1 and 8.2, respectively[20].
Re =4m
µπD(8.1)
Lh ≈ 0.05ReD (8.2)
For the design conditions equations 8.1 and 8.2 resulted in a Reynolds number of
2200 and an entry length of 1.6 meters (5.2 ft). Fully developed laminar flow was
expected at the outlet of the holding tube[20]. The calculated flow rate was close to
the predicted transition region for flow in a pipe. If there were to be turbulence, the
flow profile would be broader and the centerline velocity would be lower, resulting in
a longer minimum holding time.
63
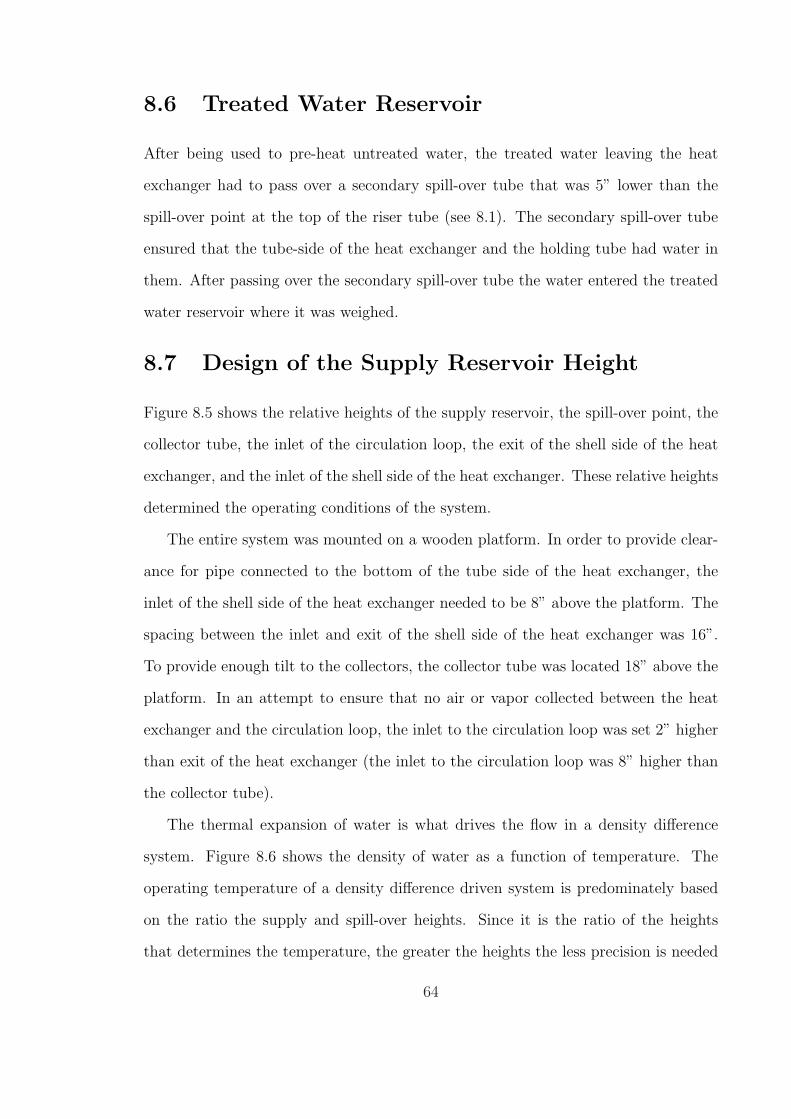
8.6 Treated Water Reservoir
After being used to pre-heat untreated water, the treated water leaving the heat
exchanger had to pass over a secondary spill-over tube that was 5” lower than the
spill-over point at the top of the riser tube (see 8.1). The secondary spill-over tube
ensured that the tube-side of the heat exchanger and the holding tube had water in
them. After passing over the secondary spill-over tube the water entered the treated
water reservoir where it was weighed.
8.7 Design of the Supply Reservoir Height
Figure 8.5 shows the relative heights of the supply reservoir, the spill-over point, the
collector tube, the inlet of the circulation loop, the exit of the shell side of the heat
exchanger, and the inlet of the shell side of the heat exchanger. These relative heights
determined the operating conditions of the system.
The entire system was mounted on a wooden platform. In order to provide clear-
ance for pipe connected to the bottom of the tube side of the heat exchanger, the
inlet of the shell side of the heat exchanger needed to be 8” above the platform. The
spacing between the inlet and exit of the shell side of the heat exchanger was 16”.
To provide enough tilt to the collectors, the collector tube was located 18” above the
platform. In an attempt to ensure that no air or vapor collected between the heat
exchanger and the circulation loop, the inlet to the circulation loop was set 2” higher
than exit of the heat exchanger (the inlet to the circulation loop was 8” higher than
the collector tube).
The thermal expansion of water is what drives the flow in a density difference
system. Figure 8.6 shows the density of water as a function of temperature. The
operating temperature of a density difference driven system is predominately based
on the ratio the supply and spill-over heights. Since it is the ratio of the heights
that determines the temperature, the greater the heights the less precision is needed
64
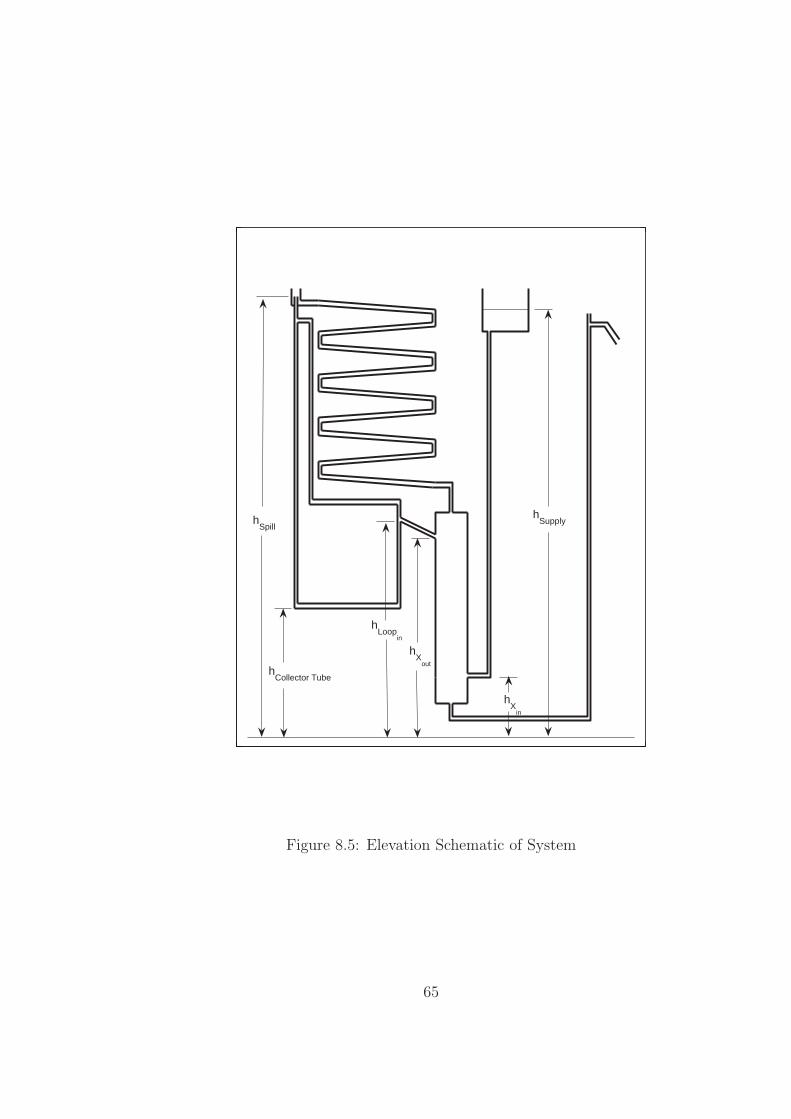
hSupplyh
Spill
hCollector Tube
hLoop
in
hX
out
hX
in
Figure 8.5: Elevation Schematic of System
65

10 20 30 40 50 60 70 80 90965
970
975
980
985
990
995
1000
Temperature (° C)
Den
sity
(kg
/m3 )
Figure 8.6: Density of Water as a function of Temperature
66

to ensure the desired operating temperature. The spill-over height of 52” above the
collector tube produced adequate precision while keeping the overall size of the system
reasonable.
The relative height of the supply reservoir was selected by considering the pressure
balance between a ‘warm’ and ‘cold’ column of water. The ‘cold’ column consisted of
the water flowing from the top of the supply reservoir to the inlet of the shell side of
the shell side of the collector. The ‘warm’ column consisted of the water flowing from
the spill-over point to the inlet of the shell side of the heat exchanger, including the
water in the circulation loop and the water in the shell side of the heat exchanger.
To simplify the height design process a few assumptions were made. It was as-
sumed that the system was well insulated and that the entire ‘cold’ water column
was at a uniform temperature. The temperature of the water in the heat exchanger
was assumed to vary nearly linearly with height and the average density of water
in the heat exchanger was assumed to be the density of the average temperature.
The temperature in the circulation loop was assumed to be uniform. Because of the
relatively slow flow rates, friction and momentum effects were ignored and near static
conditions were assumed to hold throughout the system.
Equation 8.3 was used to determine the pressure difference between any two points
in the system.
4P = −ρaveg4h (8.3)
Using equation 8.3, the pressure at the entrance of the heat exchanger was deter-
mined by thinking of it as the bottom of the ‘cold’ column.
PXin= Patm + ρ (TSupply) g (hSupply − hXin
) (8.4)
The same pressure was also found by treating the location as the bottom of the ‘warm’
67
column.
PXin= Patm + ρ (TLoop) g (hSpill − hLoopin
)
+ρ (TLoopin) g (hLoopin
− hXout) (8.5)
+ρ
(TXout + TXin
2
)g (hXout − hXin
)
The desired process temperature was 80◦C. To build in a safety margin and allow
for fluctuations in the supply reservoir height, the system was designed for an 85◦C
process temperature.
From preliminary experiments it was expected that, after a significant warm up
period, the water leaving the shell side of the heat exchanger would be 10C◦ below
the process temperature. For the designed process temperature of 85◦C and a supply
temperature of 20◦ C equations 8.4 and 8.6 were combined with the known heights
to find the needed supply reservoir height. Note from figure 8.6 the density of water
does not change much below 20◦C, so the system is fairly insensitive to the supply
water temperatures.
ρ (85◦C)
ρ (20◦C)(hSpill − hLoopin
)
hSupply − hXin= +
ρ (75◦C)
ρ (20◦C)(hLoopin
− hXout) (8.6)
+ρ (47.5◦C)
ρ (20◦C)(hXout − hXin
)
Upon evaluation,
hSupply − hXin=
ρ (85◦C)
ρ (20◦C)(44′′) +
ρ (75◦C)
ρ (20◦C)(4′′) +
ρ (47.5◦C)
ρ (20◦C)(16′′)
= 60.5′′
hSpill − hSupply = 1.5′′ ≈ 3.8cm
Performing the same calculations for a temperature set point of 80◦C and 90◦C
resulted in supply reservoir heights that were 0.25” (0.63 cm) higher, and 0.15” (0.37
cm) lower than the 85◦C height, respectively.
68

To calculate the spill-over conditions at the start of a test day (e. g. before
the heat exchanger has warmed up), the water in the heat exchanger, and the tube
connecting the heat exchanger to the circulation loop, were assumed to be at the
supply water temperature. The start-up spill-over temperature can be found with
equation 8.7.
ρ (TSpill) = ρ (TSupply)
(hSupply − hLoopin
hSpill − hLoopin
)(8.7)
Upon evaluation,
ρ (TSpill) = 998kg
m3
(42.5′′
44′′
)
= 963.8kg
m3⇒ TSpill ≈ 92◦C
So at the beginning of the day the circulation loop should need to reach a temper-
ature of approximately 92◦C before flow begins and later in the day when the heat
exchanger is fully warmed up the spill-over temperature should drop to approximately
85◦C. All other operating conditions should result in a spill-over temperature between
these bounds.
8.8 Conclusion
This chapter has presented a passive flow–through valve–less water treatment system
that is designed to treat water to a temperature of at least 80◦C for a holding time
of at least one minute. This design represents an improvement over previous designs
in that it eliminates boiling.
69
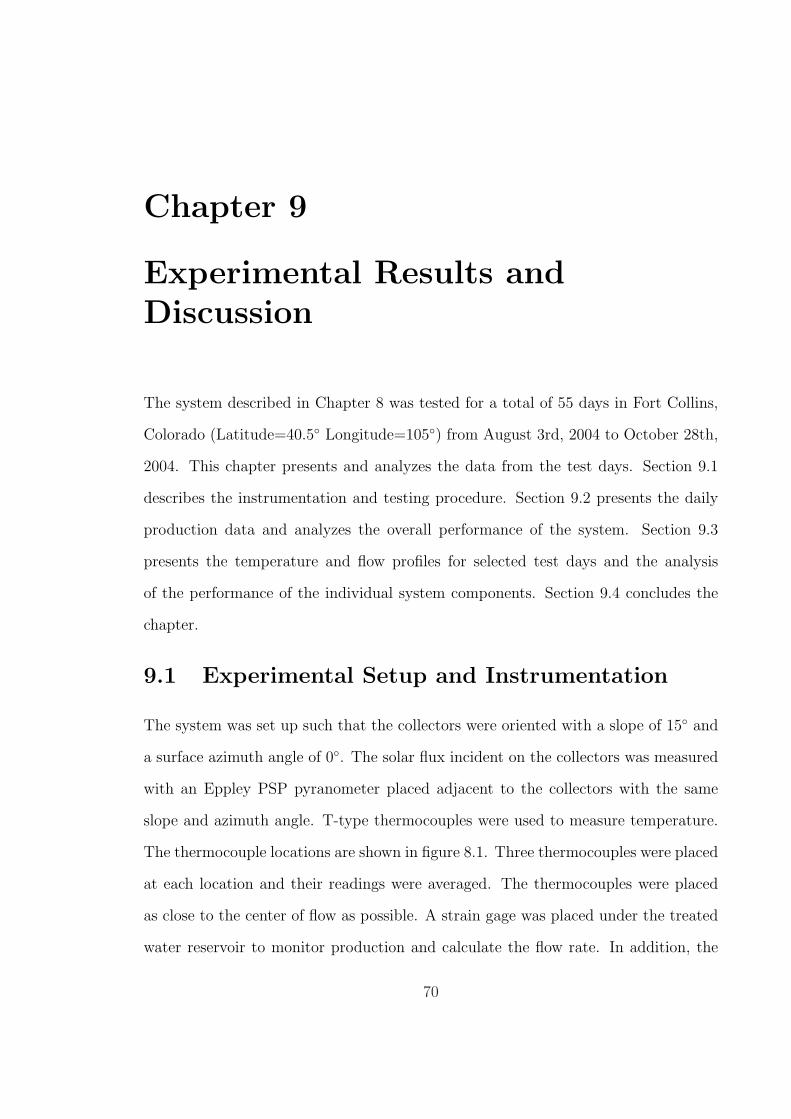
Chapter 9
Experimental Results andDiscussion
The system described in Chapter 8 was tested for a total of 55 days in Fort Collins,
Colorado (Latitude=40.5◦ Longitude=105◦) from August 3rd, 2004 to October 28th,
2004. This chapter presents and analyzes the data from the test days. Section 9.1
describes the instrumentation and testing procedure. Section 9.2 presents the daily
production data and analyzes the overall performance of the system. Section 9.3
presents the temperature and flow profiles for selected test days and the analysis
of the performance of the individual system components. Section 9.4 concludes the
chapter.
9.1 Experimental Setup and Instrumentation
The system was set up such that the collectors were oriented with a slope of 15◦ and
a surface azimuth angle of 0◦. The solar flux incident on the collectors was measured
with an Eppley PSP pyranometer placed adjacent to the collectors with the same
slope and azimuth angle. T-type thermocouples were used to measure temperature.
The thermocouple locations are shown in figure 8.1. Three thermocouples were placed
at each location and their readings were averaged. The thermocouples were placed
as close to the center of flow as possible. A strain gage was placed under the treated
water reservoir to monitor production and calculate the flow rate. In addition, the
70

treated water reservoir was weighed at the start and end of each day. The strain
gage was calibrated by weighing the treated water reservoir with different amounts
of water and recording the voltage produced by the strain gage. Figure 9.1 shows the
calibration data for the strain gage.
9.2 Daily Production
The daily production data is shown in table 9.1 and figure 9.2. The radiation values
listed on table 9.1 and the insolation values in figure 9.2 are the daily totals incident
on the collector surface.
Figure 9.2 shows that a minimum total daily isolation of about 12 MJ/m2 is
required before any treated water is produced. This phenomenon is common in solar
applications. A minimum amount of energy is required to overcome losses before
energy can be delivered to the process. Roughly 7.8 kg of treated water are produced
for every MJ above 5.4 MJ.
The performance can also be expressed as a COP. It takes about 0.25 MJ to heat
one kilogram of water from 20◦C to 80◦C. Dividing the total daily radiation by 0.25
MJ gives the maximum production system without a heat exchanger. The COP is
the ratio of the actual production to the maximum production of a direct system.
Figure 9.3 shows the system COP as a function of total daily insolation.
9.3 Component Performance
This section analyzes the performance of the individual components of the system.
Two test days are used as examples in this analysis. The first test day (September
25th, 2004) was a mostly sunny day with a brief period of clouds in the afternoon.
The total radiation incident on the collector surface was 10.6 MJ and the system
produced 82 kg of treated water. The second test day (October 18th, 2004) was
mostly cloudy in the afternoon. The total radiation incident on the collector was 8.5
71
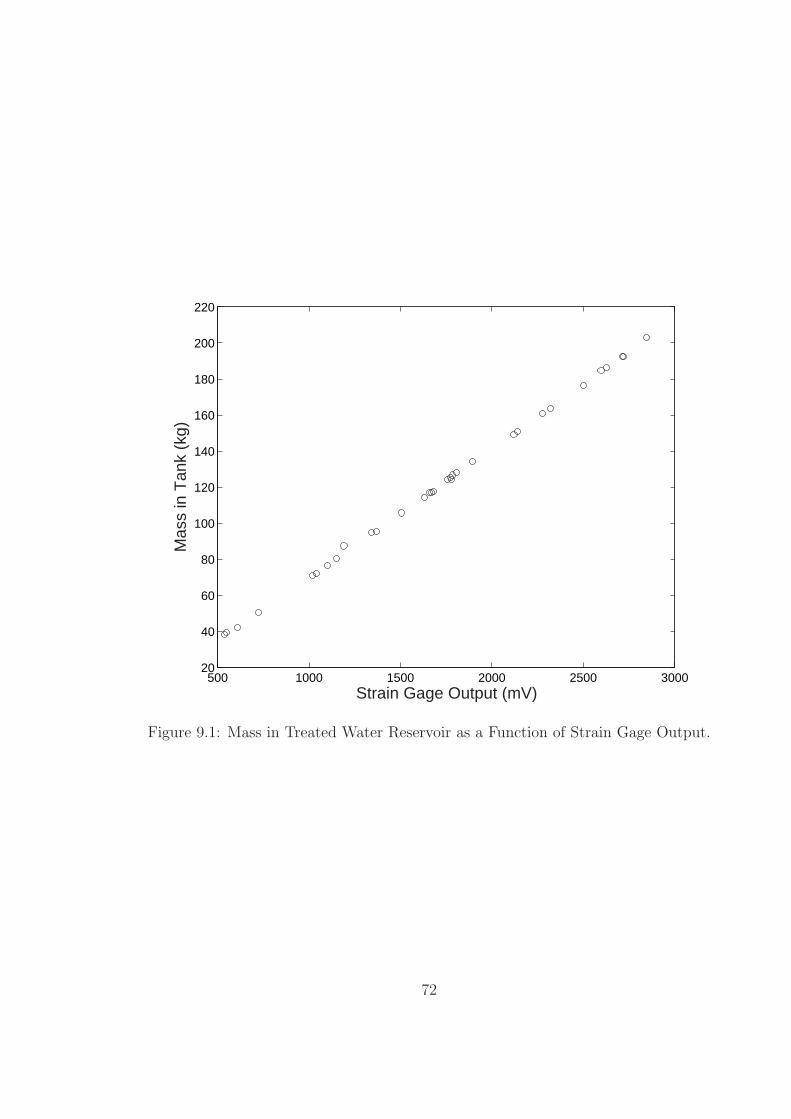
500 1000 1500 2000 2500 300020
40
60
80
100
120
140
160
180
200
220
Strain Gage Output (mV)
Mas
s in
Tan
k (k
g)
Figure 9.1: Mass in Treated Water Reservoir as a Function of Strain Gage Output.
72
Table 9.1: Daily Production Data.Date (2004) Daily Radiation (MJ) Daily Production (kg)
3-Aug 5.9 124-Aug 10.7 995-Aug 9.3 69
10-Aug 9.0 7211-Aug 13.1 15213-Aug 12.9 14714-Aug 12.8 13815-Aug 12.5 13116-Aug 12.5 12817-Aug 7.8 6524-Aug 6.2 2126-Aug 7.0 2310-Sep 5.9 3311-Sep 11.9 10112-Sep 4.0 113-Sep 6.0 814-Sep 7.4 1015-Sep 12.0 7416-Sep 10.4 8917-Sep 11.5 8918-Sep 9.6 7119-Sep 4.9 720-Sep 7.7 4723-Sep 11.6 9124-Sep 7.8 3325-Sep 10.6 8226-Sep 10.4 8127-Sep 8.9 8528-Sep 2.4 129-Sep 9.0 513-Oct 7.6 614-Oct 9.7 965-Oct 8.7 706-Oct 1.9 07-Oct 10.2 1038-Oct 10.7 689-Oct 10.6 92
10-Oct 9.5 7611-Oct 6.0 1012-Oct 9.9 9213-Oct 10.4 7814-Oct 6.2 615-Oct 1.3 116-Oct 9.3 3117-Oct 4.1 118-Oct 8.5 3819-Oct 3.5 020-Oct 8.0 1621-Oct 8.5 4822-Oct 3.5 124-Oct 3.7 125-Oct 6.9 2426-Oct 28.5 3227-Oct 5.1 328-Oct 8.7 47
73
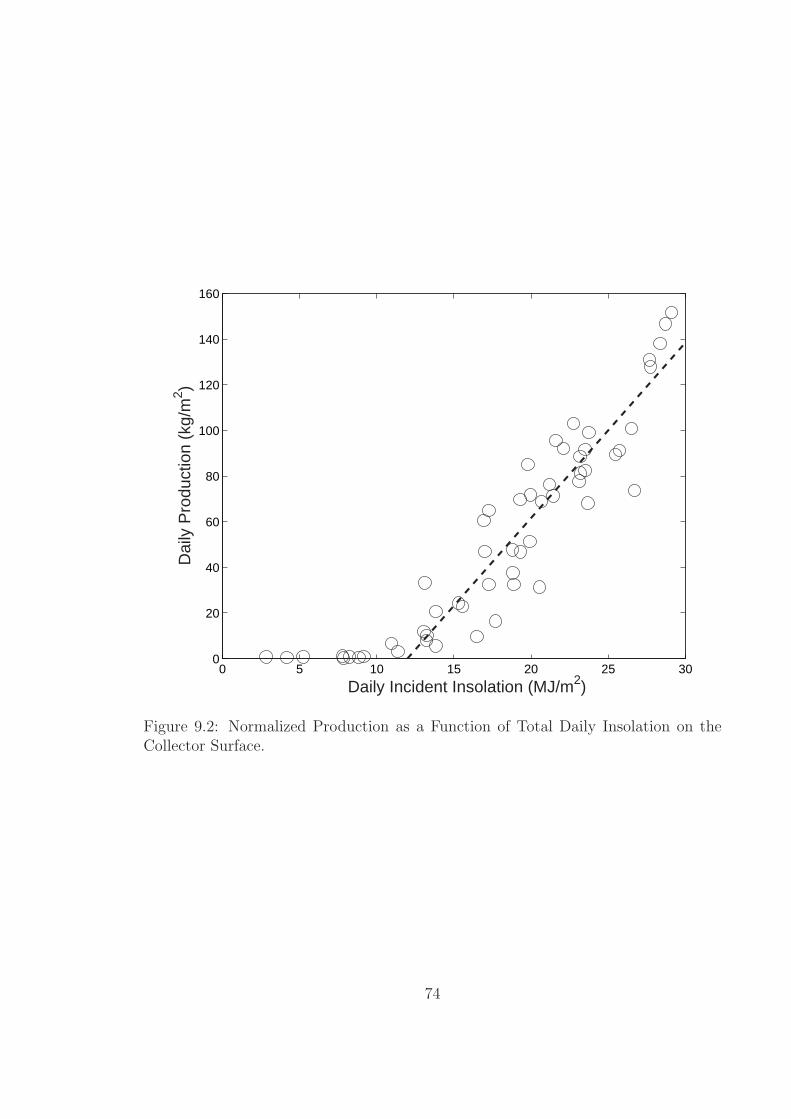
0 5 10 15 20 25 300
20
40
60
80
100
120
140
160
Daily Incident Insolation (MJ/m2)
Dai
ly P
rodu
ctio
n (k
g/m
2 )
Figure 9.2: Normalized Production as a Function of Total Daily Insolation on theCollector Surface.
74
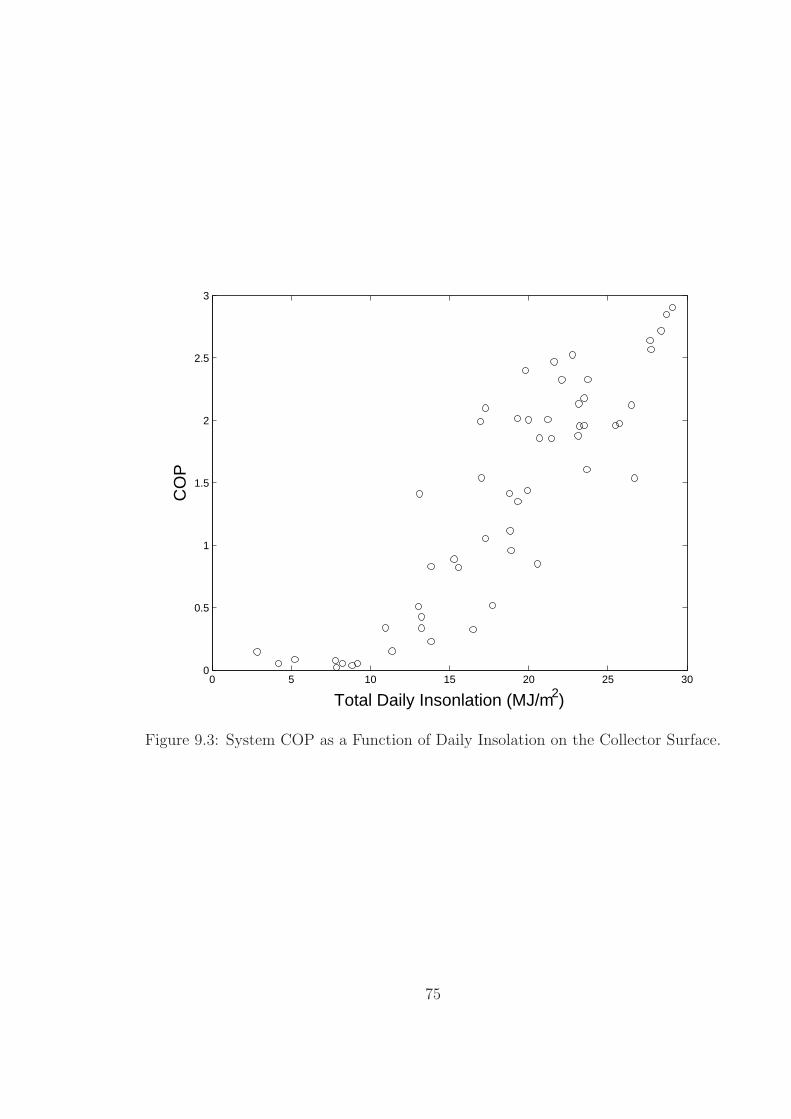
0 5 10 15 20 25 300
0.5
1
1.5
2
2.5
3
Total Daily Insonlation (MJ/m2)
CO
P
Figure 9.3: System COP as a Function of Daily Insolation on the Collector Surface.
75
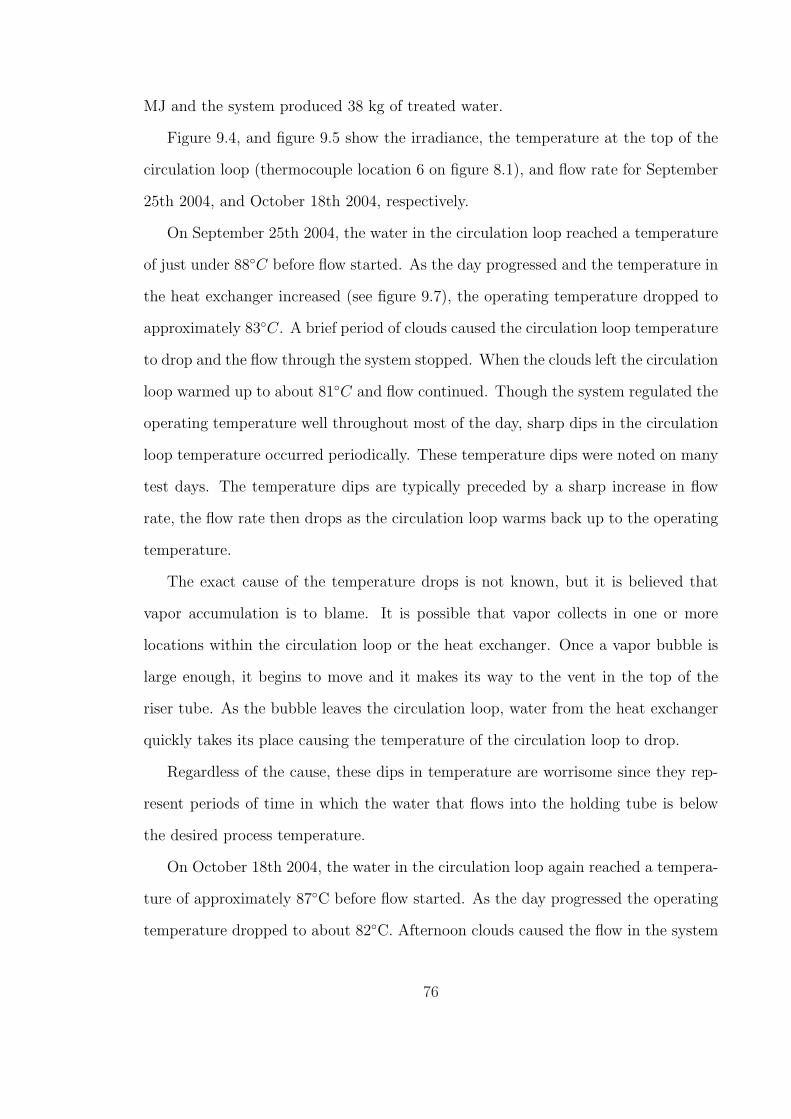
MJ and the system produced 38 kg of treated water.
Figure 9.4, and figure 9.5 show the irradiance, the temperature at the top of the
circulation loop (thermocouple location 6 on figure 8.1), and flow rate for September
25th 2004, and October 18th 2004, respectively.
On September 25th 2004, the water in the circulation loop reached a temperature
of just under 88◦C before flow started. As the day progressed and the temperature in
the heat exchanger increased (see figure 9.7), the operating temperature dropped to
approximately 83◦C. A brief period of clouds caused the circulation loop temperature
to drop and the flow through the system stopped. When the clouds left the circulation
loop warmed up to about 81◦C and flow continued. Though the system regulated the
operating temperature well throughout most of the day, sharp dips in the circulation
loop temperature occurred periodically. These temperature dips were noted on many
test days. The temperature dips are typically preceded by a sharp increase in flow
rate, the flow rate then drops as the circulation loop warms back up to the operating
temperature.
The exact cause of the temperature drops is not known, but it is believed that
vapor accumulation is to blame. It is possible that vapor collects in one or more
locations within the circulation loop or the heat exchanger. Once a vapor bubble is
large enough, it begins to move and it makes its way to the vent in the top of the
riser tube. As the bubble leaves the circulation loop, water from the heat exchanger
quickly takes its place causing the temperature of the circulation loop to drop.
Regardless of the cause, these dips in temperature are worrisome since they rep-
resent periods of time in which the water that flows into the holding tube is below
the desired process temperature.
On October 18th 2004, the water in the circulation loop again reached a tempera-
ture of approximately 87◦C before flow started. As the day progressed the operating
temperature dropped to about 82◦C. Afternoon clouds caused the flow in the system
76
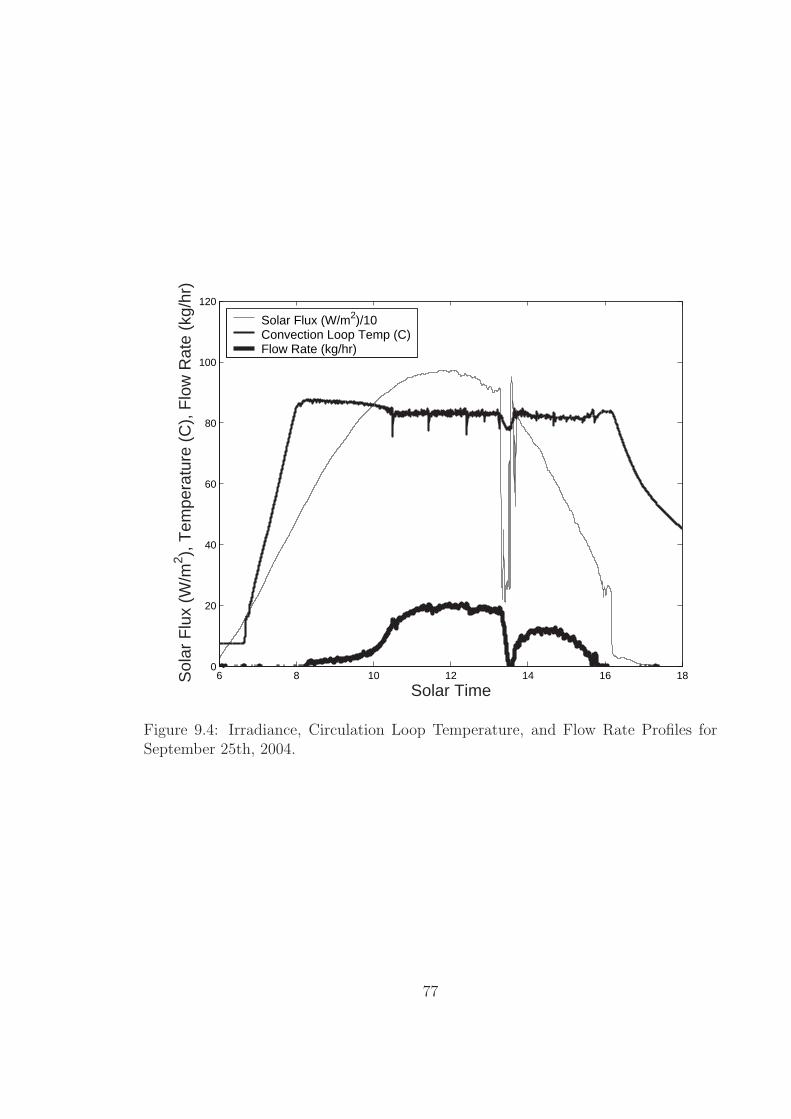
6 8 10 12 14 16 180
20
40
60
80
100
120
Solar Time
Sol
ar F
lux
(W/m
2 ), T
empe
ratu
re (
C),
Flo
w R
ate
(kg/
hr)
Solar Flux (W/m2)/10Convection Loop Temp (C)Flow Rate (kg/hr)
Figure 9.4: Irradiance, Circulation Loop Temperature, and Flow Rate Profiles forSeptember 25th, 2004.
77

6 8 10 12 14 16 180
20
40
60
80
100
120
Solar Time
Sol
ar F
lux
(W/m
2 ), T
empe
ratu
re (
C),
Flo
w R
ate
(kg/
hr)
Solar Flux (W/m2)/10Convection Loop Temp (C)Flow Rate (kg/hr)
Figure 9.5: Irradiance, Circulation Loop Temperature, and Flow Rate Profiles forOctober 18th, 2004.
78

to stop for two 45 minute periods. The system did not experience sharp temperature
drops. If vapor bubbles are the cause of the temperature drops, it is possible that the
low irradiance resulted in slow vapor bubble formation.
9.3.1 Circulation loop
There are three thermocouples located within the circulation loop: one on either side
of the collector tube and one at the top of the loop. (See figure 8.1). Figure 9.6 shows
the three circulation loop temperatures as the system warms up on September 25th,
2004. The convection tube successfully circulates water through the collector tube
and riser tube, and thus eliminates boiling at start up.
9.3.2 Performance of the Heat Exchanger
Figures 9.7 and 9.8 show the temperature of treated water entering the tube side
of the heat exchanger (thermocouple location 12 on figure 8.1), the temperature of
pre–heated water leaving the shell side of the heat exchanger (thermocouple location
2 on figure 8.1), the irradiance of the collector surface, and the flow rate through the
system for September 25th, 2004 and October 18th, 2004, respectively.
On September 25th, 2004 it took about 2.5 hours of full sun after system flow
started for the heat exchanger to reach its steady operating temperature of approx-
imately 72◦C. On October 18th, 2004 clouds moved in just as the heat exchanger
was reaching its steady operating temperature. After the clouds cleared the heat
exchanger needed to be warmed up again, resulting in a low daily production.
Since the heat exchanger is not perfectly insulated the hot–side effectiveness is
not the same as the cold–side effectiveness. It is the cold–side effectiveness that
contributes to the performance of the system. Assuming constant specific heats and
since the flow rate for the hot and cold side of the heat exchanger are equal the
79

6.5 7 7.5 8 8.50
10
20
30
40
50
60
70
80
90
Solar Time
Tem
pera
ture
(C
)
Figure 9.6: Circulation Loop Temperatures During Start–Up on September 25th 2004.
80
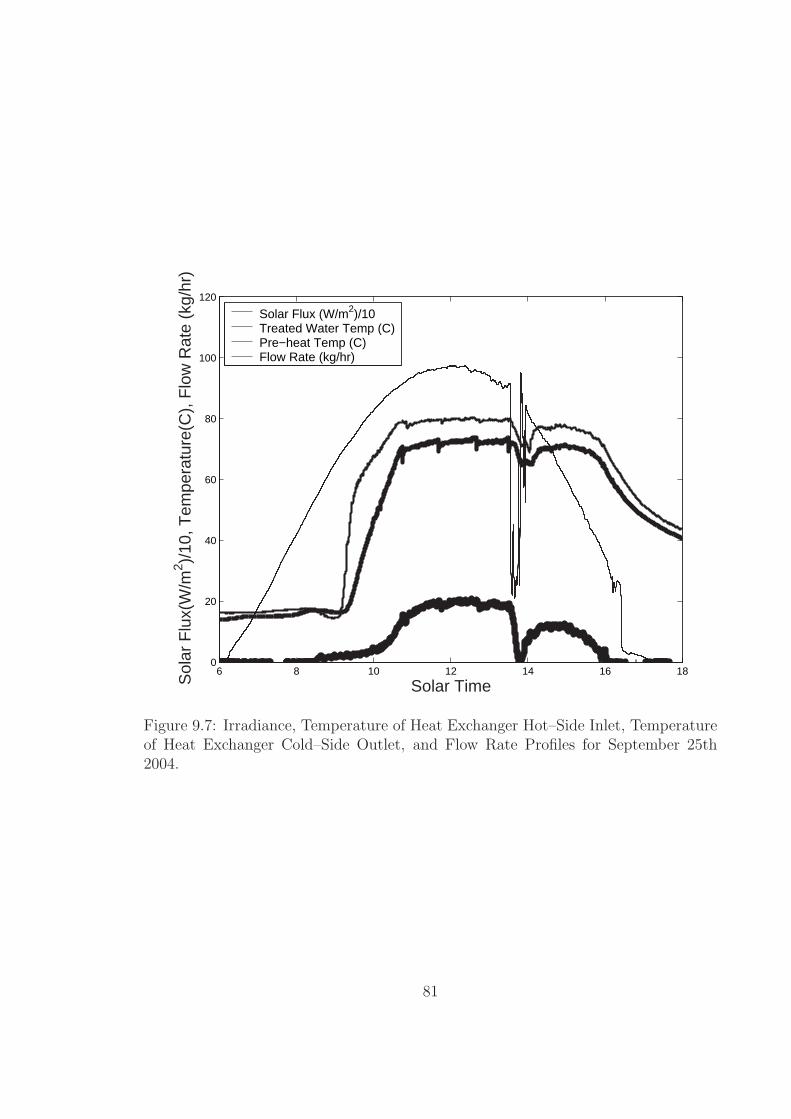
6 8 10 12 14 16 180
20
40
60
80
100
120
Solar TimeSol
ar F
lux(
W/m
2 )/10
, Tem
pera
ture
(C),
Flo
w R
ate
(kg/
hr)
Solar Flux (W/m2)/10Treated Water Temp (C)Pre−heat Temp (C)Flow Rate (kg/hr)
Figure 9.7: Irradiance, Temperature of Heat Exchanger Hot–Side Inlet, Temperatureof Heat Exchanger Cold–Side Outlet, and Flow Rate Profiles for September 25th2004.
81
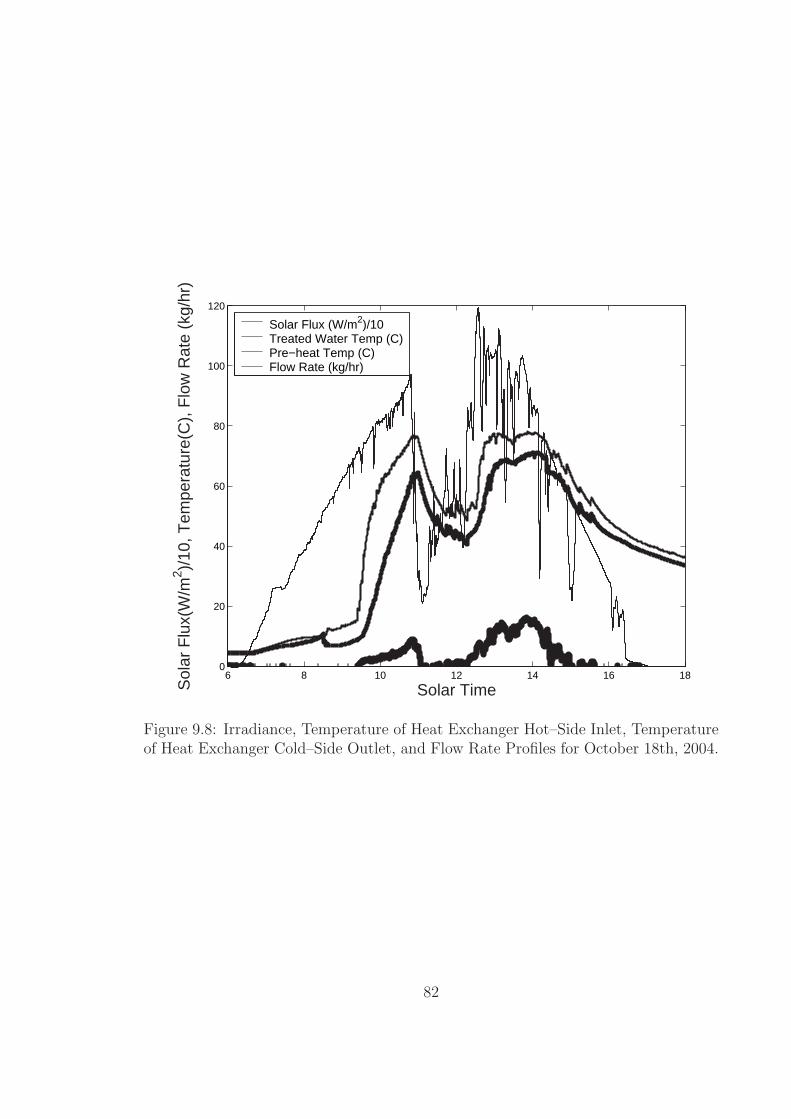
6 8 10 12 14 16 180
20
40
60
80
100
120
Solar TimeSol
ar F
lux(
W/m
2 )/10
, Tem
pera
ture
(C),
Flo
w R
ate
(kg/
hr)
Solar Flux (W/m2)/10Treated Water Temp (C)Pre−heat Temp (C)Flow Rate (kg/hr)
Figure 9.8: Irradiance, Temperature of Heat Exchanger Hot–Side Inlet, Temperatureof Heat Exchanger Cold–Side Outlet, and Flow Rate Profiles for October 18th, 2004.
82

instantaneous cold–side effectiveness can found with equation 9.1.
εCold =(TColdout − TColdin
)
(THotin − TColdin)
(9.1)
The instantaneous cold–side effectiveness for September 25th, 2004, and October
18th, 2004 are shown in figure 9.9. The instantaneous calculations are meaningless
when the flow rate or temperatures are varying significantly. During steady operation
the effectiveness of the heat exchanger was about 0.85 on both test days.
9.3.3 Temperature Profile Within the Holding Tube
Figures 9.10 and 9.11 show irradiance and the daily temperature profiles for inlet
(thermocouple location 11 on figure 8.1) and outlet (thermocouple location 8 on
figure 8.1) of the holding tube for September 25th, 2004 and October 18th, 2004,
respectively. When water is flowing there is little temperature drop within the holding
tube. Both temperatures in the holding tube experienced sharp drops on September
25th, indicating that the temperature fluctuations in the circulation loop affect the
water entering the holding tube.
As water flows through the holding tube its temperature drops. The temperature
of the water as it leaves the holding tube is the minimum temperature it has had in
the holding tube, thus the holding tube outlet temperature represents the minimum
holding temperature of the process. Since the volume of the holding tube is known,
the holding time at a particular time of day can be calculated by integrating the mass
flow rate backwards through time. In this way it is possible to determine when the
water that is currently leaving the holding tube entered the holding tube. To take
into account the possibility of a high centerline velocity the holding time determined
with this method should be multiplied by a factor of 0.5.
Figures 9.12 and 9.13 show the temperature and holding time data for the system
on September 25th, 2004, and October 18, 2004, respectively. Since they correspond
to periods of reduced flow, the temperature drops experienced in the circulation loop
83

6 8 10 12 14 16 180
0.1
0.2
0.3
0.4
0.5
0.6
0.7
0.8
0.9
1
Solar Time
Effe
ctiv
enes
s
September 25, 2004October 18, 2004
Figure 9.9: Instantaneous Effectiveness of The Heat Exchanger on September 25th,2004 and on October 18th, 2004.
84
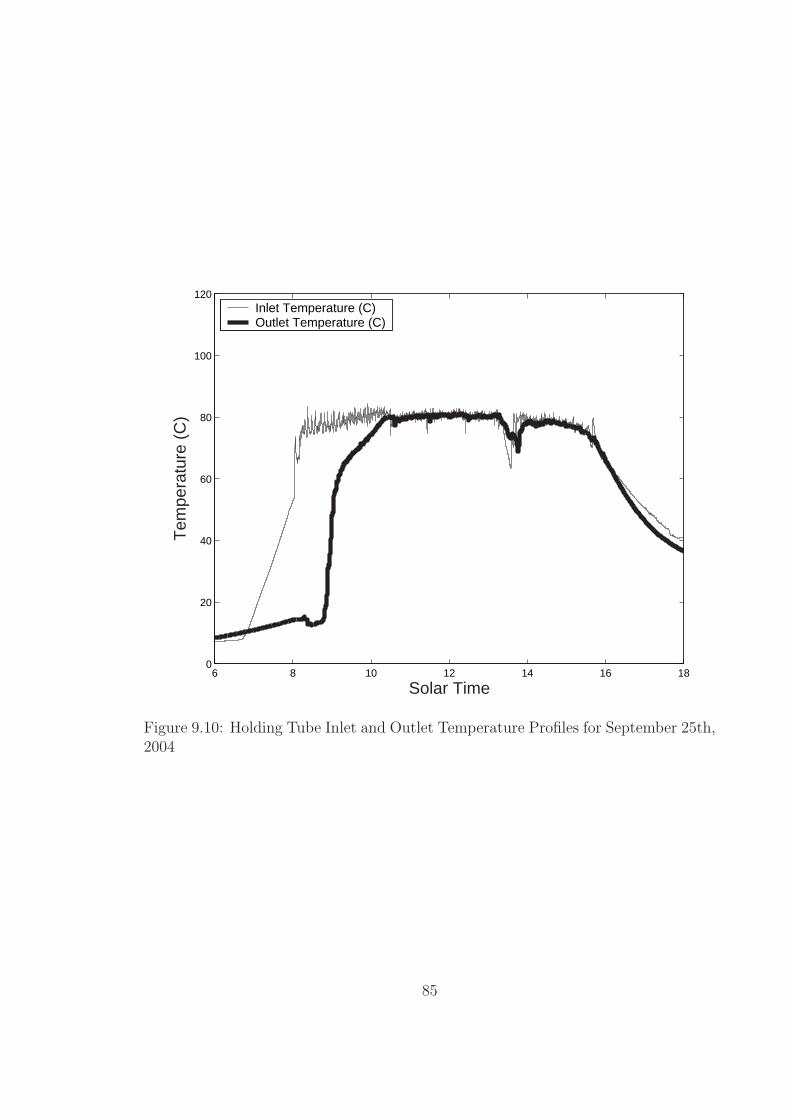
6 8 10 12 14 16 180
20
40
60
80
100
120
Solar Time
Tem
pera
ture
(C
)
Inlet Temperature (C)Outlet Temperature (C)
Figure 9.10: Holding Tube Inlet and Outlet Temperature Profiles for September 25th,2004
85

6 8 10 12 14 16 180
20
40
60
80
100
120
Solar Time
Tem
pera
ture
(C
)
Inlet Temperature (C)Outlet Temperature (C)
Figure 9.11: Holding Tube Inlet and Outlet Temperature Profiles for October 18th,2004
86
do not appear to have affected the overall process of the system. The data plotted on
figures 9.12 and 9.13 should not be thought of as the profile of a time varying process
like the example processes ‘Process D’ and ‘Process E’ of section 4.2.1. The data is
actually a collection of many constant temperature processes (like processes ‘A’, ‘B’,
and ‘C’ of section 4.2.1). It is not enough for part of this data to have an acceptable
holding time and temperature. In order for the process to be effective every data
point needs to be above and the the right of the required inactivation level.
Figure 9.14 shows the thermal inactivation data for the pathogens on table 5.1
along with the system’s process data for for all test days. From this figure it is
clear that the system should provide significant protection for those pathogens where
sufficient thermal inactivation data is available. Unfortunately, as stated in section
5.6, there is not adequate thermal inactivation data for some important pathogens.
9.4 Conclusion
This chapter has presented the experimental results for a passive valve–less flow–
through water pasteurization system. Not only does the system produce significant
amounts of treated water, the treatment process operates at higher temperatures and
for longer times than the inactivation studies reported in Chapter 5. Though the
sharp dips in the temperature of the circulation loop do not seem to have adversely
affected the treatment process, their occurrence is troubling and their cause should
be investigated further. Though adequate thermal inactivation information does not
exist for some some important pathogens, there is no data to suggest that the process
in will not be viable.
87
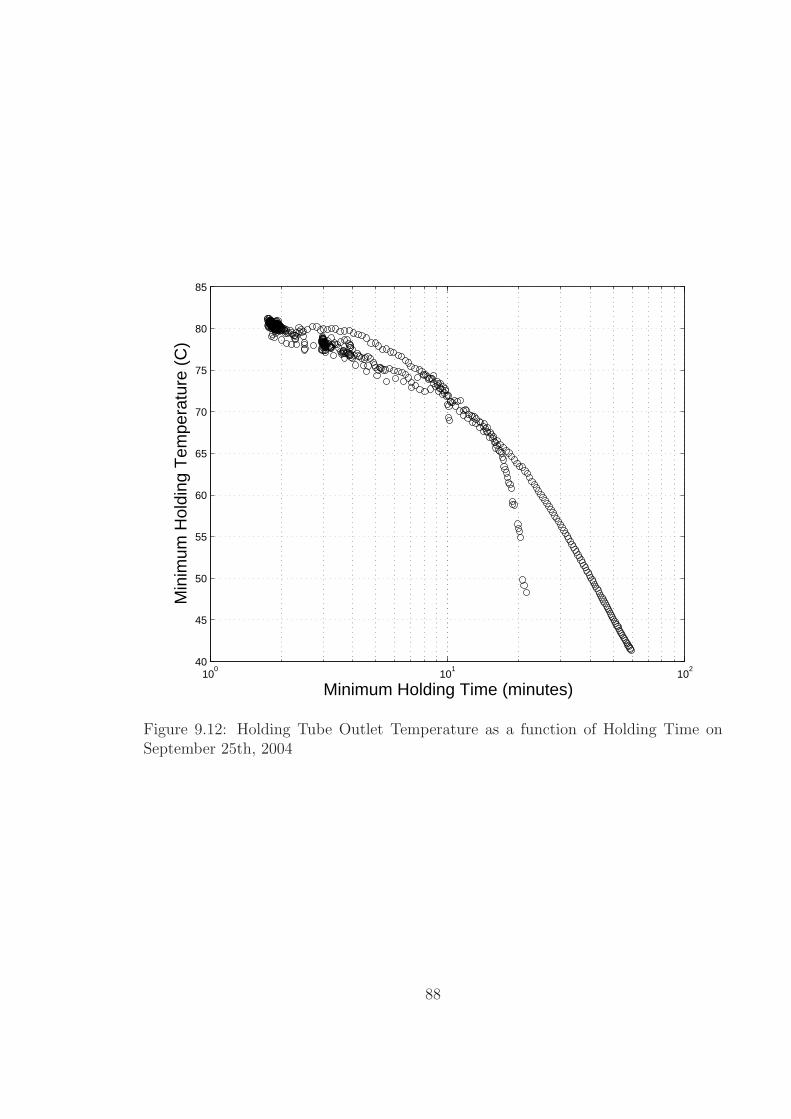
100
101
102
40
45
50
55
60
65
70
75
80
85
Minimum Holding Time (minutes)
Min
imum
Hol
ding
Tem
pera
ture
(C
)
Figure 9.12: Holding Tube Outlet Temperature as a function of Holding Time onSeptember 25th, 2004
88
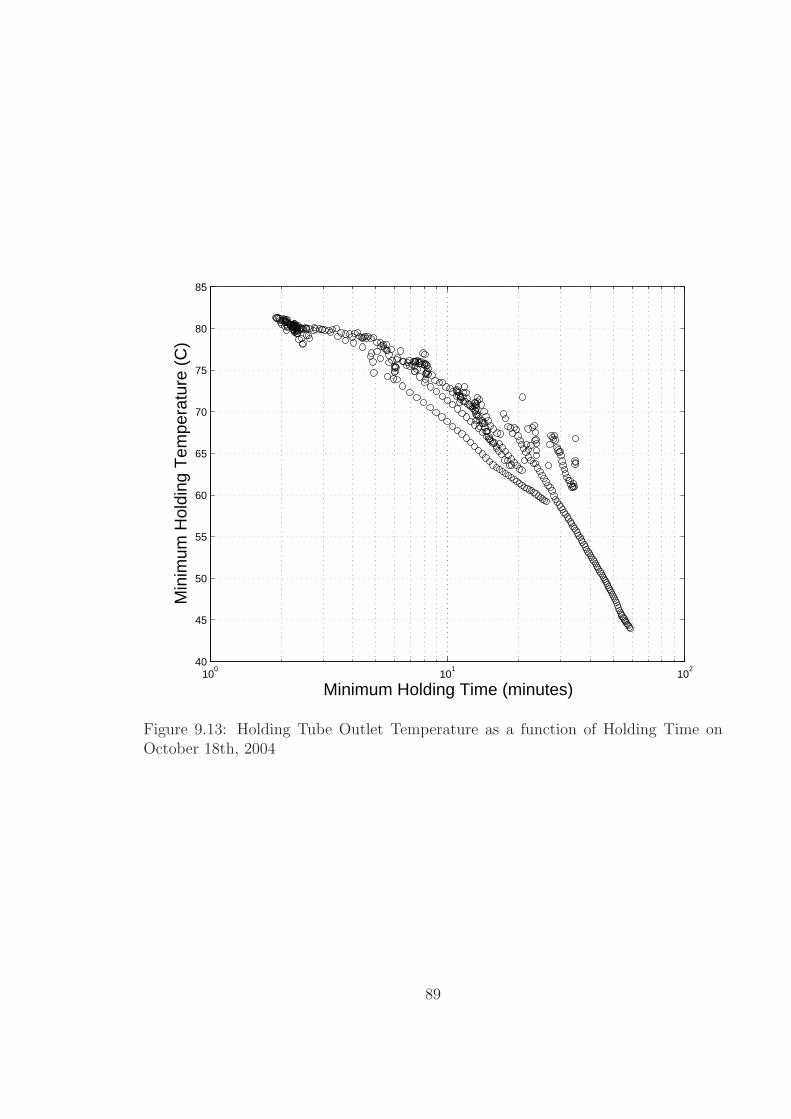
100
101
102
40
45
50
55
60
65
70
75
80
85
Minimum Holding Time (minutes)
Min
imum
Hol
ding
Tem
pera
ture
(C
)
Figure 9.13: Holding Tube Outlet Temperature as a function of Holding Time onOctober 18th, 2004
89
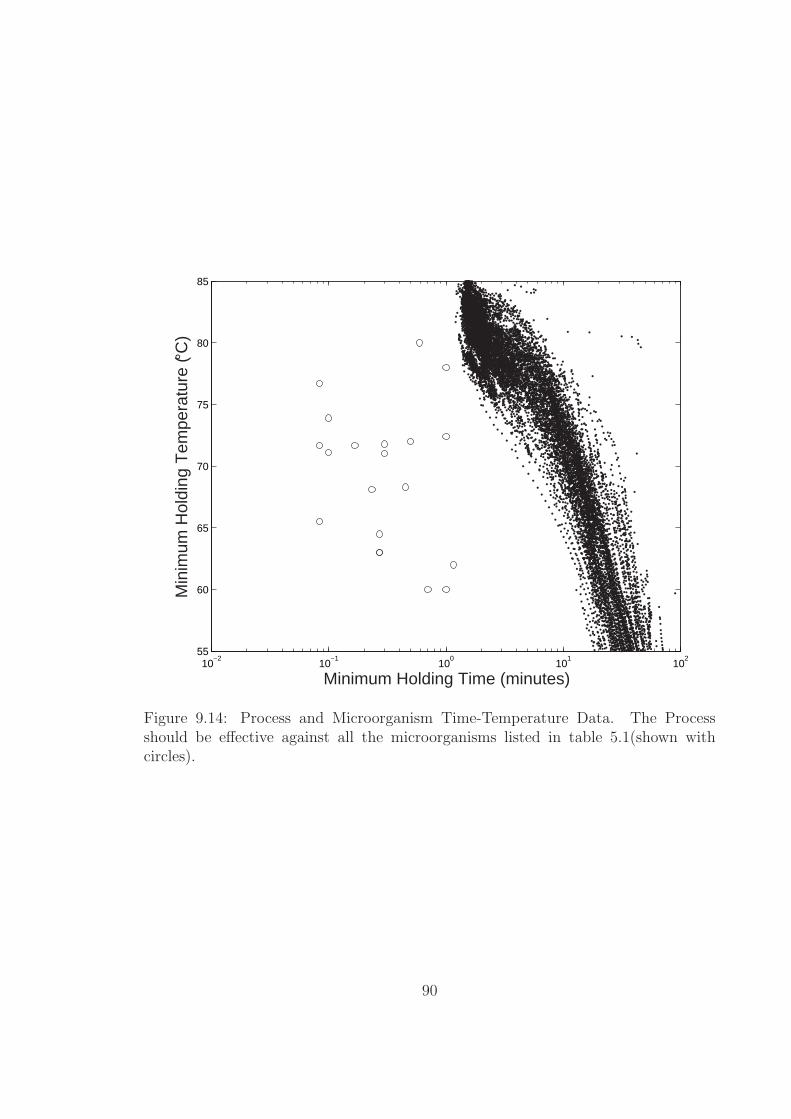
10−2
10−1
100
101
102
55
60
65
70
75
80
85
Minimum Holding Time (minutes)
Min
imum
Hol
ding
Tem
pera
ture
(°C
)
Figure 9.14: Process and Microorganism Time-Temperature Data. The Processshould be effective against all the microorganisms listed in table 5.1(shown withcircles).
90

Chapter 10
Possible Future Research andConclusion
Though this thesis represents a significant amount of research there are still many
opportunities for continued research. Section 10.1 presents some areas of possible
research. Section 10.2 concludes the thesis.
10.1 Possible Future Research
Currently there is not a lot of information about the high temperature thermal inac-
tivation of waterborne pathogens. There is no data about the thermal inactivation of
many viruses and virus families. In particular, there is a need for high temperature
inactivation data for Rotavirus. Rotavirus is believed to be responsible for a large
percentage of water related sickness and it has shown high resistance to inactivation
at 65◦C.
The system described in this thesis has hot been tested with live pathogens. Before
further development of a prototype, pathogen testing should be done to ensure the
system is as effective as it is thought to be.
The current system uses an off-the-shelf high effectiveness heat exchanger. The
draw back of this heat exchanger is that has a large thermal mass and it takes a long
time to warm up. The design of the heat exchanger could be improved. Because the
flow in the system is so low, the heat transfer in the heat exchanger is dominated by
91
conduction rather than convection. A properly designed heat exchanger would have
a very large ratio of heat transfer area to fluid volume. For a given heat exchanger
design, increasing the effectiveness requires and increase in the fluid volume and thus
the thermal mass. The trade-off between steady-state effectiveness and warm-up time
could be studied.
The current method used to maintain the supply reservoir height relies on the ac-
tive control of a solenoid valve. Preliminary experiments were also conducted with an
off-the-shelf toilet float valve. The float valve performed well, but would periodically
stick. The design and implementation of a reliable float valve is needed before the
system can be used in remote areas.
The system described in this thesis represents a proof of concept. Future de-
signs should focus on manufacturablity and maintainability as well as shipping and
installation considerations.
10.2 Conclusion
This thesis has presented the design and experimental results of a passive, density
difference driven, flow-through solar water pasteurization system. The system is
capable of producing 150 liters of treated water during a sunny summer day with
a collector area of 0.45 m2. From the analysis of the daily temperature profiles,
the system should provide significant protection against most (and potentially all)
common waterborne pathogens. The system represents a significant improvement
over previous systems since it does not experience boiling.
92

REFERENCES
[1] Randy Anderson and Kirk Collier. Solar water disinfection. In Annual Confer-ence of the American Solar Energy Society, Boulder, Colorado, 1996.
[2] D. Andreatta, D.T Yegian, L. Connelly, and R.H. Metcalf. Recent advances indevices for heat pasteurization of drinking water in the developing world.In 29th Intersociety Energy Conversion Engineering Conference, volume 4,pages 1741–1746, Washington, DC, 1994. American Institute of Aeronauticsand Astronautics.
[3] A. Anellis, J. Lubas, and M. R. Morton. Heat resistance in liquid eggs of somestrains of genus Salmonella. Food Res., 19:377–395, 1954.
[4] R.A.J. Arthur. Hanging on the lifeline. Water & Environment International,5(1), 1996.
[5] Howard D. Backer. Field water disinfection. In Paul S. Auerbach, edi-tor, Wilderness Medicine— Management of Wilderness and EnvironmentalEmergencies, St. Louis, 1995. Mosby–Year Book, Inc.
[6] Howard D. Backer. Water disinfection for international and wilderness travelers.Clinical Infectious Diseases, 34:355–364, 2002.
[7] J. Bandres, J. Mathewson, and H. Dupont. Heat susceptibility of bacterialenteropathogens. Arch Intern Med, 148:2261–2263, 1988.
[8] N.K. Bansal, R.L. Sawhney, Anil Misra, and A Boettcher. Solar sterilization ofwater. Solar Energy, 40(1):35–39, 1988.
[9] Edward E. Baruth, editor. Water treatment plant design / American WaterWorks Association, American Society of Civil Engineers. McGraw-Hill, NewYork, fouth edition, 2005.
[10] S. Bidawid, J. M. Farber, S. A. Sattar, and S. Hayward. Heat inactivation ofHepatitis A virus in dairy foods. Journal of Food Protection, 63(4):522–528,2000.
[11] Clive de W. Blackburn and Peter J. McClure, editors. Foodborne pathogens–Hazards, risk analysis and control. CRC Press, Boca Raton, Florida, 2002.
[12] Seymour S. Block, editor. Disinfection, sterilization, and preservation. Lippin-cott Williams & Wilkins, Philadelphia, fifth edition, 2001.
93
[13] A. Boettcher, H. Heybutzki, and W. Krug. Self-regulating solar water heaterswith very short start-up phase. In S. V. Szokolay, editor, Solar WorldCongress: proceedings of the eight biennial congress of the InternationalSolar Energy Society, New York, 1984. Pergamon Press.
[14] D.J. Bolton, C.M. McMahon, A.M Doherty, J.J. Sheridan, D.A. McDowell, I.S.Blair, and D. Harrington. Thermal inactivation of Liseria monocytogenesand Yersinia entercolitica in minced beef under laboratory conditions andin sous-vide prepared minced and solid beef cooked in a commercial retort.Journal of Applied Microbiology, 88:626–632, 2000.
[15] J. G. Bradshaw, J. T. Peeler, J. J. Corwin, J. E. Barnett, and R. M. Twedt.Thermal resistance of disease–associated Salmonella typhimurium in milk.Journal of Food Protection, 50:95–96, 1987.
[16] J. G. Bradshaw, J. T. Peeler, and R. M. Twedt. Thermal inactivation of idealloop-reactive Clostridium perfringens type a strains in phosphate buffer andbeef gravy. Applied and Environmental Microbiology, 34(3):280–284, 1977.
[17] Jay Burch and Karen E. Thomas. An overview of water disinfection in devel-oping countries and the potential for solar water pasteurization. Techni-cal Report TP550-23110, National Renewable Energy Laboratory (NREL),1998.
[18] Jay D. Burch and Karen E. Thomas. Solar thermal waster pasteurization. InR. Campbell-Howe, T. Cortez, and B. Wilkins-Crowder, editors, Proceedingsof the 1998 American Solar Energy Society Annual Conference, Boulder,Colorado, 1998. American Solar Energy Society.
[19] Jay D. Burch and Karen E. Thomas. Water disinfection for developing countriesand the potential for solar thermal pasteurization. Solar Energy, 64, 1998.
[20] Yunas A. Cengel. Heat Transfer: A Practicle Approach. McGraw-Hill Educa-tion, New York, second edition, 2003.
[21] Center for Food Safety & Applied Nutrition. Foodborne pathogenic mircroor-ganisms and natural toxins handbook. Technical report, The United StatesFood and Drug Andministration, http://vm.cfsan.fda.gov/ mow/intro.html,1999.
[22] Center for Food Safety & Applied Nutrition. Grade “A” pasteurized milk ordi-nance. Technical Report 229, The United States Food and Drug Andminis-tration, 1999.
[23] D Ciochetti and R.H Metcalf. Pasteurization of naturally contaminated waterwith solar energy. Applied and Environmental Microbiology, 47:223–228,1984.
[24] John C. Cobb. Simple self-regulating solar pasteurizer for contaiminated water.In Jeffery. M. Morehouse and Roy. E. Hogan, editors, Solar Engineering1998– Proceedings of the International Solar Energy Society, New York,1998. American Society of Mechanical Engineers.
94
[25] R.M. Conroy, M. Elmore-Meegan, T. M. Joyce, K. G. McGuigan, and J. Barnes.Solar disinfection of drinking water and incidence of diarrhoea in maasaichildren: A controlled field trial. The Lancet, 348:1696–1697, 1996.
[26] Adrienne T. Cooper. Solar Photochemical Technology for Potable Water Treat-ment in the Tropics: Disinfection and Detoxification. PhD thesis, Universityof Florida, 1998.
[27] Adrienne T. Cooper and Goswami D. Yogi. A survey of solar based drinkingwater treatment. In Jeffery. M. Morehouse and Roy. E. Hogan, editors, SolarEngineering 1998– Proceedings of the International Solar Energy Society,New York, 1998. American Society of Mechanical Engineers.
[28] J.-Y. D’Aoust, C. E. Park, R. A. Szabo, E. C. D. Todo, D. B. Emmons, andR. C. McKellar. Thermal inactivation of Camplylobacter species, Yersiniaenterocolitica, and hemorrhagic Eschirichia coli 0157:h7 in fluid milk. Jour-nal of Dairy Science, 71:3230–3236, 1988.
[29] Ming Qi Deng and Dean O. Cliver. Inactivation of Cryptosporidium parvumoocycts in cider by flash pasteurization. Journal of Food Protection,64(4):523–527, 2001.
[30] Ulrich Desselberger. Rotavirus infections: Guidelines for treatment and pre-vention. Drugs, 58(3):447–452, 1999.
[31] Ronald L. Droste. Theory and practice of water and wastewater treatment.John Wiley, New York, 1997.
[32] William S. Duff and David A. Hodgson. A passive solar water pastuerizationsystem without valves. In Annual Conference of the American Solar EnergySociety–Forum 2001, Washingtong, D.C., Boulder, Colorado, 2001.
[33] S. A. Esrey, J. B. Potash, L. Roberts, and C. Shiff. Health benefits from im-provements in water supply and sanitation: Survey and analysis of literatureon selected diseases. Technical Report 66, Water and Sanitation for Health(WASH), U.S. Agency for International Development, Washington, D.C.,1990.
[34] S. A. Esrey, J. B. Potash, L. Roberts, and C. Shiff. Effects of improved watersupply and sanitation on ascariasis, diarrhoea, dracunculiasis, hookworminfection, schistosomiasis, and trachoma. Bulletin of the World Health Or-ganization, 69(5):609–621, 1991.
[35] D. A. Evand, D. J. Hankinson, and W. Litsky. Heat resistance of certain patho-genic bacteria in milk using a commercial plate heat exchanger. Journal ofDairy Science, 53:1659–1665, 1971.
[36] R. Fayer. Effect of high temperature on infectivity of Cryptosporidium parvumoocysts in water. Applied and Environmental Microbiology, 60:2732–2735,1994.
95

[37] R.E. Feachem, D.J. Bradley, H. Garelick, and D. D. Mara. Sanitation andDisease: Health Aspects of Excreta and Wastewater Management. JohnWhiley and Sons, New York, 1983.
[38] Roger Fujioka and Geeta Rijal. Evaluation of the grand solar pasteurizing sys-tem to disinfect water. Technical Report PR-2-10-95, University of Hawaii,1995.
[39] Ashok Gadgil. Drinking water in developing countries. Annu. Rev. EnergyEnviron., 23:253–286, 1998.
[40] G. W. Gould. Application of thermal processing in the food industry. In A. D.Russell, W. B. Hugo, and G. A.J. Ayliffe, editors, Principles and practiceof disinfection, preservation and sterilization, Malden, MA, 1999. BlackwellScience.
[41] C. Groh, MacPherson D., and D. and Groves. Effect of heat on the sterilizationof artificially contaminated water. Journal of Travel Medicine, 3:11–13,1996.
[42] James A. Harp, Ronald Fayer, Bruce A. Pesch, and George J. Jackson. Effectof pasteurization on infectivity of Cryptosporidium parvum oocycsts in milkand water. Applied and Environmental Microbiology, 62(8):2866–2868, Aug1996.
[43] Yoshio Iijima, Mohamed Karama, Joseph O. Oundo, and Takeshi Honda. Pre-vention of bacterial diarrhea by pasteurization of drinking water in kenya.Microbiol. Immunol., 45(6):413–416, 2001.
[44] John L. Ingraham and Catherine A. Ingraham. Introduction to Microbiology.Brooks/Cole, Pacific Grove, CA, second edition, 2000.
[45] A.J. Jørgensen, K. Nøhr, H. Sorensen, and F. Boisen. Decontamination ofdrinking water by direct heating in solar panels. Journal of Applied Micro-biology, 85:441–447, 1998.
[46] T. M. Joyce, K. G. McGuigan, M. Elmore-Meegan, and R. M. Conroy. Inac-tivation of fecal bacteria in drinking water by solar heating. Applied andEnvironmental Microbiology, 62(2):399–402, 1996.
[47] V.K. Juneja and B.S. Eblen. Heat inactivation of Salmonella typhimuriumdt104 in beef as affected by fat content. Letters in Applied Microbiology,30(6):461–467, 2000.
[48] V.K. Juneja and A.J. Miller. Use of submerged-coil heating apparatus in thestudy of thermal resistance of foodborne pathogens. In Michael H. Tunick,Samuel A. Palumbo, and Pina M. Fratamico, editors, New techniques inthe analysis of foods, volume 1, pages 131–141, New York, 1998. KluwerAcademic.
[49] Evelien M. Kamminga. Economic Benefits from Improved Rural Water Supply.IRC International Water and Sanitation Centre, The Hague, 1991.
96
[50] Hilde Kruse. Opinion of the scientific committee on veterinary measures re-lating to public health on norwalk-like viruses. Technical report, EuropeanCommission, Health & consumer protection directorate–general, 2002.
[51] E. P. Larkin. Thermal inactivation of viruses. Technical report, U.S. ArmyNatick Laboratories, Natick, MA, 1977.
[52] E. P. Larkin and A. C. Fassolitis. Viral heat resistance and infectious ribonucleicacid. Applied and Environmental Microbiology, 38:650–655, 1979.
[53] Mark W LeChevallier, William D. Norton, and Ramon G. Lee. Giardia andCryptospridium spp. in filtered drinking water supplies. Applied and Envi-ronmental Microbiology, 57(9):2617–2621, Sep 1991.
[54] J.E. Line, A.R. Fain, A.B Mogan, L.M. Lechowich, R.V. Carosella, and W.L.Brown. Lethality of heat to Escheriacia coli o157:h7: D-value ans z-valuedetermination in ground beef. Journal of Food Protection, 54:762–766, 1991.
[55] Josheph Lovett, Joe G. Bradshaw, and James T. Peeler. Thermal inactivationof Yersinia enterocolitica in milk. Applied and Environmental Microbiology,44(2):517–519, Aug 1982.
[56] Peggy P. Mak, Barbara H. Ingham, and Steven C. Ingham. Validation of applecide paseurization treatments agains Escherichia coli 0157:h7, Salmonella,and Liseria monocytogenes. Journal of Food Protection, 65(11):1679–1689,2001.
[57] E.E. Mast and K. Krawczynski. Hepatitis e: An overview. Annual Review ofMedicine, 47:257–266, 1996.
[58] A.S. Mazzotta. Thermal inactivation of stationary-phase and acid-adaptedEscherichia coli o157:h7, Salmonella and Listeria monocytogenes in fruitjuices. Journal of Food Protection, 64:315–320, 2001.
[59] K.G. McGuigan, T.M. Joyce, R.M. Conroy, J.B. Gillespie, and M. Elmore-Meegan. Solar disinfection of drinking water contained in transparent plas-tic bottles: Characterizing the bacterial inactivation process. Journal ofApplied Microbiology, 84:1138–1148, 98.
[60] E. A. Meyer and S. Radulescu. Giardia and giardiasis. Advances in Parasitol-ogy, 17:1–47, 1979.
[61] C.B. Michalski, R.E. Brackett, Y.-C. Hung, and O.I. Ezeike. Use of capillarytubes and plate heat exchanger to validate u.s. department of agriculturepasteurization protocols fo elimination of Salmonella enteritidis from liquidegg products. Journal of Food Protection, 62(2):112–117, 1999.
[62] The National Advisory Commmittee on Microbiological Criteria for Foods.Campylobacter jejuni/coli. Journal of Food Protection, 57:1101–1121, 1994.
[63] Th. J. Neuwstad, A. H. Havelaar, and M. van Olphen. Hyraulic and microbi-ological characterization of reactors for ultraviolet disinfection of secondarywastewater effluent. Wat. Res., 25(7):775–783, 1991.
97
[64] Rosely Nickols and Huw Smith. Parasites: Cryptospridium, Giardia, and Cy-clospora as foodborne pathogens. In Clive de W. Blackburn and Peter J.McClure, editors, Foodborne pathogens– Hazards, risk analysis and control,Boca Raton, Florida, 2002. CRC Press.
[65] E. Ongerth, Jerry, Ron L. Johnson, Steven C MacDonald, Floyd Frost, andHenry H. Stibbs. Backcountry water treatment to prevent giardiasis. Amer-ican Journal of Public Health, 79(12):1633–1637, 1989.
[66] M.S. Palumbo, S.M. Beers, S. Bhaduri, and S.A Palumbo. Thermal resistanceof Salmonella spp. and Liseria monocytogenes in liquid egg yolk an egg yolkproducts. Journal of Food Protection, 58:960–966, 1995.
[67] U. D. Parashar, J.S. Breses, J.R. Gentsch, and R.I. Glass. Rotavirus. EmergingInfectious Dis, 5:561–570, 1998.
[68] J.V. Parry and P.P Mortimer. The heat sensitivity of Hepatitis A virus de-termined by a simple tissue culture method. Journal of Medical Virology,14:277–283, 1984.
[69] Lansing M. Prescott, John P. Harley, and Donald A. Klein. Microbiology. Wm.C. Brown, Debuque, IA, 1990.
[70] R.E. Quick et al. Diarrhoea prevention in bolivia through point of use watertreatment and safe storage: A promissing new strategy. Epidemiology andInfection, 122(1):83–90, 1999.
[71] G.K. Rijal and R.S. Fujioka. Synergistic effect of solar radiation and solarheating to disinfect drinking water sources. Water Science and Technology,43(12):155–162, 2001.
[72] A. D. Russell, W. B. Hugo, and G. A.J. Ayliffe, editors. Blackwell Science,Malden, MA, third edition, 1999.
[73] Safapour et al. Enhancement of solar water pasteurization with reflectors. Ap-plied and Environmental Microbiology, 65(2):859–861, 1999.
[74] Safe Water Systems. Technical report, Safe Water Systems, 2800 WoodlawnDrive, Suite 265, Honolulu, Hawaii 96822, www.safewatersystems.com, 2001.
[75] T. S. Saitoh et al. Solar water–sterilization system with thermally–controlledflow. Applied Energy, 64(1):387–399, 1999.
[76] Frank W. Schaefer, III, Eugene W. Rice, and John C. Hoff. Factors promoting invitro excystation of Giardia muris cysts. Transactions of the Royal Societyof Tropical Medicine and Hygiene, 78:795–800, 1984.
[77] Christopher R. Schulz and Daniel A. Okun. Surface water treatment for com-munities in developing countries. John Wiley & Sons, New York, 1984.
[78] Lawrence M. Shultz, James E. Rutledge, Robert M. Grodner, and Stanley L.Biede. Determination of the thermal death time of Vibrio cholerae in bluecrabs (Callinectes sapidus). Journal of Food Protection, 47(1):4–6, 1984.
98
[79] M. J. Slomka and H. Appleton. Feline calicivirus as a model system for heatinactivation studies of small round structured viruses in shellfish. Epidemi-ology and Infection, 121:401–407, 1998.
[80] James L. Smith. Cryptosporidium and Giardia as agents of foodborne disease.Journal of Food Protection, 56(5):451–461, May 1993.
[81] B. Sommer, A. Mari no, Y. Solarte, M. L. Salas, C. Dierolf, C. Valiente,D. Mora, R. Rechsteiner, P. Setter, W. Wirojanagud, H. Ajarmeh, A. Al-Hassan, and M. Wgelin. Sodis—an emerging water treatment process. Jour-nal Water SRT—Aqua, 46(3):127–137, 1997.
[82] S. Sorqvist. Heat resistance of Campylobacter and Yersinia strains by threemethods. Journal of Applied Bacteriology, 67:543–549, 1989.
[83] J.H. Steele. History, trends, and extent of pasteurization. Journal of the Amer-ican Veterinary Medical Association, Jul 2000.
[84] Ted S. Steiner, Nathan M. Thielman, and Richard L. Guerrant. Protazoalagents: What are the dangers for the public water supply? Annual Reviewof Med, 48:329–340, 1997.
[85] Robert J. Stevens. An investigation of a solar pasteurizer with an integral heatexchanger. Master’s thesis, North Carolina State University, 1998.
[86] Robert J. Stevens, Richard Johnson, and Herbert Eckerlin. An investiga-tion of a solar pasteurizer with an integral heat exchanger (SPIHX). InR. Campbell-Howe, T. Cortez, and B. Wilkins-Crowder, editors, Proceed-ings of the 1998 American Solar Energy Society Annual Conference, Boul-der, Colorado, 1998. American Solar Energy Society.
[87] Marco Strazynski, Johannes Kramer, and Barbara Becker. Thermal inactiva-tion of Poliovirus type 1 in water, milk and yoghurt. International Journalof Food Microbiology, 74:73–78, 2002.
[88] C. R. Stumbo. Thermobacterioilogy in Food Processing. Academic Press, NewYork, second edition, 1973.
[89] R. J. Sullivan, J. T. Tierney, E. P. Larkin, R. B. Jr Read, and Peeler J. T.Thermal resistance of certian ocogenic viruses suspended in milk and milkproducts. Journal of Applied Microbiology, 22:313–320, 1971.
[90] Global water supply and sanitation assessment: 2000 report. Technical report,Geneva and New York, 2000.
[91] John T. Tierney and Edward P. Larkin. Potential sources of error during virusthermal inactivation. Applied and Environmental Microbiology, 36(3), Sep-tember 1978.
[92] Syed Toora, Ebo Budu-Amoako, Richard F. Ablett, and Jim Smith. Effectof high-temperature short-time pasteurization, freezing adn thawing andconstant freezing, on the survival of Yersinia enterocolitica in milk. Journalof Food Protection, 55:803–805, Oct 1992.
99
[93] D. J. van Donsel, J. T. Peeler, and E. P. Larkin. Comparative thermal resis-tance of human and simian Rotaviruses assayed on cells grown in serum–freemedium. Journal of Food Protection, 49:818–821, 1986.
[94] Jan Teun Visscher. Slow sand filtration: Design, operation and maintenance.Journal of AWWA, pages 67–71, Jun 1990.
[95] Water Supply and Sanitation Collaborative Council. In VISION 21: A sharedvision for hygiene, sanitation and water supply and a framework for action.Proceedings of the Second World Water Forum, Geneva, 2000.
[96] M. Wegelin, R. Schertenleib, and M. Boller. The decade of roughing filters—development of a rural water–treatment process for developing countries.Journal of Water Research and Technology, 40(5):304–316, 1991.
[97] T. C. White, N. D. Heidelbaugh, and S. McConnell. Survial of virus after ther-moprocessing in capillary tubes. Journal of Food Processing and Preserva-tion, pages 31–40, 1982.
[98] World Health Organization. WHO Guidelines for Drinking Water Quality.World Health Organization, Geneva, 1993.
[99] World Health Organization. Dracunculiasis eradication. Weekely epidemiolog-ical record, 77:143–152, 2002.
[100] The World Health Organization. Global burden of disease and injury. In Globalhealth statistics, Cambridge, MA, 1996. Harvard School of Public Health.
[101] The World Health Organization. The world health report: making a difference.Technical report, The World Health Organization, Geneva, 2000.
100


![Ovissipour] Pasteurization Conditions (Spinacia Oleracea](https://img.pdfslide.us/doc/110x75/620925e7e2850e2aa1004127/ovissipour-pasteurization-conditions-spinacia-oleracea-.jpg)