Embed Size (px)
Citation preview
MEASUREMENTS O F DRAG COEFFICIENTS
FOR FALLING AND RISING SPHERES IN FREE MOTION
Thesis by
A . Werner Preukschat
In Pa r t i a l Fulfillment of the Requirements
F o r the Degree of
Aeronautical Engineer
California Institute of Technology
Pasadena, California
1962
ACKNOWLEDGEMENTS
The author wishes to express his deep gratitude to P ro fes so r
H. W. Liepmann under whose expert guidance the present work was
performed and for his advice and the many helpful suggestions, and
to P ro fes so r s Millikan and Zukoski, members of his supervising
committee.
The author would a l so like to acknowledge his indebtedness
to P ro fes so r Wu for placing the t e s t facil i t ies in the Hydrodynamics
Laboratory a t the author's disposal.
Thanks a r e a l so extended to M r s . Geraldine Krent ler for
typing the manuscript and to the staff of the Guggenheim Aeronautical
Laboratory and the Hydrodynamics Laboratory for the i r kind help with
the experim ents . The author wishes to express his special gratitude to the
executive committee of the Deutscher Akademischer Aus tauschdienst
by whom the author was appointed as NATO Graduate Fellow for the
years 1960 to 1962.
ABSTRACT
The purpose of this thesis is to investigate the d rag coefficient
of spheres i n f r e e motion, falling and rising, i n water .
Following the introduction the t e s t set-up, sphere re lease
mechanism, spheres and timing device and r ecorde r a r e described.
Section 3 gives the resu l t s of the drag coefficient measurements
for f r e e falling spheres which show good agreement with the known
measurements , quoted, for instance, in the Handbuch d e r Experi-
m entalphysik.
Section M e a l s with the measurement of d rag coefficients of
f ree- r i s ing spheres . It was found that the freely r is ing spheres move
in an oscil latory path of which wavelength and amplitude depend on the
rat io of sphere density and water density.
The local drag coefficient of the spheres was measured to be
the s a m e a s for falling spheres . It was found to be independent of the
sphere motion.
No cr i t ica l Reynolds number was found for the onset of the
oscil latory motion of the sphere. The oscilPatory motion appeared to
be independent of initial disturbances of the sphere motion.
F r o m photographs of the sphere paths Strouhal numbers were
formed which a r e about one third the value given fo r c i rcu lar cylinders
in the s a m e Reynolds number range.
A theoretical oscil latory force coefficient, based on a force
balance on the sphere, was obtained. It was found to be of the s a m e
o rde r of magnitude a s the correspondent, actually measured
oscillatory force coefficient on a circular cylinder.
The Strouhal number based on the main theoretical frequency
was found to be four times a s high as the one calculated from the
frequency of the sphere path. It could be, dependent on the sphere
density, as high as twice the Strouhal number found for circular
cyliliders in the same Reynolds nurnber range.
TABLE O F CONTENTS
Acknowledgements
Abstract
Table of Contents
List of Symbols
1. Introduction
2 . Equipment
2. 1. Test Set-up
2. 2. Sphere Release Mec&ai?ism
2 . 3 . Spheres
2 .4 . Timing Device and Recorder
3 . Drag Measurements of Free -Falling Spheres
3 . l. General Remarks
3 . 2. Results
3. 3 . Discussion of Results
3 . 4 . Conclusion
4. Drag Measurements of Free-Rising Spheres
4.1. General Remarks
4. 2. Spheres Rising in 6-inch Diameter Tube
4. 2. 1. Results
4. 2. 2, Discussion of Results
4. 2. 3 . Conclusion
4 . 3 . Spheres Rising in Large Water Tank
PAGE
ii
iii
i v
vi
P
2
2
3
4
5
6
6
7
8
9
10
1 0
11
112
13
15
16
References
Appendix A
Appendix B
'Tables
Figures
v
TABLE OF CONTENTS (Contd. )
PAGE
4 . 3 . Spheres Rising in Large Water Tank (contd. )
4 . 3 . P. General Remarks 17
4 . 3 . 2. Results 18
4. 3. 3 . Discussion of Results 19
4 . 3 . 4 . Summary 23
25
2 6
2 9
3 5
55
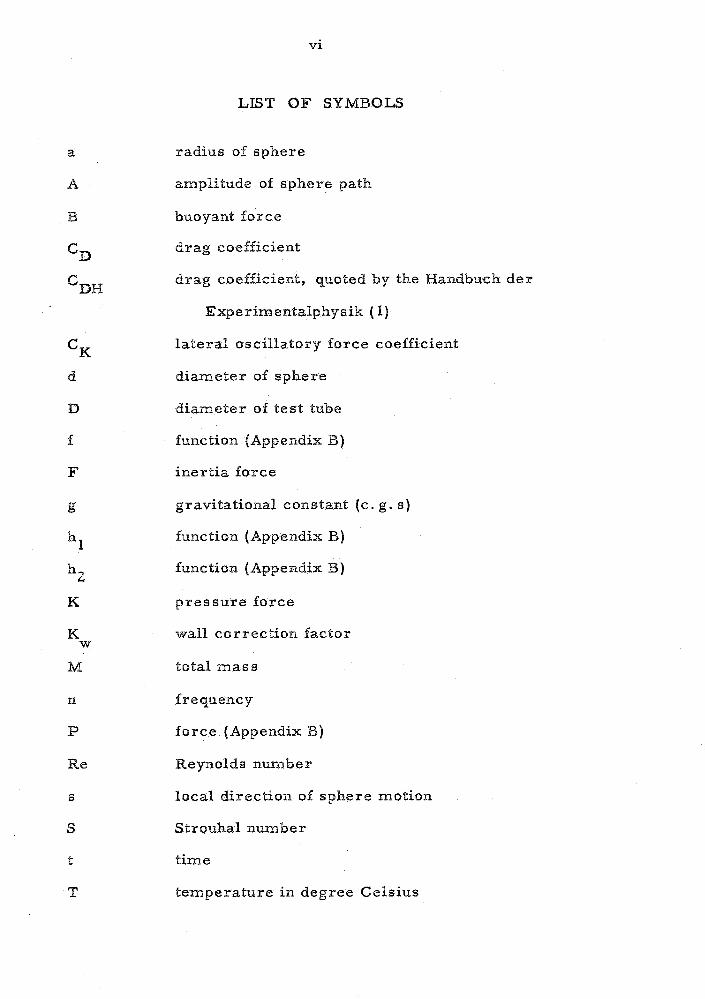
LIST O F SYMBOLS
radius of sphere
amplitude of sphere path
buoyant force
drag coefficient
drag coefficient, quoted by the Handbuch d e r
Experimentalphysik ( 11)
l a te ra l oscil latory force coefficient
diameter of sphere
diameter of t e s t tube
function (Appendix IS)
iner t ia force
gravitational constant (c. g. s )
function (Appendix B)
function (Appendix B)
p r e s s u r e force
wall correct ion factor
total m a s s
frequency
force (Appendix B)
Reynolds number
local direction of sphere motion
Strouhal number
tirn e
temperature i n degree Celsius
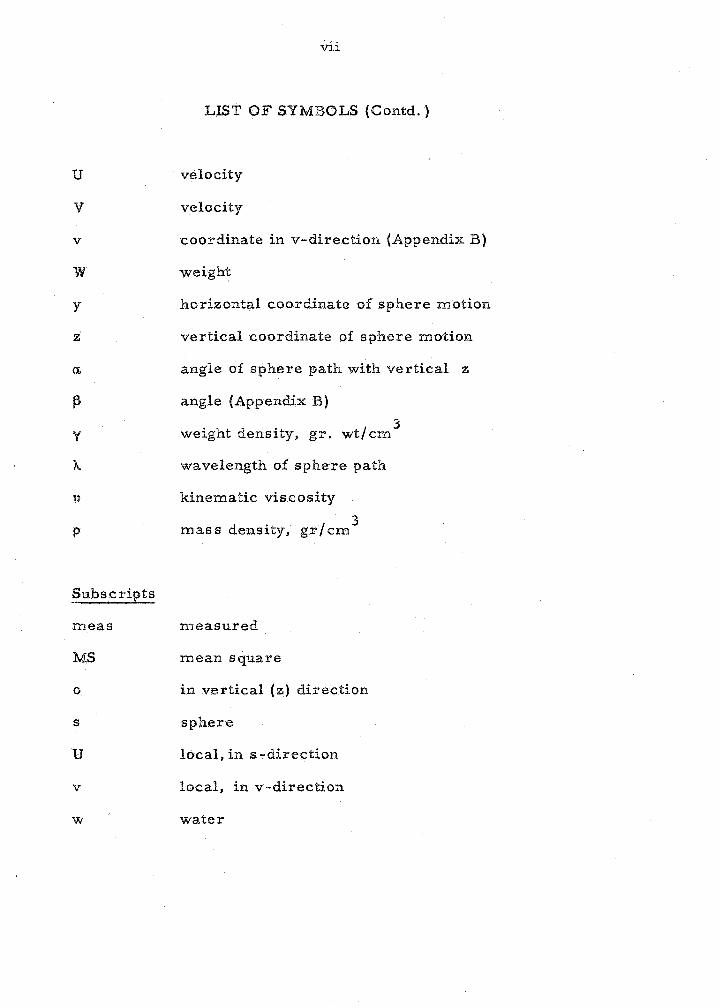
Subscripts
m e a s
MS
o
S
U
v
w
vii
LIST O F SYMBOLS (Contd. )
velocity
velocity
coordinate in v-direction (Appendix B)
weight
horizontal coordinate of sphere motion
vert ical coordinate of sphere motion
angle of sphere path with ver t ical z
angle (Appendix B)
weight density, g r . wt/crn 3
wavelength of sphere path
kinematic viscosity
m a s s density, g r / c m 3
measured
mean square
i n ver t ical (z) direction
sphere
local, i n s -direction
local, in v-direction
water
In some experiments made in the Mercury Tank a t the
Ghaggenheim Aeronautical Laboratory to dete rmine magne to-fluid
dynamic effects on the drag on spheres, i t was noticed that the
measured drag of freely rising spheres, with no magnetic field, - could be as much as twice the "acceptedw value, quoted, for instance, by
the Handbuch der Experimentalphysik (Ref. 1). The Handbuch values
are based on experiments with falling or fixed spheres; and differences
in drag for rising and falling spheres have been previously observed
by Hes selberg and Birkeland (Ref. 2) and others.
It thus seems that the flow around a rising sphere i s somehow
different from that around a falling one. The purpose of this thesis
i s to investigate the reasons for such a difference, particularly
in the drag coefficient.
2. EQUIPMENT
2. l . Test Set-Up.
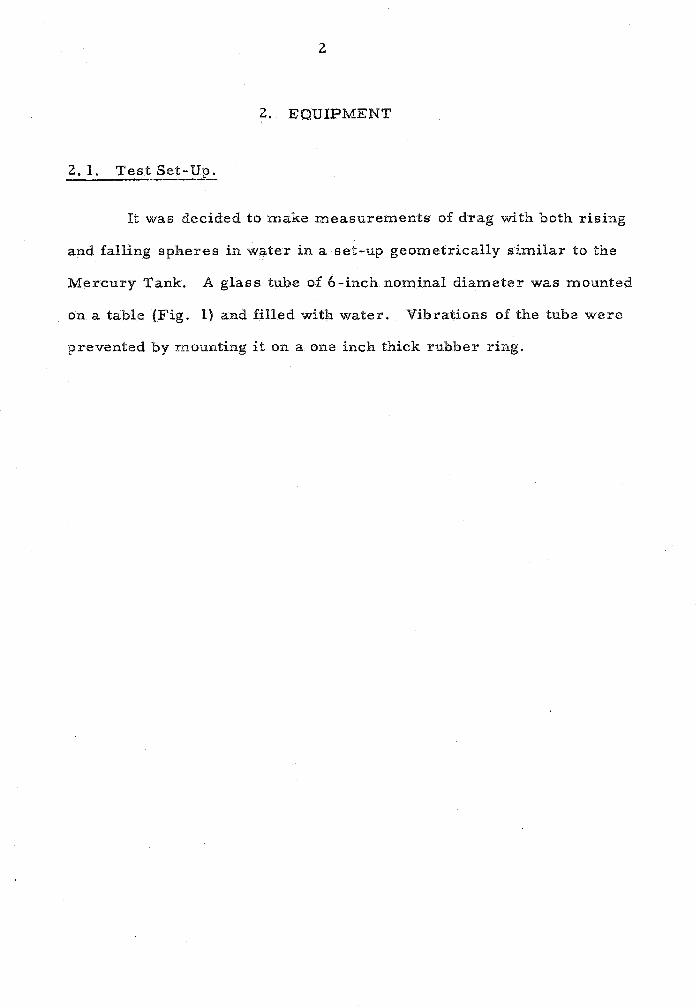
It was decided to make measurements of drag with both rising
and falling spheres in water in a set-up geometrically similar to the
Mercury Tank. A glass tube of 6-inch nominal diameter was mounted
on a table (Fig. 1) and filled with water. Vibrations of the tube were
prevented by mounting i t on a one inch thick rubber ring.
2 . 2 . Sphere Release Mechanism.
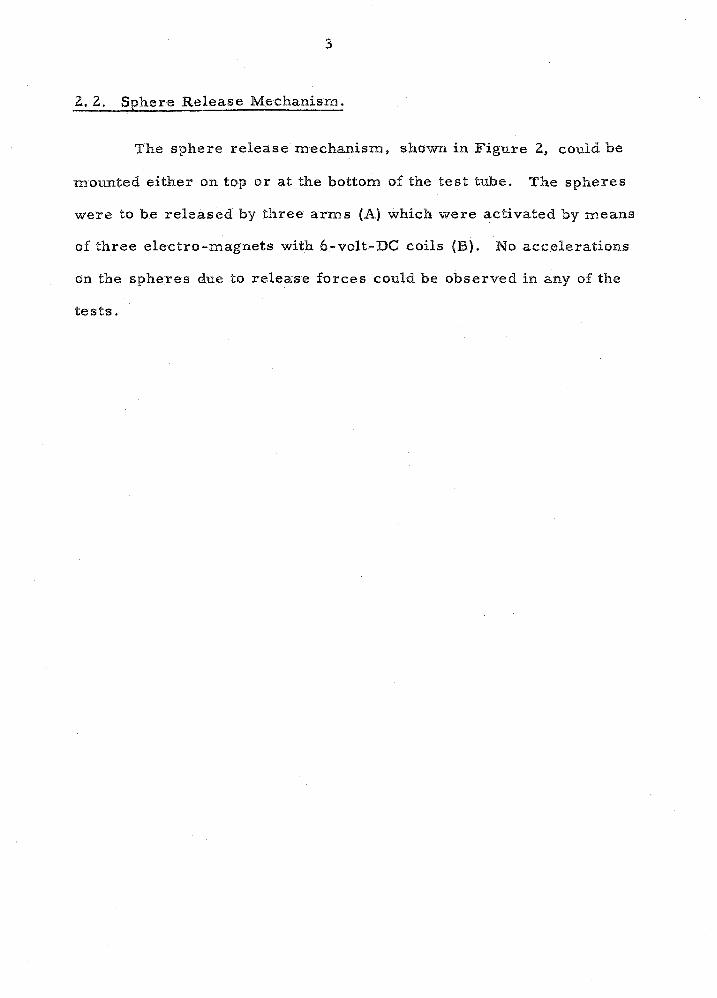
The sphere release mechanism, shown in Figure 2, could be
mounted either on top or a t the bottom of the test tube. The spheres
were to be released by three a rms (A) which were activated by means
of three electro-magnets with 6-volt-DC coils (B). No accelerations
on the spheres due to release forces could be observed in any of the
tests.
2 . 3 . Spheres.
In order to vary Reynolds number and density ratios p / p S W
different spheres were used.
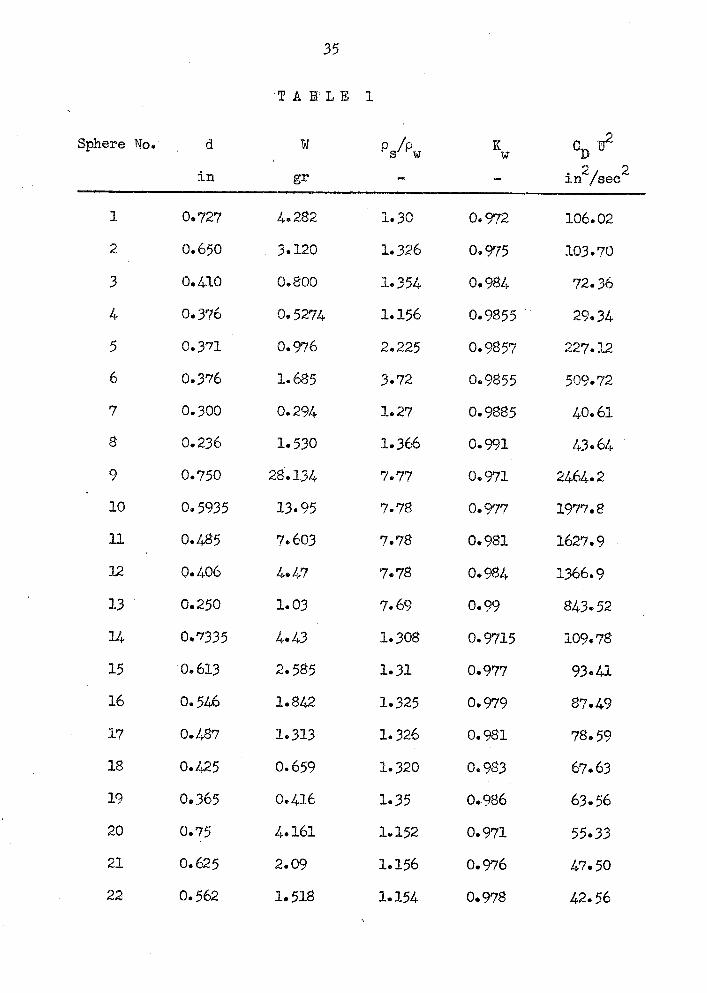
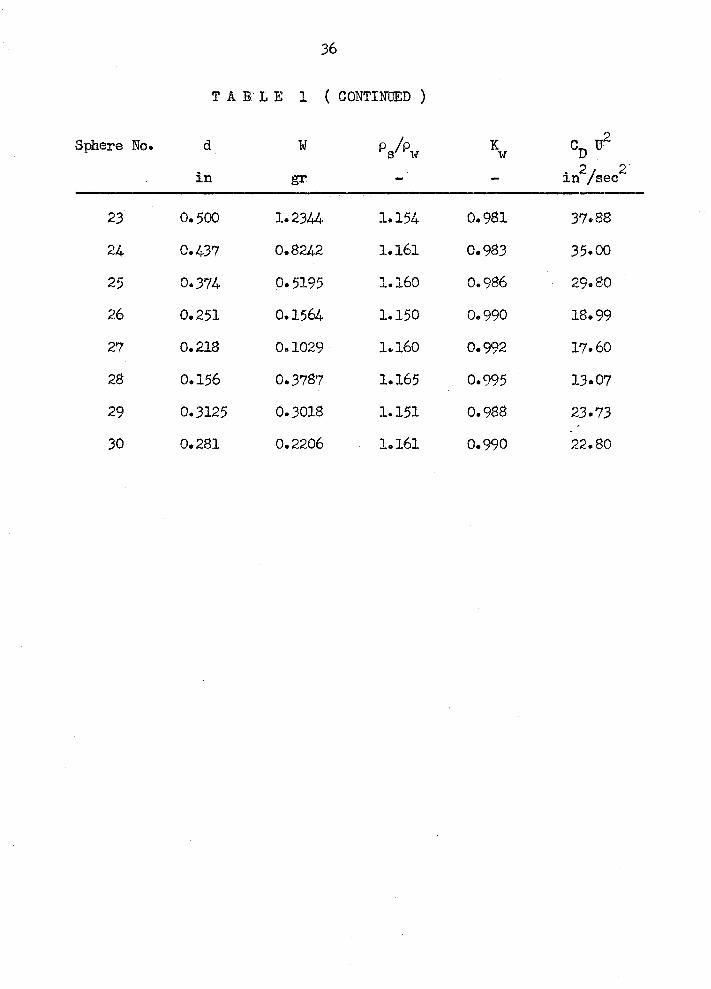
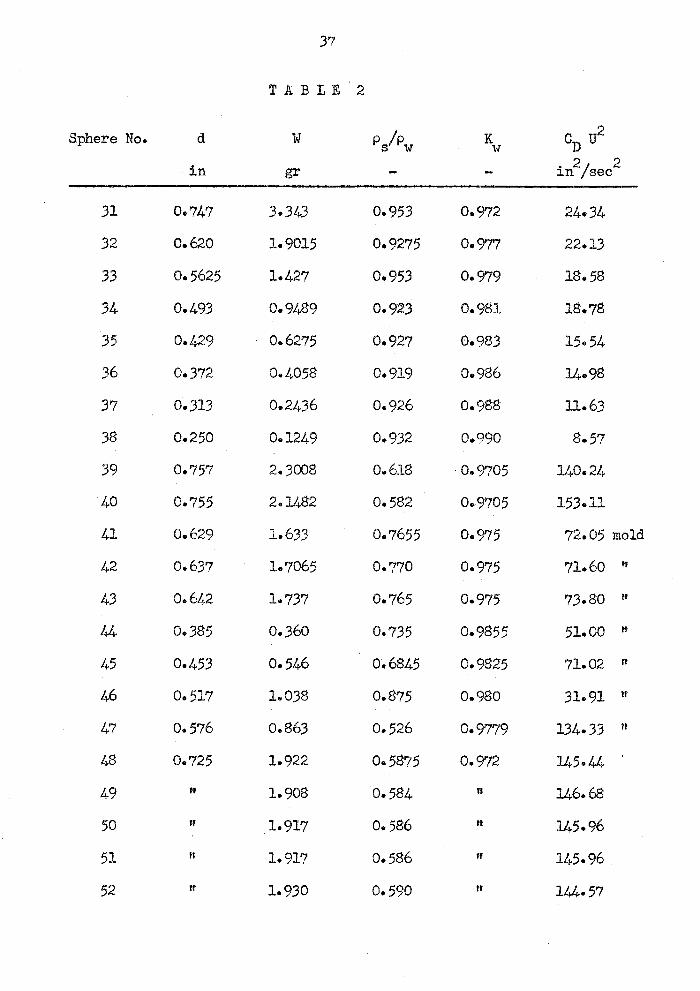
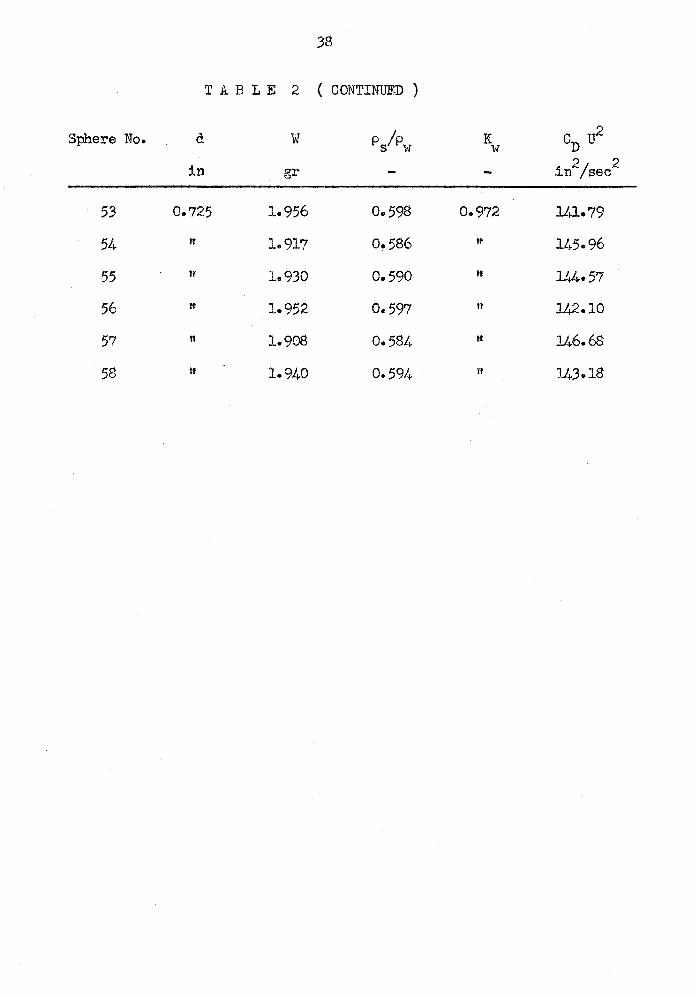
Table 1 gives data on spheres with p s i P w greater than one,
Table 2 on those with ps / Pw less than one.
The diameters of the spheres were measured using a micro-
meter. A mean diameter was found by averaging the diameters of
ten spheres. The calculation of the sphere volumes was based on
this average diameter. The weight of the spheres was determined
using a milligram balance.
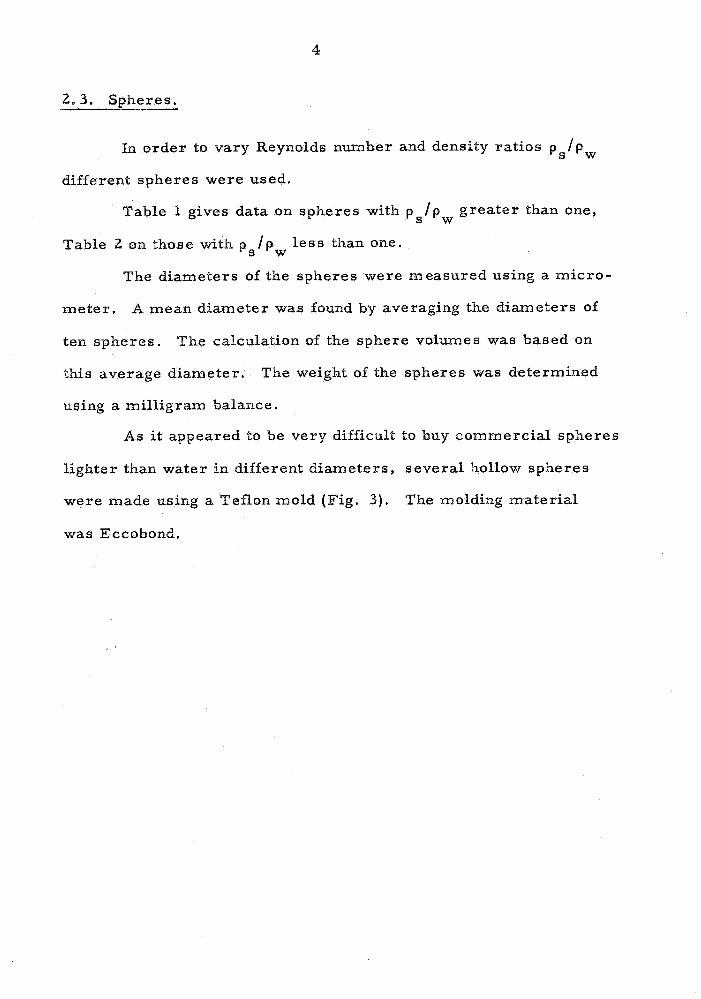
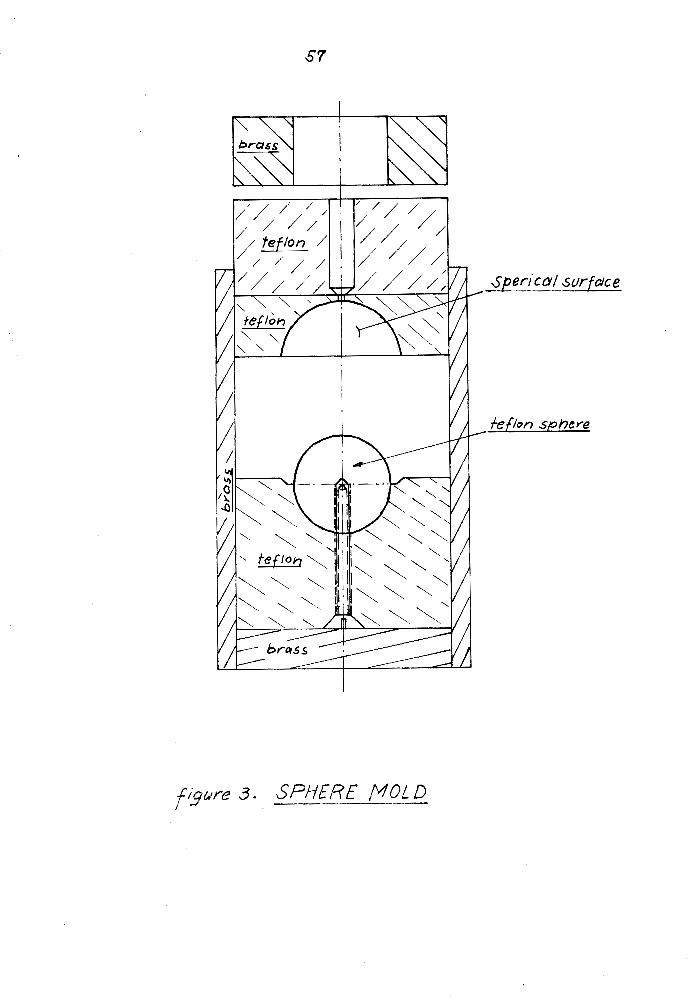
As i t appeared to be very difficult to buy commercial spheres
lighter than water in different diameters, several hollow spheres
were made using a Teflon mold (Fig. 3). The molding material
was Eccobond.
2.4. Timing Device and Recorder.
Several preliminary velocity measurements were made using
a s timing devices a stopwatch and a magnetic-type indicator. These,
however, gave no satisfactory results so that a third timing device
had to be built.
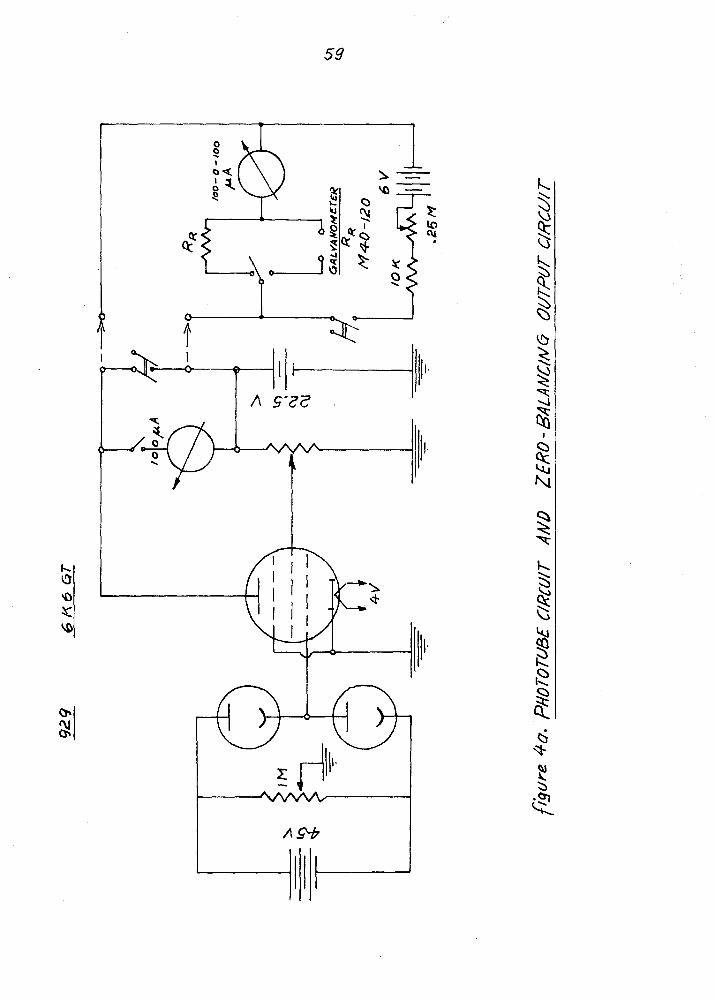
Using the principle that a change in light intensity can be
detected by photocells, a phototube timing device was constructed. In
this device the sphere crosses a light beam which changes the light
intensity at the phototube, thus giving r i se to a change in electrical
potential a t the amplifier tube (Fig. 4). The electric circuit i s shown
in Figure 4a. In order to obtain a large deflection of the galvanometer
of the Visicorder, on which the two time signals were recorded, a
Heiland M $0 - l 20 galvanometer connected to a zero-balancing output
circuit (also shown in Fig. 4a) was used.
With this timing device spheres of diameters down to 8. 25
inch were still detectable when crossinig the light beam.
3. DRAG MEASUREMENTS O F FREE-FALLING SPHERES
3. l . General Remarks.
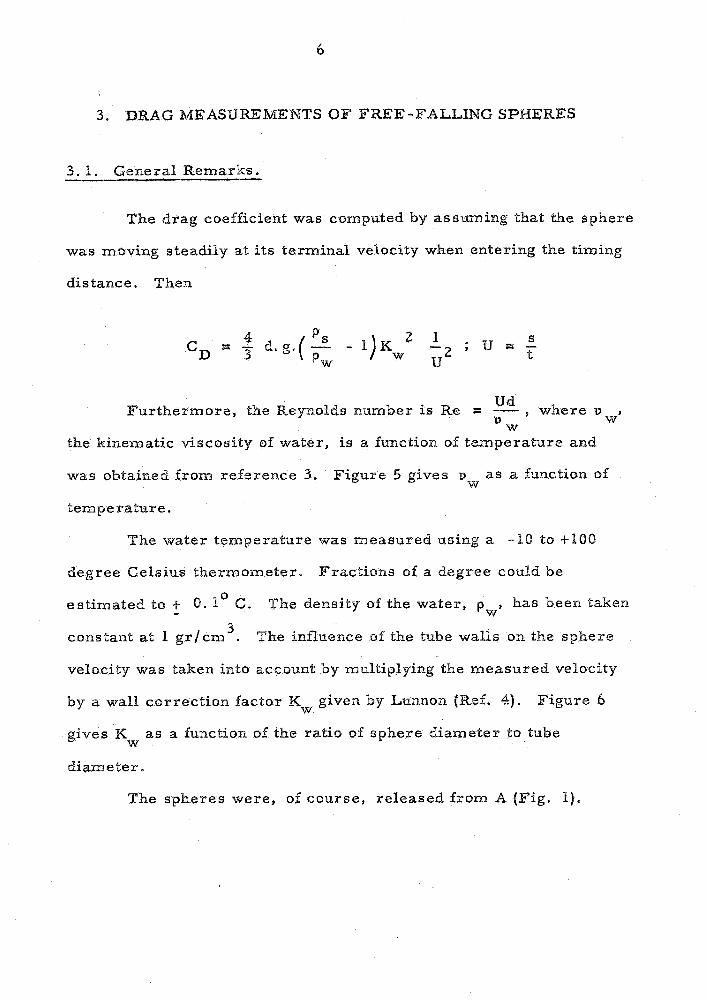
The drag coefficient was computed by assuming that the sphere
was moving steadily a t its terminal velocity when entering the timing
distance . Then
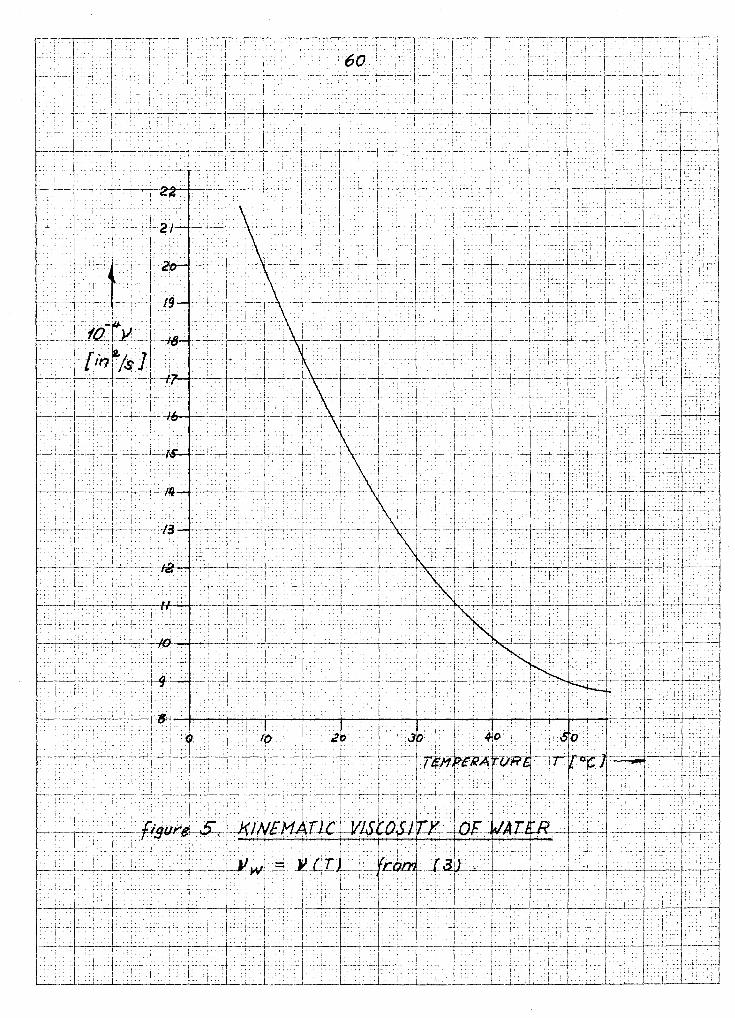
Ud Fur thermore , the Reynolds number is Re = - , where vw,
v w the kinematic viscosity of water, is a function of tempera ture and
was obtained from reference 3 . Figure 5 gives a, a s a function of w
temperature.
The water temperature was measured using a - P O to +I08
degree Celsius thermometer . Fract ions of a degree could be
0 est imated to + 0. 1 C. The density of the water , p , has been taken - w
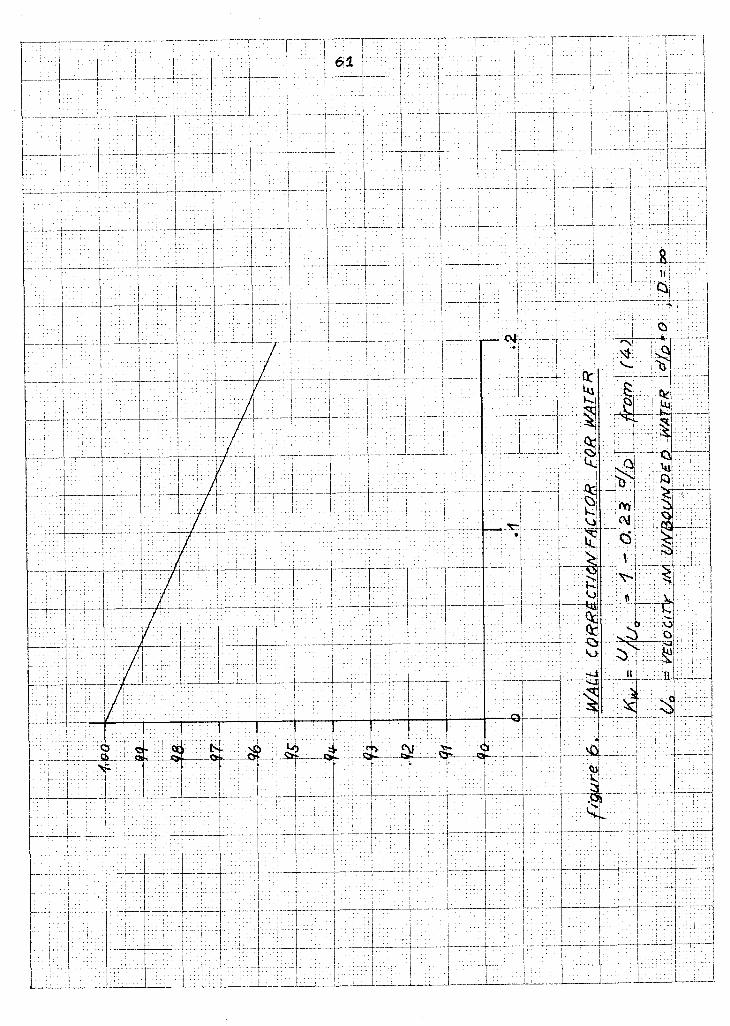
3 constant a t 1 g r / c m . The influence of the tube walls on the sphere
velocity was taken into account by multiplying the measured velocity
by a wall correct ion factor Kw given by Lunnon (Ref. 4). F igure 6
gives K a s a function of the rat io of sphere diameter to tube w
diameter .
The spheres were, of course, re leased from A (Fig. 1).
3 . 2. Results.
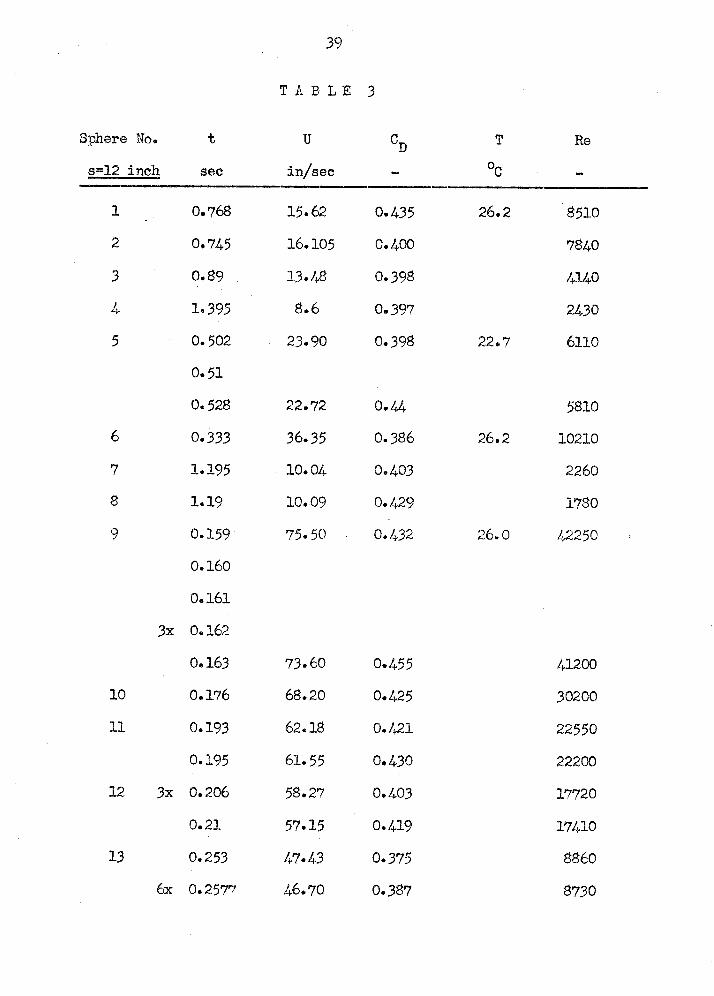
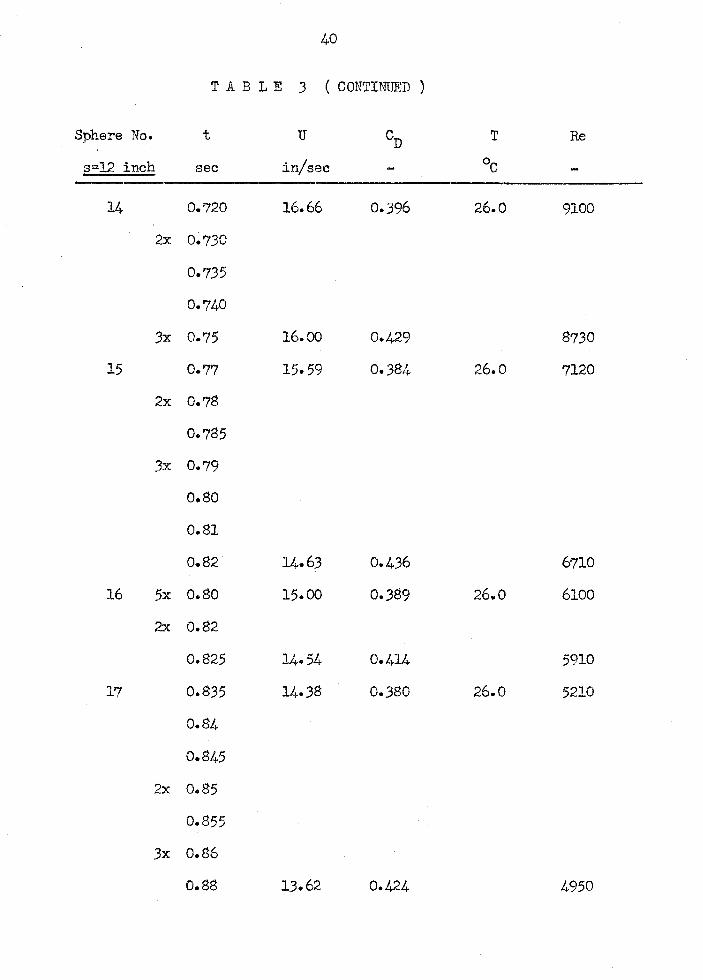
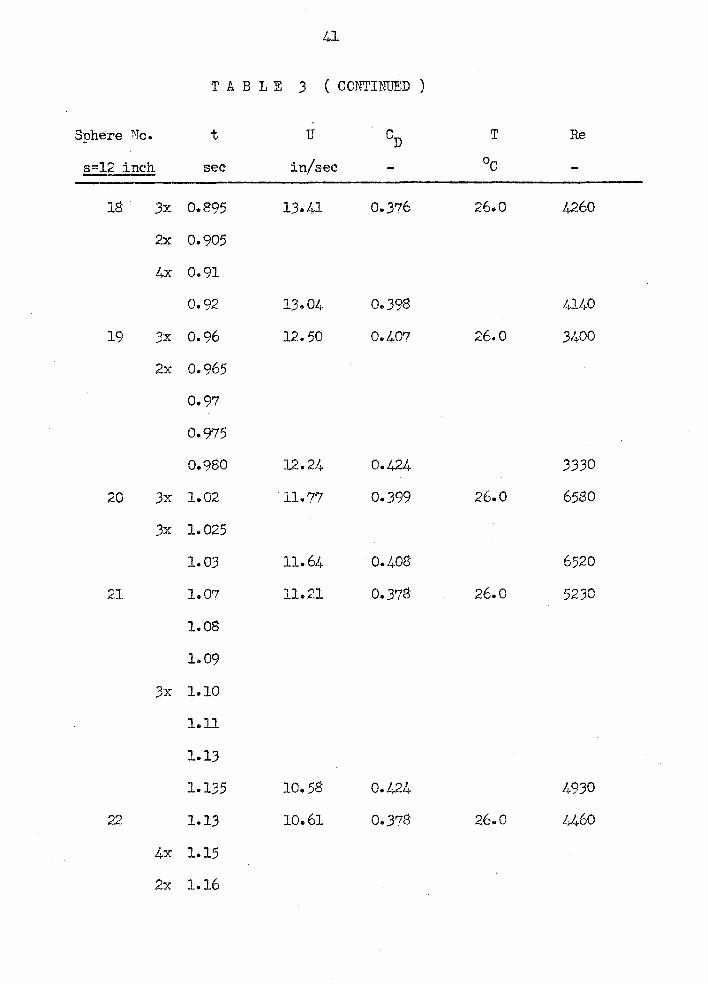
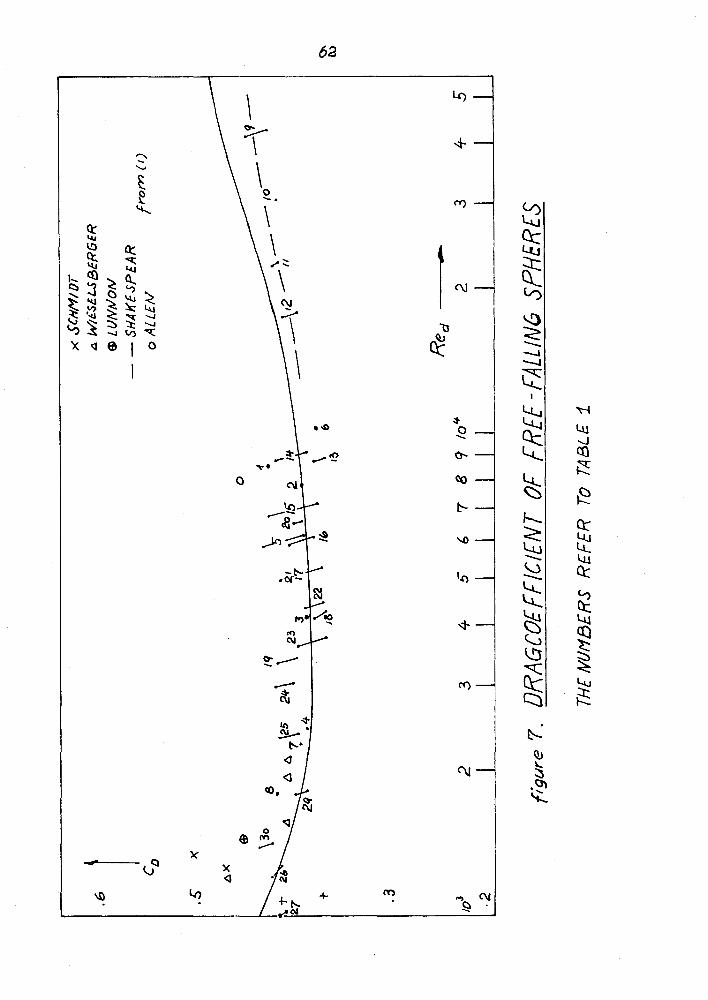
Using the described photoelectric timing device the drag
coefficients of several spheres of densities greater than that of water
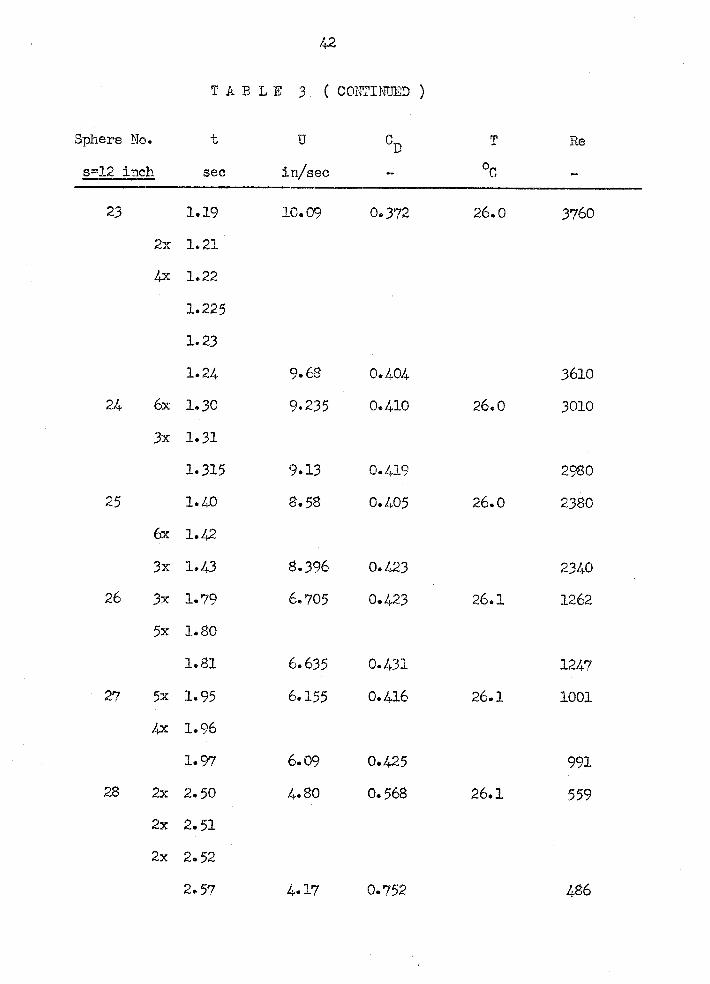
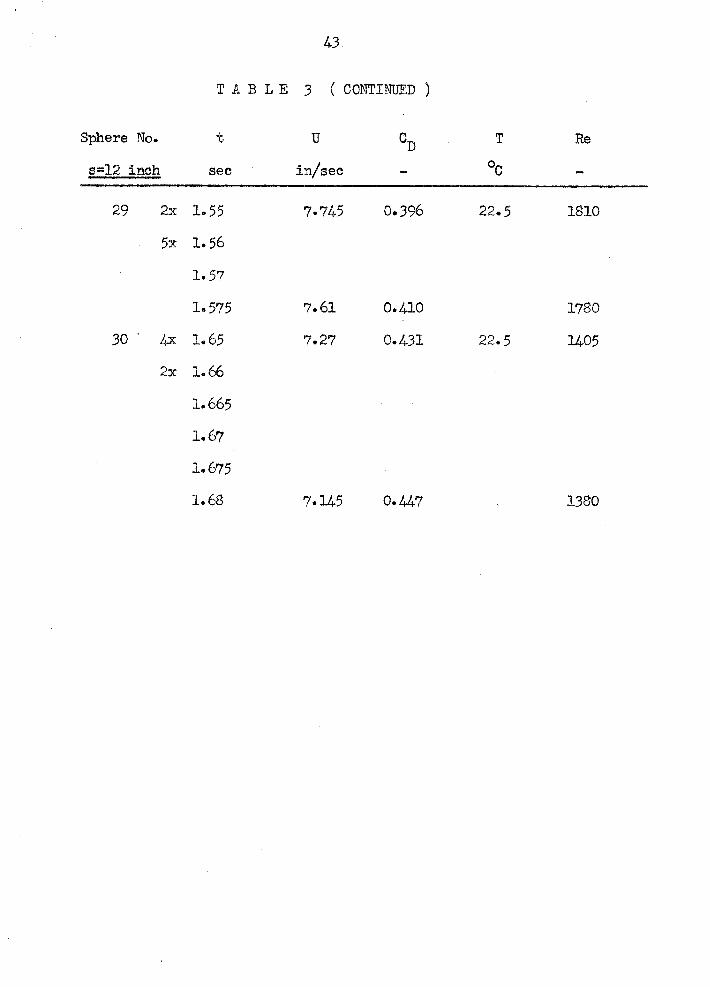
have been determined. The results a r e given in Table 3 and Figure 7.
The corresponding timing distance i s also given in Table 3.
3. 3 . Discussion of Results.
A,s can be seen from Figure '9 the drag coefficients for the
different spheres scatter up to 18 per cent around their mean
values, which agrees fairly well with the respective values of C DH'
This scatter has been observed by others, too, as shown in
Figure 7.
3.4. Conclusion.
Prom the results of these measurements i t was concluded
that the timing device works satisfactorily. Furthermore i t showed
that the drag coefficient for spheres with density ratios down to
pslpw = l. 1 i s given by the value of C DH'
Therefore, i f there occur any changes in sphere drag
coefficients they must do so only when the density of the spheres is
less than that of the medium, i. e. , for rising spheres.
18
4. DRAG MEASUREMENTS OF FREE-RISING SPHERES
4.1. General Remarks.
As before the drag coeaicient was obtained by evaluating the
sphere velocity from a distance- time measurement using the photo-
electric timing device. Again, i t was assumed that the sphere had
reached i ts steady state velocity when entering the timing distance.
This timing distance was varied in order to investigate i ts influence
on the measured velocity.
4. 2 . Spheres Rising in &>-inch Diameter Tube.
Here the sphere release was mounted at the bottom sf the
tube (B), and the spheres were introduced through the plastic
tube (C) (Fig. 1) . Otherwise the tests were run in the same way
as before.
4. 2 . 1. Results.
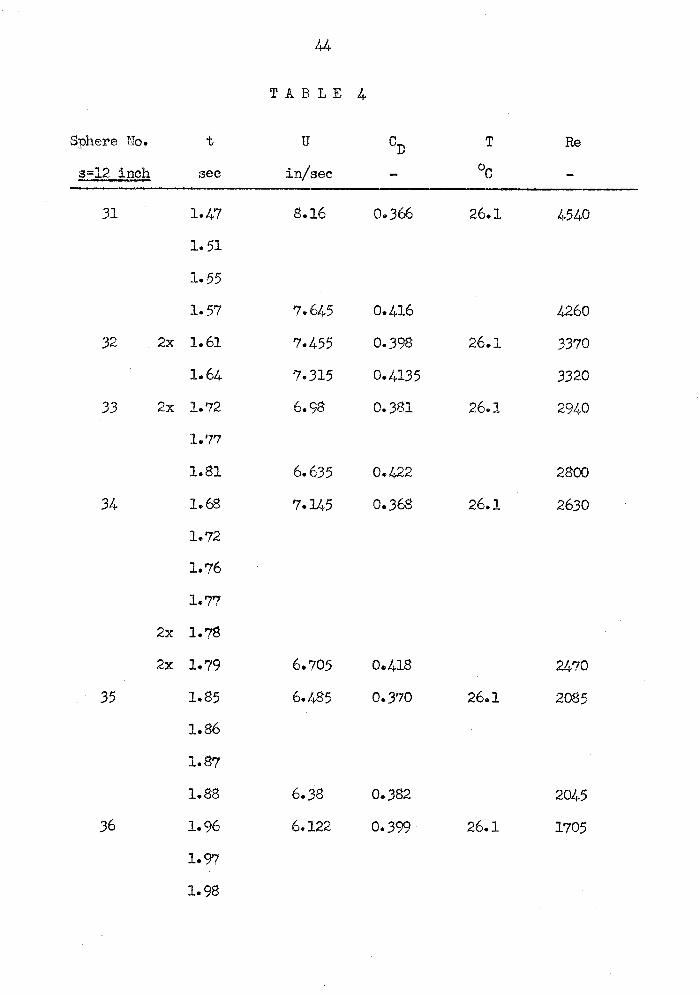
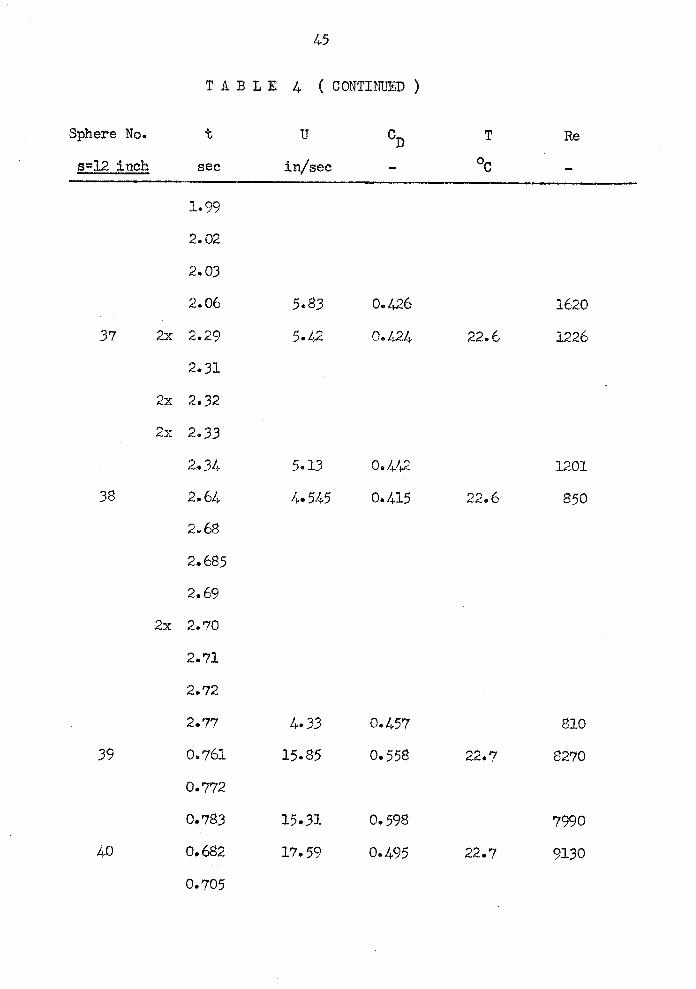
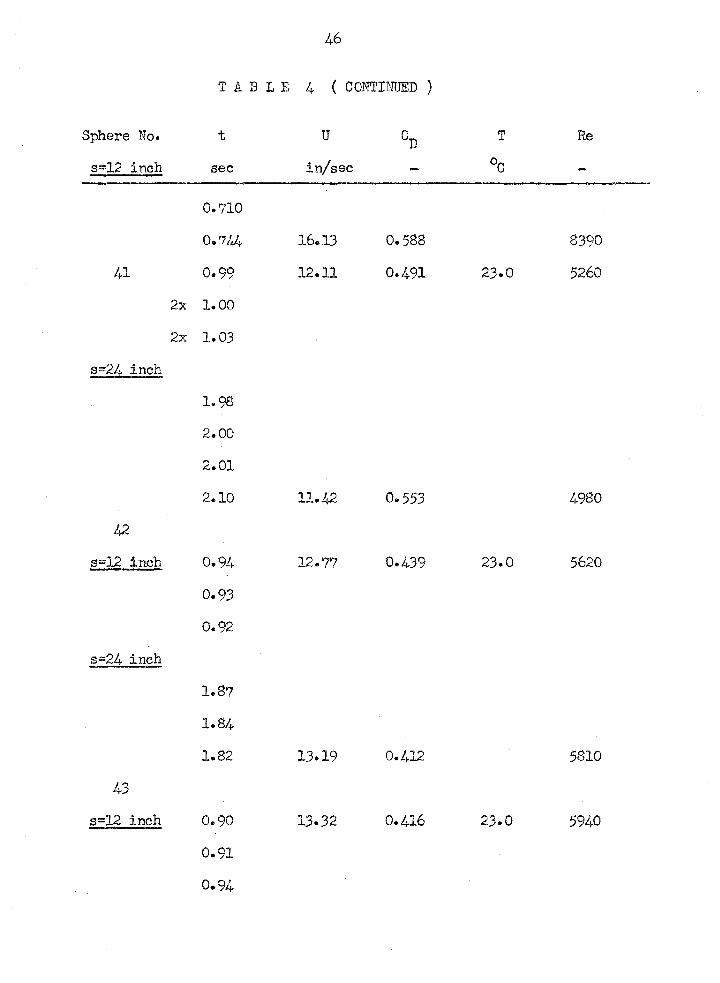
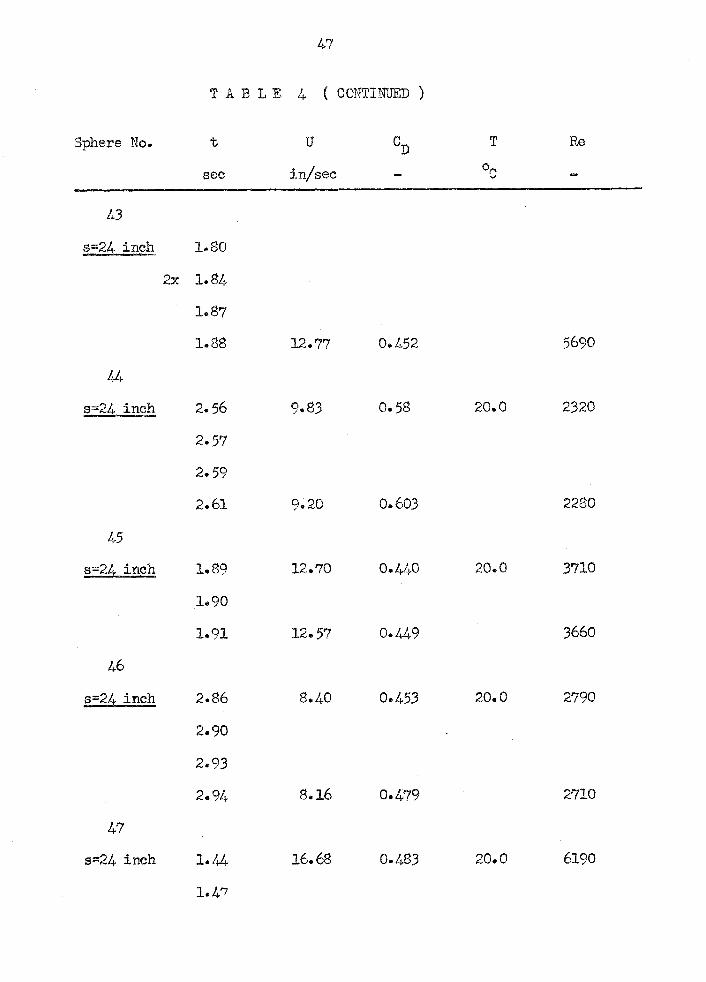
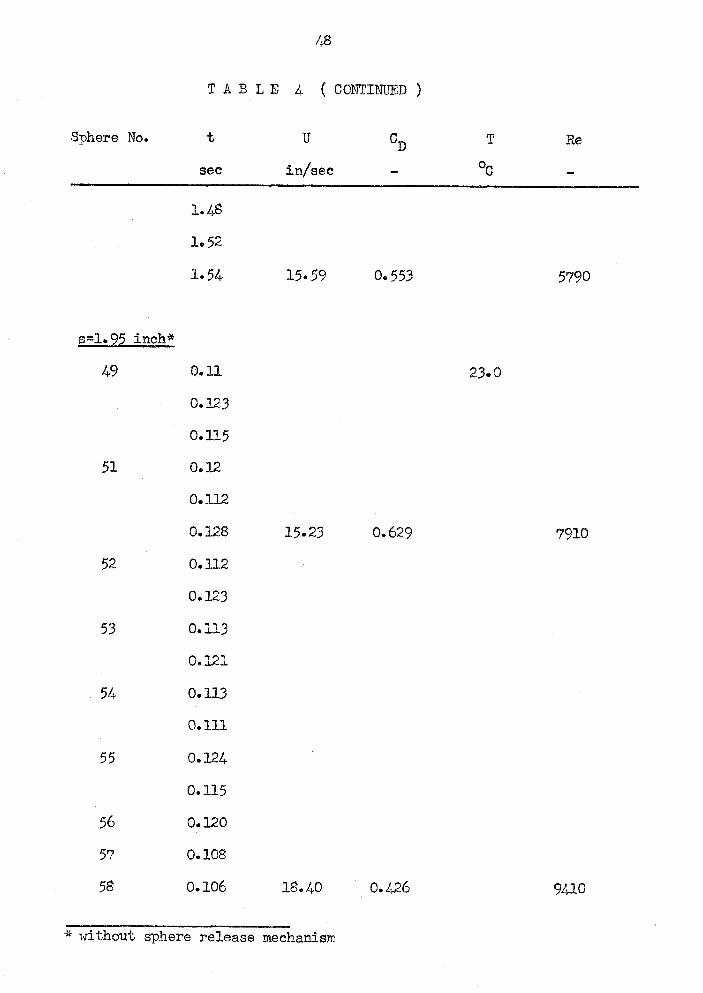
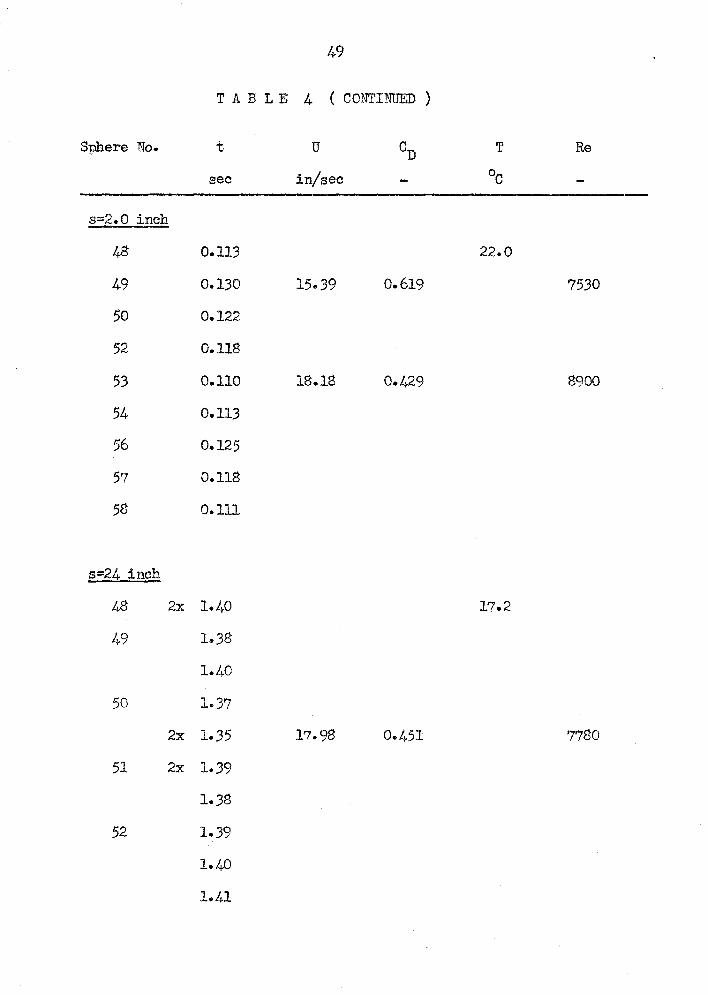
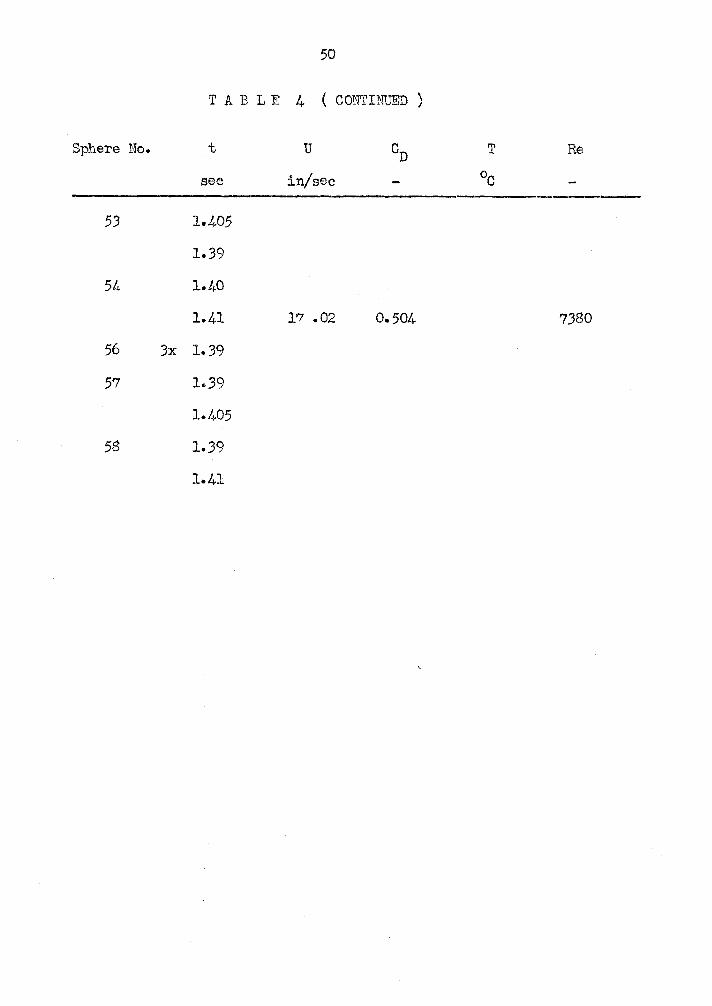
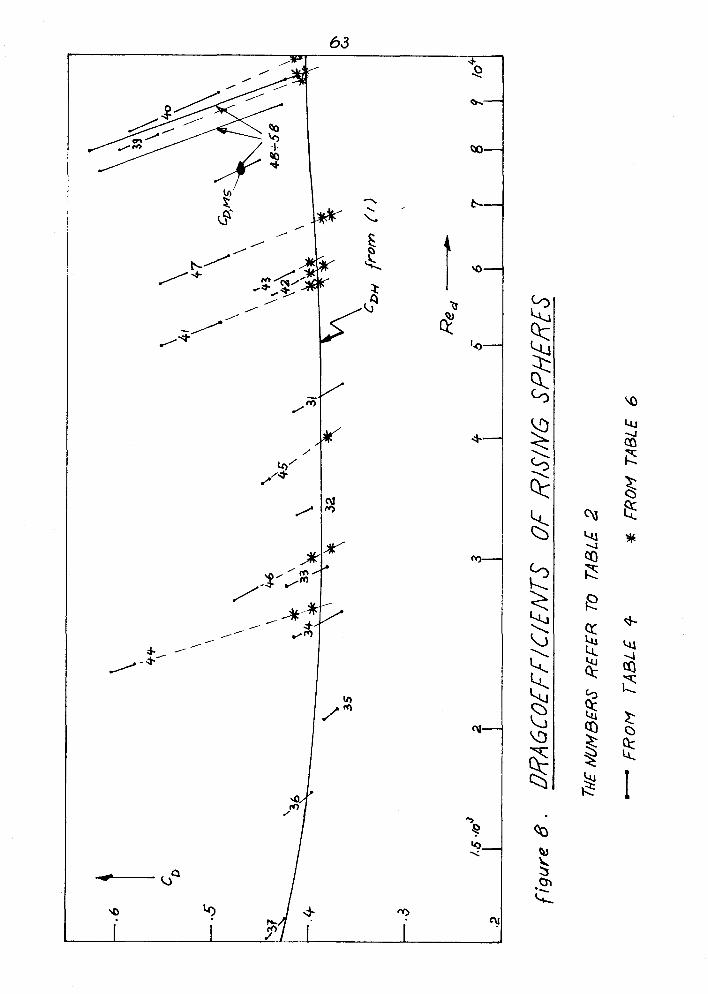
The results of these tests a r e given in Table 4 and Figure 8.
It was observed that the spheres rose in an oscillatory motion for
which amplitude and wavelength differed from sphere to sphere.
Several runs were made without using the sphere release, letting
the sphere r ise freely out of the plastic tube. No significant change
in the behavior of the spheres or in their drag coefficients could be
observed.
4. 2 . 2 . Discussion of Results.
The oscillatory motion of the rising spheres seems to be a
typical feature of the sphere motion. The wavy motion becomes
more significant as the density ratio p / p decreases. This wavy S W
motion seems to be independent of even large lateral disturbances
given initially to the sphere, as in the case where the spheres rose
freely through the plastic tube.
The displacement of the sphere out of its straight vertical
path can be attributed to a low mass to force ratio, where the
force results from non symmetric vortex shedding from the sphere.
For a falling sphere the mass to force ratio is greater *than that for
a rising sphere, so one would expect less significant or no oscillatory
motion of the heavy sphere. This was actually observed: the falling
spheres moved in a straight path. From the oscillatory sphere motion
i t can be concluded that the point at which the force acts oscillates
geometrically over the sphere. It was furthermore observed that
the sphere traveled f i rs t along a two-dimensional, wavy path which
later changed often into a more or less helical path. No evident
reason for this change of motion could be observed. Once in a
helical motion, the sphere would never go back into the two-dimensional
motion. It sometimes happened, however, that the change from two-
dimensional to helical motion did not occur a t all, and the sphere
traveled only along a sinusoidal path.
The drag coefficient for each sphere shows more or less
scatter in a random fashiop around a mean value which i s higher
than CDH. The drag coefficient of the spheres with density rat ios
s lpw rr 8.93 approach C independently of Reynolds number,
DH
with the simultaneous disappearance of the oscil latory motion.
The drag coefficients of the spheres with diameter
d = 0.725 inch and p s / p w - 0.59 were extensively examined. The
sca t te r of C i s particularly high for s s 2 inch, but i s much l e s s n for s ;i 24 inch. Fur thermore , the lowest values of CD approach
'DH* This suggests that the "local drag coefficientti of the sphere
might not be significantly diffekemt from the correspondent value of
'DH which would have been measured for a falling sphere with
same diameter a t the same Reynolds number.
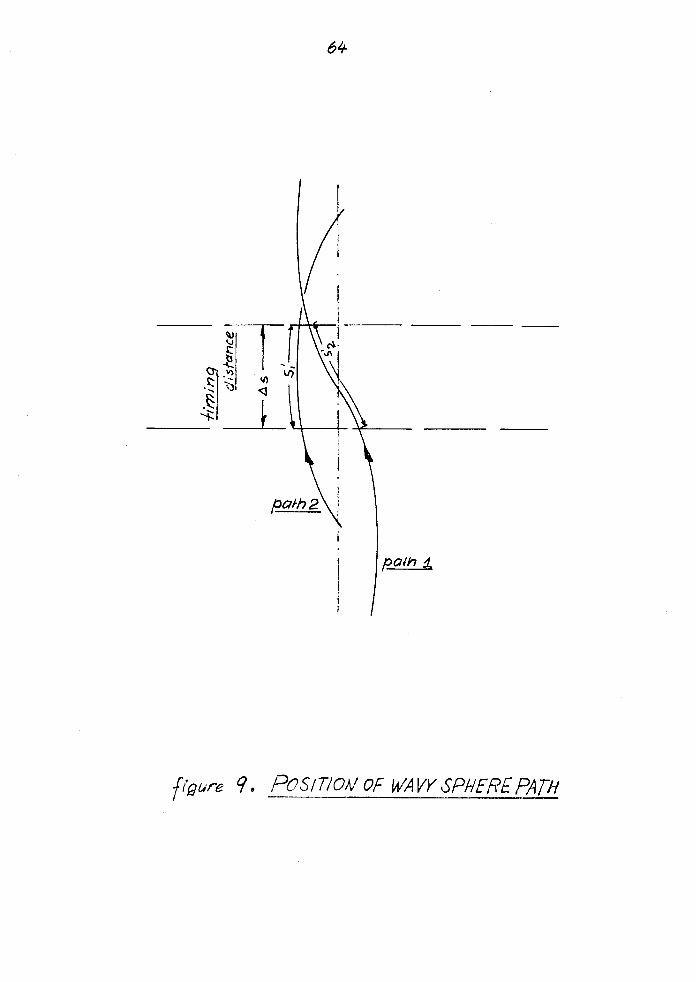
Hence, i t was assumed that the "apparent drag coefficient"
which was actually measured by our method, is the local drag
coefficient multiplied by a factor which depends mainly on the location
of the wavy sphere path with respec t to the timing distance (Fig. 91,
and that the local d rag coefficient would have been obtained with the
sphere velocity U = ds /d t .
Considering a sinusoidal sphere path, the rat io of
/ C is e q u a l to 1/cos3 a (Appendix A) . The ' ~ , r n a x D, m i n m a x
calculation was based upon the assumption of a steady s tate motion
along the sinusoidal path. If we take CD, min a s the value of C DH
and 'D, m a x a s the maximura.1 apparent drag coefficient measured ,
we find the maximum angle between vert ical and sphere path i s about
30'. This is a value which seemed not to be too high compared with
the observed motion. Fur thermore , a calculated mean square average
CD based on this a showed good agreement with the average value m a x
of 5 obtained for s r 24 inch.
4. 2 . 3. Conclusion.
In order to t e s t our assumption, that the local drag coefficient
of f ree- r i s ing spheres i n the considered density range is independent
of the wavy motion of the sphere and i s equal to CM, i t was decided
to repeat the tes t s in the la rge water tank of the Hydrodynamics
Laboratory. The tank was l a rge enough s o that the spheres could
r i s e without any wall effects, excluding thus a possible influence of
the wall on the motion of the sphere.
4 . 3 . Spheres Rising in Large Water Tank.
The experiments were performed in the water tank of the
Hydrodynamics Laboratory. The sphere release mechanism was
mounted on a platform and, with the spheres enclosed, lowered to
the bottom of the tank, from which the spheres were released one
a t a time. The temperature of the water was measured a s before
by a -10 to +PO0 degree Celsius thermometer.
4.3.1. General Remarks.
The drag coefficients of the spheres with density ratios less
than one were evaluated by measuring the local velocity of the spheres
with the aid of a Voightlgnder Bessarnatic camera, of which the used
shutter time was measured. The shutter time measurements were
made by using the photoelectric timing device (Fig. 41, with a light
beam which was f i rs t sent through the camera. The measured
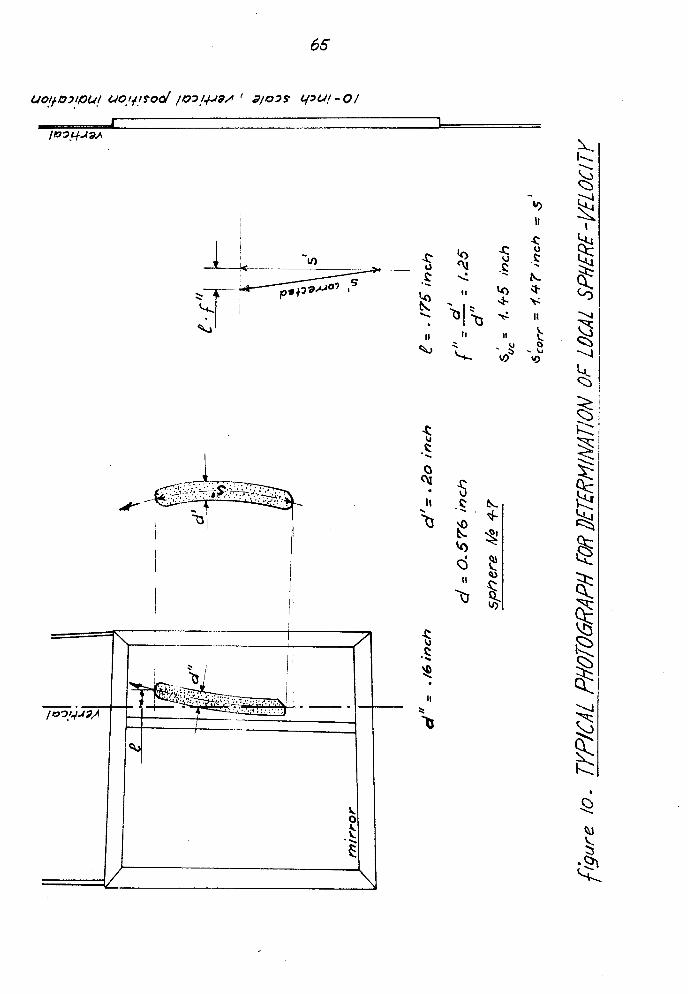
shutter time was 0.190 t 0.002 sec. - The spheres were photographed when passing a certain point
in the water through a +ndow situated at the side of the tank below
the water surface, leaving thus a streak on the film corresponding
to the traveled distance during the shutter opening. A mi r ro r was
0 placed in the water a t an angle of 45 with respect to the camera-
sphere plane in order to obtain the three-dimensional path of the
sphere.
Other pictures were taken photographing a large part of the
sphere path. Motion pictures showing the lateral disp%acement of
the spheres with respect to the vertical axis during i ts r ise were
also taken.
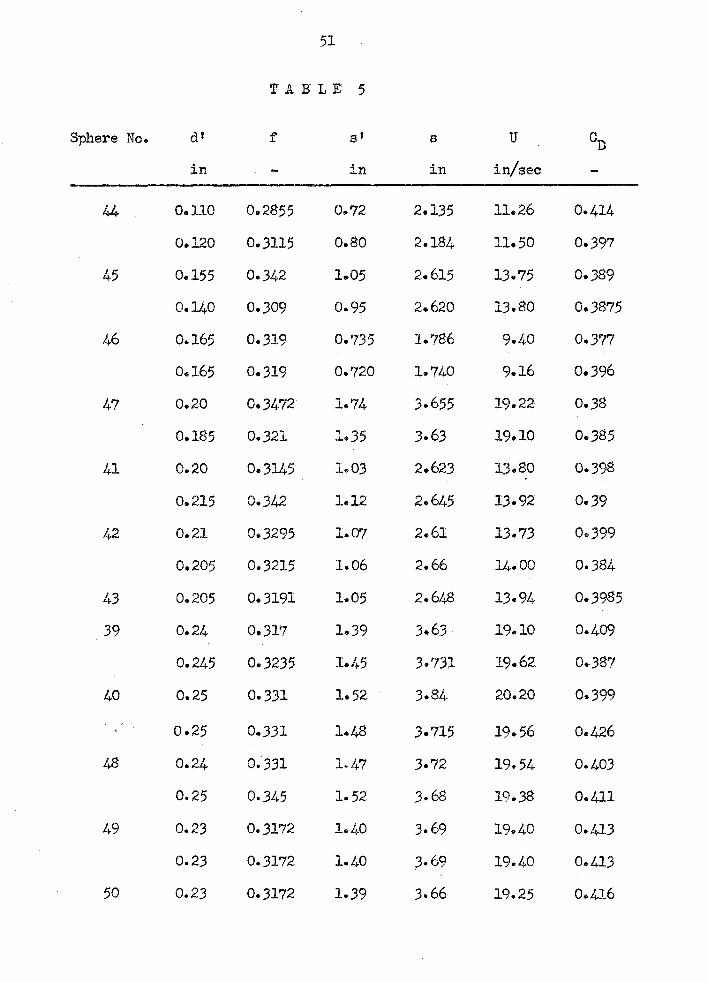
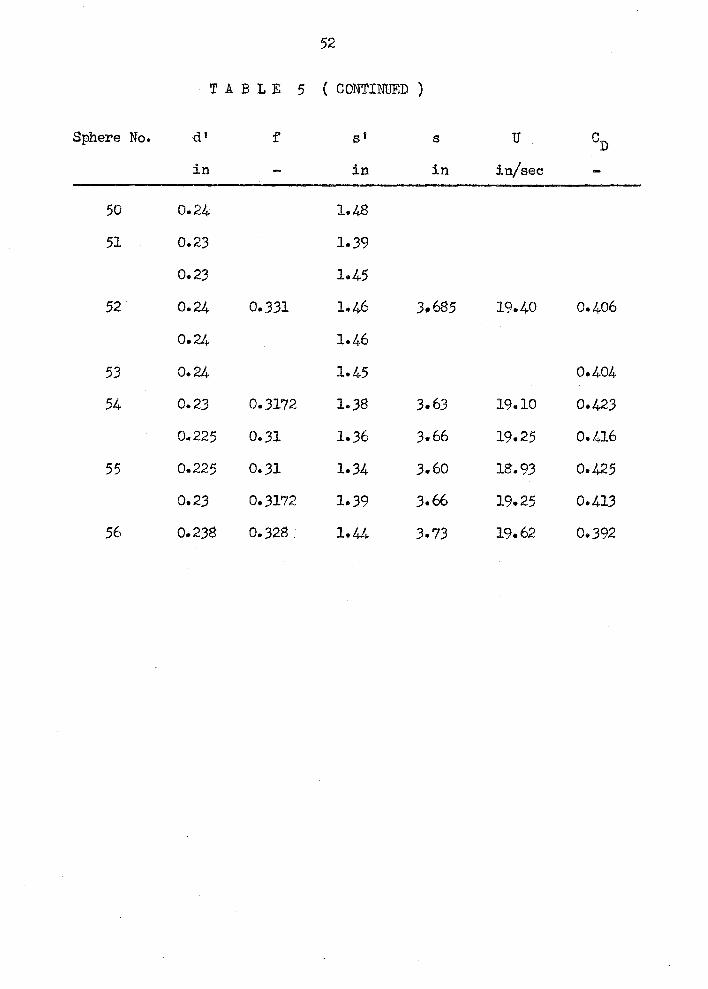
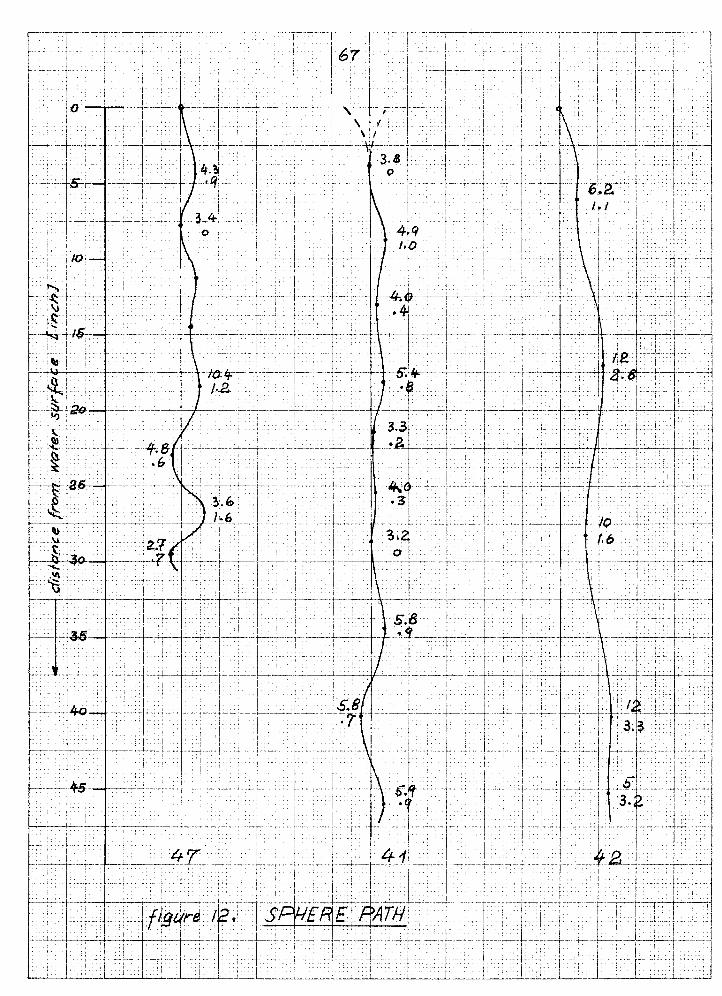
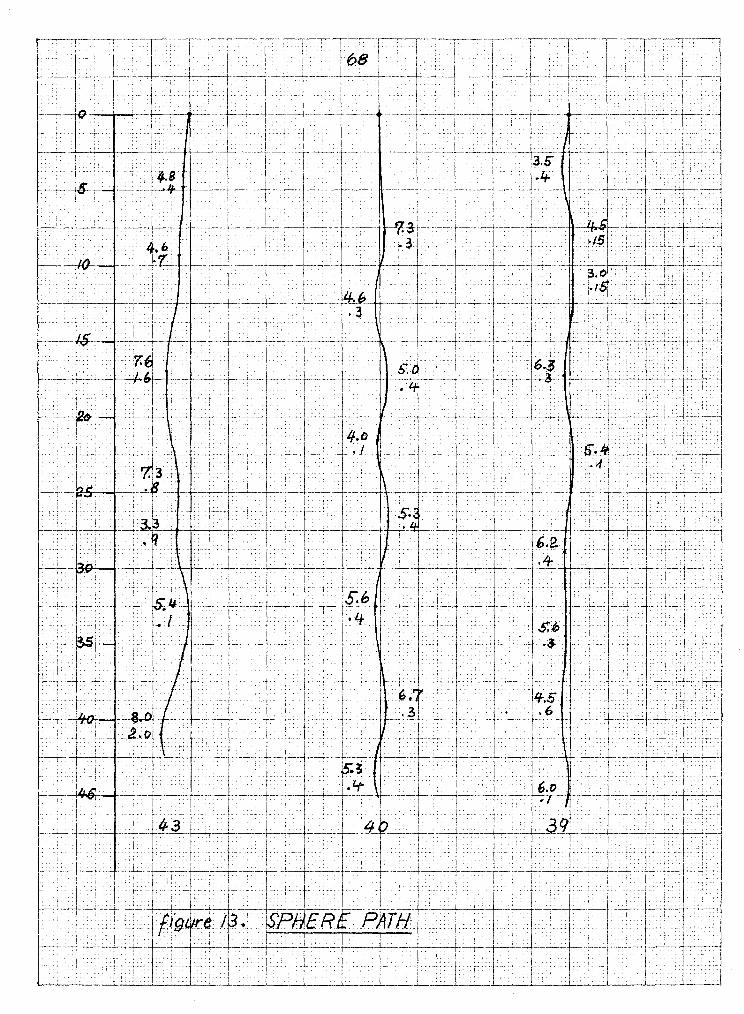
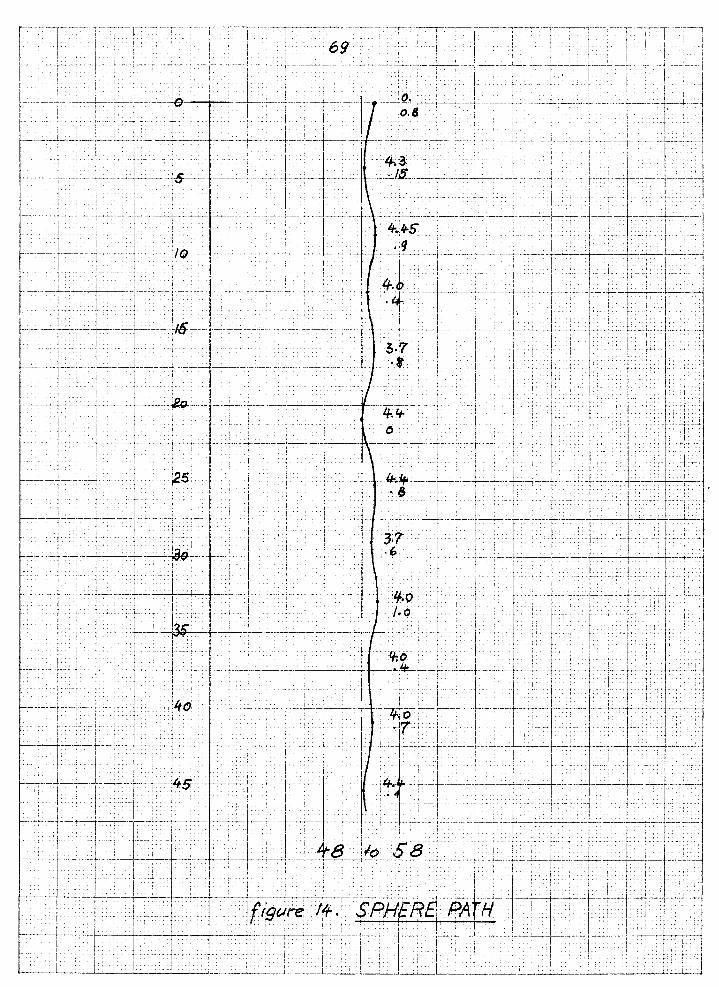
4. 3 . 2. Results.
Figure 10 shows the reproduction of one of the pictures
(sphere No. 47) from which the local sphere velocities were determined
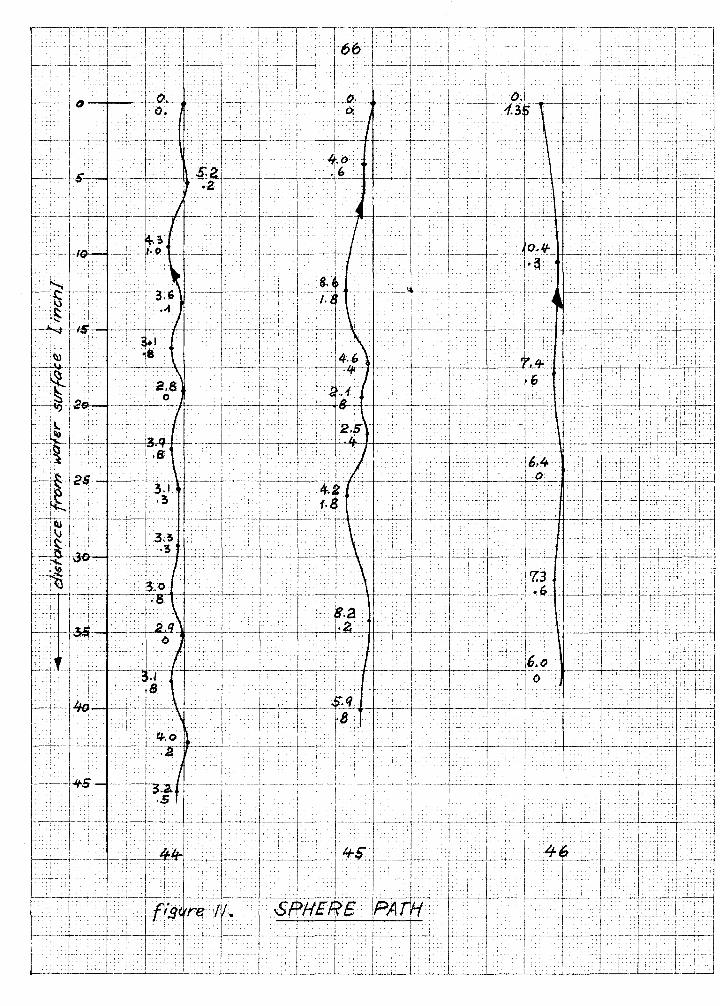
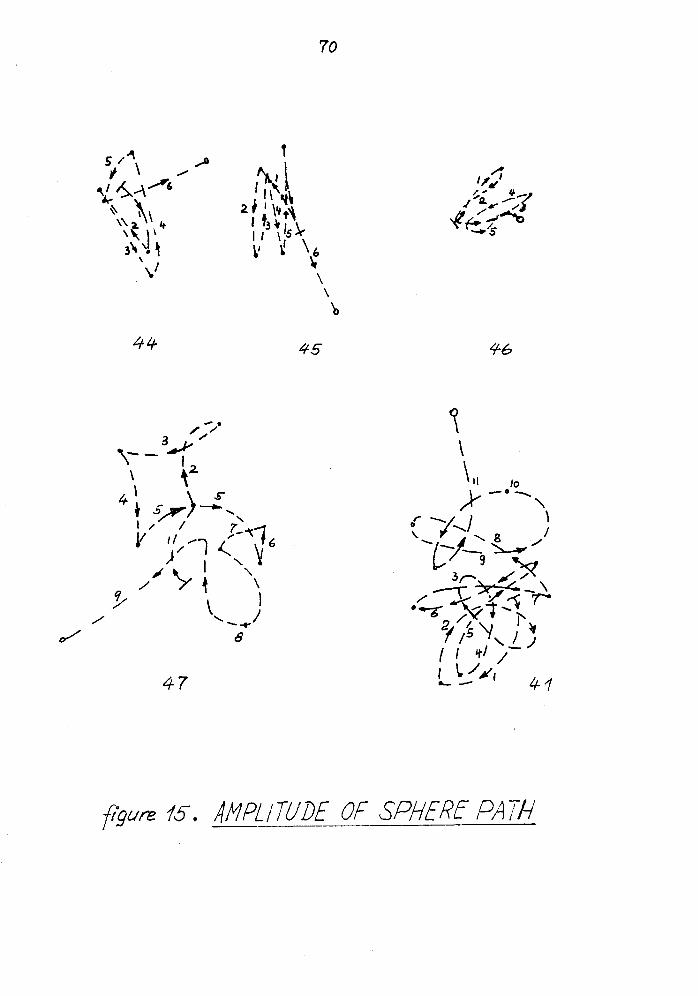
which a r e given in Table 5. Figures 11 to 14 give repro&aLnctions of
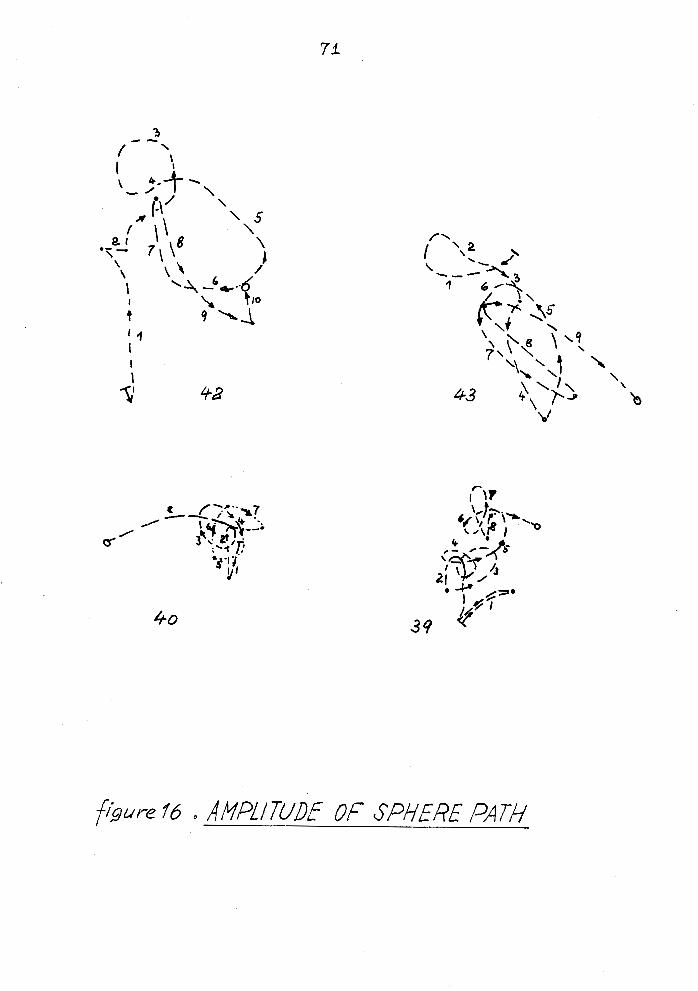
the photographs of the different sphere paths, Figures 15 and 16
reproductions of the lateral displacements of the spheres.
Table 5 gives also the drag coefficients obtained during these
tests; these a r e plotted on Figure 8.
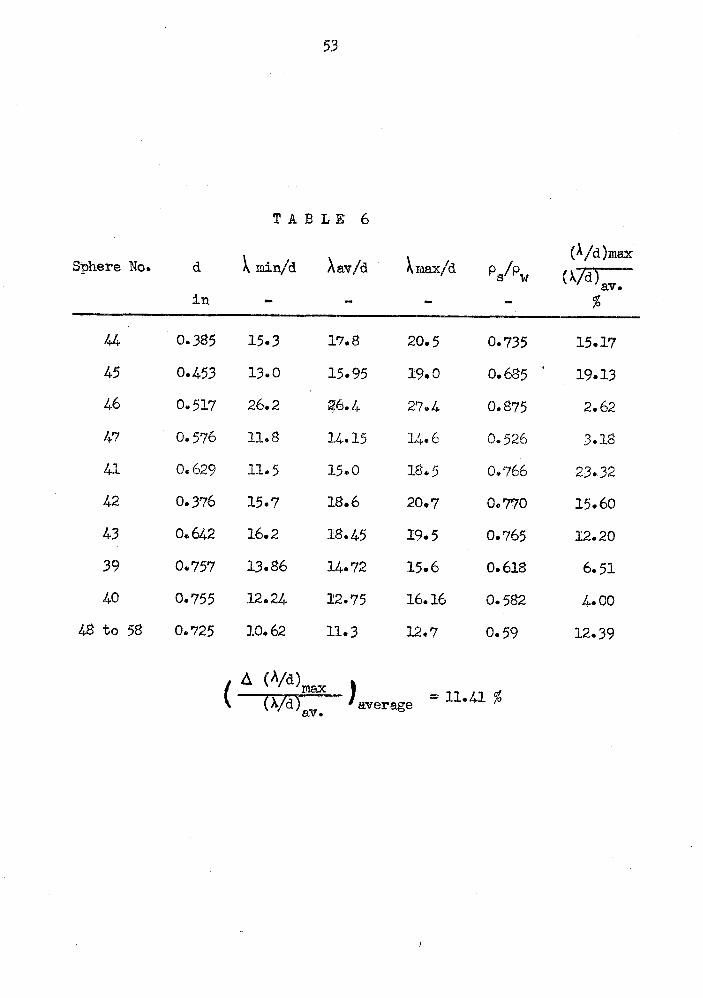
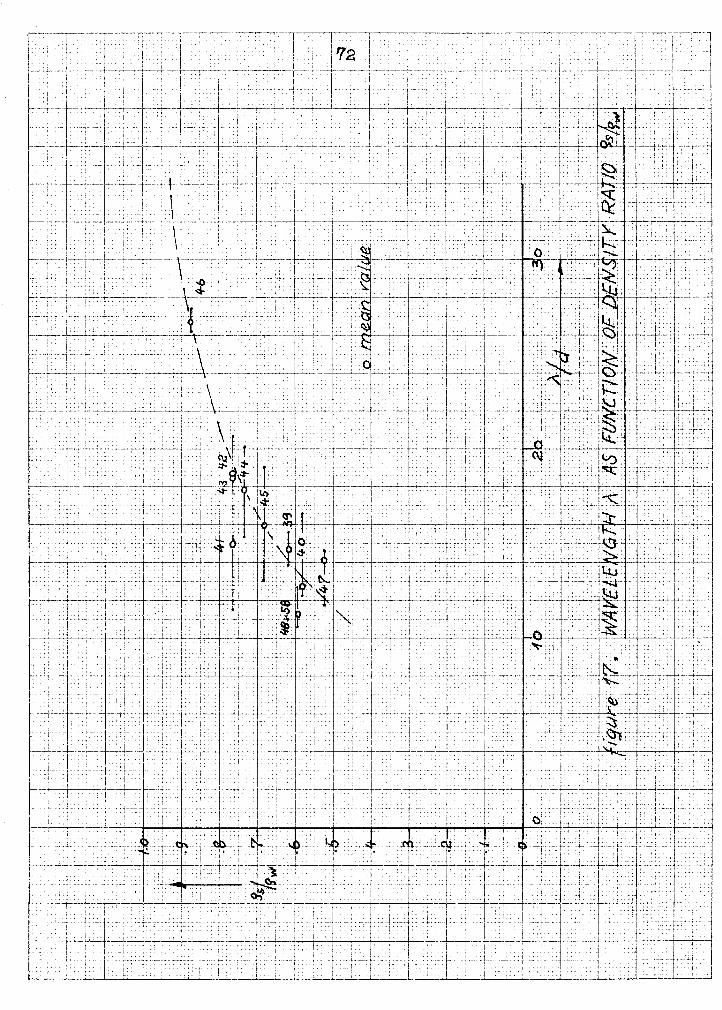
Table 6 gives the minimum, maximum and average wavelength
of the motion of the different spheres; these a r e non dimensionalized
with the sphere diameter and plotted in Figure 17 versus the density
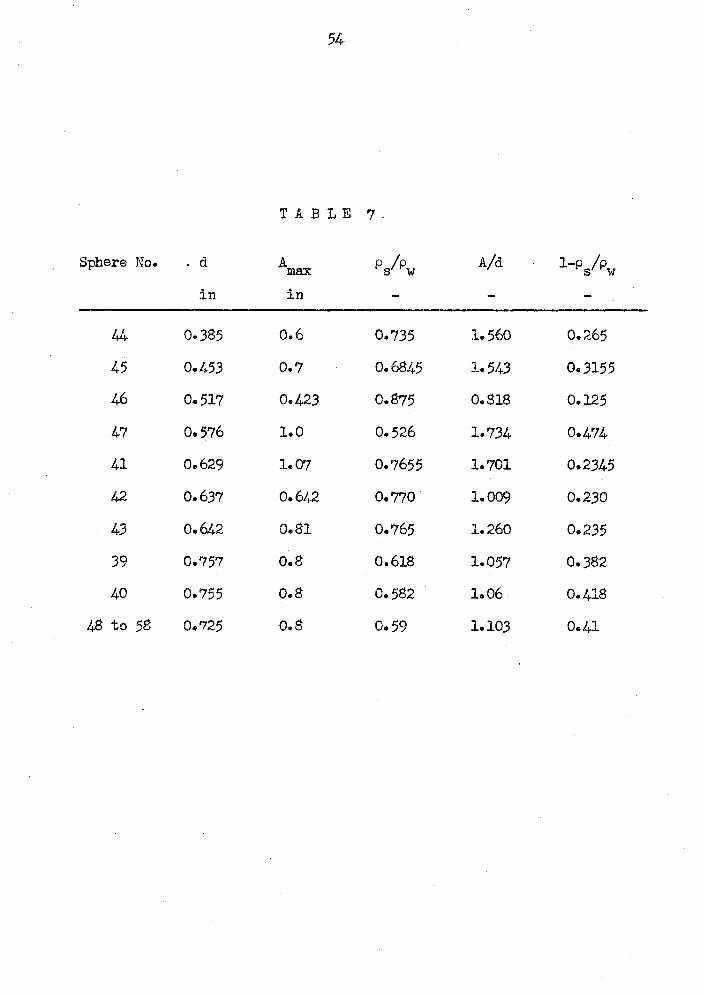
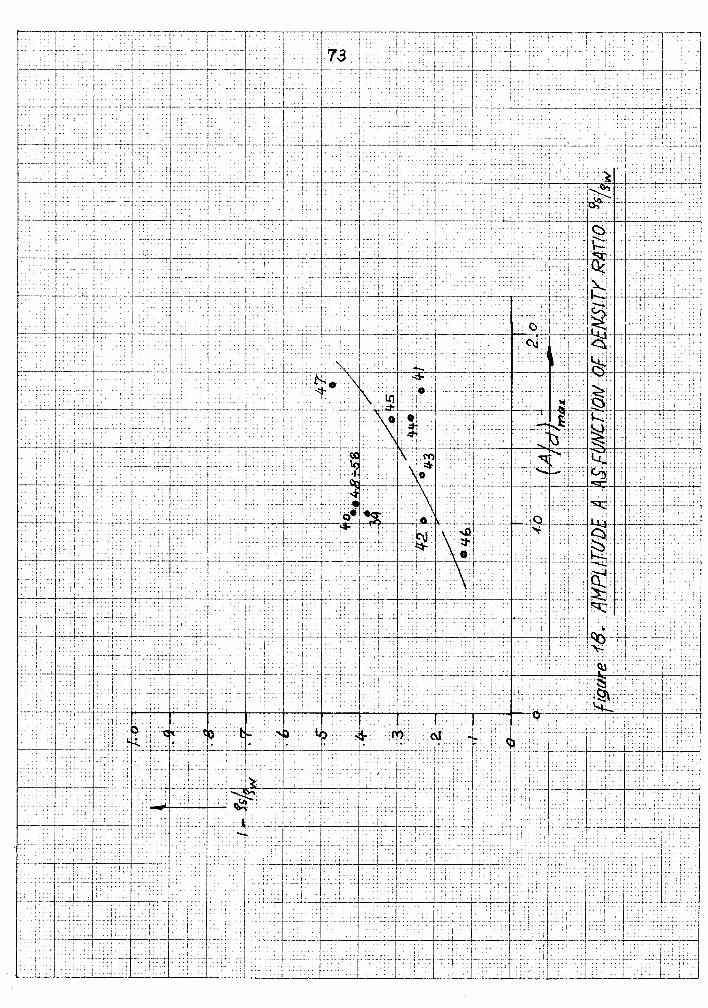
ratio. In Table 7 the maximum lateral amplitudes of the sphere path
a re given and plotted in Figure 18; they a re determined either from
the sphere path pictures of the Figures 11 to 14 or from the Figures
15 and 16.
4. 3 . 3 . Discussion of Results.
The experiments carried out in the water tank show that the
local drag coefficients of the rising spheres, for the densities
considered, a r e indeed those given by the values of CDE, within the
usual scatter observed for sphere drag coefficients. This i s true
indepedently of the oscillatory motion with which the sphere r ises.
A distinct wavelength of the sphere motion i s observed, which
i s constant along the sphePe path within an average maximum scatter
of 11.41 per cent of all spheres (Table 6 ) . The two-dimensionality
of the photographs has here no effect on the measurement.
The evaluation of the lateral amplitudes of the sphere motion
has been carried out, but i t could not be done very accurately because
of either the two-dimensionality of the Figures 11 to 14 or of the
changing scale of the Figures 15 and 14; this may account for the
large scatter of data in Figure 18. The sphere sometimes experiences
sudden displacements Prom its general axis of motion, for which no
obvious reason could be observed.
It was again observed that the sphere traveled f i rs t in a
two-dimensional motion which went over later into a helical motion.
This was especially well seen for sphere No. 39 (Fig. 16). It was
however noticed that the sphere did not remain during all i ts r i se
in this two-dimensional motion, as it sometimes did in the experiments
in the 6 -inch diameter tube.
The oscillatory motion of the spheres died out when the density
ratio approached one and their drag coefficients became CDH
independently of the timing distance. This was observed to be true
independently of Reynolds number, too (Fig. 8 , spheres No. 31 and 38),
which indicates that there i s no critical Reynolds number for the onset
of significant oscillations of the rigid spheres.
A s i t has been observed by Winny (Ref. 5) there exists a typical
vortex shedding from a sphere in the Reynolds number range considered.
He observed furthermore that the average vortex frequency on the
surface of the sphere is not the same as in the wake but i s about four
times higher. Due to this vortex motion, superimposed on the straight
fluid motion, the fluid will exert additional fluctuating pressure sn the
sphere which will influence the sphere path if the inertia of the sphere
i s not too high.
Therefore the motion of the sphere will be determined primarily
by the sphere mass and the sphere will respond significantly only to the
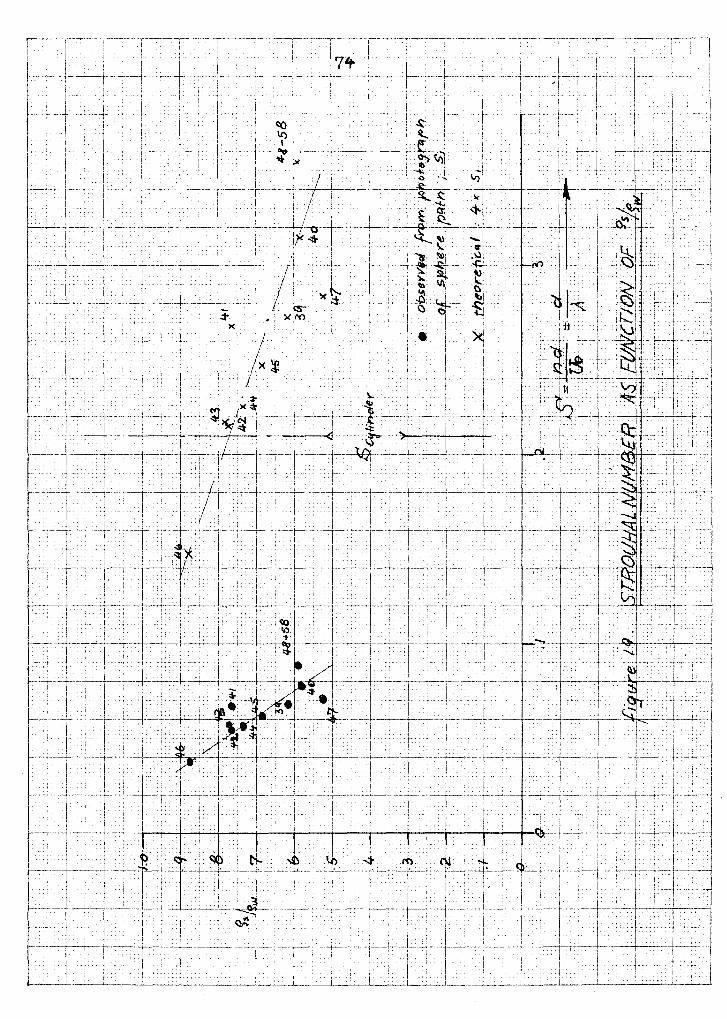
lowest frequencies with the highest energy. A s Fung (Ref. 6 ) has shown
the maximum of the power spectrum occurs a t a StrouhaE number
S = : - which i s quite low and almost constant a t S ii 0.05 for Reynolds uo 4 6
numbers from 0 . 3 3 x 10 to 1 .27 x 10 . Assuming this to be true for
lower Reynolds numbers, too, this would explain the low Strouhal
numbers obtained from the photographs, given in Figure 19, in
comparison with those observed for cylinders in the same Reynolds
number range, cf. A. Roshko (Ref. 71, who gives S = 0 . 2 1 .
As i t i s quite difficult to obtain much detailed information
about the fluctuating pressure distribution over the sphere during i ts
r ise an attempt has been made to obtain an expression for the time
varying pressure force (i. e . , the pressure integral over the sphere)
by considering the force balance on the sphere under some simplifying
assumptions . In Appendix B the necessary pressure integral which must
balance the buoyant force and the inertia force has been calculated
under the following as sumptions:
1 . The drag of the sphere is equal to the buoyant force times
the cosine of the sphere path angle with the vertical,
2. the sphere path i s sinusoidal and two-dimensional,
3. the velocity i s constant in vertical direction.
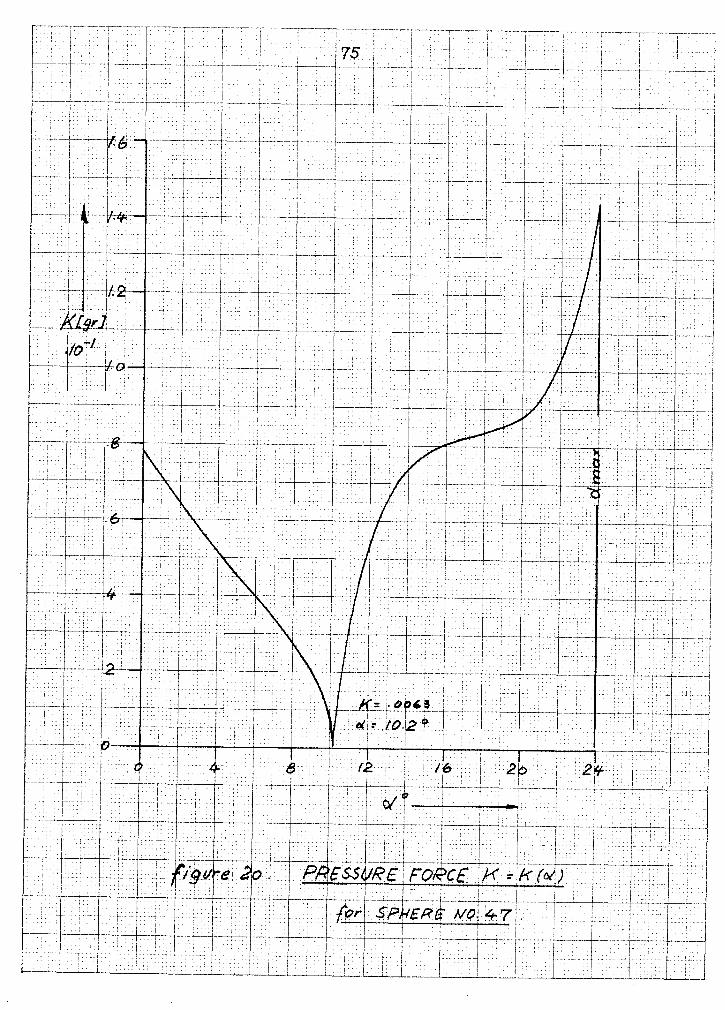
The calculations give a time dependent lateral force K which i s
given in Figure 20 as a function of a or time. For sphere No. 47, for
which an example has been calculated through, the maximum force is
%ax = 1.44 gr , wt. This corresponds to a maximum force coefficient
'max = a. 16, which corresponds to a force coefficient for a
circular cylinder of C max, cyl. = 0. 786. This i s of the same order
of magnitude as H. Drescher (Ref. 8) has actually measured for
5 circular cylinders in water a t Re =: l. 13 x 10 , as he obtains
oscillating force coefficients between 0 . 6 and 1.3.
Hence, although the approwimation is quite crude, i t gives
reasonable results for the maximum force coefficient of the sphere in
connection with the observed data for the sphere path.
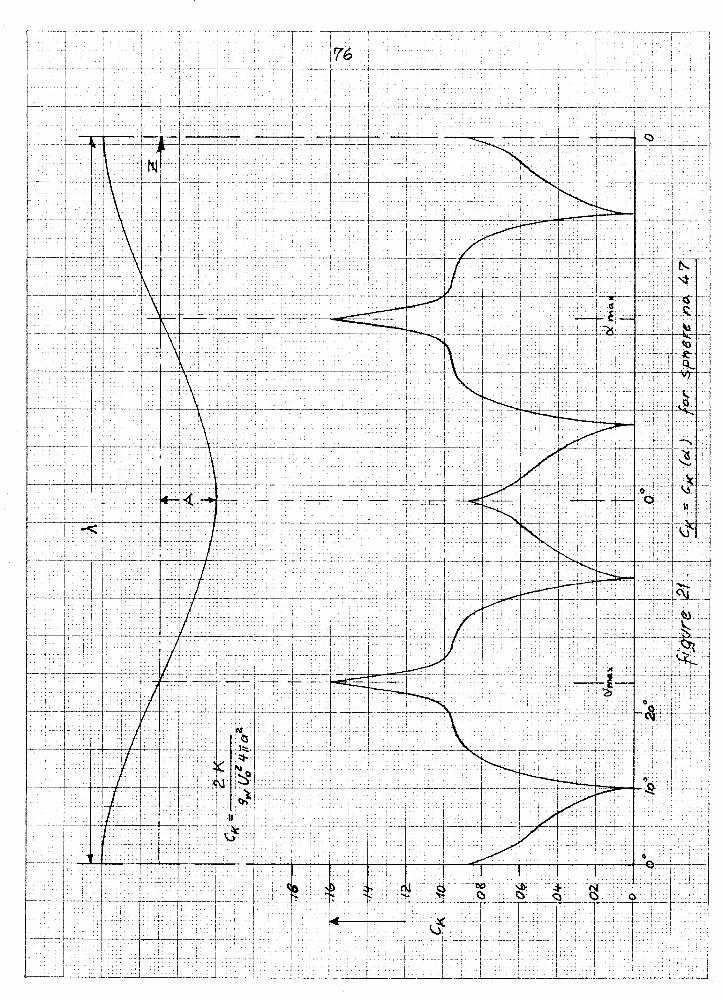
In Figure 23. the force coefficient i s given over one wavelength
of the sphere path. Due to the interaction of buoyant force and inertia
force a whole frequency spectrum for the resultant pressure force i s
created in which mainly the frequencies 2f and 4f appear, where f
is the frequency of the sphere motion. A s the amplitudes of the 48-
force a r e much higher than any other, the theoretical force coefficient
would therefore give a four times higher Strouhal number, which
would correspond to the observations Winny (Ref. 5) has made. Hence,
based on the calculations of the necessary force coefficient, a theoretical
Strouhal number i s found with a value between 0.1496 and 0.354
depending on the density ratio p / p . S W
The Pact that the Strouhal number seems to be a function of
P,/P, i s due to the method of determining the Strouhal number, i. e. ,
by evaluating S from the response of the sphere to a certain oscillatory
force. As the ratio decreases the sphere will respond more to
higher frequencies and therefore the Strauhal number, formed with
the observed data will. increase. For fixed bodies, on which the
reference Strouhal number measurements have been, performed, there
is , of course, no influence due to a change in density of the body.
' 4 . 4 Summary.
The drag coefficients of rigid, freely rising spheres in water
3 with densities in the range 0.526 < p < 0 . 9 3 gr/cm were found to be s
the same as those for rigid, free-falling spheres of densities larger
than one gr /cm3 with the same diameter, a t the same Reynolds number.
The drag coefficients were found to be independent of the
oscillatory sphere motion which dies out when the density ratio s / p w
approaches one. This oscillatory motion was practically non-existent
for = 0.93 independently of the Reynolds number, so that a
critical Reynolds number for the oscillations of the sphere path could
not be found.
"Apparent drag coefficients" were obtained when the drag
coefficient of the sphere was tried to be determined by a distance
- per time measurement of the sphere velocity. This apparent drag
coefficient was found to be a function only of the geometry of the
sphere path along which the sphere traveled.
The oscillatory motion of the sphere was f i rs t a two-dimensional
motion, then changed sometimes into a helical one, for which no
reason could be observed. .
For both the two-dimensional and the helical motion a distinct
wavelength could be found which remains constant along the sphere path
within a certain amount of scatter. The amplitudes of the sphere
motion a re given only approximately.
From photographic pictures of the sphere path Strouhal numbers
24
I . have been found which depend on the sphere densities and a r e about
three times smaller than those obtained for oscillating flow over
circular cylinders.
Under certain simplifying assumptions the necessary
pressure force for a force balance on the sphere has been calculated.
This gives a maximum force coefficient of the same order of magnitude
as observed for fluctuating force coefficients on circular cylinders.
The theoretical pressure force fluctuates with a main
frequency which i s four times larger than the sphere path frequency
giving r ise thus to a theoretical Strouhal number range around the
value measured for circular cylinders.
References
1. Handbuch d e r Experimentalphysik, Band 4, 2. Te i l (1932).
2. Th. Hes selberg und B. J. Birkeland: Steiggeschwindigkeit d e r Pilotballone, Bei t r . z. Phys. d. f reien Atrnosph., 4, 196 (1912).
3. 0, W. Eshbach: Handbook of Engineering Fundamentals , Vo1. 1 (1936).
4. R. G. Lunnon: Fluid Resistance to Moving Spheres , Psoe . Roy. Soc. London (A) 118, 680 (1928).
5. M. F. Winny: Vortex System Behind a Sphere Moving Through Viscous Fluid, A.R.C. Reports and Memoranda No. 1531, T, 3305 (1932).
6. Y . C . F u g : Flue tuating Lift and Drag Acting on a Cylinder i n a Flow a t Supercr i t ical Reynolds Numbers. IAS-Paper No. 60-6 (1960).
7. A . Roshko: On the Development of Turbulent Wakes from Vortex Streets , Thesis , California Institute of Technology, (1952).
8. H. Drescher: Messung d e r auf querangestrtlmte Zylinder ausgecibten zeitlich verklnderlichen Driicke, Z . f. Flugwis s. 4, Heft 112, pp. 17-21 (1956).
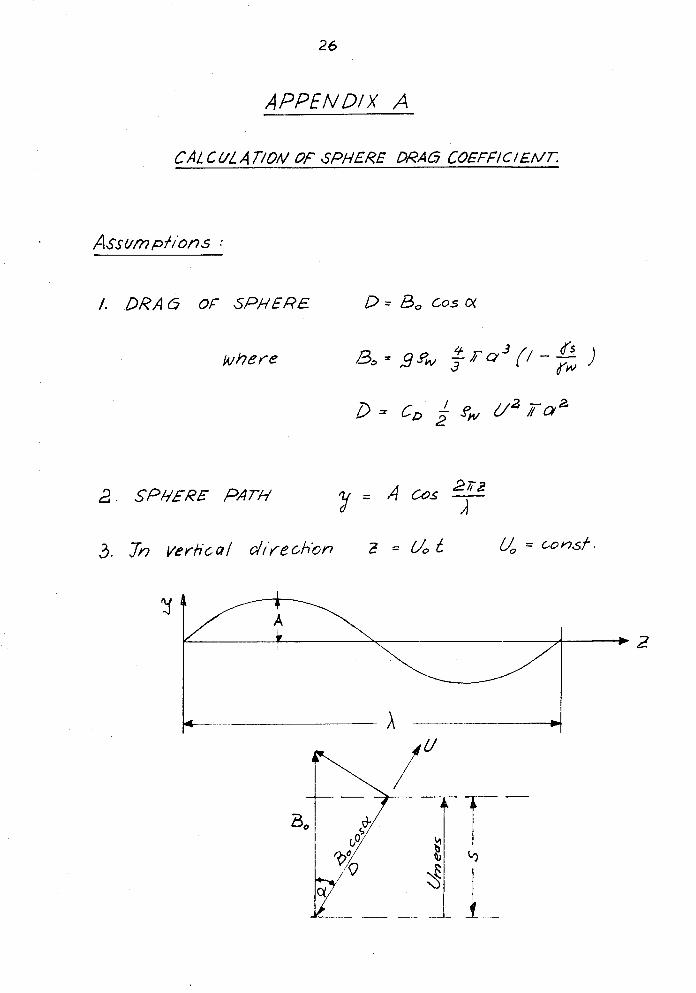
APPENDIX A
CAL CUL A T/QM G!! SPHERE DRAG COEFFICIENT.
Assum p f ions :
1. DRAG of SPHERE
k/he/e
2 . SPHERE PATH
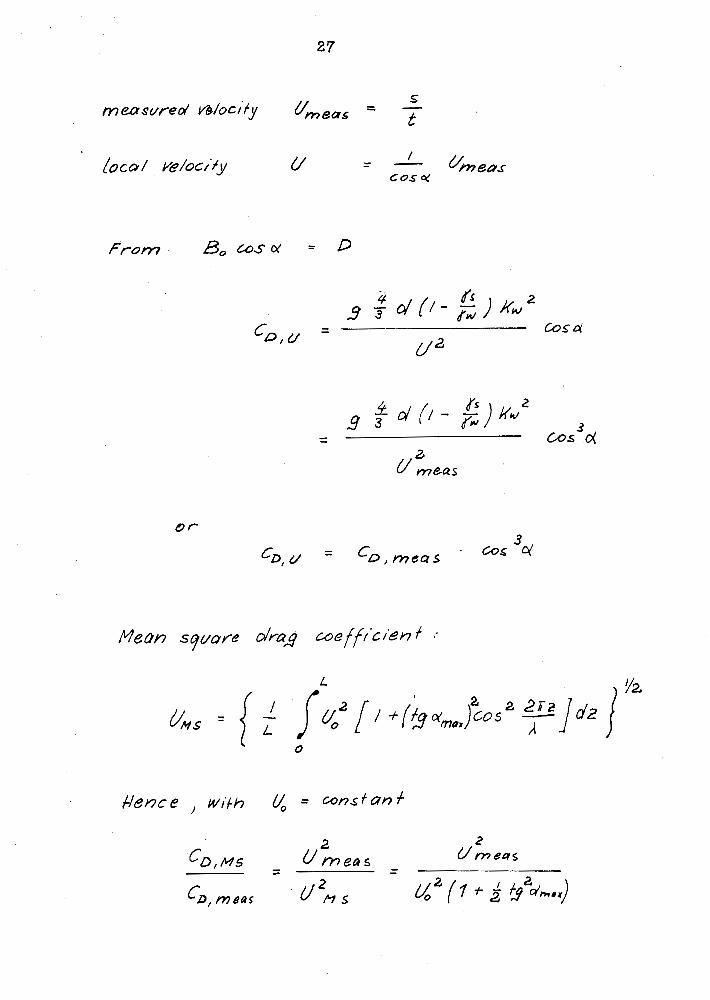
Hence , wiCh = C O ~ S f an f
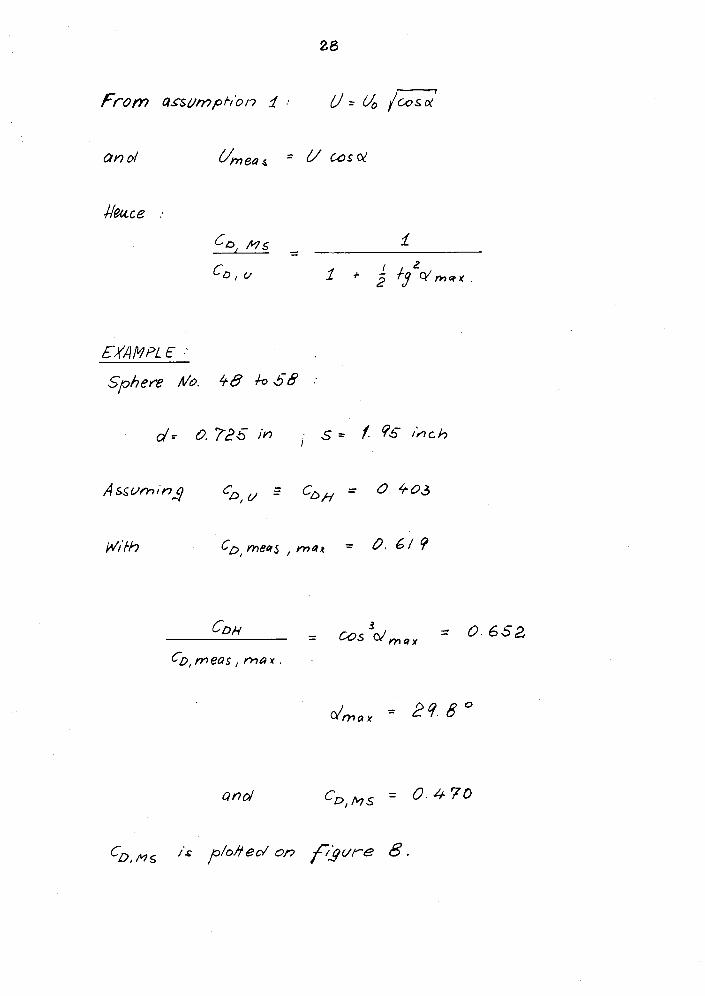
EXAMUL E
Sphere No 4 6 4-058 ..
and C , = 0 470
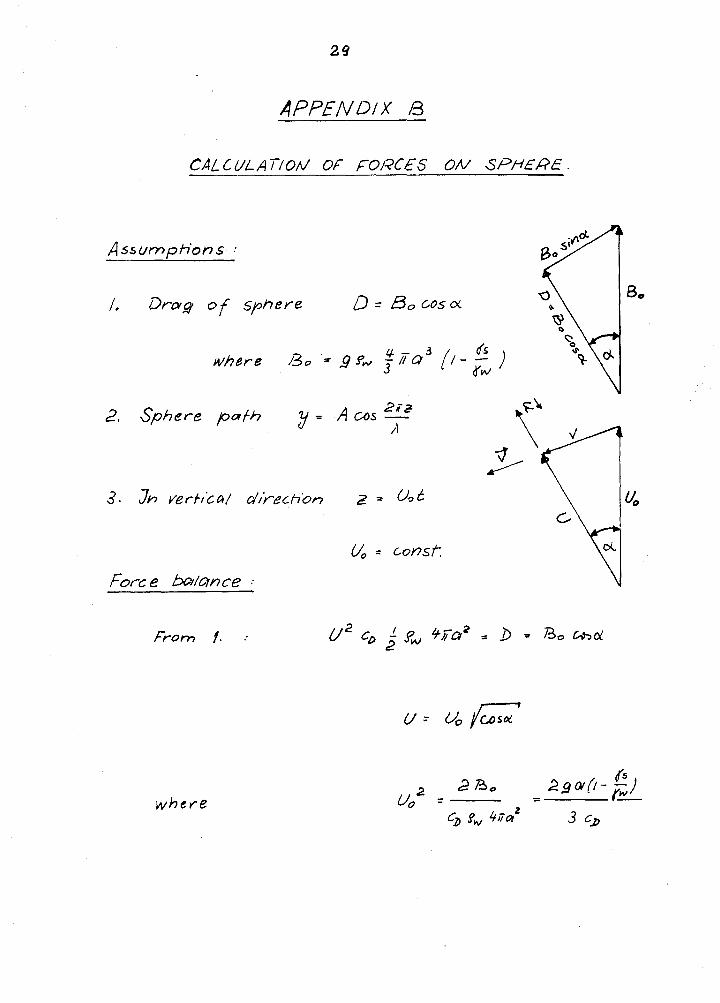
APPENDIX B
CAL C UL A T/OM O f m/?CES On/ SPHERE .
Assumpt ions :
. Drag of sphere D = a, coS
3 d's where 130 = 9 % ; /TO (/- - )
YN
2 r z 2, sphere path = A a s - /I
3. Jh verflca/ c / / h c t i + ~ 2 = uvt
C/, = consf-.
From . :
where
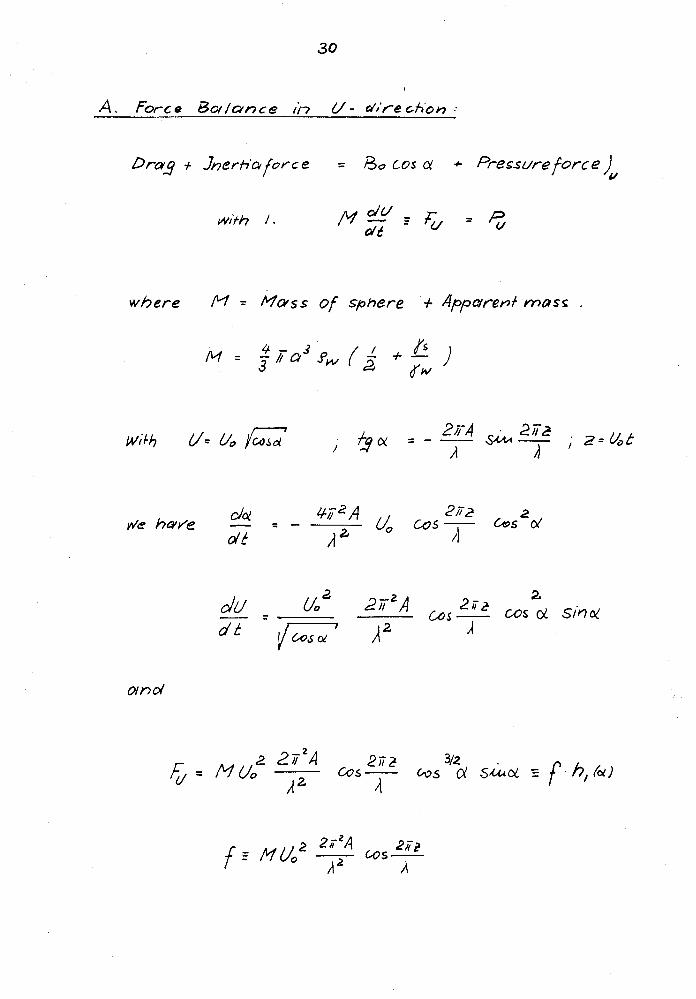
A . Force B c / / ~ r , c e U - cv'/'rechbr;,:
D r a j + Jnerh'aforce = A* G U S oc + Pressure f o r c e ) U
w h e r e lY = m s s of sphere + are^)+ m o s s
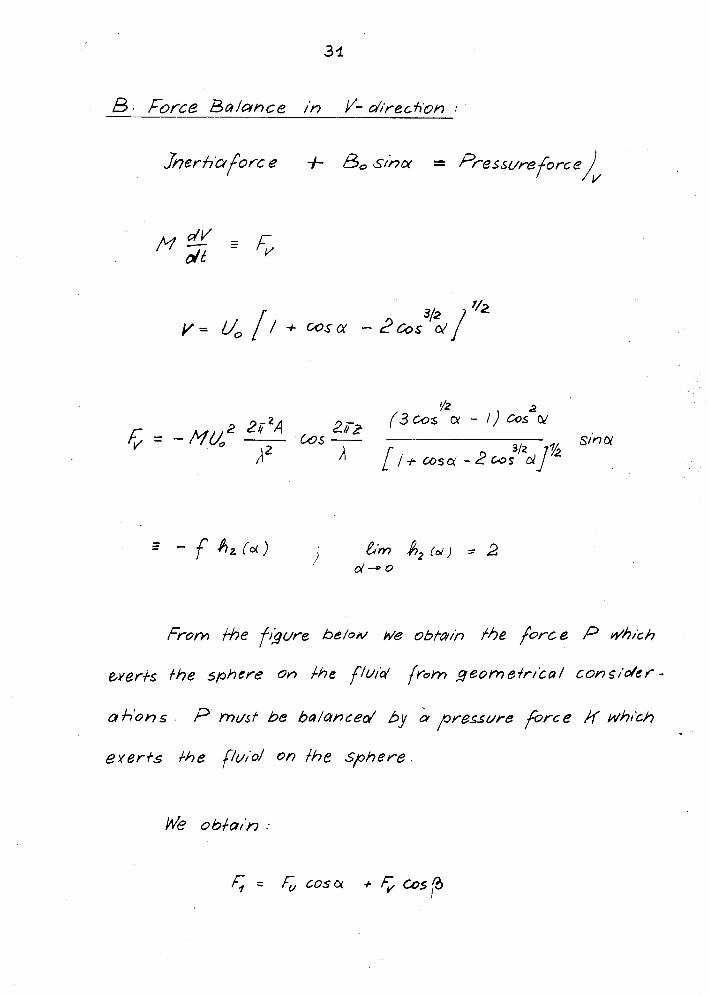
5. Force B a / ~ n c e in v- d r e c h b n :
Jnerhuforce + B,sinot = pressure orce f i v
From t h e f ~ i ~ u r e bc/ow M +he force P iu'h~ch
eyerfs t he sphere On +he flu/$ from g e o m e f r / c a / c o n s ~ ' d e r -
a hbns . P rnu$/st be ba/anced by 6- pressure force K whrch
everts +he f/u,'o/ on fhe Sphere.
= 6 cosa +
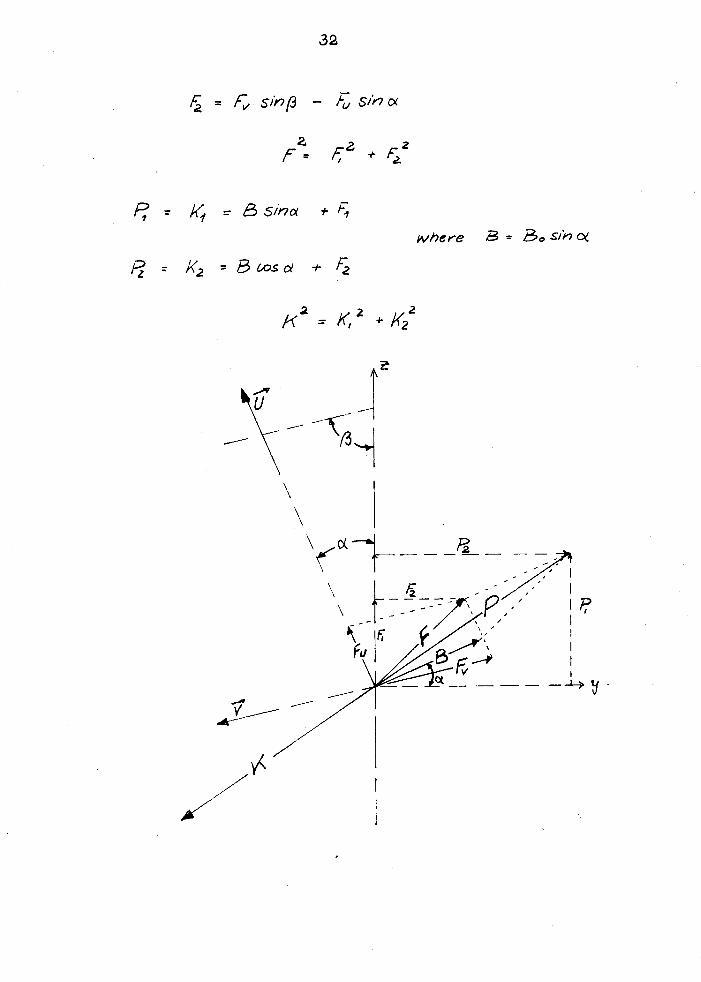
where B = 3, S J ~ Q!
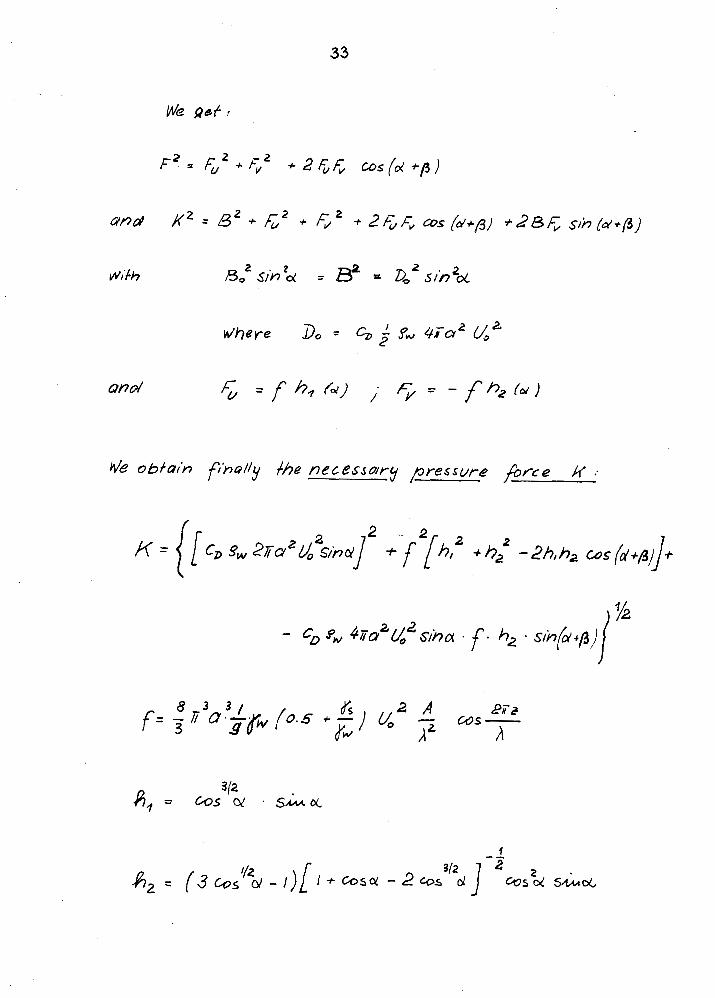
Ve oob+a~b f h ~ N y #he necessary pressure fbrce K ;
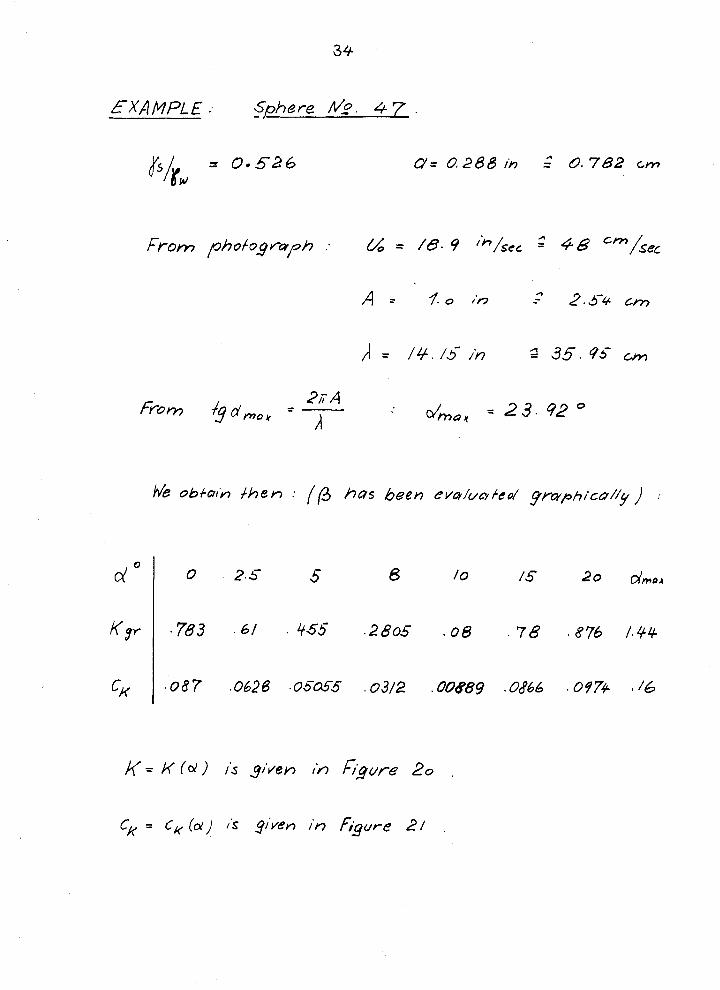
E X A M P L E . - Sphere Nc. 47
we O&+Q;H +hen : (13 has been evo/uoied g m i ~ ~ / / ~ ) ;
K = K ,i given ,i, figure 20
C~ = C& (d l I S gi 'en in f i gu re 21 .
Sphere %. d
Sphere No. d
T A B L E 2
Sphere No. d biT PS"W K w CD u2 in gr - - 2 2 i n /sec
uo. 24
153.11
72.05 mold
71.60 '' 73.80 " 51.00 "
71.02 ar
31.91
134.33 " u5.u '
14.6068
3-45.96
Sphere No. d W ps/pw K w c, u2 in gr - - 2 2 in /see
T A B L E 3
Sphere nTo. t U T Re
s=12 inch see in/sec - "C -
Sphere No. t U T Re
s=12 inch sec in/sec - C - 0
Sphere ?To. t 0 T Re C~
s=12 inch see in/see - OC - --
T A E L E 3 ( C O I Q I W D )
Sphere No. t U T %
s=12 inch - sec in/sec - OC -
Sphere No. t U C~ T Re
s=12 inch sec in/sec - OC -
T A B L E 1,
Sphere No. t U T Re
s=12 inch sec in/sec - OC -
T A B L E 4 ( COEITIE4TlED )
Sphere No. t U T Re
s=12 inch sec in/sec - OC -
T A 3 L E 4 ( CONTIRWD )
Sphere No. t U T Re
s=12 inch see in/see - Of2 - 0. $10
Oe 744 16.13 0- 588 8390
41 0.99 12-11 0- 491 23. o 5260
2x 1.00
2~ 1-03
s=24 inch -- 1.98
2- 00
2-01
2-10 11-42, 0.553 4980
4.2
s=22 inch 0, 94 12.77 0- 439 23- 0 5620
0.93
0- 92
s=24 inch 7-
1.87
S e St,
1e82 13.19 0-412 5810
43
s=92 inch 0, 90 1%. 32 0- 416 23.0 5940
0- 91
0.94
Sphere _Woo t
sec
46
s=24 inch 2.86
2.90
2.93
2 e 94
47
s=24 inch 2.4.4
1. 47
T A B E E 4 ( CONTINUED )
Sphere No. t U T Fie
see in/see - OC -
s=1.95 inch*
49 0.11
00 123
0. U5
0.12
0.112
0.128
0,112
0.123
53 0. 113
0.121
54. 0. 113
0. 111
5 5 0.124.
0.115
56 0.120
57 0.108
58 0.106 18. 40
a without sphere release meehanisnt
Sphere No.
T A I3 L E 4 ( C O N T I h r n )
t U
sec in/sec - sr2.0 inch
48
49
50
52
53
54
56
57
58
s=24 inch
48 2x 1.&0
49 1.38
1 8 40
50 1.37
2~ 1.35
51 2~ 1.39
1.38
1.39
1.40
1. L & l
Sphere No. t U C~ T RR
see in/sec - OC -
T A B L E 5
Sphere No. d ' f s 1 s U 53 in - in in i n/sec -
T A B L E 5 ( CONTINUED )
Sphere No. d 1 f s I s U
in - in in in/sec -
T A B L E 6
Sphere No. d (b'd > m a
d n / d Xav/d )trnax/d ps/pI, ( h c
laver age = 11.41 % av.
T A B L E 7
Sphere No. . d A m a x ~ s / p u ~-P~/P,
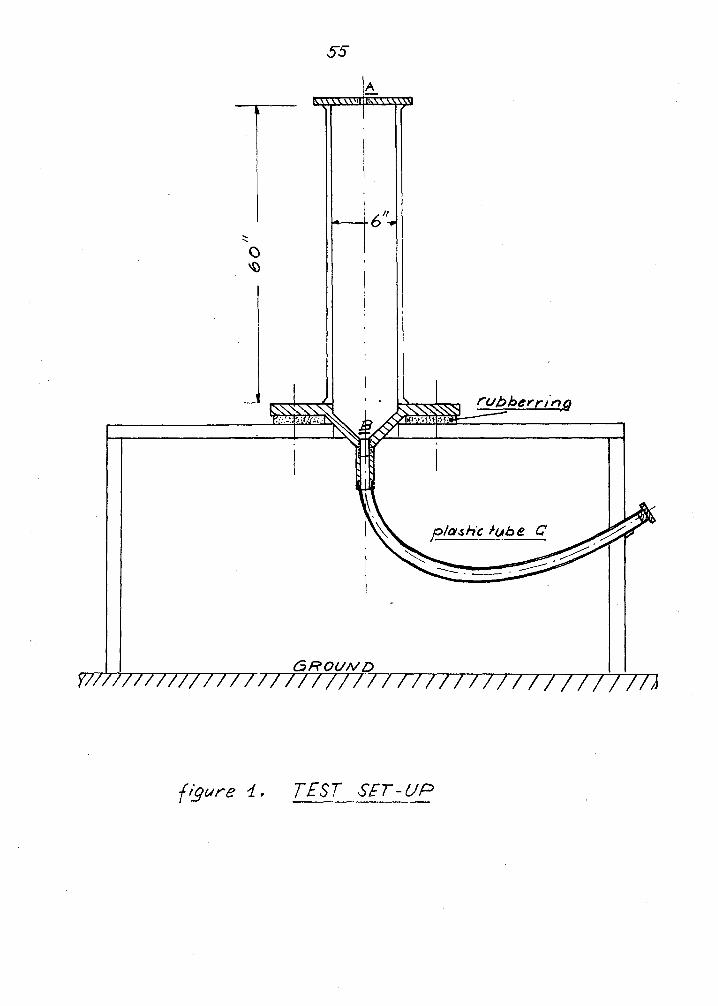
f igure 1. TEST SET-UP -
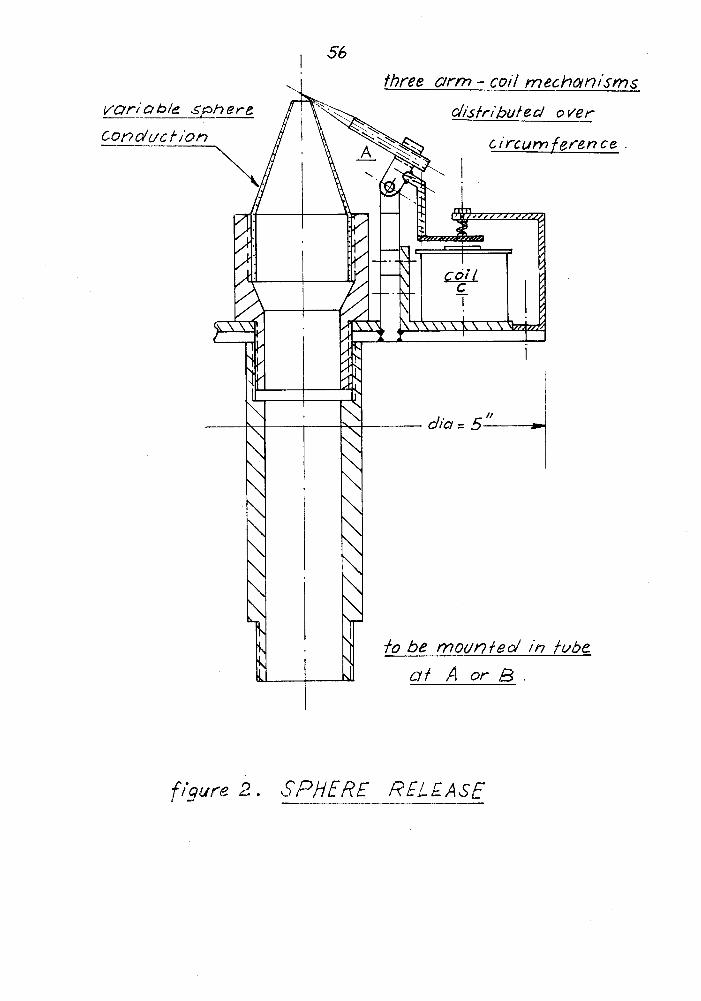
fiqure 2 . SPHERE REL E AS€
b r a s s p y
J/gure 3 . SPHERE P O L --- D

fo pho f o fube c i rw i f
7 I 1 1 ( pho fo fube 929
I I plane focussing lens
'a'
h u r e 76 AAMPIITUDE OF SPHERE PATH


![Converged Storage, Wishful Thinking & Realitycloudscaling.com/assets/pdf/cloudscaling_whitepaper_converged_st… · inimitable Werner Vogels, CTO of Amazon [@werner]. Werner focuses](https://img.pdfslide.us/doc/110x75/5f46e8be3e118e38f36b60e4/converged-storage-wishful-thinking-inimitable-werner-vogels-cto-of-amazon.jpg)