Embed Size (px)
Citation preview
THESIS APPROVAL
The abstract and thesis of Heather Rose Easterly for the Master of Science in Geology
were presented October 13, 2005, and accepted by the thesis committee and the
department.
COMMITTEE APPROVALS: _______________________________________ Curt D. Peterson, Chair
_______________________________________ Georg H. Grathoff
_______________________________________ John E. Baham
_______________________________________ William Fish Representative of the Office of Graduate Studies
DEPARTMENTAL APPROVAL: _______________________________________ Michael L. Cummings, Chair Department of Geology
CHARACTERIZATION OF IRON-BEARING FILMS FOUND ON EPHEMERAL
POOLS, CENTRAL COAST, OREGON
by
HEATHER ROSE EASTERLY
A thesis submitted in partial fulfillment of the requirements for the degree of
MASTER OF SCIENCE in
GEOLOGY
Portland State University 2005
ABSTRACT
An abstract of the thesis of Heather Rose Easterly for the Master of Science in
Geology presented October 13, 2005.
Title: Characterization of Iron-Bearing Films Found on Ephemeral Pools, Central
Coast, Oregon
Iron-bearing films have been documented worldwide, but with little
characterization or explanation of their formation. Along the Oregon coast the
films are found on ephemeral surface pools where ferrous iron discharges from the
groundwater. Example sites occur at the base of Pleistocene sand dunes at Seal
Rock State Park and Driftwood Creek Wayside. At these pools the iron oxidizes
and a thin film of about 300 nm forms. The films have been named
Schwimmeisen.
The major constituents of Schwimmeisen are iron and silica in a 3:1 ratio
based on scanning electron microscopy – energy dispersive x-ray spectroscopy
(SEM-EDS). Schwimmeisen from Seal Rock have higher concentrations of
chlorine and sodium, likely due to increased sea-spray. Fourier transfer infrared
(FTIR) spectroscopy indicates OH bonds, carbon peaks and peaks similar to
ferrihydrite. X-ray diffraction (XRD) and transmission electron microscopy (TEM)
show patterns similar to two-line ferrihydrite, with lines around 2.6 Å and 1.5 Å. A
third line at 4.5 Å is also present in some areas. Halite and quartz are also found in

2
association with Schwimmeisen. HRSEM-EDS of the film and flocculent find that
carbon is more concentrated in the flocculent. Colorimetric testing finds
Schwimmeisen has some mixed valence, roughly 1:5 Fe(II) to Fe(III). Atomic
emission spectrometry (AES) and ion chromatography (IC) analysis of the pool
water finds concentrations of reduced iron to be 9 ppm, silica 7 ppm, sodium 60
ppm, and chlorine 85 ppm. The average pH was between 5 and 6.
Optical microscopy and SEM find no bacteria in Schwimmeisen or in the
water of the pools. High resolution scanning electron microscopy (HRSEM)
indicates that there may be iron-oxidizing bacteria in the flocculent on the films.
Due to the absence of bacteria directly attached to the films I conclude they are
abiotically formed through oxidation at the air-water interface. As oxidation
continues the bacteria may attach to the oxidizing film, which falls to the bottom of
the seep pool when oxidation is complete. Schwimmeisen form where iron and
silica in reducing groundwater are exposed to oxidizing conditions in surface pools
and seeps.

i
ACKNOWLEDGEMENTS
Thank you to my advisor, Georg Grathoff, for his guidance and support
throughout this entire process. I would also like to thank John Baham, Nick
Chambers, Ann and Larrie Easterly, Rick Hugo, Eric Nielsen, Niki Parenteau, Ben
Perkins, and Curt Peterson for their help in the field and in the lab; and Paul Gassman
of Environmental Molecular Science Laboratory of Pacific Northwest National
Laboratories for work on the FTIR. Funding for this research was provided by the
Oregon Society of Soil Scientists, a Portland State University Faculty Enhancement
Grant, and by the NOAA office of Sea Grant and Extramural Programs, U.S.
Department of Commerce, under grant number NA76RG0476, project number R/SD-
04, and by appropriations made by Oregon Legislature.
ii
TABLE OF CONTENTS
ACKNOWLEDGEMENTS ............................................................................................ i LIST OF TABLES ........................................................................................................ iv LIST OF FIGURES........................................................................................................v INTRODUCTION..........................................................................................................1 BACKGROUND............................................................................................................5
Iron Oxides in Surface Environments ...................................................................6 Films and Biofilms....................................................................................................7 Geologic Setting.......................................................................................................9
SITE DESCRIPTION...................................................................................................16
Driftwood Creek Wayside .....................................................................................16 Seal Rock ................................................................................................................18
FIELD METHODS ......................................................................................................21 LABORATORY METHODS ......................................................................................25
X-ray Diffraction .....................................................................................................25 Scanning Electron Microscopy ............................................................................25 High Resolution Transmission Electron Microscopy ........................................27 Thermogravimetric Analysis.................................................................................27 Optical Microscopy ................................................................................................27 Ion Chromatography..............................................................................................28 Inductively Coupled Plasma-Atomic Emission Spectrometry .........................28 Colorimetric Determination of Ferrous and Ferric Iron ....................................29 Fourier Transfer Infrared Spectroscopy .............................................................29
RESULTS.....................................................................................................................31
Field Observations.................................................................................................32 Optical Microscopy ................................................................................................35 Scanning Electron Microscopy (SEM) ................................................................39
High Resolution Scanning Electron Microscopy (HRSEM)................................44 X-ray Diffraction (XRD) .........................................................................................47 Water Chemistry ....................................................................................................54 Fe(II)/Fe(III) ratios ..................................................................................................59 Thermogravimetric Analysis (TGA).....................................................................61 Density of the Film .................................................................................................62 Fourier Transfer Infrared Spectroscopy (FTIR).................................................63 High Resolution Transmission Electron Microscopy (HRTEM) ......................64

iii
DISCUSSION...............................................................................................................72
Ferrihydrite – Similarities and Differences .........................................................72 Formation of Ferrihydrite ......................................................................................78 Abiotic v. biotic formation (Biofilms) ....................................................................82 Floating Film ...........................................................................................................84 Future Work ............................................................................................................86
CONCLUSIONS ..........................................................................................................88 REFERENCES...........................................................................................................90 APPENDIX A: SEM-EDS LOCATIONS....................................................................95
iv
LIST OF TABLES
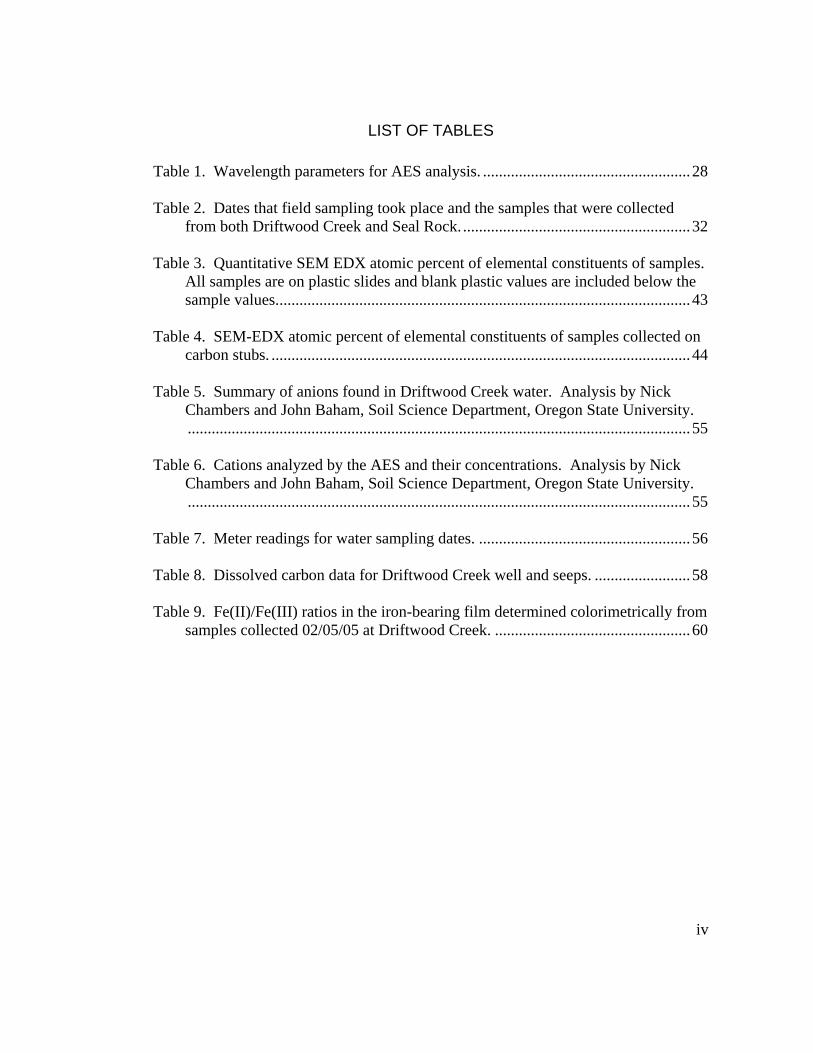
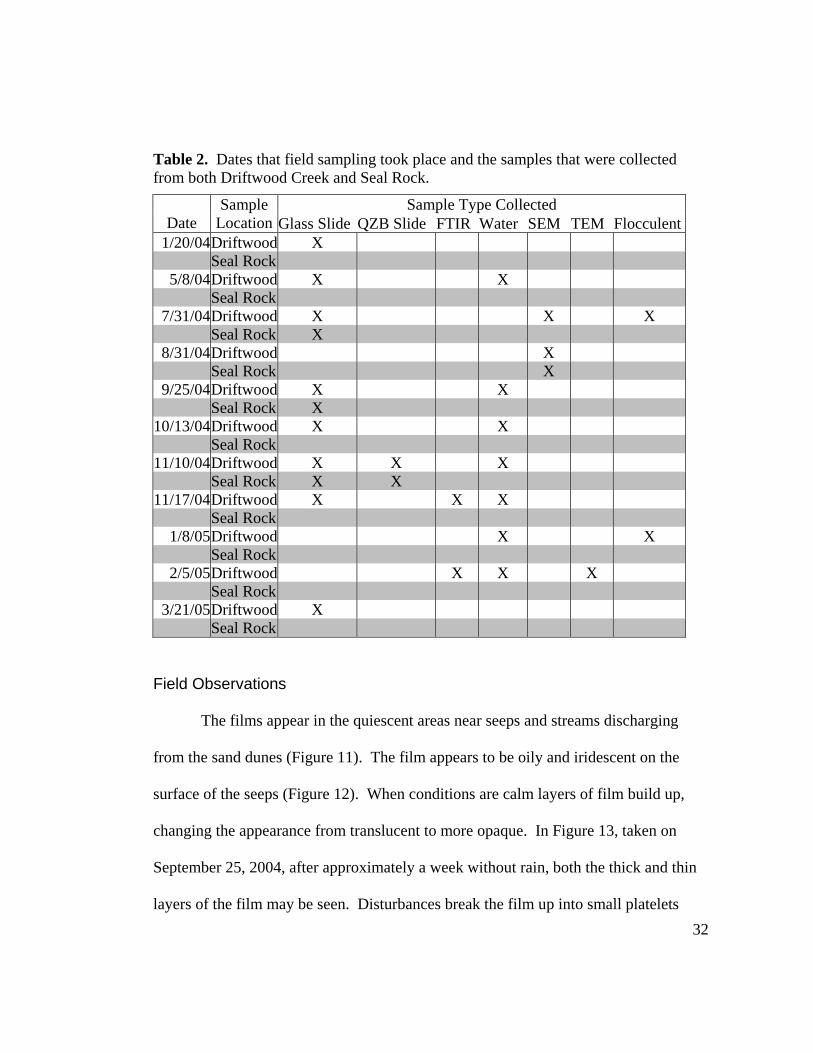
Table 1. Wavelength parameters for AES analysis. ....................................................28 Table 2. Dates that field sampling took place and the samples that were collected
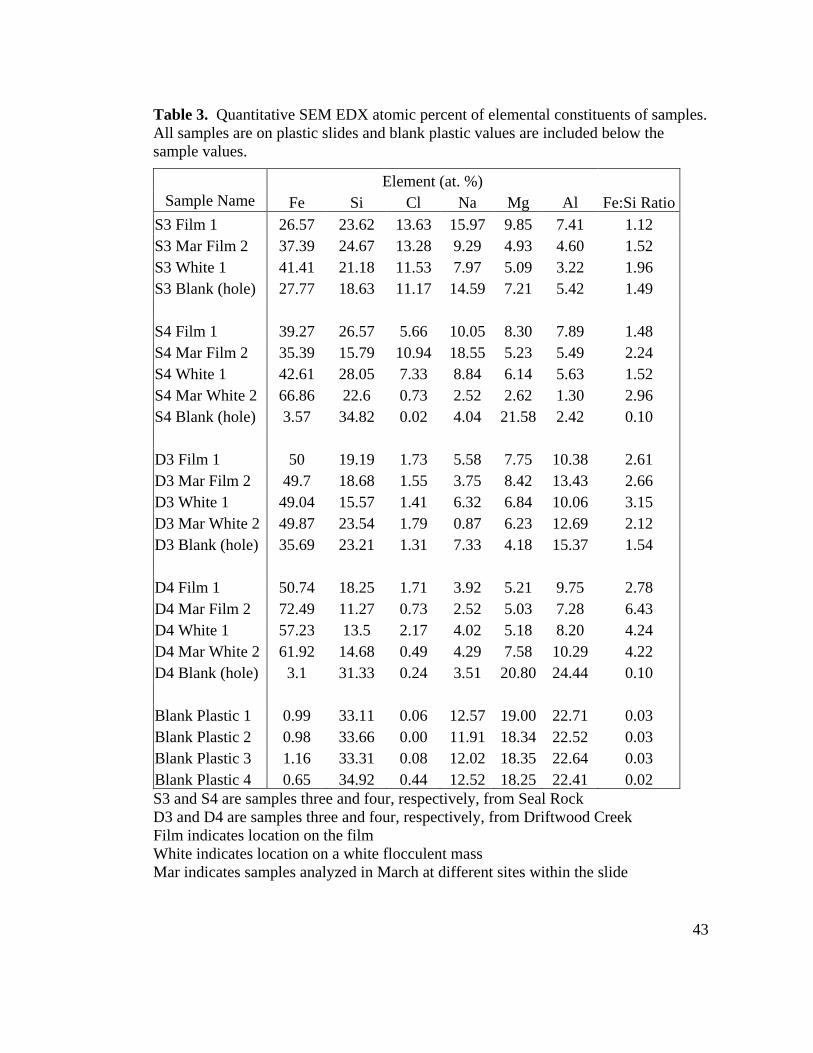
from both Driftwood Creek and Seal Rock..........................................................32 Table 3. Quantitative SEM EDX atomic percent of elemental constituents of samples.
All samples are on plastic slides and blank plastic values are included below the sample values........................................................................................................43
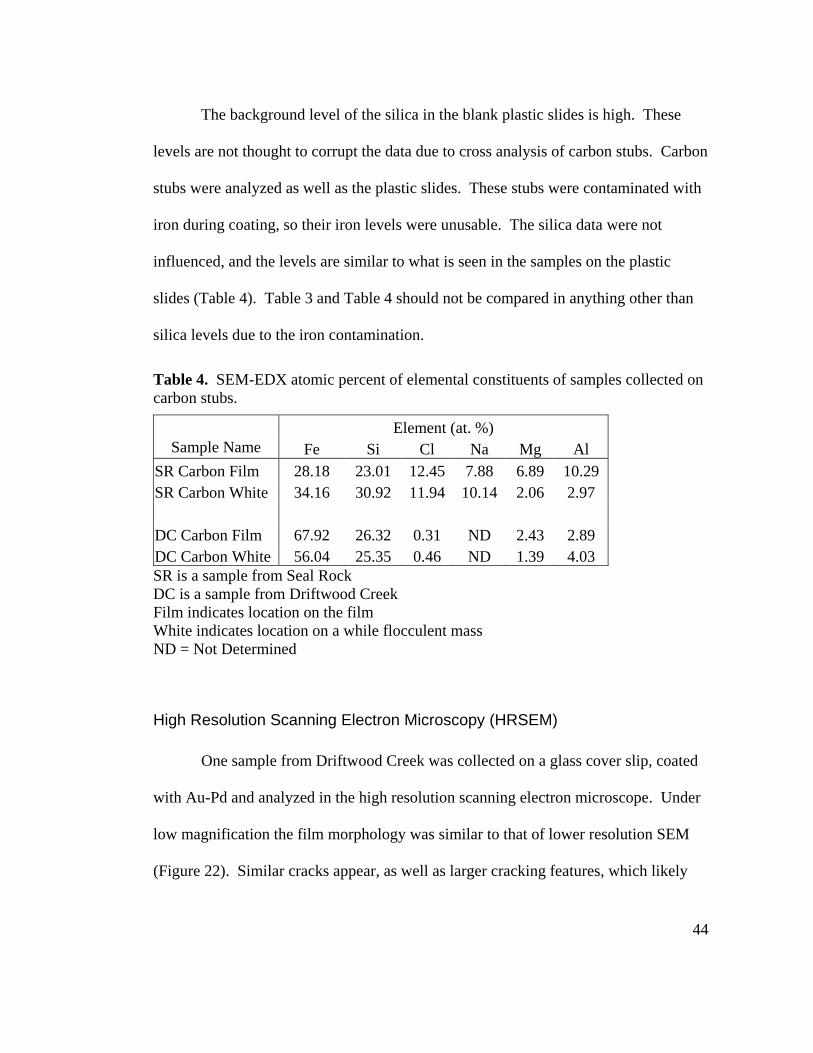
Table 4. SEM-EDX atomic percent of elemental constituents of samples collected on
carbon stubs. .........................................................................................................44 Table 5. Summary of anions found in Driftwood Creek water. Analysis by Nick
Chambers and John Baham, Soil Science Department, Oregon State University...............................................................................................................................55
Table 6. Cations analyzed by the AES and their concentrations. Analysis by Nick
Chambers and John Baham, Soil Science Department, Oregon State University...............................................................................................................................55
Table 7. Meter readings for water sampling dates. .....................................................56 Table 8. Dissolved carbon data for Driftwood Creek well and seeps. ........................58 Table 9. Fe(II)/Fe(III) ratios in the iron-bearing film determined colorimetrically from
samples collected 02/05/05 at Driftwood Creek. .................................................60
v
LIST OF FIGURES
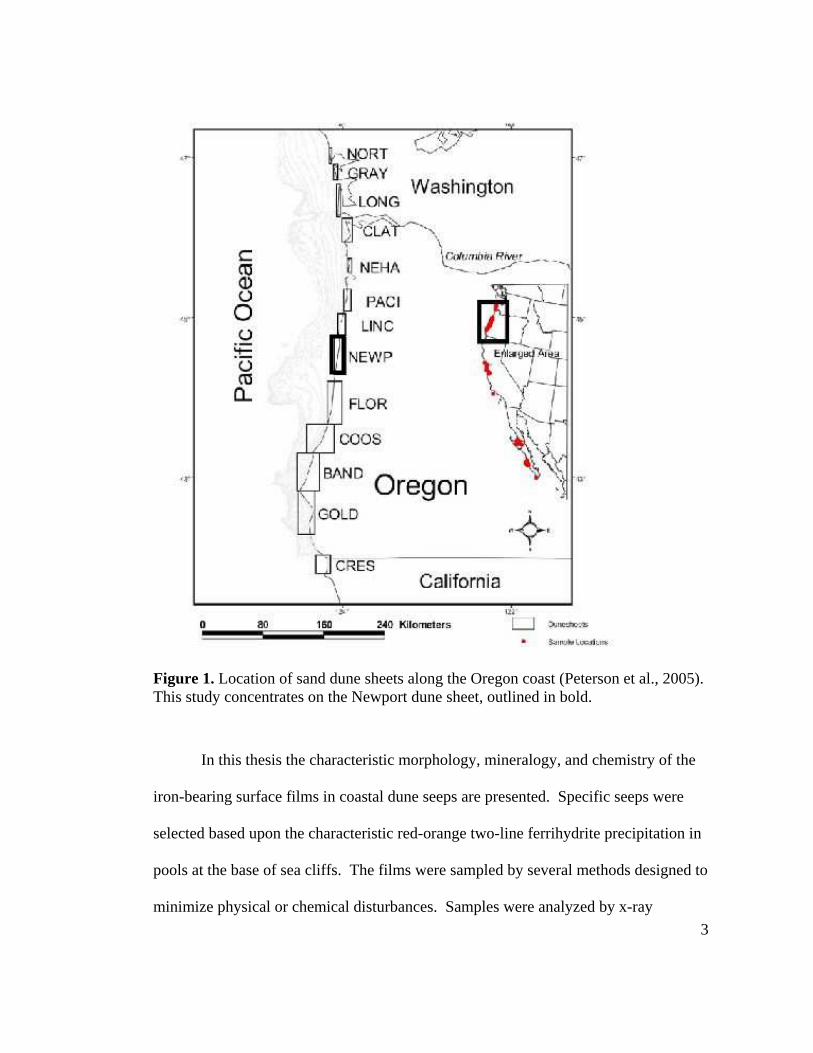
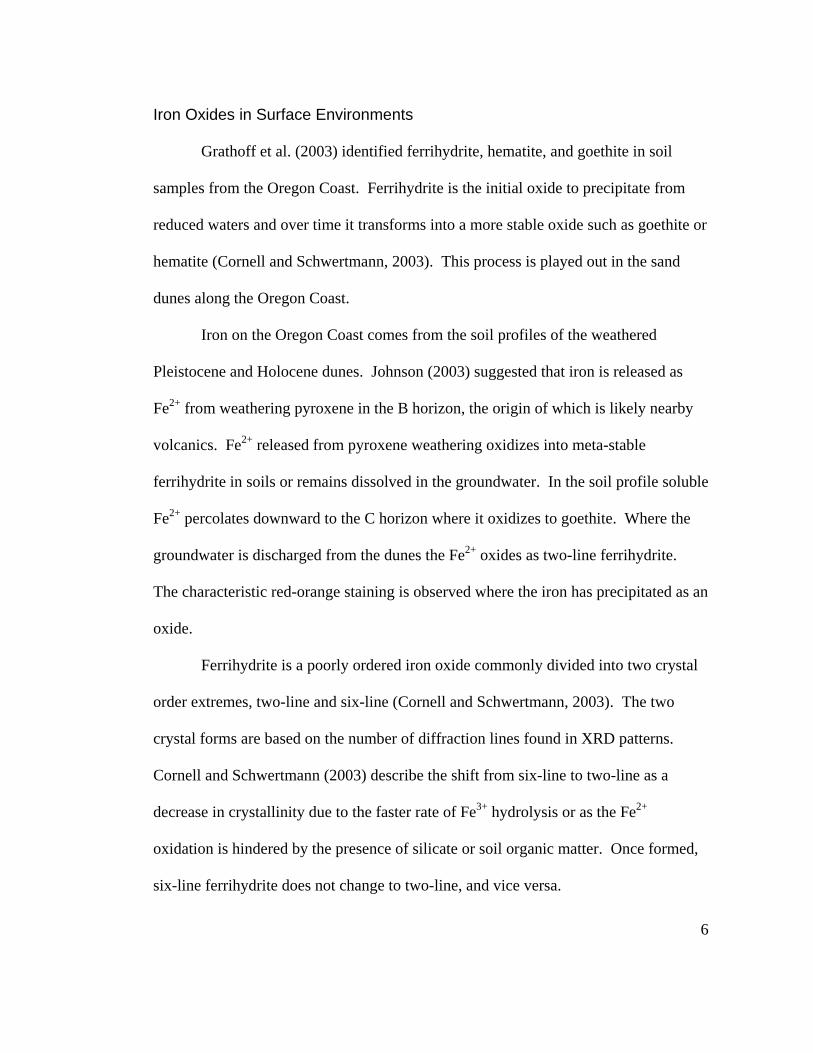
Figure 1. Location of sand dune sheets along the Oregon coast (Peterson et al., 2005). This study concentrates on the Newport dune sheet, outlined in bold. ..................3
Figure 2. Geology of the Newport Dune Sheet. Samples were collected from Seal
Rock and Driftwood Creek (Peterson, et al., 2005). ............................................11 Figure 3. View of Seal Rock beach. Water is seen seeping out of the contact between
the sand dunes and the Yaquina Formation below the trees on the left. ..............13 Figure 4. View of Driftwood Creek Wayside north of entrance to the beach. Water is
seen seeping out of the base of the sand dune onto the beach..............................13 Figure 5. Stratigraphic columns of area surrounding Driftwood Creek State Park
(DCSP) (Clough, 2005). Most of the seep pool sampling and a shallow monitoring well (Orcas) are located approximately at the left-most column, 1.5 km north of the entrance to the beach. .................................................................17
Figure 6. Stratigraphic column of the area surrounding Seal Rock State Park (Clough,
2005).....................................................................................................................19 Figure 7. The point of the arrow is on the wave cut platform where seeps appear at
Seal Rock State Park. Samples were collected at the seep directly east of the end of the arrow...........................................................................................................20
Figure 8. Sample holder for FTIR samples. Argon is pumped through the tube on the
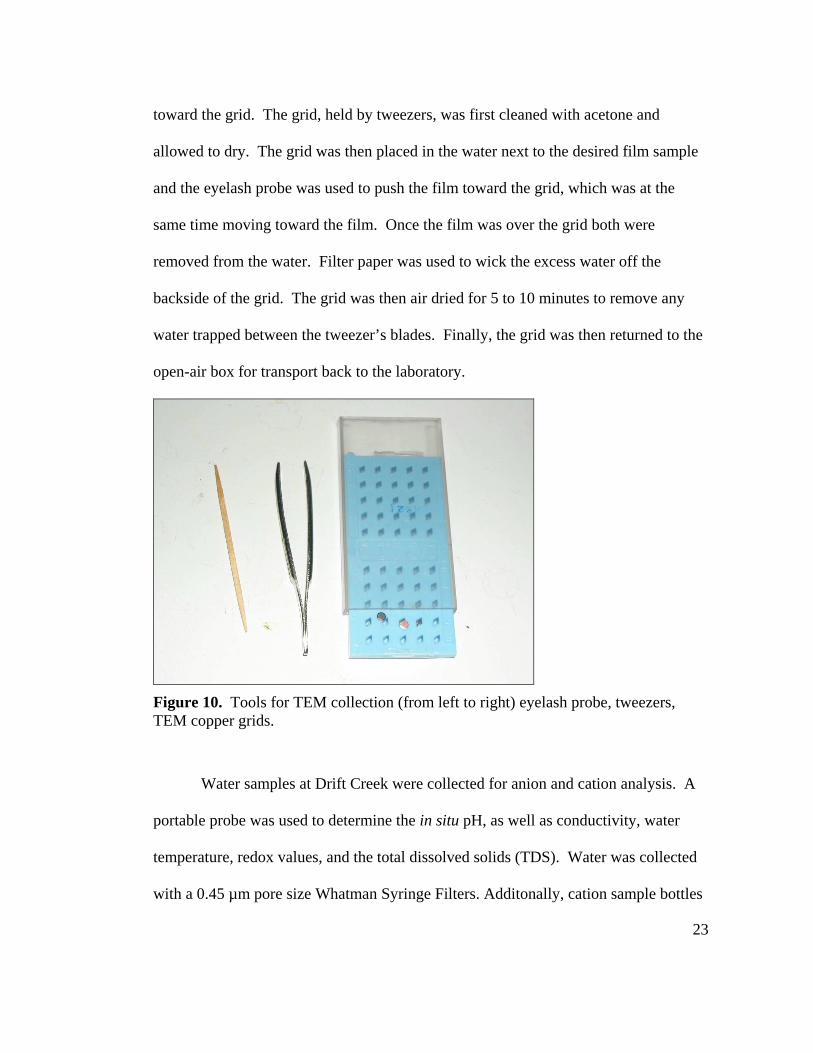
right and the sample is inserted by unscrewing the left end.................................22 Figure 9. Carbon stubs with film in the transport container........................................22 Figure 10. Tools for TEM collection (from left to right) eyelash probe, tweezers,
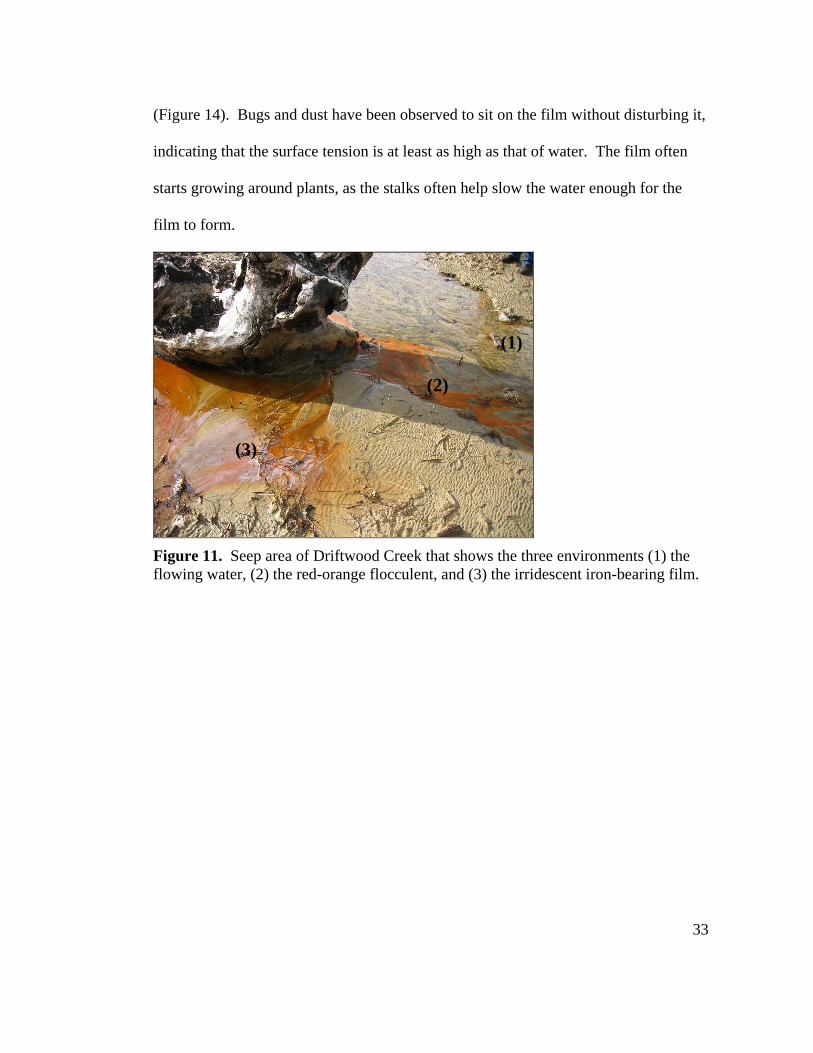
TEM copper grids.................................................................................................23 Figure 11. Seep area of Driftwood Creek that shows the three environments (1) the
flowing water, (2) the red-orange flocculent, and (3) the irridescent iron-bearing film. ......................................................................................................................33
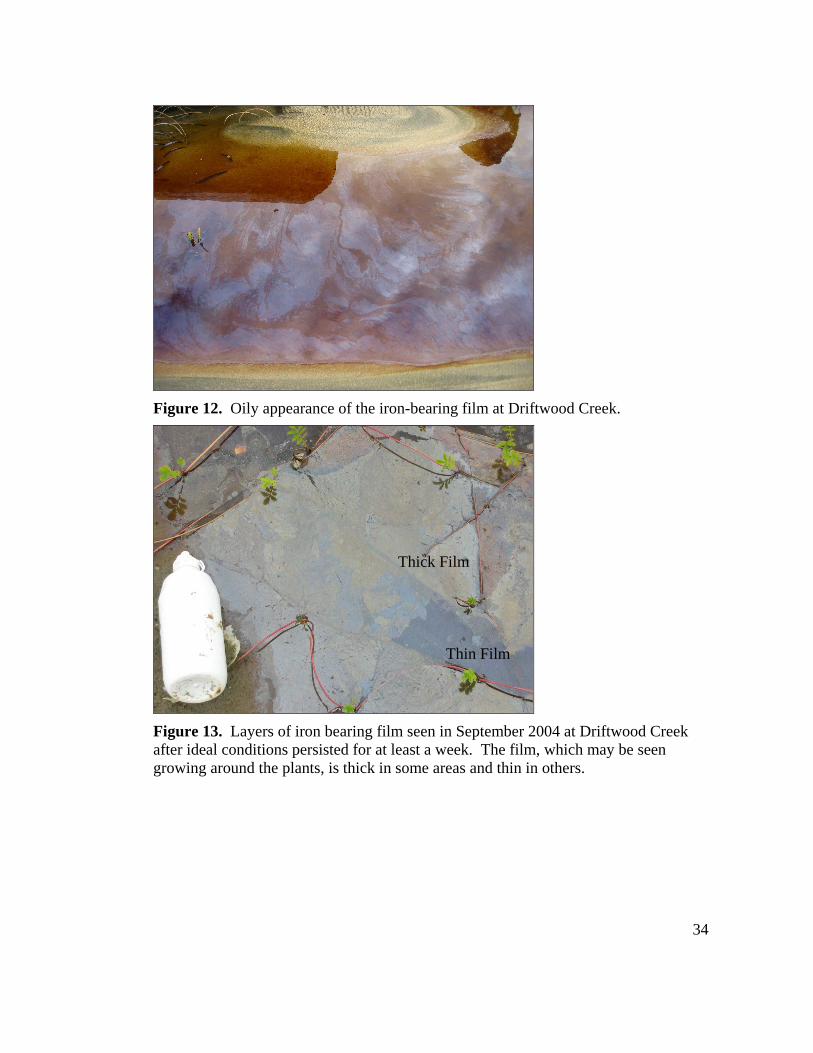
Figure 12. Oily appearance of the iron-bearing film at Driftwood Creek...................34 Figure 13. Layers of iron bearing film seen in September 2004 at Driftwood Creek
after ideal conditions persisted for at least a week. The film, which may be seen growing around the plants, is thick in some areas and thin in others...................34
vi
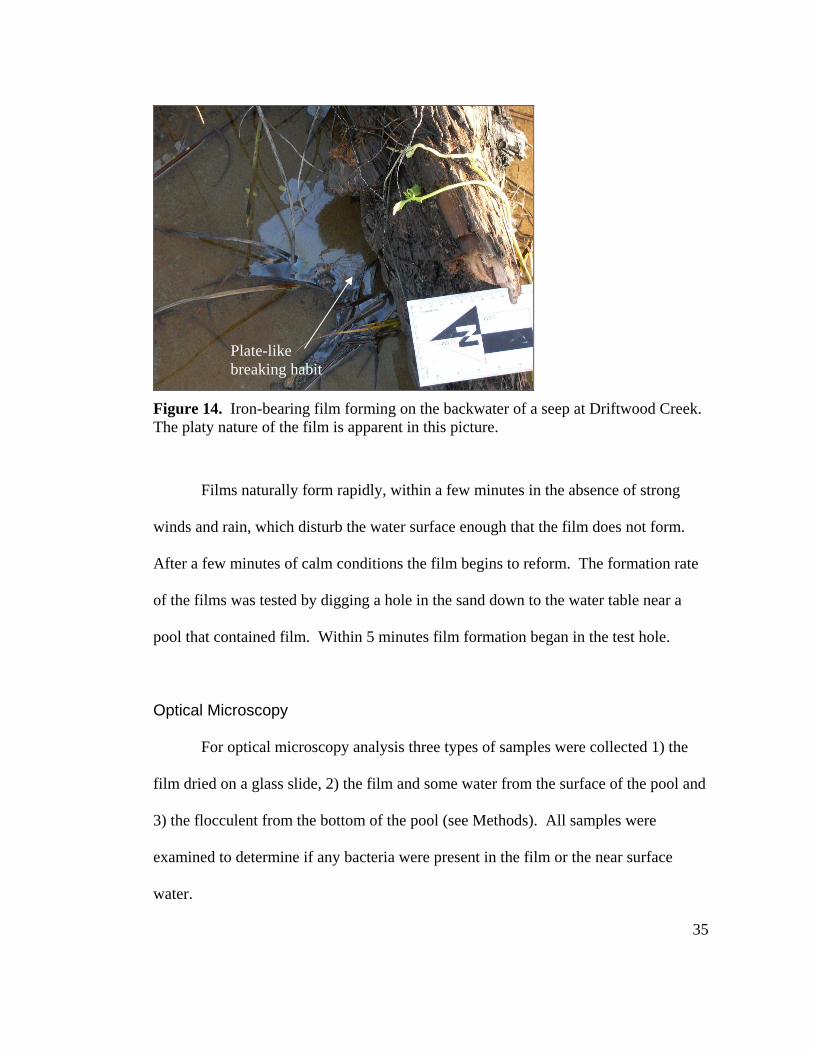
Figure 14. Iron-bearing film forming on the backwater of a seep at Driftwood Creek. The platy nature of the film is apparent in this picture.........................................35
Figure 15. QZB1 at 10x under phase conditions. This is the dried film with its shard
like brown-iridescent appearance. Parts of the film are orange-brown where the film appears be altering into flocculent. ...............................................................36
Figure 16. QZB1 at 20x. (A) is a dark-field image showing the flocculent as orange
and with more depth than (B) a phase image of the same area showing the platy nature of the film and the brown appearance of the flocculent. ...........................37
Figure 17. Driftwood Creek film and water at 10x. Among the diatoms and other
single cell organisms found in the water is this shard-like material, about 100 by 200 µm, likely representing the film in a submersed state. No diatoms or other single cell organisms are seen in this micrograph. ...............................................38
Figure 18. Flocculent at 20x. Dark-field image of the flocculent and bacteria from the
bottom of a pool at Driftwood Creek. The bacterium is indicated with the arrow...............................................................................................................................39
Figure 19. Micrograph of Seal Rock film (sample S3) on a plastic slide. The film is
the medium grey material. A crack may be seen running through the film on the right of the picture, showing the darker grey substrate. To the left of the picture are white masses of flocculent..............................................................................40
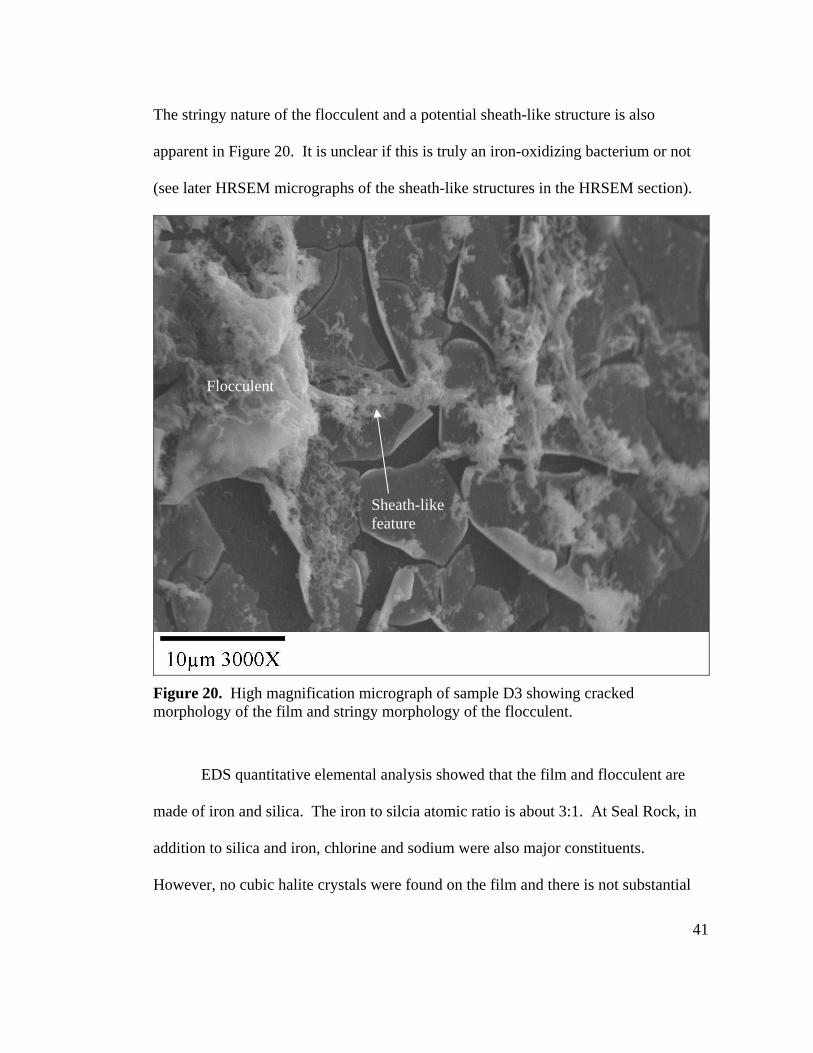
Figure 20. High magnification micrograph of sample D3 showing cracked
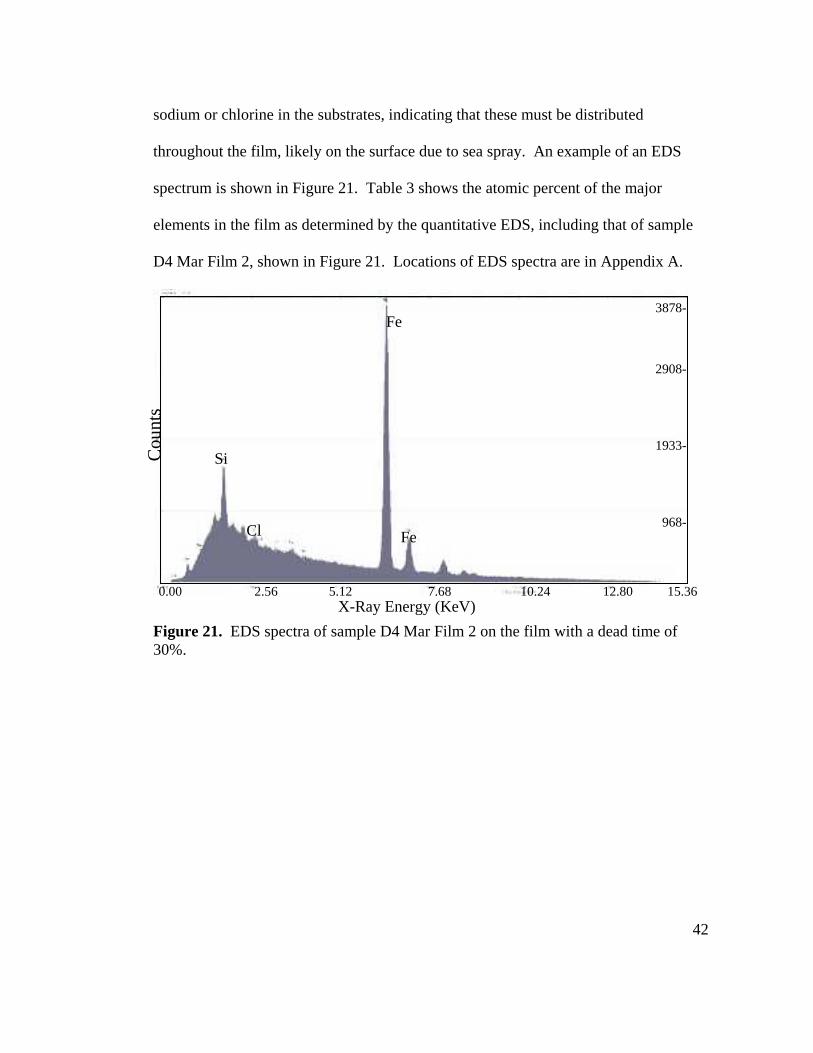
morphology of the film and stringy morphology of the flocculent. .....................41 Figure 21. EDS spectra of sample D4 Mar Film 2 on the film with a dead time of
30%.......................................................................................................................42 Figure 22. HRSEM micrograph of a Driftwood Creek film on a glass cover slip.
Cracking and flocculent masses similar to those found in previous SEM work are visible, as well as more extensive cracking features. ...........................................45
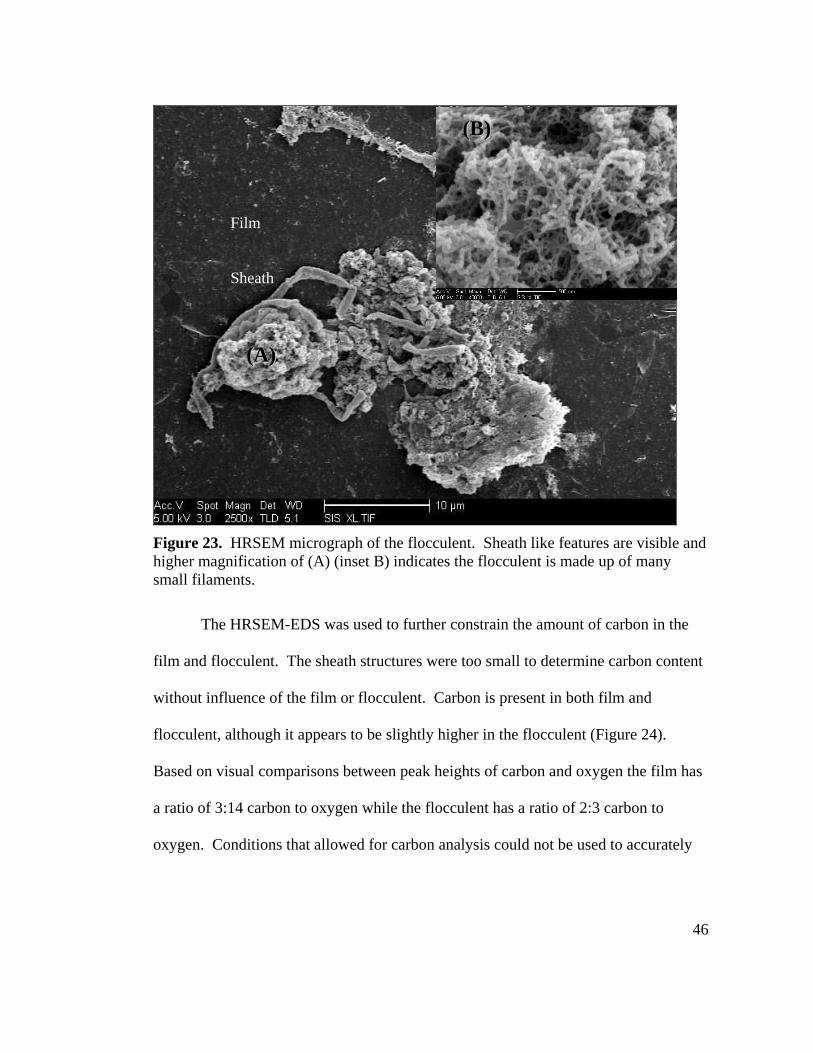
Figure 23. HRSEM micrograph of the flocculent. Sheath like features are visible and
higher magnification of (A) (inset B) indicates the flocculent is made up of many small filaments......................................................................................................46
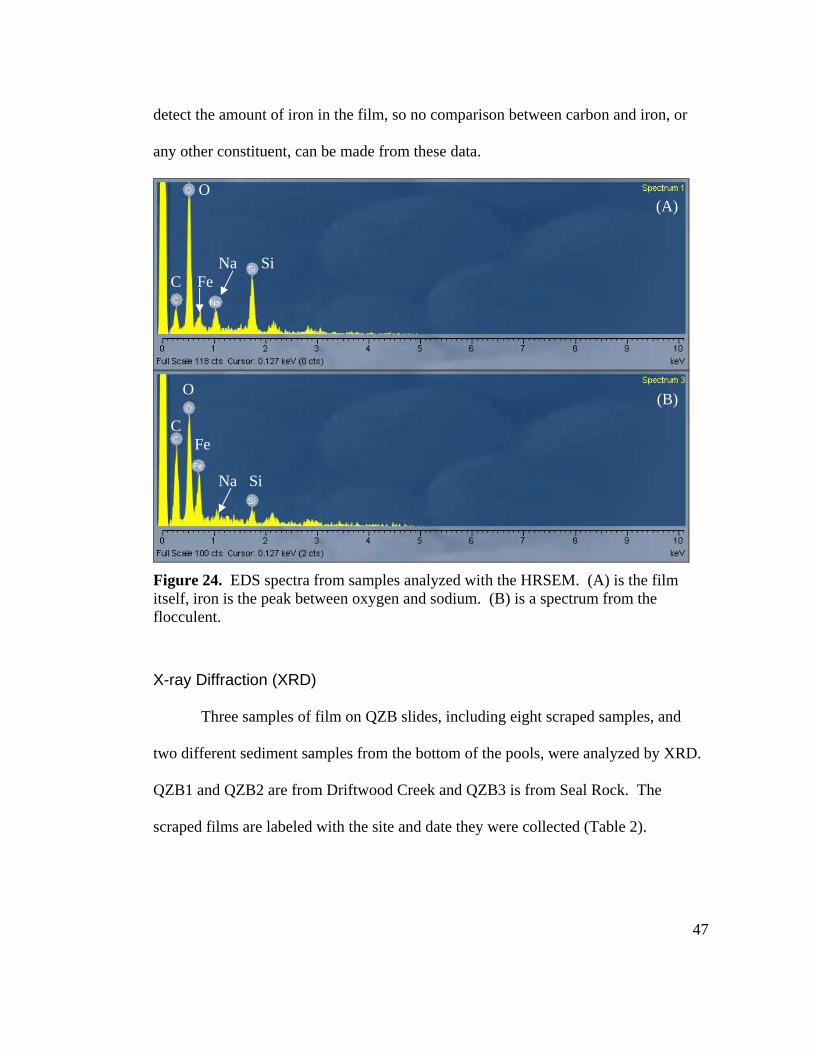
Figure 24. EDS spectra from samples analyzed with the HRSEM. (A) is the film
itself, iron is the peak between oxygen and sodium. (B) is a spectrum from the flocculent. .............................................................................................................47
vii
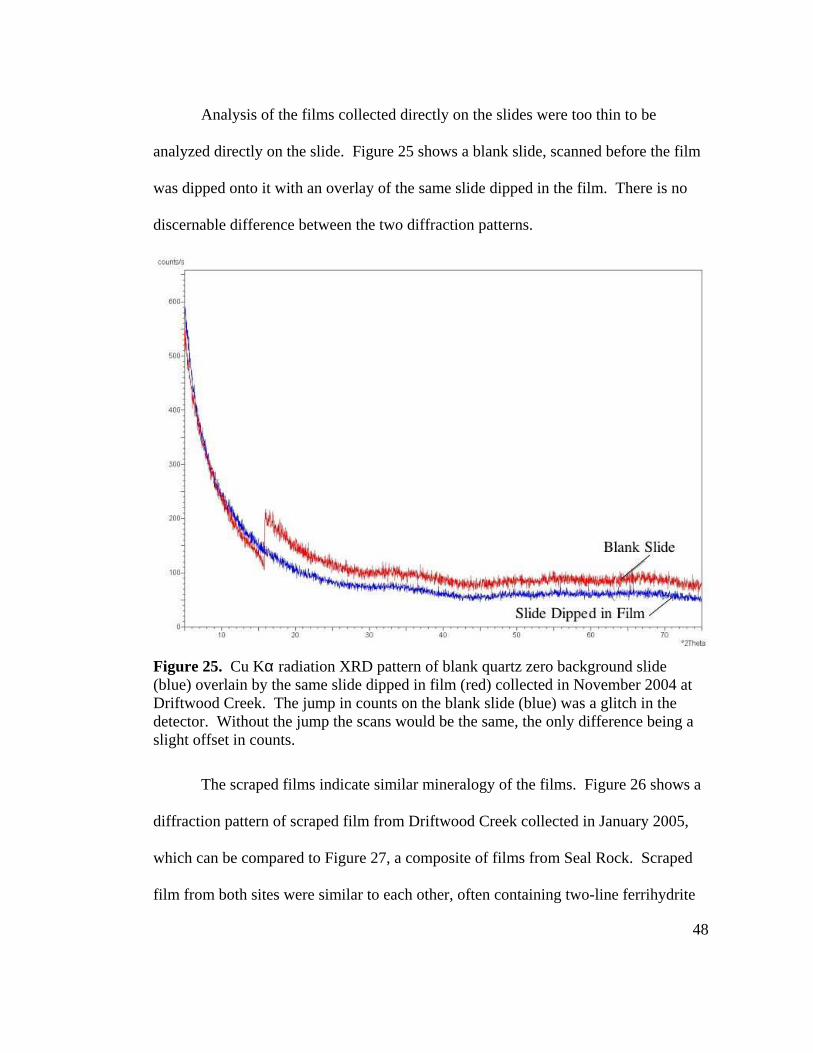
Figure 25. Cu Kα radiation XRD pattern of blank quartz zero background slide (blue) overlain by the same slide dipped in film (red) collected in November 2004 at Driftwood Creek. The jump in counts on the blank slide (blue) was a glitch in the detector. Without the jump the scans would be the same, the only difference being a slight offset in counts...............................................................................48
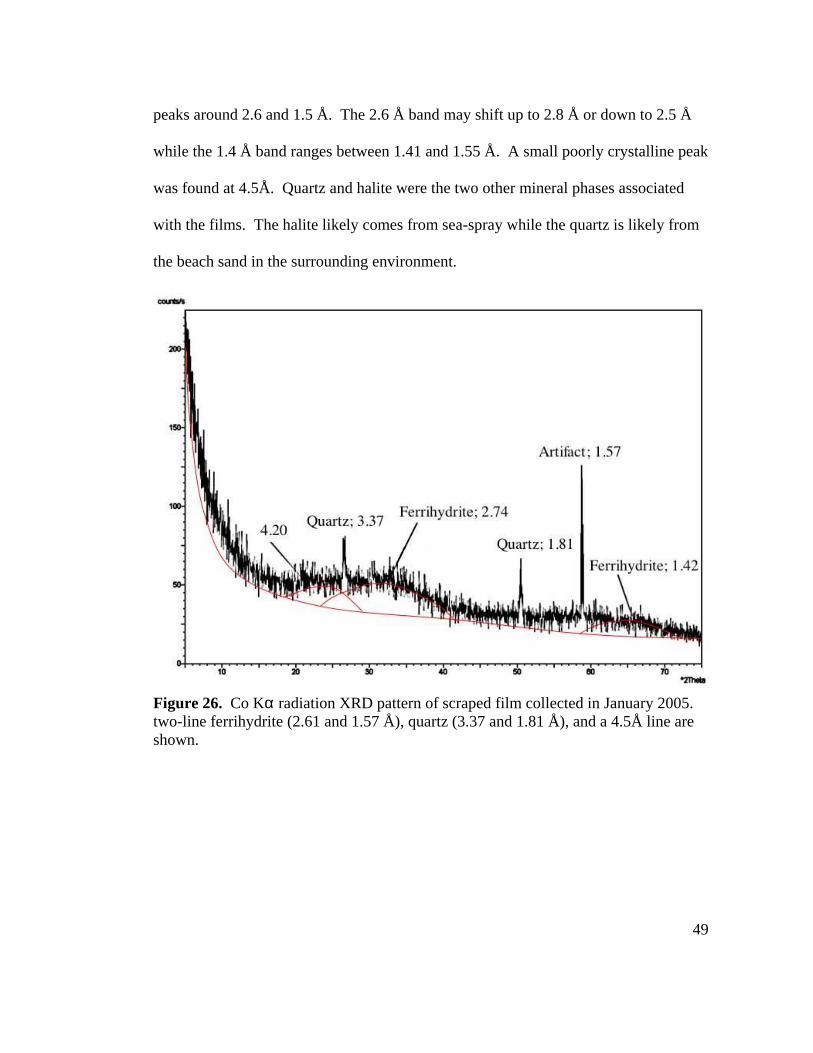
Figure 26. Co Kα radiation XRD pattern of scraped film collected in January 2005.
two-line ferrihydrite (2.61 and 1.57 Å), quartz (3.37 and 1.81 Å), and a 4.5Å line are shown..............................................................................................................49
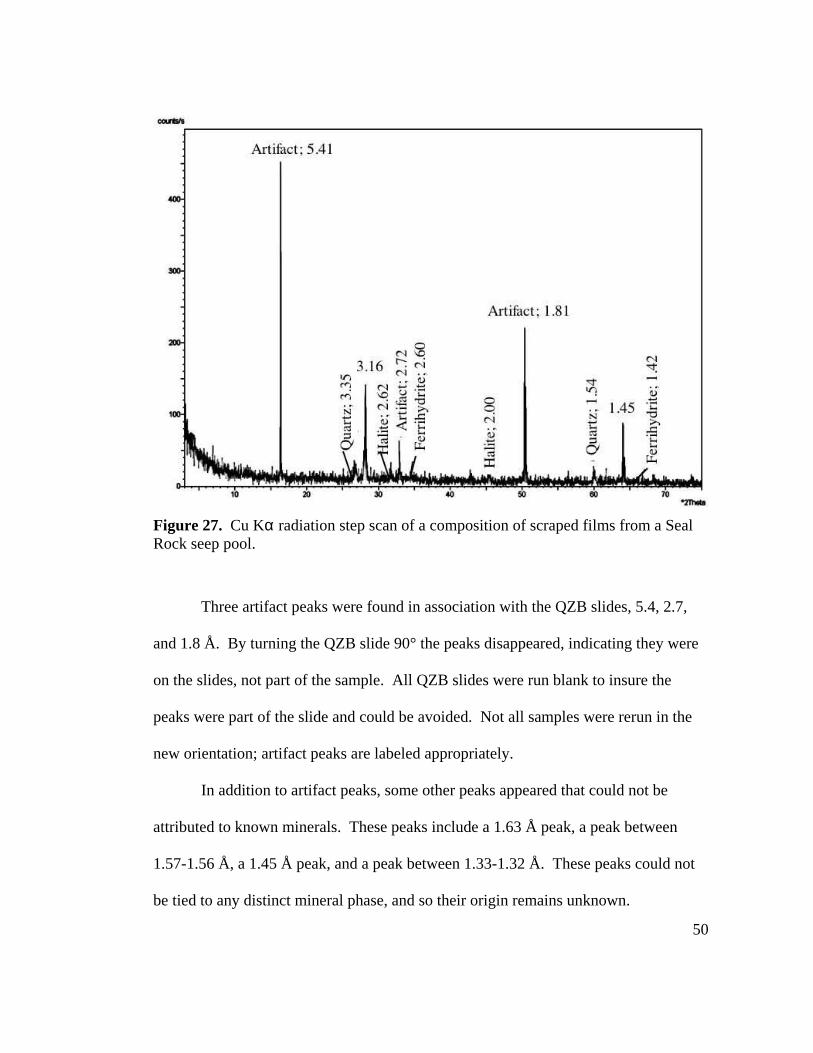
Figure 27. Cu Kα radiation step scan of a composition of scraped films from a Seal
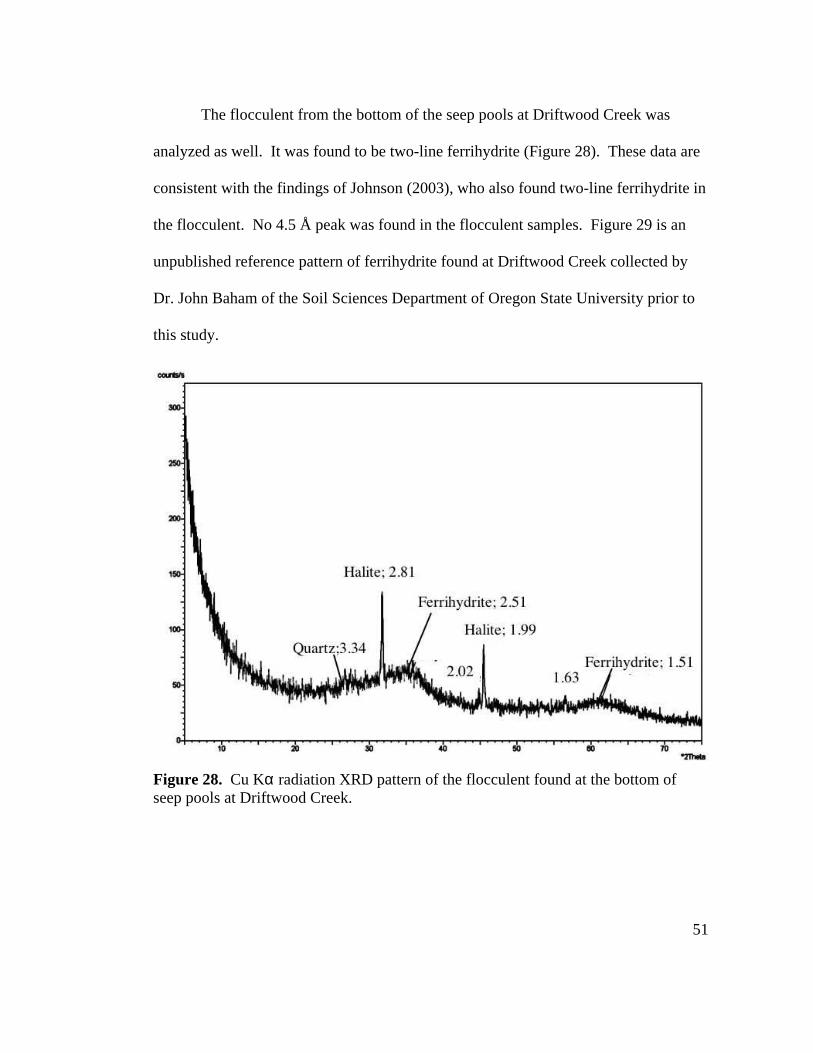
Rock seep pool. ....................................................................................................50 Figure 28. Cu Kα radiation XRD pattern of the flocculent found at the bottom of seep
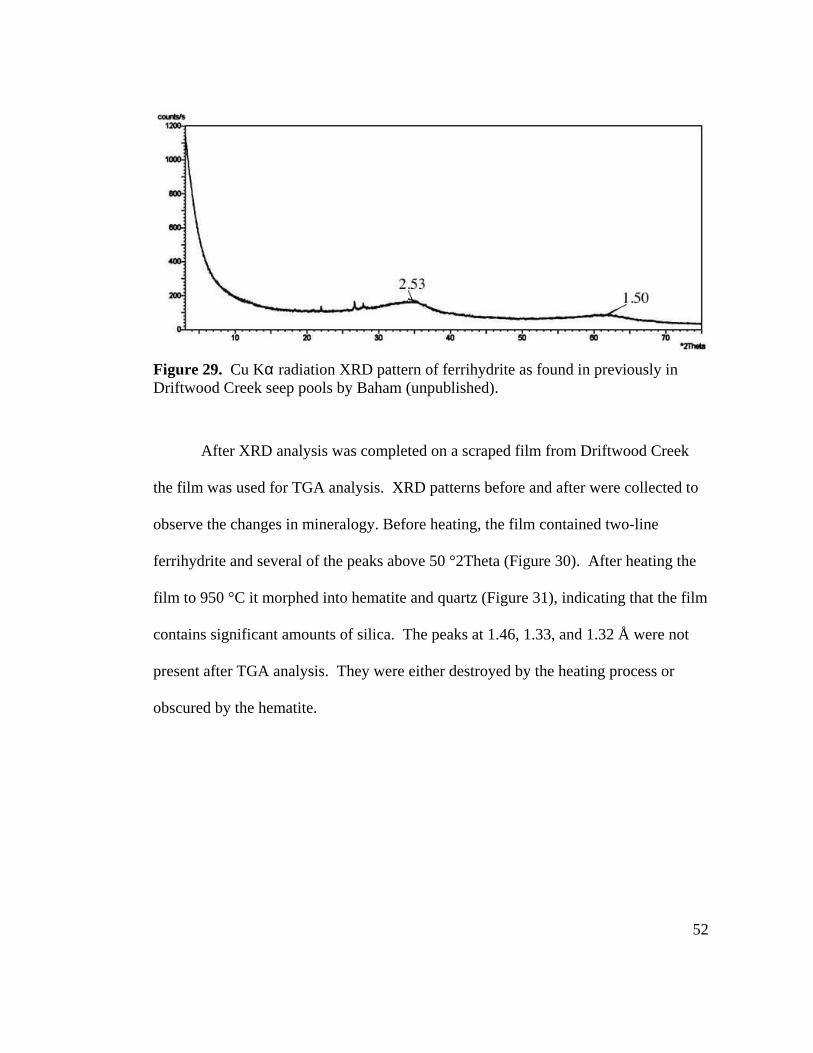
pools at Driftwood Creek. ....................................................................................51 Figure 29. Cu Kα radiation XRD pattern of ferrihydrite as found in previously in
Driftwood Creek seep pools by Baham (unpublished).........................................52 Figure 30. Cu Kα radiation XRD pattern of scraped films from Driftwood Creek seep
pool prior to TGA analysis. ..................................................................................53 Figure 31. Cu Kα radiation XRD pattern of the film after TGA analysis. .................53 Figure 32. Groundwater movement at Driftwood Creek.............................................59 Figure 33. Results of TGA performed on several compiled films from Driftwood
Creek.....................................................................................................................61 Figure 34. FTIR Transmission spectra of Sample 2. Bulk OH deformities are seen in
the 500 – 650 cm-1 range while bulk OH stretches are between 3200 and 3500 cm-1. The band between 910 – 1000 cm-1 is similar to ferrihydrite and silica. Carbon and/or carbonate are shown with the two bands 1300 – 1400 cm-1 and 1500 – 1600 cm-1. A shoulder of unknown origins occurs in the 2500 – 3000 cm-
1 range...................................................................................................................63 Figure 35. TEM diffraction pattern of iron-bearing film showing three rings of the
film. ......................................................................................................................65 Figure 36. TEM diffraction pattern of two ring spectra on the iron-bearing film.......65
viii
Figure 37. Curve fitting graph used to determine the d-spacings of the rings of the TEM diffraction pattern. The upper frame is the curve fitting and the bottom frame is how well the points correspond to the fit...............................................66
Figure 38. Bright-field image of iron-bearing film in the TEM..................................67 Figure 39. TEM element map of the carbon on the iron-bearing film. .......................68 Figure 40. Elemental map from the TEM of the iron in the iron-bearing films..........69 Figure 41. Carbon PEELs map of iron-bearing film. Peaks that are not part of the
carbon coating (graphite) or the amorphous carbon gird are marked (C). ...........70 Figure 42. Iron PEELs map of iron-bearing film. .......................................................70 Figure 43. Oxygen PEELs map of iron-bearing film. .................................................71 Figure 44. Silica PEELs map of the iron-bearing film. No silica was found in this part
of the sample.........................................................................................................71 Figure 45. X-ray diffraction patterns of ferrihydrite with various compositions of
x = Si/(Si+Fe) under a Cu Kα source (Seehra et al., 2004, used with permission)...............................................................................................................................74
Figure 46. Cycle of formation of Schwimmeisen: initial oxidation creates the film, as
oxidation continues bacteria appear, when the film is fully oxidized it falls, with the attached bacteria, to the bottom of the pool as ferrihydrite flocculent. The mixed-valent Schwimmeisen remains on the surface. .........................................81
1
INTRODUCTION
Along the Oregon Coast groundwater redistributes iron oxides in the
Pleistocene and Holocene sand dunes (Peterson and Hart, 2003). Iron-bearing films
form on the surface of ephemeral pools created where Fe(II) rich groundwater exits
the dunes. Iridescent and oily in appearance these films break into platelets when
physically disturbed. The sandy bottom of these pools is covered in iron particles,
called flocculent, as well as organic debris such as leaves and sticks. Johnson (2003)
identified two-line-ferrihydrite in a flocculent below the films; however the chemical
and mineralogical composition of the film itself was not characterized.
Soluble iron is abundant in some coastal dune systems. In such systems
coastal groundwater often has iron levels above 0.3 ppm, requiring treatment to
prevent damage to infrastructures (Frank, 1970). Such levels have been found in Coos
Bay, Oregon (Magartitz and Luzier, 1985), Long Beach, Washington (Thomas, 1995),
and South Wales, Australia (Acworth et al., 1998). Coastal groundwater systems with
high iron content feed oceanic ecosystems. Iron regulates biomass and structure
growth and thus may act as a limiting nutrient in some marine systems (Johnson et al.,
2002).
Despite the importance of iron in coastal dune systems little information is
available regarding its diagenesis. Emerson and Weiss (2004) characterize a microbial
iron cycle, while Loeppert and Inskeep (1996) summarize the principle forms of iron
in the soil. To better constrain the methods of formation, new forms of iron must be
characterized. Two-line ferrihydrite is widespread and forms in a variety of
2
environmental settings, some better known than others. Previous studies have
identified ferrihydrite in naturally occurring environments including river systems in
Canada (Konhauser and Ferris, 1997), ferri-ferrous streams in Germany (Schwertmann
and Friedl,1998), in biofilms in Japan (Tazaki et. al, 2002), and in groundwater
outwash in Iceland and New Zealand (Cornell and Schwertmann, 2003). Further
characterization of ferrihydrite formation will help to better understand the diagenetic
origins of the mineral. Locally, studies of the Pleistocene and Holocene sand dunes
along the central Oregon coast indicate that the iron oxides that are present as
intergrain cements are primarily hematite, two-line ferrihydrite, and goethite (Grathoff
et al., 2003). This study characterizes the surficial iron in the groundwater of the
central coastal system of Oregon (Figure 1).
3
Figure 1. Location of sand dune sheets along the Oregon coast (Peterson et al., 2005). This study concentrates on the Newport dune sheet, outlined in bold.
In this thesis the characteristic morphology, mineralogy, and chemistry of the
iron-bearing surface films in coastal dune seeps are presented. Specific seeps were
selected based upon the characteristic red-orange two-line ferrihydrite precipitation in
pools at the base of sea cliffs. The films were sampled by several methods designed to
minimize physical or chemical disturbances. Samples were analyzed by x-ray

4
diffraction (XRD), scanning electron microscopy (SEM), high-resolution transmission
electron microscopy (HRTEM), thermogravimetric analysis (TGA), Fourier transfer
infrared (FTIR) spectroscopy, and optical microscopy. Results from these analyses
are used to identify the mineral and elemental composition of the surface films.
Additional observations distinguish between abiotic and biotic origins of the film.
Water analysis, using ion chromatography (IC), and ion-coupled plasma atomic
emission spectra (ICP-AES), determined the chemical environment of the films.
Future work is suggested related to film formation, composition and associated
environmental conditions.
5
BACKGROUND
There are two states of iron, reduced and oxidized. The oxidized, or ferric,
state (Fe3+) is soluble in the very low or very high pH ranges and therefore precipitates
in the circumneutral region (Cornell and Schwertmann, 2003). Iron transport through
groundwater and soils occurs dominantly in the more soluble reduced, or ferrous, state
(Fe2+). Cornell and Schwertmann (2003) include iron oxides, iron hydroxides, and
oxi-hydroxides in their definition of iron oxides, which will be used in this thesis.
Iron in most minerals that make up the iron oxides is ferric, but some ferrous forms,
such as Fe(OH)2 occur. Some oxides include both ferric and ferrous iron, such as
green rusts.
Visually, iron oxides often appear red-orange, or rusty. They may also be grey
or blue-green in reducing conditions. In the laboratory, spectroscopy or diffractometry
are common methods of characterization, as each oxide has distinctive characteristics
that are discerned by these methods (Cornell and Schwertmann, 2003).
Cornell and Schwertmann (2003) identify sixteen iron oxides, including
hematite, goethite, two-line and six-line ferrihydrite, lepidocrocite, magnetite, wüstite,
Fe(OH)2, and green rust. Oxides form under specfic conditions that include pH,
temperature, redox characteristics of nearby water, and other minerals present.
Goethite (α-FeOOH), hematite (α-Fe2O3), and ferrihydrite (Fe5HO8.4H20) are the
most common iron oxides formed and are expected to form in environmental
conditions similar to those in the coastal Oregon dune.
6
Iron Oxides in Surface Environments
Grathoff et al. (2003) identified ferrihydrite, hematite, and goethite in soil
samples from the Oregon Coast. Ferrihydrite is the initial oxide to precipitate from
reduced waters and over time it transforms into a more stable oxide such as goethite or
hematite (Cornell and Schwertmann, 2003). This process is played out in the sand
dunes along the Oregon Coast.
Iron on the Oregon Coast comes from the soil profiles of the weathered
Pleistocene and Holocene dunes. Johnson (2003) suggested that iron is released as
Fe2+ from weathering pyroxene in the B horizon, the origin of which is likely nearby
volcanics. Fe2+ released from pyroxene weathering oxidizes into meta-stable
ferrihydrite in soils or remains dissolved in the groundwater. In the soil profile soluble
Fe2+ percolates downward to the C horizon where it oxidizes to goethite. Where the
groundwater is discharged from the dunes the Fe2+ oxides as two-line ferrihydrite.
The characteristic red-orange staining is observed where the iron has precipitated as an
oxide.
Ferrihydrite is a poorly ordered iron oxide commonly divided into two crystal
order extremes, two-line and six-line (Cornell and Schwertmann, 2003). The two
crystal forms are based on the number of diffraction lines found in XRD patterns.
Cornell and Schwertmann (2003) describe the shift from six-line to two-line as a
decrease in crystallinity due to the faster rate of Fe3+ hydrolysis or as the Fe2+
oxidation is hindered by the presence of silicate or soil organic matter. Once formed,
six-line ferrihydrite does not change to two-line, and vice versa.
7
Ferrihydrite can form biotically or abiotically. Abiotically, ferrihydrite forms
directly from rapidly hydrolysed Fe3+ iron solutions or as a result of oxidation of Fe2+
solutions. Overtime it changes into goethite; a more stable crystalline iron oxide
(Cornell and Schwertmann, 2003). Biotically, bacteria precipitate iron in the form of
ferrihydrite (Banfield and Zhang, 2001). The oxidation of iron provides these bacteria
with energy. Johnson (2003) identified iron oxidizing–like organisms in the seep
pools containing the films at Driftwood Creek.
Films and Biofilms
Microbiology plays an important role in natural systems. Some bacteria use
sunlight as energy and are often the base of food chains. Other energy sources,
besides sunlight, are available to bacteria, including metal ions that can be oxidized or
reduced, depending on favorable conditions (Nagai et al., 2001). The presence of
bacteria may be apparent in biofilms in the environment. Sheehan et al. (2005) define
biofilms as a sticky coating formed by bacteria, as well as fungi, algae, protozoa,
debris, and corrosion products that form on any moist surface. Biofilms may also be
termed mats if they are thick, layered microbial communities.
Naturally occurring films may be described as forming biotically (Tazaki et al.,
2002 and Nagai et al., 2001) or abiotically (Schwertmann and Friedl, 1998). Abiotic
formation includes oxidation into a precipitate. Biotically, films are created from
bacteria that use nutrients in the water to create colonies, which often lead to mats, or
biofilms. Leptothrix sp. and Gallionella sp. are two common iron oxidizing bacteria
8
species that live in circumneutral waters (Banfield and Navrotsky, 2001) similar to
those found along the Oregon coast.
Iron-bearing films are not exclusively found in the coastal system.
Schwertmann and Friedl (1998) described thin rusty films on the surface of pebbles
submerged in ferriferous streams. The pebbles were of many different lithologies, so
the origin of the film could not be linked to one type of rock. Mössbauer analysis of
the films scraped off of several pebbles established the presence of goethite and
ferrihydrite.
Tazaki et al. (2002) described the biomineral structures formed by Leptothrix
sp. and Gallionella sp. biofilms. These iron biominerals include goethite, ferrihydrite,
schwertmannite and amorphous iron hydroxides. The films formed within a few hours
and changes in the films were observed for up to two months. The resulting films,
made up of microorganisms and the adhered iron oxide were up to 10 nm thick.
Ferrihydrite was identified as the initial mineralization product. Two months into the
study the films were found to be composed of goethite.
Biofilms are particularly of interest to environmental geology because some
bacteria, such as Scenedesmus panonicus and Pseudomonas aeruginosa remove heavy
metals such as arsenic, chromium, and lead from contaminated water systems (Nagai
et al. 2001). In a study by Nagai et al. (2001) the effects of arsenic and iron
precipitating bacteria were observed in biomats about 10 cm thick. They found
bacillus type bacteria about 1.0 µm in size as well as hydrous iron oxides. With the
iron or heavy mineral trapped in the cell wall of the bacteria it will not travel further in
9
solution and contaminate other sources. The biofilms or the sediment containing the
bacteria may then be removed or capped to protect from future contamination by the
heavy metals.
Konhauser and Ferris (1997) identified films formed by iron-oxidizing bacteria
in tropical rivers in Brazil and temperate rivers in Ontario, Canada as well as metal
contaminated lake sediments in Ontario. In a study involving groundwater treatment
systems Tinholt and Wendling (1997) indicate that the environment of groundwater
treatment systems in British Columbia, Canada, promotes oxidation of dissolved iron
and the growth of iron oxidizing bacteria due to the elevated dissolved iron levels
present.
This study examined the possible role bacteria might play in the formation of
the films. To incorporate both biotic or abiotic formation the films discussed in this
study were termed iron-bearing films. Specific biotic or abiotic processes of iron-
bearing film formation are identified as such where needed.
Geologic Setting
Sand dune sheets between 1 and 6 km wide and 30 to 100 km long (Cooper,
1959; Peterson et al., 2005) are extensive along the west coast (Figure 1). Peterson et
al. (2005) determined that the dune deposits were emplaced during the Pleistocene and
Holocene epochs. The Pleistocene dunes likely migrated onshore from continental
shelf sand that was exposed to eolian processes during lower sea-level stands. The
Holocene dunes are derived from beach sand transported shoreward during the last
10
transgression (Peterson et al., 2005). Weathering by soil and groundwater has
redistributed iron, aluminum, and silica within the dunes (Grathoff et al., 2001).
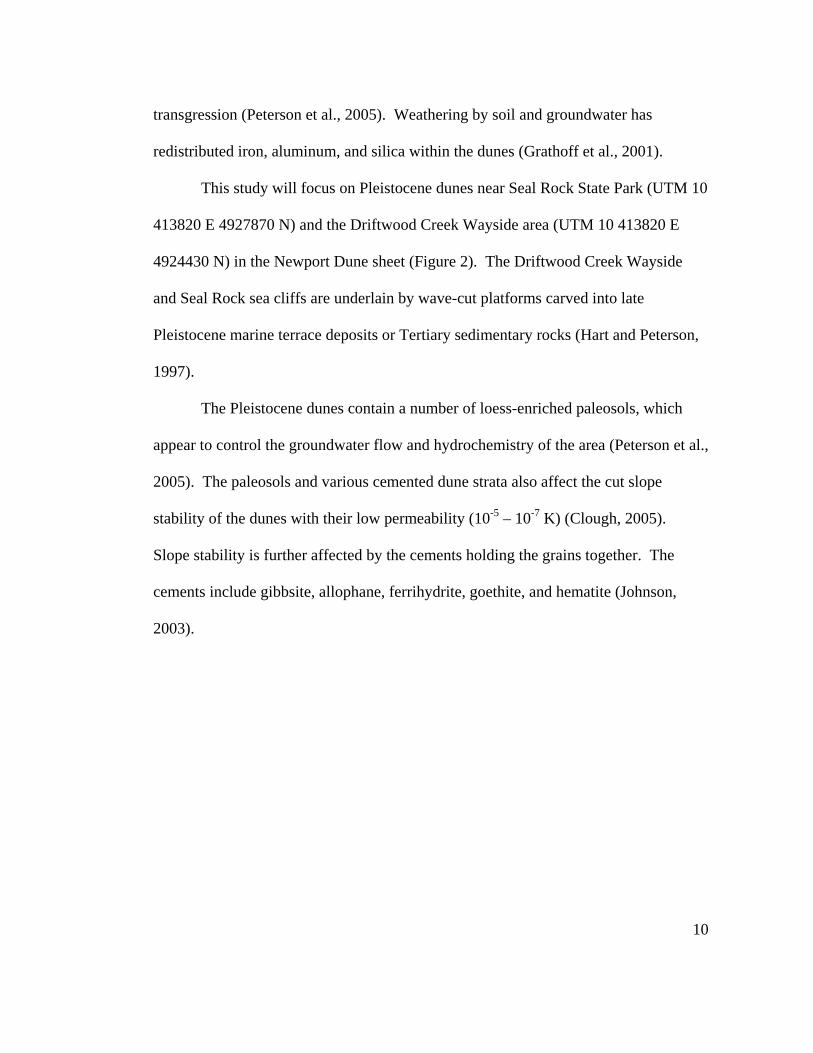
This study will focus on Pleistocene dunes near Seal Rock State Park (UTM 10
413820 E 4927870 N) and the Driftwood Creek Wayside area (UTM 10 413820 E
4924430 N) in the Newport Dune sheet (Figure 2). The Driftwood Creek Wayside
and Seal Rock sea cliffs are underlain by wave-cut platforms carved into late
Pleistocene marine terrace deposits or Tertiary sedimentary rocks (Hart and Peterson,
1997).
The Pleistocene dunes contain a number of loess-enriched paleosols, which
appear to control the groundwater flow and hydrochemistry of the area (Peterson et al.,
2005). The paleosols and various cemented dune strata also affect the cut slope
stability of the dunes with their low permeability (10-5 – 10-7 K) (Clough, 2005).
Slope stability is further affected by the cements holding the grains together. The
cements include gibbsite, allophane, ferrihydrite, goethite, and hematite (Johnson,
2003).
11
Figure 2. Geology of the Newport Dune Sheet. Samples were collected from Seal Rock and Driftwood Creek (Peterson, et al., 2005).
SEAL ROCK
DRIFTWOOD CREEK
12
Well logs inland of Seal Rock and the area above Driftwood Creek State Park,
in proximity to the study sites indicate that the local geology is predominantly sandy
material, with evidence of interbedded gravel and clay (Oregon Water Resources
Department, 2005). Aquifers at both locations are unconfined. Groundwater levels
inland of Seal Rock range between 2.4 and 16.8 m below ground surface. At the Seal
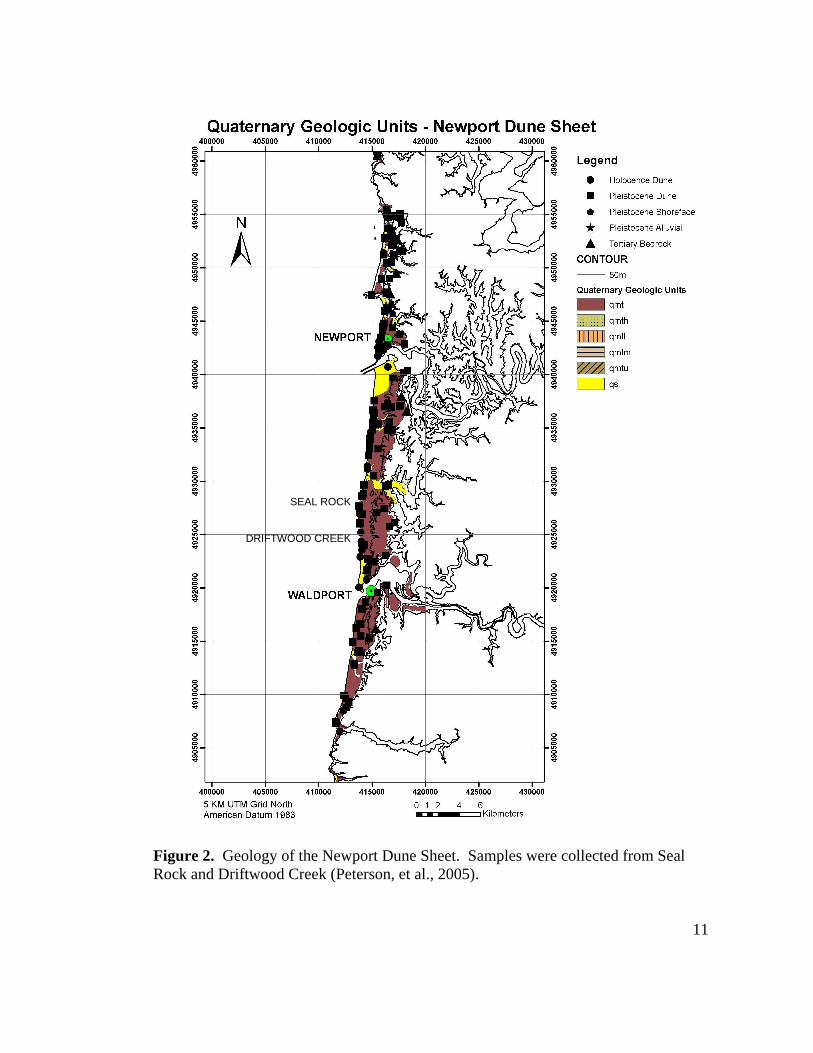
Rock site the groundwater is observed to seep out onto the beach where the permeable
Pleistocene dunes overlie the less permeable Yaquina Formation (Figure 3). Inland of
the Driftwood Creek site the groundwater levels vary from 2.1 m to as deep as 27.4 m
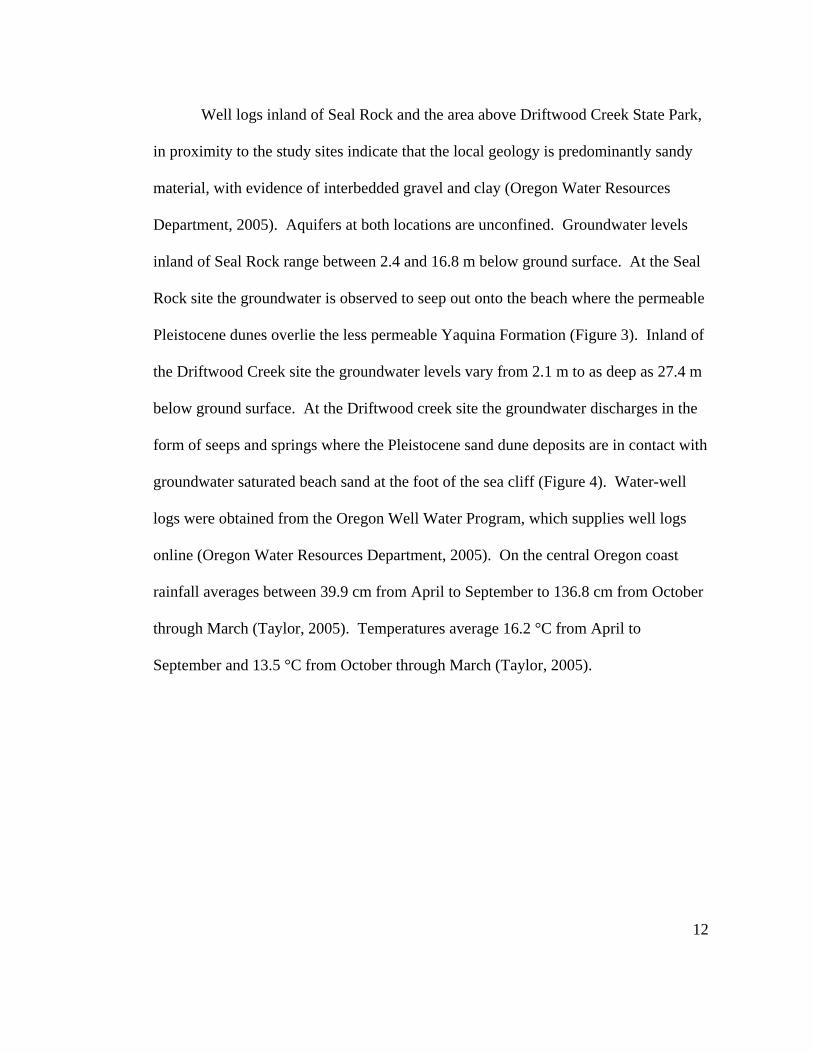
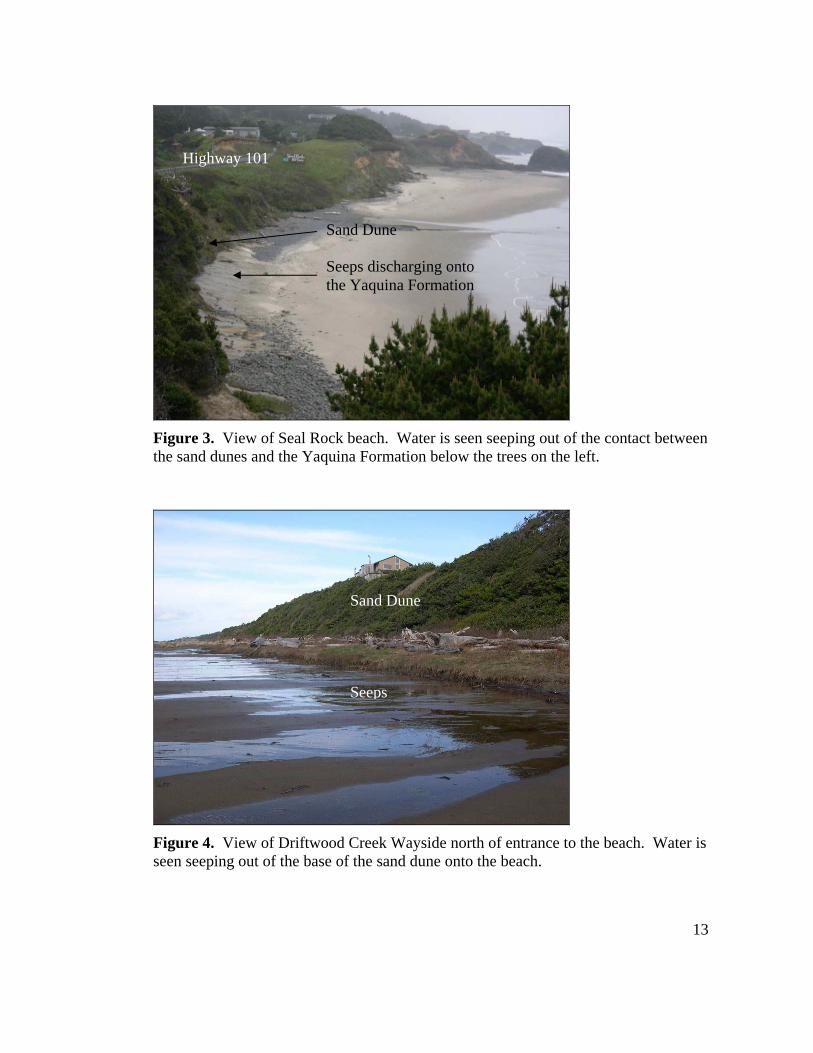
below ground surface. At the Driftwood creek site the groundwater discharges in the
form of seeps and springs where the Pleistocene sand dune deposits are in contact with
groundwater saturated beach sand at the foot of the sea cliff (Figure 4). Water-well
logs were obtained from the Oregon Well Water Program, which supplies well logs
online (Oregon Water Resources Department, 2005). On the central Oregon coast
rainfall averages between 39.9 cm from April to September to 136.8 cm from October
through March (Taylor, 2005). Temperatures average 16.2 °C from April to
September and 13.5 °C from October through March (Taylor, 2005).
13
Figure 3. View of Seal Rock beach. Water is seen seeping out of the contact between the sand dunes and the Yaquina Formation below the trees on the left.
Figure 4. View of Driftwood Creek Wayside north of entrance to the beach. Water is seen seeping out of the base of the sand dune onto the beach.
Sand Dune Seeps discharging onto the Yaquina Formation
Sand Dune Seeps
Highway 101
14
Many coastal aquifers have high concentrations of dissolved iron and other
nutrients, such as nitrogen and phosphorus (Thomas, 1995; Campbell and Bate, 1998).
Reducing and oxidizing conditions influence the total iron concentrations detected in
the groundwater. In dunal aquifers along the Oregon coast the water rises and falls
seasonally, exacerbating the complexity of iron reduction and oxidation at different
subsurface depths. This includes iron cements (Grathoff et al., 2003) and iron-bearing
films on seeps below the dunes.
Groundwater conditions throughout the Oregon coastal dunes are similar. The
average concentration of total soluble iron in the Coos Bay dune aquifer is 2.5 ppm
with a pH range of 6.4 to 8.4 (Brown and Newcomb, 1963). In the Clatsop Beach
Plains the pH ranges from 6.2 to 8.0, with iron concentrations mostly between 1 to 10
ppm. The highest iron concentrations from wells in the Clatsop aquifer reached 53
ppm (Frank, 1970). The EPA standard for iron in domestic and public water is 0.3
ppm. Where groundwater is removed for human use such high levels of iron may be
problematic. Reducing conditions in an aquifer increase the dissolved iron, leading to
diminished drinking water quality (Frank, 1970). Excessive iron in well water can
form iron precipitates in pipes, filters, and appliances (Cornell and Schwertmann,
2003).
In Washington, similar groundwater conditions are also found. Iron in the
Long Beach Peninsula in Washington ranges from 0.004 to 37 ppm, where the higher
concentrations of iron, as well as nitrogen and phosphorus, corresponded to overlaying
soils that were rich in organic matter (Thomas, 1995). Objectionable levels of iron,
15
relating to drinking water standards, were found by Slaughter (1962) in Pleistocene
dune aquifers in Delaware and Maryland.
In waters with a pH of 6 or less and an Eh of less than 200 mV Fe2+ is the
dominant form of soluble iron. Fe3+ dominates in waters with Eh values greater than
200 mV. Goethite and ferrihydrite start to form when the pH and Eh increase (Skinner
and Fitzpatrick, 1992). Detailed groundwater analyses have been performed for the
seeps and dune aquifer sources discussed in this study. Those analyses are in
preparation by John Baham and Nick Chambers, in the Soil Sciences Department of
Oregon State University, Corvallis, Oregon.
16
SITE DESCRIPTION
Driftwood Creek Wayside
Driftwood Creek Wayside is located at UTM 10 413820 E 4924430 N, at a
distance of 28.8 km south of Newport, Oregon. The parking lot is on the west side of
Highway 101 with an entrance to the beach to the north. Continuing north on the
beach for several hundred meters, across Fox Creek, the seeps are visible. Iron
staining is common, as well as iron-bearing films. Samples were collected in the
seeps just north of Fox Creek and several hundred meters further north of the creek
where they exit the Pleistocene dune sea cliff. These sites are located directly west of
Orcas Road.
Driftwood Creek Wayside contains a Holocene dune cap overlying Pleistocene
deposits (Figure 5). Houses have been built at the top of the dunes with vegetation
growing down the dune slope (Figure 4). Water flows out from these dunes and seeps
onto the beach, observed flows may be as high as several liters per minute. The pH of
the water ranges from 5.4 and 6.7, with higher iron concentrations corresponding with
higher pH. Where seep pools are present, iron may be observed in several forms: as
red-orange staining on the sand, as orange-brown flocculent in slowly flowing pools,
or as iridescent iron-bearing films formed on the surface of non-flowing water. No
iron was visually apparent in the more rapidly discharging seeps. During the summer
the films occur about 100 m from the ocean. During the winter the beach erodes and
low tides may be 50 m away. High tides during the winter occasionally wash over the
seeps.
17
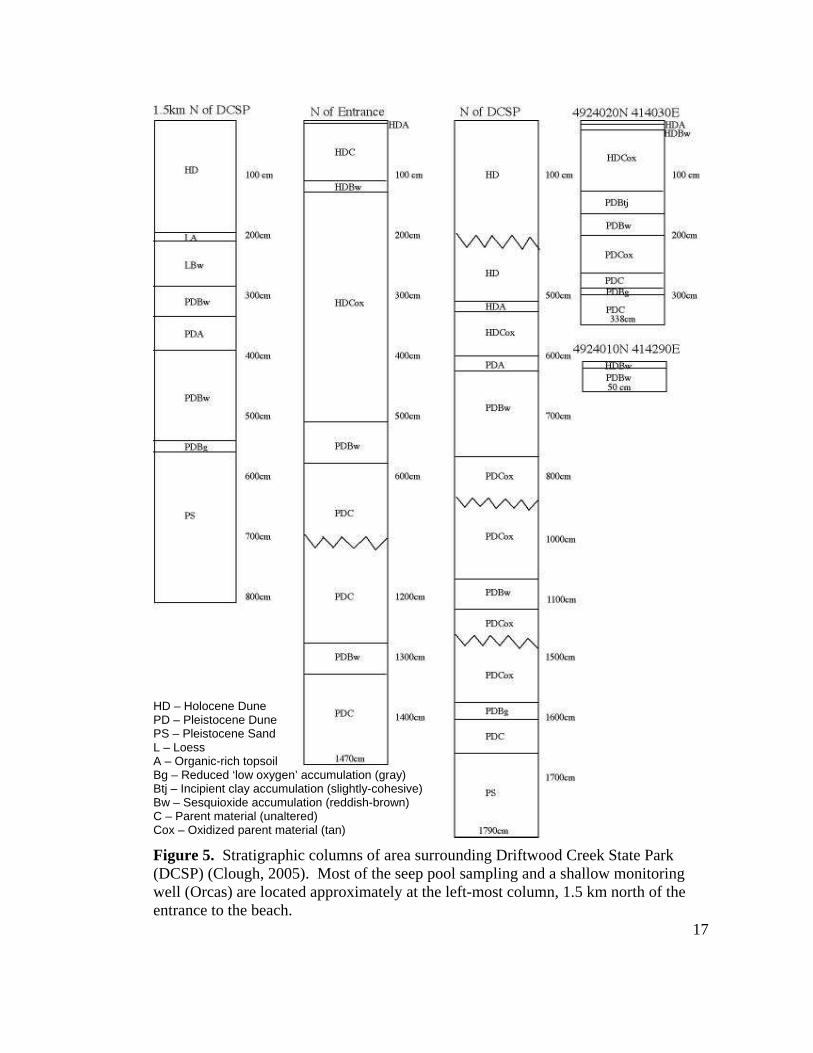
Figure 5. Stratigraphic columns of area surrounding Driftwood Creek State Park (DCSP) (Clough, 2005). Most of the seep pool sampling and a shallow monitoring well (Orcas) are located approximately at the left-most column, 1.5 km north of the entrance to the beach.
HD – Holocene Dune PD – Pleistocene Dune PS – Pleistocene Sand L – Loess A – Organic-rich topsoil Bg – Reduced ‘low oxygen’ accumulation (gray) Btj – Incipient clay accumulation (slightly-cohesive) Bw – Sesquioxide accumulation (reddish-brown) C – Parent material (unaltered) Cox – Oxidized parent material (tan)
18
Seal Rock
Seal Rock is located at UTM 10 413820 E 4927870 N, a distance of 25.6 km
from Newport, Oregon. The parking lot is on the west side of Highway. 101. Trails
down to the beach are located to the southwest of the parking lot. Seeps may be seen
along the Pleistocene dune sea cliff that makes up the east side of the beach several
hundred meters to the south. Samples were collected from these seeps and iron-
bearing films were seen at the more southern seeps.
Pleistocene dune deposits at Seal Rock State Park overlie a Miocene basalt sill
that has intruded into the westerly dipping Yaquina Formation (Gamer, 1974) (Figure
6). Highway 101 runs directly behind the park. Groundwater exits the sea cliff at the
base of the dune deposits, which are in contact with the bedrock wave-cut platform
(Figure 7). While the base of the dunes is generally damp, several outlet streams are
present. Films are found in the pools and side channels of these outlets. No seeps
were observed to exit the dunes at this location with a flow greater than 1 L/min. The
films at this location occur about 20 m from the ocean during summer and low winter
tides. High winter tides may come up to the seeps. Seal Rock gets its name from a
basalt dike located just offshore. This feature creates larger waves and more sea spray
than at Driftwood Creek.
19
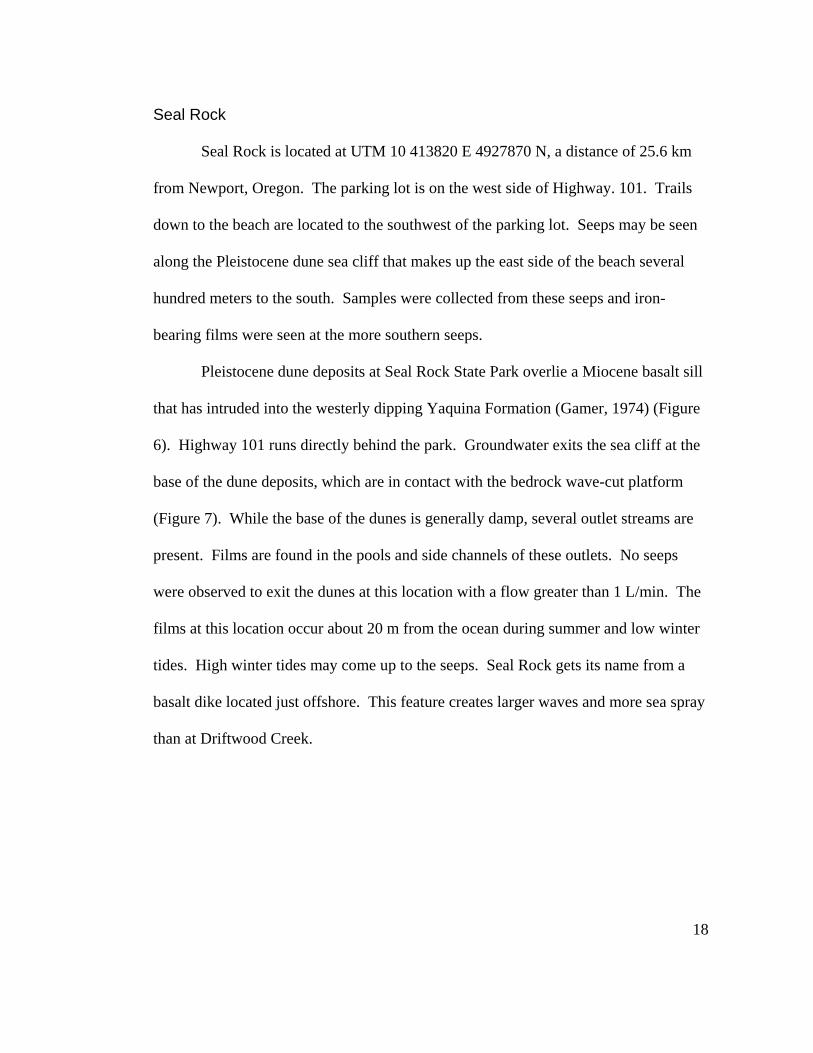
Figure 6. Stratigraphic column of the area surrounding Seal Rock State Park (Clough, 2005).
HD – Holocene Dune PD – Pleistocene Dune PS – Pleistocene Beach Shoreface L – Loess T – Tertiary PP – Pleistocene Peat M –Basal Congomerate W – Wave-cut Platform A – Organic-rich topsoil Bg – Reduced ‘low oxygen’ accumulation (gray) Btj – Incipient clay accumulation (slightly-cohesive) Bw – Sesquioxide accumulation (reddish-brown) C – Parent material (unaltered) Cox – Oxidized parent material (tan)
20
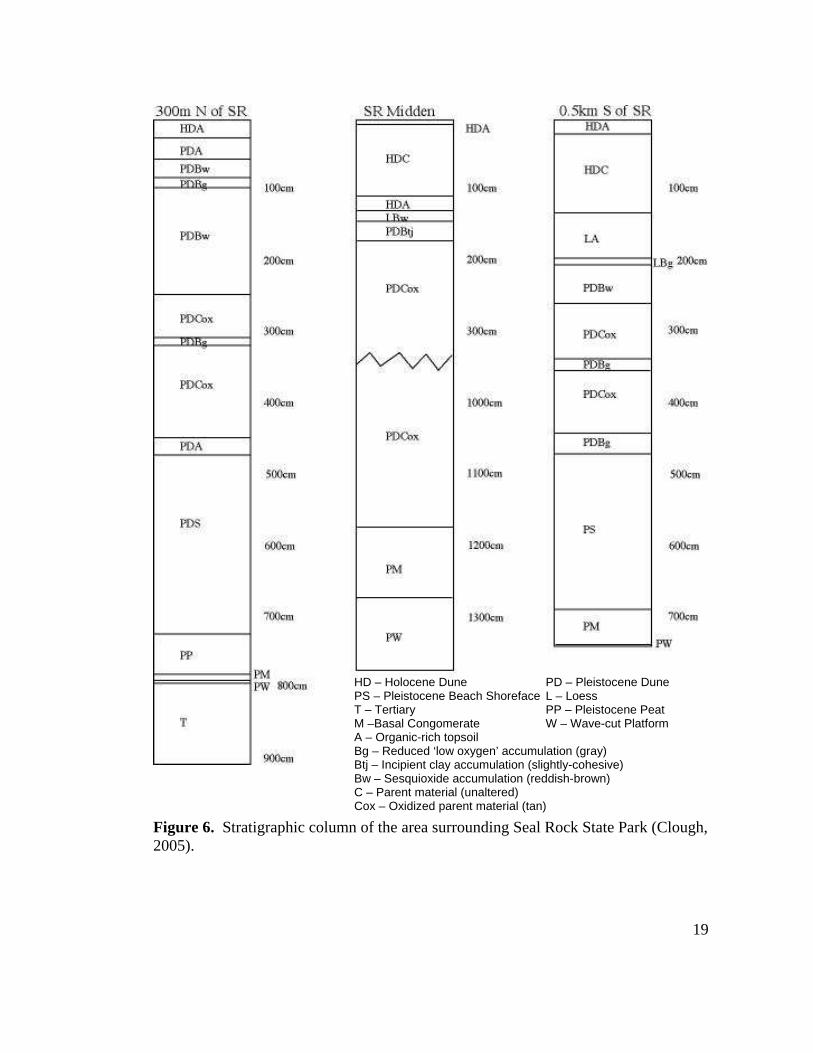
Figure 7. The point of the arrow is on the wave cut platform where seeps appear at Seal Rock State Park. Samples were collected at the seep directly east of the end of the arrow.
The amount of visible iron present at Seal Rock is less than at Driftwood
Creek. There is little orange-brown flocculent to be found in the seep streamlets,
although the discharge area is of similar length to that of Driftwood Creek and red-
orange staining is present in places. Some small biomasses may be seen in small
pools where films are not found, these are green-brown and stringy in appearance,
more like algae than the flocculent associated with the iron-bearing films.
Seeps staining the wave-cut platform
21
FIELD METHODS
Film samples from the surface seeps were collected on various types of
substrates, including glass slides, ZnSe slides, plastic slides and carbon stubs.
Flocculent from the bottom of the pools was also collected. Sample sites and
conditions were logged in a notebook. Water samples were collected at Driftwood
Creek. Due to the low water discharge at Seal Rock, water samples were not collected
from that site.
Samples were collected similarly, despite collection on different substrates and
for different analytical methods. Substrates included carbon stubs, or a glass, ZnSe or
plastic slides. Iron-bearing films were collected by placing a substrate on the surface
of a film-coated pool, the film would adhere onto the substrate with little disturbance
to its form. To prevent further oxidation glass slides were placed in a centrifuge tube
and capped. However, if left in the open air the film would slowly turn from a clear
iridescent to the reddish-brown commonly seen in oxidized iron. The ZnSe slides
were put into argon atmosphere tubes created out of PVC pipe for Fourier transfer
infrared (FTIR) analysis (Figure 8). This insured the least amount of oxidation and
disturbance to the film for this sensitive analysis. For scanning election microscope
(SEM) analysis the carbon stubs were dipped in the film and put in an open-air
traveling container for transport back to the laboratory (Figure 9).

22
Figure 8. Sample holder for FTIR samples. Argon is pumped through the tube on the right and the sample is inserted by unscrewing the left end.
Figure 9. Carbon stubs with film in the transport container.
Film collection on TEM grids varied slightly between samples. Using an
eyelash probe (Figure 10) in the seep pool a small amount of film was gently guided
23
toward the grid. The grid, held by tweezers, was first cleaned with acetone and
allowed to dry. The grid was then placed in the water next to the desired film sample
and the eyelash probe was used to push the film toward the grid, which was at the
same time moving toward the film. Once the film was over the grid both were
removed from the water. Filter paper was used to wick the excess water off the
backside of the grid. The grid was then air dried for 5 to 10 minutes to remove any
water trapped between the tweezer’s blades. Finally, the grid was then returned to the
open-air box for transport back to the laboratory.
Figure 10. Tools for TEM collection (from left to right) eyelash probe, tweezers, TEM copper grids.
Water samples at Drift Creek were collected for anion and cation analysis. A
portable probe was used to determine the in situ pH, as well as conductivity, water
temperature, redox values, and the total dissolved solids (TDS). Water was collected
with a 0.45 µm pore size Whatman Syringe Filters. Additonally, cation sample bottles

24
had been acidified with 5 mL of NO3 to 120 or 180 mL of sample water collected in
the field. Estimates of the dissolved Fe2+ and oxygen were taken during some
sampling trips using CHEMets Tests.
25
LABORATORY METHODS
X-ray Diffraction
Mineral identification was performed using a Theta-Theta Philips PW3040 X-
Ray Diffractometer with an Energy Dispersive Peltier Cooled Kevex detector.
Operating conditions were at 40 kV and 30 mA with step sizes between 0.02 and
0.025 °2θ, count times of 0.6 seconds were used for continuous scans while 1, 3 or 25
second count times were used for step scans. All scans were run from 3 or 5°2θ to 75
or 100°2θ. The film was analyzed on quartz zero background (QZB) slides, which
was then compared to the substrate without the film. Samples were analyzed with
both a Cu and a Co tube.
XRD analysis also included powder of the scraped iron-bearing films on a
quartz zero background slide. The film was scraped off the initial collection glass
slide with a razorblade and analyzed on the zero background sample holder by top
packing the film into a 0.2 mm deep cavity with a diameter of 10 mm. Random
powder analysis was also performed on the flocculent (Moore and Renyolds, 1997).
Scanning Electron Microscopy
Three sample collection and mounting protocols were used to prepare the
samples for analysis by scanning electron microscope (SEM). The first method
involved a piece of glass cover slip that was coated with film and adhered to a carbon
or aluminum stub using carbon tape. The second method involved transferring the
iron-bearing film directly onto the carbon stub in the field. In the third method, the
26
films were transferred in the field onto plastic cut from a clean piece of plastic and
then adhered to the aluminum stub with carbon tape.
The glass slide contained too much silica to constrain the major constituents
while the carbon stub was contaminated with iron during coating from the sample
holder, again hindering the proportions of major constituents of the film. The plastic
slide was thought to be a good compromise, but it also contains silica. Blank slides
were analyzed for comparison to sample loaded slides to establish background
compositions.
All film samples were coated with carbon using a Gatan Precession Etching
Coating System Model 682. Samples were analyzed using a Joel 35C Scanning
Electron Microscope at 15 kV accelerating voltage. The machine was equipped with a
Kevex X-ray detector for use in Energy Dispersive X-Ray Spectroscopy (EDS).
Samples collected on the plastic slides were used for quantitative EDS analysis to
determine relative amounts of silica and iron with a dead time of 30%. The film was
tilted to 45° in preparation for EDS analysis and for a better look at the sample film
thickness.
One sample collected on a glass cover slip was coated with gold-palladium in
preparation for high resolution SEM (HRSEM) EDS. The sample was analyzed on a
FEI Sirion Field Emission Scanning Electron Microscope equipped with an Oxford
Inca Energy 250 EDS system at 5 kV.
27
High Resolution Transmission Electron Microscopy
Films were colleted on carbon coated 300 mesh copper TEM grids with an
eyelash probe. Samples were coated with a thin layer of carbon in a Gatan Precession
Etching Coasting System Model 682. Samples were analyzed using a FEI Tecnai
G2F20 HRTEM with a voltage of 200 keV for crystallographic analysis. Parallel
Electron Energy Loss (PEELs) analysis was used on several locations on the film to
determine the different compositions of the film. Dr. Rick Hugo of Portland State
University performed the analysis.
Thermogravimetric Analysis
The powder from XRD analysis was loaded into a Perkin Elmer TGA7
Thermogravimetric Analyzer (TGA). A sample of 3 mg was heated from 50º C to
950º C with a heating rate of 10º C/min. The sample almost filled the analysis dish.
The resulting weight percent loss was compared to the temperature to reinforce
conclusions on the chemical makeup of the films.
Optical Microscopy
The morphology of the films, the water, and the seep bottom flocculent were
examined using a Leica DMRX microscope with a Apogee KX2D Camera. Phase
imagery was used on all samples to view the film and water, as well as to compare
morphology to the images collected under dark-field. Bacteria are not easily seen
under phase conditions without staining. Therefore dark-field imagery was used in
28
visual characterization of the bacteria present. All methods mentioned thus far were
analyzed at Portland State University.
Ion Chromatography
Anions were analyzed at Portland State University using a Dionex 2500 Ion
Chromatography (IC) system with autosampler consisting of a GP50 gradient pump
with an IonPac AS-14A column, a LC25 chromatography oven, and CD25
conductivity detector. Carbonate eluent with election suppression with a 1mL/min
flow rate was used. Samples were analyzed for total soluble F-, Cl-, NO3-, PO4
3-, and
SO42-. Analysis of additional samples, collected in early 2005, were performed by
Nick Chambers, Soil Science Department, Oregon State University.
Inductively Coupled Plasma-Atomic Emission Spectrometry
Total dissolved aluminum, calcium, iron, magnesium, potassium, silicon, and
sodium were measured for the water samples on a Varian Liberty 150 Inductively
Coupled Plasma-Atomic Emission Spectrometer (ICP-AES) run with a V-groove
nebulizer and a Varian SPS5 autosampler system. Table 1 shows the wavelengths
under which the samples were analyzed. Samples were analyzed by Nick Chambers
of the Soil Science Department of Oregon State University.
Table 1. Wavelength parameters for AES analysis.
Al Ca Fe Mg K Si Na Wavelength (nm) 394.4 422.7 259.9 280.3 766.5 251.6 589.6
29
Colorimetric Determination of Ferrous and Ferric Iron
Samples of the film were collected on Pall Gelman glass fiber filters. Each
filter was wiped across the film about four times to cover the filter paper completely.
The glass filters were then placed in a glass vial filled with 22 mL of 0.1M HCl.
Sample blanks were collected by placing filters from the package that had not been
dipped in film into the sample bottles.
Samples were stored in the dark until analyses were preformed. The
concentration of Fe(II) in the acid solution was measured colorimetrically using a
variation of the 1, 10-phenanthroline method (Loeppert and Inskeep, 1996) at 510 nm.
After reducing all of the soluble iron to Fe2+ with hydroxylamine hydrochloride
samples were measured again to determine the total iron. The difference between the
total iron and the ferrous iron gave the amount of ferric iron. All reactions were
conducted in an 8 mL ramin electronic pipette test tube to insure the same
concentrations. Analysis was done at Oregon State University by John Baham and
Nick Chambers of the Soil Science department.
Fourier Transfer Infrared Spectroscopy
Infrared spectra from the films were collected using a Bruker IFS66/S Fourier
Transform Infrared Spectrometer (FTIR) utilizing a Michelson interferometer and
equipped with an infrared microscope. The spectrometer and microscope were purged
with nitrogen gas to diminish strong absorbencies due to atmospheric carbon dioxide
30
and water vapor. Spectra were collected at 4 cm-1 spectral resolution over the
frequency range of 4600 to 400 cm-1, using a DTGS detector, a KBr beamsplitter, a
mid-infrared Globar source. Spectra were obtained from 128 co-added scans acquired
from double-sided/forward-backward mirror motion and with a mirror velocity of 10
kHz. Spectra were acquired while using a 16 kHz low pass filter to prevent aliasing,
using a zero filling factor of 2 and Norton Beer medium apodization, and 16 cm-1
phase resolution and Mertz phase correction.
Spectra were collected using conventional transmission measurements of the
ZnSe supported film in the sample compartment of the bench. Spectra were also
collected in transmission and reflectance modes using the infrared microscope, also
with the film on the window. A fourth set of spectra were collected using a grazing
angle (85°) specular reflectance accessory.
Samples were analyzed by FTIR on ZnSe slides at Pacific Norwthest National
Laboratories in Richland, Washington by Dr. Paul Gassman. Samples were analyzed
under the conditions in which they were received.
31
RESULTS
Iron-bearing film samples were collected from Seal Rock and Driftwood Creek
between 1/20/04 and 3/21/05 (Table 2). At Seal Rock film samples were taken from
the only seep that typically produced film. There was not enough water discharged to
collect water samples. Samples from Driftwood Creek include both film and water
samples. Sampling environments at Driftwood Creek included one seep pool that
remained full, a small stream mouth that disappeared after winter storms reworked the
beach, and several seeps that could be found for about a month at a time before they
dried up or moved. A shallow groundwater well at Driftwood Creek, installed for a
parallel study, was used to compare groundwater to surface water conditions. The pH
at Driftwood Creek ranged between 4.8 and 6.7 in the seeps and 5.4 and 5.8 in the
well.
Analytical results for Driftwood Creek include XRD, SEM, FTIR, optical
microscopy, IC, and ICP-AES. Due to the lower concentration of films at Seal Rock
only XRD and SEM analyses were performed. Types of sampling and the dates they
were collected are shown in Table 2.
32
Table 2. Dates that field sampling took place and the samples that were collected from both Driftwood Creek and Seal Rock.
Sample Type Collected Date
Sample Location Glass Slide QZB Slide FTIR Water SEM TEM Flocculent
1/20/04Driftwood X Seal Rock
5/8/04Driftwood X X Seal Rock 7/31/04Driftwood X X X
Seal Rock X 8/31/04Driftwood X
Seal Rock X 9/25/04Driftwood X X
Seal Rock X 10/13/04Driftwood X X Seal Rock 11/10/04Driftwood X X X Seal Rock X X 11/17/04Driftwood X X X Seal Rock
1/8/05Driftwood X X Seal Rock
2/5/05Driftwood X X X Seal Rock 3/21/05Driftwood X
Seal Rock
Field Observations
The films appear in the quiescent areas near seeps and streams discharging
from the sand dunes (Figure 11). The film appears to be oily and iridescent on the
surface of the seeps (Figure 12). When conditions are calm layers of film build up,
changing the appearance from translucent to more opaque. In Figure 13, taken on
September 25, 2004, after approximately a week without rain, both the thick and thin
layers of the film may be seen. Disturbances break the film up into small platelets
33
(Figure 14). Bugs and dust have been observed to sit on the film without disturbing it,
indicating that the surface tension is at least as high as that of water. The film often
starts growing around plants, as the stalks often help slow the water enough for the
film to form.
Figure 11. Seep area of Driftwood Creek that shows the three environments (1) the flowing water, (2) the red-orange flocculent, and (3) the irridescent iron-bearing film.
(1)
(2)
(3)
34
Figure 12. Oily appearance of the iron-bearing film at Driftwood Creek.
Figure 13. Layers of iron bearing film seen in September 2004 at Driftwood Creek after ideal conditions persisted for at least a week. The film, which may be seen growing around the plants, is thick in some areas and thin in others.
Thick Film Thin Film
35
Figure 14. Iron-bearing film forming on the backwater of a seep at Driftwood Creek. The platy nature of the film is apparent in this picture.
Films naturally form rapidly, within a few minutes in the absence of strong
winds and rain, which disturb the water surface enough that the film does not form.
After a few minutes of calm conditions the film begins to reform. The formation rate
of the films was tested by digging a hole in the sand down to the water table near a
pool that contained film. Within 5 minutes film formation began in the test hole.
Optical Microscopy
For optical microscopy analysis three types of samples were collected 1) the
film dried on a glass slide, 2) the film and some water from the surface of the pool and
3) the flocculent from the bottom of the pool (see Methods). All samples were
examined to determine if any bacteria were present in the film or the near surface
water.
Plate-like breaking habit

36
The film on the glass slide was collected on QZB1 from November 10, 2004
from Driftwood Creek by dipping the slide onto the film and allowing the removed
section to dry. Under the optical microscope, using phase conditions, the film was
transparent light brown to iridescent in color, appearing very jagged and shard-like
(Figure 15). The shards are lath or octahedral shaped and roughly 100 µm long.
Figure 15. QZB1 at 10x under phase conditions. This is the dried film with its shard like brown-iridescent appearance. Parts of the film are orange-brown where the film appears be altering into flocculent.
Parts of the film are a brown-orange material, similar to the flocculent found at
the bottom of the pools. This material is thick enough to be opaque in the
concentrated centers and translucent on the wispy edges. It is most commonly found
connected to the film. Figure 16 shows one location on QZB1, (A) is a dark-field
400 µm
37
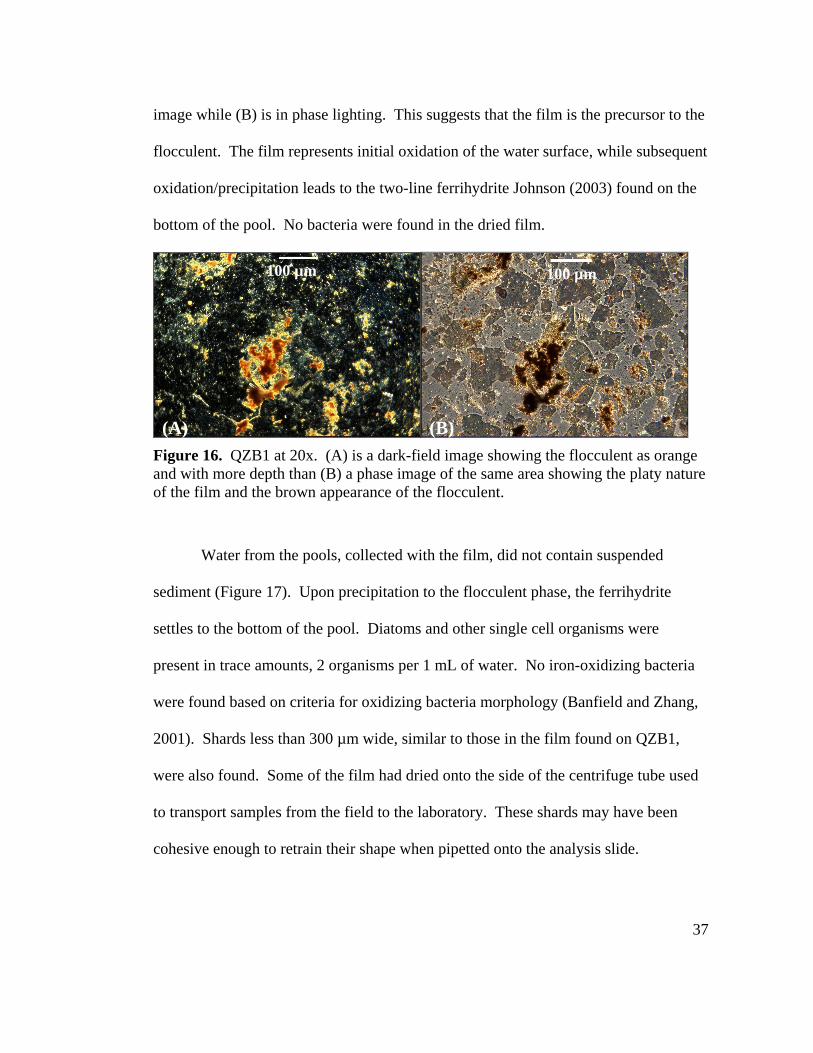
image while (B) is in phase lighting. This suggests that the film is the precursor to the
flocculent. The film represents initial oxidation of the water surface, while subsequent
oxidation/precipitation leads to the two-line ferrihydrite Johnson (2003) found on the
bottom of the pool. No bacteria were found in the dried film.
Figure 16. QZB1 at 20x. (A) is a dark-field image showing the flocculent as orange and with more depth than (B) a phase image of the same area showing the platy nature of the film and the brown appearance of the flocculent.
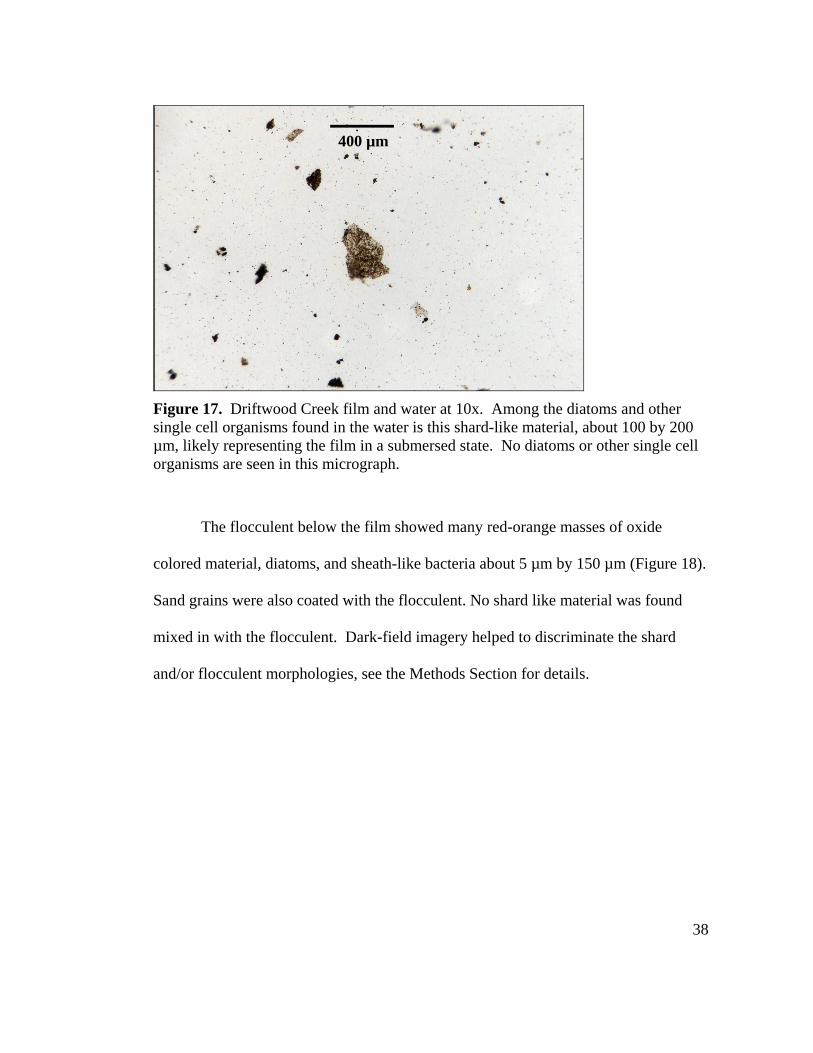
Water from the pools, collected with the film, did not contain suspended
sediment (Figure 17). Upon precipitation to the flocculent phase, the ferrihydrite
settles to the bottom of the pool. Diatoms and other single cell organisms were
present in trace amounts, 2 organisms per 1 mL of water. No iron-oxidizing bacteria
were found based on criteria for oxidizing bacteria morphology (Banfield and Zhang,
2001). Shards less than 300 µm wide, similar to those in the film found on QZB1,
were also found. Some of the film had dried onto the side of the centrifuge tube used
to transport samples from the field to the laboratory. These shards may have been
cohesive enough to retrain their shape when pipetted onto the analysis slide.
100 µm 100 µm
(A) (B)
38
Figure 17. Driftwood Creek film and water at 10x. Among the diatoms and other single cell organisms found in the water is this shard-like material, about 100 by 200 µm, likely representing the film in a submersed state. No diatoms or other single cell organisms are seen in this micrograph.
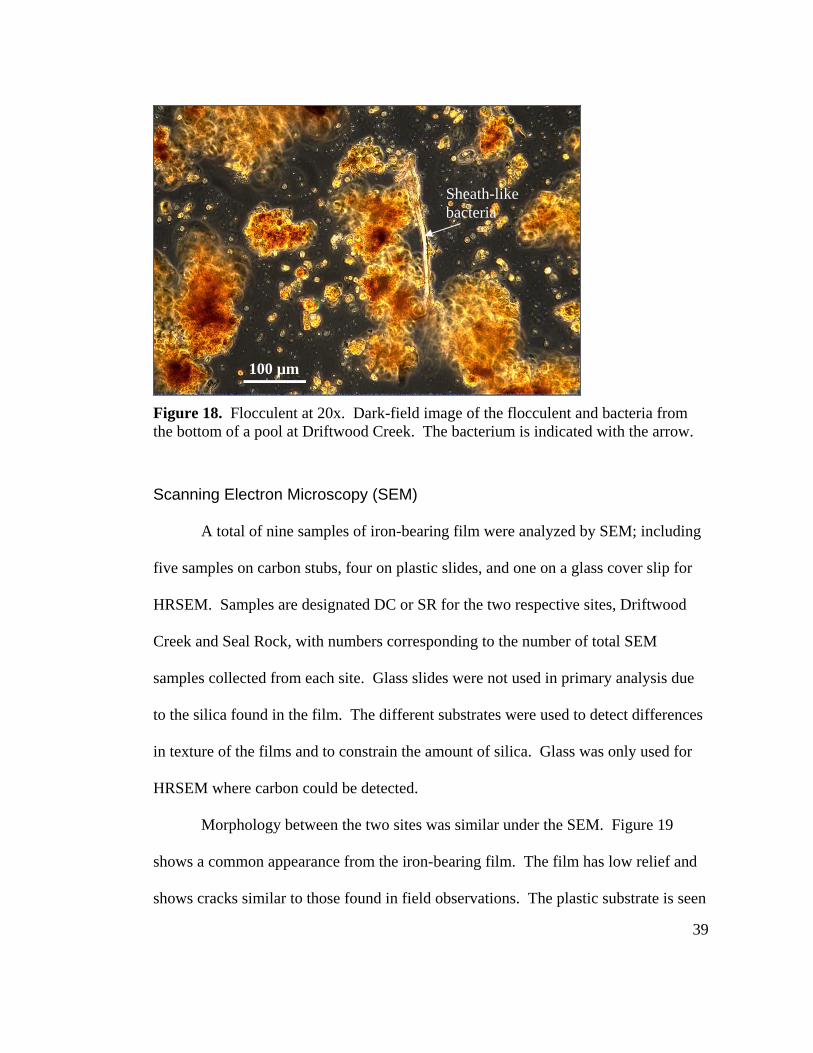
The flocculent below the film showed many red-orange masses of oxide
colored material, diatoms, and sheath-like bacteria about 5 µm by 150 µm (Figure 18).
Sand grains were also coated with the flocculent. No shard like material was found
mixed in with the flocculent. Dark-field imagery helped to discriminate the shard
and/or flocculent morphologies, see the Methods Section for details.
400 µm
39
Figure 18. Flocculent at 20x. Dark-field image of the flocculent and bacteria from the bottom of a pool at Driftwood Creek. The bacterium is indicated with the arrow.
Scanning Electron Microscopy (SEM)
A total of nine samples of iron-bearing film were analyzed by SEM; including
five samples on carbon stubs, four on plastic slides, and one on a glass cover slip for
HRSEM. Samples are designated DC or SR for the two respective sites, Driftwood
Creek and Seal Rock, with numbers corresponding to the number of total SEM
samples collected from each site. Glass slides were not used in primary analysis due
to the silica found in the film. The different substrates were used to detect differences
in texture of the films and to constrain the amount of silica. Glass was only used for
HRSEM where carbon could be detected.
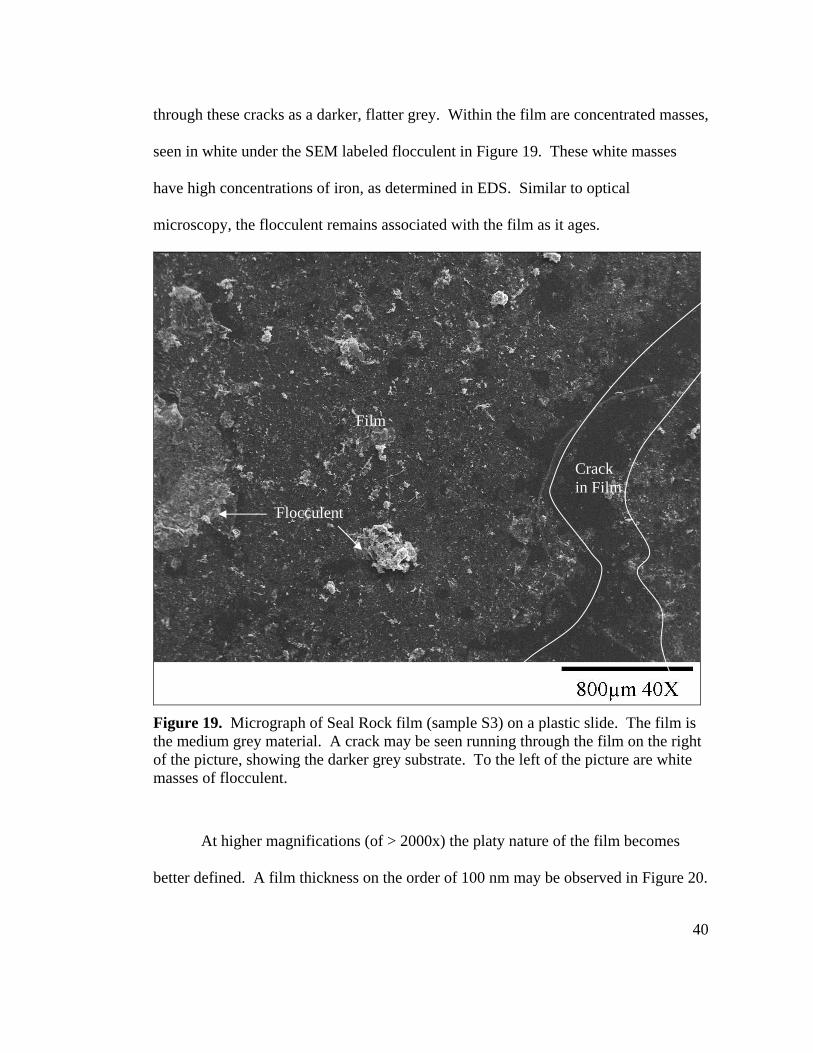
Morphology between the two sites was similar under the SEM. Figure 19
shows a common appearance from the iron-bearing film. The film has low relief and
shows cracks similar to those found in field observations. The plastic substrate is seen
100 µm
Sheath-like bacteria
40
through these cracks as a darker, flatter grey. Within the film are concentrated masses,
seen in white under the SEM labeled flocculent in Figure 19. These white masses
have high concentrations of iron, as determined in EDS. Similar to optical
microscopy, the flocculent remains associated with the film as it ages.
Figure 19. Micrograph of Seal Rock film (sample S3) on a plastic slide. The film is the medium grey material. A crack may be seen running through the film on the right of the picture, showing the darker grey substrate. To the left of the picture are white masses of flocculent.
At higher magnifications (of > 2000x) the platy nature of the film becomes
better defined. A film thickness on the order of 100 nm may be observed in Figure 20.
Crack in Film
Film Flocculent
41
The stringy nature of the flocculent and a potential sheath-like structure is also
apparent in Figure 20. It is unclear if this is truly an iron-oxidizing bacterium or not
(see later HRSEM micrographs of the sheath-like structures in the HRSEM section).
Figure 20. High magnification micrograph of sample D3 showing cracked morphology of the film and stringy morphology of the flocculent.
EDS quantitative elemental analysis showed that the film and flocculent are
made of iron and silica. The iron to silcia atomic ratio is about 3:1. At Seal Rock, in
addition to silica and iron, chlorine and sodium were also major constituents.
However, no cubic halite crystals were found on the film and there is not substantial
Sheath-like feature
Flocculent
42
sodium or chlorine in the substrates, indicating that these must be distributed
throughout the film, likely on the surface due to sea spray. An example of an EDS
spectrum is shown in Figure 21. Table 3 shows the atomic percent of the major
elements in the film as determined by the quantitative EDS, including that of sample
D4 Mar Film 2, shown in Figure 21. Locations of EDS spectra are in Appendix A.
Figure 21. EDS spectra of sample D4 Mar Film 2 on the film with a dead time of 30%.
3878- 2908- 1933- 968-
0.00 2.56 5.12 7.68 10.24 12.80 15.36
Si
Fe
Fe Cl
Co
un
ts
X-Ray Energy (KeV)
43
Table 3. Quantitative SEM EDX atomic percent of elemental constituents of samples. All samples are on plastic slides and blank plastic values are included below the sample values.
Element (at. %) Sample Name Fe Si Cl Na Mg Al Fe:Si Ratio
S3 Film 1 26.57 23.62 13.63 15.97 9.85 7.41 1.12 S3 Mar Film 2 37.39 24.67 13.28 9.29 4.93 4.60 1.52 S3 White 1 41.41 21.18 11.53 7.97 5.09 3.22 1.96 S3 Blank (hole) 27.77 18.63 11.17 14.59 7.21 5.42 1.49 S4 Film 1 39.27 26.57 5.66 10.05 8.30 7.89 1.48 S4 Mar Film 2 35.39 15.79 10.94 18.55 5.23 5.49 2.24 S4 White 1 42.61 28.05 7.33 8.84 6.14 5.63 1.52 S4 Mar White 2 66.86 22.6 0.73 2.52 2.62 1.30 2.96 S4 Blank (hole) 3.57 34.82 0.02 4.04 21.58 2.42 0.10 D3 Film 1 50 19.19 1.73 5.58 7.75 10.38 2.61 D3 Mar Film 2 49.7 18.68 1.55 3.75 8.42 13.43 2.66 D3 White 1 49.04 15.57 1.41 6.32 6.84 10.06 3.15 D3 Mar White 2 49.87 23.54 1.79 0.87 6.23 12.69 2.12 D3 Blank (hole) 35.69 23.21 1.31 7.33 4.18 15.37 1.54 D4 Film 1 50.74 18.25 1.71 3.92 5.21 9.75 2.78 D4 Mar Film 2 72.49 11.27 0.73 2.52 5.03 7.28 6.43 D4 White 1 57.23 13.5 2.17 4.02 5.18 8.20 4.24 D4 Mar White 2 61.92 14.68 0.49 4.29 7.58 10.29 4.22 D4 Blank (hole) 3.1 31.33 0.24 3.51 20.80 24.44 0.10 Blank Plastic 1 0.99 33.11 0.06 12.57 19.00 22.71 0.03 Blank Plastic 2 0.98 33.66 0.00 11.91 18.34 22.52 0.03 Blank Plastic 3 1.16 33.31 0.08 12.02 18.35 22.64 0.03 Blank Plastic 4 0.65 34.92 0.44 12.52 18.25 22.41 0.02 S3 and S4 are samples three and four, respectively, from Seal Rock D3 and D4 are samples three and four, respectively, from Driftwood Creek Film indicates location on the film White indicates location on a white flocculent mass Mar indicates samples analyzed in March at different sites within the slide
44
The background level of the silica in the blank plastic slides is high. These
levels are not thought to corrupt the data due to cross analysis of carbon stubs. Carbon
stubs were analyzed as well as the plastic slides. These stubs were contaminated with
iron during coating, so their iron levels were unusable. The silica data were not
influenced, and the levels are similar to what is seen in the samples on the plastic
slides (Table 4). Table 3 and Table 4 should not be compared in anything other than
silica levels due to the iron contamination.
Table 4. SEM-EDX atomic percent of elemental constituents of samples collected on carbon stubs.
Element (at. %) Sample Name Fe Si Cl Na Mg Al
SR Carbon Film 28.18 23.01 12.45 7.88 6.89 10.29 SR Carbon White 34.16 30.92 11.94 10.14 2.06 2.97 DC Carbon Film 67.92 26.32 0.31 ND 2.43 2.89 DC Carbon White 56.04 25.35 0.46 ND 1.39 4.03 SR is a sample from Seal Rock DC is a sample from Driftwood Creek Film indicates location on the film White indicates location on a while flocculent mass ND = Not Determined
High Resolution Scanning Electron Microscopy (HRSEM)
One sample from Driftwood Creek was collected on a glass cover slip, coated
with Au-Pd and analyzed in the high resolution scanning electron microscope. Under
low magnification the film morphology was similar to that of lower resolution SEM
(Figure 22). Similar cracks appear, as well as larger cracking features, which likely
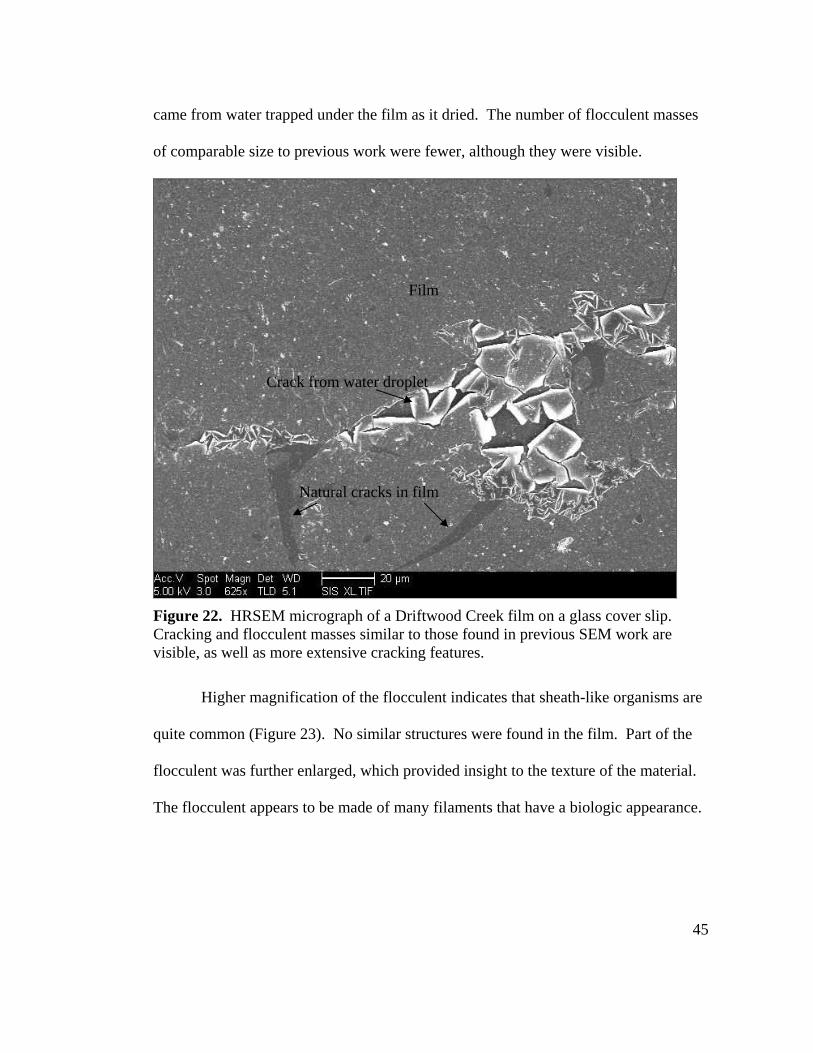
45
came from water trapped under the film as it dried. The number of flocculent masses
of comparable size to previous work were fewer, although they were visible.
Figure 22. HRSEM micrograph of a Driftwood Creek film on a glass cover slip. Cracking and flocculent masses similar to those found in previous SEM work are visible, as well as more extensive cracking features.
Higher magnification of the flocculent indicates that sheath-like organisms are
quite common (Figure 23). No similar structures were found in the film. Part of the
flocculent was further enlarged, which provided insight to the texture of the material.
The flocculent appears to be made of many filaments that have a biologic appearance.
Film Crack from water droplet
Natural cracks in film
46
Figure 23. HRSEM micrograph of the flocculent. Sheath like features are visible and higher magnification of (A) (inset B) indicates the flocculent is made up of many small filaments.
The HRSEM-EDS was used to further constrain the amount of carbon in the
film and flocculent. The sheath structures were too small to determine carbon content
without influence of the film or flocculent. Carbon is present in both film and
flocculent, although it appears to be slightly higher in the flocculent (Figure 24).
Based on visual comparisons between peak heights of carbon and oxygen the film has
a ratio of 3:14 carbon to oxygen while the flocculent has a ratio of 2:3 carbon to
oxygen. Conditions that allowed for carbon analysis could not be used to accurately
((BB)) Film Sheath
((AA))
47
detect the amount of iron in the film, so no comparison between carbon and iron, or
any other constituent, can be made from these data.
Figure 24. EDS spectra from samples analyzed with the HRSEM. (A) is the film itself, iron is the peak between oxygen and sodium. (B) is a spectrum from the flocculent.
X-ray Diffraction (XRD)
Three samples of film on QZB slides, including eight scraped samples, and
two different sediment samples from the bottom of the pools, were analyzed by XRD.
QZB1 and QZB2 are from Driftwood Creek and QZB3 is from Seal Rock. The
scraped films are labeled with the site and date they were collected (Table 2).
(A)
(B)
O Na Si C Fe
O C Fe Na Si
48
Analysis of the films collected directly on the slides were too thin to be
analyzed directly on the slide. Figure 25 shows a blank slide, scanned before the film
was dipped onto it with an overlay of the same slide dipped in the film. There is no
discernable difference between the two diffraction patterns.
Figure 25. Cu Kα radiation XRD pattern of blank quartz zero background slide (blue) overlain by the same slide dipped in film (red) collected in November 2004 at Driftwood Creek. The jump in counts on the blank slide (blue) was a glitch in the detector. Without the jump the scans would be the same, the only difference being a slight offset in counts.
The scraped films indicate similar mineralogy of the films. Figure 26 shows a
diffraction pattern of scraped film from Driftwood Creek collected in January 2005,
which can be compared to Figure 27, a composite of films from Seal Rock. Scraped
film from both sites were similar to each other, often containing two-line ferrihydrite
49
peaks around 2.6 and 1.5 Å. The 2.6 Å band may shift up to 2.8 Å or down to 2.5 Å
while the 1.4 Å band ranges between 1.41 and 1.55 Å. A small poorly crystalline peak
was found at 4.5Å. Quartz and halite were the two other mineral phases associated
with the films. The halite likely comes from sea-spray while the quartz is likely from
the beach sand in the surrounding environment.
Figure 26. Co Kα radiation XRD pattern of scraped film collected in January 2005. two-line ferrihydrite (2.61 and 1.57 Å), quartz (3.37 and 1.81 Å), and a 4.5Å line are shown.
50
Figure 27. Cu Kα radiation step scan of a composition of scraped films from a Seal Rock seep pool.
Three artifact peaks were found in association with the QZB slides, 5.4, 2.7,
and 1.8 Å. By turning the QZB slide 90° the peaks disappeared, indicating they were
on the slides, not part of the sample. All QZB slides were run blank to insure the
peaks were part of the slide and could be avoided. Not all samples were rerun in the
new orientation; artifact peaks are labeled appropriately.
In addition to artifact peaks, some other peaks appeared that could not be
attributed to known minerals. These peaks include a 1.63 Å peak, a peak between
1.57-1.56 Å, a 1.45 Å peak, and a peak between 1.33-1.32 Å. These peaks could not
be tied to any distinct mineral phase, and so their origin remains unknown.
51
The flocculent from the bottom of the seep pools at Driftwood Creek was
analyzed as well. It was found to be two-line ferrihydrite (Figure 28). These data are
consistent with the findings of Johnson (2003), who also found two-line ferrihydrite in
the flocculent. No 4.5 Å peak was found in the flocculent samples. Figure 29 is an
unpublished reference pattern of ferrihydrite found at Driftwood Creek collected by
Dr. John Baham of the Soil Sciences Department of Oregon State University prior to
this study.
Figure 28. Cu Kα radiation XRD pattern of the flocculent found at the bottom of seep pools at Driftwood Creek.
52
Figure 29. Cu Kα radiation XRD pattern of ferrihydrite as found in previously in Driftwood Creek seep pools by Baham (unpublished).
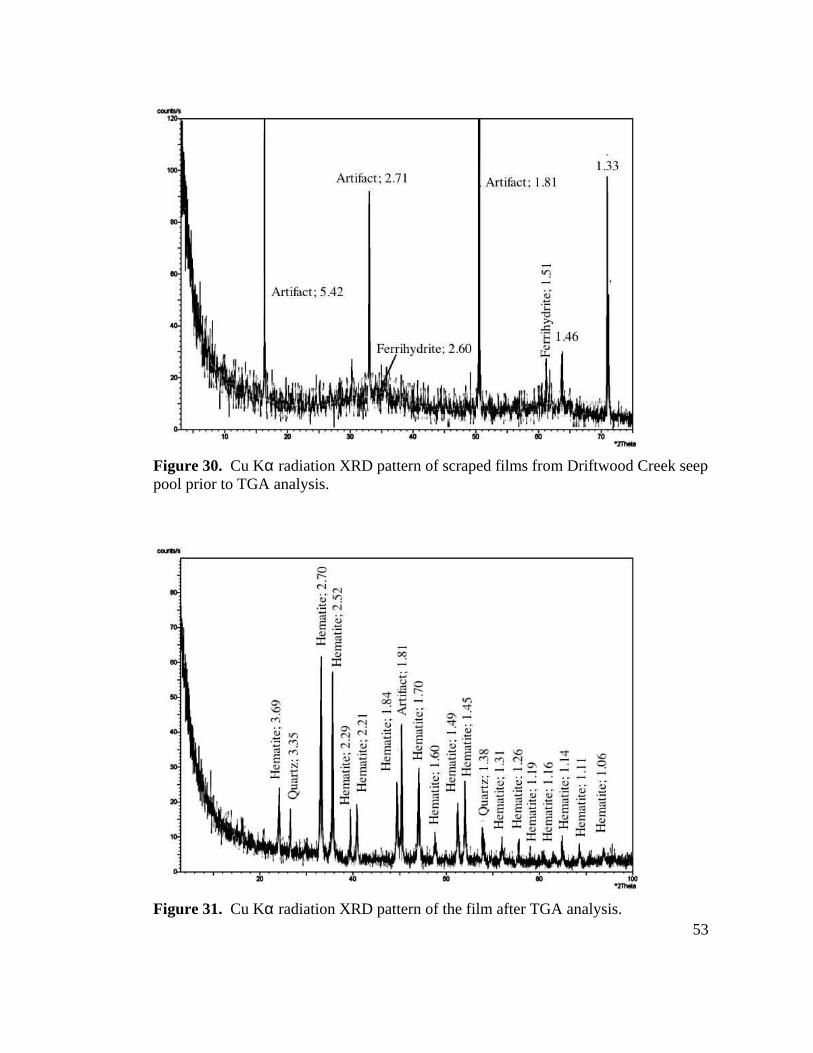
After XRD analysis was completed on a scraped film from Driftwood Creek
the film was used for TGA analysis. XRD patterns before and after were collected to
observe the changes in mineralogy. Before heating, the film contained two-line
ferrihydrite and several of the peaks above 50 °2Theta (Figure 30). After heating the
film to 950 °C it morphed into hematite and quartz (Figure 31), indicating that the film
contains significant amounts of silica. The peaks at 1.46, 1.33, and 1.32 Å were not
present after TGA analysis. They were either destroyed by the heating process or
obscured by the hematite.
53
Figure 30. Cu Kα radiation XRD pattern of scraped films from Driftwood Creek seep pool prior to TGA analysis.
Figure 31. Cu Kα radiation XRD pattern of the film after TGA analysis.
54
Water Chemistry
At Driftwood Creek a total of 14 samples were collected from a shallow well
and six seeps. One seep was sampled during each collection period, called Driftwood
Creeks Spring (DCS). Several different seep pools were analyzed, labeled SeepX,
where X is a date and number identifying when in the sequence of sampling it was
collected. Some seep pools were sampled on multiple dates, in which case the date
sampled follows the name. The Orcas well was located at the top of a small discharge
stream. The well and seep samples are separated in sampling notation by well or seep.
Samples were collected only from the well on 2/5/05, only from the seeps on 5/08/04,
8/31/04, 10/13/04, and 11/17/04, and from both the well and the seeps on 1/8/05,
1/22/05, and 2/5/05. Analytical methods included IC and ICP-AES.
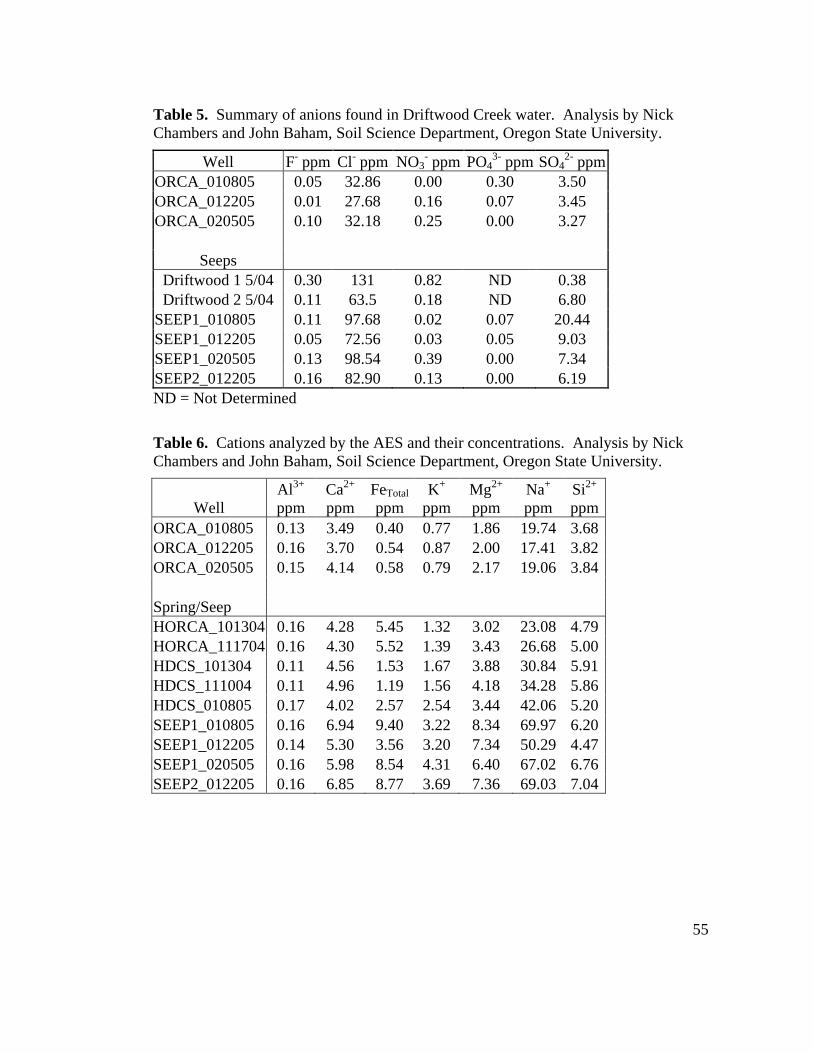
Seep chemistry was obtained to better understand the environmental conditions
under which the films form. The anion and cation concentrations are shown in Table
5 and Table 6, respectively. The pH, Eh, water temperature, total dissolved solids
(TDS), and dissolved iron and oxygen are shown in Table 7. Dissolved iron and
oxygen were measured using a CHEMets Test. All other measurements were made
using a multifunction pH probe. TDS is a product of the conductivity and an
empirical constant.
55
Table 5. Summary of anions found in Driftwood Creek water. Analysis by Nick Chambers and John Baham, Soil Science Department, Oregon State University.
Well F- ppm Cl- ppm NO3- ppm PO4
3- ppm SO42- ppm
ORCA_010805 0.05 32.86 0.00 0.30 3.50 ORCA_012205 0.01 27.68 0.16 0.07 3.45 ORCA_020505 0.10 32.18 0.25 0.00 3.27
Seeps Driftwood 1 5/04 0.30 131 0.82 ND 0.38 Driftwood 2 5/04 0.11 63.5 0.18 ND 6.80
SEEP1_010805 0.11 97.68 0.02 0.07 20.44 SEEP1_012205 0.05 72.56 0.03 0.05 9.03 SEEP1_020505 0.13 98.54 0.39 0.00 7.34 SEEP2_012205 0.16 82.90 0.13 0.00 6.19 ND = Not Determined
Table 6. Cations analyzed by the AES and their concentrations. Analysis by Nick Chambers and John Baham, Soil Science Department, Oregon State University.
Well Al 3+ ppm
Ca2+ ppm
FeTotal ppm
K+ ppm
Mg2+ ppm
Na+ ppm
Si2+ ppm
ORCA_010805 0.13 3.49 0.40 0.77 1.86 19.74 3.68 ORCA_012205 0.16 3.70 0.54 0.87 2.00 17.41 3.82 ORCA_020505 0.15 4.14 0.58 0.79 2.17 19.06 3.84 Spring/Seep HORCA_101304 0.16 4.28 5.45 1.32 3.02 23.08 4.79 HORCA_111704 0.16 4.30 5.52 1.39 3.43 26.68 5.00 HDCS_101304 0.11 4.56 1.53 1.67 3.88 30.84 5.91 HDCS_111004 0.11 4.96 1.19 1.56 4.18 34.28 5.86 HDCS_010805 0.17 4.02 2.57 2.54 3.44 42.06 5.20 SEEP1_010805 0.16 6.94 9.40 3.22 8.34 69.97 6.20 SEEP1_012205 0.14 5.30 3.56 3.20 7.34 50.29 4.47 SEEP1_020505 0.16 5.98 8.54 4.31 6.40 67.02 6.76 SEEP2_012205 0.16 6.85 8.77 3.69 7.36 69.03 7.04
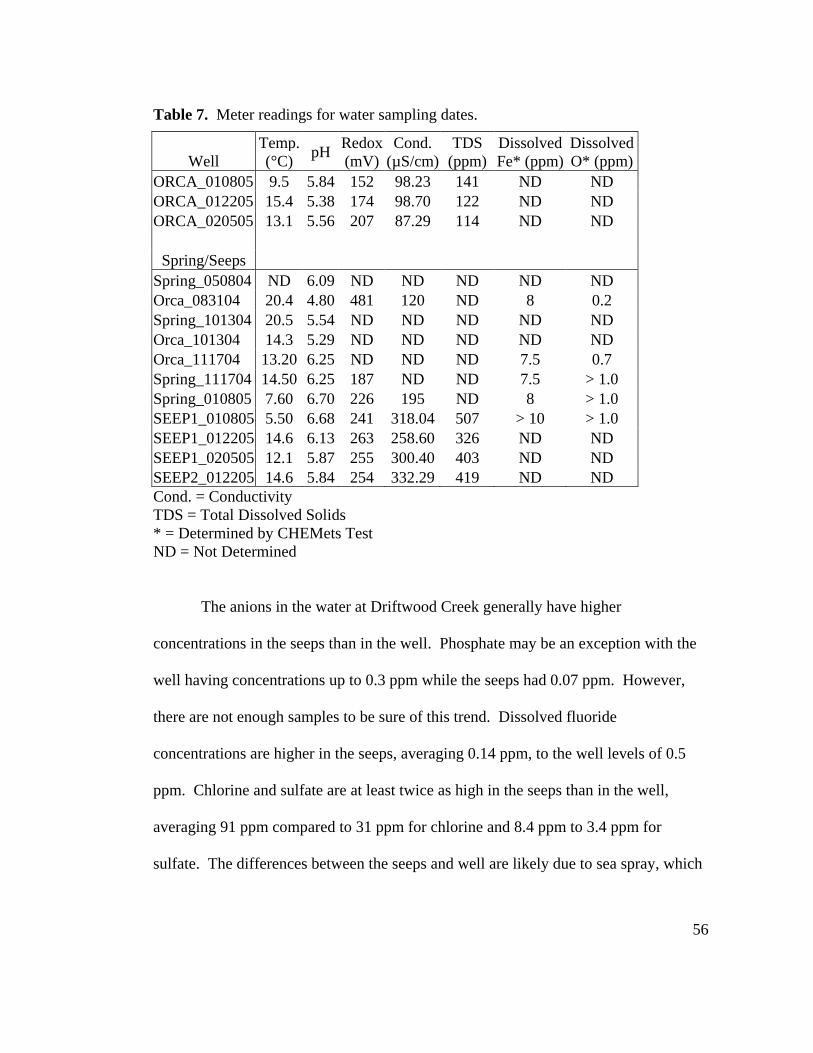
56
Table 7. Meter readings for water sampling dates.
Well Temp. (°C)
pH Redox (mV)
Cond. (µS/cm)
TDS (ppm)
Dissolved Fe* (ppm)
Dissolved O* (ppm)
ORCA_010805 9.5 5.84 152 98.23 141 ND ND ORCA_012205 15.4 5.38 174 98.70 122 ND ND ORCA_020505 13.1 5.56 207 87.29 114 ND ND Spring/Seeps
Spring_050804 ND 6.09 ND ND ND ND ND Orca_083104 20.4 4.80 481 120 ND 8 0.2 Spring_101304 20.5 5.54 ND ND ND ND ND Orca_101304 14.3 5.29 ND ND ND ND ND Orca_111704 13.20 6.25 ND ND ND 7.5 0.7 Spring_111704 14.50 6.25 187 ND ND 7.5 > 1.0 Spring_010805 7.60 6.70 226 195 ND 8 > 1.0 SEEP1_010805 5.50 6.68 241 318.04 507 > 10 > 1.0 SEEP1_012205 14.6 6.13 263 258.60 326 ND ND SEEP1_020505 12.1 5.87 255 300.40 403 ND ND SEEP2_012205 14.6 5.84 254 332.29 419 ND ND Cond. = Conductivity TDS = Total Dissolved Solids * = Determined by CHEMets Test ND = Not Determined
The anions in the water at Driftwood Creek generally have higher
concentrations in the seeps than in the well. Phosphate may be an exception with the
well having concentrations up to 0.3 ppm while the seeps had 0.07 ppm. However,
there are not enough samples to be sure of this trend. Dissolved fluoride
concentrations are higher in the seeps, averaging 0.14 ppm, to the well levels of 0.5
ppm. Chlorine and sulfate are at least twice as high in the seeps than in the well,
averaging 91 ppm compared to 31 ppm for chlorine and 8.4 ppm to 3.4 ppm for
sulfate. The differences between the seeps and well are likely due to sea spray, which
57
is added to the exposed seeps at higher rates than to the well. Nitrate is only slightly
higher in the seeps, 0.26 ppm, than in the well, 0.21 ppm.
The cations show a similar trend to the anions. Aluminum is the only cation
that is consistently similar between well and seeps with concentrations around 0.15
ppm. The average calcium concentration is higher in the seeps, 5.26 ppm, almost
twice as much as the average concentration in the wells, 3.77 ppm. The potassium
average is three times higher in the seep, 2.65 ppm, than in the well, 0.8 ppm. Sodium
averages are similar, 18.73 ppm in the wells to 47.73 ppm to the seeps; sea spray is a
likely cause of the higher sodium in the exposed seeps. Magnesium levels in the seeps
average 5.5 ppm, about twice as much as in the well, which averages 2.0 ppm. Silica
averages are similar, with a concentration of 5.73 ppm in the seeps and 3.78 ppm in
the well.
The average iron concentrations are much higher in the seeps than in the well,
5.4 ppm to 0.51 ppm, respectively. In the winter, where well data are available, there
is upwards of twenty times more total iron in the seeps than in the well. Conditions at
this time favor the presence of Fe(II) with Eh below 400 mV and pH below 6. This
increase in iron between the well and the seep is due to plant and soil horizons through
which the groundwater must travel.
Two winter sampling dates from Driftwood Creek provided inorganic and
organic carbon data for the seeps and wells. The dissolved inorganic carbon (DIC)
was consistently higher than the dissolved organic carbon (DOC) for both seeps and
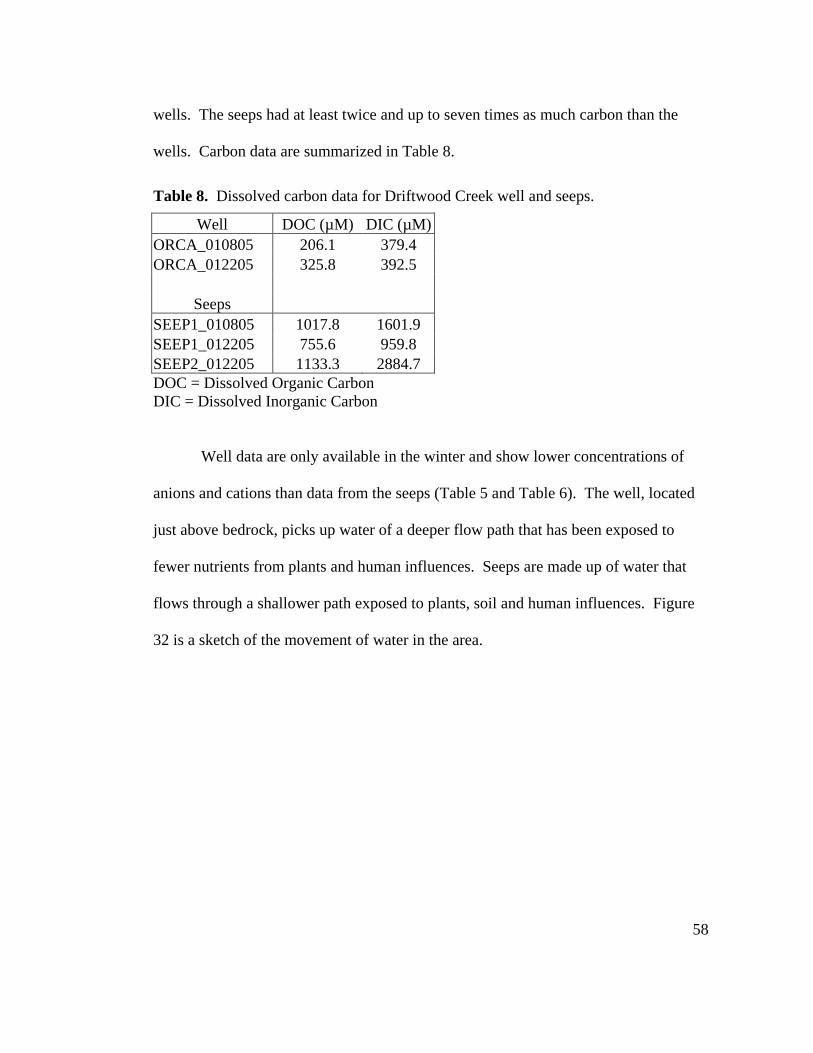
58
wells. The seeps had at least twice and up to seven times as much carbon than the
wells. Carbon data are summarized in Table 8.
Table 8. Dissolved carbon data for Driftwood Creek well and seeps.
Well DOC (µM) DIC (µM) ORCA_010805 206.1 379.4 ORCA_012205 325.8 392.5
Seeps SEEP1_010805 1017.8 1601.9 SEEP1_012205 755.6 959.8 SEEP2_012205 1133.3 2884.7 DOC = Dissolved Organic Carbon DIC = Dissolved Inorganic Carbon
Well data are only available in the winter and show lower concentrations of
anions and cations than data from the seeps (Table 5 and Table 6). The well, located
just above bedrock, picks up water of a deeper flow path that has been exposed to
fewer nutrients from plants and human influences. Seeps are made up of water that
flows through a shallower path exposed to plants, soil and human influences. Figure
32 is a sketch of the movement of water in the area.
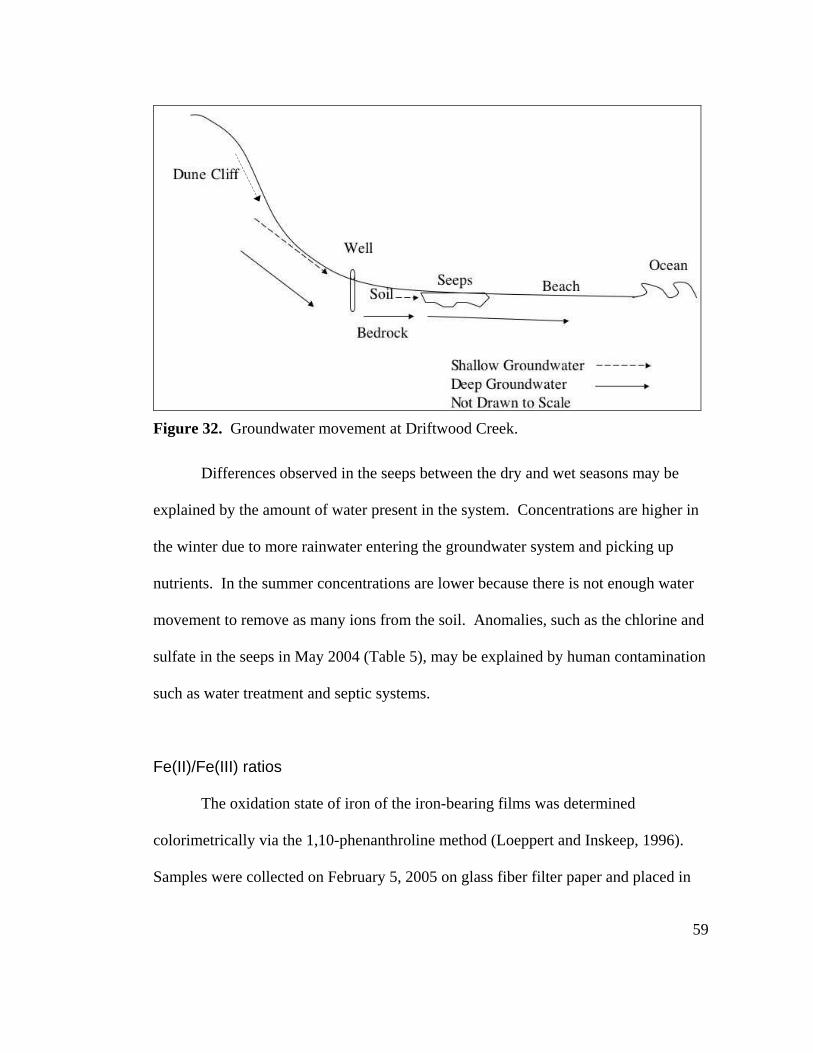
59
Figure 32. Groundwater movement at Driftwood Creek.
Differences observed in the seeps between the dry and wet seasons may be
explained by the amount of water present in the system. Concentrations are higher in
the winter due to more rainwater entering the groundwater system and picking up
nutrients. In the summer concentrations are lower because there is not enough water
movement to remove as many ions from the soil. Anomalies, such as the chlorine and
sulfate in the seeps in May 2004 (Table 5), may be explained by human contamination
such as water treatment and septic systems.
Fe(II)/Fe(III) ratios
The oxidation state of iron of the iron-bearing films was determined
colorimetrically via the 1,10-phenanthroline method (Loeppert and Inskeep, 1996).
Samples were collected on February 5, 2005 on glass fiber filter paper and placed in
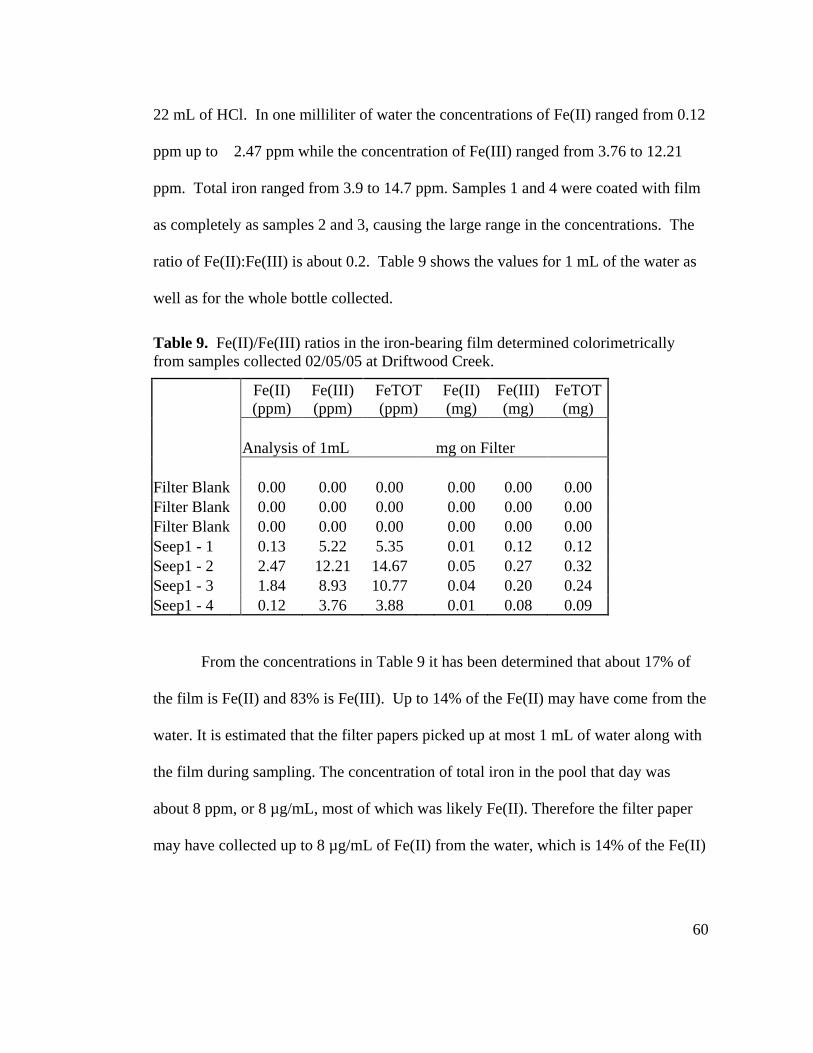
60
22 mL of HCl. In one milliliter of water the concentrations of Fe(II) ranged from 0.12
ppm up to 2.47 ppm while the concentration of Fe(III) ranged from 3.76 to 12.21
ppm. Total iron ranged from 3.9 to 14.7 ppm. Samples 1 and 4 were coated with film
as completely as samples 2 and 3, causing the large range in the concentrations. The
ratio of Fe(II):Fe(III) is about 0.2. Table 9 shows the values for 1 mL of the water as
well as for the whole bottle collected.
Table 9. Fe(II)/Fe(III) ratios in the iron-bearing film determined colorimetrically from samples collected 02/05/05 at Driftwood Creek.
Fe(II) (ppm)
Fe(III) (ppm)
FeTOT (ppm)
Fe(II) (mg)
Fe(III) (mg)
FeTOT (mg)
Analysis of 1mL mg on Filter Filter Blank 0.00 0.00 0.00 0.00 0.00 0.00 Filter Blank 0.00 0.00 0.00 0.00 0.00 0.00 Filter Blank 0.00 0.00 0.00 0.00 0.00 0.00 Seep1 - 1 0.13 5.22 5.35 0.01 0.12 0.12 Seep1 - 2 2.47 12.21 14.67 0.05 0.27 0.32 Seep1 - 3 1.84 8.93 10.77 0.04 0.20 0.24 Seep1 - 4 0.12 3.76 3.88 0.01 0.08 0.09
From the concentrations in Table 9 it has been determined that about 17% of
the film is Fe(II) and 83% is Fe(III). Up to 14% of the Fe(II) may have come from the
water. It is estimated that the filter papers picked up at most 1 mL of water along with
the film during sampling. The concentration of total iron in the pool that day was
about 8 ppm, or 8 µg/mL, most of which was likely Fe(II). Therefore the filter paper
may have collected up to 8 µg/mL of Fe(II) from the water, which is 14% of the Fe(II)
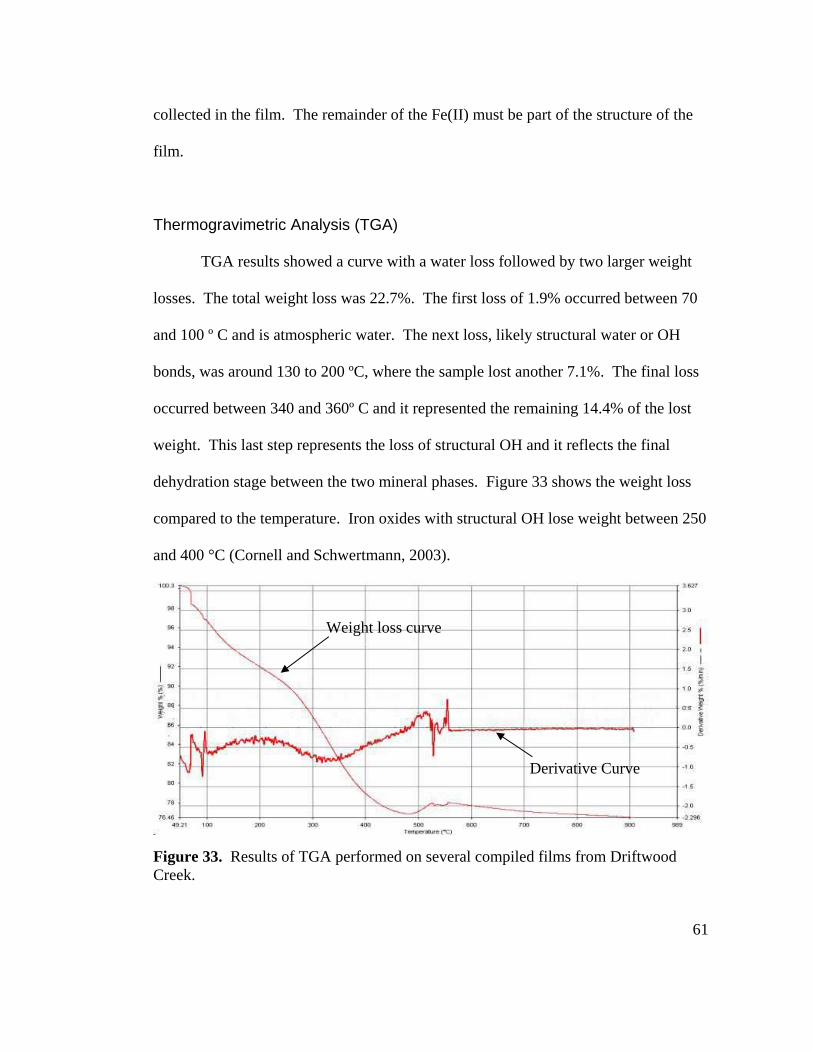
61
collected in the film. The remainder of the Fe(II) must be part of the structure of the
film.
Thermogravimetric Analysis (TGA)
TGA results showed a curve with a water loss followed by two larger weight
losses. The total weight loss was 22.7%. The first loss of 1.9% occurred between 70
and 100 º C and is atmospheric water. The next loss, likely structural water or OH
bonds, was around 130 to 200 ºC, where the sample lost another 7.1%. The final loss
occurred between 340 and 360º C and it represented the remaining 14.4% of the lost
weight. This last step represents the loss of structural OH and it reflects the final
dehydration stage between the two mineral phases. Figure 33 shows the weight loss
compared to the temperature. Iron oxides with structural OH lose weight between 250
and 400 °C (Cornell and Schwertmann, 2003).
Figure 33. Results of TGA performed on several compiled films from Driftwood Creek.
Weight loss curve
Derivative Curve
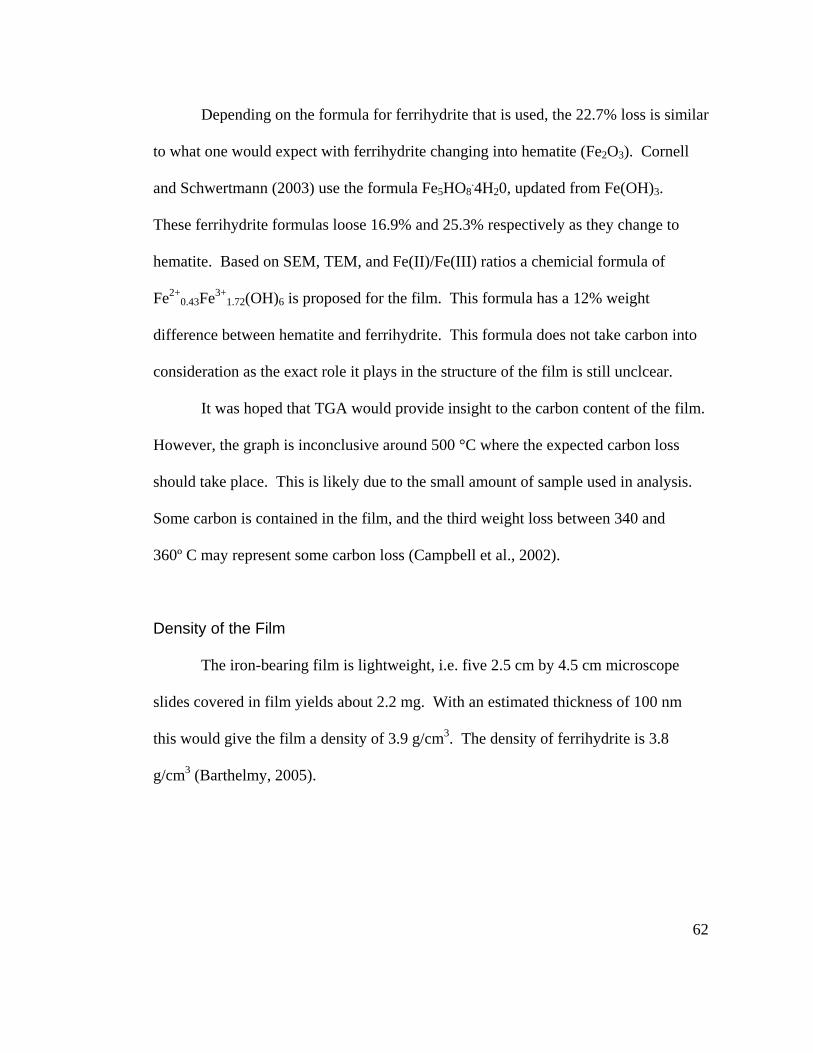
62
Depending on the formula for ferrihydrite that is used, the 22.7% loss is similar
to what one would expect with ferrihydrite changing into hematite (Fe2O3). Cornell
and Schwertmann (2003) use the formula Fe5HO8.4H20, updated from Fe(OH)3.
These ferrihydrite formulas loose 16.9% and 25.3% respectively as they change to
hematite. Based on SEM, TEM, and Fe(II)/Fe(III) ratios a chemicial formula of
Fe2+0.43Fe3+
1.72(OH)6 is proposed for the film. This formula has a 12% weight
difference between hematite and ferrihydrite. This formula does not take carbon into
consideration as the exact role it plays in the structure of the film is still unclcear.
It was hoped that TGA would provide insight to the carbon content of the film.
However, the graph is inconclusive around 500 °C where the expected carbon loss
should take place. This is likely due to the small amount of sample used in analysis.
Some carbon is contained in the film, and the third weight loss between 340 and
360º C may represent some carbon loss (Campbell et al., 2002).
Density of the Film
The iron-bearing film is lightweight, i.e. five 2.5 cm by 4.5 cm microscope
slides covered in film yields about 2.2 mg. With an estimated thickness of 100 nm
this would give the film a density of 3.9 g/cm3. The density of ferrihydrite is 3.8
g/cm3 (Barthelmy, 2005).
63
Fourier Transfer Infrared Spectroscopy (FTIR)
Conventional transmission, transmission and reflectance modes using the
infrared microscope, and at a grazing angle of 85° specular reflectance accessory were
used. Conventional transmission spectra produced the best patterns, characterized by
strong, but broad, absorption bands. Transmission spectra of Sample 2, collected from
Driftwood Creek Spring November 17, 2004 (Figure 34), exhibits a strong and very
broad OH absorbance band from 3700 to 2900 cm-1 and broad bands in the fingerprint
region (1800 to 500 cm-1).
Figure 34. FTIR Transmission spectra of Sample 2. Bulk OH deformities are seen in the 500 – 650 cm-1 range while bulk OH stretches are between 3200 and 3500 cm-1. The band between 910 – 1000 cm-1 is similar to ferrihydrite and silica. Carbon and/or carbonate are shown with the two bands 1300 – 1400 cm-1 and 1500 – 1600 cm-1. A shoulder of unknown origins occurs in the 2500 – 3000 cm-1 range.
64
The absorption bands in the fingerprint region show similarities to ferrihydrite.
Cornell and Schwertmann (2003) indicate the free surface OH groups are broad in
two-line ferrihydrite, with peaks around 3615 cm-1 and 3430 cm-1. Bands at 650 cm-1
are bulk OH deformities and ferrihydrite with a few percent silica are described at 940
cm-1. Seehra et al. (2004) also find silica substitutes producing bands at 942 cm-1 and
1018 cm-1, again similar to the pattern of the sample from Driftwood Creek.
The peaks higher in the fingerprint region are likely due to carbon bonds. Absorption
bands at 1589, 1402, and 1018 cm-1 may be attributed to the C=C stretch, the =CH2
deformation, and the =CH wag, respectively (P. Gassman, Written Communication,
May 2005).
High Resolution Transmission Electron Microscopy (HRTEM)
Two HRTEM grids were analyzed; one grid was dipped twice in the film, the
other only once. The single dipped film was found to be of suitable thickness (around
100 nm) and the other, while thick in some places, was also suitable.
Primary HRTEM electron diffraction indicated some dried salts on the grids,
identified by the cubic nature of the electron pattern. Energy filtered electron
diffraction patterns indicate the film is amorphous, with rings at 4.5 Å, 2.5 Å, and 1.4
Å (Figure 35), in some places the diffraction pattern shows only the latter 2.5 and 1.4
Å rings (Figure 36). These rings are consistent with both the standard ferrihydrite
pattern (Cornell and Schwertmann, 2003), and the XRD patterns produced in this
study.
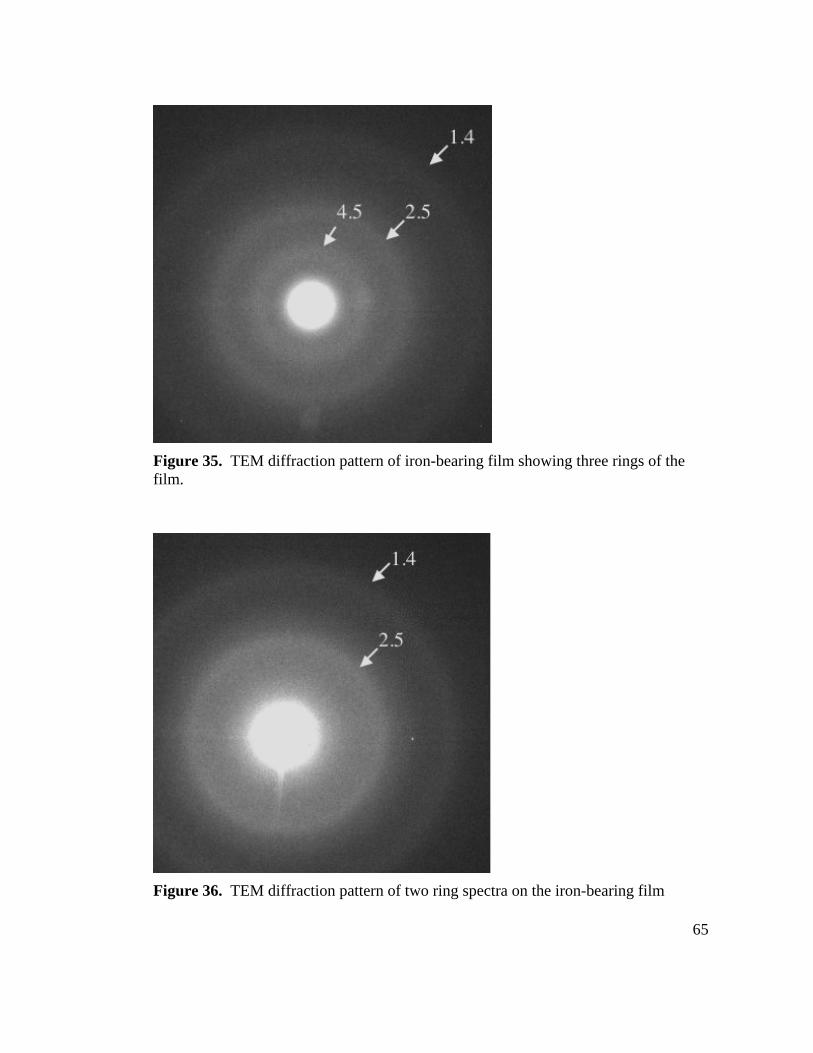
65
Figure 35. TEM diffraction pattern of iron-bearing film showing three rings of the film.
Figure 36. TEM diffraction pattern of two ring spectra on the iron-bearing film
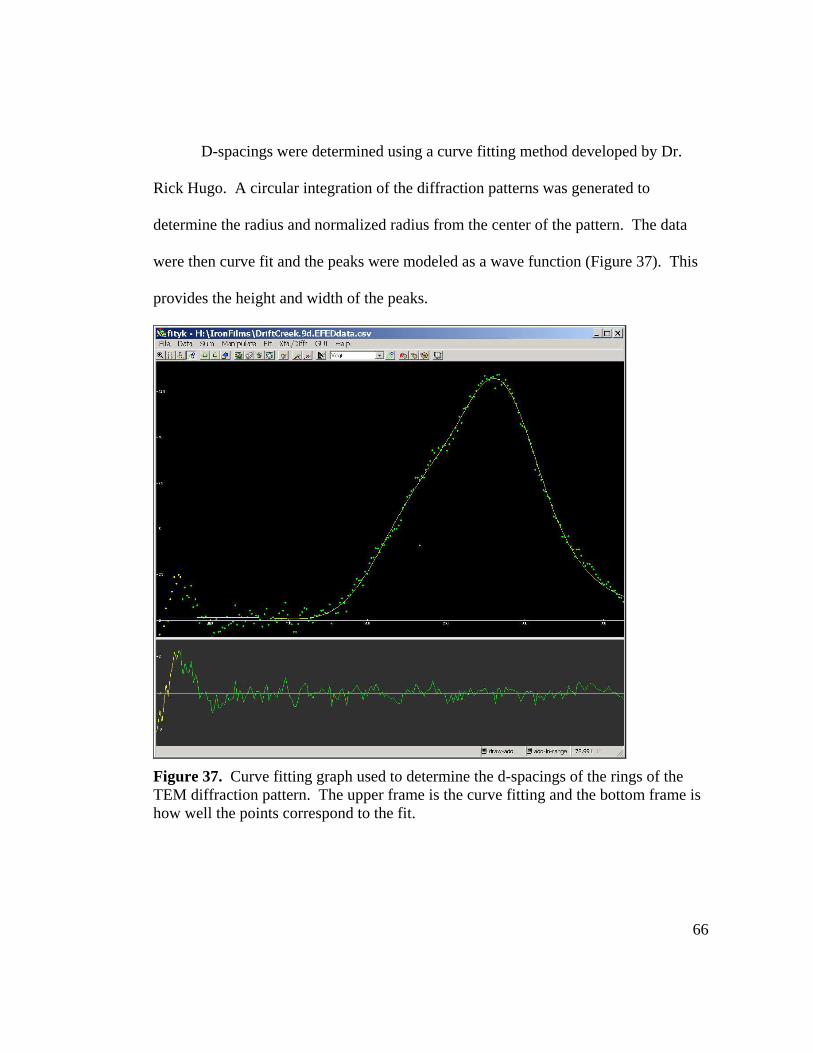
66
D-spacings were determined using a curve fitting method developed by Dr.
Rick Hugo. A circular integration of the diffraction patterns was generated to
determine the radius and normalized radius from the center of the pattern. The data
were then curve fit and the peaks were modeled as a wave function (Figure 37). This
provides the height and width of the peaks.
Figure 37. Curve fitting graph used to determine the d-spacings of the rings of the TEM diffraction pattern. The upper frame is the curve fitting and the bottom frame is how well the points correspond to the fit.
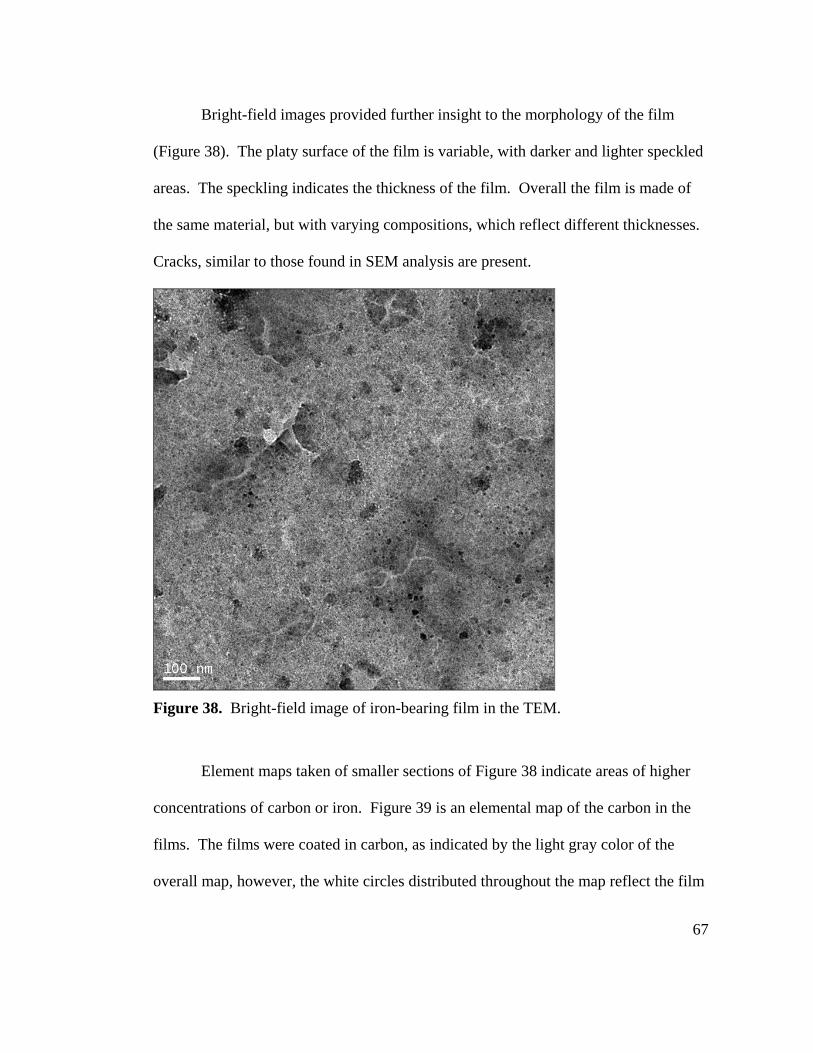
67
Bright-field images provided further insight to the morphology of the film
(Figure 38). The platy surface of the film is variable, with darker and lighter speckled
areas. The speckling indicates the thickness of the film. Overall the film is made of
the same material, but with varying compositions, which reflect different thicknesses.
Cracks, similar to those found in SEM analysis are present.
Figure 38. Bright-field image of iron-bearing film in the TEM.
Element maps taken of smaller sections of Figure 38 indicate areas of higher
concentrations of carbon or iron. Figure 39 is an elemental map of the carbon in the
films. The films were coated in carbon, as indicated by the light gray color of the
overall map, however, the white circles distributed throughout the map reflect the film
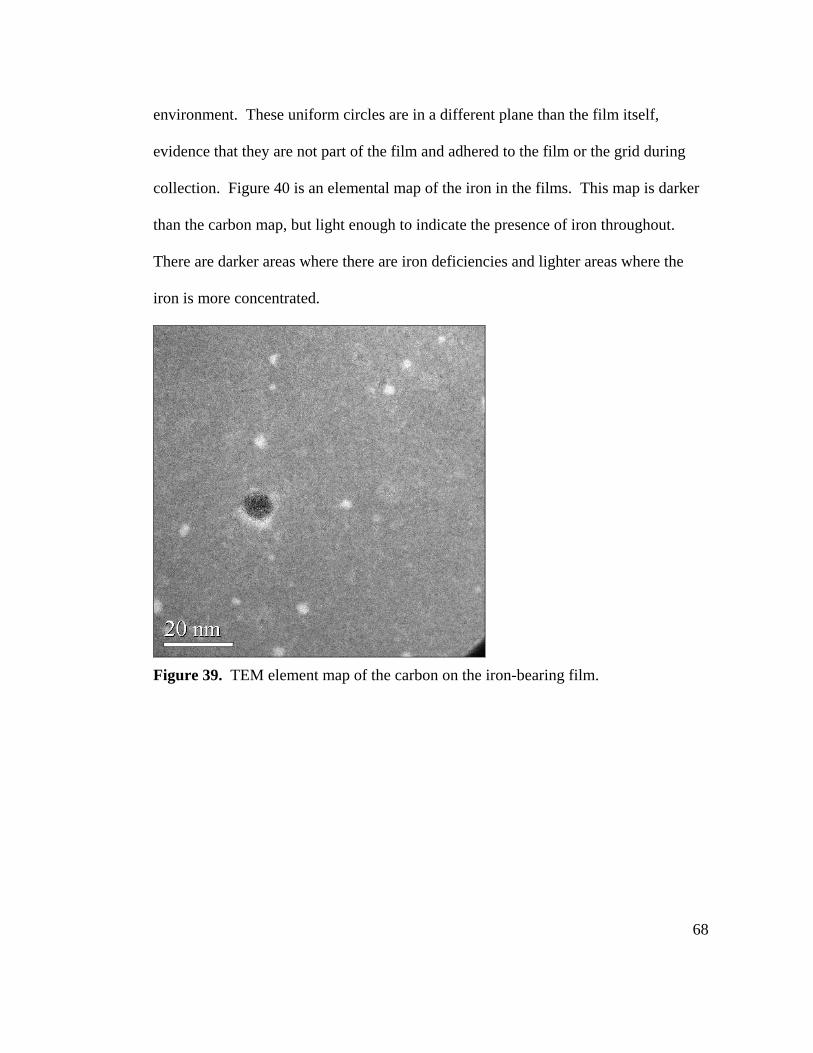
68
environment. These uniform circles are in a different plane than the film itself,
evidence that they are not part of the film and adhered to the film or the grid during
collection. Figure 40 is an elemental map of the iron in the films. This map is darker
than the carbon map, but light enough to indicate the presence of iron throughout.
There are darker areas where there are iron deficiencies and lighter areas where the
iron is more concentrated.
Figure 39. TEM element map of the carbon on the iron-bearing film.
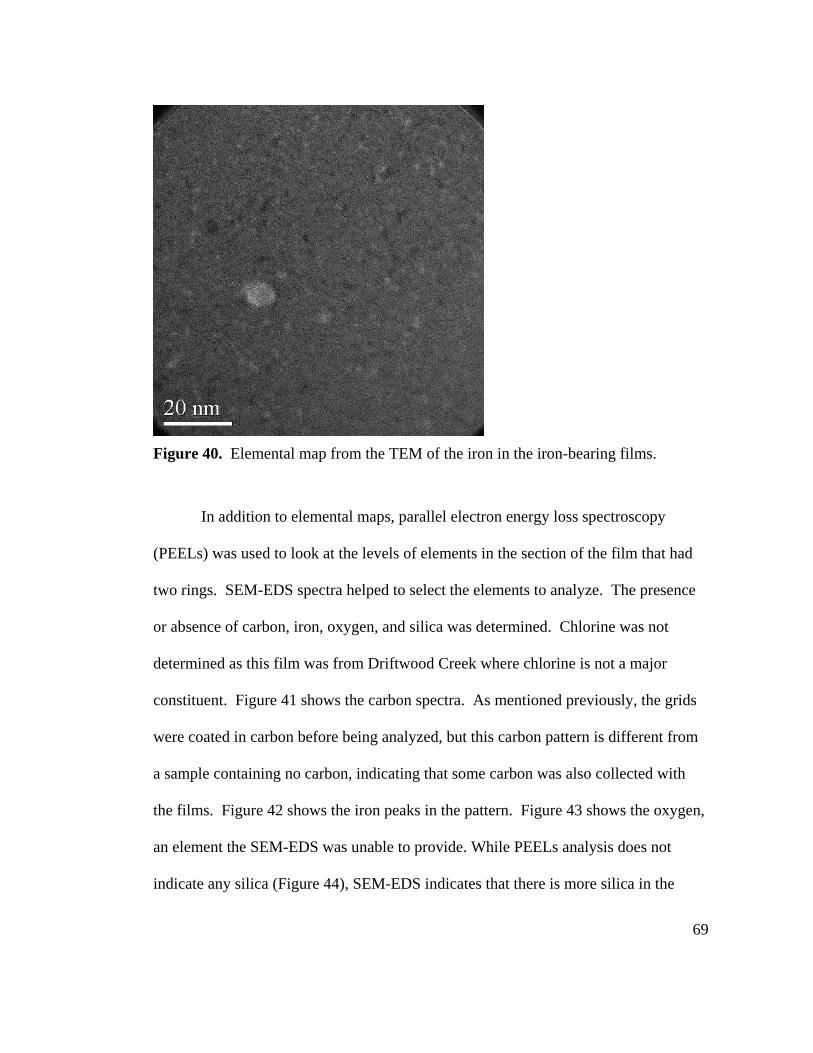
69
Figure 40. Elemental map from the TEM of the iron in the iron-bearing films.
In addition to elemental maps, parallel electron energy loss spectroscopy
(PEELs) was used to look at the levels of elements in the section of the film that had
two rings. SEM-EDS spectra helped to select the elements to analyze. The presence
or absence of carbon, iron, oxygen, and silica was determined. Chlorine was not
determined as this film was from Driftwood Creek where chlorine is not a major
constituent. Figure 41 shows the carbon spectra. As mentioned previously, the grids
were coated in carbon before being analyzed, but this carbon pattern is different from
a sample containing no carbon, indicating that some carbon was also collected with
the films. Figure 42 shows the iron peaks in the pattern. Figure 43 shows the oxygen,
an element the SEM-EDS was unable to provide. While PEELs analysis does not
indicate any silica (Figure 44), SEM-EDS indicates that there is more silica in the
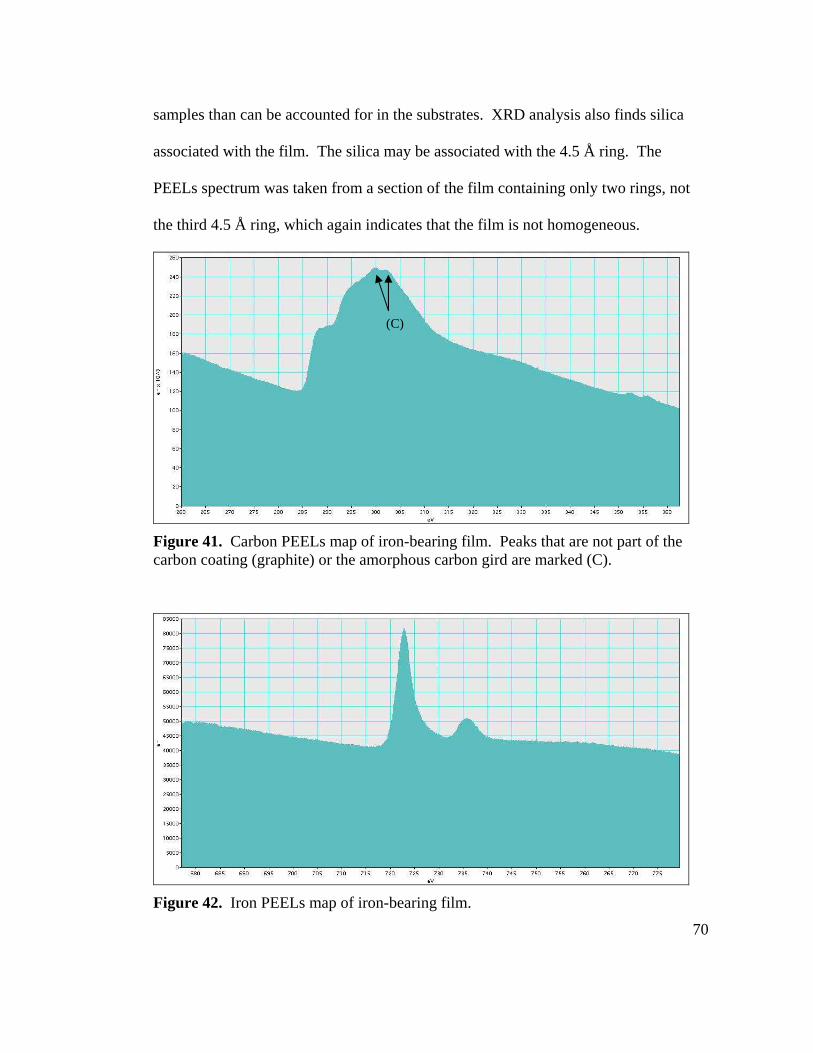
70
samples than can be accounted for in the substrates. XRD analysis also finds silica
associated with the film. The silica may be associated with the 4.5 Å ring. The
PEELs spectrum was taken from a section of the film containing only two rings, not
the third 4.5 Å ring, which again indicates that the film is not homogeneous.
Figure 41. Carbon PEELs map of iron-bearing film. Peaks that are not part of the carbon coating (graphite) or the amorphous carbon gird are marked (C).
Figure 42. Iron PEELs map of iron-bearing film.
(C)
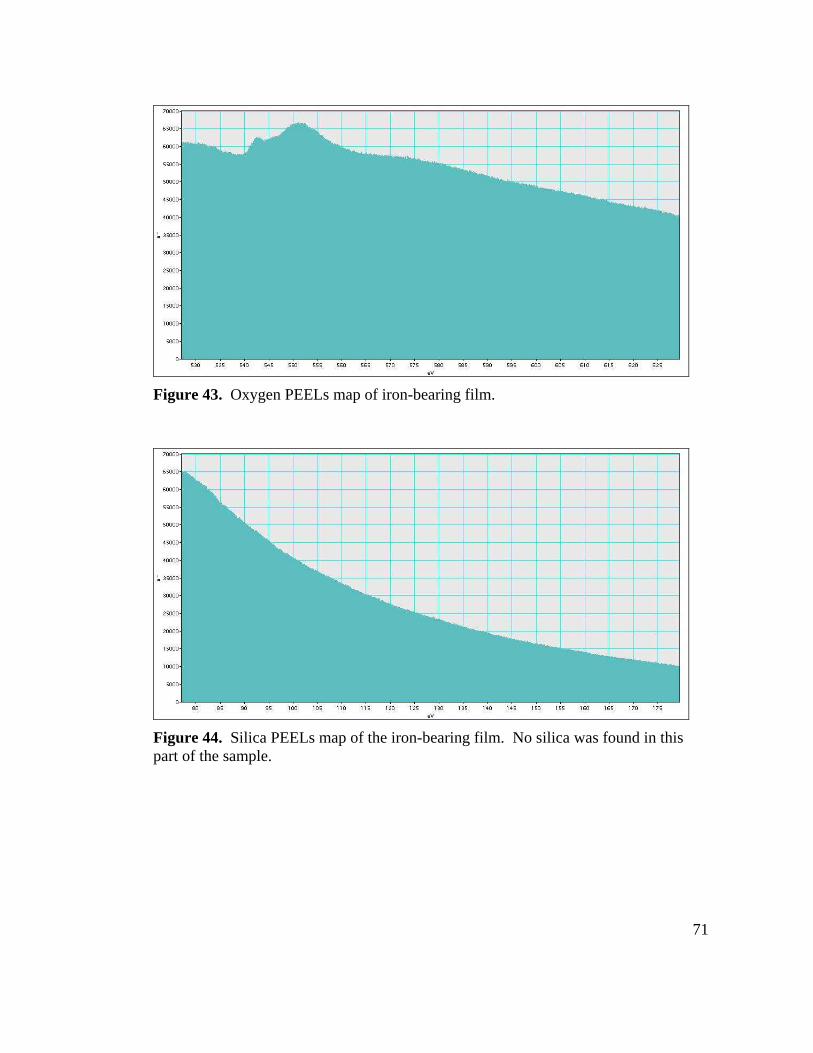
71
Figure 43. Oxygen PEELs map of iron-bearing film.
Figure 44. Silica PEELs map of the iron-bearing film. No silica was found in this part of the sample.
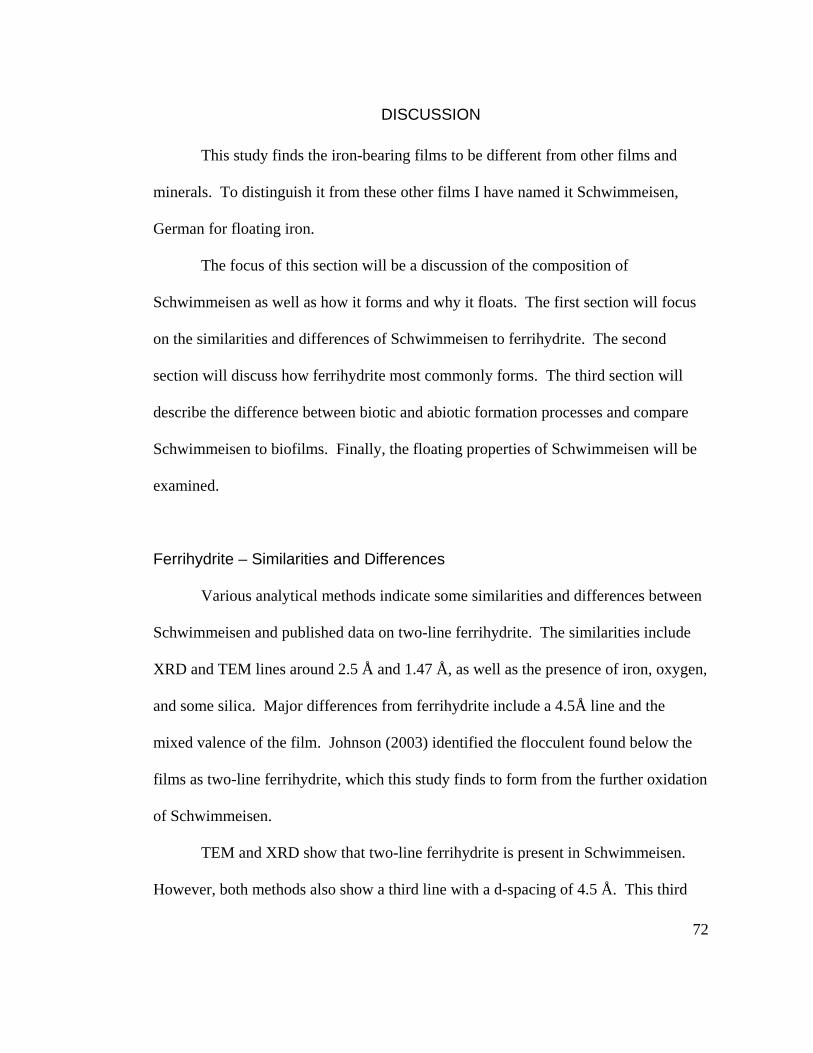
72
DISCUSSION
This study finds the iron-bearing films to be different from other films and
minerals. To distinguish it from these other films I have named it Schwimmeisen,
German for floating iron.
The focus of this section will be a discussion of the composition of
Schwimmeisen as well as how it forms and why it floats. The first section will focus
on the similarities and differences of Schwimmeisen to ferrihydrite. The second
section will discuss how ferrihydrite most commonly forms. The third section will
describe the difference between biotic and abiotic formation processes and compare
Schwimmeisen to biofilms. Finally, the floating properties of Schwimmeisen will be
examined.
Ferrihydrite – Similarities and Differences
Various analytical methods indicate some similarities and differences between
Schwimmeisen and published data on two-line ferrihydrite. The similarities include
XRD and TEM lines around 2.5 Å and 1.47 Å, as well as the presence of iron, oxygen,
and some silica. Major differences from ferrihydrite include a 4.5Å line and the
mixed valence of the film. Johnson (2003) identified the flocculent found below the
films as two-line ferrihydrite, which this study finds to form from the further oxidation
of Schwimmeisen.
TEM and XRD show that two-line ferrihydrite is present in Schwimmeisen.
However, both methods also show a third line with a d-spacing of 4.5 Å. This third
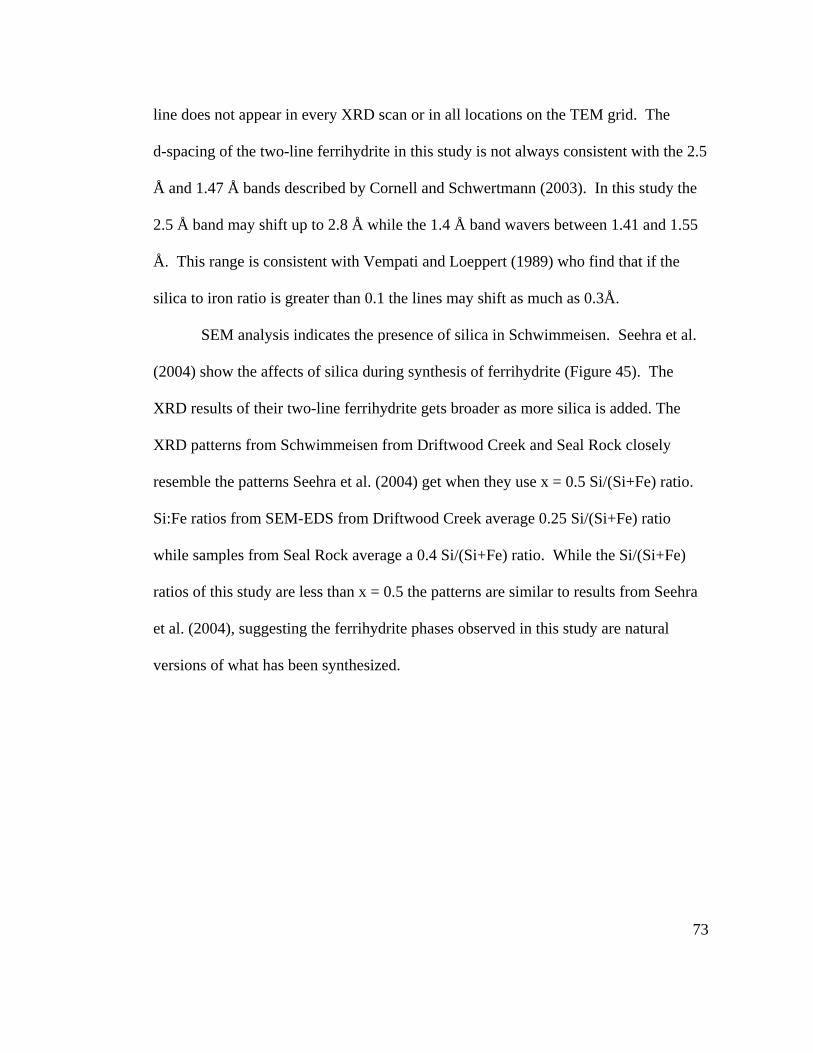
73
line does not appear in every XRD scan or in all locations on the TEM grid. The
d-spacing of the two-line ferrihydrite in this study is not always consistent with the 2.5
Å and 1.47 Å bands described by Cornell and Schwertmann (2003). In this study the
2.5 Å band may shift up to 2.8 Å while the 1.4 Å band wavers between 1.41 and 1.55
Å. This range is consistent with Vempati and Loeppert (1989) who find that if the
silica to iron ratio is greater than 0.1 the lines may shift as much as 0.3Å.
SEM analysis indicates the presence of silica in Schwimmeisen. Seehra et al.
(2004) show the affects of silica during synthesis of ferrihydrite (Figure 45). The
XRD results of their two-line ferrihydrite gets broader as more silica is added. The
XRD patterns from Schwimmeisen from Driftwood Creek and Seal Rock closely
resemble the patterns Seehra et al. (2004) get when they use x = 0.5 Si/(Si+Fe) ratio.
Si:Fe ratios from SEM-EDS from Driftwood Creek average 0.25 Si/(Si+Fe) ratio
while samples from Seal Rock average a 0.4 Si/(Si+Fe) ratio. While the Si/(Si+Fe)
ratios of this study are less than x = 0.5 the patterns are similar to results from Seehra
et al. (2004), suggesting the ferrihydrite phases observed in this study are natural
versions of what has been synthesized.
74
Figure 45. X-ray diffraction patterns of ferrihydrite with various compositions of x = Si/(Si+Fe) under a Cu Kα source (Seehra et al., 2004, used with permission).
As in the study by Seehra et al. (2004) the silica changes the XRD pattern from
that of synthesized ferrihydrite. Campbell et al. (2002) also looked at the effects of
silica on ferrihydrite, using differential thermal analysis (DTA) to determine how
silica effected the transformation of ferrihydrite into hematite. They found that pure
ferrihydrite has a significant change at 340 °C, whereas xSi = Si/(Si+Fe) = 0.27 raises
the transition temperature to 740 °C. As mentioned previously, SEM-EDS indicates
that there is xSi = 0.25 at Driftwood Creek where the TGA sample was collected.
TGA data for this study find that there is a significant change at 360 °C with no
reliable information above 500 °C. This change is not enough to suggest that our data
matches Campbell et al.’s study.
75
Schwimmeisen is found to have an Fe(II) to Fe(III) ratio of 0.2. True
ferrihydrite contains only Fe(III), while mixed valence oxides, green rusts or Fe(OH)2,
have a ratio ranging from 0.8 to 3.6 (Cornell and Schwertmann, 2003). Green rust
also incorporates other anions into its structure, usually chlorides or sulfates. This
divalent characteristic may have something to do with the 4.5Å line found in XRD and
TEM analysis.
Laboratory experiments that produced green rusts (Benner et al., 2002)
indicated that some bacteria may be crucial in the synthesis of this unique valence.
Benner et al. (2002) put ferrihydrite in an anoxic water column with Shewanella, an
iron-reducing bacteria. Over the next ten days the ferrihydrite turned into magnetite
and green rust. They suggest that green rust may be a meta-stable mineral phase from
the reduction between the ferric oxide and the ferrous oxide, similar to ferrihydrite as
an intermediate phase of ferric iron before goethite formation. This mixed-valent
mineral may be an intermediate between ferrous oxides and ferric oxides.
The mixed-valent nature of Schwimmeisen could also be an indicator that the
film itself originates as pure ferrous iron. This is unlikely because Schwimmeisen
forms at the water-air interface where the kinetics of the oxidation of ferrous iron in
solution do not promote long residence times at the surface. However, ferrous species
such as Fe(OH)2 have similar XRD peaks at 2.4 Å and 1.6 Å but is a more crystalline
phase than ferrihydrite (Miyamoto, 1976). Bernal et al. (1959) also studied Fe(OH)2.
This white precipitate is sensitive to oxygen, but is stable enough to allow the Fe3+
content to reach 10% of the total iron. Between the XRD patterns, which do not
76
include the other characteristic peaks of Fe(OH)2, and the Fe3+ content, it does not
seem likely that Schwimmeisen is formed from a reduced species of iron.
Schwertmann and Friedl (1998) used Mössbauer analysis to identify mixed-
valent films in ferriferous streams. In this environment oxygen-rich groundwater
starts oxidizing the iron in the stream. Goethite and ferrihydrite have been positively
identified by Mössbauer analysis. The pebbles that these films were found on are of
iron-free, lithologies. They are found at the bottom of streams unlike Schwimmeisen
which is found at the water surface.
FTIR analysis shows Schwimmeisen has OH bonds and some, but not all,
peaks associated with ferrihydrite. Cornell and Schwertmann (2003) describe
ferrihydrite bands at 3615 cm-1, 3430 cm-1, 650 cm-1, and 450 cm-1 with an additional
band at 940 cm-1 for ferrihydrite with a few percent silica. Absorption bands found in
the Driftwood Creek samples include a broad OH stretch between 3200 and 3500 cm-
1, a band between 500 and 650 cm-1, and overlapping band between 900 cm-1 and
1000 cm-1. The FTIR spectra are not resolved well enough to independently establish
Schwimmeisen mineralogically. However, the OH bonds are consistent with a
ferrihydrite phase.
Vempati and Loeppert (1989) studied ferrihydrite with silica. In their FTIR
analysis they found a 990 cm-1 peak. This peak is consistent with the double peak
found in the Driftwood Creek film sample. The double peak could suggest that there
is both two-line ferrihydrite and ferrihydrite with extra silica.
77
FTIR of Schwimmeisen also has two peaks that do not appear in the published
literature for ferrihydrite. These peaks occur at 1350 cm-1 and 1550 cm-1 (J. Cuadros,
Personal Communication, June 2005). They might correspond to carbon and/or
carbonate, associated with the pool environment where the film was collected. The
amount of carbon present in Schwimmeisen is a constituent that this study has been
unable to fully characterize.
Under both the optical microscope and the SEM Schwimmeisen is seen with
two different morphologies: the film by itself and flocculent attached to the film.
Under the optical microscope Schwimmeisen is clear or slightly brown, in places
pieces of the flocculent are attached to it (Figure 15). Under the SEM Schwimmeisen
is a platy, medium-grey with low topography, while the flocculent is brighter white
and it displays a more stringy appearance (Figure 19). These two morphologies and
their overlapping associations lead me to the conclusion that Schwimmeisen is a
transitional phase that develops into the ferrihydrite flocculent. HRSEM seems to
further support this theory, with bacteria only being found on the flocculent (Figure
23).
An experiment was conducted at Driftwood Creek to establish the rate of
formation of Schwimmeisen. A hole was dug in the sand near where the films
occurred on natural seeps. Due to the shallow water table the hole quickly filled with
water. Within five minutes a film of Schwimmeisen was established on the water
surface. No flocculent formed in the hole during the five minutes of observation. The
timeline for the transformation of Schwimmeisen to flocculent is presently unclear.
78
Additional observations showed that no flocculent appeared for several hours after the
film appeared. It is likely that longer than 6 hours is necessary for the flocculent to
form at the bottom of the seep pools, i.e. at least twice as long as the duration of the
negative observation time of several hours. It is possible that rain or cold temperatures
could alter the reaction time of Schwimmeisen converting to flocculent.
Formation of Ferrihydrite
Cornell and Schwertmann (2003) describe ferrihydrite as a common initial
phase in the formation of iron oxides. They find that it forms wherever Fe(II)
containing waters appear at or near the aerated surface. Under these conditions
ferrous iron is oxidized abioitcally at a very high rate, which inhibits more crystalline
oxides from forming. They also state that soluble silica, which is often present in such
waters, forms with or on the ferrihydrite, further retarding the transformation into
more crystalline iron oxides.
Ferrihydrite may also be formed via oxidation by bacteria, specifically
Gallionella sp. and Leptothrix sp.. Banfield and Zhang (2001) describe bacteria using
iron in redox reactions to generate metabolic energy. In this process iron oxidation
may take place where it is thermodynamically favored but kinetically inhibited by low
oxygen levels. They find ferrihydrite nanoparticles aggregating into colloids or
collecting directly on cell-associated polymers. These types of bacteria form part of
the red-orange mineral-loaded biomass that forms at the bottom of iron rich waters.
79
Groundwater conditions along the Oregon Coast are conducive to ferrihydrite
formation with circumneutral pH, mild temperatures, dissolved silica levels of 4.4 to
6.7 ppm, iron levels of 1.2 to 9.4 ppm, and oxidizing surface conditions. Cornell and
Schwertmann (2003) specify that, under conditions similar to those mentioned above,
two-line ferrihydrite abiotically oxidizes quickly, inhibiting other oxides from
forming. This high rate of formation may be observed in the Schwimmeisen films
forming within an hour of a heavy rainstorm, which previously had destroyed their
appearance.
Ranourt et al. (2005) give seven possible mechanisms for ferrihydrite
precipitation, only two of which have been observed in nature. The first of these is
heterogeneous nucleation on the bacterial cell wall. The second is the abiotic
precipitation of hydrous ferric oxides, which adhere to the cell walls of the bacteria.
They indicate that the end product of these conditions, ferrihydrite, is essentially the
same, but the conditions under which it forms are different. When iron is associated
with bacteria or bacterial organic matter it acts as a strong flocculating agent in water
with pH levels below 4. Schwimmeisen observed along the Oregon coast may be part
of the primary steps of ferrihydrite precipitation and flocculation. Schwimmeisen may
be observed without flocculants on the bottom of the pool, but flocculants, on the pool
bottom are associated with the films on the pool surface. Abiotic formation of
Schwimmeisen occurs at pH levels of 5 to 6 on the Oregon coast.
80
Along the Oregon Coast Leptothrix has been found in the seep pools (Johnson,
2003). Tuhela et al. (1997) indicates that oxidation is more rapidly abiotically driven
at higher pHs, although Leptothrix can oxidize iron at pH levels above 5.0. This
means that while bacteria may be present, the common iron oxidizing bacteria are not
likely to be very active in the pH range of the Oregon Coast dune seeps. Tuhela et al.
(1997) also found that Gallionella does not grow under anaerobic conditions or in the
absence of a carbon source. In organic rich environments ferrihydrite is the dominant
phase of precipitated iron where pH levels are around 5.0 (Bigham et al., 1992).
This study has found that ferrihydrite forms from precipitation of iron as the
iron changes from ferrous to ferric state. The initial precipitation may be observed as
iridescent films, Schwimmeisen, floating on the surface of the pools, which take
between 5 minutes and 1 hour to form. After some time, likely at least 6 hours, part of
the film oxidizes completely, it then becomes the red-orange flocculent found on the
bottom of the pools. This cycle may be seen in Figure 46.
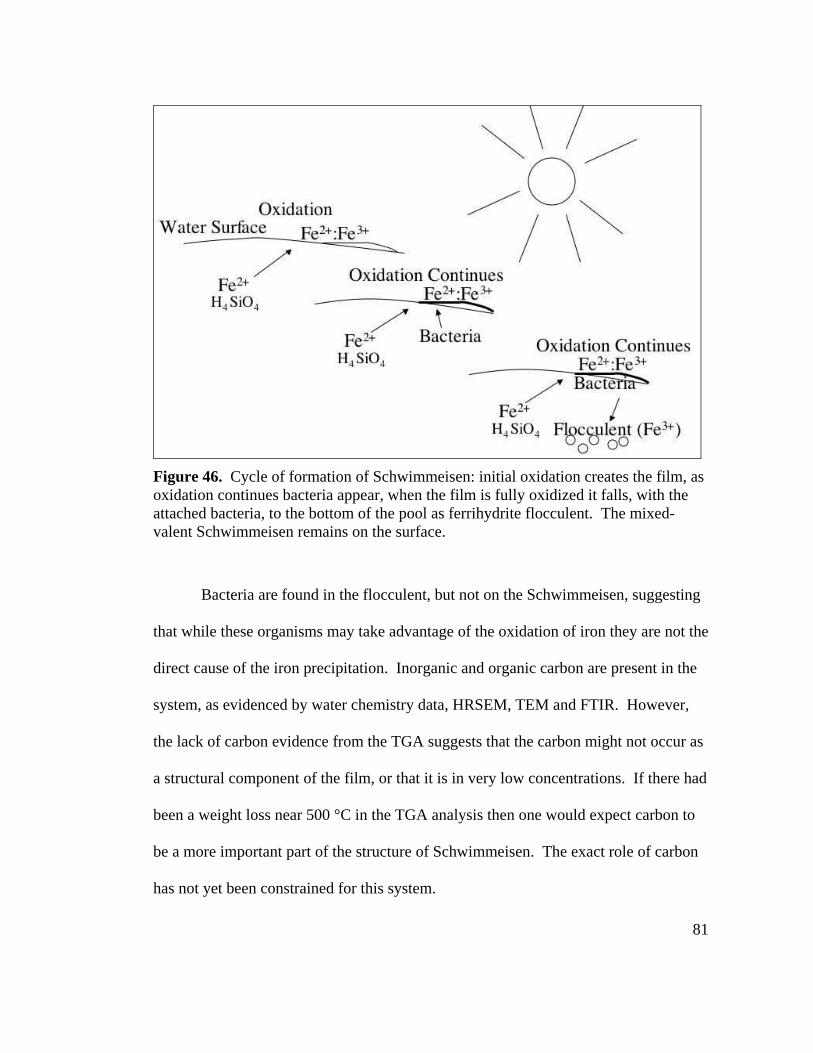
81
Figure 46. Cycle of formation of Schwimmeisen: initial oxidation creates the film, as oxidation continues bacteria appear, when the film is fully oxidized it falls, with the attached bacteria, to the bottom of the pool as ferrihydrite flocculent. The mixed-valent Schwimmeisen remains on the surface.
Bacteria are found in the flocculent, but not on the Schwimmeisen, suggesting
that while these organisms may take advantage of the oxidation of iron they are not the
direct cause of the iron precipitation. Inorganic and organic carbon are present in the
system, as evidenced by water chemistry data, HRSEM, TEM and FTIR. However,
the lack of carbon evidence from the TGA suggests that the carbon might not occur as
a structural component of the film, or that it is in very low concentrations. If there had
been a weight loss near 500 °C in the TGA analysis then one would expect carbon to
be a more important part of the structure of Schwimmeisen. The exact role of carbon
has not yet been constrained for this system.
82
Abiotic v. biotic formation (Biofilms)
As mentioned in the previous section, ferrihydrite can be precipitated either
abiotically or biotically. In the iron cycle, as summarized by Emerson and Weiss
(2004), Fe2+ oxidizes instantaneously with air or through mediation for anoxygenic
photosynthesis with bacteria. Ferrous iron most commonly oxidizes spontaneously
when exposed to the atmosphere or the aerobic zone in subsurface environments.
Differences between abiotic and biotically formed ferric iron oxides include the
presence or absence of abundant populations of bacteria cells (Emerson and Weiss,
2004).
Studies by Banfield et al. (2000), Emerson and Weiss (2004), Konhauser and
Ferris (1997) and Rancourt et al. (2005) have found biotically formed ferrihydrite in
environments where groundwater interacts with the surface air. These studies also
found iron flocculation. Emerson and Weiss (2004) studied an iron seep associated
with a wetland, where they found evidence of many sheath-like bacteria. Konhauser
and Ferris (1997) studied iron oxidizing bacteria in biofilms from tropical and
temperate rivers systems, as well as from metal-contaminated lake sediments. They
found that bacteria scavenge metallic ions, which are then incorporated into cell walls,
creating material rich in iron and often silica. In a laboratory study comparing biotic
and abiotic oxide formation of ferrihydrite, Rancourt et al. (2005) used mineral
magnetometry and Mössbauer analysis to find that biotic ferrihydrite is smaller in size,
with weaker Fe to particle bond strength, than abiotically formed ferrihydrite.
Banfield et al. (2000) suggest that crystals form because Gallionella and Leptothrix
83
enzymatically oxidize dissolved ferrous iron, which then becomes the lower soluble
ferric phase that forms the colloidal aggregates of ferrihydrite.
Bacteria oxidize iron, and other metal ions, though interactions with reactive
acidic groups contained within the bacterial cell walls and external sheaths or capsules
(Konhauser and Ferris, 1997). These acidic groups are contained in polymers that act
as a buffer zone between the organism and the environment, helping keep the
potentially-toxic metal concentrations from accumulating in the cell. Complex
microbial communities form on submerged solid surfaces and are often referred to as
biofilms. These films are often submerged. Each bacterium that makes up these
biofilms is roughly 500 nm thick, thicker than the Schwimmeisen found along surface
of pools on the Oregon Coast. These factors, together with the rarity of bacteria cells
in the iron-bearing films, lead me to conclude that Schwimmeisen is not a biofilm
(Figure 15 and Figure 23).
Bacteria found in the flocculent on the bottom of the pools and in the
flocculent on the Schwimmeisen film, as well as bacteria in the associated soils, may
be responsible for maintaining the conditions under which Schwimmeisen forms.
Emerson and Weiss (2004) specify that oxidation at the water-air boundary is the most
common oxidation method, but also concede that bacteria are part of the environment
where such precipitation occurs. The results of this study suggest that Schwimmeisen
forms as Fe2+ oxidizes when it meets the atmosphere at the surface of the seep pools.
As the film ages the remaining Fe2+ in its structure oxidizes. The fully oxidized
material then sinks to the bottom of the pool as pure two-line ferrihydrite. Bacteria
84
live in the flocculent and may help preserve the conditions under which
Schwimmeisen forms, by mediating the amount of Fe2+ and Fe3+ in the water through
further oxidation and reduction (Rancourt et al., 2004).
Floating Film
Aside from the composition of Schwimmeisen, there are two points to be made
about the formation of this film. The first is that Schwimmeisen is found only at the
water surface, between anoxic and oxic environments. The second is that Schwimeisen
stays at the surface. Upon disturbance Schwimmeisen appears to dissolve into the
water. Optical microscopy indicates that it does not necessarily dissolve, but retains
some of its plate like shape. Upon aging Schwimmeisen turns into the flocculent and
sinks to the bottom. In its primary form it remains at the surface.
Schwimmeisen forms at the surface due to oxidation of the ferrous iron in the
groundwater. The surface of the water is the most readily available source of oxygen,
which then oxidizes the iron in solution. In pools that have been sitting undisturbed
for some time there is Schwimmeisen and flocculent. It has been observed in the field
that where the Schwimmeisen film is occurring a hole may be dug in the sand and
another Schwimmeisen film will appear out of the water that has risen to the level of
the water table. No time has passed that the iron at the bottom of this new pool could
oxidize to form flocculent, but Schwimmeisen forms at the surface. This seems to
indicate that Schwimmeisen are a precursor to the other iron phases in the system.
The proposed cycle starts with the Schwimmeisen forming first, they are at the surface
85
and the first things oxidized, then as time passes and the Schwimmeisen fully oxidized
and the flocculent begins to appear.
Schwimmeisen could also be floating on the surface of the water due to surface
tension, which comes from the forces acting between water molecules (Dunkerley,
2002). These unbalanced forces allow matter to sit on the surface of the water. The
surface tension at room temperature of water is 0.072 Nm-1 while the presence of
organic matter lowers the surface tension of the water to about 0.067 Nm-1
(Slauenwhite and Johnson, 1996). Schwimmeisen has a density of 3.9 g/cm3. The
high densities require that Schwimmeisen floats via surface tension. A study by
Tuckermann and Cammenga (2004) looked at water-soluble organic compounds, that
lower the surface tension of the water. They found that low concentrations of water-
soluble organic compounds, in the 0.01 – 0.1 mgC/mL range, are enough to affect the
surface tension.
Some water-soluble organic compounds may be considered sea slicks. Sea
slicks are coastal phenomena made up of insoluble fatty acids with more than twelve
carbon atoms that form surface films at the air-water interface (Tuckermann and
Cammenga, 2004). Hühnerfuss et al. (1994) give three ways in which sea slicks may
be distributed and arranged: the molecules may spread homogeneously, the molecules
may form “islands” ranging from several microns to several hundred microns across,
or the group structure may vary in dependence on the hydration-dehydration effects.
Only a small amount of carbon is needed for some films to float.
86
The amount of carbon in Schwimmeisen has not been constrained. It may be
structural or a contaminant. TEM element mapping indicates that the majority of the
carbon observed in the film is in a different plane than the Schwimmeisen. This
indicates that the majority of the carbon is adsorbed onto the Schwimmeisen or was
present as a slick.
Future Work
Completion of this project leads to several suggestions on future work dealing
with Schwimmeisen. Foremost is the synthesis of the film. By reproducing
Schwimmeisen in controlled settings the role of silica, carbon and bacteria will be
constrained and their importance to the formation and structure of the film resolved.
The amount of change Schwimmeisen goes through between sample collection
and analysis could be determined through a field laboratory. Samples that were not
placed in a closed environment were exposed to an oxic environment for at least four
hours before analysis began. A field laboratory could constrain what changes occur
over this time.
Additional analytical methods would provide more details about the
characterization of Schwimmeisen. Mössbauer was not possible due to the quantity of
film needed for analysis, but in the future could provide more information on the
crystal structure. Microprobe analysis was attempted, but unsuccessful due to the
lightweight nature of the film and the inability to pin it to a sample holder. Future

87
work will hopefully find better ways of collecting Schwimmeisen so that more
complete analyses may be made.
88
CONCLUSIONS
In this study along the Oregon Coast Schwimmeisen films were found to be a
mixed-valent Fe/Si hydroxide mineral found in quiescent seep pools at Driftwood
Creek Wayside and Seal Rock State Park. Similar films have been observed around
the world, but this is only the second naturally occurring mixed-valent mineral,
leading to a unique name. The seep water is characterized by soluble Fe2+
concentrations in excess of 5 ppm, low Eh values, near-neutral pH. Schwimmeisen
does not form during times when the weather disturbs the water surface, such as
during rain showers or times with high winds. While Schwimmeisen looks to be thin
at first and may get thicker over time, an average thickness, estimated from SEM
images, is between 100 and 300 nm. Upon physical disturbance Schwimmeisen
breaks up into plates or appears to dissolve into the water. Optical microscopy
indicates that it does not break up completely, but remains suspended in the water
column.
Schwimmeisen is a mixed-valent nanocrystallline material with some silica
incorporated into the structure. The Fe(II) to Fe(III) ratio is 1:5 while the silica to iron
ratio is 1:2 at Seal Rock and 1:3 at Driftwood Creek Wayside. Schwimmeisen
contains two-line ferrihydrite peaks, as well as a 4.5Å line is found in some parts of
the film, but not all. Other peaks at 1.63 Å, between 1.57 - 1.56 Å, 1.45 Å, and
between 1.33-1.32 Å are also found in XRD patterns. FTIR analysis indicates there
are OH bonds consistent with ferrihydrite. XRD and FTIR both show evidence of the
silica. Schwimmeisen has a chemical formula of Fe2+0.43Fe3+
1.72(OH)6.
89
SEM and optical microscopy indicate that Schwimmeisen retains its platy
nature after collection. In places it seems to break up in over lapping shards, while in
others it has a low topography. In some areas stringy masses that are similar to the
flocculent found on the bottom of the pools are found. These flocculent masses are
the weathering product of Schwimmeisen, an intermediate stage between the film at
the pool surface and the ferrihydrite flocculent on the bottom of the pool.
Carbon is present in the pool, as well as on the Schwimmeisen. HRSEM and
TEM analysis indicate that there is carbon on Schwimmeisen, although the role it
plays is still unclear. Some carbon may adhere to the substrate the Schwimmeisen is
being collected on, thus incorporating it into some of the analytical methods. TGA
analysis does not indicate a drop at 500 °C, adding further evidence for the lack of
carbon in Schwimmeisen. Similarly, bacteria are not found in conjunction with
Schwimmeisen, although iron-oxidizing bacteria such as Leptothrix are found in the
flocculent on the bottom of the seep pools where Schwimmeisen are found. No
bacteria were found in Schwimmeisen itself. The transition to flocculent might also
be a largely abiotic process in the observed seep pools. It was determined that
Schwimmeisen forms abiotically via rapid oxidation of Fe2+ at the air-water boundary.
90
REFERENCES
Acworth, I., Jankowski, J., Turner, I, and Soriano, R., 1998, Interaction Among Coastal Sand-Dune Aquifers, Adjacent Wetlands and Seawater, New South Wales, Australia in Brahana, J.V., Eckstein, Y., Ongley, L.K., Schnider, R., and Moorse, J.E., eds., Proceedings of the Joint Meeting of the XXVIII Congress of the International Association of Hydrogeologists and the Annual Meeting of the American Institute of Hydrologists on Gambling with Groundwater – Physical, Chemical, and Biological Aspects of Aquifer – Stream Relations, 28, p. 461-468.
Banfield, J.F. and Navrotsky, A., 2001, Nanoparticles and the Environment: Reviews
in Mineralogy and Geochemistry, Mineralogical Society of America, v. 44, p. 349.
Banfield, J.F., Welch, S.A., Zhang, H., Ebert, T.T., and Penn, R.L., 2000,
Aggregation-based crystal growth and microstructure development in natural iron oxihydroxide biomineralization products: Science, v. 289, p. 751-754.
Banfield, J.F., and Zhang H., 2001, Nanoparticles in the Environment, in Banfield, J.F.
and Navrotsky, A., 2001, Nanoparticles and the Environment, Reviews in Mineralogy and Geochemistry, Mineralogical Society of America, v. 44. p. 1-58.
Barthelmy, D., 2005, Mineralogy Database: Ferrihydrite,
http://www.webmineral.com/data/Ferrihydrite.shtml, Webpage accessed June 2004 through August 2005.
Benner, S.G, Hansel, C.M., Wielinga, B.W., Bostick, B.C., Barber, T., and Fendorf,
S.E., 2002, Reductive dissolution and biomineralization of iron oxides under dynamic flow conditions: Environmental Science and Tehnology, 36, no. 8, p. 1705-1711.
Bernal, J.D., Dasgupta, D.R., and Mackay, A.L., 1959, The Oxides and Hydroxides of
Iron and Their Structural Inter-Relationships: Clay Minerals, v. 4, p. 15-29. Bigham, J.M., Schwertmann, U., and Carlson, L., 1992, Mineralogy of precipitates
formed by the biogeochemical oxidation of Fe(II) in mine drainage, in Skinner, H.C.W., and Fitzpatrick, R.W., eds., Biomineralization: Processes of iron and Manganese Modern and Ancient Environments, Catena Supplement 21, Germany, p. 219-232.
91
Brown, S.G. and Newcomb, R.C., 1963, Groundwater resources of the coastal sand- dune area north of Coos Bay, Oregon: U.S. Geological Survey Water-Supply Paper 1619-D.
Campbell, A.S., Schwertmann, U., Stanjek, H., Friedl, J., Kyek, A., and Campbell,
P.A., 2002, Si Incorporation into Hematite by Heating Si-Ferrihydrite: Langmuir, v. 18, p. 7804 – 7809.
Campbell, E.E. and Bate, G.C., 1998, Tide-induced pulsing of nutrient discharge from
an unconfined aquifer in to an Anaulus australis-dominated surf-zone: Water SA, v. 24, no. 4, p. 365-370.
Clough, C.M., 2005, Geologic model and geotechnical properties of stratified
paleodune deposits, central Oregon coast, Oregon [M.S. thesis]: Portland, Oregon, Portland State University 148 p.
Cooper, Jr., H.H., 1959, A Hypothesis Concerning the Dynamic Balance of Fresh
Water and Salt Water in a Coastal Aquifer: Journal of Geophysical Research, v. 64, no. 4, p. 461-467.
Cornell, R.M. and Schwertmann, U., 2003, The Iron Oxides: Structure, Properties,
Reactions, Occurrences and Uses: Wiley-VCH, Weinheim, Germany, 664 p. Dunkerley, D., 2002, Surface tension and friction coefficients in shallow, laminar
overland flows through organic litter: Earth Science Processes and Landforms, v. 27, no. 1, p. 45-58.
Emerson, D., and Weiss, J.V., 2004, Bacterial Iron Oxidation in Circumneutral
Freshwater Habitats: Findings from the Field and the Laboratory: Geomicrobiology Journal, v. 21, p. 405-414.
Frank, F.J., 1970, Ground Water Resources of the Clatsop Plains Sand Dune Area,
Clatsop County, Oregon: U.S. Geological Survey Water-Supply Paper 1899-A. Gamer, R.L., 1974, The Oregon Coast From Seal Rock to Haceta Head: Geological
Newsletter: Geological Society of the Oregon Country, v. 40, no. 9, p. 65. Grathoff, G.H., Baham, J., and Peterson, C.D., 2003, Al, Fe, Si Minerals in Dunal
Soils Near Newport, Oregon, USA: Euroclay 2003 10th Conference of the European Clay Groups Association, Abstracts, Modena, Italy, June 22-26, 2003, p. 118.
92
Grathoff, G.H., Peterson, C.D., and Beckstrand, D.L., 2001, Coastal Dune Soils in Oregon, USA, forming allophane, imogolite and gibbsite 2001: A Clay Odyssey, Proceedings of the 12th International Clay Conference, Bahia Blanca, Argentina, July 22-28, 2001, p. 197-204.
Hart, R. and Peterson, C., 1997, Episodically buried forests in the Oregon surf zone:
Oregon Geology, v. 59, no. 6, p. 131-144. Hühnerfuss, H., Fericke, A., Alpers, W., Thesi, R., Wismann, V., and Lange, P., 1994,
Classification of sea slicks by multi-frequency radar techniques: new chemical insights and their geophysical implications: Journal of Geophysical Research, v. 99 (C5), p. 9835-9845.
Johnson, C.M., 2003, Iron mineralogy in the Newport Dune Sheet Oregon Coast:
[B.S. Honors Thesis], Portland, Oregon, Portland State University, 37 p. Johnson, K., Moore, K., Smith, W., 2002, Workshop Highlights Iron Dynamics in
Ocean Carbon Cycle: EOS, v. 83, p. 482. Konhauser, K.O., and Ferris, G., 1997, Bacterial Formation of Clay Phases In
Freshwater Biofilms: The Dynamic Geosphere, New Delhi, Allied Publishers, p. 200-215.
Loeppert, R.L, and Inskeep, W.P., 1996, Iron, in D.L. Sparks, ed. Methods of Soil
Analysis, Part 3, American Soc. Agron., Madison, WI, p. 639-664.. Magaritz, M., and Luzier, J.E., 1985, Water-rock interactions and seawater-freshwater
mixing effects in the coastal dunes aquifer, Coos Bay, Oregon: Geochimica et Cosmochimica Acta, v. 49, p. 2515-2525.
Miyamoto, H., 1976, The magnetic properties of Fe(OH)2: Material Research Bulletin,
v. 11, p. 329-336. Moore, D.M. and Reynolds, R.C., 1997, X-Ray Diffraction and the Identification and
Analysis of Clay Minerals: Oxford University Press Inc., New York, 378 p. Nagai, K., Islam, A. R., and Tazaki, K., 2001, Bacterial Fe-As mineralization: The
Science Reports of the Kanazawa University, v. 46, no. 1-2, p. 49-68.
Oregon Water Resources Department, 2005, Well Log Query Application, http://stamp.wrd.state.or.us/apps/gw/well_log/well_log.php, Webpage accessed February 2005 through June 2005.
93
Peterson, C.D., and Hart, R., 2003, Quaternary History of the Dunes Cover the Bandon Marine Terraces: Final Report Submitted to Department of Land Conservation and Development, Salem, Oregon.
Peterson, C.D., Stock, E., Cloyd, C., Beckstrand, D., Clough, C., Eriandson, J.M., Hart, R., Murillo, J., Percy, D., Price, D., Reckendorf, F., and Vanderburgh, S., 2005, Dating and Morphostratigraphy of Coastal Dune Sheets from the Central West Coast of North America: Oregon Sea Grant Publications, Corvallis, Oregon.
Rancourt, D.G., Thibault, P.J., Mavrocordatos, D., and Lamarche, G., 2005, Hydrous
ferric oxide precipitation in the presence of nonmetabolizing bacteria: Constraints on the mechanism of a biotic effect: Geochimica et Cosmochimica Acta, v. 69, no. 3, p. 553-557.
Schwertmann, U. and Friedl, J., 1998, Thin iron oxide films on pebbles in ferriferous streams: Neues Jahrbuch Fur Mineralogie, no. 2, p. 63-67.
Seehra, M.S., Raman, R.A., and Manivannan, A., 2004, Structural investigations of synthetic ferrihydrite nanoparticles doped with Si: Solid State Communications v. 130, p. 597-601.
Sheehan, K.B., Patterson, D.J., Dicks, B.L., and Henson, J.M., 2005, Seen and
Unseen: Discovering the Microbes of Yellowstone: A Falcon Guide, Montana State University, Helena, Montana 128 p.
Skinner, H.C.W., and Fitzpatrick, R.W., 1992, Iron and manganese biomineralization,
in Skinner, H.C.W., and Fitzpatrick, R.W., eds., Biomineralization: Processes of iron and Manganese Modern and Ancient Environments, Catena Supplement 21, Germany, p. 1-6.
Slauenwhite, D.E., and Johnson, B.D., 1996, Effect of organic matter on bubble
surface tension: Journal of Geophysical Research, v. 101, no. C2, p. 3769-3774.
Slaughter, T.H., 1962, Beach-area water supplies between Ocean City, Maryland, and
Rehoboth Beach, Delaware: U.S. Geological Survey Water-Supply Paper 1619-T.
Taylor, G., 2005, Climate of Lincoln County, Special Report,
http://www.ocs.oregonstate.edu/county_climate/Lincoln_files/Lincoln.html, Webpage accessed August 2005.
94
Tazaki, K., Asada, R., and Ikeda, Y., 2002, Quick Occurrence of Fe-rich Biofilms on the Water Surface: Journal of the Clay Science Society of Japan, v.. 42, no. 1, p. 21-36.
Thomas, B.E., 1995, Ground-water Flow and Water Quality in the Sand Aquifer of
Long Beach Peninsula, Washington: U.S. Geological Survey Water-Resources Investigations Report 95-4026, 94 p.
Tinholt, M.J. and Wendling, G.R., 1997, Descriptive Analysis of Iron Fouling in
Groundwater Treatment Systems, In Situ and On-Site Bioremediation: Paper from the Fourth International In Situ and On-Site Bioremediation Symposium, New Orleans, April 28- May 1, 1997, v. 4, p. 29-33.
Tuckermann, R., and Cammenga, H.K., 2004, The surface tension of aqueous
solutions of some atmospheric water-soluble organic compounds: Atmospheric Environment, v. 38, p 6135-6138.
Tuhela, Carlson, and Tuovinen, 1997, Biogeochemical transformations of Fe and Mn
in oxic groundwater and well water environments: Journal of Environmental Science and Health. Part A, Environmental science and engineering, v. 32, no. 2, p. 407-426.
Vempati, R.K., and Loeppert, R.H., 1986, Influence of structural and adsorbed Si on
the transformation of synthetic ferrihydrite: Clays and Clay Mineral v. 37, no. 3 p. 273-279.
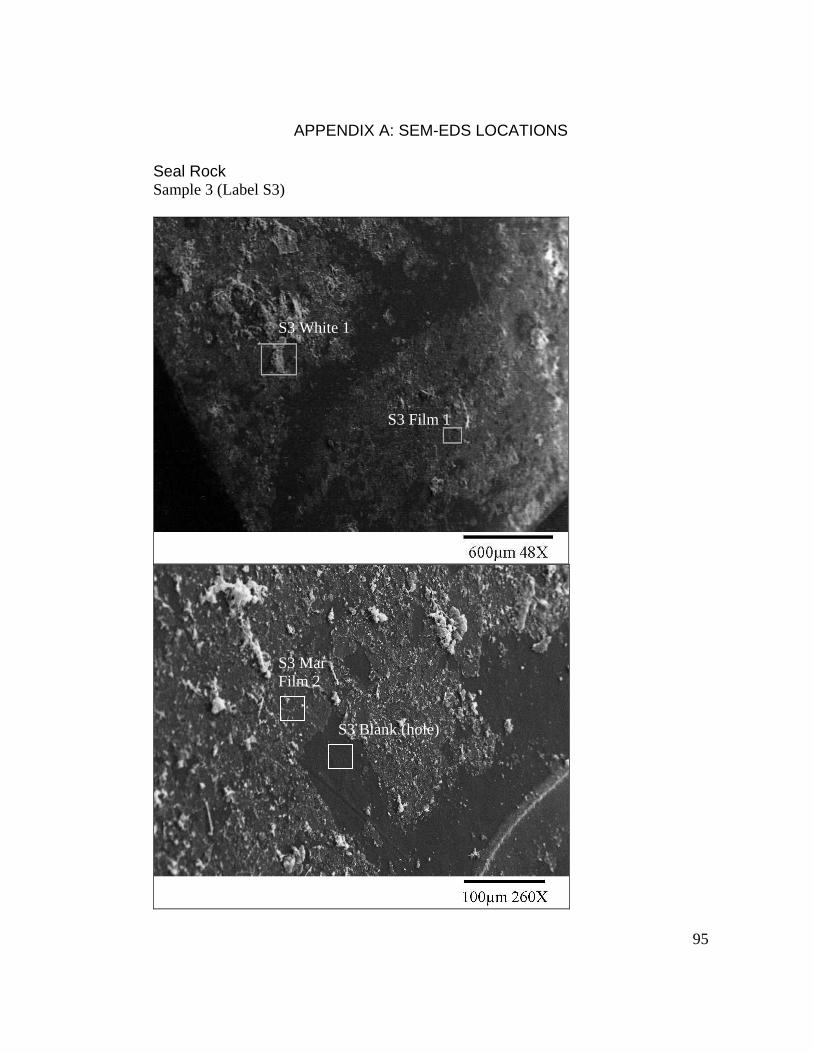
95
APPENDIX A: SEM-EDS LOCATIONS
Seal Rock Sample 3 (Label S3)
S3 White 1
S3 Film 1
S3 Blank (hole)
S3 Mar Film 2
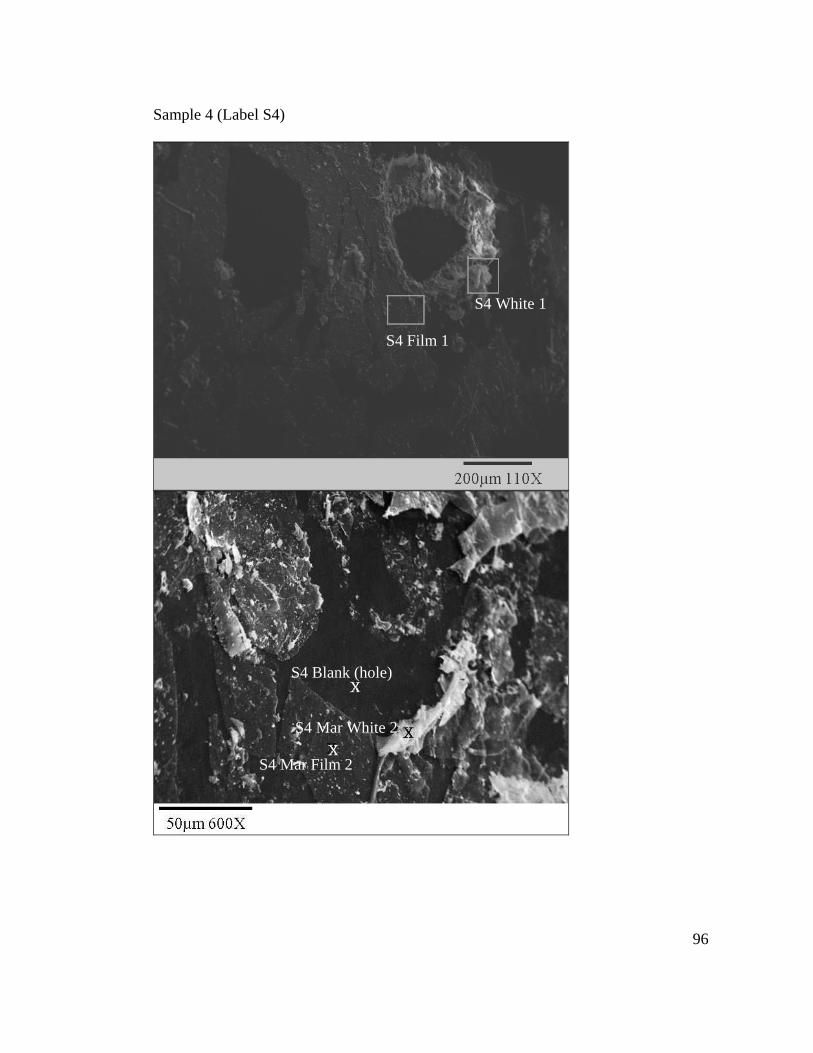
96
Sample 4 (Label S4)
S4 White 1 S4 Film 1
S4 Blank (hole)
S4 Mar White 2 S4 Mar Film 2
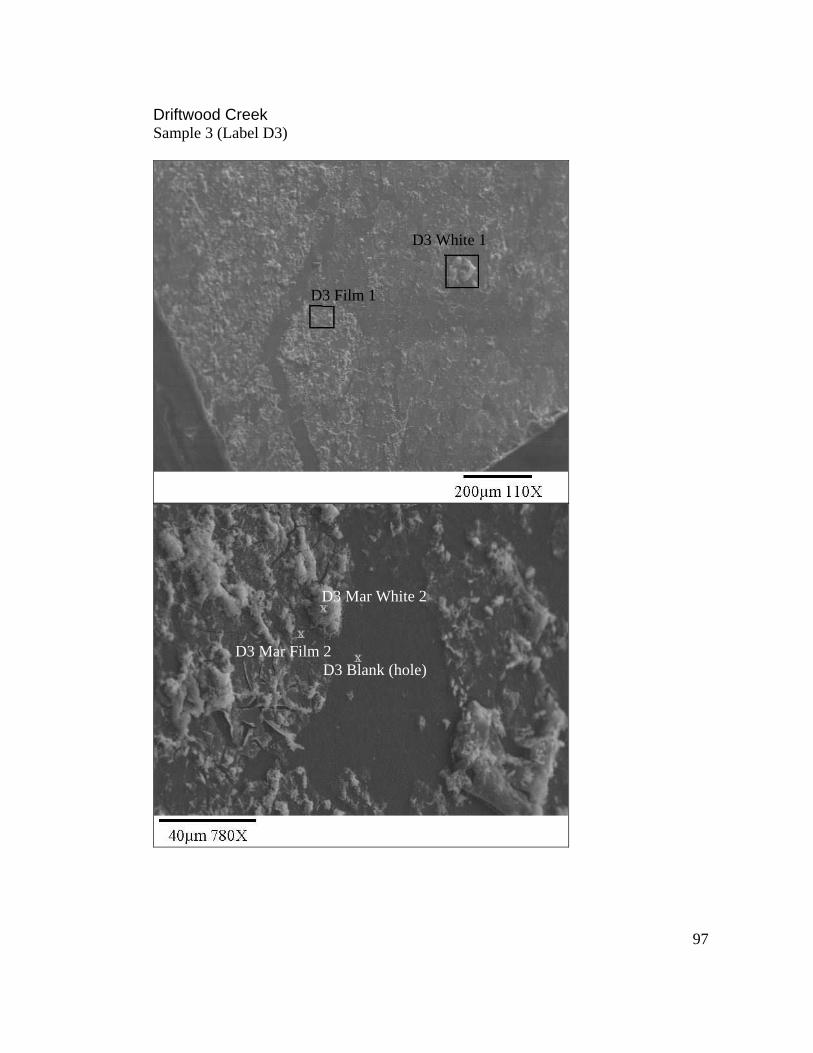
97
Driftwood Creek Sample 3 (Label D3)
D3 White 1 D3 Film 1
D3 Mar White 2
D3 Mar Film 2 D3 Blank (hole)
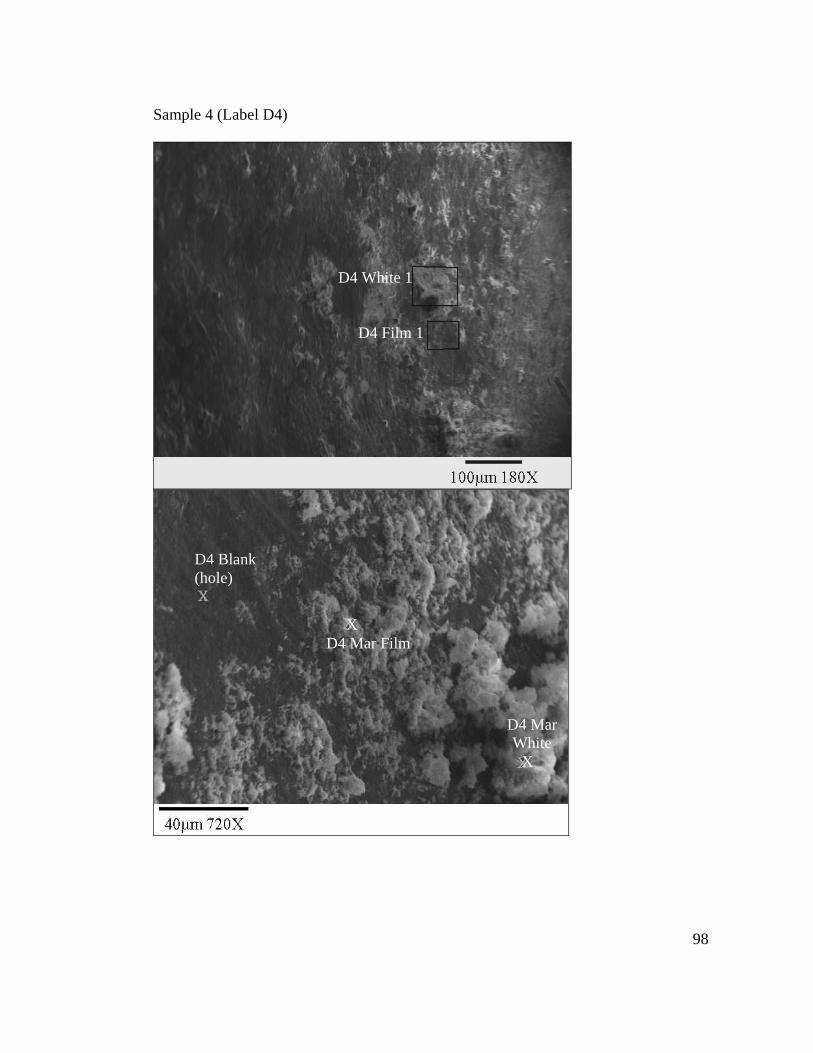
98
Sample 4 (Label D4)
D4 White 1 D4 Film 1
D4 Blank (hole)
X D4 Mar Film
D4 Mar White
X