Embed Size (px)
Citation preview
Research Collection
Doctoral Thesis
Mechanisms of N₂O production in biological wastewatertreatmentfrom pathway identification to process control
Author(s): Wunderlin, Pascal
Publication Date: 2013
Permanent Link: https://doi.org/10.3929/ethz-a-010027252
Rights / License: In Copyright - Non-Commercial Use Permitted
This page was generated automatically upon download from the ETH Zurich Research Collection. For moreinformation please consult the Terms of use.
ETH Library
DISS. ETH NO. 21375
MECHANISMS OF N2O PRODUCTION IN BIOLOGICAL WASTEWATER TREATMENT:
FROM PATHWAY IDENTIFICATION TO PROCESS CONTROL
A thesis submitted to attain the degree of
DOCTOR OF SCIENCES of ETH ZURICH
(Dr. sc. ETH Zurich)
presented by
PASCAL WUNDERLIN
Dipl. Umwelt-Natw. ETH
born on 10.9.1982
citizen of Stein AG
accepted on the recommendation of
Prof. Dr. Hansruedi Siegrist, examiner
Prof. Dr. Kartik Chandran, co-examiner
Dr. Adriano Joss, co-examiner
Dr. Joachim Mohn, co-examiner
Prof. Dr. Eberhard Morgenroth, co-examiner
2013


i
ACKNOWLEDGEMENTS
Wow! It is so exciting to finally write this page! Many times in the past I have thought about that special moment, and tried to imagine how I am going to feel about. Writing these lines, is more than words can say, but definitely a great moment in my life. Now it is time to relax and taking the opportunity to say thank you to a lot of important people who have supported me during the last years.
First of all, a great thank goes to the project partners who have financially supported this doctoral thesis. This is the Swiss Federal Office for the Environment (FOEN), the canton of Bern (AWA), the canton of Basel- Landschaft (AIB), the canton of St. Gallen (AFU), the canton of Thurgau (AfU), the canton of Zurich (AWEL), TBF + Partner AG Consulting Engineers, WWTP region Bern, WWTP ProRheno, WWTP REAL Luzern, WWTP Zurich-Werdhölzli, WWTP Worblental, Abwasserverband Altenrhein, Abwasserverband Morgental, Entsorgung St. Gallen and Zentralschweizer Umweltdirektorenkonferenz (ZUDK).
Then, I would like to thank Hansruedi Siegrist, for supervising this doctoral thesis, and giving me the opportunity and support to conduct this research. It was a great experience and honor to me working with him and learning from his experience.
Also, a big thank goes to Adriano Joss, who has accompanied me on my long way, always bringing in his great expertise. I very much enjoyed his support and open door, whenever I needed his advice.
Thanks are extended to Joachim Mohn, Lukas Emmenegger, Béla Tuzson and Kerstin Zeyer from the laboratory for air pollution and environmental technology of Empa. The collaboration with them added an extra-dimension to my thesis, since this would not have been possible without their expertise in isotopic analysis, and their motivation to collaborate. Moreover, their support and help, concerning the off-gas analysis, were great and indispensable.
Also a big thank goes to Kartik Chandran, from the Columbia University of New York. It is a great honor to have such a renowned expert co-examining my doctoral thesis.
I also would like to thank Eberhard Morgenroth, for his advices and the numerous discussions, especially during the PhD-seminars. I very much enjoyed his inputs and critical feedbacks.
Moreover, I would like to thank Moritz Lehmann, from the Department of Environmental Science of the University of Basel, for bringing in his isotope expertise.
Furthermore, a special thank go to all the colleagues from the process engineering and urban water management department at Eawag. Especially I would like to thank:
ii
(i) Marco Kipf and Adriana Lotito, both of them contributed substantially to the success of this thesis,
(ii) all the PhD-students who made PhD life unforgettable: Sarina Jenni, Christoph Egger, Alexandra Hug, Hanspeter Zöllig, Ania Chomiak, Jonathan Habermacher, Basil Thalmann, Dario Del Giudice, Michele Laureni, Ann-Kathrin Ostermeyer, Joao Mimoso, and the former PhD-students: Christian Abegglen, Markus Gresch, Maryna Peter-Varbanets and David Dürrenmatt,
(iv) Jack Eugster, Richard Fankhauser, Karin Rottermann, Claudia Bänninger and Anja Wollhauser for their technical support in the lab, and
(v) the teaching assistants: René Lüscher, Angela Birrer, Marine Schneider and Lena Mutzner.
Ein grosses Dankeschön geht auch an all meine Freunde, und insbesondere an Beni, für seine guten Ratschläge und unterstützenden Worte, sowie an Philipp Hänger für die Covergestaltung.
Ebenfalls möchte ich mich bei meiner Familie und ganz speziell bei meinen Eltern, Brigitte und Ignaz, bedanken. Sie haben mir ermöglicht, diesen Weg einzuschlagen, und mich dabei immer voll unterstützt.
Abschliessend möchte ich mich herzlichst bei Aline bedanken. Sie hat durch ihr Verständnis und ihre aufmunternden Worte in schwierigen Zeiten einen grossen Anteil am Gelingen dieser Doktorarbeit.
Thanks a lot to all of you.
Pascal Wunderlin, July 2013
iii
TABLE OF CONTENTS
ACKNOWLEDGEMENTS……………………………………………………………………………………………………………. i
TABLE OF CONTENTS…………………………………………..……………………………………………………………….……. iii
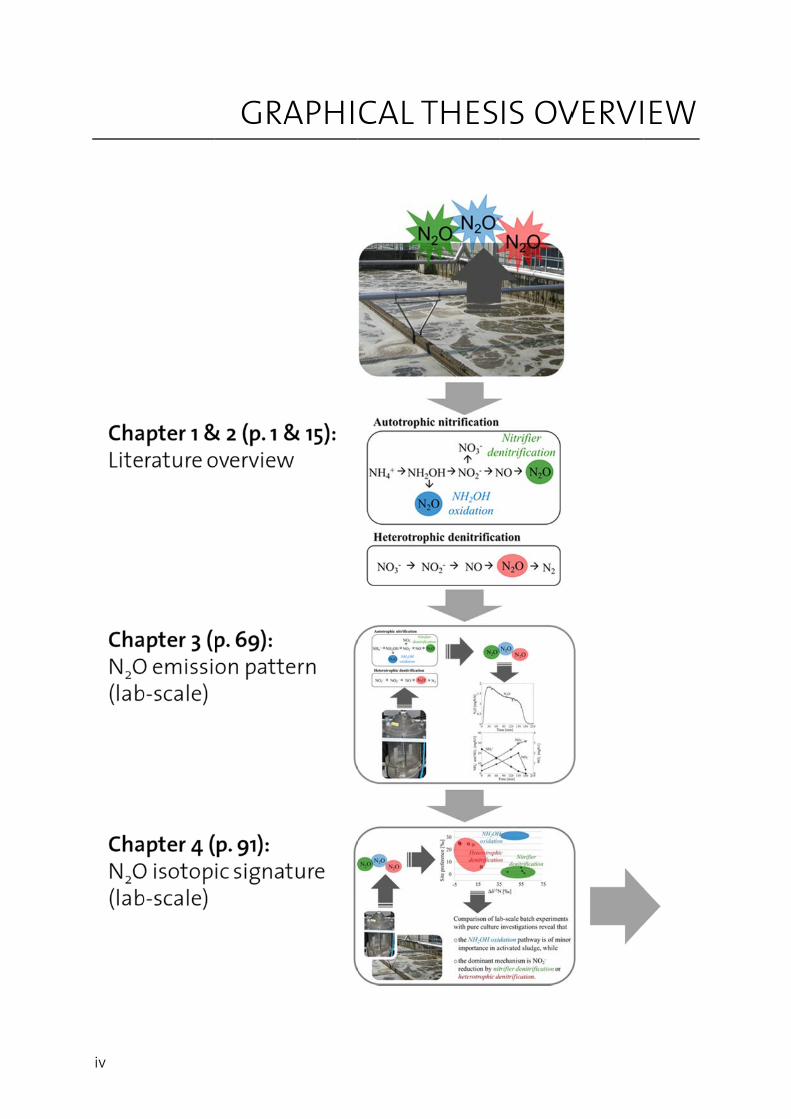
GRAPHICAL THESIS OVERVIEW……………………………………………………………………………………………….. iv
LIST OF FREQUENTLY USED ABBREVIATIONS ………………………………………………………………………. vii
ZUSAMMENFASSUNG………………………………………………………………………………………………………………. ix
SUMMARY……………………………………………………………..…………………………………………………………………….. xi
Chapter 1: General Introduction……………………………………………………………………………………….. 1
Chapter 2: Nitric oxide and nitrous oxide turnover in natural and engineered microbial communities: biological pathways, chemical reactions and novel technologies…………………………………………………………………………………………… 15
Chapter 3: Mechanisms of N2O production in biological wastewater treatment under nitrifying and denitrifying conditions………………………………………………. 69
Chapter 4: Isotope signatures of N2O in a mixed microbial population system: Constraints on N2O producing pathways in wastewater treatment…….. 91
Supporting Information for Chapter 4…………………………………………………….……………………………. 115
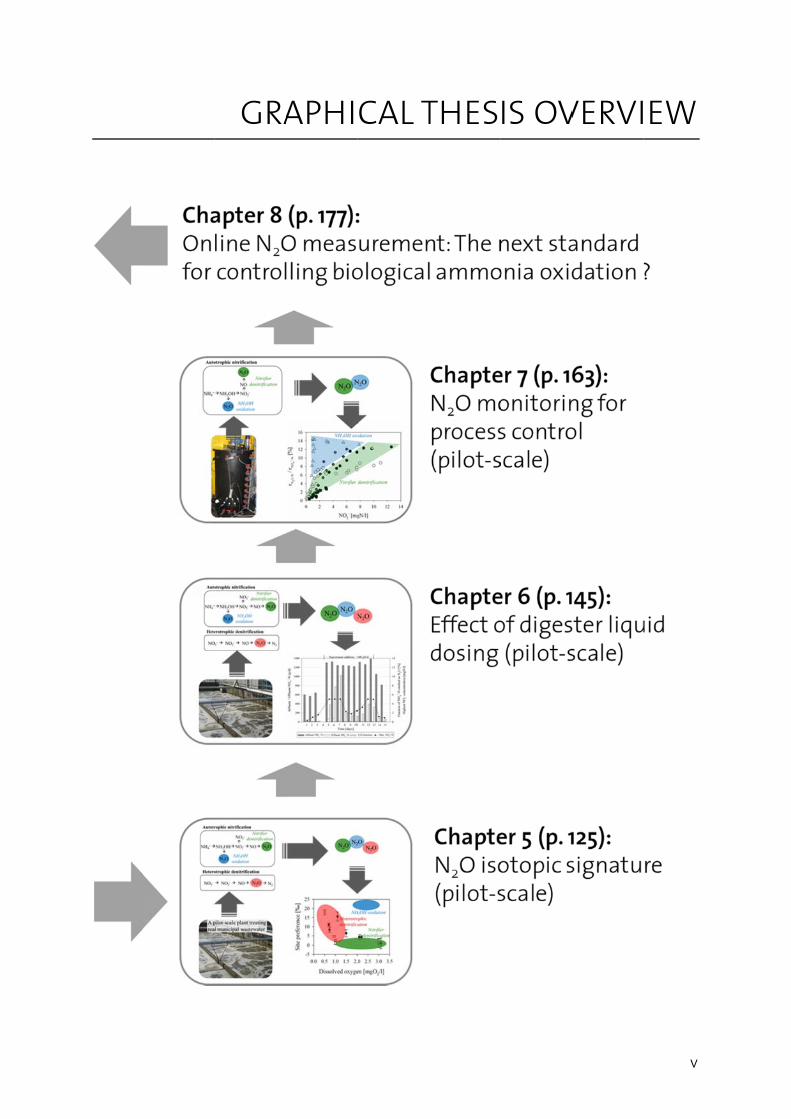
Chapter 5: Pathway identification of N2O production in biological wastewater treatment: Is the nitrogen isotopic signature a suitable tool?.................... 125
Chapter 6: Effect of digester liquid addition on N2O production in a pilot-scale biological wastewater treatment plant………………………………………………………. 145
Chapter 7: Monitoring N2O emission for indirect NO2- measurement and
nitritation-anammox process control………………………………………………………….. 163
Chapter 8: Online N2O measurement: The next standard for controlling biological ammonia oxidation?................................................................................ 177
Chapter 9: General Conclusions………………………………………………………………………………………… 183
Chapter 10: Outlook……………………………………………………………………………………………………………….. 189
Appendix A: N2O emission of sludge incineration……………………………………………………………. 197
Appendix B: N2O emission of biological wastewater treatment…………………………………... 217
CURRICULUM VITAE………………………………………………………………………………………………………………….. 231
iv
GRAAPHICAL T THESIS OVVERVIEW
GRAAPHICAL T THESIS OVVERVI
v
EW

vii
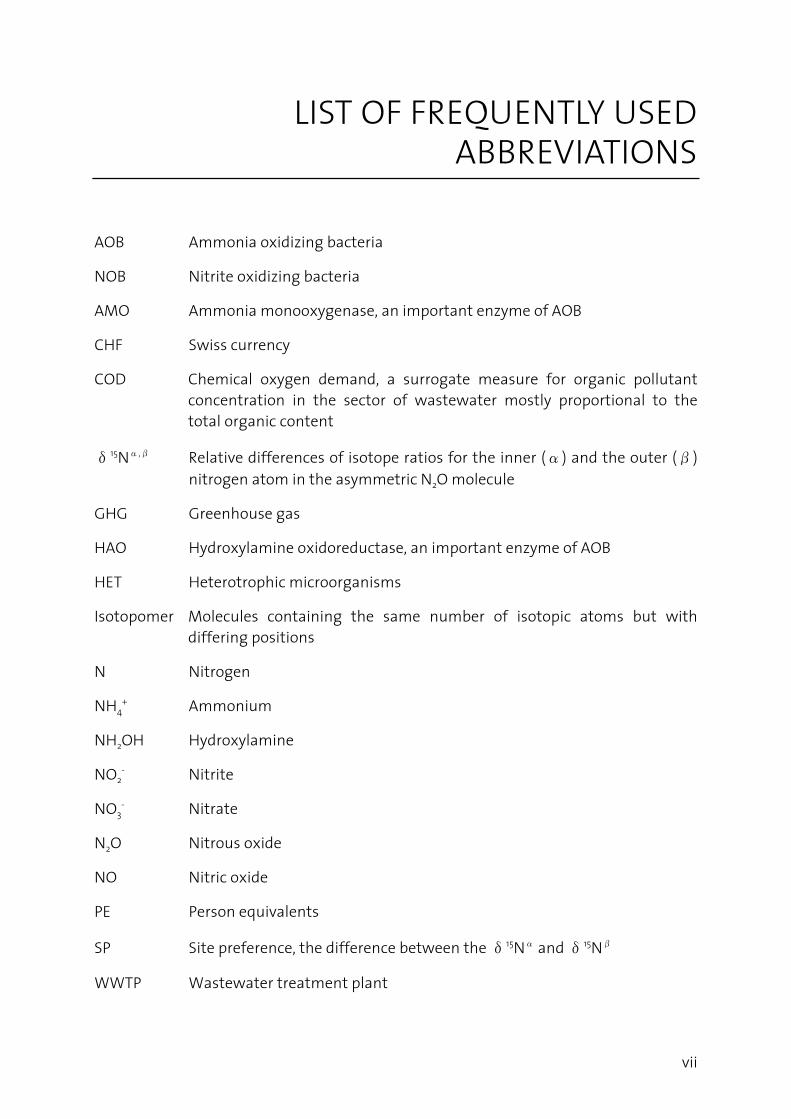
LIST OF FREQUENTLY USED ABBREVIATIONS
AOB Ammonia oxidizing bacteria
NOB Nitrite oxidizing bacteria
AMO Ammonia monooxygenase, an important enzyme of AOB
CHF Swiss currency
COD Chemical oxygen demand, a surrogate measure for organic pollutant concentration in the sector of wastewater mostly proportional to the total organic content
δ15Nα,β Relative differences of isotope ratios for the inner (α) and the outer (β) nitrogen atom in the asymmetric N2O molecule
GHG Greenhouse gas
HAO Hydroxylamine oxidoreductase, an important enzyme of AOB
HET Heterotrophic microorganisms
Isotopomer Molecules containing the same number of isotopic atoms but with differing positions
N Nitrogen
NH4+ Ammonium
NH2OH Hydroxylamine
NO2- Nitrite
NO3- Nitrate
N2O Nitrous oxide
NO Nitric oxide
PE Person equivalents
SP Site preference, the difference between the δ15Nα and δ15Nβ
WWTP Wastewater treatment plant

ix
ZUSAMMENFASSUNG
Lachgas (N2O) ist ein starkes Treibhausgas und bedeutend an der Zerstörung der stratosphärischen Ozonschicht beteiligt. Seine Bildung und Freisetzung in die Atmosphäre ist deshalb von grosser Umweltrelevanz. In der biologischen Abwasserreinigung kann N2O sowohl während der Nitrifikation (Oxidation von Ammonium zu Nitrat), wie auch durch die heterotrophe Denitrifikation (Reduktion von Nitrat zu Luftstickstoff) gebildet werden. Die simultane Aktivität mehrerer Bildungswege erschwert eine eindeutige Identifizierung der dominanten biochemischen Bildungsmechanismen. Auf Grund der grossen Umweltrelevanz von N2O sowie des ungenügenden Prozessverständnisses der N2O Bildung in der Abwasserreinigung, werden in dieser Arbeit die wichtigsten Bildungsprozesse sowie die relevanten Prozessparameter untersucht. Dazu wurde eine Methode angewandt, die es erlaubt die positionsabhängige Verteilung von 15N (genannt Site Preference, SP), wie auch den Anteil von 15N im N2O Molekül zu bestimmen. Darauf aufbauend wurden Betriebsstrategien formuliert und getestet, welche die N2O Emissionen aus der Abwasserreinigung minimieren.
Es konnte gezeigt werden, dass die N2O Bildung unter aeroben Bedingungen durch die Nitrifikanten dominiert wird, wobei hohe Ammonium- und Nitrit- Konzentrationen die N2O Produktion begünstigen. Ein Beispiel stellt die Dosierung von Faulwasser dar, in deren Folge die Ammonium- und Nitrit-Konzentrationen mit den N2O Emissionen deutlich korreliert haben. In diesem Sinne wurde getestet, ob NO2
- indirekt über die N2O Messung detektiert werden kann. Dies wurde für ein Nitritations-Anammox Prozess getestet, bei welchem NO2
- ein wichtiges Zwischenprodukt darstellt, da seine Konzentration ein Indikator für eine mangelnde Prozessstabilität ist. Der Zusammenhang zwischen gelöstem NO2
- und erhöhter N2O Emission konnte bestätigt werden, wobei weitere Bildungswege (z.B. die NH2OH Oxidation) berücksichtigt werden müssen. Insgesamt sind die Resultate jedoch vielversprechend.
Die Mechanismen der N2O Bildung sind jedoch noch nicht vollständig verstanden, was eine Abschätzung der Emissionsfaktoren schwierig macht. Zudem sind die Emissionen räumlich und zeitlich sehr variabel und werden durch eine Vielzahl von Faktoren beeinflusst. Aus diesem Grund sind aktuelle Emissionsabschätzungen noch mit einer grossen Unsicherheit verbunden. Daraus wird gefolgert, dass für die gezielte Optimierung einer Anlage eine fix installierte kontinuierliche N2O-Abluftmessung vorteilhaft ist. Damit kann neben der N2O Emissionsüberwachung auch die Prozessstabilität überwacht werden. Abschliessend kann gesagt werden, dass auf Grund des N2O Emissionspotentials energetische Optimierungen von Abwasserreinigungsverfahren, ohne Mitberücksichtigung der N2O Emissionen, nicht sinnvoll erscheinen.

xi
SUMMARY
Nitrous oxide (N2O) is a strong greenhouse gas, and involved in the destruction of the stratospheric ozone layer. Emissions to the atmosphere are therefore harmful for the environment. In biological wastewater treatment, N2O can be produced in different process steps: during nitrification (the oxidation of ammonia to nitrate) and during heterotrophic denitrification (the reduction of nitrate to dinitrogen gas). However, identifying the most important N2O production pathways is a complex issue, since all of them might be active simultaneously. The aim of this work was therefore (i) to identify the most important N2O production pathway in biological wastewater treatment based on isotopomeric analysis in combination with emission pattern, (ii) to evaluate the impact of relevant operating parameters as well as (iii) to test operating strategies reducing these emissions.
Results indicate that NO2- reduction (presumably by ammonia oxidizing bacteria) is the
dominant N2O production pathway under aerobic conditions. The contribution from NH2OH oxidation in wastewater treatment, however, cannot be completely excluded, but is deemed only of minor importance in this investigation. The addition of digester liquid, equivalent to a temporary increase of the nitrogen load, to a pilot-scale activated sludge plant showed that high nitrogen loads accelerated N2O emission significantly, correlating positively with the NO2
- build-up in the nitrification activated sludge tanks. As such, operating strategies reducing NO2
- accumulation are considered to emit only low amounts of N2O. Given the correlation of soluble NO2
- with N2O emission, the application of N2O analysis as a potential indirect measure for dissolved NO2
- was tested for a nitritation-anammox process. Results clearly confirmed this correlation but showed that also other pathways are relevant for N2O emission in this process (e.g. NH2OH oxidation or yet undefined toxic components). Thus this is a promising approach and needs to be further investigated.
N2O production is a complex issue, since strongly depending on the individual plant operating conditions. This makes it difficult to extrapolate from one treatment plant to another. Given the N2O emission potential, plant optimization from an energetic point of view does not make sense without considering N2O emission. Further, a continuous N2O off-gas online monitoring concept for full-scale plants is considered favorable in order to minimize overall climate impact of wastewater treatment. A financial greenhouse gas crediting system could be a potent incentive to promote widespread adoption of the here proposed approach.


Chapter 1
General Introduction
Chapte
2
Introd
In this biologicidentifireal-tim
In the fN2O, (iiconcernin the f
Manag
The nitfrom -3importais driveAtwatebasical(BartonBosch pthrougcycle anwaters,atmosp
Figure 1oxidatiofixation
N2O is gas (GHcarbon stratos
er 1 - Genera
duction
doctoral cal wastewcation, pla
me data for
following i) some fac
ning N2O p field of biol
ging the n
trogen (N) 3 to +5) is ant compo
en by micrer 2002; Jely driven by
n and Atwa process or bhout the land led to w, acid rain
pheric N2O
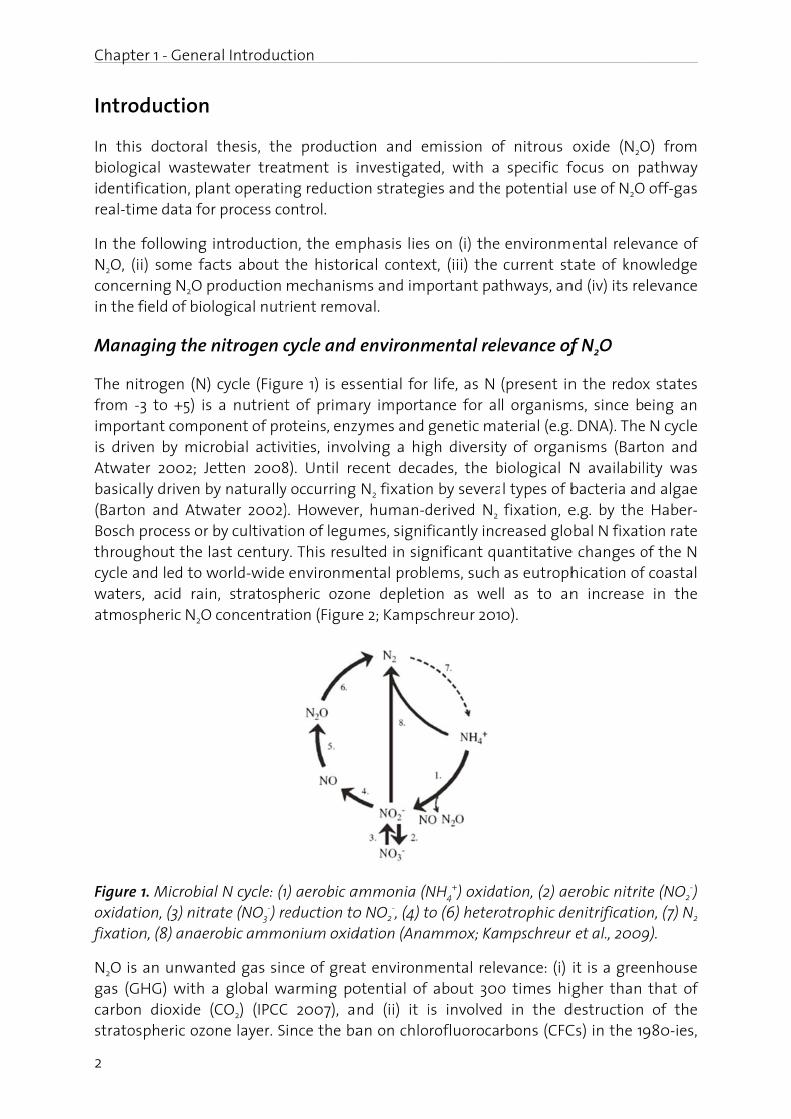
1. Microbiaon, (3) nitran, (8) anaer
an unwantHG) with a dioxide (pheric ozo
al Introduc
thesis, thewater treant operatin
r process co
introductiocts about troduction ogical nutr
nitrogen c
cycle (Figu a nutrient
onent of prorobial activetten 2008y naturallyater 2002)
by cultivatiast century
world-wide n, stratosp concentrat
l N cycle: (1ate (NO3
-) rerobic ammo
ted gas sin a global w
CO2) (IPCCne layer. S
ction
e productitment is ing reductioontrol.
on, the em the histori mechanismrient remov
cycle and
ure 1) is esst of primaoteins, enzyvities, invo8). Until rey occurring ). Howeverion of leguy. This resu environmeheric ozontion (Figure
1) aerobic aeduction toonium oxid
nce of greawarming poC 2007), anince the ba
ion and e investigateon strategi
phasis liesical contexms and impval.
environm
sential for ry importaymes and glving a hig
ecent deca N2 fixationr, human-dmes, signif
ulted in sigental problne depletioe 2; Kamps
ammonia (No NO2
-, (4) tdation (Ana
at environmotential of nd (ii) it ian on chlo
mission ofed, with a es and the
s on (i) the xt, (iii) the portant pat
mental rel
life, as N ance for al genetic magh diversitydes, the b
n by severaderived N2 ficantly incnificant qulems, such on as wel
schreur 201
NH4+) oxida
o (6) heteroammox; Kam
mental rele about 300
is involvedrofluoroca
f nitrous specific f potential
environme current stthways, an
levance of
(present inl organism
aterial (e.g.y of organ
biological Nl types of b
fixation, ecreased glouantitative as eutrophl as to an0).
ation, (2) aeotrophic dempschreur
evance: (i) 0 times higd in the drbons (CFC
oxide (N2Ofocus on p use of N2O
ental relevtate of knond (iv) its re
f N2O
n the redoxms, since b. DNA). The
nisms (Bart N availabil bacteria an
e.g. by theobal N fixate changes ohication ofn increase
erobic nitritenitrificatior et al., 2009
it is a greegher than
destructionCs) in the 19
O) from pathway O off-gas
vance of owledge elevance
x states eing an
e N cycle ton and lity was nd algae Haber-
tion rate of the N f coastal e in the
te (NO2-)
on, (7) N2 9).
enhouse that of of the
980-ies,
N2O is e(Kramliindustrabout 2primari114 yeawith mstratosWuebb
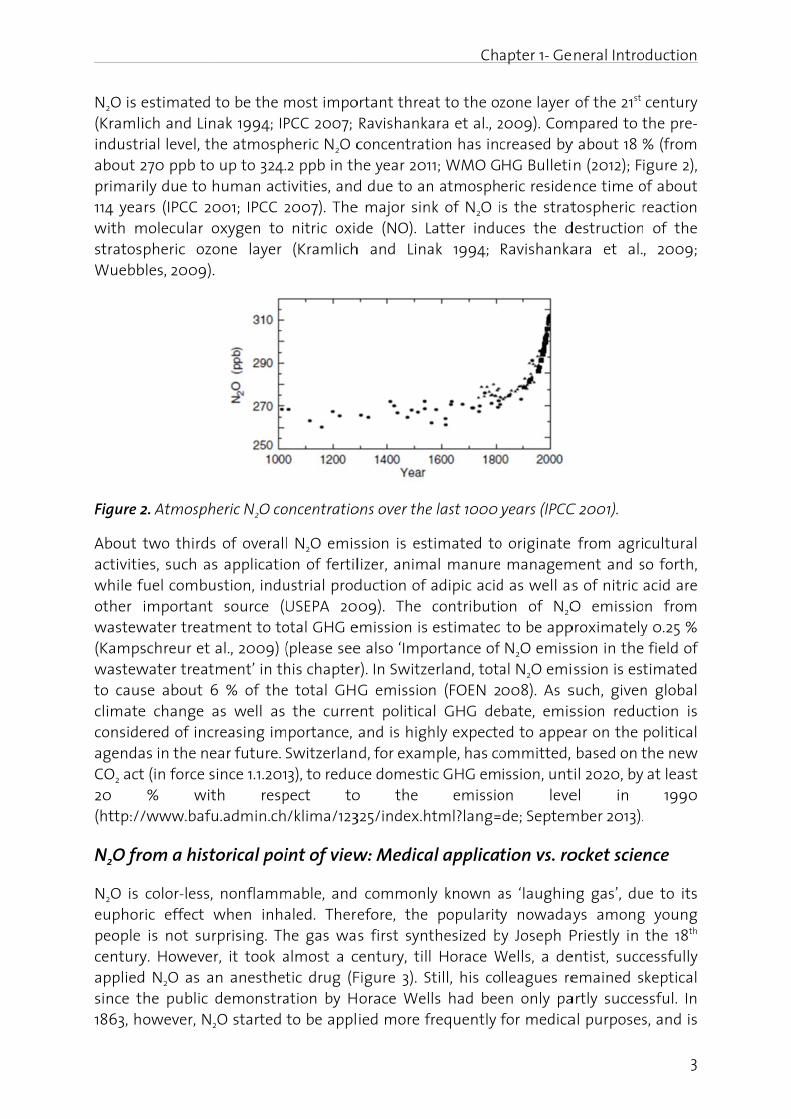
Figure 2
About tactivitiewhile fother wastew(Kampswastewto causclimateconsideagendaCO2 act20 (http://
N2O fro
N2O is euphorpeople centuryappliedsince t1863, ho
estimated ich and Linrial level, th 270 ppb to ily due to hrs (IPCC 20
molecular opheric ozo
bles, 2009).
2. Atmosph
two thirdses, such as
fuel combu important water treatschreur et
water treatse about 6e change aered of incas in the net (in force s
% wit/www.bafu
om a hist
color-less, ric effect w is not sury. Howeverd N2O as ahe public owever, N2
to be the mnak 1994; IPhe atmosp up to 324.
human act001; IPCC 2
oxygen to one layer
heric N2O co
s of overals applicatio
ustion, indu source (ment to to
al., 2009) (ment’ in th
6 % of theas well as reasing im
ear future. since 1.1.201th respu.admin.ch
torical poi
nonflamm when inharprising. Thr, it took an anesthet
demonstra
2O started
most impoPCC 2007; heric N2O c2 ppb in th
tivities, and 2007). The nitric oxid (Kramlich
oncentratio
l N2O emison of fertilustrial prodUSEPA 20otal GHG e (please seehis chaptere total GH the curre
mportance, Switzerlan3), to reduc
pect to/klima/123
int of view
mable, andaled. Therehe gas wa
almost a ctic drug (F
ation by H to be appl
ortant threa Ravishanka concentrathe year 201d due to ane major sinde (NO). L
h and Lina
ons over the
ssion is estlizer, animduction of 09). The
emission is e also ‘Impr). In SwitzeG emissio
ent politica and is highd, for examce domest
o the 325/index.h
w: Medica
commonlefore, the s first synt
century, tilFigure 3). Sorace Welied more f
Cha
at to the ozara et al., 2tion has inc11; WMO Gn atmosphnk of N2O iLatter induak 1994;
e last 1000 y
timated toal manure adipic acid
contributi estimatedortance of erland, totan (FOEN 2al GHG dehly expecte
mple, has coic GHG em
emissiohtml?lang=
al applica
y known a popularitythesized bl Horace W
Still, his cols had bee
frequently
apter 1- Ge
zone layer 2009). Com
creased byHG Bulletieric reside
s the stratuces the dRavishanka
years (IPCC
o originate managem
d as well ason of N2O to be app N2O emissal N2O emi008). As sbate, emised to appeommitted, ission, unt
on leve=de; Septem
tion vs. ro
as ‘laughiny nowadayy Joseph P
Wells, a delleagues reen only pa for medica
eneral Intro
of the 21st mpared to ty about 18 %n (2012); Fince time otospheric r
destructionara et al.
C 2001).
from agriment and s
s of nitric O emissio
proximatelysion in theission is est
such, givenssion redu
ear on the based on t
til 2020, byel in mber 2013).
ocket scien
ng gas’, duys among
Priestly in entist, succemained s
artly succesal purposes
oduction
3
century the pre- % (from igure 2),
of about reaction
of the , 2009;
cultural so forth, acid are n from
y 0.25 % field of timated
n global ction is
political the new at least
1990
nce
ue to its g young the 18th cessfully keptical ssful. In s, and is
Chapte
4
nowadaMai 201
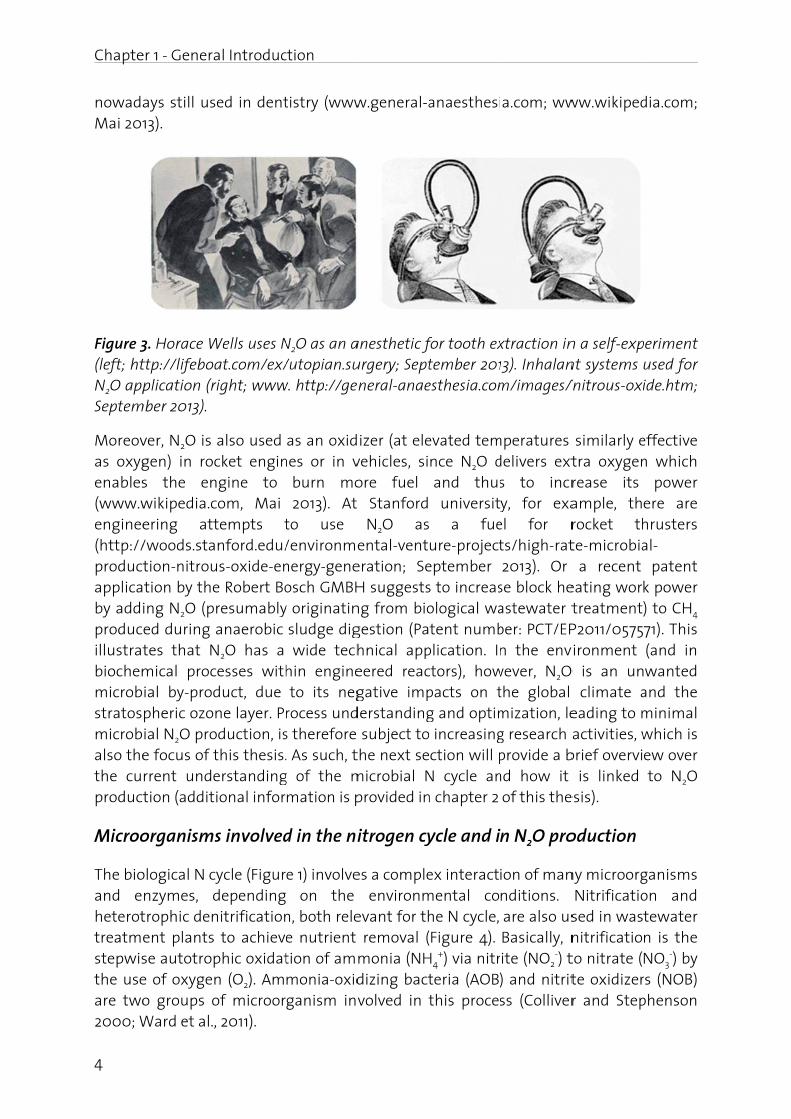
Figure 3(left; htN2O appSeptem
Moreovas oxygenables(www.wenginee(http://productapplicaby addiproducillustratbiochemmicrobstratosmicrobalso thethe cuproduct
Microo
The bioand eheterottreatmestepwisthe useare two2000; W
er 1 - Genera
ays still us13).
3. Horace Wttp://lifeboaplication (r
mber 2013).
ver, N2O is gen) in rocs the enwikipedia.cering att/woods.station-nitroution by theing N2O (ped during tes that Nmical procial by-prodpheric ozoial N2O proe focus of trrent undetion (addit
organism
ological N cnzymes, dtrophic denent plantsse autotrope of oxygeno groups o
Ward et al.,
al Introduc
sed in dent
Wells uses Nat.com/ex/
right; www
also used cket engin
ngine to com, Mai tempts t
anford.edu/us-oxide-ene Robert Boresumably
anaerobic N2O has a cesses withduct, due ne layer. P
oduction, is this thesis.erstandingional infor
s involved
cycle (Figurdependingnitrification to achievphic oxidatn (O2). Am
of microor, 2011).
ction
tistry (www
N2O as an a/utopian.su
w. http://ge
as an oxidnes or in v burn mo 2013). At to use /environmenergy-geneosch GMBH
y originatin sludge dig wide techhin engine to its negrocess unds therefore . As such, t
g of the mmation is p
d in the ni
e 1) involve on the
n, both relee nutrient tion of ammonia-oxidganism inv
w.general-a
anesthetic furgery; Septneral-anae
izer (at elevehicles, siore fuel Stanford
N2O asental-vent
eration; SeH suggestsng from biogestion (Pahnical appeered reacgative imp
derstanding subject to
the next semicrobial N provided in
itrogen cy
es a comple environmevant for th removal (monia (NHdizing bactvolved in t
anaesthesi
for tooth extember 201esthesia.com
evated temnce N2O d
and thus university a fueure-project
eptember s to increasological watent numb
plication. Inctors), howpacts on tg and optim
o increasingction will p
N cycle ann chapter 2
ycle and i
ex interactmental cohe N cycle,
(Figure 4). H4
+) via nitrteria (AOB)
this proces
a.com; ww
xtraction in13). Inhalanm/images/
mperatures delivers exts to incry, for exa
el for rts/high-rat
2013). Or se block heastewater tber: PCT/EPn the env
wever, N2O the global mization, leg research a provide a bnd how it of this the
n N2O pro
ion of mannditions. are also us
Basically, nite (NO2
-) t) and nitritss (Colliver
ww.wikiped
n a self-expnt systems /nitrous-oxi
similarly etra oxygenrease its ample, throcket thte-microbia a recent eating wor treatment)P2011/0575
vironment O is an un
climate a eading to m activities, w
brief overvi is linked
esis).
oduction
ny microorgNitrificatiosed in was
nitrificatio to nitrate (
te oxidizerr and Step
dia.com;
periment used for ide.htm;
effective n which power ere are hrusters al- patent k power ) to CH4 71). This
(and in wanted
and the minimal which is ew over
to N2O
ganisms on and tewater n is the
NO3-) by
rs (NOB) phenson
Chapter 1- General Introduction
5
Denitrification is the heterotrophic reduction of NO3- to atmospheric nitrogen (N2), with
NO2-, nitric oxide (NO) and N2O as obligatory intermediates (detailed overview given in
Zumft 1997).
Ammonia oxidizing bacteria (AOB) and nitrite oxidizing bacteria (NOB)
During the autotrophic oxidation of NH4+ to NO3
-, O2 is used as the terminal electron acceptor and CO2 as the carbon source (Colliver and Stephenson 2000). In activated sludge, the oxidation from NH4
+ via NH2OH to NO2- is performed by AOB (such as
Nitrosomonas oligotropha, Nitrosomonas europaea, and Nitrosospira, a β-subclass of
proteobacteria). NOB perform the oxidation of NO2- to NO3
- (e.g. Nitrobacter, an α-subclass of proteobacteria and Nitrospira an independent line within the domain of bacteria; Bock and Wagner 2006). Under regular operating conditions, Nitrosomonas were reported to be the dominant AOB species and Nitrospira the dominant NOB species at low NH4
+ and NO2- concentrations (Purkhold et al., 2000; Freitag et al., 2005;
Manser et al., 2005).
The enzymes required for the oxidation of NH4+ to NO2
- are ammonia monooxygenase (AMO) and hydroxylamine oxidoreductase (HAO). The latter being the energy-generating step: four electrons are released, two of them are required for the AMO reaction while the other two are used for energy generation. The enzyme for the oxidation of NO2
- to NO3- is called nitrite oxidoreductase (NO2-OR) (Colliver and
Stephenson 2000; Bock and Wagner 2006).
Heterotrophic denitrifying microorganisms (HET)
Heterotrophic denitrification is the reduction of NO3- to N2 by use of organic substrate
as the electron donor and carbon source. It is carried out by prokaryotes (bacteria as well as archaea), such as Paracoccus denitrificans and Alcaligenes faecalis (Zumft 1997). The N2O release is expected to be linked to the activity of N2O-reductase enzymes relative to the activity of N2O forming enzymes (Alinsafi et al., 2008; Knowles 1982; von Schulthess et al., 1994). For example, low dissolved oxygen concentrations may result in incomplete denitrification (Stouthamer 1991), and strong N2O-reductase enzyme inhibition in the presence of O2 (von Schulthess et al., 1994).
Denitrification requires four reductases: NO3-- (NaR / Nap), NO2
-- (NiR), NO (NoR) and N2O (N2OR) reductase (Bergaust, 2008; Zumft 1997). The genes encoding these proteins are activated by several signals: both, (i) no (or low) O2 concentrations as well as (ii) the presence of denitrification intermediates (e.g. NO2
-, NO) are needed for their expression (Bergaust et al., 2008). In general, regulation of these enzymes helps to avoid toxic NO2
- and NO concentrations, as e.g. reported for Nitrosomonas europaea expressing NO2
- reductase (NirK) at toxic NO2
- levels (Beaumont et al., 2004).
N2O production pathways in wastewater treatment
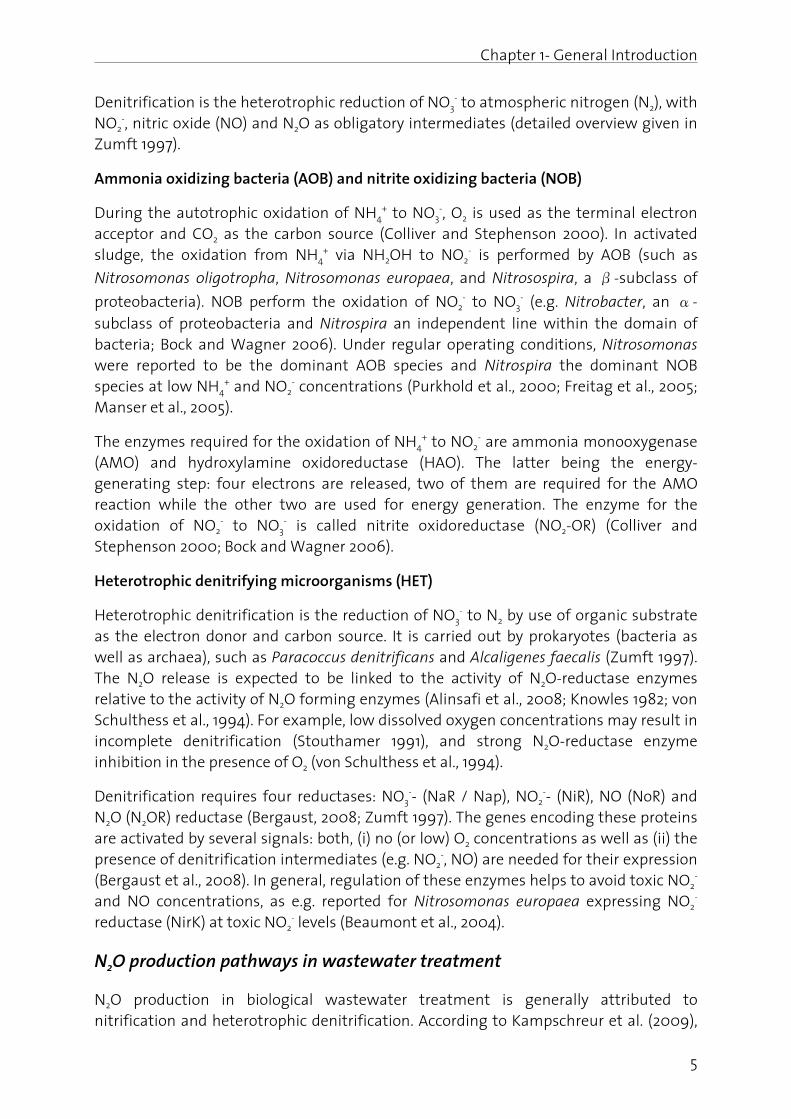
N2O production in biological wastewater treatment is generally attributed to nitrification and heterotrophic denitrification. According to Kampschreur et al. (2009),
Chapte
6
there hydroxyrespect
eAc
wc
a
Ca
Figure heterotdenitrifobligate
Even thhave bconditiobeen aThe scirecognconcenaccumu
er 1 - Genera
are three ylamine otively (adap
Hydroxylambiological et al., 2012AOB (Yu echemical oRitchie and
Nitrifier dewith NH4
+
conditionsStephenso
During hetand its proreducing eChandran availability
4. Overvietrophic denfication or e intermed
hough, thebeen identons is not chieved soentific discized to betration duulation of
al Introduc
main rooxidation, pted from W
mine oxida hydroxylam), being pr
et al., 2010 oxidation wd Nicholas
enitrificatio+, hydroge or elevatn 2000; W
terotrophicoduction th
enzymes, e 2010), NOy of biodeg
w of N2O nitrification NH2OH o
diate (adapt
e dominanttified (Figu yet clear to far aboutcussion, ho
e strongly uring nitrif NO2
- and /
ction
utes for nitrifier de Wunderlin
ation refersmine oxidaobably rela
0), or to ch with NO2
- 1972; Stuve
on is attriben or pyred NO2
- coWrage et al.,
c denitrificherefore as
e.g. due to
2- accumul
radable org
productionn. During oxidation. ted from W
t N2O produre 4), theto avoid unt the mostowever, ha linked to fication as
/ or NH4+ d
N2O prodenitrificati et al., 2012
s to the protion (e.g. H
ated to a hhemical de as an elecen et al., 19
uted to reduvate as oncentratio, 2001).
cation, howssumed to o O2 inhiblation (vonganic comp
n pathway nitrificatio
During heWunderlin et
duction paeir relativennecessaryt importanas been foc N2O produs well as during nitri
uction (Figon and h):
oduction o HNO, N2O2H highly imbaecompositictron acce92).
duction of electron ons (Stuve
wever, N2O be due to bition (Baun Schulthepounds (Ito
ys during aon, N2O caeterotrophit al., 2013).
thways in e contribut emissions
nt parametcused on suction. The heterotropification du
gure 4), weterotroph
of N2O fromH2; Poughoalanced meon of NH2
ptor (chem
NO2- by AO
donors, e.en et al., 1
is an oblig an imbalanumann et ss et al., 19
okawa et a
autotrophican be prodc denitrific
biological tion unders. As such, ter favoringome factoese are (i) phic denitue to high
which arehic denitrif
m intermedon et al., 20etabolic ac
2OH as wemo-denitrif
OB in comb.g. at O2-
1992; Colliv
gate intermnced activi al., 1997; 994), or a l., 2001).
c nitrificatduced via cation, N2O
nutrient rr defined no conseng N2O prod
ors that hav low disso
trification, nitrogen
e called fication,
diates of 001; Law ctivity of ell as to fication;
bination limiting ver and
mediate ity of N- Lu and limited
ion and nitrifier O is an
removal process nsus has duction. ve been
olved O2 (ii) the loads in
Chapter 1- General Introduction
7
combination with limited aeration, and (iii) a low ratio of readily biodegradable organic compounds to NO3
- during heterotrophic denitrification (Kampschreur et al., 2009; Ahn et al., 2010; Desloover et al., 2012; Wunderlin et al., 2012).
A continuously and fast growing understanding of the N2O production mechanisms and the relevant impacting parameters within the near future is highly expected, since in addition to the present thesis, an increasing number of research groups worldwide are working on this topic.
Importance of N2O emission in the field of wastewater treatment
In conventional biological wastewater treatment, N removal occurs via microbial nitrification and heterotrophic denitrification. Most of the wastewater treatment plants in Switzerland are designed for nutrient removal. Basically, aerobic conditions are needed for autotrophic nitrification, while anoxic conditions (absence of O2) and a sufficient amount of organic carbon is required to support heterotrophic denitrification (detailed overview given in Law et al., 2012).
In the last decade, significant efforts have been made to reduce the energy consumption of wastewater treatment plants, mainly by lowering the aeration of the nitrification stage to the required minimum (Kampschreur et al., 2009), because aeration is responsible for about 50 % of the total energy consumption of a wastewater treatment plant (VSA, 2008). This leads to low dissolved O2 concentrations in the bioreactors used for nitrification, which might in combination with high N loads be a trigger for N2O production (please see also ‘N2O production pathways wastewater treatment’ in this chapter).
The literature is currently inconsistent about the quantities of N2O emitted during wastewater treatment: reported values are ranging from 0 to 25 % (Kampschreur et al., 2009; Law et al., 2012). Recently, a measuring campaign across the United States showed that 0.01 to 3.3 % of the removed N is emitted as N2O (Ahn et al., 2010). And in another investigation, where N2O was measured continuously over one year on a full-scale treatment plant in the Netherlands, an emission of 3 % was reported (Daelman et al., 2012). These wide ranges clearly indicate that N2O emission is dynamic, plant specific, and not yet sufficiently understood.
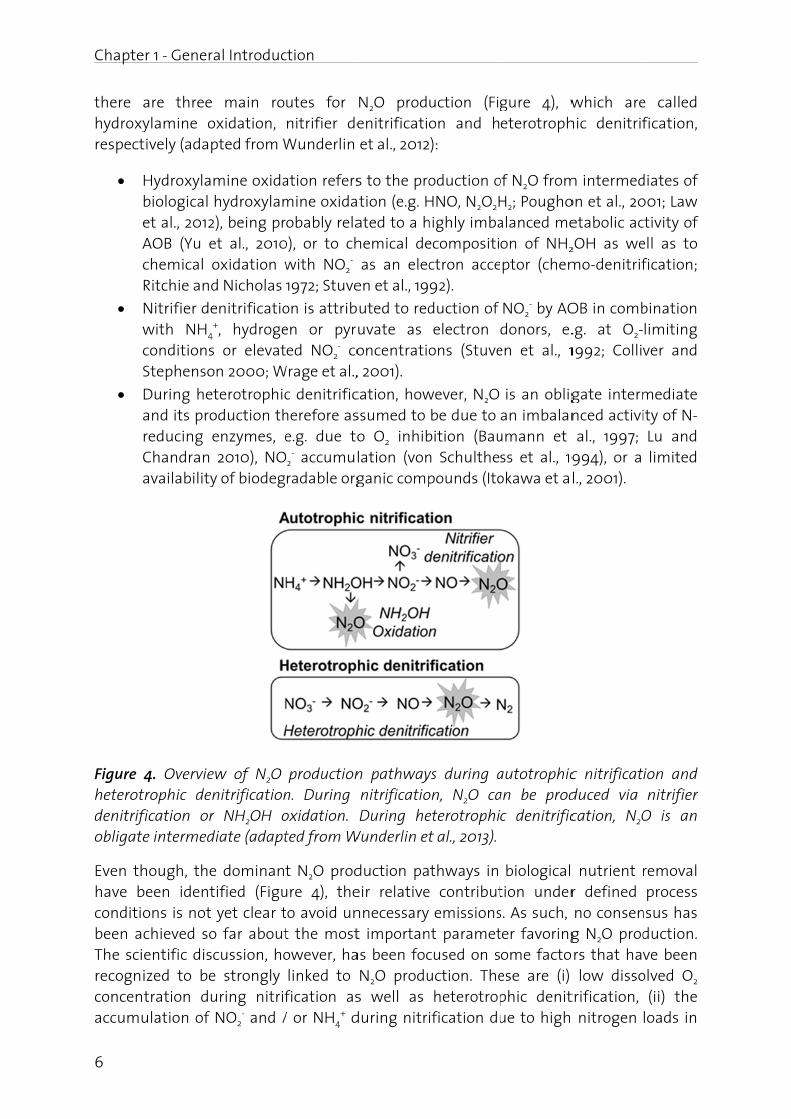
Figure 5 shows a rough estimation of GHG emission (CO2, CH4, N2O) from wastewater treatment. Currently, an average N2O emission of 0.5 % with respect to influent N, is proposed as an acceptable emission level, since in this case, the respective global warming potential is somewhat smaller compared to the one of aeration energy consumption. Moreover, in a recent investigation it is discussed that in addition to biological nutrient removal, N2O production can also be relevant during sludge incineration (please see Appendix A). Data from two Swiss sludge mono-incineration plants indicate that around 0.2 to 1 % of the N influent load was emitted as N2O (equivalent to about 10 to 47 gCO2,equiv/PE/d), which is comparable to estimated N2O emission from the main water line. Moreover, N2O emissions from sludge incineration were negatively correlated with incineration temperatures, being higher at low
Chapte
8
temperclearly focusinemissio
Figure 5et al., 2incinerasludge biogas s
Gene
The ovehow thTherefomunicistructuovervie
(1) Pt
(2) Il
(3) Ips
er 1 - Genera
rature and illustrates ng on moreons need to
5. Estimatio013): N2O i
ation; CH4 digestion a system).
ral objec
erall objeche resultinore, the fopal wastered around
ew on page
Providing ato elucidat
Investigatilab-scale b
Identifyingprocesses spectrome
al Introduc
vice-versa that wastee than just o be taken
on of GHG is produced originates and storag
ctives of
tive of thing emissioocus will bwater tread the follo
e iv and v):
a sound litee N2O prod
ng the N2Oioreactor (C
g the N2O in a lab-sctry (QCLAS
ction
a. Accordinewater trea one aspec
into accou
emission ind during bio most probe (e.g. cont
f this the
s thesis is ons can bebe on mixatment. T
owing mile
erature oveduction me
O productioChapter 3).
O site-speccale reacto; Chapter 4
ngly, the hatment plact like aerant.
n wastewaological nu
bably from tribution of
esis
to identifye reduced
xed microbTo addressestones (pl
erview, andechanisms
on pathwa.
cific isotopor, based o4).
here presenant optimiztion energ
ter treatmeutrient rem the sewer of past-dige
fy mechani in biologbial culture these obease refer
d discussing (Chapter 2)
ys based o
pic signatu on quantu
nted compzation requy, and that
ent (adapteoval as we system, priester if not
sms of N2
ical wastees used fobjectives, t also to th
g suitable m).
on N2O emi
ure of indm cascade
parison (Fiuires a broat all releva
ed from Wuell as duringimary clarift connected
O productewater treor state-ofthe work e graphica
methods a
ission patt
dividual me laser abs
gure 5), ad view, nt GHG
underlin g sludge ifier and d to the
ion and atment.
f-the-art will be al thesis
vailable
tern in a
microbial sorption
Chapter 1- General Introduction
9
(4) Validating the isotope approach during regular operation of a pilot-scale wastewater treatment plant (Chapter 5).
(5) Evaluating the importance of the different operating strategies, and the impact of key factors linked to N2O production (Chapter 6).
(6) Discussing and exemplifying the potential future role of N2O off-gas measurement in wastewater treatment and process control (Chapter 7 and 8).
Significance of the work
This thesis contributes to a better understanding of the relevant N2O production pathways, including the discussion of N2O impacting process parameters. However, the wide range of emissions observed, as well as the multiple factors correlating with them, result in complex and dynamic N2O emission patterns, which makes it challenging to formulate general plant operating strategies for keeping N2O emissions low. Therefore, it is suggested to implement a continuous on-line N2O off-gas measurement at full-scale plants. Investment costs are estimated to be higher, but still in the same order of magnitude, compared to conventional commercially available ion selective electrodes, as usually applied for online NH4
+ or NO3- measurement (please see
also Chapter 8). Consequently, every plant can be optimized individually with respect to its overall carbon footprint. Moreover, the implementation of a financial GHG crediting system, as suggest by Wang et al. (2011), could be an additional incentive to promote widespread adoption of a continuous N2O off-gas monitoring concept.
The site-specific isotopic signatures of N2O produced during biological nutrient removal, and determined in this study, is a novel approach in the field of wastewater treatment, and will very likely be increasingly applied in future work. Accordingly, this method has the potential to substantially improve the understanding of N2O emission dynamics in biological nutrient removal, especially when combined with other tools, such as molecular approaches (e.g. Yu et al., 2010) and mathematical modeling (e.g. Ni et al., 2011; Ni et al., 2012; please see also Chapter 2).
Our improved understanding of the involved mechanisms is deemed to be relevant well beyond wastewater treatment, since the biochemical processes also occur in aquatic environments (e.g. surface waters, sediments), in agricultural soils (the dominant global N2O source) as well as other ecosystems and technical processes, and play a crucial role in the global N cycle.
Outline
In the first part of this thesis (chapters 3 to 5), the mechanisms of N2O production are investigated, based on concentration and emission data combined with the nitrogen isotopic signature of N2O. With the latter being a novel approach in the field of biological nutrient removal. In the second part (chapter 6), the dynamics and levels of
Chapter 1 - General Introduction
10
N2O emissions are studied in pilot-scale. Finally, in chapter 7 and 8, N2O off-gas measurement as a process control parameter was investigated for a nitritation-anammox process, which is judged to be a promising approach for future applications and a necessary stepping stone toward implementation in conventional full-scale plants.
In the first part of Chapter 2 an overview is given over the current state of knowledge concerning N2O production pathways and mechanisms, while the second part focuses on novel methods for future investigations of N2O emissions from natural as well as engineered systems. One of the presented methods is about the nitrogen isotopic
signature of N2O (site preference, δ15N), which is a novel tool in biological wastewater treatment and applied in this thesis (see chapter 3 and 4).
In Chapter 3 the mechanisms of N2O production are investigated in a lab-scale bioreactor. Based on N2O emission data in combination with NH4
+, NO2- and NO3
- concentration profiles, production pathways and mechanisms are discussed. The main conclusion is that there was a small contribution of NH2OH oxidation at the beginning of the aeration phase when NH4
+ concentration is high but NO2- still low, while in the
course of nitrification a shift to nitrifier denitrification driven N2O production is observed.
Chapter 4 introduces the nitrogen isotopic signature of N2O as a novel method in biological wastewater treatment (see Chapter 2). The isotopic signature of the different N2O production pathways was investigated based on lab-scale experiments where substrate availability was controlled in order to ‘promote’ the different production routes. The data confirm that under aerobic conditions, NO2
- reduction, presumably by AOB, is the dominant N2O production pathway. The contribution from NH2OH oxidation is only of minor importance. This is an important aspect concerning the actual debate about the N2O production mechanisms in biological wastewater treatment.
In Chapter 5 the nitrogen isotopic signature of N2O was applied to a pilot-scale treatment plant operated at different dissolved oxygen concentrations. The data confirm the findings of Chapter 3 and 4, where NO2
- reduction was postulated as the dominant N2O production mechanism under aerobic conditions. Moreover, it was confirmed that analyzing N2O nitrogen isotopic signature is a promising tool for pathway identification in biological wastewater treatment.
The effect of digester liquid addition to a pilot-scale activated sludge plant was studied in Chapter 6. Results show that an increase in influent N load resulted in elevated N2O emission, correlating positively with the NO2
- build-up in the nitrification reactor. This underscores the fact that an operating strategy at low dissolved NO2
- (<2 mgN/l) and with equalized N loads prevents substantial N2O emission.
In Chapter 7 and 8 the potential of N2O as an indirect measure for dissolved NO2- will be
discussed in detail. This application is based on a positive correlation between dissolved NO2
- and N2O off-gas concentration (as reported for conventional treatment schemes; see e.g. chapter 6). A nitritation-anammox reactor was operated at different aeration
Chapter 1- General Introduction
11
rates in order to control NO2- accumulation, which is feasible due to the absence of
NOBs, and due to anammox inhibition if molecular oxygen is not promptly depleted by AOB activity. It is shown that N2O emission can be controlled by adjusting the airflow rate, with high emissions at high aeration rates, and vice-versa. Moreover, NO2
- reduction and NH2OH oxidation seemed to contribute to N2O production as independent mechanisms, and thus did not always result in a clear linear NO2
-/N2O correlation. However, reactor operation at minimal N2O emission avoided situations of NO2
- accumulation, which is expected to improve overall process stability of nitritation-anammox reactors, and thus suggests incorporating continuous N2O off-gas measurement in the process control.
Appendix A shows an article about N2O emission of sludge incineration (in German).
Appendix B shows an overview article about N2O emission of biological wastewater treatment (in German).
References
Alinsafi, A., Adouani, N., Beline, F., Lendormi, T., Limousy, L., Sire, O. (2008). Nitrite effect on nitrous oxide emission from denitrifying activated sludge. Process Biochemistry 2008, 43, 683-689.
Ahn, J. H., Kim, S., Park, H., Rahm, B., Pagilla, K. and Chandran, K. (2010). N2O Emissions from Activated Sludge Processes, 2008-2009: Results of a National Monitoring Survey in the United States. Environmental Science & Technology 44(12), 4505-4511.
Barton, P. K. and Atwater, J. W. (2002). Nitrous oxide emissions and the anthropogenic nitrogen in wastewater and solid waste. Journal of Environmental Engineering-Asce 128(2), 137-150.
Baumann, B., Snozzi, M., VanderMeer, J. R. and Zehnder, A. J. B. (1997). Development of stable denitrifying cultures during repeated aerobic-anaerobic transient periods. Water Research 31(8), 1947-1954.
Beaumont, H. J. E., Lens, S. I., Reijnders, W. N. M., Westerhoff, H. V. and van Spanning, R. J. M. (2004). Expression of nitrite reductase in Nitrosomonas europaea involves NsrR, a novel nitrite-sensitive transcription repressor. Molecular Microbiology 54(1), 148-158.
Bergaust, L., Shapleigh, J., Frostegard, A. and Bakken, L. (2008). Transcription and activities of NOx reductases in Agrobacterium tumefaciens: the influence of nitrate, nitrite and oxygen availability. Environmental Microbiology 10(11), 3070-3081.
Bock, E. and Wagner, M. (2006). Oxidation of Inorganic Nitrogen Compounds as an Energy Source. The Prokaryotes 2, 457-495.
Colliver, B. B. and Stephenson, T. (2000). Production of nitrogen oxide and dinitrogen oxide by autotrophic nitrifiers. Biotechnology Advances 18(3), 219-232.
Chapter 1 - General Introduction
12
Daelman, M. R. J., van Dongen, L. G. J. M., van Voorthuizen, E. M., Volcke, E. I. P. and van Loosdrecht, M. C. M. (2012). Methane and nitrous oxide emissions from municipal wastewater treatment. IWA Nutrient Removal and Recovery 2012: Trends in NRR, Harbin, China, 23-25 September 2012.
Desloover, J., Vlaeminck, S. E., Clauwaert, P., Verstraete, W. and Boon, N. (2012). Strategies to mitigate N2O emissions from biological nitrogen removal systems. Current Opinion in Biotechnology, doi:10.1016/j.copbio.2011.12.030.
FOEN (2008). Switzerland's Greenhouse Gas Inventory 1990-2007. National Inventory Report 2009. Submission of 15 April 2009 under the United Nations Framework Convention on Climate Change and under the Kyoto Protocol. Federal Office for the Environment, Bern.
Freitag, T. E., Chang, L., Clegg, C. D. and Prosser, J. I. (2005). Influence of inorganic nitrogen management regime on the diversity of nitrite-oxidizing bacteria in agricultural grassland soils. Applied and Environmental Microbiology 71(12), 8323-8334.
IPCC (2001). Climate Change 2001: The Scientific Basis, Contribution of Working Group I to the Third Assessment Report of the Intergovernmental Panel on Climate Change [Houghton, J.T.,Y. Ding, D.J. Griggs, M. Noguer, P.J. van der Linden, X. Dai, K. Maskell, and C.A. Johnson (eds.)]. Cambridge University Press, Cambridge, United Kingdom and New York, NY, USA, 881pp.
IPCC (2007). Climate Change 2007: The Physical Science Basis, Contribution of Working Group I to the Fourth Assessment Report of the Intergovernmental Panel on Climate Change [Solomon, S., Qin, D. Manning, M., Chen, Z., Marquis, M., Averyt, K.B., Tignor, M., Miller, H.L. (eds)]. Cambridge University Press, Cambridge, United Kingdom and New York, NY, USA, 996pp.
Itokawa, H., Hanaki, K. and Matsuo, T. (2001). Nitrous oxide production in high-loading biological nitrogen removal process under low COD/N ratio condition. Water Research 35(3), 657-664.
Jetten, M. S. M. (2008). The microbial nitrogen cycle. Environmental Microbiology 10(11), 2903-2909.
Kampschreur, M. J. (2010). Dynamics of nitric oxide and nitrous oxide emission during nitrogen conversion processes. Dissertation.
Kampschreur, M. J., Poldermans, R., Kleerebezem, R., Van Der Star, W. R. L., Haarhuis, R., Abma, W. R., Jetten, M. S. M. and Van Loosdrecht, M. C. M. (2009). Emission of nitrous oxide and nitric oxide from a full-scale single-stage nitritation-anammox reactor. 60: 3211-3217.
Kampschreur, M. J., Temmink, H., Kleerebezem, R., Jetten, M. S. M. and van Loosdrecht, M. C. M. (2009). Nitrous oxide emission during wastewater treatment. Water Research 43(17), 4093-4103.
Chapter 1- General Introduction
13
Knowles, R. (1982). Denitrification. Microbiological Reviews 46(1), 43-70.
Kramlich, J. C. and Linak, W. P. (1994). Nitrous-Oxide Behavior in the Atmosphere, and in Combustion and Industrial-Systems. Progress in Energy and Combustion Science 20(2), 149-202.
Law, Y., Ni, B.-J., Lant, P. and Yuan, Z. (2012). N2O production rate of an enriched ammonia oxidising bateria culture exponentially correlates to its ammonia oxidation rate. Water Research 46(10), 3409-3419.
Law, Y., Ye, L., Pan, Y. and Yuan, Z. (2012). Nitrous oxide emissions from wastewater treatment processes. Phil Trans R Soc B 367, 1265-1277.
Lu, H. and Chandran, K. (2010). Factors promoting emissions of nitrous oxide and nitric oxide from denitrifying sequencing batch reactors operated with methanol and ethanol as electron donors. Biotechnology and Bioengineering 106(3), 390-398, 10.1002/bit.22704.
Manser, R., Gujer, W. and Siegrist, H. (2005). Membrane bioreactor versus conventional activated sludge system: population dynamics of nitrifiers. Water Science and Technology 52(10-11), 417-425.
Ni, B.-J., Yuan, Z., Chandran, K., Vanrolleghem, P. A. and Murthy, S. (2012). Evaluating mathematical models for N2O production by ammonia-oxidizing bacteria: Towards a unified model. Proccedings of the 3rd IWA/WEF Wastewater Treatment Modelling (WWTmod) Conference Mont-Sainte-Anne, Québec, Canada.
Ni, B. J., Ruscalleda, M., Pellicer-Nàcher, C. and Smets, B. F. (2011). Modeling nitrous oxide production during biological nitrogen removal via nitrification and denitrification: Extensions to the general ASM models. Environmental Science and Technology 45(18), 7768-7776.
Poughon, L., Dussap, C. G. and Gros, J. B. (2001). Energy model and metabolic flux analysis for autotrophic nitrifiers. Biotechnology and Bioengineering 72(4), 416-433.
Purkhold, U., Pommerening-Roser, A., Juretschko, S., Schmid, M. C., Koops, H. P. and Wagner, M. (2000). Phylogeny of all recognized species of ammonia oxidizers based on comparative 16S rRNA and amoA sequence analysis: Implications for molecular diversity surveys. Applied and Environmental Microbiology 66(12), 5368-5382.
Ravishankara, A. R., Daniel, J. S. and Portmann, R. W. (2009). Nitrous oxide (N2O): the dominant ozone-depleting substance emitted in the 21st century. Science 326(5949), 123-125.
Ritchie, G. A. and Nicholas, D. J. (1972). Identification of the sources of nitrous oxide produced by oxidative and reductive processes in Nitrosomonas europaea. Biochemical Journal 126(5), 1181-1191.
Chapter 1 - General Introduction
14
Stouthamer, A. H. (1991). Metabolic regulation including anaerobic metabolism in Paracoccus denitrificans. Journal of Bioenergetics and Biomembranes 23(2), 163-185.
Stuven, R., Vollmer, M. and Bock, E. (1992). The impact of organic matter on nitric oxide formation by Nitrosomonas europaea. Archives of Microbiology 158(6), 439-443.
USEPA (2009). Inventory of U.S. Greenhouse Gas Emissions And Sinks: 1990-2007, U.S. Environmental Protection Agency, Washington DC, Report No. EPA 430-R09-004.
von Schulthess, R., Wild, D. and Gujer, W. (1994). Nitric and Nitrous Oxides from Denitrifying Activated-Sludge at Low-Oxygen Concentration. Water Science and Technology 30(6), 123-132.
VSA, (2008). Handbuch Energie in ARA. Neuauflage des Handbuchs Energie in ARA von 1994.
Wang, J. S., Hamburg, S. P., Pryor, D. E., Chandran, K. and Daigger, G. T. (2011). Emissions credits: Opportunity to promote integrated nitrogen management in the wastewater sector. Environmental Science and Technology 45(15), 6239-6246.
Ward, B. B., Arp, D. J. and Klotz, M. G. (2011). Nitrification. Washington, USA: IWA Publishing.
WMO greenhouse gas bulletin (2012). The state of greenhouse gases in the atmosphere based on global observations through 2011. www.wmo.int
Wrage, N., Velthof, G. L., van Beusichem, M. L. and Oenema, O. (2001). Role of nitrifier denitrification in the production of nitrous oxide. Soil Biology and Biochemistry 33(12-13), 1723-1732.
Wuebbles, D. J. Nitrous oxide: No laughing matter. Science 2009, 326 (5949), 56-57.
Wunderlin, P., Mohn, J., Joss, A., Emmenegger, L. and Siegrist, H. (2012). Mechanisms of N2O production in biological wastewater treatment under nitrifying and denitrifying conditions. Water Research 46(4), 1027-1037.
Wunderlin, P., Mohn, J., Joss, A., Emmenegger, L. and Siegrist, H. (2013). Lachgas-Emissionen aus ARA - Relevanz, Bildungswege und Reduktionsstrategien. Aqua & Gas 2, 54-59.
Yu, R., Kampschreur, M. J., Loosdrecht, M. C. M. v. and Chandran, K. (2010). Mechanisms and specific directionality of autotrophic nitrous oxide and nitric oxide generation during transient anoxia. Environmental Science & Technology 44(4), 1313-1319.
Zumft, W. G. (1997). Cell biology and molecular basis of denitrification. Microbiology and Molecular Biology Reviews 61(4), 533-616.
Chapter 2
Nitric oxide and nitrous oxide turnover in natural and engineered microbial communities:
biological pathways, chemical reactions and novel technologies
This chapter has been published as:
Schreiber, F.; Wunderlin, P.; Udert, K. M.; Wells, G. F.. Frontiers in Microbiology, 2012, 3, 10.3389/fmicb.2012.00372.
Chapte
16
Graph
er 2
hical absstract
Chapter 2
17
Abstract
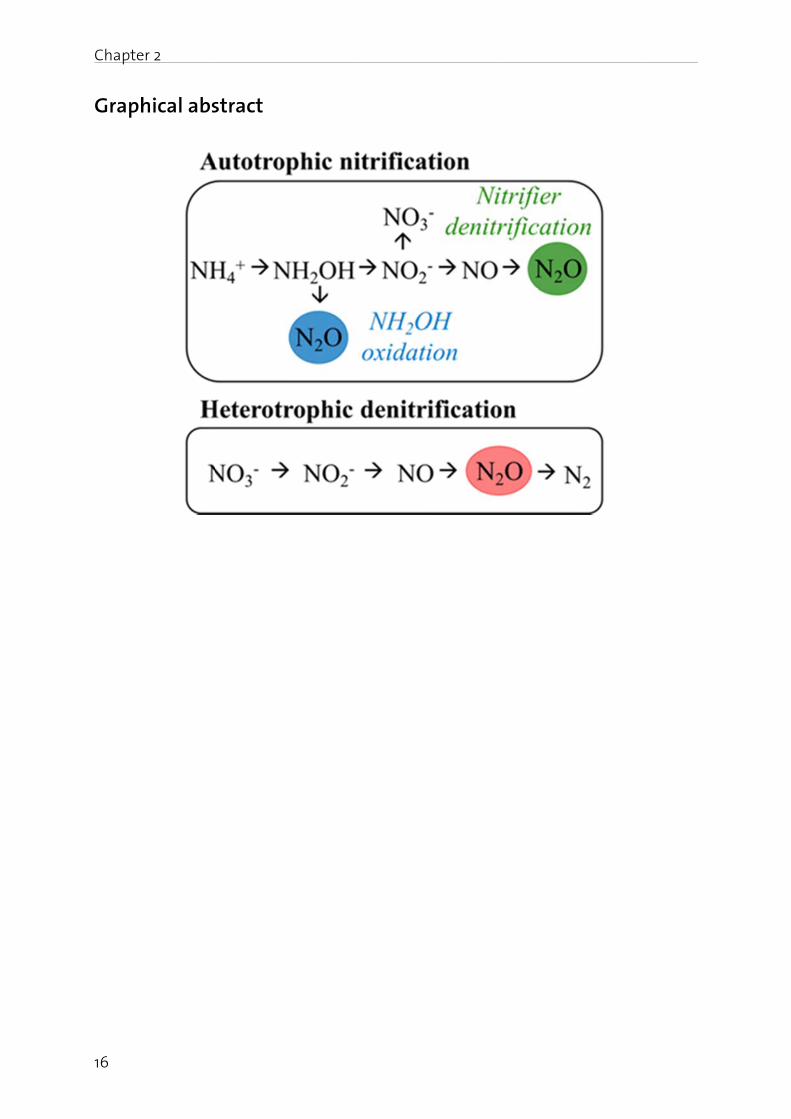
Nitrous oxide (N2O) is an environmentally important atmospheric trace gas because it is an effective greenhouse gas and it leads to ozone depletion through photo-chemical nitric oxide (NO) production in the stratosphere. Mitigating its steady increase in atmospheric concentration requires an understanding of the mechanisms that lead to its formation in natural and engineered microbial communities. N2O is formed biologically from the oxidation of hydroxylamine (NH2OH) or the reduction of nitrite (NO2
-) to NO and further to N2O. Our review of the biological pathways for N2O production shows that apparently all organisms and pathways known to be involved in the catabolic branch of microbial N-cycle have the potential to catalyze the reduction of NO2
- to NO and the further reduction of NO to N2O, while N2O formation from NH2OH is only performed by ammonia oxidizing bacteria. In addition to biological pathways, we review important chemical reactions that can lead to NO and N2O formation due to the reactivity of NO2
-, NH2OH and nitroxyl (HNO). Moreover, biological N2O formation is highly dynamic in response to N-imbalance imposed on a system. Thus, understanding NO formation and capturing the dynamics of NO and N2O build-up are key to understand mechanisms of N2O release. Here, we discuss novel technologies that allow experiments on NO and N2O formation at high temporal resolution, namely NO and N2O microelectrodes and the dynamic analysis of the isotopic signature of N2O with quantum cascade laser based absorption spectroscopy. In addition, we introduce other techniques that use the isotopic composition of N2O to distinguish production pathways and findings that were made with emerging molecular techniques in complex environments. Finally, we discuss how a combination of the presented tools might help to address important open questions on pathways and controls of nitrogen flow through complex microbial communities that eventually lead to N2O build-up.
Key words
Isotopic signature; micro-sensors; molecular tools; dinitrogen oxide; nitrogen monoxide; pathway identification; quantum cascade laser based absorption spectrometry, site preference
Chapter 2
18
Introduction
Nitric oxide (NO) and nitrous oxide (N2O) are atmospheric trace gases that influence atmospheric chemistry and the greenhouse effect. Biological and chemical processes produce N2O on the earth surface (Crutzen, 1979). Entering the stratosphere, N2O is converted to NO by photo-oxidation. NO together with nitrogen dioxide (NO2) participate in a set of reactions that transfer ozone (O3) to molecular oxygen (O2), thereby leading to O3 layer depletion. In fact, N2O is and will remain the dominant O3-depleting substance in the 21st century (Ravishankara et al., 2009), since the use of chlorofluorocarbons has been restricted by the Montreal Protocol. In addition, N2O is a potent greenhouse gas. The infrared radiative forcing of one N2O molecule is 206 times that of one carbon dioxide (CO2) molecule (Stein and Yung, 2003). Together with the long atmospheric lifetime of N2O (~ 120 years) this results in a ~300 times higher global warming potential of N2O than that of CO2 on a per molecule basis. Overall, N2O contributes 6 to 8 % to the anthropogenic greenhouse effect, despite its relatively low atmospheric concentration (~322 ppbv) (Montzka et al., 2011).
Over the last 100 years atmospheric N2O concentrations have been steadily increasing due to the massive introduction of fixed nitrogen into the environment by humans (IPCC, 2001). Counteracting the further increase of N2O in the atmosphere will rely on (i) decreasing the introduction of fixed nitrogen into the environment by humans, (ii) exactly quantifying the important environmental sources of N2O, and (iii) implementing effective strategies to mitigate its formation in nitrogen-transforming, man-made ecosystems such as agriculture and wastewater treatment. Thus, there is an urgent need to understand the mechanisms that underpin the formation of N2O in natural and engineered microbial communities.
In this review, we will outline the current state-of-the-art on biological and chemical processes that can produce and consume N2O and NO - an important precursor of N2O in many biological pathways. We will discuss pathways that produce NO and N2O in natural and engineered microbial communities and experimental approaches that can be used to distinguish between different pathways in these systems. Importantly, NO and N2O formation can be highly dynamic and occur at small spatial scales. Thus, we will further introduce two novel technologies that provide such data and how they can lead to mechanistic insight: (i) NO and N2O microelectrodes and (ii) the analysis of the site preference in N2O measured with quantum cascade laser based absorption spectrometry. In addition, we discuss the challenges of incorporating molecular biological techniques in this scheme.
Biological pathways for NO and N2O production
The study of laboratory cultures for pathways and controls of NO and N2O production in different organisms has generated considerable knowledge, which was partly reviewed recently (Stein, 2011; Chandran et al., 2011). Figure 1 shows that the sequential reduction of nitrite (NO2
-) to NO and further to N2O can be performed by all organisms involved in the catabolic branch of the N-cycle. While all N-cycle organisms can perform
Chapter 2
19
these reactions it is currently believed that denitrifiers and ammonia oxidizing bacteria (AOB) and archaea (AOA) are the most important environmental sources of N2O. However, in the following section we additionally review the evidence for NO and N2O production by nitrite oxidizing bacteria (NOB), anaerobic methane (N-AOM) and ammonia oxidizing bacteria (anammox), and bacteria that perform dissimilatory nitrate reduction to ammonia (DNRA). Even though it is clear that these bacteria can produce NO and N2O there is only few information on the controls, conditions and magnitude for NO and N2O production by these bacteria in the laboratory and in the environment. This should be an important aspect of future research as e.g. DNRA and anammox are the major N-conversion pathways in some important environments.
Denitrification. The key enzyme for NO formation during denitrification is nitrite reductase (Nir). Purification and characterization of Nir from several bacteria revealed two entirely different periplasmic enzymes: a heme-containing cytochrome cd1 Nir (NirS) and a copper-containing Nir (NirK) as reviewed by Cutruzzolà (1999). Reduction of NO to N2O is mediated by respiratory nitric oxide reductases (Nor). Respiratory Nor proteins are integral membrane proteins that fall into two groups: one is a cytochrome bc complex that can use c-type cytochromes as electron donors (cNor), whereas the other one lacks a cytochrome c component and accepts electrons from quinols (qNor; sometimes termed NorZ) (Hendriks et al., 2000; Zumft, 2005). Few bacteria use qNor for classical denitrification. Rather, qNor is mainly encoded by pathogenic bacteria that use it for NO detoxification and the survival of anoxic periods when expressed in concert with Nir, as shown for Neisseria spp. (Anjum et al., 2002; Rock et al., 2007). The final step in denitrification is mediated by nitrous oxide reductase (Nos), a multi-copper enzyme that reduces N2O to dinitrogen (N2) (Zumft and Kroneck, 2007).
N2O reduction by Nos is the only known N2O consuming process that can counteract release of N2O from ecosystems (Richardson et al., 2009). Accumulation of N2O is often observed in pure cultures (Otte et al., 1996; Baumann et al., 1996; Kester et al., 1997; Bergaust et al., 2010) and mixed microbial communities (Firestone and Tiedje, 1979; Firestone et al., 1980; Morley et al., 2008; Kampschreur et al., 2008b; Schreiber et al., 2009; Elberling et al., 2010; Pellicer-Nàcher et al., 2010; Liengaard et al., 2011) during transitions from anoxic to oxic conditions or vice versa (Table 1). Even in pure cultures the physiological basis for this is not well understood because it probably has multiple, strain-specific reasons. It has been hypothesized that Nos is - unlike Nir and Nor - inhibited by O2 (Morley et al., 2008), but in pure cultures evidence for O2-insensitive (Berks et al., 1993) and O2-sensitive (Otte et al., 1996) Nos have been reported. Likewise, it has been argued that expression of Nos is slower than that of the preceding denitrification enzymes (Stief et al., 2009; Firestone et al., 1980), but in Paracoccus denitrificans Nos synthesis is faster (Baumann et al., 1996; Bergaust et al., 2010) and in Pseudomonas stutzeri Nos is even constitutively expressed at low levels (Körner and Zumft, 1989). More studies on Nos expression in relation to N2O production pathways and on Nos inhibition by O2 are needed with environmentally relevant isolates and mixed microbial communities. Additional factors that lead N2O accumulation are the slower turnover of Nos at low pH as compared to nitrate reductase (Nar), Nir and Nor (Richardson et al., 2009; Bergaust et al., 2010), low pH during Nos assembly (Bergaust et
Chapte
20
al., 20102008), Schreiblimitati
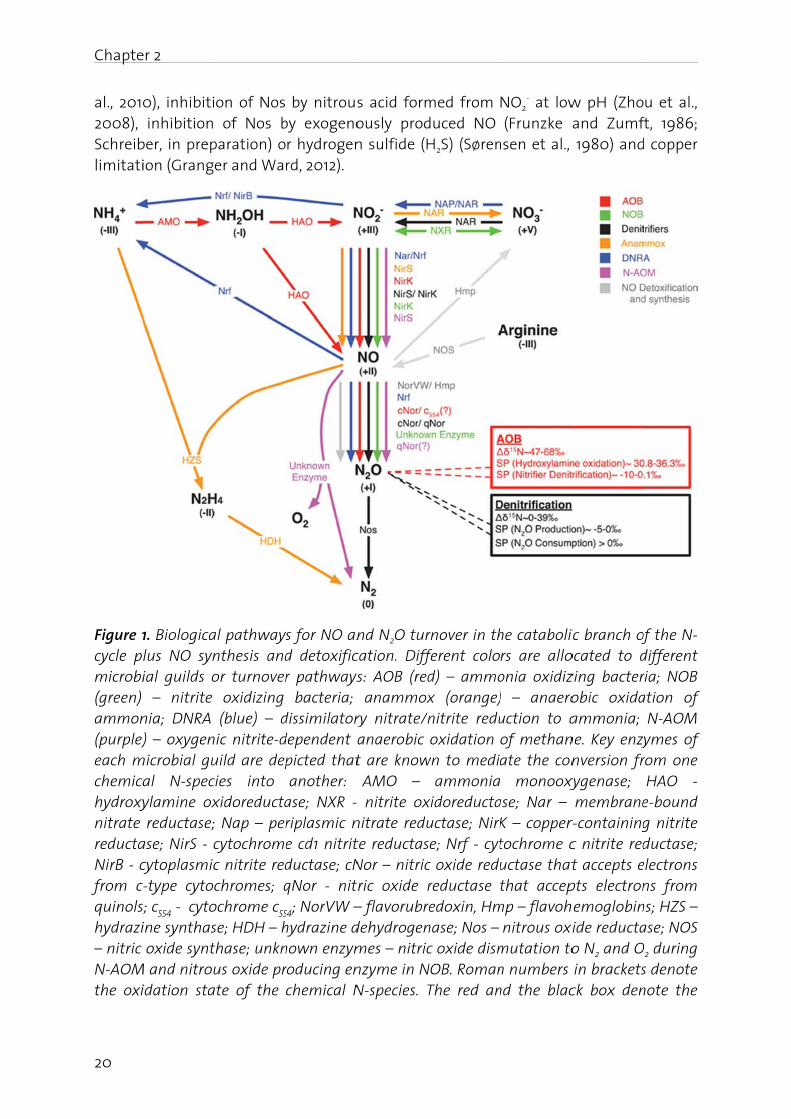
Figure 1cycle pmicrobi(green) ammon(purple)each mchemicahydroxynitrate reductaNirB - cfrom cquinolshydrazi– nitric N-AOMthe oxi
er 2
0), inhibiti inhibition ber, in prepion (Grang
1. Biologicalus NO synial guilds o – nitrite nia; DNRA ) – oxygen
microbial gual N-specylamine ox reductase;ase; NirS - ccytoplasmic-type cytoc
s; c554 - cytoine synthas oxide synt
M and nitrouidation sta
on of Nos of Nos b
paration) oer and Wa
al pathwaysnthesis andor turnover oxidizing (blue) – d
nic nitrite-duild are depcies into xidoreducta; Nap – percytochromec nitrite redchromes; q
ochrome c55
se; HDH – hthase; unknus oxide pr
ate of the
by nitrousby exogenor hydrogenrd, 2012).
s for NO and detoxificr pathways bacteria;
dissimilatorydependent apicted thatanother:
ase; NXR - riplasmic ne cd1 nitritductase; cNqNor - nit
54; NorVW –hydrazine dnown enzymroducing enchemical N
s acid formously prodn sulfide (H
nd N2O turcation. Diffs: AOB (red anammoxry nitrate/n anaerobic t are know
AMO – nitrite ox
nitrate redute reductasNor – nitricric oxide r– flavorubredehydrogenmes – nitricnzyme in NN-species. T
med from duced NO H2S) (Søren
rnover in thferent colod) – ammox (orange)nitrite redu oxidation
wn to mediaammonia
xidoreductauctase; NirKe; Nrf - cyt
c oxide redureductase edoxin, Hm
nase; Nos – c oxide dism
NOB. RomanThe red an
NO2- at low
(Frunzke ansen et al.,
he catabolirs are alloonia oxidiz) – anaerouction to a of methanate the con monooxy
ase; Nar – K – coppertochrome cuctase thatthat accep
mp – flavoh nitrous oximutation ton numbers nd the blac
w pH (Zho and Zumf
1980) and
ic branch ofocated to dzing bacterobic oxidaammonia;
ne. Key enzynversion fr
xygenase; membraner-containingc nitrite redt accepts e
pts electronhemoglobinxide reducta
o N2 and O in bracketsck box den
u et al., ft, 1986; d copper
of the N-different ria; NOB ation of N-AOM ymes of
rom one HAO -
e-bound g nitrite ductase;
electrons ns from
ns; HZS – ase; NOS
O2 during s denote note the
Chapter 2
21
isotopic composition (δ15N) and the site preference (SP) in isotopomers of N2O produced by AOB and denitrifiers, respectively.
Ammonia oxidizing bacteria (AOB). High levels of NO and N2O can be produced by pure cultures of aerobic AOB (Lipschultz et al., 1981; Kester et al., 1997; Shaw et al., 2006), but the mechanism is not completely understood. Generally, two different pathways are inferred. First, the activity of nitrifier-encoded NirK and cNor reduces NO2
- to NO and N2O in a pathway termed nitrifier denitrification (Poth and Focht, 1985; Wrage et al., 2001; Schmidt et al., 2004b). A few reports exist on N2 formation by AOB during nitrifier denitrification, but a nosZ gene or functional Nos in AOB was not demonstrated (Poth, 1986; Schmidt et al., 2004b; Schmidt, 2009). The term nitrifier denitrification is somewhat misleading as it has until now not been shown that it is a true dissimilatory process for energy conservation and growth, but rather may be a detoxification mechanism to counteract the accumulation of NO2
- to toxic concentrations (Beaumont et al., 2002, 2004a, 2004b).
In the second pathway, N2O is formed by hydroxylamine (NH2OH) oxidation. The current model is that hydroxylamine oxidoreductase (HAO) oxidizes NH2OH to NO (Hooper, 1968; Hooper and Terry, 1979). NO is then reduced to N2O by a yet unidentified Nor; a potential candidate is cytochrome c554 (Upadhyay et al., 2006). However, the catalytic cycle of HAO, including its intermediates and its catalytic potential are a subject of ongoing debate (Hendrich et al., 2002; Cabail and Pacheco, 2003; Cabail et al., 2005; Fernández et al., 2008; Kostera et al., 2008) and as of yet direct formation of N2O from HAO or other reactions cannot be excluded. Indeed, the difference in the site preference (SP) of N2O produced by NH2OH oxidation and nitrifier denitrification indicates that N2O might be produced by HAO by a mechanism that (i) either does not involve NO reduction by canonical Nor used for nitrifier denitrification or (ii) does proceed via a completely different mechanism without free NO as intermediate (discussed in section ‘site preference’ and ‘HNO as intermediate of enzymatic hydroxylamine oxidation’). Both nitrifier denitrification and NH2OH oxidation require O2 to activate ammonia (NH3) with ammonia monooxygenase (AMO) to NH2OH, which serves as a substrate for HAO or as electron donor to nitrifier denitrification. A pathway in which AOB perform denitrification with organic substrates instead of NH3 as electron donor (Schmidt, 2009) should be considered heterotrophic denitrification performed by AOB. Ammonia oxidizing archaea (AOA) have also been demonstrated to produce N2O probably by pathways akin to AOB (Santoro et al., 2011).
The relative importance of NH2OH oxidation and nitrifier denitrification for NO and N2O production is still debated. Based on pure culture investigations Yu et al. (2010) hypothesized that a high NH3 oxidation activity favors N2O production via NH2OH oxidation. Similarly, Wunderlin et al. (2012) found that NH2OH oxidation is favored by high NH3 and low NO2
- concentrations, and a high nitrification rate in a mixed culture for treating municipal wastewater. Moreover, stable nitrogen isotopes work with AOB pure cultures showed that NH2OH oxidation contributes to N2O production mainly at high O2 whereas nitrifier denitrification is more active at low O2 concentrations (Sutka et al. 2006).
Chapter 2
22
Nitrite oxidizing bacteria (NOB). NOB form NO and N2O during denitrification of nitrate (NO3
-) or NO2- with pyruvate or glycerol as electron donor under anoxic conditions
(Freitag et al., 1987; Ahlers et al., 1990), but a known NO reductase could not be identified in the genomes of different Nitrobacter species and 'Candidatus Nitrospira defluvii' (Starkenburg et al., 2006, 2008b; Lücker et al., 2010). Under anoxic conditions nitrite oxidoreductase (NXR) mediates NO3
- reduction to NO2-, while it mediates the
reverse reaction under oxic conditions (Freitag et al., 1987). NOB actively express NirK, which co-purifies with NXR, in the presence of NO2
- and if O2 concentrations are low (Ahlers et al., 1990; Starkenburg et al., 2008a). NO generated by NOB-NirK is thought to direct cellular electron flux either toward O2 respiration at high O2 concentrations or toward NADH synthesis by reversibly inhibiting cytochrome oxidase at low O2 concentrations. An interesting question to explore in natural communities would be whether NO produced by AOB or denitrifying bacteria can influence the activity of NOB.
Dissimilatory nitrate reduction to ammonia (DNRA). NO and N2O turnover by bacteria that perform DNRA has been mainly investigated in Escherichia coli and Salmonella typhimurium. In E. coli, NO formation is mediated by cytochrome c nitrite reductase (Nrf) under anoxic conditions in the presence of NO3
- and NO2- (Corker and Poole, 2003).
NO detoxifying enzymes, such as flavorubredoxin, may further reduce NO to N2O. On the other hand, E. coli Nrf reduces NO to N2O or NH3 if electrons are donated to the enzyme at high or low potential, respectively (Costa et al., 1990), contributing to detoxification of exogenously generated NO (van Wonderen et al., 2008). Aerobic and anaerobic NO formation from NO2
- in S. typhimurium is mediated by membrane-bound nitrate reductase (Nar). Under aerobic conditions, activity of NO detoxifying Hmp (see below) oxidizes NO to NO3
- resulting in non-detectable NO concentrations in culture suspensions (Gilberthorpe and Poole, 2008).
Anaerobic methane and ammonia oxidizing bacteria. Bacteria that mediate the oxygenic nitrite-dependent oxidation of methane (N-AOM) and anaerobic ammonia oxidation (anammox) have been shown to use NO as an intracellular intermediate produced by NO2
- reduction via NirS while they consume exogenous NO without concurrent N2O formation (Ettwig et al., 2010; Kartal et al., 2010, 2011). Rather, N-AOM dismutates NO to form N2 and O2, while anammox couples the reduction of NO to a condensation with NH3 to produce hydrazine (N2H4). Both have the genetic potential to reduce NO to N2O; anammox bacteria encode for flavorubredoxin (Strous et al., 2006) and N-AOM encodes for qNor (Ettwig et al., 2010). However, physiological data for both indicates that they withstand rather high NO levels (N-AOM 20 μmol L-1, anammox 7 μmol L-1) without activating anaerobic NO detoxification mechanisms.
NO2- → NO → N2O. central steps in the N-cycle. Generally, the reduction of NO2
- to NO is a central step in the catabolic branch of the N-cycle, because it can be carried out by all involved organisms (Figure 1). The reduction of NO2
- to NO is central for energy conservation in denitrification, anammox and N-AOM. In contrast, during NO2
- oxidation and nitrifier denitrification the reduction of NO2
- to NO is involved in regulating metabolic homeostasis or the removal of toxic NO2
- (Beaumont et al., 2002, 2004a; Starkenburg et al., 2008).
Chapter 2
23
The reduction of NO to N2O is, besides a potential direct formation of N2O from NH2OH in AOB, the only known biochemical reaction that produces N2O. NO reduction to N2O is central for energy conservation only in denitrification (Zumft, 1997). The function of cNor in AOB is unclear. cNor is expressed and metabolically active during aerobic growth (Beaumont et al., 2004b). Knock-out mutants of cNor have lower growth rate and yield in chemostats (Schmidt et al., 2004b) but not in batch culture (Beaumont et al., 2004b). In chemostats, cNor regulates the free NO concentration to an optimal, non-toxic level and contributes to recovery of AOB from anaerobic conditions (Schmidt et al., 2004b). On the other hand, stripping NO from AOB cultures leads to the inhibition of growth, arguing for NO being an obligate intermediate of AOB (Zart et al., 2000).
NO detoxification and NO synthesis. Most bacteria encode for enzymes involved in NO detoxification. This is true for bacteria inside and outside the catabolic N-cycle. Flavohemoglobins (Hmp) mediate the O2-dependent detoxification of NO to NO3
- with NO dioxygenase activity (Gardner et al., 1998). In contrast, the anaerobic detoxification of NO is mediated by Flavodiiron NO reductase (flavorubredoxin [NorVW]) and Hmp by reducing NO to N2O (Kim et al., 1999; Gardner et al., 2002; Gomes et al., 2002).
An alternative, less explored route to N2O formation is via the synthesis of NO from arginine by NO synthases (NOS) and subsequent reduction of NO to N2O by cNor, qNor, Hmp or NorVW. Because NOS was discovered in the medical field it shares a similar abbreviation with N2O reductases (Nos). Until now, NOS has only been detected in a few bacterial –mostly gram-positive – species (Sudhamsu and Crane, 2009) and synthesized NO seems to remain intracellular (Shatalin et al., 2008; Schreiber et al., 2011). However, NOS activity has also been reported in blooming, pelagic diatoms (Vardi et al., 2006). More research is needed to elucidate if NOS-derived NO is a significant source for N2O emitted from phytoplankton blooms in oceans and freshwater.
Chemical reactions in NO and N2O turnover
Chemical production of NO and N2O from inorganic nitrogen compounds at ambient temperatures are well known phenomena in soil science (van Cleemput and Samater, 1996) and atmospheric chemistry (Lammel and Cape, 1996). In soil science, the chemical processes leading to NO and N2O are often summarized as chemo-denitrification (Chalk and Smith, 1983). NH2OH and NO2
- (or its acid HNO2) are the main precursors for chemical production of NO and N2O in wastewater or natural waters. In the following, we discuss chemical reactions involving HNO, NH2OH and NO2
- that can be responsible for the release of NO and N2O. We will also discuss the possible significance of chemical N2O production during biological NH2OH oxidation.
Significance of HNO. In many studies on chemical N2O production, HNO is postulated as the direct precursor of N2O (see below): HNO dimerizes via hyponitrous acid (H2N2O2), to N2O and H2O (Bonner and Hughes, 1988).
2 HNO → H2N2O2 → N2O + H2O Equation 1
Chapter 2
24
It can be assumed that formation of HNO in natural and wastewater follows the same mechanisms that are used to synthesize HNO (DuMond and King, 2011) in the laboratory: (i) disproportionation of NH2OH derivatives containing good leaving groups attached to the nitrogen atom and (ii) decomposition of nitroso compounds (X-N=O, where X represents a good leaving group). Chemical HNO production is a likely process for wastewater treatment, since nitrification can produce considerable amounts of both, HNO2, which is a precursor for nitrosation agents (e.g. dinitrogen trioxide N2O3, Bonner and Stedman, 1996), and NH2OH.
Recently, medical researchers have started to reevaluate the relevance of HNO for physiologically and biologically systems (Fehling and Friedrichs, 2011). The increased interest in HNO is due to the fact that HNO lifetime in aqueous solutions is much longer than previously assumed: the HNO dimerization rate constant has been reassessed to be on the order of 8·105 M-1·s-1 instead of the previously reported value of 2·109 M-1·s-1, and the pKa value of HNO has been redetermined to be 11.4 instead of the old value of 4.2 (Shafirovich and Lymar, 2002). It is likely that the importance of HNO has also been underestimated in the research on N2O emissions. Analytical determination of HNO is very challenging (Miranda, 2005), because HNO is short-lived. However, computer simulations could be a helpful tool to assess the importance of HNO in N2O formation (Law et al., 2012).
HNO2 disproportionation. A well understood process for NO production is the disproportionation of HNO2 (Udert et al., 2005). Since the pKa value of the NO2
-/HNO2 couple (pKa = 3.29; Schwartz and White, 1981) is far below 7, this process releases relevant amounts of NO only under acidic conditions. The disproportionation of HNO2 can be described with Equation 2. The products - NO and NO2 - are in equilibrium with N2O3 (Eq. 5) which is an important agent for nitrosation (Bonner and Stedman, 1996). Under aerobic conditions, NO will be further oxidized to NO2. Since NO2 reacts with H2O to form HNO2 and NO3
-, the reaction scheme (Eq. 2 to 4) is ultimately a chemical pathway for the oxidation of NO2
- to NO3-.
2 HNO2 ↔ NO + NO2 + H2O Equation 2
NO + 0.5 O2 → NO2 Equation 3
2 NO2 + H2O ↔ HNO2 + NO3- + H+ Equation 4
NO + NO2 ↔ N2O3 Equation 5
Since the kinetic and equilibrium constants for Equations 2 to 5 are known, the production of NO can be calculated (Udert et al., 2005). Depending on the aeration intensity, substantial losses of nitrogen oxides can occur during chemical HNO2 oxidation. The stripped nitrogen oxides are mainly HNO2, but also NO is lost.
Iron-mediated reduction of NO2-. Ferrous iron (Fe(II)) can reduce NO2
- to NO and, in the second reaction step, NO to N2O (Kampschreur et al., 2011)
Chapter 2
25
NO2- + Fe2+ + 2H+ → Fe3+ + NO + H2O ΔG0 = 35.8•kJ reaction−1
Equation 6
NO + Fe2+ + H+ → Fe3+ + 0.5 N2O + 0.5 H2O ΔG0 = −38.9 kJ reaction−1 Equation 7
The first reaction is thermodynamically not possible under standard conditions, but in natural waters ferric iron (Fe(III)) will precipitate and thereby draw the Gibbs free energy to negative values. Iron-mediated reduction of NO2
- was described as one of the sources of N2O in soils (Van Cleemput, 1998). Recently, Kampschreur et al. (2011) postulated that this process can contribute significantly to N2O production in wastewater treatment, if NO2
- and Fe(II) are present concomitantly. One example for such a system is nitrogen removal from anaerobic digester effluents via nitritation/denitrification or nitritation/anammox. Digester supernatants can contain high amounts of Fe(II), because iron salts are used to precipitate phosphate and Fe(II) will be released in the anaerobic digester due to the reducing conditions. Hu et al. (2001) reported an additional reaction of NO2
- with iron: under acidic conditions NO2- is
reduced in the presence of metallic iron to N2 and NH3. They propose a mechanism, in which metallic iron is oxidized at low pH releasing Fe2+ ions and molecular hydrogen (H2). NO2
- is then reduced by H2 to N2 and NH3.
Oxidation of NH2OH by Fe(III). Iron not only mediates NO and N2O production from NO2-
. As Fe(III), it also oxidizes NH2OH to N2O. This process can be used for the analytical determination of trace amounts of NH2OH (Butler and Gordon, 1986a). The general equation for the reaction is
4 Fe(III) + 2 NH2OH → 4 Fe(II) + N2O + H2O + 4 H+ Equation 8
In this reaction, N2O formation strongly depends on the pH value. In experiments with distilled water and natural seawater, Butler and Gordon (1986b) found that at pH 3, N2O recovery was 80 %, while at a pH value of 9.5, N2O production was negligibly low. The authors hypothesized that at high pH values, HNO, reacts with O2 to produce NO2
- and H2O. However, it is also known that HNO can react with NH2OH to N2 (Bonner et al. 1978, Eq. 10). Chemical production of N2O via NH2OH oxidation by Fe(III) is a likely process during nitrification, because Fe(III) compounds are ubiquitous in natural waters and wastewater treatment systems.
Reaction of NH2OH with HNO2 and HNO. Döring and Gehlen (1961) investigated the reaction of NH2OH and HNO2. They described the process as nitrosation of NH2OH. The overall reaction can be written as
NH2OH + HNO2 → N2O + 2 H2O Equation 9
In their reaction scheme, Döring and Gehlen (1961) included H2N2O2 (the dimer of HNO) as a direct precursor for N2O. At neutral pH values, N2O3 is the relevant nitrosation agent. There are several reaction pathways for N2O3 formation from HNO2. Formation of N2O3 from HNO2 is given by Equation 2 and 5. A kinetic constant for nitrosation of
Chapter 2
26
NH2OH is given by Döring and Gehlen (1961) and together with the kinetic constants for Equation 1 and 4 (Udert et al., 2005) the N2O production from NH2OH and HNO2 can be estimated. Some of the NH2OH can also react with the intermediate HNO to form N2 (Bonner et al., 1978)
HNO + NH2OH → N2 + 2 H2O Equation 10
Disproportionation of NH2OH. The disproportionation of NH2OH can be described with the following equation (Bonner et al., 1978)
4 NH2OH → 2 NH3 + N2O + H2O Equation 11
In pure water, this process is very slow with slightly higher degradation rates at elevated pH values. At pH 3 and 25±3 °C, Bonner et al. (1978) observed no NH2OH disproportionation over 2 months, while 12 to 18% of the NH2OH was degraded over two months at pH 13.5. Complexes of transition metals can accelerate NH2OH disproportionation considerably (Alluisetti et al., 2004). Jenni et al. (2012) also observed N2O formation within minutes, although the experiment was conducted in a phosphate buffer solution without transition metals. The disproportionation might have been catalyzed by the steel surface of an electrode immersed in the reactor, but this hypothesis still has to be proven.
Autoxidation of NH2OH. Oxidation of NH2OH with O2 (autoxidation, Eq. 12) is a slow process, although faster than NH2OH disproportionation.
2 NH2OH + O2 → N2O + 3 H2O Equation 12
Again, trace concentrations of metals can strongly accelerate the process. Anderson
(1964) reported that in an aerated solution with 1 mmol•L-1 NH2OH and 1 μmol•L-1 cupric sulfate 30% of the NH2OH was oxidized within 1 hour, while only 2.5 % were degraded without cupric sulfate addition (pH between 7.8 and 7.9, 30°C). Cu is by far the most potent catalyzer for the autooxidation of NH2OH followed by Co(II), Fe(II), Mn(II) and Zn(II) (Moews Jr and Audrieth, 1959). Since most wastewaters and natural waters contain some traces of metals, autoxidation of hydroxylamine cannot a priori be excluded as a source of N2O.
HNO as intermediate of enzymatic NH2OH oxidation. Several authors postulated that HNO was a likely intermediate of HAO due to the observed N2O production (Ritchie and Nicholas, 1972; Anderson 1964). Igarashi et al. (1997) could show that the crystal structure of HAO in Nitrosomonas europaea is in agreement with the following two step reaction
NH2OH → (HNO) + 2 H+ + 2 e- Equation 13
(HNO) + H2O → HNO2 + 2 H+ + 2 e- Equation 14
Based on this scheme, an imbalance of the two reaction steps could lead to an accumulation of HNO and subsequently to chemical N2O production (Eq. 1). Law et al. (2012) developed four different metabolic computer models to elucidate the
Chapter 2
27
mechanisms of aerobic N2O production in a nitritation reactor. The best fit of the measurement data was achieved with a model based on chemical HNO production. The other models, which represented three different metabolic pathways for the enzymatic reduction of nitrite and NO to N2O, could not reproduce the measurement data satisfactorily. Indeed, we think that the positive site preference (SP) of N2O produced during NH2OH oxidation can be explained by a kinetic isotope effect acting during the chemical cleavage of a symmetric intermediate such as H2N2O2 formed by dimerization of two HNO molecules (Eq. 1; Toyoda et al., 2005). In addition, the studies of Law et al. (2012) and of Udert et al. (2005) exemplify that computer models are powerful tools to elucidate the mechanisms of N2O and NO production, especially when the processes contain microbial as well as chemical reaction steps.
Relevant environments for chemical reactions. In the last years, nitrogen treatment of high-strength wastewaters such as digester supernatant, manure and urine have received considerable attention. Based on our literature review, these systems are particularly prone to chemical production of NO and N2O because of high NH3 oxidation rates and high concentrations of the intermediate NH2OH. Furthermore, some treatment schemes include NO2
- accumulation as a process step, for example SHARON®. Ubiquitous iron compounds, e.g. from phosphate precipitation or as sensors and reactor walls, are another factor that can support the production of NO and N2O. At the current stage of knowledge, it is hard to estimate the contribution of chemical processes to the overall NO and N2O production. Many chemical processes have been described, but with the exception of HNO2 disproportionation and the reaction of HNO2 with NH2OH, the kinetic data are insufficient for a reliable prediction of the production rates. Chemical production of NO and N2O can also occur in natural environments, where high ammonia inputs meet low pH values such as strongly fertilized soils (van Cleemput and Samater, 1996) or poorly buffered lakes (Schuurkes and Mosello, 1988). Furthermore, chemical oxidation of NO and N2O is an important process in the atmosphere (Lammel and Cape, 1996).
NO and N2O formation in natural environments
Nitric oxide. NO production and consumption has been studied in soils. The studies used inhibition of nitrification with low concentrations of acetylene (~10 Pa) to distinguish between NO turnover by nitrification and denitrification, assuming that acetylene does not inhibit N2O reductase at these concentrations. O2 availability, as regulated by soil moisture content, is the main factor controlling the mechanisms of NO release (Bollmann and Conrad, 1998). While denitrification is the only process that releases NO under anoxic conditions, nitrification dominates NO release under oxic conditions with highest rates at low O2 concentrations. In addition, soil pH, NH4
+, NO3-,
NO2- and respiration are important soil variables that affect NO turnover (Gödde and
Conrad, 2000).
Measurements of NO in seawater are rare, because concentrations are low and turnover is fast due to its reactivity. However, Zafiriou et al. (1980) found that surface water of the central equatorial Pacific is a NO source to the atmosphere. Here, NO is
Chapter 2
28
formed by photolysis of NO2- during daytime and reaches concentrations in the
picomolar range (Zafiriou and True, 1979). Moreover, NO is formed by microbial processes in the O2 minimum zone of the eastern tropical North Pacific (Ward and Zafiriou, 1988). Here, maximum NO turnover and concentration coincide with low O2 concentrations (10 – 100 μmol L-1) and some nitrification activity overlying the O2 minimum zone. In contrast, NO turnover and concentrations are low in the core of the O2 minimum zone. The exact source of NO remained unidentified, but it was hypothesized that nitrifiers produce NO under reduced O2 concentrations and that denitrifiers establish rather low NO concentrations in the core of the O2 minimum zone. NO formation has been measured in marine sediments (Schreiber et al., 2008) and a more detailed study of NO turnover has been performed in freshwater sediments (Schreiber in preparation). Both studies will be discussed in the section focusing on microelectrodes.
Nitrous oxide. Generally, N2O formation has been investigated to greater detail and in a wider variety of habitats as compared to NO, because its environmental impact is considered to be stronger than that of NO and its turnover is easier to measure due to its chemical stability. At present anthropogenic N2O emissions account for ~40 % of the global N2O emissions (Montzka et al., 2011). Current estimates state that ~50 % of the anthropogenic N2O is emitted from soils (Stein and Yung, 2003), 10 % from estuaries and freshwater habitats (Beaulieu et al., 2011) and 3.2 % are emitted from wastewater treatment plants (WWTP) (Kampschreur et al., 2009). We caution that future adjustments to these estimates are likely, and that these averages do not capture the high variability in emissions from selected environments. Recent work has suggested that emissions from WWTPs in particular are highly variable and may in some cases be up to an order of magnitude greater than previous estimates (Lotito et al, 2012; Ahn et al., 2010). Soils and aquatic habitats exposed to intense agricultural activities are the largest sources due to high N-input through fertilization. Since mixed microbial communities in soils are the largest anthropogenic source for N2O, its formation has been intensively studied and was recently reviewed (Baggs, 2011). N2O formation in WWTP has been reviewed by Kampschreur et al. (2009).
The ocean is an important source of N2O accounting for ~30 % of the natural N2O emission (Stein and Yung, 2003). Large areas of the ocean are thought to be in equilibrium with the atmosphere, but regions of O2 depletion are significant sources of N2O (Elkins et al., 1978). In O2 minimum zones, N2O is generally produced to concentrations in the nanomolar range as O2 reaches low concentrations (Yoshida et al., 1989; Naqvi et al., 2000; Farias et al., 2007; Nicholls et al., 2007). High N2O accumulation was observed in surface water of the Arabian Sea and explained with frequent, turbulence-induced aeration of suboxic surface water (Naqvi et al., 2000). Likewise, O2 fluctuations, induced by the El Nino-Southern oscillation, have been proposed to affect N2O emission from the O2 minimum zone of the eastern South Pacific (Farias et al., 2007). Furthermore, marine and freshwater sediments emit N2O (Meyer et al., 2008; Nielsen et al., 2009). NO and N2O formation in sediments will be discussed in more detail in the section focusing on microelectrodes.
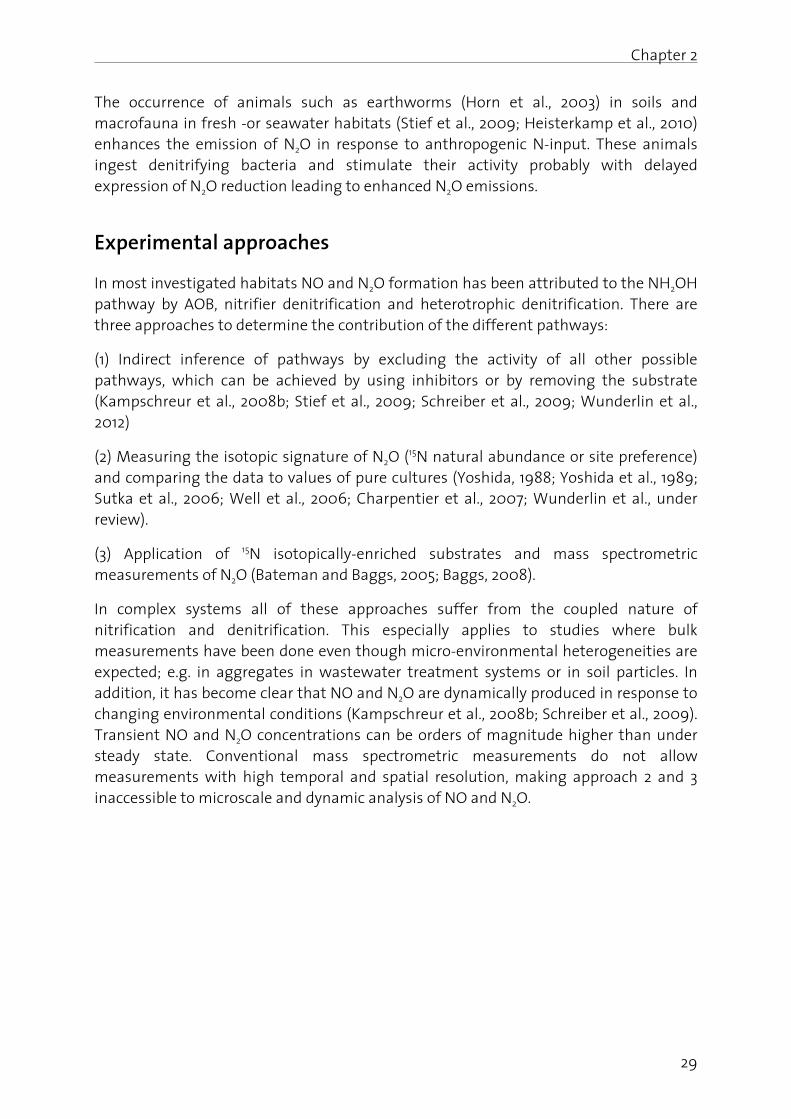
Chapter 2
29
The occurrence of animals such as earthworms (Horn et al., 2003) in soils and macrofauna in fresh -or seawater habitats (Stief et al., 2009; Heisterkamp et al., 2010) enhances the emission of N2O in response to anthropogenic N-input. These animals ingest denitrifying bacteria and stimulate their activity probably with delayed expression of N2O reduction leading to enhanced N2O emissions.
Experimental approaches
In most investigated habitats NO and N2O formation has been attributed to the NH2OH pathway by AOB, nitrifier denitrification and heterotrophic denitrification. There are three approaches to determine the contribution of the different pathways:
(1) Indirect inference of pathways by excluding the activity of all other possible pathways, which can be achieved by using inhibitors or by removing the substrate (Kampschreur et al., 2008b; Stief et al., 2009; Schreiber et al., 2009; Wunderlin et al., 2012)
(2) Measuring the isotopic signature of N2O (15N natural abundance or site preference) and comparing the data to values of pure cultures (Yoshida, 1988; Yoshida et al., 1989; Sutka et al., 2006; Well et al., 2006; Charpentier et al., 2007; Wunderlin et al., under review).
(3) Application of 15N isotopically-enriched substrates and mass spectrometric measurements of N2O (Bateman and Baggs, 2005; Baggs, 2008).
In complex systems all of these approaches suffer from the coupled nature of nitrification and denitrification. This especially applies to studies where bulk measurements have been done even though micro-environmental heterogeneities are expected; e.g. in aggregates in wastewater treatment systems or in soil particles. In addition, it has become clear that NO and N2O are dynamically produced in response to changing environmental conditions (Kampschreur et al., 2008b; Schreiber et al., 2009). Transient NO and N2O concentrations can be orders of magnitude higher than under steady state. Conventional mass spectrometric measurements do not allow measurements with high temporal and spatial resolution, making approach 2 and 3 inaccessible to microscale and dynamic analysis of NO and N2O.
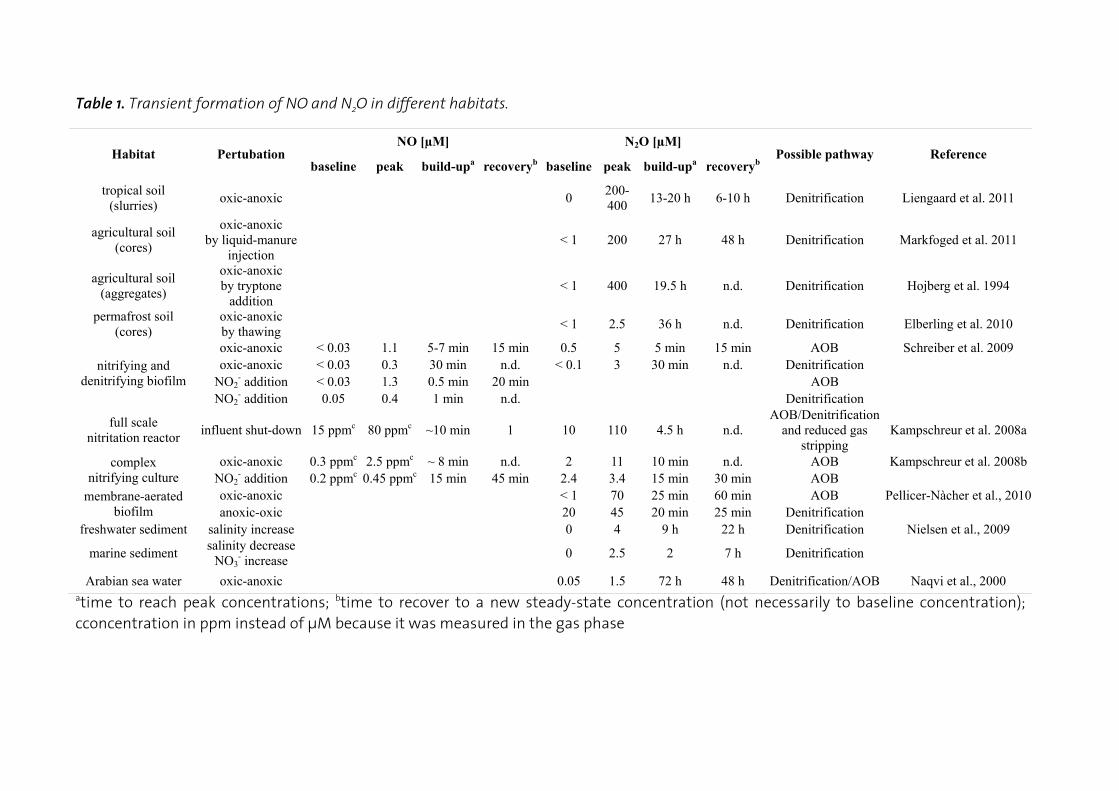
Table 1. Transient formation of NO and N2O in different habitats.
Habitat Pertubation NO [µM] N2O [µM]
Possible pathway Reference baseline peak build-upa recoveryb baseline peak build-upa recoveryb
tropical soil (slurries)
oxic-anoxic 0 200-400
13-20 h 6-10 h Denitrification Liengaard et al. 2011
agricultural soil (cores)
oxic-anoxic by liquid-manure
injection < 1 200 27 h 48 h Denitrification Markfoged et al. 2011
agricultural soil (aggregates)
oxic-anoxic by tryptone
addition < 1 400 19.5 h n.d. Denitrification Hojberg et al. 1994
permafrost soil (cores)
oxic-anoxic by thawing
< 1 2.5 36 h n.d. Denitrification Elberling et al. 2010
nitrifying and denitrifying biofilm
oxic-anoxic < 0.03 1.1 5-7 min 15 min 0.5 5 5 min 15 min AOB Schreiber et al. 2009 oxic-anoxic < 0.03 0.3 30 min n.d. < 0.1 3 30 min n.d. Denitrification
NO2- addition < 0.03 1.3 0.5 min 20 min AOB
NO2- addition 0.05 0.4 1 min n.d. Denitrification
full scale nitritation reactor
influent shut-down 15 ppmc 80 ppmc ~10 min 1 10 110 4.5 h n.d. AOB/Denitrification
and reduced gas stripping
Kampschreur et al. 2008a
complex nitrifying culture
oxic-anoxic 0.3 ppmc 2.5 ppmc ~ 8 min n.d. 2 11 10 min n.d. AOB Kampschreur et al. 2008b NO2
- addition 0.2 ppmc 0.45 ppmc 15 min 45 min 2.4 3.4 15 min 30 min AOB membrane-aerated
biofilm oxic-anoxic < 1 70 25 min 60 min AOB Pellicer-Nàcher et al., 2010 anoxic-oxic 20 45 20 min 25 min Denitrification
freshwater sediment salinity increase 0 4 9 h 22 h Denitrification Nielsen et al., 2009
marine sediment salinity decrease
NO3- increase
0 2.5 2 7 h Denitrification
Arabian sea water oxic-anoxic 0.05 1.5 72 h 48 h Denitrification/AOB Naqvi et al., 2000 atime to reach peak concentrations; btime to recover to a new steady-state concentration (not necessarily to baseline concentration); cconcentration in ppm instead of μM because it was measured in the gas phase
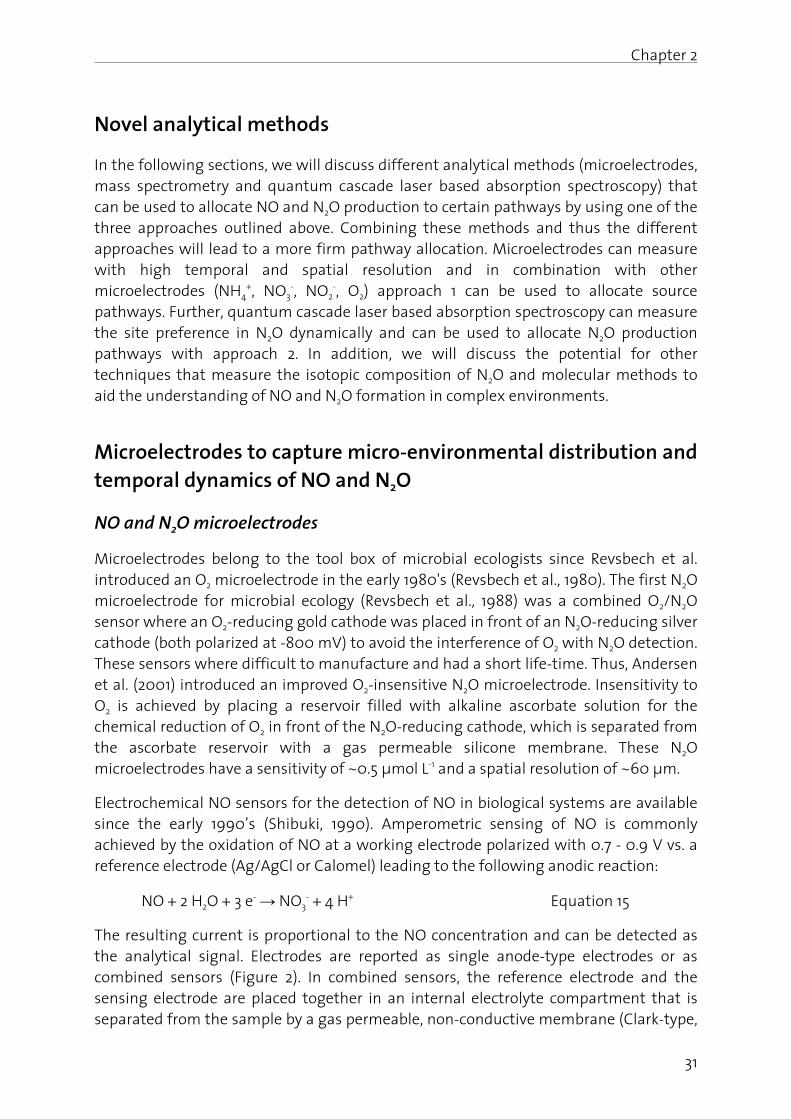
Chapter 2
31
Novel analytical methods
In the following sections, we will discuss different analytical methods (microelectrodes, mass spectrometry and quantum cascade laser based absorption spectroscopy) that can be used to allocate NO and N2O production to certain pathways by using one of the three approaches outlined above. Combining these methods and thus the different approaches will lead to a more firm pathway allocation. Microelectrodes can measure with high temporal and spatial resolution and in combination with other microelectrodes (NH4
+, NO3-, NO2
-, O2) approach 1 can be used to allocate source pathways. Further, quantum cascade laser based absorption spectroscopy can measure the site preference in N2O dynamically and can be used to allocate N2O production pathways with approach 2. In addition, we will discuss the potential for other techniques that measure the isotopic composition of N2O and molecular methods to aid the understanding of NO and N2O formation in complex environments.
Microelectrodes to capture micro-environmental distribution and temporal dynamics of NO and N2O
NO and N2O microelectrodes
Microelectrodes belong to the tool box of microbial ecologists since Revsbech et al. introduced an O2 microelectrode in the early 1980's (Revsbech et al., 1980). The first N2O microelectrode for microbial ecology (Revsbech et al., 1988) was a combined O2/N2O sensor where an O2-reducing gold cathode was placed in front of an N2O-reducing silver cathode (both polarized at -800 mV) to avoid the interference of O2 with N2O detection. These sensors where difficult to manufacture and had a short life-time. Thus, Andersen et al. (2001) introduced an improved O2-insensitive N2O microelectrode. Insensitivity to O2 is achieved by placing a reservoir filled with alkaline ascorbate solution for the chemical reduction of O2 in front of the N2O-reducing cathode, which is separated from the ascorbate reservoir with a gas permeable silicone membrane. These N2O microelectrodes have a sensitivity of ~0.5 μmol L-1 and a spatial resolution of ~60 μm.
Electrochemical NO sensors for the detection of NO in biological systems are available since the early 1990’s (Shibuki, 1990). Amperometric sensing of NO is commonly achieved by the oxidation of NO at a working electrode polarized with 0.7 - 0.9 V vs. a reference electrode (Ag/AgCl or Calomel) leading to the following anodic reaction:
NO + 2 H2O + 3 e- → NO3- + 4 H+ Equation 15
The resulting current is proportional to the NO concentration and can be detected as the analytical signal. Electrodes are reported as single anode-type electrodes or as combined sensors (Figure 2). In combined sensors, the reference electrode and the sensing electrode are placed together in an internal electrolyte compartment that is separated from the sample by a gas permeable, non-conductive membrane (Clark-type,
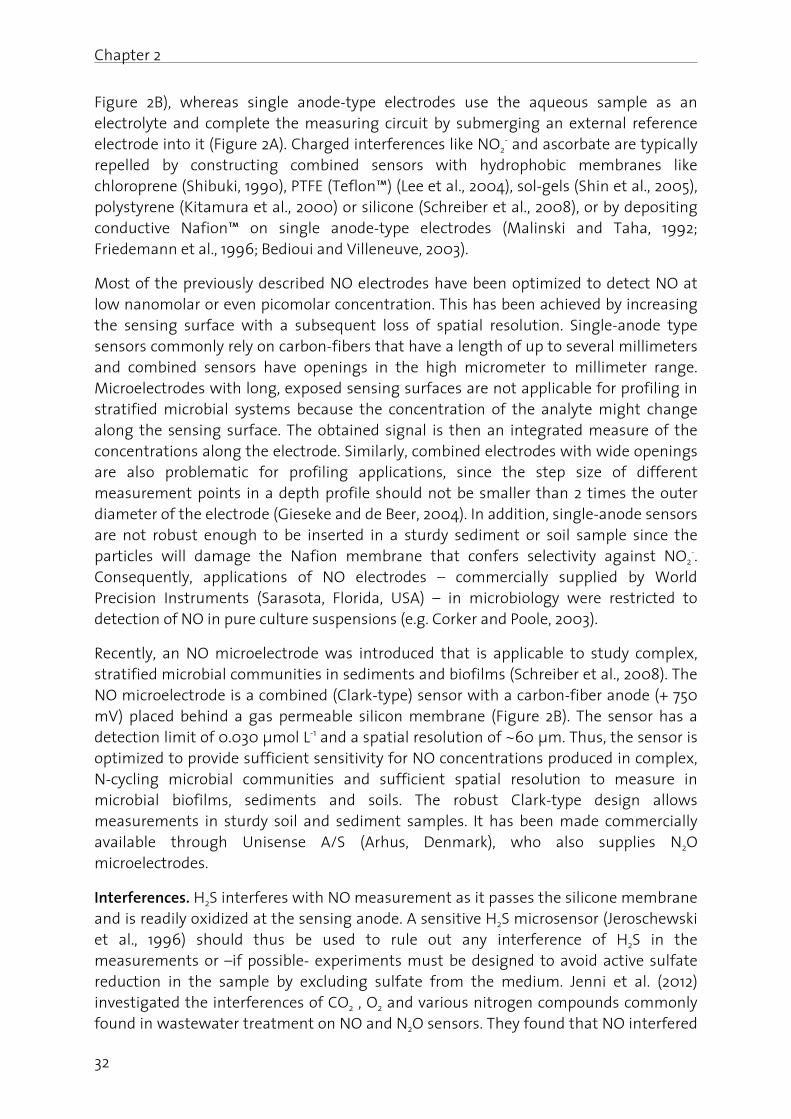
Chapter 2
32
Figure 2B), whereas single anode-type electrodes use the aqueous sample as an electrolyte and complete the measuring circuit by submerging an external reference electrode into it (Figure 2A). Charged interferences like NO2
- and ascorbate are typically repelled by constructing combined sensors with hydrophobic membranes like chloroprene (Shibuki, 1990), PTFE (Teflon™) (Lee et al., 2004), sol-gels (Shin et al., 2005), polystyrene (Kitamura et al., 2000) or silicone (Schreiber et al., 2008), or by depositing conductive Nafion™ on single anode-type electrodes (Malinski and Taha, 1992; Friedemann et al., 1996; Bedioui and Villeneuve, 2003).
Most of the previously described NO electrodes have been optimized to detect NO at low nanomolar or even picomolar concentration. This has been achieved by increasing the sensing surface with a subsequent loss of spatial resolution. Single-anode type sensors commonly rely on carbon-fibers that have a length of up to several millimeters and combined sensors have openings in the high micrometer to millimeter range. Microelectrodes with long, exposed sensing surfaces are not applicable for profiling in stratified microbial systems because the concentration of the analyte might change along the sensing surface. The obtained signal is then an integrated measure of the concentrations along the electrode. Similarly, combined electrodes with wide openings are also problematic for profiling applications, since the step size of different measurement points in a depth profile should not be smaller than 2 times the outer diameter of the electrode (Gieseke and de Beer, 2004). In addition, single-anode sensors are not robust enough to be inserted in a sturdy sediment or soil sample since the particles will damage the Nafion membrane that confers selectivity against NO2
-. Consequently, applications of NO electrodes – commercially supplied by World Precision Instruments (Sarasota, Florida, USA) – in microbiology were restricted to detection of NO in pure culture suspensions (e.g. Corker and Poole, 2003).
Recently, an NO microelectrode was introduced that is applicable to study complex, stratified microbial communities in sediments and biofilms (Schreiber et al., 2008). The NO microelectrode is a combined (Clark-type) sensor with a carbon-fiber anode (+ 750 mV) placed behind a gas permeable silicon membrane (Figure 2B). The sensor has a detection limit of 0.030 μmol L-1 and a spatial resolution of ~60 μm. Thus, the sensor is optimized to provide sufficient sensitivity for NO concentrations produced in complex, N-cycling microbial communities and sufficient spatial resolution to measure in microbial biofilms, sediments and soils. The robust Clark-type design allows measurements in sturdy soil and sediment samples. It has been made commercially available through Unisense A/S (Arhus, Denmark), who also supplies N2O microelectrodes.
Interferences. H2S interferes with NO measurement as it passes the silicone membrane and is readily oxidized at the sensing anode. A sensitive H2S microsensor (Jeroschewski et al., 1996) should thus be used to rule out any interference of H2S in the measurements or –if possible- experiments must be designed to avoid active sulfate reduction in the sample by excluding sulfate from the medium. Jenni et al. (2012) investigated the interferences of CO2 , O2 and various nitrogen compounds commonly found in wastewater treatment on NO and N2O sensors. They found that NO interfered
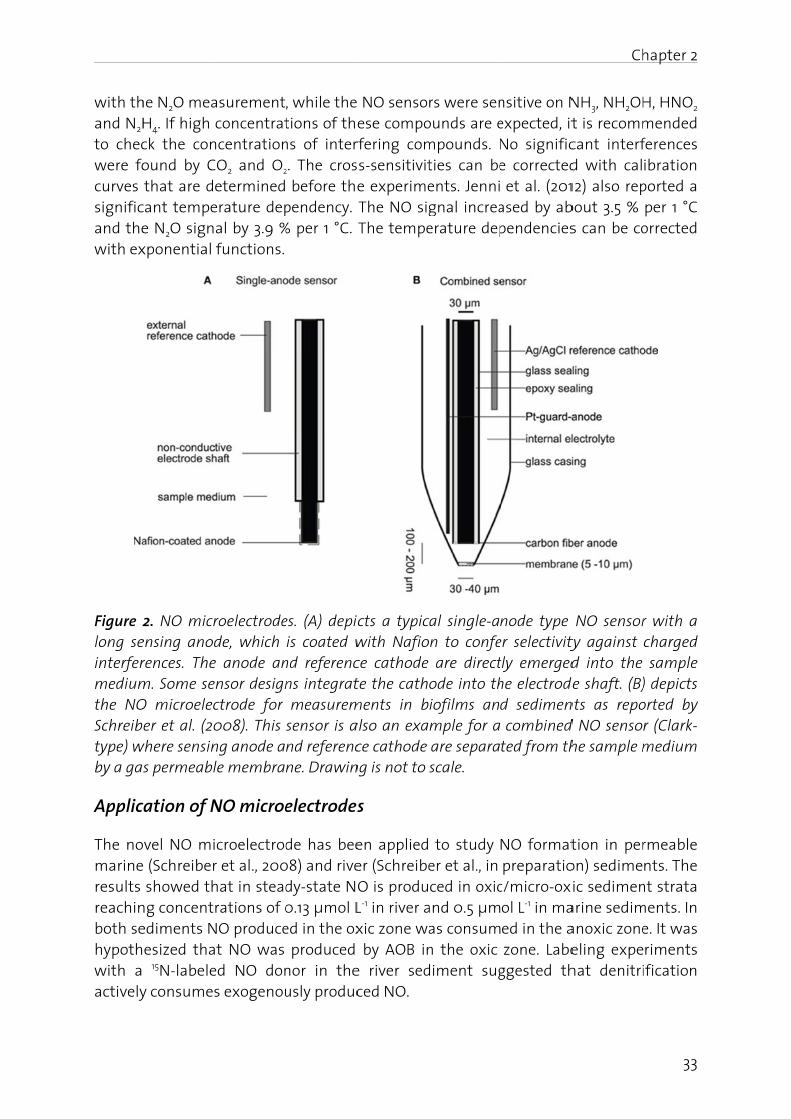
with thand N2Hto checwere focurves significand thewith ex
Figure 2long seinterfermediumthe NOSchreibtype) wby a ga
Applic
The nomarineresults reachinboth sehypothwith a actively
he N2O meaH4. If high ck the conound by C that are dcant tempee N2O signxponential
2. NO micrensing anodrences. Them. Some seO microelec
er et al. (20where sensin
s permeabl
cation of N
ovel NO mie (Schreiber showed th
ng concentediments Nesized tha 15N-labele
y consumes
asurement, concentratncentrationCO2 and O2
eterminederature depal by 3.9 % functions.
roelectrodede, which
e anode anensor designctrode for 008). This ng anode ale membra
NO microe
icroelectrodr et al., 200hat in steadrations of 0
NO produceat NO was ed NO dons exogenou
, while the tions of the
ns of inter
2. The cros before the
pendency. % per 1 °C.
es. (A) depic is coated wnd referencns integrat measurem sensor is and referencne. Drawin
electrodes
de has bee08) and rivedy-state NO
0.13 μmol Led in the ox produced nor in theusly produc
NO sensoese compo
rfering coms-sensitivite experime
The NO sig The tempe
cts a typicwith Nafioce cathode te the cath
ments in balso an exace cathode
ng is not to
s
en applieder (SchreibeO is produ
L-1 in river axic zone wa by AOB in
e river sedced NO.
rs were senounds are empounds. Nties can beents. Jennignal increaerature dep
al single-an to confe are directode into thiofilms anmple for a are separa scale.
to study er et al., in ced in oxic
and 0.5 μmas consumn the oxic diment sug
nsitive on N expected, it No signific
e corrected et al. (201
ased by abpendencies
node type er selectivitytly emergedhe electroded sedimen combinedted from th
NO format preparatioc/micro-oxol L-1 in maed in the a
zone. Labeggested th
Ch
NH3, NH2OH t is recommcant interfd with cal12) also rep
bout 3.5 % s can be co
NO sensorty against d into the
de shaft. (B)nts as repod NO sensohe sample m
tion in peron) sedimeic sedimen
arine sedim anoxic zone
eling expehat denitri
hapter 2
33
H, HNO2 mended ferences ibration
ported a per 1 °C orrected
r with a charged sample ) depicts orted by r (Clark-
medium
rmeable nts. The
nt strata ments. In
e. It was riments ification
Chapter 2
34
Furthermore, the NO microelectrodes have been applied together with N2O microelectrodes in two N-cycling microbial biofilms; namely a complex NH4
+-fed biofilm with nitrifying and denitrifying activity (Schreiber et al., 2009) and human dental plaque that was naturally exposed to high NO3
- and NO2- in saliva (Schreiber et
al., 2010). The study in dental plaque showed that plaque denitrified under aerobic conditions, that NO and N2O was produced by denitrification and that NO and N2O concentrations increased with decreasing pH. Aerobic denitrification has also been reported from permeable marine sediments (Gao et al., 2010) and from isolated (Patureau et al., 2000) or extracted soil bacteria (Morley et al., 2008). Until now, it is not known in which environments aerobic denitrification plays an important role and if it is an environmentally significant NO and N2O emission pathway. NO, N2O, NO2
-, NO3- and
O2 microelectrodes will be crucial to determine the importance of aerobic denitrification for NO and N2O release for complex ecosystems, because these sensors allow the simultaneous detection of NO, N2O, NO2
-, NO3-, O2 concentrations at high
spatial resolution and their relation to denitrification activity.
Studying a complex N-cycling biofilm revealed the dynamics of NO and N2O formation upon perturbations in a system where nitrification and denitrification co-exist (Schreiber et al., 2009). The concomitant use of an O2 microelectrode and a set of control experiments enabled assignment of NO and N2O formation under oxic conditions to AOB and under anoxic conditions to denitrifiers. It also showed that AOB produce NO and N2O under fully oxic conditions if NO2
- concentrations are high. This is in agreement with other observations (Beaumont et al., 2004a, 2004b; Shaw et al., 2006) and contradicts the assumption that AOB require low O2 to release NO and N2O (Lipschultz et al., 1981; Poth and Focht, 1985; Kester et al., 1997; Beaumont et al., 2004a; Kampschreur et al., 2008b). The high temporal resolution of the microelectrodes allow to detect transient bursts (seconds to minutes) of NO and N2O. The bursts occurred by AOB upon O2 removal and upon NO2
- addition by both AOB and denitrifiers. The bursts only occurred if the perturbations were exerted upon metabolically active AOB and denitrifiers. In both scenarios NO and N2O are formed in parallel confirming that NO is the preceding intermediate of N2O in the N2O production pathways in this biofilm. An important contribution by Yu et al. (2010) showed that an AOB pure culture accumulated only NO, not N2O, upon transition from oxic to anoxic conditions. In mixed microbial communities were AOB and heterotrophic denitrifiers co-exist this could lead to NO release by AOB and immediate reduction to N2O by heterotrophic denitrifiers or anaerobic detoxification via NorVW and Hmp. This mixed source of N2O during transient oxic to anoxic conditions has to be taken into account when determining the pathways with isotopic techniques. It has been argued that N2O transiently accumulates during transition from anoxic to oxic conditions because O2 inhibits Nos while denitrification still proceeds, but direct evidence for this hypothesis is weak. Using both NO and N2O microelectrodes would allow to test this because N2O accumulation should not be accompanied by NO accumulation if the denitrification sequence is inhibited at the level of Nos.
Chapter 2
35
Application of N2O microelectrodes
In many habitats steady-state N2O concentrations are below or at the detection limit of the N2O microelectrode. Thus, the N2O microelectrode has commonly been used to estimate the denitrification potentials in stratified microbial communities such as sediments, biofilms and aggregates in combination with the acetylene inhibition technique (Revsbech et al., 1988). Acetylene (~10 kPa) inhibits N2O reductase and leads to the accumulation of high amounts of N2O.
More recently, N2O microelectrodes have been used to study N2O production without acetylene inhibition in natural samples. These studies revealed that N2O concentrations in the micromolar range are expected when the system is exposed to a perturbation (Table 1). Transient accumulation of high N2O concentrations were achieved by any perturbation that affects the ambient O2 concentration: flooding of soils with water (Liengaard et al., 2011; Markfoged et al., 2011), creating an organic hotspot around a soil aggregate (Hojberg et al., 1994), thawing of permafrost soils (Elberling et al., 2010), and decreasing the O2 supply to wastewater-grown biofilms (Kampschreur et al., 2008a, 2008b; Schreiber et al., 2009; Pellicer-Nàcher et al., 2010). In addition, increased input of NO3
-, NO2- or NH4
+ to sediments, soils and biofilms (Hojberg et al., 1994; Meyer et al., 2008; Schreiber et al., 2009; Nielsen et al., 2009), organic inputs, salinity fluctuations in sediments (Nielsen et al., 2009) and changes of pH due to microbial activity in a denitrifying, dental biofilm (Schreiber et al., 2010) lead to increased micro-environmental N2O levels. Importantly, in many of these studies N2O accumulated in a transient manner making time-course measurements necessary to capture the N2O peak and the accumulation time span. The high spatial resolution of the N2O microelectrode allowed allocating processes that mitigate the emission of N2O to the atmosphere in soils, sediments and wastewater treatment biofilms. N2O that is produced by denitrification in deeper layers is consumed during its diffusion toward the sediment-water interface in nutrient-enriched mangrove sediments (Meyer et al., 2008), toward the soil-atmosphere interface in a thawed permafrost soil (Elberling et al., 2010) or in a soil aggregate exposed to an organic hotspot (Hojberg et al., 1994). Likewise, N2O release from a membrane-aerated biofilm reactor was minimized by N2O-reducing microbes placed above AOB that produced N2O due to perturbations induced by an intermittent aeration regime (Pellicer-Nàcher et al., 2010).
Outlook
From the investigations of transient NO and N2O accumulation it emerges that two scenarios with distinct dynamics are important. First, N2O accumulates over hours to days, because it mirrors the onset of denitrification activity. Depending on the system it decreases because N2O reduction pathways are turned on with a delay or denitrification activity decreases due to substrate limitation. Ahn et al. (2011) even observed that peak NO and N2O emissions after a shift to O2-limitation in a nitrifying reactor were lasting for several month before adaptation on the metabolic or community level decreased the emissions. Second, perturbation of active AOB or denitrifiers leads to burst-like (within seconds to minutes) release of NO and N2O. The
Chapter 2
36
exact biochemical mechanisms for this require further research directly on the involved enzymes. Moreover, future research must show the contributions of the two types of transitions to the N2O budget and could use this as a framework to mitigate peak N2O releases to the atmosphere. Mitigation strategies could aid at avoiding perturbations or confining the N2O-releasing processes into a diffusion-limited environment that is overlaid with N2O-consuming microbial communities.
N2O source partitioning based on the nitrogen and oxygen isotopic signature
In recent years, the isotopic signature of N2O has been used as a powerful tool to assign N2O production pathways to nitrification and heterotrophic denitrification in different ecosystems such as soils, rivers, sea, wastewater treatment (Yoshida et al., 1989; Yamagishi et al., 2007; Baggs, 2008; Koba et al., 2009; Baulch et al., 2011; Park et al.,
2011; Toyoda et al., 2011). N2O is a linear molecule (Nβ-Nα-O) with one nitrogen atom at
the center position (Nα) bound to oxygen, and one at the end position (Nβ) bound to Nα. The three most abundant N2O isotopic species in the atmosphere are 14N15N16O (0.37 %), 15N14N16O (0.37 %) and 14N14N16O (> 99 %). Isotope abundances are usually reported in
the δ-notation (in per-mil; ‰), δ15N = [(Rsample/Rreference) - 1] x 1000, where R is the ratio of 15N/14N of a sample (Rsample) with respect to atmospheric N2 as the reference (Rreference) (Mariotti et al., 1981).
The intramolecular distribution of the nitrogen isotopes (14N15NO versus 15N14NO) is
termed site preference (SP) and is expressed as the relative difference in δ15N between
the α and the β position (SP = δ15Nα – δ15Nβ) (Toyoda and Yoshida, 1999). In analogy
to the δ-notation, the isotopomer analysis denotes the relative difference of the 15N/14N isotope ratio for a given position (δ15Nα, δ15Nβ) with respect to the standard
(e.g. δ15Nα = [(15Rα/15Rαreference) - 1] x 1000, whereas 15Rα = [14N15N16O]/[14N14N16O] and 15Rα
reference is the isotope ratio of the standard material (N2O) (see below)) (Toyoda and Yoshida, 1999). The SP has the advantage of being independent of the isotopic signature of the respective substrates (e.g. NH4
+ or NO3-) and of being specific for
pathways (enzymes) involved in N2O formation (Toyoda et al., 2005; Sutka et al., 2006).
Microbial (enzymatic) processes usually lead to an isotopic fractionation due to different transformation rates of 14N and 15N, resulting in isotopically lighter end-products than molecules in prior steps (Stein and Yung, 2003). Thus, the average 15N/14N
ratio of N2O, termed as δ15NbulkN2O, can be used to distinguish different production
pathways in complex samples if the isotopic signature of the pure bacterial culture is
known. However, the meaning of δ15NbulkN2O can be limited since it is strongly
dependent on the isotopic signature of the substrate, which usually is unknown, as well as on the physiological activity (Mariotti et al., 1981). Additionally, the isotopic composition of an intermediate (e.g. N2O during heterotrophic denitrification) is
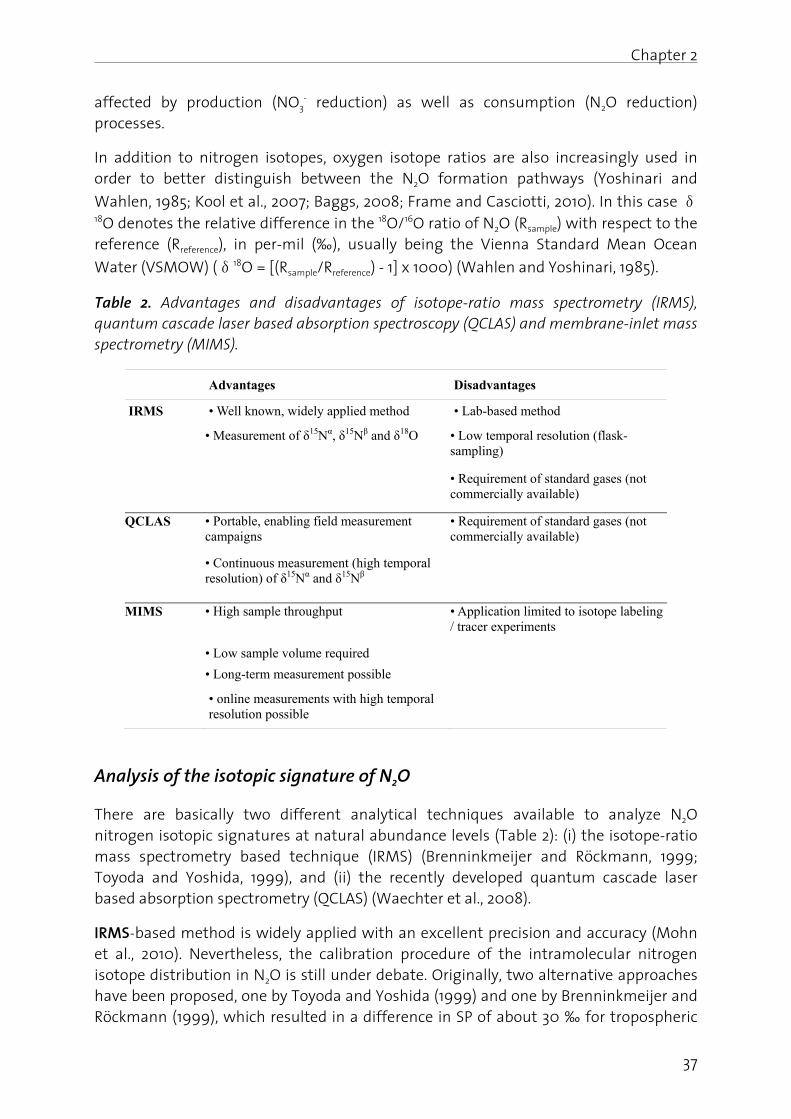
Chapter 2
37
affected by production (NO3- reduction) as well as consumption (N2O reduction)
processes.
In addition to nitrogen isotopes, oxygen isotope ratios are also increasingly used in order to better distinguish between the N2O formation pathways (Yoshinari and
Wahlen, 1985; Kool et al., 2007; Baggs, 2008; Frame and Casciotti, 2010). In this case δ18O denotes the relative difference in the 18O/16O ratio of N2O (Rsample) with respect to the reference (Rreference), in per-mil (‰), usually being the Vienna Standard Mean Ocean
Water (VSMOW) (δ18O = [(Rsample/Rreference) - 1] x 1000) (Wahlen and Yoshinari, 1985).
Table 2. Advantages and disadvantages of isotope-ratio mass spectrometry (IRMS), quantum cascade laser based absorption spectroscopy (QCLAS) and membrane-inlet mass spectrometry (MIMS).
Advantages Disadvantages
IRMS • Well known, widely applied method • Lab-based method
• Measurement of δ15Nα, δ15Nβ and δ18O • Low temporal resolution (flask-sampling)
• Requirement of standard gases (not commercially available)
QCLAS • Portable, enabling field measurement campaigns
• Requirement of standard gases (not commercially available)
• Continuous measurement (high temporal resolution) of δ15Nα and δ15Nβ
MIMS • High sample throughput • Application limited to isotope labeling / tracer experiments
• Low sample volume required
• Long-term measurement possible
• online measurements with high temporal resolution possible
Analysis of the isotopic signature of N2O
There are basically two different analytical techniques available to analyze N2O nitrogen isotopic signatures at natural abundance levels (Table 2): (i) the isotope-ratio mass spectrometry based technique (IRMS) (Brenninkmeijer and Röckmann, 1999; Toyoda and Yoshida, 1999), and (ii) the recently developed quantum cascade laser based absorption spectrometry (QCLAS) (Waechter et al., 2008).
IRMS-based method is widely applied with an excellent precision and accuracy (Mohn et al., 2010). Nevertheless, the calibration procedure of the intramolecular nitrogen isotope distribution in N2O is still under debate. Originally, two alternative approaches have been proposed, one by Toyoda and Yoshida (1999) and one by Brenninkmeijer and Röckmann (1999), which resulted in a difference in SP of about 30 ‰ for tropospheric
Chapter 2
38
N2O. The analysis of the SP by IRMS techniques relies on the N2O+ and NO+ fragment
ions at the mass-to-charge ratio (m/z) 44, 45, 46 (for N2O) and m/z 30, 31 (for NO). However, both calibration approaches do not take into account the isotope effects associated with the formation of NO+ in the ion source of the mass spectrometer. Recently, Westley et al. (2007) investigated these discrepancies in more detail and found that these isotope effects have much smaller impact on the calibration procedure proposed by Toyoda and Yoshida (1999) (see below), and supported therefore this procedure as the most accurate basis for a community standard.
Furthermore, IRMS is a lab-based technique. Thus, the time resolution of N2O isotopic analysis during field measurement campaigns is therefore limited (Waechter et al., 2008). Nevertheless, in addition to nitrogen isotopes, the oxygen isotopic signature can also be analyzed routinely by IRMS.
QCLAS is a novel approach for site-specific analysis of nitrogen isotopes, with the advantage of a high sensitivity, time resolution, and portability, the latter of which enables field measurement campaigns (Waechter et al., 2008). This was demonstrated by Mohn et al. (2012), who recently presented first data of a high precision real-time analysis of site-specific isotopic signatures of atmospheric N2O above a grassland plot. The measurement campaign was run over three weeks with almost 550 analyzed gas samples. It was demonstrated that a continuous measurement of the N2O isotopic signature allowed improved detection of the dynamics of N2O production (before and after fertilizer application to the grassland plot), and thus opens a completely new field of applications. In another study, isotopic signature of N2O, produced during batch-scale experiments with activated sludge, were analyzed in real time, which permitted
to trace short-term fluctuations in SP and δ15NbulkN2O, allowing to identify N2O
production pathways in biological wastewater treatment (Wunderlin et al., under review).
The QCLAS is based on direct absorption laser spectroscopy in the mid-infrared range for simultaneous measurement of the most abundant N2O isotopic species, such as 14N15N16O, 15N14N16O and 14N14N16O (Waechter et al., 2008; Mohn et al., 2010). In order to
enable high precision analysis (e.g. a precision of < 0.1 ‰ for δ15Nα and δ15Nβ) (Waechter et al., 2008) a combination with a pre-concentration unit is essential at ambient or sub-ambient mixing ratios (Mohn et al., 2010, 2012). For example, with the liquid nitrogen-free, fully-automated pre-concentration unit built by Mohn et al. (2010), N2O can be concentrated by a factor of 200 (e.g. from ambient concentrations to around 60 ppm) from 10 L gas samples within 20 min.
Calibration. For both techniques, IRMS as well as QCLAS, an adequate calibration procedure needs to be applied, since instrumental nonlinearity and drifts impact the
accuracy of the isotope ratio measurement (e.g. δ15NbulkN2O values depend on the N2O
gas concentration) (Waechter et al., 2008). However, international standards are not commercially available so far. Therefore, they need to be prepared and analyzed from
other laboratories (intercalibration) for δ15NbulkN2O, δ15Nα and δ15Nβ, to ensure that
measurements are performed on a common scale and that results are comparable
Chapter 2
39
between laboratories (Westley et al., 2007). So far, the calibration procedure proposed by Toyoda and Yoshida (1999), as mentioned above, is accepted as the provisional basis for a community standard: N2O is synthesized via thermal decomposition of isotopically
characterized NH4NO3, since it is known that the nitrogen atom at the center (α)
position of N2O originates from NO3-, while the end (β) nitrogen comes from NH4
+. Using this calibration procedure a SP of tropospheric N2O of 18.7 ± 2.2 ‰ is measured (Westley et al., 2007).
Membrane-inlet mass spectrometry (MIMS) was proposed as another promising tool to study the dynamics of N2O production in 15N labeling experiments. MIMS has a high sample throughput (within minutes), allows direct analysis of liquid or gas samples and requires only low sample amounts (Bauer, 1995; Baggs, 2008) (Table 2). Recently, it was coupled with an automated sampling and calibration unit (ASCU), and was tested in a long-term 15N-NO3
- tracer experiment over 7 days. It was confirmed that 15N measurements of N2 and N2O, detected as N2 at m/z 28, 29 and 30 (N2O was reduced to N2 in an elemental copper furnace prior to analysis), are in good agreement with IRMS-based analysis (Eschenbach and Well, 2011).
The membrane-inlet part can also be combined with a quadrupole mass spectrometer for simultaneous online measurement of different m/z ratios (e.g. 15,15N2O at m/z = 46, 14,15N2O at m/z = 45, 15,15N2 at m/z = 30, 14,15N2 at m/z = 29) with a time resolution of 1 to 2 minutes (Ettwig et al., 2010; Gao et al., 2010). Nevertheless, the interpretation of spectra corresponding to a certain gas mixture might be difficult since one peak can correspond to different atomic compositions (e.g. 14,14N2
+ and CO+ at m/z = 28). This problem is reduced by applying 15N labeled substrates, where the only important remaining correction needed is for m/z = 30, which consist of the signal from the 15,15N2
+ fragment of 15,15N2O, the 14NO+ fragment of 14,14N2O and 15,15N2) (Thomsen et al., 1994).
Isotopic signature of N2O: site preference, δ15N and δ18O
Site preference. The SP is a promising tool for N2O source partitioning since it is specific to pathways involved and independent of the respective substrates (Sutka et al., 2006) (Table 3). For N2O production via NH2OH oxidation by typical AOB pure cultures values in the range of 30.8 ± 5.9 to 35.6 ± 1.4 ‰ were measured (Sutka et al., 2003, 2004, 2006), which is in agreement with recently reported SP values of marine AOA (30.8 ± 4.4 ‰) (Santoro et al., 2011). In contrast, Frame and Casciotti (2010) estimated 36.3 ± 2.4 ‰ for a marine AOB. For nitrifier denitrification by AOB, the following SP values were reported: 0.1 ± 1.7 ‰ (Sutka et al., 2006), -0.8 ± 5.8 ‰ (Sutka et al., 2003, 2004) and -10.7 ± 2.9 ‰ (Frame and Casciotti, 2010). For N2O production via heterotrophic denitrification SP values in the range of -5.1 to 0 ‰ were reported (Toyoda et al., 2005; Sutka et al., 2006). Nitric oxide reductases (Nor) likely determine the SP of N2O during nitrifier denitrification as well as heterotrophic denitrification. The SP for both pathways is in the same range indicating that the involved Nor’s in AOB (cNor) and heterotrophic denitrifiers (cNor or qNor) (Stein and Yung, 2003; Stein, 2011) share a similar enzymatic mechanism. In case free NO is formed during NH2OH oxidation, any NO molecule that is funneled into nitrifier or heterotrophic denitrification (either directly or via initial
Chapter 2
40
oxidation to NO2-) would result in N2O with an SP of ~0 ‰ masking its initial NH2OH
source.
The most probable explanation for a positive SP during NH2OH oxidation is a preferable 14N-16O bond cleavage of a symmetric intermediate such as hyponitrite (-16O14N15N16O-), leading to an enrichment of 14N-15N-16O (Toyoda et al., 2005; Schmidt et al., 2004a). In the current model of N2O formation from NH2OH oxidation, NH2OH is reduced to NO, which is further reduced to N2O by an unidentified Nor. However, the positive SP of N2O formed from NH2OH oxidation can only be explained (i) if the involved Nor has a different mechanism than Nor’s mediating nitrifier and heterotrophic denitrification or (ii) if N2O is formed by a different mechanism, which does not involve free NO. We suggest mechanisms involving HNO: either by formation of free H2N2O2 with further chemical decomposition to N2O (discussed in section ‘HNO as intermediate of enzymatic NH2OH oxidation’) or a site specific enzymatic cleavage of -ONNO- as discussed above (Toyoda et al., 2005; Schmidt et al., 2004a). Further insights in the enzymatic mechanism of HAO and potentially HAO-associated Nor with careful chemical control experiments are needed to elucidate the biochemical mechanism of N2O formation during NH2OH oxidation.
Furthermore, a positive SP is, in addition to NH2OH oxidation, also an indicator for increasing importance of the heterotrophic N2O reductase activity relative to N2O production (substantially greater activity than 10 % compared to production) (Yamagishi et al., 2007; Jinuntuya-Nortman et al., 2008; Koba et al., 2009). As a consequence, N2O reduction to N2 might lead to an overestimation of N2O production by NH2OH oxidation, or vice versa. Nevertheless, further investigations are necessary in order to determine the individual signatures under conditions more representative for ecosystems with mixed culture populations (Wunderlin et al., under review).
Under nitrifying conditions, N2O can theoretically be produced simultaneously via NH2OH oxidation as well as nitrifier denitrification. Thus, based on SP literature data, the individual contribution (FNN: NH2OH oxidation; FND: nitrifier denitrification) can be calculated from the following isotopomer mixing model:
NNND
NNtotNNND SPSP
SPSPFF
)1( Equation 16
where SPND and SPNN are the end-member SP signatures of the NH2OH oxidation and nitrifier denitrification pathway, respectively, as reviewed above, and SPtot the measured signature of the individual produced N2O (Frame and Casciotti, 2010).
δ15N. Wide ranges for δ15NbulkN2O were reported so far, mainly due to limited
information about the isotopic signature of the substrates or to both a huge complexity determined by multiple transformation processes involving different enzymes, as well as variable reaction rates or mechanisms affecting isotopic fractionation (Perez et al., 2006) (Table 3). For example, it was shown that isotopic fractionation during NH3 oxidation is variable, depending mainly on the amino acid
sequences for the α-subunit of AMO of the different investigated pure culture AOB
Chapter 2
41
(Casciotti et al., 2003). However, N2O produced by AOB during nitrifier denitrification or
NH2OH oxidation is basically more strongly depleted in 15N (Δδ15N = δ15Nsubstrate - δ15Nbulk
N2O; in the range of between 40 to 68 ‰) compared to heterotrophic denitrification, where N2O is an obligate intermediate and the fractionation therefore
depends on both production and consumption processes (Δδ15N of 0 to 39 ‰) (Yoshida, 1988; Yoshida et al., 1989; Stein and Yung, 2003; Perez et al., 2006; Koba et al., 2009; Park et al., 2011).
δ18O. The oxygen isotopic signature of N2O (δ18O) is also used as a tool for N2O source partitioning, even though this approach faces a couple of difficulties: for example, N2O production via NH2OH oxidation as well heterotrophic N2O reduction result in a positive
correlation between the δ18O in N2O and SP (Frame and Casciotti, 2010) (Table 3).
Furthermore, δ18O enrichment factors are scarce and highly variable (Park et al., 2011), and are reported to be strongly influenced by oxygen exchange or incorporation, such as (i) oxygen incorporation (from dissolved O2) into NH2OH during the oxidation of NH4
+ to NH2OH, (ii) oxygen incorporation (from H2O) into NO2
- during the oxidation of NH2OH to NO2
-, and (iii) oxygen exchange between NO2-/NO3
- and H2O (Kool et al., 2007). For example, it was shown that 64 to 94 % of the oxygen atoms in the precursors of N2O were exchanged with oxygen atoms in H2O (Snider et al., 2009; Park et al., 2011), which underscores the fact that the understanding and quantification of the effect of oxygen exchange between H2O and dissolved nitrogen species is and will remain challenging. Isotopic labeling is a promising approach to overcome such difficulties (see below), but up to now the natural abundance oxygen isotopic signature should be used with caution in N2O source partitioning studies (Kool et al., 2007, 2010).
N and O labeling. Beside natural abundances, nitrogen and oxygen isotope labeling techniques have been applied to study and quantify N2O production pathways (Table 3). For example, Poth and Focht (1985) investigated the relative importance of the NH2OH oxidation and nitrifier denitrification pathway in Nitrosomonas europaea pure culture by applying 14N-NH4
+ in combination with 15N-NO2-. Based on the large amounts
of double-labeled 15,15N2O (m/z = 46), it was concluded that nitrifier denitrification is the dominant pathway. Baggs and Blum (2004) determined the relative contribution of nitrification and denitrification to 15N-N2O production by the application of 14NH4
15NO3 and 15NH4
15NO3. However, such conventional 15N labeling techniques do not allow to distinguish between NH2OH oxidation and nitrifier denitrification in mixed population systems (Kool et al., 2010). As a consequence, a dual isotope approach was applied, based on 18O-labeling of H2O as well as 15N-labeling of NH4
+ or NO3- (Wrage et al., 2005).
The basic concept behind is, that AOB use oxygen from O2 for the oxidation of NH4+ to
NH2OH, but oxygen from H2O for the oxidation of NH2OH to NO2- (see above). As such,
the 18O signature of N2O produced via nitrifier denitrification reflect to 50 % the signature of O2 and to the other 50 % the signature of H2O, which is in this study artificially enriched in 18O (Kool et al., 2007), under the assumption that no further oxygen is exchanged between NO2
- and H2O. In contrast, the 18O signature of N2O derived from NH2OH oxidation reflects to 100 % the signature of O2 (Wrage et al., 2005;
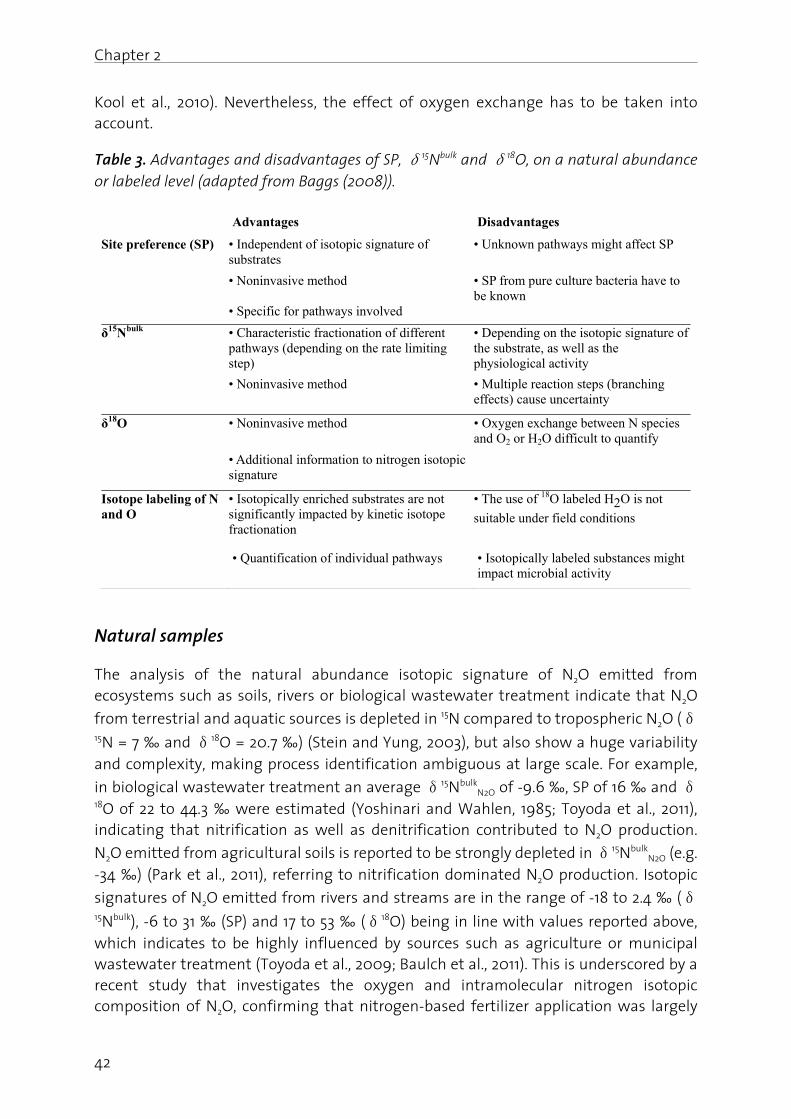
Chapter 2
42
Kool et al., 2010). Nevertheless, the effect of oxygen exchange has to be taken into account.
Table 3. Advantages and disadvantages of SP, δ15Nbulk and δ18O, on a natural abundance or labeled level (adapted from Baggs (2008)).
Advantages Disadvantages
Site preference (SP) • Independent of isotopic signature of substrates
• Unknown pathways might affect SP
• Noninvasive method • SP from pure culture bacteria have to be known
• Specific for pathways involved
δ15Nbulk • Characteristic fractionation of different pathways (depending on the rate limiting step)
• Depending on the isotopic signature of the substrate, as well as the physiological activity
• Noninvasive method • Multiple reaction steps (branching effects) cause uncertainty
δ18O • Noninvasive method • Oxygen exchange between N species and O2 or H2O difficult to quantify
• Additional information to nitrogen isotopic signature
Isotope labeling of N and O
• Isotopically enriched substrates are not significantly impacted by kinetic isotope fractionation
• The use of 18O labeled H2O is not
suitable under field conditions
• Quantification of individual pathways • Isotopically labeled substances might impact microbial activity
Natural samples
The analysis of the natural abundance isotopic signature of N2O emitted from ecosystems such as soils, rivers or biological wastewater treatment indicate that N2O
from terrestrial and aquatic sources is depleted in 15N compared to tropospheric N2O (δ15N = 7 ‰ and δ18O = 20.7 ‰) (Stein and Yung, 2003), but also show a huge variability and complexity, making process identification ambiguous at large scale. For example,
in biological wastewater treatment an average δ15NbulkN2O of -9.6 ‰, SP of 16 ‰ and δ
18O of 22 to 44.3 ‰ were estimated (Yoshinari and Wahlen, 1985; Toyoda et al., 2011), indicating that nitrification as well as denitrification contributed to N2O production.
N2O emitted from agricultural soils is reported to be strongly depleted in δ15NbulkN2O (e.g.
-34 ‰) (Park et al., 2011), referring to nitrification dominated N2O production. Isotopic
signatures of N2O emitted from rivers and streams are in the range of -18 to 2.4 ‰ (δ15Nbulk), -6 to 31 ‰ (SP) and 17 to 53 ‰ (δ18O) being in line with values reported above, which indicates to be highly influenced by sources such as agriculture or municipal wastewater treatment (Toyoda et al., 2009; Baulch et al., 2011). This is underscored by a recent study that investigates the oxygen and intramolecular nitrogen isotopic composition of N2O, confirming that nitrogen-based fertilizer application was largely
Chapter 2
43
responsible for the rise in N2O atmospheric concentration during the last 65 years (Park et al., 2012).
Outlook
In this section, the isotopic signature of N2O, especially the SP, is discussed to be a powerful tool to distinguish N2O production pathways. Recent technological advances, e.g. the development and application of the quantum cascade laser absorption spectroscopy, now allow a high temporal resolution in the analysis of the isotopic changes of N2O. Nevertheless, an adequate calibration procedure still needs to be applied, since instrumental nonlinearity and drifts impact the accuracy of the isotope ratio measurement, and calibration standards are not commercially available so far. It is a pressing issue to further investigate the characteristic isotopic signatures of the individual N2O production pathways in mixed microbial communities under controlled conditions, in order to more accurately interpret isotopic signatures from complex environmental systems. Further, it is important to study N2O isotopic signatures with respect to involved microbial communities, enzymatic reaction mechanisms and enzymatic transformation rates. The use of the oxygen isotopic signature of N2O as a reliable tool for pathway identification requires the elucidation of mechanisms and rates of oxygen exchange in the future.
Molecular approaches to understanding microbial NO and N2O formation
While abiotic variables such as dissolved O2, pH, NO2-, and other nitrogen compounds
have long been recognized to exert a strong influence on rates of microbial NO and N2O emissions, the importance of microbial community composition and dynamics to such emissions is still little understood (Wallenstein et al., 2006). As such, researchers have recently begun supplementing process-level NO and N2O emission measurements in a variety of environments with molecular techniques aimed at characterizing abundance, diversity, community structure, and activity of microbial guilds involved in nitrogen cycling. Here, we briefly introduce emerging molecular approaches to the delineation of key pathways, communities, and controls of NO and N2O production, and we summarize recent applications of these tools.
Quantifying the genetic potential for N2O consumption
An appealing focus for application of molecular tools in environmental samples is direct quantification via the quantitative polymerase chain reaction (qPCR) of relevant functional genes (Smith and Osborn, 2008). Such an approach most commonly targets DNA, not RNA, and is thus a measure of genetic potential in the environment and not the activity.
Owing to the relative independence of each catabolic step, denitrification has been described as having a modular organization (Zumft, 1997). Indeed, Jones et al. (2008)
Chapter 2
44
concluded based on an analysis of 68 sequenced genomes of heterotrophic denitrifiers that approximately 1/3 lacked the nosZ gene encoding for N2O reductase and thus lack the genetic capacity for N2O reduction. Based on this assessment, researchers have hypothesized that the ratio of nosZ to the sum of nirK and nirS encoding for copper and cytochrome cd1-type nitrite reductases, respectively, is representative of the fraction of denitrifiers in a given environment that generate N2O as a catabolic end product. Environments with high nosZ/(nirK+nirS) ratios are likely associated with a high capacity for N2O consumption, and thus for low N2O emissions. Commonly used primers and qPCR conditions for genes relevant for NO and N2O turnover during N-cycling are available in the literature and are listed in Table 4, and thus the measurement of such ratios are feasible with little method development. Application of such tools has commonly shown a lower abundance of nosZ compared to other denitrifying reductases, particularly in soil environments (Henry et al., 2006; Hallin et al., 2009; Bru et al., 2011).
First assessments of this hypothesis are somewhat conflicting. In favor for the hypothesis, Philippot et al. (2009) demonstrated a negative correlation between nosZ proportional abundance and N2O/(N2 + N2O) ratio in grassland pasture soil. In a follow-up study, Philippot et al. (2011) dosed three soils with several dilutions of a denitrifying bacterial isolate known to lack the nosZ gene, and measured the response at the DNA level of nirK, nirS, and nosZ genes via qPCR. N2O emissions increased in all soils upon dosing of the nosZ-deficient isolate. However, in two of the three soils, the increase in denitrification potential (relative to non-inoculated controls) was higher than the measured increase in N2O emissions, suggesting that the original denitrifier community was capable of acting as a sink for N2O production. Moreover, ratios of N2O emissions to total denitrifying end products (N2O + N2) in non-inoculated soils were not correlated to nosZ/(nirK+nirS). While the authors acknowledge that abundance of nosZ deficient denitrifiers may not be as important in soils with a high N2O uptake capacity, their results clearly demonstrate that abundance of denitrifiers incapable of N2O reduction can influence denitrification end products in natural environments. Similarly, Morales et al. (2010) document a strong positive correlation between the difference in nirS and nosZ gene abundance (nirS-nosZ; nirK was not quantified) and N2O emissions in 10 soils. Garcia-Lledo et al. (2011) suggested that a significant decrease in nosZ gene abundance during periods of high NO3
- content in a constructed wetland might be indicative of increased genetic capacity for (unmeasured) N2O emissions.
In contrast, Čuhel et al. (2010) detail a significant but, puzzlingly, positive correlation in grassland soil between nosZ/(nirS+nirK) ratios and N2O/(N2 + N2O), but caution that the relative importance of denitrifier community composition and enzyme regulation relative to proportion of nosZ deficient community members remains uncertain. In line with this result, Braker and Conrad (2011) found similar ratios of nosZ/(nirS+nirK) via Most Probable Number (MPN-) PCR in three soils with profoundly different N2O/(N2 + N2O) ratios, and concluded that the hypothesis that a higher abundance of denitrifiers lacking nosZ is linked to increased N2O emissions may be an oversimplification.
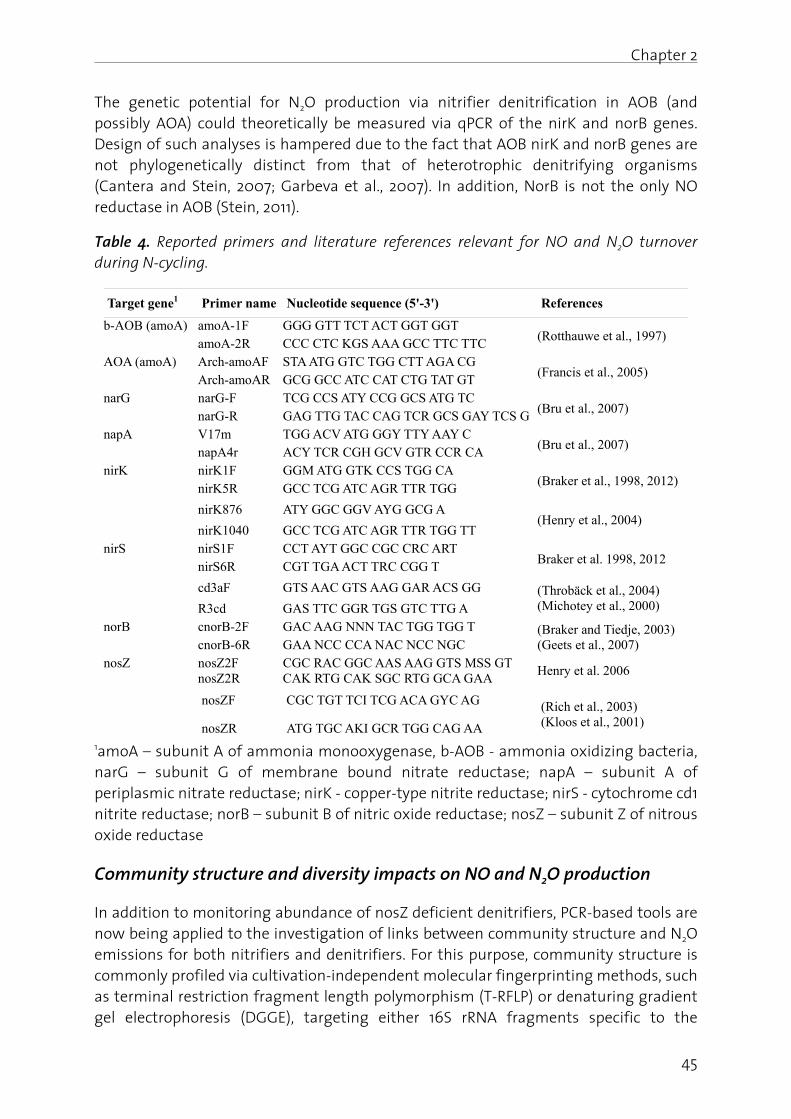
Chapter 2
45
The genetic potential for N2O production via nitrifier denitrification in AOB (and possibly AOA) could theoretically be measured via qPCR of the nirK and norB genes. Design of such analyses is hampered due to the fact that AOB nirK and norB genes are not phylogenetically distinct from that of heterotrophic denitrifying organisms (Cantera and Stein, 2007; Garbeva et al., 2007). In addition, NorB is not the only NO reductase in AOB (Stein, 2011).
Table 4. Reported primers and literature references relevant for NO and N2O turnover during N-cycling.
Target gene1 Primer name Nucleotide sequence (5'-3') References
b-AOB (amoA) amoA-1F GGG GTT TCT ACT GGT GGT (Rotthauwe et al., 1997)
amoA-2R CCC CTC KGS AAA GCC TTC TTC AOA (amoA) Arch-amoAF STA ATG GTC TGG CTT AGA CG
(Francis et al., 2005) Arch-amoAR GCG GCC ATC CAT CTG TAT GT
narG narG-F TCG CCS ATY CCG GCS ATG TC (Bru et al., 2007)
narG-R GAG TTG TAC CAG TCR GCS GAY TCS G napA V17m TGG ACV ATG GGY TTY AAY C
(Bru et al., 2007) napA4r ACY TCR CGH GCV GTR CCR CA
nirK nirK1F GGM ATG GTK CCS TGG CA (Braker et al., 1998, 2012)
nirK5R GCC TCG ATC AGR TTR TGG
nirK876 ATY GGC GGV AYG GCG A (Henry et al., 2004)
nirK1040 GCC TCG ATC AGR TTR TGG TT nirS nirS1F CCT AYT GGC CGC CRC ART
Braker et al. 1998, 2012 nirS6R CGT TGA ACT TRC CGG T
cd3aF GTS AAC GTS AAG GAR ACS GG (Throbäck et al., 2004) (Michotey et al., 2000) R3cd GAS TTC GGR TGS GTC TTG A
norB cnorB-2F GAC AAG NNN TAC TGG TGG T (Braker and Tiedje, 2003) (Geets et al., 2007) cnorB-6R GAA NCC CCA NAC NCC NGC
nosZ nosZ2F CGC RAC GGC AAS AAG GTS MSS GT Henry et al. 2006
nosZ2R CAK RTG CAK SGC RTG GCA GAA
nosZF CGC TGT TCI TCG ACA GYC AG (Rich et al., 2003) (Kloos et al., 2001) nosZR ATG TGC AKI GCR TGG CAG AA
1amoA – subunit A of ammonia monooxygenase, b-AOB - ammonia oxidizing bacteria, narG – subunit G of membrane bound nitrate reductase; napA – subunit A of periplasmic nitrate reductase; nirK - copper-type nitrite reductase; nirS - cytochrome cd1 nitrite reductase; norB – subunit B of nitric oxide reductase; nosZ – subunit Z of nitrous oxide reductase
Community structure and diversity impacts on NO and N2O production
In addition to monitoring abundance of nosZ deficient denitrifiers, PCR-based tools are now being applied to the investigation of links between community structure and N2O emissions for both nitrifiers and denitrifiers. For this purpose, community structure is commonly profiled via cultivation-independent molecular fingerprinting methods, such as terminal restriction fragment length polymorphism (T-RFLP) or denaturing gradient gel electrophoresis (DGGE), targeting either 16S rRNA fragments specific to the
Chapter 2
46
functional guild of interest or functional genes (for example, nirK or amoA) directly. In addition, traditional cloning and Sanger sequencing and, increasingly, barcoded amplicon-based pyrosequencing of functional genes are often employed for robust phylogenetic comparisons. Readers are referred to Prosser et al. (2010) for a detailed methodological description of these and other nucleic-acid based methods. Multivariate statistical analyses such as canonical correspondence analysis (CCA), redundancy analysis (RDA) (Ramette, 2007; Wells et al., 2009), or path analysis (Avrahami and Bohannan, 2009) can then be used to explore the interplay between abiotic variables, community composition, and extant process rates.
It should be emphasized that the molecular and statistical tools highlighted above are most commonly used in microbial ecology to explore correlations, rather than causal associations, between community structure and function in complex microbial communities. As discussed in detail by Reed and Martiny (2007) directly testing causal relationships between microbial community composition or diversity and ecosystem processes is significantly more difficult, but experimental approaches often drawn from classical ecology are now being adapted to this challenge. We anticipate that future studies testing the functional significance of microbial community structure to NO or N2O production will benefit greatly from these approaches.
Studies targeting the relationship between nitrifier community composition and greenhouse gas production are sparse at present, despite the fact that ample molecular tools are available for this purpose. Avrahami and Bohannan (2009) employed a combination of qPCR and T-RFLP to explore the response of N2O emission rates and betaproteobacterial AOB abundance and composition in a California meadow to manipulations in temperature, soil moisture, and fertilizer concentration. While a complex interaction between factors was determined to directly and indirectly contribute to N2O emission rates, path analysis suggested that the major path by which NH4
+ influenced emission rates in the high N fertilization treatment was indirectly via two specific AOB clusters. This observation suggested a significant relationship between AOB community structure and N2O emission rates. It is important to note that this study did not attempt to discriminate between the nitrifier denitrification and hydroxylamine oxidation pathways for AOB-linked N2O production, nor was the relative importance of heterotrophic denitrification versus nitrification for overall N2O emissions directly compared.
Assessment of the importance of DNRA as a process, and diversity therein, to NO and N2O production is in its infancy. It has been suggested that our understanding of this little understood phenomena would benefit from the future investigations employing molecular techniques to quantify abundance and diversity of the nrf gene in conjunction with either modeling or stable isotope-based methods (Baggs, 2011). To our knowledge, such an assessment has yet to be conducted.
The relationship between denitrifier community composition and N2O emissions, while still ambiguous, has been studied in more detail. Palmer et al. (2010) investigated narG (encoding for membrane-bound nitrate reductase, Nar) and nosZ phylogenetic diversity
Chapter 2
47
in a low-pH fen via gene clone libraries and T-RFLP. They documented novel narG and nosZ genotypes and a phylogenetically diverse low-pH adapted denitrifier community, and suggested that the novel community structure may be responsible for complete denitrification and low N2O emissions under in situ conditions. In a more recent study, Palmer et al. (2011) investigated denitrifier gene diversity in peat circles in the arctic tundra via barcoded amplicon pyrosequencing of narG, nirK/nirS, and nosZ, and found evidence that high and low N2O emission patterns were associated with contrasting denitrifier community composition. Braker et al. (2012) found that, of three soils profiled, the soil with the most robust denitrification (lowest N2O/N2 ratio) harbored the most diverse denitrifier community, as measured via nosZ and nirK sequence diversity, suggesting that differences in community composition (higher diversity) are associated with ecosystem-level functional differences. In denitrifying bioreactors, population dynamics tracked via 16S rRNA-based T-RFLP were strongly correlated to NO2
- appearance and emissions of N2O (Gentile et al., 2007). In contrast, Rich and Myrold (2004) found little relationship between nosZ phylogenetic diversity as measured via T-RFLP in wet soils and creek sediments in an agrosystem, and suggested that activity and community composition were uncoupled in this ecosystem.
Taken together, the body of literature reviewed here suggests that, in at least some cases, community structure and diversity can play a functionally significant role in microbial N2O emissions. The importance of community composition relative to environmental parameters and metabolic adaptation in response to transient conditions (for example, shifts in patterns of gene expression or regulation) in determining N2O production, however, remains poorly understood. A worthwhile, but challenging future research direction would be to tease apart the influence of whole community metabolic adaptation versus community shifts on NO/N2O emissions in mixed microbial communities.
A role for variation in regulatory response
Differences in transcriptional and translational regulation as well as enzyme activity have also been highlighted as potentially critical modulators of microbial NO or N2O production (Richardson et al., 2009; Bergaust et al., 2011; Braker and Conrad, 2011). Such differences likely contribute to observed associations between community structure and greenhouse gas production discussed above. Strong regulation at the transcriptional, translational, and enzyme level is likely occurring in both nitrifier and denitrifier communities, and such regulation complicates attempts to directly relate abundance or diversity of functional guilds to process rates (Braker and Conrad, 2011). Similarly, transient near-instantaneous NO and N2O accumulation in active nitrifying and denitrifying biofilms in response to O2 or NO2
- perturbations, as measured with high temporal resolution via microelectrodes, strongly suggests that dynamics are controlled in some cases at the enzyme level (Schreiber et al., 2009). Indeed, culture-based assays targeting denitrifier isolates from two soils demonstrated substantial diversity in sensitivity of Nos enzymes to O2 and provided a physiological underpinning for a previously observed link between denitrifier community composition and rate of N2O production (Cavigelli and Robertson, 2000).
Chapter 2
48
Gene expression can be readily quantified with reverse transcriptase quantitative PCR (RT-qPCR), and researchers are now beginning to explore the relationship between gene expression patterns for critical functional genes (amoA, hao, nirK, nirS, norB, and nosZ) and NO/N2O emissions. Yu et al. (2010) used such an approach to quantify expression of amoA, hao, nirK, and norB in chemostats of Nitrosomonas europaea during initiation and recovery from transient anoxic conditions. Surprisingly, expression profiles of nirK and norB were not strongly linked; strong overexpression of nirK concomitant with NO accumulation was observed upon initiation of anoxia, and at the same time norB, amoA, and hao gene transcripts declined in abundance. N2O emissions peaked during recovery to aerated conditions, but did not correlate strongly to gene expression. The methods of Yu et al. (2010) provide a robust road map for examining relationships between nitrifier gene expression and NO/N2O emissions in mixed communities in environmental settings, though it should be noted that such an analysis is complicated by the polyphyletic nature of the AOB nirK and norB genes.
RT-qPCR has also been used to assess the relationship between gene expression and NO/N2O production in systems dominated by denitrifiers. Liu et al. (2010) quantified the relationship between nirS, nirK, and nosZ gene pools, their transcription products, and gas kinetics (NO, N2O, and N2) as a function of pH in soils. Interestingly, neither gene pool abundance, nor transcription rates could explain a profound increase in N2O emissions at low pH. The authors attribute the observed N2O:N2 product ratio to post-transcriptional phenomenon, although it is also plausible that enhanced chemo-denitrification may play a role.
A worthy future contribution could be made via direct environmental metatranscriptomic assessment of patterns in microbial gene expression in environments with different or varying rates of NO or N2O production. Metatranscriptomics is the direct sequencing of cDNA generated via reverse transcription of environmental RNA transcripts, and therefore provides a picture of currently transcribed genes in a given environment (Morales and Holben, 2010). In line with the results of Liu et al. (2010), it is important to recognize that measurement of the size or diversity of the gene transcript pool neglects post-transcriptional regulation governing, for example, the assembly of N2O reductase and enzyme activity (Braker and Conrad, 2011). As of yet, variations in post-transcriptional regulation at the community level and its effect on NO/N2O production has been little explored in nitrifying and denitrifying pure cultures and communities. Critical insights in this regard may be possible in the future from an approach coupling metatranscriptomics and metaproteomics—that is, direct measurement of the composition of the proteome in an environment.
A need for an integrated approach to NO and N2O turnover in complex microbial communities
NO and N2O can be produced by many different biological and chemical reactions. Considerable progress has been made to allocate NO and N2O production to certain
Chapter 2
49
biological pathways, but commonly some uncertainty remains, because many processes share the same reaction sequence for N2O production via NO and NO2
-. We delineated basically 3 independent approaches to allocate pathways (indirect inference; isotopic signature of N2O, and isotopic labeling). Parallel use of these approaches will increase confidence in the interpretation. The possibility for various chemical reaction that produce and consume NO and N2O additionally complicate the picture. Chemical reactions can be important in engineered systems that employ waters with concentrated N-contents and in natural systems, where low pH values coincide with high ammonia inputs. However, in most natural systems and in municipal wastewater treatment, chemical reactions will probably not be the main contributors of NO and N2O emissions. Nevertheless, the possibility of chemical NO and N2O production has to be considered when interpreting measurements. Experiments with inactivated biomass could help to give a first estimation of the chemical production rates. However, care has to be taken since the chemical conditions that facilitate chemical NO and N2O production such as pH and trace metal availability are in turn shaped by microbial activity.
Molecular methods have largely been applied independently from the stable isotope and microelectrode approaches. Ample opportunities exist for integration of these techniques. Indeed, it is clear that such an integrated approach is critical to assessing the importance of microscale heterogeneity in environmental parameters, microbial community structure and stability, and genetic regulation to observed process-level N2O emission rates.
Joint use of stable isotope methods in conjunction with molecular techniques appears particularly important, given reported difference in isotope effects depending on the community structure of nitrifiers (Casciotti et al., 2003) or denitrifiers (Toyoda et al., 2005) present. In addition, linking source-partioned N2O as measured via stable isotope techniques to the underlying microbial communities via molecular approaches may allow a more significant measure of the strength of coupling between microbial diversity and measured emissions (Baggs, 2008, 2011). One promising way forward is to assess environmental conditions that favor a shift of dominant N2O production pathway (for example, from denitrification to nitrification, or vice versa) as measured via stable isotope methods, and to simultaneously link such a shift to diversity and abundance of functional gene pools and transcripts via PCR-based molecular approaches. Such an approach has the potential to yield insights into the relative importance of dominant functional guilds, community composition, and activity in determining microbial NO/N2O production rates. A fruitful first application would be to combine stable isotope-based methods with the molecular approach pioneered by Yu et al. (2010) for delineating the relationship between transcriptional response of the model AOB Nitrosomonas europaea and NO/N2O production. This coupled approach would allow conclusive verification of conditions proposed by Chandran et al. (2011) to favor a switch between nitrifier denitrification and NH2OH oxidation as dominant sources NO and N2O production.
Chapter 2
50
Similarly, it is clear that molecular tools and microelectrodes are complementary to study NO and N2O turnover. An excellent example of such integration is provided by Okabe et al. (2011), who profiled microscale gradients in N2O emissions in anammox granules and compared these profiles to spatial location of AOB, as measured via fluorescence in-situ hybridization (FISH). Based on their results, the authors concluded that putative heterotrophic denitrifiers in the inner part of the granule, not AOB, were likely responsible for the majority of the extant N2O process emissions. A similar approach is likely applicable in a wide variety of environments, including flocs, sediments, soils, and microbial mats. In addition, use of either FISH probes with higher phylogenetic resolution or depth stratified DNA/RNA extraction coupled to PCR-based measurements may allow a direct microscale assessment of links between microbial diversity and activity and NO/N2O production profiles. Such a microscale assessment is important because stratified environments likely contain both regions of N2O production and consumption that are masked during bulk NO/N2O concentration measurements or DNA/RNA extractions. In addition, microelectrode measurements with high temporal resolution should be combined with qPCR to better understand the regulation of NO and N2O peak emissions from different environments.
The conditions for NO and N2O formation in pure cultures and by chemical reactions begin to be better understood. Furthermore, several recent technological advancements allow researcher to investigate the regulation of NO and N2O formation in complex environments at high spatial and temporal resolution. These advancements provide a cornerstone to understand and mitigate the release of NO and N2O from natural and engineered environments.
Acknowledgements
We thank Joachim Mohn (Swiss Federal Laboratories for Materials Testing and Research, Empa) for helpful discussions during the preparation of the manuscript.
References
Ahlers, B., Konig, W., and Bock, E. (1990). Nitrite reductase activity in Nitrobacter vulgaris. FEMS Microbiology Letters 67, 121-126.
Ahn, J.H., Kwan, T, and Chandran, K. (2011). Comparison of partial and full nitrification processes applied for treating high-strength nitrogen wastewaters: microbial ecology through nitrous oxide production. Environmental Science and Technology. 45, 2734-2740.
Ahn, J. H., Kim, S., Park, H., Rahm, B., Pagilla, K., & Chandran, K. (2010). N2O Emissions from Activated Sludge Processes, 2008-2009: Results of a National Monitoring Survey in the United States. Environmental Science & Technology, 44(12), 4505–4511.
Chapter 2
51
Alluisetti, G. E., Almaraz, A. E., Amorebieta, V. T., Doctorovich, F., and Olabe, J. A. (2004). Metal-catalyzed anaerobic disproportionation of hydroxylamine. Role of diazene and nitroxyl intermediates in the formation of N2, N2O, NO+, and NH3. Journal of the American Chemical Society 126, 13432-13442.
Andersen, K., Kjaer, T., and Revsbech, N. P. (2001). An oxygen insensitive microsensor for nitrous oxide. Sensors and Actuators B: Chemical 81, 42-48.
Anderson, J. H. (1964). The copper-catalysed oxidation of hydroxylamine. The Analyst 89, 357-362.
Anjum, M. F., Stevanin, T. M., Read, R. C., and Moir, J. W. B. (2002). Nitric Oxide Metabolism in Neisseria meningitidis. Journal of Bacteriology 184, 2987-2993.
Avrahami, S., and Bohannan, B. J. M. (2009). N2O emission rates in a California meadow soil are influenced by fertilizer level, soil moisture and the community structure of ammonia-oxidizing bacteria. Global Change Biology 15, 643-655.
Baggs, E. M. (2011). Soil microbial sources of nitrous oxide: recent advances in knowledge, emerging challenges and future direction. Current Opinion in Environmental Sustainability 3, 321-327.
Baggs, E. M. (2008). A review of stable isotope techniques for N2O source partitioning in soils: recent progress, remaining challenges and future considerations. Rapid Communications in Mass Spectrometry 22, 1664-1672.
Baggs, E. M., and Blum, H. (2004). CH4 oxidation and emissions of CH4 and N2O from Lolium perenne swards under elevated atmospheric CO2. Soil Biology and Biochemistry 36, 713-723.
Bateman, E. J., and Baggs, E. M. (2005). Contributions of nitrification and denitrification to N2O emissions from soils at different water-filled pore space. Biology and Fertility of Soils 41, 379-388.
Bauer, S. (1995). Membrane introduction mass spectrometry; an old method that is gaining new interest through recent technological advances. Trends in Analytical Chemistry 14, 202-213.
Baulch, H. M., Schiff, S. L., Thuss, S. J., and Dillon, P. J. (2011). Isotopic character of nitrous oxide emitted from streams. Environmental Science and Technology 45, 4682-4688.
Baumann, B., Snozzi, M., Zehnder, a J., and van der Meer, J. R. (1996). Dynamics of denitrification activity of Paracoccus denitrificans in continuous culture during aerobic-anaerobic changes. Journal of Bacteriology 178, 4367-74.
Beaulieu, J. J., Tank, J. L., Hamilton, S. K., Wollheim, W. M., Hall, R. O., Mulholland, P. J., Peterson, B. J., Ashkenas, L. R., Cooper, L. W., Dahm, C. N., et al. (2011). Nitrous oxide emission from denitrification in stream and river networks. Proceedings of the National Academy of Sciences of the United States of America 108, 214-9.
Chapter 2
52
Beaumont, H. J. E., Lens, S. I., Reijnders, W. N. M., Westerhoff, H. V., and van Spanning, R. J. M. (2004a). Expression of nitrite reductase in Nitrosomonas europaea involves NsrR, a novel nitrite-sensitive transcription repressor. Molecular Microbiology 54, 148-58.
Beaumont, H. J. E., van Schooten, B., Lens, S. I., Westerhoff, H. V., and van Spanning, R. J. M. (2004b). Nitrosomonas europaea Expresses a Nitric Oxide Reductase during Nitrification. Journal of Bacteriology 186, 4417-4421.
Beaumont, H. J. E., Hommes, N. G., Sayavedra-Soto, L. A., Arp, D. J., Arciero, D. M., Hooper, A. B., Westerhoff, H. V., and van Spanning, R. J. M. (2002). Nitrite Reductase of Nitrosomonas europaea Is Not Essential for Production of Gaseous Nitrogen Oxides and Confers Tolerance to Nitrite. Journal of Bacteriology 184, 2557-2560.
Bedioui, F., and Villeneuve, N. (2003). Electrochemical Nitric Oxide Sensors for Biological Samples - Principle, Selected Examples and Applications. Electroanalysis 15, 5-18.
Bergaust, L., Bakken, L. R., and Frostegård, A. (2011). Denitrification regulatory phenotype, a new term for the characterization of denitrifying bacteria. Biochemical Society Transactions 39, 207-12.
Bergaust, L., Mao, Y., Bakken, L. R., and Frostegård, A. (2010). Denitrification response patterns during the transition to anoxic respiration and posttranscriptional effects of suboptimal pH on nitrous oxide reductase in Paracoccus denitrificans. Applied and Environmental Microbiology 76, 6387-96.
Berks, B. C., Baratta, D., Richardson, J., and Ferguson, S. J. (1993). Purification and characterization of a nitrous oxide reductase from Thiosphaera pantotropha. Implications for the mechanism of aerobic nitrous oxide reduction. European Journal of Biochemistry 212, 467-76.
Bollmann, A., and Conrad, R. (1998). Influence of O2 availability on NO and N2O release by nitrification and denitrification in soils. Global Change Biology 4, 387-396.
Bonner, F. T., and Stedman, G. (1996). “The Chemistry of Nitric Oxide and Redox-related Species”, in Methods in Nitric Oxide Research, eds. M. Feelisch and J. S. Stamler (New York: John Wiley & Sons), 3-18.
Bonner, F.T. and Hughes, M.N. (1988). The aqueous solution chemistry of nitrogen in low positive oxidation states. Comments on Inorganic Chemistry 7, 215-234.
Bonner, F. T., Dzelzkalns, L. S., and Bonucci, J. A. (1978). Properties of nitroxyl as intermediate in the nitric oxide-hydroxylamine reaction and in trioxodinitrate decomposition. Inorganic Chemistry 17, 2487-2494.
Braker, G., Dörsch, P., and Bakken, L. R. (2012). Genetic characterization of denitrifier communities with contrasting intrinsic functional traits. FEMS Microbiology Ecology 79, 542-554.
Chapter 2
53
Braker, G., and Conrad, R. (2011). Diversity, structure, and size of N2O producing microbial communities in soil--what matters for their functioning? Advances in Applied Microbiology 75, 33-69.
Braker, G., and Tiedje, J. M. (2003). Nitric Oxide Reductase (norB) Genes from Pure Cultures and Environmental Samples. Applied and Environmental Microbiology 69, 3476-3483.
Braker, G., Fesefeldt, A., and Witzel, K.-P. (1998). Development of PCR Primer Systems for Amplification of Nitrite Reductase Genes (nirK and nirS) To Detect Denitrifying Bacteria in Environmental Samples. Applied and Environmental Microbiology 64, 3769-3775.
Brenninkmeijer, C. A. M., and Röckmann, T. (1999). Mass spectrometry of the intramolecular nitrogen isotope distribution of environmental nitrous oxide using fragment-ion analysis. Rapid Communications in Mass Spectrometry 13, 2028-2033.
Bru, D., Ramette, A., Saby, N. P. A., Dequiedt, S., Ranjard, L., Jolivet, C., Arrouays, D., and Philippot, L. (2011). Determinants of the distribution of nitrogen-cycling microbial communities at the landscape scale. ISME Journal 5, 532-542.
Bru, D., Sarr, A., and Philippot, L. (2007). Relative Abundances of Proteobacterial Membrane-Bound and Periplasmic Nitrate Reductases in Selected Environments. Applied and Environmental Microbiology 73, 5971-5974.
Butler, J. H., and Gordon, L. I. (1986a). An improved gas chromatographic method for the measurement of hydroxylamine in marine and fresh waters. Marine Chemistry 19, 229-243.
Butler, J. H., and Gordon, L. I. (1986b). Rates of nitrous oxide production in the oxidation of hydroxylamine by iron (III). Inorganic Chemistry 25, 4573-4577.
Cabail, M. Z., Kostera, J., and Pacheco, a A. (2005). Laser photoinitiated nitrosylation of 3-electron reduced Nm europaea hydroxylamine oxidoreductase: kinetic and thermodynamic properties of the nitrosylated enzyme. Inorganic Chemistry 44, 225-31.
Cabail, M. Z., and Pacheco, a A. (2003). Selective one-electron reduction of Nitrosomonas europaea hydroxylamine oxidoreductase with nitric oxide. Inorganic Chemistry 42, 270-2.
Cantera, J. J. L., and Stein, L. Y. (2007). Molecular diversity of nitrite reductase genes (nirK) in nitrifying bacteria. Environmental Microbiology 9, 765-776.
Casciotti, K. L., Sigman, D. M., and Ward, B. B. (2003). Linking Diversity and Stable Isotope Fractionation in Ammonia-Oxidizing Bacteria. Geomicrobiology Journal 20, 335-353.
Cavigelli, M. A., and Robertson, G. P. (2000). The functional significance of denitrifier community composition in a terrestrial ecosystem. Ecology 81, 1402-1414.
Chapter 2
54
Chalk, P. M., and Smith, C. J. (1983). “Chemodenitrification,” in Gaseous Loss of Nitrogen from Plant-Soil Systems, , eds. J. R. Freney and J. R. Simpson (Dordrecht, The Netherlands: Kluwer).
Chandran, K., Stein, L. Y., Klotz, M. G., and van Loosdrecht, M. C. M. (2011). Nitrous oxide production by lithotrophic ammonia-oxidizing bacteria and implications for engineered nitrogen-removal systems. Biochemical Society Transactions 39, 1832-7.
Charpentier, J., Farias, L., Yoshida, N., Boontanon, N., and Raimbault, P. (2007). Nitrous oxide distribution and its origin in the central and eastern South Pacific Subtropical Gyre. Biogeosciences 4, 729-741.
van Cleemput, O. (1998). Subsoils: Chemo- and biological denitrification, N2O and N2 emissions. Nutrient Cycling in Agroecosystems 52, 187-194.
van Cleemput, O., and Samater, A. H. (1996). Nitrite in soils: Accumulation and role in the formation of gaseous N compounds. Fertilizer Research 45, 81-89.
Corker, H., and Poole, R. K. (2003). Nitric oxide formation by Escherichia coli- Dependence on nitrite reductase, the NO-sensing regulator Fnr, and flavohemoglobin Hmp. Journal of Biological Chemistry 278, 31584-92.
Costa, C., Macedo, A., Moura, I., Moura, J. G. G., Le Gall, J., Berlier, Y., Liu, M.-Y., and Payne, W. J. (1990). Regulation of the hexaheme nitrite/nitric oxide reductase of Desulfovibrio desulfuricans, Wolinella succinogenes and Escherichia coli: A mass spectrometric study. FEBS Letters 1, 67-70.
Crutzen, P. J. (1979). The Role of NO and NO2 in the Chemistry of the Troposphere and Stratosphere. Annual Review of Earth and Planetary Sciences 7, 443-472.
Čuhel, J., Šimek, M., Laughlin, R. J., Bru, D., Chèneby, D., Watson, C. J., and Philippot, L. (2010). Insights into the Effect of Soil pH on N2O and N2 Emissions and Denitrifier Community Size and Activity. Applied and Environmental Microbiology 76, 1870-1878.
Cutruzzolà, F. (1999). Bacterial nitric oxide synthesis. Biochimica et Biophysica Acta 1411, 231-49.
Döring, C., and Gehlen, H. (1961). Über die Kinetic der Reaktion zwischen Hydroxylamin und Salpetriger Säure. Zeitschrift für anorganische und allgemeine Chemie 312, 32-44.
DuMond, J.F. and King, S.B. (2011). The chemistry of nitroxyl-releasing compounds. Antioxidants and Redox Signaling 14, 1637-1648.
Elberling, B., Christiansen, H. H., and Hansen, B. U. (2010). High nitrous oxide production from thawing permafrost. Nature Geoscience 3, 332-335.
Elkins, J. W., Wofsy, S. C., McElroy, M. B., Kolb, C. E., and Kaplan, W. A. (1978). Aquatic sources and sinks for nitrous oxide. Nature 275, 602 - 606.
Chapter 2
55
Eschenbach, W., and Well, R. (2011). Online measurement of denitrification rates in aquifer samples by an approach coupling an automated sampling and calibration unit to a membrane inlet mass spectrometry system. Rapid Communications in Mass Spectrometry 25, 1993-2006.
Ettwig, K. F., Butler, M. K., Le Paslier, D., Pelletier, E., Mangenot, S., Kuypers, M. M. M., Schreiber, F., Dutilh, B. E., Zedelius, J., de Beer, D., et al. (2010). Nitrite-driven anaerobic methane oxidation by oxygenic bacteria. Nature 464, 543-8.
Farias, L., Paulmier, a, and Gallegos, M. (2007). Nitrous oxide and N-nutrient cycling in the oxygen minimum zone off northern Chile. Deep Sea Research Part I: Oceanographic Research Papers 54, 164-180.
Fehling, C. and Friedrichs, G. (2011). Dimerization of HNO in aqueous solution: An interplay of solvation effects, fast acid-base equilibria, and intramolecular hydrogen bonding? Journal of the American Chemical Society 133, 17912-17922.
Fernández, M. L., Estrin, D. a, and Bari, S. E. (2008). Theoretical insight into the hydroxylamine oxidoreductase mechanism. Journal of Inorganic Biochemistry 102, 1523-30.
Firestone, M. K., Firestone, R. B., and Tiedje, J. M. . (1980). Nitrous Oxide from Soil Denitrification: Factors Controlling its Biological Production. Science 208, 749-751.
Firestone, M. K., and Tiedje, J. M. (1979). Temporal Change in Nitrous Oxide and Dinitrogen from Denitrification Following Onset of Anaerobiosis. Applied and Environmental Microbiology 38, 673-679.
Frame, C. H., and Casciotti, K. L. (2010). Biogeochemical controls and isotopic signatures of nitrous oxide production by a marine ammonia-oxidizing bacterium. Biogeosciences 7, 2695-2709.
Francis, C. A., Roberts, K. J., Beman, J. M., Santoro, A. E., and Oakley, B. B. (2005). Ubiquity and diversity of ammonia-oxidizing archaea in water columns and sediments of the ocean. Proceedings of the National Academy of Sciences, USA 102, 14683-14688.
Freitag, A., Rudert, M., and Bock, E. (1987). Growth of Nitrobacter by dissimilatoric nitrate reduction. FEMS Microbiology Letters 48, 105-109.
Friedemann, M. N., Robinson, S. W., and Gerhardt, G. a (1996). o-Phenylenediamine-modified carbon fiber electrodes for the detection of nitric oxide. Analytical Chemistry 68, 2621-8.
Frunzke, K., and Zumft, W. (1986). Inhibition of nitrous-oxide respiration by nitric oxide in the denitrifying bacterium Pseudomonas perfectomarina. Biochimica et Biophysica Acta 852, 119-125.
Chapter 2
56
Gao, H., Schreiber, F., Collins, G., Jensen, M. M., Svitlica, O., Kostka, J. E., Lavik, G., de Beer, D., Zhou, H.-yang, and Kuypers, M. M. M. (2010). Aerobic denitrification in permeable Wadden Sea sediments. The ISME Journal 4, 417-26.
Garbeva, P., Baggs, E. M., and Prosser, J. I. (2007). Phylogeny of nitrite reductase (nirK) and nitric oxide reductase (norB) genes from Nitrosospira species isolated from soil. FEMS Microbiology Letters 266, 83-89.
Garcia-Lledo, A., Vilar-Sanz, A., Trias, R., Hallin, S., and Baneras, L. (2011). Genetic potential for N2O emissions from the sediment of a free water surface constructed wetland. Water Research 45, 5621-5632.
Gardner, A. M., Helmick, R. A., and Gardner, P. R. (2002). Flavorubredoxin, an inducible catalyst for nitric oxide reduction and detoxification in Escherichia coli. Journal of Biological Chemistry 277, 8172-7.
Gardner, P. R., Gardner, A. M., Martin, L. A., and Salzman, A. L. (1998). Nitric oxide dioxygenase: an enzymic function for flavohemoglobin. Proceedings of the National Academy of Sciences of the United States of America 95, 10378-83.
Geets, J., de Cooman, M., Wittebolle, L., Heylen, K., Vanparys, B., De Vos, P., Verstraete, W., and Boon, N. (2007). Real-time PCR assay for the simultaneous quantification of nitrifying and denitrifying bacteria in activated sludge. Applied Microbiology and Biotechnology 75, 211-21.
Gentile, M. E., Lynn Nyman, J., and Criddle, C. S. (2007). Correlation of patterns of denitrification instability in replicated bioreactor communities with shifts in the relative abundance and the denitrification patterns of specific populations. ISME Journal 1, 714-728.
Gieseke, A., and de Beer, D. (2004). “Use of microelectrodes to measure in situ microbial activities in biofilms, sediments, and microbial mats”, in Molecular Microbial Ecology Manual, eds. G. Kowalchuk, F. de Bruijn, I. Head, A. Akkermans, and J. van Elsas (Springer Heidelberg).
Gilberthorpe, N. J., and Poole, R. K. (2008). Nitric oxide homeostasis in Salmonella typhimurium: roles of respiratory nitrate reductase and flavohemoglobin. Journal of Biological Chemistry 283, 11146-54.
Gomes, C. M., Giuffrè, A., Forte, E., Vicente, J. B., Saraiva, L. M., Brunori, M., and Teixeira, M. (2002). A novel type of nitric-oxide reductase. Escherichia coli flavorubredoxin. Journal of Biological Chemistry 277, 25273-6.
Granger, J., and Ward, B. B. (2012). Accumulation of nitrogen oxides in copper-limited cultures of denitrifying bacteria. Limnology and Oceanography 48, 313-318.
Gödde, M., and Conrad, R. (2000). Influence of soil properties on the turnover of nitric oxide and nitrous oxide by nitrification and denitrification at constant temperature and moisture. Biology and Fertility of Soils 32, 120-128.
Chapter 2
57
Hallin, S., Jones, C. M., Schloter, M., and Philippot, L. (2009). Relationship between N-cycling communities and ecosystem functioning in a 50-year-old fertilization experiment. ISME Journal.
Heisterkamp, I., Schramm, a, de Beer, D., and Stief, P. (2010). Nitrous oxide production associated with coastal marine invertebrates. Marine Ecology Progress Series 415, 1-9.
Hendrich, M. P., Upadhyay, A. K., Riga, J., Arciero, D. M., and Hooper, A. B. (2002). Spectroscopic characterization of the NO adduct of hydroxylamine oxidoreductase. Biochemistry 41, 4603-11.
Hendriks, J., Oubrie, A., Castresana, J., Urbani, A., Gemeinhardt, S., and Saraste, M. (2000). Nitric oxide reductases in bacteria. Biochimica et Biophysica Acta 1459, 266-73.
Henry, S., Bru, D., Stres, B., Hallet, S., and Philippot, L. (2006). Quantitative Detection of the nosZ Gene, Encoding Nitrous Oxide Reductase, and Comparison of the Abundances of 16S rRNA, narG, nirK, and nosZ Genes in Soils. Applied and Environmental Microbiology 72, 5181-5189.
Henry, S., Baudoin, E., Lopezgutierrez, J., Martinlaurent, F., Brauman, A., and Philippot, L. (2004). Quantification of denitrifying bacteria in soils by gene targeted real-time PCR. Journal of Microbiological Methods 59, 327-335.
Hojberg, O., Revsbech, N. P., and Tiedje, J. M. (1994). Denitrification in Soil Aggregates Analyzed with Microsensors for Nitrous Oxide and Oxygen. Soil Science Society of America Journal 58, 1691-1698.
Hooper, A. B., and Terry, K. R. (1979). Hydroxylamine oxidoreductase of Nitrosomonas. Production of nitric oxide from hydroxylamine. Biochimica et Biophysica Acta 571, 12-20.
Hooper, A. B. (1968). A nitrite-reducing enzyme from Nitrosomonas europaea: Preliminary characterization with hydroxylamine as electron donor. Biochimica et Biophysica Acta 162, 49-65.
Horn, M. A., Schramm, A., and Drake, H. L. (2003). The Earthworm Gut: an Ideal Habitat for Ingested N2O-Producing Microorganisms. Applied and Environmental Microbiology 69, 1662-1669.
Hu, H. Y., Goto, N., and Fujie, K. (2001). Effect of pH on the reduction of nitrite in water by metallic iron. Water Research 35, 2789-2793.
Igarashi, N., Moriyama, H., Fujiwara, T., Fukumori, Y. and Tanaka, N. (1997). The 2.8 Å structure of hydroxylamine oxidoreductase from a nitrifying chemoautotrophic bacterium, Nitrosomonas europaea. Nature Structural Biology 4(4), 276-284.
IPCC. (2001). Climate Change 2001: The Scientific Basis. Cambridge, UK: Cambridge University Press.
Chapter 2
58
Jenni, S., Mohn, J., Emmenegger, L., and Udert, K. M. (2012). Temperature dependence and interferences of NO and N2O microelectrodes used in wastewater treatment. Environmental Science & Technology 46, 2257-2266.
Jeroschewski, P., Steuckart, C., and Kühl, M. (1996). An Amperometric Microsensor for the Determination of H2S in Aquatic Environments. Analytical Chemistry 68, 4351-4357.
Jinuntuya-Nortman, M., Sutka, R. L., Ostrom, P. H., Gandhi, H., and Ostrom, N. E. (2008). Isotopologue fractionation during microbial reduction of N2O within soil mesocosms as a function of water-filled pore space. Soil Biology and Biochemistry 40, 2273-2280.
Jones, C. M., Stres, B., Rosenquist, M., and Hallin, S. (2008). Phylogenetic analysis of nitrite, nitric oxide, and nitrous oxide respiratory enzymes reveal a complex evolutionary history for denitrification. Molecular Biology and Evolution 25, 1955-1966.
Kampschreur, M. J., Kleerebezem, R., de Vet, W. W. J. M., and Van Loosdrecht, M. C. M. (2011). Reduced iron induced nitric oxide and nitrous oxide emission. Water Research 45, 5945-5952.
Kampschreur, M. J., van der Star, W. R. L., Wielders, H. A., Mulder, J. W., Jetten, M. S. M., and van Loosdrecht, M. C. M. (2008a). Dynamics of nitric oxide and nitrous oxide emission during full-scale reject water treatment. Water Research 42, 812-26.
Kampschreur, M. J., Tan, N. C. G., Kleerebezem, R., Picioreanu, C., Jetten, M. S. M., and van Loosdrecht, M. C. M. (2008b). Effect of dynamic process conditions on nitrogen oxides emission from a nitrifying culture. Environmental Science & Technology 42, 429-35.
Kampschreur, M. J., Temmink, H., Kleerebezem, R., Jetten, M. S. M., and van Loosdrecht, M. C. M. (2009). Nitrous oxide emission during wastewater treatment. Water Research 43, 4093-103.
Kartal, B., Maalcke, W. J., de Almeida, N. M., Cirpus, I., Gloerich, J., Geerts, W., Op den Camp, H. J. M., Harhangi, H. R., Janssen-Megens, E. M., Francoijs, K.-J., et al. (2011). Molecular mechanism of anaerobic ammonium oxidation. Nature 479, 127-130.
Kartal, B., Tan, N. C. G., Van de Biezen, E., Kampschreur, M. J., Van Loosdrecht, M. C. M., and Jetten, M. S. M. (2010). Effect of nitric oxide on anammox bacteria. Applied and Environmental Microbiology 76, 6304-6.
Kester, R. A., de Boer, W., and Laanbroek, H. J. (1997). Production of NO and N2O by Pure Cultures of Nitrifying and Denitrifying Bacteria during Changes in Aeration. Applied and Environmental Microbiology 63, 3872-7.
Kim, S. O., Orii, Y., Lloyd, D., Hughes, M. N., and Poole, R. K. (1999). Anoxic function for the Escherichia coli flavohaemoglobin (Hmp): reversible binding of nitric oxide and reduction to nitrous oxide. FEBS Letters 445, 389-94.
Chapter 2
59
Kitamura, Y., Uzawa, T., Oka, K., Komai, Y., Ogawa, H., Takizawa, N., Kobayashi, H., and Tanishita, K. (2000). Microcoaxial electrode for in vivo nitric oxide measurement. Analytical Chemistry 72, 2957-62.
Kloos, K., Mergel, A., Sch, C., and Bothe, H. (2001). Denitrification within the genus Azospirillum and other associative bacteria. Functional Plant Biology 28, 991-998.
Koba, K., Osaka, K., Tobari, Y., Toyoda, S., Ohte, N., Katsuyama, M., Suzuki, N., Itoh, M., Yamagishi, H., Kawasaki, M., et al. (2009). Biogeochemistry of nitrous oxide in groundwater in a forested ecosystem elucidated by nitrous oxide isotopomer measurements. Geochimica et Cosmochimica Acta 73, 3115-3133.
Kool, D. M., Wrage, N., Zechmeister-Boltenstern, S., Pfeffer, M., Brus, D., Oenema, O., and van Groenigen, J. W. (2010). Nitrifier denitrification can be a source of N2O from soil: A revised approach to the dual-isotope labelling method. European Journal of Soil Science 61, 759-772.
Kool, D. M., Wrage, N., Oenema, O., Dolfing, J., and van Groenigen, J. W. (2007). Oxygen exchange between (de)nitrification intermediates and H2O and its implications for source determination of NO3
- and N2O: A review. Rapid Communications in Mass Spectrometry 21, 3569-3578.
Kostera, J., Youngblut, M. D., Slosarczyk, J. M., and Pacheco, A. A. (2008). Kinetic and product distribution analysis of NO* reductase activity in Nitrosomonas europaea hydroxylamine oxidoreductase. Journal of Biological Inorganic Chemistry 13, 1073-83.
Körner, H., and Zumft, W. G. (1989). Expression of denitrification enzymes in response to the dissolved oxygen level and respiratory substrate in continuous culture of Pseudomonas stutzeri. Applied and Environmental Microbiology 55, 1670-6.
Lammel, G., and Cape, J. N. (1996). Nitrous acid and nitrite in the atmosphere. Chemical Society Reviews 25, 361-369.
Law, Y., Ni, B.-J., Lant, P. and Yuan, Z. (2012). N2O production rate of an enriched ammonia-oxidising bacteria culture exponentially correlates to its ammonia oxidation rate. Water Research 46, 3409-3419.
Lee, Y., Oh, B. K., and Meyerhoff, M. E. (2004). Improved planar amperometric nitric oxide sensor based on platinized platinum anode. 1. Experimental results and theory when applied for monitoring NO release from diazeniumdiolate-doped polymeric films. Analytical Chemistry 76, 536-44.
Liengaard, L., Nielsen, L. P., Revsbech, N. P., Elberling, B., Priemé, a., Prast, a. E., and Kühl, M. (2011). Effects of flooding cycles in the Pantanal on the turnover of soil nitrogen pools and emission of N2O. Biogeosciences Discussions 8, 5991-6030.
Lipschultz, F., Zafiriou, O. C., Wofsy, S. C., McElroy, M. B., Valois, F. W., and Watson, S. W. (1981). Production of NO and N2O by Soil nitrifying bacteria. Nature 294, 641-643.
Chapter 2
60
Liu, B., Mørkved, P. T., Frostegård, Å., and Bakken, L. R. (2010). Denitrification gene pools, transcription and kinetics of NO, N2O and N2 production as affected by soil pH. FEMS Microbiology Ecology 72, 407-417.
Lotito, A. M., Wunderlin, P., Joss, A., Kipf, M. and Siegrist, H. (2012). Nitrous oxide emissions from the oxidation tank of a pilot activated sludge plant. Water Research 46(11), 3563-3573.
Lücker, S., Wagner, M., Maixner, F., Pelletier, E., Koch, H., and Vacherie, B. (2010). A Nitrospira metagenome illuminates the physiology and evolution of globally important nitrite-oxidizing bacteria. Proceedings of the National Academy of Sciences of the United States of America 107, 13479-13484.
Malinski, T., and Taha, Z. (1992). Nitric oxide release from a single cell measured in situ by a porphyrinic-based microsensor. Nature 358, 676 - 678.
Mariotti, A., Germon, J. C., Hubert, P., Kaiser, P., Letolle, R., Tardieux, A., and Tardieux, P. (1981). Experimental determination of nitrogen kinetic isotope fractionation: Some principles; illustration for the denitrification and nitrification processes. Plant and Soil 62, 413-430.
Markfoged, R., Nielsen, L. P., Nyord, T., Ottosen, L. D. M., and Revsbech, N. P. (2011). Transient N2O accumulation and emission caused by O2 depletion in soil after liquid manure injection. European Journal of Soil Science 62, 541-550.
Meyer, R. L., Allen, D. E., and Schmidt, S. (2008). Nitrification and denitrification as sources of sediment nitrous oxide production: A microsensor approach. Marine Chemistry 110, 68-76.
Michotey, V., Mejean, V., and Bonin, P. (2000). Comparison of Methods for Quantification of Cytochrome cd 1-Denitrifying Bacteria in Environmental Marine Samples. Applied and Environmental Microbiology 66, 1564-1571.
Miranda, K.M. (2005) The chemistry of nitroxyl (HNO) and implications in biology. Coordination Chemistry Reviews 249, 433-455.
Moews Jr, P. C., and Audrieth, L. F. (1959). The autoxidation of hydroxylamine. Journal of Inorganic and Nuclear Chemistry 11, 242-246.
Mohn, J., Tuzson, B., Manninen, A., Yoshida, N., Toyoda, S., Brand, W. A., and Emmenegger, L. (2012). Site selective real-time measurements of ambient N2O isotopomers by laser spectroscopy. Atmospheric Measurement Techniques Discussions 5, 813-838
Mohn, J., Guggenheim, C., Tuzson, B., Vollmer, M., Toyoda, S., Yoshida, N., and Emmenegger, L. (2010). A liquid-free preconcentration unit for measurements of ambient N2O isotopomers by QCLAS. Atmospheric Measurement Techniques 3, 609-618.
Chapter 2
61
Montzka, S. a, Dlugokencky, E. J., and Butler, J. H. (2011). Non-CO2 greenhouse gases and climate change. Nature 476, 43-50.
Morales, S. E., and Holben, W. E. (2011). Linking bacterial identities and ecosystem processes: can “omic” analyses be more than the sum of their parts? FEMS Microbiology Ecology 75, 1-16.
Morales, S. E., Cosart, T., and Holben, W. E. (2010). Bacterial gene abundances as indicators of greenhouse gas emission in soils. ISME Journal 4, 799-808.
Morley, N., Baggs, E. M., Dörsch, P., and Bakken, L. (2008). Production of NO, N2O and N2 by extracted soil bacteria, regulation by NO2(-) and O2 concentrations. FEMS Microbiology Ecology 65, 102-12.
Naqvi, S. W., Jayakumar, D. a, Narvekar, P. V., Naik, H., Sarma, V. V., D’Souza, W., Joseph, S., and George, M. D. (2000). Increased marine production of N2O due to intensifying anoxia on the Indian continental shelf. Nature 408, 346-349.
Nicholls, J. C., Davies, C. A., and Trimmer, M. (2007). High-resolution profiles and nitrogen isotope tracing reveal a dominant source of nitrous oxide and multiple pathways of nitrogen gas formation in the central Arabian Sea. Limnology and Oceanography 52, 156-168.
Nielsen, M., Gieseke, A., de Beer, D., and Revsbech, N. (2009). Nitrate, nitrite, and nitrous oxide transformations in sediments along a salinity gradient in the Weser Estuary. Aquatic Microbial Ecology 55, 39-52.
Okabe, S., Oshiki, M., Takahashi, Y., and Satoh, H. (2011). N2O emission from a partial nitrification-anammox process and identification of a key biological process of N2O emission from anammox granules. Water Research 45, 6461-6470.
Otte, S., Grobben, N. G., Robertson, L. a, Jetten, M. S., and Kuenen, J. G. (1996). Nitrous oxide production by Alcaligenes faecalis under transient and dynamic aerobic and anaerobic conditions. Applied and Environmental Microbiology 62, 2421-6.
Palmer, K., Biasi, C., and Horn, M. A. (2011). Contrasting denitrifier communities relate to contrasting N(2)O emission patterns from acidic peat soils in arctic tundra. The ISME Journal, 1-20.
Palmer, K., Drake, H. L., and Horn, M. A. (2010). Association of Novel and Highly Diverse Acid-Tolerant Denitrifiers with N2O Fluxes of an Acidic Fen. Applied and Environmental Microbiology 76, 1125-1134.
Park, S., Croteau, P., Boering, K. A., Etheridge, D. M., Ferretti, D., Fraser, P. J., Kim, K. R., Krummel, P. B., Langenfelds, R. L., van Ommen, T. D., Steele, L. P., et al. (2012). Trends and seasonal cycles in the isotopic composition of nitrous oxide since 1940. Nature Geoscience 5, 261-265.
Chapter 2
62
Park, S., Pérez, T., Boering, K. A., Trumbore, S. E., Gil, J., Marquina, S., and Tyler, S. C. (2011). Can N2O stable isotopes and isotopomers be useful tools to characterize sources and microbial pathways of N2O production and consumption in tropical soils? Global Biogeochemical Cycles 25.
Patureau, D., Zumstein, E., Delgenes, J. P., and Moletta, R. (2000). Aerobic Denitrifiers Isolated from Diverse Natural and Managed Ecosystems. Microbial Ecology 39, 145-152.
Pellicer-Nàcher, C., Sun, S., Lackner, S., Terada, A., Schreiber, F., Zhou, Q., and Smets, B. F. (2010). Sequential aeration of membrane-aerated biofilm reactors for high-rate autotrophic nitrogen removal: experimental demonstration. Environmental Science & Technology 44, 7628-34.
Perez, T., Garcia-Montiel, D., Trumbore, S., Tyler, S., Camargo, P. de, Moreira, M., Piccolo, M., and Cerri, C. (2006). Nitrous oxide nitrification and denitrification 15N enrichment factors from amazon forest soils. Ecological Applications 16, 2153-2167.
Philippot, L., Andert, J., Jones, C. M., Bru, D., and Hallin, S. (2011). Importance of denitrifiers lacking the genes encoding the nitrous oxide reductase for N2O emissions from soil. Global Change Biology 17, 1497-1504.
Philippot, L., Čuhel, J., Saby, N. P. A., Chèneby, D., Chroňáková, A., Bru, D., Arrouays, D., Martin-Laurent, F., and Šimek, M. (2009). Mapping field-scale spatial patterns of size and activity of the denitrifier community. Environmental Microbiology 11, 1518-1526.
Poth, M. (1986). Dinitrogen Production from Nitrite by a Nitrosomonas Isolate. Applied and Environmental Microbiology 52, 957-959.
Poth, M., and Focht, D. D. (1985). 15N Kinetic Analysis of N2O Production by Nitrosomonas: an Examination of Nitrifier Denitrification. Applied and Environmental Microbiology 49, 1134-1141.
Prosser, J. I., Jansson, J. K., and Liu, W.-T. (2010). “Nucleic-acid-based characterization of community structure and function”, in Environmental Molecular Microbiology, eds. W.-T. Liu and J. K. Jansson (Norfolk, UK: Caister Academic Press), 63-86.
Ramette, A. (2007). Multivariate analyses in microbial ecology. FEMS Microbiology Ecology 62, 142-160.
Ravishankara, A. R., Daniel, J. S., and Portmann, R. W. (2009). Nitrous oxide (N2O): the dominant ozone-depleting substance emitted in the 21st century. Science 326, 123-5.
Reed, H. E. and Martiny, J. B. H. (2007). Testing the functional significance of microbial composition in natural communities. FEMS Microbiology Ecology 62, 161-170.
Revsbech, N. P., Nielsen, L. P., Christensen, P. B., and Sørensen, J. (1988). Combined oxygen and nitrous oxide microsensor for denitrification studies. Applied and Environmental Microbiology 54, 2245-9.

Chapter 2
63
Revsbech, N. P., Jørgensen, B. B., and Blackburn, T. H. (1980). Oxygen in the Sea Bottom Measured with a Microelectrode. Science 207, 1355-1356.
Rich, J. J., and Myrold, D. D. (2004). Community composition and activities of denitrifying bacteria from adjacent agricultural soil, riparian soil, and creek sediment in Oregon, USA. Soil Biology and Biochemistry 36, 1431-1441.
Rich, J. J., Heichen, R. S., Bottomley, P. J., Cromack, K., and Myrold, D. D. (2003). Community Composition and Functioning of Denitrifying Bacteria from Adjacent Meadow and Forest Soils. Applied and Environmental Microbiology 69, 5974-5982.
Richardson, D., Felgate, H., Watmough, N., Thomson, A., and Baggs, E. M. (2009). Mitigating release of the potent greenhouse gas N2O from the nitrogen cycle - could enzymic regulation hold the key? Trends in Biotechnology 27, 388-97.
Ritchie, G.A. and Nicholas, D.J. (1972). Identification of the sources of nitrous oxide produced by oxidative and reductive processes in Nitrosomonas europaea. Biochemical Journal 126, 1181-1191.
Rock, J. D., Thomson, M. J., Read, R. C., and Moir, J. W. B. (2007). Regulation of denitrification genes in Neisseria meningitidis by nitric oxide and the repressor NsrR. Journal of Bacteriology 189, 1138-44.
Rotthauwe, J. H., Witzel, K. P., and Liesack, W. (1997). The ammonia monooxygenase structural gene amoA as a functional marker: molecular fine-scale analysis of natural ammonia-oxidizing populations. Applied and Environmental Microbiology 63, 4704-4712.
Santoro, A. E., Buchwald, C., McIlvin, M. R., and Casciotti, K. L. (2011). Isotopic Signature of N2O Produced by Marine Ammonia-Oxidizing Archaea. Science 333, 7-10.
Schmidt, H. L., Werner, R. A., Yoshida, N., and Well, R. (2004a). Is the isotopic composition of nitrous oxide an indicator for its origin from nitrification or denitrification? A theoretical approach from referred data and microbiological and enzyme kinetic aspects. Rapid Communications in Mass Spectrometry 18, 2036-2040.
Schmidt, I. (2009). Chemoorganoheterotrophic growth of Nitrosomonas europaea and Nitrosomonas eutropha. Current Microbiology 59, 130-8.
Schmidt, I., van Spanning, R. J. M., and Jetten, M. S. M. (2004b). Denitrification and ammonia oxidation by Nitrosomonas europaea wild-type, and NirK- and NorB-deficient mutants. Microbiology 150, 4107-14.
Schreiber, F., Beutler, M., Enning, D., Lamprecht-Grandio, M., Zafra, O., González-Pastor, J. E., and Beer, D. de (2011). The role of nitric-oxide-synthase-derived nitric oxide in multicellular traits of Bacillus subtilis 3610: biofilm formation , swarming , and dispersal. BMC Microbiology 111.
Chapter 2
64
Schreiber, F., Stief, P., Gieseke, A., Heisterkamp, I. M., Verstraete, W., de Beer, D., and Stoodley, P. (2010). Denitrification in human dental plaque. BMC Biology 8, 24.
Schreiber, F., Loeffler, B., Polerecky, L., Kuypers, M. M. M., and de Beer, D. (2009). Mechanisms of transient nitric oxide and nitrous oxide production in a complex biofilm. The ISME Journal 3, 1301-13.
Schreiber, F., Polerecky, L., and de Beer, D. (2008). Nitric oxide microsensor for high spatial resolution measurements in biofilms and sediments. Analytical Chemistry 80, 1152-8.
Schreiber, F., Stief, P., Kuypers, M. M. M., and de Beer, D. Nitric oxide turnover in a permeable river sediment-in preparation.
Schuurkes, J. A. A. R., and Mosello, R. (1988). The role of external ammonium inputs in freshwater acidification. Swiss Journal of Hydrology 50, 71-87.
Schwartz, S. E., and White, W. H. (1981). Solubility equilibria of the nitrogen oxides and oxyacids in dilute aqueous solution. Advances in environmental science and engineering. Volume 4, 1-45.
Shafirovich, V. and Lymar, S.V. (2002). Nitroxyl and its anion in aqueous solutions: Spin states, protic equilibria, and reactivities toward oxygen and nitric oxide. Proceedings of the National Academy of Sciences of the United States of America 99, 7340-7345.
Shatalin, K., Gusarov, I., Avetissova, E., Shatalina, Y., McQuade, L. E., Lippard, S. J., and Nudler, E. (2008). Bacillus anthracis-derived nitric oxide is essential for pathogen virulence and survival in macrophages. Proceedings of the National Academy of Sciences of the United States of America 105, 1009-13.
Shaw, L. J., Nicol, G. W., Smith, Z., Fear, J., Prosser, J. I., and Baggs, E. M. (2006). Nitrosospira spp. can produce nitrous oxide via a nitrifier denitrification pathway. Environmental Microbiology 8, 214-22.
Shibuki, K. (1990). An Electrochemical Microprobe for Detecting Nitric-Oxide Release in Brain-Tissue. Neuroscience Research 9, 69-76.
Shin, J. H., Weinman, S. W., and Schoenfisch, M. H. (2005). Sol-gel derived amperometric nitric oxide microsensor. Analytical Chemistry 77, 3494-501.
Smith, C. J., and Osborn, A. M. (2008). Advantages and limitations of quantitative PCR (Q-PCR)-based approaches in microbial ecology. FEMS Microbiology Ecology 67, 6-20.
Snider, D. M., Schiff, S. L., and Spoelstra, J. (2009). 15N/14N and 18O/16O stable isotope ratios of nitrous oxide produced during denitrification in temperate forest soils. Geochimica Et Cosmochimica Acta 73, 877-888.
Starkenburg, S. R., Arp, D. J., and Bottomley, P. J. (2008a). Expression of a putative nitrite reductase and the reversible inhibition of nitrite-dependent respiration by nitric oxide in Nitrobacter winogradskyi Nb-255. Environmental Microbiology 10, 3036-42.
Chapter 2
65
Starkenburg, S. R., Larimer, F. W., Stein, L. Y., Klotz, M. G., Chain, P. S. G., Luis, A., Poret-peterson, A. T., Gentry, M. E., Arp, D. J., Ward, B., et al. (2008b). Complete Genome Sequence of Nitrobacter hamburgensis X14 and Comparative Genomic Analysis of Species within the Genus Nitrobacter. Applied and Environmental Microbiology 74, 2852-2863.
Starkenburg, S. R., Chain, P. S. G., Sayavedra-Soto, L. A., Hauser, L., Land, M. L., Larimer, F. W., Malfatti, S. A., Klotz, M. G., Bottomley, P. J., Arp, D. J., et al. (2006). Genome Sequence of the Chemolithoautotrophic Nitrite-Oxidizing Bacterium Nitrobacter winogradskyi Nb-255. Applied and Environmental Microbiology 72, 2050-2063.
Stein, L. Y. (2011). Surveying N2O-producing pathways in bacteria. Methods in Enzymology 486, 131-52.
Stein, L. Y., and Yung, Y. L. (2003). Production , Isotopic Composition, and a Atmospheric Fate of Biologically Produced Nitrous Oxide. Annual Review of Earth and Planetary Sciences 31, 329-356.
Stief, P., Poulsen, M., Nielsen, L. P., Brix, H., and Schramm, A. (2009). Nitrous oxide emission by aquatic macrofauna. Proceedings of the National Academy of Sciences of the United States of America 106, 4296-300.
Strous, M., Pelletier, E., Mangenot, S., Rattei, T., Lehner, A., Taylor, M. W., Horn, M., Daims, H., Bartol-Mavel, D., Wincker, P., et al. (2006). Deciphering the evolution and metabolism of an anammox bacterium from a community genome. Nature 440, 790-4.
Sudhamsu, J., and Crane, B. R. (2009). Bacterial nitric oxide synthases: what are they good for? Trends in Microbiology 17, 212-8.
Sutka, R. L., Ostrom, N. E., Ostrom, P. H., Breznak, J. A., Gandhi, H., Pitt, A. J., and Li, F. (2006). Distinguishing Nitrous Oxide Production from Nitrification and Denitrification on the Basis of Isotopomer Abundances. Applied and Environmental Microbiology 72, 638-644.
Sutka, R. L., Ostrom, N. E., Ostrom, P. H., Gandhi, H., and Breznak, J. A. (2004). Nitrogen isotopomer site preference of N2O produced by Nitrosomonas europaea and Methylococcus capsulatus Bath. Rapid Communications in Mass Spectrometry 18, 1411-1412.
Sutka, R. L., Ostrom, N. E., Ostrom, P. H., Gandhi, H., and Breznak, J. A. (2003). Nitrogen isotopomer site preference of N2O produced by Nitrosomonas europaea and Methylococcus capsulatus Bath. Rapid Communications in Mass Spectrometry 17, 738-745.
Sørensen, J., Tiedje, J. M., and Firestone, R. B. (1980). Inhibition by sulfide of nitric and nitrous oxide reduction by denitrifying Pseudomonas fluorescens. Applied and Environmental Microbiology 39, 105-8.
Chapter 2
66
Thomsen, J. K., Geest, T., and Cox, R. P. (1994). Mass spectrometric studies of the effect of pH on the accumulation of intermediates in denitrification by Paracoccus denitrificans. Applied and Environmental Microbiology 60, 536-541.
Throbäck, I. N., Enwall, K., Jarvis, Å., and Hallin, S. (2004). Reassessing PCR primers targeting nirS, nirK and nosZ genes for community surveys of denitrifying bacteria with DGGE. FEMS Microbiology Ecology 49, 401-417.
Toyoda, S., Suzuki, Y., Hattori, S., Yamada, K., Fujii, A., Yoshida, N., Kouno, R., Murayama, K., and Shiomi, H. (2011). Isotopomer Analysis of Production and Consumption Mechanisms of N2O and CH4 in an Advanced Wastewater Treatment System. Environmental Science & Technology 45, 917-922.
Toyoda, S., Iwai, H., Koba, K., and Yoshida, N. (2009). Isotopomeric analysis of N2O dissolved in a river in the Tokyo metropolitan area. Rapid Communications in Mass Spectrometry 23, 809-821.
Toyoda, S., Mutobe, H., Yamagishi, H., Yoshida, N., and Tanji, Y. (2005). Fractionation of N2O isotopomers during production by denitrifier. Soil Biology and Biochemistry 37, 1535-1545.
Toyoda, S., and Yoshida, N. (1999). Determination of nitrogen isotopomers of nitrous oxide on a modified isotope ratio mass spectrometer. Analytical Chemistry 71, 4711-4718.
Udert, K. M., Larsen, T. A., and Gujer, W. (2005). Chemical nitrite oxidation in acid solutions as a consequence of microbial ammonium oxidation. Environmental Science and Technology 39, 4066-4075.
Upadhyay, A. K., Hooper, A. B., and Hendrich, M. P. (2006). NO reductase activity of the tetraheme cytochrome C554 of Nitrosomonas europaea. Journal of the American Chemical Society 128, 4330-7.
Vardi, A., Formiggini, F., Casotti, R., De Martino, A., Ribalet, F., Miralto, A., and Bowler, C. (2006). A stress surveillance system based on calcium and nitric oxide in marine diatoms. PLoS Biology 4, e60.
Waechter, H., Mohn, J., Tuzson, B., Emmenegger, L., and Sigrist, M. W. (2008). Determination of N2O isotopomers with quantum cascade laser based absorption spectroscopy. Optics Express 16, 9239-9244.
Wahlen, M., and Yoshinari, T. (1985). Oxygen isotope ratios in N2O from different environments. Nature 313, 780-782.
Wallenstein, M. D., Myrold, D. D., Firestone, M., and Voytek, M. (2006). Environmental controls on denitrifying communities and denitrification rates: insights from molecular methods. Ecological Applications 16, 2143-2152.
Chapter 2
67
Ward, B. B., and Zafiriou, O. C. (1988). Nitrification and Nitric-Oxide in the Oxygen Minimum of the Eastern Tropical North Pacific. Deep-Sea Research Part a-Oceanographic Research Papers 35, 1127-1142.
Well, R., Kurganova, I., Lopesdegerenyu, V., and Flessa, H. (2006). Isotopomer signatures of soil-emitted N2O under different moisture conditions—A microcosm study with arable loess soil. Soil Biology and Biochemistry 38, 2923-2933.
Wells, G. F., Park, H.-D., Yeung, C.-H., Eggleston, B., Francis, C. A., and Criddle, C. S. (2009). Ammonia-oxidizing communities in a highly aerated full-scale activated sludge bioreactor: betaproteobacterial dynamics and low relative abundance of Crenarchaea. Environmental Microbiology 11, 2310-2328.
Westley, M. B., Popp, B. N., and Rust, T. M. (2007). The calibration of the intramolecular nitrogen isotope distribution in nitrous oxide measured by isotope ratio mass spectrometry. Rapid Communications in Mass Spectrometry 21, 391-405.
van Wonderen, J. H., Burlat, B., Richardson, D. J., Cheesman, M. R., and Butt, J. N. (2008). The nitric oxide reductase activity of cytochrome c nitrite reductase from Escherichia coli. Journal of Biological Chemistry 283, 9587-94.
Wrage, N., Van Groenigen, J. W., Oenema, O., and Baggs, E. M. (2005). A novel dual-isotope labelling method for distinguishing between soil sources of N2O. Rapid Communications in Mass Spectrometry 19, 3298-3306.
Wrage, N., Velthof, G. L., Beusichem, M. L. V., and Oenema, O. (2001). Role of nitrifier denitrification in the production of nitrous oxide. Soil Biology and Biochemistry 33, 1723-1732.
Wunderlin, P., Mohn, J., Joss, A., Emmenegger, L., and Siegrist, H. (2012). Mechanisms of N2O production in biological wastewater treatment under nitrifying and denitrifying conditions. Water Research 46, 1027-1037.
Wunderlin, P., Siegrist, H., Tuzson, B., Joss, A., Lehmann, M. F., Emmenegger, L., and Mohn, J. Idenitification of N2O production pathways in biological wastewater treatment based on stable nitrogen isotopes-under review.
Yamagishi, H., Westley, M. B., Popp, B. N., Toyoda, S., Yoshida, N., Watanabe, S., Koba, K., and Yamanaka, Y. (2007). Role of nitrification and denitrification on the nitrous oxide cycle in the eastern tropical North Pacific and Gulf of California. Journal of Geophysical Research-Biogeosciences 112.
Yoshida, N., Morimoto, H., Hirano, M., Koike, I., Matsuo, S., Wada, E., Saino, T., and Hattori, A. (1989). Nitrification Rates and N-15 Abundances of N2O and NO3
- in the Western North Pacific. Nature 342, 895-897.
Yoshida, N. (1988). 15N-depleted N2O as a product of nitrification. Nature 335, 528-529.
Chapter 2
68
Yoshinari, T., and Wahlen, M. (1985). Oxygen isotope ratios in N2O from nitrification at a wastewater treatment facility. Nature 317, 349-350.
Yu, R., Kampschreur, M. J., van Loosdrecht, M. C. M., and Chandran, K. (2010). Mechanisms and specific directionality of autotrophic nitrous oxide and nitric oxide generation during transient anoxia. Environmental Science & Technology 44, 1313-9.
Zafiriou, O. C., Mcfarland, M., and Bromund, R. H. (1980). Nitric-Oxide in Seawater. Science 207, 637-639.
Zafiriou, O. C., and True, M. B. (1979). Nitrite photolysis in seawater by sunlight. Marine Chemistry 8, 9-32.
Zart, D., Schmidt, I., and Bock, E. (2000). Significance of gaseous NO for ammonia oxidation by Nitrosomonas eutropha. Antonie van Leeuwenhoek 77, 49-55.
Zhou, Y., Pijuan, M., Zeng, R. J., and Yuan, Z. (2008). Free nitrous acid inhibition on nitrous oxide reduction by a denitrifying-enhanced biological phosphorus removal sludge. Environmental Science & Technology 42, 8260-5.
Zumft, W., and Kroneck, P. (2007). Respiratory transformation of nitrous oxide N2O to dinitrogen by Bacteria and Archaea. Advances in Microbial Physiology 52, 107.
Zumft, W. G. (2005). Nitric oxide reductases of prokaryotes with emphasis on the respiratory, heme-copper oxidase type. Journal of Inorganic Biochemistry 99, 194-215.
Zumft, W. G. (1997). Cell biology and molecular basis of denitrification. Microbiology and Molecular Biology Reviews 61, 533-616.
Chapter 3
Mechanisms of N2O production in biological wastewater treatment under nitrifying and
denitrifying conditions
This chapter has been published as:
Wunderlin, P.; Mohn, J.; Joss, A.; Emmenegger, L.; Siegrist, H. Mechanisms of N2O production in biological wastewater treatment under nitrifying and denitrifying
conditions. Water Research, 2012, 46 (4), 1027-1037.
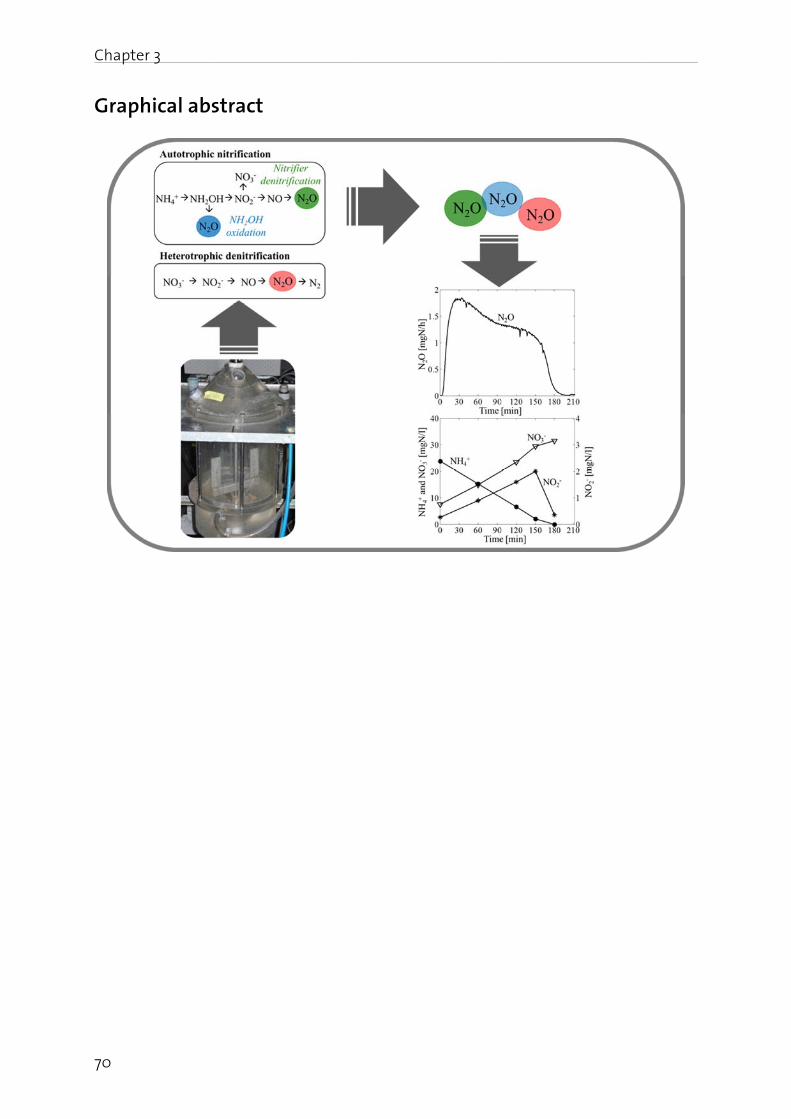
Chapte
70
Graph
er 3
hical absstract
Chapter 3
71
Abstract
Nitrous oxide (N2O) is an important greenhouse gas and a major sink for stratospheric ozone. In biological wastewater treatment, microbial processes such as autotrophic nitrification and heterotrophic denitrification have been identified as major sources; however, the underlying pathways remain unclear. In this study, the mechanisms of N2O production were investigated in a laboratory batch scale system with activated sludge for treating municipal wastewater. This relatively complex mixed population system is well representative for full-scale activated sludge treatment under nitrifying and denitrifying conditions.
Under aerobic conditions, nitrite oxidation experiments have confirmed nitrifier denitrification to be the dominant, strongly nitrite-dependent N2O production pathway. Furthermore, N2O is produced via hydroxylamine oxidation, as has been shown by the addition of hydroxylamine. In both sets of experiments, N2O production was highest at the beginning of the experiment, then decreased continuously and ceased when the substrate (nitrite, hydroxylamine) had been completely consumed. In ammonia oxidation experiments, N2O peaked at the beginning of the experiment when the nitrite concentration was lowest. This indicates that N2O production via hydroxylamine oxidation is favored at high ammonia and low nitrite concentrations, and in combination with a high metabolic activity of ammonia-oxidizing bacteria (at 2 to 3 mgO2/l); the contribution of nitrifier denitrification increases at higher nitrite and lower ammonia concentrations towards the end of the experiment.
Under anaerobic conditions, nitrate reducing experiments confirmed that N2O emission is low under optimal growth conditions for heterotrophic denitrifiers. However, N2O and nitric oxide (NO) production rates increased significantly under unfavorable conditions, for example in the presence of oxygen or nitrite.
Keywords
Biological wastewater treatment; denitrifying condition; hydroxylamine oxidation; nitrous oxide; nitric oxide; nitrifying condition
Chapter 3
72
Introduction
Nitrous oxide (N2O) is an important greenhouse gas, about 310 times more effective than carbon dioxide (CO2), and a major sink for stratospheric ozone (S.A. Montzka and S. Reimann et al., 2011; Ravishankara et al., 2009; IPCC 2007). Limiting anthropogenic N2O emission is thus an urgent requirement. It is estimated that about two thirds of the overall N2O is emitted by microbial processes occurring mainly in agriculture, but also in biological wastewater treatment (USEPA 2009). In fact, N2O emissions have been shown to dominate total greenhouse gas emissions from biological wastewater treatment (Wunderlin et al., 2010). In addition to N2O, nitric oxide (NO) could also be emitted, which is toxic for microorganisms (Zumft 1993) and contributes to the destruction of the stratospheric ozone layer (Crutzen 1979).
N2O production in biological wastewater treatment is associated with autotrophic nitrification and heterotrophic denitrification. Nitrification is the stepwise autotrophic oxidation of ammonia (NH4
+) to nitrite (NO2-) by ammonia-oxidizing bacteria (AOB) and
further to nitrate (NO3-) by nitrite-oxidizing bacteria (NOB). Denitrification is the
reduction of nitrate (NO3-) to atmospheric nitrogen (N2) by heterotrophic denitrifiers
(HET), with nitrite (NO2-), nitric oxide (NO) and nitrous oxide (N2O) as obligatory
intermediates. According to Kampschreur et al. (2009), there are three main routes for N2O production (Figure 1):
Hydroxylamine oxidation: production of N2O from intermediates of biological hydroxylamine oxidation (HNO, N2O2H2; Poughon et al., 2001), probably related to a highly imbalanced metabolic activity of AOB (Yu et al., 2010), or by chemical decomposition of hydroxylamine as well as by chemical oxidation with NO2
- as an electron acceptor (chemodenitrification; Stüven et al., 1992; Ritchie and Nicholas 1972).
Nitrifier denitrification: reduction of NO2- by AOB in combination with ammonia,
hydrogen or pyruvate as electron donors, e.g. at oxygen-limiting conditions or elevated nitrite concentrations (Wrage et al., 2001; Colliver and Stephenson 2000; Stüven et al., 1992).
Heterotrophic denitrification: production of N2O by heterotrophic denitrifiers due to an imbalanced activity of nitrogen-reducing enzymes, e.g. due to oxygen inhibition (Lu and Chandran 2010; Baumann et al., 1997), nitrite accumulation (von Schulthess et al., 1994), or a limited availability of biodegradable organic compounds (Itokawa et al., 2001).
In the last decade, significant efforts have been made to better understand the mechanisms of N2O production (Rassamee et al., 2011; Yu et al., 2010; Tallec et al., 2006; Burgess et al., 2002; Itokawa et al., 2001; von Schulthess et al., 1994). As a result, several parameters favoring N2O production were identified: low dissolved oxygen concentration, accumulation of nitrite, rapidly changing (dynamic) conditions or a low ratio of COD to N-compounds during heterotrophic denitrification (Kampschreur et al., 2009).
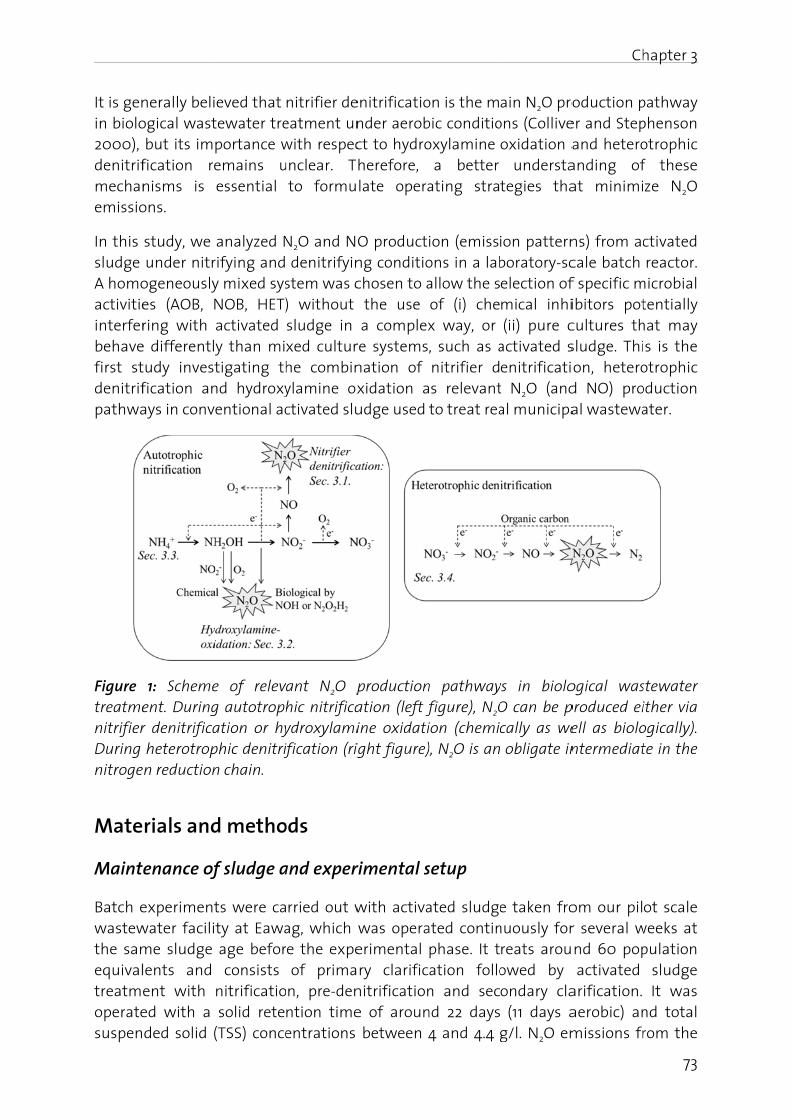
It is genin biolo2000), denitrifmechanemissio
In this sludge A homoactivitieinterferbehavefirst stdenitrifpathwa
Figure treatmenitrifierDuring nitroge
Mate
Maint
Batch ewastewthe samequivaltreatmeoperatesuspen
nerally beliogical wast but its imfication renisms is ons.
study, we under nitrogeneouslyes (AOB, Nring with
e differentltudy investfication anays in conv
1: Schemeent. Duringr denitrifica heterotropn reduction
rials and
enance of
experimentwater facilime sludge lents and ent with ed with a ded solid (
ieved that tewater treportance wemains u
essential
analyzed Nrifying andy mixed sys
NOB, HET) activated
y than mitigating th
nd hydroxyventional ac
e of relevg autotrophation or hyphic denitrifn chain.
d metho
f sludge a
ts were caty at Eawa age befor consists
nitrificatio solid rete
(TSS) conce
nitrifier deeatment un
with respecunclear. T to formu
N2O and NO denitrifyinstem was c) without
sludge in xed culturhe combinylamine oxctivated slu
ant N2O phic nitrificaydroxylamiification (rig
ods
and exper
rried out wag, which e the expe
of primaon, pre-denntion timeentrations
enitrificationder aerobct to hydroherefore, late opera
O productng conditio chosen to a the use a complexre systems,nation of xidation audge used
productionation (left fine oxidatiight figure)
rimental s
with activa was operaerimental ry clarific
nitrificatione of aroun between 4
on is the mbic conditiooxylamine
a better ating stra
ion (emissons in a lab allow the s of (i) chex way, or , such as a
nitrifier ds relevant
to treat rea
n pathway figure), N2Oion (chemic), N2O is an
setup
ated sludgeated contin phase. It tation follon and sec
nd 22 days 4 and 4.4 g
ain N2O proons (Collive oxidation a understategies tha
ion patternboratory-sc
election ofmical inhi
(ii) pure c activated s
enitrificatit N2O (andal municipa
ys in bioloO can be pcally as we obligate in
e taken fronuously forreats arouowed by ondary cla (11 days a
g/l. N2O em
Ch
oduction per and Step and heteroanding ofat minimi
ns) from accale batch f specific mibitors pot
cultures th sludge. Thi
on, heterod NO) proal wastewa
ogical wasproduced eiell as biolontermediat
om our pilr several wnd 60 pop
activated arification.
aerobic) anmissions fr
hapter 3
73
pathway phenson otrophic f these ze N2O
ctivated reactor.
microbial tentially
hat may s is the
otrophic oduction ater.
stewater ither via ogically). te in the
ot scale weeks at pulation sludge It was nd total rom the
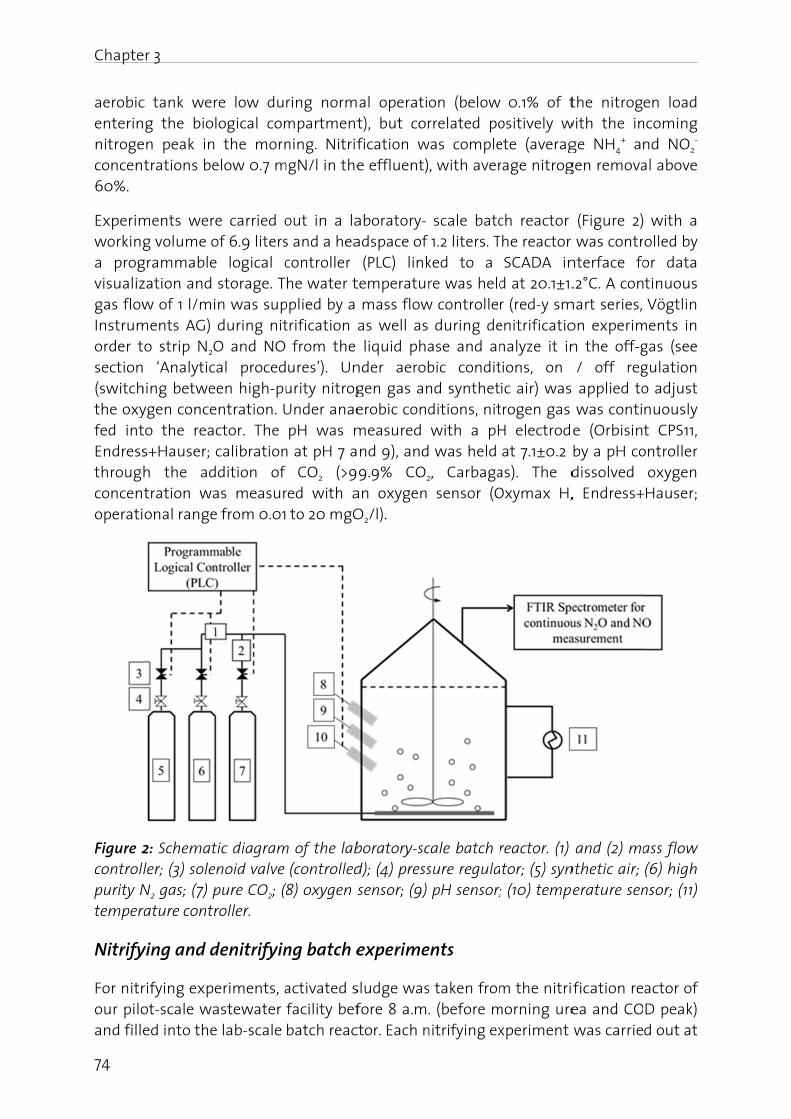
Chapte
74
aerobicenterinnitrogeconcen60%.
Experimworkinga progvisualizgas flowInstrumorder tsection(switchthe oxyfed intEndressthrougconcenoperati
Figure 2controlpurity Ntemper
Nitrify
For nitrour piloand fille
er 3
c tank werng the bioen peak intrations be
ments werg volume o
grammablezation and w of 1 l/mi
ments AG) to strip N2O ‘Analytic
hing betweygen conceto the reas+Hauser; h the adtration waonal range
2: Schematler; (3) soleN2 gas; (7) prature contr
ying and d
rifying expot-scale waed into the
re low dulogical com the morn
elow 0.7 m
e carried o of 6.9 literse logical c storage. Tin was sup during nitO and NO
cal procedeen high-puentration. Uctor. The
calibrationddition of as measure from 0.01
tic diagramenoid valve pure CO2; (roller.
denitrifyin
eriments, aastewater e lab-scale
ring normmpartmentning. Nitrif
mgN/l in the
out in a las and a heacontroller he water t
pplied by a trification from the ures’). Unurity nitrog
Under anae pH was mn at pH 7 a CO2 (>9red with a to 20 mgO
m of the lab (controlled
(8) oxygen s
ng batch e
activated s facility bef batch reac
al operatit), but corfication we effluent)
aboratory- adspace of (PLC) link temperatur
mass flow as well as liquid pha
nder aerobgen gas anerobic condmeasured nd 9), and9.9% CO2
an oxygen O2/l).
boratory-scd); (4) press sensor; (9)
experime
sludge wasfore 8 a.m.
ctor. Each n
on (belowrrelated po
was comple, with aver
scale batc 1.2 liters. Tked to a re was held
w controlle during dease and anbic conditnd synthetditions, nit
with a pH was held
2, Carbaga sensor (O
cale batch rsure regula pH sensor;
ents
s taken from. (before m
nitrifying ex
0.1% of tositively wete (averagrage nitrog
ch reactor he reactor
SCADA ind at 20.1±1.r (red-y sm
enitrificationalyze it intions, on ic air) was
trogen gas H electrod at 7.1±0.2 as). The dOxymax H,
reactor. (1) tor; (5) syn; (10) temp
m the nitrimorning urexperiment
the nitrogwith the inge NH4
+ angen remova
(Figure 2) was contr
nterface fo.2°C. A con
mart series, on experimn the off-g
/ off regs applied to was contie (Orbisin
by a pH codissolved , Endress+
and (2) manthetic air;
erature sen
fication reea and CO was carrie
en load ncoming nd NO2
- al above
with a olled by or data tinuous Vögtlin
ments in gas (see gulation o adjust nuously t CPS11,
ontroller oxygen +Hauser;
ass flow (6) high nsor; (11)
actor of D peak) d out at
Chapter 3
75
a constant oxygen concentration (set point): 0.5, 1, 2 or 3 mgO2/l. The experiments were started by adding the substrate (25 mgNH4
+-N/l, NH4HCO4 from Merck; 15 mgNO2--N/l,
NaNO2 from Merck; 10 mgNH2OH-N/l, NH2OH-Cl from Fluka; Table 1). Except for simultaneous nitrifying and denitrifying experiments, no external organic carbon source was provided in order to prevent heterotrophic activity, which was confirmed by nitrogen mass balances and a constant NO3
- concentration after the experiment. The substrate addition initialized N2O production, but also NO production in some nitrite oxidation experiments. Neither N2O nor NO was emitted before the substrate addition.
For the denitrifying experiments, sludge was taken from the nitrification reactor of our pilot-scale wastewater facility in the afternoon and was stored overnight in the batch-scale reactor under anaerobic conditions in order to remove the remaining dissolved nitrogen compounds (mainly NO3
-). The experiments were launched by adding organic carbon (Na acetate from Merck; always >100 mgCOD/l) and nitrate (20 mgNO3
--N/l, NaNO3 from Fluka; Table 1). The substrate addition initiated N2O production, as well as NO production during suboptimal growth conditions, while neither N2O nor NO was produced before the substrate addition. For experiments at low dissolved oxygen concentrations, an N2 / O2 gas mixture with only about 5% oxygen was applied in order to better adjust the dissolved oxygen concentration in the reactor.
The nitrifying and denitrifying experiments were both stopped when N2O (and NO) production ceased and the dissolved nitrogen species were completely oxidized (NH4
+, NH2OH or NO2
- in the nitrifying experiment) or reduced (NO3- in the denitrifying
experiment). During all experiments, N2O as well as NO were continuously analyzed in the off-gas and liquid samples were periodically taken (see section ‘Analytical procedures’). The disappearance and appearance rates of NH4
+, NH2OH, NO2- and NO3-
were calculated using regression analysis. Average N2O and NO emission rates were calculated based on time integration of emission loads.
Analytical procedures
The N2O and NO concentrations in the off-gas were continuously (1 minute temporal resolution) analyzed by FTIR spectroscopy (GASMET CX-4000, Temet Instruments, Helsinki), equipped with a heated (40°C) flow-through gas cell with a 9.8 m path length. The quantification limits for N2O and NO are 0.25 and 5 ppm respectively, and the expanded standard uncertainty for both components is around 10% (95% confidence level; Mohn et al., 2008). Liquid grab samples were taken regularly (every 15 to 60 minutes) and immediately filtered through a 0.7μm filter (GF/F Whatman) and a
0.45μm syringe filter (Chromafil Membranfilter from Macherey), then stored at 4°C. NH4
+-N was analyzed photometrically using a Foss FIAstar flow injection 5000 analyzer (detection limit 0.2 mgN/l; uncertainty around 5% at 95% confidence level). NO3
--N and NO2
--N were determined by anion chromatography (761 compact IC, Metrohm; detection limit for both components 0.2 mgN/l; uncertainty around 5% at 95% confidence level). Commercial photochemical test kits (Hach Lange GmbH, Düsseldorf, Germany) were used to measure low NO2
- concentrations (LCK 341; detection limit 0.015mgN/l) and COD (LCK 314, LCK 414, or LCK 114).
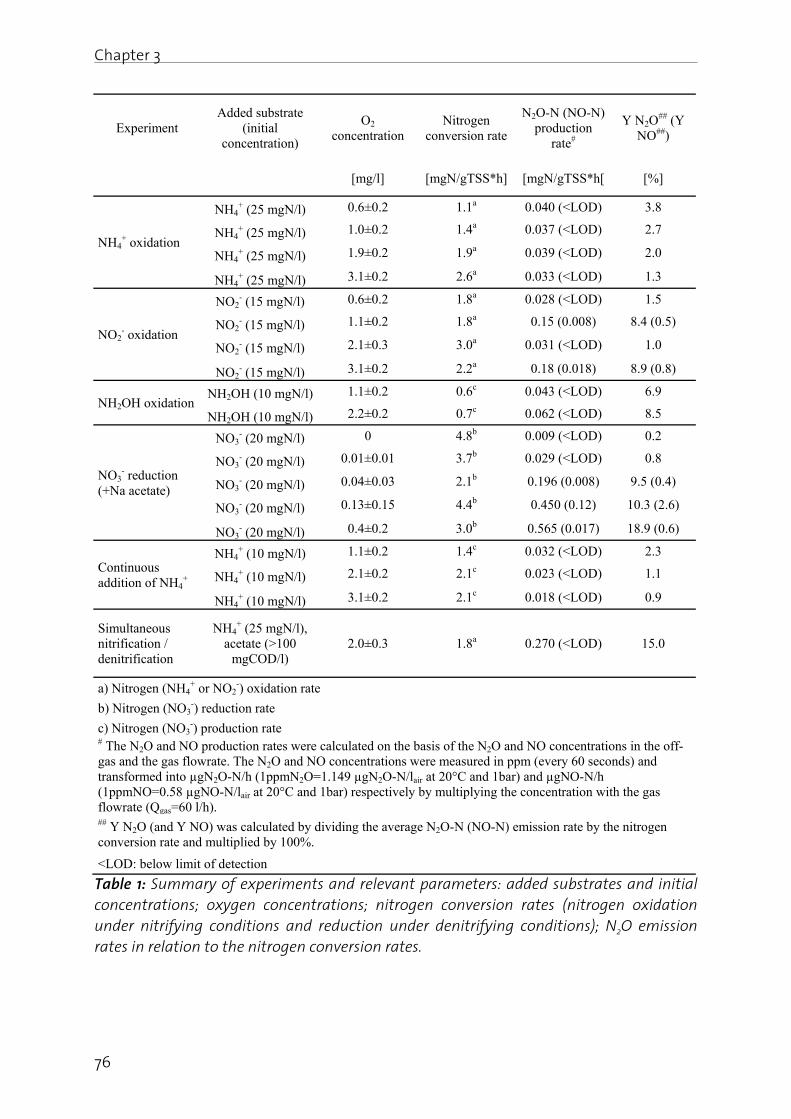
Chapter 3
76
Experiment Added substrate
(initial concentration)
O2 concentration
Nitrogen conversion rate
N2O-N (NO-N) production
rate#
Y N2O## (Y
NO##)
[mg/l] [mgN/gTSS*h] [mgN/gTSS*h[ [%]
NH4+ oxidation
NH4+ (25 mgN/l) 0.6±0.2 1.1a 0.040 (<LOD) 3.8
NH4+ (25 mgN/l) 1.0±0.2 1.4a 0.037 (<LOD) 2.7
NH4+ (25 mgN/l) 1.9±0.2 1.9a 0.039 (<LOD) 2.0
NH4+ (25 mgN/l) 3.1±0.2 2.6a 0.033 (<LOD) 1.3
NO2- oxidation
NO2- (15 mgN/l) 0.6±0.2 1.8a 0.028 (<LOD) 1.5
NO2- (15 mgN/l) 1.1±0.2 1.8a 0.15 (0.008) 8.4 (0.5)
NO2- (15 mgN/l) 2.1±0.3 3.0a 0.031 (<LOD) 1.0
NO2- (15 mgN/l) 3.1±0.2 2.2a 0.18 (0.018) 8.9 (0.8)
NH2OH oxidation NH2OH (10 mgN/l) 1.1±0.2 0.6c 0.043 (<LOD) 6.9
NH2OH (10 mgN/l) 2.2±0.2 0.7c 0.062 (<LOD) 8.5
NO3- reduction
(+Na acetate)
NO3- (20 mgN/l) 0 4.8b 0.009 (<LOD) 0.2
NO3- (20 mgN/l) 0.01±0.01 3.7b 0.029 (<LOD) 0.8
NO3- (20 mgN/l) 0.04±0.03 2.1b 0.196 (0.008) 9.5 (0.4)
NO3- (20 mgN/l) 0.13±0.15 4.4b 0.450 (0.12) 10.3 (2.6)
NO3- (20 mgN/l) 0.4±0.2 3.0b 0.565 (0.017) 18.9 (0.6)
Continuous addition of NH4
+
NH4+ (10 mgN/l) 1.1±0.2 1.4c 0.032 (<LOD) 2.3
NH4+ (10 mgN/l) 2.1±0.2 2.1c 0.023 (<LOD) 1.1
NH4+ (10 mgN/l) 3.1±0.2 2.1c 0.018 (<LOD) 0.9
Simultaneous nitrification / denitrification
NH4+ (25 mgN/l),
acetate (>100 mgCOD/l)
2.0±0.3 1.8a 0.270 (<LOD) 15.0
a) Nitrogen (NH4+ or NO2
-) oxidation rate
b) Nitrogen (NO3-) reduction rate
c) Nitrogen (NO3-) production rate
# The N2O and NO production rates were calculated on the basis of the N2O and NO concentrations in the off-gas and the gas flowrate. The N2O and NO concentrations were measured in ppm (every 60 seconds) and transformed into µgN2O-N/h (1ppmN2O=1.149 µgN2O-N/lair at 20°C and 1bar) and µgNO-N/h (1ppmNO=0.58 µgNO-N/lair at 20°C and 1bar) respectively by multiplying the concentration with the gas flowrate (Qgas=60 l/h). ## Y N2O (and Y NO) was calculated by dividing the average N2O-N (NO-N) emission rate by the nitrogen conversion rate and multiplied by 100%.
<LOD: below limit of detection
Table 1: Summary of experiments and relevant parameters: added substrates and initial concentrations; oxygen concentrations; nitrogen conversion rates (nitrogen oxidation under nitrifying conditions and reduction under denitrifying conditions); N2O emission rates in relation to the nitrogen conversion rates.
Chapter 3
77
Results and discussion
N2O production during nitrite (NO2-) oxidation under aerobic conditions
Figure 3 shows two typical profiles of the N2O emission rate and the concentrations of NO2
- and NO3- (the initial nitrite concentration was around 15 mgN/l), at 2.1 and 3.1
mgO2/l respectively. The nitrite degradation rate was in the range from 1.8 to 3 mgN/gTSS*h, depending on the oxygen concentration (Table 1). Most of the nitrite was oxidized to nitrate, which indicates that there was no significant heterotrophic activity. NO was only produced under conditions with high N2O production rates, where NO peaked before N2O. In most experiments, the NO concentration was close or below the FTIR detection limit and therefore not shown in in Figure 3 A. The production of N2O started as soon as nitrite was added and ceased when all the nitrite was consumed. The N2O production was dynamic and variable, but not oxygen-dependent: there was a high N2O emission rate compared to the nitrogen oxidation rate (8.4 and 8.9%) at 1.1 and 3.1 mgO2/l (Figure 3, A and B), but only a low emission rate (1.0 to 1.5%) at 0.6 and 2.1 mgO2/l (Figure 3, C and D; Table 1). The different N2O emissions seem to be due to variable maximum NO2
- oxidation rates: the NO2- oxidation rate was low at high N2O
production and vice-versa (Table 1).
The NO2- oxidation experiments always showed the highest N2O production rate after
NO2- addition (when the NO2
- concentration was highest), and decreased in parallel with the NO2
- concentration (Figure 3). This is consistent with Tallec et al. (2006), who also showed a positive correlation between the nitrite concentration and N2O production. NO2
- is often considered to be one of the key parameters responsible for N2O production (see Kampschreur et al., 2009; Bock et al., 1995; Remde and Conrad, 1990). It is generally assumed that an accumulation of nitrite leads to increased nitrifier denitrification activity by AOB with nitrite instead of oxygen as the terminal electron acceptor; ammonia is thought to be the corresponding electron donor (Kampschreur et al., 2009; Colliver and Stephenson 2000): as reported by Kim et al. (2010), N2O emissions were significantly enhanced when ammonia was added together with nitrite to activated sludge. In our experiments, ammonia is unlikely to act as an electron donor since no external ammonia was added, and it was not detectable in the bulk media; the inhibition of the ammonia oxidation (by allylthiourea) confirmed that there was no significant ammonia production from biomass decay (data not shown). Therefore, hydrogen, pyruvate or other electron donors have to be considered.
At high N2O production rates, the production of NO, a precursor of N2O in the nitrogen reduction chain, underscores nitrifier denitrification to be the dominant N2O production pathway (Figure 3, C and D). In our setup, heterotrophs cannot be assumed to contribute significantly to N2O production, because (i) no external organic carbon was added, (ii) most of the nitrite was converted into nitrate, and (iii) the enzyme activity of heterotrophic denitrifiers is known to be strongly affected by the availability of dissolved oxygen because this process operates mainly under anaerobic conditions (von Schulthess et al., 1994).
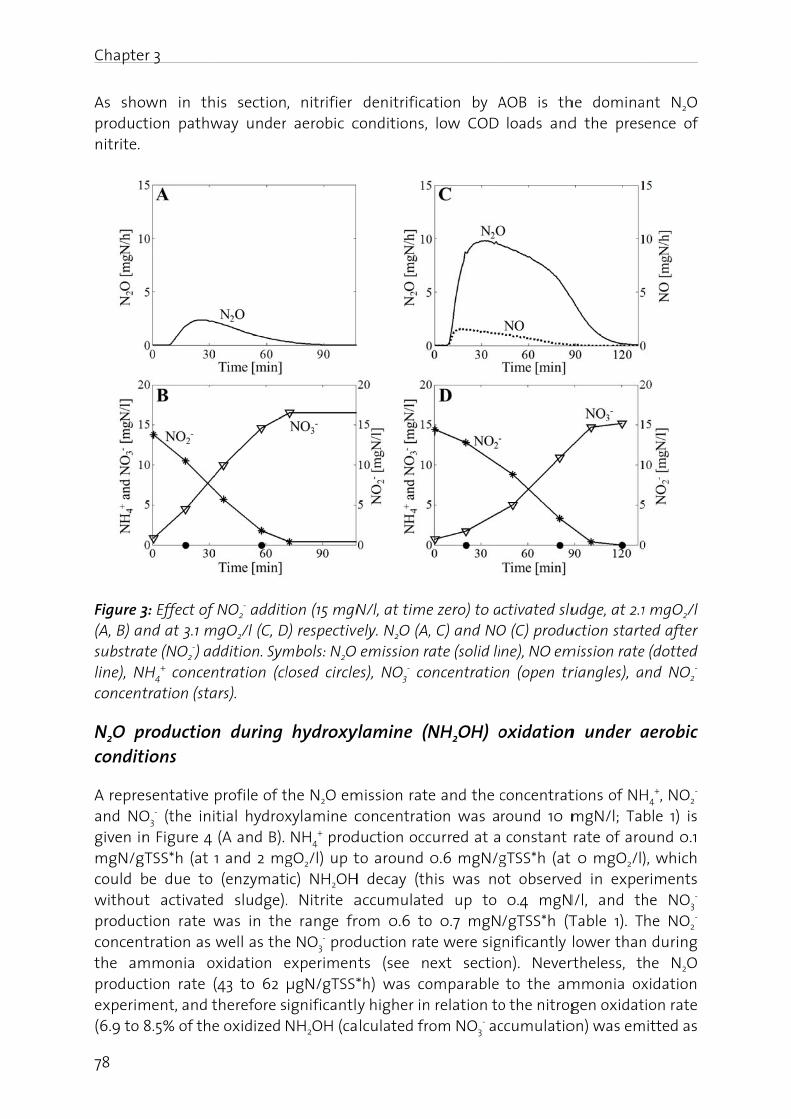
Chapte
78
As shoproductnitrite.
Figure 3(A, B) asubstraline), Nconcent
N2O pcondit
A repreand NOgiven inmgN/gcould bwithouproductconcenthe amproductexperim(6.9 to
er 3
own in thtion pathw
3: Effect of nd at 3.1 m
ate (NO2-) ad
NH4+ concen
tration (sta
productiontions
esentative O3
- (the ini n Figure 4 gTSS*h (at be due to
t activatetion rate wtration as
mmonia otion rate (
ment, and t 8.5% of the
his sectionway under
f NO2- addit
mgO2/l (C, Dddition. Symntration (clars).
n during
profile of titial hydrox (A and B).
1 and 2 mg (enzymatd sludge).
was in the well as thexidation e
(43 to 62 therefore se oxidized
, nitrifier r aerobic c
ion (15 mgND) respectivembols: N2O losed circle
hydroxy
the N2O emxylamine c NH4
+ prodgO2/l) up tic) NH2OH. Nitrite ae range fre NO3
- prodexperimen
μgN/gTSS* ignificantly NH2OH (ca
denitrificaconditions,
N/l, at timeely. N2O (A, emission r
es), NO3- co
ylamine (N
mission rate concentratduction occ to around H decay (thaccumulaterom 0.6 toduction ratts (see n*h) was coy higher inlculated fr
ation by A low COD
e zero) to a, C) and NOate (solid li
oncentratio
NH2OH) o
e and the cion was a
curred at a 0.6 mgN/ghis was noed up to o 0.7 mgNte were sigext sectio
omparable n relation to
om NO3- ac
AOB is th loads and
ctivated sluO (C) produne), NO em
on (open tr
oxidation
concentratround 10 m constant gTSS*h (at ot observe 0.4 mgN/gTSS*h (T
gnificantly on). Never to the amo the nitrogccumulatio
he dominad the pres
udge, at 2.1uction startmission rateriangles), a
n under a
tions of NH mgN/l; Ta rate of aro 0 mgO2/l)
ed in expeN/l, and thTable 1). T lower thanrtheless, tmmonia oxgen oxidat
on) was em
ant N2O ence of
1 mgO2/l ted after e (dotted nd NO2
-
aerobic
H4+, NO2
- ble 1) is
ound 0.1 ), which riments
he NO3-
he NO2-
n during he N2O xidation tion rate
mitted as
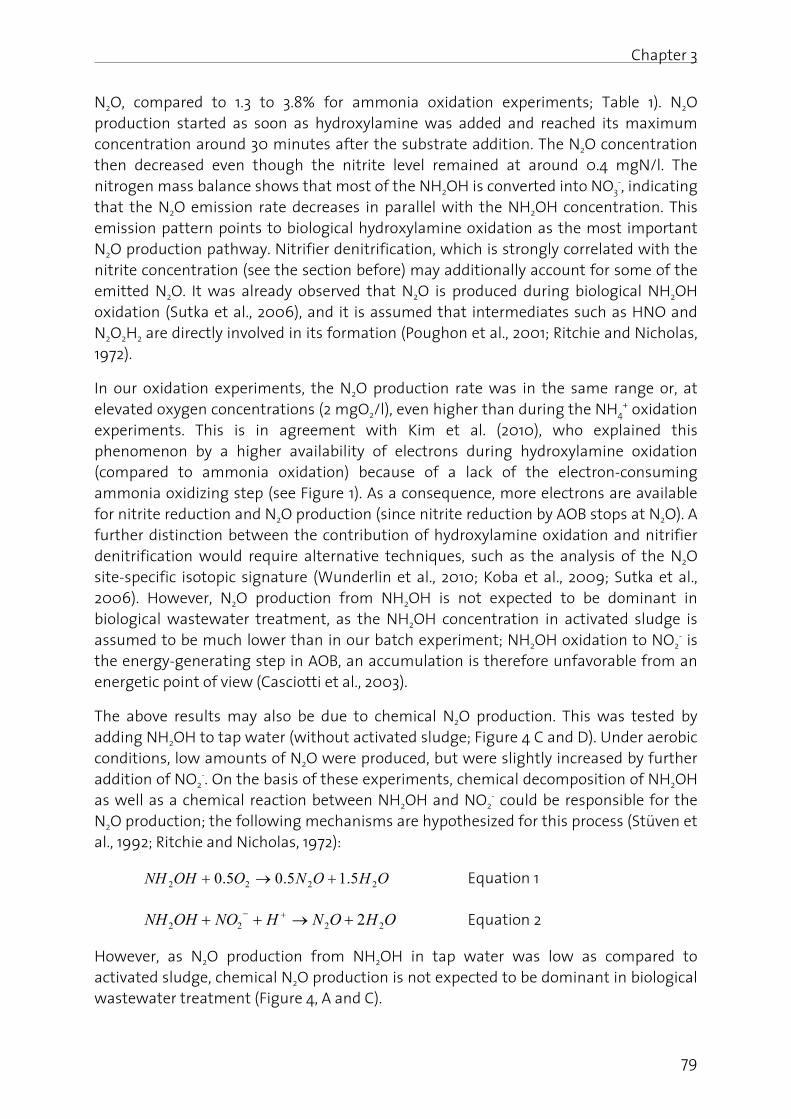
Chapter 3
79
N2O, compared to 1.3 to 3.8% for ammonia oxidation experiments; Table 1). N2O production started as soon as hydroxylamine was added and reached its maximum concentration around 30 minutes after the substrate addition. The N2O concentration then decreased even though the nitrite level remained at around 0.4 mgN/l. The nitrogen mass balance shows that most of the NH2OH is converted into NO3
-, indicating that the N2O emission rate decreases in parallel with the NH2OH concentration. This emission pattern points to biological hydroxylamine oxidation as the most important N2O production pathway. Nitrifier denitrification, which is strongly correlated with the nitrite concentration (see the section before) may additionally account for some of the emitted N2O. It was already observed that N2O is produced during biological NH2OH oxidation (Sutka et al., 2006), and it is assumed that intermediates such as HNO and N2O2H2 are directly involved in its formation (Poughon et al., 2001; Ritchie and Nicholas, 1972).
In our oxidation experiments, the N2O production rate was in the same range or, at elevated oxygen concentrations (2 mgO2/l), even higher than during the NH4
+ oxidation experiments. This is in agreement with Kim et al. (2010), who explained this phenomenon by a higher availability of electrons during hydroxylamine oxidation (compared to ammonia oxidation) because of a lack of the electron-consuming ammonia oxidizing step (see Figure 1). As a consequence, more electrons are available for nitrite reduction and N2O production (since nitrite reduction by AOB stops at N2O). A further distinction between the contribution of hydroxylamine oxidation and nitrifier denitrification would require alternative techniques, such as the analysis of the N2O site-specific isotopic signature (Wunderlin et al., 2010; Koba et al., 2009; Sutka et al., 2006). However, N2O production from NH2OH is not expected to be dominant in biological wastewater treatment, as the NH2OH concentration in activated sludge is assumed to be much lower than in our batch experiment; NH2OH oxidation to NO2
- is the energy-generating step in AOB, an accumulation is therefore unfavorable from an energetic point of view (Casciotti et al., 2003).
The above results may also be due to chemical N2O production. This was tested by adding NH2OH to tap water (without activated sludge; Figure 4 C and D). Under aerobic conditions, low amounts of N2O were produced, but were slightly increased by further addition of NO2
-. On the basis of these experiments, chemical decomposition of NH2OH as well as a chemical reaction between NH2OH and NO2
- could be responsible for the N2O production; the following mechanisms are hypothesized for this process (Stüven et al., 1992; Ritchie and Nicholas, 1972):
OHONOOHNH 2222 5.15.05.0 Equation 1
OHONHNOOHNH 2222 2 Equation 2
However, as N2O production from NH2OH in tap water was low as compared to activated sludge, chemical N2O production is not expected to be dominant in biological wastewater treatment (Figure 4, A and C).
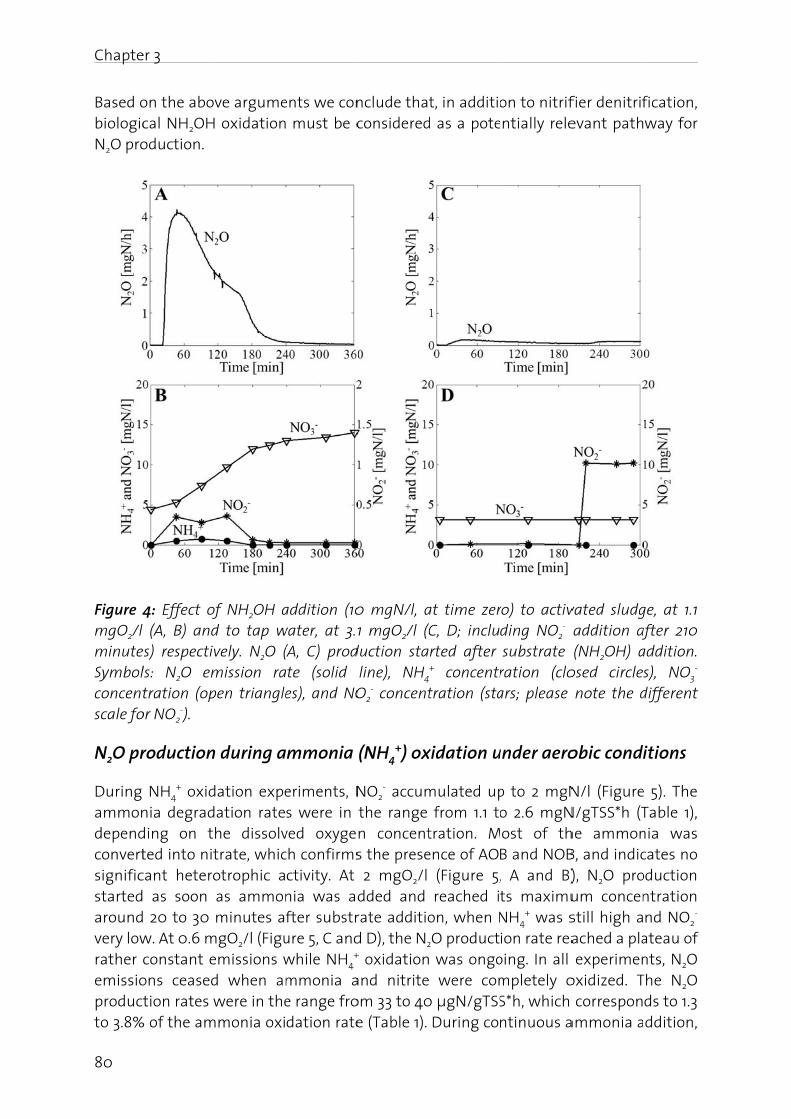
Chapte
80
Based obiologicN2O pro
Figure 4mgO2/l minuteSymbolconcentscale fo
N2O pr
During ammondependconvertsignificstartedaroundvery lowrather emissioproductto 3.8%
er 3
on the abocal NH2OHoduction.
4: Effect of (A, B) and
es) respectivls: N2O emtration (op
or NO2-).
roduction
NH4+ oxid
nia degradding on tted into nit
cant hetero as soon 20 to 30
w. At 0.6 m constant eons ceasedtion rates w
% of the am
ve argume oxidation
of NH2OH ad to tap wvely. N2O (mission rapen triangle
n during a
dation expeation ratehe dissolvtrate, whicotrophic a
as ammon minutes af
mgO2/l (Figu emissions wd when am were in the
mmonia oxi
ents we con must be c
addition (10water, at 3.1(A, C) prodte (solid es), and NO
mmonia
eriments, Ns were in
ved oxygech confirmsctivity. At nia was adfter substr
ure 5, C and while NH4
+
mmonia ae range frodation rate
nclude that considered
0 mgN/l, a1 mgO2/l (C
duction staline), NH4
O2- concent
(NH4+) ox
NO2- accum
the range n concents the prese 2 mgO2/l dded and rate additiod D), the N2+ oxidationand nitriteom 33 to 40e (Table 1).
t, in additiod as a pote
at time zerC, D; inclurted after + concentrtration (sta
xidation u
mulated up from 1.1 totration. Mence of AO (Figure 5, reached iton, when N
2O product was ongo were com
0 μgN/gTSS During co
on to nitrifntially rele
ro) to activding NO2
- substrate ration (cloars; please
under aero
p to 2 mgNo 2.6 mgNost of thB and NOB, A and B)ts maximu
NH4+ was s
ion rate reaoing. In all mpletely oS*h, which ntinuous a
fier denitrifevant path
vated sludg addition af (NH2OH) aosed circle note the d
obic condi
N/l (FigureN/gTSS*h (The ammonB, and indic), N2O proum concen
still high aached a pla experimenoxidized. T correspon
ammonia a
fication, way for
ge, at 1.1 after 210 addition. s), NO3
- different
itions
e 5). The Table 1), nia was cates no oduction ntration nd NO2
- ateau of nts, N2O
The N2O ds to 1.3
ddition,
Chapter 3
81
the N2O emission rate was in the range from 18 to 32 μgN/gTSS*h, which corresponds to 0.88 to 2.3% of the ammonia oxidation rate (Table 1) and thus comparable to the NH4
+ (peak) addition experiments. It is also similar to the values reported in the literature: Tallec et al. (2006) measured N2O emissions from nitrifying activated sludge in the range from 0.1 to 0.4%, compared to ammonia oxidation; N2O emissions in the range from 0.05 to 3.3% were observed for pure-culture AOB (Hynes and Knowles, 1984; Yoshida, 1988). Recently, Kim et al. (2010) reported a value of 2.9% from nitrifying activated sludge. Our experiments showed quite comparable N2O emission rates at different oxygen concentrations. In contrast, the NH4
+ fraction emitted as N2O was higher at low oxygen concentrations. This is in agreement with Tallec et al. (2006), who reported a maximum yield (ratio of emitted N2O to oxidized nitrogen) at an oxygen concentration of 1 mgO2/l. It is hypothesized that oxygen-limiting conditions during nitrification lead to an accumulation of nitrite, since NOB have a lower affinity to oxygen than AOB, possibly due to a different half-saturation constant (Blackburne et al., 2008) and therefore a lower activity. Given that AOB can use nitrite instead of oxygen as the electron acceptor, nitrifier denitrification is held responsible for the increased N2O emissions (Kampschreur et al., 2009; Wrage et al., 2001). Burgess et al. (2002) observed a strong correlation between the build-up of nitrite and N2O emissions in combination with ammonia shock loads, which is consistent with our data. At high concentrations of dissolved oxygen, N2O emissions peaked at the beginning of the experiment, when NH4
+ was highest and NO2- lowest. This indicates that N2O might
partly be produced via NH2OH oxidation, when ammonia is in excess, nitrite at low concentrations and the nitrogen oxidation rate is high. This is consistent with the findings of Sutka et al. (2006), who showed that an increasing oxygen concentration in N. europaea cultures decreased the relative importance of NO2
- reduction relative to NH2OH oxidation in N2O production. Moreover, they suggested that an increase in NO2
- concentration could have contributed to N2O production via nitrite reduction. Similarly, Yu et al. (2010) reported a positive correlation between N2O production and NH4
+ concentration in N. europaea cultures and concluded that N2O production via NH2OH oxidation contributed even more when ammonia oxidation is shifted from low towards its maximum specific activity.
Based on the results presented in the two sections before, we conclude that in ammonia oxidation experiments (this section) NH2OH oxidation and nitrifier denitrification contribute to the N2O production: nitrifier denitrification is dominant but hydroxylamine oxidation becomes increasingly relevant at high ammonia and low nitrite concentrations. Therefore, a systematic experimental approach, as chosen in this study, proves to be appropriate to study the mechanisms of N2O production in a complex, mixed population system.
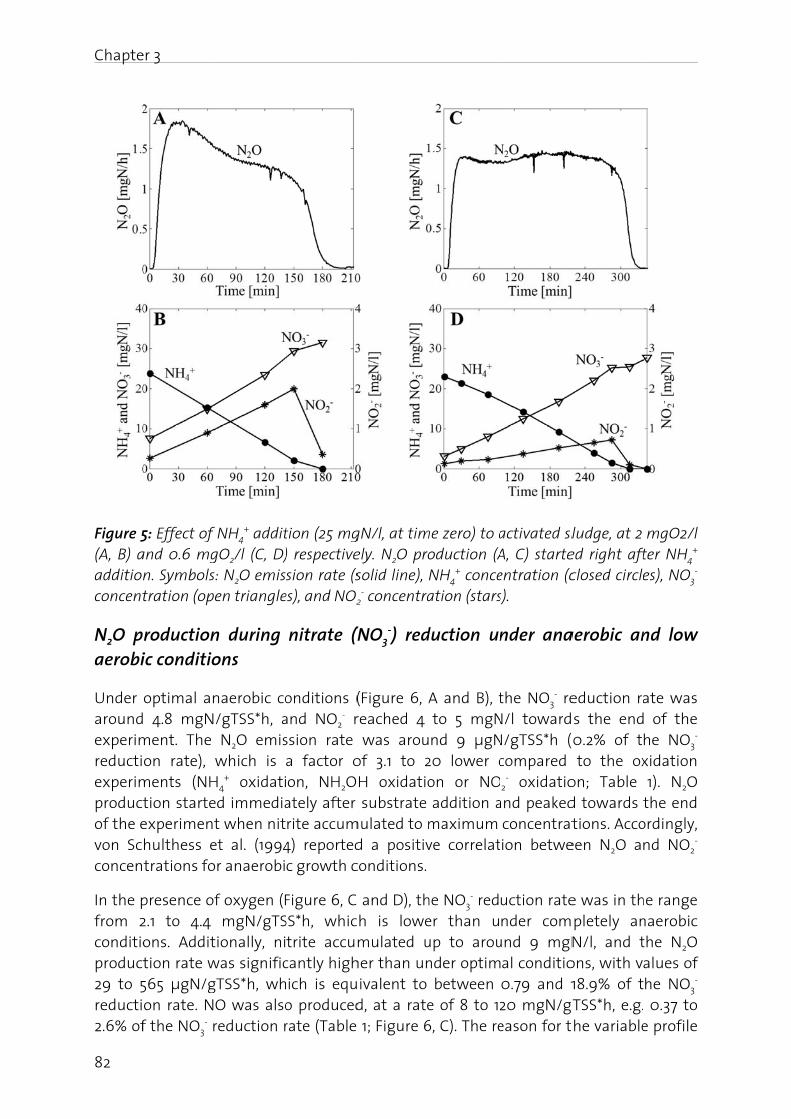
Chapte
82
Figure 5(A, B) aadditionconcent
N2O paerobi
Under aroundexperimreductiexperimproductof the evon Scconcen
In the pfrom 2conditioproduct29 to 5reducti2.6% of
er 3
5: Effect of and 0.6 mgn. Symbolstration (op
roductionic conditio
optimal an 4.8 mgN
ment. The on rate),
ments (NHtion starteexperimenthulthess etrations fo
presence of2.1 to 4.4 ons. Addittion rate w
565 μgN/gon rate. Nf the NO3
- r
f NH4+ addit
gO2/l (C, D): N2O emisen triangle
n during ons
naerobic co/gTSS*h, a N2O emis
which is H4
+ oxidatied immediat when nit
et al. (1994or anaerobi
f oxygen (F mgN/gTStionally, niwas significgTSS*h, wh
O was alsoreduction r
tion (25 mg) respectivesion rate (s
es), and NO2
nitrate (N
onditions (and NO2
- rssion rate
a factor oon, NH2O
ately after rite accum4) reportedc growth c
Figure 6, C SS*h, whictrite accum
cantly highich is equo produced
rate (Table
gN/l, at timely. N2O prosolid line),
2- concentra
(NO3-) red
(Figure 6, Areached 4 was arouof 3.1 to 2H oxidatio substrate
mulated to md a positiv
conditions.
and D), thh is lowemulated u
her than univalent to
d, at a rate 1; Figure 6
me zero) to aoduction (A NH4
+ conceation (stars
duction un
A and B), t to 5 mgNnd 9 μgN
20 lower con or NO addition a
maximum ve correlat
he NO3- red
er than uup to arounder optim between e of 8 to 12
6, C). The re
activated slA, C) starteentration (cs).
nder ana
the NO3- re
N/l towardN/gTSS*h (compared
2- oxidatio
and peaked concentration betwe
uction ratender com
und 9 mgNal conditio
0.79 and 120 mgN/gTeason for t
ludge, at 2 ed right aftclosed circle
aerobic an
eduction ras the end
(0.2% of t to the oxon; Table d towards tions. Acco
een N2O a
e was in thpletely anN/l, and t
ons, with v 18.9% of t
TSS*h, e.g. he variable
mgO2/l ter NH4
+ es), NO3
-
nd low
ate was of the he NO3
- xidation
1). N2O the end ordingly, nd NO2
-
he range naerobic the N2O alues of he NO3
- 0.37 to
e profile
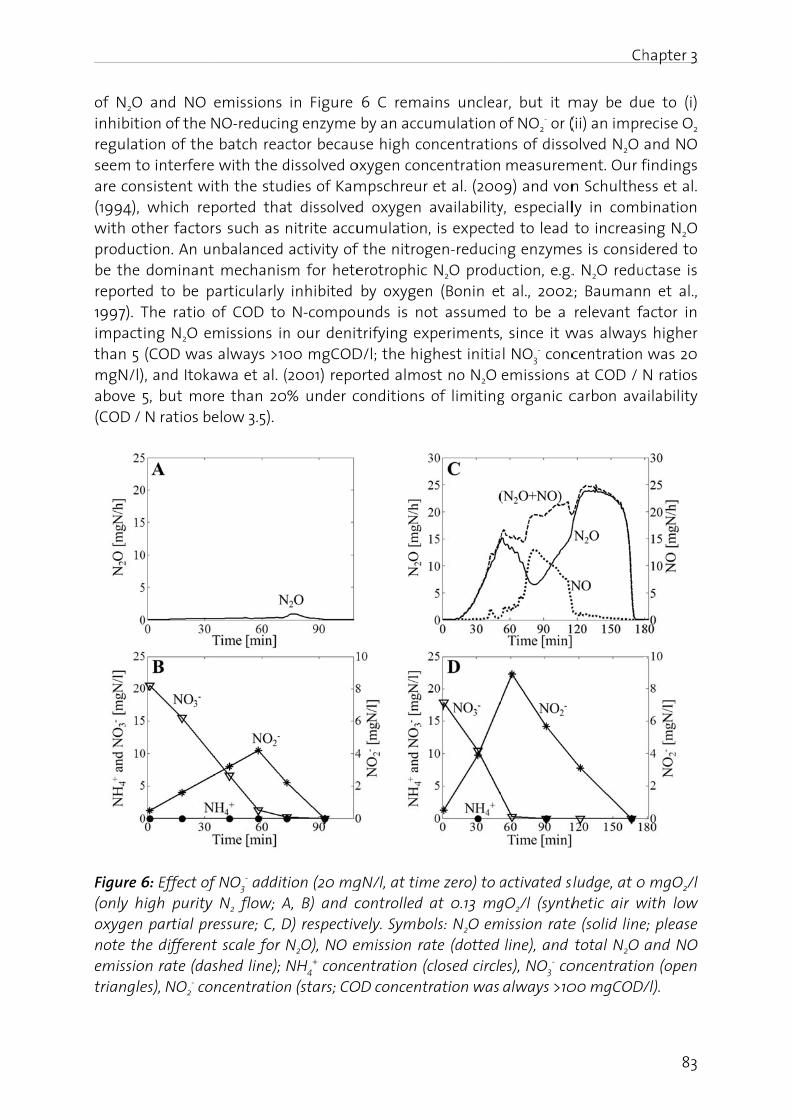
of N2O inhibitiregulatseem toare con(1994), with otproductbe the reporte1997). Timpactthan 5 mgN/l)above 5(COD /
Figure 6(only hoxygennote themissiotriangle
and NO eon of the N
tion of the o interferensistent wit which repther factortion. An un dominant ed to be p The ratio o
ing N2O em (COD was ), and Itoka
5, but mor N ratios be
6: Effect ofigh purity partial pre
he differenton rate (dases), NO2
- con
emissions NO-reducin
batch reac with the dth the stud
ported thars such as nbalanced mechanisarticularly
of COD to missions in always >10awa et al. (re than 20elow 3.5).
f NO3- addit
N2 flow; Aessure; C, Dt scale for shed line); ncentration
in Figure ng enzyme ctor becau
dissolved odies of Kamt dissolved
nitrite accu activity ofm for hete inhibited N-compoun our denit00 mgCOD
(2001) repo% under c
tion (20 mgA, B) and cD) respectiv N2O), NO e NH4
+ concen (stars; CO
6 C rema by an accuse high co
oxygen conmpschreur d oxygen umulation,f the nitrogerotrophic by oxygenunds is notrifying ex
D/l; the higorted almo
conditions
gN/l, at timcontrolled vely. Symboemission raentration (c
OD concentr
ins uncleaumulation oncentratio
centration et al. (200
availability, is expecte
gen-reducin N2O produn (Bonin etot assumedperiments,
ghest initiast no N2O
of limiting
me zero) to a at 0.13 mgols: N2O emate (dotted closed circleration was
ar, but it m of NO2
- or (ons of disso
measurem09) and vony, especialled to lead ng enzymeuction, e.g.t al., 2002d to be a , since it wl NO3
- conc emissions g organic c
activated sgO2/l (synth
mission rate line), and es), NO3
- co always >10
Ch
may be du (ii) an improlved N2O
ment. Our fn Schulthely in comb to increases is consid. N2O redu
2; Bauman relevant fa
was alwayscentration at COD /
carbon ava
sludge, at 0hetic air we (solid line total N2O oncentratio00 mgCOD/
hapter 3
83
ue to (i) recise O2 and NO findings ess et al. bination ing N2O
dered to ctase is n et al., actor in s higher was 20
N ratios ailability
0 mgO2/l with low e; please and NO on (open /l).
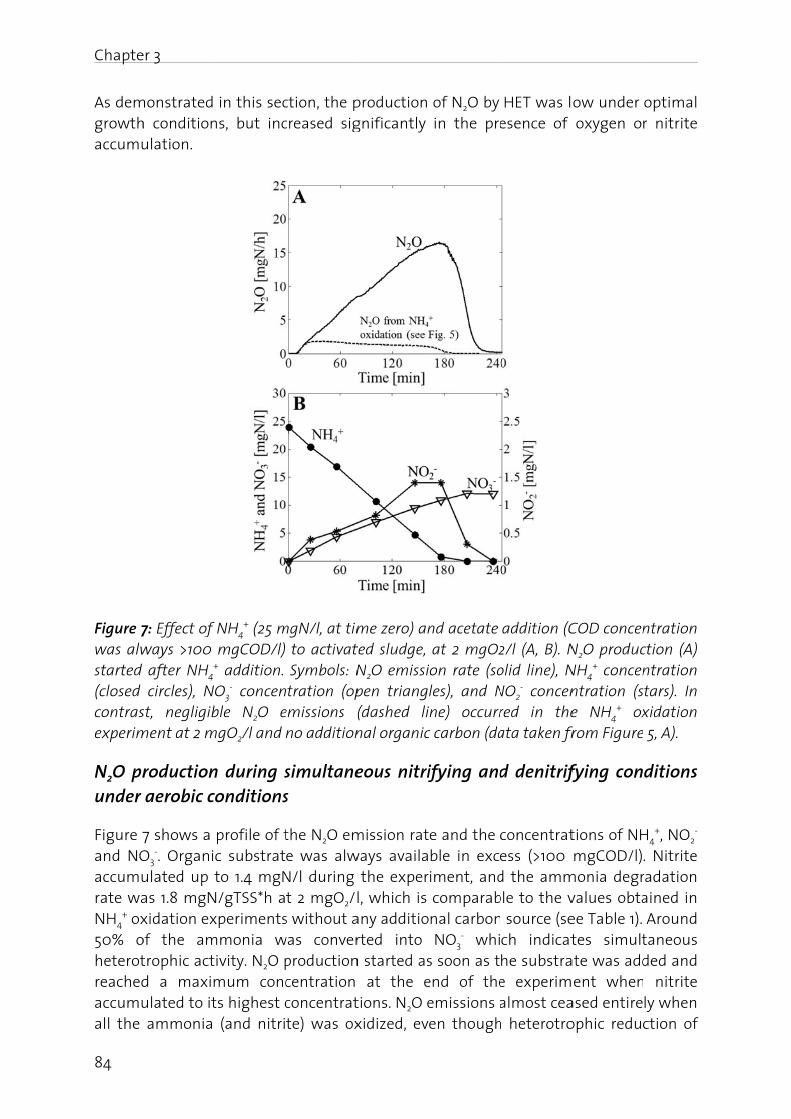
Chapte
84
As demgrowthaccumu
Figure 7was alwstarted (closed contrasexperim
N2O prunder
Figure 7and NOaccumurate waNH4
+ ox50% oheterotreachedaccumuall the
er 3
monstrated h conditionulation.
7: Effect of ways >100 after NH4
+
circles), Nst, negligibment at 2 m
roduction aerobic c
7 shows a O3
-. Organiulated up tas 1.8 mgNxidation ex
of the amtrophic actd a maximulated to it ammonia
in this secns, but inc
f NH4+ (25 m
mgCOD/l) + addition. O3
- concenble N2O e
mgO2/l and
n during sconditions
profile of tc substrat
to 1.4 mgNN/gTSS*h axperiments
mmonia wivity. N2O pmum conc
ts highest c (and nitri
ction, the pcreased sig
mgN/l, at tim to activat Symbols: Ntration (op
emissions ( no addition
simultanes
the N2O eme was alw
N/l during t 2 mgO2/l
s without awas conver productioncentration
concentratte) was ox
production gnificantly
me zero) anted sludge, N2O emissipen triang(dashed linal organic
eous nitrif
mission ratways availa
the experl, which is
any additiorted into
n started as at the etions. N2O exidized, ev
of N2O by in the pre
nd acetate at 2 mgO2ion rate (soles), and Nne) occurr
c carbon (da
ifying and
e and the ble in exciment, and comparabnal carbon
NO3- whi
s soon as tend of the emissions aen though
HET was lesence of
addition (C2/l (A, B). Nolid line), NNO2
- concenred in theata taken fr
d denitrify
concentratess (>100 d the ammble to the v
source (sech indicat
he substrae experim almost ceah heterotro
ow under oxygen o
COD concenN2O producNH4
+ concenntration (se NH4
+ oxfrom Figure
fying con
tions of NH mgCOD/l)monia degr values obtaee Table 1). tes simult
ate was addent when
ased entireophic reduc
optimal r nitrite
ntration ction (A) ntration tars). In xidation 5, A).
ditions
H4+, NO2
- . Nitrite
radation ained in Around taneous ded and nitrite ly when ction of
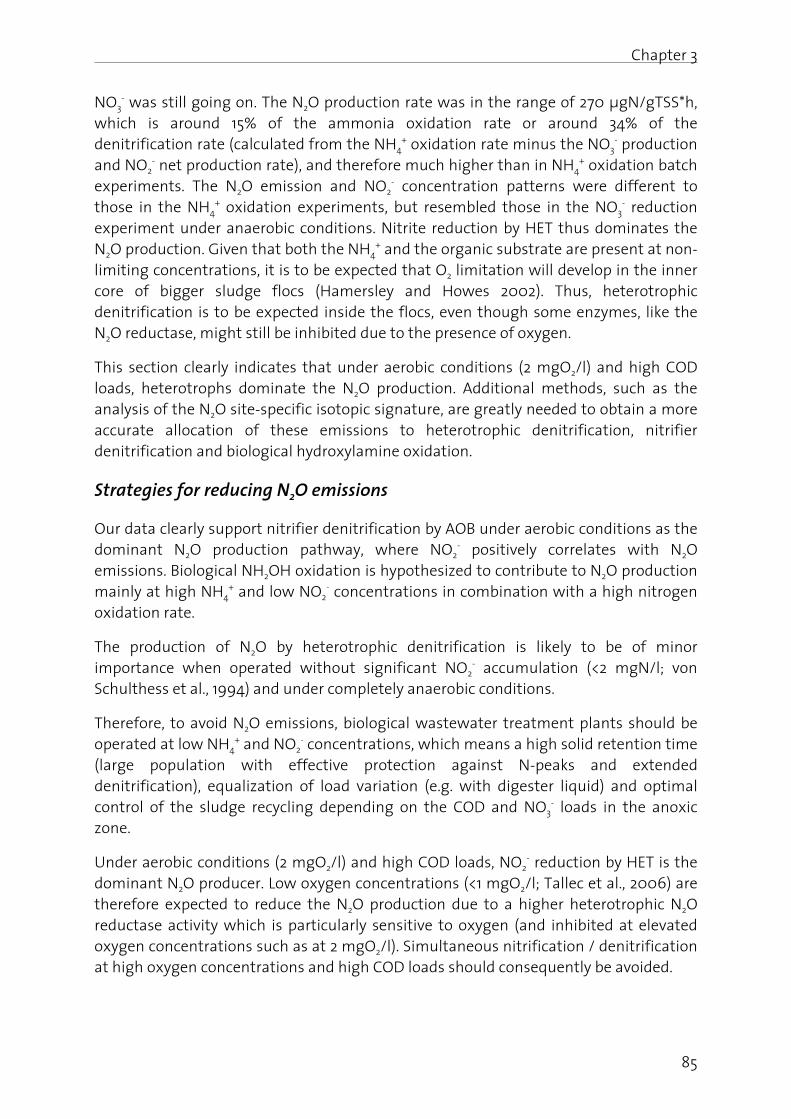
Chapter 3
85
NO3- was still going on. The N2O production rate was in the range of 270 μgN/gTSS*h,
which is around 15% of the ammonia oxidation rate or around 34% of the denitrification rate (calculated from the NH4
+ oxidation rate minus the NO3- production
and NO2- net production rate), and therefore much higher than in NH4
+ oxidation batch experiments. The N2O emission and NO2
- concentration patterns were different to those in the NH4
+ oxidation experiments, but resembled those in the NO3- reduction
experiment under anaerobic conditions. Nitrite reduction by HET thus dominates the N2O production. Given that both the NH4
+ and the organic substrate are present at non-limiting concentrations, it is to be expected that O2 limitation will develop in the inner core of bigger sludge flocs (Hamersley and Howes 2002). Thus, heterotrophic denitrification is to be expected inside the flocs, even though some enzymes, like the N2O reductase, might still be inhibited due to the presence of oxygen.
This section clearly indicates that under aerobic conditions (2 mgO2/l) and high COD loads, heterotrophs dominate the N2O production. Additional methods, such as the analysis of the N2O site-specific isotopic signature, are greatly needed to obtain a more accurate allocation of these emissions to heterotrophic denitrification, nitrifier denitrification and biological hydroxylamine oxidation.
Strategies for reducing N2O emissions
Our data clearly support nitrifier denitrification by AOB under aerobic conditions as the dominant N2O production pathway, where NO2
- positively correlates with N2O emissions. Biological NH2OH oxidation is hypothesized to contribute to N2O production mainly at high NH4
+ and low NO2- concentrations in combination with a high nitrogen
oxidation rate.
The production of N2O by heterotrophic denitrification is likely to be of minor importance when operated without significant NO2
- accumulation (<2 mgN/l; von Schulthess et al., 1994) and under completely anaerobic conditions.
Therefore, to avoid N2O emissions, biological wastewater treatment plants should be operated at low NH4
+ and NO2- concentrations, which means a high solid retention time
(large population with effective protection against N-peaks and extended denitrification), equalization of load variation (e.g. with digester liquid) and optimal control of the sludge recycling depending on the COD and NO3
- loads in the anoxic zone.
Under aerobic conditions (2 mgO2/l) and high COD loads, NO2- reduction by HET is the
dominant N2O producer. Low oxygen concentrations (<1 mgO2/l; Tallec et al., 2006) are therefore expected to reduce the N2O production due to a higher heterotrophic N2O reductase activity which is particularly sensitive to oxygen (and inhibited at elevated oxygen concentrations such as at 2 mgO2/l). Simultaneous nitrification / denitrification at high oxygen concentrations and high COD loads should consequently be avoided.
Chapter 3
86
Conclusions
Batch experiments with activated sludge treating municipal wastewater have shown that N2O is produced under both nitrifying (aerobic) and denitrifying (anaerobic) conditions:
AOB are the main N2O producers under aerobic conditions and low COD loads; the N2O production pathway is dominated by nitrifier denitrification.
At high ammonia and low nitrite concentrations in combination with a high nitrogen oxidation rate, biological N2O production via hydroxylamine oxidation is favored. However, an alternative technique such as the analysis of the N2O site-specific isotopic signature has to be applied to confirm the activity of this pathway and to further distinguish between the contribution of hydroxylamine oxidation and nitrifier denitrification (Wunderlin et al., 2010; Koba et al., 2009; Sutka et al., 2006).
The production of N2O by HET is of minor importance when the plant is operated under optimal growth conditions. Suboptimal conditions, such as the presence of oxygen or the accumulation of nitrite, significantly increased both N2O and NO production rates. Oxygen input into anoxic zones should therefore be strongly prevented.
At simultaneous nitrification and denitrification, N2O production is dominated by heterotrophic NO2
- reduction, depending strongly on the nitrite concentration, the COD load and the dissolved oxygen concentration. Simultaneous nitrification / denitrification at high oxygen concentrations (2 to 3 mgO2/l) and high COD loads should consequently be avoided.
This study provides direct evidence that strategies to study and avoid N2O emissions must consider nitrifier denitrification, hydroxylamine oxidation as well as heterotrophic denitrification.
Acknowledgements
This study was financially supported by the Swiss Federal Office for the Environment (FOEN), the Swiss National Foundation for Scientific Research, the canton of Bern (AWA), the canton of Basel-Landschaft (AIB), the canton of St. Gallen (AFU), the canton of Thurgau (AfU), the canton of Zurich (AWEL), TBF+Partner AG Consulting Engineers, WWTP region Bern, WWTP ProRheno, WWTP REAL Luzern, WWTP Zurich-Werdhölzli, Abwasserverband Altenrhein, Abwasserverband Morgental, Entsorgung St. Gallen, Zentralschweizer Umweltdirektorenkonferenz (ZUDK), Empa and Eawag.
Chapter 3
87
References
Baumann, B., Snozzi, M., VanderMeer, J. R., Zehnder, A. J. B. (1997). Development of stable denitrifying cultures during repeated aerobic-anaerobic transient periods. Water Research 31(8), 1947-1954.
Blackburne, R., Yuan, Z. G., Keller, J. (2008). Partial nitrification to nitrite using low dissolved oxygen concentration as the main selection factor. Biodegradation 19(2), 303-312.
Bock, E., Schmidt, I., Stuven, R., Zart, D. (1995). Nitrogen loss caused by denitrifying nitrosomonas cells using ammonium or hydrogen as electron-donors and nitrite as electron-acceptor. Archives of Microbiology 163(1), 16-20.
Bonin, P., Tamburini, C., Michotey, V. (2002). Determination of the bacterial processes which are sources of nitrous oxide production in marine samples. Water Research 36(3), 722-732.
Burgess, J. E., Colliver, B. B., Stuetz, R. M., Stephenson, T. (2002). Dinitrogen oxide production by a mixed culture of nitrifying bacteria during ammonia shock loading and aeration failure. Journal of Industrial Microbiology & Biotechnology 29(6), 309-313.
Casciotti, K. L., Sigman, D. M., Ward, B. B. (2003). Linking diversity and stable isotope fractionation in ammonia-oxidizing bacteria. Geomicrobiology Journal 20(4), 335-353.
Colliver, B. B. and Stephenson, T. (2000). Production of nitrogen oxide and dinitrogen oxide by autotrophic nitrifiers. Biotechnology Advances 18(3), 219-232.
Crutzen, P. J. (1979). The role of NO and NO2 in the chemistry of the troposphere and stratosphere. Annual review of earth and planetary sciences, Vol. 7, 443-472.
Hamersley, M. R. and Howes, B. L. (2002). Control of denitrification in a septage-treating artificial wetland: the dual role of particulate organic carbon. Water Research 36(17), 4415-4427.
Hynes, R. K. and Knowles, R. (1984). Production of nitrous oxide by nitrosomonas europaea: effects of acetylene, pH, and oxygen. Canadian Journal of Microbiology 30(11), 1397-1404.
IPCC, (2007). Climate Change 2007: The Physical Science Basis, Contribution of Working Group I to the Fourth Assessment Report of the Intergovernmental Panel on Climate Change [Solomon, S., Qin, D. Manning, M., Chen, Z., Marquis, M., Averyt, K.B., Tignor, M., Miller, H.L. (eds)]. Cambridge University Press, Cambridge, United Kingdom and New York, NY, USA, 996pp.
Itokawa, H., Hanaki, K., Matsuo, T. (2001). Nitrous oxide production in high-loading biological nitrogen removal process under low COD/N ratio condition. Water Research 35(3), 657-664.
Chapter 3
88
Kampschreur, M. J., Temmink, H., Kleerebezem, R., Jetten, M. S. M., van Loosdrecht, M. C. M. (2009). Nitrous oxide emission during wastewater treatment. Water Research 43(17), 4093-4103.
Kim, S. W., Miyahara, M., Fushinobu, S., Wakagi, T., Shoun, H. (2010). Nitrous oxide emission from nitrifying activated sludge dependent on denitrification by ammonia-oxidizing bacteria. Bioresource Technology 101(11), 3958-3963.
Koba, K., Osaka, K., Tobari, Y., Toyoda, S., Ohte, N., Katsuyama, M., Suzuki, N., Itoh, M., Yamagishi, H., Kawasaki, M., Kim, S. J., Yoshida, N., Nakajima, T. (2009). Biogeochemistry of nitrous oxide in groundwater in a forested ecosystem elucidated by nitrous oxide isotopomer measurements. Geochimica et Cosmochimica Acta 73(11): 3115-3133.
Mohn, J., Zeeman, M. J., Werner, R. A., Eugster, W., Emmenegger, L. (2008). Continuous field measurements of delta C-13-CO2 and trace gases by FTIR spectroscopy. Isotopes in Environmental and Health Studies 44(3), 241-251.
Rassamee, V., Sattayatewa, C., Pagilla, K., Chandran, K. (2011). Effect of oxic and anoxic conditions on nitrous oxide emissions from nitrification and denitrification processes. Biotechnology and Bioengineering 108(9), 2036-2045.
Ravishankara, A. R., Daniel, J. S., Portmann, R. W. (2009). Nitrous Oxide (N2O): The dominant ozone-depleting substance emitted in the 21st century. Science 326(5949), 123-125.
Remde, A. and Conrad, R. (1990). Production of nitric-oxide in nitrosomonas-europaea by reduction of nitrite. Archives of Microbiology 154(2): 187-191.
Ritchie, G. A. and Nicholas, D. J. (1972). Identification of the sources of nitrous oxide produced by oxidative and reductive processes in nitrosomonas europaea. Biochemical Journal 126(5), 1181-1191.
Lu, H. and Chandran, K. (2010). Factors promoting emissions of nitrous oxide and nitric oxide from denitrifying sequencing batch reactors operated with methanol and ethanol as electron donors. Biotechnology and Bioengineering 106(3), 390-398.
Montzka, S. A. and Reimann, S. (Coordinating Lead Authors), Engel, A., Krüger, K., O’Doherty, S., Sturges, W. T., Blake, D., Dorf, M., Fraser, P., Froidevaux, L., Jucks, K., Kreher, K., Kurylo, M. J., Mellouki, A., Miller, J., Nielsen, O.-J., Orkin, V. L., Prinn, R. G., Rhew, R., Santee, M. L., Stohl, A., Verdonik, D., 2011. Ozone-depleting substances (ODSs) and related chemicals, Chapter 1 in Scientific Assessment of Ozone Depletion: (2010), Global Ozone Research and Monitoring Project, Report No. 52, 516 pp., World Meteorological Organization, Geneva, Switzerland, 2011.
Poughon, L., Dussap, C. G., Gros, J. B. (2001). Energy model and metabolic flux analysis for autotrophic nitrifiers. Biotechnology and Bioengineering 72(4), 416-433.
Stüven, R., Vollmer, M., Bock, E. (1992). The impact of organic matter on nitric oxide formation by nitrosomonas europaea. Archives of Microbiology 158(6), 439-443.
Chapter 3
89
Sutka, R. L., Ostrom, N. E., Ostrom, P. H., Breznak, J. A., Gandhi, H., Pitt, A. J., Li, F. (2006). Distinguishing nitrous oxide production from nitrification and denitrification on the basis of isotopomer abundances. Applied and Environmental Microbiology 72(1), 638-644.
Tallec, G., Garnier, J., Billen, G., Gousailles, M. (2006). Nitrous oxide emissions from secondary activated sludge in nitrifying conditions of urban wastewater treatment plants: Effect of oxygenation level. Water Research 40(15), 2972-2980.
USEPA, (2009). Inventory of U.S. greenhouse gas emissions and sinks: 1990-2007, U.S. Environmental Protection Agency, Washington DC, Report No. EPA 430-R09-004.
von Schulthess, R., Wild, D., Gujer, W. (1994). Nitric and nitrous oxides from denitrifying activated-sludge at low-oxygen concentration. Water Science and Technology 30(6), 123-132.
Wrage, N., Velthof, G. L., van Beusichem, M. L., Oenema, O. (2001). Role of nitrifier denitrification in the production of nitrous oxide. Soil Biology and Biochemistry 33(12-13), 1723-1732.
Wunderlin, P., Mohn, J., Joss, A., Siegrist, H. (2010). N2O emission from biological WWT - Global relevance and pathway identification with isotopes. Proceedings of 7th IWA Leading-Edge Conference on Water and Wastewater Technologies Phoenix, AZ, USA (June).
Yoshida, N. (1988). N-15-depleted N2O as a product of nitrification. Nature 335(6190): 528-529.
Yu, R., Kampschreur, M. J., van Loosdrecht, M. C. M., Chandran, K. (2010). Mechanisms and specific directionality of autotrophic nitrous oxide and nitric oxide generation during transient anoxia. Environmental Science & Technology 44(4), 1313-1319.
Zumft, W. G. (1993). The biological role of nitric-oxide in bacteria. Archives of Microbiology 160(4), 253-264.

Chapter 4
Isotope signatures of N2O in a mixed microbial population system: Constraints on N2O
producing pathways in wastewater treatment
This chapter has been published as:
Wunderlin, P.; Lehmann, M. F.; Siegrist, H.; Tuzson, B.; Joss, A.; Emmenegger, L.; Mohn, J. Isotope signatures of N2O in a mixed microbial population system: Constraints on N2O producing pathways in wastewater treatment. Environmental Science and Technology,
2013, 47 (3), 1339-1348.
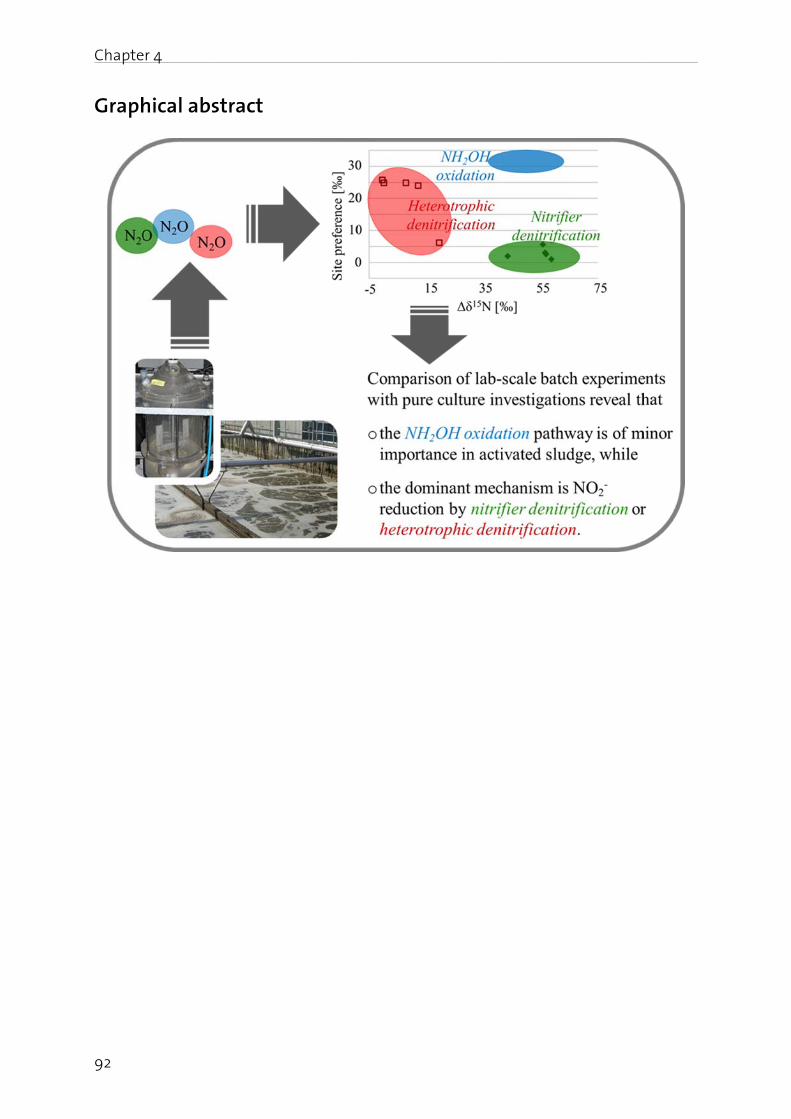
Chapte
92
Graph
er 4
hical absstract
Chapter 4
93
Abstract
We present measurements of site preferences (SP) and bulk 15N/14N ratios (δ15NbulkN2O) of
nitrous oxide (N2O) by quantum cascade laser absorption spectroscopy (QCLAS) as a powerful tool to investigate N2O production pathways in biological wastewater treatment. QCLAS enables high-precision N2O isotopomer analysis in real time. This
allowed us to trace short-term fluctuations in SP and δ15NbulkN2O and, hence, microbial
transformation pathways during individual batch experiments with activated sludge from a pilot-scale facility treating municipal wastewater. On the basis of previous work with microbial pure cultures, we demonstrate that N2O emitted during ammonia (NH4
+) oxidation with a SP of -5.8 to 5.6 ‰ derives mostly from nitrite (NO2
-) reduction (e.g. nitrifier denitrification), with a minor contribution from hydroxylamine (NH2OH) oxidation at the beginning of the experiments. SP of N2O produced under anoxic conditions was always positive (1.2 to 26.1 ‰), and SP values at the high end of this
spectrum (24.9 to 26.1 ‰) are indicative of N2O reductase activity. The measured δ15Nbulk
N2O at the initiation of the NH4+ oxidation experiments ranged between -42.3 and -
57.6 ‰ (corresponding to a nitrogen isotope effect Δδ15N = δ15Nsubstrate - δ15Nbulk
N2O of
43.5 to 58.8 ‰), which is considerably higher than under denitrifying conditions (δ15Nbulk
N2O 2.4 to -17 ‰; Δδ15N = 0.1 to 19.5 ‰). During the course of all NH4+ oxidation
and nitrate (NO3-) reduction experiments, δ15Nbulk
N2O increased significantly, indicating net 15N enrichment in the dissolved inorganic nitrogen substrates (NH4
+, NO3-) and
transfer into the N2O pool. The decrease in 15N during NO2- and NH2OH oxidation
experiments is best explained by inverse fractionation during the oxidation of NO2- to
NO3-.
Keywords
N2O production; nitrification; denitrification; pathway identification; stable nitrogen isotopes; isotopomer; laser spectroscopy
Chapter 4
94
Introduction
Nitrous oxide (N2O) is an important greenhouse gas and a major sink for stratospheric ozone (Ravishankara et al., 2009; S.A. Montzka and S. Reimann et al., 2011). It is estimated that about two thirds of anthropogenic N2O emissions can be attributed to microbial processes occurring mainly in agricultural soils, or managed lawns but also in biological wastewater treatment (USEPA 2009; Townsend-Small et al., 2011).
Microbial nitrogen (N) transforming processes such as autotrophic nitrification and heterotrophic denitrification have been identified as major N2O sources. However, the partitioning between these processes with respect to global N2O emissions and the respective mechanisms are still unclear. There are three main microbial pathways involved in N2O formation (Figure 1; Kampschreur et al., 2009): (i) N2O production as a side product during hydroxylamine (NH2OH) oxidation to nitrite (NO2
-), probably related to high metabolic activity (Yu et al., 2010), (ii) the reduction of NO2
- by ammonia-oxidizing bacteria (AOB), known as nitrifier denitrification (Colliver and Stephenson 2000), and (iii) the production of N2O by heterotrophic denitrifiers (HET), resulting from an unbalanced activity (e.g. due to inhibition) of nitrogen-reducing enzymes (or in some cases from a lack of N2O reductase; Baumann et al., 1997). The reduction of N2O to N2 by HET is currently considered to be the dominant microbial sink for N2O (Schreiber et al., 2012).
A promising approach to trace N2O source and sink processes is to analyze the nitrogen (and oxygen) isotope composition and intramolecular distribution of 15N on the central (
α) and terminal (β) positions of the asymmetric N2O molecules (Toyoda and Yoshida 1999; Sutka et al., 2006; Baggs 2008). Bulk nitrogen isotope ratios of N2O are reported
in the conventional δ-notation, in per-mil (‰), δ15N = [(RN2O/Rreference) - 1] x 1000, where R is the nitrogen isotope ratio (15N/14N), and atmospheric N2 (AIR) serves as the reference
(Mariotti et al., 1981; Coplen 2011). Analogously, δ15Nα and δ15Nβ denote the relative
enrichment of 15N in the central (Nα) position (14N15N16O) or in the terminal (Nβ) position
(15N14N16O) with respect to the reference. The site preference (SP) is defined as SP = δ15Nα - δ15Nβ (Brenninkmeijer and Röckmann 1999; Toyoda and Yoshida 1999).
Most of the studies that have used N2O isotopic measurements so far were field studies, in which the responsible N2O source processes, for instance, were not well constrained (Westley et al., 2006; Yamagishi et al., 2007; Koba et al., 2009; Toyoda et al., 2009; Ostrom et al., 2010). In this regard, it is helpful that microbial N transformation processes are typically associated with kinetic isotope fractionation, e.g. the discrimination of the 15N-containing molecules during most enzymatic reactions. During nitrification, N2O is a side-product. Therefore, the nitrogen isotope fractionation is generally higher than during heterotrophic denitrification, where N2O is assumed to be an obligate intermediate and the isotope fractionation is the net result of production and consumption processes (Figure 1; SI, Table S1; Yamagishi et al., 2007; Koba et al., 2009).
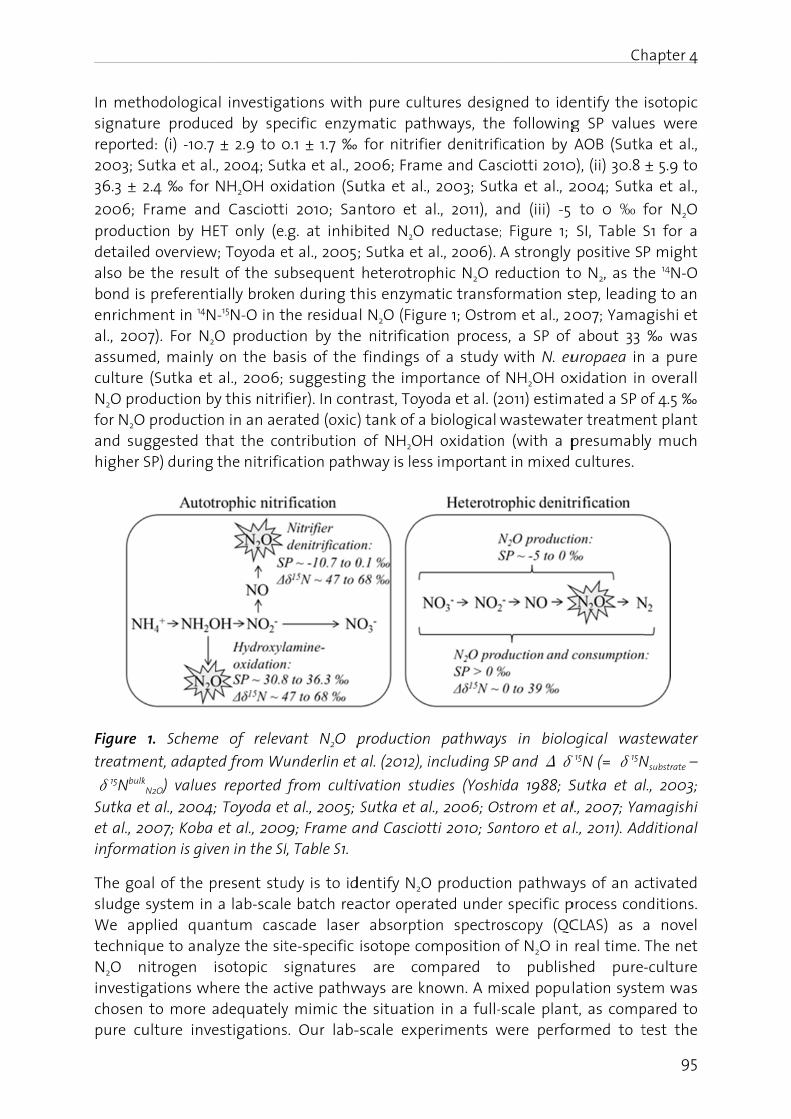
In methsignatureporte2003; S36.3 ± 2
2006; productdetailedalso bebond isenrichmal., 200assumecultureN2O profor N2Oand suhigher
Figure
treatme
δ15Nbulk
Sutka eet al., 2informa
The gosludge We aptechniqN2O ninvestigchosenpure cu
hodologicaure produced: (i) -10.7
Sutka et al. 2.4 ‰ for
Frame andtion by HEd overview
e the results preferentment in 14N07). For N2
ed, mainly (Sutka et
oduction byO productio
ggested th SP) during
1. Scheme
ent, adaptek
N2O) valueset al., 2004;
007; Koba ation is give
al of the p system in
pplied quaque to ananitrogen gations wh to more aulture inve
al investigaced by spe ± 2.9 to 0., 2004; Sut NH2OH ox
d CasciottiET only (e.
w; Toyoda et of the suially broke
N-15N-O in tO product on the ba al., 2006; y this nitrif
on in an aerhat the co the nitrific
e of relev
ed from Wu
s reported f; Toyoda et et al., 200en in the SI
present stu a lab-scalentum casclyze the sitisotopic s
here the ac adequatelyestigations
ations withecific enzy
0.1 ± 1.7 ‰tka et al., 2
xidation (Su
i 2010; Sa.g. at inhib
et al., 2005;ubsequent n during t
he residuaion by the
asis of the suggestingfier). In conrated (oxic)ntribution
cation path
ant N2O p
underlin et
from cultit al., 2005; 9; Frame a
I, Table S1.
udy is to ide batch reacade laserte-specific signatures ctive pathwy mimic ths. Our lab-
h pure cultmatic pat for nitrifie
2006; Framutka et al.,
ntoro et abited N2O ; Sutka et a heterotrop
his enzymal N2O (Figu
e nitrificat findings og the impo
ntrast, Toyo) tank of a of NH2OH
hway is less
production
al. (2012), i
ivation stu Sutka et aand Casciot
dentify N2Oactor operar absorptio isotope co are com
ways are knhe situation-scale expe
tures desighways, theer denitrifi
me and Cas, 2003; Sut
al., 2011), a reductase; al., 2006). phic N2O ratic transfoure 1; Ostroion proces
of a study ortance of oda et al. (2 biological
H oxidations importan
n pathway
including S
dies (Yoshil., 2006; Ostti 2010; Sa
O productioated underon spectro
ompositionmpared tnown. A mn in a full-eriments w
gned to idee followingication by sciotti 2010tka et al., 2
and (iii) -5 ; Figure 1; A strongly eduction tormation s
om et al., 2s, a SP of with N. eu NH2OH ox2011) estim wastewaten (with a pt in mixed
ys in biolo
P and Δδ
ida 1988; Sstrom et al
antoro et al
on pathwayr specific poscopy (QC of N2O in
to publishixed populscale plant
were perfo
Ch
entify the g SP value AOB (Sutk0), (ii) 30.8 2004; Sutk
to 0 ‰ f SI, Table positive S
to N2, as th step, leadin
007; Yama about 33 uropaea inxidation inated a SP o
er treatme presumabl
cultures.
ogical was
δ15N (= δ15N
Sutka et all., 2007; Yal., 2011). Ad
ys of an acprocess conCLAS) as real time. hed purelation systt, as comp
ormed to t
hapter 4
95
isotopic es were ka et al., ± 5.9 to ka et al.,
for N2O S1 for a P might
he 14N-O ng to an agishi et ‰ was
n a pure n overall of 4.5 ‰ nt plant y much
stewater
Nsubstrate –
l., 2003; magishi
dditional
ctivated nditions.
a novel The net -culture em was
pared to test the
Chapter 4
96
following hypotheses: (i) nitrifier denitrification is the dominant N2O production pathway during nitrification (NH4
+ oxidation), (ii) NH2OH addition is conductive to N2O production by NH2OH oxidation, while (iii) the addition of NO2
- to activated sludge fosters N2O production by nitrifier denitrification, and (iv) HET is assumed to be the main pathway under anoxic conditions with N2O reductase activity being regulated by the dissolved oxygen concentration (Table 1).
Materials and methods
Experimental setup for batch scale experiments
In the present investigation, batch experiments were carried out with activated sludge sampled from the aerobic (nitrifying) reactor of a pilot scale municipal wastewater treatment plant adapted to NH4
+ nitrification before the daily NH4+ peak load (before 8
a.m.; for more details see SI Text S1). A laboratory batch-scale reactor with a working volume of 6.9 L and a headspace of 1.2 L was used (for more details see Wunderlin et al., 2012). The wastewater temperature was held at 20 ± 1.2 °C. Continuous gas flow was maintained at 1 standard liter per minute using a mass flow controller (Red-y Smart series, Vögtlin Instruments, Switzerland) during both nitrification and denitrification experiments in order to strip N2O (and NO) from the liquid phase for subsequent analysis. The dissolved oxygen concentration was adjusted by automated oxygen-controlled (by Oxymax H, Endress + Hauser) purging either with high purity nitrogen gas or synthetic air (20.5% O2 in N2). Under anoxic conditions, nitrogen gas was continuously purged through the reactor. The pH was measured with a pH electrode (Orbisint CPS11, Endress + Hauser, calibration at pH 7 and 9), and was held constant at 7.1 ± 0.2 using a pH controller via the addition of CO2 (> 99.9% CO2, Carbagas).
Nitrification experiments were carried out at oxygen concentrations typical for full-scale plants: 0.5, 1, 2 or 3 mgO2/l. The experiments were started by adding either NH4
+, NO2
- or NH2OH (25 mg NH4+-N/l, NH4HCO3 from Merck, Switzerland; 15 mgNO2
--N/l, NaNO2 from Merck; 2, 5, 10 or 15 mgNH2OH-N/l, NH2OH-HCl from Fluka, Switzerland). Denitrification experiments were performed at zero or very low dissolved oxygen concentrations (<0.2 mgO2/l), and were launched by adding organic carbon (sodium acetate from Merck; always > 100 mg COD/l; COD: chemical oxygen demand) and NO3
- (10 or 20 mgNO3
--N/l, NaNO3 from Fluka). Samples were preconditioned to remove ambient NO3
- present in the activated sludge through denitrification, prior to the start of the actual denitrification experiment with controlled substrate amendments. Preconditioning of the nitrification experiments included continuous aeration of the batch-scale reactor to remove ambient NH4
+ by nitrification. An overview of the experiments is given in Table 1. The nitrogen isotopic signature of the substrates used in the experiments was analyzed by elemental analyzer (EA) - isotope-ratio mass-spectrometry (IRMS; for more details about the analytical aspects, see SI, Text S2).
Experiments under nitrifying and denitrifying conditions were stopped when N2O (and NO) production ceased and the dissolved N substrate was completely oxidized (NH4
+,
Chapter 4
97
NH2OH or NO2- in the nitrification experiments) or reduced (NO3
- in the denitrification experiments). More detailed descriptions of the experimental setup, the batch experiments and the respective emission data are given in Wunderlin et al. (2012).
Liquid analysis procedures
Grab samples were taken regularly (every 15 to 60 minutes) and were immediately filtered through a 0.7 μm filter (GF/F Whatman) and a 0.45 μm syringe filter (Chromafil Membranfilter from Macherey), before being stored at 4 °C until their analysis within 24 hours. NH4
+-N was analyzed photometrically using a Foss FIAstar flow injection 5000 analyzer (detection limit 0.2 mgN/l; relative uncertainty 5%). NO3
--N and NO2--N were
determined by ion chromatography (761 compact IC, Metrohm; detection limit for both components 0.2 mgN/l; relative uncertainty 5%). Commercial photochemical test kits (Hach Lange GmbH, Düsseldorf, Germany) were used to measure low NO2
- concentrations (LCK 341; detection limit 0.015 mgN/l) and COD (LCK 314, LCK 414, or LCK 114).
Analysis of N2O concentration and isotopic composition
The N2O and NO concentrations in the outflowing gas (off-gas) were continuously (1 minute temporal resolution) analyzed by FTIR spectroscopy (GASMET CX-4000, Temet Instruments, Finland), equipped with a heated (40°C) flow-through gas cell of 9.8 m path length (see SI, Figure S1). The quantification limits for N2O and NO are 0.25 and 5 ppm respectively, and the expanded standard uncertainty for both components is
around 10% (2σ confidence level; Mohn et al., 2008).
The exhaust gas was dynamically diluted with synthetic air (Messer, Switzerland) to constant N2O concentrations (around 300 ppb), using two mass flow controllers (Red-y Smart series, Vögtlin Instruments, Switzerland), in order to ensure a high precision of the isotope measurement (see SI, Text S3, Figure S1). At the pump outlet, the pressure was adjusted to 4 bar using a pressure relief valve. Humidity as well as CO2 were removed from the gas flow to ppm or even ppb levels, respectively, applying a permeation drier (MD-050-72S-1, PermaPure Inc., USA) and a chemical CO2 trap filled with Ascarite (4 g, 10 - 35 mesh, Fluka, Switzerland) and Mg(ClO4)2 (2 x 2 g, Fluka, Switzerland). Finally, the sample gas was passed through a sintered metal filter (SS-6F-MM-2, Swagelok, USA) and directed to a preconcentration unit (Mohn et al., 2010). This fully automated liquid-nitrogen free preconcentration device was used to increase the N2O concentrations by a factor of 200, from ambient level to around 70 ppm N2O (Mohn et al., 2010; Mohn et al., 2012). The N2O content from 10 liters of diluted off-gas was adsorbed onto a porous polymer adsorption trap (HayeSep D 100-120 mesh, Hayes Separations Inc., USA) at a flowrate of 500 standard cubic centimeters per minute, then desorbed by resistive heating combined with synthetic air purging, and finally introduced into the evacuated multipass cell of the QCLAS (Waechter et al., 2008). Successive preconcentration cycles resulted in a temporal resolution of 30 minutes for N2O isotopomer analysis. The accuracy of this procedure was ensured by preconcentration of N2O with a known isotopic composition (standard I) and
Chapter 4
98
subsequent QCLAS analysis at least once daily. The high precision analysis capacity and equivalence to IRMS has recently been demonstrated in an inter-comparison study (Köster et al., 2013).
The QCLAS employed in this study allowed simultaneous quantification of the three
most abundant N2O isotopic species (14N14N16O, 15N14N16O, 14N15N16O). For both δ15Nα and
δ15Nβ, a precision better than 0.1 ‰ was obtained with six minutes of spectral averaging at mixing ratios of 70 ppm N2O. Before and after each experiment, standard
gases were analyzed to calibrate the δ15Nα and δ15Nβ measurements, and to correct for drifts. The standard gas itself was calibrated against primary standards by QLAS.
Standard I: δ15Nα = 2.1 ± 0.1‰, δ15Nβ = 2.0 ± 0.2 ‰, 246.9 ± 0.1 ppm N2O; standard II: δ15Nα = 25.0 ± 0.1 ‰, δ15Nβ = 24.8 ± 0.2 ‰, 249.1 ± 0.1 ppm N2O (the precision indicated is
the standard error of the mean). Primary standard gases were analyzed (δ15Nα, δ15Nβ
and δ15NbulkN2O) by IRMS at the Tokyo Institute of Technology, Japan (Toyoda and
Yoshida 1999).
Table 1. Summary of batch experiments: added substrates (initial concentrations and their isotopic composition) to activated sludge taken from the nitrification reactor of our pilot
plant, and dissolved oxygen concentrations; SP, δ15Nbulk of N2O (both at the beginning and
end of the experiments), Δδ15N of produced N2O and the quantitative interpretation of SP data. NN refers to NH2OH oxidation, ND to AOB nitrifier denitrification, HET to heterotrophic denitrification and N2O red. to N2O reductase activity. Additional information is given in Wunderlin et al (2012).
Experiment Added
substrate O2 δ15Nbulk
N2O *
Net N isotope effect
(Δδ15N)#
Site preference (SP)*
Interpretation of microbial processes based on SP##
start end start end start end
[mg/l] [‰] [‰] [‰] [‰] [‰]
NO2-
oxidation (δ15N = -30.5‰) Hypothesis: Nitrifier denitrification (ND)
NO2-
15 mgN/l 0.6 -64.4 - 0.2 100%ND
15 mgN/l 0.6 -56.3 -72.9 25.8 -1.1 -2.1 100%ND 100%ND
15 mgN/l 1.1 -54.9 -67.1 24.4 -0.2 -1.1 100%ND 100%ND
15 mgN/l 2.1 -59.7 -72.4 29.2 -3.0 -3.4 100%ND 100%ND
15 mgN/l 3.1 -57.5 -69.2 27.0 -2.1 -3.9 100%ND 100%ND
NH2OH oxidation (δ15N = -71.3‰) Hypothesis: NH2OH oxidation (NN) and ND
NH2OH
2 mgN/l 2.1 -62.3 - 25.2 89%NN 11%ND
5 mgN/l 2.1 -76.0 -86.3 4.7 26.4 19.9 93%NN 7%ND
72%NN 28%ND
10 mgN/l 1.1 -63.9 -50.7 -7.4 30.7 3.7 100%NN 19%NN 81%ND
10 mgN/l 2.2 -68.2 -83.1 -3.1 29.0 20.7 100%NN 74%NN 26%ND
15 mgN/l 2.3 -70.1 -79.2 -1.2 27.5 25.8 97%NN 3%ND
91%NN 9%ND
10 mgN/l§
2.1 -65.7 -68.4 -5.6 30.5 30.2 100% NN§§ 100% NN§§
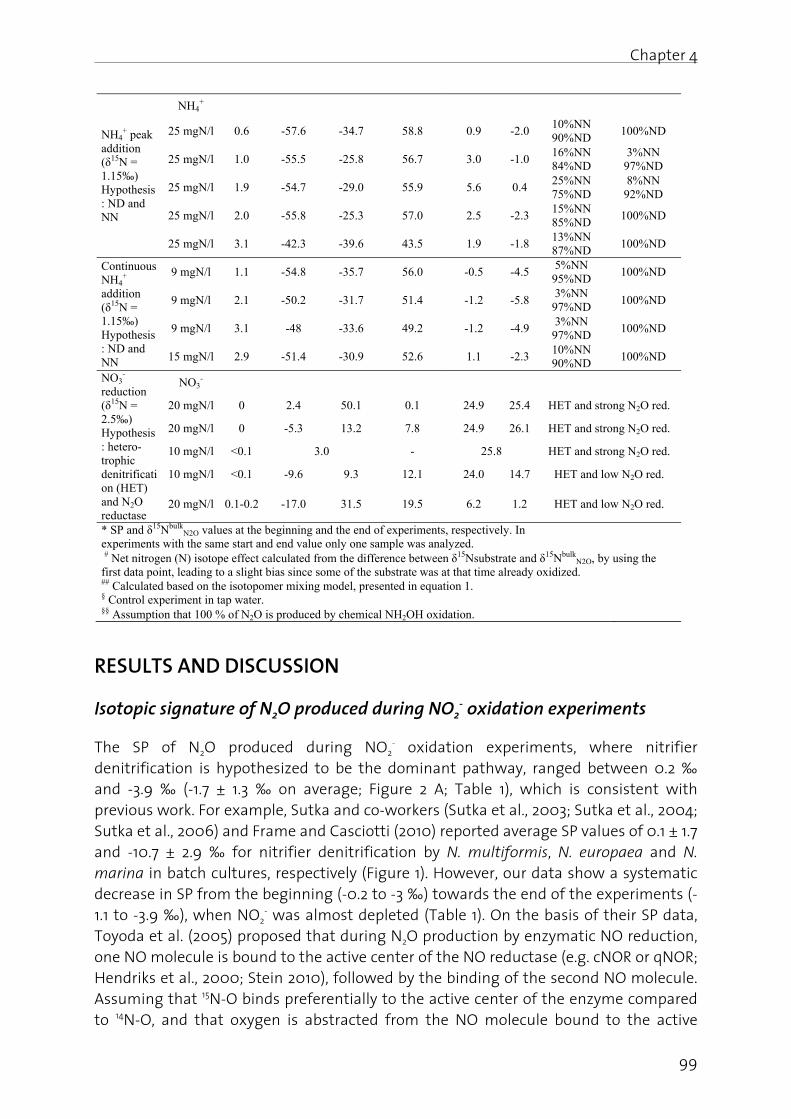
Chapter 4
99
NH4+ peak
addition (δ15N = 1.15‰) Hypothesis: ND and NN
NH4+
25 mgN/l 0.6 -57.6 -34.7 58.8 0.9 -2.0 10%NN 90%ND
100%ND
25 mgN/l 1.0 -55.5 -25.8 56.7 3.0 -1.0 16%NN 84%ND
3%NN 97%ND
25 mgN/l 1.9 -54.7 -29.0 55.9 5.6 0.4 25%NN 75%ND
8%NN 92%ND
25 mgN/l 2.0 -55.8 -25.3 57.0 2.5 -2.3 15%NN 85%ND
100%ND
25 mgN/l 3.1 -42.3 -39.6 43.5 1.9 -1.8 13%NN 87%ND
100%ND
Continuous NH4
+ addition (δ15N = 1.15‰) Hypothesis: ND and NN
9 mgN/l 1.1 -54.8 -35.7 56.0 -0.5 -4.5 5%NN
95%ND 100%ND
9 mgN/l 2.1 -50.2 -31.7 51.4 -1.2 -5.8 3%NN
97%ND 100%ND
9 mgN/l 3.1 -48 -33.6 49.2 -1.2 -4.9 3%NN
97%ND 100%ND
15 mgN/l 2.9 -51.4 -30.9 52.6 1.1 -2.3 10%NN 90%ND
100%ND
NO3-
reduction (δ15N = 2.5‰) Hypothesis: hetero-trophic denitrification (HET) and N2O reductase
NO3-
20 mgN/l 0 2.4 50.1 0.1 24.9 25.4 HET and strong N2O red.
20 mgN/l 0 -5.3 13.2 7.8 24.9 26.1 HET and strong N2O red.
10 mgN/l <0.1 3.0 - 25.8 HET and strong N2O red.
10 mgN/l <0.1 -9.6 9.3 12.1 24.0 14.7 HET and low N2O red.
20 mgN/l 0.1-0.2 -17.0 31.5 19.5 6.2 1.2 HET and low N2O red.
* SP and δ15NbulkN2O values at the beginning and the end of experiments, respectively. In
experiments with the same start and end value only one sample was analyzed. # Net nitrogen (N) isotope effect calculated from the difference between δ15Nsubstrate and δ15Nbulk
N2O, by using the first data point, leading to a slight bias since some of the substrate was at that time already oxidized. ## Calculated based on the isotopomer mixing model, presented in equation 1. § Control experiment in tap water. §§ Assumption that 100 % of N2O is produced by chemical NH2OH oxidation.
RESULTS AND DISCUSSION
Isotopic signature of N2O produced during NO2- oxidation experiments
The SP of N2O produced during NO2- oxidation experiments, where nitrifier
denitrification is hypothesized to be the dominant pathway, ranged between 0.2 ‰ and -3.9 ‰ (-1.7 ± 1.3 ‰ on average; Figure 2 A; Table 1), which is consistent with previous work. For example, Sutka and co-workers (Sutka et al., 2003; Sutka et al., 2004; Sutka et al., 2006) and Frame and Casciotti (2010) reported average SP values of 0.1 ± 1.7 and -10.7 ± 2.9 ‰ for nitrifier denitrification by N. multiformis, N. europaea and N. marina in batch cultures, respectively (Figure 1). However, our data show a systematic decrease in SP from the beginning (-0.2 to -3 ‰) towards the end of the experiments (-1.1 to -3.9 ‰), when NO2
- was almost depleted (Table 1). On the basis of their SP data, Toyoda et al. (2005) proposed that during N2O production by enzymatic NO reduction, one NO molecule is bound to the active center of the NO reductase (e.g. cNOR or qNOR; Hendriks et al., 2000; Stein 2010), followed by the binding of the second NO molecule. Assuming that 15N-O binds preferentially to the active center of the enzyme compared to 14N-O, and that oxygen is abstracted from the NO molecule bound to the active
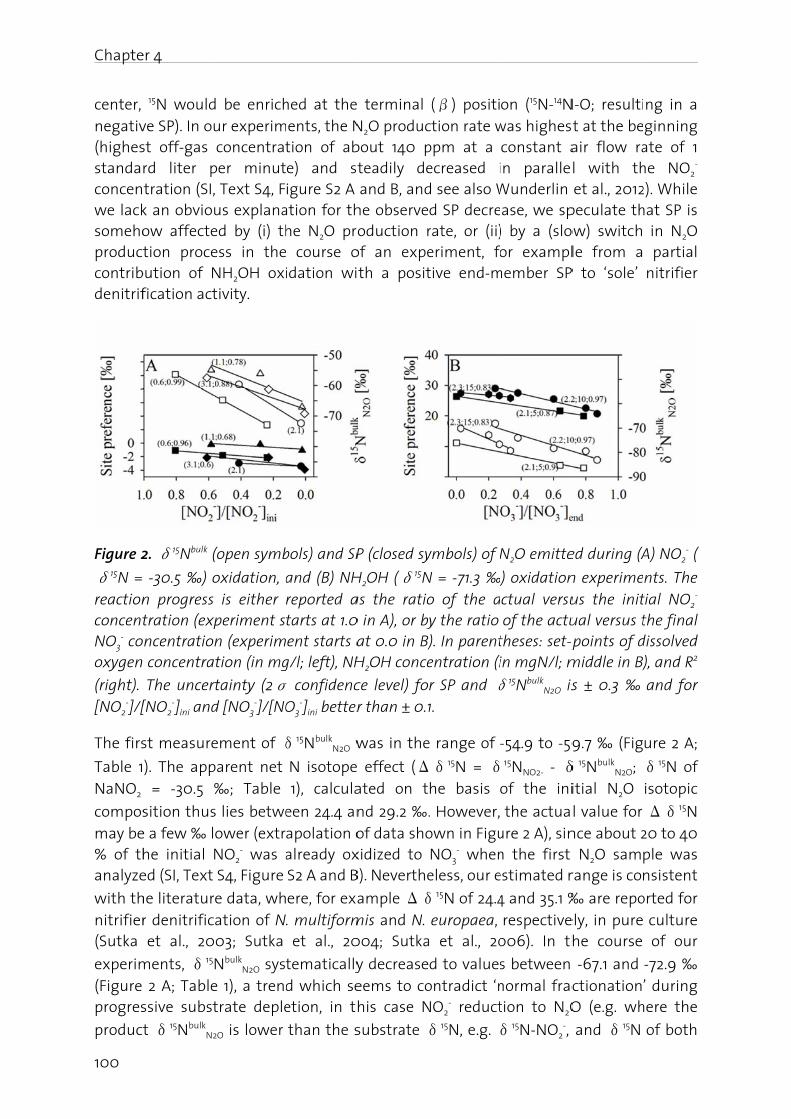
Chapte
100
center, negativ(highesstandaconcenwe lacksomehoproductcontribdenitrif
Figure 2
δ15N =reactionconcentNO3
- cooxygen
(right). [NO2
-]/[
The firs
Table 1NaNO2
composmay be% of thanalyze
with thnitrifier(Sutka
experim(Figure progres
product
er 4
15N wouldve SP). In oust off-gas rd liter ptration (SI,
k an obviouow affectetion proce
bution of Nfication act
2. δ15Nbulk (
-30.5 ‰) on progress tration (expncentratio concentra
The uncer[NO2
-]ini and
st measure
). The app = -30.5 ‰
sition thuse a few ‰ lhe initial Ned (SI, Text
he literaturr denitrific et al., 20
ments, δ15
2 A; Tablessive subst
t δ15NbulkN2
d be enrichur experim
concentratper minut, Text S4, Fus explanaed by (i) thess in theNH2OH oxitivity.
(open symb
oxidation, a is either periment sn (experimtion (in mg
rtainty (2σd [NO3
-]/[NO
ement of δ
parent net ‰; Table
s lies betwe ower (extr NO2
- was a S4, Figure
e data, whation of N03; Sutka
NbulkN2O syst
e 1), a trendtrate deple
2O is lower
hed at thements, the N
tion of abe) and stigure S2 A
ation for thhe N2O pro course oidation wi
bols) and SP
and (B) NHreported atarts at 1.0ent starts a
g/l; left), NH
σ confidencO3
-]ini better
δ15NbulkN2O w
N isotope 1), calcula
een 24.4 anapolation o
already ox S2 A and B
ere, for exa. multiform et al., 20
tematicallyd which seetion, in th
than the s
terminal N2O producbout 140 pteadily de and B, andhe observeoduction r
of an expeth a posit
P (closed sy
H2OH (δ15Nas the ratio0 in A), or by at 0.0 in B)H2OH conce
ce level) for than ± 0.1
was in the
effect (Δated on t
nd 29.2 ‰. of data shoxidized to
B). Neverthe
ample Δδ
mis and N. 004; Sutka
y decreaseeems to cohis case N
substrate
(β) positiction rate wppm at a ecreased id see also Wd SP decre
rate, or (ii)eriment, fotive end-m
ymbols) of N
N = -71.3 ‰)o of the ay the ratio ). In parententration (i
r SP and δ1.
e range of
δ15N = δhe basis
. However,own in Figu NO3
- wheneless, our e
δ15N of 24.4 europaea, a et al., 20
d to valuesontradict ‘nNO2
- reduct
δ15N, e.g.
on (15N-14N was highest constant ain paralle
Wunderlin ase, we sp
) by a (sloor exampl
member SP
N2O emitte
) oxidationctual versu of the actutheses: set-pin mgN/l; m
δ15NbulkN2O is
-54.9 to -5915NNO2- - δ
of the ini
the actuaure 2 A), sinn the first
estimated r
4 and 35.1 ‰ respective006). In th
s between normal fraction to N2O
δ15N-NO2-,
N-O; resultit at the be
air flow ral with th et al., 2012peculate thow) switchle from a
P to ‘sole’
ed during (A
n experimeus the initual versus tpoints of d
middle in B)
s ± 0.3 ‰
9.7 ‰ (Fig
δ15NbulkN2O;
itial N2O
l value for nce about 2 N2O sam
range is con
‰ are repoely, in purehe course
-67.1 and ctionationO (e.g. wh
and δ15N
ng in a ginning
ate of 1 he NO2
- 2). While hat SP is in N2O partial
nitrifier
A) NO2- (
nts. The tial NO2
- the final dissolved ), and R2
and for
ure 2 A;
δ15N of isotopic
Δδ15N 20 to 40 ple was nsistent
orted for culture of our
-72.9 ‰ ’ during
here the
of both
Chapter 4
101
substrate and product increase with ongoing reaction). The decreasing trend in δ15N
indicates that the δ15N of the NO2- itself represents a ‘moving baseline’ which is
affected not only by N isotope fractionation during the reduction to N2O, but also by the oxidation to NO3
- (preventing the use of a Rayleigh model to calculate N isotope effects for N2O production). Oxidation of NO2
- to NO3- in the ocean has been reported to
be associated with an inverse N isotope effect (e.g. a negative Δδ15N; Casciotti 2009), and it appears that this effect seems to dominate the isotopic changes of the NO2
- (and hence of N2O).
Isotopic signature of N2O produced during NH2OH oxidation experiments
During NH2OH oxidation experiments, where NH2OH oxidation is hypothesized to be the dominant N2O production pathway, the SP of N2O ranged between 26.4 and 30.7 ‰ at the beginning of the experiments (28.4 ± 1.9 ‰ on average; Figure 2 B; Table 1). This was significantly higher than the SP observed during NO2
- oxidation experiments (SP in the range of -0.2 to -3.0 ‰; Figure 2 A), where nitrifier denitrification by AOB was the dominant N2O producing process. But in agreement with previous work, where average SP values of 32.5 ± 0.6 ‰, 33.5 ± 1.2 ‰ and 30.8 ± 5.9 ‰ were measured for the N2O production via NH2OH oxidation by N. multiformis, N. europaea and Methylococcus capsulatus, respectively (Sutka et al., 2003; Sutka et al., 2004; Sutka et al., 2006). SP
values of 36.3 ± 2.4 ‰ were determined for the marine β-proteobacterium Nitrosomonas marina C-113a (Figure 1; Frame and Casciotti 2010). The systematic decrease in SP in the course of our experiments (Figure 2 B), in addition to the
decreasing trend observed for δ15NbulkN2O (see below), underscores that NH2OH
oxidation is dominant at the beginning of the experiments, while nitrifier denitrification becomes important with ongoing depletion of NH2OH substrate. By assuming an average SP of 28.5 ‰ for pure N2O production via NH2OH oxidation (SPNN; this section) and an average SP of -2 ‰ for AOB nitrifier denitrification (SPND; see section before), the partitioning of both processes with regards to total N2O production can be estimated (FND and FNN, respectively), even though a marginal contribution from additional (not considered) pathways cannot be completely excluded (equation 1; Frame and Casciotti 2010):
)(
)()1(
NNND
NNtotNNND SPSP
SPSPFF
Equation 1
Accordingly, a site preference (SPtot) generally in between of 20 and 25 ‰ (as observed towards the end of several of the experiments shown in Figure 2 B) suggests that ~12 to ~28 % of the total N2O production in the nitrifying batch experiments can eventually be attributed to nitrifier denitrification (FND). At the extreme, in one of the experiments at 1.1 mgO2/l (Table 1; SI, Figure S2 C), we measured a SP of 3.7 ‰ at the end of the experiment when NH2OH is low suggesting that nitrifier denitrification by AOB can almost completely take over N2O production (see also Figure 3 A).
Chapter 4
102
The exact mechanism of N2O formation during NH2OH oxidation is unknown, but can be hypothesized that it is produced either via chemical breakdown of nitroxyl radicals (NOH; Law et al., 2012), or via NO production by hydroxylamine oxidoreductase (HAO), which is subsequently reduced to N2O by an NO reductase such as cytochrome c554 (Upadhyay et al., 2006; Chandran et al., 2011). For both scenarios, a positive SP can be interpreted as an indicator of a reaction via a symmetric intermediate, where the cleavage of the 14N-O bond is preferred over that of the 15N-O bond, resulting in a 15N
enrichment at the central (α) position (14N-15N-O; Schmidt et al., 2004).
The δ15Nbulk values of N2O produced at the beginning of the NH2OH oxidation experiments were in the range of -63.9 to -76 ‰ (Figure 2 B). On the basis of these
values, Δδ15N between -7.4 and 4.7 ‰ were estimated (δ15N of NH2OH-HCl = -71.3 ‰; Table 1). Yet, the observed N isotope effect range is consistent with reports from the
literature, with Δδ15N values for N2O production via NH2OH oxidation of -2 ‰ for N. europaea and N. multiformis, and -5.7 ‰ for M. trichosporium respectively (Sutka et al., 2006). A similar value was measured for N. capsulatus (-3.1 ‰; Sutka et al., 2003; Sutka
et al., 2004) and for the marine β-proteobacterium Nitrosomonas marina C-113a (6.7 ‰; Frame and Casciotti 2010). As in the NO2
- oxidation experiments, we observed
systematically decreasing δ15NbulkN2O values to -79.2 to -86.3 ‰ with progressive
reaction (Figure 2 B). This trend is best explained by the above mentioned increasing contribution of nitrifier denitrification activity by AOB to the total N2O production. Indeed, NO2
-, the precursor substrate of N2O in nitrifier denitrification, accumulated by up to 0.4 mgN/l during the experiment (in parallel with N2O), yielding maximum off-gas concentrations of about 60 ppm (SI, Text S4, Figure S2 C and D). The inverse fractionation during partial NO2
- oxidation to NO3- can explain the negative trends as
described for the NO2- oxidation experiments (see above and Casciotti 2009). In the
experiment at 1.1 mgO2/l (shown in SI, Figure S2 C and D), we monitored the N2O isotopic signature until NH2OH was almost completely oxidized (in contrast to the other NH2OH oxidation experiments shown in Figure 2 B): at very low N2O production
rates during the second half of the incubation, δ15NbulkN2O increased again from a
minimum of -81.1 to -50.7 ‰. We consider this increase in δ15NbulkN2O to be the result of a
paralleling increase of the δ15N of the precursor N (NH2OH and NO2-) and N2O pools
according to Rayleigh distillation kinetics, dominating the overall N isotope dynamics towards substrate depletion.
In a control experiment, where we added NH2OH to tap water (without activated
sludge), N2O was produced with an average δ15Nbulk value of -67.2 ± 1.8 ‰ (Δδ15N of around -4.1 ± 1.8 ‰) and an average SP of 30.3 ± 0.2 ‰ (Table 1). SP remained essentially
invariant and only a minor decrease in δ15NbulkN2O (from -65.7 to -68.4 ‰) was observed.
As NO2- production was marginal in the absence of activated sludge (data not shown),
we conclude that the observed signatures are characteristic for purely inorganic NH2OH oxidation. Indeed, Toyoda et al. (2005) reported an average SP value of 30.1 ‰ for inorganic NO2
- reduction and 29.5 ‰ for inorganic NH2OH oxidation respectively, and proposed an N2O formation mechanism via hyponitrite (N2O2
2-), a symmetric
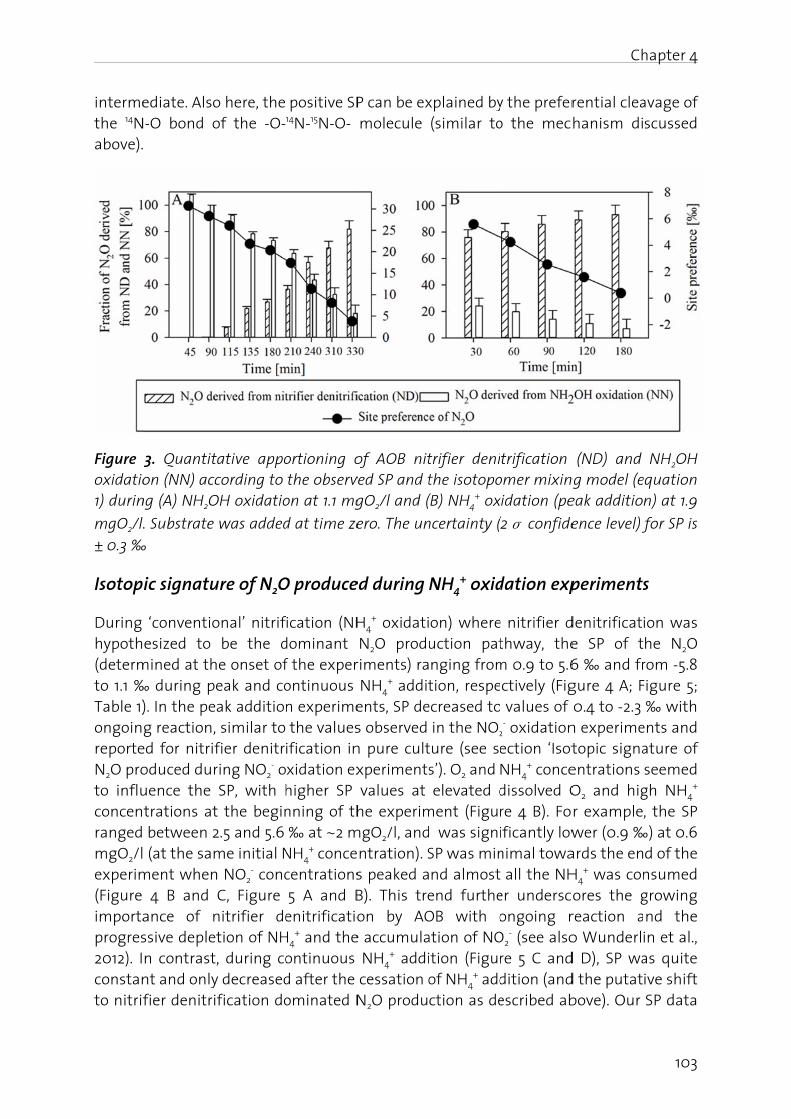
intermethe 14Nabove).
Figure oxidatio1) durin
mgO2/l.± 0.3 ‰
Isotop
During hypoth(determto 1.1 ‰Table 1)ongoinreporteN2O proto influconcenrangedmgO2/lexperim(Figure importaprogres2012). Iconstanto nitrif
ediate. AlsoN-O bond o
.
3. Quantiton (NN) ac
ng (A) NH2O
. Substrate ‰
ic signatu
‘conventioesized to
mined at th‰ during p ). In the pe
g reaction,ed for nitrifoduced duruence the trations at between 2 (at the sam
ment when 4 B and ance of nssive deple
n contrastnt and onlyfier denitri
o here, the of the -O-
tative appocording to
OH oxidatio
was added
ure of N2O
onal’ nitrif be the dhe onset ofeak and co
eak additio, similar to fier denitrring NO2
- o SP, with ht the begin
2.5 and 5.6 me initial Nn NO2
- conc C, Figure nitrifier de
etion of NHt, during coy decreasedification do
positive SP14N-15N-O-
ortioning o the observon at 1.1 mg
d at time ze
O produce
ication (NHdominant f the experontinuous n experime the valuesification inxidation ex
higher SP nning of th ‰ at ~2 m
NH4+ conce
centrations 5 A and Benitrificatio
H4+ and the
ontinuous d after the ominated N
P can be ex molecule
of AOB nitved SP and tgO2/l and (
ero. The un
ed during
H4+ oxidati
N2O prodriments) ra NH4
+ additents, SP des observed n pure cultxperiments values at he experim
mgO2/l, andntration). Ss peaked a
B). This treon by AO
e accumula NH4
+ addi cessation o
N2O produ
xplained by (similar to
trifier deni the isotopo(B) NH4
+ ox
ncertainty (
NH4+ oxid
on) whereuction patnging fromtion, respe
ecreased to in the NO2
ture (see ses’). O2 and elevated d
ment (Figu was signi
SP was minnd almostend furtheOB with oation of NOition (Figur of NH4
+ addction as de
y the prefero the mec
trification omer mixinxidation (pe
(2σ confide
dation exp
e nitrifier dthway, the
m 0.9 to 5.6ctively (Fig values of
2- oxidation
ection ‘Isot NH4
+ conce dissolved O
re 4 B). Foificantly lownimal towa all the NH
er underscongoing r
O2- (see also
re 5 C anddition (andescribed ab
Ch
rential cleahanism di
(ND) and ng model (eeak additio
ence level) f
periments
denitrificate SP of t6 ‰ and frgure 4 A; F 0.4 to -2.3 n experimetopic signaentrations
O2 and higr examplewer (0.9 ‰
ards the enH4
+ was conores the g
reaction ao Wunderld D), SP wad the putatbove). Our
hapter 4
103
avage of scussed
NH2OH equation n) at 1.9
for SP is
s
ion was he N2O rom -5.8
Figure 5; ‰ with
ents and ature of seemed gh NH4
+ , the SP
‰) at 0.6 d of the nsumed
growing nd the in et al., as quite ive shift SP data
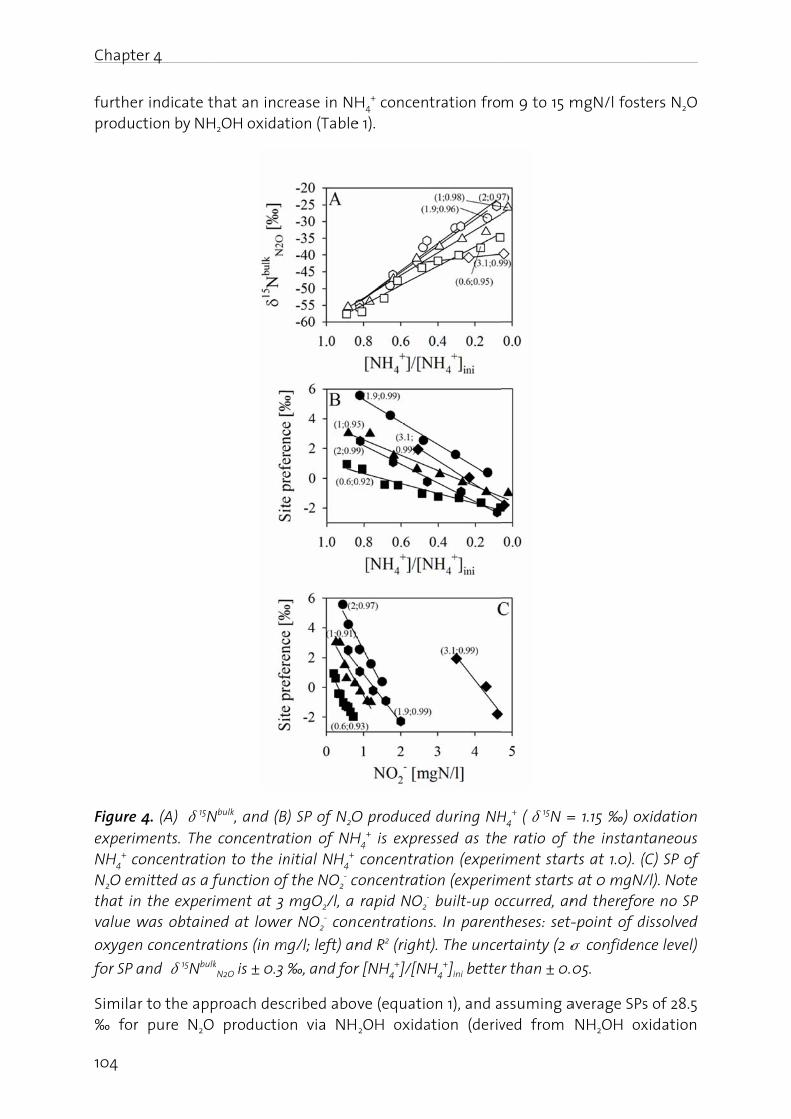
Chapte
104
furtherproduct
Figure 4experimNH4
+ coN2O emthat in value w
oxygen
for SP a
Similar ‰ for
er 4
r indicate ttion by NH
4. (A) δ15Nments. The oncentratio
mitted as a f the experi
was obtaine
concentra
and δ15Nbulk
to the app pure N2O
hat an incrH2OH oxidat
Nbulk, and (B concentraton to the in function ofiment at 3 ed at lowe
tions (in mk
N2O is ± 0.3
proach desc productio
rease in NHtion (Table
B) SP of N2Otion of NHnitial NH4
+ f the NO2
- c mgO2/l, a
er NO2- conc
mg/l; left) an
‰, and for
cribed abovon via NH
H4+ concen
e 1).
O producedH4
+ is expre concentrat
concentrati rapid NO2
-
centrations
nd R2 (right
r [NH4+]/[NH
ve (equatio
2OH oxida
tration fro
d during NHessed as thtion (experon (experim- built-up os. In paren
t). The unce
H4+]ini bette
on 1), and aation (deriv
m 9 to 15 m
H4+ (δ15N =
e ratio of riment starment startsoccurred, antheses: set-
ertainty (2σ
r than ± 0.0
assuming aved from
mgN/l fost
= 1.15 ‰) ox the instanrts at 1.0). (s at 0 mgN/nd therefor-point of d
σ confiden
05.
average SPs NH2OH ox
ters N2O
xidation taneous (C) SP of /l). Note re no SP
dissolved
nce level)
s of 28.5 xidation
Chapter 4
105
experiments) and of -2 ‰ for NO2- reduction (derived from NO2
- oxidation experiments) respectively, the contribution from both pathways can be assessed, even though the marginal contribution from other pathways cannot be completely excluded at this point. Accordingly, a site preference (SPtot) of 0.9 to 5.6 ‰ at the onset of the peak addition experiments indicates a maximum contribution of NH2OH oxidation to the total N2O production of about 25 %. This contribution systematically decreases to less than ~7 % towards the end of the experiments (Figure 3 B). This observation appears to be qualitatively consistent with a recent study by Yu et al. (2010), who speculated that during initial N2O production in a pure N. europaea culture NH2OH oxidation is more important because NH2OH accumulates transiently at high NH4
+ oxidation rates, e.g. under oxic conditions in an ammonia-fed chemostat or at high NH4
+ loads (Chandran et al., 2011). Furthermore, in a nitritation system, the NH4
+ oxidation rate correlated exponentially with the specific N2O production rate, which can be explained by the chemical breakdown of NOH (presumably formed during NH2OH oxidation; Law et al., 2012), and in a pure culture of N. europaea it was shown that increased dissolved oxygen concentrations decreased the relative importance of nitrifier denitrification to NH2OH oxidation (Sutka et al., 2006; Frame and Casciotti 2010). In other mixed culture nitrification experiments, the observed SP values suggest a dominance of nitrifier denitrification (over NH2OH oxidation) with regard to N2O production (Toyoda et al., 2011).
The δ15Nbulk of N2O emitted at the onset of NH4+ oxidation experiments ranged
between -42.3 and -57.6 ‰ (Figure 4 A), which translates into Δδ15N values of 43.5 to
58.8 ‰ (δ15N of NH4HCO3 = 1.15 ‰; Table 1) (again being slightly biased by a potential 15N enrichment prior to the first measurement). Nevertheless, these Δδ15N values are similar to data reported for N2O production via nitrification (50 ‰ by Toyoda et al., 2011; 47 to 68 ‰ by Koba et al., 2009; 56.9 ‰ by Frame and Casciotti 2010; Figure 1). In the
course of our incubation experiments, δ15NbulkN2O values systematically increased to -
25.3 to -39.6 ‰ due to 15N enrichment in the substrate N pool (NH4+ and transformation
products) as result of N isotopic fractionation according to the Rayleigh distillation kinetics during the stepwise oxidation to NO2
- and NO3- (Figure 4 A; SI, Text S2 and S5,
Figure S4 A). In the experiment with 3.1 mgO2/l, the initial δ15NbulkN2O was significantly
higher (-42.3 ‰) than in the other NH4+ oxidation experiments (-54.7 to -57.6 ‰), and
thus the net Δδ15N was significantly lower (43.5 ‰). In addition, NO2- accumulation
was highest in the high-O2 experiment (up to almost 5 mgN/l; Figure 4 C), indicating that the NO2
- oxidation to NO3- was the limiting step. In a mixed population system, the
Δδ15N naturally depends on the importance of each single transformation process. However, there are ambiguities with respect to the relationship between biogeochemical process reaction rate and N isotope fractionation (e.g. Kritee et al., 2012), and the reduction in N isotope fractionation is often linked to low substrate concentrations (e.g. Lehmann et al., 2007; Granger et al., 2008). In the high-O2 experiment (at 3.1 mgO2/l), NO2
- was clearly not limiting N2O production, and hence we assume that it is the high NH4
+ oxidation rate in combination with a comparatively sluggish NO2
- oxidation, which leads to NO2- accumulation and in turn to the partial
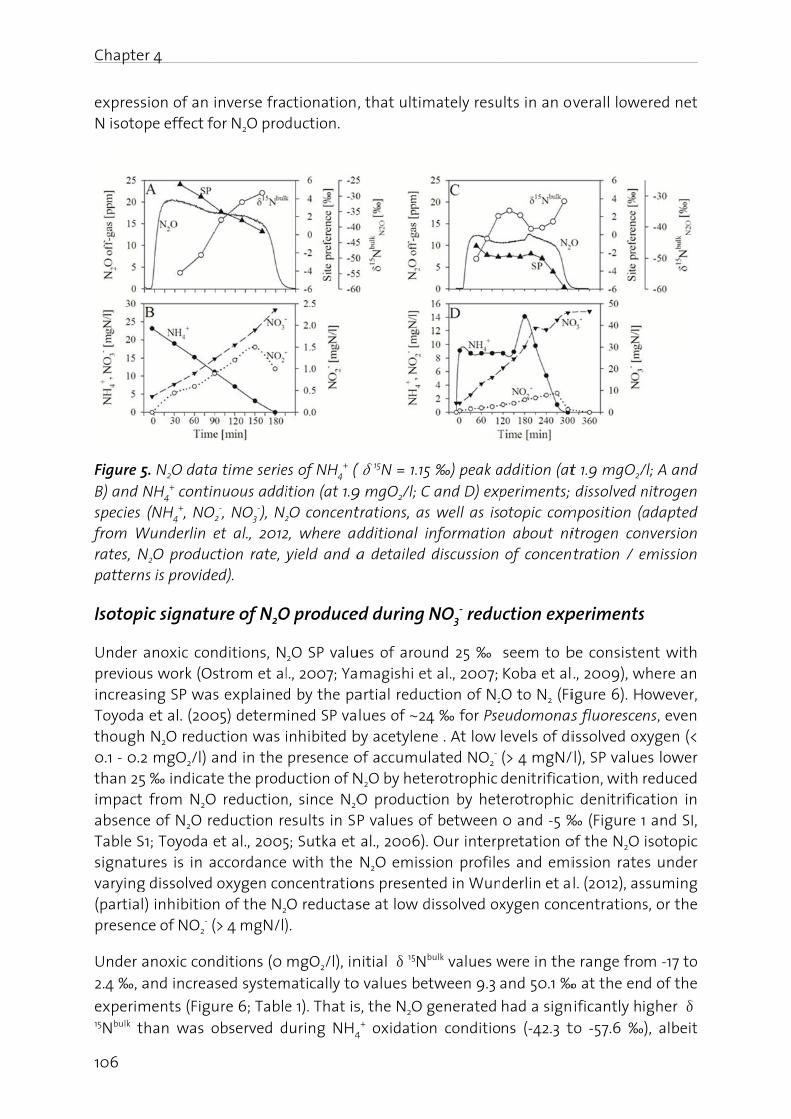
Chapte
106
expressN isoto
Figure 5B) and Nspecies from Wrates, Npattern
Isotop
Under previouincreasToyodathough0.1 - 0.2than 25impact absencTable Ssignatuvarying(partialpresenc
Under a2.4 ‰, a
experim15Nbulk t
er 4
sion of an pe effect fo
5. N2O data NH4
+ contin (NH4
+, NOWunderlin eN2O producns is provide
ic signatu
anoxic conus work (Osing SP was et al. (200
h N2O reduc2 mgO2/l) a5 ‰ indicat from N2Oe of N2O re
S1; Toyoda eures is in ag dissolved
) inhibitionce of NO2
- (
anoxic con and increa
ments (Figuhan was o
inverse fra or N2O prod
a time serienuous addi
2-, NO3
-), N2
et al., 2012ction rate, yed).
ure of N2O
nditions, Nstrom et als explained05) determction was
and in the te the prod
O reductioneduction re
et al., 2005 accordance
oxygen con of the N2
(> 4 mgN/l)
ditions (0 sed system
ure 6; Table observed d
ctionation,duction.
es of NH4+ (
ition (at 1.9
2O concent2, where ad yield and a
O produce
2O SP valul., 2007; Yad by the pained SP va
inhibited b presence ouction of N
n, since N2Oesults in SP5; Sutka et with the ncentratioO reductas).
mgO2/l), inmatically to
e 1). That isduring NH4
, that ultim
(δ15N = 1.159 mgO2/l; Ctrations, asdditional ia detailed
ed during
ues of aroumagishi et
artial reduclues of ~24
by acetylen of accumu N2O by hete
O productP values of al., 2006). N2O emissons presentse at low d
nitial δ15Nb
o values bet
s, the N2O g
4+ oxidatio
mately resu
5 ‰) peak aC and D) exps well as isnformation discussion
NO3- redu
und 25 ‰ t al., 2007; ction of N2
4 ‰ for Psee . At low lated NO2
- erotrophic ion by hetf between Our interp
sion profileted in Wun
dissolved ox
bulk values wtween 9.3
generated n conditio
ults in an o
addition (atperiments; otopic comn about ni of concen
uction exp
seem to b Koba et alO to N2 (Fi
eudomonas levels of di (> 4 mgN/ denitrificaterotrophic
0 and -5 ‰pretation oes and emiderlin et a
xygen conc
were in the and 50.1 ‰
had a signns (-42.3 t
overall lowe
t 1.9 mgO2/ dissolved n
mposition (aitrogen con
ntration / e
periments
be consiste., 2009), wigure 6). Hs fluorescenissolved ox
/l), SP valuetion, with
c denitrifica ‰ (Figure 1 of the N2O
ission ratel. (2012), ascentrations
e range fro‰ at the en
ificantly h to -57.6 ‰
ered net
/l; A and nitrogen adapted nversion emission
s
ent with where an
owever, ns, even xygen (< es lower reduced ation in
1 and SI, isotopic s under
ssuming s, or the
m -17 to d of the
igher δ), albeit
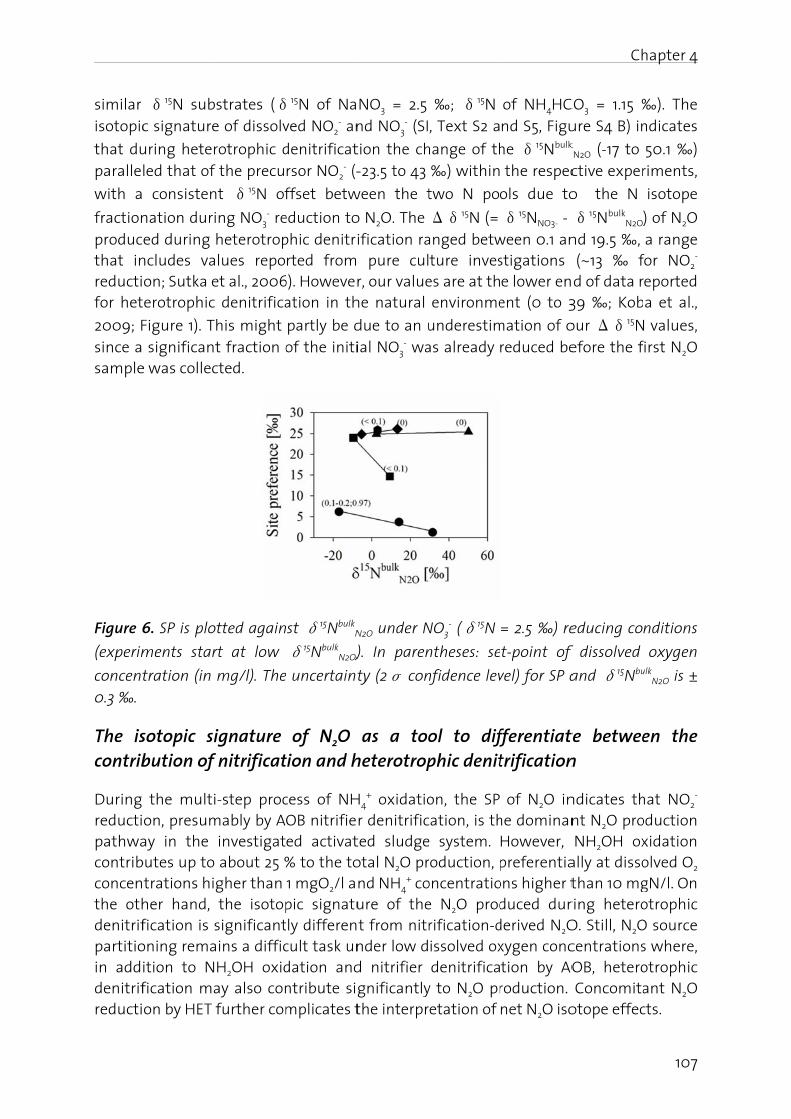
similar isotopic
that duparalle
with a
fractionproducthat inreductifor het
2009; Fsince a sample
Figure 6
(experim
concent0.3 ‰.
The iscontrib
During reductipathwacontribconcenthe othdenitrifpartitioin addidenitrifreducti
δ15N subc signature
uring heterled that of
consisten
nation duried during
ncludes vaon; Sutka eerotrophic
Figure 1). T significan
e was collec
6. SP is plo
ments star
tration (in
sotopic sibution of
the multion, presum
ay in the butes up to
trations hiher hand, fication is oning remaition to Nfication maon by HET
bstrates (δe of dissolv
rotrophic df the precu
nt δ15N of
ing NO3- re
heterotropalues repo et al., 2006c denitrifica
This might t fraction o
cted.
otted again
rt at low
mg/l). The
ignature f nitrificat
i-step procmably by A investigat about 25 %gher than
the isotop significantains a difficH2OH oxiday also con further com
15N of Naved NO2
- an
denitrificatrsor NO2
- (-
ffset betw
eduction tophic denitrirted from
6). Howeveration in th
partly be d of the initi
st δ15NbulkN
δ15NbulkN2O)
e uncertaint
of N2O tion and h
cess of NHOB nitrifieed activat
% to the to 1 mgO2/l apic signatuly differen
cult task undation andntribute sigmplicates t
NO3 = 2.5 nd NO3
- (SI
tion the ch-23.5 to 43
ween the t
o N2O. The ification ra pure culr, our value
he natural
due to an uial NO3
- wa
N2O under N
). In paren
ty (2σ con
as a tooheterotrop
H4+ oxidatio
r denitrificted sludgeotal N2O prnd NH4
+ coure of thet from nitrnder low dd nitrifier gnificantly
the interpr
‰; δ15N , Text S2 a
hange of th ‰) within
two N po
Δδ15N (= anged betwture inves
es are at th environme
underestimas already
NO3- (δ15N
ntheses: se
nfidence lev
ol to diffphic denit
on, the SP cation, is the system. roduction, poncentratioe N2O prodrification-dissolved ox
denitrificay to N2O pretation of
of NH4HCnd S5, Figu
he δ15Nbulk
the respec
ols due to
δ15NNO3- - ween 0.1 anstigations e lower enent (0 to 3
mation of o reduced be
= 2.5 ‰) re
t-point of
vel) for SP a
fferentiattrification
of N2O inhe dominan
However, preferentiaons higher tduced dur
derived N2Oxygen conction by AOroduction. net N2O iso
Ch
CO3 = 1.15 ‰ure S4 B) ink
N2O (-17 to ctive exper
o the N
δ15NbulkN2O)
nd 19.5 ‰, (~13 ‰ f
d of data r 39 ‰; Kob
our Δδ15Nefore the f
educing co
f dissolved
and δ15Nbu
te between
ndicates thnt N2O pro
NH2OH oxally at disso than 10 mgring heteroO. Still, N2OcentrationsOB, hetero Concomitaotope effec
hapter 4
107
‰). The ndicates
50.1 ‰) riments,
isotope
) of N2O a range for NO2
- eported
a et al.,
N values, first N2O
nditions
oxygen ulk
N2O is ±
en the
hat NO2-
oduction xidation olved O2 gN/l. On otrophic
O source s where, otrophic ant N2O cts.
Chapter 4
108
Our results underscore the value, but also the limitations, of N2O isotopomer analysis in investigating the pathways of, and controls on, N2O production and co-occurring N transformations in biological (municipal) wastewater treatment. Especially in combination with parameters commonly reported in wastewater treatment, such as the concentrations of dissolved O2, N species, COD, but also N2O and NO, the isotopic signature of N2O provides additional insight into the pathways directly involved in N2O production. Our data elucidating the N isotope dynamics associated with N2O production in wastewater treatment may be integrated in future numerical models in order to establish a more quantitative framework for predicting and understanding N2O production in biological wastewater treatment plants.
Nomenclature
Isotopomer: Molecules containing the same isotopes but with differing isotope positions; e.g. N2O with 15N in the central (14N-15N-O) or the end (15N-14N-O) position (Müller 1994)
R: Nitrogen isotope ratio, 15N/14N
δ15Ncompound: (Rcompound - Rref) / Rref x 1000, with atmospheric nitrogen as the reference material (ref)
δ15Nα and δ15Nβ: Relative differences of isotope ratios for the inner (α) and the
outer (β) nitrogen atom in the asymmetric N2O molecule
SP: Site preference, the difference between the δ15Nα and δ15Nβ
δ15NbulkN2O: The average between δ15Nα and δ15Nβ in N2O
Δδ15N: The net nitrogen (N) isotope effect, which approximates the apparent fractionation of a multiple step reaction, expressed as
the difference between δ15Nsubstrate and δ15NbulkN2O;
according to Koba et al. (2009) and Sutka et al. (2006).
Acknowledgements
This study was financially supported by the Swiss Federal Office for the Environment (FOEN), the Swiss National Foundation for Scientific Research, the canton of Bern (AWA), the canton of Basel- Landschaft (AIB), the canton of St. Gallen (AFU), the canton of Thurgau (AfU), the canton of Zurich (AWEL), TBF + Partner AG Consulting Engineers, WWTP region Bern, WWTP ProRheno, WWTP REAL Luzern, WWTP Zurich-Werdhölzli, WWTP Worblental, Abwasserverband Altenrhein, Abwasserverband Morgental, Entsorgung St. Gallen, Zentralschweizer Umweltdirektorenkonferenz (ZUDK), Empa
Chapter 4
109
and Eawag. The authors thank Naohiro Yoshida and Sakae Toyoda from the Tokyo Institute of Technology for analysis of the site-specific isotopic composition of our primary N2O calibration gases. Special thanks go also to Carsten Schubert and Gijs Nobbe (Eawag) for the isotopic analysis of the applied substrates, and George F. Wells (Eawag) for helpful discussions during the preparation of the manuscript.
Supporting information available
Additional information about the analysis of the nitrogen isotopic composition of dissolved nitrogen species, the experimental setup for the analysis of N2O isotopic composition, and the time series of NO2
- oxidation and NH2OH oxidation experiments is given in the supporting information. This information is available free of charge via the Internet at http://pubs.acs.org/.
References
Baggs, E. M. (2008). A review of stable isotope techniques for N2O source partitioning in soils: recent progress, remaining challenges and future considerations. Rapid Communications in Mass Spectrometry 22(11), 1664-1672.
Baumann, B., Snozzi, M., VanderMeer, J. R. and Zehnder, A. J. B. (1997). Development of stable denitrifying cultures during repeated aerobic-anaerobic transient periods. Water Research 31(8), 1947-1954.
Brenninkmeijer, C. A. M. and Röckmann, T. (1999). Mass spectrometry of the intramolecular nitrogen isotope distribution of environmental nitrous oxide using fragment-ion analysis. Rapid Communications in Mass Spectrometry 13(20), 2028-2033.
Casciotti, K. L. (2009). Inverse kinetic isotope fractionation during bacterial nitrite oxidation. Geochimica et Cosmochimica Acta 73(7), 2061-2076.
Chandran, K., Stein, L. Y., Klotz, M. G. and Van Loosdrecht, M. C. M. (2011). Nitrous oxide production by lithotrophic ammonia-oxidizing bacteria and implications for engineered nitrogen-removal systems. Biochemical Society Transactions 39(6), 1832-1837.
Colliver, B. B. and Stephenson, T. (2000). Production of nitrogen oxide and dinitrogen oxide by autotrophic nitrifiers. Biotechnology Advances 18(3), 219-232.
Coplen, T. B. (2011). Guidelines and recommended terms for expression of stable-isotope-ratio and gas-ratio measurement results. Rapid Communications in Mass Spectrometry 25, 2538-2560.
Frame, C. H. and Casciotti, K. L. (2010). Biogeochemical controls and isotopic signatures of nitrous oxide production by a marine ammonia-oxidizing bacterium. Biogeosciences 7(9), 2695-2709.
Chapter 4
110
Granger, J., Sigman, D. M., Lehmann, M. F. and Tortell, P. D. (2008). Nitrogen and oxygen isotope fractionation during dissimilatory nitrate reduction by denitrifying bacteria. Limnology and Oceanography 53(6), 2533-2545.
Hendriks, J., Oubrie, A., Castresana, J., Urbani, A., Gemeinhardt, S. and Saraste, M. (2000). Nitric oxide reductases in bacteria. Biochimica et Biophysica Acta - Bioenergetics 1459(2-3), 266-273.
Kampschreur, M. J., Temmink, H., Kleerebezem, R., Jetten, M. S. M. and van Loosdrecht, M. C. M. (2009). Nitrous oxide emission during wastewater treatment. Water Research 43(17), 4093-4103.
Koba, K., Osaka, K., Tobari, Y., Toyoda, S., Ohte, N., Katsuyama, M., Suzuki, N., Itoh, M., Yamagishi, H., Kawasaki, M., Kim, S. J., Yoshida, N. and Nakajima, T. (2009). Biogeochemistry of nitrous oxide in groundwater in a forested ecosystem elucidated by nitrous oxide isotopomer measurements. Geochimica et Cosmochimica Acta 73(11), 3115-3133.
Köster, J. R., Well, R., Tuzson, B., Bol, R., Dittert, K., Giesemann, A., Emmenegger, L., Manninen, A., Cardenas, L. and Mohn, J. (2013). Novel laser spectroscopic technique for continuous analysis of N2O isotopomers - application and intercomparison with isotope ratio mass spectrometry. Rapid Communications in Mass Spectrometry 27, 216-222.
Kritee, K., Sigman, D. M., Granger, J., Ward, B. B., Jayakumar, A. and Deutsch, C. (2012). Reduced isotope fractionation by denitrification under conditions relevant to the ocean. Geochimica Et Cosmochimica Acta 92, 243-259.
Law, Y., Ni, B.-J., Lant, P. and Yuan, Z. (2012). N2O production rate of an enriched ammonia oxidising bateria culture exponentially correlates to its ammonia oxidation rate. Water Research 46(10), 3409-3419.
Lehmann, M. F., Sigman, D. M., McCorkle, D. C., Granger, J., Hoffmann, S., Cane, G. and Brunelle, B. G. (2007). The distribution of nitrate 15N/ 14N in marine sediments and the impact of benthic nitrogen loss on the isotopic composition of oceanic nitrate. Geochimica Et Cosmochimica Acta 71(22), 5384-5404.
Mariotti, A., Germon, J. C., Hubert, P., Kaiser, P., Letolle, R., Tardieux, A. and Tardieux, P. (1981). Experimental determination of nitrogen kinetic isotope fractionation: Some principles; illustration for the denitrification and nitrification processes. Plant and Soil 62(3), 413-430.
Mohn, J., Guggenheim, C., Tuzson, B., Vollmer, M., Toyoda, S., Yoshida, N. and Emmenegger, L. (2010). A liquid-free preconcentration unit for measurements of ambient N2O isotopomers by QCLAS. Atmospheric Measurement Techniques 3, 609-618.
Mohn, J., Tuzson, B., Manninen, A., Yoshida, N., Toyoda, S., Brand, W. A. and Emmenegger, L. (2012). Site selective real-time measurements of ambient N2O
Chapter 4
111
isotopomers by laser spectroscopy. Atmospheric Measurement Techniques 5, 1601-1609.
Mohn, J., Zeeman, M. J., Werner, R. A., Eugster, W. and Emmenegger, L. (2008). Continuous field measurements of �13C-CO2 and trace gases by FTIR spectroscopy. Isotopes in Environmental and Health Studies 44(3), 241-251.
Müller, P. (1994). Glossary of terms used in physical organic chemistry. Pure & Applied Chemistry 66(5), 1077-1184.
Ostrom, N. E., Piit, A., Sutka, R., Ostrom, P. H., Grandy, A. S., Huizinga, K. M. and Robertson, G. P. (2007). Isotopologue effects during N2O reduction in soils and in pure cultures of denitrifiers. Journal of Geophysical Research G: Biogeosciences 112(2), G02005.
Ostrom, N. E., Sutka, R., Ostrom, P. H., Grandy, A. S., Huizinga, K. M., Gandhi, H., von Fischer, J. C. and Robertson, G. P. (2010). Isotopologue data reveal bacterial denitrification as the primary source of N2O during a high flux event following cultivation of a native temperate grassland. Soil Biology and Biochemistry 42(3), 499-506.
Ravishankara, A. R., Daniel, J. S. and Portmann, R. W. (2009). Nitrous oxide (N2O): the dominant ozone-depleting substance emitted in the 21st century. Science 326(5949), 123-125.
S.A. Montzka and S. Reimann (Coordinating Lead Authors), A. Engel, K. Krüger, S. O’Doherty, W.T. Sturges, D. Blake, M. Dorf, P. Fraser, L. Froidevaux, K. Jucks, K. Kreher, M.J. Kurylo, A. Mellouki, J. Miller, O.-J. Nielsen, V.L. Orkin, R.G. Prinn, R. Rhew, M.L. Santee, A. Stohl and Verdonik, D. (2011). Ozone-Depleting Substances (ODSs) and Related Chemicals, Chapter 1 in Scientific Assessment of Ozone Depletion: (2010), Global Ozone Research and Monitoring Project–Report No. 52, 516 pp., World Meteorological Organization, Geneva, Switzerland, 2011.
Santoro, A. E., Buchwald, C., McIlvin, M. R. and Casciotti, K. L. (2011). Isotopic signature of N2O produced by marine ammonia-oxidizing archaea. Science 333(6047), 1282-1285.
Schmidt, H. L., Werner, R. A., Yoshida, N. and Well, R. (2004). Is the isotopic composition of nitrous oxide an indicator for its origin from nitrification or denitrification? A theoretical approach from referred data and microbiological and enzyme kinetic aspects. Rapid Communications in Mass Spectrometry 18(18), 2036-2040.
Schreiber, F., Wunderlin, P., Udert, K. M. and Wells, G. F. (2012). Nitric oxide and nitrous oxide turnover in natural and engineered microbial communities: biological pathways, chemical reactions and novel technologies. Frontiers in Microbiology 3, 10.3389/fmicb.2012.00372.
Stein, L. Y. (2010). Surveying N2O-producing pathways in bacteria. Methods in Enzymology 486(C), 131-152.
Chapter 4
112
Sutka, R. L., Ostrom, N. E., Ostrom, P. H., Breznak, J. A., Gandhi, H., Pitt, A. J. and Li, F. (2006). Distinguishing nitrous oxide production from nitrification and denitrification on the basis of isotopomer abundances. Applied and Environmental Microbiology 72(1), 638-644.
Sutka, R. L., Ostrom, N. E., Ostrom, P. H., Gandhi, H. and Breznak, J. A. (2003). Nitrogen isotopomer site preference of N2O produced by Nitrosomonas europaea and Methylococcus capsulatus Bath. Rapid Communications in Mass Spectrometry 17(7), 738-745.
Sutka, R. L., Ostrom, N. E., Ostrom, P. H., Gandhi, H. and Breznak, J. A. (2004). Erratum: Nitrogen isotopomer site preference of N2O produced by Nitrosomonas europaea and Methylococcus capsulatus Bath. Rapid Communications in Mass Spectrometry 18(12), 1411-1412.
Townsend-Small, A., Pataki, D. E., Czimczik, C. I. and Tyler, S. C. (2011). Nitrous oxide emissions and isotopic composition in urban and agricultural systems in southern California. Journal of Geophysical Research G: Biogeosciences 116(1).
Toyoda, S., Iwai, H., Koba, K. and Yoshida, N. (2009). Isotopomeric analysis of N2O dissolved in a river in the Tokyo metropolitan area. Rapid Communications in Mass Spectrometry 23(6), 809-821.
Toyoda, S., Mutobe, H., Yamagishi, H., Yoshida, N. and Tanji, Y. (2005). Fractionation of N2O isotopomers during production by denitrifier. Soil Biology & Biochemistry 37(8), 1535-1545.
Toyoda, S., Suzuki, Y., Hattori, S., Yamada, K., Fujii, A., Yoshida, N., Kouno, R., Murayama, K. and Shiomi, H. (2011). Isotopomer analysis of production and consumption mechanisms of N2O and CH4 in an advanced wastewater treatment system. Environmental Science & Technology 45(3), 917-922.
Toyoda, S. and Yoshida, N. (1999). Determination of nitrogen isotopomers of nitrous oxide on a modified isotope ratio mass spectrometer. Analytical Chemistry 71(20), 4711-4718.
Upadhyay, A. K., Hooper, A. B. and Hendrich, M. P. (2006). NO reductase activity of the tetraheme cytochrome c554 of Nitrosomonas europaea. Journal of the American Chemical Society 128(13), 4330-4337.
USEPA (2009). Inventory of U.S. Greenhouse Gas Emissions And Sinks: 1990-2007, U.S. Environmental Protection Agency, Washington DC, Report No. EPA 430-R09-004.
Waechter, H., Mohn, J., Tuzson, B., Emmenegger, L. and Sigrist, M. W. (2008). Determination of N2O isotopomers with quantum cascade laser based absorption spectroscopy. Optics Express 16(12), 9239-9244.
Chapter 4
113
Westley, M. B., Yamagishi, H., Popp, B. N. and Yoshida, N. (2006). Nitrous oxide cycling in the Black Sea inferred from stable isotope and isotopomer distributions. Deep-Sea Research Part II: Topical Studies in Oceanography 53(17-19), 1802-1816.
Wunderlin, P., Mohn, J., Joss, A., Emmenegger, L. and Siegrist, H. (2012). Mechanisms of N2O production in biological wastewater treatment under nitrifying and denitrifying conditions. Water Research 46(4), 1027-1037.
Yamagishi, H., Westley, M. B., Popp, B. N., Toyoda, S., Yoshida, N., Watanabe, S., Koba, K. and Yamanaka, Y. (2007). Role of nitrification and denitrification on the nitrous oxide cycle in the eastern tropical North Pacific and Gulf of California. Journal of Geophysical Research-Biogeosciences 112, G02015.
Yoshida, N. (1988). 15N-depleted N2O as a product of nitrification. Nature 335(6190), 528-529.
Yu, R., Kampschreur, M. J., Loosdrecht, M. C. M. v. and Chandran, K. (2010). Mechanisms and specific directionality of autotrophic nitrous oxide and nitric oxide generation during transient anoxia. Environmental Science & Technology 44(4), 1313-1319.

Supporting Information for Chapter 4
Isotope signatures of N2O in a mixed microbial population system: Constraints on N2O
producing pathways in wastewater treatment
This chapter has been published as:
Wunderlin, P.; Lehmann, M. F.; Siegrist, H.; Tuzson, B.; Joss, A.; Emmenegger, L.; Mohn, J. Isotope signatures of N2O in a mixed microbial population system: Constraints on N2O producing pathways in wastewater treatment. Environmental Science and Technology,
2013, 47 (3), 1339-1348.
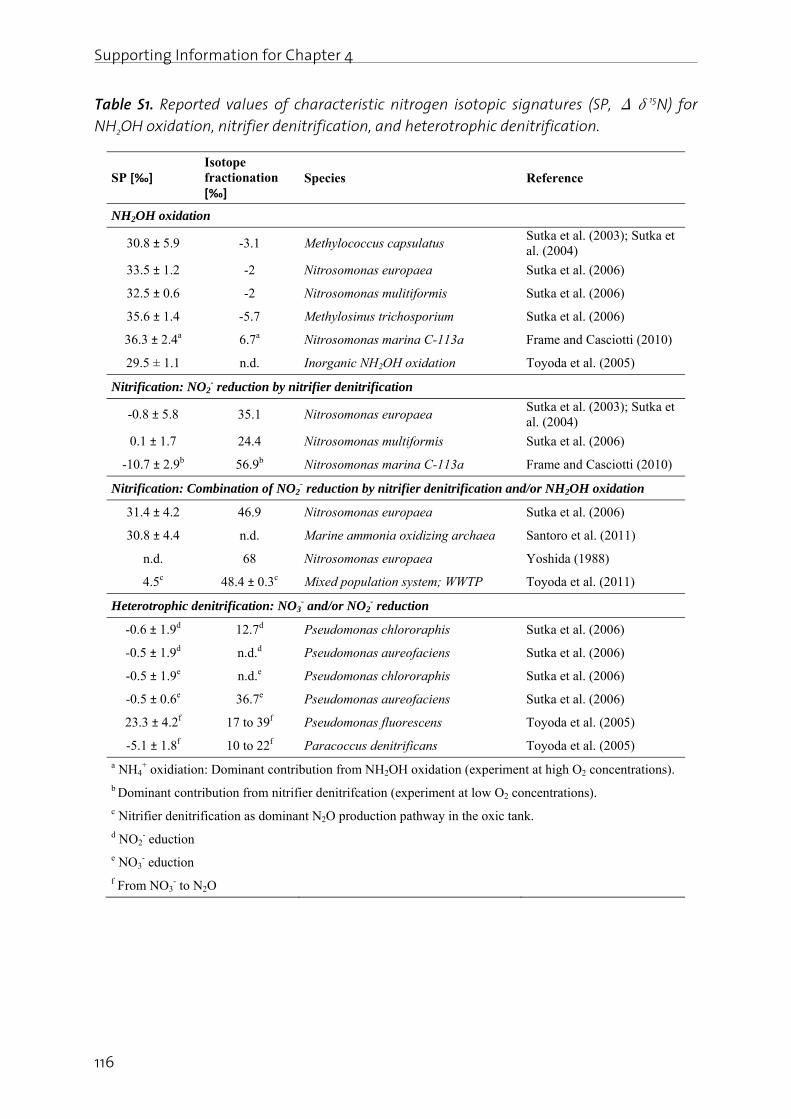
Supporting Information for Chapter 4
116
Table S1. Reported values of characteristic nitrogen isotopic signatures (SP, Δδ15N) for NH2OH oxidation, nitrifier denitrification, and heterotrophic denitrification.
SP [‰] Isotope fractionation [‰]
Species Reference
NH2OH oxidation
30.8 ± 5.9 -3.1 Methylococcus capsulatus Sutka et al. (2003); Sutka et al. (2004)
33.5 ± 1.2 -2 Nitrosomonas europaea Sutka et al. (2006)
32.5 ± 0.6 -2 Nitrosomonas mulitiformis Sutka et al. (2006)
35.6 ± 1.4 -5.7 Methylosinus trichosporium Sutka et al. (2006)
36.3 ± 2.4a 6.7a Nitrosomonas marina C-113a Frame and Casciotti (2010)
29.5 ± 1.1 n.d. Inorganic NH2OH oxidation Toyoda et al. (2005)
Nitrification: NO2- reduction by nitrifier denitrification
-0.8 ± 5.8 35.1 Nitrosomonas europaea Sutka et al. (2003); Sutka et al. (2004)
0.1 ± 1.7 24.4 Nitrosomonas multiformis Sutka et al. (2006)
-10.7 ± 2.9b 56.9b Nitrosomonas marina C-113a Frame and Casciotti (2010)
Nitrification: Combination of NO2- reduction by nitrifier denitrification and/or NH2OH oxidation
31.4 ± 4.2 46.9 Nitrosomonas europaea Sutka et al. (2006)
30.8 ± 4.4 n.d. Marine ammonia oxidizing archaea Santoro et al. (2011)
n.d. 68 Nitrosomonas europaea Yoshida (1988)
4.5c 48.4 ± 0.3c Mixed population system; WWTP Toyoda et al. (2011)
Heterotrophic denitrification: NO3- and/or NO2
- reduction
-0.6 ± 1.9d 12.7d Pseudomonas chlororaphis Sutka et al. (2006)
-0.5 ± 1.9d n.d.d Pseudomonas aureofaciens Sutka et al. (2006)
-0.5 ± 1.9e n.d.e Pseudomonas chlororaphis Sutka et al. (2006)
-0.5 ± 0.6e 36.7e Pseudomonas aureofaciens Sutka et al. (2006)
23.3 ± 4.2f 17 to 39f Pseudomonas fluorescens Toyoda et al. (2005)
-5.1 ± 1.8f 10 to 22f Paracoccus denitrificans Toyoda et al. (2005) a NH4
+ oxidiation: Dominant contribution from NH2OH oxidation (experiment at high O2 concentrations). b Dominant contribution from nitrifier denitrifcation (experiment at low O2 concentrations). c Nitrifier denitrification as dominant N2O production pathway in the oxic tank. d NO2
- eduction e NO3
- eduction f From NO3
- to N2O
Supporting Information for Chapter 4
117
Text S1. Characterization of the activated sludge and the pilot-scale treatment plant
Batch experiments were carried out with activated sludge taken from the nitrification reactor before the daily NH4
+ peak load (before 8 a.m.) of the pilot scale facility at Eawag treating municipal wastewater. The plant consists of a primary clarification unit followed by activated sludge treatment (pre-denitrification, nitrification) and secondary clarification (sludge recirculation was twice the influent flow). It was operated with a solids retention time of ~20 - 22 days (10 - 11 days aerobic) and total suspended solid (TSS) concentrations between 4 and 4.4 g/l. Nitrification was complete, with average total nitrogen removal above 60%. The nitrification reactor is operated at dissolved oxygen concentrations in the range from 0.5 to 2 mgO2/l. Therefore, batch-scale experiments were carried out at dissolved oxygen concentrations in a similar range (0.5 to 3 mgO2/l). The dissolved nitrogen species in the activated sludge tanks were usually below 10 mgN/l.
Text S2. Analytical details of the nitrogen isotopic composition of substrates and dissolved nitrogen species
For measuring δ15N, aliquots of the samples (NH4HCO3, NaNO2, NH2OH-HCl and NaNO3) were weighed into tin capsules (Säntis). Samples were combusted at 1020 °C with excess oxygen in an elemental analyzer (Thermo quest, CE instruments) and the resulting combustion gases passed through a reduction furnace at 650 °C. After removal of water with magnesium perchlorate and purification in a gas chromatographic column, N2 was measured on-line with an isotope-ratio mass-spectrometer (IRMS; Micromass). Nitrogen isotope ratios are reported in the conventional delta notation with respect to atmospheric N2 (AIR). The analytical
reproducibility is ± 0.2 ‰ for δ15N.
In selected experiments, the isotope signature of dissolved NOx (= NO3- + NO2
-) and NO3-
was measured: (i) in the ammonia oxidation experiment at 2.1 mgO2/l with an initial ammonia concentration of ~25 mgN/l, and (ii) in the denitrification experiment under anoxic conditions with an initial nitrate concentration of ~20 mgN/l (Figure S3 and S4).
Nitrogen (N) isotope ratio measurements of naturally occurring NOx (= NO2- + NO3
-) were performed using the denitrifier method (Sigman et al., 2001; Casciotti et al., 2002). Briefly, sample NOx or NO3
- (after nitrite removal from the sample) is quantitatively converted to N2O by cultured denitrifying bacteria. The N2O was automatically extracted, purified and analyzed on-line using a gas-bench preparation system coupled to a continuous flow isotope-ratio mass-spectrometer (CF-IRMS; Thermo Finnigan DeltaPlus XP). The general target sample size was 50 nmol N. Pseudomonas chlororaphis (ATCC #13985; formerly Pseudomonas aureofaciens) were used for the NOx conversion. Data were corrected for the procedural blank contribution, which was always less than 1% of the sample size. N isotope ratios are reported in the conventional
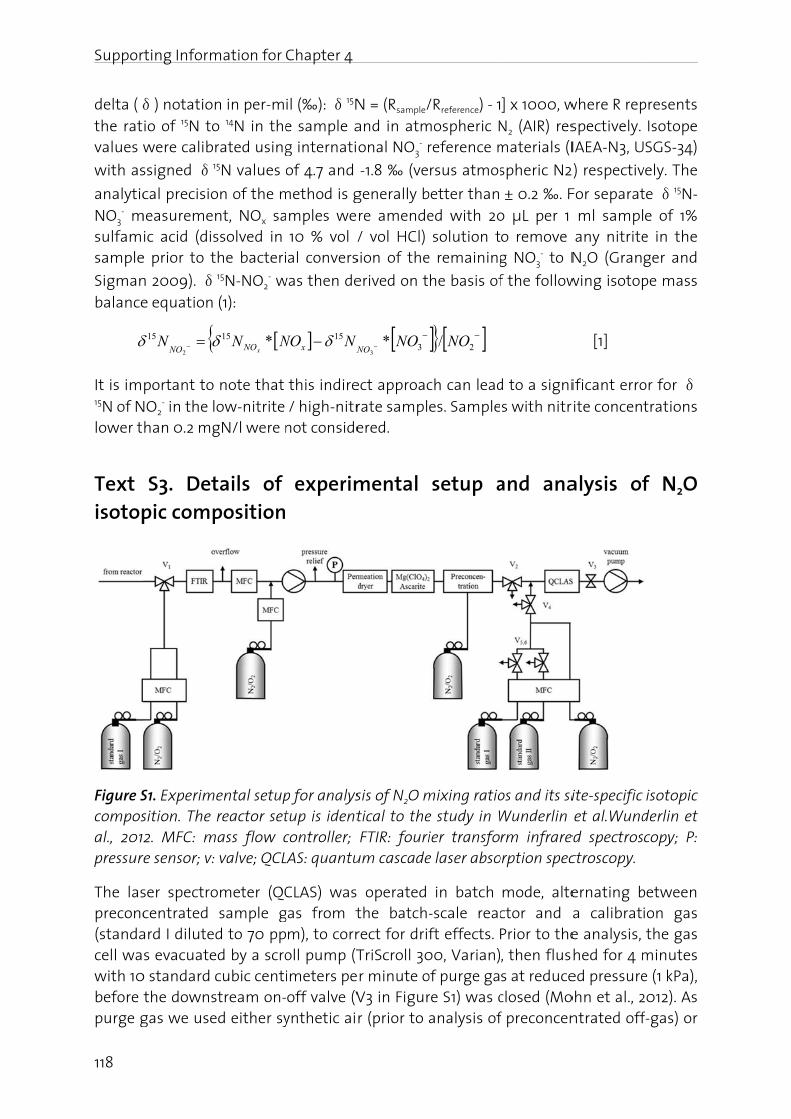
Suppor
118
delta (δthe ratvalues w
with as
analyticNO3
- msulfamsample
Sigmanbalance
It is im15N of Nlower t
Text isotop
Figure Scomposal., 201pressur
The laspreconc(standacell wawith 10before purge g
rting Inform
δ) notatioio of 15N to
were calib
ssigned δ1
cal precisiomeasureme
ic acid (dise prior to t
n 2009). δe equation
15
2N
NO
portant to NO2
- in the l han 0.2 mg
S3. Detpic comp
S1. Experimsition. The 2. MFC: m
re sensor; v:
ser spectrocentrated
ard I dilutes evacuate
0 standard the downs
gas we use
mation for
n in per-mo 14N in therated using15N values
on of the mnt, NOx sassolved in
the bacteri15N-NO2
- w (1):
15 * NNNOx
note that ow-nitrite gN/l were n
tails of position
mental setup reactor set
mass flow c valve; QCL
ometer (QC sample gd to 70 pp
ed by a scro cubic centstream on-ed either sy
Chapter 4
il (‰): δ15Ne sample ag internati
of 4.7 and
method is gamples we 10 % vol /al convers
was then de
15NNONx
this indire / high-nitr
not conside
experim
p for analystup is identcontroller; LAS: quantu
CLAS) was gas from t
m), to corroll pump (Timeters peoff valve (V
ynthetic ai
N = (Rsample/ and in atm
onal NO3- r
-1.8 ‰ (ve
generally bre amende
/ vol HCl) sion of the
erived on t
3*
3NO
NO
ect approacrate samplered.
mental
sis of N2O mtical to the
FTIR: fourium cascade
operated the batch-
rect for drif TriScroll 30
r minute o V3 in Figur
r (prior to
/Rreference) - 1mospheric N
reference m
rsus atmos
better thaned with 20 solution t
e remaining
he basis of
2/ NO
ch can leades. Sample
setup a
mixing ratioe study in Wier transfoe laser abso
in batch -scale reacft effects.
00, Varian) of purge gare S1) was c analysis of
] x 1000, w N2 (AIR) res materials (I
spheric N2
± 0.2 ‰. F0 μL per 1 o remove g NO3
- to N
f the follow
d to a signis with nitr
and ana
os and its siWunderlin rm infrare
orption spec
mode, altector and
Prior to the, then fluss at reduce
closed (Mof preconcen
where R repspectively.
IAEA-N3, U
2) respectiv
For separat ml sampl any nitrite
N2O (Gran
wing isotop
[1]
ificant errorite concent
alysis of
ite-specific et al.Wunded spectrosctroscopy.
ernating b a calibrat
e analysis, hed for 4 m
ed pressureohn et al., 2ntrated off
presents Isotope SGS-34)
vely. The
te δ15N-e of 1%
e in the ger and
pe mass
or for δtrations
f N2O
isotopic derlin et copy; P:
between ion gas the gas
minutes e (1 kPa),
2012). As f-gas) or
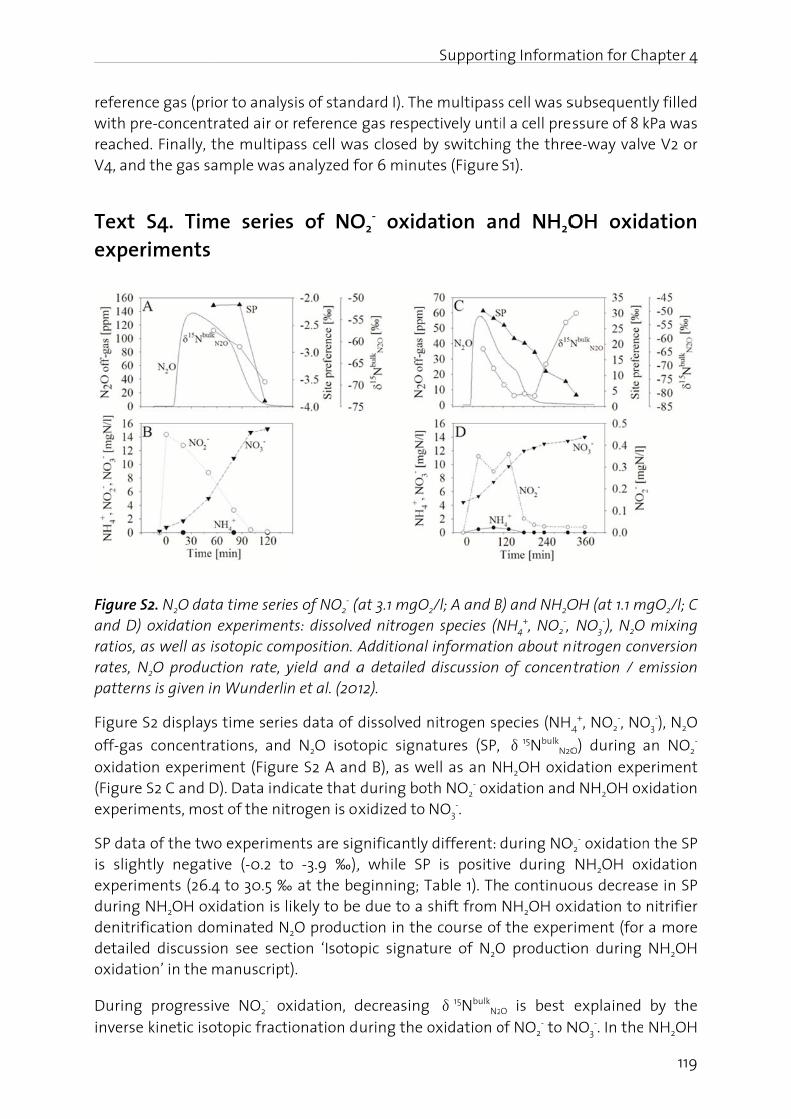
referenwith prreachedV4, and
Text exper
Figure Sand D) ratios, arates, Npattern
Figure
off-gasoxidatio(Figure experim
SP datais slighexperimduring denitrifdetailedoxidatio
During inverse
nce gas (prire-concentrd. Finally, t
d the gas sa
S4. Timriments
S2. N2O dat oxidation
as well as isN2O producns is given in
S2 displays
concentraon experim S2 C and D
ments, mos
a of the twohtly negatiments (26.4 NH2OH oxfication dod discussioon’ in the m
progressie kinetic iso
or to analyrated air or
the multipample was
me serie
ta time seri experimensotopic com
ction rate, yn Wunderli
s time serie
ations, andment (Figu
D). Data indst of the nit
o experimeive (-0.2 to4 to 30.5 ‰
xidation is minated N
on see sec manuscript
ve NO2- ox
otopic fract
ysis of standr referenceass cell wa analyzed f
s of NO
es of NO2- (
nts: dissolvemposition. A yield and ain et al. (20
es data of
d N2O isotre S2 A an
dicate that trogen is o
ents are sigo -3.9 ‰),
‰ at the be likely to beN2O producction ‘Isotot).
xidation, dtionation d
dard I). The gas respec
as closed b for 6 minut
O2- oxida
(at 3.1 mgO2
ed nitrogen Additional a detailed 12).
dissolved n
topic signad B), as we during botxidized to
gnificantly , while SPeginning; Te due to a sction in theopic signat
decreasing uring the o
Supportin
e multipassctively unti
by switchintes (Figure
ation an
2/l; A and Bn species (N informatio discussion
nitrogen sp
atures (SP, ell as an Nth NO2
- oxi NO3
-.
different: P is positiv Table 1). Th shift from e course ofure of N2O
δ15NbulkN2
oxidation o
ng Informa
s cell was sil a cell pre
ng the thre S1).
nd NH2O
B) and NH2ONH4
+, NO2-,
on about n of concen
pecies (NH4
δ15NbulkN2O
NH2OH oxiddation and
during NOve during e continuo
NH2OH oxf the experO productio
O is best of NO2
- to N
ation for Ch
subsequentssure of 8
ee-way valv
OH oxid
OH (at 1.1 m NO3
-), N2Oitrogen con
ntration / e
4+, NO2
-, NO
O) during dation expd NH2OH ox
O2- oxidation
NH2OH oxous decreaxidation to riment (foron during
explained NO3
-. In the
hapter 4
119
tly filled kPa was ve V2 or
dation
mgO2/l; C O mixing nversion emission
O3-), N2O
an NO2-
eriment xidation
n the SP xidation se in SP nitrifier a more NH2OH
by the NH2OH
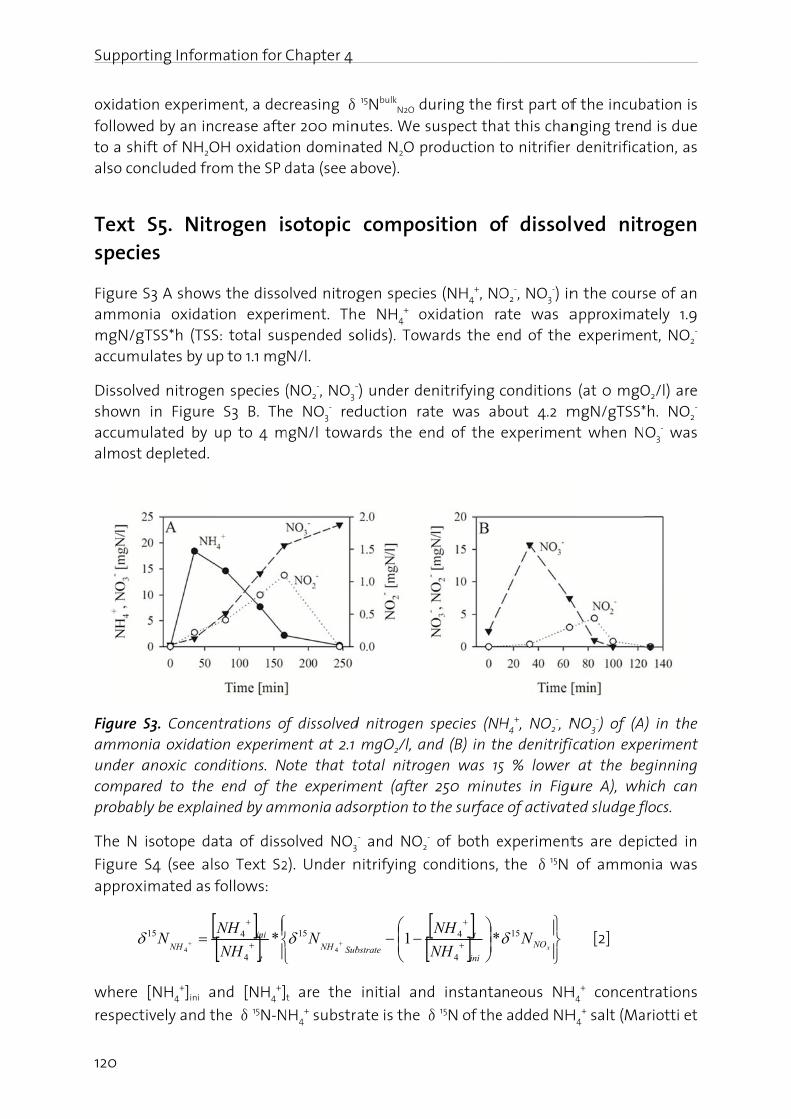
Suppor
120
oxidatiofolloweto a shalso con
Text specie
Figure ammonmgN/gaccumu
Dissolvshown accumualmost
Figure ammonunder acomparprobab
The N
Figure approx
where
respect
rting Inform
on experimed by an inift of NH2Oncluded fro
S5. Nites
S3 A shownia oxidat
gTSS*h (TSSulates by u
ved nitroge in Figureulated by depleted.
S3. Concennia oxidatioanoxic conred to the ly be explai
isotope da
S4 (see alimated as
NH
N15
4
[NH4+]ini a
tively and t
mation for
ment, a deccrease afte
OH oxidatioom the SP d
rogen is
s the dissoion exper
S: total susp to 1.1 mg
en species S3 B. Th
up to 4 m
ntrations ofon experim
nditions. N end of thined by am
ata of diss
so Text S2 follows:
t
ini
NH
NH
4
4 *
and [NH4+]
the δ15N-N
Chapter 4
creasing δer 200 minon domina data (see a
sotopic
olved nitrogiment. Thspended soN/l.
(NO2-, NO3
-
e NO3- red
mgN/l towa
f dissolvedment at 2.1
ote that the experim
mmonia ads
olved NO3
2). Under n
SubNHN15
4
t are the
NH4+ substra
15NbulkN2O d
nutes. We sated N2O p
bove).
compos
gen speciee NH4
+ oxolids). Tow
-) under deduction raards the en
d nitrogen mgO2/l, antotal nitrog
ment (after sorption to
- and NO2-
nitrifying c
bstrate1
initial and
ate is the δ
uring the f suspect tha
roduction t
sition o
es (NH4+, NO
xidation rwards the e
enitrifying te was abnd of the
species (NHnd (B) in thgen was 15 250 minu the surface
- of both e
conditions,
ini
t
NH
NH
4
4 *
d instanta
δ15N of the
first part ofat this chan to nitrifier
f dissol
O2-, NO3
-) inate was a
end of the
conditions bout 4.2 m experimen
H4+, NO2
-, Nhe denitrifi5 % lower
utes in Figue of activate
experiment
the δ15N
xNON15
neous NH
e added NH
f the incubnging tren denitrifica
ved nit
n the coursapproxima experime
(at 0 mgOmgN/gTSS*nt when N
NO3-) of (A
ication exp at the beure A), wh
ted sludge f
ts are dep
of ammo
[2]
H4+ concent
H4+ salt (Ma
bation is d is due
ation, as
rogen
se of an tely 1.9 nt, NO2
-
O2/l) are *h. NO2
- O3
- was
) in the periment eginning hich can flocs.
icted in
nia was
trations
ariotti et
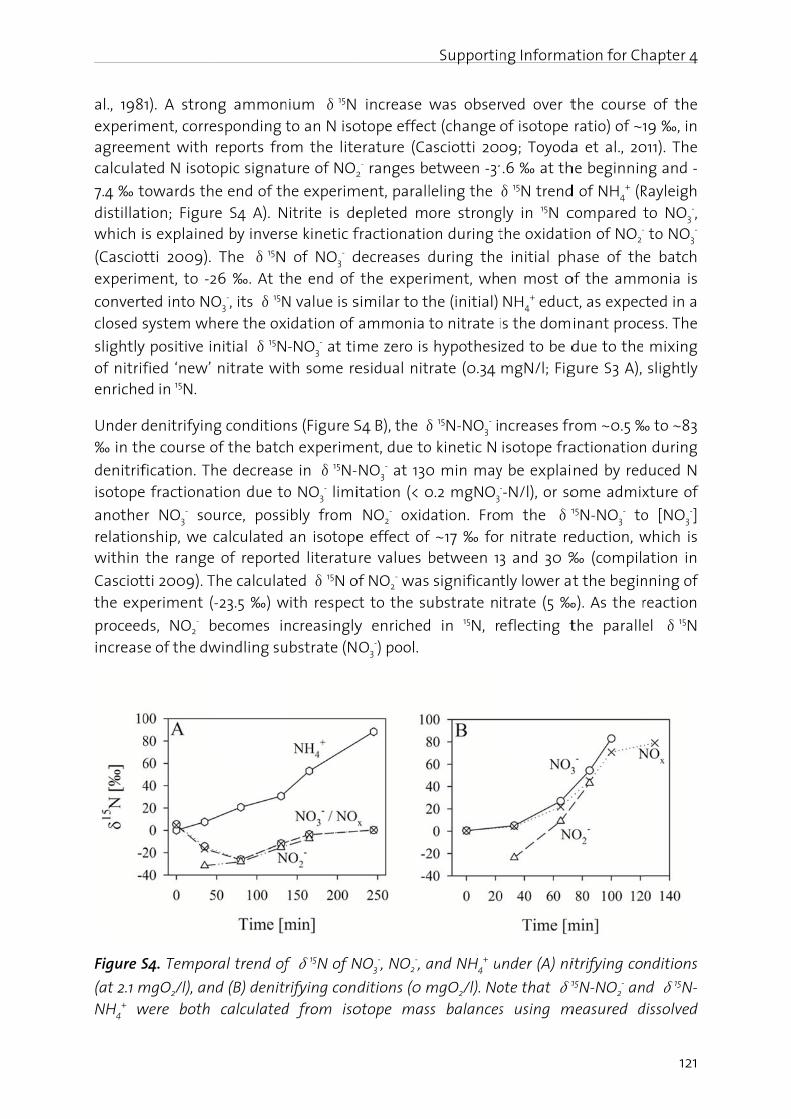
al., 198experimagreemcalculat
7.4 ‰ tdistillatwhich i
(Cascioexperim
convertclosed s
slightlyof nitrifenriche
Under d‰ in th
denitrifisotope
anotherelationwithin
Casciotthe exp
proceedincreas
Figure S
(at 2.1 mNH4
+ w
1). A stronment, corre
ment with ted N isoto
towards thtion; Figur
is explaine
tti 2009). ment, to -2
ted into NO system wh
y positive infied ‘new’
ed in 15N.
denitrifyinghe course o
fication. The fractionat
r NO3- sou
nship, we c the range
tti 2009). Tperiment (-
ds, NO2- b
e of the dw
S4. Tempor
mgO2/l), anwere both
ng ammonesponding t reports froopic signat
e end of the S4 A). Nd by invers
The δ15N26 ‰. At t
O3-, its δ15N
here the ox
nitial δ15N nitrate wit
g condition of the batc
he decreastion due to
urce, poss calculated
of reporte
The calculat-23.5 ‰) w
becomes inwindling su
ral trend of
d (B) denitr calculated
nium δ15N to an N isoom the liteture of NO2
he experimNitrite is dese kinetic f
of NO3- d
he end of
N value is sidation of
-NO3- at ti
th some re
ns (Figure Sh experime
e in δ15N-o NO3
- limi
ibly from an isotopeed literatu
ted δ15N owith respec
ncreasinglyubstrate (N
f δ15N of N
rifying condd from iso
increase otope effecerature (Ca
2- ranges b
ment, parallepleted m
fractionatio
decreases d the exper
similar to t ammonia
me zero is esidual nit
S4 B), the δent, due to
NO3- at 130
itation (< 0
NO2- oxid
e effect ofre values
of NO2- was
ct to the su
y enrichedO3
-) pool.
NO3-, NO2
-, a
ditions (0 motope mas
Supportin
was obserct (change asciotti 200etween -31
leling the ore strongon during t
during theiment, wh
he (initial) to nitrate i
hypothesirate (0.34
δ15N-NO3- i
o kinetic N
0 min may 0.2 mgNO3
-
ation. Frof ~17 ‰ for between 13
significantubstrate ni
d in 15N, r
and NH4+ u
mgO2/l). Noss balances
ng Informa
rved over t of isotope 09; Toyoda.6 ‰ at th
δ15N trendgly in 15N c the oxidati
e initial phen most o
NH4+ educ
is the dom
zed to be d mgN/l; Fig
ncreases fr isotope fra
y be explai--N/l), or so
m the δ1
r nitrate re3 and 30 ‰
tly lower atitrate (5 ‰
eflecting t
nder (A) ni
ote that δ1
s using m
ation for Ch
the course ratio) of ~1a et al., 20
he beginnin
d of NH4+ (R
compared ion of NO2
-
hase of thof the amm
ct, as expecinant proc
due to thegure S3 A),
rom ~0.5 ‰actionation
ned by redome admix15N-NO3
- toeduction, w
‰ (compila
t the begin‰). As the r
the paralle
itrifying co15N-NO2
- anmeasured d
hapter 4
121
e of the 19 ‰, in
011). The ng and -
Rayleigh to NO3
-, - to NO3
-
e batch monia is
cted in a ess. The
mixing slightly
‰ to ~83 n during
duced N xture of
o [NO3-]
which is ation in
nning of reaction
el δ15N
nditions
nd δ15N-dissolved
Supporting Information for Chapter 4
122
inorganic nitrogen (DIN) concentrations, and δ15N-NOx, δ15N-NO3
-, as well as the δ15N-NH4-substrate measurements (see Equations 1 and 2).
REFERENCES
Casciotti, K. L. (2009). Inverse kinetic isotope fractionation during bacterial nitrite oxidation. Geochimica et Cosmochimica Acta 73(7), 2061-2076.
Casciotti, K. L., Sigman, D. M., Hastings, M. G., Böhlke, J. K. and Hilkert, A. (2002). Measurement of the oxygen isotopic composition of nitrate in seawater and freshwater using the denitrifier method. Analytical Chemistry 74(19), 4905-4912.
Frame, C. H. and Casciotti, K. L. (2010). Biogeochemical controls and isotopic signatures of nitrous oxide production by a marine ammonia-oxidizing bacterium. Biogeosciences 7(9), 2695-2709.
Granger, J. and Sigman, D. M. (2009). Removal of nitrite with sulfamic acid for nitrate N and O isotope analysis with the denitrifier method. Rapid Communications in Mass Spectrometry 23(23), 3753-3762.
Mariotti, A., Germon, J. C., Hubert, P., Kaiser, P., Letolle, R., Tardieux, A. and Tardieux, P. (1981). Experimental determination of nitrogen kinetic isotope fractionation: Some principles; illustration for the denitrification and nitrification processes. Plant and Soil 62(3), 413-430.
Mohn, J., Tuzson, B., Manninen, A., Yoshida, N., Toyoda, S., Brand, W. A. and Emmenegger, L. (2012). Site selective real-time measurements of ambient N2O isotopomers by laser spectroscopy. Atmospheric Measurement Techniques Discussions 5, 813-838.
Santoro, A. E., Buchwald, C., McIlvin, M. R. and Casciotti, K. L. (2011). Isotopic signature of N2O produced by marine ammonia-oxidizing archaea. Science 333(6047), 1282-1285.
Sigman, D. M., Casciotti, K. L., Andreani, M., Barford, C., Galanter, M. and Böhlke, J. K. (2001). A bacterial method for the nitrogen isotopic analysis of nitrate in seawater and freshwater. Analytical Chemistry 73(17), 4145-4153.
Sutka, R. L., Ostrom, N. E., Ostrom, P. H., Breznak, J. A., Gandhi, H., Pitt, A. J. and Li, F. (2006). Distinguishing nitrous oxide production from nitrification and denitrification on the basis of isotopomer abundances. Applied and Environmental Microbiology 72(1), 638-644.
Sutka, R. L., Ostrom, N. E., Ostrom, P. H., Gandhi, H. and Breznak, J. A. (2003). Nitrogen isotopomer site preference of N2O produced by Nitrosomonas europaea and Methylococcus capsulatus Bath. Rapid Communications in Mass Spectrometry 17(7), 738-745.
Supporting Information for Chapter 4
123
Sutka, R. L., Ostrom, N. E., Ostrom, P. H., Gandhi, H. and Breznak, J. A. (2004). Erratum: Nitrogen isotopomer site preference of N2O produced by Nitrosomonas europaea and Methylococcus capsulatus Bath. Rapid Communications in Mass Spectrometry 18(12), 1411-1412.
Toyoda, S., Mutobe, H., Yamagishi, H., Yoshida, N. and Tanji, Y. (2005). Fractionation of N2O isotopomers during production by denitrifier. Soil Biology & Biochemistry 37(8), 1535-1545.
Toyoda, S., Suzuki, Y., Hattori, S., Yamada, K., Fujii, A., Yoshida, N., Kouno, R., Murayama, K. and Shiomi, H. (2011). Isotopomer analysis of production and consumption mechanisms of N2O and CH4 in an advanced wastewater treatment system. Environmental Science & Technology 45(3), 917-922.
Wunderlin, P., Mohn, J., Joss, A., Emmenegger, L. and Siegrist, H. (2012). Mechanisms of N2O production in biological wastewater treatment under nitrifying and denitrifying conditions. Water Research 46(4), 1027-1037.
Yoshida, N. (1988). 15N-depleted N2O as a product of nitrification. Nature 335(6190), 528-529.

Chapter 5
Pathway identification of N2O production in biological wastewater treatment: Is the
nitrogen isotopic signature a suitable tool?
This chapter has been submitted for publication
Wunderlin, P.; Siegrist, H.; Joss, A.; Emmenegger, L.; Mohn, J.
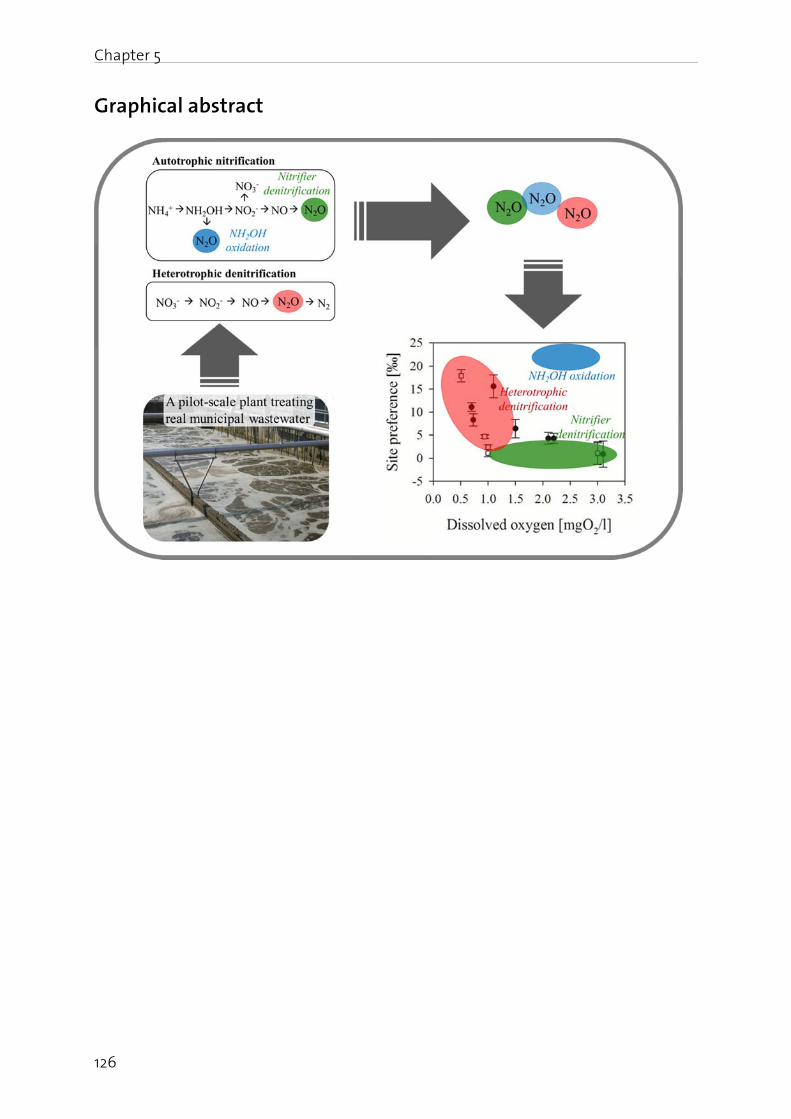
Chapte
126
Graph
er 5
hical absstract
Chapter 5
127
Abstract
Nitrous oxide (N2O) is an important greenhouse gas and a major sink of stratospheric ozone. Microbial transformation processes, particularly autotrophic nitrification and heterotrophic denitrification, have been identified as major N2O sources in biological wastewater treatment. The 15N isotopic signature of N2O is a novel and powerful technique to differentiate between these pathways: it is based on the site-specific
distribution of 15N (site preference, SP) as well as the average 15N content (δ15NbulkN2O) of
the asymmetric N2O molecule.
In the present study, we investigate the applicability of N2O isotopomer analysis to source allocation in a pilot-scale biological wastewater treatment plant. The 15N isotopic signature was analyzed with respect to the dissolved oxygen concentration in the activated sludge tank, which is one of the most important controlling parameters for autotrophic nitrification and heterotrophic denitrification. Results show that under aerated conditions with 2 to 3 mgO2/l, N2O is produced from nitrite (NO2
-) reduction by nitrifier denitrification (SP close to 0 ‰) or heterotrophic denitrification (SP close to 0 ‰, without N2O reduction). Hydroxylamine (NH2OH) oxidation cannot be excluded, but the SP data suggests that the contribution from this pathway is low. With decreasing dissolved oxygen (below 1 mgO2/l), however, the increase in SP is most probably caused
by heterotrophic denitrification due to N2O reduction. On the other hand, δ15NbulkN2O
supports the findings from the SP analysis, but cannot be used as a quantitative measure in this study, since the isotopic composition of the substrates is unknown. In sum, this study illustrates the value of the 15N isotopic signature of N2O as a promising tool to further investigate N2O production pathways in biological wastewater treatment.
Keywords
Biological wastewater treatment; nitrous oxide (N2O); nitrifier denitrification; pathway identification; site preference
Nomenclature
15N; 14N: Stable nitrogen isotopes
R: Nitrogen isotope ratio, 15N/14N
δ15Nα, δ15Nβ: Relative differences of isotope ratios to the standard material
(nitrogen, N2) for the inner (α) and the outer (β) nitrogen atom in the asymmetric N2O molecule
δ15NbulkN2O: The average 15N content in N2O relative to nitrogen (N2)
SP: Site preference, the difference between the δ15Nα and δ15Nβ
Chapter 5
128
Introduction
Nitrous oxide (N2O) is an important greenhouse gas (about 300 times more effective than CO2) and a major sink for stratospheric ozone (IPCC 2007). These impacts on our environment make it an urgent requirement to limit anthropogenic N2O emissions (Ravishankara et al., 2009). It is estimated that about two thirds of the overall N2O is emitted by microbial processes occurring mainly in agriculture, but also in biological wastewater treatment (USEPA 2009). Depending on the operating conditions, N2O emissions are estimated to represent a major part of the total greenhouse gas emissions from biological wastewater treatment (Daelman et al., 2012). Continuous online monitoring of N2O is consequently helpful in reducing overall greenhouse gas emission from biological wastewater treatment (e.g. Wunderlin et al., 2013b).
N2O production in biological wastewater treatment is mainly attributed to autotrophic nitrification and heterotrophic denitrification, which produce N2O via different pathways (Kampschreur et al., 2009; Wunderlin et al., 2012): (i) during the oxidation of ammonia (NH4
+) or hydroxylamine (NH2OH) to nitrite (NO2-), (ii) via reduction of NO2
- by ammonia-oxidizing bacteria (AOB), known as nitrifier denitrification, and (iii) during heterotrophic denitrification where N2O is an obligate intermediate. The importance of each of these pathways remains unclear, but it is generally believed that nitrifier denitrification is dominant in biological wastewater treatment under aerobic conditions (Colliver and Stephenson 2000).
A promising way of apportioning N2O production to nitrification and denitrification is to analyze the stable nitrogen (N) isotopes (Baggs 2008; Schreiber et al., 2012; Wunderlin et al., 2013a). This is done by measuring the isotope ratio of a sample (Rsample)
against atmospheric nitrogen (N2; Rstandard) and expressing the result in the delta (δ)
notation (Mariotti et al., 1981): δ15Nsample = (Rsample - Rstandard) / Rstandard * 1000. The difference in �15N between the central oxygen-bound (�� position and the outer (��
position is known as the site preference (SP): SP = δ15Nα - δ15Nβ. In recent years, analytical procedures have been developed to determine the intramolecular distribution of 15N within the asymmetric linear N2O molecule by isotope-ratio mass-spectrometry (IRMS) (Brenninkmeijer and Röckmann 1999; Toyoda and Yoshida 1999) as well as by quantum cascade laser absorption spectrometry (QCLAS) (Waechter et al., 2008; Mohn et al., 2012; Köster et al., 2013).
The advantage of SP is its independence from the 15N content of the substrates and its specificity to the processes involved in N2O production and degradation (Sutka et al., 2006). Due to the complexity of the mixed population system used in this investigation, the characteristic SP values of specific pathways need to be studied on pure bacterial cultures. The following SP end-member values were consequently reported for N2O production by both nitrifying and denitrifying bacterial strains (Sutka et al., 2006): (i) 31.4 to 33.5 ‰ for NH2OH oxidation, (ii) 0.1 ‰ for nitrifier denitrification by AOB, and (iii) -0.5 to -0.6 ‰ for heterotrophic denitrification (for a more detailed overview, see Wunderlin et al., 2013a). Positive SP values in the range from 0 to 26.1 ‰, under anoxic or very low dissolved oxygen conditions, are attributed to a significant
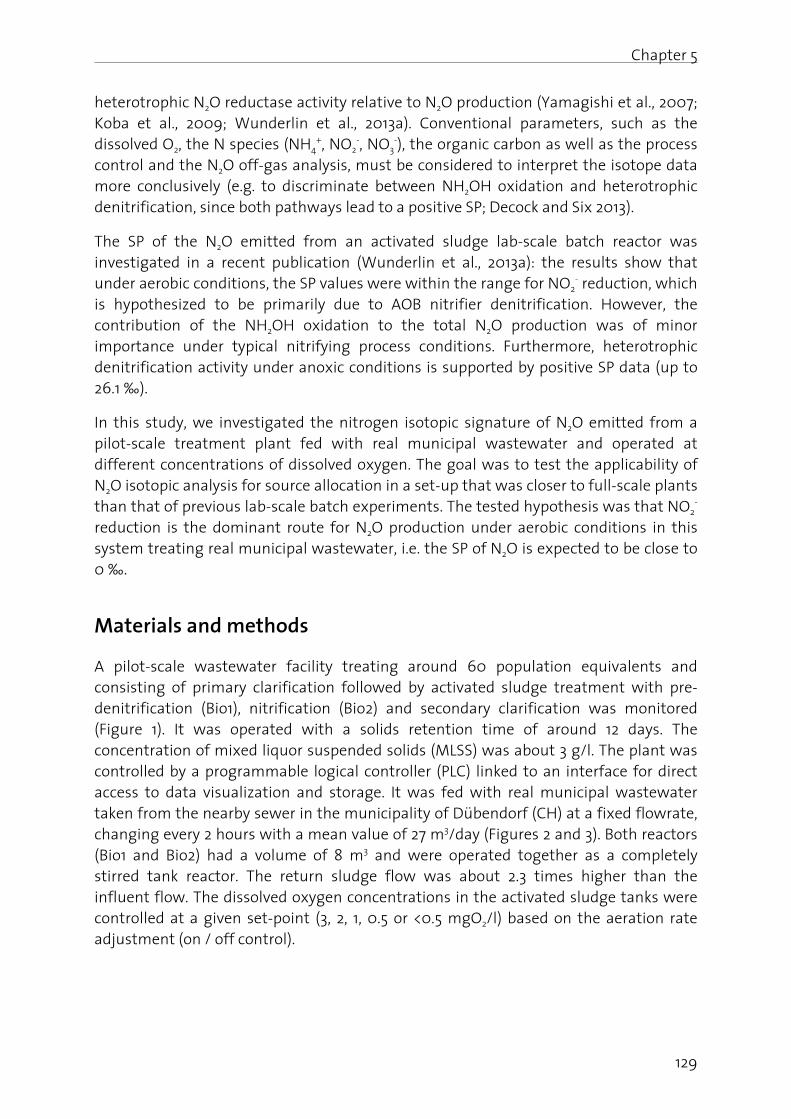
Chapter 5
129
heterotrophic N2O reductase activity relative to N2O production (Yamagishi et al., 2007; Koba et al., 2009; Wunderlin et al., 2013a). Conventional parameters, such as the dissolved O2, the N species (NH4
+, NO2-, NO3
-), the organic carbon as well as the process control and the N2O off-gas analysis, must be considered to interpret the isotope data more conclusively (e.g. to discriminate between NH2OH oxidation and heterotrophic denitrification, since both pathways lead to a positive SP; Decock and Six 2013).
The SP of the N2O emitted from an activated sludge lab-scale batch reactor was investigated in a recent publication (Wunderlin et al., 2013a): the results show that under aerobic conditions, the SP values were within the range for NO2
- reduction, which is hypothesized to be primarily due to AOB nitrifier denitrification. However, the contribution of the NH2OH oxidation to the total N2O production was of minor importance under typical nitrifying process conditions. Furthermore, heterotrophic denitrification activity under anoxic conditions is supported by positive SP data (up to 26.1 ‰).
In this study, we investigated the nitrogen isotopic signature of N2O emitted from a pilot-scale treatment plant fed with real municipal wastewater and operated at different concentrations of dissolved oxygen. The goal was to test the applicability of N2O isotopic analysis for source allocation in a set-up that was closer to full-scale plants than that of previous lab-scale batch experiments. The tested hypothesis was that NO2
- reduction is the dominant route for N2O production under aerobic conditions in this system treating real municipal wastewater, i.e. the SP of N2O is expected to be close to 0 ‰.
Materials and methods
A pilot-scale wastewater facility treating around 60 population equivalents and consisting of primary clarification followed by activated sludge treatment with pre-denitrification (Bio1), nitrification (Bio2) and secondary clarification was monitored (Figure 1). It was operated with a solids retention time of around 12 days. The concentration of mixed liquor suspended solids (MLSS) was about 3 g/l. The plant was controlled by a programmable logical controller (PLC) linked to an interface for direct access to data visualization and storage. It was fed with real municipal wastewater taken from the nearby sewer in the municipality of Dübendorf (CH) at a fixed flowrate, changing every 2 hours with a mean value of 27 m3/day (Figures 2 and 3). Both reactors (Bio1 and Bio2) had a volume of 8 m3 and were operated together as a completely stirred tank reactor. The return sludge flow was about 2.3 times higher than the influent flow. The dissolved oxygen concentrations in the activated sludge tanks were controlled at a given set-point (3, 2, 1, 0.5 or <0.5 mgO2/l) based on the aeration rate adjustment (on / off control).
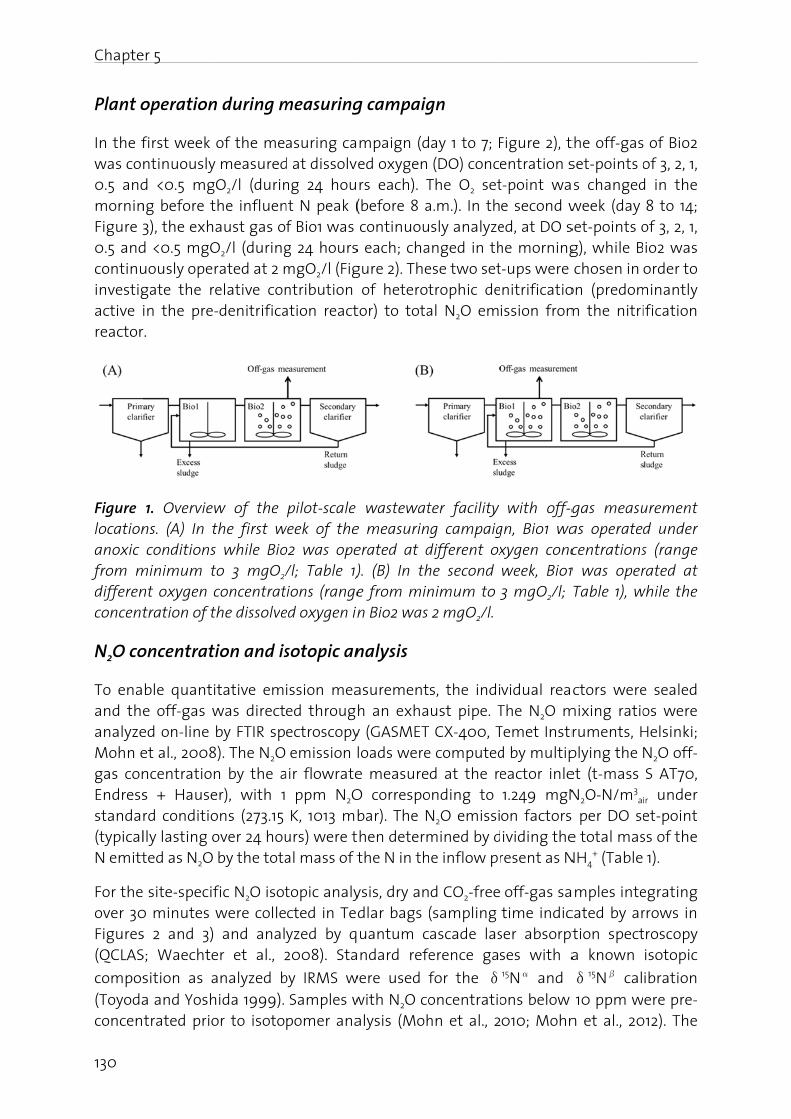
Chapte
130
Plant o
In the fwas co0.5 andmorninFigure 30.5 andcontinuinvestigactive ireactor
Figure locationanoxic from mdifferenconcent
N2O co
To enaand theanalyzeMohn egas conEndressstanda(typicalN emitt
For theover 30Figures(QCLAS
compos(Toyodaconcen
er 5
operation
first week ntinuouslyd <0.5 mg
ng before t 3), the exhd <0.5 mgOuously opegate the r
in the pre-r.
1. Overviewns. (A) In t conditions
minimum tnt oxygen ctration of t
oncentrat
ble quantie off-gas wed on-line et al., 2008ncentrations + Hauserd conditiolly lasting oted as N2O
site-specif0 minutes s 2 and 3) S; Waechte
sition as aa and Yoshtrated prio
n during m
of the mey measuredgO2/l (durin the influen
aust gas oO2/l (duringrated at 2 melative con-denitrifica
w of the the first ws while Bioto 3 mgO2/ concentratthe dissolve
tion and is
itative em was direct by FTIR sp8). The N2O n by the aer), with 1ons (273.15 over 24 hou by the tota
fic N2O isot were colle and analyer et al., 2
analyzed bhida 1999). or to isoto
measuring
asuring cad at dissolvng 24 hount N peak (
f Bio1 was g 24 hours
mgO2/l (Figntribution ation react
pilot-scale week of theo2 was ope/l; Table 1)
tions (rangeed oxygen in
sotopic an
ission meaed througectroscopy emission l
air flowrate ppm N2O K, 1013 mburs) were tal mass of t
topic analycted in Tedyzed by q
2008). Sta
by IRMS w Samples wpomer ana
g campaig
mpaign (ded oxygen rs each). T
(before 8 a continuous each; chagure 2). The of heterottor) to tota
wastewate measurinerated at d). (B) In the from minn Bio2 was
nalysis
asurementh an exha
y (GASMET loads weree measureO correspobar). The N
hen determ the N in th
ysis, dry andlar bags (uantum cndard refe
were used fwith N2O coalysis (Moh
gn
ay 1 to 7; F (DO) conc
The O2 set a.m.). In th
sly analyzeanged in these two settrophic deal N2O em
ter facility g campaig
different oxhe second nimum to 2 mgO2/l.
s, the indiust pipe. T
T CX-400, Te computedd at the re
onding to N2O emissimined by de inflow pr
d CO2-free (sampling
ascade laserence ga
for the δoncentratiohn et al., 2
Figure 2), tentration st-point wae second w
ed, at DO she morningt-ups were nitrificatioission from
with off-ggn, Bio1 waxygen concweek, Bio1
3 mgO2/l;
vidual rea The N2O m Temet Instr
d by multipeactor inle
1.249 mgNon factorsividing the
resent as N
off-gas sa time indicser absorptses with a15Nα and ons below 010; Mohn
the off-gas set-points o
s changed week (day set-points o
g), while B chosen in
on (predomm the nitri
gas measuas operatedcentrations1 was oper Table 1), w
ctors weremixing ratio
ruments, Hplying the et (t-mass N2O-N/m3
ai
s per DO see total mas
NH4+ (Table
amples intecated by artion spect
a known
δ15Nβ cal 10 ppm wn et al., 20
of Bio2 of 3, 2, 1, d in the 8 to 14;
of 3, 2, 1, io2 was
order to minantly ification
urement d under s (range rated at
while the
e sealed os were
Helsinki; N2O off- S AT70,
ir under et-point ss of the 1).
egrating rrows in troscopy
isotopic
ibration ere pre-
012). The
Chapter 5
131
performance achieved by high-precision analysis and its equivalence to IRMS were recently demonstrated in an inter-comparison study (Köster et al., 2013).
Wastewater sampling procedures and analysis
Laboratory measurements were carried out every weekday. Grab samples were taken six times per day at 7, 8, 10 and 12 a.m. and 2 and 4 p.m. The samples were immediately
filtered through a 0.45μm syringe filter and stored at 4°C. The NH4+-N was analyzed by
photometry using a Foss FIAstar (flow-injection 5000 analyzer). The NO3--N and NO2
--N were determined by anion chromatography (761 compact IC, Metrohm). The measurements were carried out within 24 hours of sampling. The influent municipal wastewater was subjected to flow-proportional sampling for 2 hours in each case (WaterSam, Gerber Instruments) during the whole measuring campaign for the total organic carbon (TOC) analysis. The samples were homogenized (Ultra-turrax T25, Faust Laborbedarf AG) before TOC analysis (IL 550 TOC-TN, Hach Lange GmbH). The ratio of CODtotal (total chemical oxygen demand) to TOC is 3.3 ± 0.5 (n = 39, measured over one year), while the CODtotal to CODsoluble ratio is 1.8 ± 0.2 (n = 6; measured over two months).
Results and discussion
Trends of dissolved nitrogen species and N2O emissions
The trend data for the NH4+ influent concentrations, influent flows, aeration rates,
dissolved oxygen concentrations, N2O off-gas concentrations and dissolved N species (NH4
+, NO2-, NO3
-) are shown in Figures 2 and 3. The NH4+ influent loads tended to peak
during the morning hours (between 8 to 11 a.m.) due to high NH4+ concentrations in the
sewer system and in combination with the highest daily influent flow into the activated sludge plant (~1.4 m3/h between 8 to 10 a.m.). The low N influent loads in the morning of days 3, 8, 11 and 12 were affected by rainfall in the catchment area leading to dilution in the sewer networks (pilot-plant influent flow with a fixed daily variation; see Figures 2 and 3). Under normal dry weather conditions, the NH4
+ influent loads were typically in the range from 20 to 70 gN/h. The total organic carbon (TOC) concentrations of the influent wastewater were between 100 and 250 mg/l (data not shown), corresponding to about 330 to 850 mg/l total chemical oxygen demand (COD; i.e. about a factor of 3.3 higher than the TOC).
The N2O emissions were highly dynamic but seemed to depend on the dissolved NH4+
and NO2- concentrations in the activated sludge tanks: for example, during day 2 (Figure
2), the N influent load was high, and both NH4+ and NO2
- built up in the nitrification reactor, while the N2O emissions rose in parallel. On the other hand, during low N loading situations, such as during rain events on days 8 and 14 (Figure 3), N2O emissions were low or even below the limit of detection (< 0.5 ppm). This is in accordance with several studies: thus Lotito et al. (2012) reported a similar daily pattern of N2O emissions correlating with the N influent load, and Ahn et al. (2010) identified dissolved NO2
- as a relevant parameter for N2O production in full-scale treatment plants.
Chapte
132
Figure 2anoxic aeratiodissolveadaptedanalysis
No clea(Table accumuAccordilimitinget al., 20respect(Table literaturespect(2012) ameasuryear yie
As showthe doHowev
er 5
2. Data ove conditionsn rate, diss
ed N specied from Hos (one arrow
ar correlati 1). This mulation in ing to the g condition012). In factt to the NH 1). These dure: thus (it to the N an averagered, and (iielded abou
wn in this ominant Ner, additio
erview of ths; see also solved oxyges (NH4
+ (●uweling etw is equal t
ion betweemight be the activa literature,
ns than in st, the N2O e
H4+ influent
data are vai) Ahn et a influent lo
e emission ii) N2O emt 3% of the
section, thN2O produonal infor
he measuri Figure 2 A)gen, N2O off
), NO2- (∆),
t al., 2011). A to one sam
en DO and partly due
ted sludge, N2O emis
situations emissions ft load, and
ariable, but al. (2010) r
oad, and ( factor of 0issions mo
e incoming
he reportedction patmation is
ing campa): NH4
+ infff-gas conce, NO3
- (○); Arrows ind
mple integra
d N2O emise to income tank, at ssions are with DO in from Bio2 wd between t are withireported a
(ii) in a rec 0.04% withonitored on N (Daelma
d N2O emishway cou
s needed
ign from Bfluent load entration (a not availabdicate time ated over 30
ssions coulmplete nit DO below expected tn excess (T were in the 0.005 andin the rang range frocent investh respect ton a full-scaan et al., 20
ssions werld only b
to obtain
io2 (Bio1 w and influeaverage oveble for day of gas sam
0 minutes).
ld be obsetrification,
w 1.5 mg/l to be highTallec et al.,e range frod 2.1% fromge of valuem 0.01 to
tigation byo the NH4
+ le treatme
012).
e dynamic be approxin a bette
was operateent flow in
ver 10 minuy 6) of Bio2mpling for
erved in th leading t
(Figures 2 her under o, 2006; Wum 0.1 to 2.6
m Bio1, respes reported 1.8 ± 0.79
y Aboobaka influent flent plant o
and variaimately as
er underst
ed under nto Bio1, tes) and 2 (day 2 isotopic
is study to NH4
+ and 3).
oxygen-underlin 6% with
pectively d in the 9% with ar et al. ow was
over one
ble, and ssessed. tanding.
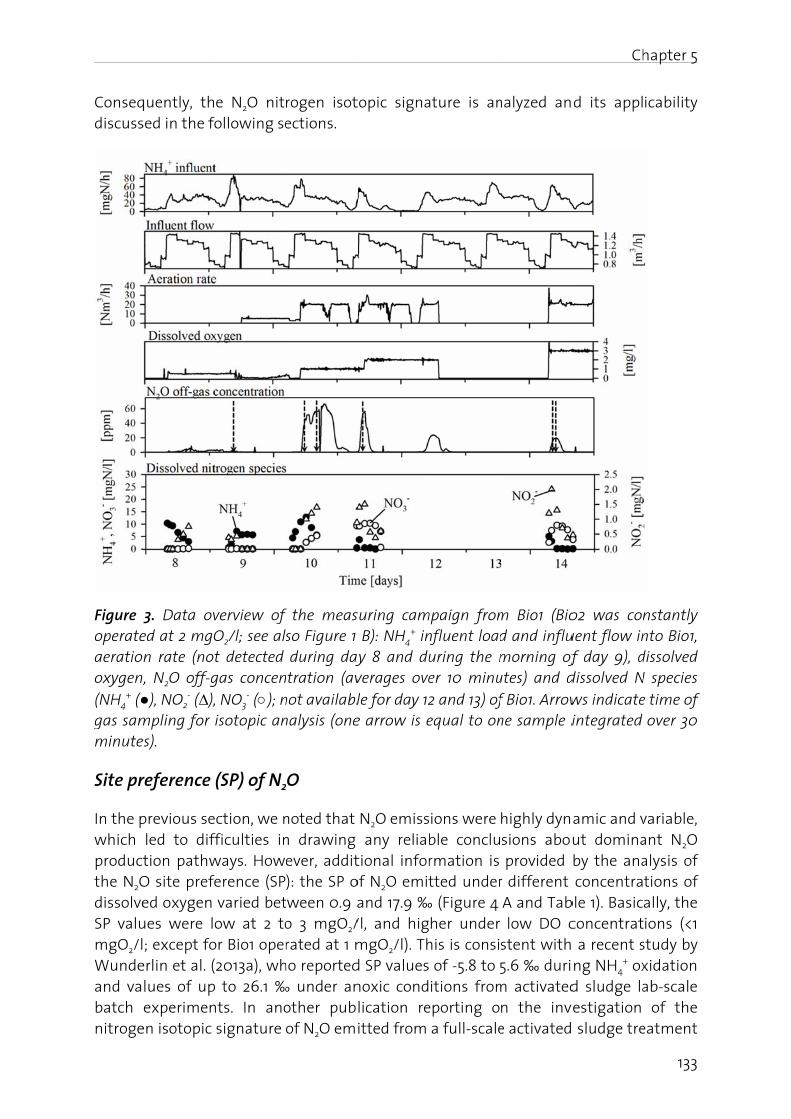
Conseqdiscuss
Figure operateaeratiooxygen,(NH4
+ (●gas samminute
Site pr
In the pwhich productthe N2OdissolveSP valumgO2/lWundeand vabatch nitroge
quently, thsed in the fo
3. Data oved at 2 mgOn rate (no, N2O off-g●), NO2
- (∆),mpling for es).
reference
previous se led to diftion pathw
O site prefeed oxygen
ues were l; except fo
erlin et al. (lues of up
experimenen isotopic
e N2O nit ollowing se
verview of O2/l; see alst detected
gas concen, NO3
- (○); n isotopic an
(SP) of N2
ection, we nfficulties inways. Howerence (SP varied bet
ow at 2 toor Bio1 oper (2013a), whp to 26.1 ‰nts. In ano signature
rogen isotections.
f the measso Figure 1 during day
ntration (avnot availablnalysis (one
O
noted that n drawing ever, addit): the SP o
tween 0.9 ao 3 mgO2/rated at 1 m
ho reported‰ under an
other pub of N2O em
topic signa
suring cam B): NH4
+ iny 8 and du
verages ovele for day 12e arrow is e
N2O emiss any reliational infor
of N2O emit and 17.9 ‰/l, and hig mgO2/l). Thd SP valuesnoxic condlication reitted from
ature is an
mpaign fromnfluent loaduring the mer 10 minu2 and 13) ofequal to on
ions were ble conclurmation is tted under
‰ (Figure 4 her under
his is consi of -5.8 to itions from
eporting o a full-scale
nalyzed an
m Bio1 (Biod and influmorning ofutes) and df Bio1. Arrowne sample i
highly dynsions abou provided r different A and Tab low DO cstent with
5.6 ‰ durim activatedn the inve activated
Ch
d its appl
o2 was conuent flow inf day 9), d
dissolved Nws indicate integrated
amic and vut domina
by the ana concentra
ble 1). Basic concentrat
a recent sng NH4
+ oxd sludge la
vestigation sludge tre
hapter 5
133
icability
nstantly nto Bio1, dissolved N species e time of over 30
variable, ant N2O alysis of tions of ally, the ions (<1
study by xidation ab-scale of the
eatment
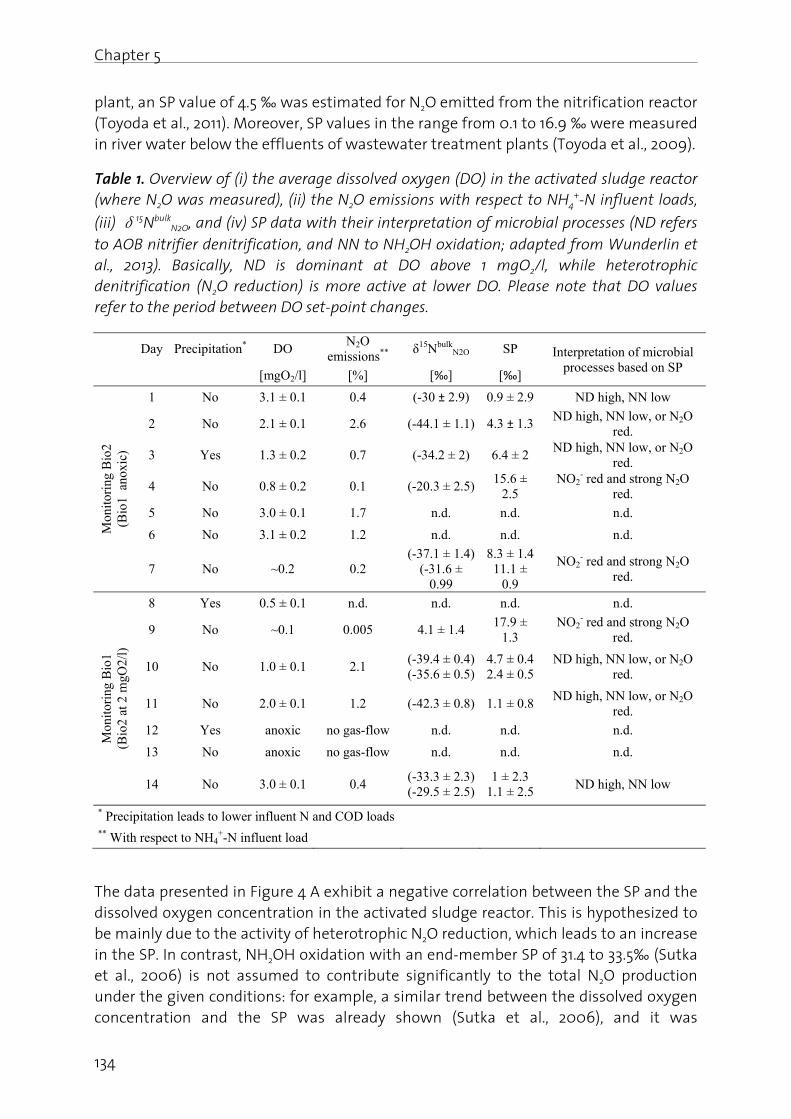
Chapter 5
134
plant, an SP value of 4.5 ‰ was estimated for N2O emitted from the nitrification reactor (Toyoda et al., 2011). Moreover, SP values in the range from 0.1 to 16.9 ‰ were measured in river water below the effluents of wastewater treatment plants (Toyoda et al., 2009).
Table 1. Overview of (i) the average dissolved oxygen (DO) in the activated sludge reactor (where N2O was measured), (ii) the N2O emissions with respect to NH4
+-N influent loads,
(iii) δ15NbulkN2O, and (iv) SP data with their interpretation of microbial processes (ND refers
to AOB nitrifier denitrification, and NN to NH2OH oxidation; adapted from Wunderlin et al., 2013). Basically, ND is dominant at DO above 1 mgO2/l, while heterotrophic denitrification (N2O reduction) is more active at lower DO. Please note that DO values refer to the period between DO set-point changes.
Day Precipitation* DO N2O
emissions** δ15Nbulk
N2O SP Interpretation of microbial processes based on SP
[mgO2/l] [%] [‰] [‰]
Mon
itori
ng B
io2
(Bio
1 a
noxi
c)
1 No 3.1 ± 0.1 0.4 (-30 ± 2.9) 0.9 ± 2.9 ND high, NN low
2 No 2.1 ± 0.1 2.6 (-44.1 ± 1.1) 4.3 ± 1.3 ND high, NN low, or N2O
red.
3 Yes 1.3 ± 0.2 0.7 (-34.2 ± 2) 6.4 ± 2 ND high, NN low, or N2O
red.
4 No 0.8 ± 0.2 0.1 (-20.3 ± 2.5)15.6 ±
2.5 NO2
- red and strong N2O red.
5 No 3.0 ± 0.1 1.7 n.d. n.d. n.d.
6 No 3.1 ± 0.2 1.2 n.d. n.d. n.d.
7 No ~0.2 0.2 (-37.1 ± 1.4)
(-31.6 ± 0.99
8.3 ± 1.411.1 ±
0.9
NO2- red and strong N2O
red.
Mon
itori
ng B
io1
(Bio
2 at
2 m
gO2/
l)
8 Yes 0.5 ± 0.1 n.d. n.d. n.d. n.d.
9 No ~0.1 0.005 4.1 ± 1.4 17.9 ±
1.3 NO2
- red and strong N2O red.
10 No 1.0 ± 0.1 2.1 (-39.4 ± 0.4)(-35.6 ± 0.5)
4.7 ± 0.42.4 ± 0.5
ND high, NN low, or N2O red.
11 No 2.0 ± 0.1 1.2 (-42.3 ± 0.8) 1.1 ± 0.8ND high, NN low, or N2O
red.
12 Yes anoxic no gas-flow n.d. n.d. n.d.
13 No anoxic no gas-flow n.d. n.d. n.d.
14 No 3.0 ± 0.1 0.4 (-33.3 ± 2.3)(-29.5 ± 2.5)
1 ± 2.31.1 ± 2.5
ND high, NN low
* Precipitation leads to lower influent N and COD loads ** With respect to NH4
+-N influent load
The data presented in Figure 4 A exhibit a negative correlation between the SP and the dissolved oxygen concentration in the activated sludge reactor. This is hypothesized to be mainly due to the activity of heterotrophic N2O reduction, which leads to an increase in the SP. In contrast, NH2OH oxidation with an end-member SP of 31.4 to 33.5‰ (Sutka et al., 2006) is not assumed to contribute significantly to the total N2O production under the given conditions: for example, a similar trend between the dissolved oxygen concentration and the SP was already shown (Sutka et al., 2006), and it was
Chapter 5
135
demonstrated that decreasing concentrations of dissolved oxygen increase the importance of nitrifier denitrification relative to NH2OH oxidation in a pure culture study of N. europaea. This is also in agreement with a recent publication showing that N2O production is related to NH4
+ oxidation in the case of imbalanced metabolic activity (Yu et al., 2010), a situation where N2O might be produced as an intermediate of the NH2OH oxidation pathway (e.g. via NO or HNO; Ritchie and Nicholas 1972). Since this would result in the opposite correlation to that shown in Figure 4 A (e.g. higher SP with higher oxygen concentration), it is concluded that NH2OH oxidation only contributed marginally to the total N2O production in this investigation (SP up to 6.4 ‰; Table 1). Similarly, in activated sludge lab-scale batch experiments, an SP close to 0 ‰ indicated a low contribution from NH2OH oxidation under NH4
+ oxidizing conditions and DO up to 3 mgO2/l (Wunderlin et al., 2013a).
According to the current state of knowledge, nitrifier denitrification is hypothesized to be the dominant N2O production pathway in biological wastewater treatment under aerobic conditions (Colliver and Stephenson 2000; Kampschreur et al., 2009; Wunderlin et al., 2012; Wunderlin et al., 2013a). This is supported by SP data (SP close to 0 ‰, at DO >1.5 mgO2/l) and by the presence of dissolved NO2
- during periods of N2O emissions (Figure 2 and 3) as reported in our study. On the other hand, positive SP values, as detected under low dissolved oxygen (e.g. 8.3 to 17.9 ‰ below 1.5 mgO2/l; Table 1), are interpreted as an indicator of heterotrophic N2O reduction. As such, the shift to lower SP values with increasing oxygen concentrations is hypothesized to be due to (i) an increasing inhibition of the N2O reductase or (ii) to reduced overall heterotrophic activity: according to the literature, N2O reductase is assumed to be inhibited more efficiently than the other heterotrophic denitrifying enzymes in the presence of oxygen (von Schulthess et al., 1994; Kampschreur et al., 2009).
Preliminary studies show the meaning of the SP data: (i) SP values at 0 ‰ are an indicator of NO2
- reduction, either by AOB nitrifier denitrification or heterotrophic denitrification, and (ii) positive SP values at high DO refer to NH2OH oxidation, while heterotrophic N2O reduction is the targeted process at low DO. As demonstrated in this section, SP data provide quantitative information about the relevant N2O production pathway. Our data are interpreted as follows: SP data close to 0 ‰ and high DO are an indicator of NO2
- reduction, while the increase in SP at low DO is attributed to increasing heterotrophic denitrification activity.
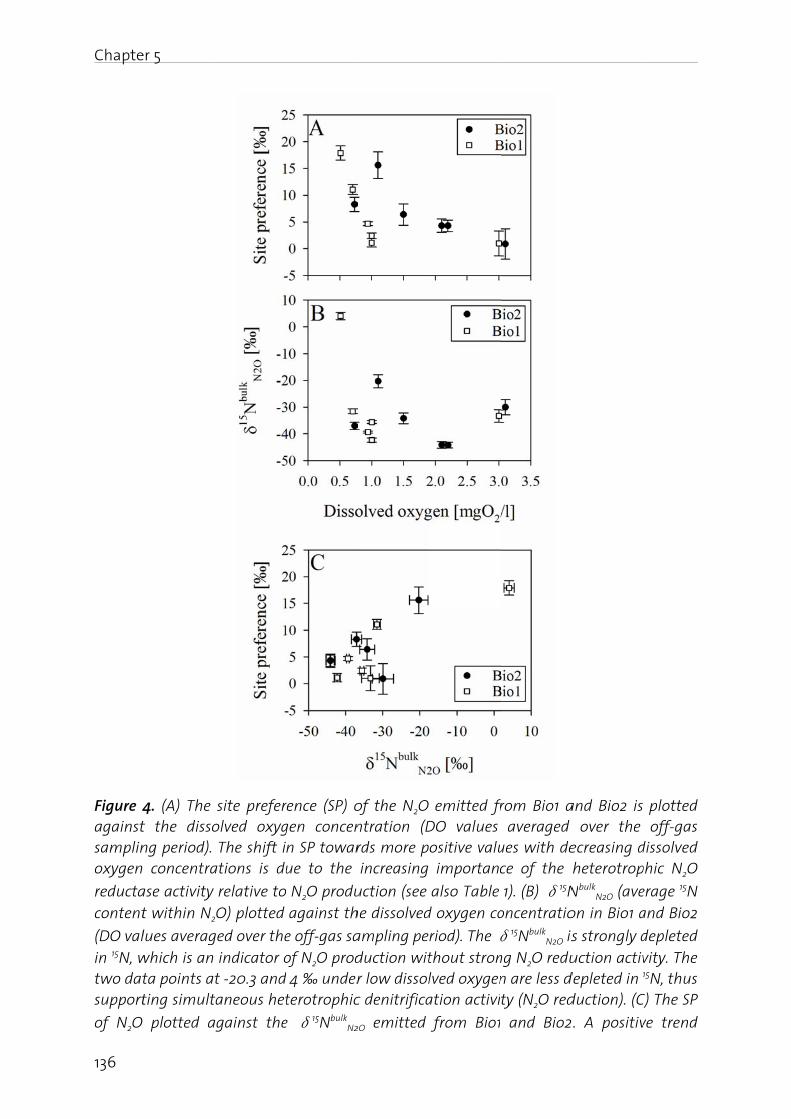
Chapte
136
Figure 4againstsamplinoxygen
reductacontent
(DO valin 15N, wtwo datsupport
of N2O
er 5
4. (A) The t the dissong period). concentra
ase activity t within N2
lues averagwhich is an ta points ating simult
plotted a
site preferolved oxyg The shift iations is du
relative to
2O) plotted
ged over the indicator ot -20.3 and
taneous het
against the
rence (SP) ogen concenn SP towarue to the
N2O produ against th
e off-gas saof N2O prod
d 4 ‰ underterotrophic
e δ15NbulkN2
of the N2O ntration (Drds more p increasing
uction (see he dissolved
ampling peduction witr low dissolc denitrifica
2O emitted
emitted frDO values ositive valu importanc
also Table d oxygen co
riod). The δthout stronlved oxygenation activi
from Bio1
from Bio1 a averaged ues with dece of the
1). (B) δ15Noncentratio
δ15NbulkN2O is
ng N2O redun are less dty (N2O red
and Bio2
and Bio2 is over the ecreasing d
heterotrop
NbulkN2O (ave
on in Bio1 a
s strongly duction activ
depleted in 1
duction). (C
2. A positiv
plotted off-gas dissolved phic N2O
erage 15N and Bio2
depleted vity. The 15N, thus
C) The SP
ve trend
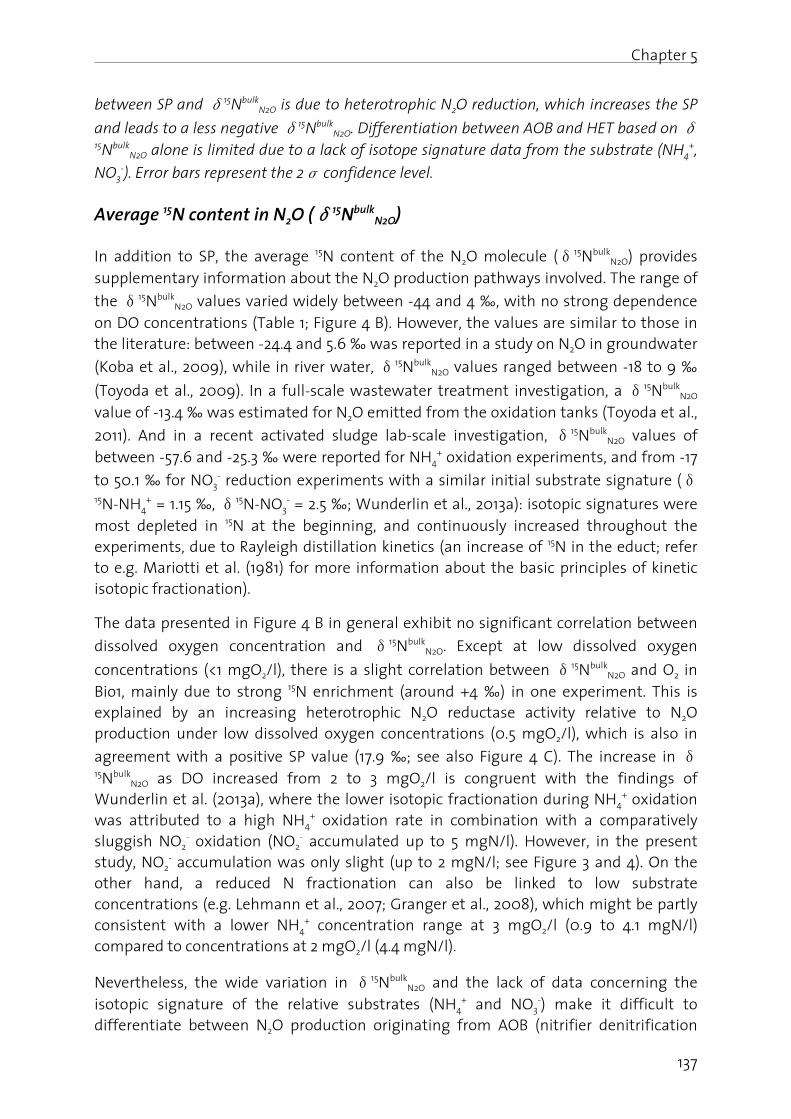
Chapter 5
137
between SP and δ15NbulkN2O is due to heterotrophic N2O reduction, which increases the SP
and leads to a less negative δ15NbulkN2O. Differentiation between AOB and HET based on δ
15NbulkN2O alone is limited due to a lack of isotope signature data from the substrate (NH4
+,
NO3-). Error bars represent the 2σ confidence level.
Average 15N content in N2O (δ15NbulkN2O)
In addition to SP, the average 15N content of the N2O molecule (δ15NbulkN2O) provides
supplementary information about the N2O production pathways involved. The range of
the δ15NbulkN2O values varied widely between -44 and 4 ‰, with no strong dependence
on DO concentrations (Table 1; Figure 4 B). However, the values are similar to those in the literature: between -24.4 and 5.6 ‰ was reported in a study on N2O in groundwater
(Koba et al., 2009), while in river water, δ15NbulkN2O values ranged between -18 to 9 ‰
(Toyoda et al., 2009). In a full-scale wastewater treatment investigation, a δ15NbulkN2O
value of -13.4 ‰ was estimated for N2O emitted from the oxidation tanks (Toyoda et al.,
2011). And in a recent activated sludge lab-scale investigation, δ15NbulkN2O values of
between -57.6 and -25.3 ‰ were reported for NH4+ oxidation experiments, and from -17
to 50.1 ‰ for NO3- reduction experiments with a similar initial substrate signature (δ
15N-NH4+ = 1.15 ‰, δ15N-NO3
- = 2.5 ‰; Wunderlin et al., 2013a): isotopic signatures were most depleted in 15N at the beginning, and continuously increased throughout the experiments, due to Rayleigh distillation kinetics (an increase of 15N in the educt; refer to e.g. Mariotti et al. (1981) for more information about the basic principles of kinetic isotopic fractionation).
The data presented in Figure 4 B in general exhibit no significant correlation between
dissolved oxygen concentration and δ15NbulkN2O. Except at low dissolved oxygen
concentrations (<1 mgO2/l), there is a slight correlation between δ15NbulkN2O and O2 in
Bio1, mainly due to strong 15N enrichment (around +4 ‰) in one experiment. This is explained by an increasing heterotrophic N2O reductase activity relative to N2O production under low dissolved oxygen concentrations (0.5 mgO2/l), which is also in
agreement with a positive SP value (17.9 ‰; see also Figure 4 C). The increase in δ15Nbulk
N2O as DO increased from 2 to 3 mgO2/l is congruent with the findings of Wunderlin et al. (2013a), where the lower isotopic fractionation during NH4
+ oxidation was attributed to a high NH4
+ oxidation rate in combination with a comparatively sluggish NO2
- oxidation (NO2- accumulated up to 5 mgN/l). However, in the present
study, NO2- accumulation was only slight (up to 2 mgN/l; see Figure 3 and 4). On the
other hand, a reduced N fractionation can also be linked to low substrate concentrations (e.g. Lehmann et al., 2007; Granger et al., 2008), which might be partly consistent with a lower NH4
+ concentration range at 3 mgO2/l (0.9 to 4.1 mgN/l) compared to concentrations at 2 mgO2/l (4.4 mgN/l).
Nevertheless, the wide variation in δ15NbulkN2O and the lack of data concerning the
isotopic signature of the relative substrates (NH4+ and NO3
-) make it difficult to differentiate between N2O production originating from AOB (nitrifier denitrification
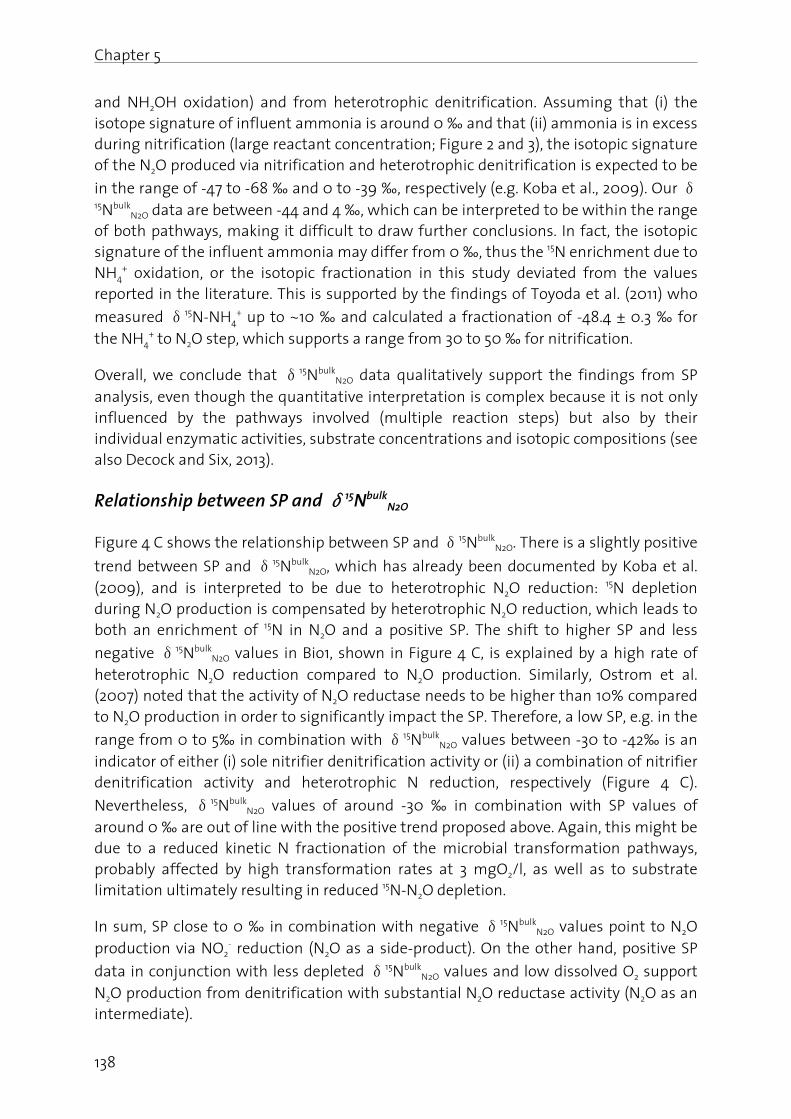
Chapter 5
138
and NH2OH oxidation) and from heterotrophic denitrification. Assuming that (i) the isotope signature of influent ammonia is around 0 ‰ and that (ii) ammonia is in excess during nitrification (large reactant concentration; Figure 2 and 3), the isotopic signature of the N2O produced via nitrification and heterotrophic denitrification is expected to be
in the range of -47 to -68 ‰ and 0 to -39 ‰, respectively (e.g. Koba et al., 2009). Our δ15Nbulk
N2O data are between -44 and 4 ‰, which can be interpreted to be within the range of both pathways, making it difficult to draw further conclusions. In fact, the isotopic signature of the influent ammonia may differ from 0 ‰, thus the 15N enrichment due to NH4
+ oxidation, or the isotopic fractionation in this study deviated from the values reported in the literature. This is supported by the findings of Toyoda et al. (2011) who
measured δ15N-NH4+ up to ~10 ‰ and calculated a fractionation of -48.4 ± 0.3 ‰ for
the NH4+ to N2O step, which supports a range from 30 to 50 ‰ for nitrification.
Overall, we conclude that δ15NbulkN2O data qualitatively support the findings from SP
analysis, even though the quantitative interpretation is complex because it is not only influenced by the pathways involved (multiple reaction steps) but also by their individual enzymatic activities, substrate concentrations and isotopic compositions (see also Decock and Six, 2013).
Relationship between SP and δ15NbulkN2O
Figure 4 C shows the relationship between SP and δ15NbulkN2O. There is a slightly positive
trend between SP and δ15NbulkN2O, which has already been documented by Koba et al.
(2009), and is interpreted to be due to heterotrophic N2O reduction: 15N depletion during N2O production is compensated by heterotrophic N2O reduction, which leads to both an enrichment of 15N in N2O and a positive SP. The shift to higher SP and less
negative δ15NbulkN2O values in Bio1, shown in Figure 4 C, is explained by a high rate of
heterotrophic N2O reduction compared to N2O production. Similarly, Ostrom et al. (2007) noted that the activity of N2O reductase needs to be higher than 10% compared to N2O production in order to significantly impact the SP. Therefore, a low SP, e.g. in the
range from 0 to 5‰ in combination with δ15NbulkN2O values between -30 to -42‰ is an
indicator of either (i) sole nitrifier denitrification activity or (ii) a combination of nitrifier denitrification activity and heterotrophic N reduction, respectively (Figure 4 C).
Nevertheless, δ15NbulkN2O values of around -30 ‰ in combination with SP values of
around 0 ‰ are out of line with the positive trend proposed above. Again, this might be due to a reduced kinetic N fractionation of the microbial transformation pathways, probably affected by high transformation rates at 3 mgO2/l, as well as to substrate limitation ultimately resulting in reduced 15N-N2O depletion.
In sum, SP close to 0 ‰ in combination with negative δ15NbulkN2O values point to N2O
production via NO2- reduction (N2O as a side-product). On the other hand, positive SP
data in conjunction with less depleted δ15NbulkN2O values and low dissolved O2 support
N2O production from denitrification with substantial N2O reductase activity (N2O as an intermediate).
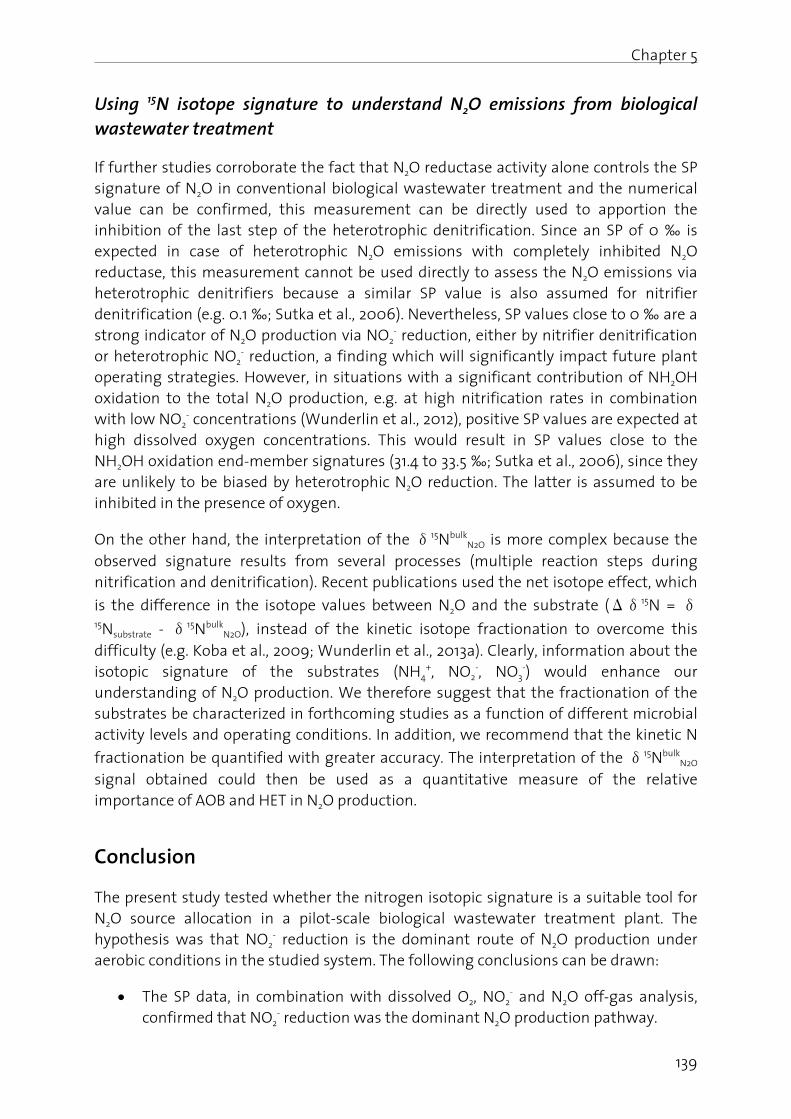
Chapter 5
139
Using 15N isotope signature to understand N2O emissions from biological wastewater treatment
If further studies corroborate the fact that N2O reductase activity alone controls the SP signature of N2O in conventional biological wastewater treatment and the numerical value can be confirmed, this measurement can be directly used to apportion the inhibition of the last step of the heterotrophic denitrification. Since an SP of 0 ‰ is expected in case of heterotrophic N2O emissions with completely inhibited N2O reductase, this measurement cannot be used directly to assess the N2O emissions via heterotrophic denitrifiers because a similar SP value is also assumed for nitrifier denitrification (e.g. 0.1 ‰; Sutka et al., 2006). Nevertheless, SP values close to 0 ‰ are a strong indicator of N2O production via NO2
- reduction, either by nitrifier denitrification or heterotrophic NO2
- reduction, a finding which will significantly impact future plant operating strategies. However, in situations with a significant contribution of NH2OH oxidation to the total N2O production, e.g. at high nitrification rates in combination with low NO2
- concentrations (Wunderlin et al., 2012), positive SP values are expected at high dissolved oxygen concentrations. This would result in SP values close to the NH2OH oxidation end-member signatures (31.4 to 33.5 ‰; Sutka et al., 2006), since they are unlikely to be biased by heterotrophic N2O reduction. The latter is assumed to be inhibited in the presence of oxygen.
On the other hand, the interpretation of the δ15NbulkN2O is more complex because the
observed signature results from several processes (multiple reaction steps during nitrification and denitrification). Recent publications used the net isotope effect, which
is the difference in the isotope values between N2O and the substrate (Δδ15N = δ15Nsubstrate - δ15Nbulk
N2O), instead of the kinetic isotope fractionation to overcome this difficulty (e.g. Koba et al., 2009; Wunderlin et al., 2013a). Clearly, information about the isotopic signature of the substrates (NH4
+, NO2-, NO3
-) would enhance our understanding of N2O production. We therefore suggest that the fractionation of the substrates be characterized in forthcoming studies as a function of different microbial activity levels and operating conditions. In addition, we recommend that the kinetic N
fractionation be quantified with greater accuracy. The interpretation of the δ15NbulkN2O
signal obtained could then be used as a quantitative measure of the relative importance of AOB and HET in N2O production.
Conclusion
The present study tested whether the nitrogen isotopic signature is a suitable tool for N2O source allocation in a pilot-scale biological wastewater treatment plant. The hypothesis was that NO2
- reduction is the dominant route of N2O production under aerobic conditions in the studied system. The following conclusions can be drawn:
The SP data, in combination with dissolved O2, NO2- and N2O off-gas analysis,
confirmed that NO2- reduction was the dominant N2O production pathway.
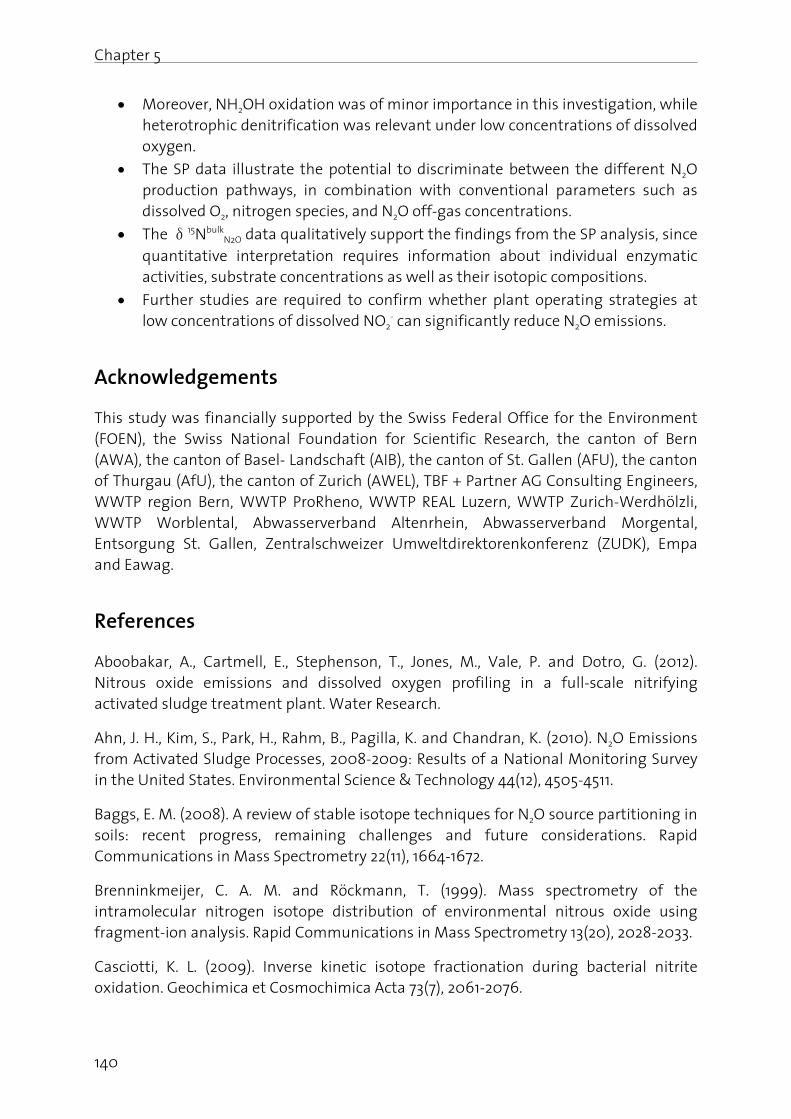
Chapter 5
140
Moreover, NH2OH oxidation was of minor importance in this investigation, while heterotrophic denitrification was relevant under low concentrations of dissolved oxygen.
The SP data illustrate the potential to discriminate between the different N2O production pathways, in combination with conventional parameters such as dissolved O2, nitrogen species, and N2O off-gas concentrations.
The δ15NbulkN2O data qualitatively support the findings from the SP analysis, since
quantitative interpretation requires information about individual enzymatic activities, substrate concentrations as well as their isotopic compositions.
Further studies are required to confirm whether plant operating strategies at low concentrations of dissolved NO2
- can significantly reduce N2O emissions.
Acknowledgements
This study was financially supported by the Swiss Federal Office for the Environment (FOEN), the Swiss National Foundation for Scientific Research, the canton of Bern (AWA), the canton of Basel- Landschaft (AIB), the canton of St. Gallen (AFU), the canton of Thurgau (AfU), the canton of Zurich (AWEL), TBF + Partner AG Consulting Engineers, WWTP region Bern, WWTP ProRheno, WWTP REAL Luzern, WWTP Zurich-Werdhölzli, WWTP Worblental, Abwasserverband Altenrhein, Abwasserverband Morgental, Entsorgung St. Gallen, Zentralschweizer Umweltdirektorenkonferenz (ZUDK), Empa and Eawag.
References
Aboobakar, A., Cartmell, E., Stephenson, T., Jones, M., Vale, P. and Dotro, G. (2012). Nitrous oxide emissions and dissolved oxygen profiling in a full-scale nitrifying activated sludge treatment plant. Water Research.
Ahn, J. H., Kim, S., Park, H., Rahm, B., Pagilla, K. and Chandran, K. (2010). N2O Emissions from Activated Sludge Processes, 2008-2009: Results of a National Monitoring Survey in the United States. Environmental Science & Technology 44(12), 4505-4511.
Baggs, E. M. (2008). A review of stable isotope techniques for N2O source partitioning in soils: recent progress, remaining challenges and future considerations. Rapid Communications in Mass Spectrometry 22(11), 1664-1672.
Brenninkmeijer, C. A. M. and Röckmann, T. (1999). Mass spectrometry of the intramolecular nitrogen isotope distribution of environmental nitrous oxide using fragment-ion analysis. Rapid Communications in Mass Spectrometry 13(20), 2028-2033.
Casciotti, K. L. (2009). Inverse kinetic isotope fractionation during bacterial nitrite oxidation. Geochimica et Cosmochimica Acta 73(7), 2061-2076.
Chapter 5
141
Colliver, B. B. and Stephenson, T. (2000). Production of nitrogen oxide and dinitrogen oxide by autotrophic nitrifiers. Biotechnology Advances 18(3), 219-232.
Daelman, M. R. J., van Dongen, L. G. J. M., van Voorthuizen, E. M., Volcke, E. I. P. and van Loosdrecht, M. C. M. (2012). Methane and nitrous oxide emissions from municipal wastewater treatment. IWA Nutrient Removal and Recovery 2012: Trends in NRR, Harbin, China, 23-25 September 2012.
Decock, C. and Six, J. (2013). How reliable is the intramolecular distribution of 15N in N2O to source partition N2O emitted from soil? Soil Biology and Biochemistry 65, 114-127.
Granger, J., Sigman, D. M., Lehmann, M. F. and Tortell, P. D. (2008). Nitrogen and oxygen isotope fractionation during dissimilatory nitrate reduction by denitrifying bacteria. Limnology and Oceanography 53(6), 2533-2545.
Houweling, D., Wunderlin, P., Dold, P., Bye, C., Joss, A. and Siegrist, H. (2011). N2O emissions: Modeling the effect of process configuration and diurnal loading patterns. Water Environment Research 83(12), 2131-2139.
IPCC (2007). Climate Change 2007: The Physical Science Basis, Contribution of Working Group I to the Fourth Assessment Report of the Intergovernmental Panel on Climate Change [Solomon, S., Qin, D. Manning, M., Chen, Z., Marquis, M., Averyt, K.B., Tignor, M., Miller, H.L. (eds)]. Cambridge University Press, Cambridge, United Kingdom and New York, NY, USA, 996pp.
Kampschreur, M. J., Temmink, H., Kleerebezem, R., Jetten, M. S. M. and van Loosdrecht, M. C. M. (2009). Nitrous oxide emission during wastewater treatment. Water Research 43(17), 4093-4103.
Koba, K., Osaka, K., Tobari, Y., Toyoda, S., Ohte, N., Katsuyama, M., Suzuki, N., Itoh, M., Yamagishi, H., Kawasaki, M., Kim, S. J., Yoshida, N. and Nakajima, T. (2009). Biogeochemistry of nitrous oxide in groundwater in a forested ecosystem elucidated by nitrous oxide isotopomer measurements. Geochimica et Cosmochimica Acta 73(11), 3115-3133.
Köster, J. R., Well, R., Tuzson, B., Bol, R., Dittert, K., Giesemann, A., Emmenegger, L., Manninen, A., Cardenas, L. and Mohn, J. (2013). Novel laser spectroscopic technique for continuous analysis of N2O isotopomers - application and intercomparison with isotope ratio mass spectrometry. Rapid Communications in Mass Spectrometry 27, 216-222.
Lehmann, M. F., Sigman, D. M., McCorkle, D. C., Granger, J., Hoffmann, S., Cane, G. and Brunelle, B. G. (2007). The distribution of nitrate 15N/ 14N in marine sediments and the impact of benthic nitrogen loss on the isotopic composition of oceanic nitrate. Geochimica Et Cosmochimica Acta 71(22), 5384-5404.
Lotito, A. M., Wunderlin, P., Joss, A., Kipf, M. and Siegrist, H. (2012). Nitrous oxide emissions from the oxidation tank of a pilot activated sludge plant. Water Research 46(11), 3563-3573.
Chapter 5
142
Mariotti, A., Germon, J. C., Hubert, P., Kaiser, P., Letolle, R., Tardieux, A. and Tardieux, P. (1981). Experimental determination of nitrogen kinetic isotope fractionation: Some principles; illustration for the denitrification and nitrification processes. Plant and Soil 62(3), 413-430.
Mohn, J., Guggenheim, C., Tuzson, B., Vollmer, M., Toyoda, S., Yoshida, N. and Emmenegger, L. (2010). A liquid-free preconcentration unit for measurements of ambient N2O isotopomers by QCLAS. Atmospheric Measurement Techniques 3, 609-618.
Mohn, J., Tuzson, B., Manninen, A., Yoshida, N., Toyoda, S., Brand, W. A. and Emmenegger, L. (2012). Site selective real-time measurements of ambient N2O isotopomers by laser spectroscopy. Atmospheric Measurement Techniques 5, 1601-1609.
Ostrom, N. E., Piit, A., Sutka, R., Ostrom, P. H., Grandy, A. S., Huizinga, K. M. and Robertson, G. P. (2007). Isotopologue effects during N2O reduction in soils and in pure cultures of denitrifiers. Journal of Geophysical Research G: Biogeosciences 112(2), G02005.
Ravishankara, A. R., Daniel, J. S. and Portmann, R. W. (2009). Nitrous oxide (N2O): the dominant ozone-depleting substance emitted in the 21st century. Science 326(5949), 123-125.
Ritchie, G. A. and Nicholas, D. J. (1972). Identification of the sources of nitrous oxide produced by oxidative and reductive processes in Nitrosomonas europaea. Biochemical Journal 126(5), 1181-1191.
Schreiber, F., Wunderlin, P., Udert, K. M. and Wells, G. F. (2012). Nitric oxide and nitrous oxide turnover in natural and engineered microbial communities: biological pathways, chemical reactions and novel technologies. Frontiers in Microbiology 3, 10.3389/fmicb.2012.00372.
Sutka, R. L., Ostrom, N. E., Ostrom, P. H., Breznak, J. A., Gandhi, H., Pitt, A. J. and Li, F. (2006). Distinguishing nitrous oxide production from nitrification and denitrification on the basis of isotopomer abundances. Applied and Environmental Microbiology 72(1), 638-644.
Tallec, G., Garnier, J., Billen, G. and Gousailles, M. (2006). Nitrous oxide emissions from secondary activated sludge in nitrifying conditions of urban wastewater treatment plants: Effect of oxygenation level. Water Research 40(15), 2972-2980.
Toyoda, S., Iwai, H., Koba, K. and Yoshida, N. (2009). Isotopomeric analysis of N2O dissolved in a river in the Tokyo metropolitan area. Rapid Communications in Mass Spectrometry 23(6), 809-821.
Toyoda, S., Suzuki, Y., Hattori, S., Yamada, K., Fujii, A., Yoshida, N., Kouno, R., Murayama, K. and Shiomi, H. (2011). Isotopomer analysis of production and consumption
Chapter 5
143
mechanisms of N2O and CH4 in an advanced wastewater treatment system. Environmental Science & Technology 45(3), 917-922.
Toyoda, S. and Yoshida, N. (1999). Determination of nitrogen isotopomers of nitrous oxide on a modified isotope ratio mass spectrometer. Analytical Chemistry 71(20), 4711-4718.
USEPA (2009). Inventory of U.S. Greenhouse Gas Emissions And Sinks: 1990-2007, U.S. Environmental Protection Agency, Washington DC, Report No. EPA 430-R09-004.
von Schulthess, R., Wild, D. and Gujer, W. (1994). Nitric and Nitrous Oxides from Denitrifying Activated-Sludge at Low-Oxygen Concentration. Water Science and Technology 30(6), 123-132.
Waechter, H., Mohn, J., Tuzson, B., Emmenegger, L. and Sigrist, M. W. (2008). Determination of N2O isotopomers with quantum cascade laser based absorption spectroscopy. Optics Express 16(12), 9239-9244.
Wunderlin, P., Lehmann, M. F., Siegrist, H., Tuzson, B., Joss, A., Emmenegger, L. and Mohn, J. (2013a). Isotope signatures of N2O in a mixed microbial population system: Constraints on N2O producing pathways in wastewater treatment. Environmental Science and Technology 47(3), 1339-1348.
Wunderlin, P., Mohn, J., Joss, A., Emmenegger, L. and Siegrist, H. (2012). Mechanisms of N2O production in biological wastewater treatment under nitrifying and denitrifying conditions. Water Research 46(4), 1027-1037.
Wunderlin, P., Siegrist, H. and Joss, A. (2013b). Online N2O measurement: The next standard for controlling biological ammonia oxidation? Environmental Science and Technology 47(17), 9567-9568.
Yamagishi, H., Westley, M. B., Popp, B. N., Toyoda, S., Yoshida, N., Watanabe, S., Koba, K. and Yamanaka, Y. (2007). Role of nitrification and denitrification on the nitrous oxide cycle in the eastern tropical North Pacific and Gulf of California. Journal of Geophysical Research-Biogeosciences 112, G02015.
Yu, R., Kampschreur, M. J., Loosdrecht, M. C. M. v. and Chandran, K. (2010). Mechanisms and specific directionality of autotrophic nitrous oxide and nitric oxide generation during transient anoxia. Environmental Science & Technology 44(4), 1313-1319.

Chapter 6
Effect of digester liquid addition on N2O production in a pilot-scale biological
wastewater treatment plant
Thesis chapter
Wunderlin, P., Kipf, M., Lotito, A.M., Joss, A., Siegrist, H.
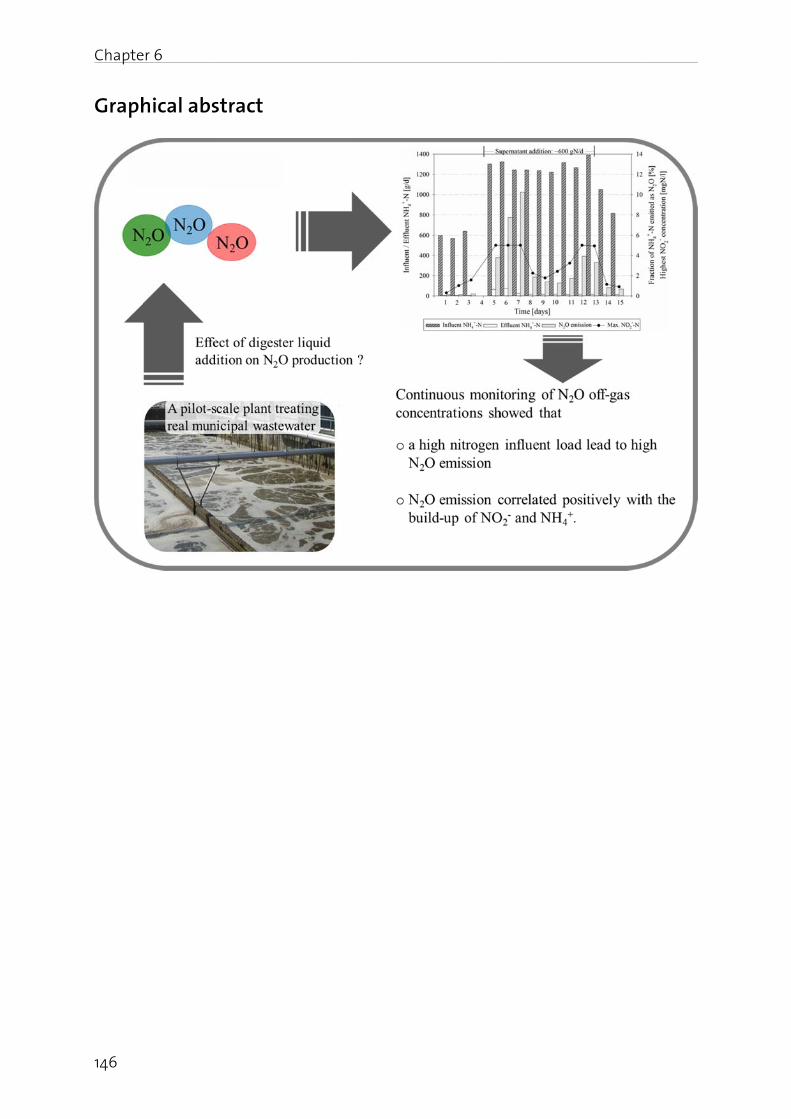
Chapte
146
Graph
er 6
hical absstract
Chapter 6
147
Abstract
Nitrous oxide (N2O) is an important greenhouse gas, involved in the stratospheric ozone depletion. Its emission from biological wastewater treatment should therefore be avoided. With regard to on-going debate about energetic optimization and efficient conventional treatment of ammonia-rich digester liquid, a better understanding of N2O dynamics as well as of emission levels is needed.
In the present study, we operated a pilot scale wastewater facility treating municipal wastewater and investigated the effect of peak as well as continuous digester liquid addition on N2O emission. Under ‘normal’ operating conditions (without digester liquid dosing), 0.1 to 0.6 % of the ammonia influent load was emitted as N2O, while being substantially increased at high nitrogen loads (during digester liquid peak addition), positively correlating with the build-up of ammonia (NH4
+) and nitrite (NO2-) in the
nitrification activated sludge tank. Results further show that continuous digester liquid addition (doubling ’normal‘ average nitrogen influent load) over 9 days, directly into the pre-denitrification reactor, resulted in high N2O emissions during the first 3 days (up to 10 %). Even though N2O emission decreased to a level of 1 to 4 % during the consecutive days, emission ranges were still high compared to ‘normal’ operating conditions. During a second continuous addition period, with variable influent loads, N2O emission levels were lower. These findings indicate that transient nitrification overloading leads to elevated N2O emission, and is therefore sensitive to digester liquid dosing. Moreover, nitrifier denitrification is hypothesized to be the dominant N2O production pathway, due to the positive correlation between N2O emission and dissolved NO2
- concentrations. A continuous online N2O off-gas measurement is deemed necessary for plant specific overall carbon footprint minimization.
Keywords
Biological wastewater treatment; denitrification; nitrification; nitrous oxide (N2O); digester liquid addition
Chapter 6
148
Introduction
Nitrous oxide (N2O) is an atmospheric pollutant relevant as a greenhouse gas (about 300 times stronger than carbon dioxide (CO2)) and a major sink of stratospheric ozone (Ravishankara et al., 2009). In the last decade, significant efforts have been made to reduce the energy consumption and to improve nitrogen (N) removal of wastewater treatment plants: since aeration is responsible for about 50 to 60 % of the total energy consumption, one of the most adopted solutions is to lower the aeration of the nitrification stage to the required minimum (Müller 2010; Wang et al., 2012). However, the resulting low dissolved oxygen (O2) concentrations in the aerated reactors are currently discussed to be one of the key factors impacting N2O production (Kampschreur et al., 2009). N2O emissions higher than 0.5 to 1 % compared to converted N, result in greenhouse gas emission equivalent to aeration energy consumption (Law et al., 2012). Consequently, N2O emissions have to be considered in energy optimization strategies, in order to avoid a net increase of greenhouse gas emission instead of the alleged reduction (Kampschreur et al., 2009).
In biological wastewater treatment, N2O is produced either during nitrification by ammonia oxidizing bacteria (AOB) or during heterotrophic denitrification by heterotrophic denitrifiers (HET). There is increasing evidence of a dominant N2O production pathway via nitrite (NO2
-) reduction by AOB, called nitrifier denitrification, strongly correlating with the build-up of ammonia (NH4
+) and NO2- (Tallec et al., 2006a;
Kampschreur et al., 2009; Ahn et al., 2010b; Houweling et al., 2011; Wunderlin et al., 2012). Hydroxylamine (NH2OH) oxidation to NO2
- (via intermediates such as nitric oxide, NO, or nitroxyl, HNO; Law et al., 2012; Schreiber et al., 2012) is currently discussed to be active at high NH4
+ oxidation rates in combination with high NH4+ and low NO2
- concentrations, but is probably of minor importance within concentration ranges typically found in conventional municipal wastewater treatment systems (Sutka et al., 2006; Yu et al., 2010; Wunderlin et al., 2013). Similarly, the contribution from heterotrophic denitrification is considered negligible under normal operating conditions, such as low NO2
- and no dissolved oxygen concentrations during denitrification (von Schulthess et al., 1994; Kampschreur et al., 2009).
The literature is currently inconsistent about the quantities of N2O emitted during wastewater treatment. For example:
Lotito et al. (2012) continuously measured N2O emission from the oxidation tank of a pilot activated sludge plant, and reported ranges of <0.04 to 0.1 %, with respect to influent N, for solid retention times higher than 15 days, but up to 0.3 % for a solid retention time of approximately 11 days.
von Schulthess and Gujer (1996) investigated N2O emission from a continuously fed full-scale wastewater treatment plant. Total N2O emissions were between 0.02 to 0.07 %, compared to total N input.
N2O emission of 12 full-scale treatment plants were monitored by Ahn et al. (2010b), and emission factors, in terms of N2O emitted compared to total N
Chapter 6
149
input, in the range of between 0.01 to 1.8 ± 0.79 % were reported (corresponding to 0.01 to 3.3 ± 1.5 % with respect to N removed).
A highly variable N2O emission range of 0.6 to 25.3 % (3.5 ± 2.7 % on average), with respect to N denitrified, has been calculated from an investigation across seven biological nutrient removal plants in Australia (Foley et al., 2010).
Likewise, no consensus has been achieved about the operating strategies to reduce N2O emission. Discussion has been focused on some factors that have been recognized to be mainly responsible for N2O production, such as (i) low dissolved O2 concentration during nitrification as well as heterotrophic denitrification, (ii) the accumulation of NO2
- and / or NH4
+ during nitrification, or (iii) a low ratio of readily biodegradable organic compounds to NO3
- during heterotrophic denitrification (Kampschreur et al., 2009; Ahn et al., 2010b; Desloover et al., 2012; Wunderlin et al., 2012). Recently, through the continuous operation of a pilot scale activated sludge plant combined with continuous N2O off-gas measurement, it has been demonstrated that N2O emissions follow a reproducible specific daily pattern: while emissions are quite negligible during night (at low N loads), it peaks in the morning during the hours of maximum N load, correlating with the build-up of NH4
+ and NO2- in the activated sludge tanks (Lotito et al., 2012).
In this study we investigated the impact of digester liquid addition on the dynamics as well as on the level of N2O production in a pilot-scale activated sludge plant, with the hypothesis that high N loading situations promote the build-up of NH4
+ and NO2-,
which in turn favors high N2O emissions. As a first step, short-term effects of digester liquid peak addition on N2O emission was evaluated. Then, the impact of continuous digester liquid addition over several days was investigated, in order to address potential biomass adaptation. To the best of our knowledge this is the first time that N2O off-gas concentrations are continuously monitored over several weeks, in combination with continuous measurement of dissolved NO2
- and NH4+ in the activated sludge tanks.
Materials and methods
Pilot plant set-up and operation
The pilot scale wastewater facility, treating around 60 to 80 population equivalents, consisted of a mechanical pre-treatment and a primary clarification, followed by an activated sludge treatment with pre-denitrification (Bio1) and two nitrification reactors (Bio2 and Bio3; each operated as a completely stirred tank reactor with a volume of about 7.5 m3) and a secondary clarifier (Figure 1). The plant was fed with municipal wastewater from the sewer system of the city of Dübendorf (Switzerland) and was operated at a solid retention time (referred to the biological compartments) of approximately 11 to 12 days (7 to 8 days aerobic) by wasting excess sludge from Bio1. The concentration of total suspended solids (TSS) was in the range of 1.6 to 1.8 g/l. Aeration was controlled at a constant dissolved oxygen (DO) concentration in the reactor (set-point at 0.5, 1 or 2 mgO2/l). Furthermore, an internal recirculation from the second nitrification tank into the pre-denitrification stage was applied at 1.5 m3/h, in order to

Chapte
150
maintadiurnalinfluenbetweeproport
The digSwitzerdosed dbelow).below 1
Figure wastewby two Further
Analyt
Off-gascontinuA 3-way36 minwas calwhile appm) wcomputto 1.249details and weemissioas N2O
er 6
in a suffic pattern, ct flow of
en 8 to 10 tionally to t
gester liquirland), was
directly int. The avera
1 mgN/l.
1. Flow swater. The p aerated rear online me
tical meth
s concentruously. They valve wautes), and librated th
a standard was used ted by mul9 mgN2O-N about the ere integraon factors by the tota
cient NO3-
hanging ev 0.7 m3/h b a.m.). The the influen
d from thes stored in to Bio1, eithge ammon
scheme ofplant was oactors (Bio2asurement
hods for of
ations of e sample gas used in o
missing daree times p gas (Carba
for the seltiplying thN/m3
air und accuracy oated over per day weal mass of N
load for devery two ho
between 4 return slu
nt flow.
e municipa our experiher continnia concent
f the pilotoperated w2 and Bio3)ts are indica
off-gas me
N2O (Roseas was drie
order to swata were su per week: dagas, Switzecond calie concentr
der standa of N2O off- time to eere then ca N in the inf
enitrificatioours, with a
4 to 6 a.m.udge, from
l wastewatmental hauously or btration wa
t scale wwith one pr). N2O was aated by dot
easureme
mount Aned prior to
witch betweupplement
dinitrogen (zerland) wbration po
ration by thrd conditio-gas measuvaluate th
alculated bflow presen
on. The inf an average.; maximum the secon
ter treatmell (neither
by disconts 800 mgN
wastewater re-denitrific analyzed intted lines.
ent
alytical X- analysis (Peen the offed by linea
(N2) was uswith known
oint. Thenhe air flow ons at 273.urement is
he total mby dividing nt as NH4
+.
fluent flowe value of 1.m influentndary clarif
ent plant W aerated noinuous (‘pe
N/l, while N
facility trcation reactn the off-ga
Stream X2KE 521, Bühf-gas of Bio
ar interpolased for zero concentra, N2O emi rate (1 ppm15 K and 1
s given in Lass of N2O
the total m
w followed .2 m3/h (mt flow of 1fier to Bio1
Werdhölzli or stirred) aeak’) addit
NO2- and NO
reating mtor (Bio1), fas of Bio2 a
2) were mhler Technoo2 and Bio
ation. The ao point caliation for Nission load
m N2O corre 013 mbar; Lotito et alO-N emitt
mass of N
a fixed inimum
.6 m3/h 1, varied
(Zürich, and was
ion (see O3
- were
unicipal followed and Bio3.
easured ologies).
o3 (every analyzer
bration,
2O (200 ds were esponds further ., 2012.), ed. N2O
emitted
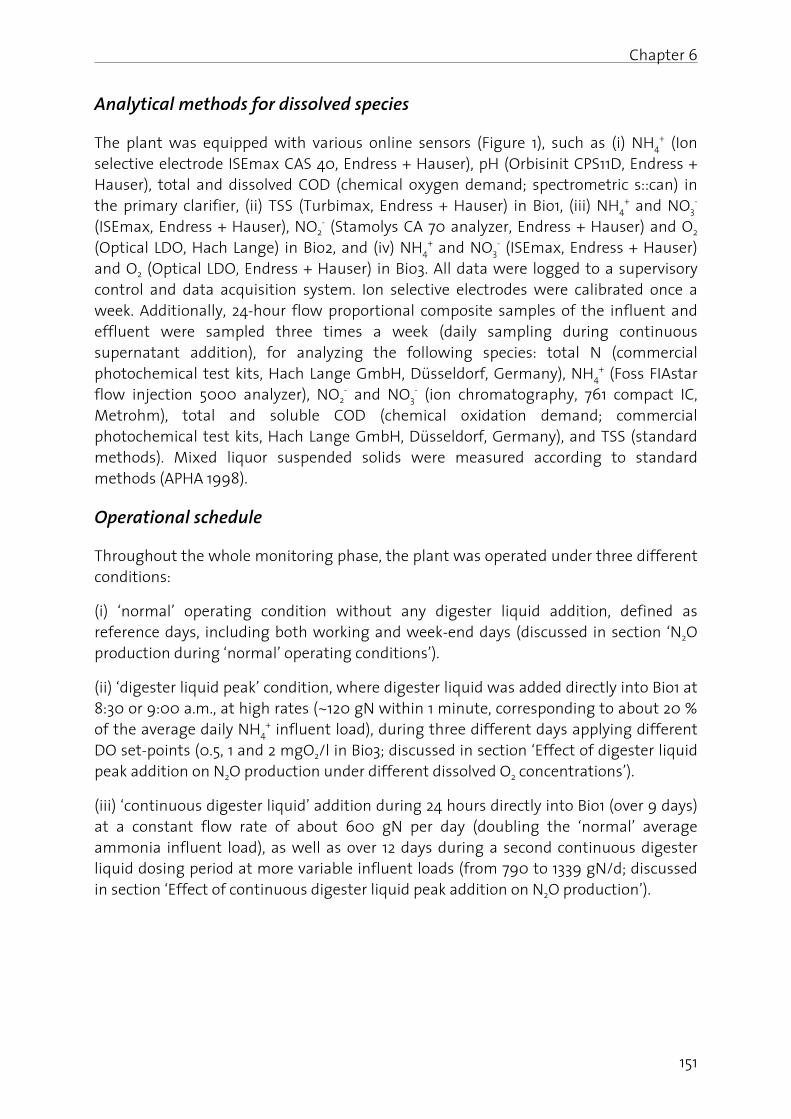
Chapter 6
151
Analytical methods for dissolved species
The plant was equipped with various online sensors (Figure 1), such as (i) NH4+ (Ion
selective electrode ISEmax CAS 40, Endress + Hauser), pH (Orbisinit CPS11D, Endress + Hauser), total and dissolved COD (chemical oxygen demand; spectrometric s::can) in the primary clarifier, (ii) TSS (Turbimax, Endress + Hauser) in Bio1, (iii) NH4
+ and NO3-
(ISEmax, Endress + Hauser), NO2- (Stamolys CA 70 analyzer, Endress + Hauser) and O2
(Optical LDO, Hach Lange) in Bio2, and (iv) NH4+ and NO3
- (ISEmax, Endress + Hauser) and O2 (Optical LDO, Endress + Hauser) in Bio3. All data were logged to a supervisory control and data acquisition system. Ion selective electrodes were calibrated once a week. Additionally, 24-hour flow proportional composite samples of the influent and effluent were sampled three times a week (daily sampling during continuous supernatant addition), for analyzing the following species: total N (commercial photochemical test kits, Hach Lange GmbH, Düsseldorf, Germany), NH4
+ (Foss FIAstar flow injection 5000 analyzer), NO2
- and NO3- (ion chromatography, 761 compact IC,
Metrohm), total and soluble COD (chemical oxidation demand; commercial photochemical test kits, Hach Lange GmbH, Düsseldorf, Germany), and TSS (standard methods). Mixed liquor suspended solids were measured according to standard methods (APHA 1998).
Operational schedule
Throughout the whole monitoring phase, the plant was operated under three different conditions:
(i) ‘normal’ operating condition without any digester liquid addition, defined as reference days, including both working and week-end days (discussed in section ‘N2O production during ‘normal’ operating conditions’).
(ii) ‘digester liquid peak’ condition, where digester liquid was added directly into Bio1 at 8:30 or 9:00 a.m., at high rates (~120 gN within 1 minute, corresponding to about 20 % of the average daily NH4
+ influent load), during three different days applying different DO set-points (0.5, 1 and 2 mgO2/l in Bio3; discussed in section ‘Effect of digester liquid peak addition on N2O production under different dissolved O2 concentrations’).
(iii) ‘continuous digester liquid’ addition during 24 hours directly into Bio1 (over 9 days) at a constant flow rate of about 600 gN per day (doubling the ‘normal’ average ammonia influent load), as well as over 12 days during a second continuous digester liquid dosing period at more variable influent loads (from 790 to 1339 gN/d; discussed in section ‘Effect of continuous digester liquid peak addition on N2O production’).
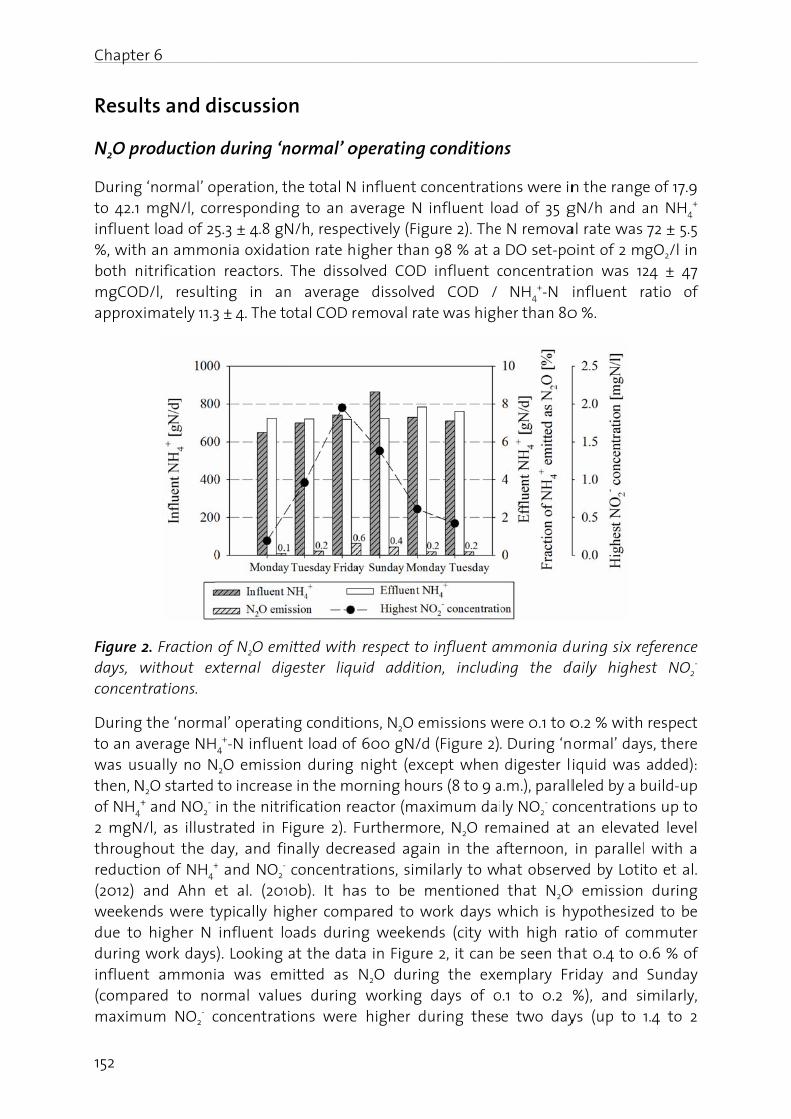
Chapte
152
Resul
N2O pr
During to 42.1 influen%, withboth nmgCODapprox
Figure 2days, wconcent
During to an awas usthen, Nof NH4
+
2 mgNthrougreducti(2012) weekendue to during influen(compamaxim
er 6
ts and d
roduction
‘normal’ o mgN/l, cot load of 2
h an ammoitrification
D/l, resultimately 11.3
2. Fraction without extrations.
the ‘normverage NH
sually no NN2O started
+ and NO2-
/l, as illusthout the don of NH4
+
and Ahn nds were t higher N work dayst ammoni
ared to noum NO2
- c
discussio
n during ‘n
operation, torrespondin5.3 ± 4.8 gN
onia oxidatn reactors.
ing in an3 ± 4. The t
of N2O emxternal dig
al’ operatiH4
+-N influeN2O emissio
to increase in the nitrtrated in F
day, and fi+ and NO2
- et al. (201 typically hi
influent los). Looking ia was em
ormal valuconcentrat
on
normal’ op
the total N ng to an aN/h, respection rate h The disson average
otal COD r
mitted with gester liqu
ng conditioent load of on during e in the moification re
Figure 2). Fnally decre concentra10b). It hagher compoads durin at the dat
mitted as es during
tions were
operating
influent coverage N ctively (Figigher than
olved COD e dissolved emoval rat
respect to uid additio
ons, N2O em 600 gN/d night (excorning houeactor (max
Furthermoeased agai
ations, simas to be mpared to wng weekenta in Figure N2O durin
working higher du
condition
oncentratio influent lo
ure 2). The 98 % at a influent cd COD / te was high
influent aon, includi
missions w (Figure 2)
cept when urs (8 to 9 aximum daire, N2O remin in the ailarly to w
mentioned work days w
ds (city we 2, it can b
ng the exe days of 0uring thes
ns
ons were inoad of 35 ge N remova DO set-po
concentrat NH4
+-N her than 80
mmonia duing the d
were 0.1 to 0. During ‘n digester li
a.m.), parallly NO2
- conmained at
afternoon, hat observ that N2O
which is hyith high ra
be seen themplary Fr0.1 to 0.2 %
e two day
n the rang gN/h and aal rate was oint of 2 mion was 12influent r
0 %.
uring six redaily highe
0.2 % withormal’ day
iquid was leled by a bncentration an elevat in parallelved by Lotit
O emissionypothesizeatio of comat 0.4 to 0
riday and %), and sys (up to
e of 17.9 an NH4
+ 72 ± 5.5 gO2/l in 24 ± 47 ratio of
eference est NO2
-
respect ys, there added):
build-up ns up to ed level l with a to et al. during
ed to be mmuter
0.6 % of Sunday imilarly,
1.4 to 2
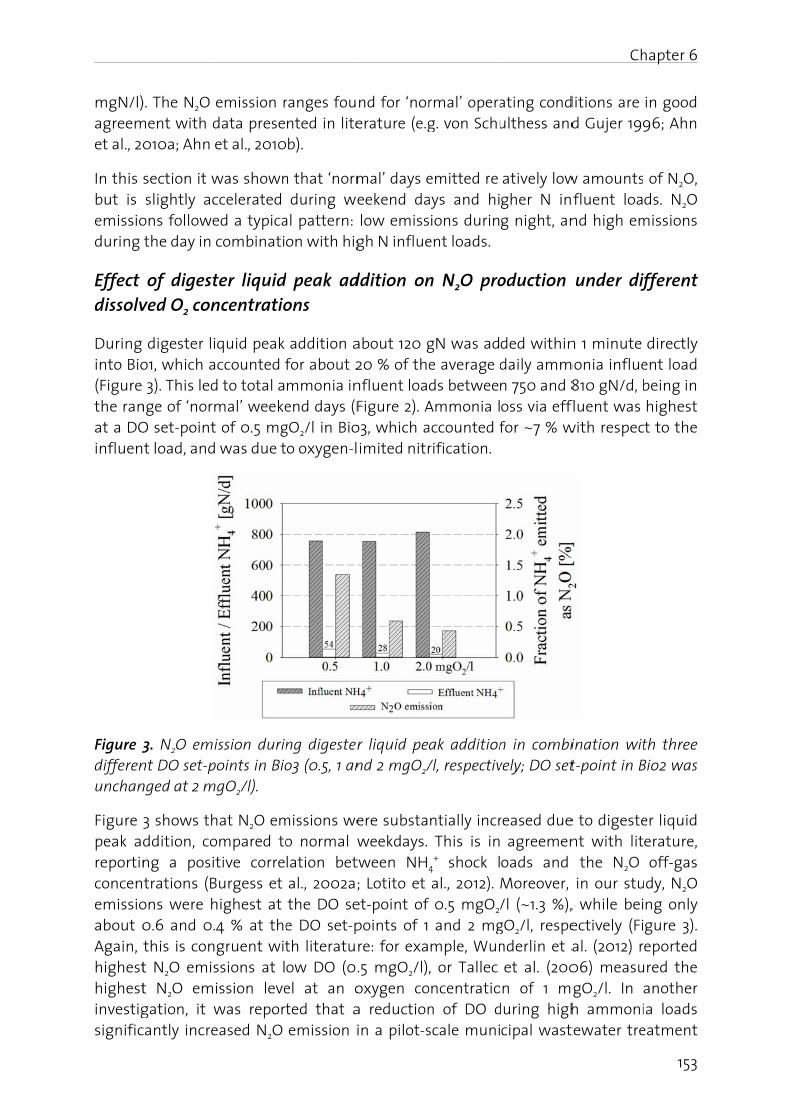
mgN/l)agreemet al., 20
In this but is emissioduring
Effect dissolv
During into Bio(Figure the ranat a DOinfluen
Figure 3differenunchan
Figure peak adreportinconcenemissioabout 0Again, highesthighestinvestigsignific
). The N2O ment with d
010a; Ahn
section it w slightly acons followe the day in
of digestved O2 con
digester lio1, which a 3). This led
nge of ‘normO set-pointt load, and
3. N2O emnt DO set-pnged at 2 m
3 shows thddition, cong a positrations (B
ons were h 0.6 and 0. this is cont N2O emist N2O emgation, it wcantly incre
emission r data prese et al., 2010
was shownccelerated ed a typica combinati
ter liquidncentratio
iquid peak accounted fd to total amal’ weeket of 0.5 mgd was due t
ission durinpoints in Bio
mgO2/l).
hat N2O emompared totive corre
Burgess et highest at
.4 % at thegruent witssions at lission leve
was reporteased N2O
ranges founted in liteb).
n that ‘norm during weal pattern: on with hig
d peak adons
addition a for about 2mmonia inend days (F
gO2/l in Bio o oxygen-l
ng digestero3 (0.5, 1 an
missions weo normal wlation bet al., 2002a; the DO see DO set-pth literatu
ow DO (0.el at an oted that a emission i
nd for ‘norerature (e.g
mal’ days eeekend da low emissgh N influe
ddition on
about 120 g 20 % of thenfluent loa
Figure 2). Ao3, which a
imited nitr
r liquid pend 2 mgO2/
ere substa weekdays. tween NH4
; Lotito et et-point of points of 1 re: for exa.5 mgO2/l),oxygen coa reduction in a pilot-s
rmal’ operag. von Schu
emitted relays and hiions durin
ent loads.
n N2O pro
gN was ade average dds betwee
Ammonia l accounted f
rification.
ak addition/l, respectiv
ntially incr This is in
4+ shock l
al., 2012). 0.5 mgO2
and 2 mgmple, Wun, or Tallec
oncentration of DO dscale muni
ating condulthess and
atively lowgher N ing night, an
oduction
ded within daily ammn 750 and 8
oss via eff for ~7 % w
n in combively; DO set
reased due agreemenoads and
Moreover, /l (~1.3 %),
gO2/l, respenderlin et a et al. (200n of 1 m
during highcipal wast
Ch
ditions are d Gujer 199
w amountsfluent loa
nd high em
under dif
n 1 minute monia influe
810 gN/d, bfluent was with respec
ination witt-point in B
e to digestent with lit the N2O in our stu, while beiectively (Fi
al. (2012) r06) measugO2/l. In h ammonitewater tre
hapter 6
153
in good 96; Ahn
of N2O, ds. N2O
missions
ifferent
directly ent load being in highest ct to the
th three Bio2 was
er liquid erature,
off-gas udy, N2O
ng only gure 3). eported
ured the another
ia loads eatment
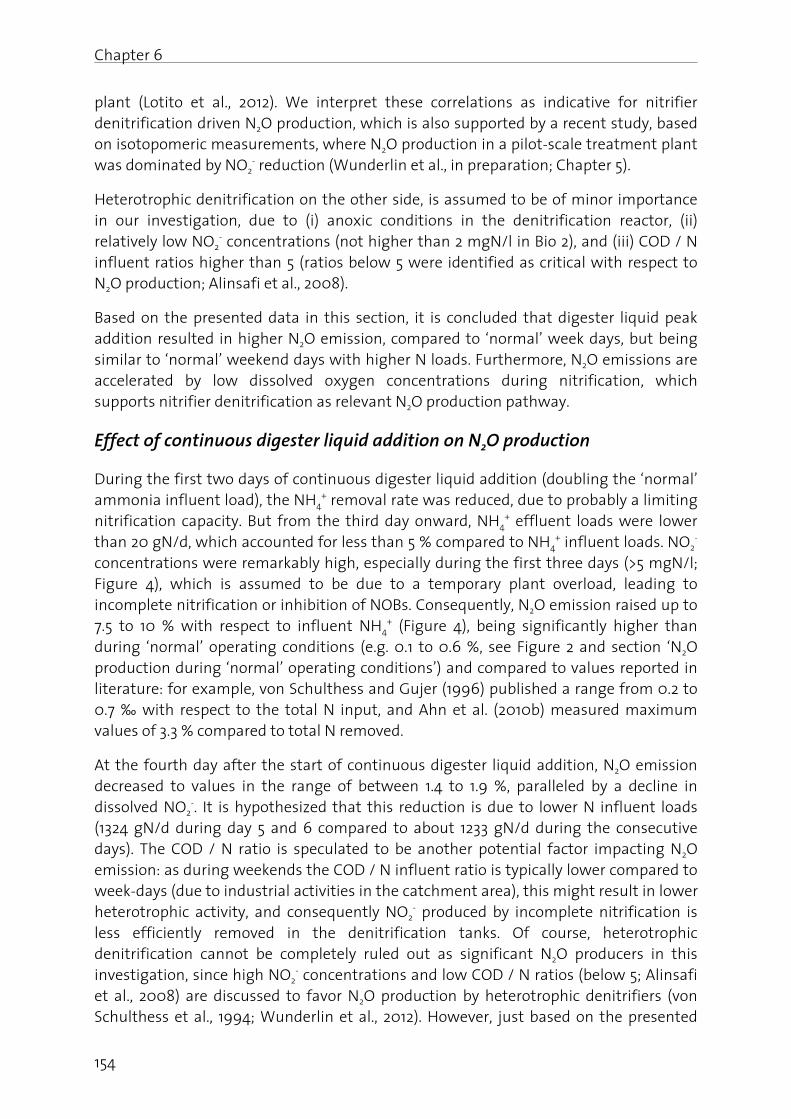
Chapter 6
154
plant (Lotito et al., 2012). We interpret these correlations as indicative for nitrifier denitrification driven N2O production, which is also supported by a recent study, based on isotopomeric measurements, where N2O production in a pilot-scale treatment plant was dominated by NO2
- reduction (Wunderlin et al., in preparation; Chapter 5).
Heterotrophic denitrification on the other side, is assumed to be of minor importance in our investigation, due to (i) anoxic conditions in the denitrification reactor, (ii) relatively low NO2
- concentrations (not higher than 2 mgN/l in Bio 2), and (iii) COD / N influent ratios higher than 5 (ratios below 5 were identified as critical with respect to N2O production; Alinsafi et al., 2008).
Based on the presented data in this section, it is concluded that digester liquid peak addition resulted in higher N2O emission, compared to ‘normal’ week days, but being similar to ‘normal’ weekend days with higher N loads. Furthermore, N2O emissions are accelerated by low dissolved oxygen concentrations during nitrification, which supports nitrifier denitrification as relevant N2O production pathway.
Effect of continuous digester liquid addition on N2O production
During the first two days of continuous digester liquid addition (doubling the ‘normal’ ammonia influent load), the NH4
+ removal rate was reduced, due to probably a limiting nitrification capacity. But from the third day onward, NH4
+ effluent loads were lower than 20 gN/d, which accounted for less than 5 % compared to NH4
+ influent loads. NO2-
concentrations were remarkably high, especially during the first three days (>5 mgN/l; Figure 4), which is assumed to be due to a temporary plant overload, leading to incomplete nitrification or inhibition of NOBs. Consequently, N2O emission raised up to 7.5 to 10 % with respect to influent NH4
+ (Figure 4), being significantly higher than during ‘normal’ operating conditions (e.g. 0.1 to 0.6 %, see Figure 2 and section ‘N2O production during ‘normal’ operating conditions’) and compared to values reported in literature: for example, von Schulthess and Gujer (1996) published a range from 0.2 to 0.7 ‰ with respect to the total N input, and Ahn et al. (2010b) measured maximum values of 3.3 % compared to total N removed.
At the fourth day after the start of continuous digester liquid addition, N2O emission decreased to values in the range of between 1.4 to 1.9 %, paralleled by a decline in dissolved NO2
-. It is hypothesized that this reduction is due to lower N influent loads (1324 gN/d during day 5 and 6 compared to about 1233 gN/d during the consecutive days). The COD / N ratio is speculated to be another potential factor impacting N2O emission: as during weekends the COD / N influent ratio is typically lower compared to week-days (due to industrial activities in the catchment area), this might result in lower heterotrophic activity, and consequently NO2
- produced by incomplete nitrification is less efficiently removed in the denitrification tanks. Of course, heterotrophic denitrification cannot be completely ruled out as significant N2O producers in this investigation, since high NO2
- concentrations and low COD / N ratios (below 5; Alinsafi et al., 2008) are discussed to favor N2O production by heterotrophic denitrifiers (von Schulthess et al., 1994; Wunderlin et al., 2012). However, just based on the presented
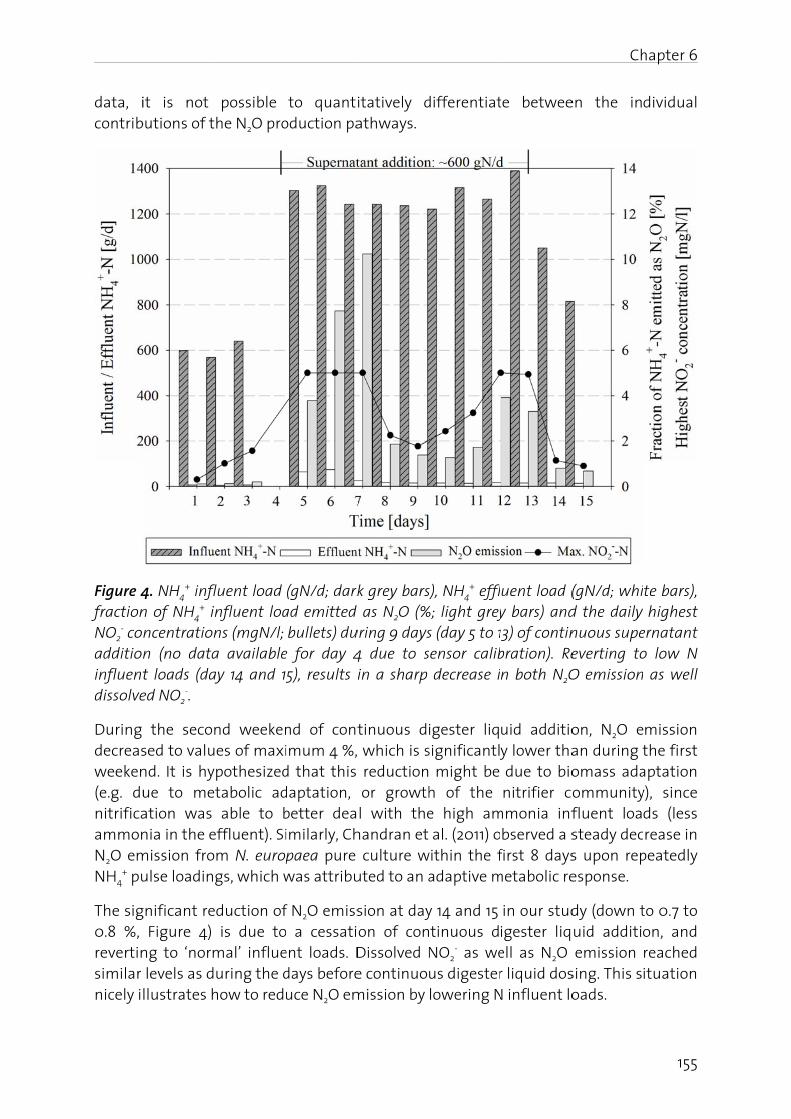
data, icontrib
Figure 4fractionNO2
- coadditioninfluentdissolve
During decreasweeken(e.g. dunitrificaammonN2O emNH4
+ pu
The sig0.8 %, revertinsimilar nicely i
it is not butions of t
4. NH4+ infl
n of NH4+ i
ncentrationn (no datat loads (daed NO2
-.
the seconsed to valund. It is hyue to meation was nia in the e
mission froulse loadin
gnificant re Figure 4) ng to ‘norm levels as d
llustrates h
possible he N2O pro
fluent load nfluent loans (mgN/l; a availableay 14 and 1
nd weekenes of maxipothesizedtabolic ad able to b
effluent). Sim N. europgs, which w
eduction of is due tomal’ influeuring the d
how to red
to quantioduction pa
(gN/d; darkad emitted bullets) du
e for day 45), results i
nd of contimum 4 %,d that this daptation, better deaimilarly, Chpaea pure
was attribu
f N2O emiss a cessati
ent loads. D days beforeuce N2O em
itatively dathways.
k grey bars as N2O (%
uring 9 days4 due to s in a sharp
tinuous d which is s reduction
or growthl with the
handran et culture w
uted to an a
sion at dayon of con
Dissolved Ne continuomission by
differentiat
s), NH4+ effl
%; light greys (day 5 to 1sensor calib decrease i
igester liq significantl
might be h of the e high am al. (2011) o
within the f adaptive m
y 14 and 15 tinuous d
NO2- as we
us digester lowering N
te betwee
uent load (y bars) and13) of continbration). Ren both N2O
uid additioy lower tha due to bio
nitrifier commonia inf
bserved a s first 8 daysmetabolic re
in our studigester liqell as N2O r liquid dos
N influent lo
Ch
en the in
(gN/d; whid the daily nuous supeeverting toO emission
on, N2O ean during tomass adaommunityfluent loa
steady decs upon repesponse.
dy (down tuid additio
emission sing. This s
oads.
hapter 6
155
dividual
te bars), highest
ernatant o low N as well
mission the first aptation y), since ds (less rease in
peatedly
to 0.7 to on, and
reached ituation
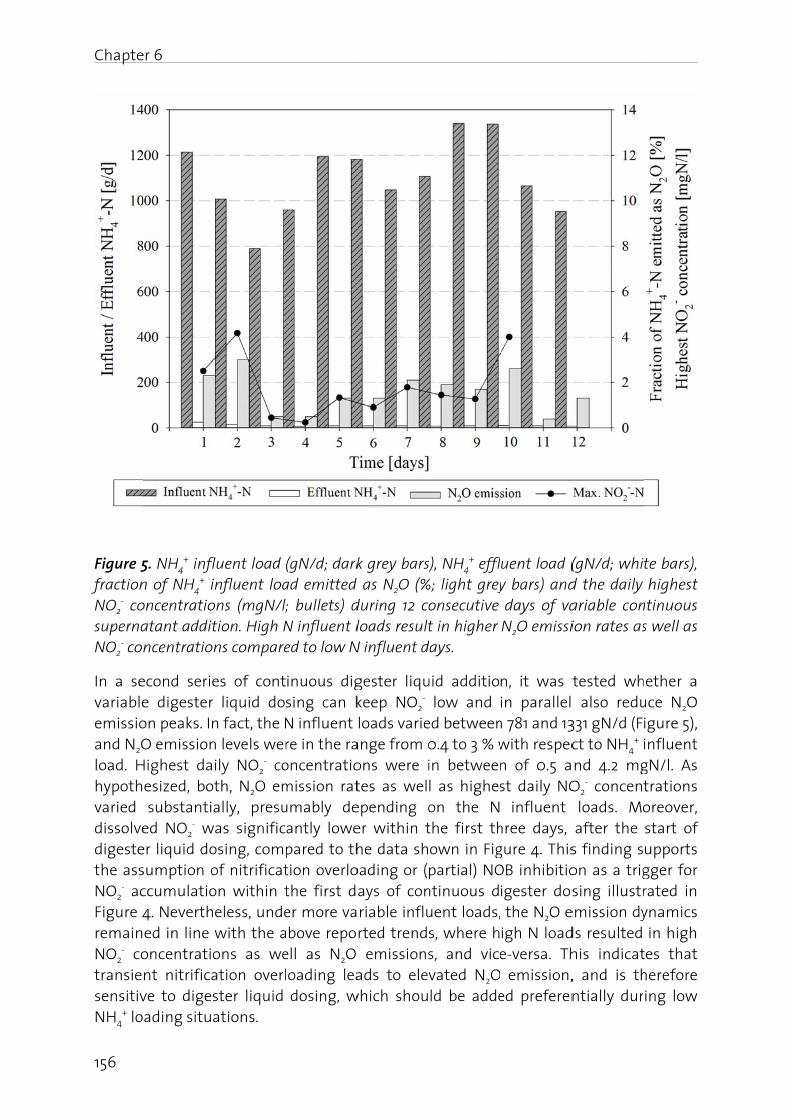
Chapte
156
Figure 5fractionNO2
- cosupernaNO2
- co
In a sevariableemissioand N2Oload. Hhypothvaried dissolvedigestethe assNO2
- acFigure 4remainNO2
- cotransiesensitivNH4
+ lo
er 6
5. NH4+ infl
n of NH4+ i
oncentratioatant additncentration
econd seriee digester on peaks. InO emission
Highest daesized, bot
substantiaed NO2
- wer liquid dosumption occumulatio 4. Neverthed in line
oncentrationt nitrificave to digesading situa
luent load nfluent loa
ons (mgN/l;tion. High Nns compare
es of cont liquid don fact, the Nn levels werily NO2
- coth, N2O emally, presuas signific
osing, com of nitrificaton within teless, unde
with the aons as weation overlster liquid ations.
(gN/d; darkad emitted ; bullets) dN influent led to low N
inuous digsing can k
N influent re in the raoncentratiomission ratumably deantly lowepared to thtion overlo
the first der more vabove repo
ell as N2O oading lea
dosing, w
k grey bars) as N2O (%
during 12 co loads resultN influent d
gester liqu keep NO2
- loads varieange from 0ons were ites as welepending oer within the data sh
oading or (ays of conriable influrted trend emissionsads to elev
which shou
), NH4+ effl
%; light greyonsecutive t in higher
days.
uid additio low and ed between 0.4 to 3 % w
in betweenl as higheson the N
the first thown in Fig
partial) NOntinuous duent loads,s, where hs, and vicevated N2Old be adde
uent load (y bars) and days of va N2O emissi
n, it was t in parallel n 781 and 13 with respecn of 0.5 ast daily NO influent
hree days, gure 4. ThisOB inhibitioigester dos the N2O eigh N loade-versa. Th emission,
ed preferen
(gN/d; whid the daily ariable conion rates as
tested wh also redu
331 gN/d (Fct to NH4
+ nd 4.2 mg
O2- concen
loads. Mo after the s finding son as a trigsing illustr
emission dyds resulted his indicat, and is thntially dur
te bars), highest
ntinuous s well as
hether a uce N2O igure 5), influent gN/l. As trations oreover,
start of upports gger for rated in ynamics in high
tes that herefore ing low
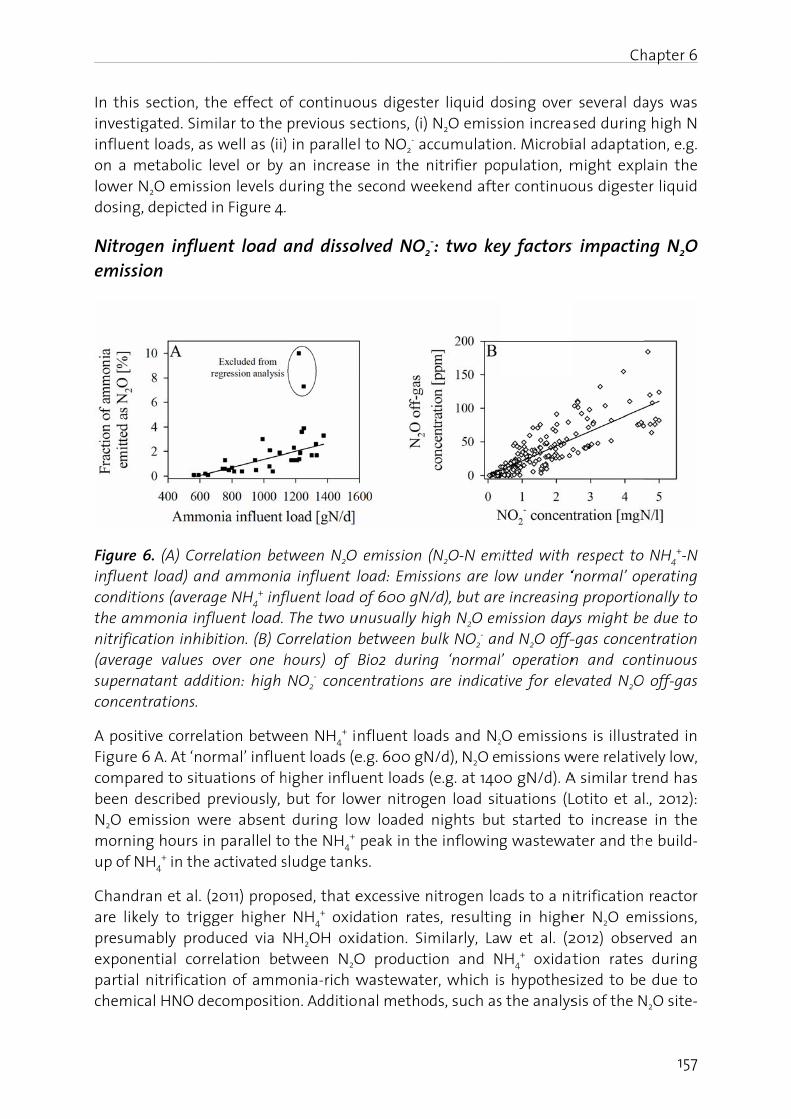
In this investiginfluenon a mlower Ndosing,
Nitrogemissi
Figure influentconditiothe amnitrifica(averagsupernaconcent
A positFigure 6comparbeen dN2O emmorninup of N
Chandrare likepresumexponepartial chemic
section, thgated. Simt loads, as
metabolic le N2O emissio
, depicted i
gen influeion
6. (A) Corrt load) andons (averagmonia infl
ation inhibge values oatant addittrations.
ive correla 6 A. At ‘norred to situaescribed p
mission weng hours inNH4
+ in the a
ran et al. (2ely to trigg
mably prodential corre nitrificatiocal HNO de
he effect oilar to the well as (ii)evel or by on levels d
n Figure 4.
ent load a
relation betd ammoniage NH4
+ influent load. ition. (B) Cover one htion: high
tion betwermal’ influeations of h
previously, ere absent parallel to
activated s
2011) propoger higher uced via Nelation beton of ammcompositio
of continuo previous se) in paralle an increasuring the
and disso
tween N2O a influent lfluent load The two uorrelation hours) of B NO2
- conce
een NH4+ i
ent loads (ehigher influ but for low during lo
o the NH4+
sludge tank
osed, that e NH4
+ oxid NH2OH oxi
tween N2Omonia-rich w
on. Additio
ous digesteections, (i) l to NO2
- acse in the n second we
olved NO2
emission load: Emiss of 600 gN
unusually h between bBio2 durinentrations
nfluent loa e.g. 600 gNuent loads wer nitrogw loaded peak in thks.
excessive ndation rateidation. SimO product
wastewatenal metho
er liquid do N2O emissccumulatio
nitrifier poeekend afte
2-: two key
(N2O-N emsions are lo
N/d), but areigh N2O emulk NO2
- anng ‘normal are indicat
ads and N2
N/d), N2O e (e.g. at 140en load sit
nights bute inflowing
nitrogen loes, resultinmilarly, Lawion and N
er, which isds, such as
osing over sion increaon. Microbipulation, m
er continuo
ey factors
mitted with ow under ‘e increasingmission daynd N2O off-’ operationtive for ele
2O emissionmissions w
00 gN/d). Atuations (Lt started tg wastewa
ads to a nng in highew et al. (2
NH4+ oxidat
s hypothess the analys
Ch
r several dased duringial adaptat
might expous digeste
s impactin
respect to‘normal’ opg proportioys might be
f-gas concenn and conevated N2O
ns is illust were relativ A similar trLotito et a
to increaseater and th
itrificationer N2O em2012) obsetion rates
sized to besis of the N
hapter 6
157
ays was g high N tion, e.g. lain the er liquid
ng N2O
NH4+-N
perating onally to e due to ntration
ntinuous O off-gas
rated in vely low, end has l., 2012): e in the e build-
reactor missions,
rved an during
e due to N2O site-
Chapter 6
158
specific isotopic signature, are needed to obtain a more accurate allocation of the emissions reported in this study.
The correlation between dissolved NO2- and the N2O off-gas concentrations is shown in
Figure 6 B: nitrification at high dissolved NO2- concentration, leads to high N2O
emissions. This is comparable to former investigations reporting increasing N2O emissions upon NO2
- build-up (Burgess et al., 2002a; Burgess et al., 2002b; Shiskowski and Mavinic 2006). Such a correlation is consistent with the general understanding of NO2
- reduction as the dominant pathway for N2O production in biological wastewater treatment (Colliver and Stephenson 2000), and leads to the conclusion that plants operated at low dissolved NO2
- (and NH4+) emit only low amounts of N2O, which was
confirmed by ceasing continuous digester dosing (day 14 and 15 shown in Figure 4).
Implementation of continuous online N2O measurement for reducing overall carbon footprint of biological wastewater treatment
A continuous N2O off-gas monitoring is recommended in order to elucidate and adopt appropriate plant specific operating strategies, which is supported by a recent finding of Daelman et al. (2013) who showed that continuous long-term online monitoring is required to capture N2O emission ranges accurately and emission dynamics more fully.
The application of continuous N2O off-gas analysis in conventional biological wastewater treatment was already proposed by Burgess et al. (2002b), who came up with the idea of using N2O off-gas emission measurement as an indicator for monitoring nitrification process stability: it was shown that nitrification failure (e.g. due to microbial inhibition) or during NH4
+ shock loads resulted in NO2- build-up and in
increasing N2O off-gas concentrations (similar to our data). Their work resulted in an international patent application (number PCT/GB00/01094), which was further developed by Butler et al. (2009) who investigated N2O off-gas measurement as a tool for early warning of biological nitrification failure: basically, an increase in N2O was detected in parallel to an increase in NO2
-. However, to our knowledge, this idea was not further developed nor applied in full-scale treatment plants.
The accumulation of NO2- is unwanted but difficult to measure so far. As such, based on
the correlation between dissolved NO2- and N2O emission, the latter could be used as an
indirect measure for NO2- accumulation. Still, it is to be elucidated whether, beside
nitrifier denitrification, also NH2OH oxidation contributes substantially to N2O production under specific operating conditions, as for example in a sequencing batch operating mode or during partial nitrification, since the NH2OH pathway is not expected to correlated with dissolved NO2
-. Nevertheless, by controlling activated sludge treatment processes at minimal N2O emissions, the contribution from both pathways, NH2OH oxidation as well as nitrifier denitrification, will be low.
Chapter 6
159
Conclusions
The effect of digester liquid addition on N2O production during conventional biological wastewater treatment was evaluated in this study, with the hypothesis that high N load situations promote the build-up of NH4
+ and NO2- in the activated sludge tanks,
which in turn favors high N2O emission. The conclusion can be summarized as follows:
The external addition of digester liquid (high N load situation) significantly increased the N2O emission rate compared to ‘normal’ operating conditions. Consequently, ammonia rich digester liquid should be dosed preferentially during low ammonia loads.
N2O emissions were lower when activated sludge was adapted to continuously high N influent loads, presumably by an increase of the nitrifier population. Thus, ammonia rich digester liquid could be added to bridge low N load situations in order to maintain a ‘strong’ nitrifier community.
N2O emission correlated with the N influent load and the build-up of NO2- (and
NH4+) in the nitrification reactor. As a consequence, plants facing high N influent
load variations, should be operated at sufficient dissolved oxygen, in order to avoid incomplete nitrification and to keep NO2
- low (< 1 to 2 mgN/l; e.g. aeration with NH4
+ control).
Energetic optimization of wastewater treatment by reducing aeration (and O2 input) is critical, especially during high N loads. Therefore, it is recommended to reduce (or switching off) the aeration solely at low N load situations.
A continuous online N2O off-gas measurement is deemed necessary for plant specific overall greenhouse gas minimization.
Acknowledgements
This study was financially supported by the Swiss Federal Office for the Environment (FOEN), the canton of Bern (AWA), the canton of Basel-Landschaft (AIB), the canton of St. Gallen (AFU), the canton of Thurgau (AfU), the canton of Zurich (AWEL), TBF + Partner AG Consulting Engineers, WWTP region Bern, WWTP ProRheno, WWTP REAL Luzern, WWTP Zurich-Werdhölzli, WWTP Worblental, Abwasserverband Altenrhein, Abwasserverband Morgental, Entsorgung St. Gallen, Zentralschweizer Umweltdirektorenkonferenz (ZUDK) and Eawag. Special thanks go to Jakob Eugster, Anja Wohlhauser, Karin Rottermann, Claudia Bänninger-Werffeli and Richard Fankhauser (Eawag) for helpful assistance and support during the experimental phase. We also thank Joachim Mohn (Empa, Swiss Federal Laboratories for Materials Testing and Research) for helpful discussions concerning off-gas measurement.
Chapter 6
160
References
Ahn, J. H., Kim, S., Park, H., Katehis, D., Pagilla, K. and Chandran, K. (2010a). Spatial and temporal variability in atmospheric nitrous oxide generation and emission from full-scale biological nitrogen removal and non-BNR processes. Water Environment Research 82(12), 2362-2372.
Ahn, J. H., Kim, S., Park, H., Rahm, B., Pagilla, K. and Chandran, K. (2010b). N2O Emissions from Activated Sludge Processes, 2008-2009: Results of a National Monitoring Survey in the United States. Environmental Science & Technology 44(12), 4505-4511.
Alinsafi, A., Adouani, N., Beline, F., Lendormi, T., Limousy, L. and Sire, O. (2008). Nitrite effect on nitrous oxide emission from denitrifying activated sludge. Process Biochemistry 43(6), 683-689.
APHA, AWWA and WEF (1998). Standard Methods for the Examination of Water and Wastewater. 20th ed. American Public Health Association, American Water Works Association, Water Environment Federation. Washington, DC, USA, 1220pp.
Burgess, J. E., Colliver, B. B., Stuetz, R. M. and Stephenson, T. (2002a). Dinitrogen oxide production by a mixed culture of nitrifying bacteria during ammonia shock loading and aeration failure. Journal of Industrial Microbiology & Biotechnology 29(6), 309-313.
Burgess, J. E., Stuetz, R. M., Morton, S. and Stephenson, T. (2002b). Dinitrogen oxide detection for process failure early warning systems. Water Science and Technology 45(4-5), 247-254.
Butler, M. D., Wang, Y. Y., Cartmell, E. and Stephenson, T. (2009). Nitrous oxide emissions for early warning of biological nitrification failure in activated sludge. Water Research 43(5), 1265-1272.
Chandran, K., Stein, L. Y., Klotz, M. G. and Van Loosdrecht, M. C. M. (2011). Nitrous oxide production by lithotrophic ammonia-oxidizing bacteria and implications for engineered nitrogen-removal systems. Biochemical Society Transactions 39(6), 1832-1837.
Colliver, B. B. and Stephenson, T. (2000). Production of nitrogen oxide and dinitrogen oxide by autotrophic nitrifiers. Biotechnology Advances 18(3), 219-232.
Daelman, M. R. J., De Baets, B., van Loosdrecht, M. C. M. and Volcke, E. I. P. (2013). Influence of sampling strategies on the estimated nitrous oxide emission from wastewater treatment plants. Water Research 47(9), 3120-3130.
Desloover, J., Vlaeminck, S. E., Clauwaert, P., Verstraete, W. and Boon, N. (2012). Strategies to mitigate N2O emissions from biological nitrogen removal systems. Current Opinion in Biotechnology, doi:10.1016/j.copbio.2011.12.030.
Foley, J., de Haas, D., Yuan, Z. and Lant, P. (2010). Nitrous oxide generation in full-scale biological nutrient removal wastewater treatment plants. Water Research 44(3), 831-844.
Chapter 6
161
Houweling, D., Wunderlin, P., Dold, P., Bye, C., Joss, A. and Siegrist, H. (2011). N2O emissions: Modeling the effect of process configuration and diurnal loading patterns. Water Environment Research 83(12), 2131-2139.
Kampschreur, M. J., Temmink, H., Kleerebezem, R., Jetten, M. S. M. and van Loosdrecht, M. C. M. (2009). Nitrous oxide emission during wastewater treatment. Water Research 43(17), 4093-4103.
Law, Y., Ni, B.-J., Lant, P. and Yuan, Z. (2012). N2O production rate of an enriched ammonia oxidising bateria culture exponentially correlates to its ammonia oxidation rate. Water Research 46(10), 3409-3419.
Lotito, A. M., Wunderlin, P., Joss, A., Kipf, M. and Siegrist, H. (2012). Nitrous oxide emissions from the oxidation tank of a pilot activated sludge plant. Water Research 46(11), 3563-3573.
Müller, E. A. (2010). Handbuch Energie in ARA. Verband Schweizer Abwasser- und Gewässerschutzfachleute (VSA).
Ravishankara, A. R., Daniel, J. S. and Portmann, R. W. (2009). Nitrous oxide (N2O): the dominant ozone-depleting substance emitted in the 21st century. Science 326(5949), 123-125.
Schreiber, F., Wunderlin, P., Udert, K. M. and Wells, G. F. (2012). Nitric oxide and nitrous oxide turnover in natural and engineered microbial communities: biological pathways, chemical reactions and novel technologies. Frontiers in evolutionary and genomic microbiology.
Shiskowski, D. M. and Mavinic, D. S. (2006). The influence of nitrite and pH (nitrous acid) on aerobic-phase, autotrophic N2O generation in a wastewater treatment bioreactor. Journal of Environmental Engineering and Science 5(4), 273-283.
Sutka, R. L., Ostrom, N. E., Ostrom, P. H., Breznak, J. A., Gandhi, H., Pitt, A. J. and Li, F. (2006). Distinguishing nitrous oxide production from nitrification and denitrification on the basis of isotopomer abundances. Applied and Environmental Microbiology 72(1), 638-644.
Tallec, G., Garnier, J., Billen, G. and Gousailles, M. (2006). Nitrous oxide emissions from secondary activated sludge in nitrifying conditions of urban wastewater treatment plants: Effect of oxygenation level. Water Research 40(15), 2972-2980.
von Schulthess, R. and Gujer, W. (1996). Release of nitrous oxide (N2O) from denitrifying activated sludge: Verification and application of a mathematical model. Water Research 30(3), 521-530.
von Schulthess, R., Wild, D. and Gujer, W. (1994). Nitric and Nitrous Oxides from Denitrifying Activated-Sludge at Low-Oxygen Concentration. Water Science and Technology 30(6), 123-132.
Chapter 6
162
Wang, X., Liu, J., Ren, N.-Q. and Duan, Z. (2012). Environmental profile of typical anaerobic/anoxic/oxic wastewater treatment systems meeting increasingly stringent treatment standars from a life cycle perspective. Bioresource Technology, 10.1016/j.biortech.2012.09.009.
Wunderlin, P., Lehmann, M. F., Siegrist, H., Tuzson, B., Joss, A., Emmenegger, L. and Mohn, J. (2013). Isotope signatures of N2O in a mixed microbial population system: Constraints on N2O producing pathways in wastewater treatment. Environmental Science and Technology 47(3), 1339-1348.
Wunderlin, P., Mohn, J., Joss, A., Emmenegger, L. and Siegrist, H. (2012). Mechanisms of N2O production in biological wastewater treatment under nitrifying and denitrifying conditions. Water Research 46(4), 1027-1037.
Wunderlin, P., Mohn, J., Joss, A., Emmenegger, L. and Siegrist, H. (in preparation). Nitrogen isotopic signature of N2O emitted from a pilot scale municipal wastewater treatment plant.
Yu, R., Kampschreur, M. J., Loosdrecht, M. C. M. v. and Chandran, K. (2010). Mechanisms and specific directionality of autotrophic nitrous oxide and nitric oxide generation during transient anoxia. Environmental Science & Technology 44(4), 1313-1319.
Chapter 7
Monitoring N2O emission for indirect NO2-
measurement and nitritation-anammox process control
Thesis chapter
Wunderlin, P., Joss, A., Kipf, M., Siegrist, H.
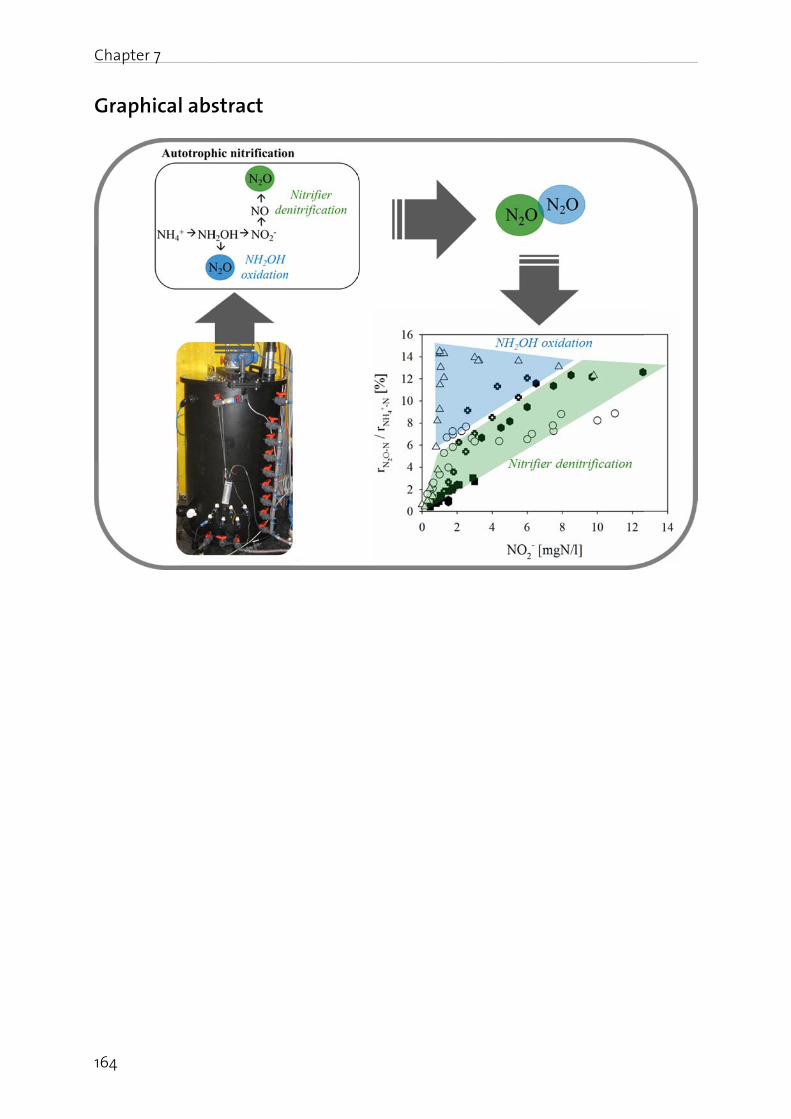
Chapte
164
Graph
er 7
hical absstract
Chapter 7
165
Abstract
Nitrous oxide (N2O) is a strong greenhouse gas and involved in the destruction of the stratospheric ozone layer. N2O production mechanisms of nitritation-anammox processes are not fully understood, but hypothesized to depend on dissolved NO2
- concentrations. Latter accumulates if the process is not stable and promotes growth of unwanted nitrite oxidizing bacteria (NOB), but so far, NO2
- is not easily measured online. Therefore, NO2
- is expected to be monitored indirectly via N2O off-gas analysis.
In this investigation, a single-stage pilot-scale nitritation-anammox process was fed with digester liquid. The reactor was temporary operated at high aeration rates, up to the double of the usually applied airflow rates, in order to accumulate NO2
-, and thus to test the correlation between NO2
- and N2O. Results show that N2O emissions were controlled by the airflow rate: high aeration rates resulted in high NO2
- concentrations as well as high N2O emissions. However, there was not always a clear correlation between dissolved NO2
- and N2O off-gas concentrations, which is hypothesized to be due to NH2OH oxidation activity (another N2O production pathway). Nevertheless, reactor operation controlled at minimal N2O emission kept stable ammonia (NH4
+) removal rates at low NO2
- concentrations (<0.6 mgN/l). This is a promising finding and supports future directions incorporating continuous N2O off-gas measurement in the automatic process control, for example to control the airflow rate.
Keywords
Aeration rate; Nitrous oxide (N2O); Nitrite (NO2-); Nitritation-anammox process control
Chapter 7
166
Introduction
Nitrous oxide (N2O) is a strong greenhouse gas, involved in the destruction of the stratospheric ozone layer (Ravishankara et al., 2009). However, N2O production and its relevance in biological wastewater treatment is still under debate. There is only a limited number of studies, investigating N2O production mechanisms and emission levels from anammox-based nitrogen (N) removal processes. For example, Kampschreur et al. (2008) measured an N2O emission rate of 2.3 % with respect to the N load during full-scale two-stage reject water treatment. And an emission level of 9.6±3.2 %, with respect to N removed, was reported for a lab-scale two-stage granular nitrification-anammox process (Okabe et al., 2011). In another study, 1.2 % of the N load was emitted as N2O from a full-scale single-stage granular reactor (Kampschreur et al., 2009). Similarly, Joss et al. (2009) investigated N2O emission from a single-stage nitritation-anammox reactor with suspended biomass, and measured an N2O emission rate of 0.6 % with respect to removed N during intermittent aeration, and 0.4 % during continuous aeration, respectively.
These data reveal that N2O emission ranges from anammox-based systems can be relevant, depending on the operating conditions. And in some situations, N2O emission might even annihilate the avoided environmental impact achieved by lower energy consumption and organic carbon requirements compared to conventional treatment schemes.
In addition to greenhouse gas emission, process stability is another issue of nitritation-anammox processes. Currently, an active discussion concerning the selection of suitable sensors for process control, such as pH, conductivity, NH4
+ or O2, and on process control strategies is going on (e.g. Joss et al., 2011). A volumetric aeration control was recently proposed to be crucial for process stability in a single-stage nitritation-anammox reactor, since O2 supply beyond depletion by AOB (e.g. during situations of over-aeration) can lead to anammox inhibition and thus favor NOB growth. Such process instability could be detected at an early stage by online monitoring of NO2
-. However, this requires a suitable online electrode with sufficient resolution (measuring few mgNO2
--N/l in digester liquid on the background of 0 to >100 mgNO3--N/l), which
is, to the author’s knowledge, currently not commercially available. However, based on the findings of enzymatic NO2
- reduction as a dominant N2O production pathway in biological wastewater treatment (e.g. Colliver and Stephenson 2000; Kampschreur et al., 2009; Wunderlin et al., 2012), and the confirmation of increased N2O off-gas concentrations upon NO2
- accumulation in a granular nitritation-anammox system operated at high dissolved oxygen (DO; >2 mgO2/l) (Kampschreur et al., 2009), it is hypothesized that dissolved NO2
- can be monitored indirectly via the measurement of N2O off-gas concentration (see also Butler et al., 2009 and Colliver et al., 2002). Thus, N2O emission rates, as a proxy for NO2
- concentration, could be used to control the aeration rate, as well as to design process control strategies reducing environmentally relevant gaseous emissions of the nitritation-anammox systems.
Chapter 7
167
Materials and methods
Set-up and operation of the nitritation-anammox pilot-scale sequencing batch reactor (SBR)
A 400 liter one-stage nitritation-anammox pilot-scale reactor was operated in sequencing batch mode with digester liquid from the full-scale wastewater treatment plant Werdhölzli (Switzerland). The SBR cycle always included the following phases: (i) feeding (15 to 20 % volume exchange) with mixing, (ii) aeration, (iii) mixing, (iv) sedimentation, and (v) discharge (a typical SBR cycle is illustrated in Figure 2). A complete cycle usually lasted between 5 and 7 hours, depending amongst others, on parameters like NH4
+ degradation rate, sludge concentration, or aeration rate. The nitritation-anammox process was controlled by a programmable logical controller equipped with online sensors for the water level, NH4
+, NO3-, DO concentrations,
temperature, pH, and conductivity. Moreover, the reactor was also equipped with a stirrer, an aeration unit, as well as a temperature control (30±1 °C unless stated otherwise). Further details are given in Joss et al. (2011).
Unless stated otherwise, the reactor aeration rate was manually controlled with a rotameter, to keep NO2
- concentration below 1 mgNO2--N/l. This typically resulted in DO
concentrations, measured in the bulk, of <0.05 mgO2/l. For experimental purposes, the reactor aeration rate was temporary increased to foster NO2
- accumulation, since an increase in oxygen supply is known to trigger NO2
- accumulation due to (i) anammox inhibition by DO, and (ii) a weak (or absent) NOB population (Joss et al., 2011) (see section ‘Correlation between dissolved NO2
- and N2O emission rate’). The proposed control of the aeration rate according to N2O emission, was done by manually adjusting the airflow rate, based on the N2O off-gas concentration measurement, where high N2O concentrations resulted in an airflow reduction, and vice-versa (see section ‘Manual airflow adjustment based on continuous N2O off-gas concentration measurement’).
Analytical methods for dissolved species
The sequencing batch reactor was equipped with various online sensors, such as for NH4
+ and NO3- (ISEmax, Endress+Hauser), pH (Orbisint CPS11D, Endress+Hauser), O2
(Oxymax H COS61D, Endress+Hauser) and conductivity (Indumax CLS50D, Endress+Hauser). All data were logged to a supervisory control and data acquisition system. To test the accuracy of the online sensors, dissolved NH4
+ and NO3- were
measured with commercial photochemical test kits (Hach Lange GmbH, Düsseldorf, Germany, Test LCK 305 or 303; LCK 340). Dissolved NO2
- was measured by anion chromatography (881 compact IC, Metrohm; detection limit 0.2 mgN/l), photochemically (Hach Lange GmbH, Düsseldorf, Germany, LCK 341) or with NO2
- test strips (Nitrite-test, 0-24 mgNO2
--N/l, Merck, Darmstadt, Germany).
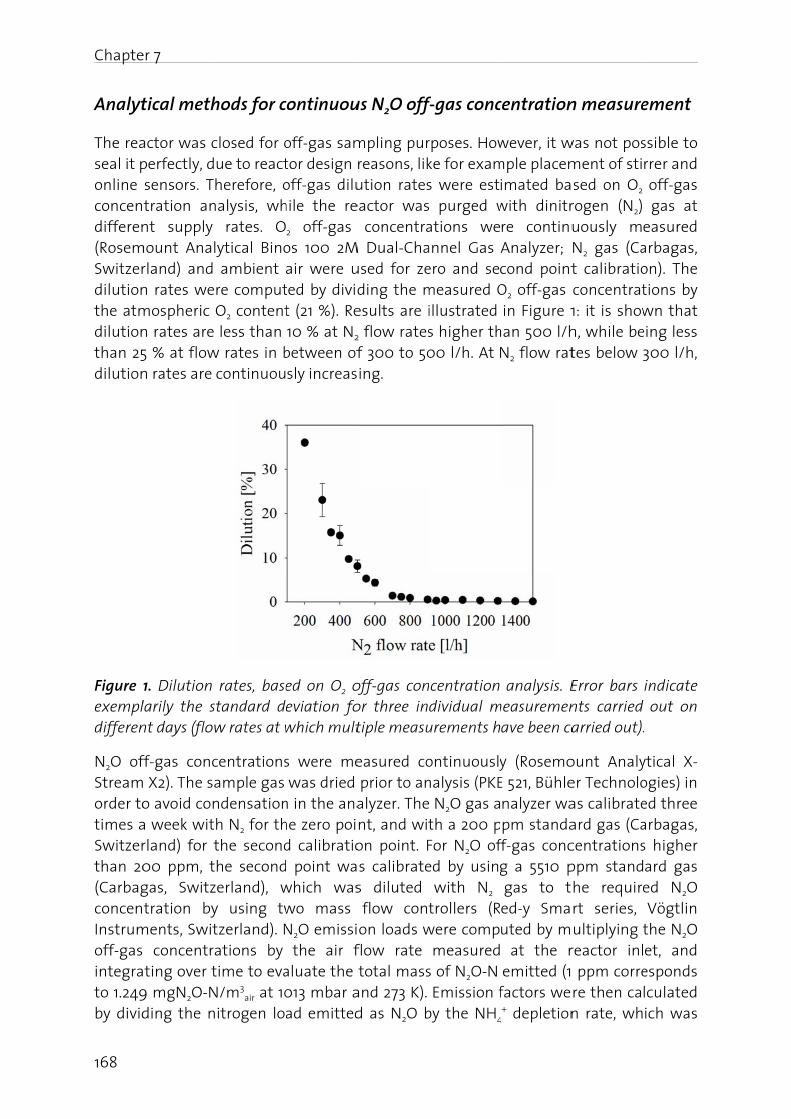
Chapte
168
Analyt
The reaseal it ponline concendifferen(RosemSwitzerdilutionthe atmdilutionthan 25dilution
Figure exempldifferen
N2O ofStreamorder totimes aSwitzerthan 20(CarbagconcenInstrumoff-gasintegrato 1.249by divid
er 7
tical meth
actor was c perfectly, d sensors. Ttration an
nt supply mount Anal
rland) and n rates wemospheric n rates are 5 % at flown rates are
1. Dilution larily the snt days (flow
ff-gas conc X2). The sao avoid con
a week witrland) for t00 ppm, tgas, Switztration by
ments, Swit concentrting over t
9 mgN2O-Nding the n
hods for c
closed for oue to reactherefore, o
nalysis, wh rates. Olytical Bino ambient re comput
O2 content less than
w rates in b continuou
rates, basestandard dw rates at w
centrationsample gas ndensationh N2 for th
the secondthe secondzerland), wy using twtzerland). Nations by
time to evaN/m3
air at 10nitrogen lo
continuou
off-gas samtor design
off-gas diluhile the re
2 off-gas os 100 2M
air were uted by dividt (21 %). Re 10 % at N2
between ofsly increas
ed on O2 ofeviation fo
which mult
s were me was dried
n in the anahe zero poid calibratio point wa
which waswo mass
N2O emissi the air faluate the 013 mbar aad emitted
us N2O off
mpling pur reasons, likution rates
eactor was concentra
M Dual-Chaused for zeding the mesults are i
2 flow ratesf 300 to 50ing.
off-gas conor three intiple measu
easured co prior to analyzer. Thent, and witon point. Fs calibrate
s diluted flow conton loads w
flow rate total mass
and 273 K). d as N2O b
f-gas conc
rposes. Howke for exams were est purged w
ations weannel Gas ero and semeasured O illustrated s higher th00 l/h. At
ncentrationdividual m
urements h
ontinuouslynalysis (PKE N2O gas ath a 200 p
For N2O ofed by using with N2 trollers (R
were comp measureds of N2O-N Emission f
by the NH4
centration
wever, it wmple placem
imated bawith dinitrre continu
Analyzer; cond point
O2 off-gas in Figure 1
han 500 l/h N2 flow rat
analysis. Emeasuremen
ave been ca
y (RosemoE 521, Bühlenalyzer wapm standa
ff-gas concg a 5510 p
gas to ted-y Smauted by m at the r emitted (1
factors we
4+ depletion
n measure
was not posment of stised on O2
rogen (N2) uously m
N2 gas (Cat calibratio
concentrat 1: it is showh, while betes below
Error bars nts carried arried out).
ount Analyer Technoloas calibrateard gas (Cacentrations
ppm standhe requirert series, ultiplying t
reactor inl ppm correre then can rate, wh
ement
ssible to rrer and off-gas gas at easured
arbagas, on). The tions by wn that
eing less 300 l/h,
indicate out on .
ytical X-ogies) in ed three arbagas, s higher ard gas ed N2O
Vögtlin the N2O et, and
esponds lculated ich was
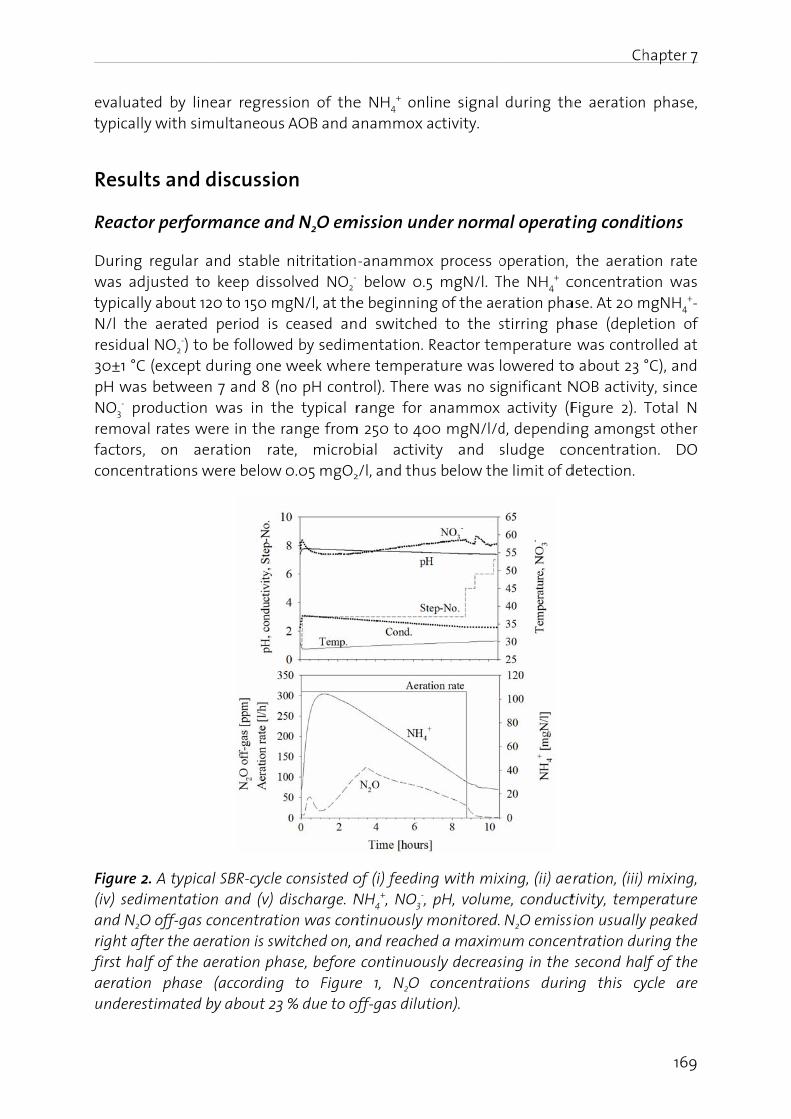
evaluattypicall
Resul
Reacto
During was adtypicallN/l theresidua30±1 °CpH wasNO3
- prremovafactors,concen
Figure 2(iv) sedand N2Oright affirst haaeratiounderes
ted by liney with sim
ts and d
or perform
regular adjusted to
y about 120e aerated al NO2
-) to bC (except ds between roduction al rates we, on aertrations w
2. A typicaldimentationO off-gas cofter the aerlf of the aen phase stimated by
ear regressultaneous
discussio
mance and
nd stable keep disso0 to 150 mg
period is be followeduring one 7 and 8 (n
was in there in the rration ratere below
l SBR-cycle n and (v) doncentratio
ration is sweration pha(according y about 23
sion of the AOB and a
on
d N2O em
nitritationolved NO2
- gN/l, at the
ceased and by sedim week wheno pH conte typical r
ange frome, microb
0.05 mgO2
consisted odischarge. Non was con
witched on, aase, before to Figure % due to of
e NH4+ onl
anammox a
mission und
-anammox below 0.5e beginnind switche
mentation. re tempera
trol). There range for m 250 to 40
bial activi
2/l, and thu
of (i) feedinNH4
+, NO3-,
ntinuously m and reache continuoue 1, N2O ff-gas dilut
ine signal activity.
der norm
x process o5 mgN/l. Tg of the aed to the s
Reactor temature was was no si
anammox 00 mgN/l/d
ty and ss below th
ng with mix pH, volum
monitored.ed a maximusly decreas
concentrattion).
during th
al operati
operation, The NH4
+ ceration pha
stirring phmperature
lowered tognificant N activity (Fd, dependinsludge coe limit of d
xing, (ii) aeme, conduct
N2O emissmum concen
sing in the tions durin
Ch
he aeration
ting condi
the aeraticoncentratiase. At 20 mhase (deple
was contro about 23 NOB activit
Figure 2). ng amongoncentratio
detection.
eration, (iii) tivity, tempsion usuallyntration du second hang this cy
hapter 7
169
n phase,
itions
ion rate ion was
mgNH4+-
etion of rolled at °C), and ty, since
Total N st other on. DO
mixing, perature y peaked uring the
lf of the ycle are
Chapter 7
170
N2O emissions were in between of 0.2 and 1 % with respect to converted N. This emission range is comparable to other investigations: for example, Joss et al. (2009) measured an N2O emission rate of 0.4 % with respect to N removed from a single-stage nitritation-anammox full-scale reactor. N2O emissions in our investigation were highly dynamic, usually peaking in the first part of the aeration phase, followed by a continuous decrease in parallel with the NH4
+ concentration (Figure 2). An emission delay, caused by the residence time in the headspace, is of minor importance, since being lower than 10 minutes at aeration rates higher than 300 l/h. In another investigation it was reported that N2O emission levels decreased by more than 10-times between the start and the end of the aerated period in a full-scale nitritation reactor (Kampschreur et al., 2008). An initial N2O peak was also reported for a partial nitrification system treating synthetic high strength NH4
+ wastewater: here it is assumed that under low DO concentrations of around 1 mgO2/l (during feeding) nitrifier denitrification was induced, while the continuous consumption of alkalinity during the second half of the aeration phase seemed to slow down AOB activity as well as N2O production (Kong et al., 2013). We hypothesize that our observed N2O emission peak at the beginning of the cycle and in combination with high NH4
+ concentrations, might, in addition to AOB nitrifier denitrification, presumably be due to a contribution from NH2OH oxidation to total N2O production (discussed in the next section). However, this needs to be confirmed in upcoming investigations. Isotopomeric analysis is considered a suitable tool to quantitatively apportion between these two pathways (please see Wunderlin et al., 2013 for more details about this method).
Correlation between dissolved NO2- and N2O emission rates
As demonstrated in the previous section, both NO2- concentrations as well as N2O
emissions were low under regular and stable nitritation-anammox process operation. In this section, the purpose was to investigate the short-term effect of high aeration rates on NO2
- and N2O emission levels, because an increase in the airflow as well as in dissolved O2 is expected to accelerate AOB activities and to inhibit anammox bacteria.
Figure 3 A illustrates the correlation between dissolved NO2- and the N2O emission
rates. It is shown that a build-up of dissolved NO2-, upon a manual elevation of the
airflow rate, leads to a linear increase of N2O emissions. Similarly, Kampschreur et al. (2009) reported higher N2O emissions upon NO2
- accumulation in a single-stage nitritation-anammox full-scale granular reactor, and also showed a linear correlation between NO2
- and N2O off-gas concentrations under non-limiting dissolved O2 concentrations (>2 mgO2/l). We hypothesize that such a correlation, illustrated in Figure 3 A, is due to AOB nitrifier denitrification activity, since switching off the oxygen supply or adding allylthiourea, a specific AOB inhibitor, ceased N2O production instantaneously (data not shown). Moreover, this is in agreement with the current assumption that N2O does not play a role in the anammox metabolism (Kartal et al., 2007; Kampschreur et al., 2009).
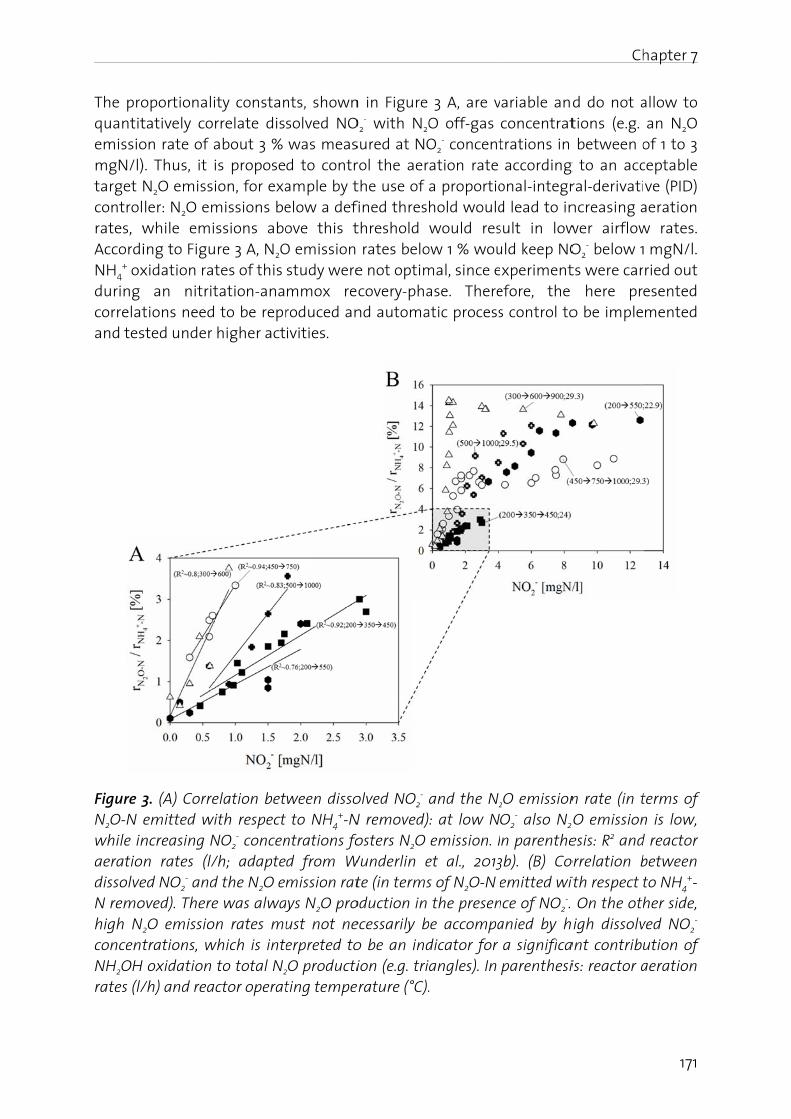
The proquantitemissiomgN/l)target controlrates, wAccordiNH4
+ oxduring correlatand tes
Figure 3N2O-N while inaeratiodissolveN remohigh N2
concentNH2OH rates (l/
oportionalitatively coon rate of a). Thus, it N2O emissler: N2O em
while emiing to Figuxidation rat an nitrittions need
sted under
3. (A) Corre emitted wincreasing Nn rates (l/
ed NO2- and
oved). There
2O emissiotrations, w oxidation /h) and rea
ity constanrrelate dis
about 3 % is proposeion, for exa
missions bessions abo
ure 3 A, N2Otes of this tation-ana to be repr higher act
elation betith respect
NO2- concen
/h; adapted the N2O ee was alwayn rates mu
which is inte to total N2
ctor operat
nts, shownsolved NO was measd to contrample by telow a defove this t
O emission study weremmox reroduced anivities.
ween disso to NH4
+-Nntrations fod from Wmission rat
ays N2O proust not neerpreted to
2O productiting tempe
n in Figure O2
- with N2Osured at NOrol the aer
the use of fined thresthreshold rates beloe not optimcovery-pha
nd automa
olved NO2-
N removed)osters N2O
Wunderlin ete (in terms
oduction in ecessarily bo be an indion (e.g. trirature (°C).
3 A, are vO off-gas O2
- concentation rate
a proportiohold would
would resow 1 % woumal, since ease. Thereatic process
and the N2
: at low N emission. Iet al., 2013s of N2O-N e the presen
be accompadicator for angles). In .
ariable an concentrattrations in accordingonal-integrd lead to insult in lowuld keep NO
xperimentefore, the s control to
2O emissionO2
- also N2
n parenthe3b). (B) Co emitted wince of NO2
-. anied by h a significa parenthesi
Ch
d do not ations (e.g. between o
g to an accral-derivatincreasing awer airflowO2
- below 1ts were car here pro be imple
n rate (in t
2O emissionesis: R2 and
orrelation bith respect t On the oth
high dissolvant contribuis: reactor a
hapter 7
171
allow to an N2O of 1 to 3 ceptable ve (PID)
aeration w rates. mgN/l.
ried out esented mented
terms of n is low, d reactor between to NH4
+-her side,
ved NO2-
ution of aeration
Chapter 7
172
In some experiments, N2O strongly increased, even though NO2- did not accumulate
substantially (e.g. triangles in Figure 3 B). We hypothesize that this characteristic behavior was due to a significant contribution of NH2OH oxidation, which is another N2O production pathway of AOB. Accordingly, for nitrification, it was reported that N2O production via NH2OH oxidation seemed to be favored at high NH4
+ concentrations in combination with a high nitrification activity, and low NO2
- concentrations (Yu et al., 2010; Law et al., 2012; Wunderlin et al., 2013a). In our experiments, N2O emission, at high AOB activities and low NO2
- concentrations, correlated with the NH4+ concentration
(data not shown). Moreover, in combination with a temporary airflow increase, this might have induced imbalanced metabolic activities, as proposed by Yu et al. (2010), and consequently might have fostered N2O production via NH2OH oxidation. Again, N2O production mechanisms in the (single-stage) nitritation-anammox process needs to be further investigated.
Manual airflow adjustment based on continuous N2O off-gas concentration measurement
Based on the results illustrated in Figure 3 and discussed in the previous sections, it is concluded that (i) under normal operation, both NO2
- as well as N2O were kept at low levels, while (ii) an increase in the airflow rate resulted in a built-up of NO2
- and in high N2O emission rates. Consequently, in this section, it is investigated, whether process operation can be optimized by manual aeration rate adjustment, solely based on N2O off-gas concentration data, which is considered a necessary stepping stone implementing this signal in automated process control.
Figure 4 shows a typical nitritation-anammox cycle, where the aeration rate was manually adjusted based on N2O off-gas data. In general, N2O off-gas concentrations decreased upon decreasing airflow rates, and vice-versa: for example, in Figure 4, a strong N2O emission increase at the beginning of the aeration period (within the first 30 minutes), was counteracted by lowering the airflow from 500 to 400 l/h. Then, a stepwise airflow increase (from 400 up to 550 l/h) accelerated N2O emissions again. However, there was usually a threshold aeration rate, below which the N2O emission did not correlate anymore with the airflow rate (when dissolved NO2
- was below the limit of detection). These emissions are attributed to NH2OH oxidation, and are presumably impacted by the presence of toxic compounds or high NH4
+ concentrations.
The above reported responses in N2O emissions upon changing airflow rates are interpreted to be primarily due to changing microbial activities: at high aeration rates, AOB activity is higher with respect to anammox bacteria, since latter are partly inhibited by the presence of oxygen. Therefore, aeration rates controlled according to microbial activities lead to stable and more balanced nitritation-anammox process operation. This argumentation is also supported by the effect of reducing process temperature: for example, lowering the temperature from 30 to about 23 °C resulted in decreasing microbial activities (data not shown; in agreement with the Arrhenius equation describing the dependency of reaction rate constants on temperature), and
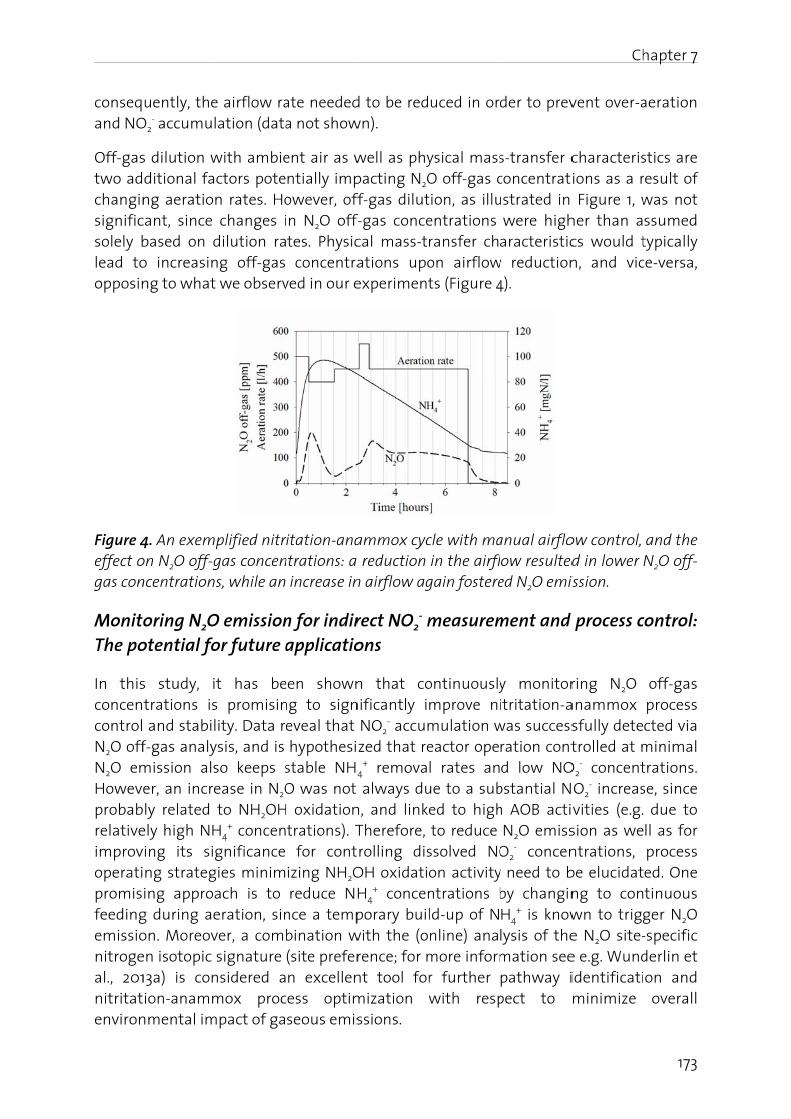
conseqand NO
Off-gastwo adchanginsignificsolely blead toopposin
Figure 4effect ogas con
MonitThe po
In thisconcencontrolN2O offN2O emHowevprobabrelativeimprovoperatipromisfeedingemissionitrogeal., 201nitritatenviron
uently, theO2
- accumu
s dilution wditional fang aeratio
cant, since based on do increasinng to what
4. An exemon N2O off-gncentration
oring N2Ootential fo
s study, itrations is and stabilf-gas analymission alser, an increly related
ely high NHving its si
ng strateging appro
g during aeon. Moreoven isotopic 13a) is conion-anamm
nmental im
e airflow ralation (data
with ambiectors poten rates. Ho changes i
dilution rang off-gas t we observ
mplified nitrgas concen
ns, while an
O emissionor future a
it has bes promisinlity. Data rysis, and is so keeps sease in N2O to NH2OHH4
+ concengnificance
gies minimach is to eration, sinver, a com signature nsidered amox proc
mpact of ga
ate neededa not show
ent air as wntially impowever, off
in N2O off-tes. Physic concentra
ved in our e
itation-anantrations: a
increase in
n for indir applicatio
een shownng to sign
eveal that hypothesistable NH4
O was not H oxidation
trations). T for contizing NH2O
reduce NHnce a tempbination w (site prefern excellen
cess optimseous emis
d to be redwn).
well as phypacting N2Off-gas dilutf-gas concecal mass-tations upo
experiment
ammox cyc reduction
n airflow ag
rect NO2- m
ons
n that conificantly i NO2
- accumzed that re
4+ remova
always dun, and link Therefore,
rolling disOH oxidatiH4
+ concenporary buil
with the (orence; for mnt tool formization wssions.
uced in or
ysical massO off-gas ction, as illuentrations ransfer chon airflowts (Figure 4
cle with ma in the airflgain fostere
measurem
ontinuouslymprove nimulation weactor opel rates an
ue to a subed to high to reduce ssolved NOon activityntrations bld-up of Nnline) ana
more informr further with resp
der to prev
s-transfer c concentratustrated in were higharacteristic
w reduction 4).
anual airfloow resulted
ed N2O emis
ment and
y monitoritritation-a
was successration contd low NO
bstantial Nh AOB acti N2O emissO2
- conceny need to b
by changinH4
+ is knowlysis of themation see
pathway ipect to
Ch
vent over-a
characterisions as a r Figure 1, w
her than acs would tn, and vic
ow control, d in lower ission.
process c
ring N2O anammox sfully detetrolled at m
O2- concent
O2- increas
vities (e.g.sion as wentrations,
be elucidatng to conwn to trigge N2O site-e e.g. Wund
identificatiminimize
hapter 7
173
aeration
stics are result of was not
ssumed typically ce-versa,
and the N2O off-
control:
off-gas process cted via
minimal trations. se, since due to ll as for
process ed. One tinuous ger N2O -specific derlin et on and
overall
Chapter 7
174
Conclusions
In the present study, it was tested whether the continuous monitoring of N2O off-gas concentrations can be used as an indirect measure for dissolved NO2
- in a single-stage nitritation-anammox process, which is based on the hypothesis that NO2
- dependent N2O emission by AOB is the dominant cause for the observed off-gas concentrations. The conclusions can be summarized as follows:
N2O emissions have proven to correlate with dissolved NO2- concentrations:
temporary high airflow rates resulted in both, increasing NO2- concentrations as
well as increasing N2O emissions, while aeration rates adequate to microbial activities kept NO2
- and N2O at low levels.
Operating conditions at high N2O emission and in combination with relatively low NO2
- is assumed to be biased by NH2OH oxidation activity, another independent pathway for N2O formation.
Reactor operation controlled at minimal N2O emissions, give stable NH4+
removal rates and low NO2- concentrations.
In sum, N2O off-gas concentration is a promising parameter for nitritation-anammox process control and supports future directions incorporating this approach in full-scale.
Acknowledgements
This study was financially supported by the Swiss Federal Office for the Environment (FOEN), the canton of Bern (AWA), the canton of Basel- Landschaft (AIB), the canton of St. Gallen (AFU), the canton of Thurgau (AfU), the canton of Zurich (AWEL), TBF + Partner AG Consulting Engineers, WWTP region Bern, WWTP ProRheno, WWTP REAL Luzern, WWTP Zurich-Werdhölzli, WWTP Worblental, Abwasserverband Altenrhein, Abwasserverband Morgental, Entsorgung St. Gallen, Zentralschweizer Umweltdirektorenkonferenz (ZUDK) and Eawag
References
Butler, M. D., Wang, Y. Y., Cartmell, E. and Stephenson, T. (2009). Nitrous oxide emissions for early warning of biological nitrification failure in activated sludge. Water Research 43(5), 1265-1272.
Colliver, B. B. and Stephenson, T. (2000). Production of nitrogen oxide and dinitrogen oxide by autotrophic nitrifiers. Biotechnology Advances 18(3), 219-232.
Colliver, B. B., Stuetz, R. M. and Stephenson, T. (2002). Dinitrogen oxide production by a mixed culture of nitrifying bacteria during ammonia shock loading and aeration failure. Industrial Microbiology and Biotechnology 29(6), 309-313.
Chapter 7
175
Joss, A., Derlon, N., Cyprien, C., Burger, S., Szivak, I., Traber, J., Siegrist, H. and Morgenroth, E. (2011). Combined nitritation-anammox: Advances in understanding process stability. Environmental Science and Technology 45(22), 9735-9742.
Joss, A., Salzgeber, D., Eugster, J., Konig, R., Rottermann, K., Burger, S., Fabijan, P., Leumann, S., Mohn, J. and Siegrist, H. (2009). Full-Scale Nitrogen Removal from Digester Liquid with Partial Nitritation and Anammox in One SBR. Environmental Science & Technology 43(14), 5301-5306.
Kampschreur, M. J., Poldermans, R., Kleerebezem, R., Van Der Star, W. R. L., Haarhuis, R., Abma, W. R., Jetten, M. S. M. and Van Loosdrecht, M. C. M. (2009). Emission of nitrous oxide and nitric oxide from a full-scale single-stage nitritation-anammox reactor. 60: 3211-3217.
Kampschreur, M. J., Temmink, H., Kleerebezem, R., Jetten, M. S. M. and van Loosdrecht, M. C. M. (2009). Nitrous oxide emission during wastewater treatment. Water Research 43(17), 4093-4103.
Kampschreur, M. J., van der Star, W. R. L., Wielders, H. A., Mulder, J. W., Jetten, M. S. M. and van Loosdrecht, M. C. M. (2008). Dynamics of nitric oxide and nitrous oxide emission during full-scale reject water treatment. Water Research 42(3), 812-826.
Kartal, B., Kuypers, M. M. M., Lavik, G., Schalk, J., den Camp, H., Jetten, M. S. M. and Strous, M. (2007). Anammox bacteria disguised as denitrifiers: nitrate reduction to dinitrogen gas via nitrite and ammonium. Environmental Microbiology 9(3), 635-642.
Kong, Q., Liang, S., Zhang, J., Xie, H., Miao, M. and Tian, L. (2013). N2O emission in a partial nitrification system: Dynamic emission characteristics and the ammonium-oxidizing bacteria community. Bioresource Technology 127, 400-406.
Law, Y., Ni, B.-J., Lant, P. and Yuan, Z. (2012). N2O production rate of an enriched ammonia oxidising bateria culture exponentially correlates to its ammonia oxidation rate. Water Research 46(10), 3409-3419.
Okabe, S., Oshiki, M., Takahashi, Y. and Satoh, H. (2011). N2O emission from a partial nitrification-anammox process and identification of a key biological process of N2O emission from anammox granules. Water Research 45(19), 6461-6470.
Ravishankara, A. R., Daniel, J. S. and Portmann, R. W. (2009). Nitrous oxide (N2O): the dominant ozone-depleting substance emitted in the 21st century. Science 326(5949), 123-125.
Wunderlin, P., Lehmann, M. F., Siegrist, H., Tuzson, B., Joss, A., Emmenegger, L. and Mohn, J. (2013a). Isotope signatures of N2O in a mixed microbial population system: Constraints on N2O producing pathways in wastewater treatment. Environmental Science and Technology 47(3), 1339-1348.

Chapter 7
176
Wunderlin, P., Siegrist, H., Joss, A. (2013b). Online N2O Measurement: The Next Standard for Controlling Biological Ammonia Oxidation? Environmental Science & Technology, 47 (17), 9567-9568, 10.1021/es402971p.
Wunderlin, P., Mohn, J., Joss, A., Emmenegger, L. and Siegrist, H. (2012). Mechanisms of N2O production in biological wastewater treatment under nitrifying and denitrifying conditions. Water Research 46(4), 1027-1037.
Yu, R., Kampschreur, M. J., Loosdrecht, M. C. M. v. and Chandran, K. (2010). Mechanisms and specific directionality of autotrophic nitrous oxide and nitric oxide generation during transient anoxia. Environmental Science & Technology 44(4), 1313-1319.
Chapter 8
Online N2O measurement: The next standard for controlling biological ammonia oxidation?
This chapter has been published as:
Wunderlin, P., Siegrist, H., Joss, A. Online N2O measurement: The next standard for controlling biological ammonia oxidation? Environmental Science and Technology, 2013,
47 (17), 9567-9568, 10.1021/es402971p.
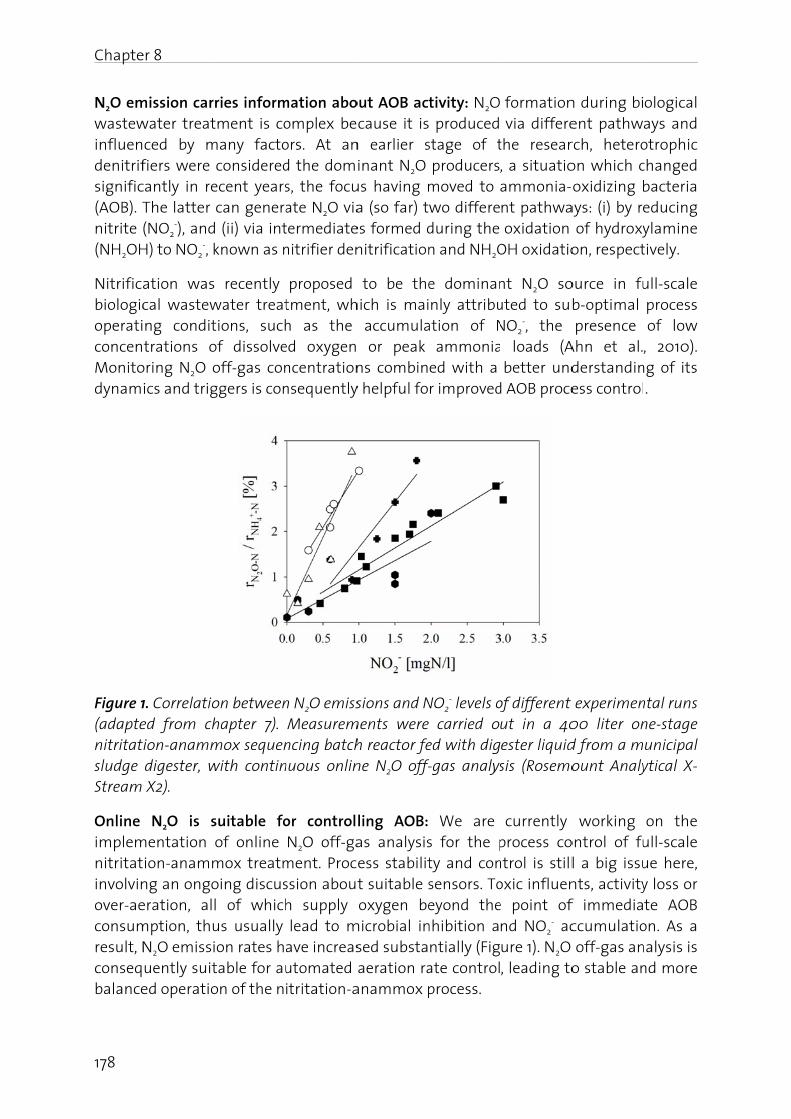
Chapte
178
N2O emwastewinfluendenitrifsignific(AOB). Tnitrite (NH2OH
NitrificabiologicoperaticoncenMonitodynam
Figure 1(adaptenitritatsludge Stream
Online implemnitritatinvolvinover-aeconsumresult, Nconseqbalance
er 8
mission carwater treat
ced by mfiers were cantly in re The latter (NO2
-), andH) to NO2
-, k
ation wascal wastewng condittrations o
oring N2O oics and trig
1. Correlatioed from chion-anamm
digester, w X2).
N2O is smentation
ion-anammng an ongoeration, almption, thu N2O emissiuently suited operatio
ries informtment is co
many facto consideredecent years can generad (ii) via int known as n
recently water treattions, suchof dissolve off-gas conggers is con
on betweenhapter 7). mox sequenwith contin
suitable fo of online mox treatmoing discusl of whichus usually ion rates htable for auon of the n
mation aboomplex beors. At and the doms, the focuate N2O viatermediate
nitrifier den
proposed tment, whh as the ed oxygen ncentrationnsequently
n N2O emiss Measuremncing batch
nuous onlin
or control N2O off-gament. Procssion abouth supply lead to mave increasutomated itritation-a
out AOB actcause it is
n earlier sinant N2O
us having ma (so far) t
es formed dnitrification
to be thehich is mai accumula or peak ns combin
y helpful fo
sions and Nments were
h reactor fene N2O off-
ling AOB: as analysisess stabilitt suitable s
oxygen bemicrobial in
sed substa aeration raanammox p
tivity: N2O produced
stage of t producers
moved to wo differe during the n and NH2O
e dominannly attribu
ation of N ammoniaed with a r improved
NO2- levels o
carried oed with digf-gas analys
We are s for the pty and con
sensors. Toeyond the
nhibition antially (Figate controlprocess.
formation via differe
the resear, a situatio
ammonia-nt pathwa oxidation
OH oxidatio
nt N2O souted to subNO2
-, the loads (A
better undd AOB proce
of different ut in a 40ester liquidsis (Rosemo
currently process control is stilloxic influene point ofnd NO2
- acure 1). N2O , leading to
n during bient pathwrch, heteroon which coxidizing b
ays: (i) by re of hydroxyon, respect
ource in fub-optimal
presence Ahn et al.derstandiness control
experimen00 liter ond from a mount Analy
working ontrol of ful a big issunts, activityf immediaccumulatio off-gas an
o stable an
ological ays and otrophic
changed bacteria educing ylamine tively.
ull-scale process of low
, 2010). ng of its
.
ntal runs ne-stage unicipal ytical X-
on the ull-scale ue here, y loss or te AOB
on. As a nalysis is nd more
Chapter 8
179
In nitritation-anammox systems, N2O production is driven by AOB activity, either via nitrifier denitrification or NH2OH oxidation, since heterotrophic denitrification activity is negligible due to the low availability of degradable organic substrate, and anammox bacteria are considered not to produce N2O. Therefore, suitable process control strategies need to be clarified in order to (i) minimize N2O emissions, (ii) maintain low concentrations of dissolved NO2
- and (iii) keep NH2OH oxidation activity low. In this context, the continuous analysis of the N2O site-specific nitrogen isotopic signature is considered an excellent tool for quantitative pathway investigation. One promising approach is to feed the digester liquid continuously during aeration: at low NH4
+ concentrations, N2O production via NH2OH oxidation is also low, and the N2O emissions can therefore be taken as proxy for the NO2
- concentrations in the reactor (Figure 1).
It was recently concluded that long-term continuous N2O off-gas analysis is required for the accurate recording of emission dynamics and levels of conventional wastewater treatment plants (Daelman et al., 2013). As such, nitrification (AOB) process control based on N2O emissions is considered helpful, because multiple factors impact on N2O production, resulting in a complex, dynamic and plant-specific pattern of N2O emissions (Burgess et al., 2002). Operating strategies minimizing overall greenhouse gas (GHG) emissions thus need to be tested individually in combination with online N2O emission analysis.
N2O emission is environmentally relevant and must be considered in energy optimization scenarios: N2O is an environmentally harmful substance: it is a GHG and is involved in the destruction of the stratospheric ozone layer. Indeed N2O is estimated to play the biggest role in depletion of stratospheric ozone during the 21st century (Ravishankara et al., 2009). Therefore, N2O (and other GHG) emissions from the wastewater treatment sector must be minimized.
On the basis of Siegrist et al. (2008), it is estimated that the average net energy consumption of Swiss wastewater treatment plants, including biogas use from sludge digestion, is in the range from 40 to 50 watt hours per person and day (Wh/p/d). This value can be reduced by about 50% by introducing the nitritation-anammox process for digester liquid treatment while keeping nitrogen removal at the same level. The resulting savings of 20 to 25 Wh/p/d correspond to about 150 gCO2,equivalents/p/d, assuming 700 gCO2,equivalents/kWhelectrical, which refers to emissions of about 0.5 gN2O/p/d. This accounts for approximately 3% of the daily nitrogen load of one person. Consequently, any discussion of potential future treatment schemes, must necessarily include N2O (and other GHG) emissions. Analogously, aeration energy-saving concepts for conventional treatment must include N2O emissions, which should not be significantly increased by them: for example, emission levels in the range of 0.5 to 1% with respect to oxidized nitrogen are already in the same order of magnitude as GHG emissions from the production of energy for aeration.
Online N2O off-gas measurement is cost-effective, robust and requires little maintenance: Today’s N2O off-gas analyzers are stable and robust, enabling automated calibration procedures. Monitoring off-gas concentrations avoids direct contact with
Chapter 8
180
activated sludge, hence significantly reduces cleaning, matrix interferences and the overall maintenance effort compared to probes inserted in the liquid phase. Investment costs are estimated to be higher, but still in the same order of magnitude, than those for the conventional commercially available ion selective electrodes usually applied for online NH4
+ and NO3- measurement in the liquid. Alternatively, monitoring dissolved
NO2- would require a suitable online sensor with sufficient resolution, which needs, to
the authors’ knowledge, considerably more maintenance. In addition, extending the N2O off-gas analyzer by an oxygen sensor in combination with an airflow measurement would allow the oxygen consumption to be continuously monitored and thus the aeration to be controlled via the online nitrification rate.
A win-win situation for the environment and the plant operators: The implementation of a financial GHG crediting system, as suggested by Wang et al. (2011), is considered a powerful incentive to promote the broad application of a continuous N2O off-gas monitoring concept. We are convinced that the efforts described here have an enormous potential to reduce air and water pollution substantially and thus contribute significantly to sustainable development within the global wastewater treatment sector.
Acknowledgements
Acknowledgments: This study was financially supported by the European Research Council within the Athene Project (grant 267897), as well as by the Swiss N2O research project. Special thanks go to Marco Kipf (Eawag) for conducting the experiments, and to the operators of the Swiss wastewater treatment plants of Bazenheid and Zürich-Werdhölzli.
References
Ahn, J. H.; Kim, S.; Park, H.; Rahm, B.; Pagilla, K.; Chandran, K. (2010). N2O Emissions from Activated Sludge Processes, 2008-2009: Results of a National Monitoring Survey in the United States. Environmental Science & Technology, 44 (12), 4505-4511.
Burgess, J. E., Stuetz, R. M., Morton, S., Stephenson, T. (2002). Dinitrogen oxide detection for process failure early warning systems. Water Science and Technology, 45 (4-5), 247-254.
Daelman, M. R. J.; De Baets, B.; van Loosdrecht, M. C. M.; Volcke, E. I. P. (2013). Influence of sampling strategies on the estimated nitrous oxide emission from wastewater treatment plants. Water Research, 47 (9), 3120-3130.
Ravishankara, A. R.; Daniel, J. S.; Portmann, R. W. (2009). Nitrous oxide (N2O): the dominant ozone-depleting substance emitted in the 21st century. Science, 326 (5949), 123-125.

Chapter 8
181
Siegrist, H.; Salzgeber, D.; Eugster, J.; Joss, A. (2008). Anammox brings WWTP closer to energy autarky due to increased biogas production and reduced aeration energy for N-removal. Water Science and Technology, 57 (3), 383-388.
Wang, J. S.; Hamburg, S. P.; Pryor, D. E.; Chandran, K.; Daigger, G. T. (2011). Emissions credits: Opportunity to promote integrated nitrogen management in the wastewater sector. Environmental Science and Technology, 45 (15), 6239-6246.


Chapter 9
General Conclusions
Chapter 9 - General Conclusions
184
In this doctoral thesis, the production and emission of N2O in biological wastewater treatment was investigated with a specific focus on pathway identification, plant operating reduction strategies and the potential use of continuous N2O off-gas real-time measurement for process control.
The general conclusion section is structured as follows: first, the highlights of the presented work are summarized, followed by an extended conclusion of the individual chapters. A specific focus is put on the role of NO2
-. Moreover, it is discussed whether biomass might potentially adapt to N2O promoting factors, such as N influent peaks, which could lead to a reduction of N2O emission. Finally, the implications on wastewater treatment plant operation are addressed.
Highlights of this thesis
The overall objective of this thesis was to identify the mechanisms of N2O production in biological wastewater treatment and how the resulting emissions can be reduced. The work can be summarized with the following highlights:
NO2- reduction to N2O was found to be a key pathway in the investigated
conventional municipal wastewater treatment systems.
Isotopomeric analysis has been confirmed to be a powerful method to quantitatively differentiate between the three most important N2O production routes, e.g. nitrifier denitrification, hydroxylamine (NH2OH) oxidation pathway and heterotrophic denitrification in presence of low dissolved O2 concentrations.
Continuous N2O off-gas analysis is considered a necessary stepping stone for overall carbon footprint minimization of wastewater treatment.
Implementation of continuous N2O off-gas analysis in full-scale has the potential to further improve nitritation-anammox process stability of supernatant treatment.
Main conclusions of the individual chapters
Lab-scale batch experiments with mixed microbial culture indicated that both, NH2OH oxidation as well as NO2
- reduction contributed to N2O production during NH4+
oxidation: the former was interpreted to be active at the beginning of the aeration phase, when NH4
+ concentration was high, but NO2- still low, while in the course of
nitrification a shift to nitrifier denitrification driven N2O production was observed (chapter 3). This trend is supported by N2O isotopomeric analysis, a novel method in the field of biological wastewater treatment. These data confirm that under aerobic conditions, NO2
- reduction seemed to be the dominant N2O production pathway. The contribution from NH2OH oxidation, however, cannot be completely excluded, but is deemed of minor importance in our investigation (chapter 4). Moreover, N2O isotope measurements on a pilot-scale treatment plant (SP close to 0 ‰), indicate that NO2
- reduction was dominant at dissolved oxygen concentrations higher than 1.5 mgO2/l. An
Chapter 9 - General Conclusions
185
increase in SP at low dissolved oxygen is attributed to heterotrophic denitrification activity, with a substantial N2O reductase activity compared to N2O production (chapter 5).
The effect of digester liquid addition, equivalent to a temporary increase of the nitrogen load, to a pilot-scale activated sludge plant showed that high N loads accelerated N2O emission significantly, correlating positively with the NO2
- build-up in the nitrifying activated sludge tanks (chapter 6). This underscores the assumption that an operating strategy at low dissolved NO2
- (<2 mgN/l) contributes to keeping N2O emissions at low levels.
The application of N2O as a potential indirect measure for dissolved NO2- was the focus
of chapter 7, where a nitritation-anammox reactor was operated at different aeration rates in order to experimentally operate at various degrees of NO2
- accumulation. Latter is feasible due to the absence of nitrite oxidizing bacteria (NOBs), and anammox inhibition at elevated dissolved oxygen concentrations. Data indicate that the correlation between dissolved NO2
- and the N2O off-gas concentration seems to be biased by a (so far) unknown contribution from NH2OH oxidation. In future investigations, the application of the isotopomeric analysis is promising to quantitatively differentiate between the two pathways. Nevertheless, the here presented results are judged to be prospective for further implementation in full-scale plants, and point to future directions incorporating continuous N2O off-gas measurement in the process control (chapter 8).
The role of NO2- within N2O production pathways
A main conclusion of this thesis is, that NO2- reduction is a major N2O production
pathway in the investigated activated sludge systems. Consequently, low NO2-
concentrations during aeration are expected to reduce overall N2O emission. This is in line with several studies reporting a positive correlation between dissolved NO2
- and N2O emission (e.g. Kampschreur et al., 2009a; Kampschreur et al., 2009b; Ahn et al., 2010; Foley et al., 2010). Moreover, data of this study also indicate that a shift from one dominating production route to another might occur over time within the same system, or that all of the known pathways are contributing simultaneously to total N2O production, depending on operating and environmental conditions, respectively. This implies that critical operating parameters, optimally combined with isotopomer data, need to be considered when discussing N2O emission dynamics, when testing N2O reducing operating strategies or when applying mathematical models. The latter currently includes either NH2OH oxidation or nitrifier denitrification, but not both at the same time due to parameter identifiability problems (e.g. Ni et al., 2011; Ni et al., 2012; Ni et al., 2013). Another important point to consider in upcoming studies is whether the correlation between NO2
- and N2O holds also for high NO2- concentrations,
since this might have severe implications on nitritation systems (e.g. two-stage nitritation-anammox process), which are usually operated at high dissolved NO2
- concentrations (see e.g. Law et al., 2013).
Chapter 9 - General Conclusions
186
Adaptation of the biomass might influence N2O production: Short-term vs. long-term effects
The present study is based on short-term effects, such as NH4+ or NO2
- peak addition, on N2O production, with activated sludge taken from a continuously operating pilot plant fed with municipal wastewater. Additionally, pilot-scale monitoring was conducted over several weeks, and continuous digester liquid dosing was performed over 9 days. An adaptive response, in terms of lower NO2
- concentrations and lower N2O emissions over the time, at simultaneously high N influent loads, was observed. This is in agreement with a recent publication, where daily NH4
+ feed-pulses were conducted over 18 days, and ‘stable’ N2O emissions were reached after about 8 days (Chandran et al., 2011). However, in another study it took about 80 days to stabilize N2O emission after transition from full nitrification to nitritation (Ahn et al., 2011).
In this thesis, microbial long-term adaptation to changing conditions e.g. high N loads, high NO2
- concentrations, or low dissolved oxygen, was not systematically investigated. This is necessarily to be done in upcoming studies. The trend within the N2O research community goes towards long-term on-line monitoring to measure and control N2O emission levels, in order to better capture daily, weekly and seasonal N2O emission dynamics (Daelman et al., 2013), as well as to improve aeration and load control minimizing N2O emission. Therefore, upcoming long-term investigations, addressing this topic, are expected.
Implications for wastewater treatment plant operation
This study supports the current understanding, that NO2- reduction is the dominant
N2O production pathway in biological wastewater treatment (Colliver and Stephenson 2000). Moreover, it is hypothesized that process perturbations, such as sudden increases of NH4
+ or NO2- or drops in dissolved oxygen (at high N influent loads), leads
to immediate N2O increases (Desloover et al., 2012; Law et al., 2012). In future, such N2O responses upon process perturbations might be used as an early warning for process failure in full-scale plants, as already proposed by e.g. Butler et al. (2009), Colliver et al. (2002), or Burgess et al. (2002).
With respect to strategies minimizing N2O emissions, it is concluded that biological wastewater treatment plants should be operated at low NH4
+ and NO2- concentrations,
which means (i) a high solid retention time and thus a large population with nitrifying activity to handle nitrogen-peak-loads, (ii) sufficient dissolved oxygen at high N influent loads in order to avoid incomplete nitrification and to keep NO2
- low (<1 to 2 mgN/l), (iii) an extended denitrification preventing soluble oxygen (to avoid inhibition of the N2O to N2 reduction step) and operated with sufficient readily biodegradable organic carbon (to avoid competition for reducing equivalents among denitrifying enzymes), and (iv) that ammonia rich digester liquid should be dosed preferentially during low ammonia loads (equalization of load variations; adapted from Wunderlin et al., 2012). However, these recommendations have yet to be verified in full-scale plants.
Chapter 9 - General Conclusions
187
Energetic optimization of wastewater treatment by reducing aeration (and O2 input) is critical, especially during high N loads. Therefore, it is recommended to reduce oxygen set-point (or partly switching off) the aeration solely at low N load situations. Based on the current understanding, it is postulated that plants designed for a high degree of N removal and operated under stable conditions emit only low amounts of N2O: high nitrogen removal and low N2O emission rates are therefore not considered as opposing targets (Chandran et al., 2011; Law et al., 2012).
References
Ahn, J. H., Kim, S., Park, H., Rahm, B., Pagilla, K. and Chandran, K. (2010). N2O Emissions from Activated Sludge Processes, 2008-2009: Results of a National Monitoring Survey in the United States. Environmental Science & Technology 44(12), 4505-4511.
Ahn, J. H., Kwan, T. and Chandran, K. (2011). Comparison of partial and full nitrification processes applied for treating high-strength nitrogen wastewaters: Microbial ecology through nitrous oxide production. Environmental Science and Technology 45(7), 2734-2740.
Burgess, J. E., Stuetz, R. M., Morton, S., Stephenson, T. (2002). Dinitrogen oxide detection for process failure early warning systems. Water Science and Technology, 45 (4-5), 247-254.
Butler, M. D., Wang, Y. Y., Cartmell, E. and Stephenson, T. (2009). Nitrous oxide emissions for early warning of biological nitrification failure in activated sludge. Water Research 43(5), 1265-1272.
Chandran, K., Stein, L. Y., Klotz, M. G. and Van Loosdrecht, M. C. M. (2011). Nitrous oxide production by lithotrophic ammonia-oxidizing bacteria and implications for engineered nitrogen-removal systems. Biochemical Society Transactions 39(6), 1832-1837.
Colliver, B. B. and Stephenson, T. (2000). Production of nitrogen oxide and dinitrogen oxide by autotrophic nitrifiers. Biotechnology Advances 18(3), 219-232.
Colliver, B. B., Stuetz, R. M. and Stephenson, T. (2002). Dinitrogen oxide production by a mixed culture of nitrifying bacteria during ammonia shock loading and aeration failure. Industrial Microbiology and Biotechnology 29(6), 309-313.
Daelman, M. R. J., De Baets, B., van Loosdrecht, M. C. M. and Volcke, E. I. P. (2013). Influence of sampling strategies on the estimated nitrous oxide emission from wastewater treatment plants. Water Research 47(9), 3120-3130.
Desloover, J., Vlaeminck, S. E., Clauwaert, P., Verstraete, W. and Boon, N. (2012). Strategies to mitigate N2O emissions from biological nitrogen removal systems. Current Opinion in Biotechnology, doi:10.1016/j.copbio.2011.12.030.
Chapter 9 - General Conclusions
188
Foley, J., de Haas, D., Yuan, Z. and Lant, P. (2010). Nitrous oxide generation in full-scale biological nutrient removal wastewater treatment plants. Water Research 44(3), 831-844.
Kampschreur, M. J., Poldermans, R., Kleerebezem, R., Van Der Star, W. R. L., Haarhuis, R., Abma, W. R., Jetten, M. S. M. and Van Loosdrecht, M. C. M. (2009a). Emission of nitrous oxide and nitric oxide from a full-scale single-stage nitritation-anammox reactor. 60: 3211-3217.
Kampschreur, M. J., Temmink, H., Kleerebezem, R., Jetten, M. S. M. and van Loosdrecht, M. C. M. (2009b). Nitrous oxide emission during wastewater treatment. Water Research 43(17), 4093-4103.
Law, Y.; Lant, P.; Yuan, Z. (2013). The Confounding Effect of Nitrite on N2O Production by an Enriched Ammonia-Oxidizing Culture. Environmental Science & Technology, 10.1021/es4009689.
Law, Y., Ye, L., Pan, Y. and Yuan, Z. (2012). Nitrous oxide emissions from wastewater treatment processes. Phil Trans R Soc B 367, 1265-1277.
Ni, B.-J.; Ye, L.; Law, Y.; Byers, C.; Yuan, Z. (2013). Mathematical Modeling of Nitrous Oxide (N2O) Emissions from Full-Scale Wastewater Treatment Plants. Environmental Science & Technology, 10.1021/es4005398.
Ni, B.-J., Yuan, Z., Chandran, K., Vanrolleghem, P. A. and Murthy, S. (2012). Evaluating mathematical models for N2O production by ammonia-oxidizing bacteria: Towards a unified model. Proccedings of the 3rd IWA/WEF Wastewater Treatment Modelling (WWTmod) Conference Mont-Sainte-Anne, Québec, Canada.
Ni, B. J., Ruscalleda, M., Pellicer-Nàcher, C. and Smets, B. F. (2011). Modeling nitrous oxide production during biological nitrogen removal via nitrification and denitrification: Extensions to the general ASM models. Environmental Science and Technology 45(18), 7768-7776.
Wunderlin, P., Mohn, J., Joss, A., Emmenegger, L. and Siegrist, H. (2012). Mechanisms of N2O production in biological wastewater treatment under nitrifying and denitrifying conditions. Water Research 46(4), 1027-1037.

Chapter 10
Outlook
Chapter 10 - Outlook
190
The outlook chapter is structured as follows: first, the remaining open questions for future investigations are addressed, followed by a specific focus on future applications of N2O isotopic analysis in combination with microbiological tools and mathematical modeling. This chapter is then completed with relevant aspects from a practical point of view, such as discussing the potential of implementing continuous N2O off-gas analysis on full-scale plants, and how to provide incentives to reduce overall carbon footprint of wastewater treatment plants.
Further application of N2O nitrogen isotopic signature in combination with pure culture studies and mathematical modeling: A need for an integrated approach
In this study, the N2O nitrogen isotopic signatures of mixed cultures from a pilot-scale plant treating real municipal wastewater were compared to published pure-culture investigations where the active pathways are known. A mixed population system was chosen as a necessary compromise between pure culture and full-scale studies, since it more closely resembles a full-scale plant, as compared to pure culture investigations and most of the microorganisms are barely cultivable as pure cultures. Yet, at the same time, a lab or pilot scale system is more easily controllable compared to a full-scale treatment plant required to discharge according to legal constraints.
Nevertheless, pure culture investigations are considered an important approach complementing mixed culture studies determining N2O production mechanisms, and is also relevant for novel pathway identification. For example, Schreiber et al. (2012) concluded that, combining the genomic/proteomic approach, as demonstrated by Yu et al. (2010), with isotopomeric analysis, as investigated in this thesis (chapter 4; Wunderlin et al., 2013), could be a promising future direction for characterizing the relationship between transcriptional response of the AOB Nitrosomonas europaea and N2O production.
Isotopomeric analysis has been demonstrated to be powerful for quantitatively apportioning N2O production from nitrifier denitrification, NH2OH oxidation and heterotrophic denitrification, respectively, in mixed microbial activated sludge systems, especially when combined with parameters such as the concentrations of dissolved O2, N species and COD (Wunderlin et al., 2013). Thus, combining this method with conventional N2O emission monitoring, is expected to further improve overall process understanding. Moreover, using δ15Nbulk
N2O as an additional quantitative measure, it is beneficial to further characterize the fractionation of the substrates depending on different microbial activity levels and operation conditions. Otherwise, the interpretation of the δ15Nbulk
N2O signal obtained from mixed culture remains, beside SP, limited to a qualitative information of the relative importance of AOB and heterotrophic denitrification to N2O production (for more details please see chapter 5; Wunderlin et al., in preparation).
Chapter 10 - Outlook
191
Finally, improved process understanding needs to be incorporated into existing mathematical models, which is a powerful tool for better dealing with N2O emission dynamics. Especially, including NH2OH oxidation, nitrifier denitrification, as well as heterotrophic denitrification in a unified model would allow more general conclusions. Current mathematical models do not yet allow robust quantitative prediction of N2O emission without local parameter calibration. This is interpreted as an indicator for the model structure not yet having reached a generally applicable form.
Implementation of continuous N2O off-gas measurement in full-scale: A win-win situation for plant operators and the global climate
The dynamic N2O emission pattern observed in this thesis and reported in literature, and its correlation with multiple factors, make it challenging to define general plant operating strategies for reducing N2O emission. Therefore, it is concluded that the implementation of continuous on-line N2O off-gas measurement at full-scale is favorable to achieve plant operation optimized with respect to its overall carbon footprint (comprehensive energy optimization strategies). On the long-term this might lead to sustainable operation strategies where online N2O measurement is not required anymore (e.g. conservative operation for small-scale facilities).
Basically, N2O production is related to process instabilities leading for example to incomplete nitrification. In this context, Butler et al. (2009) came up with the idea of using N2O off-gas measurement as a tool for early warning of biological nitrification failure: for example, an increase in N2O was detected in parallel to an increase in NO2
-, similar to our data. Moreover, for a single-stage nitritation-anammox process, NO2
- accumulation induced by sudden activity loss could be easily detected online. Thus process monitoring via N2O off-gas analysis is expected to improve overall process stability of ammonia oxidizing processes. However, up to now, this idea was not further pursued nor applied in full-scale treatment plants, which might also be due to the only recent development of affordable and low maintenance off-gas monitoring. It is therefore considered an important step to further develop a robust method enabling representative measurements (e.g. to adequately deal with the spatial N2O emission variability; Ahn et al., 2010), with only low maintenance efforts required from the operator (Wunderlin et al., 2013).
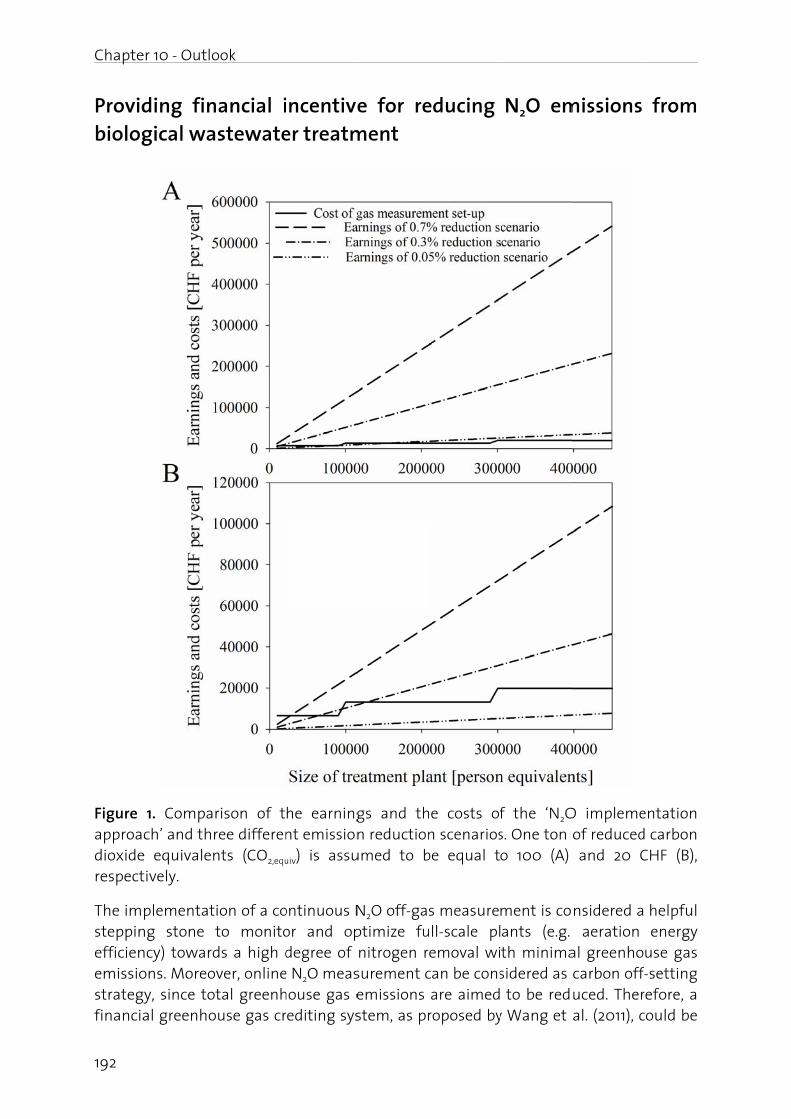
Chapte
192
Providbiolog
Figure approadioxiderespect
The imsteppinefficienemissiostrategfinancia
er 10 - Outlo
ding fingical wa
1. Compach’ and thr
e equivalentively.
plementatng stone ncy) towardons. Moreogy, since toal greenho
ook
nancial iastewate
rison of tree differennts (CO2,equ
ion of a co to monito
ds a high dover, onlineotal greenhouse gas cr
incentiveer treatm
he earningnt emission
uiv) is assu
ontinuous Nor and op
degree of e N2O meashouse gas e
editing sys
e for rement
gs and thn reduction
umed to b
N2O off-gaptimize fu nitrogen rsurement c emissions stem, as pr
educing
e costs ofn scenarios
be equal t
s measurell-scale plemoval wi
can be cons are aimedroposed by
N2O em
f the ‘N2Os. One ton o 100 (A)
ment is coants (e.g. th minimasidered as to be red
y Wang et
missions
O impleme of reduced and 20 C
nsidered a aeration al greenho carbon offuced. Ther
al. (2011), c
from
entation d carbon CHF (B),
helpful energy use gas
f-setting refore, a
could be
Chapter 10 - Outlook
193
an additional incentive, beside improving process stability, to promote widespread adoption of a continuous N2O off-gas monitoring concept. For example, N2O analytical equipment could be financed over greenhouse gas certificates: then, an N2O emission baseline scenario has to be defined first (as-is state), followed by the implementation of N2O reduction strategies resulting in lower overall emissions compared to the baseline scenario (according to the Swiss CO2 act, this reduction is called ‘additionality’; http://www.bafu.admin.ch/klima/12325/index.html?lang=de, September 2013).
It is roughly estimated the ‘N2O implementation approach’ might lead to total costs of about 6’625 CHF per year, including the analyzer, the hood for gas sampling, the implementation and starting-up, as well as the maintenance (Table 1). Moreover, it is assumed that wastewater treatment plants (WWTPs) smaller than 100’000 person equivalents (PE) require one N2O monitoring set-up (6’625 CHF per year), WWTPs smaller than 200’000 PEs need two of them (13’250 CHF/a), and plants bigger than 300’000 PEs require three set-ups (19’875 CHF/a) or even more, in order to get representative measurements.
Table 1. Estimated costs of the ‘N2O implementation approach’ per year. The investment costs of the N2O analyzer is in the range of 40’000 CHF and has an estimated lifetime of 10 years (personnel communication with MBE AG, Wetzikon, Switzerland). Both, the hood for off-gas sampling as well as the costs for implementation and starting-up are estimated to 10’000 CHF each (amortized over 10 years).
Time horizon 5 years
Costs of analyzer 20’000 CHF
Costs of hood 5’000 CHF
Cost of implementation and starting-up 5’000 CHF
Cost of maintenance (0.5 h per week at 25 CHF) 3’125 CHF
Total estimated costs per year 6’625 CHF
Figure 1 compares the costs from Table 1 with the estimated earnings (resulting from the financial crediting system) of three exemplifying (conservative) N2O reduction scenarios: an N2O emission reduction of (i) 0.05 %, (ii) 0.3 %, and (iii) 0.7 % with respect to influent nitrogen (e.g. a reduction of 0.3 % means that N2O emissions are reduced from 0.8 to 0.5 % of the influent nitrogen). Data show that an absolute reduction of 0.3 % leads to positive cash flows at a price of only 20 CHF per ton reduced CO2,equiv for plants bigger than 130’000 PEs (Figure 1 B). At a price of 100 CHF per ton CO2,equiv emission offset, however, an absolute reduction of 0.05 % already leads to positive cash flows for plants bigger than 170’000 PEs, while a reduction of 0.3 % is already cost efficient for WWTPs bigger than 20’000 PEs (Figure 1 A).
It is estimated that, with this approach, about 10’800 tons of CO2,equiv emissions can be offset per year, when only 1/3 of the Swiss wastewater is treated in plants equipped with online N2O sensors, and resulting optimized operation is attributed to an absolute
Chapter 10 - Outlook
194
emission reduction of about 0.3 % (there are probably additional emission savings due to a higher aeration efficiency, which is not considered in this calculation). Consequently, about 70’000 tons of CO2,equiv could be offset till 2020, which is about 1 % of the amount that has to be reduced by the Swiss mineral oil industry (in case they do not fulfill this target, they are obligated to pay a penalty of 160 CHF per ton CO2,equiv that has not been offset; www.klik.ch, September 2013). Even if this seems to be a small contribution, it still has to be considered potentially relevant, because Swiss offsetting projects are currently rare. For example, myclimate, one of the leading global provider of voluntary carbon offsetting solutions, presents just four Swiss offsetting projects on their webpage, reducing between 200 and 9’700 tons CO2,equiv over 7 to 10 years (http://www.myclimate.org/en/carbon-offset-projects/international-projects.html, September 2013). Therefore, wastewater treatment plants might become an attractive partner in Switzerland for carbon offsetting projects in the near future and thus contributing substantially to a further sustainable development.
References
Ahn, J. H., Kim, S., Park, H., Katehis, D., Pagilla, K. and Chandran, K. (2010). Spatial and temporal variability in atmospheric nitrous oxide generation and emission from full-scale biological nitrogen removal and non-BNR processes. Water Environment Research 82(12), 2362-2372.
Butler, M. D., Wang, Y. Y., Cartmell, E. and Stephenson, T. (2009). Nitrous oxide emissions for early warning of biological nitrification failure in activated sludge. Water Research 43(5), 1265-1272.
Chandran, K., Stein, L. Y., Klotz, M. G. and Van Loosdrecht, M. C. M. (2011). Nitrous oxide production by lithotrophic ammonia-oxidizing bacteria and implications for engineered nitrogen-removal systems. Biochemical Society Transactions 39(6), 1832-1837.
Daelman, M. R. J., De Baets, B., van Loosdrecht, M. C. M. and Volcke, E. I. P. Influence of sampling strategies on the estimated nitrous oxide emission from wastewater treatment plants. Water Research, 10.1016/j.watres.2013.03.016.
Schreiber, F., Wunderlin, P., Udert, K. M. and Wells, G. F. (2012). Nitric oxide and nitrous oxide turnover in natural and engineered microbial communities: biological pathways, chemical reactions and novel technologies. Frontiers in Microbiology 3, 10.3389/fmicb.2012.00372.
Wang, J. S., Hamburg, S. P., Pryor, D. E., Chandran, K. and Daigger, G. T. (2011). Emissions credits: Opportunity to promote integrated nitrogen management in the wastewater sector. Environmental Science and Technology 45(15), 6239-6246.
Wunderlin, P., Lehmann, M. F., Siegrist, H., Tuzson, B., Joss, A., Emmenegger, L. and Mohn, J. (2013). Isotope signatures of N2O in a mixed microbial population system:
Chapter 10 - Outlook
195
Constraints on N2O producing pathways in wastewater treatment. Environmental Science and Technology 47(3), 1339-1348.
Wunderlin, P., Mohn, J., Joss, A., Emmenegger, L. and Siegrist, H. (in preparation). Nitrogen isotopic signature of N2O emitted from a pilot scale municipal wastewater treatment plant.
Wunderlin, P., Siegrist, H., Joss, A. (2013). Online N2O Measurement: The Next Standard for Controlling Biological Ammonia Oxidation? Environmental Science & Technology, 47 (17), 9567-9568, 10.1021/es402971p.
Yu, R., Kampschreur, M. J., Loosdrecht, M. C. M. v. and Chandran, K. (2010). Mechanisms and specific directionality of autotrophic nitrous oxide and nitric oxide generation during transient anoxia. Environmental Science & Technology 44(4), 1313-1319.

Appendix A
N2O emission of sludge incineration
Thesis chapter
Wunderlin, P.; Mohn, J.; Joss, A.; Emmenegger, L.; Siegrist, H.
Appendix A
198
Abstract
Nitrous oxide (N2O) is a strong greenhouse gas (GHG) and involved in the destruction of the stratospheric ozone layer. During sludge incineration, significant N2O emissions may occur due to the high nitrogen content of sewage sludge.
Literature studies as well as data from two Swiss fluidized bed furnaces display lower N2O emissions when operated at high freeboard temperature, compared to incinerators operated at lower temperatures. On the other side, literature studies indicate that NOx production is influenced by the bed temperature, where high temperatures favor NOx formation. Due to these opposing trends, it is important to note that focusing solely on N2O reduction strategies, e.g. by increasing the freeboard temperature, might result in increasing NOx emissions. New operating strategies have therefore to be tested at individual plants since N2O and NOx production and emissions are highly variable and plant-specific.
To lower NOx emissions, fluidized bed furnaces can be equipped with a secondary DeNOx system (e.g. selectively non-catalytic reduction, SNCR) where NOx is reduced to N2 by injection of a reducing agent, such as ammonia or urea. On the other hand, the addition of nitrogen compounds (especially urea) encloses the risk of additional N2O formation. During standard system operation, however, it is difficult to distinguish between N2O produced during the primary incineration process (e.g. within the freeboard) and the secondary DeNOx system, respectively.
Sewage sludge incineration in waste to energy plants (WTE) may lead to additional N2O emissions because of the relatively high nitrogen content within the sewage sludge. However, at low sewage sludge fraction, differentiation between N2O from waste and sewage sludge incineration, respectively, is not feasible, and thus can only roughly be estimated.
N2O emission during sludge incineration in Swiss fluidized bed furnaces were in the range of 1.2 to 3.8 % with respect to the nitrogen content of sewage sludge. These emission levels indicate that N2O production during sludge incineration is relevant, since being around one fifth of total GHG emissions of wastewater treatment, but not the most important source.
Appendix A
199
Zusammenfassung
Lachgas (N2O) ist ein starkes Treibhausgas und hat einen wesentlichen Einfluss auf die Zerstörung der stratosphärischen Ozonschicht. Bei der Klärschlammverbrennung können relevante N2O-Emissionen auftreten, da der Brennstoff einen relativ hohen Stickstoffanteil aufweist.
Verschiedene Literaturstudien, wie auch Messungen an zwei Schweizer Wirbelschichtöfen deuten darauf hin, dass bei hohen Brennraumtemperaturen die N2O-Emissionen tiefer sind, als bei Anlagen, die bei geringeren Temperaturen betrieben werden. Auf der anderen Seite wird die NOx-Bildung stark durch die Betttemperatur beeinflusst. So deuten Literaturstudien darauf hin, dass eine erhöhte Betttemperatur die NOx-Bildung fördert. Vor diesem Hintergrund muss unbedingt beachtet werden, dass durch N2O-Reduktionsmassnahmen die NOx-Emissionen nicht wesentlich erhöht werden. Da die N2O- und NOx-Bildung jedoch sehr variabel und anlagenspezifisch ist, müssen allgemeinformulierte Betriebsstrategien mit Vorsicht betrachtet, und im Einzelfall getestet werden.
Zur Senkung der NOx Emissionen können Wirbelschichtöfen zur Klärschlammverbrennung mit einer sekundären Entstickungsanlage (meist selektive nicht-katalytische Reduktion, SNCR) ausgerüstet werden. Bei diesen Systemen kann es jedoch zu erhöhten N2O Emissionen kommen, insbesondere bei der Verwendung von Harnstoff als Reduktionsmittel. Eine Unterscheidung der Emissionen aus dem primären Verbrennungsprozess und der sekundären Entstickungsstufe ist im regulären Anlagenbetrieb jedoch nicht möglich.
Bei Klärschlamm-Mitverbrennung in Kehrichtverbrennungsanlagen können auf Grund des N Gehaltes im Klärschlamm erhöhte N2O Emissionen auftreten. Ist der Anteil des mitverbrannten Klärschlamms jedoch gering, so ist eine Unterscheidung der N2O Emissionen aus Kehrrichtverbrennung bzw. Klärschlammverbrennung nicht bzw. nur näherungsweise möglich.
Die N2O-Emissionen bei den untersuchten Schweizer Anlagen waren im Bereich von 1.2-3.8 % bezogen auf den im Schlamm enthaltenen Stickstoff. Der Vergleich mit anderen Treibhausgas-Quellen in der Abwasserreinigung zeigt, dass die Klärschlammverbrennung nicht den Hauptanteil der Emissionen ausmacht, mit einem Beitrag von rund einem Fünftel aber als relevant einzustufen ist.
Appendix A
200
Einleitung
Lachgas (N2O) ist ein 300-mal stärkeres Treibhausgas als CO2 (IPCC 2007). Anthropogene Aktivitäten haben seit der Industrialisierung einen Anstieg der N2O Konzentration um etwa 20 % verursacht, nicht zuletzt auf Grund der langen Halbwertszeit in der Atmosphäre von 120 Jahren. Der N2O Abbau findet primär in der Stratosphäre statt, wobei das dabei gebildete Zwischenprodukt, NO, den Ozonabbau massiv beschleunigt (Kramlich and Linak, 1994). Aus diesem Grund ist N2O die bedeutendste anthropogen-emittierte ozonabbauende Substanz des 21. Jahrhunderts (Ravishankara et al., 2009).
Die globalen anthropogenen N2O Emissionen machen schätzungsweise 8 % der Treibhausgasemissionen aus, wobei der Grossteil der Lachgasemissionen aus der Landwirtschaft stammt (intensive Bodenbewirtschaftung/Stickstoff-Düngung) (IPCC, 2007). Weitere Quellen sind industrielle Prozesse und stationäre Verbrennungsanlagen, deren Anteil an den globalen N2O Emissionen zirka 5 % beträgt (Svoboda et al., 2006; Vitovec 1991a; Vitovec 1991b). Der Beitrag der biologischen Abwasserreinigung bezogen auf die gesamten anthropogenen N2O Emissionen ist noch unklar (BAFU, 2011).
Im Rahmen des Forschungsprojekts ‚N2O Emissionen in der Abwasserreinigung: Biologische Nährstoffelimination und Schlammverbrennung‘ werden die N2O Emissionen und insbesondere deren Bildungsmechanismen in der biologischen Abwasserreinigung untersucht und kritische Betriebszustände identifiziert. Zudem sollen die N2O Emissionen der Klärschlammverbrennung abgeschätzt werden, da Verbrennungsprozesse ebenfalls zur N2O Bildung beitragen können. In einigen Literaturstudien wurde die Verbrennung von kommunalem Klärschlamm in Wirbelschichtfeuerungen bereits als bedeutende N2O Quelle identifiziert, wobei der hohe Stickstoffgehalt des Brennstoffs und die tiefen Brennraumtemperaturen (verglichen mit einer konventionellen Feuerungsanlage) Gründe für die relativ hohen N2O Emissionen zu sein scheinen (Vitovec 1991a; Vitovec 1991b; Korving et al., 2010; Sänger et al., 2001; Wether et al., 1999). Vor diesem Hintergrund soll die N2O Bildung an zwei Schweizer Schlammverbrennungsanlagen exemplarisch untersucht werden.
Im Rahmen dieser Untersuchung wird anhand einer vertiefen Literaturstudie auf die Mechanismen der N2O Bildung bei Verbrennungsprozessen eingegangen (siehe Kapitel ‚Mechanismen der N2O Bildung‘). In Kapitel 2 (‚Fallstudie Schweiz‘) werden die N2O Emissionen an zwei Klärschlamm-Monoverbrennungen im Vollmassstab (Anlage A und B), sowie einer Kehrichtverbrennungsanlage mit Klärschlamm-Mitverbrennung (Anlage C) quantifiziert, sowie der Einfluss verschiedener Prozessparameter abgeschätzt.
Mechanismen der N2O Bildung in der Schlammverbrennung
Lachgas wird bei der Klärschlammverbrennung in Wirbelschichtöfen hauptsächlich aus dem im Brennstoff enthaltenen Stickstoff gebildet (eine Reaktion von Luftstickstoff zu N2O ist bei Temperaturen <1000°C nicht zu erwarten). Die Verbrennung von Klärschlamm hat ein hohes N2O-Bildungspotential, da der Stickstoff-Anteil im

KlärschBlick in(homog(hetero
AbbilduSchlam
AbbilduKlärschAmin-SanschliaktuelleBildungZugabedie Zug
Neben wobei heiner sLiteratuLuft/BrSauerst(VitoveBrennraTempe1991b). gefördeeingega
hlamm relan die Litergener Me
ogener Mec
ung 1. Ümverbrenn
ung 1 gibthlamm entStruktur voessend zuem Stand g betrachte von HCN gabe von N
der N2O Bi hauptsächsehr schneur sind H-ennstoff-Vtoffüberschc 1991a;aumtemperaturen üb Zudem wert, die soangen wird
ativ hoch iatur zeigt,
echanismuschanismus)
Übersicht nung in Wir
t eine Übehaltenen Sor) werdenu HCN un des Wisseet. So hat die N2O BH3.
ildung ist alich H-, O- oellen ReakRadikale d
Verhältnis, huss (hohe Vitovec
eraturen diber 1000°Cwird durchogenannte d.
st (40-60 , dass N2Os), aber a) gebildet w
über mörbelschichtö
ersicht übe Stickstoffven durch Vnd NH3 umens wird vot Kramlich ildung sig
auch der Noder OH-Ra
ktion, OH-dominieren siehe weites Luft/Brec 1991b).ie Bildung
C ist der Nh hohe Te thermisch
g/kg TrockO einerseitauch durc
werden kan
ögliche Nöfen (nach
er möglicherbindungeVerdampfumgesetzt or allem H et al. (19nifikant er
N2O-Abbau adikale bet-Radikale rnd unter bter unten),
ennstoff-Ve. Grunds der N2O-a
N2O-Abbau emperaturhe Dissozia
kensubstants durch Rch oberflänn (Vitovec
N2O Bildu Korving et
he N2O-Bilen (liegt inng in die
(Vitovec 19HCN als ze
89) gezeighöht wurd
ein wichtigteiligt sindreagieren
brennstoffr, wohingegerhältnis) dsätzlich
abbauende vorherrschen auch ation, wor
nz; KorvingReaktionen ächen-katac 1991a; Vito
ngsmechan al., 2010).
dungmech Biomasse Gasphase991a; Vitontrale Sub
gt, dass dude, wenige
ger Prozess. H-Radikal
etwas laneichen Bed
gen O- und den Haupt
gilt aben Radikale
hend; Vitov ein weiterrauf hier a
App
g et al., 20 in der Ga
alysierte Povec 1991b
nismen b
hanismen. hauptsäch
e freigesetovec 1991bbstanz für urch eine r stark abe
s in der Gae zerstören
ngsamer. Gdingungend OH-Radianteil aus
er, dass e begünstigvec 1991a; rer Abbau
aber nicht
pendix A
201
010). Ein asphase Prozesse b).
bei der
Die im hlich als tzt, und ). Nach
die N2O externe er durch
asphase, n N2O in Gemäss
n (tiefes kale bei machen hohe gen (bei Vitovec
uprozess t weiter
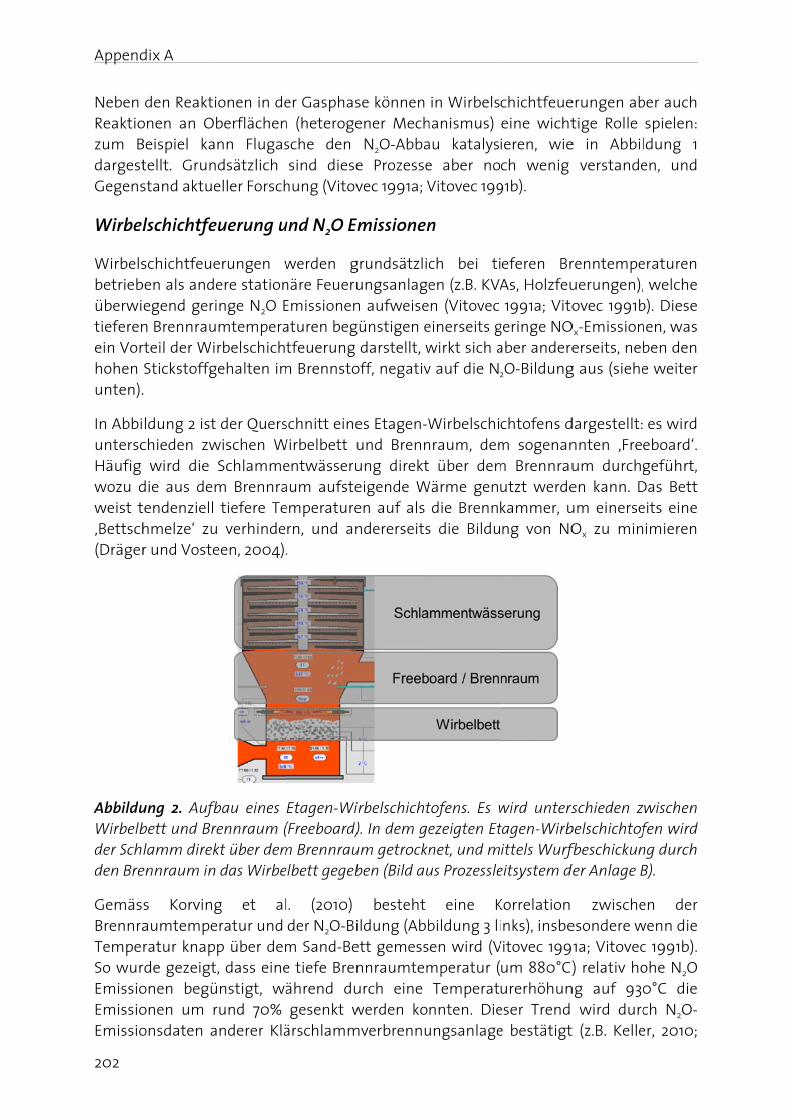
Append
202
Neben Reaktiozum BdargestGegens
Wirbel
Wirbelsbetriebüberwitieferenein Vorhohen unten).
In AbbiunterscHäufig wozu dweist t‚Bettsch(Dräger
AbbilduWirbelbder Schden Bre
GemäsBrennraTempeSo wurEmissioEmissioEmissio
dix A
den Reaktonen an OBeispiel katellt. Grunstand aktue
lschichtfe
schichtfeueben als and
egend gern Brennraurteil der Wi Stickstoffg.
ldung 2 istchieden zw wird die
die aus de tendenziell
hmelze‘ zur und Voste
ung 2. Aufbbett und Brlamm direk
ennraum in
s Korvingaumtemperatur knap
rde gezeigtonen begüonen um ronsdaten a
ionen in deberflächennn Flugas
ndsätzlich eller Forsch
euerung u
erungen were stationinge N2O E
umtemperairbelschich
gehalten im
t der Querswischen W Schlammem Brennra tiefere Te
u verhindeeen, 2004).
fbau eines rennraum (kt über dem
n das Wirbe
g et aleratur und pp über demt, dass eineünstigt, wä
rund 70% anderer Klä
er Gasphasn (heterogesche den
sind diesehung (Vitov
und N2O Em
werden gnäre Feueru
Emissionenaturen begtfeuerung
m Brennsto
schnitt eineWirbelbett u
entwässeruaum aufsteemperaturern, und an.
Etagen-Wi(Freeboard)
m Brennrauelbett gegeb
l. (2010) der N2O-Bim Sand-Bee tiefe Brenährend du gesenkt wärschlamm
se können ener Mech N2O-Abbae Prozessevec 1991a; V
missionen
grundsätzlicungsanlagen aufweisegünstigen e darstellt, w
off, negativ
es Etagen-W und Brennung direkteigende Wen auf als ndererseits
irbelschicht). In dem ge
um getrocknben (Bild au
besteht ildung (Abb
ett gemessnnraumtemurch eine werden ko
mverbrennu
in Wirbelshanismus) au katalyse aber no Vitovec 199
n
ch bei tien (z.B. KVAn (Vitovec
einerseits g wirkt sich av auf die N
Wirbelschinraum, dem über dem
Wärme gen die Brenns die Bildu
tofens. Es wezeigten Etnet, und mus Prozessle
eine Kbildung 3 lien wird (V
mperatur ( Temperatnnten. Die
ungsanlage
chichtfeue eine wichtieren, wiech wenig
91b).
eferen BrAs, Holzfeu 1991a; Vito
geringe NO aber andere
2O-Bildung
chtofens dm sogenanm Brennrauutzt werdekammer, ung von NO
wird unterstagen-Wirbittels Wurf
eitsystem d
Korrelation inks), insbeVitovec 199 um 880°C)
urerhöhuneser Trend e bestätigt
erungen abtige Rolle
e in Abbil verstande
renntempeuerungen),ovec 1991b
Ox-Emissionerseits, neb
g aus (siehe
dargestellt:nnten ‚Freum durchgen kann. D
um einerseOx zu min
rschieden zbelschichtoffbeschickun
der Anlage B
zwischeesondere w1a; Vitovec) relativ ho
ng auf 930 wird durc
t (z.B. Kelle
ber auch spielen: ldung 1 en, und
eraturen welche
b). Diese nen, was ben den e weiter
es wird eboard‘. geführt,
Das Bett eits eine imieren
wischen fen wird
ng durch B).
en der wenn die c 1991b). ohe N2O 0°C die ch N2O-
er, 2010;
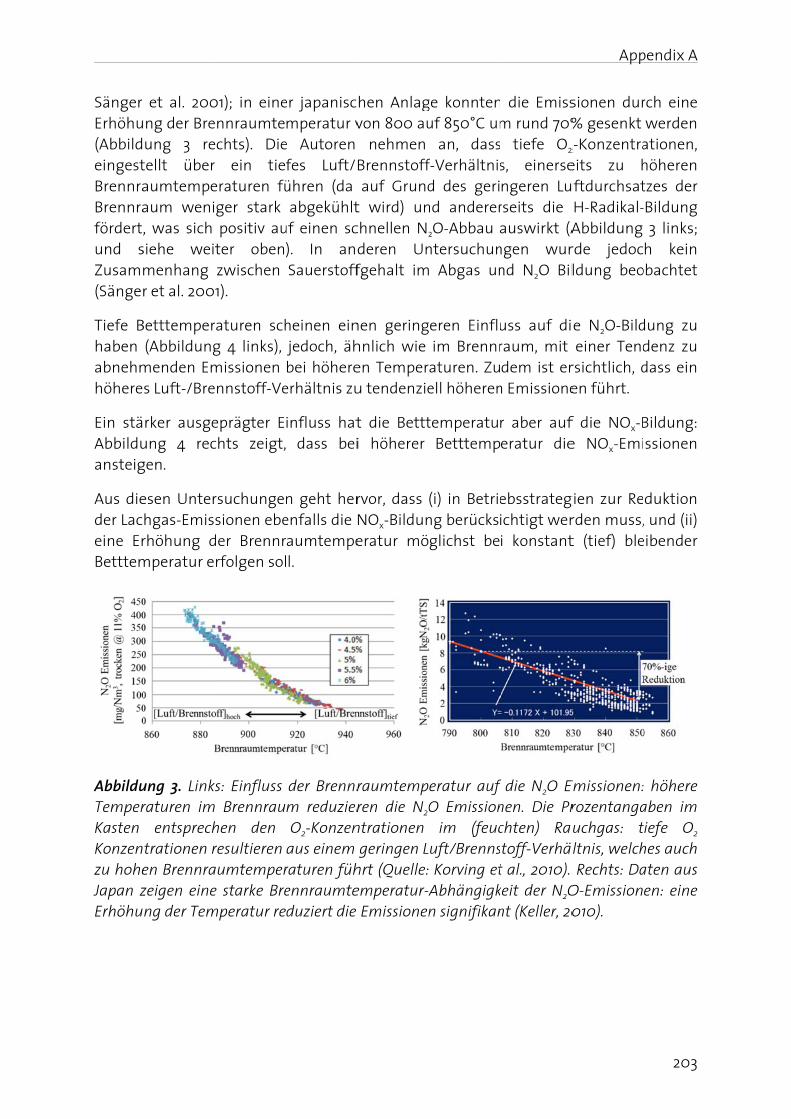
Sänger Erhöhu(AbbildeingestBrennraBrennrafördert,und sZusam(Sänge
Tiefe Bhaben abnehmhöhere
Ein stäAbbilduansteig
Aus dieder Laceine ErBetttem
AbbilduTemperKasten Konzenzu hoheJapan zErhöhu
et al. 200ung der Bre
ung 3 retellt überaumtempeaum weni, was sich
siehe weimenhang r et al. 200
Betttemper (Abbildungmenden Ems Luft-/Bre
rker ausgeung 4 recgen.
esen Unterhgas-Emisrhöhung dmperatur e
ung 3. Linkraturen im entsprechtrationen ren Brennrazeigen eineng der Tem
01); in eineennraumteechts). Dier ein tieeraturen füger stark positiv auter oben
zwischen 1).
raturen schg 4 links), missionen ennstoff-Ve
eprägter Echts zeigt,
rsuchungesionen ebe
der Brennr rfolgen sol
ks: Einfluss m Brennrau
hen den resultieren aumtempere starke Bre
mperatur re
er japaniscmperatur v
e Autoren fes Luft/Bühren (da abgekühltuf einen sc). In and
Sauerstoff
heinen ein jedoch, äh bei höhereerhältnis zu
influss hat dass bei
n geht herenfalls die Naumtempel.
der Brennrm reduzierO2-Konzen
aus einem raturen fühennraumteduziert die
hen Anlag von 800 au nehmen Brennstoff auf Grundt wird) unchnellen N2
deren Unfgehalt im
nen geringhnlich wie en Temperu tendenzie
t die Bettti höherer
rvor, dass NOx-Bilduneratur mö
raumtempren die N2O
ntrationen geringen Lhrt (Quelle:emperatur-A Emissionen
ge konntenuf 850°C um an, dassf-Verhältnisd des geri
nd anderer
2O-Abbau ntersuchun Abgas un
eren Einflu im Brennraturen. Zuell höheren
temperatu Betttemp
(i) in Betrieng berücksglichst be
eratur auf O Emission im (feucuft/Brenns Korving etAbhängigkn signifikan
die Emissm rund 70% tiefe O2
s, einersengeren Lu
rseits die auswirkt (Angen wurnd N2O Bil
uss auf diraum, mit dem ist er
n Emissione
r aber auferatur die
ebsstrategichtigt weri konstant
f die N2O Enen. Die Prchten) Ratoff-Verhä
t al., 2010). keit der N2Ont (Keller, 20
App
sionen dur% gesenkt
2-Konzentraeits zu huftdurchsat H-Radikal-Abbildung rde jedocldung beo
e N2O-Bild einer Tendrsichtlich, den führt.
f die NOx-Be NOx-Emi
gien zur Rerden muss,t (tief) ble
Emissionen:rozentangauchgas: tltnis, welch Rechts: Da
O-Emission010).
pendix A
203
rch eine werden ationen, höheren tzes der -Bildung 3 links; h kein
obachtet
dung zu denz zu
dass ein
Bildung: ssionen
duktion , und (ii)
eibender
: höhere aben im tiefe O2 hes auch aten aus en: eine
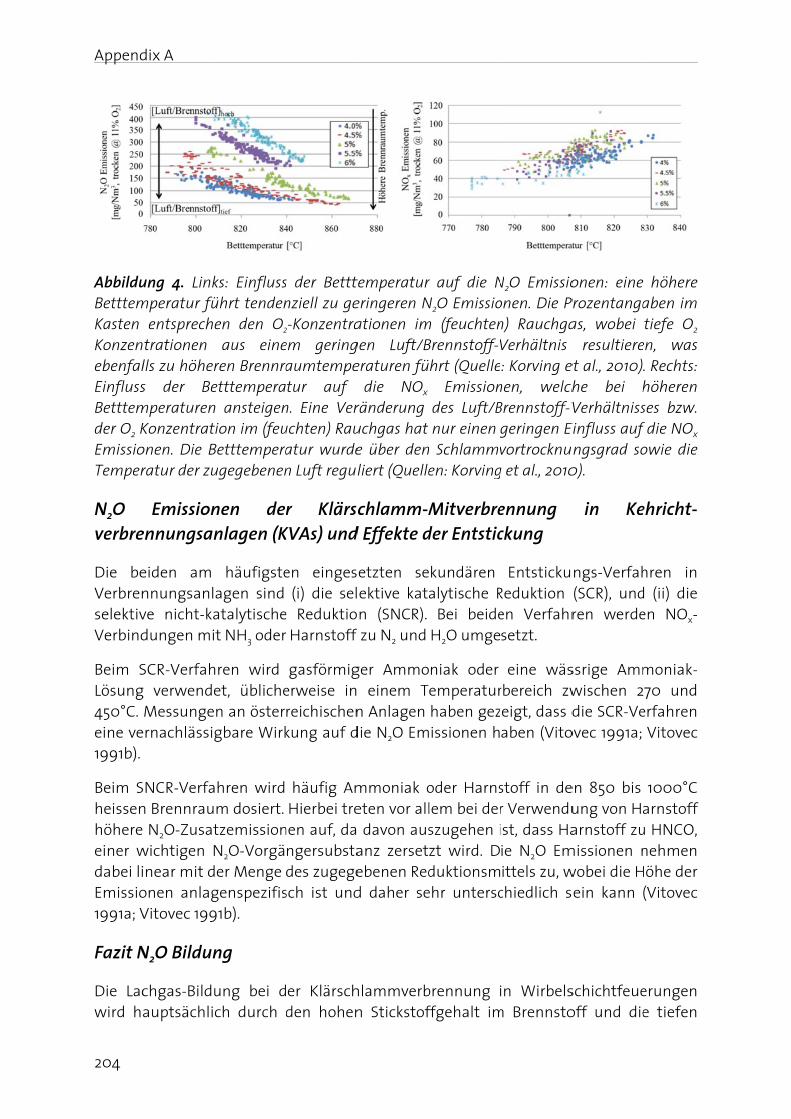
Append
204
AbbilduBetttemKasten KonzenebenfalEinflussBetttemder O2 KEmissioTemper
N2O verbre
Die beVerbrenselektivVerbind
Beim SLösung450°C. eine ve1991b).
Beim Sheissenhöhereeiner wdabei liEmissio1991a; V
Fazit N
Die Lacwird ha
dix A
ung 4. Linkmperatur fü entsprechtrationen lls zu höhers der Be
mperaturenKonzentratonen. Die Bratur der zu
Emissionennungsan
eiden am nnungsanlve nicht-kadungen mi
SCR-Verfahg verwende Messungeernachlässig
SNCR-Verfan Brennrau N2O-Zusat
wichtigen N inear mit donen anlag Vitovec 199
N2O Bildun
chgas-Bilduauptsächli
ks: Einflussührt tendenen den O2
aus eineren Brennraetttemperan ansteigention im (feuBetttemperaugegebenen
nen denlagen (K
häufigsteagen sind atalytischet NH3 oder
hren wird et, üblichen an östergbare Wirk
ahren wird m dosiert. tzemission
N2O-Vorgäder Menge genspezifis91b).
ng
ung bei dch durch
s der Betttnziell zu ge
2-Konzentraem geringaumtempetur auf
n. Eine Veruchten) Rauatur wurden Luft regul
r KlärscKVAs) und
en einges (i) die sel
e Reduktio Harnstoff
gasförmigerweise inreichischenkung auf d
häufig Am Hierbei tre
nen auf, dangersubsta
des zugegesch ist und
er Klärsch den hohen
temperatureringeren Nationen im
gen Luft/Beraturen fü
die NOx ränderung uchgas hat e über denliert (Quelle
chlamm-Md Effekte d
etzten seektive katn (SNCR). zu N2 und
ger Ammo einem T
n Anlagen die N2O Em
mmoniak oeten vor all davon ausanz zersetebenen Redd daher se
hlammverbn Stickstof
r auf die NN2O Emissiom (feuchtenBrennstoff-Vhrt (Quelle Emission des Luft/B nur einen g
n Schlammven: Korving
Mitverbreder Entstic
kundären alytische R Bei beide H2O umge
niak oder emperatur haben gezissionen h
oder Harnslem bei derszugehen izt wird. Dduktionsm
ehr untersc
brennung ffgehalt im
N2O Emissioonen. Die Pn) RauchgaVerhältnis : Korving e
nen, welchBrennstoff-V geringen Evortrocknu
g et al., 2010
ennung ckung
EntstickuReduktion en Verfahrsetzt.
eine wäsrbereich zweigt, dass daben (Vito
stoff in der Verwendu
ist, dass Haie N2O Emittels zu, w
chiedlich s
in Wirbelsm Brennsto
onen: eineProzentangaas, wobei resultiereet al., 2010).he bei hVerhältniss
Einfluss auf ungsgrad so0).
in Ke
ngs-Verfah (SCR), undren werde
ssrige Ammwischen 2 die SCR-Veovec 1991a;
en 850 bis ung von Haarnstoff zu
missionen nwobei die Hsein kann
schichtfeueoff und die
höhere aben im tiefe O2
en, was . Rechts: höheren ses bzw. f die NOx owie die
ehricht-
hren in d (ii) die en NOx-
moniak-70 und
erfahren Vitovec
1000°C arnstoff
u HNCO, nehmen Höhe der (Vitovec
erungen e tiefen
Appendix A
205
Verbrennungstemperaturen verursacht. Neben der Bildung haben aber auch N2O abbauende Reaktionen einen Einfluss auf die N2O Emissionen.
Gemäss Literaturangaben begünstigen tiefe Brennraumtemperatur die N2O Bildung. Im Weiteren wurde beschrieben, dass der Einsatz einer sekundären Entstickungsstufe (SCR) nicht per se einen Einfluss auf die N2O-Bildung haben muss, wobei insbesondere die Verwendung von Ammoniak als wenig problematisch einzustufen ist. Hingegen können bei der Eindüsung von Harnstoff als Reduktionsmittel in den Brennraum (SNCR), erhöhte Emissionen auftreten, welche möglicherweise durch die Bildung von HNCO, eine Vorläufersubstanz von N2O, aus Harnstoff verursacht werden.
Es gilt festzuhalten, dass bei Schlammverbrennungsanlagen die N2O-Emissionen stark variieren können, da verschiedene Faktoren, wie Brennstoffzusammensetzung, Feuchte (Entwässerungsgrad), Art der Schlammentwässerung oder Betrieb des Ofens (insbesondere Temperatur) zeitlichen Schwankungen unterworfen sind.
Im folgenden Kapitel wird (i) die Auswirkung der Bett- und Brennraumtemperatur auf die N2O-/NOx-Emissionen von zwei Klärschlamm-Monoverbrennungsanlagen (A und B) betrachtet, und (ii) die Effekte einer sekundären Entstickungsanlage (DeNOx) einer KVA untersucht (C).
Fallstudien Schweiz
Von Schweizer Klärschlammverbrennungsanlagen liegen noch keine systematisch erhobenen Daten vor. Das Handbuch Emissionsfaktoren für stationäre Quellen des BAFU geht aber von vergleichbaren N2O Emission wie bei KVAs aus (Bafu, 2000). Im Folgenden werden die Emissionen von zwei grosstechnischen Klärschlamm-Monoverbrennungsanlagen (Anlage A und B) und einer Kehrichtverbrennungsanlage mit Klärschlamm-Mitverbrennung (Anlage C) präsentiert. Insbesondere wird die Auswirkung der Brennraumtemperatur beim Wirbelschichtofen (Anlage A und B), sowie die Wirkung eines DeNOx Systems (SCR-Verfahren mit NH3-Eindüsung) auf die N2O-Emissionen einer KVA diskutiert (Anlage C).
Anlage A ist ein Wirbelschichtofen, in dem rund 40‘000 Tonnen Klärschlamm pro Jahr (entspricht 280‘000 Einwohnergleichwerten), mit einem mittleren Trockenmaterialgehalt (TS) von 25% verbrannt werden. Dies ergibt rund 9‘000 Tonnen TS pro Jahr. Die Anlage wird bei einer Brennraumtemperatur von rund 850°C betrieben und die NOx Emissionen werden mittels SNCR Verfahren, durch Zudosierung des Klärschlammfiltrats, reduziert (Angaben des Anlagenbetreibers).
Anlage B verfügt über drei Etagen-Wirbelschichtöfen mit einer Nachbrennkammer, einer Wärmerückgewinnung und einer Entstickungsanlage (SNCR Verfahren mit Ammoniak Zugabe). Die Brennraumtemperatur liegt im Mittel bei rund 800°C. Es werden durchschnittlich etwa 9‘600 Tonnen Trockenmaterial pro Jahr verwertet (8‘500 Tonnen eigener und zirka 1‘100 Tonnen fremder Klärschlamm; 25-26% TS-Anteil im entwässerten Klärschlamm; gemäss Angaben des Anlagenbetreibers).
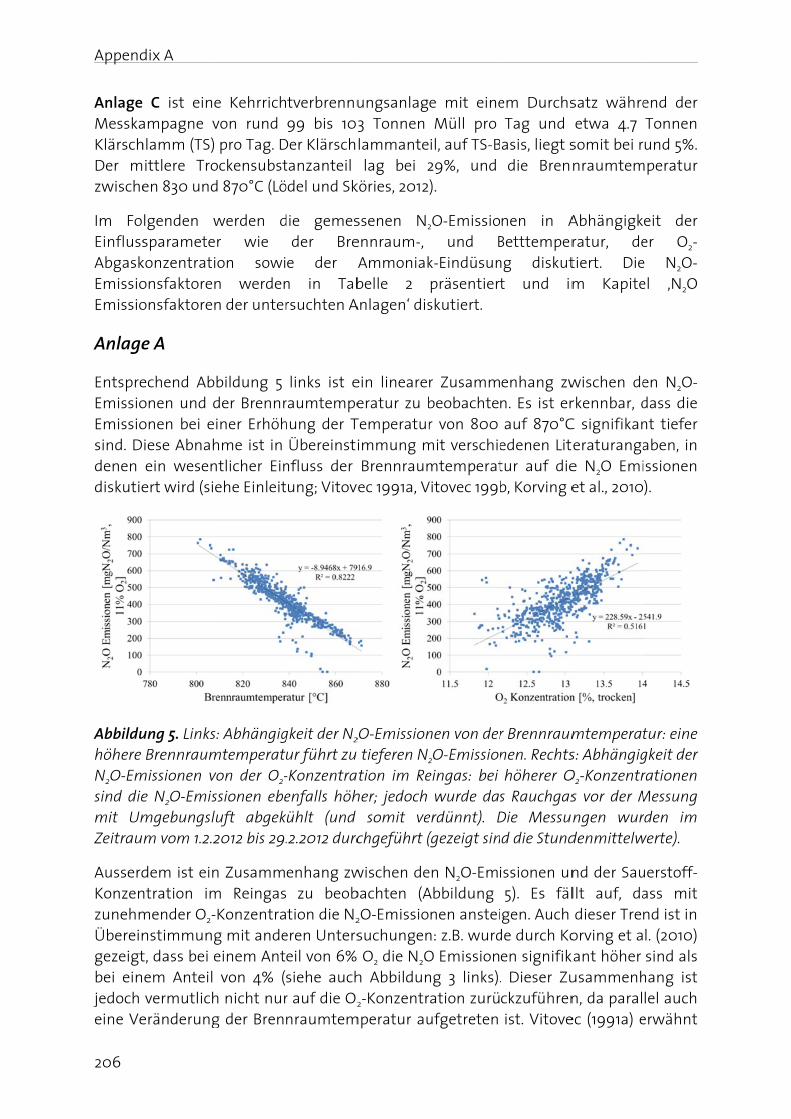
Append
206
Anlage MesskaKlärschDer mzwische
Im FoEinflussAbgaskEmissioEmissio
Anlage
EntspreEmissioEmissiosind. Ddenen diskutie
Abbilduhöhere N2O-Emsind diemit UmZeitrau
AusserdKonzenzunehmÜbereingezeigtbei einjedoch eine Ve
dix A
C ist eineampagne vhlamm (TS)
ittlere Troen 830 und
lgenden wsparamete
konzentrationsfaktorenonsfaktoren
e A
echend Abonen und donen bei eiese Abnah
ein wesenert wird (si
ung 5. Links Brennraum
missionen ve N2O-Emismgebungslm vom 1.2.2
dem ist einntration immender O2-nstimmungt, dass bei eem Anteil vermutlicheränderung
e Kehrrich von rund
pro Tag. Dockensubstd 870°C (Lö
werden der wie ion sowin werdenn der unter
bildung 5 der Brennr
iner Erhöhhme ist in ntlicher Einehe Einleit
s: Abhängigmtemperatvon der O2-ssionen ebeluft abgek2012 bis 29.
n Zusammm Reingas-Konzentrag mit ande
einem Ant von 4% (h nicht nurg der Bren
tverbrennu 99 bis 10Der Klärschtanzanteil
ödel und Sk
die gemesder Bre
e der n in Tabrsuchten A
links ist eraumtempehung der T Übereinstinfluss der ung; Vitov
gkeit der N2
ur führt zu -Konzentraenfalls höhühlt (und .2.2012 durc
enhang zw zu beobtion die N2
eren Unterseil von 6%siehe auchr auf die O2
nraumtem
ungsanlag3 Tonnen lammante
lag bei 2köries, 2012
ssenen N2
ennraum-, Ammoniakbelle 2
Anlagen‘ dis
ein lineareeratur zu b
Temperaturimmung m Brennraumec 1991a, V
2O-Emission tieferen N2
tion im Reher; jedoch somit vechgeführt (
wischen debachten (A
2O-Emissiosuchungen O2 die N2O
h Abbildun
2-Konzentrmperatur au
e mit eine Müll pro il, auf TS-B29%, und ).
2O-Emissio und Bk-Eindüsunpräsentiertskutiert.
r Zusamm beobachter von 800
mit verschiemtemperat
Vitovec 199b
nen von der
2O-Emissioneingas: bei wurde das
erdünnt). D (gezeigt sin
en N2O-EmiAbbildung nen anstei
n: z.B. wurdO Emissionng 3 links).ation zurü
ufgetreten
em Durchs Tag und asis, liegt s
die Bren
nen in ABetttemperng diskutt und im
enhang zwn. Es ist er auf 870°Cedenen Littur auf dieb, Korving e
r Brennraumnen. Rechts höherer Os RauchgasDie Messud die Stund
issionen un 5). Es fäl
gen. Auch de durch Koen signifik. Dieser Zuckzuführen ist. Vitove
satz währe etwa 4.7 somit bei rnraumtem
Abhängigkratur, detiert. Diem Kapite
wischen derkennbar, dC signifikanteraturangae N2O Emi et al., 2010
mtemperats: Abhängig
O2-Konzentrs vor der Mngen wur
denmittelw
nd der Saullt auf, da dieser Treorving et a
kant höher usammenhn, da paral
ec (1991a) e
end der Tonnen und 5%. mperatur
eit der er O2-e N2O-el ‚N2O
en N2O- dass die nt tiefer aben, in issionen ).
tur: eine gkeit der rationen Messung rden im
werte).
uerstoff-ass mit nd ist in l. (2010) sind als hang ist lel auch
erwähnt
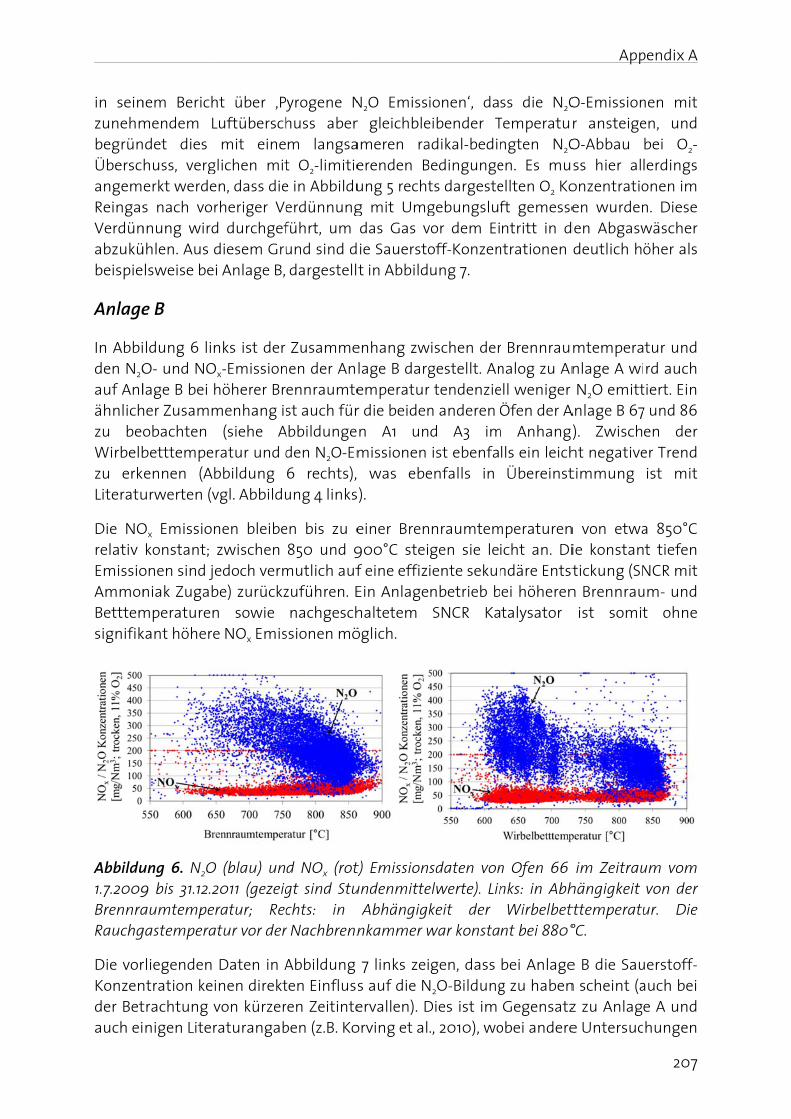
in seinzunehmbegrünÜberscangemReingasVerdünabzukübeispie
Anlage
In Abbiden N2Oauf Anlähnlichzu beoWirbelbzu erkLiteratu
Die NOrelativ EmissioAmmonBetttemsignifik
Abbildu1.7.2009BrennraRauchg
Die vorKonzender Betauch ei
nem Berichmendem L
det dies huss, vergerkt werdes nach vor
nnung wirdühlen. Aus d
lsweise be
e B
ildung 6 linO- und NOlage B bei h
her Zusammobachten betttempeennen (Ab
urwerten (v
Ox Emission konstant; onen sind jniak Zugab
mperaturenkant höhere
ung 6. N2O9 bis 31.12.2aumtempe
gastempera
rliegenden ntration ketrachtung vnigen Liter
ht über ‚PLuftübersch mit eineglichen miten, dass dierheriger Ved durchgef diesem Grui Anlage B,
nks ist der Ox-Emission höherer Brmenhang is (siehe Aratur und dbbildung
vgl. Abbildu
nen bleibe zwischen
edoch vermbe) zurückzn sowie e NOx Emis
O (blau) un2011 (gezeigratur; Rec
atur vor der
Daten in Ainen direkt
von kürzerraturangab
yrogene Nhuss aberm langsat O2-limitiee in Abbilduerdünnungführt, um und sind d dargestell
Zusammenen der Anennraumte
st auch fürAbbildunge den N2O-Em
6 rechts), ung 4 links
en bis zu e 850 und 9mutlich aufzuführen. E
nachgeschssionen mö
d NOx (rot)gt sind Stuchts: in
r Nachbrenn
Abbildung ten Einflussren Zeitinteben (z.B. Ko
N2O Emissr gleichbleameren raerenden Bung 5 rechtg mit Umg das Gas vie Sauerstot in Abbild
enhang zwlage B dargemperaturr die beidenn A1 unmissionen was ebe).
einer Bren 900°C stei
f eine effiz Ein Anlagehaltetem öglich.
t) Emissionundenmitte
Abhängigknkammer w
7 links zeis auf die Nervallen). D
orving et al
ionen‘, daeibender Tadikal-bedinBedingungets dargestegebungsluf
vor dem Eioff-Konzenung 7.
wischen dergestellt. Anr tendenzien anderen Öd A3 im ist ebenfaenfalls in
nraumtemgen sie leiente sekunnbetrieb b
SNCR Ka
sdaten vonelwerte). Linkeit der
war konsta
gen, dass N2O-Bildung Dies ist im
., 2010), wo
ss die N2OTemperatungten N2Oen. Es muellten O2 Koft gemessentritt in d
ntrationen
r Brennraunalog zu Anell weniger Öfen der A
m Anhang)lls ein leich
Übereinst
mperaturenicht an. Dindäre Entstei höherentalysator
n Ofen 66 nks: in Abh
Wirbelbetnt bei 880°
bei Anlageg zu haben Gegensatzobei andere
App
O-Emissionr ansteigeO-Abbau ss hier al
onzentratioen wurden
den Abgasw deutlich h
mtemperanlage A wi N2O emitt
Anlage B 67). Zwisch
ht negativetimmung
n von etwaie konstantickung (SN
n Brennrau ist somit
im Zeitrauhängigkeit tttemperatu°C.
e B die Saun scheint (az zu Anlage Untersuc
pendix A
207
nen mit en, und bei O2-lerdings onen im n. Diese wäscher öher als
tur und rd auch
tiert. Ein 7 und 86 en der
er Trend ist mit
a 850°C t tiefen
NCR mit um- und t ohne
um vom von der ur. Die
uerstoff-auch bei e A und hungen
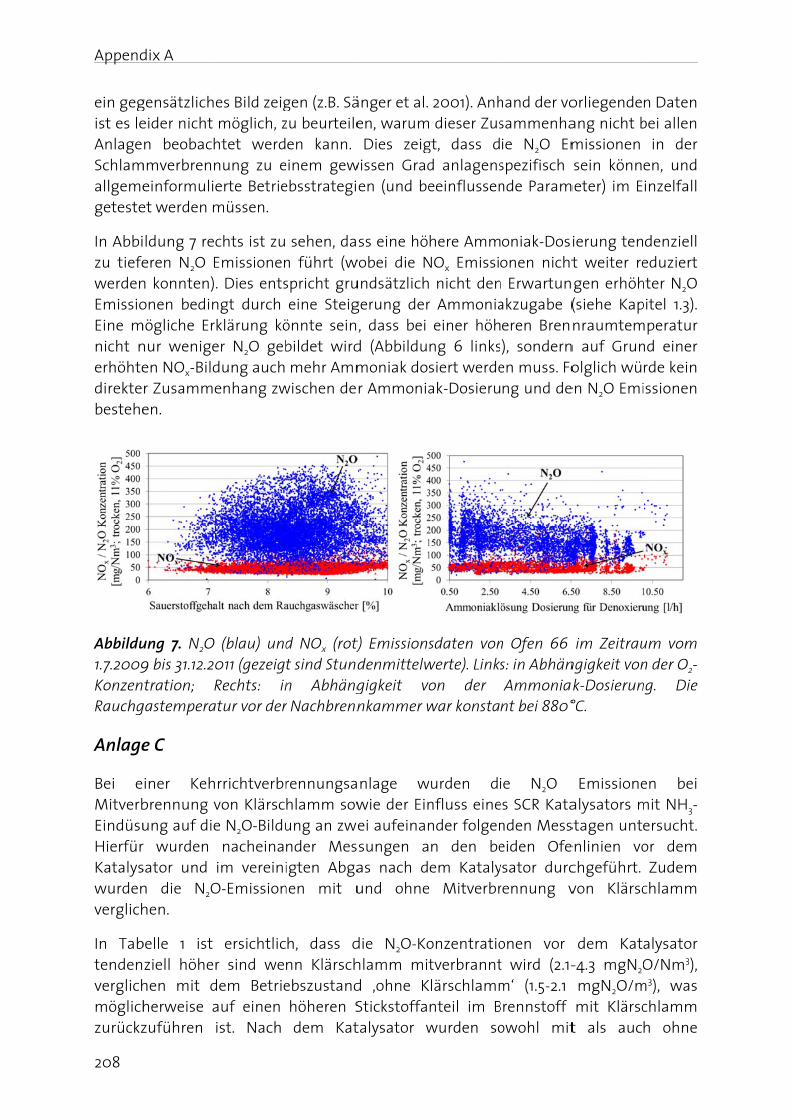
Append
208
ein gegist es leAnlageSchlamallgemegeteste
In Abbizu tiefewerdenEmissioEine mnicht nerhöhtedirektebestehe
Abbildu1.7.2009KonzenRauchg
Anlage
Bei eMitverbEindüsuHierfürKatalyswurdenverglich
In Tabtendenverglichmöglichzurückz
dix A
gensätzlicheider nicht n beobach
mmverbrenneinformuli
et werden m
ldung 7 reeren N2O En konnten)onen bedin
mögliche Ernur wenigeen NOx-Bildr Zusammen.
ung 7. N2O9 bis 31.12.2tration; R
gastempera
e C
iner Kehbrennung vung auf dier wurden sator und n die N2Ohen.
belle 1 ist ziell höhe
hen mit dherweise azuführen
es Bild zeig möglich, zhtet werdnung zu eerte Betrie
müssen.
chts ist zu Emissionen
. Dies entsngt durch rklärung köer N2O gebdung auch enhang zw
(blau) und011 (gezeigRechts: in
atur vor der
hrrichtverbr von Klärsce N2O-Bildu nacheina im vereiniO-Emission
ersichtlicr sind we
dem Betrie auf einen ist. Nach
gen (z.B. Sä zu beurteile
en kann. einem gewebsstrategi
sehen, dan führt (wspricht gru eine Steigönnte seinbildet wird mehr Amm
wischen de
d NOx (rot)t sind Stundn Abhängr Nachbrenn
rennungsahlamm sowung an zwender Mesigten Abga
nen mit u
h, dass dnn Klärschebszustand höheren S dem Kat
änger et al. en, warum Dies zeig
wissen Graden (und be
ss eine höwobei die Nundsätzlichgerung der
, dass bei d (Abbildumoniak dor Ammonia
t) Emissionsdenmittelwgigkeit vonkammer w
nlage wwie der Einei aufeinansungen aas nach dund ohne
die N2O-Kohlamm mitd ‚ohne K
Stickstoffatalysator w
2001). Anh dieser Zus
gt, dass dd anlagenseeinflussen
here AmmNOx Emissi
nicht denr Ammonia einer höhng 6 linkssiert werdeak-Dosieru
sdaten vonwerte). Linkson der war konsta
wurden dinfluss einender folgenn den beem Kataly
e Mitverbr
onzentratiotverbrannt
Klärschlammnteil im Bwurden so
hand der vosammenhaie N2O Emspezifisch nde Param
oniak-Dosionen nicht
n Erwartunakzugabe (eren Bren), sondern
en muss. Fong und de
n Ofen 66 s: in AbhänAmmonia
nt bei 880°
ie N2O es SCR Katanden Messeiden Ofeysator durcrennung v
onen vor t wird (2.1-m‘ (1.5-2.1
Brennstoff owohl mit
orliegendeang nicht bmissionen
sein könnmeter) im E
ierung tent weiter regen erhöh
(siehe Kapnraumtem
n auf Grunolglich wü
en N2O Emi
im Zeitraungigkeit vonk-Dosierun°C.
Emissionealysators mstagen unteenlinien vochgeführt. von Klärsc
dem Kat-4.3 mgN2O mgN2O/m mit Klärsct als auc
n Daten bei allen in der en, und inzelfall
denziell eduziert
hter N2O pitel 1.3).
mperatur nd einer rde kein issionen
um vom n der O2-ng. Die
en bei mit NH3-ersucht. or dem Zudem chlamm
alysator O/Nm3),
m3), was chlamm h ohne
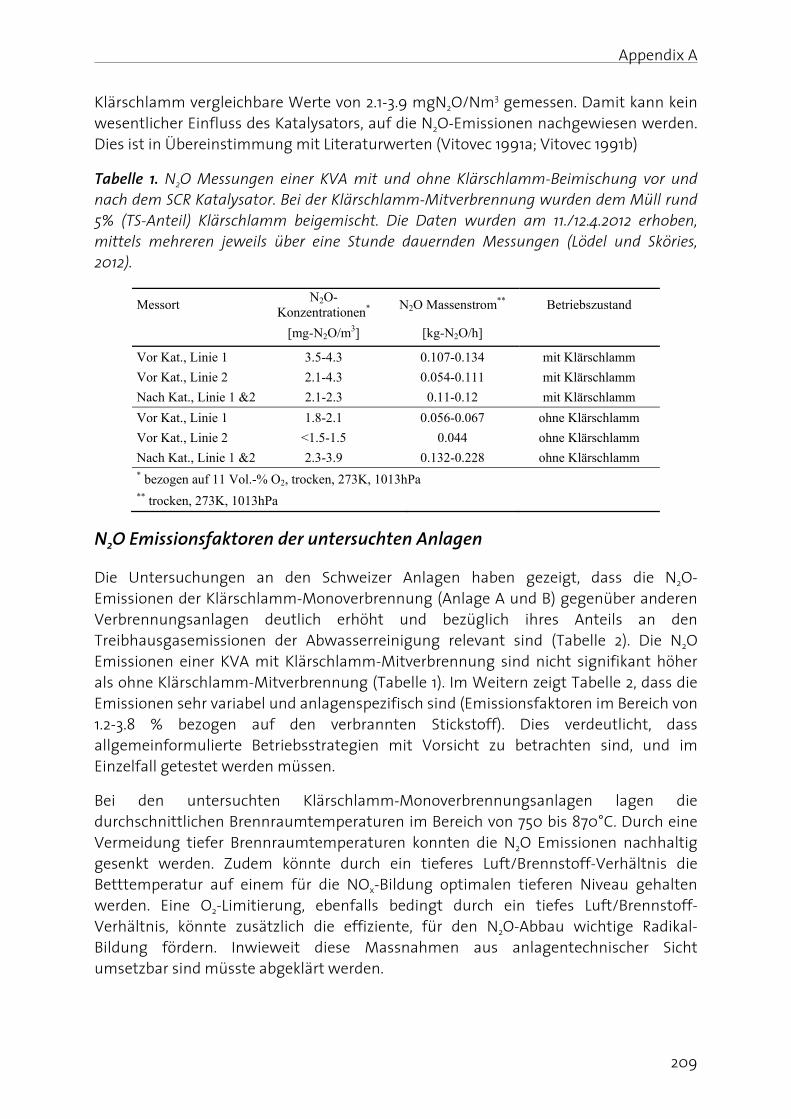
Appendix A
209
Klärschlamm vergleichbare Werte von 2.1-3.9 mgN2O/Nm3 gemessen. Damit kann kein wesentlicher Einfluss des Katalysators, auf die N2O-Emissionen nachgewiesen werden. Dies ist in Übereinstimmung mit Literaturwerten (Vitovec 1991a; Vitovec 1991b)
Tabelle 1. N2O Messungen einer KVA mit und ohne Klärschlamm-Beimischung vor und nach dem SCR Katalysator. Bei der Klärschlamm-Mitverbrennung wurden dem Müll rund 5% (TS-Anteil) Klärschlamm beigemischt. Die Daten wurden am 11./12.4.2012 erhoben, mittels mehreren jeweils über eine Stunde dauernden Messungen (Lödel und Sköries, 2012).
Messort N2O-
Konzentrationen* N2O Massenstrom** Betriebszustand
[mg-N2O/m3] [kg-N2O/h]
Vor Kat., Linie 1 3.5-4.3 0.107-0.134 mit Klärschlamm
Vor Kat., Linie 2 2.1-4.3 0.054-0.111 mit Klärschlamm
Nach Kat., Linie 1 &2 2.1-2.3 0.11-0.12 mit Klärschlamm
Vor Kat., Linie 1 1.8-2.1 0.056-0.067 ohne Klärschlamm
Vor Kat., Linie 2 <1.5-1.5 0.044 ohne Klärschlamm
Nach Kat., Linie 1 &2 2.3-3.9 0.132-0.228 ohne Klärschlamm * bezogen auf 11 Vol.-% O2, trocken, 273K, 1013hPa ** trocken, 273K, 1013hPa
N2O Emissionsfaktoren der untersuchten Anlagen
Die Untersuchungen an den Schweizer Anlagen haben gezeigt, dass die N2O-Emissionen der Klärschlamm-Monoverbrennung (Anlage A und B) gegenüber anderen Verbrennungsanlagen deutlich erhöht und bezüglich ihres Anteils an den Treibhausgasemissionen der Abwasserreinigung relevant sind (Tabelle 2). Die N2O Emissionen einer KVA mit Klärschlamm-Mitverbrennung sind nicht signifikant höher als ohne Klärschlamm-Mitverbrennung (Tabelle 1). Im Weitern zeigt Tabelle 2, dass die Emissionen sehr variabel und anlagenspezifisch sind (Emissionsfaktoren im Bereich von 1.2-3.8 % bezogen auf den verbrannten Stickstoff). Dies verdeutlicht, dass allgemeinformulierte Betriebsstrategien mit Vorsicht zu betrachten sind, und im Einzelfall getestet werden müssen.
Bei den untersuchten Klärschlamm-Monoverbrennungsanlagen lagen die durchschnittlichen Brennraumtemperaturen im Bereich von 750 bis 870°C. Durch eine Vermeidung tiefer Brennraumtemperaturen konnten die N2O Emissionen nachhaltig gesenkt werden. Zudem könnte durch ein tieferes Luft/Brennstoff-Verhältnis die Betttemperatur auf einem für die NOx-Bildung optimalen tieferen Niveau gehalten werden. Eine O2-Limitierung, ebenfalls bedingt durch ein tiefes Luft/Brennstoff-Verhältnis, könnte zusätzlich die effiziente, für den N2O-Abbau wichtige Radikal-Bildung fördern. Inwieweit diese Massnahmen aus anlagentechnischer Sicht umsetzbar sind müsste abgeklärt werden.
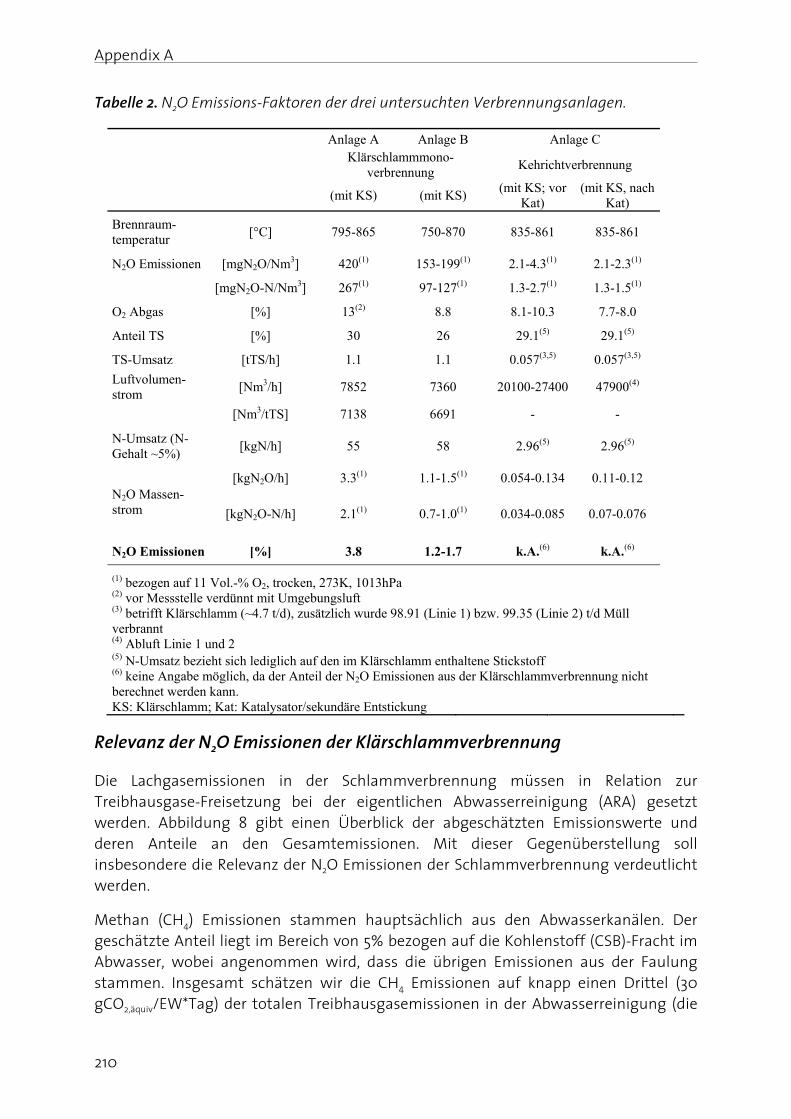
Appendix A
210
Tabelle 2. N2O Emissions-Faktoren der drei untersuchten Verbrennungsanlagen.
Anlage A Anlage B Anlage C Klärschlammmono-
verbrennung Kehrichtverbrennung
(mit KS) (mit KS)
(mit KS; vor Kat)
(mit KS, nach Kat)
Brennraum-temperatur
[°C] 795-865 750-870 835-861 835-861
N2O Emissionen [mgN2O/Nm3] 420(1) 153-199(1) 2.1-4.3(1) 2.1-2.3(1)
[mgN2O-N/Nm3] 267(1) 97-127(1) 1.3-2.7(1) 1.3-1.5(1)
O2 Abgas [%] 13(2) 8.8 8.1-10.3 7.7-8.0
Anteil TS [%] 30 26 29.1(5) 29.1(5)
TS-Umsatz [tTS/h] 1.1 1.1 0.057(3,5) 0.057(3,5)
Luftvolumen-strom
[Nm3/h] 7852 7360 20100-27400 47900(4)
[Nm3/tTS] 7138 6691 - -
N-Umsatz (N-Gehalt ~5%)
[kgN/h] 55 58 2.96(5) 2.96(5)
N2O Massen-strom
[kgN2O/h] 3.3(1) 1.1-1.5(1) 0.054-0.134 0.11-0.12
[kgN2O-N/h] 2.1(1) 0.7-1.0(1) 0.034-0.085 0.07-0.076
N2O Emissionen [%] 3.8 1.2-1.7 k.A.(6) k.A.(6)
(1) bezogen auf 11 Vol.-% O2, trocken, 273K, 1013hPa (2) vor Messstelle verdünnt mit Umgebungsluft (3) betrifft Klärschlamm (~4.7 t/d), zusätzlich wurde 98.91 (Linie 1) bzw. 99.35 (Linie 2) t/d Müll verbrannt (4) Abluft Linie 1 und 2 (5) N-Umsatz bezieht sich lediglich auf den im Klärschlamm enthaltene Stickstoff (6) keine Angabe möglich, da der Anteil der N2O Emissionen aus der Klärschlammverbrennung nicht berechnet werden kann. KS: Klärschlamm; Kat: Katalysator/sekundäre Entstickung
Relevanz der N2O Emissionen der Klärschlammverbrennung
Die Lachgasemissionen in der Schlammverbrennung müssen in Relation zur Treibhausgase-Freisetzung bei der eigentlichen Abwasserreinigung (ARA) gesetzt werden. Abbildung 8 gibt einen Überblick der abgeschätzten Emissionswerte und deren Anteile an den Gesamtemissionen. Mit dieser Gegenüberstellung soll insbesondere die Relevanz der N2O Emissionen der Schlammverbrennung verdeutlicht werden.
Methan (CH4) Emissionen stammen hauptsächlich aus den Abwasserkanälen. Der geschätzte Anteil liegt im Bereich von 5% bezogen auf die Kohlenstoff (CSB)-Fracht im Abwasser, wobei angenommen wird, dass die übrigen Emissionen aus der Faulung stammen. Insgesamt schätzen wir die CH4 Emissionen auf knapp einen Drittel (30 gCO2,äquiv/EW*Tag) der totalen Treibhausgasemissionen in der Abwasserreinigung (die
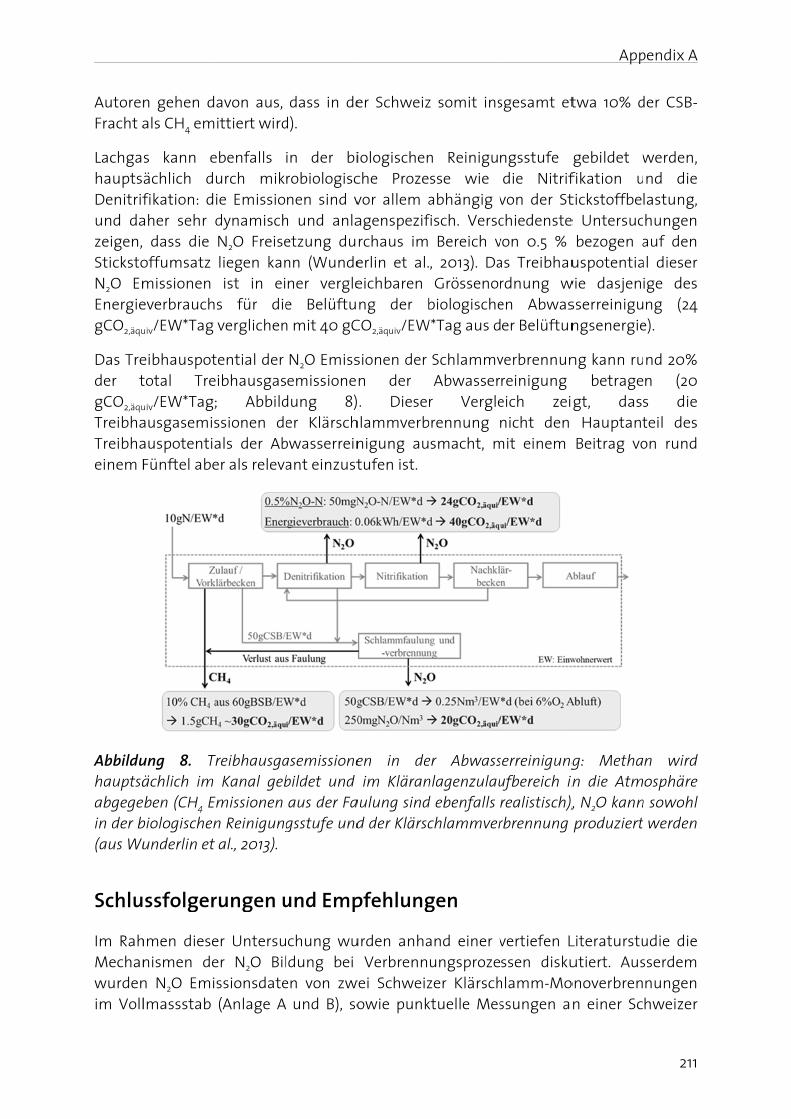
AutorenFracht a
LachgahauptsDenitrifund dazeigen, StickstoN2O EmEnergiegCO2,äqu
Das Treder tgCO2,äqu
TreibhaTreibhaeinem F
Abbilduhauptsäabgegein der b(aus Wu
Schlu
Im RahMechanwurdenim Voll
n gehen d als CH4 em
s kann eächlich dfikation: d
aher sehr dass die offumsatz missionen everbrauch
uiv/EW*Tag
eibhauspottotal Tre
uiv/EW*Tagausgasemisauspotenti Fünftel abe
ung 8. Tächlich im
eben (CH4 Ebiologischenunderlin et
ssfolger
hmen diesenismen den N2O Emilmassstab
avon aus, ittiert wird
ebenfalls urch mikie Emissio
dynamisch N2O Freise liegen kan ist in eis für die verglichen
tential der eibhausgas; Abbildssionen deals der Aber als releva
Treibhausga Kanal geb
Emissionen n Reinigung
t al., 2013).
rungen u
er Untersuer N2O Bilssionsdate
(Anlage A
dass in ded).
in der birobiologiscnen sind v
h und anlaetzung dunn (Wundener verglee Belüftu
n mit 40 gC
N2O Emissemissione
dung 8)er Klärsch
bwasserreinant einzust
asemissionebildet und aus der Fagsstufe und
und Emp
chung wuldung bei en von zw und B), so
er Schweiz
iologischenche Proze
vor allem aagenspezifrchaus imerlin et al.eichbaren ng der b
CO2,äquiv/EW
sionen der n der . Diese
hlammverbnigung autufen ist.
en in de im Kläran
aulung sindd der Klärsc
pfehlung
urden anha Verbrenn
wei Schweizowie punk
z somit ins
n Reinigusse wie
abhängig vfisch. Versc Bereich v, 2013). Da
Grössenobiologische
W*Tag aus d
SchlammvAbwasser
r Verglebrennung
smacht, m
er Abwassnlagenzulaud ebenfalls chlammver
gen
and einer vungsprozezer Klärschktuelle Mes
sgesamt et
ngsstufe die Nitrif
von der Stchiedenstevon 0.5 % as Treibhaurdnung wen Abwas
er Belüftun
verbrennunreinigung eich zeinicht den
mit einem
serreinigungufbereich in realistisch),rbrennung
vertiefen Lssen disku
hlamm-Mossungen a
App
twa 10% d
gebildet wfikation utickstoffbee Untersuc bezogen auspotentia
wie dasjensserreinigungsenergie
ng kann ru betragegt, dass Hauptant
Beitrag vo
g: Methan die Atm, N2O kann produziert
Literaturstuutiert. Aus
onoverbrenn einer Sc
pendix A
211
der CSB-
werden, nd die lastung, hungen
auf den al dieser ige des ng (24
e).
nd 20% n (20 s die teil des on rund
n wird osphäre
n sowohl werden
udie die sserdem nungen hweizer
Appendix A
212
Kehrichtverbrennungsanlage, mit Klärschlamm-Mitverbrennung (Anlage C) ausgewertet und der Einfluss relevanter Faktoren betrachtet.
Die Messungen haben ergeben, dass bei der Klärschlamm-Monoverbrennung eine Korrelation zwischen der Brennraumtemperatur und den N2O Emissionen besteht, wobei hohe Temperaturen tendenziell tiefere Emissionen begünstigen. Dieser Zusammenhang ist in Übereinstimmung mit Literaturstudien, in denen die Brennraumtemperatur als einer der wichtigsten Faktoren für die N2O-Bildung diskutiert wird. Im Weiteren muss darauf hingewiesen werden, dass durch Erhöhung der Brennraumtemperatur auch die NOx-Emissionen ansteigen können. Insbesondere, wenn dadurch die Betttemperatur erhöht wird. Erhöhte NOx Emissionen können jedoch durch eine nachgeschaltete sekundäre Entstickung vermieden werden. Gemäss Korving et al. (2010) ist eine Minimierung der N2O Emissionen durch ein tiefes Luft-/Brennstoffverhältnis möglich, wobei eine grössere Temperaturdifferenz zwischen dem Bett und dem Brennraum resultiert.
Aufgrund punktueller Messungen vor bzw. nach dem SCR Katalysators einer KVA mit bzw. ohne Klärschlamm-Mitverbrennung, konnte kein signifikanter Einfluss des SCR Katalysators bzw. der Klärschlamm-Mitverbrennung beobachtet werden.
Gemäss Vitovec (1991a) sind drei Strategien zur Reduktion der N2O Bildung denkbar: (i) Optimierung der Verbrennungstemperatur, (ii) thermische Nachbehandlung (durch Zugabe eines zusätzlichen stickstoffarmen Brennstoffs, z.B. Erdgas, wird eine Zone hoher Temperatur und hoher Radikalkonzentrationen geschaffen), oder (iii) katalytische N2O-Entfernung.
Literaturverzeichnis
Bafu (2000). Handbuch Emissionsfaktoren für sationäre Quellen. Bundesamt für Umwelt, Bern, 355pp.
BAFU (2011). Entwicklung der Treibhausgas-Emissionen seit 1990. http://www.bafu.admin.ch/klima/09570/09574/index.html?lang=de
Dräger, R. und Vosteen, B. W. (2004). Monoklärschlammverbrennung in Etagenöfen, Wirbelschichtöfen und Etagenwirblern. VDI-Wissensforum, Seminar 433625 über Klärschlamm, Tiermehl, Altholz, biogene Abfälle, 12.-13.05.2004, München.
IPCC (2007). Climate Change 2007: The Physical Science Basis, Contribution of Working Group I to the Fourth Assessment Report of the Intergovernmental Panel on Climate Change [Solomon, S., Qin, D. Manning, M., Chen, Z., Marquis, M., Averyt, K.B., Tignor, M., Miller, H.L. (eds)]. Cambridge University Press, Cambridge, United Kingdom and New York, NY, USA, 996pp.
Keller, J. (2010). Präsentation LET 2010, Phoenix (AZ), USA; Kuno, Nagano and Ozawa, Tokyo Metropolitan Government Courtesy Keisuke Hanaki, Uni-Tokyo.
Appendix A
213
Korving, L. D., Schilt, C., De Jong, W. (2010). Reduction of nitrous oxide emission by a smaller air to fuel ratio in a large-scale sewage sludge fluidized bed combustor. WIT Transaction on Ecology and the Environment, doi:10.2495/WM100051.
Kramlich, J. C. und Linak, W. P. (1994). Nitrous-Oxide Behavior in the Atmosphere, and in Combustion and Industrial-Systems. Progress in Energy and Combustion Science 20(2), 149-202.
Lödel, J. und Sköries, H. (2012). Bericht über die Durchführung von PCDD-/PCDF-Messungen am Kehrichtheizkraftwerk ‚Anlage C‘. Berichts-Nr.: 1805631.
Ravishankara, A. R., Daniel, J. S., Portmann, R. W. (2009). Nitrous oxide (N2O): the dominant ozone-depleting substance emitted in the 21st century. Science 326(5949), 123-125.
Sänger, M., Werther, J., Ogada T. (2001). NOx and N2O emission characteristics from fuidised bed combustion of semi-dried municipal sewage sludge. Fuel 80 167-177.
Svoboda, K., Baxter, D., Martinec, J. (2006). Nitrous Oxide Emissions from Waste Incineration. Chemical Papers 60(1), 78-90.
Vitovec, W. (1991a). Pyrogene N2O-Emissionen. Workshop: ‘N2O und das Kyoto-Ziel’, Innovative Impulse für die Wirtschaft- und Klimapolitik, Österreichische Akademie der Wissenschaften.
Vitovec, W. (1991b). N2O Emissionen aus pyrogenen Quellen in Österreich, Dissertation TU-Wien.
Werther, J., Ogada T. (1999). Sewage sludge combustion. Progress in Energy and Combustion Science 25, 55–116.
Wunderlin, P.; Mohn, J.; Joss, A.; Emmenegger, L.; Siegrist, H. Lachgas-Emissionen aus ARA - Relevanz, Bildungswege und Reduktionsstrategien. Aqua & Gas 2013, 2, 54-59.Anhang
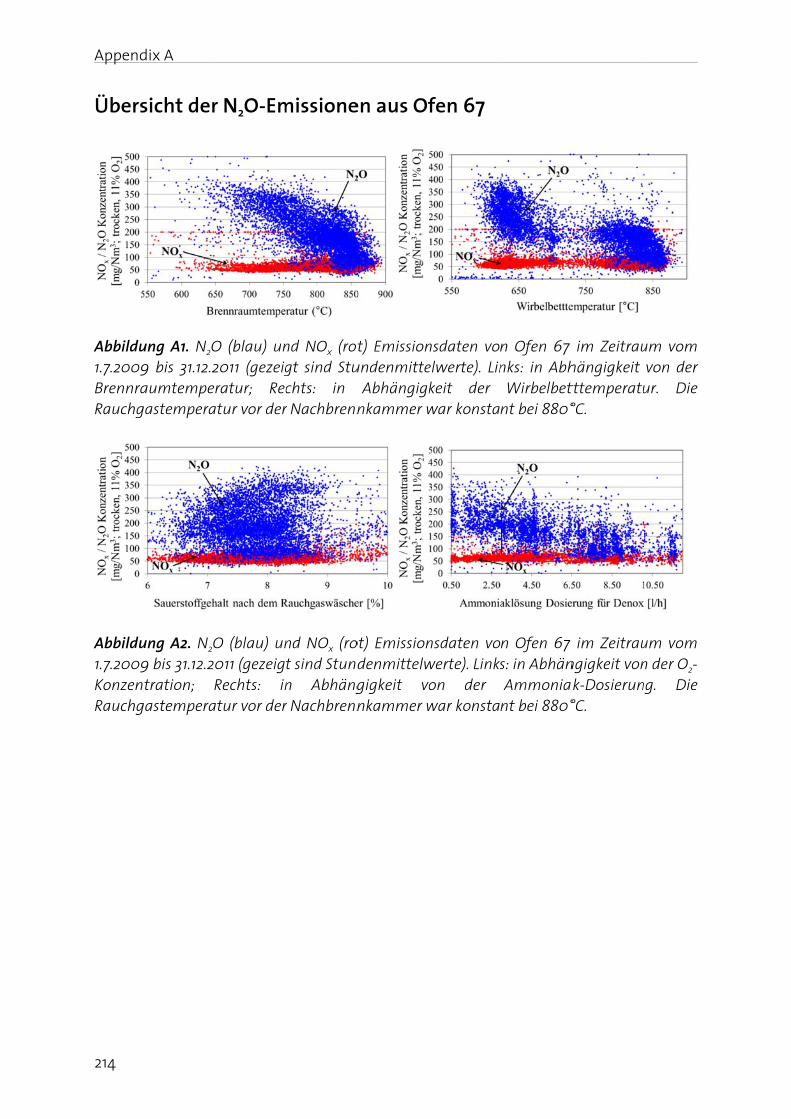
Append
214
Übers
Abbildu1.7.2009BrennraRauchg
Abbildu1.7.2009KonzenRauchg
dix A
sicht der
ung A1. N2O9 bis 31.12.2aumtempe
gastempera
ung A2. N2O9 bis 31.12.2tration; R
gastempera
r N2O-Em
O (blau) un2011 (gezeigratur; Rec
atur vor der
O (blau) un011 (gezeigRechts: in
atur vor der
missione
nd NOx (rotgt sind Stuchts: in
r Nachbrenn
nd NOx (rot sind Stundn Abhängr Nachbrenn
en aus Of
t) Emissionundenmitte
Abhängigknkammer w
ot) Emissiondenmittelwgigkeit vonkammer w
fen 67
nsdaten voelwerte). Linkeit der
war konsta
nsdaten vowerte). Linkson der
war konsta
n Ofen 67 nks: in Abh
Wirbelbetnt bei 880°
n Ofen 67 s: in AbhänAmmonia
nt bei 880°
im Zeitrauhängigkeit tttemperatu°C.
im Zeitraungigkeit vonk-Dosierun°C.
um vom von der ur. Die
um vom n der O2-ng. Die
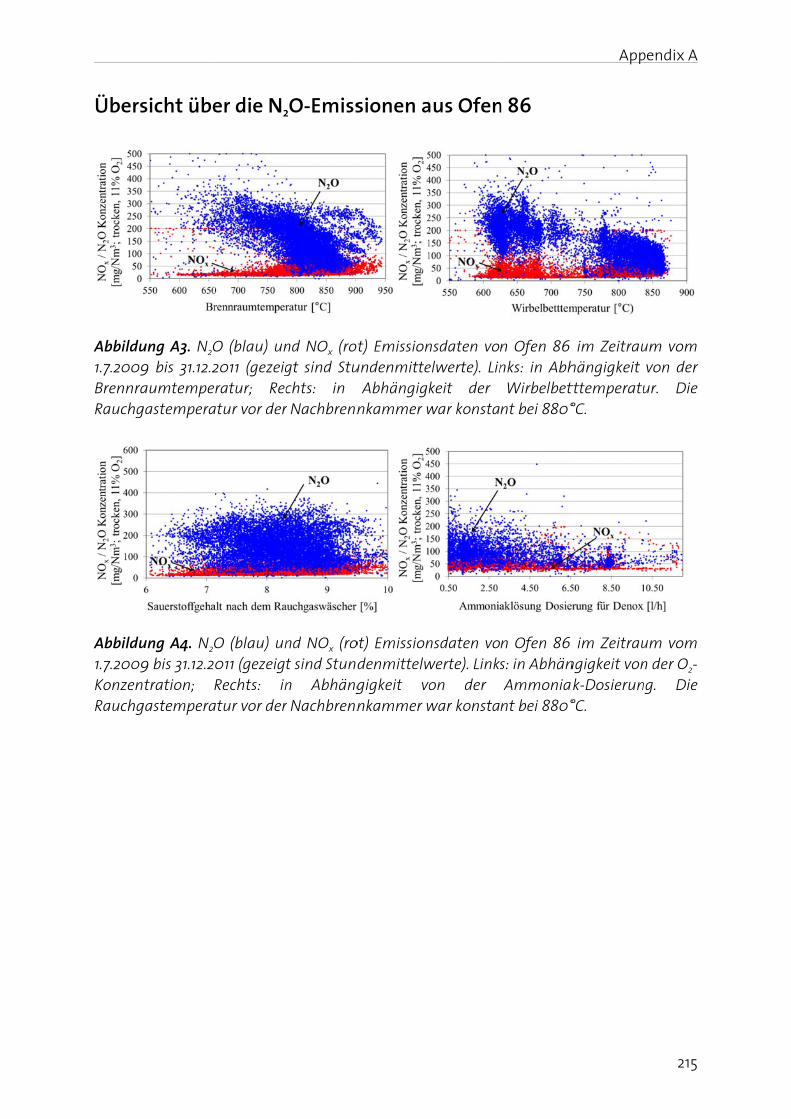
Übers
Abbildu1.7.2009BrennraRauchg
Abbildu1.7.2009KonzenRauchg
sicht übe
ung A3. N2O9 bis 31.12.2aumtempe
gastempera
ung A4. N2O9 bis 31.12.2tration; R
gastempera
er die N2
O (blau) un2011 (gezeigratur; Rec
atur vor der
O (blau) un011 (gezeigRechts: in
atur vor der
2O-Emiss
nd NOx (rotgt sind Stuchts: in
r Nachbrenn
nd NOx (rot sind Stundn Abhängr Nachbrenn
sionen a
t) Emissionundenmitte
Abhängigknkammer w
ot) Emissiondenmittelwgigkeit vonkammer w
aus Ofen
nsdaten voelwerte). Linkeit der
war konsta
nsdaten vowerte). Linkson der
war konsta
n 86
n Ofen 86 nks: in Abh
Wirbelbetnt bei 880°
n Ofen 86 s: in AbhänAmmonia
nt bei 880°
App
im Zeitrauhängigkeit tttemperatu°C.
im Zeitraungigkeit vonk-Dosierun°C.
pendix A
215
um vom von der ur. Die
um vom n der O2-ng. Die

Appendix B
N2O emission of biological wastewater treatment
This chapter has been published as:
Wunderlin, P., Mohn, J., Joss, A., Emmenegger, L., Siegrist, H. Lachgas-Emissionen aus ARA - Relevanz, Bildungswege und Reduktionsstrategien. Aqua & Gas 2013, 2, 54-59.
Appendix B
218
Zusammenfassung
Lachgas (N2O) ist ein starkes Treibhausgas und bedeutend an der Zerstörung der stratosphärischen Ozonschicht beteiligt. Seine Bildung und Freisetzung in die Atmosphäre hat deshalb eine grosse Umweltrelevanz. In der biologischen Abwasserreinigung kann N2O sowohl während der Nitrifikation (Oxidation von Ammonium zu Nitrat), wie auch durch die heterotrophe Denitrifikation (Reduktion von Nitrat zu Luftstickstoff) gebildet werden. Diese Prozesse laufen meist gleichzeitig ab. Daher lässt sich ihr individueller Beitrag zur N2O Bildung nur schwer abschätzen. Für diese Studie wurde ein neuartiger Ansatz angewandt, der eine bessere Beurteilung der N2O Bildung auf Abwasserreinigungsanlagen erlaubt. Anhand der Analyse der stabilen Stickstoffisotopen wurde gezeigt, dass unter aeroben Bedingungen die Nitrifikation die N2O Bildung dominiert. Dabei fördern hohe Ammonium (NH4
+) und Nitrit (NO2-)
Konzentrationen die N2O Bildung. Ausserdem ist zu beachten, dass die Entstehung von N2O räumlich und zeitlich sehr variabel ist und durch viele Parameter beeinflusst wird. Die aktuellen Emissionsschätzungen sind daher mit einer grossen Unsicherheit verbunden, was eine Bestimmung von präzisen Emissionsfaktoren schwierig macht. Untersuchungen aber zeigen, dass die N2O Emissionen die Treibhausgasbilanz der gesamten Anlage dominieren können, welche ansonsten vor allem durch die indirekten Emissionen der Belüftung der biologischen Reinigungsstufe beeinflusst wird.
In Anbetracht der negativen Umweltauswirkungen von N2O und der langen Aufenthaltszeit in der Atmosphäre (rund 120 Jahre) sollte unbedingt eine möglichst weitgehende Reduktion der Emissionen angestrebt werden. Das gegenwärtige Verständnis der relevanten Bildungsmechanismen deutet darauf hin, dass bei einer möglichst vollständigen Nitrifikation und Denitrifikation gleichzeitig auch die N2O Bildung minimiert werden kann. Aus diesem Grund sollte sowohl bei der Auslegung wie auch bei der Optimierung und beim Betrieb von Belebtschlamm-Anlagen (z.B. Regelung der Belüftung) die N2O Bildung mitberücksichtigt werden.
Stichwörter
Betriebsstrategien, biologische Abwasserreinigung, Denitrifikation, Lachgas (N2O), Nitrifikation, Treibhausgas, Zerstörung der Ozonschicht
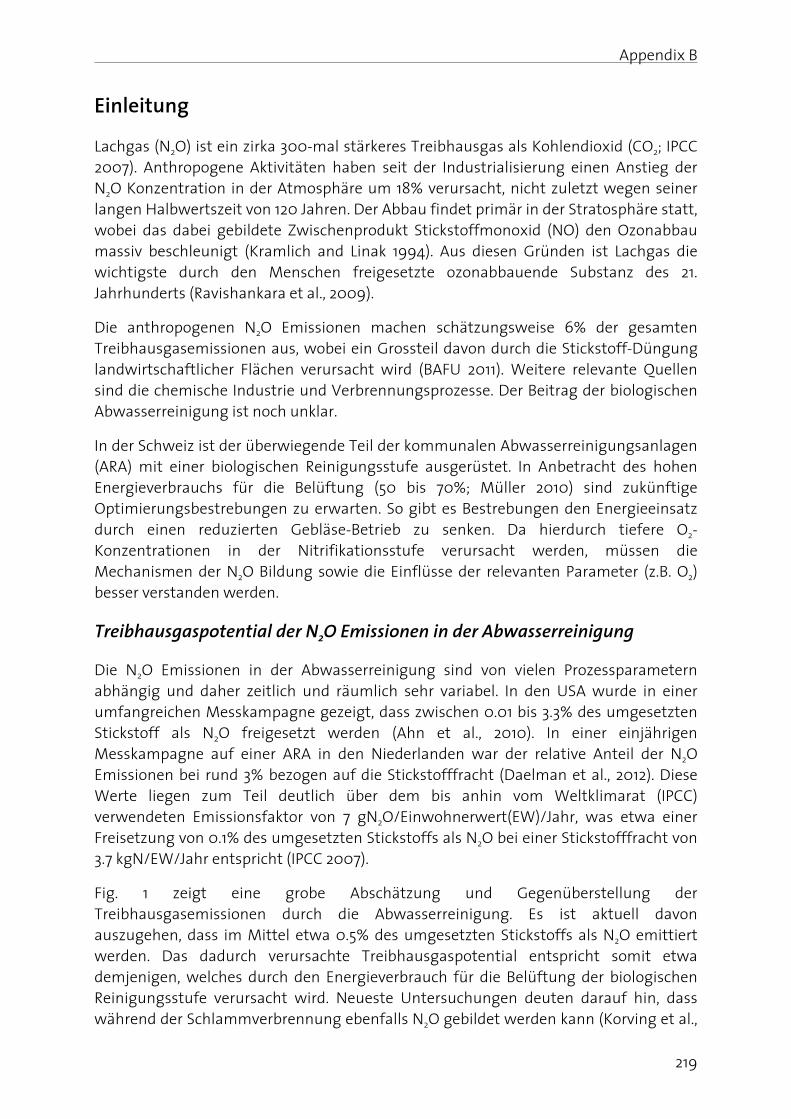
Appendix B
219
Einleitung
Lachgas (N2O) ist ein zirka 300-mal stärkeres Treibhausgas als Kohlendioxid (CO2; IPCC 2007). Anthropogene Aktivitäten haben seit der Industrialisierung einen Anstieg der N2O Konzentration in der Atmosphäre um 18% verursacht, nicht zuletzt wegen seiner langen Halbwertszeit von 120 Jahren. Der Abbau findet primär in der Stratosphäre statt, wobei das dabei gebildete Zwischenprodukt Stickstoffmonoxid (NO) den Ozonabbau massiv beschleunigt (Kramlich and Linak 1994). Aus diesen Gründen ist Lachgas die wichtigste durch den Menschen freigesetzte ozonabbauende Substanz des 21. Jahrhunderts (Ravishankara et al., 2009).
Die anthropogenen N2O Emissionen machen schätzungsweise 6% der gesamten Treibhausgasemissionen aus, wobei ein Grossteil davon durch die Stickstoff-Düngung landwirtschaftlicher Flächen verursacht wird (BAFU 2011). Weitere relevante Quellen sind die chemische Industrie und Verbrennungsprozesse. Der Beitrag der biologischen Abwasserreinigung ist noch unklar.
In der Schweiz ist der überwiegende Teil der kommunalen Abwasserreinigungsanlagen (ARA) mit einer biologischen Reinigungsstufe ausgerüstet. In Anbetracht des hohen Energieverbrauchs für die Belüftung (50 bis 70%; Müller 2010) sind zukünftige Optimierungsbestrebungen zu erwarten. So gibt es Bestrebungen den Energieeinsatz durch einen reduzierten Gebläse-Betrieb zu senken. Da hierdurch tiefere O2-Konzentrationen in der Nitrifikationsstufe verursacht werden, müssen die Mechanismen der N2O Bildung sowie die Einflüsse der relevanten Parameter (z.B. O2) besser verstanden werden.
Treibhausgaspotential der N2O Emissionen in der Abwasserreinigung
Die N2O Emissionen in der Abwasserreinigung sind von vielen Prozessparametern abhängig und daher zeitlich und räumlich sehr variabel. In den USA wurde in einer umfangreichen Messkampagne gezeigt, dass zwischen 0.01 bis 3.3% des umgesetzten Stickstoff als N2O freigesetzt werden (Ahn et al., 2010). In einer einjährigen Messkampagne auf einer ARA in den Niederlanden war der relative Anteil der N2O Emissionen bei rund 3% bezogen auf die Stickstofffracht (Daelman et al., 2012). Diese Werte liegen zum Teil deutlich über dem bis anhin vom Weltklimarat (IPCC) verwendeten Emissionsfaktor von 7 gN2O/Einwohnerwert(EW)/Jahr, was etwa einer Freisetzung von 0.1% des umgesetzten Stickstoffs als N2O bei einer Stickstofffracht von 3.7 kgN/EW/Jahr entspricht (IPCC 2007).
Fig. 1 zeigt eine grobe Abschätzung und Gegenüberstellung der Treibhausgasemissionen durch die Abwasserreinigung. Es ist aktuell davon auszugehen, dass im Mittel etwa 0.5% des umgesetzten Stickstoffs als N2O emittiert werden. Das dadurch verursachte Treibhausgaspotential entspricht somit etwa demjenigen, welches durch den Energieverbrauch für die Belüftung der biologischen Reinigungsstufe verursacht wird. Neueste Untersuchungen deuten darauf hin, dass während der Schlammverbrennung ebenfalls N2O gebildet werden kann (Korving et al.,
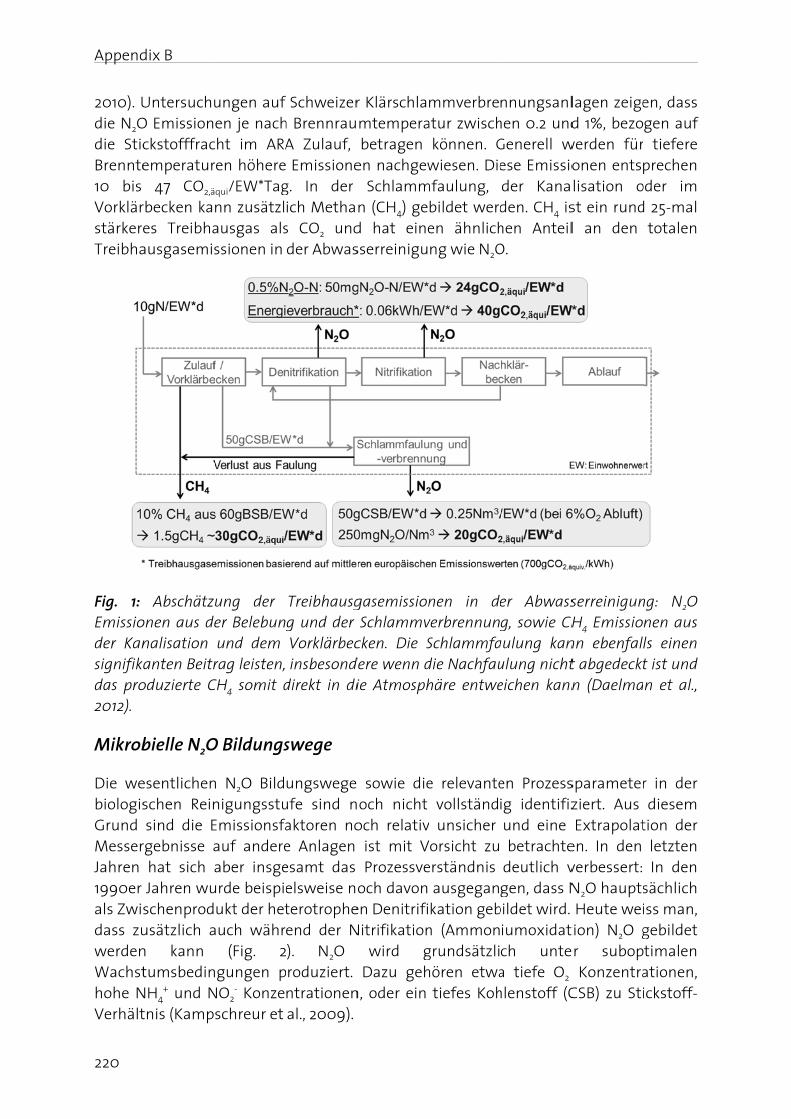
Append
220
2010). Udie N2Odie SticBrennte10 bis VorklärstärkereTreibha
Fig. 1: Emissioder Kansignifikdas pro2012).
Mikrob
Die webiologisGrund MesserJahren 1990er als Zwidass zuwerdenWachsthohe NVerhält
dix B
UntersuchuO Emissionckstofffracemperatur 47 CO2,ä
rbecken kaes Treibha
ausgasemis
Abschätzonen aus denalisation anten Beitr
oduzierte C
bielle N2O
esentlichenschen Rein sind die Ergebnisse a hat sich Jahren wuschenprodusätzlich an kann tumsbedin
NH4+ und N
tnis (Kamp
ungen auf en je nach
cht im ARAren höhere
qui/EW*Tagnn zusätzlausgas alsssionen in
ung der er Belebun
und dem rag leisten,
CH4 somit d
O Bildungs
n N2O BildnigungsstuEmissionsfa
auf andere aber insgeurde beispieukt der het
auch währ (Fig. 2ngungen pNO2
- Konzeschreur et
Schweizerh BrennrauA Zulauf, Emissione
g. In der ich Methas CO2 und der Abwas
Treibhausgg und der
Vorklärbec insbesonddirekt in di
swege
ungswege ufe sind naktoren noe Anlagen esamt das elsweise noterotropheend der N). N2O roduziert. ntrationen al., 2009).
r Klärschlamtempera
betragen en nachgew Schlammn (CH4) ge
d hat einesserreinigu
gasemission Schlammvcken. Die S
dere wenn die Atmosph
sowie dieoch nicht
och relativ ist mit V Prozessveoch davon
en DenitrifiNitrifikation
wird g Dazu gehn, oder ein
mmverbreatur zwisch können. Gwiesen. Die
mfaulung, bildet werden ähnlichng wie N2O
nen in deverbrennunSchlammfadie Nachfauhäre entwe
e relevante vollständ
v unsicher Vorsicht zuerständnis ausgegankation geb
n (Ammongrundsätzlihören etwa tiefes Koh
nnungsanlhen 0.2 undGenerell wese Emissioder Kanaden. CH4 ishen AnteilO.
er Abwassg, sowie CH
aulung kanulung nichteichen kann
en Prozessig identifiz und eine betrachte
deutlich vgen, dass N
bildet wird. iumoxidatch untea tiefe O2 hlenstoff (C
lagen zeiged 1%, bezo
werden füronen entsplisation ost ein rundl an den
serreinigunH4 Emissio
nn ebenfalt abgedecktn (Daelma
sparameterziert. Aus
Extrapolaten. In den verbessert: N2O haupts Heute wei
tion) N2O ger subop KonzentraCSB) zu Sti
en, dass gen auf tiefere prechen
oder im d 25-mal totalen
ng: N2O nen aus ls einen t ist und n et al.,
r in der diesem tion der letzten In den sächlich iss man,
gebildet timalen ationen, ickstoff-
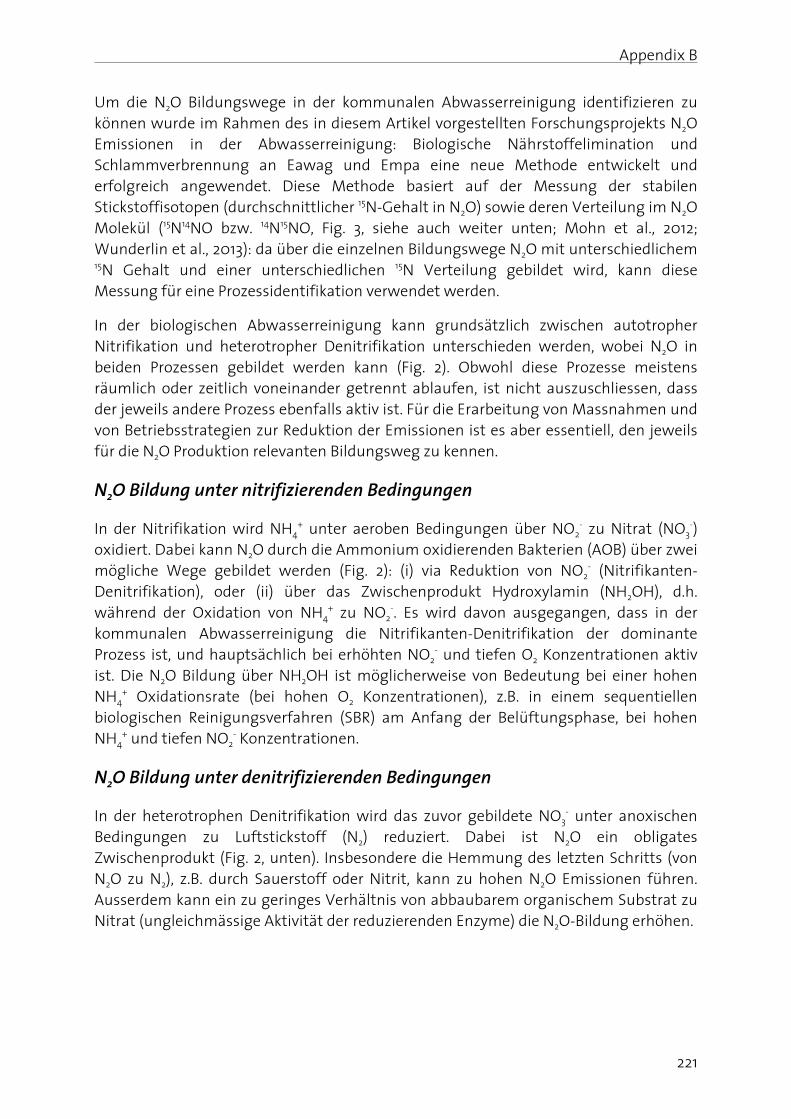
Appendix B
221
Um die N2O Bildungswege in der kommunalen Abwasserreinigung identifizieren zu können wurde im Rahmen des in diesem Artikel vorgestellten Forschungsprojekts N2O Emissionen in der Abwasserreinigung: Biologische Nährstoffelimination und Schlammverbrennung an Eawag und Empa eine neue Methode entwickelt und erfolgreich angewendet. Diese Methode basiert auf der Messung der stabilen Stickstoffisotopen (durchschnittlicher 15N-Gehalt in N2O) sowie deren Verteilung im N2O Molekül (15N14NO bzw. 14N15NO, Fig. 3, siehe auch weiter unten; Mohn et al., 2012; Wunderlin et al., 2013): da über die einzelnen Bildungswege N2O mit unterschiedlichem 15N Gehalt und einer unterschiedlichen 15N Verteilung gebildet wird, kann diese Messung für eine Prozessidentifikation verwendet werden.
In der biologischen Abwasserreinigung kann grundsätzlich zwischen autotropher Nitrifikation und heterotropher Denitrifikation unterschieden werden, wobei N2O in beiden Prozessen gebildet werden kann (Fig. 2). Obwohl diese Prozesse meistens räumlich oder zeitlich voneinander getrennt ablaufen, ist nicht auszuschliessen, dass der jeweils andere Prozess ebenfalls aktiv ist. Für die Erarbeitung von Massnahmen und von Betriebsstrategien zur Reduktion der Emissionen ist es aber essentiell, den jeweils für die N2O Produktion relevanten Bildungsweg zu kennen.
N2O Bildung unter nitrifizierenden Bedingungen
In der Nitrifikation wird NH4+ unter aeroben Bedingungen über NO2
- zu Nitrat (NO3-)
oxidiert. Dabei kann N2O durch die Ammonium oxidierenden Bakterien (AOB) über zwei mögliche Wege gebildet werden (Fig. 2): (i) via Reduktion von NO2
- (Nitrifikanten-Denitrifikation), oder (ii) über das Zwischenprodukt Hydroxylamin (NH2OH), d.h. während der Oxidation von NH4
+ zu NO2-. Es wird davon ausgegangen, dass in der
kommunalen Abwasserreinigung die Nitrifikanten-Denitrifikation der dominante Prozess ist, und hauptsächlich bei erhöhten NO2
- und tiefen O2 Konzentrationen aktiv ist. Die N2O Bildung über NH2OH ist möglicherweise von Bedeutung bei einer hohen NH4
+ Oxidationsrate (bei hohen O2 Konzentrationen), z.B. in einem sequentiellen biologischen Reinigungsverfahren (SBR) am Anfang der Belüftungsphase, bei hohen NH4
+ und tiefen NO2- Konzentrationen.
N2O Bildung unter denitrifizierenden Bedingungen
In der heterotrophen Denitrifikation wird das zuvor gebildete NO3- unter anoxischen
Bedingungen zu Luftstickstoff (N2) reduziert. Dabei ist N2O ein obligates Zwischenprodukt (Fig. 2, unten). Insbesondere die Hemmung des letzten Schritts (von N2O zu N2), z.B. durch Sauerstoff oder Nitrit, kann zu hohen N2O Emissionen führen. Ausserdem kann ein zu geringes Verhältnis von abbaubarem organischem Substrat zu Nitrat (ungleichmässige Aktivität der reduzierenden Enzyme) die N2O-Bildung erhöhen.
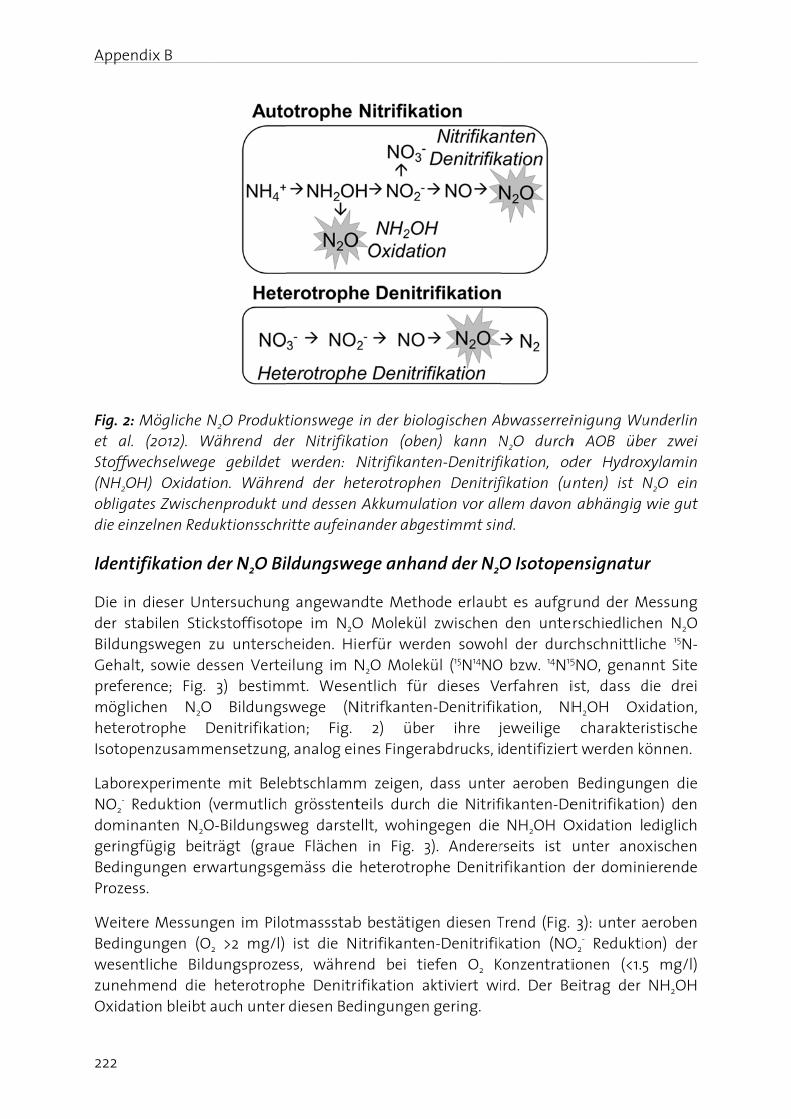
Append
222
Fig. 2: Met al. Stoffwe(NH2OHobligatedie einz
Identif
Die in der staBildungGehalt,preferemöglichheterotIsotope
LaborexNO2
- RedominageringfBedingProzess
WeitereBedingwesentzunehmOxidati
dix B
Mögliche N(2012). W
echselwegeH) Oxidatioes Zwische
zelnen Redu
fikation d
dieser Untabilen Stickgswegen z, sowie des
ence; Fig. hen N2O trophe Denzusamm
xperimenteeduktion (vanten N2Ofügig beitrungen erw
s.
e Messungungen (O2
tliche Bildmend die ion bleibt a
N2O ProduktWährend de
e gebildet on. Währenprodukt u
uktionsschr
der N2O Bi
tersuchungkstoffisoto
zu unterschssen Verte
3) bestim Bildungs
Denitrifikatiensetzung
e mit Belevermutlich-Bildungswrägt (grau
wartungsge
gen im Pilo
2 >2 mg/l) ungsproze
heterotrop auch unter
tionswege er Nitrifika werden: Nnd der he
und dessen ritte aufein
ildungswe
g angewanpe im N2Oheiden. Hi
eilung im Nmt. Wese
swege (Nion; Fig.
g, analog ei
ebtschlammh grösstentweg darste
e Flächenemäss die
otmassstab ist die Nss, währe
phe Denitr diesen Bed
in der bioloation (obeNitrifikanteeterotrophe Akkumulaander abge
ege anhan
ndte MethoO Molekül erfür werd
N2O Molekntlich für
Nitrifkanten 2) übenes Fingera
m zeigen, teils durchellt, wohin in Fig. 3
heterotrop
b bestätigeitrifikantennd bei tieifikation adingungen
ogischen An) kann Nen-Denitrifen Denitrifation vor alestimmt sin
nd der N2O
ode erlaub zwischen den sowohkül (15N14NO dieses V
n-Denitrifikr ihre jabdrucks, i
dass unte die Nitrifgegen die
3). Andererphe Denitr
en diesen Tn-Denitrifikefen O2 Kktiviert wi gering.
bwasserreiN2O durch
fikation, odfikation (ulem davon
nd.
O Isotope
bt es aufgr den untehl der durcO bzw. 14N15
erfahren ikation, NHjeweilige
dentifiziert
r aeroben fikanten-De NH2OH Orseits ist ifikantion
Trend (Fig. kation (NO
Konzentratiird. Der Be
inigung Wuh AOB übder Hydroxnten) ist N abhängig
ensignatu
rund der Mrschiedlichchschnittlic5NO, genanist, dass dH2OH Ox
charaktert werden k
Bedingunenitrifikatio
Oxidation l unter ano der domin
3): unter aO2
- Reduktiionen (<1.5eitrag der
underlin er zwei xylamin N2O ein wie gut
r
Messung hen N2O che 15N-nnt Site die drei xidation, ristische
können.
gen die on) den
ediglich oxischen nierende
aeroben on) der 5 mg/l) NH2OH
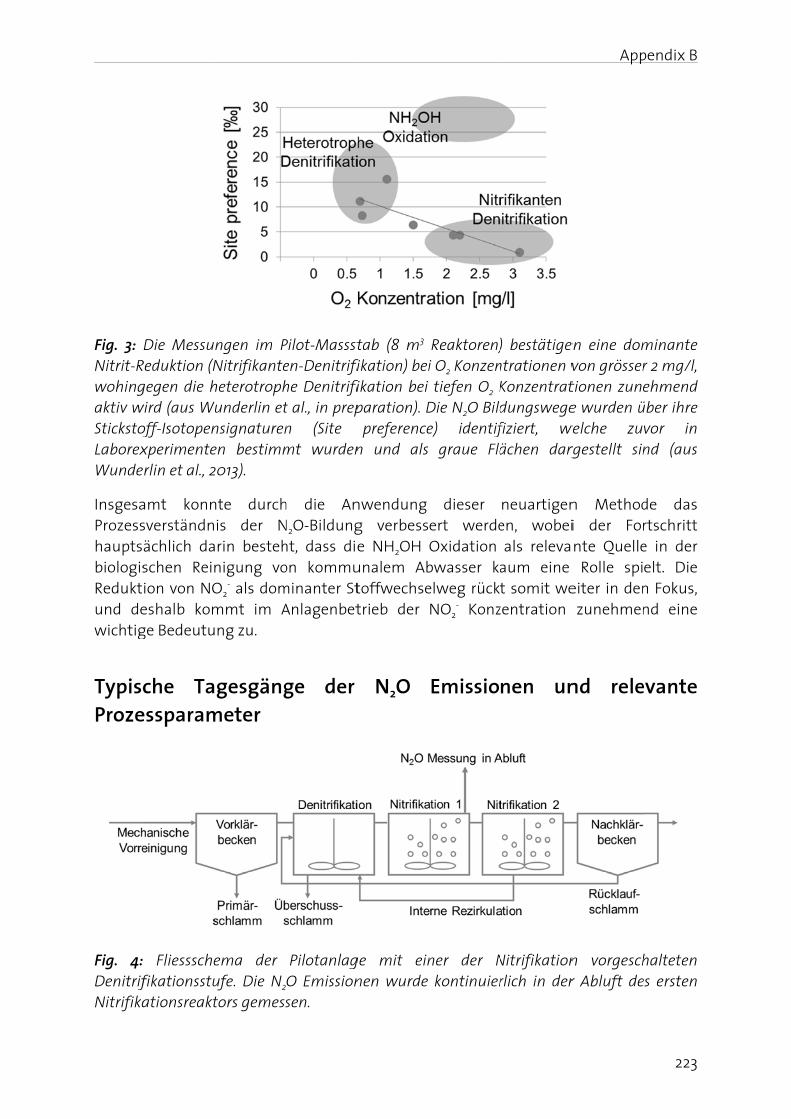
Fig. 3: Nitrit-Rwohingaktiv wStickstofLaborexWunde
InsgesaProzesshauptsbiologisReduktund dewichtig
TypiscProze
Fig. 4:DenitrifNitrifika
Die MessuReduktion (Ngegen die h
wird (aus Woff-Isotopenxperimenterlin et al., 2
amt konnsverständnächlich daschen Reinion von NOeshalb komge Bedeutu
che Taessparam
Fliessschefikationsstuationsreakt
ngen im PNitrifikanteheterotrophunderlin etnsignaturenen bestimm2013).
nte durchis der N
arin bestehnigung voO2
- als dommmt im A
ung zu.
gesgängmeter
ema der ufe. Die N2
tors gemess
Pilot-Masssten-Denitrifihe Denitrifit al., in prepn (Site mt wurden
h die AnN2O-Bildunght, dass dieon kommuminanter StAnlagenbet
ge der
PilotanlagO Emissionsen.
tab (8 m3 fikation) beifikation bei paration). D
preferencen und als
nwendung g verbesse NH2OH
unalem Abtoffwechsetrieb der
N2O
ge mit einnen wurde
Reaktoren)i O2 Konzen tiefen O2 KDie N2O Bilde) identif graue Flä
dieser ert werde
Oxidation bwasser kaelweg rückt
NO2- Konz
Emissio
ner der N kontinuier
) bestätigentrationen vKonzentratdungswegefiziert, wächen darg
neuartigenen, wobei als relevaaum eine t somit we
zentration
nen un
Nitrifikationrlich in der
App
en eine dom von grössertionen zunee wurden ü
welche zurgestellt sin
n Methodi der Fornte Quelle Rolle spieiter in den zunehmen
nd rele
n vorgeschr Abluft de
pendix B
223
minante r 2 mg/l, ehmend
über ihre vor in nd (aus
de das rtschritt e in der elt. Die n Fokus, nd eine
evante
halteten es ersten
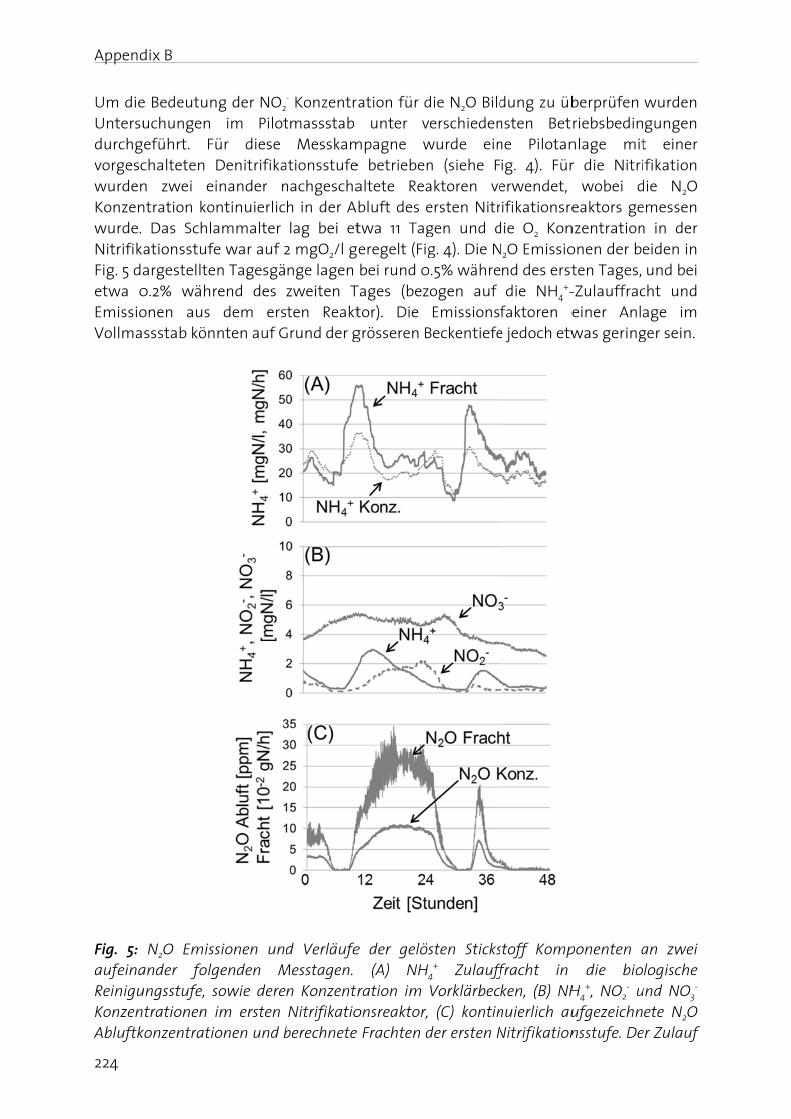
Append
224
Um dieUntersudurchgvorgescwurdenKonzenwurde. NitrifikFig. 5 daetwa 0EmissioVollma
Fig. 5: aufeinaReiniguKonzenAbluftk
dix B
e Bedeutunuchungen eführt. Fchalteten n zwei entration ko Das Schlaationsstufeargestellte0.2% währonen aus ssstab kön
N2O Emisander folgungsstufe, s
trationen konzentrati
ng der NO2
im Pilotür diese
Denitrifikainander nntinuierlicammalter e war auf 2
en Tagesgärend des dem ersnten auf G
sionen ungenden Msowie dere
im ersten onen und b
- Konzentrtmassstab Messkamationsstufenachgeschah in der A
lag bei et 2 mgO2/l g
nge lagen zweiten T
ten Reakt Grund der g
d VerläufeMesstagen.
n Konzentr Nitrifikatioberechnete
ation für d unter v
mpagne we betriebenaltete Reabluft des etwa 11 Tageregelt (Fig bei rund 0
Tages (beztor). Die
grösseren B
e der gelös (A) NH4
ration im onsreaktor, Frachten d
die N2O Bilderschieden
wurde einn (siehe Faktoren ve
ersten Nitrgen und dg. 4). Die N
0.5% währeogen auf
Emissionsf Beckentiefe
sten Sticks
4+ Zulauff
Vorklärbec (C) kontin
der ersten N
dung zu übnsten Betne Pilotanig. 4). Fürerwendet, ifikationsre
die O2 KonN2O Emissio
nd des erst die NH4
+-faktoren e
e jedoch etw
stoff Kompfracht in ken, (B) NH
nuierlich auNitrifikation
berprüfen riebsbedin
nlage mitr die Nitri wobei deaktors ge
nzentrationonen der beten Tages, -Zulauffraceiner Anlawas gering
ponenten a die bioH4
+, NO2- u
ufgezeichnnsstufe. De
wurden gungen t einer fikation
die N2O emessen n in der eiden in und bei cht und age im
ger sein.
an zwei logische
und NO3-
ete N2O er Zulauf
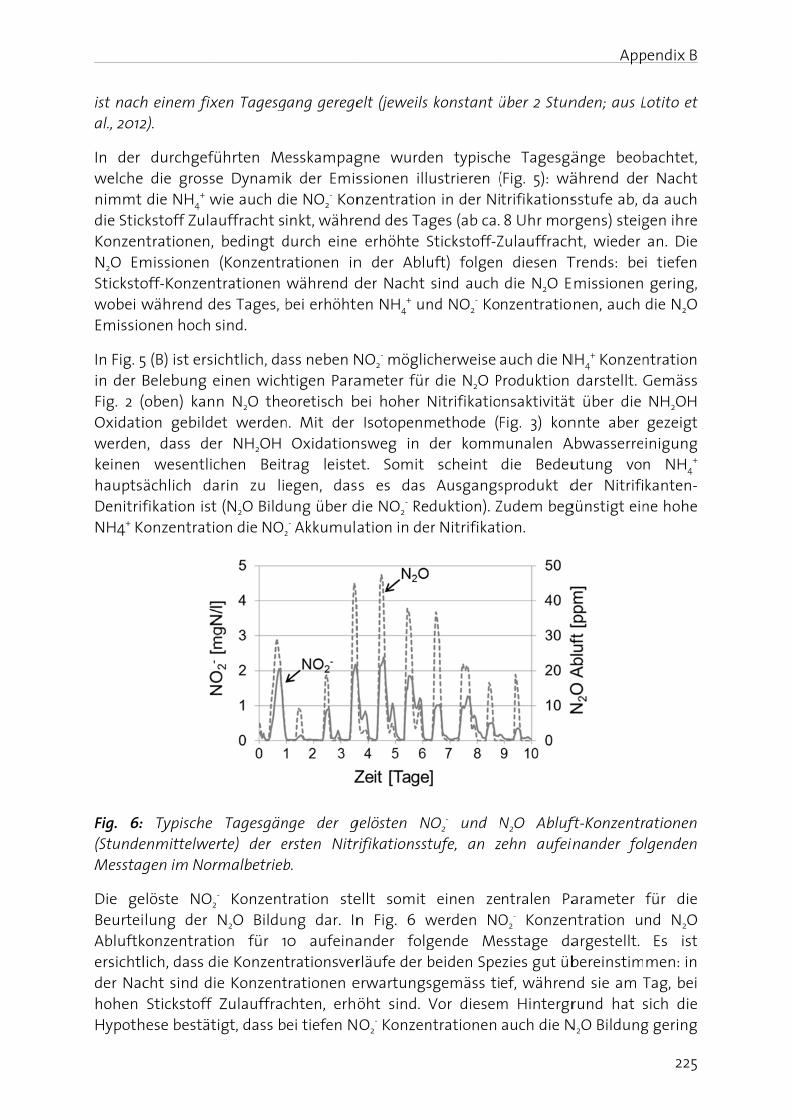
ist nachal., 2012
In der welchenimmt die SticKonzenN2O EmStickstowobei wEmissio
In Fig. 5in der BFig. 2 (Oxidatiwerdenkeinen hauptsDenitrifNH4+ K
Fig. 6:(StundeMesstag
Die geBeurteiAbluftkersichtlder Nachohen Hypoth
h einem fix2).
durchgef die gross die NH4
+ wckstoff Zulantrationen, missionen off-Konzen während donen hoch
5 (B) ist ers Belebung e (oben) kan
ion gebildn, dass de wesentlicächlich dafikation ist
Konzentrati
Typische enmittelwegen im Nor
elöste NO2
ilung der konzentratlich, dass dcht sind di Stickstoff hese bestät
xen Tagesg
ührten Mese Dynamiwie auch dauffracht s bedingt d
(Konzentrntrationen
des Tages, b sind.
ichtlich, da einen wich
n N2O theet werden
er NH2OH chen Beitarin zu lit (N2O Bilduon die NO2
Tagesgänerte) der ermalbetrieb
2- Konzent
N2O Bilduion für 1
die Konzentie Konzent Zulauffractigt, dass b
ang gerege
esskampagk der Emisie NO2
- Koninkt, währe
durch eine ationen in
während d bei erhöhte
ass neben Nhtigen Paraeoretisch bn. Mit der Oxidationtrag leisteegen, dasung über d
2- Akkumula
nge der gersten Nitrb.
tration steung dar. In
0 aufeinatrationsvertrationen echten, erhöei tiefen N
elt (jeweils
gne wurdessionen illnzentrationend des Ta erhöhte S
n der Ablu der Nacht
en NH4+ un
NO2- möglic
ameter fürbei hoher N Isotopenm
nsweg in et. Somit s es das
die NO2- Re
ation in de
gelösten Nrifikationsst
ellt somit n Fig. 6 wander folgrläufe der b
erwartungsöht sind. VO2
- Konzen
konstant ü
en typischustrieren (n in der Niges (ab ca.
Stickstoff-Zuft) folgen sind auch nd NO2
- Ko
cherweise r die N2O P
Nitrifikatiomethode (F
der komm scheint Ausgangsduktion). Z
er Nitrifikat
NO2- und N
tufe, an z
einen zewerden NOgende Me beiden Spesgemäss ti
Vor diesemntrationen
über 2 Stun
he Tagesgä (Fig. 5): wä
trifikations 8 Uhr mor
Zulauffrachn diesen T die N2O Enzentratio
auch die NProduktion nsaktivitätFig. 3) kon
munalen Adie Bedeu
sprodukt d Zudem beg
ion.
N2O Ablufzehn aufein
ntralen PaO2
- Konzenesstage daezies gut übef, währen
m Hintergr auch die N
App
nden; aus L
änge beobährend desstufe ab, drgens) steight, wieder Trends: bemissionennen, auch
NH4+ Konzen
darstellt. t über die nnte aber
Abwasserreutung voder Nitrifi
günstigt ein
ft-Konzentrinander fo
arameter ntration uargestellt. bereinstimnd sie am Trund hat s
N2O Bildung
pendix B
225
Lotito et
bachtet, r Nacht
da auch gen ihre an. Die i tiefen gering, die N2O
ntration Gemäss NH2OH gezeigt inigung n NH4
+ kanten-ne hohe
rationen lgenden
für die nd N2O
Es ist men: in
Tag, bei sich die g gering
Appendix B
226
gehalten werden kann, was impliziert, dass die biologische Reinigungsstufe bei möglichst tiefen NO2
- Konzentrationen betrieben werden sollte.
Neben erhöhten NH4+ und NO2
- Konzentrationen ist auch die O2-Konzentration ein relevanter Parameter für die N2O Bildung. Dies soll hier nochmals kurz aufgegriffen werden, denn im Zusammenhang mit der N2O Bildung über die NO2
- Reduktion ist bekannt, dass bei tiefen O2 Konzentrationen (<1 mgO2/l) die N2O Emissionen tendenziell höher sind als bei 2 bis 3 mgO2/l (Kampschreur et al., 2009). Bei der energetischen Optimierung der biologischen Reinigungsstufe, insbesondere wenn bei der Belüftung angesetzt wird, ist daher besondere Vorsicht geboten. Die N2O-Bildung ist hoch komplex und weist eine grosse Dynamik auf. Daher kann an dieser Stelle keine abschliessende Empfehlung zur Optimierung der biologischen Abwasserreinigung präsentiert werden, um die N2O Emissionen aus ARA möglichst tief zu halten. Vielmehr sollte vor dem Hintergrund der in diesem Artikel diskutierten Einflussparameter, wie NO2
-, NH4+ oder O2, jede Anlage für sich betrachtet werden, und optimierte
Betriebsstrategien anhand einer fix installierten N2O Abluftmessung getestet und überwacht werden (empfohlene Betriebsstrategien, siehe unten). Die Messgeräte für eine kontinuierliche Abluftmessung sind standardmässig verfügbar und können bei verschiedenen Anbietern gekauft werden. Bei abgedeckten Reaktoren mit einer gefassten Abluft ist die Implementierung relativ einfach. Bei offenen, ungedeckten Reaktoren liegt die Schwierigkeit bei der Fassung der Abluft. In diesen Fällen muss eine auf der Wasseroberfläche aufliegende ‚Haube‘ eingesetzt werden, was aktuell noch nicht routinemässig angewendet wird. Es existieren aber Ansätze wie dies in Zukunft umgesetzt werden kann. Die Investitionskosten für eine online N2O-Abluftmessung liegen höher als beispielsweise für konventionelle ionenselektive Sonden. Die Betriebskosten sind jedoch wegen des geringeren Wartungsaufwands tiefer.
Die anschliessend diskutierten Betriebsempfehlungen können aus den präsentierten Daten und dem daraus resultierenden Prozessverständnis abgeleitet werden. Sie stellen einen ersten Ausgangspunkt für weitere Optimierungen dar, die anhand von direkten Emissionsmessungen für die jeweilige Anlage überprüft und verifiziert werden sollten:
Es wird als wichtig erachtet, dass die Nitrifikation wie auch die Denitrifikation möglichst vollständig ablaufen können, um die NO2
- Bildung tief zu halten. Insbesondere sollten bei einer vorgeschalteten Denitrifikation zu kurze anoxische Phasen vermieden werden. Andererseits muss bei einer NH4
+ geregelten Belüftung genügend Zeit für die NO2
- Oxidation zur Verfügung stehen.
Generell sollte die NH4+ Konzentration in der Belebung möglichst tief gehalten
werden, was eine ausreichende Nitrifikationskapazität voraussetzt, d.h. ein aerobes Schlammalter mit genügend Sicherheit zur Verarbeitung von Stickstoff-Frachtspitzen. Zudem sollte Faulwasser nicht während Phasen mit hohen Stickstoff-Frachten im Zulauf dosiert werden.
Während Phasen mit hohen Stickstoff-Frachten sollte die Nitrifikation bei ausreichend Sauerstoff betrieben werden, da bei tiefen O2 Konzentrationen die
Appendix B
227
N2O Bildung gegenüber der NO2- Reduktion begünstigt wird. Somit sind tiefere
O2-Konzentrationen während der Nacht bei geringen Stickstoff-Frachten sinnvoll und sparen Energie ohne viel N2O zu produzieren.
Anderseits sollte die Denitrifikation anoxisch betrieben werden. Daher ist es wichtig, einen O2-Eintrag aus der Nitrifikation (Rücklauf, interne Rezirkulation) oder durch das Rührwerk möglichst zu vermeiden.
Schlussfolgerungen
Aus dem vorliegenden Artikel geht hervor, dass das Treibhausgaspotential der N2O Emissionen in der biologischen Abwasserreinigung relevant ist und eine vergleichbare Grössenordnung aufweist wie die indirekten Emissionen der Belüftung. Aus diesem Grund sollten die N2O Emissionen möglichst reduziert werden, und sowohl bei der Auslegung, der Optimierung sowie beim Betrieb der Anlage beachtet werden.
Anhand der präsentierten Daten wurde gezeigt, dass der mikrobiologischen Reduktion von NO2
- zu N2O in der kommunalen Abwasserreinigung eine grosse Bedeutung zukommt. Im Weitern ist ersichtlich, dass die N2O Emissionen einer grossen zeitlichen und räumlichen Dynamik unterliegen, was es schwierig macht, von einem Tagesgang auf den nächsten zu extrapolieren, oder gar Aussagen über das Emissionspotential von anderen, nicht untersuchten Anlagen zu machen. In diesem Sinne wird als Schlussfolgerung in Aussicht gestellt, dass für eine gezielte Optimierung des Anlagenbetriebes eine kontinuierliche N2O Emissionsmessung unerlässlich ist. Denn zusätzlich zur Emissionsüberwachung kann anhand der N2O Bildung die Prozessstabilität relativ gut überwacht werden, gilt doch die Akkumulation von NO2
- als Indiz für eine (vorübergehende) Überlastung der Anlage, eine O2-Unterversorgung durch ineffiziente Belüftung oder gar Hemmung der mikrobiologischen Prozesse (Burgess et al., 2002; Butler et al., 2009).
Verdankung
Die Autoren danken folgenden Projektpartnern: Bundesamt für Umwelt (BAFU), Kanton Bern (AWA), Kanton Basellandschaft (AIB), Kanton St. Gallen (AFU), Kanton Thurgau (AfU), Kanton Zürich (AWEL), Zentralschweizer Umweltdirektorenkonferenz (ZUDK), TBF + Partner AG, Abwasserverband Altenrhein, ARA Region Bern, ARA REAL (Luzern), Abwasserverband Morgental, ARA ProRheno, Entsorgung St. Gallen, ARA Zürich-Werdhölzli und ARA Worblental. Zudem geht ein grosser Dank an Michael Schärer (BAFU), Marco Kipf (Eawag) und Adriana Lotito (Eawag).
Appendix B
228
Literaturverzeichnis
Ahn, J. H., Kim, S., Park, H., Rahm, B., Pagilla, K. and Chandran, K. (2010). N2O Emissions from Activated Sludge Processes, 2008-2009: Results of a National Monitoring Survey in the United States. Environmental Science & Technology 44(12), 4505-4511.
BAFU (2011). Entwicklung der Treibhausgas-Emissionen seit 1990. http://www.bafu.admin.ch/klima/09570/09574/index.html?lang=de.
Burgess, J. E., Stuetz, R. M., Morton, S. and Stephenson, T. (2002). Dinitrogen oxide detection for process failure early warning systems. Water Science and Technology 45(4-5), 247-254.
Butler, M. D., Wang, Y. Y., Cartmell, E. and Stephenson, T. (2009). Nitrous oxide emissions for early warning of biological nitrification failure in activated sludge. Water Research 43(5), 1265-1272.
Daelman, M. R. J., van Dongen, L. G. J. M., van Voorthuizen, E. M., Volcke, E. I. P. and van Loosdrecht, M. C. M. (2012). Methane and nitrous oxide emissions from municipal wastewater treatment. IWA Nutrient Removal and Recovery 2012: Trends in NRR, Harbin, China, 23-25 September 2012.
Daelman, M. R. J., van Voorthuizen, E. M., van Dongen, U. G. J. M., Volcke, E. I. P. and van Loosdrecht, M. C. M. (2012). Methane emission during municipal wastewater treatment. Water Research 46(11), 3657-3670.
IPCC (2007). Climate Change 2007: The Physical Science Basis, Contribution of Working Group I to the Fourth Assessment Report of the Intergovernmental Panel on Climate Change [Solomon, S., Qin, D. Manning, M., Chen, Z., Marquis, M., Averyt, K.B., Tignor, M., Miller, H.L. (eds)]. Cambridge University Press, Cambridge, United Kingdom and New York, NY, USA, 996pp.
Kampschreur, M. J., Temmink, H., Kleerebezem, R., Jetten, M. S. M. and van Loosdrecht, M. C. M. (2009). Nitrous oxide emission during wastewater treatment. Water Research 43(17), 4093-4103.
Korving, L. D., Schilt, C. and De Jong, W. (2010). Reduction of nitrous oxide emission by a smaller air to fuel ratio in a large-scale sewage sludge fluidized bed combustor. 140, 43-55.
Kramlich, J. C. and Linak, W. P. (1994). Nitrous-Oxide Behavior in the Atmosphere, and in Combustion and Industrial-Systems. Progress in Energy and Combustion Science 20(2), 149-202.
Lotito, A. M., Wunderlin, P., Joss, A., Kipf, M. and Siegrist, H. (2012). Nitrous oxide emissions from the oxidation tank of a pilot activated sludge plant. Water Research 46(11), 3563-3573.
Appendix B
229
Mohn, J., Tuzson, B., Manninen, A., Yoshida, N., Toyoda, S., Brand, W. A. and Emmenegger, L. (2012). Site selective real-time measurements of ambient N2O isotopomers by laser spectroscopy. Atmospheric Measurement Techniques Discussions 5, 813-838.
Müller, E. A. (2010). Handbuch Energie in ARA. Verband Schweizer Abwasser- und Gewässerschutzfachleute (VSA).
Ravishankara, A. R., Daniel, J. S. and Portmann, R. W. (2009). Nitrous oxide (N2O): the dominant ozone-depleting substance emitted in the 21st century. Science 326(5949), 123-125.
Wunderlin, P., Mohn, J., Joss, A., Emmenegger, L. and Siegrist, H. (2012). Mechanisms of N2O production in biological wastewater treatment under nitrifying and denitrifying conditions. Water Research 46(4), 1027-1037.
Wunderlin, P., Mohn, J., Joss, A., Emmenegger, L. and Siegrist, H. (in preparation). Nitrogen isotopic signature of N2O: Application to a pilot scale biological wastewater treatment plant.
Wunderlin, P.; Lehmann, M. F.; Siegrist, H.; Tuzson, B.; Joss, A.; Emmenegger, L.; Mohn, J. Isotope signatures of N2O in a mixed microbial population system: Constraints on N2O producing pathways in wastewater treatment. Environmental Science and Technology 2013, 47 (3), 1339-1348.

231
CURRICULUM VITAE
2009 - 2013 PhD student at the Swiss Federal Institute of Aquatic Science and Technology (Eawag), Department of Process Engineering, Dübendorf, Switzerland
2008 Project engineer and application-oriented research and development at the Institute for Environmental and Process Engineering at the University of Applied Sciences of Eastern Switzerland (FHO)
2002 - 2007 Studies in environmental science with a focus on aquatic chemistry (Master of Science ETH), Swiss Federal Institute of Technology (ETH), Zürich
1998 - 2001 High School, Type E, Liestal (BL)
1994 - 1998 Secundary school, Gelterkinden (BL)
1989 - 1994 Primary school, Hemmiken (BL)
September 10, 1982 Born in Laufenburg (AG)


![[halshs-00586267, v1] Measuring well-being across … · 2017-05-05 · Johannes Siegrist Alois Stutzer Joar Vittersø ... 4 Institut für Medizinische Soziologie, Hein rich Heine-Universität](https://img.pdfslide.us/doc/110x75/5ba067c509d3f242318cdb54/halshs-00586267-v1-measuring-well-being-across-2017-05-05-johannes-siegrist.jpg)