Embed Size (px)
Citation preview

Simulations and measurements of the pre-isolator test set-upWG5 Meeting
F. Ramos, A. Gaddi, H. Gerwig, N. Siegrist
November 9, 2010
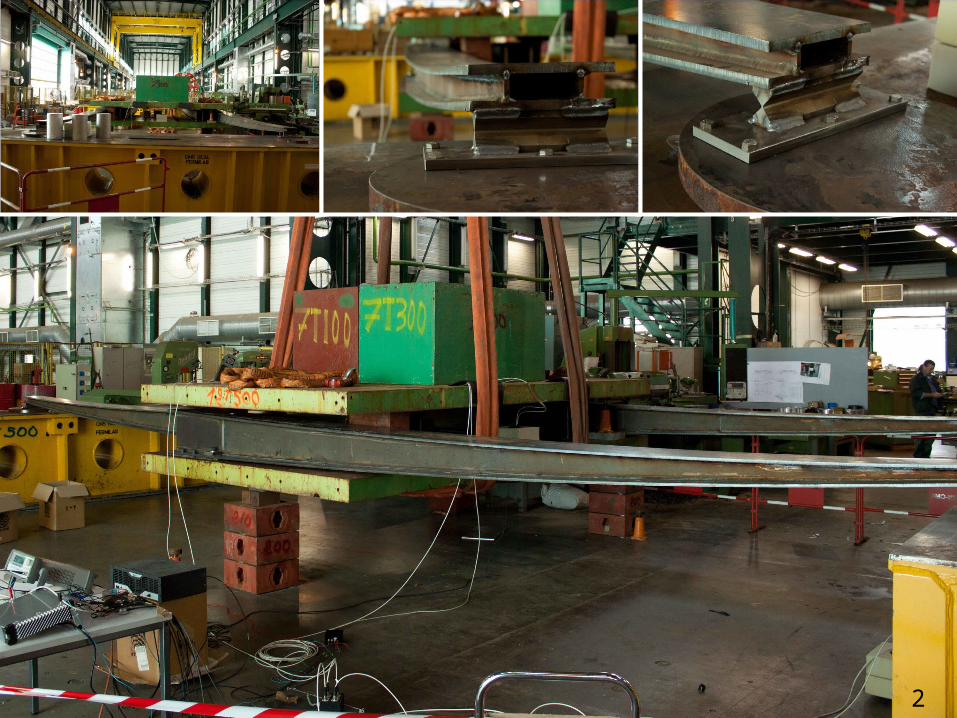
2
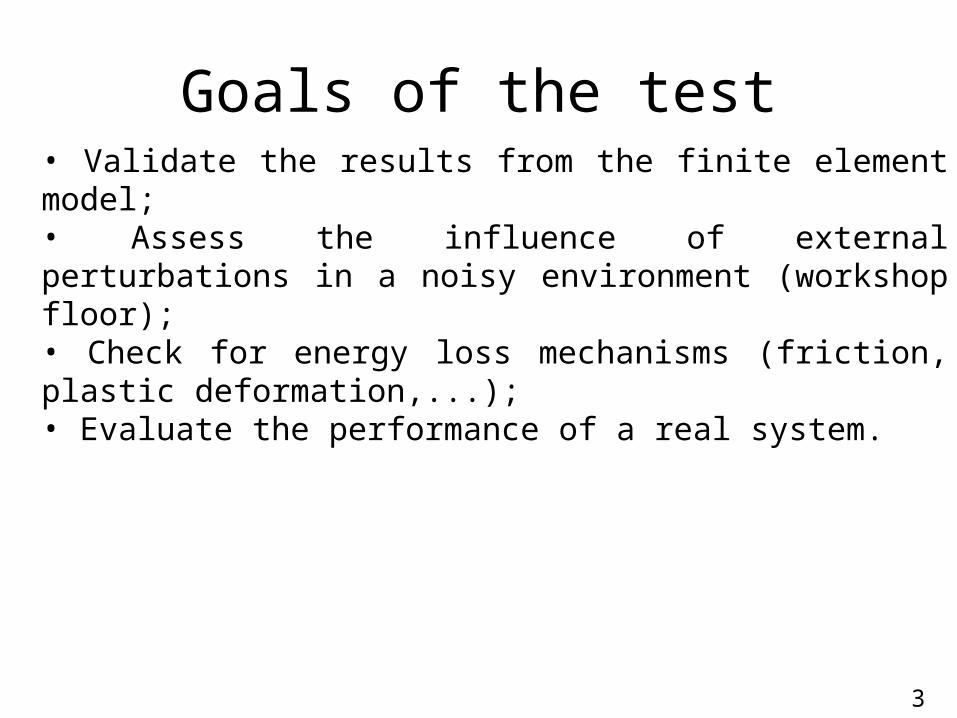
Goals of the test• Validate the results from the finite element model;• Assess the influence of external perturbations in a noisy environment (workshop floor);• Check for energy loss mechanisms (friction, plastic deformation,...);• Evaluate the performance of a real system.
3
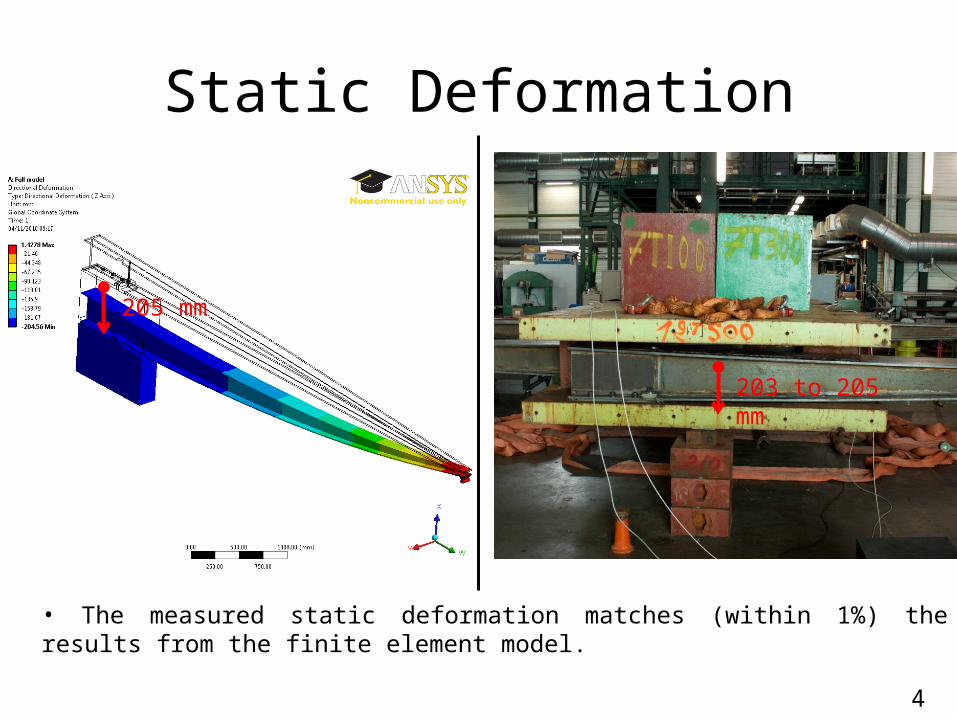
Static Deformation
203 to 205 mm
205 mm
• The measured static deformation matches (within 1%) the results from the finite element model.
4
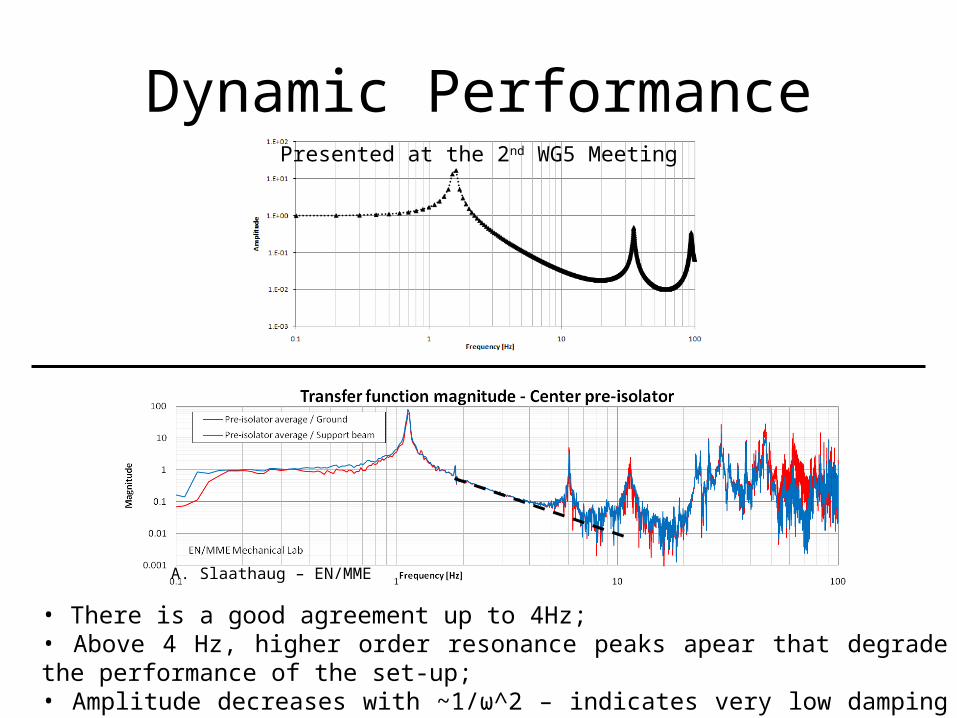
Dynamic PerformancePresented at the 2nd WG5 Meeting
A. Slaathaug – EN/MME
• There is a good agreement up to 4Hz;• Above 4 Hz, higher order resonance peaks apear that degrade the performance of the set-up;• Amplitude decreases with ~1/ω^2 – indicates very low damping of the set-up (below 1%);
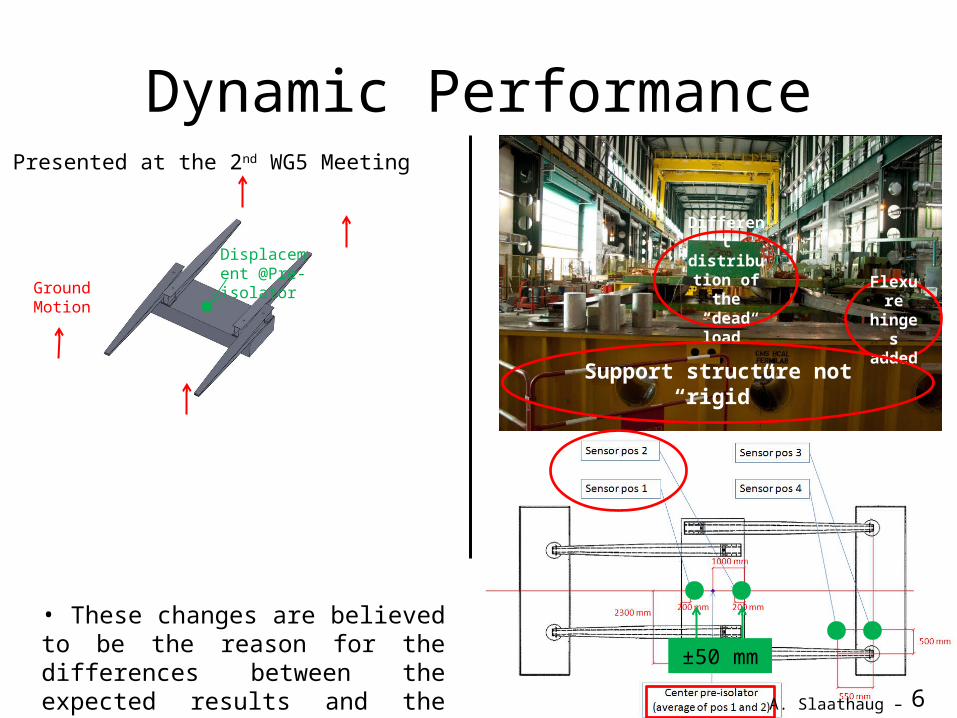
Dynamic Performance
Ground Motion
Displacement @Pre-isolator
Different distribution of the “dead
load” Flexure hinges added
Support structure not “rigid”
±50 mm
A. Slaathaug – EN/MME
Presented at the 2nd WG5 Meeting
• These changes are believed to be the reason for the differences between the expected results and the measured data.
6
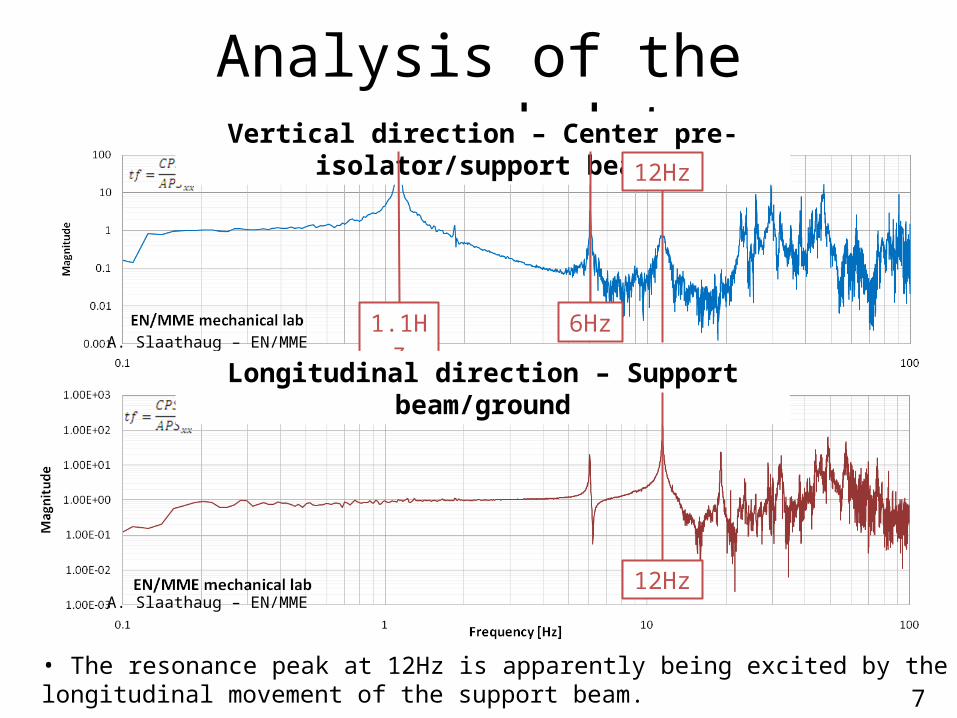
Analysis of the measured dataVertical direction – Center pre-isolator/support beam
1.1Hz 6Hz
12Hz
A. Slaathaug – EN/MME
A. Slaathaug – EN/MME
Longitudinal direction – Support beam/ground
12Hz
• The resonance peak at 12Hz is apparently being excited by the longitudinal movement of the support beam. 7
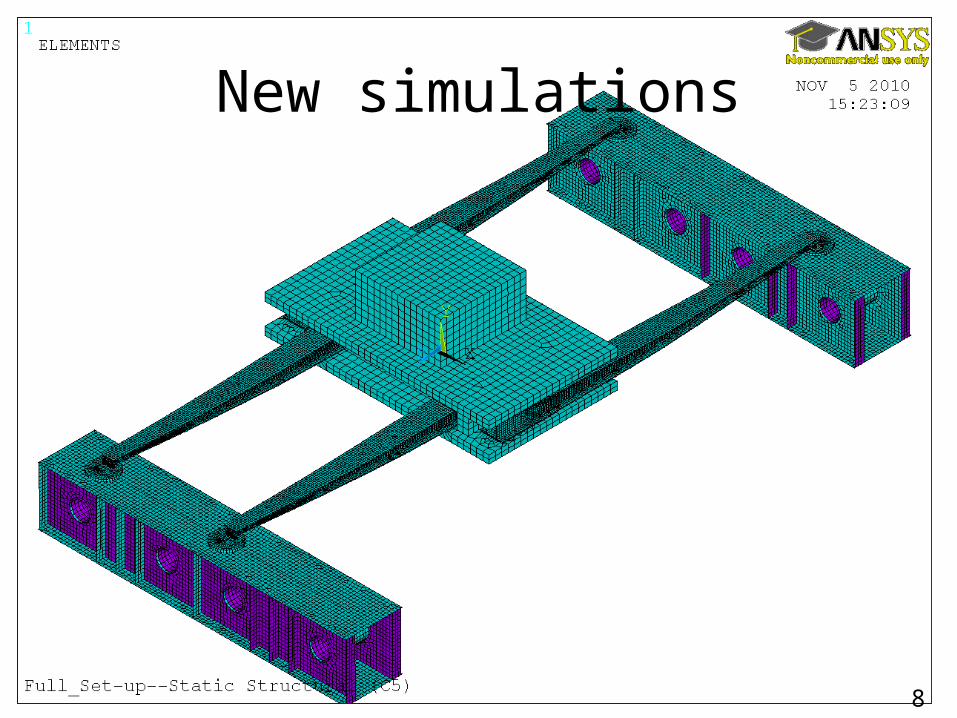
New simulations
8
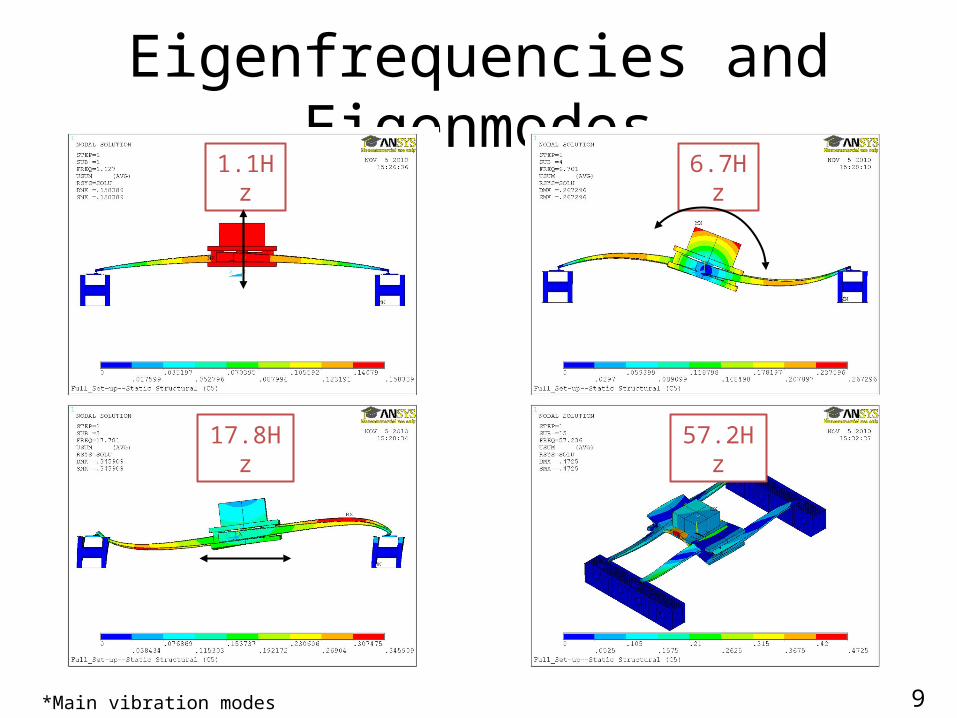
Eigenfrequencies and Eigenmodes1.1Hz 6.7Hz
17.8Hz 57.2Hz
*Main vibration modes 9
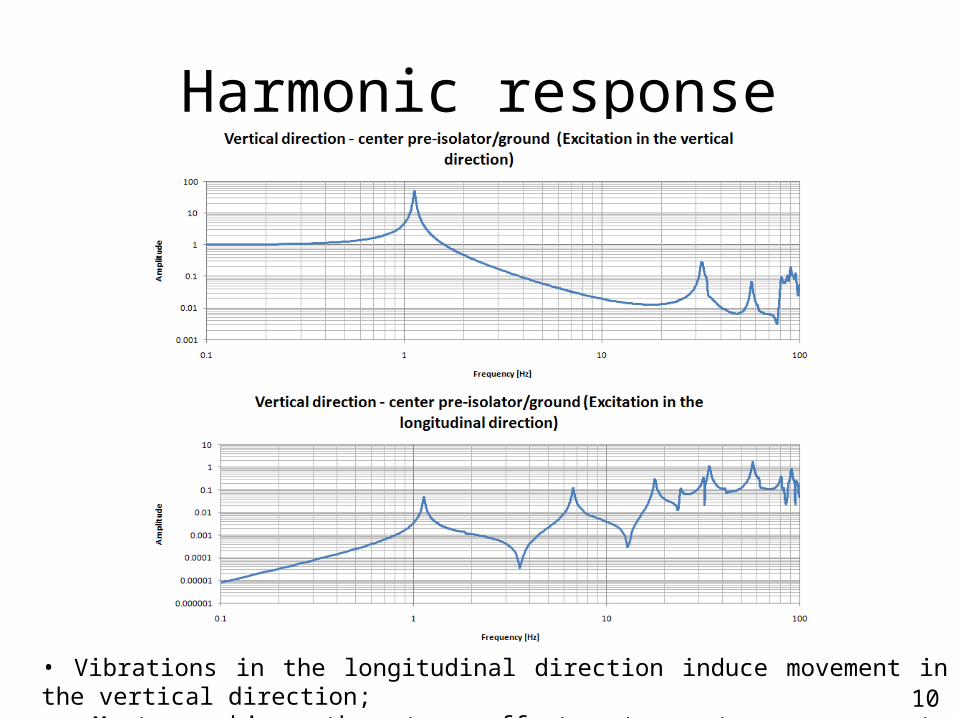
Harmonic response
• Vibrations in the longitudinal direction induce movement in the vertical direction;• Must combine the two effects to get an accurate representation of the set-up. 10
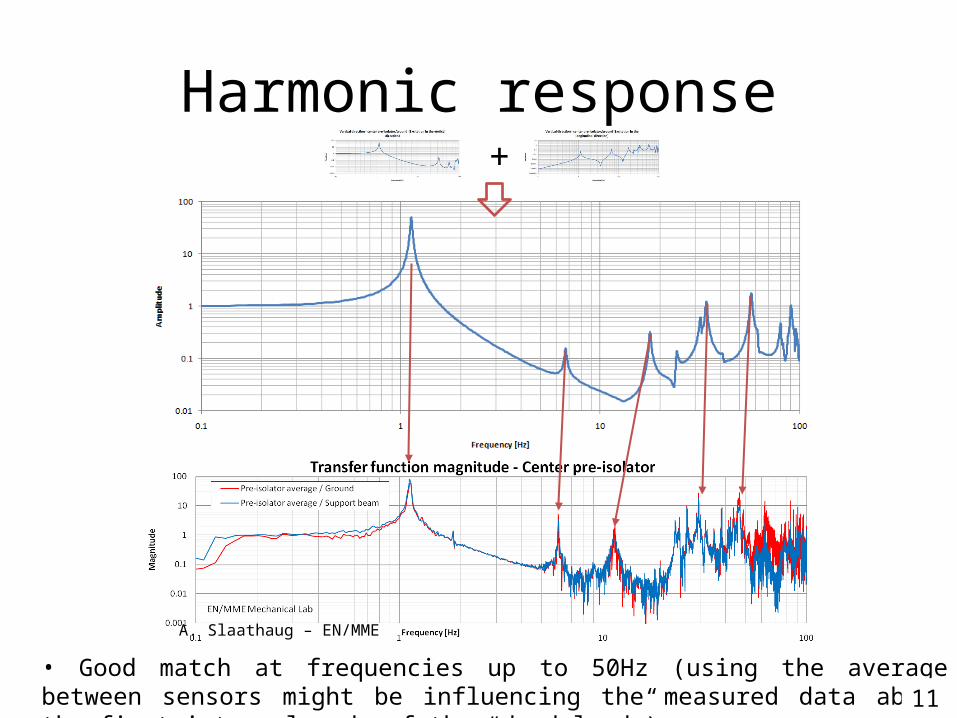
Harmonic response+
A. Slaathaug – EN/MME
• Good match at frequencies up to 50Hz (using the average between sensors might be influencing the measured data above the first internal mode of the “dead load”). 11
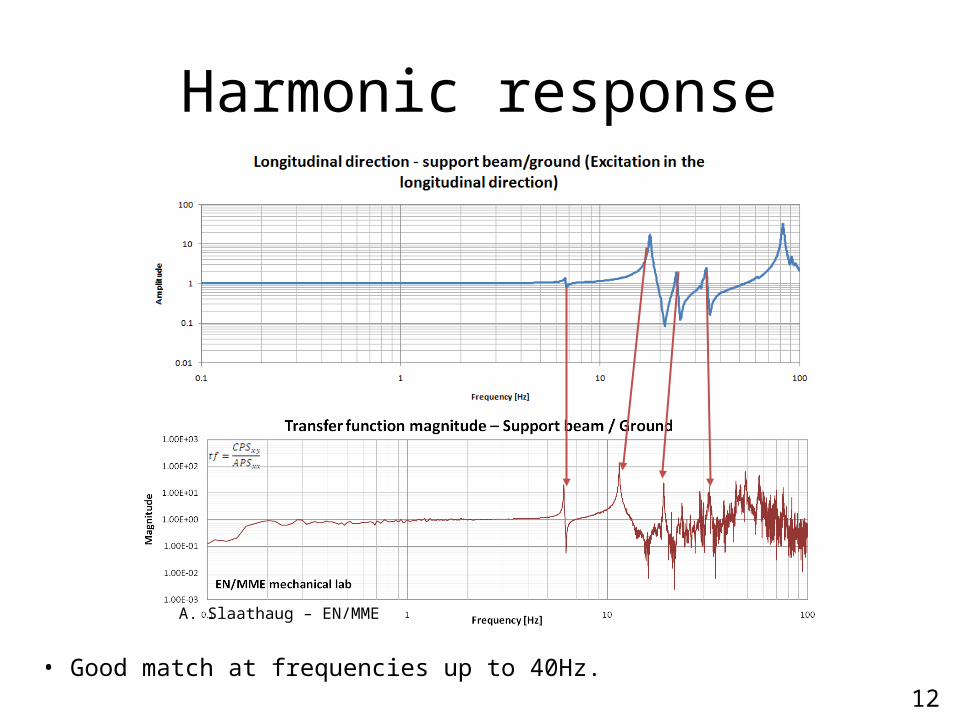
Harmonic response
A. Slaathaug – EN/MME
• Good match at frequencies up to 40Hz.12
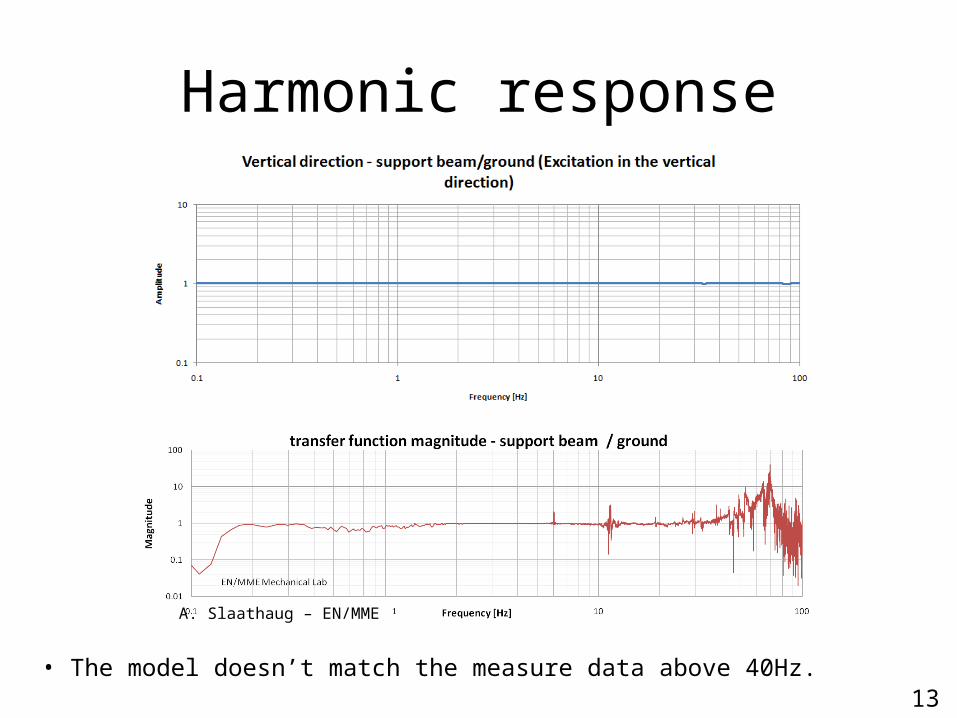
Harmonic response
• The model doesn’t match the measure data above 40Hz.
A. Slaathaug – EN/MME
13

Improvements
• Replace the steel supports by concrete blocks ;• Add 4 sets of horizontal stiffeners to improve the longitudinal stiffness of the set-up;• Change the distribution of the steel blocks that make up the “dead load” to improve its internal natural frequency. 14
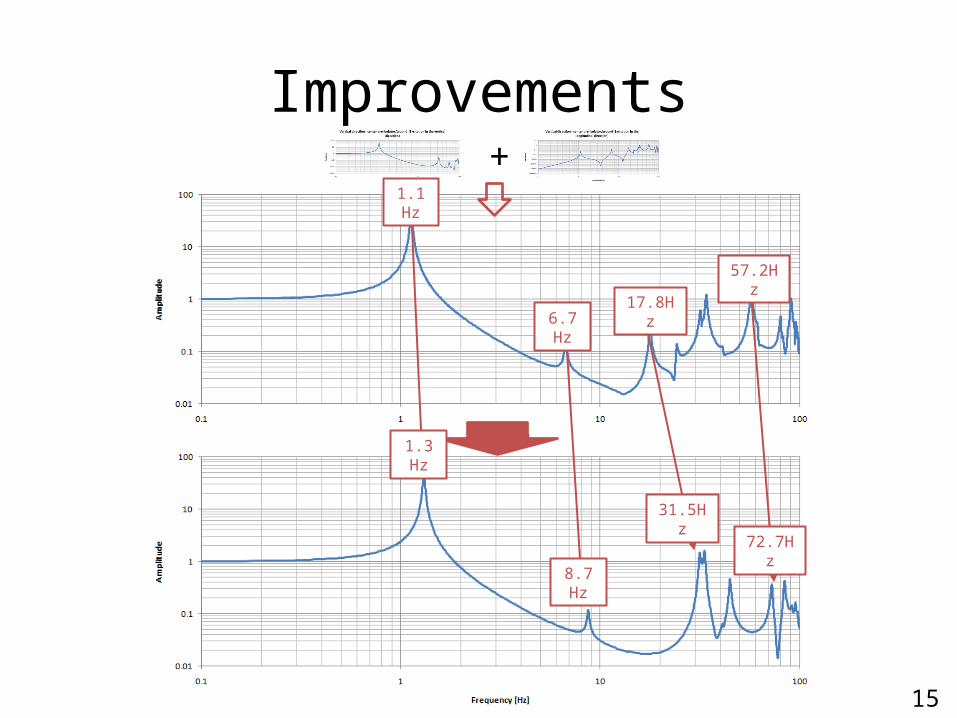
+
Improvements1.1Hz
1.3Hz
6.7Hz17.8Hz
57.2Hz
8.7Hz
31.5Hz
72.7Hz
15
Summary (1)• When compared with the initial simulations, the first set of measurements made on the pre-isolator test set-up showed unexpected results in the mid to high frequency range;
• An updated F.E. model was created and the results match the measured data in low to mid range frequencies;
• High frequency data calculated using the average between sensors might not be usable due to the relatively low internal eigenfrequencies of the “dead load”;
16
Summary (2)• New measurements should be performed with a sensor placed at the center of the “dead load”, concrete blocks as a support to the set-up and horizontal stiffeners in the longitudinal direction;
• The good performance of the set-up at low frequencies gives good hopes for what is to come. Nevertheless, it should be acknowledged that this design, with its several high frequency modes, is not representative of the actual design of the pre-isolator.
17


![+ $ bm b tv hm-]-u 7;u-0-7 - ACE Engineering Academy...Sri Chilkuri Bors Hostel Gaddi Annaram, Dsnr, Hyd Phone 09704847994, 09030827857. Sri Boy's Hostel Gaddi Annaram, Dsnr, Hyd Phone](https://img.pdfslide.us/doc/110x75/5e9a82669d3ad63bec4709d5/-bm-b-tv-hm-u-7u-0-7-ace-engineering-academy-sri-chilkuri-bors-hostel.jpg)