Embed Size (px)
Citation preview
Eur J Appl Physiol (1988) 57:499--506 European Journal of
Applied Physiology and Occupational Physiology �9 Springer Verlag 1988
Thermoregulatory adjustments during continuous heat exposure
J. P. Libert l, C. Amoros ~, J. Di Nisi 1, A. Muzet l, H. Fukuda 2, and J. Ehrhart I
1 Laboratoire de Physiologie et de Psychologie Environnementales, UM 32, C.N.R.S.--I.N.R.S., 21 rue Becquerel, F-67087 Strasbourg-C+dex, France
2 Department of Physiology, Toho University School of Medicine, 5-21-16 Omori-Nishi Ota-ku, Tokyo, Japan
Summary. Body temperature regulation was stud- ied in 6 male subjects during an acclimation pro- cedure involving uninterrupted heat exposure for 5 successive days and nights in a hot dry environ- ment (ambient temperature = 3 5 ~ dew-point temperature = 7 ~ C; air velocity =0.2 m . s - l ) . Data were obtained at rest and during exercise (relative mechanical workload = 35% VO2m,,)- At rest, hourly measurements were made of oesopha- geal and 4 local skin temperatures, to allow the calculation of mean skin temperature, and of body motility and heart rate. During the working periods these measurements were made at 5 min intervals. Hourly whole-body weight loss was measured at rest on a sensitive platform scale while in the working condition just before starting and immediately after completing the bicycle ex- ercise. The results show that, in both exercise and at rest, the successive heat exposures increased the sweat gland output during the first 3 days. Afterwards, sweat rate decreased without any cor- responding change in body temperature. For the fixed workload, the sweat rate decline was asso- ciated with a decrease in circulatory strain. Ad- justments in both sweating and circulatory mech- anisms occur in the first 3 days of continuous heat exposure. The overall sweat rate decline could in- volve a redistribution of the regional sweating rates which enhances the sweat gland activities of skin areas with maximal evaporative efficiencies.
Key words: Heat acclimation -- Sweating rate -- Exercise -- Body temperatures
Introduction
The physiological changes occurring during heat acclimation have been extensively studied. It is
Offprint requests to: J. P. Libert
well-known that in man the sweating ability in- creases with acclimation brought about by re- peated short duration daily exposures to h e a t stress (Ladell 1951; Belding and Hatch 1963; Lind and Bass 1963; Fox et al. 1964; Wyndham 1967; H6nane and Valatx 1973 ; Libert et al. 1983). The increase in sweating is associated with reduc- tions in both skin and internal temperatures. Ac- climation to heat is also accompanied by a fall in heart rate at rest as well as at work, indicative of a diminution in the physiological strain induced by the environmental stress. This results in an im- provement in the ability to perform muscular work. These conclusions have been drawn mostly from studies performed in climatic chambers, and have dealt with acute heat effects. These results disagree with most studies on long-term residents in hot climates, which indicate that native subjects have lower sweat rates than newcomers. This was reported by Hellon et al. (1956) for British sub- jects in Aden and by Wyndham et al. (1952) for Bantu in South Africa when tested in environ- mental humid conditions producing high sweat rates. Ladell (1964) also showed that West Afri- cans sweat less than residentially acclimated new- comers when exposed to a standard humid heat load in a climatic chamber, but pointed out that the differences were small and might have been due to different patterns of activity in the two groups. In all these conditions, despite the smaller sweat loss, lower rectal temperatures were also re- ported. Raynaud et al. (1979), however, reported that the sweating rates are the same in newcomers and native residents in Guyana and in South In- dia. Comparisons between the field studies and those carried out in laboratories could lead to the conclusion that heat acclimation is a lengthy process involving a rapid response to heat marked by a sweat rate increase which is later modified, leading to a sweat rate reduction. There are, nev-
500 J. P- Libert et al.: Thermoregulation and heat adaptation
ertheless, difficulties in accepting such a state- ment without more evidence. In field studies, as compared with laboratory ones, the difficulties of controlling the ambient parameters and measur- ing physiological variables are much greater, so that the experimental situation cannot always be standardized. Furthermore, between-group com- parisons always involve a number of unresolved problems of ethnic characteristics and behaviour and anthropometric (weight-to-body area ratio) differences. For these reasons, in none of the studies reported above was it possible to define the time at which sweat rate started to decline. Furthermore, no explanation for the decline has been put forward. The sweat rate change may be attributable to changes in the body areas effec- tively participating in heat exchange with the sur- roundings. In such a process, there could be a large behavioural component which would make it difficult to draw a firm conclusion from inter- group comparisons.
The aim of the present study was to analyse the changes in the thermophysiological responses occurring during an uninterrupted heat exposure in order to give a better understanding of the ad- aptative response pattern and to determine the origin of the adjustment of the sweating response observed in the studies reported above. For this, care was taken to discard behavioural compo- nents and ethnic and anthropometric differences, to ensure that all changes in physiological re- sponses were due to heat exposure: the subjects lived continuously in a constant hot environment where their activity and clothing were strictly con- trolled.
Methods
Subjects. Six French male students (20--29 years) whose phy- sical characteristics and maximal oxygen uptake are shown in
Table 1 lived continuously in a climatic apartment (including a bedroom, a living room, a dressing room, a bathroom and two water-closets: surface area 70 m 2) so as to allow experimental observations in a situation close to ordinary life during chronic heat exposure. The subjects gave their written con- sents for participation and were informed about the protocol and the potential risks. After a clinical examination the sub- jects were selected on the results of 3 questionnaires: a) the Bortner's behaviour test (1969); b) the morningness-evening- ness questionnaire (Home and Ostberg 1976); c) the Eysenck Personality Inventory (1971). All the subjects were normally distributed in respect to these different tests. In order to stand- ardize the groups of subjects, the following requisites have also been taken into account: a) all subjects had established continuous residence in France; b) the values of weight-to- body area ratio did not greatly differ between subjects; c) the subjects had not lived in a hot climate since the last summer; d) individual values of maximal oxygen uptake were very sim- ilar.
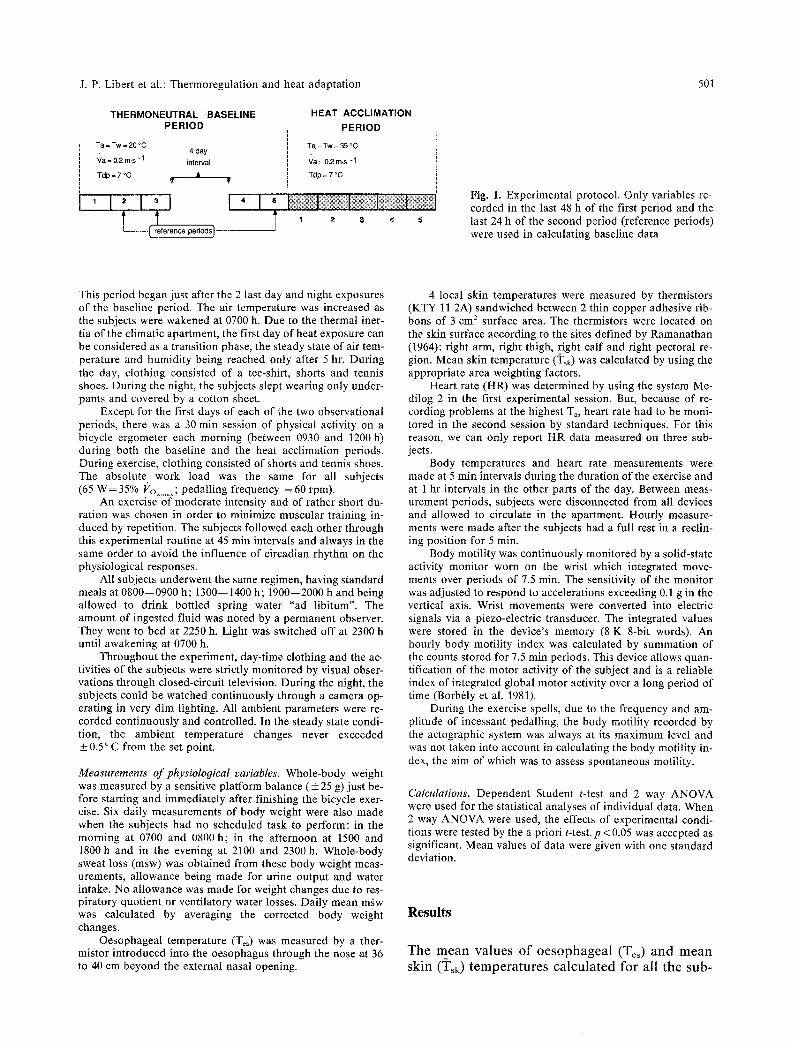
Procedure. The experiment was carried out in 2 separate ses- sions in Apri l - -May (3 subjects in each session) during which the subjects lived and slept continuously in the selected ther- mal condition. In each session data were recorded simulta- neously from the 3 subjects. Each experimental protocol was divided into 2 periods (Fig. 1):
The first was a baseline period during which the subjects were exposed to a thermoneutral environment: air (Ta) and wall (Tw) temperatures = 2 0 ~ dew-point temperature, Tdp=7~ air velocity, /?a=0.2 m.s -1. During the day, the subjects were clothed in a cotton track-suit and tennis shoes. During the night, the subjects slept in a bed, wearing pyjamas. Covering consisted of two cotton sheets and one wool blanket. These initial periods in the facilities lasted for 5 days and nights in total, and consisted of 72 h exposure (from Monday to Wednesday) followed, 4 days later, by a 48 h period imme- diately before the acclimation procedure. During the 4 day in- terval, the subjects were out of the laboratory and living their normal lives. Only the variables recorded during the last 48 h of the first period and the last 24 h of the second period were used in calculating the baseline data. This was to minimize any strain due to the unusual condition (the subject being equip- ped with temperature sensors and electrodes during the first 24 h of each observational period in the laboratory).
The second period was that of heat acclimation and con- sisted of 5 consecutive days and nights (120 h) in a hot dry environment (Ta=Tw=35~ Ydp=7~ Va=0.2m.s-1) .
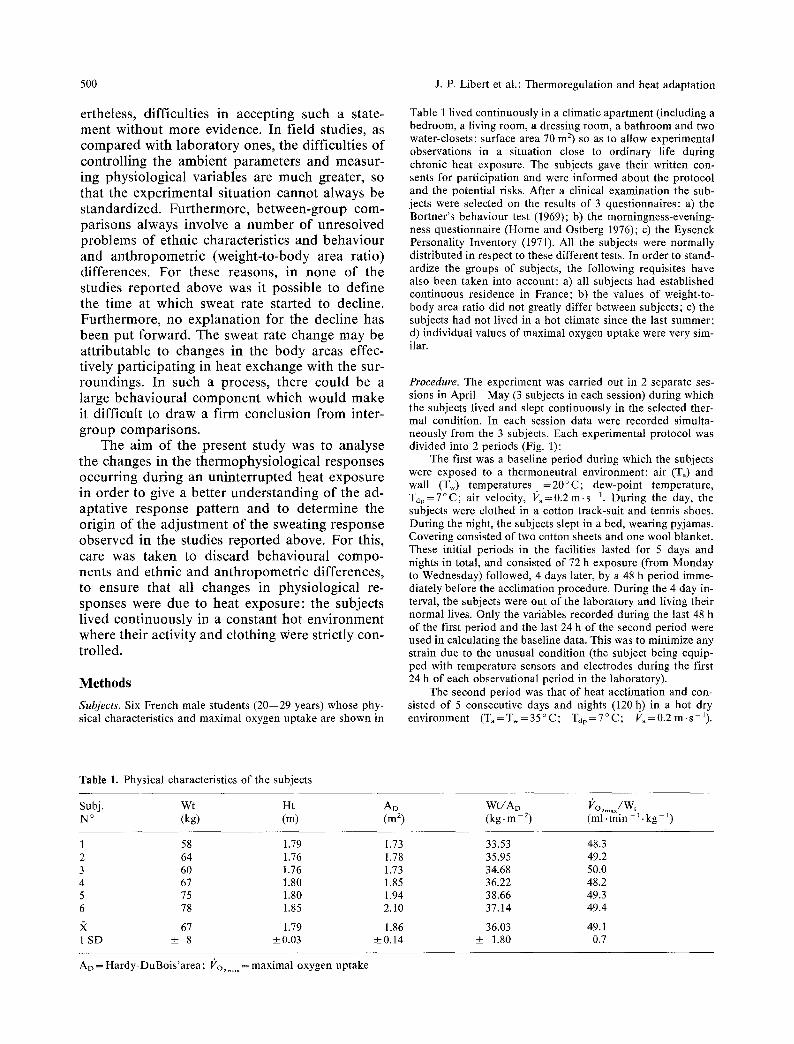
Table 1. Physical characteristics of the subjects
Subj. Wt Ht AD Wt/AD Vo . . . . /Wt N ~ (kg) (m) (m 2) (kg. m - 2) (ml. min -1. kg - 1)
1 58 1.79 1.73 33.53 48.3 2 64 1.76 1.78 35.95 49.2 3 60 1.76 1.73 34.68 50.0 4 67 1.80 1.85 36.22 48.2 5 75 1.80 1.94 38.66 49.3 6 78 1.85 2.10 37.14 49.4
67 1.79 1.86 36.03 49.1 1 SD • 8 +0.03 • • 1.80 0.7
A o = Hardy-DuBois'area; I2o . . . . =maximal oxygen uptake
J. P. Libert et al.: Thermoregulation and heat adaptation 501
THERMONEUTRAL BASELINE PERIOD
Ta = Tw = 20 ~ 4 day
~/a = 0.2 m.s -1 interval
Tdp = 7 ~ ~, V u
2 3 4 '1 I t 7 I I [ - - { reference periodsJ
HEAT ACCLIMATION
PERIOD
T a = T w = 3 5 ~
Va = 0.2 m.s -1
Ydp = 7 ~
1 2 3 4 5
Fig. 1. Experimental protocol. Only variables re- corded in the last 48 h of the first period and the last 24 h of the second period (reference periods) were used in calculating baseline data
This period began just after the 2 last day and night exposures of the baseline period. The air temperature was increased as the subjects were wakened at 0700 h. Due to the thermal iner- tia of the climatic apartment, the first day of heat exposure can be considered as a transition phase, the steady state of air tem- perature and humidity being reached only after 5 hr. During the day, clothing consisted of a tee-shirt, shorts and tennis shoes. During the night, the subjects slept wearing only under- pants and covered by a cotton sheet.
Except for the first days of each of the two observational periods, there was a 30 min session of physical activity on a bicycle ergometer each morning (between 0930 and 1200 h) during both the baseline and the heat acclimation periods. During exercise, clothing consisted of shorts and tennis shoes. The absolute work load was the same for all subjects (65 W = 35% I2o . . . . ; pedalling frequency = 60 rpm).
An exercise of moderate intensity and of rather short du- ration was chosen in order to minimize muscular training in- duced by repetition. The subjects followed each other through this experimental routine at 45 min intervals and always in the same order to avoid the influence of circadian rhythm on the physiological responses.
All subjects underwent the same regimen, having standard meals at 0800--0900 h; 1300--1400 h; 1900--2000 h and being allowed to drink bottled spring water "ad libitum". The amount of ingested fluid was noted by a permanent observer. They went to bed at 2250 h. Light was switched off at 2300 h until awakening at 0700 h.
Throughout the experiment, day-time clothing and the ac- tivities of the subjects were strictly monitored by visual obser- vations through closed-circuit television. During the night, the subjects could be watched continuously through a camera op- erating in very dim lighting. All ambient parameters were re- corded continuously and controlled. In the steady state condi- tion, the ambient temperature changes never exceeded + 0.5 ~ from the set point.
Measurements of physiological variables. Whole-body weight was measured by a sensitive platform balance (_+ 25 g)just be- fore starting and immediately after finishing the bicycle exer- cise. Six daily measurements of body weight were also made when the subjects had no scheduled task to perform: in the morning at 0700 and 0800 h; in the afternoon at 1500 and 1800 h and in the evening at 2100 and 2300 h. Whole-body sweat loss (mgw) was obtained from these body weight meas- urements, allowance being made for urine output and water intake. No allowance was made for weight changes due to res- piratory quotient or ventilatory water losses. Daily mean mgw was calculated by averaging the corrected body weight changes.
Oesophageal temperature (Tes) was measured by a ther- mistor introduced into the oesophagus through the nose at 36 to 40 em beyond the external nasal opening.
4 local skin temperatures were measured by thermistors (KTY 11 2A) sandwiched between 2 thin copper adhesive rib- bons of 3 cm 2 surface area. The thermistors were located on the skin surface according to the sites defined by Ramanathan (1964): right arm, right thigh, right calf and right pectoral re- gion. Mean skin temperature (Tsk) was calculated by using the appropriate area weighting factors.
Heart rate (HR) was determined by using the system Me- dilog 2 in the first experimental session. But, because of re- cording problems at the highest Ta, heart rate had to be moni- tored in the second session by standard techniques. For this reason, we can only report HR data measured on three sub- jects.
Body temperatures and heart rate measurements were made at 5 rain intervals during the duration of the exercise and at 1 hr intervals in the other parts of the day. Between meas- urement periods, subjects were disconnected from all devices and allowed to circulate in the apartment. Hourly measure- ments were made after the subjects had a full rest in a reclin- ing position for 5 min.
Body motility was continuously monitored by a solid-state activity monitor worn on the wrist which integrated move- ments over periods of 7.5 min. The sensitivity of the monitor was adjusted to respond to accelerations exceeding 0.1 g in the vertical axis. Wrist movements were converted into electric signals via a piezo-electric transducer. The integrated values were stored in the device's memory (8 K 8-bit words). An hourly body motility index was calculated by summation of the counts stored for 7.5 min periods. This device allows quan- tification of the motor activity of the subject and is a reliable index of integrated global motor activity over a long period of time (Borb~ly et al. 1981).
During the exercise spells, due to the frequency and am- plitude of incessant pedalling, the body motility recorded by the actographic system was always at its maximum level and was not taken into account in calculating the body motility in- dex, the aim of which was to assess spontaneous motility.
Calculations. Dependent Student t-test and 2 way ANOVA were used for the statistical analyses of individual data. When 2 way ANOVA were used, the effects of experimental condi- tions were tested by the a priori t-test, p < 0.05 was accepted as significant. Mean values of data were given with one standard deviation.
Results
T h e m e a n v a l u e s o f o e s o p h a g e a l (Tes) a n d m e a n
s k i n (3?sk) t e m p e r a t u r e s c a l c u l a t e d f o r a l l t h e s u b -
502 J .P. Libert et al.: Thermoregulation and heat adaptation
T~, (~
36.0
35.0
34.0
33.0
Tes (~
37.5 y I I /:= i ,
E X E R C I S E
............... ~ TIME (h) ,, , , , ,,,,,, ,,,, 7 9 . 13~s 17 1 9 ~ 23
W t W t W t
37.0
36.5
32.0 36.0
i i E X E R C I S E
' ................. ' TIHE (h) I I I I I ~ , I I, ,I i 7 9 11 13 15 17 19 21 2 3
I I I I I I
Wt Wt Wt
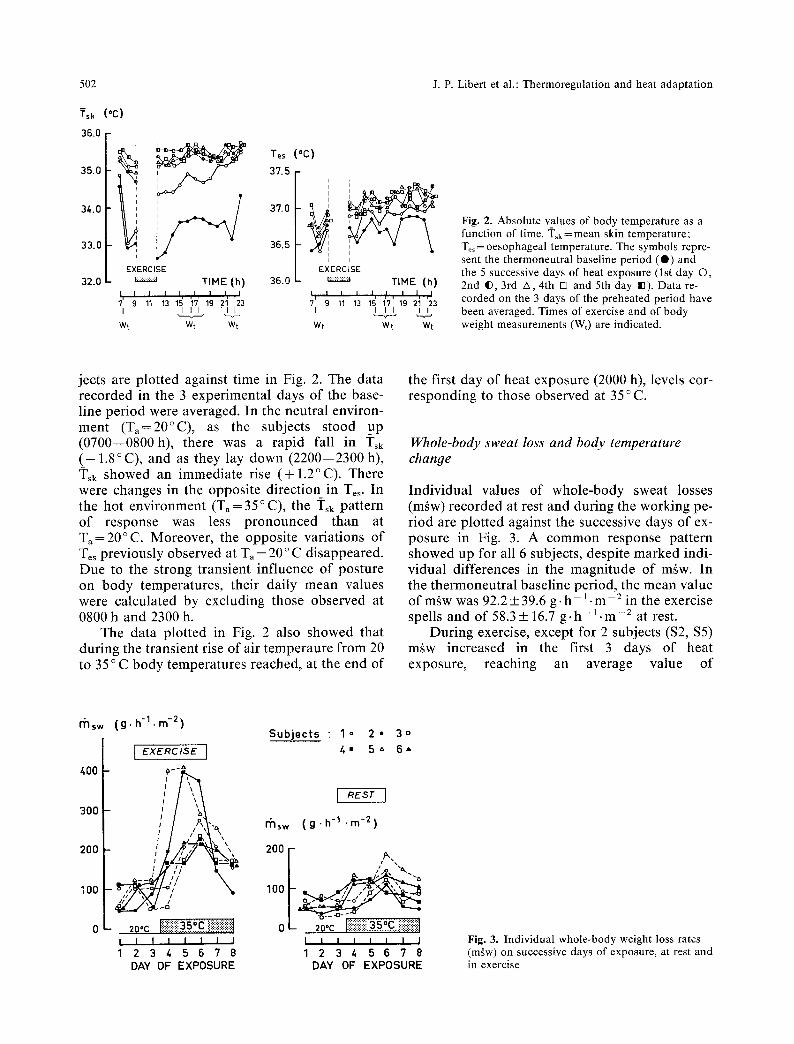
Fig. 2. Absolute values of body temperature as a function of time. ~i'sk=mean skin temperature; Te~ = oesophageal temperature. The symbols repre- sent the thermoneutral baseline period (@) and the 5 successive days of heat exposure (lst day �9 2nd I), 3rd A 4th [] and 5th day IB). Data re- corded on the 3 days of the preheated period have been averaged. Times of exercise and of body weight measurements (Wt) are indicated.
jects are plotted against time in Fig. 2. The data recorded in the 3 experimental days of the base- line period were averaged. In the neutral environ- ment (T ,=20~ as the subjects stood up (0700--0800h), there was a rapid fall in ]'sk (-- 1.8~ and as they lay down (2200--2300 h), Tsk showed an immediate rise (+1.2~ There were changes in the opposite direction in Tes. In the hot environment (Ta= 35 ~ C), the ~i'sk pattern of response was less pronounced than at Ta=20~ Moreover, the opposite variations of Tes previously observed at Ta = 20 ~ C disappeared. Due to the strong transient influence of posture on body temperatures, their daily mean values were calculated by excluding those observed at 0800 h and 2300 h.
The data plotted in Fig. 2 also showed that during the transient rise of air temperaure from 20 to 35 ~ C body temperatures reached, at the end of
the first day of heat exposure (2000 h), levels cor- responding to those observed at 35 ~ C.
Whole-body sweat loss and body temperature change
Individual values of whole-body sweat losses (maw) recorded at rest and during the working pe- riod are plotted against the successive days of ex- posure in Fig. 3. A common response pattern showed up for all 6 subjects, despite marked indi- vidual differences in the magnitude of m~w. In the thermoneutral baseline period, the mean value ofm~w was 92.2+39.6 g .h - ] .m-= in the exercise spells and of 58.3 _+ 16.7 g .h -1 . m - 2 at rest.
During exercise, except for 2 subjects ($2, $5) maw increased in the first 3 days of heat exposure, reaching an average value of
msw
400
300
200
100
( g . h - l . r n -2 ) S u b j e c t s : 1o 2 - 3o
I t,. s o 6- i ExERc,sE
/ [ ",~ rhsw ( g ' h -1 ' m -2)
- ' ' '\ 200 r ,,~..
=0 ,c 2o.c liii;i;;iiiii;i I I I I I I I I I I I I I I I J
1 2 3 4 5 6 7 8 1 2 3 4 5 6 "I 8 DAY OF EXPOSURE DAY OF EXPOSURE
Fig. 3. Individual whole-body weight loss rates (m~w) on successive days of exposure, at rest and in exercise
J, P. Libert et al.: Thermoregulation and heat adaptation 503
260.9+74.0 g . h - l - m -2. For those sweating the most ($2, $5), the maximum values of mgw (397.9 g - h - l . m -2 for $2 and 404.6 g . h - l . m -2 for $5) were reached on the 2nd day of heat exposure.
After this transient increase, for all the sub- jects m~w declined significantly (t(5)=3.169; p < 0.05) until the 5th day of heat exposure when it reached an average of 154.5 + 29.9 g. h - l . m-2 (decline of 41% from the maximum sweating rate observed in these experiments). In exercise, the amount of visible unevaporated sweat on the skin surface, wetting the shorts or dripping onto the floor was always larger in the first 3 days than in the last 2 days of heat exposure. On the very last day, the clothing remained practically dry.
At rest, similar features appeared. Compared with the thermoneutral period, 5 of the 6 subjects showed an increase in sweat gland activity, reach- ing a peak value of 140.3+31 g . h - l - m -2 after 3 days of heat exposure. For $4, the peak value (mgw 125.7 g . h - l . m -2) was reached already on the 2nd day of heat exposure. Afterwards, mgw decreased significantly (t(5)=6.204; p<0.01) for all 6 subjects reaching a value of 84.8+26.2 g - h - ~ . m -2 (decline of 40% from the maximum sweating rate value observed in these experi- ments).
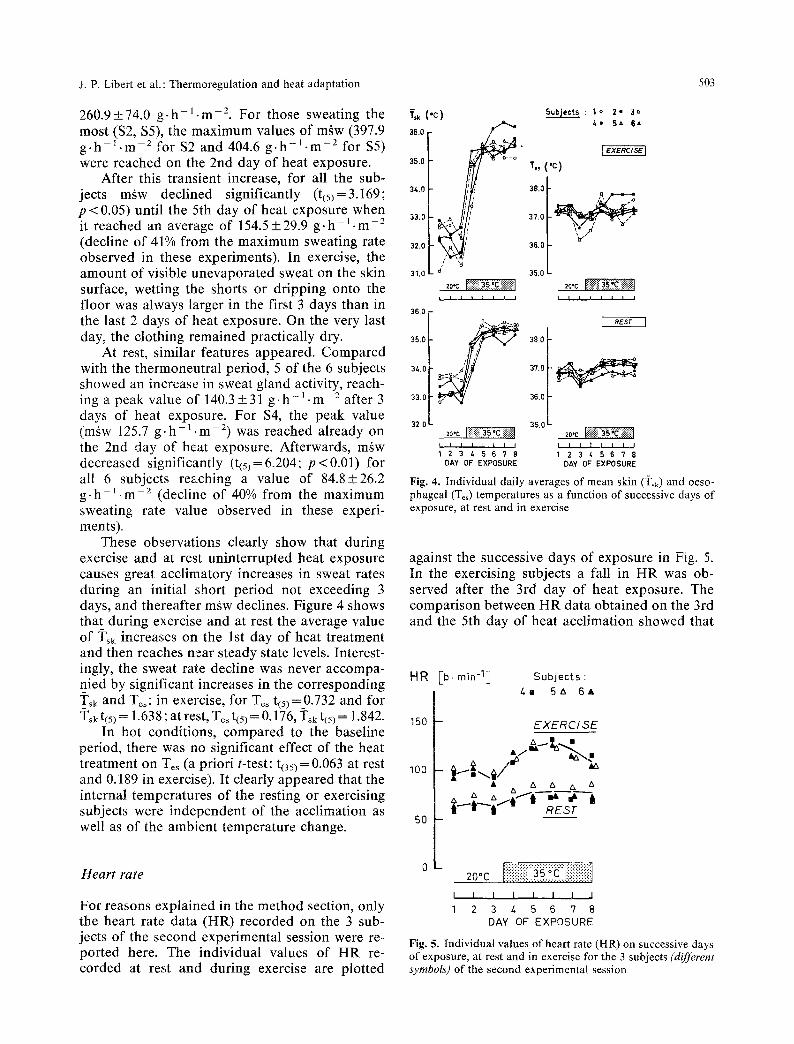
These observations clearly show that during exercise and at rest uninterrupted heat exposure causes great acclimatory increases in sweat rates during an initial short period not exceeding 3 days, and thereafter mgw declines. Figure 4 shows that during exercise and at rest the average value of q'sk increases on the 1st day of heat treatment and then reaches near steady state levels. Interest- ingly, the sweat rate decline was never accompa- nied by significant increases in the corresponding rsk and Tes : in exercise, for Te~ t(5)=0.732 and for 2C~k t(5) = 1.638 ; at rest, T~ t(5) = 0.176, rsk t(5 ) = 1.842.
In hot conditions, compared to the baseline period, there was no significant effect of the heat treatment o n Tes (a priori t-test: t(35)= 0.063 at rest and 0.189 in exercise). It clearly appeared that the internal temperatures of the resting or exercising subjects were independent of the acclimation as well as of the ambient temperature change.
Heart rate
For reasons explained in the method section, only the heart rate data (HR) recorded on the 3 sub- jects of the second experimental session were re- ported here. The individual values of HR re- corded at rest and during exercise are plotted
T., (.c) 36.0
35.0
3!,.0
33.0
32.0
31.0
36.0
35.0
34.0
33.0
32.0
.o .g . .
' b--o
/ �9 d
20~
i i i t 1 1 1 1
Subiects : l o 2= 30 4 . 5A 6~
t.. (.c)
38.0
37.0 ' @
36.0
35.0
20"C I I I ' t = i i
j 20%
I I I I I I I I
1 2 3 4 5 6 7 8 DAY OF EXPOSURE
38.0
37.0
35.0
35.0 20'C
i i i t I i i i
1 2 3 4 5 6 7 8 DAY OF EXPOSURE
Fig. 4. Individual daily averages of mean skin (q'sk) and oeso- phageal (Te~) temperatures as a function of successive days of exposure, at rest and in exercise
against the successive days of exposure in Fig. 5. In the exercising subjects a fall in HR was ob- served after the 3rd day of heat exposure. The comparison between HR data obtained on the 3rd and the 5th day of heat acclimation showed that
HR I-b, rnin -1 ] Subjects : 4m 5z~ 6 &
150
100
50
- E X E R C I S E
& & & & &
l | REST
0 - ::::i:i:i:?"""o'"'":i:i??':::': 20~ [.;.;.; ................................................ 1 :.:.:.:.:.:+ 35 C :.:..:...:..:
I I I I I I I 1
1 2 3 4 5 6 7 8 DAY OF" EXPOSURE
Fig. 5. Individual values of heart rate (HR) on successive days of exposure, at rest and in exercise for the 3 subjects (different symbols) of the second experimental session
504 J.P. Libert et al.: Thermoregulation and heat adaptation
there was a heart rate reduction of - 1 9 + 4 b. min - 1. In spite of the fact that the small num- ber of subjects did not allow statistical analysis, it can be observed that, after 3 days of continuous heat exposure, the same mechanical workload can be performed with a much lower cardiac strain. But at rest there was no HR change between the 3rd and the 5th day of heat exposure.
Body motifity
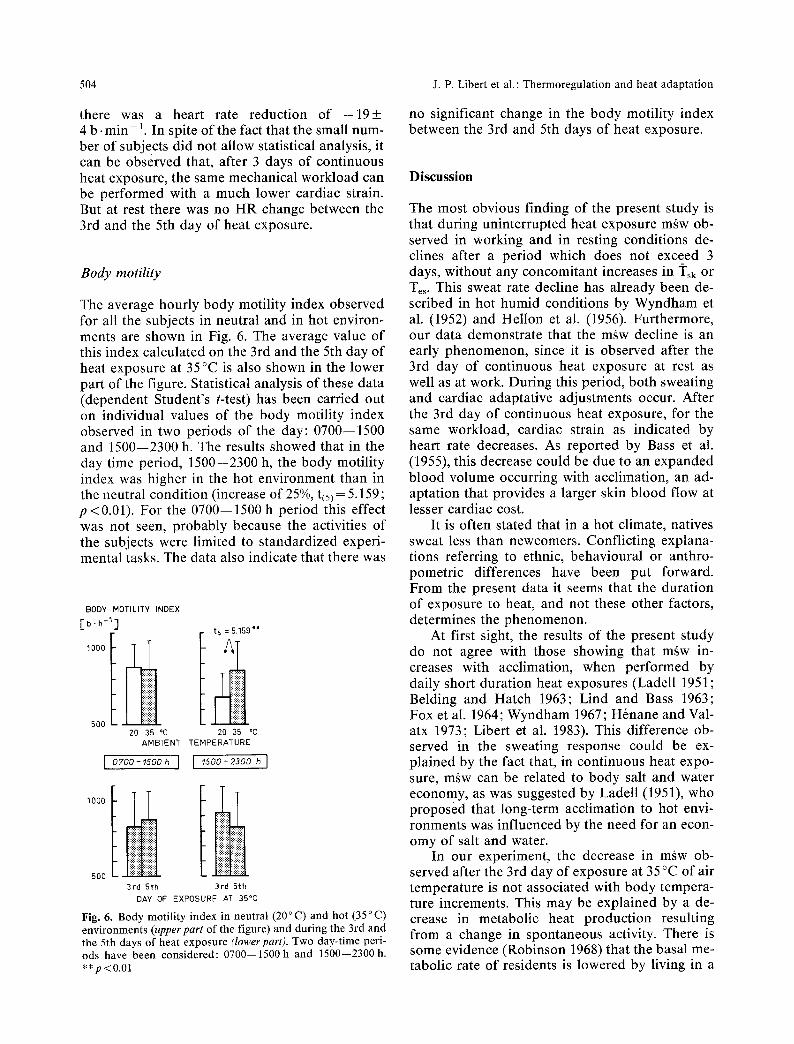
The average hourly body motility index observed for all the subjects in neutral and in hot environ- ments are shown in Fig. 6. The average value of this index calculated on the 3rd and the 5th day of heat exposure at 35~ is also shown in the lower part of the figure. Statistical analysis of these data (dependent Student's t-test) has been carried out on individual values of the body motility index observed in two periods of the day: 0700--1500 and 1500--2300 h. The results showed that in the day time period, 1500--2300 h, the body motility index was higher in the hot environment than in the neutral condition (increase of 25%, t(5)= 5.159; p<0.01). For the 0700--1500 h period this effect was not seen, probably because the activities of the subjects were limited to standardized experi- mental tasks. The data also indicate that there was
BODY MOTILITY INDEX
[b.h-'] ts = 5.159"*
20 35 *C 20 35 ~ AMBIENT TEMPERATURE
I 0 7 0 0 - 7 5 0 0 h i I , 5 0 0 - 2300 h I
1000
500 3rd 5th 3rd 5th
DAY OF EXPOSURE AT 35~
Fig. 6. Body motility index in neutral (20~ and hot (35~ environments (upper part of the figure) and during the 3rd and the 5th days of heat exposure (lower part). Two clay-time peri- ods have been considered: 0700--1500 h and 1500--2300 h. **p<0.01
no significant change in the body motility index between the 3rd and 5th days of heat exposure.
Discussion
The most obvious finding of the present study is that during uninterrupted heat exposure m~w ob- served in working and in resting conditions de- clines after a period which does not exceed 3 days, without any concomitant increases in Tsk or Tes. This sweat rate decline has already been de- scribed in hot humid conditions by Wyndham et al. (1952) and Hellon et al. (1956). Furthermore, our data demonstrate that the maw decline is an early phenomenon, since it is observed after the 3rd day of continuous heat exposure at rest as well as at work. During this period, both sweating and cardiac adaptative adjustments occur. After the 3rd day of continuous heat exposure, for the same workload, cardiac strain as indicated by heart rate decreases. As reported by Bass et al. (1955), this decrease could be due to an expanded blood volume occurring with acclimation, an ad- aptation that provides a larger skin blood flow at lesser cardiac cost.
It is often stated that in a hot climate, natives sweat less than newcomers. Conflicting explana- tions referring to ethnic, behavioural or anthro- pometric differences have been put forward. From the present data it seems that the duration of exposure to heat, and not these other factors, determines the phenomenon.
At first sight, the results of the present study do not agree with those showing that m~w in- creases with acclimation, when performed by daily short duration heat exposures (Ladell 1951; Belding and Hatch 1963; Lind and Bass 1963; Fox et al. 1964; Wyndham 1967; H6nane and Val- atx 1973; Libert et al. 1983). This difference ob- served in the sweating response could be ex- plained by the fact that, in continuous heat expo- sure, maw can be related to body salt and water economy, as was suggested by Ladell (1951), who proposed that long-term acclimation to hot envi- ronments was influenced by the need for an econ- omy of salt and water.
In our experiment, the decrease in m~w ob- served after the 3rd day of exposure at 35 ~ of air temperature is not associated with body tempera- ture increments. This may be explained by a de- crease in metabolic heat production resulting from a change in spontaneous activity. There is some evidence (Robinson 1968) that the basal me- tabolic rate of residents is lowered by living in a
J. P. Libert et al.: Thermoregulation and heat adaptation 505
hot climate. This reduction is rapid in onset but small in quantity. As shown in the results, the body motility index increases in hot conditions and is not significantly modified from the 3rd day to the end of the heat exposure. These observa- tions indicate no reduction in resting heat produc- tion due to a decrease in the daily activities of the subjects, which could explain the decline in mgw. Another explanation may be fatigue of the sweat- ing mechanism. As stated by Gerking et al. (1946) and by Sargent (1962), this failure in mgw only oc- curred with long sustained high body tempera- tures (i?sk > 35 ~ C ; Tre > 37.8 o C) and high rates of sweat output (over 400 g .h -1 .m -2) and was ac- companied by an increase in internal temperature. In addition, these authors reported that, the greater the initial maw, the greater was the decline in mgw. This is not the case in our experiment: a) the maximum mean value of maw observed dur- ing the working period (30 min) is 265 g.h -~ -m -2 which is not maximal; b) there is also a decline in mgw at rest, which, even at peak response to heat, is only 140 g - h - l . m - 2 ; c) the degree o fmgw de- cline is similar at rest and in exercise (40%) de- spite very different initial values of maw; d) maw decline is never accompanied by a corresponding increase in body temperature.
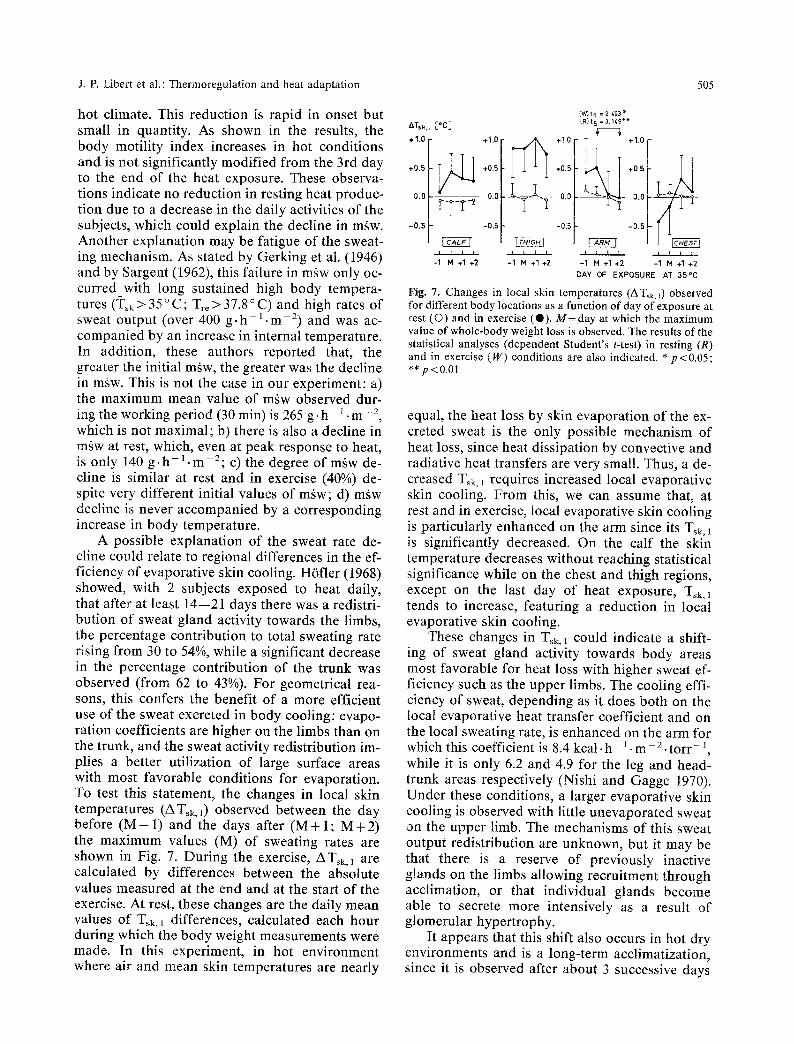
A possible explanation of the sweat rate de- cline could relate to regional differences in the ef- ficiency of evaporative skin cooling. H6fler (1968) showed, with 2 subjects exposed to heat daily, that after at least 14--21 days there was a redistri- bution of sweat gland activity towards the limbs, the percentage contribution to total sweating rate rising from 30 to 54%, while a significant decrease in the percentage contribution of the trunk was observed (from 62 to 43%). For geometrical rea- sons, this confers the benefit of a more efficient use of the sweat excreted in body cooling: evapo- ration coefficients are higher on the limbs than on the trunk, and the sweat activity redistribution im- plies a better utilization of large surface areas with most f avorabb conditions for evaporation. To test this statement, the changes in local skin temperatures (ATsk, 0 observed between the day before ( M - l ) and the days after ( M + I ; M + 2 ) the maximum values (M) of sweating rates are shown in Fig. 7. During the exercise, ATsk, 1 are calculated by differences between the absolute values measured at the end and at the start of the exercise. At rest, these changes are the daily mean values of T~k, 1 differences, calculated each hour during which the body weight measurements were made. In this experiment, in hot environment where air and mean skin temperatures are nearly
aT,,.L [~ ,,. 1.0
+0.5
0.0 0.0
F-T-r -0.5 -0.5
I [ I I
-1 M .I §
+1.0 ~ k ~ +1.0
+0.5 +0.5
17.I. 00
-0.5
I I l I
-1 M +1 +2
{w)t 5 = 2./'93 ~ {R}t 5 =3.1/,9"*
+1.0
T +0.5
- 0.0
-0.5
--l ~ I I -1 M +1 +2
M R I I
-1 M +1 § DAY OF EXPOSURE AT 35~
Fig. 7. Changes in local skin temperatures (ATsk, l ) observed for different body locations as a function of day of exposure at rest (O) and in exercise (0) . M = d a y at which the maximum value of whole-body weight loss is observed. The results of the statistical analyses (dependent Student's t-test) in resting (R) and in exercise (W) conditions are also indicated. * p<0.05; �9 * p<0.01
equal, the heat loss by skin evaporation of the ex- creted sweat is the only possible mechanism of heat loss, since heat dissipation by convective and radiative heat transfers are very small. Thus, a de- creased Tsk, l requires increased local evaporative skin cooling. From this, we can assume that, at rest and in exercise, local evaporative skin cooling is particularly enhanced on the arm since its Tsk, 1 is significantly decreased. On the calf the skin temperature decreases without reaching statistical significance while on the chest and thigh regions, except on the last day of heat exposure, Tsk,1 tends to increase, featuring a reduction in local evaporative skin cooling.
These changes in Tsk ,1 could indicate a shift- ing of sweat gland activity towards body areas most favorable for heat loss with higher sweat ef- ficiency such as the upper limbs. The cooling effi- ciency of sweat, depending as it does both on the local evaporative heat transfer coefficient and on the local sweating rate, is enhanced on the arm for which this coefficient is 8.4 kcal. h - 1. m -2. to r r - 2, while it is only 6.2 and 4.9 for the leg and head- trunk areas respectively (Nishi and Gagge 1970). Under these conditions, a larger evaporative skin cooling is observed with little unevaporated sweat on the upper limb. The mechanisms of this sweat output redistribution are unknown, but it may be that there is a reserve of previously inactive glands on the limbs allowing recruitment through acclimation, or that individual glands become able to secrete more intensively as a result of glomerular hypertrophy.
It appears that this shift also occurs in hot dry environments and is a long-term acclimatization, since it is observed after about 3 successive days
506 J.P. Libert et al.: Thermoregulation and heat adaptation
and nights of heat exposure (72 h of continuous heat exposure).
The time from the onset of heat exposure at which this redistribution occurs is shorter than that reported by H6fler (at least 14 days). This discordance could be explained by the fact that in H6fler's study the subjects were only exposed to a hot environment during the day, the air tempera- ture at night being lowered to near neutrality at 31 ~ C, while in our experiment the subjects lived and slept continuously in the hot environment.
The redistribution in sweat gland activity is considered the most likely explanation of the data reported in this study, since it is consistent with the fact that the observed rate of change in sweat- ing with heat acclimation results not only from a modification in sensitivity of the thermoregula- tory system but also from a local training re- sponse of the sweat glands due to the recruitment of sweat glands previously inactive. Therefore, the redistribution of the activity of the local sweat glands appears as a factor which can be taken into account in the analysis of sweating regulation during heat acclimation.
Acknowledgements. This work was supported by D.R.E.T. (Re- search convention n ~ 85/083). The authors are indebted to Professors P. Lenzi and B. Metz for their critical review of the manuscript.
References
Bass DE, Kleeman CR, Quinn M, Henschel A, Hegnauer H (1955) Mechanisms of acclimatization to heat in man. Medicine 34:323--380
Belding HS, Hatch TF (1963) Relation of skin temperature to acclimation and tolerance to heat. Fed Proc 22:881--883
Borb+ly AA, Neuhauss HU, Mattmann P, Waser PG (1981) Langzeitregistrierung der Bewegungsaktivit~it: Anwen- dungen in Forschung und Clinik. Schweiz Med Wo- chenschr 111:730--735
Bortner RW (1969) A short rating scale as a potential measure of pattern A behavior. J Chron Dis 22:86--91
Eysenck MJ, Eysenck SB (1971) Inventaire de personnalit~ d'Eysenck (E.P.I.). Traduction et adaptation par Ganansia K, Editions du Centre de Psychologic Appliqu+e, Paris
Fox RH, Goldsmith R, Hampton LFG, Lewis HE (1964) The nature of the increase in sweating capacity produced by heat acclimatization. J Physiol 171:368--376
Gerking SD, Robinson S (1946) Decline in the rates of sweat- ing of men working in severe heat. Am J Physiol 147:370-- 378
H~nane R, Valatx JL (1973) Thermoregulatory changes in- duced during heat acclimatization by controlled hyperther- mia in man. J Physiol 230:255--271
Hellon RF, Jones JM, Mac Pherson RK, Weiner DS (1956) Natural and artificial acclimatization to hot environments. J Physiol 132:559--576
H6fler W (1968) Changes in regional distribution of sweating during acclimation to heat. J Appl Physiol 25:503--506
Horne JA, Ostberg O (1976) A self-assessment questionnaire to determine morningness-eveningness in human circadian rhythm. Int J Chronobiol 4:97-- 110
Ladell WSS (1951) Assessment of group acclimation to heat and humidity. J Physiol 115:296--312
Ladell WSS (1964) Terrestrial animals in humid heat: man. In: Dill DB, Adolph EF, Wilber GG (eds) Handbook of phy- siol adaptation to the environment. Am Physiol Soc, Wash- ington, pp 625--679
Libert JP, Candas V, Vogt JJ (1983) Modifications of sweating responses to thermal transients following heat acclimation. Eur J Appl Physiol 50:235--246
Lind AR, Bass DE (1963) Optimal exposure time for develop- ment of acclimatization to heat. Fed Proc 22:704--708
Nishi Y, Gagge AP (1970) Direct evaluation of convective heat transfer coefficient by naphtalene sublimation. J Appl Phy- siol 29:830--838
Ramanathan NL (1964) A new weighting system for mean sur- face temperature of the human body. J Appl Physiol 19:531--533
Raynaud J, Martineaud JP, Durand J (1979) Body tempera- tures and chronic heat exposure. In: Durand J, Raynaud J (eds) Thermal comfort: physiological and psychological bases. INSERM, Paris, pp 345--365
Robinson S (1968) Physiological adjustments to heat. In: Physiology of Heat Regulation and The Science of Cloth- ing. Newburgh LH (ed) Hafner Publ Comp, New-York, London: 193--231
Sargent F (1962) Depression of sweating in man: so-called sweat gland fatigue. In: Montagna W, Ellis RA, Silver AI (eds) Advances in biology of skin. Pergamon, London, 3:163--212
Wyndham CH, Bouwer WV, Devine MG, Paterson HE (1952) Physiological responses of African labourers at various sa- turated air temperatures, wind velocities and rates of en- ergy expenditure. J Appl Physiol 5:290--298
Wyndham CH (1967) Effect of acclimation on the sweat rate/ rectal temperature relationship. J Appl Physiol 22:27--30
Accepted October 29, 1987