Embed Size (px)
Citation preview
Thermohaline instability and the formation of glacialNorth Atlantic super polynyas at the onsetof Dansgaard-Oeschger warming eventsGuido Vettoretti1 and W. Richard Peltier1
1Department of Physics, University of Toronto, Toronto, Ontario, Canada
Abstract Late Quaternary rapid warming events inferred on the basis of oxygen isotopic data fromGreenland ice cores are the most prominent characteristic of millennial-scale Dansgaard-Oeschgeroscillations. In a coupled climate model simulation which has accurately reproduced this oscillatorybehavior for the first time, we show that formation of a glacial North Atlantic super polynyacharacterizes the initial stage of transition from cold stadial to warm interstadial conditions. The winterpolynya forms within the otherwise sea ice-covered North Atlantic as a consequence of the onset of athermohaline convective instability beneath an extensive stadial sea ice lid. Early in the stadial period,the tendency for thermal convective instability of an extensive warm pool beneath the sea ice lid isstrongly inhibited by a stabilizing vertical salinity gradient, which gradually diminishes until athermohaline convective instability occurs that leads to polynya formation and the rapid retreat ofNorth Atlantic sea ice cover.
1. Introduction
Marine Isotopic Stage 3 (MIS3; approximately 60,000 to 30,000 years ago) was a period characterized byintense climate instability in the form of millennium timescale Dansgaard-Oeschger (D-O) oscillations[Dansgaard et al., 1993]. Individual D-O oscillations are characterized by abrupt Northern Hemispherewarming events followed by gradual cooling periods and the temperature records inferred fromGreenland δ18O records [Huber et al., 2006] are closely correlated with North Atlantic Ocean temperature[Bond et al., 1997]. During MIS3, the occurrence of a warm Atlantic species group of foraminifera anddepleted benthic δ18O in marine sediment cores from the Norwegian Sea have been interpreted as point-ing to an unstable vertical temperature gradient with a warm high-salinity Atlantic water mass below coldlow-salinity polar surface water [Rasmussen et al., 1996a, 1996b; Rasmussen and Thomsen, 2004; Dokkenet al., 2013].
Previous qualitative proposals intended to enhance understanding of the abrupt D-O warming phase haveinvoked a renewal of North Atlantic Deep Water (NADW) production associated with the disruption of apolar halocline, possibly associated with reduced glacial meltwater and iceberg discharge into the ocean[Broecker et al., 1990; Bond et al., 1992; Sakai and Peltier, 1997, 1999]. Rasmussen and Thomsen [2004] sug-gested on the contrary that subsurface warming gradually decreased the density of the intermediate depthwater so as to lead to the onset of a thermal convective instability, which was imagined to destroy the polarhalocline. Our model-based analyses, the first to reproduce this physical phenomenon and all of its primarycharacteristics [Peltier and Vettoretti, 2014, hereinafter PV14], have established not only that the D-O oscil-lation is expected only under generally cold glacial conditions but that its existence does not rely uponfreshwater forcing of the North Atlantic Ocean to disrupt the overturning circulation. Furthermore, themodel has also been shown to accurately explain the bipolar seesaw aspect of the D-O phenomenonthrough which the amplitude and phase relationships between the δ18O signals in Greenland andAntarctic ice cores are established [Vettoretti and Peltier, 2015; PV14].
As we will show in what follows, the physical mechanism that underlies stadial-interstadial transitions in ourmodel involves the onset of a thermohaline convective instability that develops beneath the extensive NorthAtlantic stadial sea ice cover through the erosion of the stabilizing effect of the halocline salinity gradient. Thehallmark of the eventual instability that marks the onset of interstadial conditions is the formation of a “glacialsuper polynya” well north of the southern boundary of the sea ice lid.
VETTORETTI AND PELTIER GLACIAL NORTH ATLANTIC SUPER POLYNYAS 1
PUBLICATIONSGeophysical Research Letters
RESEARCH LETTER10.1002/2016GL068891
Key Points:• North Atlantic thermohaline instabilityis an integral component of D-Owarming events
• Erosion of the halocline salinity gradientresults in glacial super polynya formation
• The thermohaline instability processmay depend upon the nonlinearequation of state
Supporting Information:• Supporting Information S1
Correspondence to:G. Vettoretti,[email protected]
Citation:Vettoretti, G., and W. R. Peltier (2016),Thermohaline instability and theformation of glacial North Atlantic superpolynyas at the onset of Dansgaard-Oeschger warming events, Geophys. Res.Lett., 43, doi:10.1002/2016GL068891.
Received 27 MAR 2016Accepted 8 MAY 2016Accepted article online 11 MAY 2016
©2016. American Geophysical Union.All Rights Reserved.
2. Methods and Model
There are a number of plausible thermohaline convective instability-related processes that may be associatedwith a water column in which cold low-salinity water lies above warm high-salinity water. A simple convectiveinstability associated with the double-diffusion process may occur in the polar halocline regime and be aviable mechanism for halocline destabilization [Baines and Gill, 1969]. Alternatively, a quadratic temperatureterm in a series expansion of the nonlinear equation of state (NEOS) of seawater gives rise to a diabatic phe-nomenon (cabbeling) that occurs when two parcels of water that are of the same density but of differenttemperature and salinity are combined along neutral density surfaces to produce a water mass that is ofgreater density than the original two parcels [Foster, 1972; McDougall, 1987; Schanze and Schmitt, 2013].Similarly, the influence of thermobaricity [Gill, 1973;McDougall, 1984;McDougall, 1987] which depends uponthe pressure dependence of the coefficient of thermal expansion of seawater is in principle also capable ofleading to polar halocline instability. Adkins et al. [2005] and Adkins [2013] have suggested that such thermo-baric instability could underlie the stadial interstadial transitions of interest to us here, but they invoked thepossible importance of geothermal heat flux as a key ingredient needed to destabilize the water column.
We are employing the 1× 1° resolution Community Climate System Model Version 4 (CCSM4) [Gent et al.,2011] to study the details of the D-O oscillation phenomenon. The condition for instability within the verticalmixing scheme of the approximately Boussinesq hydrostatic model of the ocean is solely dependent on thelocal Brunt-Väisälä frequency (N2) of the water column. We are therefore limited in our ability to determinethe relative importance of the subtle instability mechanisms described above. Nevertheless, the NEOS is offirst-order importance since it determines the Brunt-Väisälä frequency which controls convective adjustment,the rate of exchange between the atmosphere and ocean, and the state of the global ocean stratification[Roquet et al., 2015; Nycander et al., 2015].
The simulation of modern Southern Ocean sea ice cover has been demonstrated to be sensitive to thevertical mixing scheme employed within an ocean model [e.g., Losch et al., 2006; Kjellsson et al., 2015]. TheK-profile parameterization (KPP) [Large et al., 1994] has previously been demonstrated to produce unphysicalpolynyas in the Southern Ocean in a coupled ocean-sea ice sectoral model of the Weddell Sea region[Timmermann and Beckmann, 2004]. The KPP parameterization is employed in the Parallel Ocean ProgramVersion 2 (POP2) ocean component of CCSM4 that is implemented in the current study, but the control simu-lation does not exhibit such behavior. Polynya formation may also be sensitive to sea ice model parameter-izations, but ocean and sea ice sensitivity studies will not be a focus of the current paper.
In contrast to the constant diapycnal diffusivity (κ) background profile employed for discussions in the maintext of PV14, here we will present results for the D-O oscillation when the constant (κ = 0.16 cm2/s) profile isreplaced by the κ profile employed in the previous CCSM3 version of the model (e.g., see Jayne [2009] andsupporting information). This κ profile captures the increase of diapycnal diffusivity below the main thermo-cline (to κ = 1.0 cm2/s) that has been argued to be required in order to enable the deep water that forms atthe poles to upwell to the surface in the Southern Ocean [e.g.,Munk, 1966]. The ice age boundary conditionsare provided by the ICE-6G_C (VM5a) model for paleotopography, bathymetry, and land ice cover [Arguset al., 2014; Peltier et al., 2015]. The boundary and initial conditions for the glacial and preindustrial simula-tions employed in this study have been discussed in detail in Vettoretti and Peltier [2013] and PV14.
3. Analyses3.1. Statistical Equilibrium
The Atlantic Meridional Overturning Circulation (AMOC) strength under preindustrial (PI) boundary conditions isapproximately 20 sverdrup (Sv, 106m3/s), when the same κ profile is employed as in the glacial experiment. ThisPI run has been spun off the PI control run from PV14 and run for an additional 1000years, leading to no changein AMOC compared with PV14. The glacial simulation of 4500 calendar years was branched off the initial PV14glacial experiment at year 1700 and was determined to have reached statistical equilibrium at year 2500. Theglacial decadal average AMOC oscillates between a minimum stadial value of 8 Sv and a maximum interstadialvalue of 33 Sv (Figure 1a), which is somewhat larger than the peak-to-peak amplitude variations of the D-Ooscillation described in the main text of PV14. Changes of 5°C in annual mean North Greenland Ice CoreProject (NGRIP) surface temperature have previously beenmodeled with sensitivity experiments of low and high
Geophysical Research Letters 10.1002/2016GL068891
VETTORETTI AND PELTIER GLACIAL NORTH ATLANTIC SUPER POLYNYAS 2
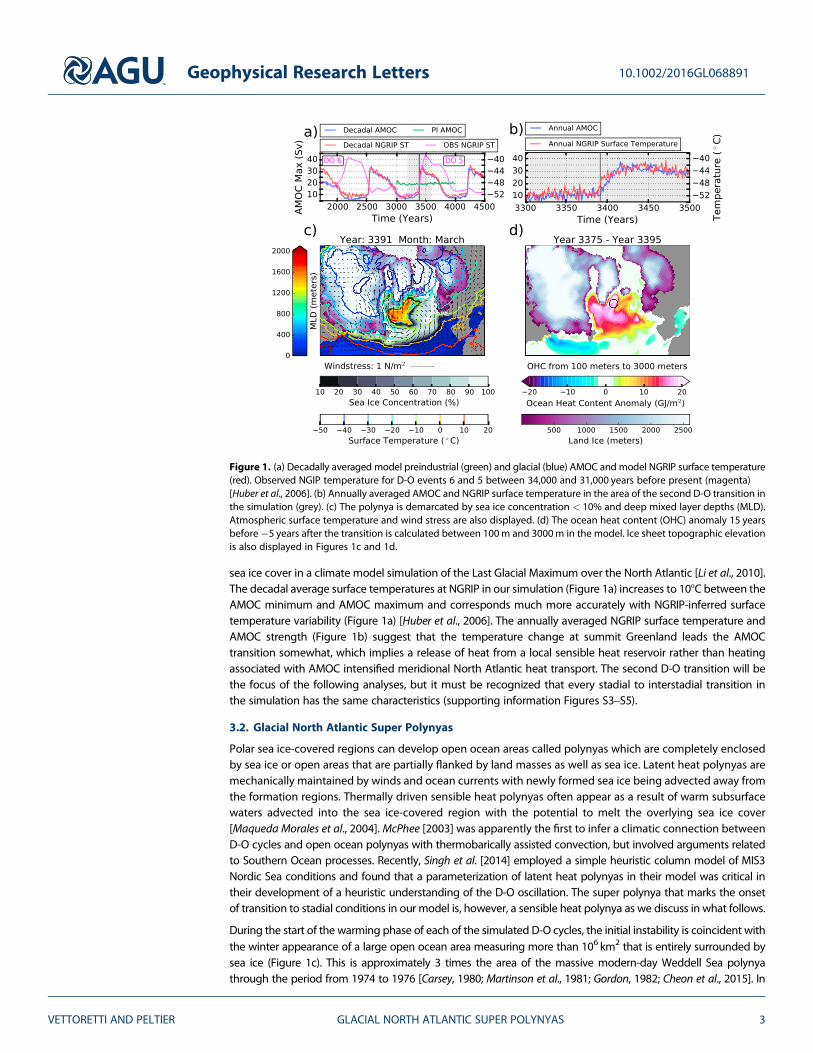
sea ice cover in a climate model simulation of the Last Glacial Maximum over the North Atlantic [Li et al., 2010].The decadal average surface temperatures at NGRIP in our simulation (Figure 1a) increases to 10°C between theAMOC minimum and AMOC maximum and corresponds much more accurately with NGRIP-inferred surfacetemperature variability (Figure 1a) [Huber et al., 2006]. The annually averaged NGRIP surface temperature andAMOC strength (Figure 1b) suggest that the temperature change at summit Greenland leads the AMOCtransition somewhat, which implies a release of heat from a local sensible heat reservoir rather than heatingassociated with AMOC intensified meridional North Atlantic heat transport. The second D-O transition will bethe focus of the following analyses, but it must be recognized that every stadial to interstadial transition inthe simulation has the same characteristics (supporting information Figures S3–S5).
3.2. Glacial North Atlantic Super Polynyas
Polar sea ice-covered regions can develop open ocean areas called polynyas which are completely enclosedby sea ice or open areas that are partially flanked by land masses as well as sea ice. Latent heat polynyas aremechanically maintained by winds and ocean currents with newly formed sea ice being advected away fromthe formation regions. Thermally driven sensible heat polynyas often appear as a result of warm subsurfacewaters advected into the sea ice-covered region with the potential to melt the overlying sea ice cover[Maqueda Morales et al., 2004].McPhee [2003] was apparently the first to infer a climatic connection betweenD-O cycles and open ocean polynyas with thermobarically assisted convection, but involved arguments relatedto Southern Ocean processes. Recently, Singh et al. [2014] employed a simple heuristic column model of MIS3Nordic Sea conditions and found that a parameterization of latent heat polynyas in their model was critical intheir development of a heuristic understanding of the D-O oscillation. The super polynya that marks the onsetof transition to stadial conditions in our model is, however, a sensible heat polynya as we discuss in what follows.
During the start of the warming phase of each of the simulated D-O cycles, the initial instability is coincident withthe winter appearance of a large open ocean area measuring more than 106 km2 that is entirely surrounded bysea ice (Figure 1c). This is approximately 3 times the area of the massive modern-day Weddell Sea polynyathrough the period from 1974 to 1976 [Carsey, 1980; Martinson et al., 1981; Gordon, 1982; Cheon et al., 2015]. In
Figure 1. (a) Decadally averaged model preindustrial (green) and glacial (blue) AMOC and model NGRIP surface temperature(red). Observed NGIP temperature for D-O events 6 and 5 between 34,000 and 31,000 years before present (magenta)[Huber et al., 2006]. (b) Annually averaged AMOC and NGRIP surface temperature in the area of the second D-O transition inthe simulation (grey). (c) The polynya is demarcated by sea ice concentration < 10% and deep mixed layer depths (MLD).Atmospheric surface temperature and wind stress are also displayed. (d) The ocean heat content (OHC) anomaly 15 yearsbefore�5 years after the transition is calculated between 100m and 3000m in the model. Ice sheet topographic elevationis also displayed in Figures 1c and 1d.
Geophysical Research Letters 10.1002/2016GL068891
VETTORETTI AND PELTIER GLACIAL NORTH ATLANTIC SUPER POLYNYAS 3
this simulation, deep water formation is able to penetrate to depths between 1500 and 2000m during winter inthe polynya region while the North Atlantic region to the south remains sea ice covered. During the formation ofthis wintertime super polynya, the lower atmosphere over the North Atlantic is characterized by a stronglyanticyclonic circulation which effects a wind stress mechanical forcing that tends to force sea ice inward towardthe opening. The south to north wind flow over the polynya also provides a transport pathway for ocean sensibleheat release to summit Greenland during the winter season.
The growth of the Northern Hemisphere continental ice sheets lowers sea level by approximately 120m[Peltier and Fairbanks, 2006] thereby creating a stronger barrier to north-south transport at the location ofthe Denmark and Faroe Islands channels. Therefore, the cyclonic motion of the North Atlantic and IrmingerCurrent deposits more sensible heat into the North Atlantic subpolar gyre. Furthermore, under glacialconditions the average global ocean salinity is increased by 1 practical salinity unit (psu) due to freshwateraccumulated primarily in the Laurentide and Fennoscandian ice sheets (Figure 1d). Glacial intermediatewaters are therefore more saline and result in an increase in polar halocline stratification and help to stabilizea strong thermocline temperature inversion. The ocean temperature reaches upward of 4–6°C just below themixed layer and down to 1000m depth just as has been inferred from benthic δ18O records [Dokken et al.,2013]. The ocean heat content (OHC) anomaly spanning a 20 year period across the D-O transition between100 and 3000m is upward of 20GJ/m2 in the polynya region (Figure 1d). McPhee [2003], in calculating theintegrated sensible heat change from 1976 to 1997 in the Weddell Polynya from 150m to 3000m, found itto be approximately 4.6 GJ/m2. Considering that 0.3 GJ/m2 of latent heat energy is required to melt 1m3 ofsea ice, we can assume that this heat reservoir can potentially melt the entire sea ice cover in the glacialNorth Atlantic and do so rapidly. This OHC anomaly is therefore an entirely suitable Available PotentialEnergy (APE) reservoir for the triggering of stadial-interstadial transitions.
3.3. Glacial Polynya Water Mass Structure
The water mass properties of the polynya region in Figure 1c are used to produce March temperature-salinity(T-S) diagrams immediately before (year 3389) and after (year 3392) the D-O warming transition (Figures 2aand 2b). The T-S diagram employs a very simplified three-term equation of state in potential density anomalyreferenced to the surface (σ0), which describes to a very high degree of accuracy the density in the polarhalocline region, namely, σ0 = βS+ α T+ γ T2, where β = 0.8031, α=�0.0554, and γ=�0.0065 (see supportinginformation). The fidelity of the match with an 80-term expansion of the NEOS for σ0 demonstrates excellentagreement [Fofonoff and Millard, 1983]. A T-S diagram of a well-defined polar halocline has the characteristicfeature displayed in Figure 2a with much of the stadial surface and intermediate water masses spanning the28.5σ0 surface. After the transition, a rapid thermohaline convective instability in the entire polynya regionmixes the water mass, thereby destroying the halocline and producing a more uniformly mixed water massas there is a clear intersection of the surface, intermediate, and deeper water masses (Figure 2b).
The vertical profiles of horizontally averaged temperature and salinity before and after the D-O transition(Figure 2c) demonstrate that the average stadial warm pool temperature below the strong near-surfacepycnocline is approximately 1.5°C. The stadial is characterized by both a strong thermocline and strong halo-cline at 100m depth, with the stable salinity profile dominating the stratification at these low temperatures.After the transition the polynya becomes well mixed and almost unstratified from the surface to 2000mdepth (see also supporting information Figure S6). The relative contributions of temperature and salinity tothe densification of the vertical density profile through the transition are quantified by displaying the densitychanges associated with each of the three terms in the approximate NEOS (Figure 2d). The change in salinitythrough the transition event has the tendency to reduce the density in the vertical while the loss of heat tothe atmosphere tends to increase the density of the vertical profile. The temperature dominates the densityincrease from 100 to 1500m while increases in salinity dominate the increases in the mixed layer after thetransition. The cabbeling term indicates that this nonlinear temperature term accounts for 20% of the densityincrease from the base of the mixed layer to 1000m depth on average. It is interesting to note that the poly-nya center of mass (CM) in the top 2200m drops from 1100m before to 1750m after the transition and thatthe average thermosteric drop in sea level in the polynya region is approximately 3m across the transition.
The mixing of water mass through the region of the sharp pycnocline would result in buoyancy loss anddianeutral mixing due to cabbeling. Here we diagnose the approximate increase in density that can potentially
Geophysical Research Letters 10.1002/2016GL068891
VETTORETTI AND PELTIER GLACIAL NORTH ATLANTIC SUPER POLYNYAS 4
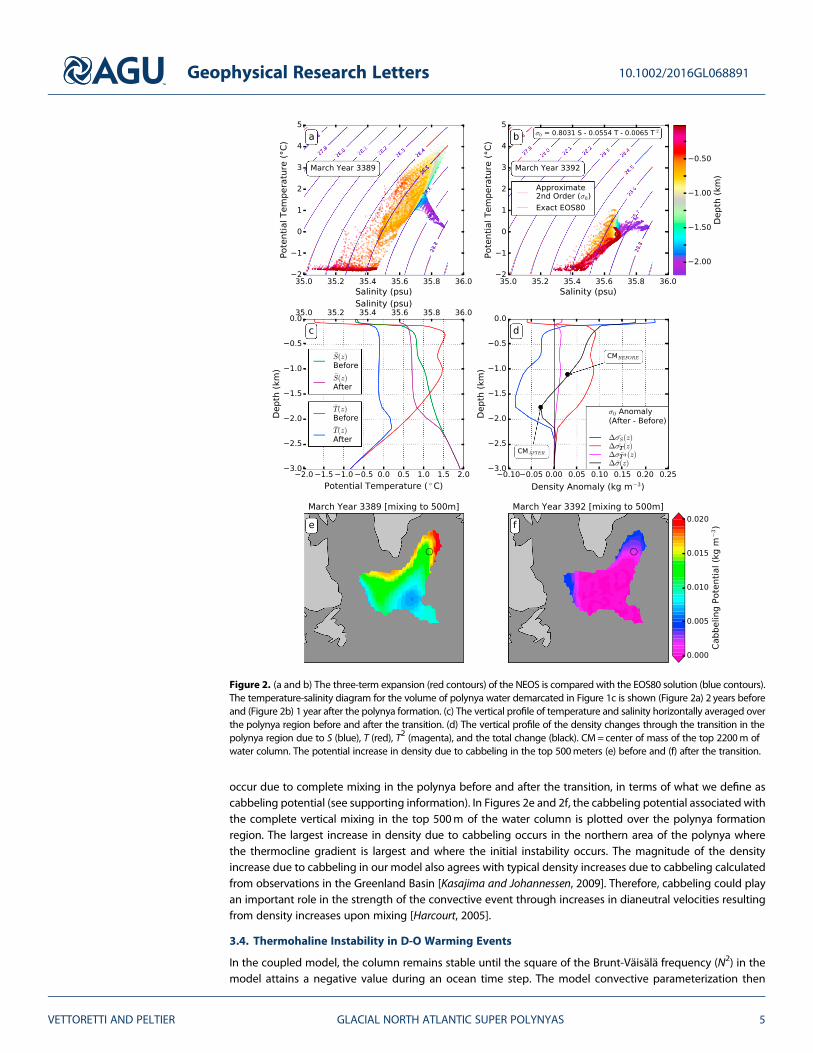
occur due to complete mixing in the polynya before and after the transition, in terms of what we define ascabbeling potential (see supporting information). In Figures 2e and 2f, the cabbeling potential associated withthe complete vertical mixing in the top 500m of the water column is plotted over the polynya formationregion. The largest increase in density due to cabbeling occurs in the northern area of the polynya wherethe thermocline gradient is largest and where the initial instability occurs. The magnitude of the densityincrease due to cabbeling in our model also agrees with typical density increases due to cabbeling calculatedfrom observations in the Greenland Basin [Kasajima and Johannessen, 2009]. Therefore, cabbeling could playan important role in the strength of the convective event through increases in dianeutral velocities resultingfrom density increases upon mixing [Harcourt, 2005].
3.4. Thermohaline Instability in D-O Warming Events
In the coupled model, the column remains stable until the square of the Brunt-Väisälä frequency (N2) in themodel attains a negative value during an ocean time step. The model convective parameterization then
Figure 2. (a and b) The three-term expansion (red contours) of the NEOS is compared with the EOS80 solution (blue contours).The temperature-salinity diagram for the volume of polynya water demarcated in Figure 1c is shown (Figure 2a) 2 years beforeand (Figure 2b) 1 year after the polynya formation. (c) The vertical profile of temperature and salinity horizontally averaged overthe polynya region before and after the transition. (d) The vertical profile of the density changes through the transition in thepolynya region due to S (blue), T (red), T2 (magenta), and the total change (black). CM= center of mass of the top 2200m ofwater column. The potential increase in density due to cabbeling in the top 500meters (e) before and (f) after the transition.
Geophysical Research Letters 10.1002/2016GL068891
VETTORETTI AND PELTIER GLACIAL NORTH ATLANTIC SUPER POLYNYAS 5
increases the vertical turbulent diffusivities for heat and salt to very high values to remove the static instabil-ity [Smith et al., 2010]. As this relatively coarse resolution model does not solve an explicit equation for verticalmomentum, but rather employs the hydrostatic approximation, we are unable to describe the precise natureof this instability. Our intention in continuing work is to employ a nested nonhydrostatic model configurationto explicitly resolve the details of the mixing process.
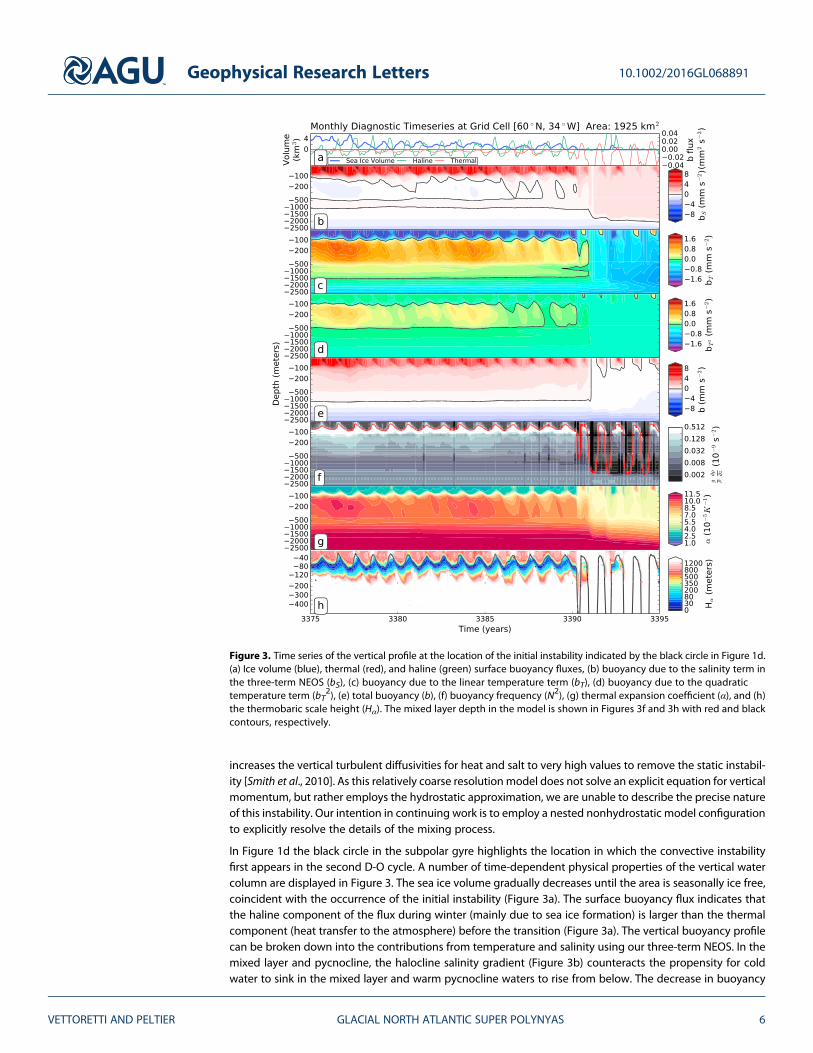
In Figure 1d the black circle in the subpolar gyre highlights the location in which the convective instabilityfirst appears in the second D-O cycle. A number of time-dependent physical properties of the vertical watercolumn are displayed in Figure 3. The sea ice volume gradually decreases until the area is seasonally ice free,coincident with the occurrence of the initial instability (Figure 3a). The surface buoyancy flux indicates thatthe haline component of the flux during winter (mainly due to sea ice formation) is larger than the thermalcomponent (heat transfer to the atmosphere) before the transition (Figure 3a). The vertical buoyancy profilecan be broken down into the contributions from temperature and salinity using our three-term NEOS. In themixed layer and pycnocline, the halocline salinity gradient (Figure 3b) counteracts the propensity for coldwater to sink in the mixed layer and warm pycnocline waters to rise from below. The decrease in buoyancy
Figure 3. Time series of the vertical profile at the location of the initial instability indicated by the black circle in Figure 1d.(a) Ice volume (blue), thermal (red), and haline (green) surface buoyancy fluxes, (b) buoyancy due to the salinity term inthe three-term NEOS (bS), (c) buoyancy due to the linear temperature term (bT), (d) buoyancy due to the quadratictemperature term (bT
2), (e) total buoyancy (b), (f) buoyancy frequency (N2), (g) thermal expansion coefficient (α), and (h)the thermobaric scale height (Hα). The mixed layer depth in the model is shown in Figures 3f and 3h with red and blackcontours, respectively.
Geophysical Research Letters 10.1002/2016GL068891
VETTORETTI AND PELTIER GLACIAL NORTH ATLANTIC SUPER POLYNYAS 6
in the winter mixed layer is associated with the gradual increase in salinity (Figure 3b). This is in spite of themelting of overlying sea ice from Figure 3a which acts to freshen the surface and increase buoyancy. Thereare of course horizontal transports of sea ice into and out of the area and salinity transports into the mixedlayer both horizontally and from below. Overall, the balance is in favor of increasing mixed layer salinity.The buoyancy associated with both the linear and quadratic temperature terms in the NEOS (Figures 3cand 3d) is approximately 30% smaller in the mixed layer until the salinity increases to a critical value wherethe total buoyancy goes negative at the transition (Figure 3e).
The decrease in buoyancy in the subsurface warm pool (but not in the mixed layer) as the transition isapproached is somewhat suggestive of the vertical diffusion of heat into the mixed layer and conversionof this heat into the latent heat required to melt sea ice (i.e., the mixed layer temperature is maintainedat the freezing point as the sea ice decreases). The horizontally uniform model κ in the upper ocean(0.1 cm2/s) is an order of magnitude greater than the turbulent κ observed in the modern Arctic Oceanpolar halocline [Zhang and Steele, 2007; Nguyen et al., 2009]. Also, the diffusive convection parameteriza-tion employed in the model is active in the sea ice-covered regions of this simulation in the base of themixed layer. The parameterization adds to the prespecified column diapycnal diffusivity according to a
criterion dependent upon a measure of the stability ratio, Rρ ¼ α ∂T∂z =β
∂S∂z
� �in the diffusive convection
regime such that 0< Rρ< 1 and therefore acts to enhance the turbulent κ in this region (see supportinginformation Figures S7 and S8). These factors are likely important in the model simulation of polarhaloclines and could play a role in the behavior of the D-O cycle.
The influence of the convective adjustment scheme in the model is best appreciated by plotting the modelbuoyancy frequency (N2) on a logarithmic scale along with the mixed layer depth (Figure 3f). The highestvalues of N2 at depths between 50 and 150m are most stable to perturbation and are thus most stablystratified, preventing the release of subsurface heat to the atmosphere. This region is thinner in winter thanin summer and is only penetrated by the mixed layer during the winter season right at the D-O warmingtransition. We conclude that the salinification of the winter mixed layer reaches a critical point as the surfaceocean transitions to a state of nonperennial sea ice, which subsequently destabilizes the water column andinitiates the formation of the glacial super polynya.
It has been hypothesized that thermobaric instability might be an important mechanism in the onset of deepwater formation in the Greenland and Weddell Seas [Akitomo, 1999a, 1999b;McPhee, 2003; Akitomo, 2011]. Aunique feature of this glacial stadial polar halocline is the rapid increase in the thermal expansion coefficientwith depth (α(z)) in this region of the North Atlantic. In fact, α increases by a factor of 3 as we transitionthrough the pycnocline at 100m depth (Figure 3g). In this region, the potential temperature and salinity thendecrease from approximately 200 to 500m, below a maximum which exists beneath the base of the mixedlayer (see supporting information Figure S8). Scaling analysis has been used to investigate the propensityfor thermobaric convection in polar regions using ameasure of the vertical gradient of the thermal expansioncoefficient [e.g., Garwood et al., 1994; Akitomo, 1999a].
The increase in the density in sinking water with depth due to the thermobaric effect needs to exceed thebackground density gradient below the mixed layer in order for instability to occur. Our analyses (not shown)indicate that the mean conditions in this region are highly susceptible to thermobaric “plume” convection,referred to as Type-II convection [e.g., see Akitomo, 2011]. The thermobaric scale height (Hα= α(z)/∂α/∂z) cal-culated at each model level is shown in Figure 3h. The surface value in this region has a scale height of 900mand is typical of the value used in the previous scaling analyses. This scale height can be used to describe theloss in buoyancy of a cold parcel of seawater which is displaced vertically to a depth where the surroundingwarmer water has potential temperature (δθ). This loss of buoyancy influences the tendency of this parcel toreturn to its equilibrium position or to become vertically unstable. The loss of buoyancy or the reduction in N2
can be expressed as δbδz ¼ N2 � g a zð Þ
Hαδθ [see Garwood et al., 1994; Vallis, 2006; Nycander et al., 2015]. Many of
the previous analyses do not consider the strong change in the vertical gradient of α near the base of themixed layer in the polar halocline. This strong gradient implies that fluid parcels that are perturbed in the ver-tical, possibly associated with strong brine rejection during sea ice formation, would be highly susceptible tobuoyancy loss near 100m, a region where the stratification is most stable (Figure 3f). The influence of thethermobaric effect on the stability of the water column and instability associated with diffusive convectionwill be addressed in more detail elsewhere.
Geophysical Research Letters 10.1002/2016GL068891
VETTORETTI AND PELTIER GLACIAL NORTH ATLANTIC SUPER POLYNYAS 7
4. Conclusions
In this analysis we have presented a novel simulation demonstrating the role of the appearance of glacialsuper polynyas in the North Atlantic at the onset of D-O warming events. It is through the action of a thermo-haline convective instability that occurs beneath the stadial North Atlantic sea ice lid that transition into theinterstadial phase of the D-O oscillation is initiated. Once the polynya is opened by thermohaline convectiveinstability, the large reservoir of sensible heat that is recharged during the stadial phase of the D-O cycle isreleased to the atmosphere and subsequently transported to summit Greenland and elsewhere. AlthoughNADW production begins immediately with the onset of the thermohaline convective instability, the fullinterstadial AMOC strength is delayed by a few decades. These initial atmospheric temperature anomaliesobserved at summit Greenland are reinforced by the full reactivation of the AMOC. The increasing trend inthe salinification of the winter mixed layer and the erosion of sea ice cover in the polar halocline due toupward turbulent diffusion of heat from below the mixed layer may be important mechanisms that triggerthe D-O warming instability in this model. The surface salinity changes dominate the vertical buoyancy profileas a result of the first-order salinity contribution to the NEOS in this cold polar ocean environment. The use ofa NEOS for seawater may prove to be a critical component for understanding the detailed nature of thethermohaline instability process that is synchronous with rapid D-O warming events.
ReferencesAdkins, J. F. (2013), The role of deep ocean circulation in setting glacial climates, Paleoceanography, 28, 539–561, doi:10.1002/palo.20046.Adkins, J. F., A. P. Ingersoll, and C. Pasquero (2005), Rapid climate change and conditional instability of the glacial deep ocean from the
thermobaric effect and geothermal heating, Quat. Sci. Rev., 24(5), 581–594.Akitomo, K. (1999a), Open-ocean deep convection due to thermobaricity: 1. Scaling argument, J. Geophys. Res., 104, 5225–5234, doi:10.1029/
1998JC900058.Akitomo, K. (1999b), Open-ocean deep convection due to thermobaricity: 2. Numerical experiments, J. Geophys. Res., 104, 5235–5249,
doi:10.1029/1998JC900062.Akitomo, K. (2011), Two types of thermobaric deep convection possible in the Greenland Sea, J. Geophys. Res., 116, C08012, doi:10.1029/
2010JC006635.Argus, D. F., W. R. Peltier, R. Drummond, and S. Moore (2014), The Antarctic component of glacial isostatic adjustment model ICE-6G_C
(VM5a) based upon GPS measurements of vertical motion of the crust, exposure age dating of ice thickness variations and relative sealevel histories, Geophys J. Int, 198(1), 537–563.
Baines, P. G., and A. E. Gill (1969), On thermohaline convection with linear gradients, J. Fluid Mech., 37(02), 289–306.Bond, G., et al. (1992), Evidence for massive discharges of icebergs into the North Atlantic Ocean during the last glacial period, Nature, 360,
245–249.Bond, G., W. Showers, M. Cheseby, R. Lotti, P. Almasi, P. Priore, H. Cullen, I. Hajdas, and G. Bonani (1997), A pervasive millennial-scale cycle in
North Atlantic Holocene and glacial climates, Science, 278(5341), 1257–1266.Broecker, W. S., G. Bond, M. Klas, G. Bonani, and W. Wolfli (1990), A salt oscillator in the glacial Atlantic? 1. The concept, Paleoceanography, 5,
469–477, doi:10.1029/PA005i004p00469.Carsey, F. D. (1980), Microwave observation of the Weddell Polynya, Mon. Weather Rev., 108(12), 2032–2044.Cheon, W. G., S.-K. Lee, A. L. Gordon, Y. Liu, C.-B. Cho, and J. J. Park (2015), Replicating the 1970s’Weddell Polynya using a coupled ocean-sea
ice model with reanalysis surface flux fields, Geophys. Res. Lett., 42, 5411–5418, doi:10.1002/2015GL064364.Dansgaard, W., et al. (1993), Evidence for general instability of past climate from a 250-kyr ice-core record, Nature, 364(6434), 218–220.Dokken, T. M., K. H. Nisancioglu, C. Li, D. S. Battisti, and C. Kissel (2013), Dansgaard-Oeschger cycles: Interactions between ocean and sea ice
intrinsic to the Nordic seas, Paleoceanography, 28, 491–502, doi:10.1002/palo.20042.Fofonoff, N. P., and Millard Jr, R. C. (1983), Algorithms for computation of fundamental properties of seawater, Endorsed by Unesco/SCOR/
ICES/IAPSO Joint Panel on Oceanographic Tables and Standards and SCOR Working Group 51. Unesco Tech. Pap. in Mar. Sci., No. 44.Foster, T. D. (1972), An analysis of the cabbeling instability in sea water, J. Phys. Oceanogr., 2(3), 294–301.Garwood, R. W., S. M. Isakari, and P. C. Gallacher (1994), Thermobaric convection, in The Polar Oceans and Their Role in Shaping the Global
Environment, edited by O. M. Johannessen, R. D. Muench, and J. E. Overland, pp. 199–209, AGU, Washington, D. C.Gent, P. R., et al. (2011), The community climate system model version 4, J. Clim., 24(19), 4973–4991.Gill, A. E. (1973), Circulation and bottom water production in the Weddell Sea, Deep Sea Res. Oceanogr. Abstr., 20, 111–140.Gordon, A. L. (1982), Weddell deep water variability, J. Mar. Res., 40(suppl), 199–217.Harcourt, R. R. (2005), Thermobaric cabbeling over Maud Rise: Theory and large eddy simulation, Prog. Oceanogr., 67(1), 186–244.Huber, C., M. Leuenberger, R. Spahni, J. Flückiger, J. Schwander, T. F. Stocker, JohnsenS. , A. Landais, and J. Jouzel (2006), Isotope calibrated
Greenland temperature record over Marine Isotope Stage 3 and its relation to CH 4, Earth Planet. Sci. Lett., 243(3), 504–519.Jayne, S. R. (2009), The impact of abyssal mixing parameterizations in an ocean general circulation model, J. Phys. Oceanogr., 39(7), 1756–1775.Kasajima, Y., and T. Johannessen (2009), Role of cabbeling in water densification in the Greenland Basin, Ocean Sci., 5(3), 247–257.Kjellsson, J., P. R. Holland, G. J. Marshall, P. Mathiot, Y. Aksenov, A. C. Coward, S. Bacon, A. P. Megann, and J. Ridley (2015), Model sensitivity of
the Weddell and Ross seas, Antarctica, to vertical mixing and freshwater forcing, Ocean Model., 94, 141–152.Large, W. G., J. C. McWilliams, and S. C. Doney (1994), Oceanic vertical mixing: A review and a model with a nonlocal boundary layer
parameterization, Rev. Geophys., 32, 363–403, doi:10.1029/94RG01872.Li, C., D. S. Battisti, and C. M. Bitz (2010), Can North Atlantic sea ice anomalies account for Dansgaard-Oeschger climate signals?*, J. Clim.,
23(20), 5457–5475.Losch, M., S. Herlufsen, and R. Timmermann (2006), Effects of heterogeneous surface boundary conditions on parameterized oceanic deep
convection, Ocean model., 13(2), 156–165.
Geophysical Research Letters 10.1002/2016GL068891
VETTORETTI AND PELTIER GLACIAL NORTH ATLANTIC SUPER POLYNYAS 8
AcknowledgmentsThe research has relied upon computa-tional resources provided by the SciNetfacility for high-performance computa-tion of the University of Torontothrough the Compute Canada resourceallocation process. SciNet is a compo-nent of the Compute Canada HPC plat-form. The research of WRP at Toronto issupported by NSERC Discovery GrantA9627. Data employed in the produc-tion of this manuscript and supportinginformation can be provided uponrequest by contacting Guido Vettoretti;email [email protected].
Maqueda Morales, M. A., A. J. Willmott, and N. R. Biggs (2004), Polynya dynamics: A review of observations and modeling, Rev. Geophys., 42,RG1004, doi:10.1029/2002RG000116.
Martinson, D. G., P. D. Killworth, and A. L. Gordon (1981), A convective model for the Weddell Polynya, J. Phys. Oceanogr., 11(4), 466–488.McDougall, T. J. (1984), The relative roles of diapycnal and isopycnal mixing on subsurface water mass conversion, J. Phys. Oceanogr., 14(10),
1577–1589.McDougall, T. J. (1987), Thermobaricity, cabbeling, and water-mass conversion, J. Geophys. Res., 92, 5448–5464, doi:10.1029/
JC092iC05p05448.McPhee, M. G. (2003), Is thermobaricity a major factor in Southern Ocean ventilation?, Antarct. Sci., 15(01), 153–160.Munk, W. H. (1966), Abyssal recipes, Deep Sea Res. Oceanogr. Abstr., 13, 707–730.Nguyen, A. T., D. Menemenlis, and R. Kwok (2009), Improved modeling of the Arctic halocline with a subgrid-scale brine rejection parame-
terization, J. Geophys. Res., 114, C11014, doi:10.1029/2008JC005121.Nycander, J., M. Hieronymus, and F. Roquet (2015), The nonlinear equation of state of sea water and the global water mass distribution,
Geophys. Res. Lett., 42, 7714–7721, doi:10.1002/2015GL065525.Peltier, W. R., D. F. Argus, and R. Drummond (2015), Space geodesy constrains ice age terminal deglaciation: The global ICE-6G_C (VM5a)
model, J. Geophys. Res. Solid Earth, 120, 450–487, doi:10.1002/2014JB011176.Peltier, W. R., and R. G. Fairbanks (2006), Global glacial ice volume and Last Glacial Maximum duration from an extended Barbados sea level
record, Quat. Sci. Rev., 25(23), 3322–3337.Peltier, W. R., and G. Vettoretti (2014), Dansgaard-Oeschger oscillations predicted in a comprehensive model of glacial climate: A “kicked” salt
oscillator in the Atlantic, Geophys. Res. Lett., 41, 7306–7313, doi:10.1002/2014GL061413.Rasmussen, T. L., and E. Thomsen (2004), The role of the North Atlantic Drift in the millennial timescale glacial climate fluctuations,
Palaeogeogr. Palaeoclimatol. Palaeoecol., 210(1), 101–116.Rasmussen, T. L., E. Thomsen, L. Labeyrie, and T. C. vanWeering (1996a), Circulation changes in the Faeroe-Shetland Channel correlating with
cold events during the last glacial period (58–10 ka), Geology, 24(10), 937–940.Rasmussen, T. L., E. Thomsen, T. C. Weering, and L. Labeyrie (1996b), Rapid changes in surface and deep water conditions at the Faeroe
Margin during the last 58,000 years, Paleoceanography, 11, 757–771, doi:10.1029/96PA02618.Roquet, F., G. Madec, L. Brodeau, and J. Nycander (2015), Defining a simplified yet realistic equation of state for seawater, J. Phys. Oceanogr.,
45(10), 2564–2579.Sakai, K., and W. R. Peltier (1997), Dansgaard-Oeschger oscillations in a coupled atmosphere-ocean climate model, J. Clim., 10(5), 949–970.Sakai, K., and W. R. Peltier (1999), A dynamical systems model of the Dansgaard-Oeschger oscillation and the origin of the Bond cycle, J. Clim.,
12(8), 2238–2255.Schanze, J. J., and R. W. Schmitt (2013), Estimates of cabbeling in the global ocean, J. Phys. Oceanogr., 43(4), 698–705.Singh, H. A., D. S. Battisti, and C. M. Bitz (2014), A heuristic model of Dansgaard–Oeschger cycles. Part I: Description, results, and sensitivity
studies, J. Clim., 27(12), 4337–4358.Smith, R., et al. (2010), The Parallel Ocean Program (POP) reference manual ocean component of the Community Climate System Model
(CCSM) and Community Earth System Model (CESM), Rep. LAUR-01853, 141.Timmermann, R., and A. Beckmann (2004), Parameterization of vertical mixing in the Weddell Sea, Ocean Model., 6(1), 83–100.Vallis, G. K. (2006), Atmospheric and Oceanic Fluid Dynamics: Fundamentals and Large-Scale Circulation, 745 pp., Cambridge Univ. Press,
Cambridge, U. K.Vettoretti, G., andW. R. Peltier (2013), Last Glacial Maximum ice sheet impacts on North Atlantic climate variability: The importance of the sea
ice lid, Geophys. Res. Lett., 40, 6378–6383, doi:10.1002/2013GL058486.Vettoretti, G., andW. R. Peltier (2015), Interhemispheric air temperature phase relationships in the nonlinear Dansgaard-Oeschger oscillation,
Geophys. Res. Lett., 42, 1180–1189, doi:10.1002/2014GL062898.Zhang, J., and M. Steele (2007), Effect of vertical mixing on the Atlantic Water layer circulation in the Arctic Ocean, J. Geophys. Res., 112,
C04S04, doi:10.1029/2006JC003732.
Geophysical Research Letters 10.1002/2016GL068891
VETTORETTI AND PELTIER GLACIAL NORTH ATLANTIC SUPER POLYNYAS 9


![Celda Peltier [027690]](https://img.pdfslide.us/doc/110x75/577cd74d1a28ab9e789ea0f8/celda-peltier-027690.jpg)


