Embed Size (px)
Citation preview
Max Planck Institut für Kolloid‐ und Grenzflächenforschung Abteilung für Grenzflachen
Thermodynamics, kinetics and rheology of surfactant adsorption layers at water/oil interfaces
Dissertation zur Erlangung des akademischen Grades
"doctor rerum naturalium" (Dr. rer. nat.)
in der Wissenschaftsdisziplin "Kolloidchemie"
eingereicht an der Mathematisch‐Naturwissenschaftlichen Fakultät
der Universität Potsdam
von Nenad Mucic
Potsdam, den 24. September 2012

III
ABSTRACT
This thesis presents a quantitative analysis of surfactant’s or macromolecule’s adsorption layers at the
water/oil interface in respect to their equilibrium and dynamic states. The molecules in water/oil
adsorption layer interact with each other and with the oil molecules via electrostatic and van der Waals
interactions, respectively. Therewith, the thermodynamic and dynamic properties of the adsorption layer
directly depend on the physical characteristics of the molecules, i.e. the length of the surfactants’ tails
and the oil chain length. The longer the surfactant tail is, the stronger is the mutual interaction between
the surfactant molecules in the adsorption layer and the more are the oil molecules will be squeezed out
from the adsorption layer. On the other side, if the oil molecules possess longer chains, they will bind
stronger to the surfactant’s tail and resist against the squeezing out from the adsorption layer.
When some other molecules or impurities are dissolved in a surfactant aqueous solution, they might
transfer to the oil phase depending on their hydrophobicity. Due to this process the impurities do not
leave any additional effects on the equilibrium and dynamic interfacial tension properties of the adsorbed
prime surfactant. On the contrary, at the water/air interface the impurities leave significant effects on the
solution’s surface tension, form a mixed adsorption layer, and can even dominate it.
The interaction between surfactant and oil molecules can be investigated at the water/oil vapor interface
too. The surfactant molecules, once adsorb, attract the oil molecules from the vapor phase through
hydrophobic interaction. In addition, the surfactant molecules at the interface change their orientation at
different surface concentrations which influences the amount of adsorbed oil molecules.
Investigating the dilational rheology of surfactants at the water/oil interface it was found that additional
processes follow the adsorption/desorption of the surfactant molecules. During interfacial perturbation,
the adsorbed surfactants are effected by the attractive forces of the hydrophobic oil molecules. On the
other hand, desorption of surfactant molecules from the water/oil interface can be decelerated by the
same attractive hydrophobic interaction with the oil molecules.
This work also considers the interfacial properties of pure macromolecules and their mixtures with
surfactants at the water/hexane interface. It is dedicated to the investion of the equilibrium and dynamic
behavior of non‐ionic triblock copolymers, Pluronics, when varying the number of poly(ethylene oxide)
and poly(propylene oxide) groups. By comparing the experimental results with the respective theoretical
model for protein solutions, it was found that the best fit is achieved when a multilayer adsorption is
considered.
A part of this work is also devoted to mixtures of the cationic polyelectrolyte PAH and the anionic
surfactant SDS and describes their interfacial tension and dilational rheology. The formation of PAH/SDS
complexes governs the dilational elasticity values, depending on the concentrations of surfactant and
polyelectrolyte and their mixing ratio. It was found that with increasing the surfactant concentration the
SDS dominates in the adsorption layer whereas the polyelectrolyte‐surfactant complexes remain in the
bulk phase.
The experiments were generally performed on the Profile Analysis Tensiometer, PAT‐1, or the Capillary Pressure Tensiometer, ODBA, or the combination of the two instruments when required. A systematic analysis was performed to show the optimum experimental conditions for studies of the adsorption dynamics and dilational visco‐elasticity of surfactant interfacial layer. The received experimental results were analyzed by fitting with the respective theoretical models. In this way the interfacial properties of the adsorptions layers have been quantified.

V
LIST OF PAPERS AND MY CONTRIBUTIONS
I. Effects of dodecanol on the adsorption kinetics of SDS at the water/hexane interface A. Javadi, N. Mucic (40%), D. Vollhardt, V.B. Fainerman and R. Miller Journal of Colloid and Interface Science 351 (2010) 537‐541.
II. Adsorption of alkyl trimethylammonium bromides at the water/air and water/hexane interface V. Pradines, V.B. Fainerman, E.V. Aksenenko, J. Krägel, N. Mucic (30%) and R. Miller Colloids and Surfaces A 371 (2010) 22‐28
III. Adsorption layer properties of alkyl trimethylammonium bromides at interfaces between water and different alkanes N. Mucic (70%), N.M. Kovalchuk, V.B. Fainerman, E.V. Aksenenko and R. Miller to be submitted
IV. Mixed adsorption layers at the aqueous CnTAB solution / hexane vapor interface N. Mucic (70%), N. Moradi, A. Javadi, E.V. Aksenenko, V.B. Fainerman and R. Miller to be submitted
V. Dynamics of interfacial layers – Experimental feasibilities of adsorption kinetics and dilational rheology N. Mucic (70%), A. Javadi, N.M. Kovalchuk, E.V. Aksenenko and R. Miller Advances in Colloid and Interface Science 168 (2010) 167‐178.
VI. Fast dynamic interfacial tension measurements and dilational rheology of interfacial layers by using the capillary pressure technique A. Javadi, J. Krägel, A.V. Makievski, N.M. Kovalchuk, V.I. Kovalchuk, N. Mucic (10%), G. Loglio, P. Pandolfini, M. Karbaschi and R. Miller Colloids and Surfaces A, 407 (2012) 159‐168
VII. Dynamic properties of CnTAB adsorption layers at the water/oil interface N. Mucic (70%), N.M. Kovalchuk, V. Pradines, A. Javadi, E.V. Aksenenko, J. Krägel and R. Miller Colloids and Surfaces A, submitted 2012
VIII. Dynamic interfacial tension of triblock copolymers solutions at the water/hexane interface P. Ramirez, J. Munoz, V.B. Fainerman, E.V. Aksenenko, N. Mucic (10%) and R. Miller Colloids and Surfaces A 391 (2011) 119‐124
IX. Dilational rheology of polymer/surfactant mixtures at water/hexane interface A. Sharipova, S. Aidarova, N. Mucic (20%) and R. Miller Colloids and Surfaces A 391 (2011) 130‐134
X. Competitive adsorption at water/oil interface as a tool for controlling the emulsion stability and breaking (Beiersdorf project report, 2012) N. Mucic (70%), B. Reetz and R. Miller

VII
LIST OF PUBLICATIONS NOT INCLUDED IN THIS THESIS
I. Interrelation between surfactant adsorption kinetics, interfacial rheology and emulsion stability T. Sobisch, N. Mucic, J. Krägel, A.V. Makievski, R. Miller and D. Lerche Proceedings of the 5th World’s Emulsion Congress, 2010, Lyon, No. 0065, 1‐7
II. Capillary pressure studies of adsorption layers at water/hydrocarbon Interfaces R. Miller, A. Javadi, N. Mucic, N. Moradi, M. Born, J. Krägel, G. Loglio, P. Pandolfini, A.V. Makievski, M.E. Leser, L. Liggieri, F. Ravera, Ch. Eigenbrod, S. Mawn and V.I. Kovalchuk Proceedings of the 5th World’s Emulsion Congress, 2010, Lyon, No. 0232, 1‐6
III. Adsorption characteristics of ionic surfactants at water/hexane Interface N. Mucic, V. Pradines, A. Javadi, A. Sharipova, J. Krägel, M.E. Leser, E.V. Aksenenko, V.B. Fainerman and R. Miller Proceedings of the 5th World’s Emulsion Congress, 2010, Lyon, No. 0233, 1‐4
IV. Rheology of interfacial layers R. Miller, J.K. Ferri, A. Javadi, J. Krägel, N. Mucic and R. Wüstneck Colloid and Polymer Science 288 (2010) 937‐950
V. Adsorption kinetics of surfactants, in “Encyclopedia of Colloid and Interface Science” Th. Tadros (Ed.) N. Mucic, A. Javadi, M. Karbaschi, A. Sharipova, V.B. Fainerman, E.V. Aksenenko, N.M. Kovalchuk and R. Miller Springer, Germany (submitted 2012)
VI. Experimental methods for interfacial dynamics, in “Encyclopedia of Colloid and Interface Science” Th. Tadros (Ed.) A. Javadi, N. Mucic, M. Karbaschi, J.Y. Won, V.B. Fainerman, A. Sharipova, E.V. Aksenenko, V.I. Kovalchuk, N.M. Kovalchuk, J. Krägel and R. Miller Springer, Germany (submitted 2012)
VII. Surfactant adsorption layers at liquid interfaces, in “Surfactant Science and Technology: Retrospects and Prospects” R. Miller, V.B. Fainerman, V. Pradines, V.I. Kovalchuk, N.M. Kovalchuk, E.V. Aksenenko, L. Liggieri, F. Ravera, G. Loglio, A. Sharipova, Y. Vysotsky, D. Vollhardt, N. Mucic, R. Wüstneck, J. Krägel and A. Javadi CRC Press/Taylor &Francis (submitted 2012)
VIII. Adsorption characteristics of ionic surfactants at water/hexane interface obtained by PAT and ODBA N. Mucic, V. Pradines, A. Javadi, A. Sharipova, J. Krägel, M.E. Leser, E.V. Aksenenko, V.B. Fainerman and R. Miller Proceedings of the 5th World’s Emulsion Congress, Lyon, 2010.

IX
Table of Contents
ABSTRACT………………………………………………………………………………………………………………………. I
LIST OF PAPERS AND MY CONTRIBUTIONS…………………………………………………………… III
LIST OF PUBLICATIONS NOT INCLUDED IN THIS THESIS……………………………………… VII
TABLE OF CONTENTS…………………………………………………………………………………………………… IX
1 INTRODUCTION………………………………………………………………………………………………… 1
1.1 Background…………………………………………………………………………………………………………… 2
1.2 Emulsions……………………………………………………………………………………………………………… 4
1.3 Adsorption layers…………………………………………………………………………….…………………… 5
2 THEORY………………………………………………………………………………………………………………. 7
2.1 Chemistry of surfactants and polymers………………………………………………………………… 7
2.1.1 Surface properties of surfactants and polymers…………………………………………. 7
2.1.2 Bulk properties of surfactants and polymers………………………………………………. 8
2.2 The Gibbs dividing surface and adsorption…………………………………………………………… 10
2.3 Surface and interfacial tension……………………………………………………………………………… 11
2.4 Thermodynamic adsorption models……………………………………………………………………… 12
2.4.1 Langmuir adsorption model……………………………………………………………………….. 12
2.4.2 Frumkin adsorption model…………………………………………………………………………. 13
2.4.3 Reorientation model………………………………………………………………………………….. 13
2.5 Dynamic adsorption models…………………………………………………………………………………. 13
2.5.1 Ward and Tordai equation…………………………………………………………………………. 13
2.5.2 Lucassen and van den Temple model…………………………………………………………. 14
3 EXPERIMENTAL SECTION………………………………………………………………………………… 15
3.1 Materials………………………………………………………………………………………………………………. 15
3.1.1 Surfactants………………………………………………………………………………………………... 15
3.1.2 Macromolecules………………………………………………………………………………………… 15
3.1.3 Oil phase……………………………………………………………………………………………………. 15
3.2 Methods……………………………………………………………………………………………………………….. 16
3.2.1 Capillary Pressure Tensiometry………………………………………………………………….. 16
3.2.2 Profile Analysis Tensiometry (PAT)……………………………………………………………… 17
4 RESULTS AND DISCUSSION………………………………………………………………............... 20
4.1 Thermodynamics of surfactant adsorption layers………………………………………………… 20
4.2 Kinetics and rheology of surfactant adsorption layers…………………………………………. 21
5 CONCLUSIONS…………………………………………………………………………………………………… 24
ACKNOWLEDGEMENT…………………………………………………………………………………………………. 27
REFERENCES………………………………………………………………………………………………………………….. 28

CHAPTER 1
Introduction
‐ 1 ‐
This thesis is dedicated to discover the physicochemical properties of surfactant adsorption layers at water/oil interfaces. Surfactants are omnipresent in our modern world and are applied in almost any field of our daily life. They are used to modify the properties of interfaces in a defined way such that products are easier or better produced or more stable over the products’ lifetime. Most investigations on the interfacial properties of surfactant adsorption layers have been performed at the water/air interface. The reason for this is mainly the easier approach of this interface by experimental methods or theoretical models. The much more important interface is that between two liquids, mainly the interface between water and oil. A large number of application fields require a tailored system of surfactants with adequate characteristics in order to produce respective products with well defined properties and required stability. Examples are the emulsification of oils in water or vice versa of two immiscible liquids. Although emulsions exist for a long time, many new challenges appear, as products in food or pharmacy for instance have to be reformulated due to a required replacement of compounds by other more healthy ones. Therefore quantitative knowledge of surfactant adsorption layers at the water/oil interface appears to be much more important. Many experimental methods, however, are easily applied to water/gas interfaces but cannot be used for investigations of water/oil interfaces. The reason can be quite manifold. For example, optical methods, such as Brewster Angle Microscopy (BAM), interfacial ellipsometry or Second Harmonic Generation (SHG), often fail due to the small difference in the refractive index of the two fluids, and the probing beam has to travel at least through one fluid. Obstacles for other methods can be the smaller difference in the density. In particular for dynamic methods, the hydrodynamics of the involved fluid can have strong influences on the quality of experiments and set much stronger limitations for the applicability of certain experimental tools. The much higher complexity of the water/oil system as compared to water/air systems is also given by the fact that non‐ionic surfactants are soluble in both liquid phases. Moreover, the interaction of the hydrophobic parts of an adsorbed surfactant with the oil molecules can be quite significant while it is more or less negligible for the interaction with air. In summary we have to state that studies on a quantitative characterization of surfactants at water/oil interfaces are much more demanding than equivalent investigations at the water/air interface. Therefore, systematic studies are scarce. Due to the above mentioned facts, clear conclusions about the quantitative behavior of surfactants at water/oil interfaces require investigations with quite a number of complementary methods. In addition the analysis of the resulting data is possible only with much more sophisticated theoretical models taking into account the peculiarities of the studied interface. The presented results in the thesis were obtained from pure fundamental investigations. Therefore, any parts in the following text on practical applications are just examples of a possible utilization of the fundamental results in industry. Molecular interactions are more complex at water/oil than at water/air interfaces. In such systems there are not only interactions between the adsorbed surfactant molecules but also with the oil molecules. These surfactant‐oil interactions are the subject of this thesis. For the sake of simplicity we have investigated just single surfactant adsorption layers. The interactions between oil molecules and surfactants have impact on the area per surfactant molecule in an adsorption layer. Practically, the area per surfactant molecule is obtained after analyzing the experimental results with respective theoretical models. Therewith a thorough analysis of most recent theoretical models is also part of the investigations presented in this thesis. Each of the thermodynamic, kinetic and rheological results can be described by particular theoretical models which in the end help to create a physical picture of surfactant adsorption layers on a molecular level. To achieve relationships between all three theoretical models – thermodynamics, adsorption kinetics and dilational visco‐elasticity ‐ is
Introduction
‐ 2 ‐
much more complex at the water/oil interface by involving more physical effects and program parameters as compared to the water/air interface. Beside at the water/oil interface, the interactions between surfactants and oil molecules can be investigated at the water/oil vapor interface too. Measuring the CnTAB adsorption kinetics before and after injection of the oil vapor into the gas phase leads us to additional information about the influence of the different surfactants’ alkyl chain lengths on the decrease of interfacial tension during the oil co‐adsorption from the vapor phase. We have tackled the problems of natural impurities in aqueous surfactant solutions and investigated their influence on the surfactant adsorption layers at water/oil interfaces. It was found that in our system impurities have strong effects at the water/air interface, while at water/oil interfaces, due to the oil solubility, the impurities transfer from the aqueous into the oil phase without affecting the surfactant adsorption layer properties remarkably. In addition to the adsorption thermodynamics, the thesis is particularly devoted to investigation of the dynamic properties in the adsorption layer. The subjects of this study are surfactants, polymers and their mixtures. The dynamics in the adsorption layers was studied by measuring the dynamic interfacial tension and dilational rheology. Here it will be shown that the adsorption dynamics of triblock copolymers (Pluronic) can be theoretically well described by a model based on the analysis of the chemical potentials of the solvent and the dissolved substances, for physically reasonable values of the adsorption layer thickness and diffusion coefficient. When mixing a polyelectrolyte with a surfactant, two‐dimensional rigid structures can be observed at the water/oil interface and they can be destroyed when the surfactant concentration is raised above a certain concentration. By analyzing the dilational rheology results it was found that polyelectrolyte‐surfactant mixed adsorption layers have a higher dilational elasticity and viscosity than layers formed by surfactants alone. We have reported also new aspects of the optimization of experimental tools for investigations of the fast interfacial dynamics. Following this, it will be shown how the adsorption kinetics and dilational rheology depend closely on the correct choice of the instrument and theoretical model for analyzing the data afterwards. When speaking about adsorption layers at water/air interfaces, the most important effect on the layer characteristics in general arises from the interaction between the adsorbed molecules. The lateral interactions between molecules in an adsorption layer are manifested through the hydrophobic attraction of surfactants’ alkyl chains and electrostatic repulsion of surfactants’ polar heads. Oppositely charged ions (counterions) in the surfactant aqueous solution reduce the electrostatic repulsions between adsorbed surfactants by screening the surfactants’ charge. This effect reduces the surfactant area per molecule, and consequently, leads to a significant decrease in surface tension. On the other hand, the effect of surfactant chain‐length compatibility in surfactant adsorption layers is particularly important for interfacial properties too. For mixed adsorption layers comprised of surfactants of different chain lengths, the shorter hydrocarbon tails have more freedom to disrupt the molecular packing through conformational disorder and thermal motion. This causes a slight increase in the intermolecular distance and, hence, the average area per molecule. For the sake of simplicity, our investigation was focused just on single surfactant adsorption layers.
1.1 Background
For many years the behavior of surfactants in solution or at liquid/fluid interfaces has been widely studied and found as very important for understanding of many processes and technologies, such as detergency, food processing, pharmaceutical industry, or cosmetics [1,2,3,4]. The general characteristics of disperse systems, such as foams, emulsions and suspensions, are practically defined by the interfacial properties of liquid films stabilized by single surfactants or mixtures of surface active compounds. Due to the availabilities of suitable instruments, most adsorption studies have been performed at the water/air interface [5,6,7,8,9,10] for which surface tension measurements [11], sum frequency spectroscopy [12], or neutron reflection experiments [13,14], followed by a modeling of the experimental data are very powerful methods to give an accurate idea
Introduction
‐ 3 ‐
of the interfacial layer properties (adsorbed amount, thickness of the layer, molar area and orientation of adsorbed molecules). Contrary to this, so far only few systematic experimental studies involving also a theoretical treatment of the data have been dedicated to the adsorption of surfactants at water/oil interfaces [15,16,17]. One of the reasons for this is technical difficulties to measure for example with optical methods due to the presence of the upper oil phase. The purification of the oil phases which often contain traces of surface active molecules, and their volatility which limits the experimental time, are additional critical points. Moreover, the difficulty of such studies increases when the surfactants are soluble in both water and oil phases. This fact entails, in addition to all mentioned parameters, the need of determination of the partition coefficient [18,19] in experiments. The questions regarding the role of the oil molecules at the water interfaces are still unclear and so the interactions between the oil molecules and surfactants and the mutual surfactant interactions at the water/oil interface. Some of the answers can be found when comparing the results obtained at water/air and the water/oil interfaces. In the past, Hutchinson suggested the presence of a competitive adsorption between surfactant and oil molecules at the water/non‐polar solvent interface [20]. Gillap et al. [21] have observed a strong increase of the adsorbed amount of sodium dodecyl and decyl sulfate at the water/oil interface as compared to the water/air interface, certainly due to the presence of hydrophobic interactions between adsorbed surfactants and oil molecules. Systematic study of the water/oil interfaces started also with investigations of the surfactant’s natural impurities and their behavior at water/oil interfaces. It was shown that depending on the volume ratio of water and oil, the initial concentrations of the surfactant in the two phases and the
partition coefficient, a minimum in (t) can be observed and explained by the transfer of surfactant from the phase of smaller volume to the other phase [22]. This behavior is typical for oil and water soluble substances such as dodecanol (C12OH), the natural impurity of aqueous SDS solution. Compared to SDS, C12OH is only slightly soluble in water and about 400 times higher surface active at the water/air interface [23]. In comparison with spreading oil on the water/air interface there is much less published work on the adsorption of alkane from the vapor phase on aqueous surfactant solution surfaces [24, 25]. Aveyard et al. reported that for nonionic surfactants, dodecane adsorption decreases with increasing temperature at low surface concentration of the oil whereas it increases at high surface concentrations. With the ionic surfactant DoTAB, the temperature effect showed a similar crossover in the behavior but the changes in adsorption were opposite in direction to those seen for the non‐ionic surfactant. Javadi et al. have found that the surface tension value reached in presence of a saturated hexane atmosphere due to hexane co‐adsorption depends on the surfactant concentration. Understanding the surfactant dynamic behavior in an adsorption layer has significant importance not just for fundamental science but also for different technological applications, such as foaming or emulsification, broadly used in the pharmaceutical, food and mining industry and in oil recovery. By studying the dynamic interfacial behavior, it is possible to obtain important information about the interaction between molecules, change of conformation and aggregation of molecules, kinetics of chemical reactions, kinetics of formation and disintegration of micelles, and other processes which take place on a molecular level [26,27]. Interfacial rheology gives insight into many relaxation processes within the adsorption layer, which is of fundamental interest and also of great applied value [28]. Surfactants of low surface activity generally adsorb fairly quickly due to the required high bulk concentration. This in turn requires experimental techniques able to measure changes in surface tension already after a few milliseconds or even less. On the other side, highly surface active substances are used at rather low bulk concentrations and, therefore, their adsorption kinetic is slow, i.e. the equilibrium state is established only after long adsorption times. In this case one should choose instruments which provide data for adsorption times of many hours or even days rather than recording the surface tension in less than a few milliseconds. In both cases, the most important point is to select and properly apply the right experimental techniques for getting the required information.
Introduction
‐ 4 ‐
Similar problems arise in investigations of the frequency dependence of the interfacial tension response to small harmonic perturbations of the interfacial area, i.e. when we want to measure the dilational visco‐elasticity of a surfactant adsorption layer. For a weak surfactant a method is obviously needed that works at very high frequencies as the required compression/expansion perturbations should be fast enough to create a deviation of the surface layer from equilibrium before this equilibrium is reestablished by desorption/adsorption. Again, on the contrary, for the very highly surface active substances a method is required to allow slow compression and expansion (measurements at low frequencies of interfacial perturbations). As a part of this thesis is devoted to investigations of macromolecular block copolymers (Pluronics) and mixtures of polyelectrolytes (polyallyl amine hydrochloride) and surfactants at the water/oil interface, in the following paragraphs work will be presented done so far only at the water/air interface. Surface properties of adsorbed and spread Pluronics block copolymer (PEO‐PPO‐PEO) films at the water/air interface have been studied by equilibrium and dynamic surface tension measurements [29,30], ellipsometry [29,30,31,32], neutron reflectivity [33,34,35], and surface rheology measurements [36,37,38,39,40,41]. It was found that by increasing the surface concentration of these copolymers, they are passing through different conformational changes at the water/air interface. The layer structure changes from a two‐dimensional flat structure with both PEO and PPO segments lying flat at the surface to a brush‐like structure where the PEO segments are protruding into the solution bulk. The interfacial behavior of polyelectrolyte‐surfactant mixtures at water/oil interfaces has only very recently been studied systematically, since suitable experimental tools are available, and only few papers are so far devoted to this subject [42]. The dilational surface rheology is used to obtain additional information on the polyelectrolyte‐surfactant complex formation in the surface layer. Measurements of the dynamic surface visco‐elasticity can be used to study every single chemical and physical process in the system and provide more information on the dynamics of polymer chains and their interactions with surfactant molecules at the surface, supposed the measurements are done in a suitable frequency range.
1.2 Emulsions
Emulsions are systems where the water/oil interfacial properties play a key role. As the water/oil interface is the subject of the thesis, the following part summarizes some general knowledge about emulsions. Emulsions are dispersions (often colloidal) of one fluid phase in another stabilized by the presence of surfactants adsorbed at fluid interfaces. The dependencies of the interfacial tension on the adsorption, and its dependence on bulk composition, temperature, etc., play a key role in the hydrodynamics of coalescence phenomena which determines the stability of emulsions. Dispersed phase droplets in emulsions have usually a diameter less than 100 µm. Corresponding to the size of the droplets, the type can be macro–, mini‐, nano‐ and micro–emulsions. The macro–emulsions, simply called emulsions, are thermodynamically unstable, showing characteristic properties such as segregation (sedimentation or creaming due to gravity), flocculation (clustering of emulsion droplets) and coalescence (the merging of droplets into larger droplets), and drop size disproportionation. Coalescence is preceded by flocculation, in which the drops are drawn together by net long–range attraction, although they are mechanically transported, by gravity, filtration, etc., into sufficient proximity to coalesce. The liquid interface between adjacent droplets is flattened and separated by a thinning film of the external liquid phase. The liquid films, when stable, drain to some “critical thickness” hc, are found to be of the order of 50–100 nm and remain metastable for a finite period of time (“resting” time), before they suddenly rupture. In order to prolong the “resting” time, emulsions must contain a third constituent (in addition to oil and water) known as an emulsifier or emulsifying agent. The first class of emulsifiers is low molecular weight surfactants, which adsorb and orient at the interface. They play both mechanical and physico‐chemical roles in emulsion stabilization. Other emulsifiers are macromolecular
Introduction
‐ 5 ‐
substances. These might include proteins, gums, starches and derivatives from such substances (such as dextrin, methyl cellulose, lignosulfonates, etc.) as well as certain synthetic polymers or polyelectrolytes. These materials are also strongly adsorbed at the interface and confer stability primarily through “steric” and mechanical effects. Finally, finely dispersed solids may act as emulsifiers too, as it is the case for “Pickering emulsions”. In addition there is also a fourth type of emulsifier, i.e. certain inorganic anions which adsorb to the interface in sufficient quantity to confer some electrostatic stabilization. Common among these are the thiocyanate ions (CNS). 1.3 Adsorption layers
In the previous section emulsions were presented as complex systems of thin films between dispersed droplets. A thin film can be considered as adsorption bilayer of some surfactants. Therefore, by analyzing the behavior of single adsorption layers, one is able to understand the behavior of the total emulsion. The characteristics that surfactants provide to an interface are not just a matter of their chemical structure. The polarity of the two liquids has to be taken in consideration too. Namely, the polarity of liquids directly influences the interactions with surfactants adsorbed at the interface. In practice, water or an aqueous electrolyte solution are most frequently considered as a polar phase, and hydrocarbons or their mixtures, e.g. oil fractions, as an apolar phase. In this connection, substances practically completely soluble in water are ascribed to the so called water–soluble surfactants. Nonionics like alcohol ethoxylates, alkylphenols and alkyloamides having an average hydrocarbon radical length of C12 – C16, products containing up to 4 EO moles are ascribed to oil–soluble, those containing over 10 moles as water–soluble and those with 4 to 10 EO moles to water–oil–soluble. In this case, the surfactant is distributed between the aqueous and oil phases. The affinity of surfactants to the aqueous or the oil phase is quantified by the distribution coefficient K = cw/co where cw is the surfactant concentration in the aqueous phase and co is the surfactant concentration in the oil phase. The value K is considerably influenced by temperature, oil phase polarity and electrolyte content in water [43,44]. It is observed that some rules of the water/air interface (Szyszkowski equation, Traube rule etc.) can be utilized for the water/oil interface too. Note that the adsorption of oil – soluble surfactants at the oil‐air interface is weak and changes only slightly with the chain length in a homologous series. One of the principal distinctions between the liquid‐liquid and liquid‐gas interface is the possibility to achieve very low interfacial tensions (close to zero). This possibility is provided by using surfactants soluble in both, the aqueous and oil phases, as well as using binary mixtures of water–soluble and oil–soluble surfactants. Numerous systematic experimental studies of surfactants, macromolecules or their mixtures have been performed using various complementary methods: dynamic and equilibrium interfacial tension measurements [45,46,47], ellipsometry [48,49,50,51], surface light scattering [52,53], dilational and shear rheology [54,55,56]. New or recently developed experimental technique broaden the sources of information, such as FRAP (Fluorescence Recovery After Photobleaching) [57,58], which enables one to measure the molecular mobility in adsorption layers, Brewster Angle Microscopy [59,60,61] and Atomic Force Microscopy [62,63,64], which allow the visualization of macroscopic structures in the adsorption layers. IRRAS (Infrared Reflection Adsorption Spectroscopy) [65], SHG (Second Harmonic Generation) and other new non‐linear optical principles have been proven to be applicable to study the arrangement of individual molecular moieties in monolayers at different liquid interfaces. Theoretical adsorption models
The thermodynamics and dynamics of interfacial layers have gained large interest in interfacial research. An accurate description of the thermodynamics of adsorption layers at liquid interfaces is the vital prerequisite for a quantitative understanding of the equilibrium or any non–equilibrium processes going on at the surface of liquids or at the interface between two liquids. The
Introduction
‐ 6 ‐
thermodynamic analysis of adsorption layers at liquid‐fluid interfaces is provided by the equation of state which expresses the surface pressure as a function of surface layer composition, and the adsorption isotherm, which determines the dependence of adsorption of each dissolved component on their bulk concentrations. From these equations, the surface tension (pressure) isotherm can also be calculated and compared with experimental data. The description of experimental data by the Langmuir adsorption isotherm or the corresponding von Szyszkowski surface tension equation often shows significant deviations. These equations can be derived for a surface layer model where the molecules of the surfactant and the solvent from which the molecules adsorb obey two conditions: (i) no interaction between adsorbed molecules (ii) equal molar areas at the interface. In a number of cases, deviations from the Langmuir behavior can be explained by an invalidity of the former condition, for example by the presence of interactions between adsorbed molecules or differences in the molecular areas. The adsorption isotherm and equation of state for adsorption layers proposed by Frumkin [66] describe the adsorption of low molecular weight surfactants rather well, provided the systems under investigation deviate only slightly from an ideal (Langmuir) behavior. Reasonable agreement between theory and experiment was found when interactions between all components in the system were taken into consideration [67,68,69]. However, the intermolecular interaction parameters which can be estimated from a comparison of experimental data and model isotherms do not always correlate with the properties of the surfactants or solvents. Often they have to be regarded simply as matching parameters. A better understanding of the physical reasons for deviations between experimental data and theoretical models should result from new models for the adsorption isotherm and the corresponding equation of state. Such new models should account for the effects of, e.g., the size of the surfactant or protein molecules, molecular reorientation within the surface, dimerisation, cluster formation, etc.
CHAPTER 2
Theory
‐ 7 ‐
2.1 Chemistry of surfactants and polymers
Surfactants are amphiphilic substances which adsorb and by that decrease the surface (interfacial) tension. In some literature, the word “surfactant” is used for all kind of molecules that are surface active, including low and high molecular‐weight substances. Here we will use the terminology “surfactant” just for low molecular‐weight surface active substances that, in a more specific sense, possess an asymmetric molecular structure. On the other hand, polymers, polyelectrolytes and proteins belong to the high molecular‐weight group of substances characterized by some other more specific properties. Generally, surfactants consist of two parts, which possess properties opposite to each other by their nature. One part of the molecule is the hydrophilic polar head group, for example, ‐NH2, ‐OH, ‐COOH, ‐SO3H, ‐OSO3H, ‐COOMe, ‐OSO3Me, ‐N(CH3)3Cl, ‐CH2CH2O. The other part is formed by a rather long hydrocarbon or hydrofluorine hydrophobic (oleophilic) chain. In contrast, high molecular‐weight surfactants can contain alternating hydrophilic and hydrophobic molecular groups distributed along the whole molecule chain. According to the chemical nature, surfactants can be divided into two major groups – non‐ionic and ionic surfactants which consist of a long‐chain (surface active) ion and an ordinary inorganic counter ion. The non‐ionic surfactants contain polar groups consisting of atoms of oxygen, nitrogen, phosphorus or sulphur (alcohols, amines, ethers etc.). These polar groups are unable to dissociate and possess a significant affinity to water and other polar substances. Contrary to this, ionic surfactants can be represented by anionic and cationic surfactants depending on the sign of the charge of the polar head group. A more detailed categorization of ionic surfactants will be presented further below. Among the anionic surfactants, the most significant are salts of fatty acids (RCOOMe), alkyl sulphates (sulphoether salts) ROSO3Me, alkyl sulphonates RSO3Me, alkyl aryl sulphonates RC6H5SO3Me, alkyl phosphates ROPO(OMe)2, salts of sulphosuccinic acids. The typical surfactants which belong to this class are sodium dodecyl sulphate (SDS), sodium oleate and sodium dodecyl benzene sulphonate. Among the cationic surfactants, the most common are the salts of (primary, secondary and tertiary) amines, and quaternary salts of ammonium, for example, cetyl trimethyl ammonium bromide (C16TAB) and octadecyl pyridinium chloride.
2.1.1 Surface properties of surfactants and polymers
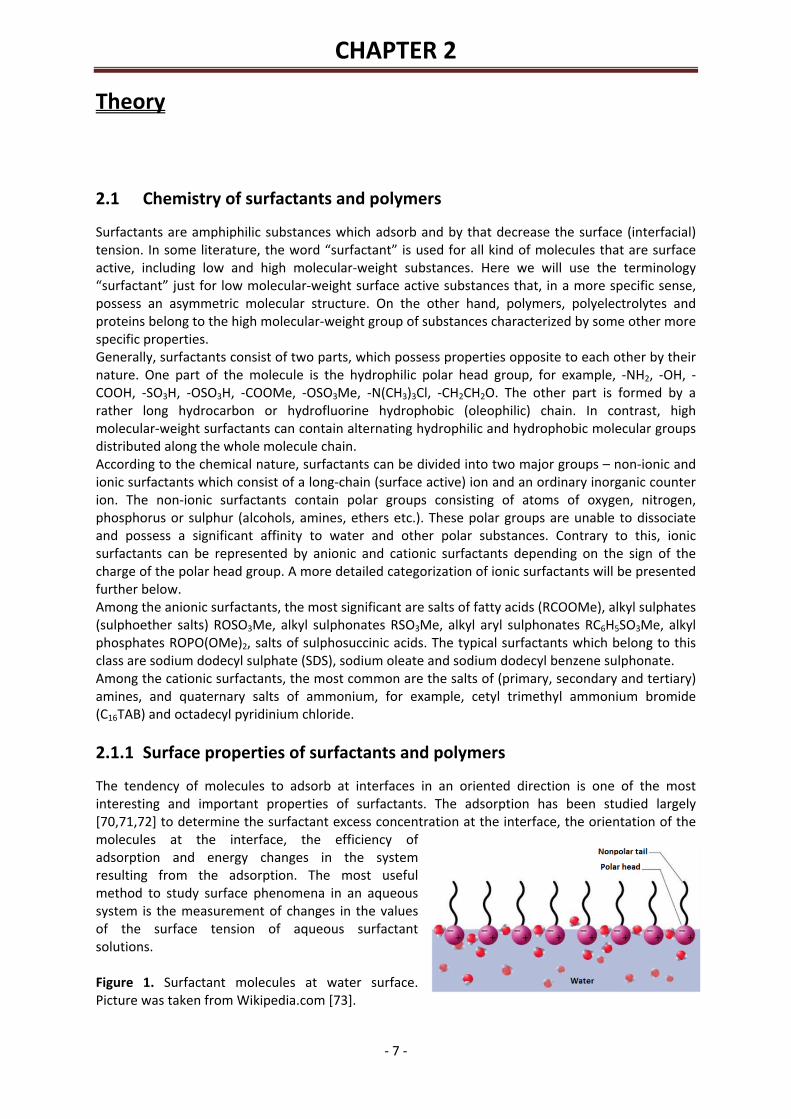
The tendency of molecules to adsorb at interfaces in an oriented direction is one of the most interesting and important properties of surfactants. The adsorption has been studied largely [70,71,72] to determine the surfactant excess concentration at the interface, the orientation of the molecules at the interface, the efficiency of adsorption and energy changes in the system resulting from the adsorption. The most useful method to study surface phenomena in an aqueous system is the measurement of changes in the values of the surface tension of aqueous surfactant solutions. Figure 1. Surfactant molecules at water surface. Picture was taken from Wikipedia.com [73].
Theory
‐ 8 ‐
In this thesis we have used theoretical models, explained in the following part, to describe the results of surface and interfacial tension measurements of aqueous surfactant and polymer solutions at the water/air and water/oil interfaces, respectively. In this way it is possible to accurately determine the physical properties of the surfactants in the adsorption layer. Using the most simple theoretical model, the Langmuir adsorption model, it is possible to determine the adsorption
constant b and the maximum adsorption . The adsorption constant b is a measure of the
surfactant’s surface activity or tendency to adsorb at an interface. The maximum adsorption represents the surface concentration of the surfactant at the interface. It is also possible to define
the surface coverage by surfactants, , and the molar area of the adsorbed molecules, . If the compressibility of the adsorbed layer is taken into account the molar area depends on the surface pressure and it changes with the surface coverage. Another, more complex model is the Frumkin adsorption model, which considers the interaction between molecules at the interface expressed via the intermolecular interaction constant a. The newer version of the Frumkin adsorption model gives the option to take into account added electrolyte ions together with the surfactant ions and counterions, if the experiment is performed in salt solution. For some surfactants the molecules in the adsorption layer can change their orientation with increasing surface coverage leading to a transition from a state of larger to one with a smaller molar interfacial area. The behavior of such surfactants is described most precisely by the so‐called
Reorientation model, where two different molar areas 1 and 2 are taken into account, presenting the two states of molecules at the interface with different molecular orientations. Surface properties of the high molecular‐weight substances depend on the structure of the molecules, i.e. on the order of the active groups in the molecule. Therewith, pluronic as a non‐ionic triblock copolymer consisting of poly(ethylene oxide) and poly(propylene oxide) blocks, adopts different conformations as adsorption increases. The layer structure changes from a two‐dimensional flat structure to a brush‐like structure.
2.1.2 Bulk properties of surfactants and polymers
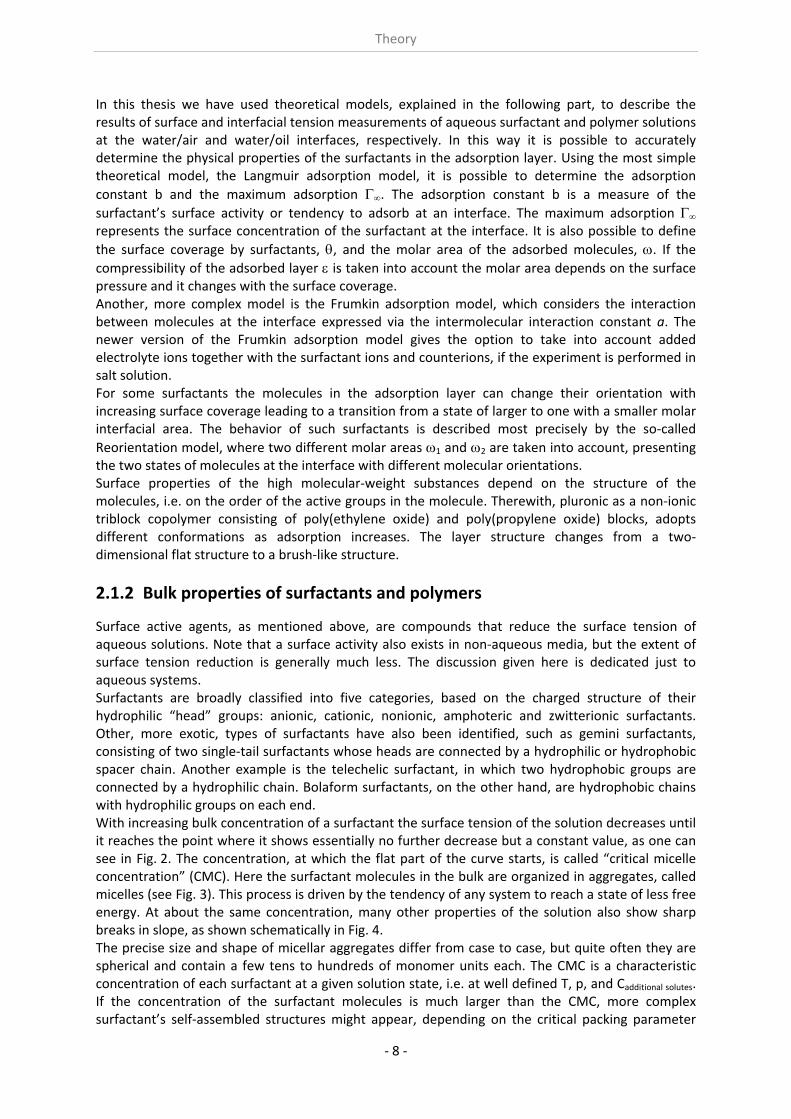
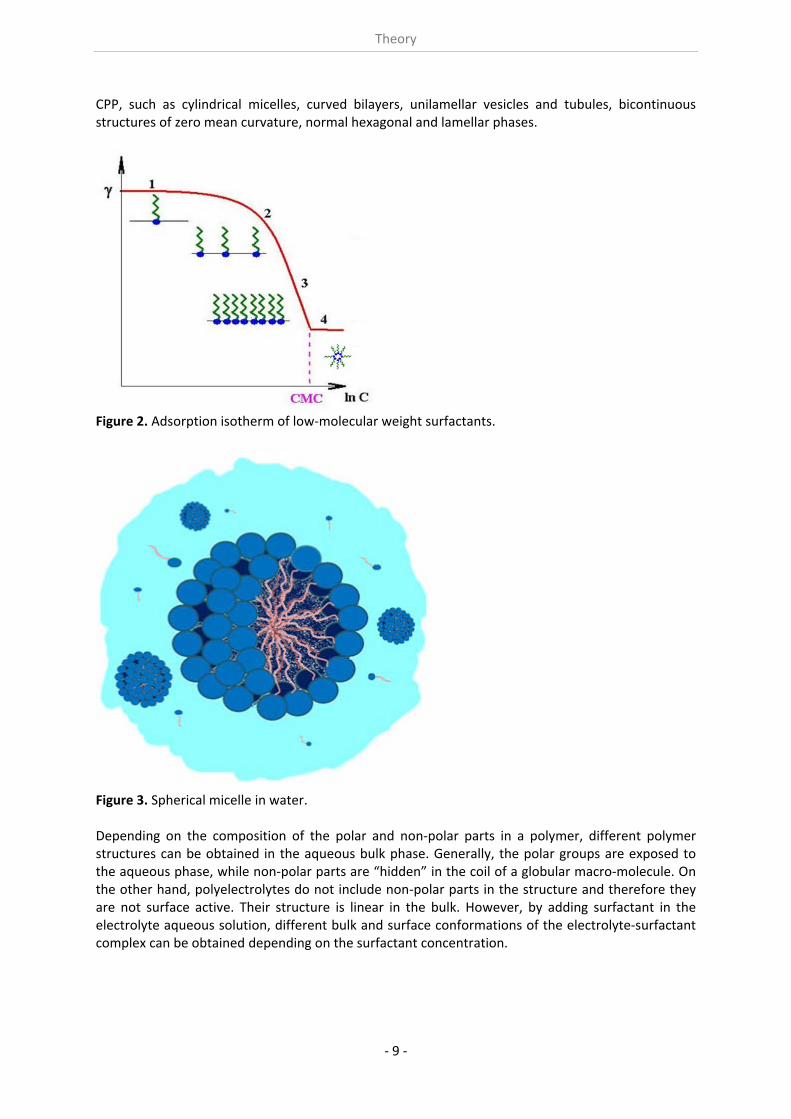
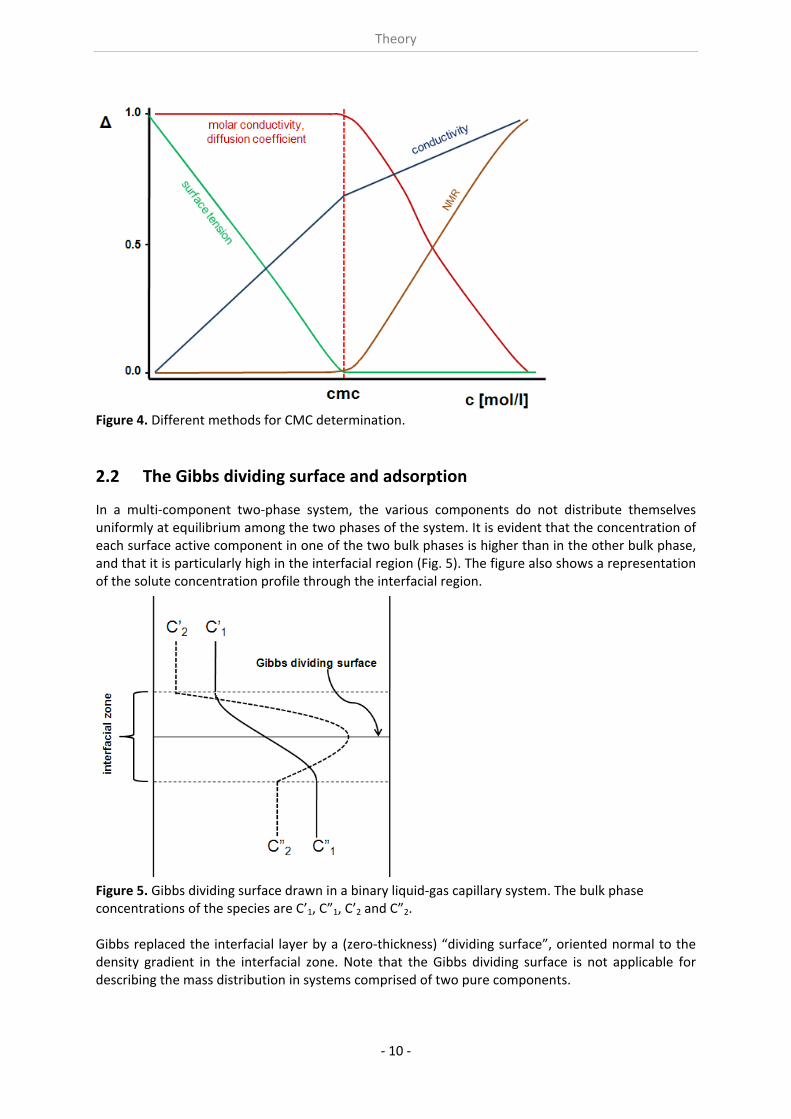
Surface active agents, as mentioned above, are compounds that reduce the surface tension of aqueous solutions. Note that a surface activity also exists in non‐aqueous media, but the extent of surface tension reduction is generally much less. The discussion given here is dedicated just to aqueous systems. Surfactants are broadly classified into five categories, based on the charged structure of their hydrophilic “head” groups: anionic, cationic, nonionic, amphoteric and zwitterionic surfactants. Other, more exotic, types of surfactants have also been identified, such as gemini surfactants, consisting of two single‐tail surfactants whose heads are connected by a hydrophilic or hydrophobic spacer chain. Another example is the telechelic surfactant, in which two hydrophobic groups are connected by a hydrophilic chain. Bolaform surfactants, on the other hand, are hydrophobic chains with hydrophilic groups on each end. With increasing bulk concentration of a surfactant the surface tension of the solution decreases until it reaches the point where it shows essentially no further decrease but a constant value, as one can see in Fig. 2. The concentration, at which the flat part of the curve starts, is called “critical micelle concentration” (CMC). Here the surfactant molecules in the bulk are organized in aggregates, called micelles (see Fig. 3). This process is driven by the tendency of any system to reach a state of less free energy. At about the same concentration, many other properties of the solution also show sharp breaks in slope, as shown schematically in Fig. 4. The precise size and shape of micellar aggregates differ from case to case, but quite often they are spherical and contain a few tens to hundreds of monomer units each. The CMC is a characteristic concentration of each surfactant at a given solution state, i.e. at well defined T, p, and Cadditional solutes. If the concentration of the surfactant molecules is much larger than the CMC, more complex surfactant’s self‐assembled structures might appear, depending on the critical packing parameter
Theory
‐ 9 ‐
CPP, such as cylindrical micelles, curved bilayers, unilamellar vesicles and tubules, bicontinuous structures of zero mean curvature, normal hexagonal and lamellar phases.
Figure 2. Adsorption isotherm of low‐molecular weight surfactants.
Figure 3. Spherical micelle in water. Depending on the composition of the polar and non‐polar parts in a polymer, different polymer structures can be obtained in the aqueous bulk phase. Generally, the polar groups are exposed to the aqueous phase, while non‐polar parts are “hidden” in the coil of a globular macro‐molecule. On the other hand, polyelectrolytes do not include non‐polar parts in the structure and therefore they are not surface active. Their structure is linear in the bulk. However, by adding surfactant in the electrolyte aqueous solution, different bulk and surface conformations of the electrolyte‐surfactant complex can be obtained depending on the surfactant concentration.
Theory
‐ 10 ‐
Figure 4. Different methods for CMC determination.
2.2 The Gibbs dividing surface and adsorption
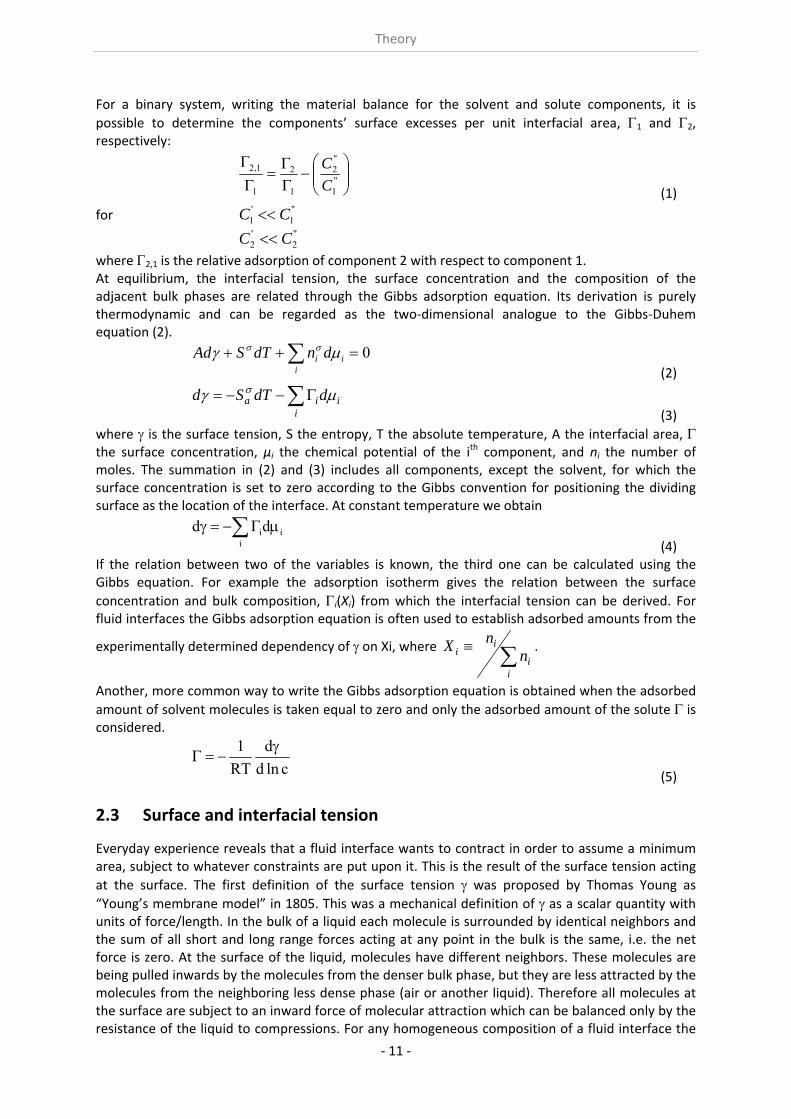
In a multi‐component two‐phase system, the various components do not distribute themselves uniformly at equilibrium among the two phases of the system. It is evident that the concentration of each surface active component in one of the two bulk phases is higher than in the other bulk phase, and that it is particularly high in the interfacial region (Fig. 5). The figure also shows a representation of the solute concentration profile through the interfacial region.
Figure 5. Gibbs dividing surface drawn in a binary liquid‐gas capillary system. The bulk phase concentrations of the species are C’1, C”1, C’2 and C”2. Gibbs replaced the interfacial layer by a (zero‐thickness) “dividing surface”, oriented normal to the density gradient in the interfacial zone. Note that the Gibbs dividing surface is not applicable for describing the mass distribution in systems comprised of two pure components.
Theory
‐ 11 ‐
For a binary system, writing the material balance for the solvent and solute components, it is
possible to determine the components’ surface excesses per unit interfacial area, 1 and 2, respectively:
"1
"2
1
2
1
1,2
C
C
(1)
for "1
'1 CC
"2
'2 CC
where 2,1 is the relative adsorption of component 2 with respect to component 1. At equilibrium, the interfacial tension, the surface concentration and the composition of the adjacent bulk phases are related through the Gibbs adsorption equation. Its derivation is purely thermodynamic and can be regarded as the two‐dimensional analogue to the Gibbs‐Duhem equation (2).
0 i
ii dndTSAd
(2)
i
iia ddTSd
(3)
where is the surface tension, S the entropy, T the absolute temperature, A the interfacial area, the surface concentration, μi the chemical potential of the ith component, and ni the number of moles. The summation in (2) and (3) includes all components, except the solvent, for which the surface concentration is set to zero according to the Gibbs convention for positioning the dividing surface as the location of the interface. At constant temperature we obtain
i
iidd (4)
If the relation between two of the variables is known, the third one can be calculated using the Gibbs equation. For example the adsorption isotherm gives the relation between the surface
concentration and bulk composition, i(Xi) from which the interfacial tension can be derived. For fluid interfaces the Gibbs adsorption equation is often used to establish adsorbed amounts from the
experimentally determined dependency of on Xi, where
ii
ii n
nX .
Another, more common way to write the Gibbs adsorption equation is obtained when the adsorbed
amount of solvent molecules is taken equal to zero and only the adsorbed amount of the solute is considered.
clnd
d
RT
1
(5)
2.3 Surface and interfacial tension
Everyday experience reveals that a fluid interface wants to contract in order to assume a minimum area, subject to whatever constraints are put upon it. This is the result of the surface tension acting
at the surface. The first definition of the surface tension was proposed by Thomas Young as
“Young’s membrane model” in 1805. This was a mechanical definition of as a scalar quantity with units of force/length. In the bulk of a liquid each molecule is surrounded by identical neighbors and the sum of all short and long range forces acting at any point in the bulk is the same, i.e. the net force is zero. At the surface of the liquid, molecules have different neighbors. These molecules are being pulled inwards by the molecules from the denser bulk phase, but they are less attracted by the molecules from the neighboring less dense phase (air or another liquid). Therefore all molecules at the surface are subject to an inward force of molecular attraction which can be balanced only by the resistance of the liquid to compressions. For any homogeneous composition of a fluid interface the
Theory
‐ 12 ‐
surface tension is uniform. The macroscopic mechanical model of a fluid interface is thus a zero‐thickness membrane. The units of surface tension, force/length, are the same as those of an energy (or work) per unit area. Hence, surface tension can also be interpreted in terms of a mechanical energy required to create new area of a liquid surface. As stated above, the terminology “surface tension” is usually reserved for the tension observed at a liquid/gas interface, whereas “interfacial tension” is used in reference to all kinds of interface, but in the present context to liquid/liquid interfaces. The same molecular picture developed above explains the existence of the interfacial tension between two liquids too. If two liquids are immiscible and form an interface, the molecules of each bulk phase prefer to stay together rather than to mix. On the molecules at the interface the interactions with the molecules of the two phases are asymmetric, resulting in interfacial tension. The values of the interfacial tension for each water/oil system differ from each other, depending on the nature, but mainly on the polarity of the oil.
2.4 Thermodynamic adsorption models
The first real adsorption model for surfactants at liquid interfaces as proposed by Langmuir was originally developed for the gas adsorption at solid surfaces [74]. Later Frumkin showed that the additional assumption of an interaction between molecules in the adsorption layer can improve the agreement between the theory and experimental data. Although refinements have been recently published reflecting some specific features of adsorbed surfactant molecules, as described in detail elsewhere [75], in many cases the Langmuir model is still used by many authors. This rather simple model is at least acceptable when semi‐quantitative evaluations are needed. An accurate analysis of experimental data should of course be done on the basis of an optimum model for the respective studied surfactant.
2.4.1 Langmuir adsorption model
The adsorption isotherm for the Langmuir model [76] reads:
bc
bc
1
(6)
and the corresponding Szyszkowski‐Langmuir equation of state has the form
bcRTRTo
1ln)1ln( (7)
Here 0 is the interfacial tension in the absence of surfactant, c is the surfactant bulk concentration, is the surface pressure 0‐, R and T are the gas law constant and absolute temperature,
respectively, is the maximum adsorption, and b is the adsorption constant with the dimension of a reciprocal concentration. The physical idea behind this model is a localized adsorption layer where each molecule requires a certain area at the interface.
2.4.2 Frumkin adsorption model
The Frumkin adsorption isotherm and the corresponding equation of state are given in the following form [77]:
)2exp(1
abc
(8)
20 )1ln(
aRT
(9)
where a is the intermolecular interaction constant, θ is the surface coverage by surfactant molecules, θ = Γω, and ω is the molar area of the adsorbed molecule. If the compressibility of the
Theory
‐ 13 ‐
adsorbed layer is additionally taken into account then the molar area is considered to depend on the surface pressure ω = ω0(1 – εΠθ), where ω0 is the molar area of a solvent molecule, and ε is the two dimensional compressibility coefficient [78].
2.4.3 Reorientation model
For some surfactants the molecules in the adsorption layer can change their orientation upon increasing the surface coverage to that with smaller molar area. The behaviour of such surfactants is described most precisely by the so‐called Reorientation model [79]:
))2(exp(
)1( 10
11011
101
acb
(10)
210
10 )()1ln(
aRT
(11)
2211 (12)
21 (13)
)2(exp)1(10
12
1
2
1
2 10
12
a (14)
)1(101 (15)
where indices 1 and 2 correspond to the two states with different molecular orientations and therefore with different molar areas. Eq. (15) accounts for the surface compressibility of the state with smaller molar area.
2.5 Dynamic adsorption models 2.5.1 Ward and Tordai equation
Assumed the adsorption process is diffusion controlled, the kinetics is given by the equation derived by Ward and Tordai for a flat interface [80]:
t
0
s0 d)t(ctcD4
)t( (16)
where c0 is the bulk concentration of surfactant and cs is the so‐called subsurface concentration
related to the adsorption through the adsorption isotherm, for example, Eq. (6). The equation (16) was later extended to the case of adsorption at a spherical interface of radius r as [2]
t
0
s0
t
0
s0 d)t(ctcr
Dd)t(ctc
D4)t( (17)
The plus sign in Eq. (17) corresponds to adsorption from outside the droplet. The short time approximation useful to describe the very beginning of the adsorption process is
r
cDtDtct
2)( (18)
Theory
‐ 14 ‐
The quantitative solution of the Ward‐Tordai equation has been discussed for example in [81].
As is obvious from Eq. (16), the adsorption of the surfactant molecules depends on the bulk
concentration c0. Once (t) has been obtained, the corresponding dynamic interfacial tension is calculated via the corresponding equation of state, for example, Eq. (7).
2.5.2 Lucassen and van den Temple model
Another important concept for characterising the adsorption dynamics is the surface dilational visco‐elasticity modulus, which displays the response of the interfacial tension upon compression or expansion of the interfacial area [82]:
Ad
d
d
dE
ln
ln
ln
(19)
The modulus can be presented as a complex quantity where the real part represents the surface elasticity and the imaginary part the surface viscosity. The first factor in the r.h.s. of Eq. (19) is called the limiting Gibbs elasticity corresponding to the high frequency limit when the surfactant layer behaves like an insoluble monolayer. Using the same Langmuir adsorption model, the high frequency limit of the elasticity is given by
bcRTd
dE
ln0
(20)
The dilational visco‐elasticity, measured at a certain frequency f = /2, was presented for a diffusional exchange of matter by Lucassen and van den Temple [83, 84] in a complex form via
0
02
''')(
i
iEiEEiE (21)
Here E and E are the real and imaginary parts of E, corresponding to the elastic and viscous parts of the dilational visco‐elasticity, respectively:
/2/21
/1)('
00
00
EE (22)
/2/21
/)(
00
00
EE (23)
These equations contain the key parameter 0 which is the characteristic frequency of the diffusional matter exchange
)²/(20 ddcD (24)
It includes in turn the adsorption activity of the surfactant dc/d and corresponds to the slope of the adsorption isotherm.
CHAPTER 3
Experimental section
‐ 15 ‐
3.1 Materials 3.1.1 Surfactants
The main substances investigated in this thesis are members of the homologous series of alkyl trimethylammonium bromides, i.e. decyl trimethylammonium bromide C10TAB (MW = 280.29 g/mol, purity ≥ 98%), dodecyl trimethylammonium bromide C12TAB (MW = 308.35 g/mol, purity ≥ 99%), hexadecyl trimethylammonium bromide C16TAB (MW = 364.46 g/mol, purity ≥ 99%) purchased from Fluka (Switzerland), and tetradecyl trimethylammonium bromide C14TAB (MW = 336.40 g/mol, purity 99%) purchased from Aldrich. The surfactants were purified by triple re‐crystallization in ethanol and acetone. All surfactant solutions were prepared in phosphate buffer NaH2PO4/Na2HPO4 (10mM, pH7)
purchased from Fluka with a purity 99%, using ultrapure Milli‐Q water (resistivity = 18.2 Mcm). Sodium dodecyl sulphate, SDS, was used in experiments purified or not depending on where this was
required due to the specificity of the experiments. SDS was purchased from Fluka with purity 99%. The solutions were prepared in 10mM aqueous phosphate buffer solution, pH 7, using Milli‐Q water.
Dodecanol (Fluka, 99%) was used in the experiments to mimic the natural impurities in aqueous SDS solution, where SDS hydrolyses to dodecanol and sulfuric acid salt.
3.1.2 Macromolecules
Pluronics are symmetric non‐ionic triblock copolymers of the form (PEO)x‐(PPO)y‐(PEO)x, where PEO and PPO are the oxyethylene and oxypropylene units, respectively. The Pluronic L64 and F68 were purchased from Sigma‐Aldrich, whereas Pluronic P9400 was provided by BASF. All Pluronics were used without further purification. The block copolymers have been chosen to form two pairs, one of them (L64 and P9400) with the same percentages of PEO and PPO, 40% (w/w) and 60% (w/w), respectively, and increasing average molecular weight, and the other pair with the same number of PPO units and increasing number of PEO ones (L64 and F68), which results in a larger average HLB (15 to > 24). The solutions studied were prepared with ultrapure Milli‐Q water. Polyallylamine hydrochloride (PAH) is a cationic polyelectrolyte prepared by polymerization of allylamine. In our experiments we used PAH with a molecular weight of MW = 56000 g/mol, purchased from Aldrich. The properties of polyelectrolyte/surfactant complexes depend on their preparation and can drastically change with the mixing protocol [85]. To prepare polymer/surfactant complexes in these experiments polymer and surfactant stock solutions of respective concentrations were diluted and mixed with each other and kept in an ultrasonic bath for 30 min. Freshly prepared solutions were kept for 24h and then used for the measurements.
3.1.3 Oil phase
The experiments were performed at water/oil and water/oil vapor interfaces, where different alkanes were chosen as the oil phase. Hexane was purchased from Fluka (Switzerland), heptane, octane, nonane, decane from ACROS Organics, and dodecane and tetradecane from Alfa Aesar. The oils were distilled and purified with Florisil. According to [86] the interfacial tensions at 25°C for the water/hexane interface is 51.1 mN/m, water/heptane interface 51 mN/m, water/octane interface 51.2 mN/m, water/nonane interface 51.5 mN/m, water/decane interface 52 mN/m, water/dodecane interface 51.9 mN/m and water/tetradecane interface 52.2 mN/m. Dimeticone used in the application example is a free trade name for a silicon oil (Polydimethylsiloxane) which is
Experimental section
‐ 16 ‐
PR
2
common used in cosmetics e.g. in skin‐moisturizing lotions and has been provided by Beiersdorf, Germany.
3.2 Methods
3.2.1 Capillary Pressure Tensiometry
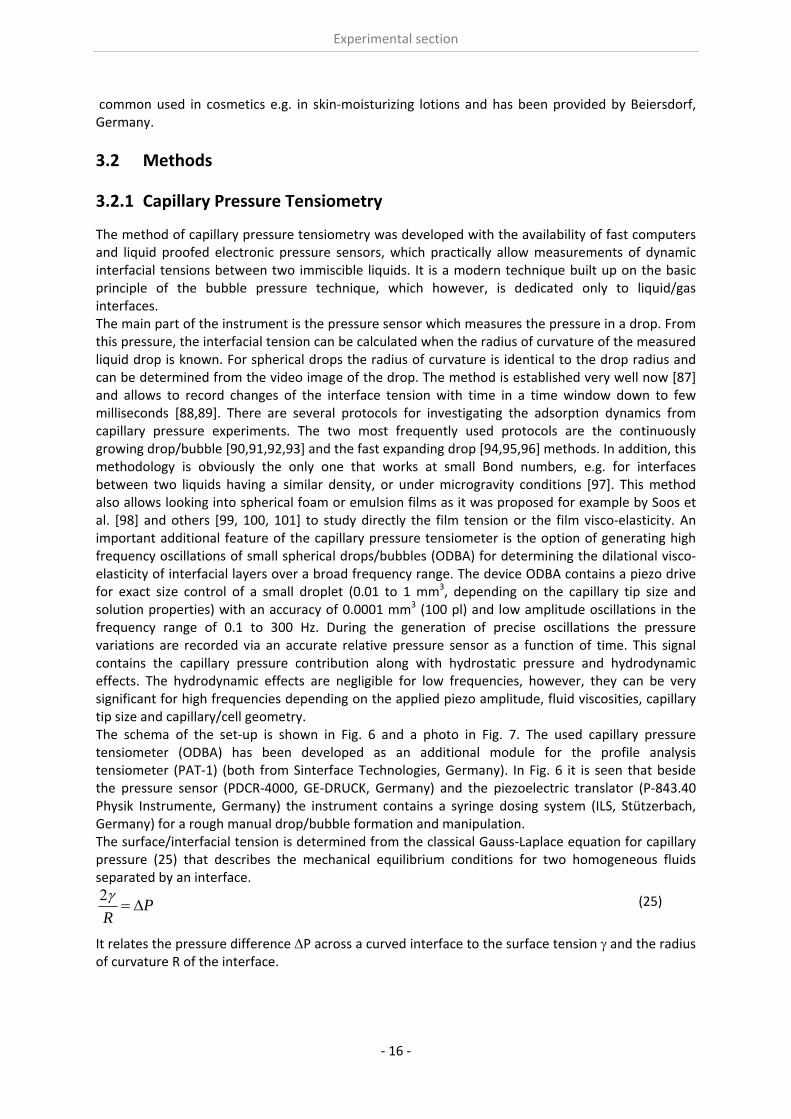
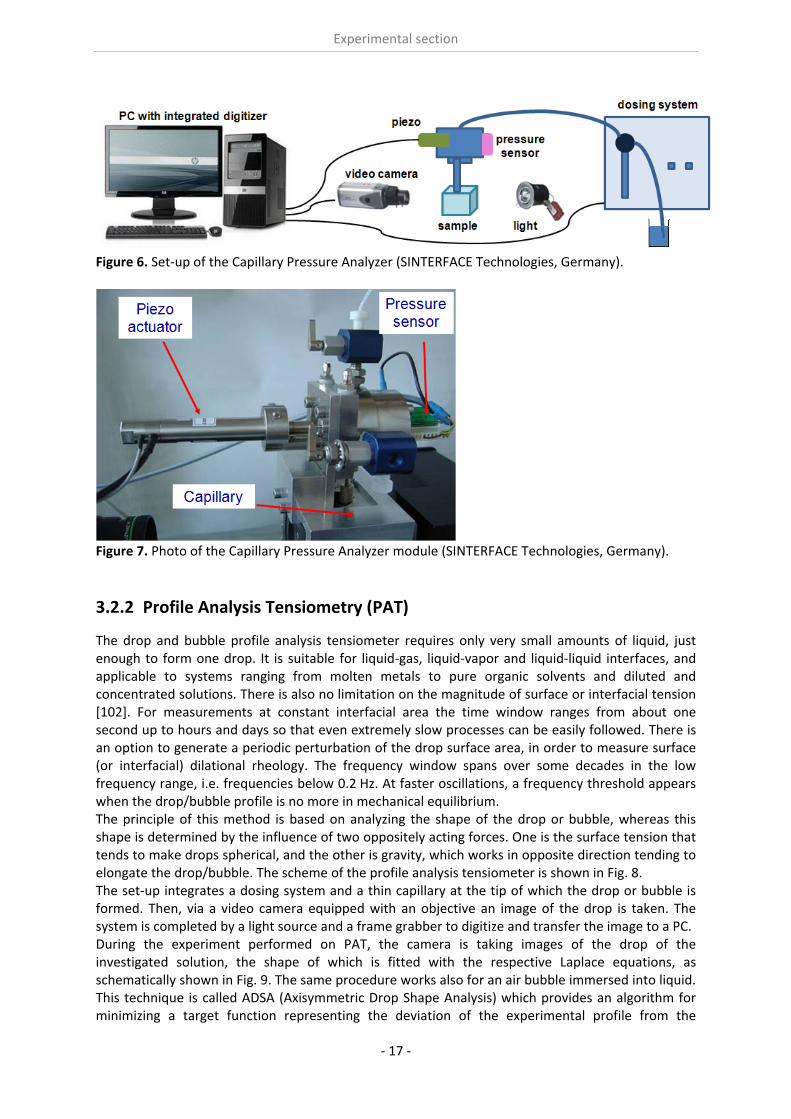
The method of capillary pressure tensiometry was developed with the availability of fast computers and liquid proofed electronic pressure sensors, which practically allow measurements of dynamic interfacial tensions between two immiscible liquids. It is a modern technique built up on the basic principle of the bubble pressure technique, which however, is dedicated only to liquid/gas interfaces. The main part of the instrument is the pressure sensor which measures the pressure in a drop. From this pressure, the interfacial tension can be calculated when the radius of curvature of the measured liquid drop is known. For spherical drops the radius of curvature is identical to the drop radius and can be determined from the video image of the drop. The method is established very well now [87] and allows to record changes of the interface tension with time in a time window down to few milliseconds [88,89]. There are several protocols for investigating the adsorption dynamics from capillary pressure experiments. The two most frequently used protocols are the continuously growing drop/bubble [90,91,92,93] and the fast expanding drop [94,95,96] methods. In addition, this methodology is obviously the only one that works at small Bond numbers, e.g. for interfaces between two liquids having a similar density, or under microgravity conditions [97]. This method also allows looking into spherical foam or emulsion films as it was proposed for example by Soos et al. [98] and others [99, 100, 101] to study directly the film tension or the film visco‐elasticity. An important additional feature of the capillary pressure tensiometer is the option of generating high frequency oscillations of small spherical drops/bubbles (ODBA) for determining the dilational visco‐elasticity of interfacial layers over a broad frequency range. The device ODBA contains a piezo drive for exact size control of a small droplet (0.01 to 1 mm3, depending on the capillary tip size and solution properties) with an accuracy of 0.0001 mm3 (100 pl) and low amplitude oscillations in the frequency range of 0.1 to 300 Hz. During the generation of precise oscillations the pressure variations are recorded via an accurate relative pressure sensor as a function of time. This signal contains the capillary pressure contribution along with hydrostatic pressure and hydrodynamic effects. The hydrodynamic effects are negligible for low frequencies, however, they can be very significant for high frequencies depending on the applied piezo amplitude, fluid viscosities, capillary tip size and capillary/cell geometry. The schema of the set‐up is shown in Fig. 6 and a photo in Fig. 7. The used capillary pressure tensiometer (ODBA) has been developed as an additional module for the profile analysis tensiometer (PAT‐1) (both from Sinterface Technologies, Germany). In Fig. 6 it is seen that beside the pressure sensor (PDCR‐4000, GE‐DRUCK, Germany) and the piezoelectric translator (P‐843.40 Physik Instrumente, Germany) the instrument contains a syringe dosing system (ILS, Stützerbach, Germany) for a rough manual drop/bubble formation and manipulation. The surface/interfacial tension is determined from the classical Gauss‐Laplace equation for capillary pressure (25) that describes the mechanical equilibrium conditions for two homogeneous fluids separated by an interface.
(25)
It relates the pressure difference P across a curved interface to the surface tension and the radius of curvature R of the interface.
Experimental section
‐ 17 ‐
Figure 6. Set‐up of the Capillary Pressure Analyzer (SINTERFACE Technologies, Germany).
Figure 7. Photo of the Capillary Pressure Analyzer module (SINTERFACE Technologies, Germany).
3.2.2 Profile Analysis Tensiometry (PAT)
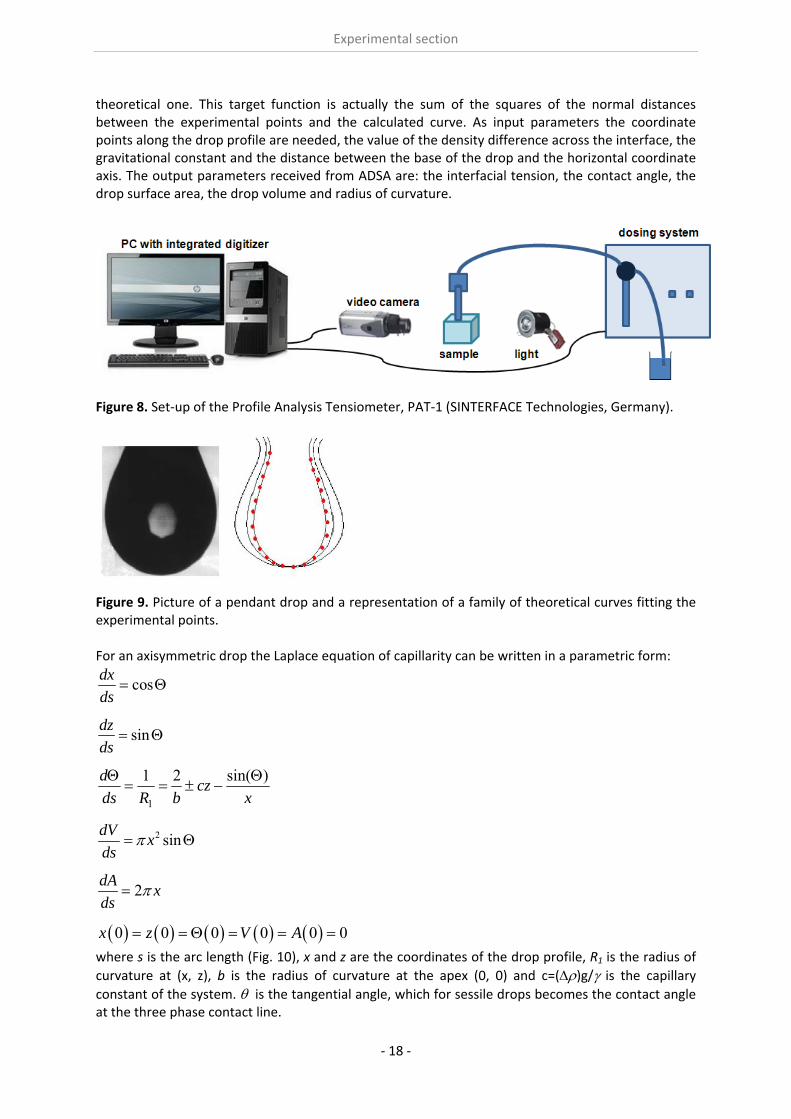
The drop and bubble profile analysis tensiometer requires only very small amounts of liquid, just enough to form one drop. It is suitable for liquid‐gas, liquid‐vapor and liquid‐liquid interfaces, and applicable to systems ranging from molten metals to pure organic solvents and diluted and concentrated solutions. There is also no limitation on the magnitude of surface or interfacial tension [102]. For measurements at constant interfacial area the time window ranges from about one second up to hours and days so that even extremely slow processes can be easily followed. There is an option to generate a periodic perturbation of the drop surface area, in order to measure surface (or interfacial) dilational rheology. The frequency window spans over some decades in the low frequency range, i.e. frequencies below 0.2 Hz. At faster oscillations, a frequency threshold appears when the drop/bubble profile is no more in mechanical equilibrium. The principle of this method is based on analyzing the shape of the drop or bubble, whereas this shape is determined by the influence of two oppositely acting forces. One is the surface tension that tends to make drops spherical, and the other is gravity, which works in opposite direction tending to elongate the drop/bubble. The scheme of the profile analysis tensiometer is shown in Fig. 8. The set‐up integrates a dosing system and a thin capillary at the tip of which the drop or bubble is formed. Then, via a video camera equipped with an objective an image of the drop is taken. The system is completed by a light source and a frame grabber to digitize and transfer the image to a PC. During the experiment performed on PAT, the camera is taking images of the drop of the investigated solution, the shape of which is fitted with the respective Laplace equations, as schematically shown in Fig. 9. The same procedure works also for an air bubble immersed into liquid. This technique is called ADSA (Axisymmetric Drop Shape Analysis) which provides an algorithm for minimizing a target function representing the deviation of the experimental profile from the
Experimental section
‐ 18 ‐
theoretical one. This target function is actually the sum of the squares of the normal distances between the experimental points and the calculated curve. As input parameters the coordinate points along the drop profile are needed, the value of the density difference across the interface, the gravitational constant and the distance between the base of the drop and the horizontal coordinate axis. The output parameters received from ADSA are: the interfacial tension, the contact angle, the drop surface area, the drop volume and radius of curvature.
Figure 8. Set‐up of the Profile Analysis Tensiometer, PAT‐1 (SINTERFACE Technologies, Germany).
Figure 9. Picture of a pendant drop and a representation of a family of theoretical curves fitting the experimental points. For an axisymmetric drop the Laplace equation of capillarity can be written in a parametric form:
cosdx
ds
sindz
ds
xcz
bRds
d )sin(21
1
2 sindV
xds
2dA
xds
0 0 0 0 0 0x z V A
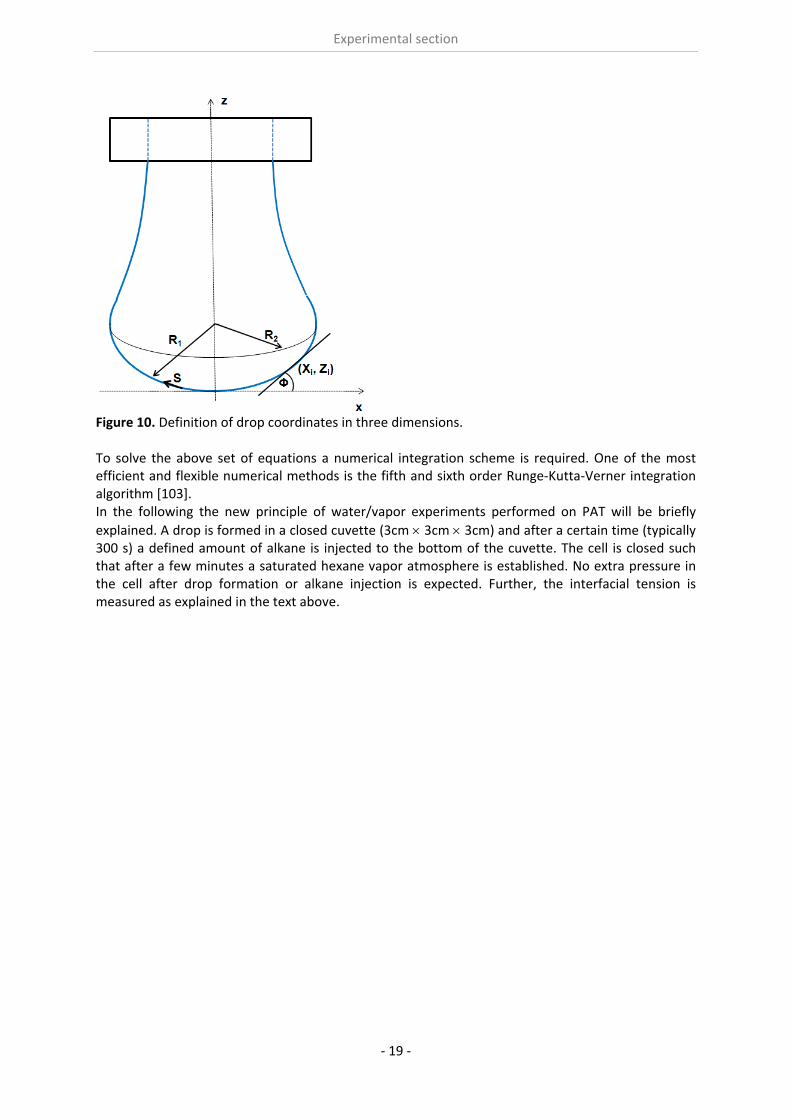
where s is the arc length (Fig. 10), x and z are the coordinates of the drop profile, R1 is the radius of
curvature at (x, z), b is the radius of curvature at the apex (0, 0) and c=()g/ is the capillary constant of the system. is the tangential angle, which for sessile drops becomes the contact angle at the three phase contact line.
Experimental section
‐ 19 ‐
Figure 10. Definition of drop coordinates in three dimensions. To solve the above set of equations a numerical integration scheme is required. One of the most efficient and flexible numerical methods is the fifth and sixth order Runge‐Kutta‐Verner integration algorithm [103]. In the following the new principle of water/vapor experiments performed on PAT will be briefly
explained. A drop is formed in a closed cuvette (3cm 3cm 3cm) and after a certain time (typically 300 s) a defined amount of alkane is injected to the bottom of the cuvette. The cell is closed such that after a few minutes a saturated hexane vapor atmosphere is established. No extra pressure in the cell after drop formation or alkane injection is expected. Further, the interfacial tension is measured as explained in the text above.
CHAPTER 4
Results and discussion
‐ 20 ‐
The results briefly discussed in this section have been the subject of publications in peer reviewed journals. The details of each publication are not repeated here but only the respective main subjects and some selected results. All details are given in the copies of the manuscripts or reprints attached further below. The results enclosed in the PhD thesis can be divided into two parts, the thermodynamics of surfactant adsorption layers, as one part, and kinetics and rheology of surfactants adsorption layers, as second part. Generally in these experiments we used common surfactants, such as alkyl trimethylammonium bromides and sodium dodecyl sulphate. Another part of the investigations were dedicated to macromolecules, such as Pluronics and polyallylamine hydrochloride (polyelectrolyte).
4.1 Thermodynamics of surfactant adsorption layers
It is essential to know the influence of impurities on surfactant adsorption properties (Paper 1). Because of its chemical structure, dodecanol is surface active and tends to adsorb at water surfaces, which in general disturbs the adsorption of SDS particularly at the water/air interface. On the contrary, at the water/hexane interface dodecanol transfers to the hexane phase and does not leave any remarkable effect on the interfacial pressure. It was found in Paper 2 that at the water/oil interface, the adsorption of the studied surfactant starts at lower concentrations than at the water/air interface. Due to the affinity of the hydrophobic chain for the oil phase, the surfactants interact with the alkane molecules located at the interface which favors their adsorption. At high surface coverage, it is seen that for C12TAB, C14TAB and C16TAB the surfactants´ adsorbed
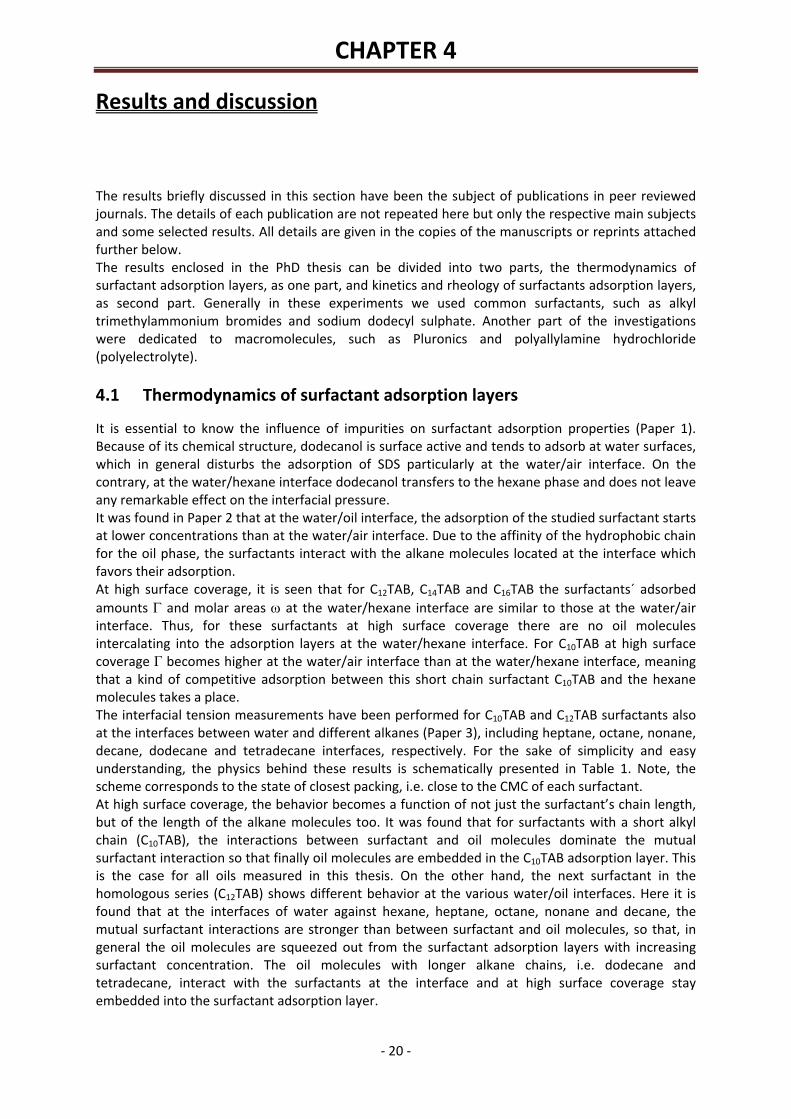
amounts and molar areas at the water/hexane interface are similar to those at the water/air interface. Thus, for these surfactants at high surface coverage there are no oil molecules intercalating into the adsorption layers at the water/hexane interface. For C10TAB at high surface coverage Γ becomes higher at the water/air interface than at the water/hexane interface, meaning that a kind of competitive adsorption between this short chain surfactant C10TAB and the hexane molecules takes a place. The interfacial tension measurements have been performed for C10TAB and C12TAB surfactants also at the interfaces between water and different alkanes (Paper 3), including heptane, octane, nonane, decane, dodecane and tetradecane interfaces, respectively. For the sake of simplicity and easy understanding, the physics behind these results is schematically presented in Table 1. Note, the scheme corresponds to the state of closest packing, i.e. close to the CMC of each surfactant. At high surface coverage, the behavior becomes a function of not just the surfactant’s chain length, but of the length of the alkane molecules too. It was found that for surfactants with a short alkyl chain (C10TAB), the interactions between surfactant and oil molecules dominate the mutual surfactant interaction so that finally oil molecules are embedded in the C10TAB adsorption layer. This is the case for all oils measured in this thesis. On the other hand, the next surfactant in the homologous series (C12TAB) shows different behavior at the various water/oil interfaces. Here it is found that at the interfaces of water against hexane, heptane, octane, nonane and decane, the mutual surfactant interactions are stronger than between surfactant and oil molecules, so that, in general the oil molecules are squeezed out from the surfactant adsorption layers with increasing surfactant concentration. The oil molecules with longer alkane chains, i.e. dodecane and tetradecane, interact with the surfactants at the interface and at high surface coverage stay embedded into the surfactant adsorption layer.
Results and discussion
‐ 21 ‐
Table 1: Scheme of the molecular interactions between different chain lengths surfactant and oil molecules.
In contrast to the water/oil interface, a competitive adsorption is observed for all aqueous CnTAB solutions at the water/hexane vapor interface (Paper 4). With increasing CnTAB surface concentration, the hexane molecule co‐adsorption is more efficient. Probably, the surfactant chains act like collectors for hexane molecules, to which they bind via hydrophobic (van der Waals) interactions. Following the low‐molecular surfactants´ adsorption characterization, their interaction with polyelectrolytes and the formation of mixed adsorption layers were investigated too (Paper 9). It was found that the interfacial characteristics of PAH/SDS complexes depend on the concentration of SDS. With increasing SDS concentration the system passes through three states. The first state happens when PAH/SDS complexes adsorb to the water/hexane interface, the second is indicated as a flat part of the adsorption isotherm revealing that the interface is more or less saturated with PAH/SDS complexes. In the final third state the PAH/SDS complexes become hydrophilic again due to the hydrophobic interaction between the complex and the additionally available SDS molecules. The complexes desorb back into the bulk phase, replaced by adsorbed free SDS molecules.
4.2 Kinetics and rheology of surfactant adsorption layers
For investigations of the adsorption kinetics and dilational rheology it is important to know that with increasing surfactant concentration the adsorption kinetics is accelerated, i.e. a shorter time is needed to establish the adsorption equilibrium. This influences the selection of suitable interfacial tension and rheology methods for characterizing a particular surfactant (Paper 5). It was found that usually the combination of two or more techniques is necessary to gain the whole adsorption kinetics curves for the complete range of concentrations. It is also seen (Paper 6) that the capillary pressure tensiometer is a powerful technique that covers a broad time range starting from 0.01 s (or 0.0002 s for an air bubble in water when it works on the principle of bubble pressure tensiometry). For studies of the dilational rheology the capillary pressure tensiometer is capable of producing relatively high frequencies, from 0.1 Hz to 100 Hz. With improving the geometry of the capillary, it is possible to perform also experiments at higher frequencies. The influence of impurities on the adsorption kinetics is essential. Comparing the adsorption kinetics at the water/hexane with that at the water/air interface [104] it is evident that at the water/air interface the dodecanol adsorption additionally decreases the surface tension gradually over a long adsorption time. This is not the case at the water/hexane interface where the adsorption equilibrium depends just on the SDS concentration and it is reached much faster than at the water/air interface. This can be explained only by the transfer of dodecanol molecules to the hexane
Results and discussion
‐ 22 ‐
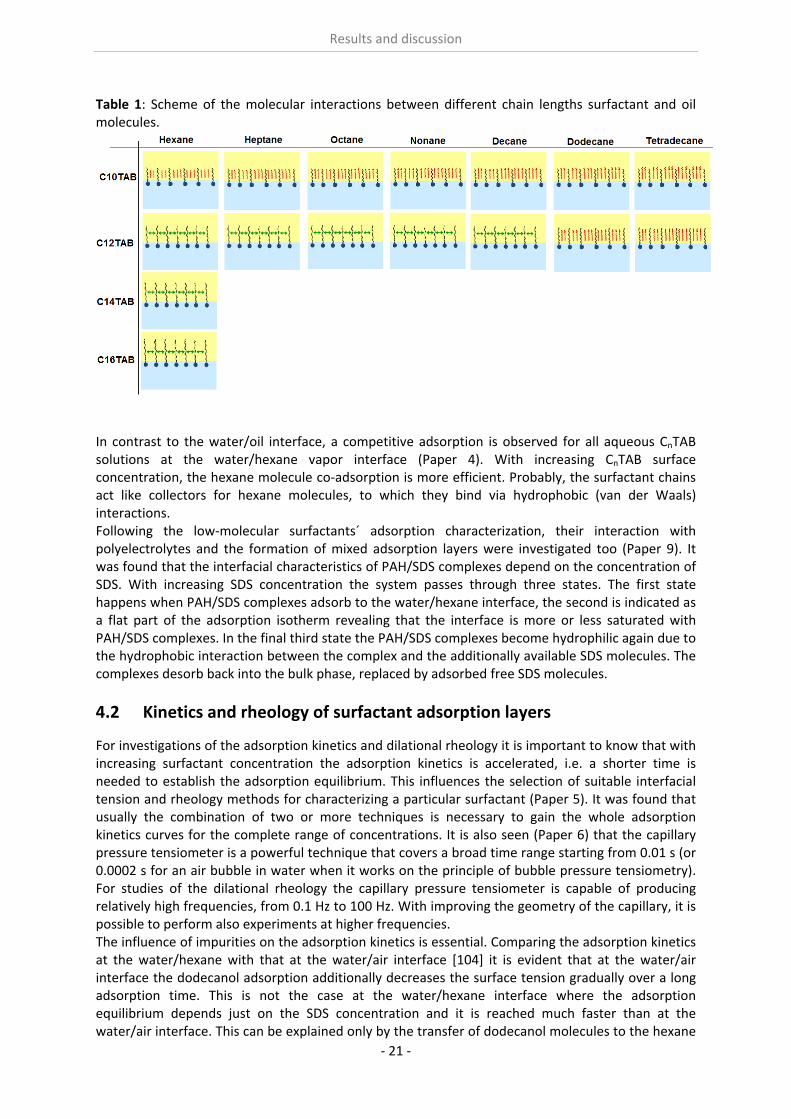
phase without interfering remarkably with the SDS adsorption. Therefore, at the water/hexane interface it is possible to theoretically describe just SDS adsorption without taking into account the competitive adsorption of dodecanol (Fig. 11) as is the case at the water/air interface.
Figure 11. Dynamic surface tension of SDS solutions 10‐5 (), 10‐4 (), 510‐4 () mol/l in aqueous buffer at pH 7 against hexane, compared with data calculated with the Frumkin (solid thin line) and Langmuir (dotted thin line) adsorption model. Note, the theoretical curves in Fig. 11 are not best fits but just result from the equilibrium adsorption parameter and an average diffusion coefficient for the SDS molecules. In Paper 7 it is shown that each surfactant has a characteristic adsorption time in which the adsorption can be followed if the instrument provides an adequate measuring time window. Combining the profile analysis and capillary pressure tensiometry it is possible to measure completely the adsorption kinetics of C16TAB and C14TAB surfactants at the water/hexane interface. For the shorter chains C12TAB and C10TAB mainly the equilibrium interfacial tension can be measured. However, it is not needed to have the whole adsorption kinetic curve in order to successfully fit the experimental data by a theoretical model. The most important is that a major part of the curve is available before reaching equilibrium. If not, the fitting of such a curve can lead to unrealistic values of the model parameters. The same rules work for measurements of the dilational rheology too. The fitting of the experimental dilational visco‐elasticity data with theoretical models (Frumkin Ionic Compressibility and Langmuir Compressibility), which are primarily made for water/air interfaces, can lead to slightly different values as compared to the kinetic and equilibrium values of the adsorption model parameters. This is possibly caused by additional processes at the water/hexane interface. It might be that oil molecules participate in the dynamics more than expected and those mechanisms cannot be described yet quantitatively by the existing theoretical models. The adsorption of macromolecules such as Pluronics is followed by the formation of multilayers at the water/hexane interface (Paper 8). It was found that the Pluronics P9400 and L64 form three layers (m = 3) and F68 two layers (m = 2) at the water/hexane interface. For mixtures of polyelectrolyte and surfactant (PAH/SDS) it was found that the values of dilational elasticity and viscosity depend on the concentration of both components (Paper 9). The high dilational elasticity for the mixtures at low surfactant concentration indicates that the PAH/SDS complexes are adsorbed at the interface and have adsorption and desorption relaxation times longer than the pure SDS molecules. The further increase of the surfactant concentration leads to an
Results and discussion
‐ 23 ‐
increase of the dilational elasticity and then a sharp decrease at higher concentrations presumably due to the destruction of the two‐dimensional rigid structure and the formation of micro‐aggregates in the interfacial layer.
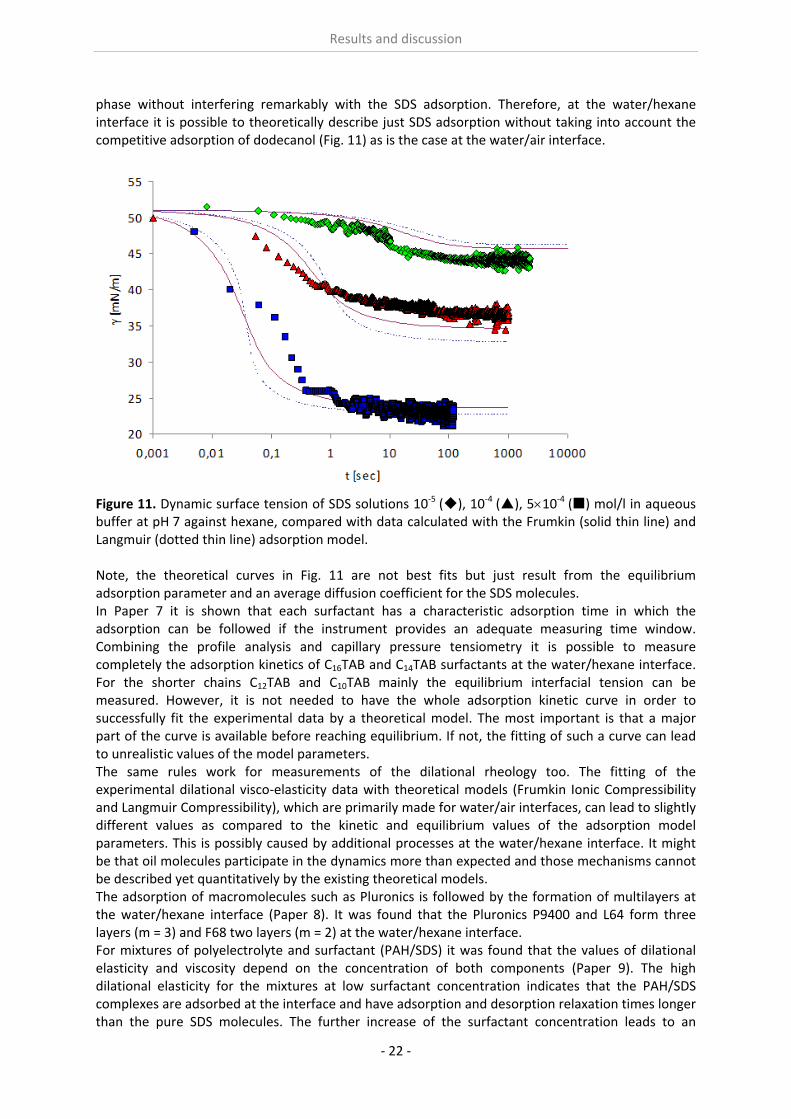
Application example In paper 10 a practical implementation of the fundamental knowledge in interfacial science for controlling the emulsion stability and breaking was approached. Generally, the competitive adsorption of two different types of surfactants, i.e. one aqueous and one oil soluble surfactant, can lead to the break‐down of an emulsion. The competitive adsorption is possible only when appropriate concentrations of both surfactants are reached. By changing the concentration of the oil soluble surfactant, the emulsion breaks after a longer or shorter time or can last for long or short
times, respectively. From Fig. 12 it is seen that by adding 1.3710‐3 mol/l Span80 into the oil phase (Dimeticone) the break‐down time is significantly shorter than for the emulsion formed with pure oil. The stability time, after which the emulsions start breaking down, is for both samples similar and amounts to around 25 s.
Figure 12. Comparison of the emulsion break‐down in presence and absence of surfactant in the oil
phase; 10 diluted water with emulsifier as water phase and dimeticone without surfactant (left)
and with c = 1.3710‐3 mol/l Span80 (right).
CHAPTER 5
Conclusions
‐ 24 ‐
Thermodynamics of surfactant adsorption layer The dynamic and equilibrium interfacial tensions of SDS solutions against hexane can be obtained without disturbing effects by the presence of the natural impurity dodecanol due to its good solubility in hexane. As a result of this thesis it was shown that the interfacial tension isotherm of SDS can be well described by the Frumkin adsorption model. In such a way the diffusion coefficient can be obtained from the dynamic interfacial tensions at the water/hexane interface without any influence of the presence of C12OH, in contrast to data observed at the water/air interface. C12OH dissolved in water shows a significant decrease of the surface tension against air even at very small concentrations. On the other hand, C12OH dissolved in hexane does not show any remarkable surface activity. The results obtained from CnTAB buffer solutions at the water/air interface have shown a strong increase of the adsorption due to the screening by the added electrolyte leading to a decrease of electrostatic repulsion. The experiments in the presented thesis show, that at the water/oil interface, the high adsorbed amounts are due to the presence of oil molecules which interact with the surfactants at low surface coverage. At high surface coverage, the behavior becomes a function of the surfactant chain length and the length of the oil molecule too. We concluded in this work that we deal here with a kind of competitive adsorption for the shortest chain surfactant (C10TAB) and all measured oils (hexane, heptane, octane, nonane, decane, dodecane and tetradecane). For the longer chain surfactant (C12TAB), the mutual interactions are strong enough to replace the molecules of the all measured oils at the interface except dodecane and tetradecane. With dodecane and tetradecane a competitive adsorption was observed. C14TAB and C16TAB show strong surfactant mutual interactions and single adsorption layers without embedded hexane molecules. In the presence of phosphate buffer, the use of a modified Frumkin Ionic Compressibility model (FIC), taking into account the average activity of the ions, has shown a remarkable accuracy in the determination of the fitting parameters and for the calculation of the adsorbed amount and molar area as compared with the classical Frumkin model. The studies performed in this thesis on the co‐adsorption of surfactants with oil molecules from the vapor phase clearly demonstrate that the interfacial layers incorporate or squeeze out the oil between the surfactant chains, depending on the alkyl chain lengths of both components. This phenomenon is observed at the water/bulk oil interface as well. Hence, the water/oil vapor interface can serve as an intermediate situation providing several advantages from an experimental point of view. However, basic theoretical models for a quantitative data analysis are yet pending. A good complementary work would be to study these systems with neutron reflectivity, ellipsometry or sum frequency spectroscopy in order to reach as close as possible the values of the adsorbed amount in the presence of buffer.
Kinetics and rheology of surfactant adsorption layers As part of this thesis we have analyzed the suitability of available experimental tools and found that for a given surfactant one can estimate whether the adsorption kinetics and dilational rheology can be studied appropriately, and which experimental methods are most suitable, using the Langmuir adsorption model and the Ward and Tordai equation for diffusion controlled adsorption processes. Fast dynamic liquid interfaces require sophisticated techniques such as the Oscillating Drop and Bubble Analyzer (ODBA) and a suitable way of its use. Optimization of the experimental setup is very important. Smaller drops are favorable as the measured absolute capillary pressure is higher, however, it is increasingly difficult to handle defined changes of smaller amounts of liquids by the dosing systems, such as syringes or piezo translators. Note, smaller drops require more narrow capillaries, which can cause much higher hydrodynamic effects on the other hand. However, there is
Conclusions
‐ 25 ‐
an optimum capillary tip size and design according to the hydrodynamic effects which allows us presently to apply a reliable regular hydrodynamic analysis model for data gained at frequencies up to about 80 Hz. The adsorption kinetics and dilational rheology depend closely on the correct choice of the right instrument and theoretical model for analyzing the data afterwards. Generally the Langmuir compressibility model gives a good description of dynamic and rheological types of data. In the perfect case a single diffusion coefficient is used for fitting all thermodynamic, kinetic and dilational rheology experimental results. However, as example, for the studied cationic surfactants C14TAB and C16TAB it was necessary to manipulate the model parameters and choose different values of the diffusion coefficient to reach a perfect fit. From these findings of the thesis we were able to conclude that the different diffusion coefficients are caused by possible additional processes at the water/hexane interface during oscillations of the interface. The experimental data for the equilibrium and dynamic interfacial tensions of Pluronic triblock copolymers at their aqueous solution/hexane interface are compared with the theoretical values calculated from a thermodynamic model based on the analysis of the chemical potentials of the solvent and the dissolved substances. To reproduce the surface tension values at high bulk concentrations of the Pluronics, i.e. in the post‐critical range, a simple model is proposed which assumes the proportionality between the surface pressure of the solution and the adsorption of the polymer (expressed in kinetic units). The theoretical predictions agree well with the experimental data for physically reasonable values of the adsorption layer thickness and realistic values of the diffusion coefficient. For PAH/SDS mixtures the dilational elasticity values depend on the SDS concentrations. The increase of the SDS concentration in PAH/SDS mixtures, leads to a slight increase of the dilational elasticity up to a mixing ratio of n = cSDS/cPAH = 1, and then a sharp decrease is observed. This sharp decrease happens in a narrow range presumably due to the destruction of a two‐dimensional rigid structure and the formation of micro‐aggregates in the interfacial layer. The dilational viscosity of PAH/SDS mixtures for harmonic expansions/compressions of the water/hexane interface at small frequencies is much higher than for SDS alone. This effect could be caused by a release/binding relaxation of SDS molecules with the polymer at the interface.
Application example As a practical result in this thesis we proposed the competitive adsorption as a process suitable for controlling the break‐down of an emulsion. Adapting the concentration of the aqueous surfactant, the O/W emulsion stability can be improved or not depending on the number of aqueous surfactants at the interface. On the other hand, by changing the concentration of a surfactant in the oil phase, the O/W emulsion can break after longer or shorter time and can also last for a longer or shorter time, respectively, controlled by the dynamics of surfactant adsorption from either bulk phase.

‐ 26 ‐

‐ 27 ‐
ACKNOWLEDGEMENT I would like to express my sincerely gratitude to everyone from Interface department of Max Planck Institute: My supervisor Helmuth Möhwald and my group leader Reinhard Miller for believing in me and my work, great support with literature, instruments and limitless source of new ideas as well as many brainstorming discussions, enthusiasm and guidance. Without You, I would never grow up as a scientist so rapidly and determined. My excellent senior colleagues Jürgen Krägel, Dieter Vollhardt, Rainer Wüstneck, Nina M. Kovalchuk, Volodja I. Kovalchuk, Eugene V. Aksenenko and Valentin B. Fainerman for working patient with me, unselfishly sharing the knowledge, experience and ideas. I look up to all of You as Your careers are one of the goals I would like to achieve. Aliyar Javadi, Vincent Pradines, Georgi Gochev, Pablo Ramirez, James K. Ferri, Abhijit Dan, Alexander V. Makievski and Jaroslav M. Katona, have a special part in my heart as people who are on the right way to become great scientists and I had luck to closely work with them. My great young scientists and the age group where I belong, Altynay Sharipova, Narges Moradi, Vamseekrishna Ulaganathan, Jooyoung Y. Won and Mohsen Karbaschi. We have been sharing all problems that the young scientists have during the PhD study, supporting each other and trying to give answers on many for us difficult questions. I would like to give a special part in the acknowledgement to our dear technician Sabine Siegmund. Without her the experimental work would be much harder and definitely not so amusing. My family which I owe more than I would ever be possible to give back, I thank very much for support through all my education and life in general. The sweetest part in the acknowledgment list I left to thank to my wonderful wife Jelena for choosing me to be her husband and so going to share the joined future on behalf of love.
‐ 28 ‐
REFERENCES
1 E. Dickinson, Soft Mater. 4 (2008) 932‐942. 2 M.E. Leser, L. Sagalowicz, M. Michel, H.J. Watzke, Adv. Colloid Interface Sci. 123‐126 (2006) 125‐136. 3 R.H. Müller, C.M. Keck, J. Biotechnol. 133 (2004) 151‐170. 4 L.L. Schramm, E.N. Stasiuk, D.G. Marangoni, Annu. Rep. Prog. Chem. 99 (2003) 3‐48. 5 V.B. Fainerman, R. Miller, E.V. Aksenenko, A.V. Makievski, J. Krägel, G. Loglio, L. Liggieri, Adv. Colloid Interface Sci. 89 (2000) 83‐101. 6 C.‐H. Chang, E.I. Franses, Colloids Surf. A 100 (1995) 1‐45. 7 P. Warszynski, W. Barzyk, K. Lunkenheimer, H. Fruhner, J. Phys. Chem. B 102 (1998) 10948‐10957. 8 V. Pradines, D. Lavabre, J.‐C. Micheau, V. Pimienta, Langmuir 21 (2005) 11167‐11172. 9 V.B. Fainerman, R. Miller, E.V. Aksenenko, Adv. Colloid Interface Sci. 96 (2002) 339‐259. 10 K. Lunkenheimer, G. Czichocki, R. Hirte, W. Barzyk, Colloids Surf. A 101 (1995) 187‐197.
11 A.J. Prosser, E.I. Franses, Colloids Surf. A 178 (2001) 1‐40.
12 M.M. Knock, C.D. Bain, Langmuir 16 (2000) 2857–2865.
13 J.R. Lu, R.K. Thomas, J. Penfold, Adv. Colloid Interface Sci. 84 (2000) 143‐304.
14 A. Zarbakhsh, A. Querol, J. Bowers, J.R.P. Webster, Faraday Discuss. 129 (2005) 155‐167.
15 R. Aveyard, D.A. Haydon, J. Colloid Sci. 20 (1965) 2255‐2261.
16 S.R. Deshiikan, D. Bush, E. Eschenazi, K.D. Papadopoulos, Colloids Surf. A 136 (1998) 133‐150.
17 M. Mulqueen, D. Blankschtein, Langmuir 18 (2001) 365‐376.
18 F. Ravera, M. Ferrari, L. Liggieri, Adv. Colloid Interface Sci. 88 (2000) 129‐177.
19 R. Tadmouri, C. Zedde, C. Routaboul, J.‐C. Micheau, V. Pimienta, J. Phys. Chem. B 122 (2008) 12318‐12325.
20 E. Hutchinson, J. Colloid Sci. 3 (1948) 219‐234.
21 W.R. Gillap, N.D. Weiner, M. Gibaldi, J. Phys. Chem. 72 (1968) 2222‐2227.
22 L. Liggieri, F. Ravera, M. Ferrari, A. Passerone, R. Miller, J. Colloid Interface Sci. 186 (1997) 46.
23 R. Miller, V.B. Fainerman, H. Möhwald, J. Colloid Interface Sci. 247 (2002) 193.
24 A. Javadi, N. Moradi, V.B. Fainerman, H. Möhwald, R. Miller, Colloids Surf A 391 (2011) 19‐24.
25 R. Aveyard, B.P. Binks, P.D.I. Fletcher, J.R. Macnab, Ber. Bunser‐Ges. Phys. Chem. 100 (1996) 224‐231.
26 S.S. Dukhin, G. Kretzschmar, R. Miller In: D. Möbius, R. Miller, editors. Dynamics of adsorption at liquid interfaces: theory, experiment, application. Studies in Interface Science, Vol. 1, Amsterdam, Elsevier; 1995.
27 P. Joos, Dynamic surface phenomena. VSP: Dordrecht; 1999.
28 R. Miller and L. Liggieri (Eds.), Interfacial Rheology, Vol. 1, Progress in Colloid and Interface Science, Brill Publ., Leiden, 2009.
29 M.G. Munoz, F. Monroy, F. Ortega, R.G. Rubio, D. Langevin, Langmuir 16 (2000) 1083‐1093.
30 M.G. Munoz, F. Monroy, F. Ortega, R.G. Rubio, D. Langevin, Langmuir 16 (2000) 1094‐1101.
31 B.R. Blomqvist, J.W. Benjamins, T. Nylander, T. Arnebrant, Langmuir 21 (2005) 5061‐5068.
32 A. Hambardzumayan, V. Aguie‐Beghin, M. Daoud, R. Douillard, Langmuir 20 (2004) 756‐763.
33 R. Sedev, R. Steitz, G.H. Findenegg, Physica B 315 (2002) 267‐272.
34 J.B. Vieira, Z.X. Li, R.K. Thomas, J. Phys. Chem. B 106 (2002) 5400‐5407.
35 J.B. Vieira, Z.X. Li, R.K. Thomas, J. Penfold, J. Phys. Chem. B 106 (2002) 10641‐10648.
36 A. Hambardzumyan, V. Aguir‐Beghin, M. Daoud, R. Douillard. Langmuir 20 (2004) 756‐763.
37 B.R. Blomqvist, T. Warnheim, P.M. Claesson, Langmuir 21 (2005) 6373‐6384.
38 C. Kim, H. Yu, Langmuir 19 (2003) 4460‐4464.
39 F. Monroy, F. Ortega, R.G. Rubio, B.A. Noskov, Surface rheology studies of spread and adsorbed polymer layer, in: R. Miller, L. Liggieri (Eds.), Interfacial Rheology, Brill, Leiden, 2009.
40 B.A. Noskov, Curr. Opin. Colloid Interface Sci. 15 (2010) 229‐236.
41 B.A. Noskov, A.V. Akentiev, G. Loglio, R. Miller, J. Phys. Chem. B 104 (2000) 7923‐7931.
42 Hong‐Bo Fang, Colloid. Polym. Sci. 287 (2009) 1131‐1137.
43 W. Schönfeldt, Grenzflächenaktive Äthylenoxyd‐Addukte – ihre Herstellung, Eigenschaften, Anwendung und Analyse, Wissenschafts Verlag mbH, Stuttgart, 1976.
44 Nonionic Surfactant: Organic Chemistry, N.M. Van Os (Ed.), Surfactant Sci. Ser., Vol. 72, Marcel Dekker, New York, 1997.
45 R. Miller, P. Joos, V.B. Fainerman, Adv. Colloid Interface Sci. 49 (1994) 249‐302.
46 N. Mucic, A. Javadi, N.M. Kovalchuk, E.V. Aksenenko, R. Miller, Adv. Colloid Interface Sci. 168 (2011) 167‐178.
47 V.B. Fainerman, S.V. Lylyk, E.V. Aksenenko, J.T. Petkov, J. Yorke, R. Miller, Colloid Surfaces A 354 (2010) 8‐15.
48 J.A. De Feijter, J. Benjamins, F.A. Veer, Biopolymers 17 (1978) 1759.
49 H. Motschmann, R. Teppner, Ellipsometry in Interfacial Science in “Novel Methods to study interfacial layers” D. Möbius and R. Miller, Studies in Interface Science, Vol. 11, Amsterdam, Elsevier, (2001).
50 J.P.R. Day, P.D.A. Pudney, C.D. Bain, Phys. Chem. Chem. Phys. 12 (2010) 4590‐4599.
51 S.C. Russev, T.Vl. Arguirov, T.D. Gurkov, Colloids Surfaces B 19 (2000) 89‐100.
52 D. Langevin, Light Scattering by Liquid Surfaces and Complimentary Techniques, Marcel Dekker (Eds.), New York, 1992.
53 D. Vollhardt, G. Czichocki, R. Rudert, Colloids Surfaces A, 76 (1993) 217.
54 A. Martin, M. Bos, M.C. Stuart, T. Vliet, Langmuir 18 (2002) 1238‐1243.
55 J. Benjamins, A. Cagna, E.H. Lucassen‐Reynders, Colloids Surfaces A, 114 (1996) 245‐254.
56 G. Kretzschmar, K. Lunkenheimer, Ber. Bunsenges, Phys. Chem. 74 (1970) 1064.
57 L.Y. Wang, M. Schonhoff, H. Möhwald, J. Physical Chemistry B. 106 (2002) 9135‐9142.
58 L.Y. Wang, M. Schonhoff, H. Möhwald, J. Physical Chemistry B 108 (2004) 4767‐4774.
59 A.R. Mackie, A.P. Gunning, M.J. Ridout, P.J. Wilde, J.R. Patino, Biomacromolecules 2 (2001) 1001‐1006.
60 Tzung‐Han Chou, Yu‐Shun Lin, Wei‐Ta Li, Chien‐Hsiang Chang, J. Colloid Interface Sci. 321 (2008) 384‐392.
61 S. Uredat, G.H. Findenegg, Langmuir 15 (1999) 1108.
62 A.R. Mackie, A.P. Gunning, P.J. Wilde, V.J. Morris, Langmuir 16 (2000) 2242‐2247.
‐ 29 ‐
63 A.R. Mackie, A.P. Gunning, M.J. Ridout, P.J. Wilde, J.R. Patino, Biomacromolecules 2 (2001) 1001‐1006.
64 E. Bonaccurso, M. Kappl, H.J. Butt, Current Opinion Colloid Interface Sci. 13 (2008) 107‐119.
65 M.B.J. Meinders, G.G.M. van den Bosch, H.H.J. Jongh, Trends in Food Science & Technology, 11 (2000) 218.
66 A.N. Frumkin, Z. Phys. Chem. (Leipzig), 166(1925)446.
67 R. Wüstneck, R. Miller, J. Kriwanek, H.‐R. Holzbauer, Langmuir, 10(1994)3738.
68 R. Wüstneck, R. Miller, J. Kriwanek, J. Colloid Interface Sci., 1(1993)1.
69 E.H. Lucassen‐Reynders, J. Colloid Interface Sci., 42(1973)563.
70 B.P. Binks, P.D.I. Fletcher, W.F.C. Sager, R.L. Thompson, Adsorption of semifluorinated alkanes at hydrocarbon‐air surfaces, 1995.
71 B.V. Derjaguin, S.S. Dukhin, A.E. Yaroshchuk, On the role of the electrostatic factor in stabilization of dispersions protected by adsorption layers of polymers, 1986.
72 H. Diamant, G. Ariel, D. Andelman, Physicochemical and Engineering Aspects 183‐185 (2001) 259‐276.
73 http://en.wikipedia.org/wiki/File:Surfactant.jpg
74 I. Langmuir, J. Amer. Chem. Soc., 39 (1917) 1848.
75 V.B. Fainerman and R. Miller, Adsorption isotherms at liquid interfaces, Encyclopedia of Surface and Colloid Science, P. Somasundaran and A. Hubbard (Eds.), 2nd. Edition, 1 (2009) pp. 1.
76 B. Z. von Szyszkowski, Phys Chem (Leipzig) 1908;64:385.
77 A.N. Frumkin, Z Phys Chem (Leipzig) 1925; 116:466‐85.
78 V.B. Fainerman, V.I. Kovalchuk, E.V. Aksenenko, M. Michel, M.E. Leser, R.Miller, J. Phys. Chem. B 108 (2004) 13700.
79 V.B. Fainerman, S.V. Lylyk, E.V. Aksenenko, A.V. Makievski, J.T. Petkov, J. Yorke, R. Miller, Coll. Surf. A 334 (2009), 1.
80 A. Ward F.H. and L. Tordai, J. Phys. Chem., 14 (1946) 453.
81 M. Ziller and R. Miller, Colloid Polymer Sci., 264(1986)611
82 M. van den Tempel, J. Lucassen and E.H. Lucassen‐Reynders, J.Phys.Chem., 69 (1965) 1798‐1804.
83 J. Lucassen and M. van den Tempel, Chem. Eng. Sci., 27 (1972) 1283.
84 J. Lucassen and M. van den Tempel, J. Colloid Interface Sci., 41 (1972) 491.
85 K. Tonigold, I. Varga, T. Nylander, R.A. Campbell, Langmuir 25 (2009) 4036.
86 A.H. Demond, A.S. Lindner, Environ.Sci.Technol. 27 (1993) 2318‐2331
87 L. Liggieri, F. Ravera, A. Passerone, J. Colloid Interface Sci. 169 (1995) 226
88 V.I. Kovalchuk, F. Ravera, L. Liggieri, G. Loglio, A. Javadi, M.N. Kovalchuk, et al. Studies in capillary pressure tensiometry and interfacial dilational rheology. In: R. Miller, L. Liggieri, editors. Bubble and drop interfaces. Progress in Colloid and Interface Science Leiden: Brill Publ.; 2011. p. 175.
89 G. Loglio, P. Pandolfini, L. Liggieri, A.V. Makievski, F. Ravera, Determination of interfacial properties by the pendant drop tensiometry: optimization of experimental and calculation procedures. In: R. Miller, L. Liggieri, editors. Bubble and drop interfaces. Progress in Colloid and Interface Science Leiden: Brill Publ. ; 2011.p. 8.
90 R. Nagarajan, D.T. Wasan, J. Colloid Interface Sci. 159 (1993) 164.
91 C.A. MacLeod, C.J. Radke, J. Colloid Interface Sci. 160 (1994) 435.
92 X. Zhang, T. Harris, O.A. Basaran, J. Colloid Interface Sci. 168 (1994) 47.
93 A. Javadi, J. Krägel, P. Pandolfini, G. Loglio, V.I. Kovalchuk, E.V. Aksenenko, et al. Colloids Surf. A 365 (2010) 62.
94 L. Liggieri, F. Ravera, A. Passerone, J. Colloid Interface Sci. 169 (1995) 22.
95 L. Liggieri, F. Ravera, A. Passerone, A. Sanfeld, A. Steinchen, Lect Notes Phys. 467 (1996) 175.
96 P.J. Breen, Langmuir 11 (1995) 885.
97 V.I. Kovalchuk, F. Ravera, L. Liggieri, G. Loglio, P. Pandolfini, A.V. Makievski, S. Vincent‐Bonnieu, J. Krägel, A. Javadi, R. Miller, Adv. Colloid Interface Sci. 161 (2010) 102.
98 J.M. Soos, K. Koczo, E. Erdos, D.T. Wasan, Rev. Sci. Instrum. 65 (1994) 3555.
99 V.I. Kovalchuk, A.V Makievski, J. Krägel, P Pandolfini, G. Loglio, L. Liggieri, F. Ravera, R. Miller, Colloids Surfaces A 261 (2005) 115.
100 D. Georgieva, A. Cagna, D. Langevin, Soft Matter 5 (2009) 2063.
101 H. Bianco, A. Marmur, J. Colloid Interface Sci. 158 (1993) 295.
102 R. Miller, V.B. Fainerman, A.V. Makievski, M. Ferrari, G. Loglio, Measuring dynamic surface tensions. In: Holmberg K., editor. Handbook of applied colloid and surface science. John Wiley & Sons; 2001. p. 775.
103 C. Maze, G. Burnet, Surface Sci. 13 (1969) 451.
104 V.B. Fainerman, S.V. Lylyk, E.V. Aksenenko, J.T. Petkov, J. Yorke, R. Miller, Colloids Surf. A 354 (2010) 8.

Paper I
Effects of dodecanol on the adsorption kinetics of SDS at the water/hexane interface A. Javadi, N. Mucic, D. Vollhardt, V.B. Fainerman and R. Miller Journal of Colloid and Interface Science 351 (2010) 537‐541.
Author's personal copy
Effects of dodecanol on the adsorption kinetics of SDS at the water–hexane interface
A. Javadi a,*, N. Mucic a, D. Vollhardt a, V.B. Fainerman b, R. Miller a
aMax-Planck-Institut für Kolloid- und Grenzflächenforschung, Am Mühlenberg 1, 14424 Potsdam, GermanybDonetsk Medical University, 16 Ilych Avenue, 83003 Donetsk, Ukraine
a r t i c l e i n f o
Article history:Received 25 April 2010Accepted 15 July 2010Available online 18 July 2010
Keywords:Adsorption kineticsSodium dodecyl sulphate (SDS)Oil/water interfaceTensiometryDodecanol effects
a b s t r a c t
Even though sodium dodecyl sulphate (SDS) is the most frequently studied surfactant, its properties atliquid interfaces are not easily accessible. This is mainly caused by the fact that in aqueous solutionSDS is subject to hydrolysis, by which the homologous dodecanol (C12OH) is formed. Due to its enor-mously high surface activity it competes with SDS at the interface. We demonstrate here that this ‘‘nat-ural” impurity C12OH does not remarkably affect the adsorption dynamics of SDS at the water/hexaneinterface, due to its high solubility in hexane. Therefore, the dynamic adsorption properties can be deter-mined independent of disturbing dodecanol effects. The surfactant adsorbs diffusion controlled and theinterfacial tension isotherm at the water/hexane interface is well described by a Frumkin model. How-ever complementary experiments via direct admixture of dodecanol in hexane indicate a significantdecrease in interfacial tension of the water–hexane interface at concentrations higher than 103 mol/lin hexane. This condition may happen when the oil phase is distributed as small droplets in a high con-centrated solution of SDS. The distribution coefficient of C12OH between water and hexane is estimatedfrom adsorption experiments to be Kp = co/cw = 6.7 103.
2010 Elsevier Inc. All rights reserved.
1. Introduction
A clear understanding of the adsorption mechanism of amphi-philes from aqueous solutions is of eminent importance in a major-ity of technical applications [1–3]. An important prerequisite for acorrect analysis of this adsorption mechanism is the absence of anysurface active impurities in the sample solution. For some evenhighly purified substance it can however happen that impuritiesare produced as soon as the sample is dissolved in water. For alkylsulphates this was frequently described in literature [4–7]. Despitemany attempts, it is still very difficult for example to determinequantitatively the dynamic adsorption properties of sodium dode-cyl sulphate (SDS) at the solution/air interface. Although being themost frequently studied surfactant worldwide, there are all kindsof adsorption mechanisms discussed in literature, as it was sum-marised recently in [8]. In the same work it was demonstrated thatassuming a certain (although unknown) amount of dodecanol, theadsorption kinetics of SDS follows a clear diffusion controlledmechanism.
For adsorption studies at liquid–liquid interfaces there is gener-ally rather little work done, which is due to the higher complexityof interfaces between two immiscible liquids and significant diffi-culties with the adaptation of measuring tools to such systems [9].
Therefore, even for SDS there are very few investigations at water–oil interfaces as stressed in [10].
The first systematic adsorption study of non-ionic surfactants atthe water/oil interface has shown that in particular the solubility ofan amphiphile in water and oil leads to interesting time dependen-cies of surface tension c(t) [11]. Depending on the volume ratio ofwater and oil, the initial concentrations of the surfactant in the twophases and the partition coefficient, a minimum in c(t) can be ob-served and explained by the transfer of surfactant from the phaseof smaller volume to the other phase [12].
In the present work we present investigations on SDS solutionsusing a surfactant sample without prior purification from possiblesurface active impurities. The major amount of potential impuritiesin SDS samples is the homologous alcohol dodecanol (C12OH) [13].Compared to SDS, C12OH is only slightly soluble in water andabout 400 times higher surface active at the water/air interface[14]. The effect of dodecanol on the co-adsorption with SDS fromaqueous solutions at the air/water interface has been investigatedby various methods, such as surface pressure measurements atequilibrium and dynamic conditions, Brewster angle microscopy(BAM) and Grazing incidence X-ray diffraction (GIXD) [15–17]. Itwas shown that already trace amounts of dodecanol in the solutionbulk can lead to an adsorption layer mainly containing C12OH.
In water/oil systems we can expect an excellent solubility ofC12OH in the oil phase [18], i.e. dodecanol will not be highly sur-face active at this interface. Therefore, we can expect that theadsorption of SDS from the aqueous phase at the water/hexane
0021-9797/$ - see front matter 2010 Elsevier Inc. All rights reserved.doi:10.1016/j.jcis.2010.07.033
* Corresponding author.E-mail address: [email protected] (A. Javadi).
Journal of Colloid and Interface Science 351 (2010) 537–541
Contents lists available at ScienceDirect
Journal of Colloid and Interface Science
www.elsevier .com/locate / jc is
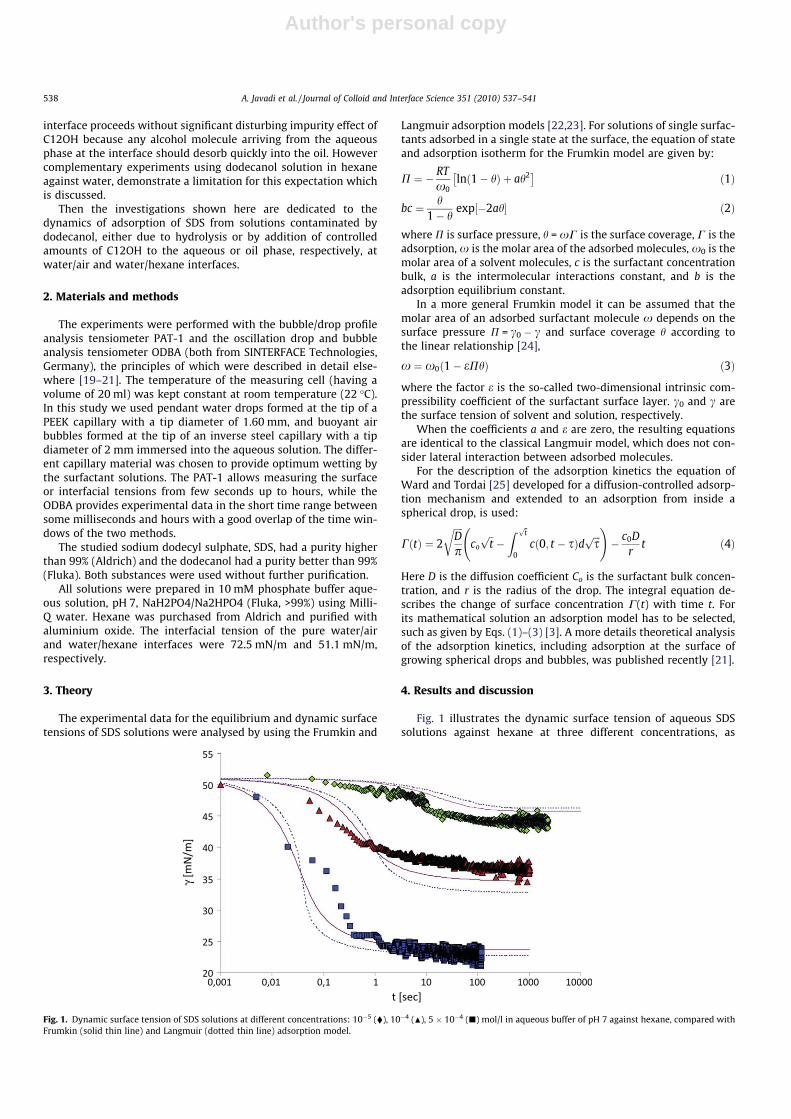
Author's personal copy
interface proceeds without significant disturbing impurity effect ofC12OH because any alcohol molecule arriving from the aqueousphase at the interface should desorb quickly into the oil. Howevercomplementary experiments using dodecanol solution in hexaneagainst water, demonstrate a limitation for this expectation whichis discussed.
Then the investigations shown here are dedicated to thedynamics of adsorption of SDS from solutions contaminated bydodecanol, either due to hydrolysis or by addition of controlledamounts of C12OH to the aqueous or oil phase, respectively, atwater/air and water/hexane interfaces.
2. Materials and methods
The experiments were performed with the bubble/drop profileanalysis tensiometer PAT-1 and the oscillation drop and bubbleanalysis tensiometer ODBA (both from SINTERFACE Technologies,Germany), the principles of which were described in detail else-where [19–21]. The temperature of the measuring cell (having avolume of 20 ml) was kept constant at room temperature (22 C).In this study we used pendant water drops formed at the tip of aPEEK capillary with a tip diameter of 1.60 mm, and buoyant airbubbles formed at the tip of an inverse steel capillary with a tipdiameter of 2 mm immersed into the aqueous solution. The differ-ent capillary material was chosen to provide optimum wetting bythe surfactant solutions. The PAT-1 allows measuring the surfaceor interfacial tensions from few seconds up to hours, while theODBA provides experimental data in the short time range betweensome milliseconds and hours with a good overlap of the time win-dows of the two methods.
The studied sodium dodecyl sulphate, SDS, had a purity higherthan 99% (Aldrich) and the dodecanol had a purity better than 99%(Fluka). Both substances were used without further purification.
All solutions were prepared in 10 mM phosphate buffer aque-ous solution, pH 7, NaH2PO4/Na2HPO4 (Fluka, >99%) using Milli-Q water. Hexane was purchased from Aldrich and purified withaluminium oxide. The interfacial tension of the pure water/airand water/hexane interfaces were 72.5 mN/m and 51.1 mN/m,respectively.
3. Theory
The experimental data for the equilibrium and dynamic surfacetensions of SDS solutions were analysed by using the Frumkin and
Langmuir adsorption models [22,23]. For solutions of single surfac-tants adsorbed in a single state at the surface, the equation of stateand adsorption isotherm for the Frumkin model are given by:
P ¼ RTx0
lnð1 hÞ þ ah2 ð1Þ
bc ¼ h1 h
exp½2ah ð2Þ
whereP is surface pressure, h =xC is the surface coverage, C is theadsorption,x is the molar area of the adsorbed molecules, x0 is themolar area of a solvent molecules, c is the surfactant concentrationbulk, a is the intermolecular interactions constant, and b is theadsorption equilibrium constant.
In a more general Frumkin model it can be assumed that themolar area of an adsorbed surfactant molecule x depends on thesurface pressure P = c0 c and surface coverage h according tothe linear relationship [24],
x ¼ x0ð1 ePhÞ ð3Þwhere the factor e is the so-called two-dimensional intrinsic com-pressibility coefficient of the surfactant surface layer. c0 and c arethe surface tension of solvent and solution, respectively.
When the coefficients a and e are zero, the resulting equationsare identical to the classical Langmuir model, which does not con-sider lateral interaction between adsorbed molecules.
For the description of the adsorption kinetics the equation ofWard and Tordai [25] developed for a diffusion-controlled adsorp-tion mechanism and extended to an adsorption from inside aspherical drop, is used:
CðtÞ ¼ 2
ffiffiffiffiDp
rco
ffiffit
pZ ffiffi
tp
0cð0; t sÞd ffiffiffi
sp
! c0D
rt ð4Þ
Here D is the diffusion coefficient Co is the surfactant bulk concen-tration, and r is the radius of the drop. The integral equation de-scribes the change of surface concentration C(t) with time t. Forits mathematical solution an adsorption model has to be selected,such as given by Eqs. (1)–(3) [3]. A more details theoretical analysisof the adsorption kinetics, including adsorption at the surface ofgrowing spherical drops and bubbles, was published recently [21].
4. Results and discussion
Fig. 1 illustrates the dynamic surface tension of aqueous SDSsolutions against hexane at three different concentrations, as
Fig. 1. Dynamic surface tension of SDS solutions at different concentrations: 105 (), 104 (N), 5 104 (j) mol/l in aqueous buffer of pH 7 against hexane, compared withFrumkin (solid thin line) and Langmuir (dotted thin line) adsorption model.
538 A. Javadi et al. / Journal of Colloid and Interface Science 351 (2010) 537–541
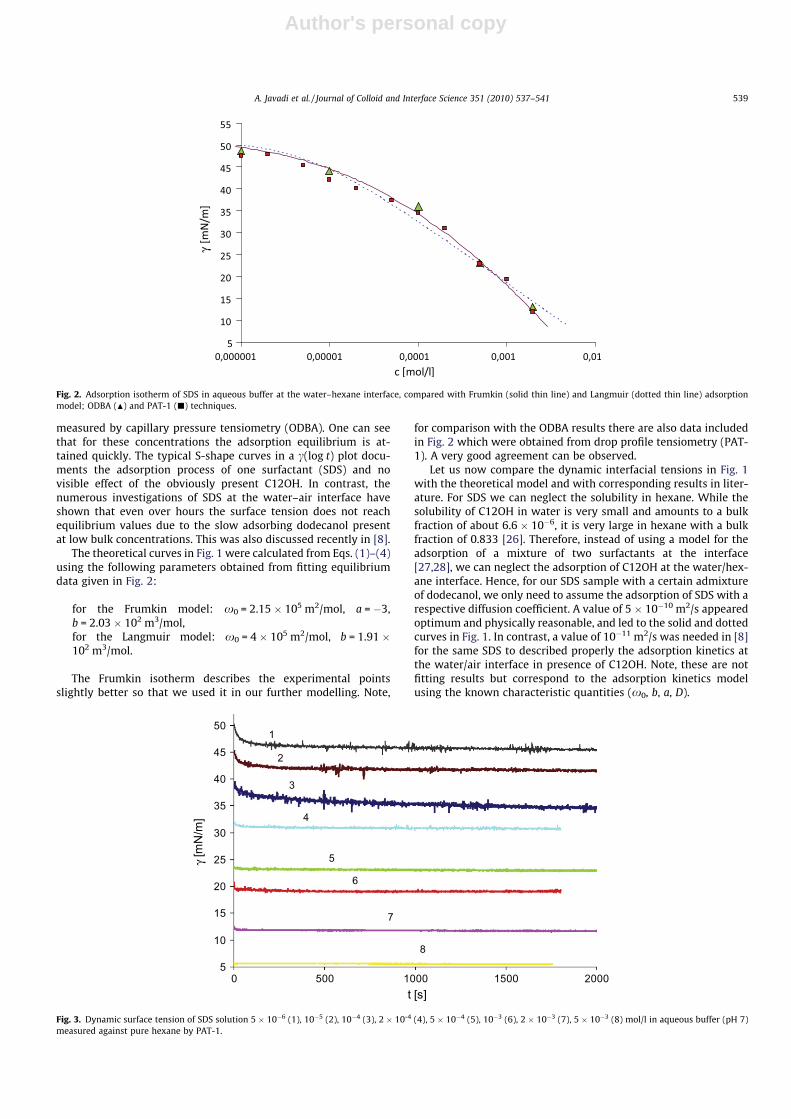
Author's personal copy
measured by capillary pressure tensiometry (ODBA). One can seethat for these concentrations the adsorption equilibrium is at-tained quickly. The typical S-shape curves in a c(log t) plot docu-ments the adsorption process of one surfactant (SDS) and novisible effect of the obviously present C12OH. In contrast, thenumerous investigations of SDS at the water–air interface haveshown that even over hours the surface tension does not reachequilibrium values due to the slow adsorbing dodecanol presentat low bulk concentrations. This was also discussed recently in [8].
The theoretical curves in Fig. 1 were calculated from Eqs. (1)–(4)using the following parameters obtained from fitting equilibriumdata given in Fig. 2:
for the Frumkin model: x0 = 2.15 105 m2/mol, a = 3,b = 2.03 102 m3/mol,for the Langmuir model: x0 = 4 105 m2/mol, b = 1.91 102 m3/mol.
The Frumkin isotherm describes the experimental pointsslightly better so that we used it in our further modelling. Note,
for comparison with the ODBA results there are also data includedin Fig. 2 which were obtained from drop profile tensiometry (PAT-1). A very good agreement can be observed.
Let us now compare the dynamic interfacial tensions in Fig. 1with the theoretical model and with corresponding results in liter-ature. For SDS we can neglect the solubility in hexane. While thesolubility of C12OH in water is very small and amounts to a bulkfraction of about 6.6 106, it is very large in hexane with a bulkfraction of 0.833 [26]. Therefore, instead of using a model for theadsorption of a mixture of two surfactants at the interface[27,28], we can neglect the adsorption of C12OH at the water/hex-ane interface. Hence, for our SDS sample with a certain admixtureof dodecanol, we only need to assume the adsorption of SDS with arespective diffusion coefficient. A value of 5 1010 m2/s appearedoptimum and physically reasonable, and led to the solid and dottedcurves in Fig. 1. In contrast, a value of 1011 m2/s was needed in [8]for the same SDS to described properly the adsorption kinetics atthe water/air interface in presence of C12OH. Note, these are notfitting results but correspond to the adsorption kinetics modelusing the known characteristic quantities (x0, b, a, D).
Fig. 2. Adsorption isotherm of SDS in aqueous buffer at the water–hexane interface, compared with Frumkin (solid thin line) and Langmuir (dotted thin line) adsorptionmodel; ODBA (N) and PAT-1 (j) techniques.
5
10
15
20
25
30
35
40
45
50
0 500 1000 1500 2000t [s]
γ [m
N/m
]
1
6
5
4
3
2
7
8
Fig. 3. Dynamic surface tension of SDS solution 5 106 (1), 105 (2), 104 (3), 2 10-4 (4), 5 104 (5), 103 (6), 2 103 (7), 5 103 (8) mol/l in aqueous buffer (pH 7)measured against pure hexane by PAT-1.
A. Javadi et al. / Journal of Colloid and Interface Science 351 (2010) 537–541 539
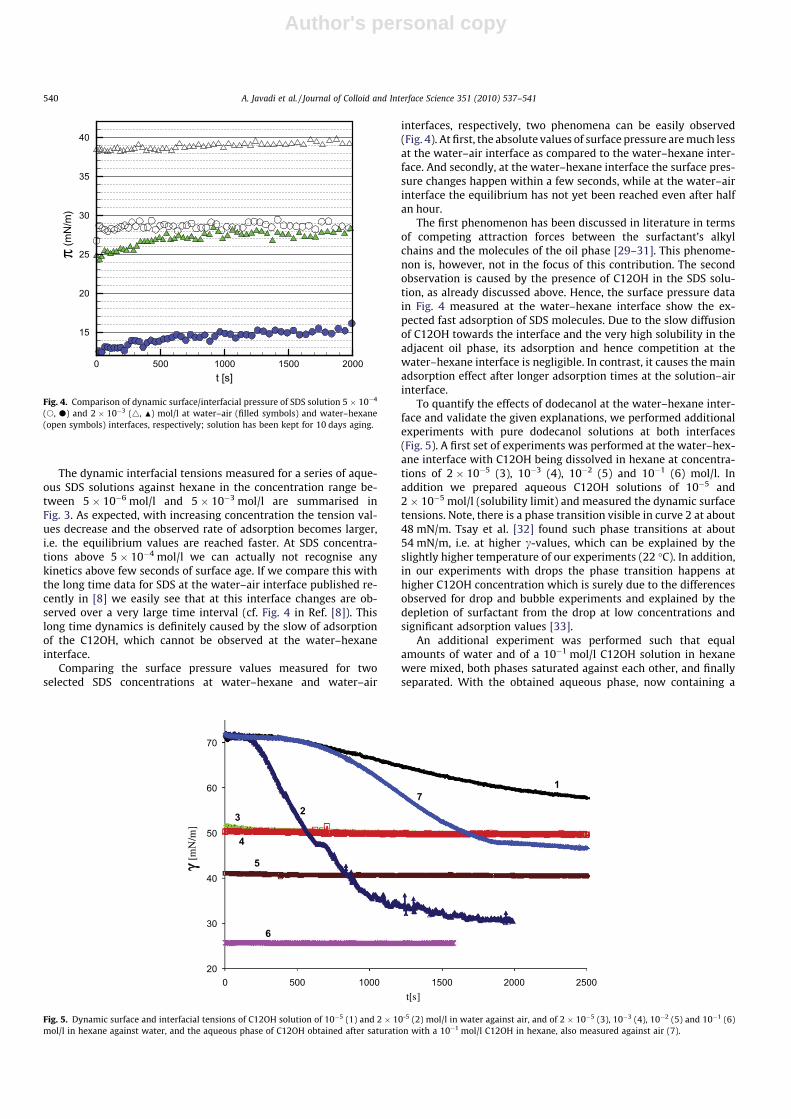
Author's personal copy
The dynamic interfacial tensions measured for a series of aque-ous SDS solutions against hexane in the concentration range be-tween 5 106 mol/l and 5 103 mol/l are summarised inFig. 3. As expected, with increasing concentration the tension val-ues decrease and the observed rate of adsorption becomes larger,i.e. the equilibrium values are reached faster. At SDS concentra-tions above 5 104 mol/l we can actually not recognise anykinetics above few seconds of surface age. If we compare this withthe long time data for SDS at the water–air interface published re-cently in [8] we easily see that at this interface changes are ob-served over a very large time interval (cf. Fig. 4 in Ref. [8]). Thislong time dynamics is definitely caused by the slow of adsorptionof the C12OH, which cannot be observed at the water–hexaneinterface.
Comparing the surface pressure values measured for twoselected SDS concentrations at water–hexane and water–air
interfaces, respectively, two phenomena can be easily observed(Fig. 4). At first, the absolute values of surface pressure aremuch lessat the water–air interface as compared to the water–hexane inter-face. And secondly, at the water–hexane interface the surface pres-sure changes happen within a few seconds, while at the water–airinterface the equilibrium has not yet been reached even after halfan hour.
The first phenomenon has been discussed in literature in termsof competing attraction forces between the surfactant’s alkylchains and the molecules of the oil phase [29–31]. This phenome-non is, however, not in the focus of this contribution. The secondobservation is caused by the presence of C12OH in the SDS solu-tion, as already discussed above. Hence, the surface pressure datain Fig. 4 measured at the water–hexane interface show the ex-pected fast adsorption of SDS molecules. Due to the slow diffusionof C12OH towards the interface and the very high solubility in theadjacent oil phase, its adsorption and hence competition at thewater–hexane interface is negligible. In contrast, it causes the mainadsorption effect after longer adsorption times at the solution–airinterface.
To quantify the effects of dodecanol at the water–hexane inter-face and validate the given explanations, we performed additionalexperiments with pure dodecanol solutions at both interfaces(Fig. 5). A first set of experiments was performed at the water–hex-ane interface with C12OH being dissolved in hexane at concentra-tions of 2 105 (3), 103 (4), 102 (5) and 101 (6) mol/l. Inaddition we prepared aqueous C12OH solutions of 105 and2 105 mol/l (solubility limit) and measured the dynamic surfacetensions. Note, there is a phase transition visible in curve 2 at about48 mN/m. Tsay et al. [32] found such phase transitions at about54 mN/m, i.e. at higher c-values, which can be explained by theslightly higher temperature of our experiments (22 C). In addition,in our experiments with drops the phase transition happens athigher C12OH concentration which is surely due to the differencesobserved for drop and bubble experiments and explained by thedepletion of surfactant from the drop at low concentrations andsignificant adsorption values [33].
An additional experiment was performed such that equalamounts of water and of a 101 mol/l C12OH solution in hexanewere mixed, both phases saturated against each other, and finallyseparated. With the obtained aqueous phase, now containing a
t [s]
π
0 500 1000 1500 2000
15
20
25
30
35
40
(mN
/m)
Fig. 4. Comparison of dynamic surface/interfacial pressure of SDS solution 5 104
(s, d) and 2 103 (4, N) mol/l at water–air (filled symbols) and water–hexane(open symbols) interfaces, respectively; solution has been kept for 10 days aging.
20
30
40
50
60
70
0 500 1000 1500 2000 2500t[s]
γγ [m
N/m
]
7
5
4
3 2
1
6
Fig. 5. Dynamic surface and interfacial tensions of C12OH solution of 105 (1) and 2 10-5 (2) mol/l in water against air, and of 2 105 (3), 103 (4), 102 (5) and 101 (6)mol/l in hexane against water, and the aqueous phase of C12OH obtained after saturation with a 101 mol/l C12OH in hexane, also measured against air (7).
540 A. Javadi et al. / Journal of Colloid and Interface Science 351 (2010) 537–541
Author's personal copy
respective amount of C12OH which refers to the partition equilib-rium with hexane, also the dynamic surface tension was measured(curve 7 in Fig. 5).
The curves 3 and 4 in Fig. 5 demonstrate that at C12OH con-centrations of 2 105 and 103 mol/l in hexane, no measurableadsorption effects can be observed. For the much higher C12OHconcentrations of 102 and 101 mol/l in hexane, (curves 5 and6) constant interfacial tensions of 41 mN/m and 26 mN/m, respec-tively, are obtained, without any kinetics due to the very highbulk concentrations. The curves 1 and 2, i.e. the surface tensionsof the aqueous C12OH solutions at concentrations 105 and2 105 mol/l (solubility limit in water), respectively, demon-strate the high surface activity of C12OH at the water–air inter-face. These results are in very good agreement with thosepublished in [32]. As one can see, the curve 7 is in between curves1 and 2 which allows us to conclude that the C12OH concentra-tion in this aqueous solution is approximately 1.5 105 mol/l.As this aqueous solution was in equilibrium with a 101 mol/lsolution of C12OH in hexane, we can estimate the partition coef-ficient of C12OH between hexane and water to be Kp 6.7 103.Unfortunately, due to our knowledge there are no values in liter-ature to compare, however, the obtained value appears reasonablewhen compared to Kp values reported in [18] for shorter alcohols.
From these findings we can conclude that in typical situationsof interfacial studies, i.e. extended bulk phases of water and oil,effects of an admixture like C12OH in SDS cannot play ameasurablerole due to its low surface activity and high partition coefficient.In particular experiments, however, when a small oil drop is formedin a larger volume of a SDS solution the transfer of C12OHcould reach concentrations above 103 mol/l in the oil and thenco-adsorption (impurity) effects will possibly be observed.
5. Conclusions
The dynamic and equilibrium interfacial tensions of SDS solu-tions against hexane, determined by using profile analysis (PAT-1) and capillary pressure (ODBA) tensiometry, can be obtainedwithout disturbing effects by the present of natural impuritydodecanol. The isotherm interfacial tension of SDS can be de-scribed well by the Frumkin adsorption model. A diffusion coeffi-cient of D = 5 1010 m2/s was obtained from the dynamicinterfacial tensions at the aqueous solution–hexane interface,which is not affected by the presence of C12OH, in contrast to dataobserved at the water–air interface [8].
The experiments performed directly with C12OH allow valida-tion of the adsorption behaviour of SDS at both water–air andwater–hexane interfaces. C12OH dissolved in water shows a signif-icantly surface tension decrease even at very small concentrationsof 105 mol/l. From these experiment it was possible to estimatethe partition coefficient Kp = co/cw of C12OH between water andhexane to be 6.7 103. On the other hand C12OH dissolved in hex-ane does not show any surface activity at concentrations lower
than 103 mol/l. For concentrations higher than 103 mol/l whichmay happen when the oil phase is distributed as a small dropletin a high concentrated solution of SDS, the dodecanol effects canbe significant also at the water/hexane interface.
Acknowledgments
The work was financially supported by a project of the GermanSpace Agency (DLR 50WM0941) and the DFG (Mi418/18-1).
References
[1] H.J. De Boer, The Dynamical Character of Adsorption, Oxford University Press,1945.
[2] A.W. Adamson, Physical Chemistry of Surfaces, fifth ed., Wiley, New York,1990.
[3] S.S. Dukhin, G. Kretzschmar, R. Miller, Dynamics of adsorption at liquidinterfaces, in: D. Möbius, R. Miller (Eds.), Studies in Interface Science, vol. 1,Elsevier, 1995.
[4] G. Czichocki, D. Vollhardt, H. Seibt, Tenside, Deterg. 18 (1981) 320.[5] K. Lunkenheimer, G. Czichocki, J. Colloid Interface Sci. 160 (1993) 509.[6] D. Vollhardt, G. Czichocki, Tenside, Deterg. 30 (1993) 349.[7] B.A. Noskov, A.E. Alexandrov, E.V. Gumennik, V.V. Krotov, R. Miller, Colloid J.
(Russ.) 60 (1998) 204.[8] V.B. Fainerman, S.V. Lylyk, E.V. Aksenenko, J.T. Petkov, J. Yorke, R. Miller,
Colloids Surf., A 354 (2010) 8.[9] I.B. Ivanov, K.P. Ananthapadmanabhan, A. Lips, Adv. Colloid Interface Sci. 104
(2003) 245.[10] P.A. Kralchevsky, K.D. Danov, V.L. Kolev, G. Broze, A. Mehreteab, Langmuir 19
(2003) 5004.[11] M. Ferrari, L. Liggieri, F. Ravera, C. Amodio, R. Miller, J. Colloid Interface Sci. 186
(1997) 40.[12] L. Liggieri, F. Ravera, M. Ferrari, A. Passerone, R. Miller, J. Colloid Interface Sci.
186 (1997) 46.[13] D. Vollhardt, V.B. Fainerman, Adv. Colloid Interface Sci. 154 (2010) 1.[14] R. Miller, V.B. Fainerman, H. Möhwald, J. Colloid Interface Sci. 247 (2002) 193.[15] D. Vollhardt, G. Emrich, Colloids Surf., A 161 (2000) 173.[16] D. Vollhardt, G. Brezesinski, S. Siegel, G. Emrich, J. Phys. Chem. B 105 (2001)
12061.[17] V.B. Fainerman, D. Vollhardt, G. Emrich, J. Phys. Chem. B 105 (2001) 4324.[18] F. Ravera, M. Ferrari, L. Liggieri, Adv. Colloid Interface Sci. 88 (2000) 129.[19] D. Möbius, R. Miller (Eds.), Novel methods to study interfacial layers, in:
Studies in Interface Science, vol. 11, Elsevier, 2001, pp. 439.[20] S.A. Zholob, A.V. Makievski, R. Miller, V.B. Fainerman, Adv. Colloid Interface Sci.
322 (2007) 134.[21] A. Javadi, J. Krägel, P. Pandolfini, G. Loglio, V.I. Kovalchuk, E.V. Aksenenko, F.
Ravera, L. Liggieri, R. Miller, Colloids Surf., A 365 (2010) 62.[22] A. Frumkin, Z. Phys. Chem. Leipzig 116 (1925) 466.[23] V.B. Fainerman, S.A. Zholob, E.H. Lucassen-Reynders, R. Miller, J. Colloid
Interface Sci. 261 (2003) 180.[24] V.B. Fainerman, V.I. Kovalchuk, E.V. Aksenenko, M. Michel, M.E. Leser, R. Miller,
J. Phys. Chem. 108 (2004) 13700.[25] A.F.H. Ward, L. Tordai, J. Chem. Phys. 14 (1946) 453.[26] P. Ruelle, U.W. Kesselring, Can. J. Chem. 76 (1998) 553.[27] R. Miller, A.V. Makievski, C. Frese, J. Krägel, E.V. Aksenenko, V.B. Fainerman,
Tenside, Surfactants, Deterg. 40 (2003) 256.[28] R. Miller, V.B. Fainerman, E.V. Aksenenko, Colloids Surf., A 272 (2004) 123.[29] R. Aveyard, D.A. Haydon, J. Colloid Sci. 20 (1965) 2255.[30] K. Medrzycka, W. Zwierzykowski, J. Colloid Interface Sci. 230 (2000) 67.[31] J. Bahtz, D. Knorr, C. Tedeschi, M.E. Leser, B. Valles-Pamies, R. Miller, Colloids
Surf., B 74 (2009) 492.[32] R.-Y. Tsay, T.-F. Wu, S.-Y. Lin, J. Phys. Chem. B 108 (2004) 18623.[33] A.V. Makievski, G. Loglio, J. Krägel, R. Miller, V.B. Fainerman, A.W. Neumann, J.
Phys. Chem. 103 (1999) 9557.
A. Javadi et al. / Journal of Colloid and Interface Science 351 (2010) 537–541 541

Paper II Adsorption of alkyl trimethylammonium bromides at the water/air and water/hexane interface V. Pradines, V.B. Fainerman, E.V. Aksenenko, J. Krägel, N. Mucic and R. Miller Colloids and Surfaces A 371 (2010) 22‐28
Author's personal copy
Colloids and Surfaces A: Physicochem. Eng. Aspects 371 (2010) 22–28
Contents lists available at ScienceDirect
Colloids and Surfaces A: Physicochemical andEngineering Aspects
journa l homepage: www.e lsev ier .com/ locate /co lsur fa
Adsorption of alkyl trimethylammonium bromides at the water/air and
water/hexane interfaces
Vincent Pradinesa,b,∗, Valentin B. Fainermanc, Eugene V. Aksenenkod, Jürgen Krägela,Nenad Mucica, Reinhard Millera
a Max Planck Institute für Kolloid-und Grenzflächenforschung, 14424 Potsdam, Germanyb Laboratoire de Chimie de Coordination, 31077 Toulouse Cedex 04, Francec Medical University Donetsk, 16 Ilych Avenue, 83003 Donetsk, Ukrained Institute of Colloid Chemistry of Water, 42 Vernadsky Avenue, 03680 Kiev, Ukraine
a r t i c l e i n f o
Article history:
Received 13 June 2010
Received in revised form 10 August 2010
Accepted 30 August 2010
Available online 9 September 2010
Keywords:
Adsorption
Cationic surfactant
Thermodynamic model
Alkyl trimethylammonium bromide
Water–air interface
Water–hexane interface
Effect of buffer
a b s t r a c t
Surface and interfacial tension measurements have been performed at the water/air and water/hexane
interface by drop profile analysis tensiometry for a series of alkyl trimethylammonium bromides with
different chain lengths (C10, C12, C14 and C16). The effect of neutral phosphate buffer (10 mM, pH 7)
has been investigated and the results have been compared with literature data obtained for the same
surfactants in the absence of salt. The use of a modified Frumkin isotherm (Ionic Compressibility) taking
into account the mean activity of all ions in solution leads to a real improvement of the data interpretation,
while the classical Frumkin Compressibility model yields similar results but overestimates the adsorption
parameters. At the water/hexane interface, the hexane molecules are incorporated in the surfactant layer
and it results a kind of competitive adsorption for the shortest chain surfactant (10 carbons). For the
longest chains, the attractive interactions between the hydrophobic chains of the adsorbed surfactants
are strong enough to replace the solvent molecules from the interface.
© 2010 Elsevier B.V. All rights reserved.
1. Introduction
The behaviour of surfactants in solution or at liquid/fluid inter-
faces has been widely studied for many years due to their enormous
importance in many processes and technologies, such as deter-
gency, food processing, pharmaceutical industry, or cosmetics
[1–4]. The properties of disperse systems (foams, emulsions and
suspensions) used in many applications are largely determined
by the interfacial properties of liquid films stabilized by single
surfactants or more generally by mixtures of surface active com-
pounds. Most of adsorption studies have been performed at the
water/air interface for which surface tension measurements [5],
sum frequency spectroscopy [6], or neutron reflection experiments
[7,8], followed by a modelling of the experimental data are very
powerful methods to give an accurate idea of the interfacial layer
properties (adsorbed amount, thickness of the layer, area and ori-
entation of adsorbed molecules). In contrast to the huge number
of works performed at the water/air interface [9–15], only few sys-
∗ Corresponding author at: Laboratoire de Chimie de Coordination, 31077
Toulouse Cedex 04, France.
E-mail address: [email protected] (V. Pradines).
tematic experimental studies involving also a theoretical treatment
of the data have been dedicated to the adsorption of surfactants
at water/oil interfaces [16–20]. Technical difficulties encountered,
for example the decrease of sensitivity of optical methods, are
mainly due to the presence of the upper oil phase. The purifica-
tion of these oil phases which often contain traces of surface active
molecules, and their volatility which limits the experimental time,
are additional critical points. Moreover, the difficulty of such stud-
ies increases when the surfactants are soluble in both water and oil
phase. This fact entails that in addition to all mentioned parame-
ters, also the partition coefficient [21,22] has to be determined, the
value of which has a significant effect under dynamic conditions
due to Marangoni effects [23,24].
So far, there is still an open question concerning the importance
of both surfactant–surfactant and surfactant–solvent molecular
interactions and on the role of oil molecules at the interface which
are responsible for differences observed when compared with the
water/air interface. In the past, Hutchinson suggested the presence
of a competitive adsorption between surfactant and oil molecules at
a water/non-polar solvent interface [25]. Due to solvent molecules
interpenetrated between the surfactants, the attractive interac-
tions and so the cohesion between surfactants observed very often
at the water/air interface could be strongly decreased inducing a
0927-7757/$ – see front matter © 2010 Elsevier B.V. All rights reserved.doi:10.1016/j.colsurfa.2010.08.052
Author's personal copy
V. Pradines et al. / Colloids and Surfaces A: Physicochem. Eng. Aspects 371 (2010) 22–28 23
smaller adsorption at the water/oil interface [26]. On the contrary,
Gillap et al. [27] have observed a strong increase of the adsorbed
amount of sodium dodecyl and decyl sulfate at the water/oil inter-
face as compared to the water/air interface, certainly due to the
presence of hydrophobic interactions between adsorbed surfac-
tants and oil molecules. Thus, the adsorption of ionic surfactants
at the water/oil interface generally follows an ideal behaviour,
and is well described by using the Langmuir adsorption isotherm
although the Frumkin one is more suitable at the water/air interface
[18,21,22].
The target of this work is to describe and compare the adsorp-
tion behaviour at the water/air and water/hexane interfaces of
a series of alkyl trimethylammonium bromides with different
alkyl chain lengths (10, 12, 14, 16 carbon atoms). For the sake
of simplicity, the conventional nomenclature of these surfactants
(DeTAB, DoTAB, TTAB and CTAB) was changed to CnTAB where n
corresponds to the number of carbon atoms in the hydrophobic
chain. Systematic surface and interfacial tension measurements
have been performed, followed by a theoretical interpretation
of the experimental data with two different adsorption models
giving access to thermodynamic adsorption parameters. The salt
effects, due to the presence of phosphate buffer, have been taken
into account using a modified Frumkin model, our motivations
being to describe the adsorption behaviour of these surfactants
in this medium in addition to the studies already done in the
literature at the pure water/air interface. Such work is relevant
when surfactants are combined with biological compounds such
as proteins in which case it’s necessary to control the number of
charges (as a function of the pH). Surfactant layers or aggregates
can also be used as the simplest model of biological membranes
which justifies also the control of the pH. Thus, we have dis-
cussed the buffer effects at the water/air interface and compared
our experiments with others performed without additional elec-
trolyte [28–30]. Surface tension isotherms of the same series (n = 12,
14, 16) have been studied at the water/air interface by Stuben-
rauch et al. [28] using two different theoretical adsorption models
which take into account lateral interactions (Frumkin model) and
the possibility to change the interfacial molar area (reorienta-
tion model) of adsorbed surfactants as a function of the surface
pressure (Frumkin Compressibility model). They showed that the
second model described more accurately the rheological behaviour
of the interfacial layer and the variation of the adsorbed amount
at the interface by comparing the results obtained with neutron
reflectivity experiments for C12TAB and C14TAB [31]. In this last
study, single surfactants and also mixtures of C12TAB and C14TAB
with dodecane were spread at the water/air interface. A schematic
model of the interface has been proposed in which each surfac-
tant molecule was separated by one alkane molecule showing a
loss of the surfactant–surfactant interactions under these condi-
tions. Medrzycka and Zwierzykowski [32] have also studied the
adsorption of members of the series CnTAB (n = 12, 14, 16) at
the water/air and various water/alkane interfaces, each oil phase
matching the chain length of the respective surfactant (dodecane,
tetradecane, and hexadecane), in order to determine under which
condition the interactions with the solvent molecules were the
most favourable. Studying the variation of the adsorbed amount at
the water/air and water/alkane interfaces, they have also suggested
the presence of alkane molecules intercalated in the surfactant
layer [33].
Regarding these works, we have discussed the different results
obtained at both water/air and water/hexane interfaces (shapes
of adsorption isotherms, thermodynamic adsorption parameters,
variation of the adsorbed amount and molar area of surfactants)
in order to understand the CnTABs adsorption behaviour in neutral
phosphate buffer conditions and to determine the role played by
the hexane molecules at the interface.
2. Experimental
A stock solution of phosphate buffer 10 mM, pH 7,
NaH2PO4/Na2HPO4 (Fluka, >99%) has been prepared with
ultrapure MilliQ water (resistivity = 18.2 M cm) and used to
prepare all aqueous surfactant solutions. The surfactants decyl
trimethylammonium bromide C10TAB (MW = 280.29 g mol−1,
≥98%), dodecyl trimethylammonium bromide C12TAB
(MW = 308.35 g mol−1, ≥99%), cetyl trimethylammonium bro-
mide C16TAB (MW = 364.46 g mol−1, >99.0%) were purchased
from Fluka (Switzerland), and the tetradecyl trimethylammonium
bromide C14TAB (MW = 336.40 g mol−1, 99%) was purchased from
Aldrich. All experiments were performed at room temperature
(22 C). Hexane was purchased from Fluka (Switzerland). It was
distilled and purified with aluminium oxide and subsequently
saturated with ultrapure MilliQ water.
The experimental setup used to measure the dynamic surface
tension of the different systems was the drop Profile Analysis
Tensiometer PAT-1 (SINTERFACE Technologies, Berlin, Germany).
Equilibrium surface tension values reported in the isotherms have
been obtained after a sufficient adsorption time which depends
on the concentration of surfactant (from 1 h for the highest con-
centrations close to the CMC up to 12 h for the lowest ones). The
surface tension values of a pure buffer solution were checked at the
water/air and water/hexane interfaces and were the same as for the
ultrapure MilliQ water (72.5 and 49 mN m−1 at the water/air and
water/hexane interface, respectively). For the investigations at the
water/hexane interface a drop of aqueous solution was formed in
a glass cuvette containing pure hexane.
Concerning the experimental data of C14TAB and C16TAB mea-
sured at the water/air and at the water/hexane interface, we have
applied a correction of the concentration. Due to the strong adsorp-
tion of surfactants at the surface of the drop obtained by using
very low bulk concentrations, we had surfactant depletion in the
drop [34]. Using the first Frumkin model described below, we have
obtained a new equilibrium bulk concentration with an iterative
calculation protocol. We have taken into account the loss of surfac-
tant from the bulk and checked the total mass balance between the
amount of adsorbed surfactant and that present in the bulk phase.
3. Theoretical models
Most adsorption isotherms for non-ionic and ionic surfactants
are very well described by the Frumkin model which takes into
account the lateral interactions between adsorbed surfactants at
the interface [35]. For electroneutral surface layers the follow-
ing equation of state of the surface layer and the corresponding
adsorption isotherm for the Frumkin adsorption model for ionic
surfactants was recently proposed [28,36]:
˘ = −2RT
ω0[ln(1 − ) + a2] (1)
b[c(c + c2)]1/2f =
1 − exp(−2a) (2)
where˘ is the surface pressure (˘ =0 −), and 0 are the sur-
face tensions of the solution and the solvent, respectively,ω0 is the
partial molar area of the ionic surfactant at˘ = 0 (two times larger
than the molar area of the solvent or ions), a is the intermolecular
interaction constant, b is the adsorption equilibrium constant, f is
the average activity coefficient of ions in the bulk solution, c is the
ionic surfactant concentration, c2 is the inorganic salt concentra-
tion (we made an approximation and have considered the buffer as
an electrolyte 1:1), =ω is the surface coverage, is the surfac-
tant adsorption, R is the gas law constant, and T is the temperature.
For short-range interactions the Debye-Hückel equation accurately
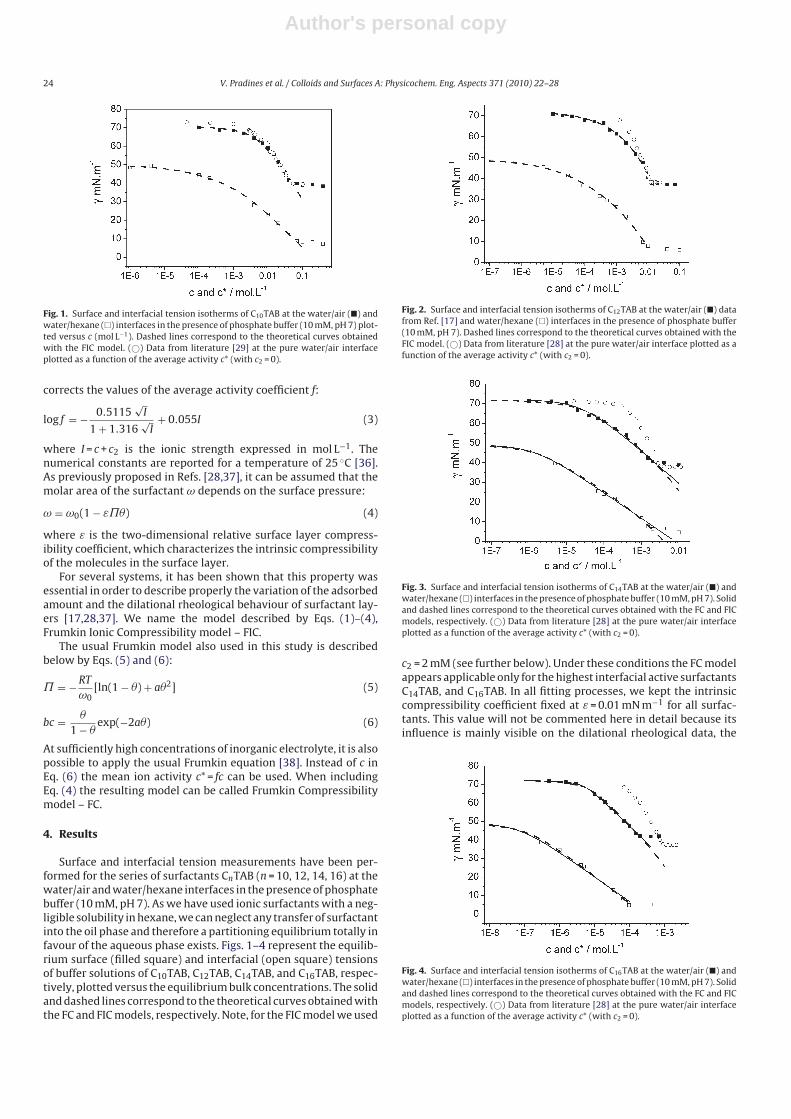
Author's personal copy
24 V. Pradines et al. / Colloids and Surfaces A: Physicochem. Eng. Aspects 371 (2010) 22–28
Fig. 1. Surface and interfacial tension isotherms of C10TAB at the water/air () and
water/hexane () interfaces in the presence of phosphate buffer (10 mM, pH 7) plot-
ted versus c (mol L−1). Dashed lines correspond to the theoretical curves obtained
with the FIC model. (©) Data from literature [29] at the pure water/air interface
plotted as a function of the average activity c* (with c2 = 0).
corrects the values of the average activity coefficient f:
log f = − 0.5115√I
1 + 1.316√I
+ 0.055I (3)
where I = c + c2 is the ionic strength expressed in mol L−1. The
numerical constants are reported for a temperature of 25 C [36].
As previously proposed in Refs. [28,37], it can be assumed that the
molar area of the surfactant ω depends on the surface pressure:
ω = ω0(1 − ε˘) (4)
where ε is the two-dimensional relative surface layer compress-
ibility coefficient, which characterizes the intrinsic compressibility
of the molecules in the surface layer.
For several systems, it has been shown that this property was
essential in order to describe properly the variation of the adsorbed
amount and the dilational rheological behaviour of surfactant lay-
ers [17,28,37]. We name the model described by Eqs. (1)–(4),
Frumkin Ionic Compressibility model – FIC.
The usual Frumkin model also used in this study is described
below by Eqs. (5) and (6):
˘ = −RTω0
[ln(1 − ) + a2] (5)
bc =
1 − exp(−2a) (6)
At sufficiently high concentrations of inorganic electrolyte, it is also
possible to apply the usual Frumkin equation [38]. Instead of c in
Eq. (6) the mean ion activity c* = fc can be used. When including
Eq. (4) the resulting model can be called Frumkin Compressibility
model – FC.
4. Results
Surface and interfacial tension measurements have been per-
formed for the series of surfactants CnTAB (n = 10, 12, 14, 16) at the
water/air and water/hexane interfaces in the presence of phosphate
buffer (10 mM, pH 7). As we have used ionic surfactants with a neg-
ligible solubility in hexane, we can neglect any transfer of surfactant
into the oil phase and therefore a partitioning equilibrium totally in
favour of the aqueous phase exists. Figs. 1–4 represent the equilib-
rium surface (filled square) and interfacial (open square) tensions
of buffer solutions of C10TAB, C12TAB, C14TAB, and C16TAB, respec-
tively, plotted versus the equilibrium bulk concentrations. The solid
and dashed lines correspond to the theoretical curves obtained with
the FC and FIC models, respectively. Note, for the FIC model we used
Fig. 2. Surface and interfacial tension isotherms of C12TAB at the water/air () data
from Ref. [17] and water/hexane () interfaces in the presence of phosphate buffer
(10 mM, pH 7). Dashed lines correspond to the theoretical curves obtained with the
FIC model. (©) Data from literature [28] at the pure water/air interface plotted as a
function of the average activity c* (with c2 = 0).
Fig. 3. Surface and interfacial tension isotherms of C14TAB at the water/air () and
water/hexane () interfaces in the presence of phosphate buffer (10 mM, pH 7). Solid
and dashed lines correspond to the theoretical curves obtained with the FC and FIC
models, respectively. (©) Data from literature [28] at the pure water/air interface
plotted as a function of the average activity c* (with c2 = 0).
c2 = 2 mM (see further below). Under these conditions the FC model
appears applicable only for the highest interfacial active surfactants
C14TAB, and C16TAB. In all fitting processes, we kept the intrinsic
compressibility coefficient fixed at ε= 0.01 mN m−1 for all surfac-
tants. This value will not be commented here in detail because its
influence is mainly visible on the dilational rheological data, the
Fig. 4. Surface and interfacial tension isotherms of C16TAB at the water/air () and
water/hexane () interfaces in the presence of phosphate buffer (10 mM, pH 7). Solid
and dashed lines correspond to the theoretical curves obtained with the FC and FIC
models, respectively. (©) Data from literature [28] at the pure water/air interface
plotted as a function of the average activity c* (with c2 = 0).
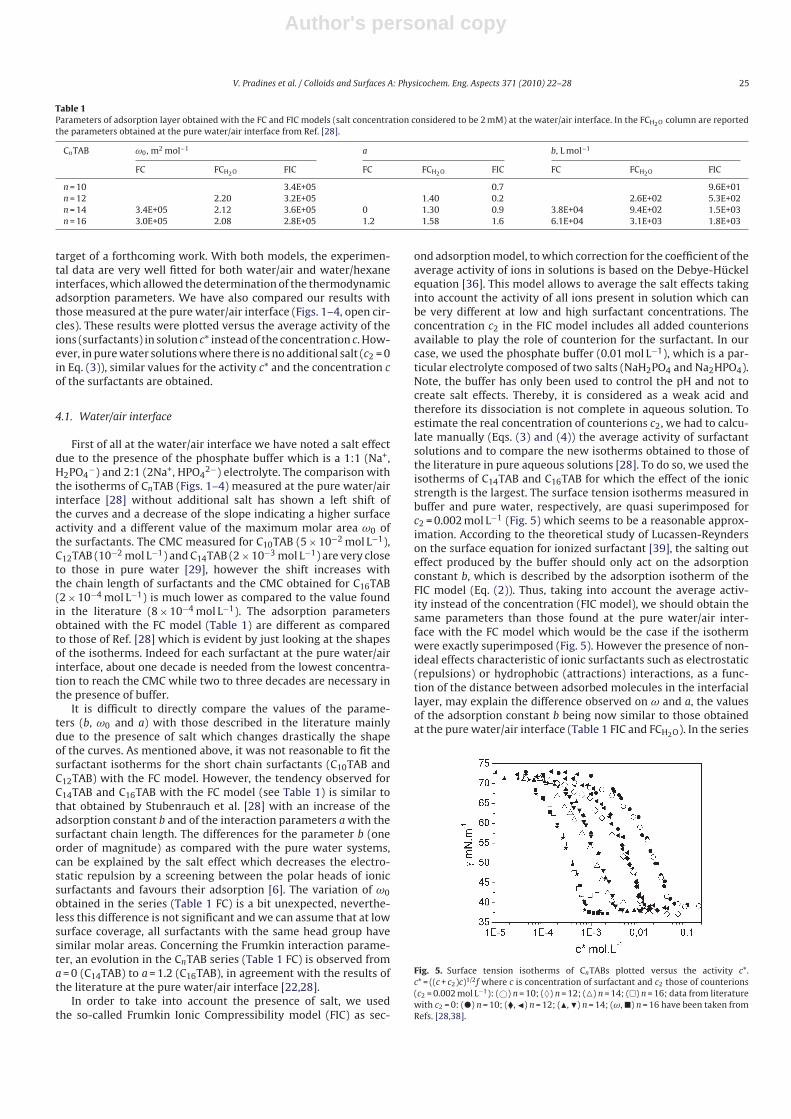
Author's personal copy
V. Pradines et al. / Colloids and Surfaces A: Physicochem. Eng. Aspects 371 (2010) 22–28 25
Table 1Parameters of adsorption layer obtained with the FC and FIC models (salt concentration considered to be 2 mM) at the water/air interface. In the FCH2O column are reported
the parameters obtained at the pure water/air interface from Ref. [28].
CnTAB ω0, m2 mol−1 a b, L mol−1
FC FCH2O FIC FC FCH2O FIC FC FCH2O FIC
n = 10 3.4E+05 0.7 9.6E+01
n = 12 2.20 3.2E+05 1.40 0.2 2.6E+02 5.3E+02
n = 14 3.4E+05 2.12 3.6E+05 0 1.30 0.9 3.8E+04 9.4E+02 1.5E+03
n = 16 3.0E+05 2.08 2.8E+05 1.2 1.58 1.6 6.1E+04 3.1E+03 1.8E+03
target of a forthcoming work. With both models, the experimen-
tal data are very well fitted for both water/air and water/hexane
interfaces, which allowed the determination of the thermodynamic
adsorption parameters. We have also compared our results with
those measured at the pure water/air interface (Figs. 1–4, open cir-
cles). These results were plotted versus the average activity of the
ions (surfactants) in solution c* instead of the concentration c. How-
ever, in pure water solutions where there is no additional salt (c2 = 0
in Eq. (3)), similar values for the activity c* and the concentration c
of the surfactants are obtained.
4.1. Water/air interface
First of all at the water/air interface we have noted a salt effect
due to the presence of the phosphate buffer which is a 1:1 (Na+,
H2PO4−) and 2:1 (2Na+, HPO4
2−) electrolyte. The comparison with
the isotherms of CnTAB (Figs. 1–4) measured at the pure water/air
interface [28] without additional salt has shown a left shift of
the curves and a decrease of the slope indicating a higher surface
activity and a different value of the maximum molar area ω0 of
the surfactants. The CMC measured for C10TAB (5 × 10⁻² mol L−1),
C12TAB (10−2 mol L−1) and C14TAB (2 × 10⁻³ mol L−1) are very close
to those in pure water [29], however the shift increases with
the chain length of surfactants and the CMC obtained for C16TAB
(2 × 10⁻⁴ mol L−1) is much lower as compared to the value found
in the literature (8 × 10⁻⁴ mol L−1). The adsorption parameters
obtained with the FC model (Table 1) are different as compared
to those of Ref. [28] which is evident by just looking at the shapes
of the isotherms. Indeed for each surfactant at the pure water/air
interface, about one decade is needed from the lowest concentra-
tion to reach the CMC while two to three decades are necessary in
the presence of buffer.
It is difficult to directly compare the values of the parame-
ters (b, ω0 and a) with those described in the literature mainly
due to the presence of salt which changes drastically the shape
of the curves. As mentioned above, it was not reasonable to fit the
surfactant isotherms for the short chain surfactants (C10TAB and
C12TAB) with the FC model. However, the tendency observed for
C14TAB and C16TAB with the FC model (see Table 1) is similar to
that obtained by Stubenrauch et al. [28] with an increase of the
adsorption constant b and of the interaction parameters a with the
surfactant chain length. The differences for the parameter b (one
order of magnitude) as compared with the pure water systems,
can be explained by the salt effect which decreases the electro-
static repulsion by a screening between the polar heads of ionic
surfactants and favours their adsorption [6]. The variation of ω0
obtained in the series (Table 1 FC) is a bit unexpected, neverthe-
less this difference is not significant and we can assume that at low
surface coverage, all surfactants with the same head group have
similar molar areas. Concerning the Frumkin interaction parame-
ter, an evolution in the CnTAB series (Table 1 FC) is observed from
a = 0 (C14TAB) to a = 1.2 (C16TAB), in agreement with the results of
the literature at the pure water/air interface [22,28].
In order to take into account the presence of salt, we used
the so-called Frumkin Ionic Compressibility model (FIC) as sec-
ond adsorption model, to which correction for the coefficient of the
average activity of ions in solutions is based on the Debye-Hückel
equation [36]. This model allows to average the salt effects taking
into account the activity of all ions present in solution which can
be very different at low and high surfactant concentrations. The
concentration c2 in the FIC model includes all added counterions
available to play the role of counterion for the surfactant. In our
case, we used the phosphate buffer (0.01 mol L−1), which is a par-
ticular electrolyte composed of two salts (NaH2PO4 and Na2HPO4).
Note, the buffer has only been used to control the pH and not to
create salt effects. Thereby, it is considered as a weak acid and
therefore its dissociation is not complete in aqueous solution. To
estimate the real concentration of counterions c2, we had to calcu-
late manually (Eqs. (3) and (4)) the average activity of surfactant
solutions and to compare the new isotherms obtained to those of
the literature in pure aqueous solutions [28]. To do so, we used the
isotherms of C14TAB and C16TAB for which the effect of the ionic
strength is the largest. The surface tension isotherms measured in
buffer and pure water, respectively, are quasi superimposed for
c2 = 0.002 mol L−1 (Fig. 5) which seems to be a reasonable approx-
imation. According to the theoretical study of Lucassen-Reynders
on the surface equation for ionized surfactant [39], the salting out
effect produced by the buffer should only act on the adsorption
constant b, which is described by the adsorption isotherm of the
FIC model (Eq. (2)). Thus, taking into account the average activ-
ity instead of the concentration (FIC model), we should obtain the
same parameters than those found at the pure water/air inter-
face with the FC model which would be the case if the isotherm
were exactly superimposed (Fig. 5). However the presence of non-
ideal effects characteristic of ionic surfactants such as electrostatic
(repulsions) or hydrophobic (attractions) interactions, as a func-
tion of the distance between adsorbed molecules in the interfacial
layer, may explain the difference observed on ω and a, the values
of the adsorption constant b being now similar to those obtained
at the pure water/air interface (Table 1 FIC and FCH2O). In the series
Fig. 5. Surface tension isotherms of CnTABs plotted versus the activity c*.
c* = ((c + c2)c)1/2f where c is concentration of surfactant and c2 those of counterions
(c2 = 0.002 mol L−1): (©) n = 10; (♦) n = 12; () n = 14; () n = 16; data from literature
with c2 = 0: () n = 10; (, ) n = 12; (, ) n = 14; (ω, ) n = 16 have been taken from
Refs. [28,38].
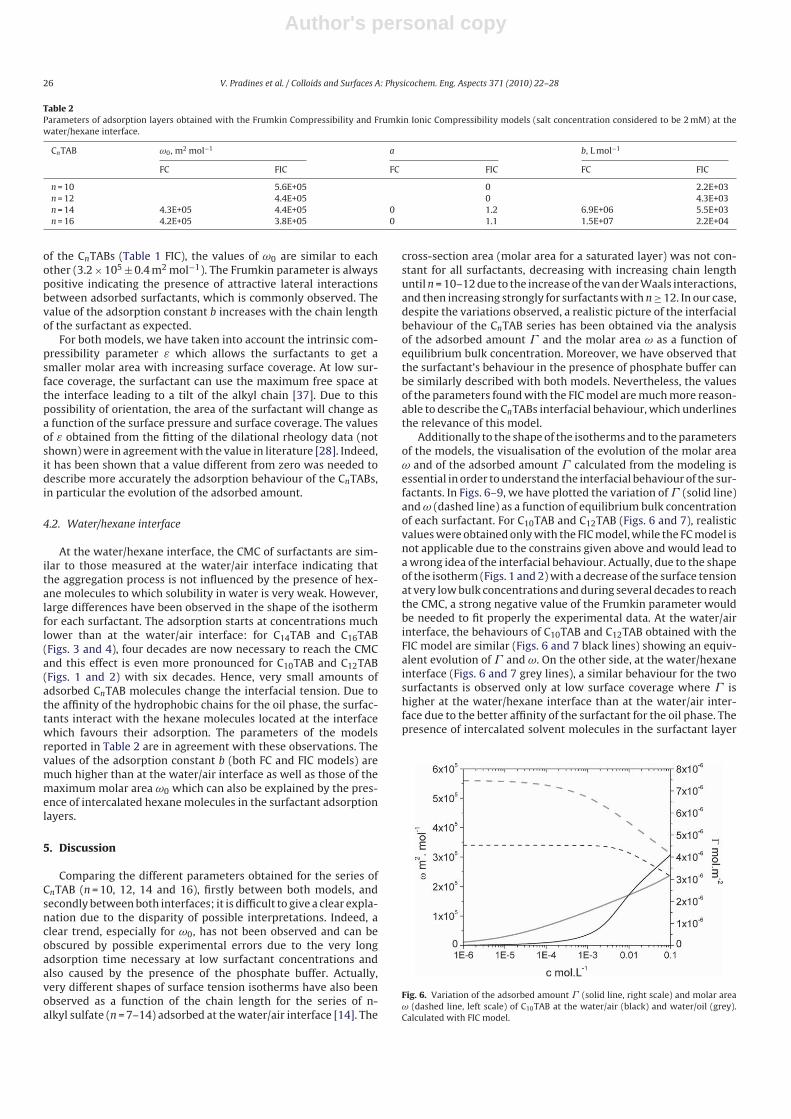
Author's personal copy
26 V. Pradines et al. / Colloids and Surfaces A: Physicochem. Eng. Aspects 371 (2010) 22–28
Table 2Parameters of adsorption layers obtained with the Frumkin Compressibility and Frumkin Ionic Compressibility models (salt concentration considered to be 2 mM) at the
water/hexane interface.
CnTAB ω0, m2 mol−1 a b, L mol−1
FC FIC FC FIC FC FIC
n = 10 5.6E+05 0 2.2E+03
n = 12 4.4E+05 0 4.3E+03
n = 14 4.3E+05 4.4E+05 0 1.2 6.9E+06 5.5E+03
n = 16 4.2E+05 3.8E+05 0 1.1 1.5E+07 2.2E+04
of the CnTABs (Table 1 FIC), the values of ω0 are similar to each
other (3.2 × 10⁵ ± 0.4 m2 mol−1). The Frumkin parameter is always
positive indicating the presence of attractive lateral interactions
between adsorbed surfactants, which is commonly observed. The
value of the adsorption constant b increases with the chain length
of the surfactant as expected.
For both models, we have taken into account the intrinsic com-
pressibility parameter ε which allows the surfactants to get a
smaller molar area with increasing surface coverage. At low sur-
face coverage, the surfactant can use the maximum free space at
the interface leading to a tilt of the alkyl chain [37]. Due to this
possibility of orientation, the area of the surfactant will change as
a function of the surface pressure and surface coverage. The values
of ε obtained from the fitting of the dilational rheology data (not
shown) were in agreement with the value in literature [28]. Indeed,
it has been shown that a value different from zero was needed to
describe more accurately the adsorption behaviour of the CnTABs,
in particular the evolution of the adsorbed amount.
4.2. Water/hexane interface
At the water/hexane interface, the CMC of surfactants are sim-
ilar to those measured at the water/air interface indicating that
the aggregation process is not influenced by the presence of hex-
ane molecules to which solubility in water is very weak. However,
large differences have been observed in the shape of the isotherm
for each surfactant. The adsorption starts at concentrations much
lower than at the water/air interface: for C14TAB and C16TAB
(Figs. 3 and 4), four decades are now necessary to reach the CMC
and this effect is even more pronounced for C10TAB and C12TAB
(Figs. 1 and 2) with six decades. Hence, very small amounts of
adsorbed CnTAB molecules change the interfacial tension. Due to
the affinity of the hydrophobic chains for the oil phase, the surfac-
tants interact with the hexane molecules located at the interface
which favours their adsorption. The parameters of the models
reported in Table 2 are in agreement with these observations. The
values of the adsorption constant b (both FC and FIC models) are
much higher than at the water/air interface as well as those of the
maximum molar area ω0 which can also be explained by the pres-
ence of intercalated hexane molecules in the surfactant adsorption
layers.
5. Discussion
Comparing the different parameters obtained for the series of
CnTAB (n = 10, 12, 14 and 16), firstly between both models, and
secondly between both interfaces; it is difficult to give a clear expla-
nation due to the disparity of possible interpretations. Indeed, a
clear trend, especially for ω0, has not been observed and can be
obscured by possible experimental errors due to the very long
adsorption time necessary at low surfactant concentrations and
also caused by the presence of the phosphate buffer. Actually,
very different shapes of surface tension isotherms have also been
observed as a function of the chain length for the series of n-
alkyl sulfate (n = 7–14) adsorbed at the water/air interface [14]. The
cross-section area (molar area for a saturated layer) was not con-
stant for all surfactants, decreasing with increasing chain length
until n = 10–12 due to the increase of the van der Waals interactions,
and then increasing strongly for surfactants with n ≥ 12. In our case,
despite the variations observed, a realistic picture of the interfacial
behaviour of the CnTAB series has been obtained via the analysis
of the adsorbed amount and the molar area ω as a function of
equilibrium bulk concentration. Moreover, we have observed that
the surfactant’s behaviour in the presence of phosphate buffer can
be similarly described with both models. Nevertheless, the values
of the parameters found with the FIC model are much more reason-
able to describe the CnTABs interfacial behaviour, which underlines
the relevance of this model.
Additionally to the shape of the isotherms and to the parameters
of the models, the visualisation of the evolution of the molar area
ω and of the adsorbed amount calculated from the modeling is
essential in order to understand the interfacial behaviour of the sur-
factants. In Figs. 6–9, we have plotted the variation of (solid line)
andω (dashed line) as a function of equilibrium bulk concentration
of each surfactant. For C10TAB and C12TAB (Figs. 6 and 7), realistic
values were obtained only with the FIC model, while the FC model is
not applicable due to the constrains given above and would lead to
a wrong idea of the interfacial behaviour. Actually, due to the shape
of the isotherm (Figs. 1 and 2) with a decrease of the surface tension
at very low bulk concentrations and during several decades to reach
the CMC, a strong negative value of the Frumkin parameter would
be needed to fit properly the experimental data. At the water/air
interface, the behaviours of C10TAB and C12TAB obtained with the
FIC model are similar (Figs. 6 and 7 black lines) showing an equiv-
alent evolution of and ω. On the other side, at the water/hexane
interface (Figs. 6 and 7 grey lines), a similar behaviour for the two
surfactants is observed only at low surface coverage where is
higher at the water/hexane interface than at the water/air inter-
face due to the better affinity of the surfactant for the oil phase. The
presence of intercalated solvent molecules in the surfactant layer
Fig. 6. Variation of the adsorbed amount (solid line, right scale) and molar area
ω (dashed line, left scale) of C10TAB at the water/air (black) and water/oil (grey).
Calculated with FIC model.
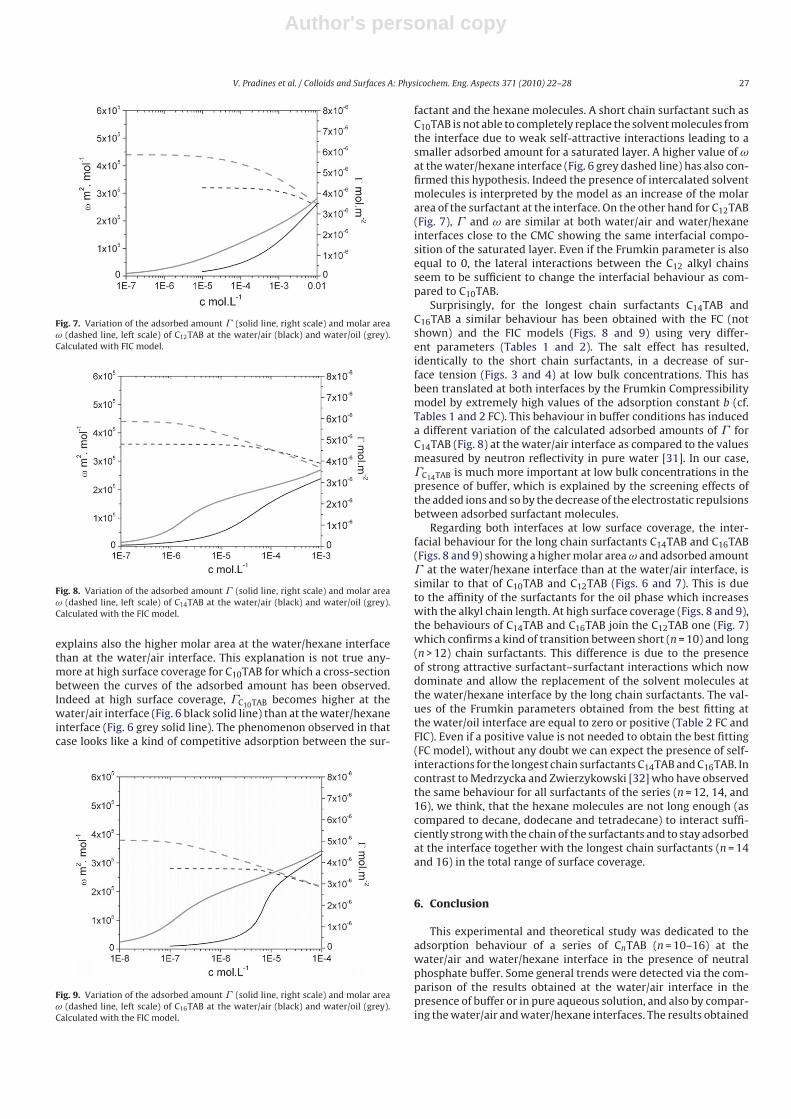
Author's personal copy
V. Pradines et al. / Colloids and Surfaces A: Physicochem. Eng. Aspects 371 (2010) 22–28 27
Fig. 7. Variation of the adsorbed amount (solid line, right scale) and molar area
ω (dashed line, left scale) of C12TAB at the water/air (black) and water/oil (grey).
Calculated with FIC model.
Fig. 8. Variation of the adsorbed amount (solid line, right scale) and molar area
ω (dashed line, left scale) of C14TAB at the water/air (black) and water/oil (grey).
Calculated with the FIC model.
explains also the higher molar area at the water/hexane interface
than at the water/air interface. This explanation is not true any-
more at high surface coverage for C10TAB for which a cross-section
between the curves of the adsorbed amount has been observed.
Indeed at high surface coverage, C10TAB becomes higher at the
water/air interface (Fig. 6 black solid line) than at the water/hexane
interface (Fig. 6 grey solid line). The phenomenon observed in that
case looks like a kind of competitive adsorption between the sur-
Fig. 9. Variation of the adsorbed amount (solid line, right scale) and molar area
ω (dashed line, left scale) of C16TAB at the water/air (black) and water/oil (grey).
Calculated with the FIC model.
factant and the hexane molecules. A short chain surfactant such as
C10TAB is not able to completely replace the solvent molecules from
the interface due to weak self-attractive interactions leading to a
smaller adsorbed amount for a saturated layer. A higher value of ωat the water/hexane interface (Fig. 6 grey dashed line) has also con-
firmed this hypothesis. Indeed the presence of intercalated solvent
molecules is interpreted by the model as an increase of the molar
area of the surfactant at the interface. On the other hand for C12TAB
(Fig. 7), and ω are similar at both water/air and water/hexane
interfaces close to the CMC showing the same interfacial compo-
sition of the saturated layer. Even if the Frumkin parameter is also
equal to 0, the lateral interactions between the C12 alkyl chains
seem to be sufficient to change the interfacial behaviour as com-
pared to C10TAB.
Surprisingly, for the longest chain surfactants C14TAB and
C16TAB a similar behaviour has been obtained with the FC (not
shown) and the FIC models (Figs. 8 and 9) using very differ-
ent parameters (Tables 1 and 2). The salt effect has resulted,
identically to the short chain surfactants, in a decrease of sur-
face tension (Figs. 3 and 4) at low bulk concentrations. This has
been translated at both interfaces by the Frumkin Compressibility
model by extremely high values of the adsorption constant b (cf.
Tables 1 and 2 FC). This behaviour in buffer conditions has induced
a different variation of the calculated adsorbed amounts of for
C14TAB (Fig. 8) at the water/air interface as compared to the values
measured by neutron reflectivity in pure water [31]. In our case,
C14TAB is much more important at low bulk concentrations in the
presence of buffer, which is explained by the screening effects of
the added ions and so by the decrease of the electrostatic repulsions
between adsorbed surfactant molecules.
Regarding both interfaces at low surface coverage, the inter-
facial behaviour for the long chain surfactants C14TAB and C16TAB
(Figs. 8 and 9) showing a higher molar areaω and adsorbed amount
at the water/hexane interface than at the water/air interface, is
similar to that of C10TAB and C12TAB (Figs. 6 and 7). This is due
to the affinity of the surfactants for the oil phase which increases
with the alkyl chain length. At high surface coverage (Figs. 8 and 9),
the behaviours of C14TAB and C16TAB join the C12TAB one (Fig. 7)
which confirms a kind of transition between short (n = 10) and long
(n > 12) chain surfactants. This difference is due to the presence
of strong attractive surfactant–surfactant interactions which now
dominate and allow the replacement of the solvent molecules at
the water/hexane interface by the long chain surfactants. The val-
ues of the Frumkin parameters obtained from the best fitting at
the water/oil interface are equal to zero or positive (Table 2 FC and
FIC). Even if a positive value is not needed to obtain the best fitting
(FC model), without any doubt we can expect the presence of self-
interactions for the longest chain surfactants C14TAB and C16TAB. In
contrast to Medrzycka and Zwierzykowski [32] who have observed
the same behaviour for all surfactants of the series (n = 12, 14, and
16), we think, that the hexane molecules are not long enough (as
compared to decane, dodecane and tetradecane) to interact suffi-
ciently strong with the chain of the surfactants and to stay adsorbed
at the interface together with the longest chain surfactants (n = 14
and 16) in the total range of surface coverage.
6. Conclusion
This experimental and theoretical study was dedicated to the
adsorption behaviour of a series of CnTAB (n = 10–16) at the
water/air and water/hexane interface in the presence of neutral
phosphate buffer. Some general trends were detected via the com-
parison of the results obtained at the water/air interface in the
presence of buffer or in pure aqueous solution, and also by compar-
ing the water/air and water/hexane interfaces. The results obtained
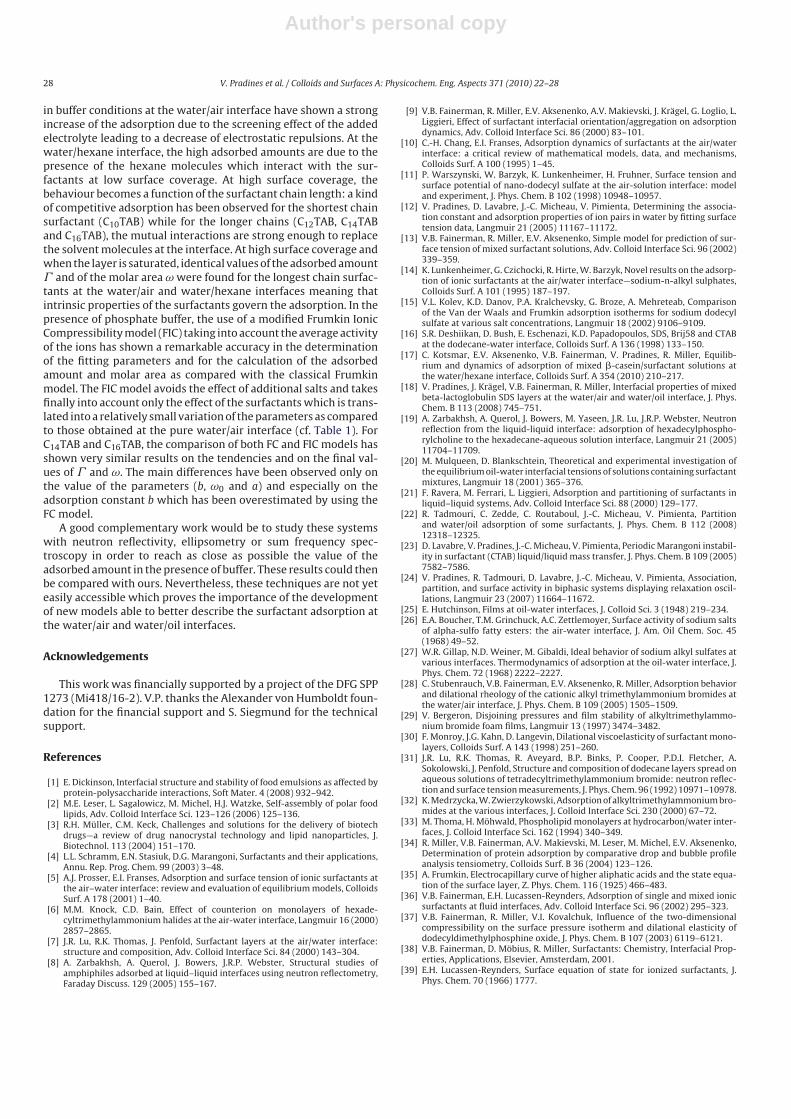
Author's personal copy
28 V. Pradines et al. / Colloids and Surfaces A: Physicochem. Eng. Aspects 371 (2010) 22–28
in buffer conditions at the water/air interface have shown a strong
increase of the adsorption due to the screening effect of the added
electrolyte leading to a decrease of electrostatic repulsions. At the
water/hexane interface, the high adsorbed amounts are due to the
presence of the hexane molecules which interact with the sur-
factants at low surface coverage. At high surface coverage, the
behaviour becomes a function of the surfactant chain length: a kind
of competitive adsorption has been observed for the shortest chain
surfactant (C10TAB) while for the longer chains (C12TAB, C14TAB
and C16TAB), the mutual interactions are strong enough to replace
the solvent molecules at the interface. At high surface coverage and
when the layer is saturated, identical values of the adsorbed amount
and of the molar area ωwere found for the longest chain surfac-
tants at the water/air and water/hexane interfaces meaning that
intrinsic properties of the surfactants govern the adsorption. In the
presence of phosphate buffer, the use of a modified Frumkin Ionic
Compressibility model (FIC) taking into account the average activity
of the ions has shown a remarkable accuracy in the determination
of the fitting parameters and for the calculation of the adsorbed
amount and molar area as compared with the classical Frumkin
model. The FIC model avoids the effect of additional salts and takes
finally into account only the effect of the surfactants which is trans-
lated into a relatively small variation of the parameters as compared
to those obtained at the pure water/air interface (cf. Table 1). For
C14TAB and C16TAB, the comparison of both FC and FIC models has
shown very similar results on the tendencies and on the final val-
ues of and ω. The main differences have been observed only on
the value of the parameters (b, ω0 and a) and especially on the
adsorption constant b which has been overestimated by using the
FC model.
A good complementary work would be to study these systems
with neutron reflectivity, ellipsometry or sum frequency spec-
troscopy in order to reach as close as possible the value of the
adsorbed amount in the presence of buffer. These results could then
be compared with ours. Nevertheless, these techniques are not yet
easily accessible which proves the importance of the development
of new models able to better describe the surfactant adsorption at
the water/air and water/oil interfaces.
Acknowledgements
This work was financially supported by a project of the DFG SPP
1273 (Mi418/16-2). V.P. thanks the Alexander von Humboldt foun-
dation for the financial support and S. Siegmund for the technical
support.
References
[1] E. Dickinson, Interfacial structure and stability of food emulsions as affected byprotein-polysaccharide interactions, Soft Mater. 4 (2008) 932–942.
[2] M.E. Leser, L. Sagalowicz, M. Michel, H.J. Watzke, Self-assembly of polar foodlipids, Adv. Colloid Interface Sci. 123–126 (2006) 125–136.
[3] R.H. Müller, C.M. Keck, Challenges and solutions for the delivery of biotechdrugs—a review of drug nanocrystal technology and lipid nanoparticles, J.Biotechnol. 113 (2004) 151–170.
[4] L.L. Schramm, E.N. Stasiuk, D.G. Marangoni, Surfactants and their applications,Annu. Rep. Prog. Chem. 99 (2003) 3–48.
[5] A.J. Prosser, E.I. Franses, Adsorption and surface tension of ionic surfactants atthe air–water interface: review and evaluation of equilibrium models, ColloidsSurf. A 178 (2001) 1–40.
[6] M.M. Knock, C.D. Bain, Effect of counterion on monolayers of hexade-cyltrimethylammonium halides at the air-water interface, Langmuir 16 (2000)2857–2865.
[7] J.R. Lu, R.K. Thomas, J. Penfold, Surfactant layers at the air/water interface:structure and composition, Adv. Colloid Interface Sci. 84 (2000) 143–304.
[8] A. Zarbakhsh, A. Querol, J. Bowers, J.R.P. Webster, Structural studies ofamphiphiles adsorbed at liquid–liquid interfaces using neutron reflectometry,Faraday Discuss. 129 (2005) 155–167.
[9] V.B. Fainerman, R. Miller, E.V. Aksenenko, A.V. Makievski, J. Krägel, G. Loglio, L.Liggieri, Effect of surfactant interfacial orientation/aggregation on adsorptiondynamics, Adv. Colloid Interface Sci. 86 (2000) 83–101.
[10] C.-H. Chang, E.I. Franses, Adsorption dynamics of surfactants at the air/waterinterface: a critical review of mathematical models, data, and mechanisms,Colloids Surf. A 100 (1995) 1–45.
[11] P. Warszynski, W. Barzyk, K. Lunkenheimer, H. Fruhner, Surface tension andsurface potential of nano-dodecyl sulfate at the air-solution interface: modeland experiment, J. Phys. Chem. B 102 (1998) 10948–10957.
[12] V. Pradines, D. Lavabre, J.-C. Micheau, V. Pimienta, Determining the associa-tion constant and adsorption properties of ion pairs in water by fitting surfacetension data, Langmuir 21 (2005) 11167–11172.
[13] V.B. Fainerman, R. Miller, E.V. Aksenenko, Simple model for prediction of sur-face tension of mixed surfactant solutions, Adv. Colloid Interface Sci. 96 (2002)339–359.
[14] K. Lunkenheimer, G. Czichocki, R. Hirte, W. Barzyk, Novel results on the adsorp-tion of ionic surfactants at the air/water interface—sodium-n-alkyl sulphates,Colloids Surf. A 101 (1995) 187–197.
[15] V.L. Kolev, K.D. Danov, P.A. Kralchevsky, G. Broze, A. Mehreteab, Comparisonof the Van der Waals and Frumkin adsorption isotherms for sodium dodecylsulfate at various salt concentrations, Langmuir 18 (2002) 9106–9109.
[16] S.R. Deshiikan, D. Bush, E. Eschenazi, K.D. Papadopoulos, SDS, Brij58 and CTABat the dodecane-water interface, Colloids Surf. A 136 (1998) 133–150.
[17] C. Kotsmar, E.V. Aksenenko, V.B. Fainerman, V. Pradines, R. Miller, Equilib-rium and dynamics of adsorption of mixed -casein/surfactant solutions atthe water/hexane interface, Colloids Surf. A 354 (2010) 210–217.
[18] V. Pradines, J. Krägel, V.B. Fainerman, R. Miller, Interfacial properties of mixedbeta-lactoglobulin SDS layers at the water/air and water/oil interface, J. Phys.Chem. B 113 (2008) 745–751.
[19] A. Zarbakhsh, A. Querol, J. Bowers, M. Yaseen, J.R. Lu, J.R.P. Webster, Neutronreflection from the liquid-liquid interface: adsorption of hexadecylphospho-rylcholine to the hexadecane-aqueous solution interface, Langmuir 21 (2005)11704–11709.
[20] M. Mulqueen, D. Blankschtein, Theoretical and experimental investigation ofthe equilibrium oil-water interfacial tensions of solutions containing surfactantmixtures, Langmuir 18 (2001) 365–376.
[21] F. Ravera, M. Ferrari, L. Liggieri, Adsorption and partitioning of surfactants inliquid–liquid systems, Adv. Colloid Interface Sci. 88 (2000) 129–177.
[22] R. Tadmouri, C. Zedde, C. Routaboul, J.-C. Micheau, V. Pimienta, Partitionand water/oil adsorption of some surfactants, J. Phys. Chem. B 112 (2008)12318–12325.
[23] D. Lavabre, V. Pradines, J.-C. Micheau, V. Pimienta, Periodic Marangoni instabil-ity in surfactant (CTAB) liquid/liquid mass transfer, J. Phys. Chem. B 109 (2005)7582–7586.
[24] V. Pradines, R. Tadmouri, D. Lavabre, J.-C. Micheau, V. Pimienta, Association,partition, and surface activity in biphasic systems displaying relaxation oscil-lations, Langmuir 23 (2007) 11664–11672.
[25] E. Hutchinson, Films at oil-water interfaces, J. Colloid Sci. 3 (1948) 219–234.[26] E.A. Boucher, T.M. Grinchuck, A.C. Zettlemoyer, Surface activity of sodium salts
of alpha-sulfo fatty esters: the air-water interface, J. Am. Oil Chem. Soc. 45(1968) 49–52.
[27] W.R. Gillap, N.D. Weiner, M. Gibaldi, Ideal behavior of sodium alkyl sulfates atvarious interfaces. Thermodynamics of adsorption at the oil-water interface, J.Phys. Chem. 72 (1968) 2222–2227.
[28] C. Stubenrauch, V.B. Fainerman, E.V. Aksenenko, R. Miller, Adsorption behaviorand dilational rheology of the cationic alkyl trimethylammonium bromides atthe water/air interface, J. Phys. Chem. B 109 (2005) 1505–1509.
[29] V. Bergeron, Disjoining pressures and film stability of alkyltrimethylammo-nium bromide foam films, Langmuir 13 (1997) 3474–3482.
[30] F. Monroy, J.G. Kahn, D. Langevin, Dilational viscoelasticity of surfactant mono-layers, Colloids Surf. A 143 (1998) 251–260.
[31] J.R. Lu, R.K. Thomas, R. Aveyard, B.P. Binks, P. Cooper, P.D.I. Fletcher, A.Sokolowski, J. Penfold, Structure and composition of dodecane layers spread onaqueous solutions of tetradecyltrimethylammonium bromide: neutron reflec-tion and surface tension measurements, J. Phys. Chem. 96 (1992) 10971–10978.
[32] K. Medrzycka, W. Zwierzykowski, Adsorption of alkyltrimethylammonium bro-mides at the various interfaces, J. Colloid Interface Sci. 230 (2000) 67–72.
[33] M. Thoma, H. Möhwald, Phospholipid monolayers at hydrocarbon/water inter-faces, J. Colloid Interface Sci. 162 (1994) 340–349.
[34] R. Miller, V.B. Fainerman, A.V. Makievski, M. Leser, M. Michel, E.V. Aksenenko,Determination of protein adsorption by comparative drop and bubble profileanalysis tensiometry, Colloids Surf. B 36 (2004) 123–126.
[35] A. Frumkin, Electrocapillary curve of higher aliphatic acids and the state equa-tion of the surface layer, Z. Phys. Chem. 116 (1925) 466–483.
[36] V.B. Fainerman, E.H. Lucassen-Reynders, Adsorption of single and mixed ionicsurfactants at fluid interfaces, Adv. Colloid Interface Sci. 96 (2002) 295–323.
[37] V.B. Fainerman, R. Miller, V.I. Kovalchuk, Influence of the two-dimensionalcompressibility on the surface pressure isotherm and dilational elasticity ofdodecyldimethylphosphine oxide, J. Phys. Chem. B 107 (2003) 6119–6121.
[38] V.B. Fainerman, D. Möbius, R. Miller, Surfactants: Chemistry, Interfacial Prop-erties, Applications, Elsevier, Amsterdam, 2001.
[39] E.H. Lucassen-Reynders, Surface equation of state for ionized surfactants, J.Phys. Chem. 70 (1966) 1777.

Paper III Adsorption layer properties of alkyl trimethylammonium bromides at interfaces between water and different alkanes N. Mucic, N.M. Kovalchuk, V.B. Fainerman, E.V. Aksenenko and R. Miller to be submitted
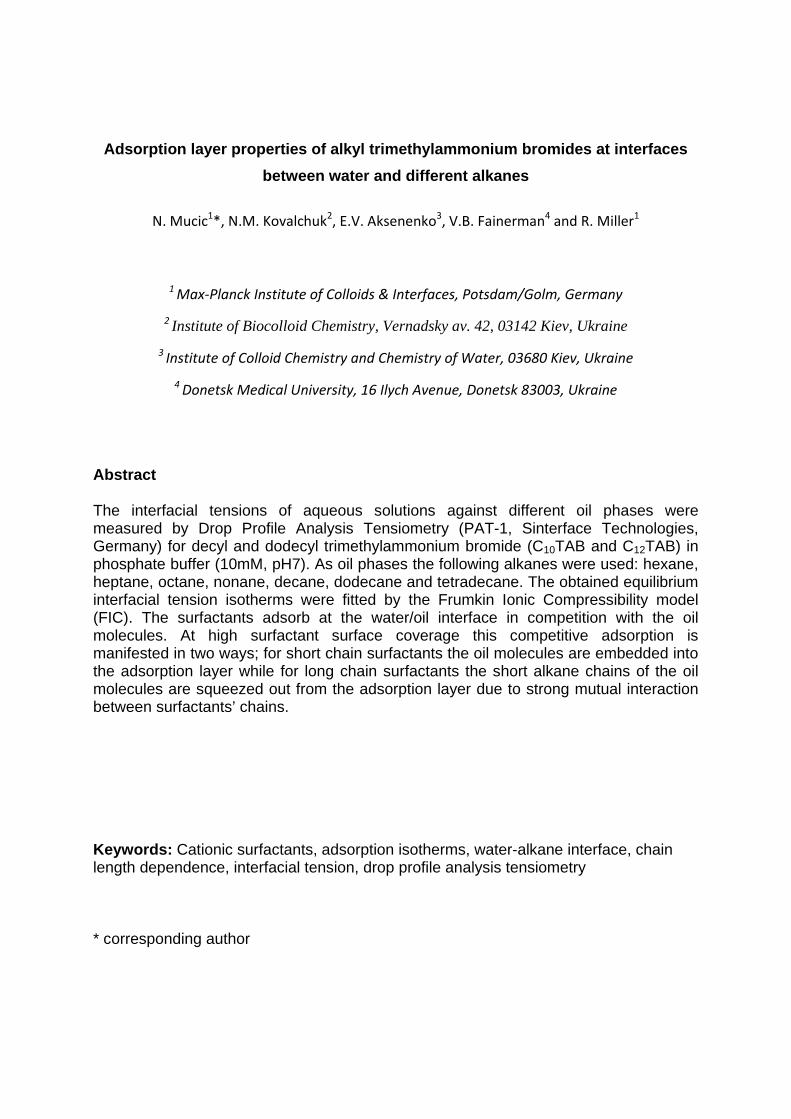
Adsorption layer properties of alkyl trimethylammonium bromides at interfaces
between water and different alkanes
N. Mucic1*, N.M. Kovalchuk2, E.V. Aksenenko3, V.B. Fainerman4 and R. Miller1
1 Max‐Planck Institute of Colloids & Interfaces, Potsdam/Golm, Germany
2 Institute of Biocolloid Chemistry, Vernadsky av. 42, 03142 Kiev, Ukraine
3 Institute of Colloid Chemistry and Chemistry of Water, 03680 Kiev, Ukraine
4 Donetsk Medical University, 16 Ilych Avenue, Donetsk 83003, Ukraine
Abstract The interfacial tensions of aqueous solutions against different oil phases were measured by Drop Profile Analysis Tensiometry (PAT-1, Sinterface Technologies, Germany) for decyl and dodecyl trimethylammonium bromide (C10TAB and C12TAB) in phosphate buffer (10mM, pH7). As oil phases the following alkanes were used: hexane, heptane, octane, nonane, decane, dodecane and tetradecane. The obtained equilibrium interfacial tension isotherms were fitted by the Frumkin Ionic Compressibility model (FIC). The surfactants adsorb at the water/oil interface in competition with the oil molecules. At high surfactant surface coverage this competitive adsorption is manifested in two ways; for short chain surfactants the oil molecules are embedded into the adsorption layer while for long chain surfactants the short alkane chains of the oil molecules are squeezed out from the adsorption layer due to strong mutual interaction between surfactants’ chains. Keywords: Cationic surfactants, adsorption isotherms, water-alkane interface, chain length dependence, interfacial tension, drop profile analysis tensiometry * corresponding author
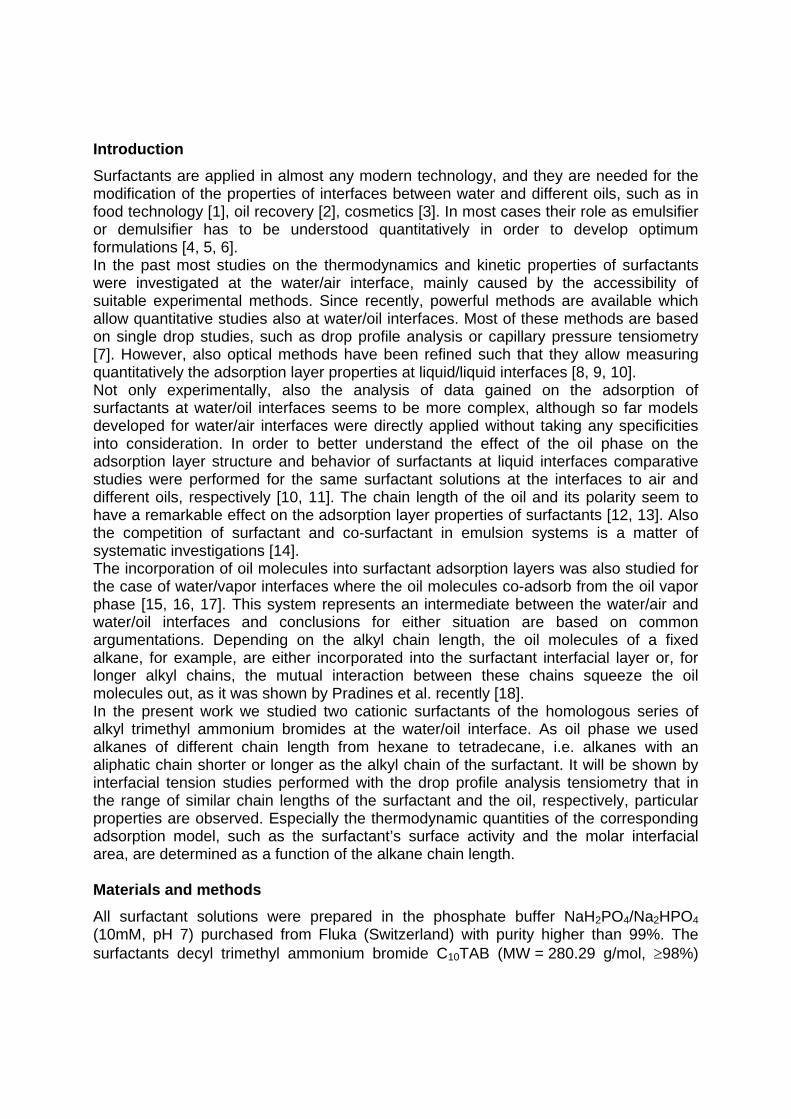
Introduction
Surfactants are applied in almost any modern technology, and they are needed for the modification of the properties of interfaces between water and different oils, such as in food technology [1], oil recovery [2], cosmetics [3]. In most cases their role as emulsifier or demulsifier has to be understood quantitatively in order to develop optimum formulations [4, 5, 6]. In the past most studies on the thermodynamics and kinetic properties of surfactants were investigated at the water/air interface, mainly caused by the accessibility of suitable experimental methods. Since recently, powerful methods are available which allow quantitative studies also at water/oil interfaces. Most of these methods are based on single drop studies, such as drop profile analysis or capillary pressure tensiometry [7]. However, also optical methods have been refined such that they allow measuring quantitatively the adsorption layer properties at liquid/liquid interfaces [8, 9, 10]. Not only experimentally, also the analysis of data gained on the adsorption of surfactants at water/oil interfaces seems to be more complex, although so far models developed for water/air interfaces were directly applied without taking any specificities into consideration. In order to better understand the effect of the oil phase on the adsorption layer structure and behavior of surfactants at liquid interfaces comparative studies were performed for the same surfactant solutions at the interfaces to air and different oils, respectively [10, 11]. The chain length of the oil and its polarity seem to have a remarkable effect on the adsorption layer properties of surfactants [12, 13]. Also the competition of surfactant and co-surfactant in emulsion systems is a matter of systematic investigations [14]. The incorporation of oil molecules into surfactant adsorption layers was also studied for the case of water/vapor interfaces where the oil molecules co-adsorb from the oil vapor phase [15, 16, 17]. This system represents an intermediate between the water/air and water/oil interfaces and conclusions for either situation are based on common argumentations. Depending on the alkyl chain length, the oil molecules of a fixed alkane, for example, are either incorporated into the surfactant interfacial layer or, for longer alkyl chains, the mutual interaction between these chains squeeze the oil molecules out, as it was shown by Pradines et al. recently [18]. In the present work we studied two cationic surfactants of the homologous series of alkyl trimethyl ammonium bromides at the water/oil interface. As oil phase we used alkanes of different chain length from hexane to tetradecane, i.e. alkanes with an aliphatic chain shorter or longer as the alkyl chain of the surfactant. It will be shown by interfacial tension studies performed with the drop profile analysis tensiometry that in the range of similar chain lengths of the surfactant and the oil, respectively, particular properties are observed. Especially the thermodynamic quantities of the corresponding adsorption model, such as the surfactant’s surface activity and the molar interfacial area, are determined as a function of the alkane chain length. Materials and methods
All surfactant solutions were prepared in the phosphate buffer NaH2PO4/Na2HPO4 (10mM, pH 7) purchased from Fluka (Switzerland) with purity higher than 99%. The surfactants decyl trimethyl ammonium bromide C10TAB (MW = 280.29 g/mol, 98%)
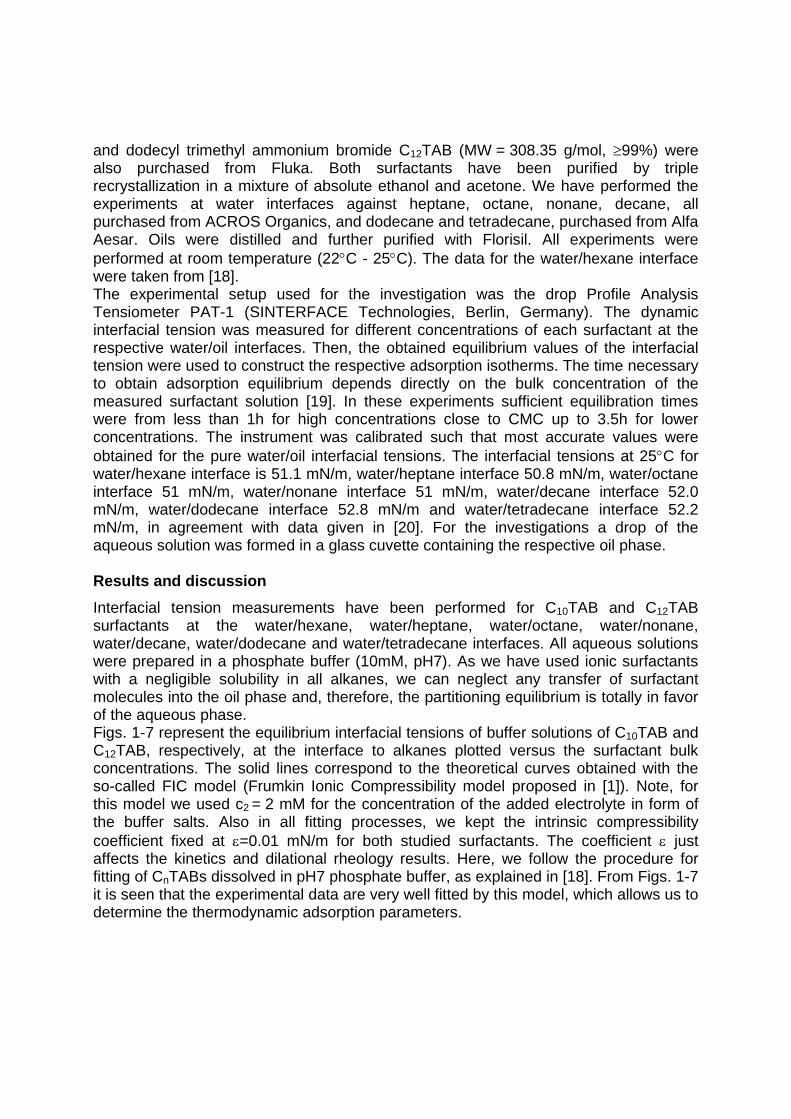
and dodecyl trimethyl ammonium bromide C12TAB (MW = 308.35 g/mol, 99%) were also purchased from Fluka. Both surfactants have been purified by triple recrystallization in a mixture of absolute ethanol and acetone. We have performed the experiments at water interfaces against heptane, octane, nonane, decane, all purchased from ACROS Organics, and dodecane and tetradecane, purchased from Alfa Aesar. Oils were distilled and further purified with Florisil. All experiments were performed at room temperature (22C - 25C). The data for the water/hexane interface were taken from [18]. The experimental setup used for the investigation was the drop Profile Analysis Tensiometer PAT-1 (SINTERFACE Technologies, Berlin, Germany). The dynamic interfacial tension was measured for different concentrations of each surfactant at the respective water/oil interfaces. Then, the obtained equilibrium values of the interfacial tension were used to construct the respective adsorption isotherms. The time necessary to obtain adsorption equilibrium depends directly on the bulk concentration of the measured surfactant solution [19]. In these experiments sufficient equilibration times were from less than 1h for high concentrations close to CMC up to 3.5h for lower concentrations. The instrument was calibrated such that most accurate values were obtained for the pure water/oil interfacial tensions. The interfacial tensions at 25C for water/hexane interface is 51.1 mN/m, water/heptane interface 50.8 mN/m, water/octane interface 51 mN/m, water/nonane interface 51 mN/m, water/decane interface 52.0 mN/m, water/dodecane interface 52.8 mN/m and water/tetradecane interface 52.2 mN/m, in agreement with data given in [20]. For the investigations a drop of the aqueous solution was formed in a glass cuvette containing the respective oil phase. Results and discussion
Interfacial tension measurements have been performed for C10TAB and C12TAB surfactants at the water/hexane, water/heptane, water/octane, water/nonane, water/decane, water/dodecane and water/tetradecane interfaces. All aqueous solutions were prepared in a phosphate buffer (10mM, pH7). As we have used ionic surfactants with a negligible solubility in all alkanes, we can neglect any transfer of surfactant molecules into the oil phase and, therefore, the partitioning equilibrium is totally in favor of the aqueous phase. Figs. 1-7 represent the equilibrium interfacial tensions of buffer solutions of C10TAB and C12TAB, respectively, at the interface to alkanes plotted versus the surfactant bulk concentrations. The solid lines correspond to the theoretical curves obtained with the so-called FIC model (Frumkin Ionic Compressibility model proposed in [1]). Note, for this model we used c2 = 2 mM for the concentration of the added electrolyte in form of the buffer salts. Also in all fitting processes, we kept the intrinsic compressibility coefficient fixed at =0.01 mN/m for both studied surfactants. The coefficient just affects the kinetics and dilational rheology results. Here, we follow the procedure for fitting of CnTABs dissolved in pH7 phosphate buffer, as explained in [18]. From Figs. 1-7 it is seen that the experimental data are very well fitted by this model, which allows us to determine the thermodynamic adsorption parameters.
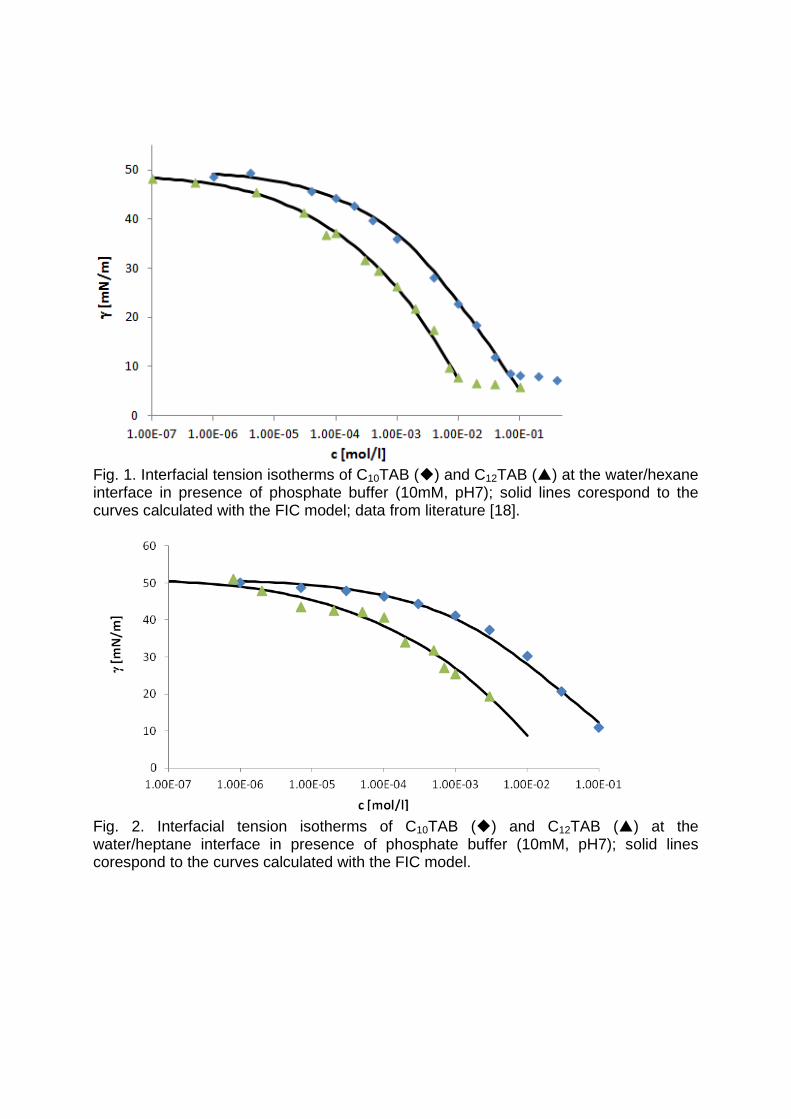
Fig. 1. Interfacial tension isotherms of C10TAB () and C12TAB () at the water/hexane interface in presence of phosphate buffer (10mM, pH7); solid lines corespond to the curves calculated with the FIC model; data from literature [18].
Fig. 2. Interfacial tension isotherms of C10TAB () and C12TAB () at the water/heptane interface in presence of phosphate buffer (10mM, pH7); solid lines corespond to the curves calculated with the FIC model.
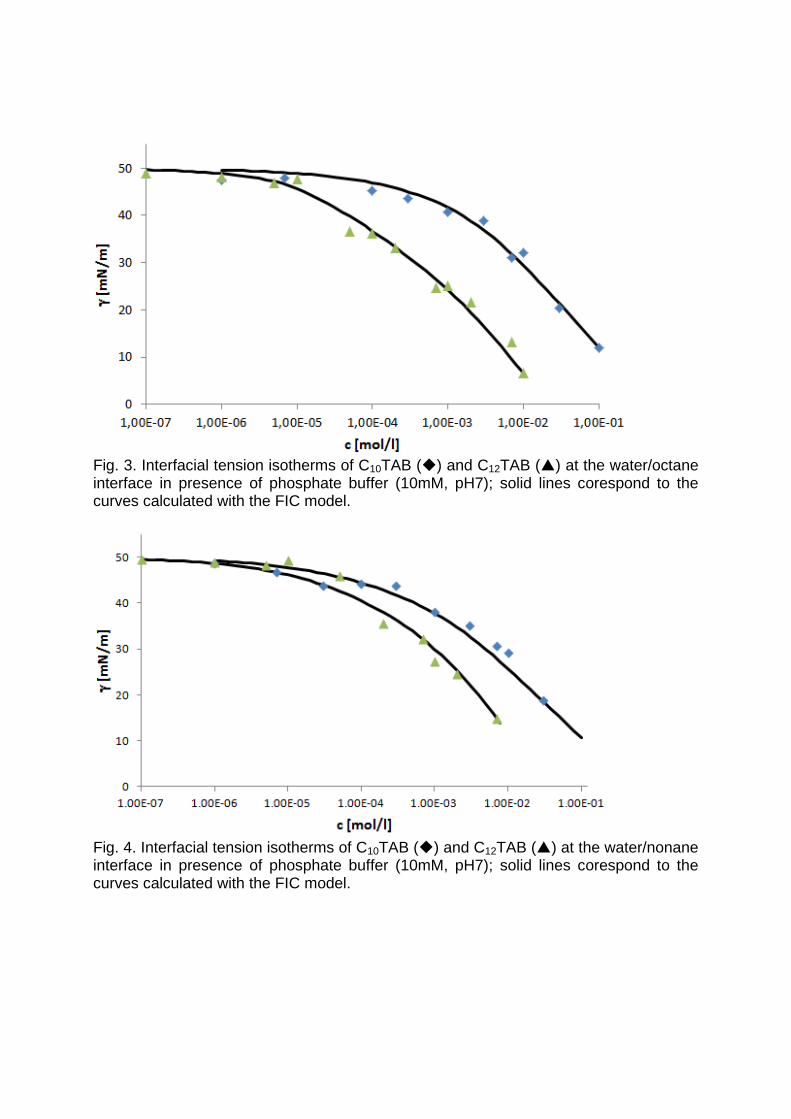
Fig. 3. Interfacial tension isotherms of C10TAB () and C12TAB () at the water/octane interface in presence of phosphate buffer (10mM, pH7); solid lines corespond to the curves calculated with the FIC model.
Fig. 4. Interfacial tension isotherms of C10TAB () and C12TAB () at the water/nonane interface in presence of phosphate buffer (10mM, pH7); solid lines corespond to the curves calculated with the FIC model.
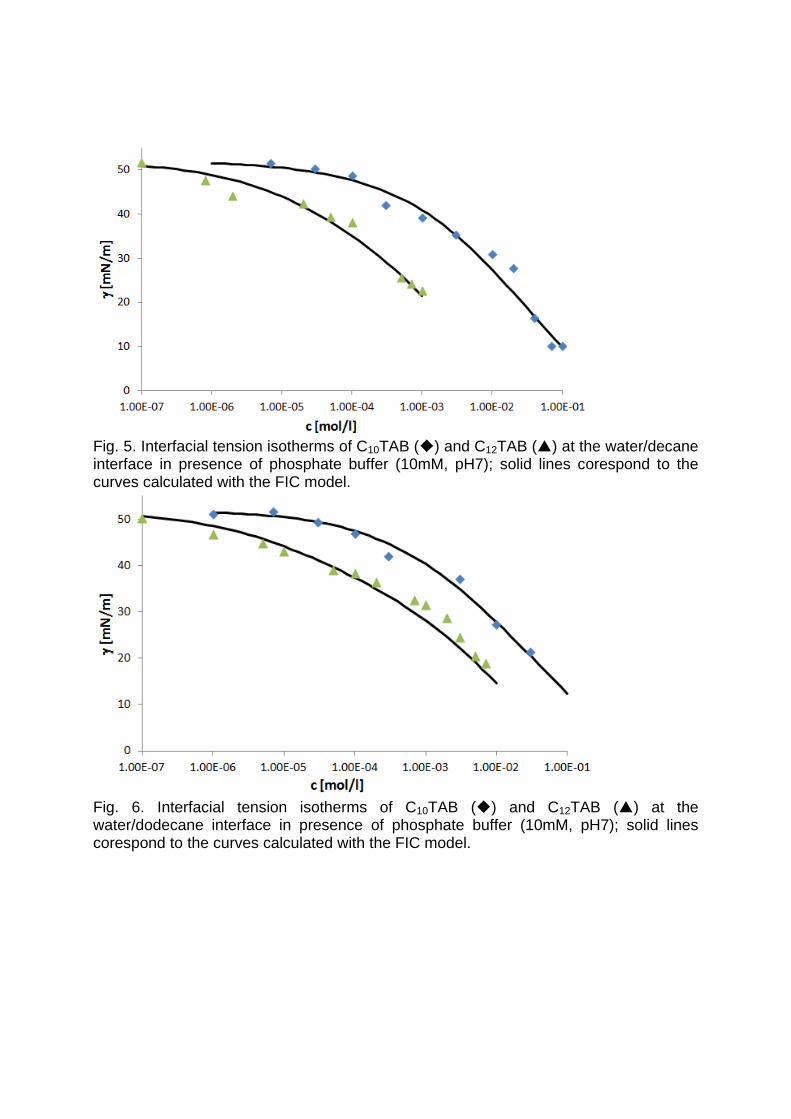
Fig. 5. Interfacial tension isotherms of C10TAB () and C12TAB () at the water/decane interface in presence of phosphate buffer (10mM, pH7); solid lines corespond to the curves calculated with the FIC model.
Fig. 6. Interfacial tension isotherms of C10TAB () and C12TAB () at the water/dodecane interface in presence of phosphate buffer (10mM, pH7); solid lines corespond to the curves calculated with the FIC model.
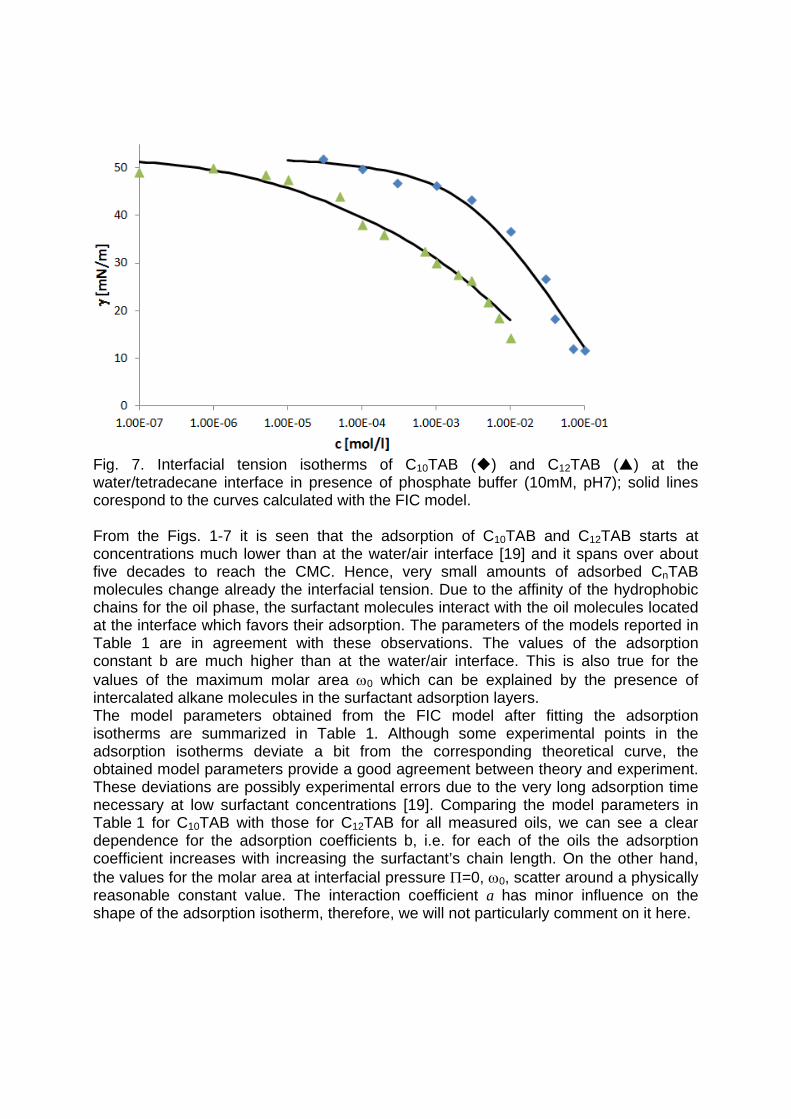
Fig. 7. Interfacial tension isotherms of C10TAB () and C12TAB () at the water/tetradecane interface in presence of phosphate buffer (10mM, pH7); solid lines corespond to the curves calculated with the FIC model. From the Figs. 1-7 it is seen that the adsorption of C10TAB and C12TAB starts at concentrations much lower than at the water/air interface [19] and it spans over about five decades to reach the CMC. Hence, very small amounts of adsorbed CnTAB molecules change already the interfacial tension. Due to the affinity of the hydrophobic chains for the oil phase, the surfactant molecules interact with the oil molecules located at the interface which favors their adsorption. The parameters of the models reported in Table 1 are in agreement with these observations. The values of the adsorption constant b are much higher than at the water/air interface. This is also true for the values of the maximum molar area 0 which can be explained by the presence of intercalated alkane molecules in the surfactant adsorption layers. The model parameters obtained from the FIC model after fitting the adsorption isotherms are summarized in Table 1. Although some experimental points in the adsorption isotherms deviate a bit from the corresponding theoretical curve, the obtained model parameters provide a good agreement between theory and experiment. These deviations are possibly experimental errors due to the very long adsorption time necessary at low surfactant concentrations [19]. Comparing the model parameters in Table 1 for C10TAB with those for C12TAB for all measured oils, we can see a clear dependence for the adsorption coefficients b, i.e. for each of the oils the adsorption coefficient increases with increasing the surfactant’s chain length. On the other hand, the values for the molar area at interfacial pressure =0, 0, scatter around a physically reasonable constant value. The interaction coefficient a has minor influence on the shape of the adsorption isotherm, therefore, we will not particularly comment on it here.
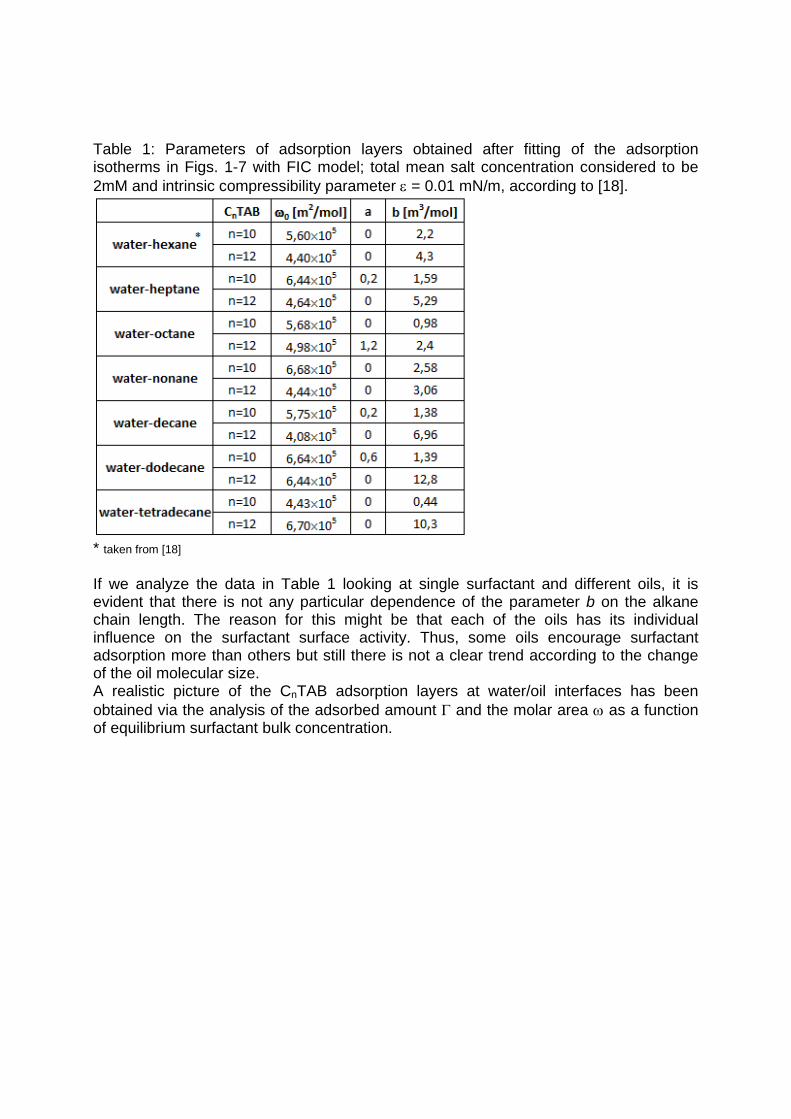
Table 1: Parameters of adsorption layers obtained after fitting of the adsorption isotherms in Figs. 1-7 with FIC model; total mean salt concentration considered to be 2mM and intrinsic compressibility parameter = 0.01 mN/m, according to [18].
* taken from [18]
If we analyze the data in Table 1 looking at single surfactant and different oils, it is evident that there is not any particular dependence of the parameter b on the alkane chain length. The reason for this might be that each of the oils has its individual influence on the surfactant surface activity. Thus, some oils encourage surfactant adsorption more than others but still there is not a clear trend according to the change of the oil molecular size. A realistic picture of the CnTAB adsorption layers at water/oil interfaces has been obtained via the analysis of the adsorbed amount and the molar area as a function of equilibrium surfactant bulk concentration.
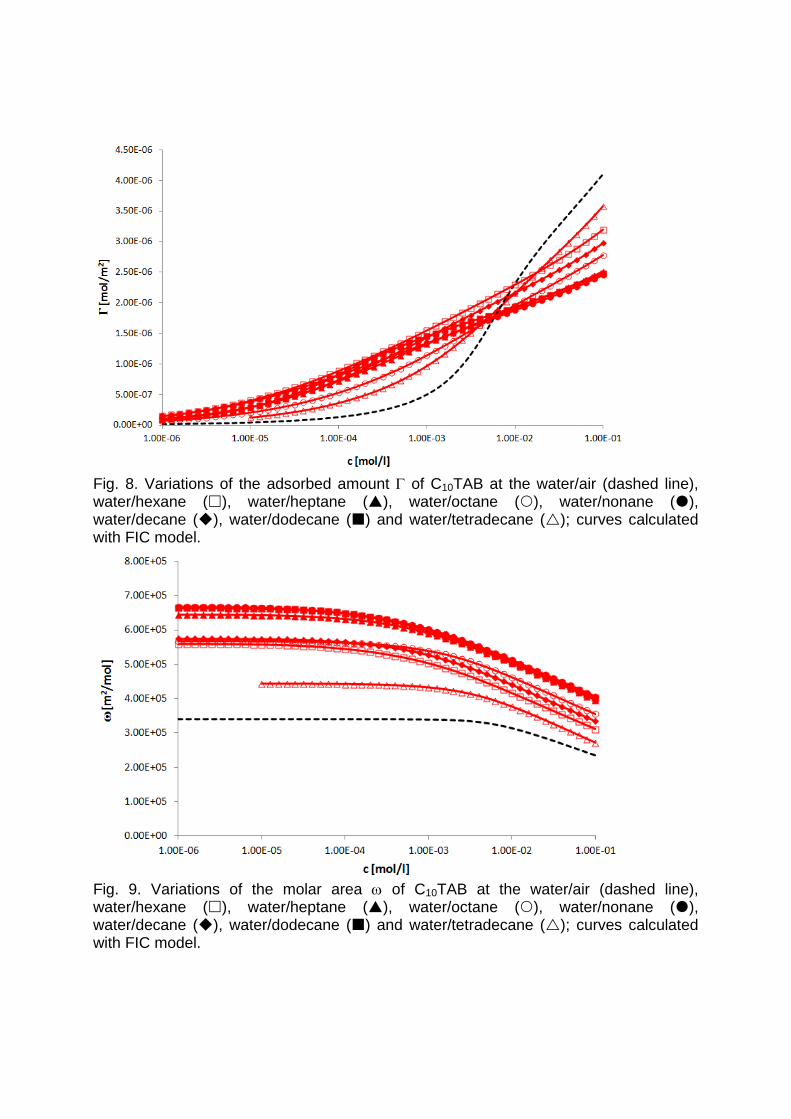
Fig. 8. Variations of the adsorbed amount of C10TAB at the water/air (dashed line), water/hexane (), water/heptane (), water/octane (), water/nonane (), water/decane (), water/dodecane () and water/tetradecane (); curves calculated with FIC model.
Fig. 9. Variations of the molar area of C10TAB at the water/air (dashed line), water/hexane (), water/heptane (), water/octane (), water/nonane (), water/decane (), water/dodecane () and water/tetradecane (); curves calculated with FIC model.
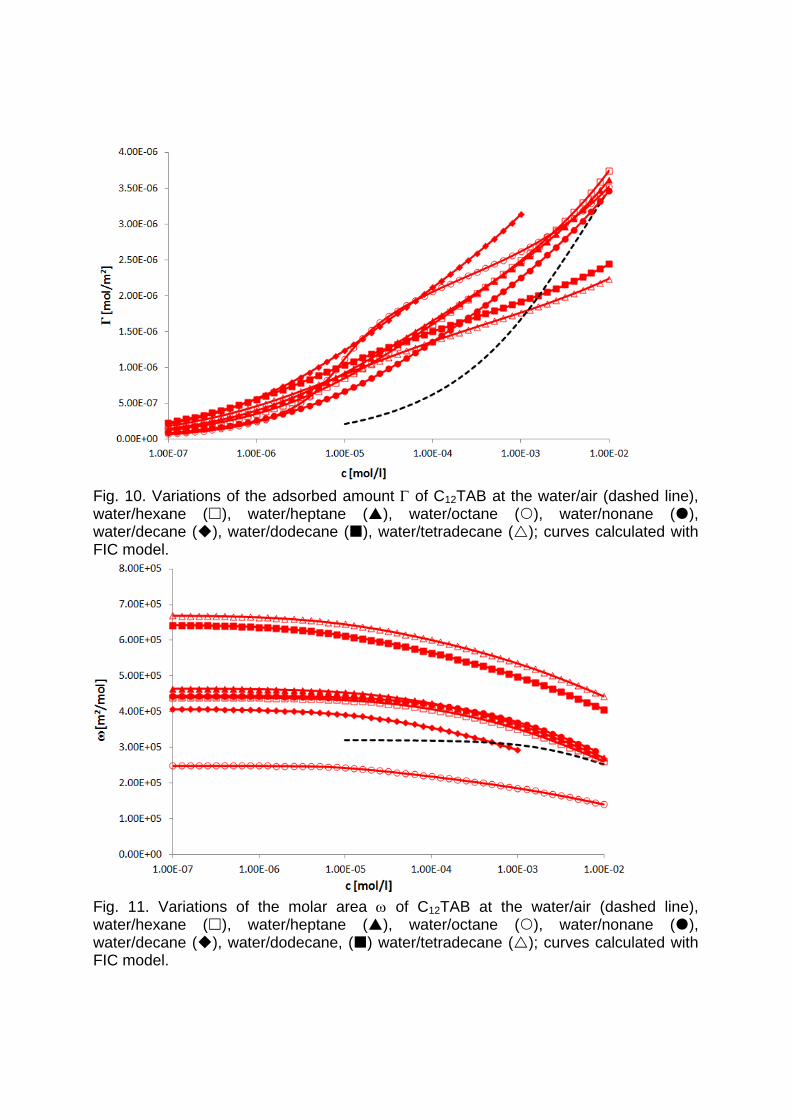
Fig. 10. Variations of the adsorbed amount of C12TAB at the water/air (dashed line), water/hexane (), water/heptane (), water/octane (), water/nonane (), water/decane (), water/dodecane (), water/tetradecane (); curves calculated with FIC model.
Fig. 11. Variations of the molar area of C12TAB at the water/air (dashed line), water/hexane (), water/heptane (), water/octane (), water/nonane (), water/decane (), water/dodecane, () water/tetradecane (); curves calculated with FIC model.
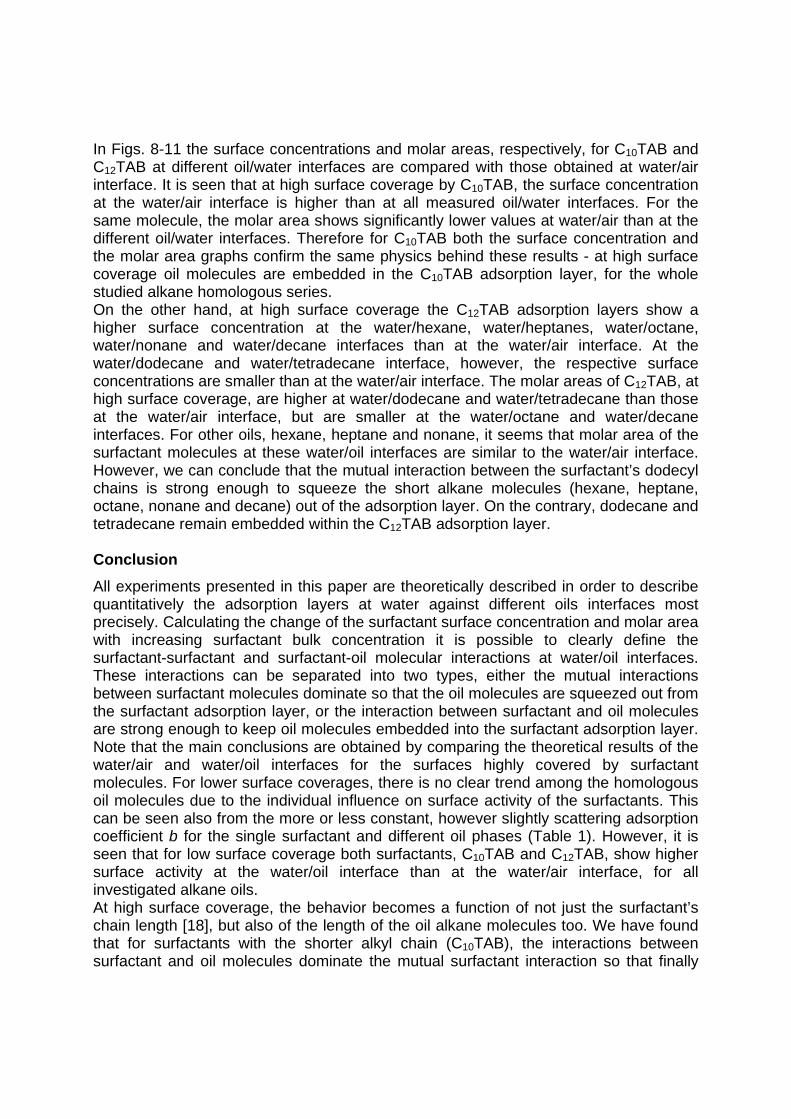
In Figs. 8-11 the surface concentrations and molar areas, respectively, for C10TAB and C12TAB at different oil/water interfaces are compared with those obtained at water/air interface. It is seen that at high surface coverage by C10TAB, the surface concentration at the water/air interface is higher than at all measured oil/water interfaces. For the same molecule, the molar area shows significantly lower values at water/air than at the different oil/water interfaces. Therefore for C10TAB both the surface concentration and the molar area graphs confirm the same physics behind these results - at high surface coverage oil molecules are embedded in the C10TAB adsorption layer, for the whole studied alkane homologous series. On the other hand, at high surface coverage the C12TAB adsorption layers show a higher surface concentration at the water/hexane, water/heptanes, water/octane, water/nonane and water/decane interfaces than at the water/air interface. At the water/dodecane and water/tetradecane interface, however, the respective surface concentrations are smaller than at the water/air interface. The molar areas of C12TAB, at high surface coverage, are higher at water/dodecane and water/tetradecane than those at the water/air interface, but are smaller at the water/octane and water/decane interfaces. For other oils, hexane, heptane and nonane, it seems that molar area of the surfactant molecules at these water/oil interfaces are similar to the water/air interface. However, we can conclude that the mutual interaction between the surfactant’s dodecyl chains is strong enough to squeeze the short alkane molecules (hexane, heptane, octane, nonane and decane) out of the adsorption layer. On the contrary, dodecane and tetradecane remain embedded within the C12TAB adsorption layer. Conclusion
All experiments presented in this paper are theoretically described in order to describe quantitatively the adsorption layers at water against different oils interfaces most precisely. Calculating the change of the surfactant surface concentration and molar area with increasing surfactant bulk concentration it is possible to clearly define the surfactant-surfactant and surfactant-oil molecular interactions at water/oil interfaces. These interactions can be separated into two types, either the mutual interactions between surfactant molecules dominate so that the oil molecules are squeezed out from the surfactant adsorption layer, or the interaction between surfactant and oil molecules are strong enough to keep oil molecules embedded into the surfactant adsorption layer. Note that the main conclusions are obtained by comparing the theoretical results of the water/air and water/oil interfaces for the surfaces highly covered by surfactant molecules. For lower surface coverages, there is no clear trend among the homologous oil molecules due to the individual influence on surface activity of the surfactants. This can be seen also from the more or less constant, however slightly scattering adsorption coefficient b for the single surfactant and different oil phases (Table 1). However, it is seen that for low surface coverage both surfactants, C10TAB and C12TAB, show higher surface activity at the water/oil interface than at the water/air interface, for all investigated alkane oils. At high surface coverage, the behavior becomes a function of not just the surfactant’s chain length [18], but also of the length of the oil alkane molecules too. We have found that for surfactants with the shorter alkyl chain (C10TAB), the interactions between surfactant and oil molecules dominate the mutual surfactant interaction so that finally
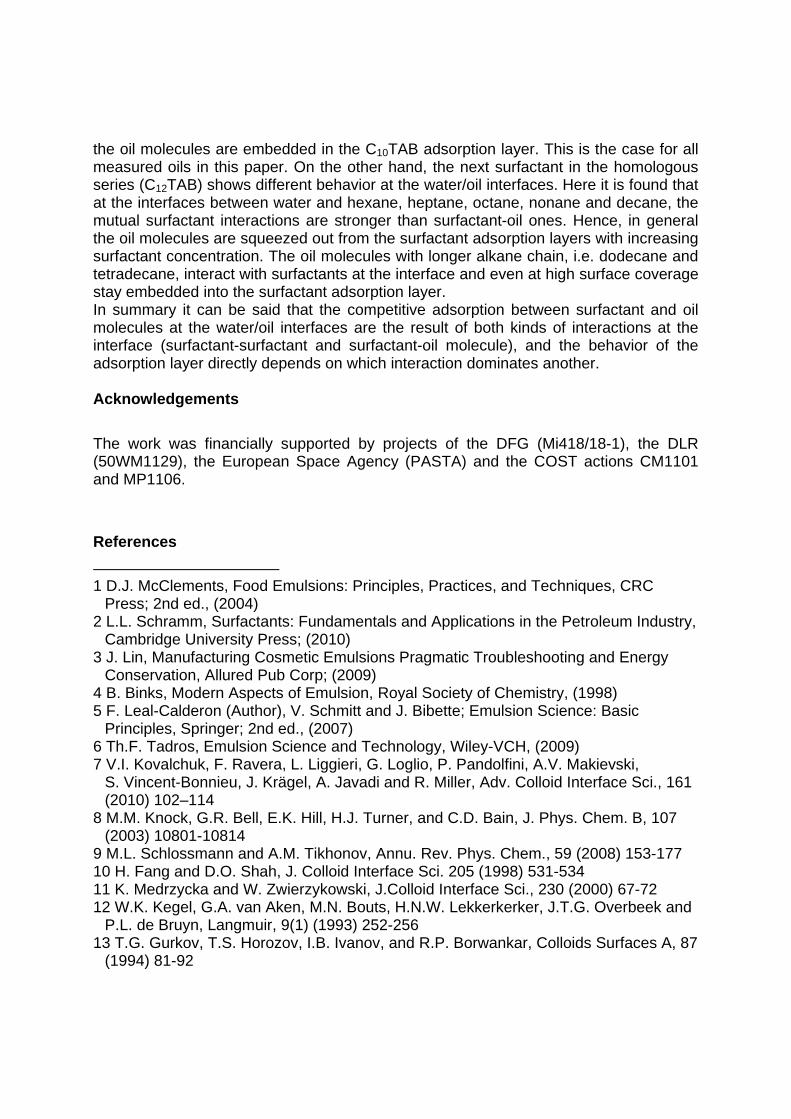
the oil molecules are embedded in the C10TAB adsorption layer. This is the case for all measured oils in this paper. On the other hand, the next surfactant in the homologous series (C12TAB) shows different behavior at the water/oil interfaces. Here it is found that at the interfaces between water and hexane, heptane, octane, nonane and decane, the mutual surfactant interactions are stronger than surfactant-oil ones. Hence, in general the oil molecules are squeezed out from the surfactant adsorption layers with increasing surfactant concentration. The oil molecules with longer alkane chain, i.e. dodecane and tetradecane, interact with surfactants at the interface and even at high surface coverage stay embedded into the surfactant adsorption layer. In summary it can be said that the competitive adsorption between surfactant and oil molecules at the water/oil interfaces are the result of both kinds of interactions at the interface (surfactant-surfactant and surfactant-oil molecule), and the behavior of the adsorption layer directly depends on which interaction dominates another. Acknowledgements
The work was financially supported by projects of the DFG (Mi418/18-1), the DLR (50WM1129), the European Space Agency (PASTA) and the COST actions CM1101 and MP1106.
References
1 D.J. McClements, Food Emulsions: Principles, Practices, and Techniques, CRC Press; 2nd ed., (2004)
2 L.L. Schramm, Surfactants: Fundamentals and Applications in the Petroleum Industry, Cambridge University Press; (2010)
3 J. Lin, Manufacturing Cosmetic Emulsions Pragmatic Troubleshooting and Energy Conservation, Allured Pub Corp; (2009)
4 B. Binks, Modern Aspects of Emulsion, Royal Society of Chemistry, (1998) 5 F. Leal-Calderon (Author), V. Schmitt and J. Bibette; Emulsion Science: Basic
Principles, Springer; 2nd ed., (2007) 6 Th.F. Tadros, Emulsion Science and Technology, Wiley-VCH, (2009) 7 V.I. Kovalchuk, F. Ravera, L. Liggieri, G. Loglio, P. Pandolfini, A.V. Makievski,
S. Vincent-Bonnieu, J. Krägel, A. Javadi and R. Miller, Adv. Colloid Interface Sci., 161 (2010) 102–114
8 M.M. Knock, G.R. Bell, E.K. Hill, H.J. Turner, and C.D. Bain, J. Phys. Chem. B, 107 (2003) 10801-10814
9 M.L. Schlossmann and A.M. Tikhonov, Annu. Rev. Phys. Chem., 59 (2008) 153-177 10 H. Fang and D.O. Shah, J. Colloid Interface Sci. 205 (1998) 531-534 11 K. Medrzycka and W. Zwierzykowski, J.Colloid Interface Sci., 230 (2000) 67-72 12 W.K. Kegel, G.A. van Aken, M.N. Bouts, H.N.W. Lekkerkerker, J.T.G. Overbeek and
P.L. de Bruyn, Langmuir, 9(1) (1993) 252-256 13 T.G. Gurkov, T.S. Horozov, I.B. Ivanov, and R.P. Borwankar, Colloids Surfaces A, 87
(1994) 81-92
14 L. Peltonen, J. Hirvonen and J. Yliruusi, J.Colloid Interface Sci., 240 (2001) 272-276 15 R. Aveyard, B.P. Binks, P.D.I. Fletcher and J.R. MacNab, Ber.Bunsenges. 100
(1996) 224-231 16 A. Javadi, N. Moradi, H. Möhwald and R. Miller, Soft Matter, 6 (2010) 4710-4714 17 A. Javadi, N. Moradi, M. Karbaschi, V.B. Fainerman, H. Möhwald and R. Miller,
Colloids Surfaces A, 391 (2011) 19-24 18 V. Pradines, V.B. Fainerman, E.V. Aksenenko, J. Kraegel, N. Mucic and R. Miller,
Colloids Surf. A, 371 (2010) 22-28 19 N. Mucic, A. Javadi, N.M. Kovalchuk, E.V. Aksenenko and R. Miller, Adv. Colloid
Interface Sci., 168 (2011) 167-178. 20 A.H. Demond and A.S. Lindner, Environ.Sci.Technol., 27 (1993) 2318-2331.

Paper IV Mixed adsorption layers at the aqueous CnTAB solution / hexane vapor interface N. Mucic, N. Moradi, A. Javadi, E.V. Aksenenko, V.B. Fainerman and R. Miller to be submitted
Mixed adsorption layers at the aqueous CnTAB solution/hexane vapor interface
N. Mucic1*, N. Moradi1, A. Javadi1, E.V. Aksenenko2, V.B. Fainerman3 and R. Miller1
1 Max‐Planck Institute of Colloids & Interfaces, Potsdam/Golm, Germany
2 Institute of Colloid Chemistry and Chemistry of Water, 03680 Kiev, Ukraine
3 Donetsk Medical University, 16 Ilych Avenue, Donetsk 83003, Ukraine
Abstract Interfacial tension experiments were performed at the water/oil vapor interface utilizing the drop profile analysis tensiometer PAT‐1 for a series of alkyl trimethylammonium bromides with different chain lengths (C10, C12, C14 and C16). At the water/hexane vapor interface the attractive interactions between the hydrophobic chains of the adsorbed surfactants and hexane molecules promote hexane adsorption at the interface. The length of the surfactant tail influences the surfactant’s adsorbed amount, as expected from the Traube rule, however the hexane co‐adsorption does not directly follow this rule.
Keywords: Cationic surfactants, adsorption isotherms, water‐alkane vapor interface, chain
length dependence, interfacial tension, drop profile analysis tensiometry * corresponding author
Introduction
Recently, the competitive adsorption between aqueous surfactants and oil molecules has been more intensively investigated. New findings from experiments at water/oil and water/oil vapor interfaces via drop profile analysis have highly encouraged these investigations. The question about the interaction between surfactant molecules adsorped from the aqueous solution and oil molecule at the interface is of enormous importance for interfacial science. These interactions directly define the interfacial properties and so the properties of a whole system, such as emulsions. The thermodynamic properties of surfactant – oil interactions were systematically investigated by the groups of Medrzycka et al. [1] and Pradines et al. [2] regarding the thermodynamic interfacial properties. They have found that the surfactant molar area and the surface concentration depend not only on the surface coverage by the surfactant molecules but also on the oil chain lengths. Thus, different chain lengths of surfactants and oils interact in different ways. Generally, surfactants with longer chain length are able to squeeze out the shorter oil molecules from the adsorption layer. In [3] the dynamic and rheological properties of such systems were investigated and it was found that the dynamics of the water/oil interface is more complex than expected for a pure diffusion process. This is obviously caused by the interaction between the surfactants’ alkyl chains and the oil molecules. In a recent work the effect of different oils on the adsorption of the homologous CnTABs was shown [4], and it was found that the behaviour of the adsorption layer directly depends on which type of interactions dominates, between surfactant‐surfactant or surfactant‐oil molecule. In the present work we essentially discuss the attraction between surfactant chains and oil molecules via measurements of aqueous solutions of surfactants with different chain lengths (C10TAB, C12TAB, C14TAB and C16TAB) against hexane vapor. Therewith, we wanted to see differences in the adsorbed amount of hexane molecules at the aqueous solution surface of the different surfactants. The obtained results are compared with data measured at the interfaces between aqueous solutions against air and (bulk) oil, respectively.
Material and methods
The substances investigated in this paper, C10TAB (decyl trimethylammonium bromide, Mw = 280.29 g/mol), C12TAB (dodecyl trimethylammonium bromide, Mw = 308.35 g/mol), C14TAB (tetradecyl trimethylammonium bromide, Mw = 336.40 g/mol) and C16TAB (hexadecyl trimethylammonium bromide, Mw = 364.46 g/mol) were purchased from Fluka (Switzerland) with a purity of >99%. The substances were additionally purified by a triple recrystallization with a ethanol/acetone mixture. All solutions were prepared in 10mM NaH2PO4/NaHPO4 phosphate buffer,
pH 7, (Fluka, >99%) using ultrapure Milli‐Q water (resistivity = 18.2 Mcm). The experiments were performed at room temperature (23 – 24 °C). Hexane was purchased from Fluka, distillated, purified with aluminium oxide and subsequently saturated with ultrapure Milli‐Q water. The experiments were performed with the drop profile analysis tensiometer PAT‐1 (SINTERFACE Technologies, Germany). In brief, the principle of the experiments consists in forming a drop in a closed cuvette (3cm × 3cm × 3cm), and after a certain time (typically 300s) a defined amount of alkane (1 ml) is injected to the bottom of the cuvette. The cell is closed such that after a few minutes the saturated hexane vapor atmosphere is established. The experimental details were explained elsewhere [5, 6].
Experimental results and discussion
The experiments were performed according to the protocol described in [6], where a drop of surfactant solution is primarily formed in air and then in addition the atmosphere around the drop is saturated with alkane vapor. Therefore, at the beginning of the measurement, the interfacial tension is decreasing
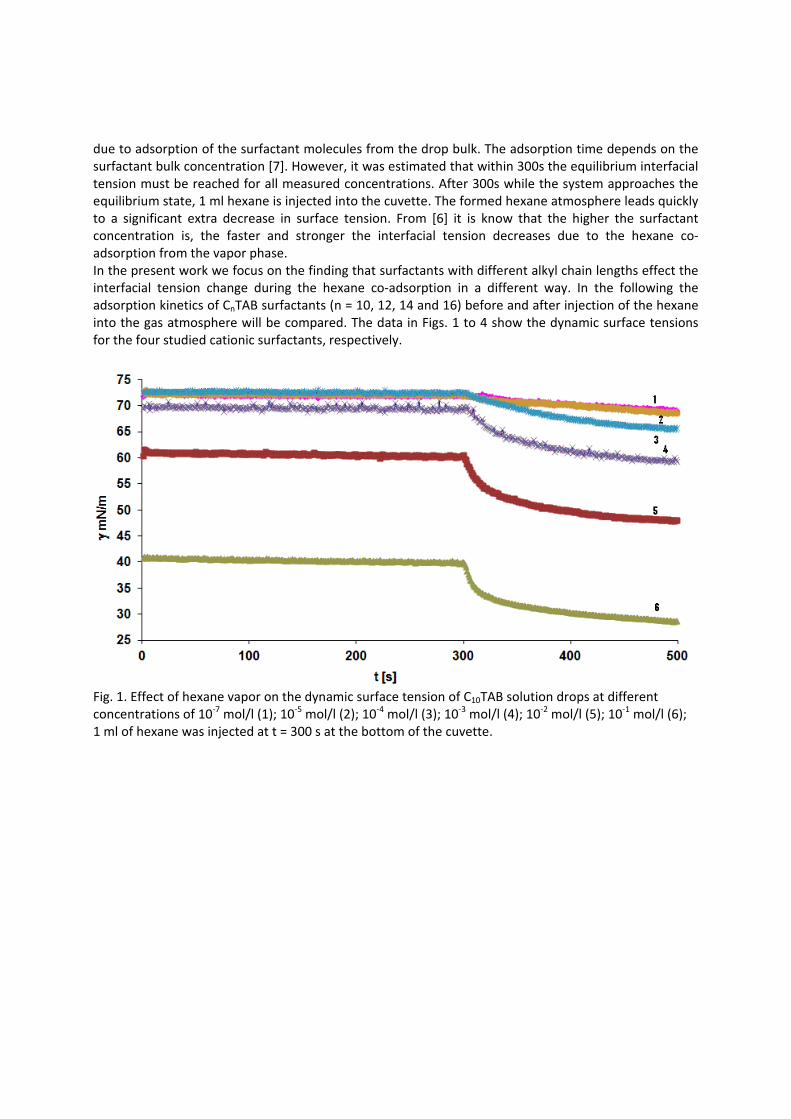
due to adsorption of the surfactant molecules from the drop bulk. The adsorption time depends on the surfactant bulk concentration [7]. However, it was estimated that within 300s the equilibrium interfacial tension must be reached for all measured concentrations. After 300s while the system approaches the equilibrium state, 1 ml hexane is injected into the cuvette. The formed hexane atmosphere leads quickly to a significant extra decrease in surface tension. From [6] it is know that the higher the surfactant concentration is, the faster and stronger the interfacial tension decreases due to the hexane co‐adsorption from the vapor phase. In the present work we focus on the finding that surfactants with different alkyl chain lengths effect the interfacial tension change during the hexane co‐adsorption in a different way. In the following the adsorption kinetics of CnTAB surfactants (n = 10, 12, 14 and 16) before and after injection of the hexane into the gas atmosphere will be compared. The data in Figs. 1 to 4 show the dynamic surface tensions for the four studied cationic surfactants, respectively.
Fig. 1. Effect of hexane vapor on the dynamic surface tension of C10TAB solution drops at different concentrations of 10‐7 mol/l (1); 10‐5 mol/l (2); 10‐4 mol/l (3); 10‐3 mol/l (4); 10‐2 mol/l (5); 10‐1 mol/l (6); 1 ml of hexane was injected at t = 300 s at the bottom of the cuvette.
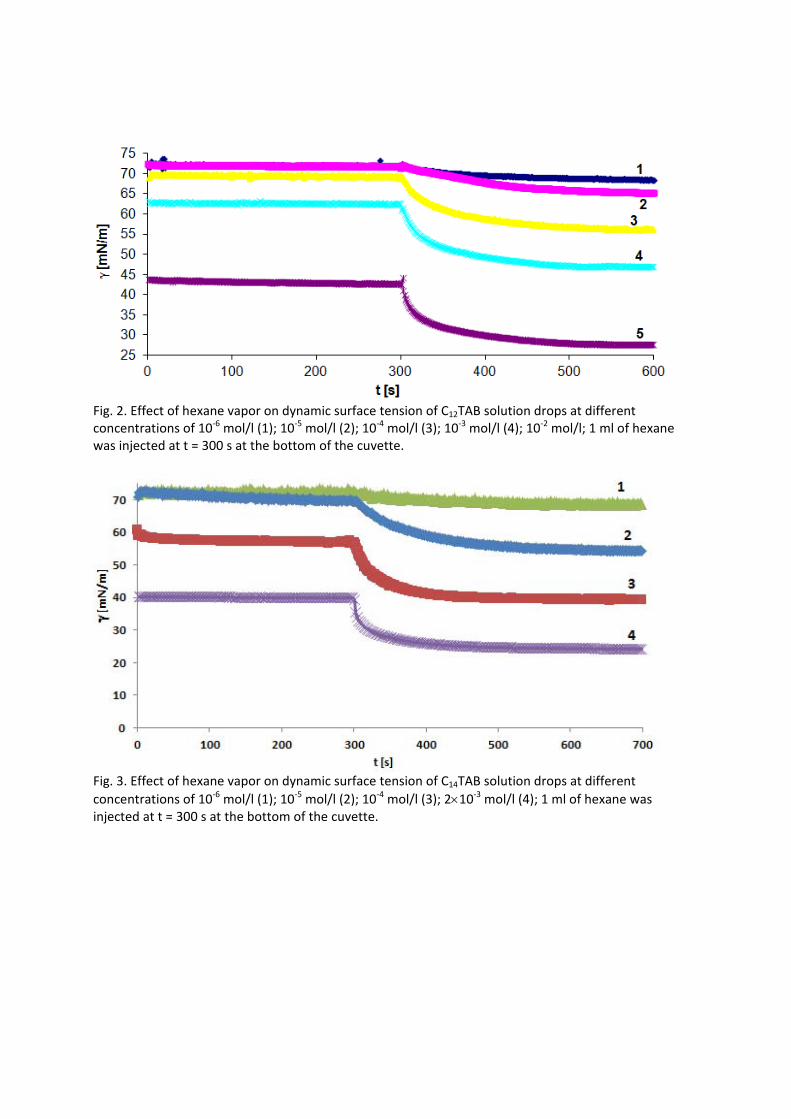
Fig. 2. Effect of hexane vapor on dynamic surface tension of C12TAB solution drops at different concentrations of 10‐6 mol/l (1); 10‐5 mol/l (2); 10‐4 mol/l (3); 10‐3 mol/l (4); 10‐2 mol/l; 1 ml of hexane was injected at t = 300 s at the bottom of the cuvette.
Fig. 3. Effect of hexane vapor on dynamic surface tension of C14TAB solution drops at different
concentrations of 10‐6 mol/l (1); 10‐5 mol/l (2); 10‐4 mol/l (3); 210‐3 mol/l (4); 1 ml of hexane was injected at t = 300 s at the bottom of the cuvette.
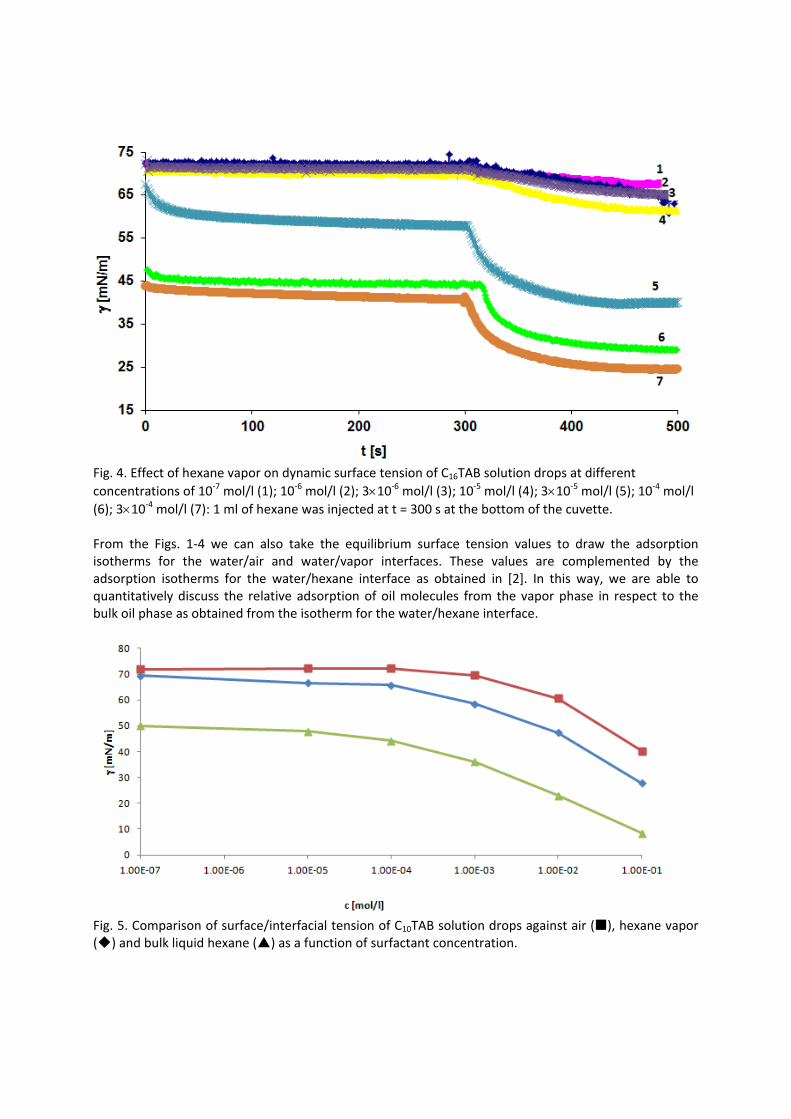
Fig. 4. Effect of hexane vapor on dynamic surface tension of C16TAB solution drops at different
concentrations of 10‐7 mol/l (1); 10‐6 mol/l (2); 310‐6 mol/l (3); 10‐5 mol/l (4); 310‐5 mol/l (5); 10‐4 mol/l
(6); 310‐4 mol/l (7): 1 ml of hexane was injected at t = 300 s at the bottom of the cuvette. From the Figs. 1‐4 we can also take the equilibrium surface tension values to draw the adsorption isotherms for the water/air and water/vapor interfaces. These values are complemented by the adsorption isotherms for the water/hexane interface as obtained in [2]. In this way, we are able to quantitatively discuss the relative adsorption of oil molecules from the vapor phase in respect to the bulk oil phase as obtained from the isotherm for the water/hexane interface.
Fig. 5. Comparison of surface/interfacial tension of C10TAB solution drops against air (), hexane vapor () and bulk liquid hexane () as a function of surfactant concentration.
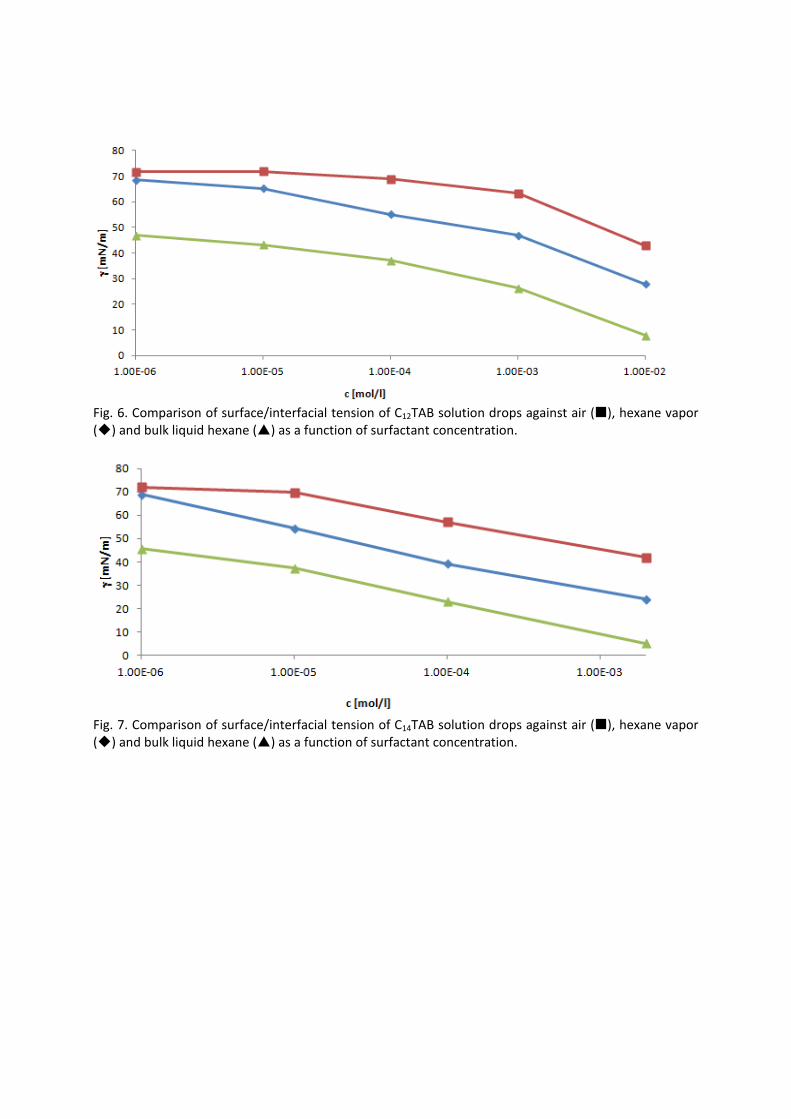
Fig. 6. Comparison of surface/interfacial tension of C12TAB solution drops against air (), hexane vapor () and bulk liquid hexane () as a function of surfactant concentration.
Fig. 7. Comparison of surface/interfacial tension of C14TAB solution drops against air (), hexane vapor () and bulk liquid hexane () as a function of surfactant concentration.
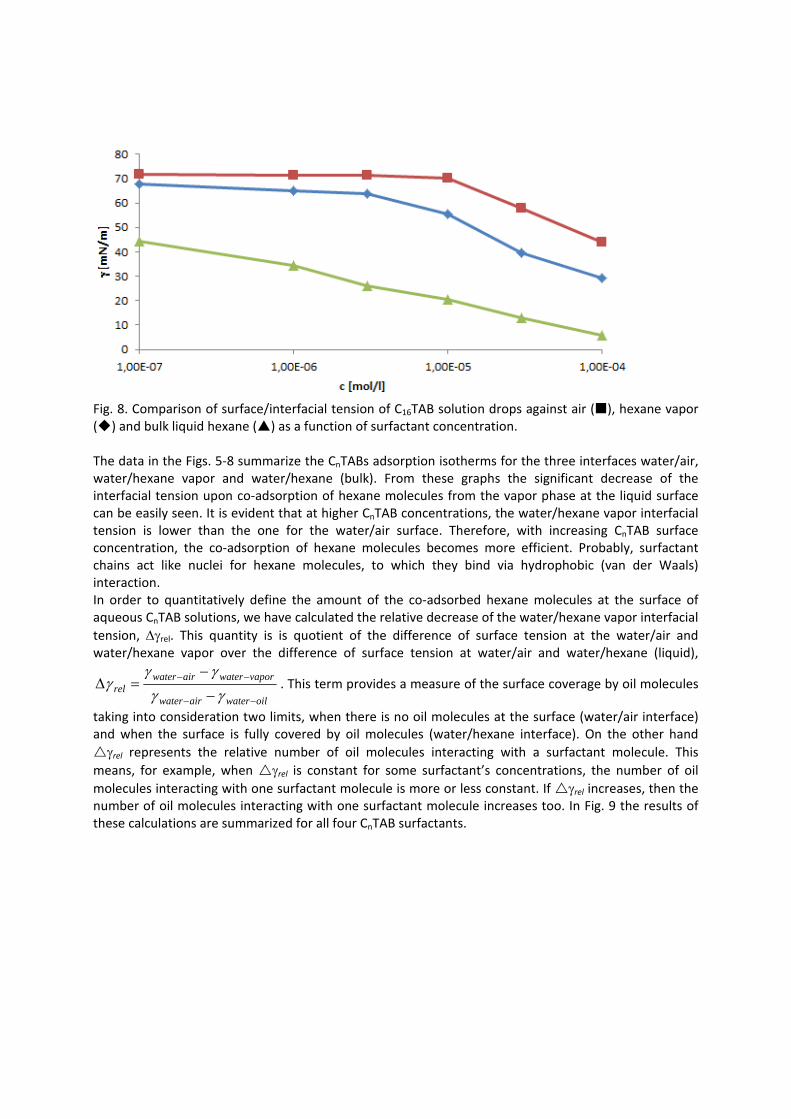
Fig. 8. Comparison of surface/interfacial tension of C16TAB solution drops against air (), hexane vapor () and bulk liquid hexane () as a function of surfactant concentration. The data in the Figs. 5‐8 summarize the CnTABs adsorption isotherms for the three interfaces water/air, water/hexane vapor and water/hexane (bulk). From these graphs the significant decrease of the interfacial tension upon co‐adsorption of hexane molecules from the vapor phase at the liquid surface can be easily seen. It is evident that at higher CnTAB concentrations, the water/hexane vapor interfacial tension is lower than the one for the water/air surface. Therefore, with increasing CnTAB surface concentration, the co‐adsorption of hexane molecules becomes more efficient. Probably, surfactant chains act like nuclei for hexane molecules, to which they bind via hydrophobic (van der Waals) interaction. In order to quantitatively define the amount of the co‐adsorbed hexane molecules at the surface of aqueous CnTAB solutions, we have calculated the relative decrease of the water/hexane vapor interfacial
tension, rel. This quantity is is quotient of the difference of surface tension at the water/air and water/hexane vapor over the difference of surface tension at water/air and water/hexane (liquid),
oilwaterairwater
vaporwaterairwaterrel
. This term provides a measure of the surface coverage by oil molecules
taking into consideration two limits, when there is no oil molecules at the surface (water/air interface) and when the surface is fully covered by oil molecules (water/hexane interface). On the other hand
rel represents the relative number of oil molecules interacting with a surfactant molecule. This
means, for example, when rel is constant for some surfactant’s concentrations, the number of oil
molecules interacting with one surfactant molecule is more or less constant. If rel increases, then the number of oil molecules interacting with one surfactant molecule increases too. In Fig. 9 the results of these calculations are summarized for all four CnTAB surfactants.
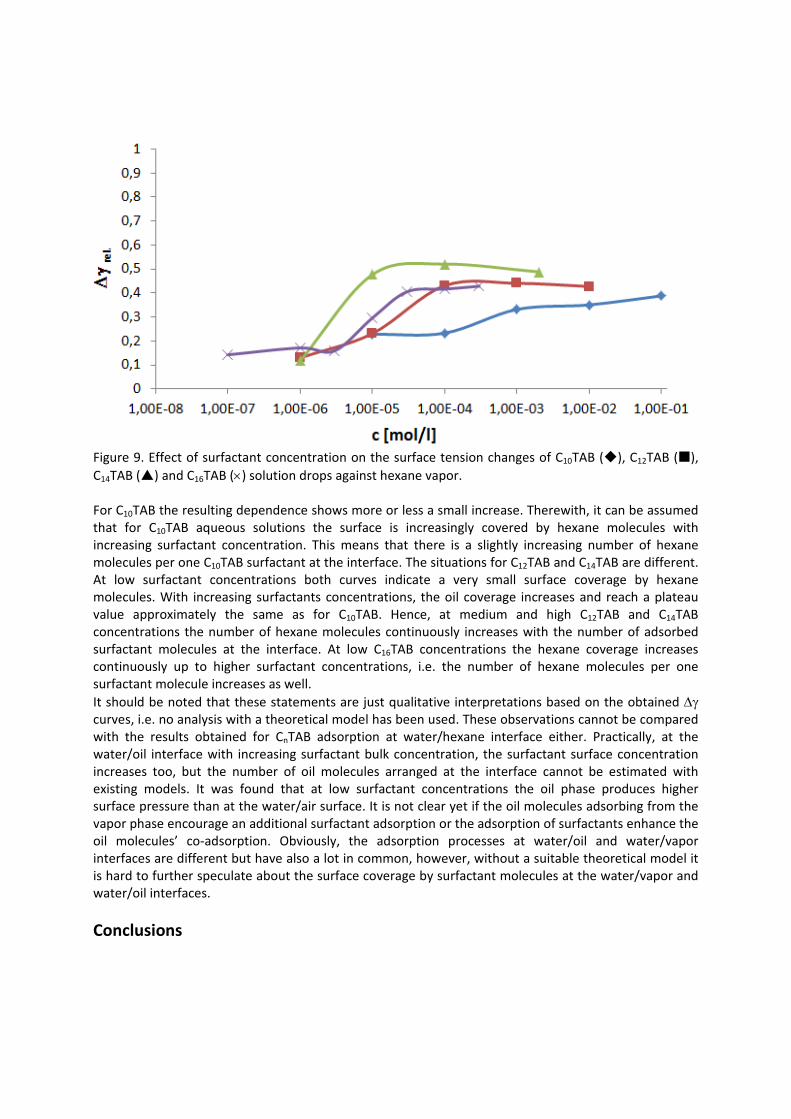
Figure 9. Effect of surfactant concentration on the surface tension changes of C10TAB (), C12TAB (),
C14TAB () and C16TAB () solution drops against hexane vapor. For C10TAB the resulting dependence shows more or less a small increase. Therewith, it can be assumed that for C10TAB aqueous solutions the surface is increasingly covered by hexane molecules with increasing surfactant concentration. This means that there is a slightly increasing number of hexane molecules per one C10TAB surfactant at the interface. The situations for C12TAB and C14TAB are different. At low surfactant concentrations both curves indicate a very small surface coverage by hexane molecules. With increasing surfactants concentrations, the oil coverage increases and reach a plateau value approximately the same as for C10TAB. Hence, at medium and high C12TAB and C14TAB concentrations the number of hexane molecules continuously increases with the number of adsorbed surfactant molecules at the interface. At low C16TAB concentrations the hexane coverage increases continuously up to higher surfactant concentrations, i.e. the number of hexane molecules per one surfactant molecule increases as well.
It should be noted that these statements are just qualitative interpretations based on the obtained curves, i.e. no analysis with a theoretical model has been used. These observations cannot be compared with the results obtained for CnTAB adsorption at water/hexane interface either. Practically, at the water/oil interface with increasing surfactant bulk concentration, the surfactant surface concentration increases too, but the number of oil molecules arranged at the interface cannot be estimated with existing models. It was found that at low surfactant concentrations the oil phase produces higher surface pressure than at the water/air surface. It is not clear yet if the oil molecules adsorbing from the vapor phase encourage an additional surfactant adsorption or the adsorption of surfactants enhance the oil molecules’ co‐adsorption. Obviously, the adsorption processes at water/oil and water/vapor interfaces are different but have also a lot in common, however, without a suitable theoretical model it is hard to further speculate about the surface coverage by surfactant molecules at the water/vapor and water/oil interfaces.
Conclusions
The present experimental study was dedicated to the adsorption behavior of members of the homologous series of CnTAB (n = 10 – 16) at the water/hexane vapor interface. The general conclusions were obtained after comparison of these results with those obtained at the water/air and water/hexane (bulk) interfaces. From the dynamic surface tension curves a significant decrease of the interfacial tension is seen upon releasing the hexane vapor into the atmosphere around the CnTAB solution drop. The surface tension decrease starts immediately when the vapor is released and it is faster for higher surfactant concentrations. Basically, hexane molecules interact with the surfactants at the interface. Therefore, the higher the surfactant surface concentration is, the more hexane molecules will adsorb and interact. The kinetic curves show plateau values when quasi‐equilibrium is reached, i.e. when the hexane molecules are adsorbed at the interface due to the interaction with surfactants. After this quasi‐equilibration additional processes are observed, such as hexane condensation, which are not discussed here. Comparison of the results obtained at the water/vapor interface with those at the water/air and water/oil interfaces allows speculating on the amount of oil molecules adsorbed from vapor phase. It was found that for the whole concentration range of C10TAB there is a slightly increasing number of hexane molecules around a single surfactant at the interface. For C12TAB and C14TAB from low to mean concentrations the number of hexane molecules per surfactant molecule increases. For the medium and high concentrations hexane molecules cover the interface uniformly and with the constant number of molecules per surfactant molecule. C16TAB at low concentrations attracts the same number of hexane molecules per surfactant molecule, and only with increasing C16TAB concentration this number increases. Difference in the behavior of hexane molecules co‐adsorbed at the surface of different CnTAB surfactants solutions might follow only after the first adsorbed surfactants change their orientation at the interface with increasing the surfactant concentration. The longer surfactants at low concentrations are more in a laying position, while at high concentrations they are oriented in a more upright position. In between, i.e. for medium concentrations there is the transition between these two positions. It has a been found that the surfactants oriented in upright position attract more hexane molecules than in laying position. Therefore, in conclusion, the different number of hexane molecules per surfactant molecule corresponds with differences in the surfactant orientations. The conclusions drawn here are based on qualitative discussions and for their approval it is necessary to develop an appropriate theoretical model which is presently pending.
Acknowledgements
The work was financially supported by projects of the DFG (Mi418/18‐1), the DLR (50WM1129), the European Space Agency (PASTA) and the COST actions CM1101 and MP1106.
References
1 K. Medrzycka, W. Zwierzykowski, Adsorption of alkyltrimethylammonium bromides at the various interfaces, J. Colloid Interface Sci. 230 (2000) 67‐72 2 V. Pradines. V.B. Fainerman, E.V. Aksenenko, J. Krägel, N. Mucic, R. Miller, Adsorption of alkyl trimethylammonium bromides at the water/air and water/hexane interfaces, Colloids Surfaces A 371 (2010) 22‐28 3 N. Mucic, N.M. Kovalchuk, V. Pradines, A. Javadi, E.V. Aksenenko, J. Krägel, R. Miller, Dynamic properties of CnTAB adsorption layers at the water/oil interface, Colloids Surfaces A, submitted (2012)
4 N. Mucic, N.M. Kovalchuk, E.V. Aksenenko, V.B. Fainerman, R. Miller, Adsorption layer properties of alkyl trimethylammonium bromides at the water interfaces against different oils. Waiting for submission 5 G. Loglio, P. Pandolfini, R. Miller, A.V. Makievski, F. Ravera, M. Ferrari, L. Liggieri, Drop and bubble shape analysis as tool for dilational rheology studies of interfacial layers, in: D. Möbius, R. Miller (Eds.), Novel Methods to Study Interfacial Layers, Studies in Interfacial Science, vol. 11, Elsevier, Amsterdam, 2001, pp. 439‐484 6 A. Javadi, N. Moradi, V.B. Fainerman, H. Möhwald, R. Miller, Alkane vapor and surfactants co‐adsorption on aqueous solution interfaces, Colloids Surfaces A 391 (2011) 19‐24 7 N. Mucic, A. Javadi, N.M. Kovalchuk, E.V. Aksenenko, R. Miller, Dynamics of interfacial layers – Experimental feasibilities of adsorption kinetics and dilational rheology, Adv. Colloid Interface Sci. 168 (2011) 167‐178

Paper V Dynamics of interfacial layers – Experimental feasibilities of adsorption kinetics and dilational rheology N. Mucic, A. Javadi, N.M. Kovalchuk, E.V. Aksenenko and R. Miller Advances in Colloid and Interface Science 168 (2010) 167‐178.
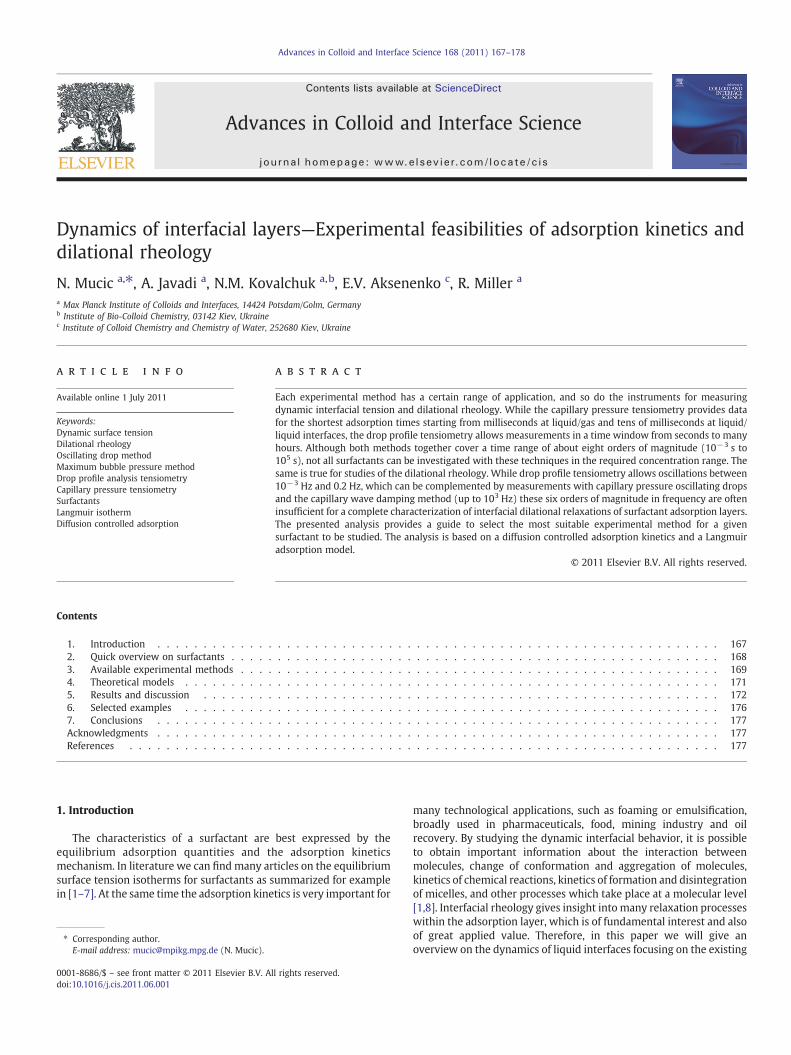
Advances in Colloid and Interface Science 168 (2011) 167–178
Contents lists available at ScienceDirect
Advances in Colloid and Interface Science
j ourna l homepage: www.e lsev ie r.com/ locate /c is
Dynamics of interfacial layers—Experimental feasibilities of adsorption kinetics anddilational rheology
N. Mucic a,⁎, A. Javadi a, N.M. Kovalchuk a,b, E.V. Aksenenko c, R. Miller a
a Max Planck Institute of Colloids and Interfaces, 14424 Potsdam/Golm, Germanyb Institute of Bio-Colloid Chemistry, 03142 Kiev, Ukrainec Institute of Colloid Chemistry and Chemistry of Water, 252680 Kiev, Ukraine
⁎ Corresponding author.E-mail address: [email protected] (N. Mucic).
0001-8686/$ – see front matter © 2011 Elsevier B.V. Aldoi:10.1016/j.cis.2011.06.001
a b s t r a c t
a r t i c l e i n f oAvailable online 1 July 2011
Keywords:Dynamic surface tensionDilational rheologyOscillating drop methodMaximum bubble pressure methodDrop profile analysis tensiometryCapillary pressure tensiometrySurfactantsLangmuir isothermDiffusion controlled adsorption
Each experimental method has a certain range of application, and so do the instruments for measuringdynamic interfacial tension and dilational rheology. While the capillary pressure tensiometry provides datafor the shortest adsorption times starting from milliseconds at liquid/gas and tens of milliseconds at liquid/liquid interfaces, the drop profile tensiometry allows measurements in a time window from seconds to manyhours. Although both methods together cover a time range of about eight orders of magnitude (10−3 s to105 s), not all surfactants can be investigated with these techniques in the required concentration range. Thesame is true for studies of the dilational rheology. While drop profile tensiometry allows oscillations between10−3 Hz and 0.2 Hz, which can be complemented by measurements with capillary pressure oscillating dropsand the capillary wave damping method (up to 103 Hz) these six orders of magnitude in frequency are ofteninsufficient for a complete characterization of interfacial dilational relaxations of surfactant adsorption layers.The presented analysis provides a guide to select the most suitable experimental method for a givensurfactant to be studied. The analysis is based on a diffusion controlled adsorption kinetics and a Langmuiradsorption model.
l rights reserved.
© 2011 Elsevier B.V. All rights reserved.
Contents
1. Introduction . . . . . . . . . . . . . . . . . . . . . . . . . . . . . . . . . . . . . . . . . . . . . . . . . . . . . . . . . . . . . 1672. Quick overview on surfactants . . . . . . . . . . . . . . . . . . . . . . . . . . . . . . . . . . . . . . . . . . . . . . . . . . . . . 1683. Available experimental methods . . . . . . . . . . . . . . . . . . . . . . . . . . . . . . . . . . . . . . . . . . . . . . . . . . . . 1694. Theoretical models . . . . . . . . . . . . . . . . . . . . . . . . . . . . . . . . . . . . . . . . . . . . . . . . . . . . . . . . . . 1715. Results and discussion . . . . . . . . . . . . . . . . . . . . . . . . . . . . . . . . . . . . . . . . . . . . . . . . . . . . . . . . 1726. Selected examples . . . . . . . . . . . . . . . . . . . . . . . . . . . . . . . . . . . . . . . . . . . . . . . . . . . . . . . . . . 1767. Conclusions . . . . . . . . . . . . . . . . . . . . . . . . . . . . . . . . . . . . . . . . . . . . . . . . . . . . . . . . . . . . . 177Acknowledgments . . . . . . . . . . . . . . . . . . . . . . . . . . . . . . . . . . . . . . . . . . . . . . . . . . . . . . . . . . . . . 177References . . . . . . . . . . . . . . . . . . . . . . . . . . . . . . . . . . . . . . . . . . . . . . . . . . . . . . . . . . . . . . . . 177
1. Introduction
The characteristics of a surfactant are best expressed by theequilibrium adsorption quantities and the adsorption kineticsmechanism. In literature we can findmany articles on the equilibriumsurface tension isotherms for surfactants as summarized for examplein [1–7]. At the same time the adsorption kinetics is very important for
many technological applications, such as foaming or emulsification,broadly used in pharmaceuticals, food, mining industry and oilrecovery. By studying the dynamic interfacial behavior, it is possibleto obtain important information about the interaction betweenmolecules, change of conformation and aggregation of molecules,kinetics of chemical reactions, kinetics of formation and disintegrationof micelles, and other processes which take place at a molecular level[1,8]. Interfacial rheology gives insight into many relaxation processeswithin the adsorption layer, which is of fundamental interest and alsoof great applied value. Therefore, in this paper we will give anoverview on the dynamics of liquid interfaces focusing on the existing
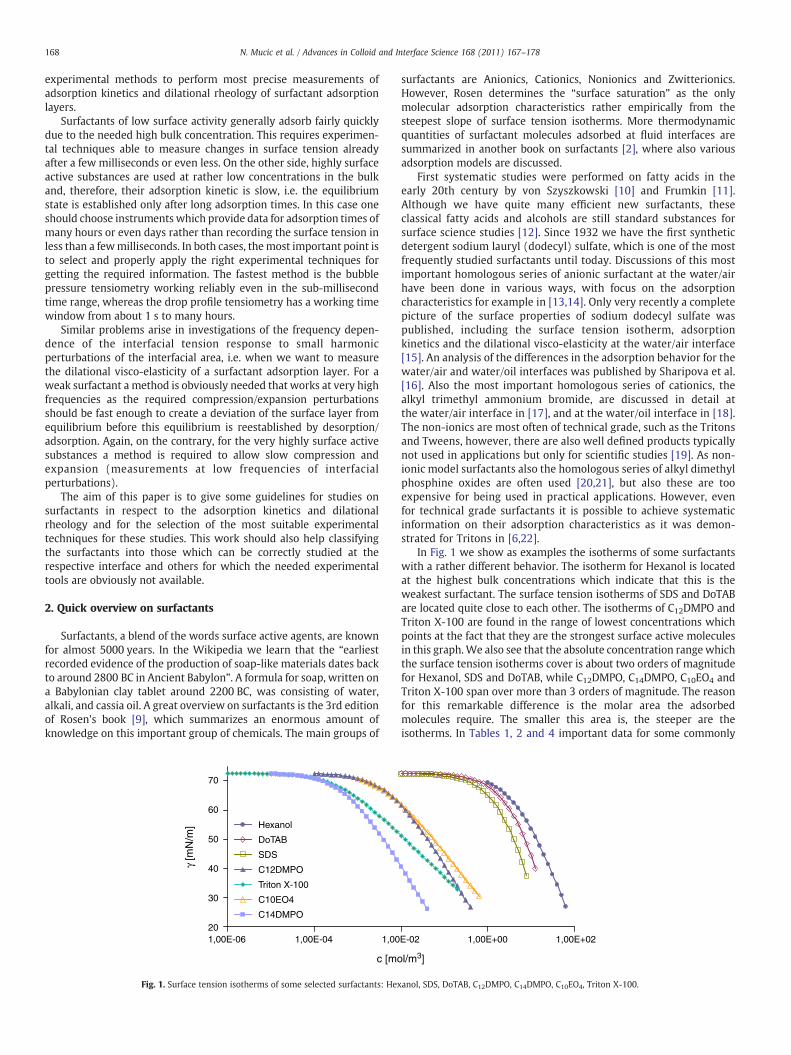
168 N. Mucic et al. / Advances in Colloid and Interface Science 168 (2011) 167–178
experimental methods to perform most precise measurements ofadsorption kinetics and dilational rheology of surfactant adsorptionlayers.
Surfactants of low surface activity generally adsorb fairly quicklydue to the needed high bulk concentration. This requires experimen-tal techniques able to measure changes in surface tension alreadyafter a few milliseconds or even less. On the other side, highly surfaceactive substances are used at rather low concentrations in the bulkand, therefore, their adsorption kinetic is slow, i.e. the equilibriumstate is established only after long adsorption times. In this case oneshould choose instruments which provide data for adsorption times ofmany hours or even days rather than recording the surface tension inless than a fewmilliseconds. In both cases, themost important point isto select and properly apply the right experimental techniques forgetting the required information. The fastest method is the bubblepressure tensiometry working reliably even in the sub-millisecondtime range, whereas the drop profile tensiometry has a working timewindow from about 1 s to many hours.
Similar problems arise in investigations of the frequency depen-dence of the interfacial tension response to small harmonicperturbations of the interfacial area, i.e. when we want to measurethe dilational visco-elasticity of a surfactant adsorption layer. For aweak surfactant a method is obviously needed that works at very highfrequencies as the required compression/expansion perturbationsshould be fast enough to create a deviation of the surface layer fromequilibrium before this equilibrium is reestablished by desorption/adsorption. Again, on the contrary, for the very highly surface activesubstances a method is required to allow slow compression andexpansion (measurements at low frequencies of interfacialperturbations).
The aim of this paper is to give some guidelines for studies onsurfactants in respect to the adsorption kinetics and dilationalrheology and for the selection of the most suitable experimentaltechniques for these studies. This work should also help classifyingthe surfactants into those which can be correctly studied at therespective interface and others for which the needed experimentaltools are obviously not available.
2. Quick overview on surfactants
Surfactants, a blend of the words surface active agents, are knownfor almost 5000 years. In the Wikipedia we learn that the “earliestrecorded evidence of the production of soap-like materials dates backto around 2800 BC in Ancient Babylon”. A formula for soap, written ona Babylonian clay tablet around 2200 BC, was consisting of water,alkali, and cassia oil. A great overview on surfactants is the 3rd editionof Rosen's book [9], which summarizes an enormous amount ofknowledge on this important group of chemicals. The main groups of
20
30
40
50
60
70
1,00E-06 1,00E-04 1,00
c [mo
γ [m
N/m
] Hexanol
DoTAB
SDS
C12DMPO
Triton X-100
C10EO4
C14DMPO
Fig. 1. Surface tension isotherms of some selected surfactants: Hex
surfactants are Anionics, Cationics, Nonionics and Zwitterionics.However, Rosen determines the “surface saturation” as the onlymolecular adsorption characteristics rather empirically from thesteepest slope of surface tension isotherms. More thermodynamicquantities of surfactant molecules adsorbed at fluid interfaces aresummarized in another book on surfactants [2], where also variousadsorption models are discussed.
First systematic studies were performed on fatty acids in theearly 20th century by von Szyszkowski [10] and Frumkin [11].Although we have quite many efficient new surfactants, theseclassical fatty acids and alcohols are still standard substances forsurface science studies [12]. Since 1932 we have the first syntheticdetergent sodium lauryl (dodecyl) sulfate, which is one of the mostfrequently studied surfactants until today. Discussions of this mostimportant homologous series of anionic surfactant at the water/airhave been done in various ways, with focus on the adsorptioncharacteristics for example in [13,14]. Only very recently a completepicture of the surface properties of sodium dodecyl sulfate waspublished, including the surface tension isotherm, adsorptionkinetics and the dilational visco-elasticity at the water/air interface[15]. An analysis of the differences in the adsorption behavior for thewater/air and water/oil interfaces was published by Sharipova et al.[16]. Also the most important homologous series of cationics, thealkyl trimethyl ammonium bromide, are discussed in detail atthe water/air interface in [17], and at the water/oil interface in [18].The non-ionics are most often of technical grade, such as the Tritonsand Tweens, however, there are also well defined products typicallynot used in applications but only for scientific studies [19]. As non-ionic model surfactants also the homologous series of alkyl dimethylphosphine oxides are often used [20,21], but also these are tooexpensive for being used in practical applications. However, evenfor technical grade surfactants it is possible to achieve systematicinformation on their adsorption characteristics as it was demon-strated for Tritons in [6,22].
In Fig. 1 we show as examples the isotherms of some surfactantswith a rather different behavior. The isotherm for Hexanol is locatedat the highest bulk concentrations which indicate that this is theweakest surfactant. The surface tension isotherms of SDS and DoTABare located quite close to each other. The isotherms of C12DMPO andTriton X-100 are found in the range of lowest concentrations whichpoints at the fact that they are the strongest surface active moleculesin this graph.We also see that the absolute concentration rangewhichthe surface tension isotherms cover is about two orders of magnitudefor Hexanol, SDS and DoTAB, while C12DMPO, C14DMPO, C10EO4 andTriton X-100 span over more than 3 orders of magnitude. The reasonfor this remarkable difference is the molar area the adsorbedmolecules require. The smaller this area is, the steeper are theisotherms. In Tables 1, 2 and 4 important data for some commonly
E-02 1,00E+00 1,00E+02
l/m3]
anol, SDS, DoTAB, C12DMPO, C14DMPO, C10EO4, Triton X-100.
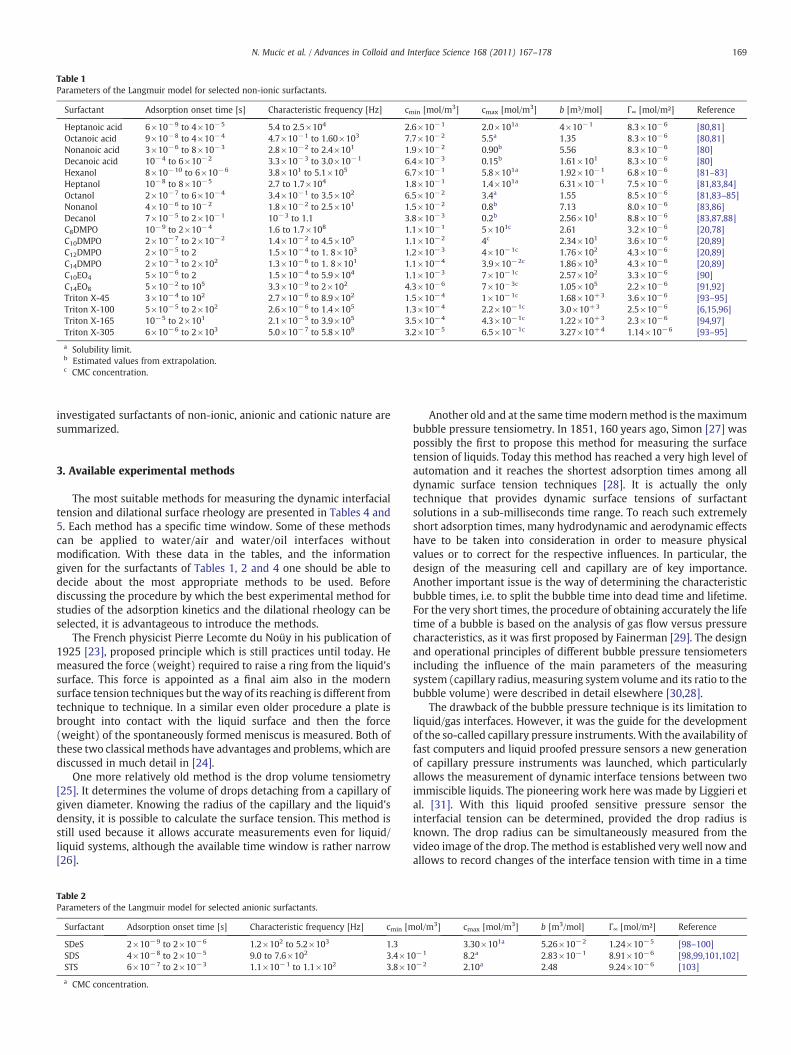
Table 1Parameters of the Langmuir model for selected non-ionic surfactants.
Surfactant Adsorption onset time [s] Characteristic frequency [Hz] cmin [mol/m3] cmax [mol/m3] b [m³/mol] Γ∞ [mol/m²] Reference
Heptanoic acid 6×10⁻⁹ to 4×10⁻⁵ 5.4 to 2.5×10⁴ 2.6×10⁻¹ 2.0×101a 4×10⁻¹ 8.3×10⁻⁶ [80,81]Octanoic acid 9×10⁻⁸ to 4×10⁻⁴ 4.7×10⁻¹ to 1.60×10³ 7.7×10⁻² 5.5a 1.35 8.3×10⁻⁶ [80,81]Nonanoic acid 3×10⁻⁶ to 8×10⁻³ 2.8×10⁻² to 2.4×101 1.9×10⁻² 0.90b 5.56 8.3×10⁻⁶ [80]Decanoic acid 10−4 to 6×10⁻² 3.3×10⁻³ to 3.0×10⁻¹ 6.4×10⁻³ 0.15b 1.61×101 8.3×10⁻⁶ [80]Hexanol 8×10⁻¹⁰ to 6×10⁻⁶ 3.8×101 to 5.1×10⁵ 6.7×10⁻¹ 5.8×101a 1.92×10⁻¹ 6.8×10⁻⁶ [81–83]Heptanol 10−8 to 8×10⁻⁵ 2.7 to 1.7×10⁴ 1.8×10⁻¹ 1.4×101a 6.31×10⁻¹ 7.5×10⁻⁶ [81,83,84]Octanol 2×10⁻⁷ to 6×10⁻⁴ 3.4×10⁻¹ to 3.5×10² 6.5×10⁻² 3.4a 1.55 8.5×10⁻⁶ [81,83–85]Nonanol 4×10⁻⁶ to 10−2 1.8×10⁻² to 2.5×101 1.5×10⁻² 0.8b 7.13 8.0×10⁻⁶ [83,86]Decanol 7×10⁻⁵ to 2×10⁻¹ 10−3 to 1.1 3.8×10⁻³ 0.2b 2.56×101 8.8×10⁻⁶ [83,87,88]C8DMPO 10−9 to 2×10⁻⁴ 1.6 to 1.7×10⁸ 1.1×10⁻¹ 5×101c 2.61 3.2×10⁻⁶ [20,78]C10DMPO 2×10⁻⁷ to 2×10⁻² 1.4×10⁻² to 4.5×10⁵ 1.1×10⁻² 4c 2.34×101 3.6×10⁻⁶ [20,89]C12DMPO 2×10⁻⁵ to 2 1.5×10⁻⁴ to 1. 8×10³ 1.2×10⁻³ 4×10⁻¹c 1.76×10² 4.3×10⁻⁶ [20,89]C14DMPO 2×10⁻³ to 2×10² 1.3×10⁻⁶ to 1. 8×101 1.1×10⁻⁴ 3.9×10⁻²c 1.86×10³ 4.3×10⁻⁶ [20,89]C10EO4 5×10⁻⁶ to 2 1.5×10⁻⁴ to 5.9×10⁴ 1.1×10⁻³ 7×10⁻¹c 2.57×10² 3.3×10⁻⁶ [90]C14EO8 5×10⁻² to 105 3.3×10⁻⁹ to 2×10² 4.3×10⁻⁶ 7×10⁻³c 1.05×10⁵ 2.2×10⁻⁶ [91,92]Triton X-45 3×10⁻⁴ to 102 2.7×10⁻⁶ to 8.9×10² 1.5×10⁻⁴ 1×10⁻¹c 1.68×10+3 3.6×10⁻⁶ [93–95]Triton X-100 5×10⁻⁵ to 2×10² 2.6×10⁻⁶ to 1.4×10⁵ 1.3×10⁻⁴ 2.2×10⁻¹c 3.0×10+3 2.5×10⁻⁶ [6,15,96]Triton X-165 10−5 to 2×101 2.1×10⁻⁵ to 3.9×10⁵ 3.5×10⁻⁴ 4.3×10⁻¹c 1.22×10+3 2.3×10⁻⁶ [94,97]Triton X-305 6×10⁻⁶ to 2×10³ 5.0×10⁻⁷ to 5.8×10⁹ 3.2×10⁻⁵ 6.5×10⁻¹c 3.27×10+4 1.14×10⁻⁶ [93–95]
a Solubility limit.b Estimated values from extrapolation.c CMC concentration.
169N. Mucic et al. / Advances in Colloid and Interface Science 168 (2011) 167–178
investigated surfactants of non-ionic, anionic and cationic nature aresummarized.
3. Available experimental methods
The most suitable methods for measuring the dynamic interfacialtension and dilational surface rheology are presented in Tables 4 and5. Each method has a specific time window. Some of these methodscan be applied to water/air and water/oil interfaces withoutmodification. With these data in the tables, and the informationgiven for the surfactants of Tables 1, 2 and 4 one should be able todecide about the most appropriate methods to be used. Beforediscussing the procedure by which the best experimental method forstudies of the adsorption kinetics and the dilational rheology can beselected, it is advantageous to introduce the methods.
The French physicist Pierre Lecomte du Noüy in his publication of1925 [23], proposed principle which is still practices until today. Hemeasured the force (weight) required to raise a ring from the liquid'ssurface. This force is appointed as a final aim also in the modernsurface tension techniques but theway of its reaching is different fromtechnique to technique. In a similar even older procedure a plate isbrought into contact with the liquid surface and then the force(weight) of the spontaneously formed meniscus is measured. Both ofthese two classical methods have advantages and problems, which arediscussed in much detail in [24].
One more relatively old method is the drop volume tensiometry[25]. It determines the volume of drops detaching from a capillary ofgiven diameter. Knowing the radius of the capillary and the liquid'sdensity, it is possible to calculate the surface tension. This method isstill used because it allows accurate measurements even for liquid/liquid systems, although the available time window is rather narrow[26].
Table 2Parameters of the Langmuir model for selected anionic surfactants.
Surfactant Adsorption onset time [s] Characteristic frequency [Hz] cmin [m
SDeS 2×10⁻⁹ to 2×10⁻⁶ 1.2×10² to 5.2×10³ 1.3SDS 4×10⁻⁸ to 2×10⁻⁵ 9.0 to 7.6×10² 3.4×1STS 6×10⁻⁷ to 2×10⁻³ 1.1×10⁻¹ to 1.1×10² 3.8×1
a CMC concentration.
Another old and at the same timemodernmethod is themaximumbubble pressure tensiometry. In 1851, 160 years ago, Simon [27] waspossibly the first to propose this method for measuring the surfacetension of liquids. Today this method has reached a very high level ofautomation and it reaches the shortest adsorption times among alldynamic surface tension techniques [28]. It is actually the onlytechnique that provides dynamic surface tensions of surfactantsolutions in a sub-milliseconds time range. To reach such extremelyshort adsorption times, many hydrodynamic and aerodynamic effectshave to be taken into consideration in order to measure physicalvalues or to correct for the respective influences. In particular, thedesign of the measuring cell and capillary are of key importance.Another important issue is the way of determining the characteristicbubble times, i.e. to split the bubble time into dead time and lifetime.For the very short times, the procedure of obtaining accurately the lifetime of a bubble is based on the analysis of gas flow versus pressurecharacteristics, as it was first proposed by Fainerman [29]. The designand operational principles of different bubble pressure tensiometersincluding the influence of the main parameters of the measuringsystem (capillary radius, measuring system volume and its ratio to thebubble volume) were described in detail elsewhere [30,28].
The drawback of the bubble pressure technique is its limitation toliquid/gas interfaces. However, it was the guide for the developmentof the so-called capillary pressure instruments.With the availability offast computers and liquid proofed pressure sensors a new generationof capillary pressure instruments was launched, which particularlyallows the measurement of dynamic interface tensions between twoimmiscible liquids. The pioneering work here was made by Liggieri etal. [31]. With this liquid proofed sensitive pressure sensor theinterfacial tension can be determined, provided the drop radius isknown. The drop radius can be simultaneously measured from thevideo image of the drop. The method is established very well now andallows to record changes of the interface tension with time in a time
ol/m3] cmax [mol/m3] b [m3/mol] Γ∞ [mol/m²] Reference
3.30×101a 5.26×10⁻² 1.24×10⁻⁵ [98–100]0−1 8.2a 2.83×10⁻¹ 8.91×10⁻⁶ [98,99,101,102]0−2 2.10a 2.48 9.24×10⁻⁶ [103]
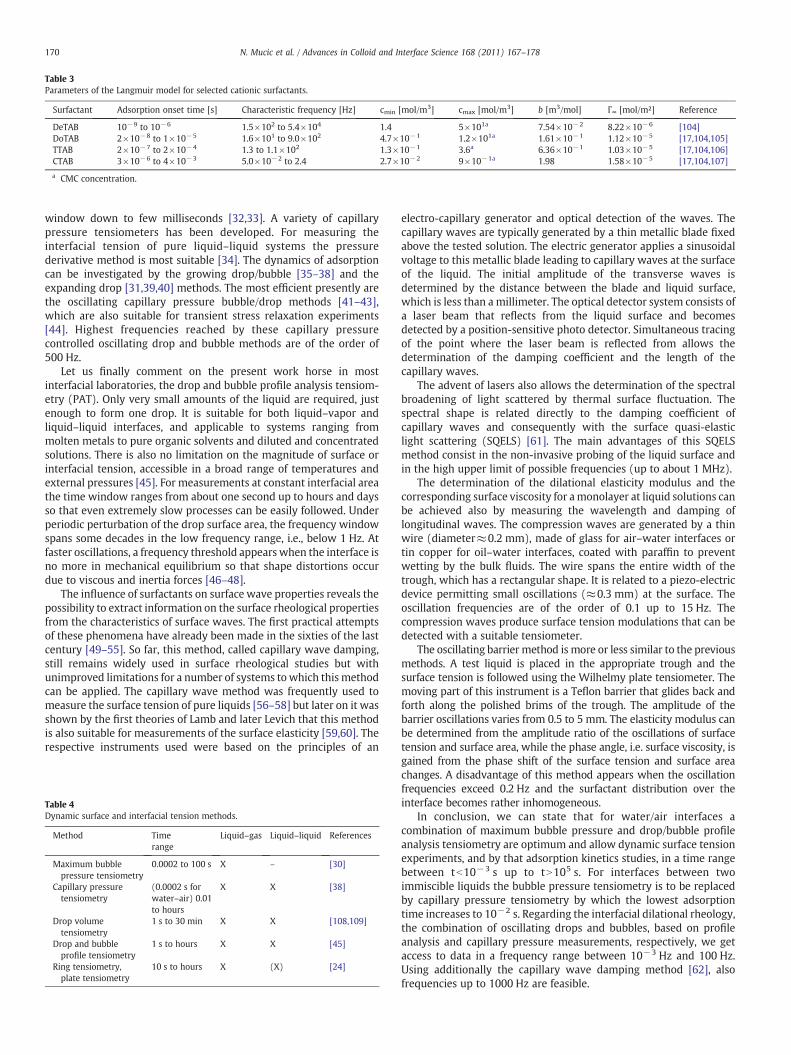
Table 3Parameters of the Langmuir model for selected cationic surfactants.
Surfactant Adsorption onset time [s] Characteristic frequency [Hz] cmin [mol/m3] cmax [mol/m3] b [m3/mol] Γ∞ [mol/m²] Reference
DeTAB 10−9 to 10−6 1.5×10² to 5.4×10⁴ 1.4 5×101a 7.54×10⁻² 8.22×10⁻⁶ [104]DoTAB 2×10⁻⁸ to 1×10⁻⁵ 1.6×101 to 9.0×10² 4.7×10⁻¹ 1.2×101a 1.61×10⁻¹ 1.12×10⁻⁵ [17,104,105]TTAB 2×10⁻⁷ to 2×10⁻⁴ 1.3 to 1.1×10² 1.3×10⁻¹ 3.6a 6.36×10⁻¹ 1.03×10⁻⁵ [17,104,106]CTAB 3×10⁻⁶ to 4×10⁻³ 5.0×10⁻² to 2.4 2.7×10⁻² 9×10⁻¹a 1.98 1.58×10⁻⁵ [17,104,107]
a CMC concentration.
170 N. Mucic et al. / Advances in Colloid and Interface Science 168 (2011) 167–178
window down to few milliseconds [32,33]. A variety of capillarypressure tensiometers has been developed. For measuring theinterfacial tension of pure liquid–liquid systems the pressurederivative method is most suitable [34]. The dynamics of adsorptioncan be investigated by the growing drop/bubble [35–38] and theexpanding drop [31,39,40] methods. The most efficient presently arethe oscillating capillary pressure bubble/drop methods [41–43],which are also suitable for transient stress relaxation experiments[44]. Highest frequencies reached by these capillary pressurecontrolled oscillating drop and bubble methods are of the order of500 Hz.
Let us finally comment on the present work horse in mostinterfacial laboratories, the drop and bubble profile analysis tensiom-etry (PAT). Only very small amounts of the liquid are required, justenough to form one drop. It is suitable for both liquid–vapor andliquid–liquid interfaces, and applicable to systems ranging frommolten metals to pure organic solvents and diluted and concentratedsolutions. There is also no limitation on the magnitude of surface orinterfacial tension, accessible in a broad range of temperatures andexternal pressures [45]. For measurements at constant interfacial areathe time window ranges from about one second up to hours and daysso that even extremely slow processes can be easily followed. Underperiodic perturbation of the drop surface area, the frequency windowspans some decades in the low frequency range, i.e., below 1 Hz. Atfaster oscillations, a frequency threshold appears when the interface isno more in mechanical equilibrium so that shape distortions occurdue to viscous and inertia forces [46–48].
The influence of surfactants on surface wave properties reveals thepossibility to extract information on the surface rheological propertiesfrom the characteristics of surface waves. The first practical attemptsof these phenomena have already been made in the sixties of the lastcentury [49–55]. So far, this method, called capillary wave damping,still remains widely used in surface rheological studies but withunimproved limitations for a number of systems towhich this methodcan be applied. The capillary wave method was frequently used tomeasure the surface tension of pure liquids [56–58] but later on it wasshown by the first theories of Lamb and later Levich that this methodis also suitable for measurements of the surface elasticity [59,60]. Therespective instruments used were based on the principles of an
Table 4Dynamic surface and interfacial tension methods.
Method Timerange
Liquid–gas Liquid–liquid References
Maximum bubblepressure tensiometry
0.0002 to 100 s X – [30]
Capillary pressuretensiometry
(0.0002 s forwater–air) 0.01to hours
X X [38]
Drop volumetensiometry
1 s to 30 min X X [108,109]
Drop and bubbleprofile tensiometry
1 s to hours X X [45]
Ring tensiometry,plate tensiometry
10 s to hours X (X) [24]
electro-capillary generator and optical detection of the waves. Thecapillary waves are typically generated by a thin metallic blade fixedabove the tested solution. The electric generator applies a sinusoidalvoltage to this metallic blade leading to capillary waves at the surfaceof the liquid. The initial amplitude of the transverse waves isdetermined by the distance between the blade and liquid surface,which is less than a millimeter. The optical detector system consists ofa laser beam that reflects from the liquid surface and becomesdetected by a position-sensitive photo detector. Simultaneous tracingof the point where the laser beam is reflected from allows thedetermination of the damping coefficient and the length of thecapillary waves.
The advent of lasers also allows the determination of the spectralbroadening of light scattered by thermal surface fluctuation. Thespectral shape is related directly to the damping coefficient ofcapillary waves and consequently with the surface quasi-elasticlight scattering (SQELS) [61]. The main advantages of this SQELSmethod consist in the non-invasive probing of the liquid surface andin the high upper limit of possible frequencies (up to about 1 MHz).
The determination of the dilational elasticity modulus and thecorresponding surface viscosity for amonolayer at liquid solutions canbe achieved also by measuring the wavelength and damping oflongitudinal waves. The compression waves are generated by a thinwire (diameter≈0.2 mm), made of glass for air–water interfaces ortin copper for oil–water interfaces, coated with paraffin to preventwetting by the bulk fluids. The wire spans the entire width of thetrough, which has a rectangular shape. It is related to a piezo-electricdevice permitting small oscillations (≈0.3 mm) at the surface. Theoscillation frequencies are of the order of 0.1 up to 15 Hz. Thecompression waves produce surface tension modulations that can bedetected with a suitable tensiometer.
The oscillating barrier method is more or less similar to the previousmethods. A test liquid is placed in the appropriate trough and thesurface tension is followed using the Wilhelmy plate tensiometer. Themoving part of this instrument is a Teflon barrier that glides back andforth along the polished brims of the trough. The amplitude of thebarrier oscillations varies from 0.5 to 5 mm. The elasticity modulus canbe determined from the amplitude ratio of the oscillations of surfacetension and surface area, while the phase angle, i.e. surface viscosity, isgained from the phase shift of the surface tension and surface areachanges. A disadvantage of this method appears when the oscillationfrequencies exceed 0.2 Hz and the surfactant distribution over theinterface becomes rather inhomogeneous.
In conclusion, we can state that for water/air interfaces acombination of maximum bubble pressure and drop/bubble profileanalysis tensiometry are optimum and allow dynamic surface tensionexperiments, and by that adsorption kinetics studies, in a time rangebetween tb10−3 s up to tN105 s. For interfaces between twoimmiscible liquids the bubble pressure tensiometry is to be replacedby capillary pressure tensiometry by which the lowest adsorptiontime increases to 10−2 s. Regarding the interfacial dilational rheology,the combination of oscillating drops and bubbles, based on profileanalysis and capillary pressure measurements, respectively, we getaccess to data in a frequency range between 10−3 Hz and 100 Hz.Using additionally the capillary wave damping method [62], alsofrequencies up to 1000 Hz are feasible.
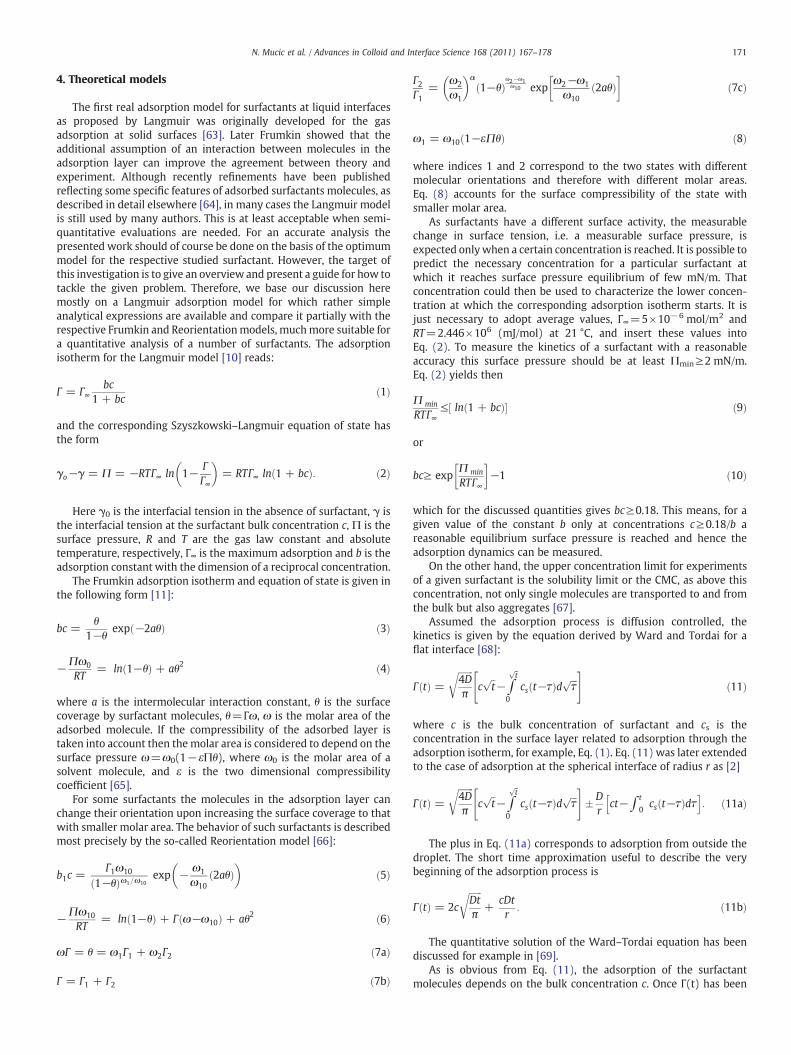
171N. Mucic et al. / Advances in Colloid and Interface Science 168 (2011) 167–178
4. Theoretical models
The first real adsorption model for surfactants at liquid interfacesas proposed by Langmuir was originally developed for the gasadsorption at solid surfaces [63]. Later Frumkin showed that theadditional assumption of an interaction between molecules in theadsorption layer can improve the agreement between theory andexperiment. Although recently refinements have been publishedreflecting some specific features of adsorbed surfactants molecules, asdescribed in detail elsewhere [64], in many cases the Langmuir modelis still used by many authors. This is at least acceptable when semi-quantitative evaluations are needed. For an accurate analysis thepresented work should of course be done on the basis of the optimummodel for the respective studied surfactant. However, the target ofthis investigation is to give an overview and present a guide for how totackle the given problem. Therefore, we base our discussion heremostly on a Langmuir adsorption model for which rather simpleanalytical expressions are available and compare it partially with therespective Frumkin and Reorientationmodels, muchmore suitable fora quantitative analysis of a number of surfactants. The adsorptionisotherm for the Langmuir model [10] reads:
Γ = Γ∞bc
1 + bcð1Þ
and the corresponding Szyszkowski–Langmuir equation of state hasthe form
γo−γ = Π = −RTΓ∞ ln 1− ΓΓ∞
= RTΓ∞ ln 1 + bcð Þ: ð2Þ
Here γ0 is the interfacial tension in the absence of surfactant, γ isthe interfacial tension at the surfactant bulk concentration c, Π is thesurface pressure, R and T are the gas law constant and absolutetemperature, respectively, Γ∞ is the maximum adsorption and b is theadsorption constant with the dimension of a reciprocal concentration.
The Frumkin adsorption isotherm and equation of state is given inthe following form [11]:
bc =θ
1−θexp −2aθð Þ ð3Þ
−Πω0
RT= ln 1−θð Þ + aθ2 ð4Þ
where a is the intermolecular interaction constant, θ is the surfacecoverage by surfactant molecules, θ=Γω, ω is the molar area of theadsorbed molecule. If the compressibility of the adsorbed layer istaken into account then the molar area is considered to depend on thesurface pressure ω=ω0(1−εΠθ), where ω0 is the molar area of asolvent molecule, and ε is the two dimensional compressibilitycoefficient [65].
For some surfactants the molecules in the adsorption layer canchange their orientation upon increasing the surface coverage to thatwith smaller molar area. The behavior of such surfactants is describedmost precisely by the so-called Reorientation model [66]:
b1c =Γ1ω10
1−θð Þω1=ω10exp − ω1
ω102aθð Þ
ð5Þ
−Πω10
RT= ln 1−θð Þ + Γ ω−ω10ð Þ + aθ2 ð6Þ
ωΓ = θ = ω1Γ1 + ω2Γ2 ð7aÞ
Γ = Γ1 + Γ2 ð7bÞ
Γ2Γ1
=ω2
ω1
α1−θð Þ
ω2−ω1ω10 exp
ω2−ω1
ω102aθð Þ
ð7cÞ
ω1 = ω10 1−εΠθð Þ ð8Þ
where indices 1 and 2 correspond to the two states with differentmolecular orientations and therefore with different molar areas.Eq. (8) accounts for the surface compressibility of the state withsmaller molar area.
As surfactants have a different surface activity, the measurablechange in surface tension, i.e. a measurable surface pressure, isexpected onlywhen a certain concentration is reached. It is possible topredict the necessary concentration for a particular surfactant atwhich it reaches surface pressure equilibrium of few mN/m. Thatconcentration could then be used to characterize the lower concen-tration at which the corresponding adsorption isotherm starts. It isjust necessary to adopt average values, Γ∞=5×10⁻⁶ mol/m2 andRT=2.446×10⁶ (mJ/mol) at 21 °C, and insert these values intoEq. (2). To measure the kinetics of a surfactant with a reasonableaccuracy this surface pressure should be at least Πmin≥2 mN/m.Eq. (2) yields then
Π min
RTΓ∞≤ ln 1 + bcð Þ½ ð9Þ
or
bc≥ expΠ min
RTΓ∞
−1 ð10Þ
which for the discussed quantities gives bc≥0.18. This means, for agiven value of the constant b only at concentrations c≥0.18/b areasonable equilibrium surface pressure is reached and hence theadsorption dynamics can be measured.
On the other hand, the upper concentration limit for experimentsof a given surfactant is the solubility limit or the CMC, as above thisconcentration, not only single molecules are transported to and fromthe bulk but also aggregates [67].
Assumed the adsorption process is diffusion controlled, thekinetics is given by the equation derived by Ward and Tordai for aflat interface [68]:
Γ tð Þ =ffiffiffiffiffiffiffi4Dπ
rc
ffiffit
p−∫
ffiffit
p
0
cs t−τð Þd ffiffiffiτ
p" #
ð11Þ
where c is the bulk concentration of surfactant and cs is theconcentration in the surface layer related to adsorption through theadsorption isotherm, for example, Eq. (1). Eq. (11) was later extendedto the case of adsorption at the spherical interface of radius r as [2]
Γ tð Þ =ffiffiffiffiffiffiffi4Dπ
rc
ffiffit
p−∫
ffiffit
p
0
cs t−τð Þd ffiffiffiτ
p" #
Dr
ct−∫ t
0cs t−τð Þdτ
h i: ð11aÞ
The plus in Eq. (11a) corresponds to adsorption from outside thedroplet. The short time approximation useful to describe the verybeginning of the adsorption process is
Γ tð Þ = 2c
ffiffiffiffiffiffiDtπ
r+
cDtr
: ð11bÞ
The quantitative solution of the Ward–Tordai equation has beendiscussed for example in [69].
As is obvious from Eq. (11), the adsorption of the surfactantmolecules depends on the bulk concentration c. Once Γ(t) has been
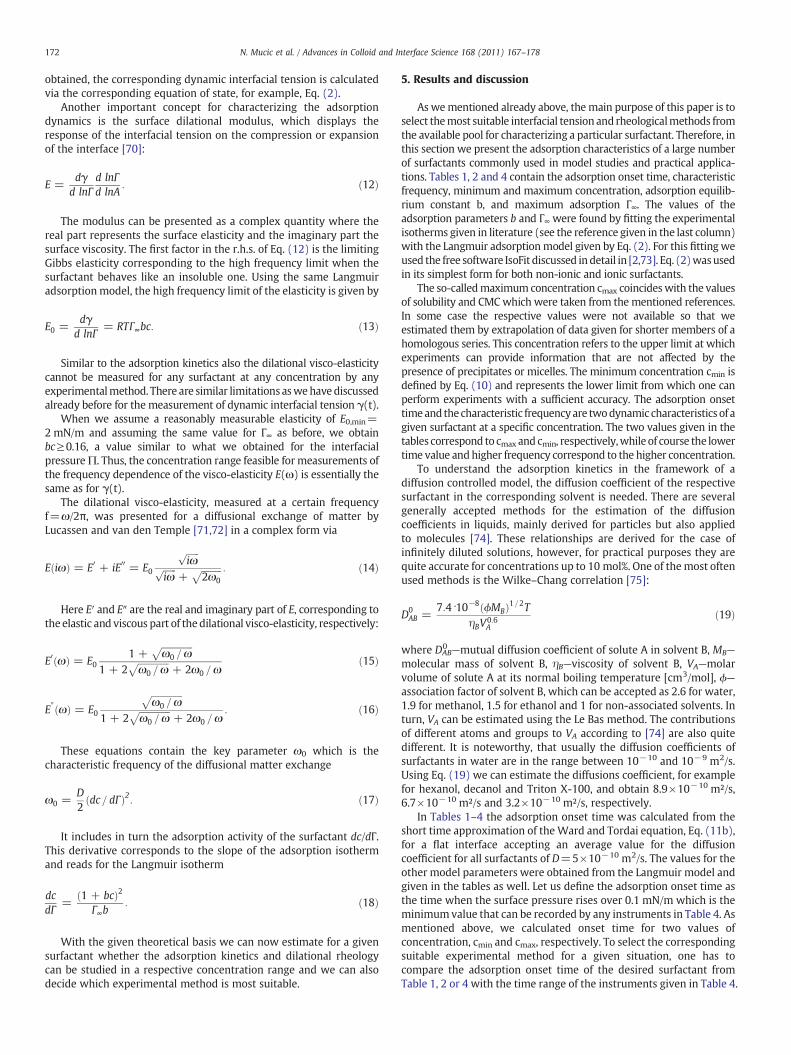
172 N. Mucic et al. / Advances in Colloid and Interface Science 168 (2011) 167–178
obtained, the corresponding dynamic interfacial tension is calculatedvia the corresponding equation of state, for example, Eq. (2).
Another important concept for characterizing the adsorptiondynamics is the surface dilational modulus, which displays theresponse of the interfacial tension on the compression or expansionof the interface [70]:
E =dγ
d lnΓd lnΓd lnA
: ð12Þ
The modulus can be presented as a complex quantity where thereal part represents the surface elasticity and the imaginary part thesurface viscosity. The first factor in the r.h.s. of Eq. (12) is the limitingGibbs elasticity corresponding to the high frequency limit when thesurfactant behaves like an insoluble one. Using the same Langmuiradsorptionmodel, the high frequency limit of the elasticity is given by
E0 =dγ
d lnΓ= RTΓ∞bc: ð13Þ
Similar to the adsorption kinetics also the dilational visco-elasticitycannot be measured for any surfactant at any concentration by anyexperimentalmethod. There are similar limitations aswehave discussedalready before for the measurement of dynamic interfacial tension γ(t).
When we assume a reasonably measurable elasticity of E0,min=2 mN/m and assuming the same value for Γ∞ as before, we obtainbc≥0.16, a value similar to what we obtained for the interfacialpressureΠ. Thus, the concentration range feasible for measurements ofthe frequency dependence of the visco-elasticity E(ω) is essentially thesame as for γ(t).
The dilational visco-elasticity, measured at a certain frequencyf=ω/2π, was presented for a diffusional exchange of matter byLucassen and van den Temple [71,72] in a complex form via
E iωð Þ = E0 + iE00 = E0
ffiffiffiffiffiffiiω
pffiffiffiffiffiffiiω
p+
ffiffiffiffiffiffiffiffiffi2ω0
p : ð14Þ
Here E′ and E″ are the real and imaginary part of E, corresponding tothe elastic and viscous part of thedilational visco-elasticity, respectively:
E0 ωð Þ = E01 +
ffiffiffiffiffiffiffiffiffiffiffiffiffiffiω0 =ω
p1 + 2
ffiffiffiffiffiffiffiffiffiffiffiffiffiffiω0 =ω
p+ 2ω0 =ω
ð15Þ
E″ ωð Þ = E0
ffiffiffiffiffiffiffiffiffiffiffiffiffiffiω0 =ω
p1 + 2
ffiffiffiffiffiffiffiffiffiffiffiffiffiffiω0 =ω
p+ 2ω0 =ω
: ð16Þ
These equations contain the key parameter ω0 which is thecharacteristic frequency of the diffusional matter exchange
ω0 =D2
dc= dΓð Þ2: ð17Þ
It includes in turn the adsorption activity of the surfactant dc/dΓ.This derivative corresponds to the slope of the adsorption isothermand reads for the Langmuir isotherm
dcdΓ
=1 + bcð Þ2
Γ∞b: ð18Þ
With the given theoretical basis we can now estimate for a givensurfactant whether the adsorption kinetics and dilational rheologycan be studied in a respective concentration range and we can alsodecide which experimental method is most suitable.
5. Results and discussion
As wementioned already above, themain purpose of this paper is toselect themost suitable interfacial tension and rheologicalmethods fromthe available pool for characterizing a particular surfactant. Therefore, inthis section we present the adsorption characteristics of a large numberof surfactants commonly used in model studies and practical applica-tions. Tables 1, 2 and 4 contain the adsorption onset time, characteristicfrequency, minimum and maximum concentration, adsorption equilib-rium constant b, and maximum adsorption Γ∞. The values of theadsorption parameters b and Γ∞ were found by fitting the experimentalisotherms given in literature (see the reference given in the last column)with the Langmuir adsorptionmodel given by Eq. (2). For this fitting weused the free software IsoFit discussed indetail in [2,73]. Eq. (2)wasusedin its simplest form for both non-ionic and ionic surfactants.
The so-calledmaximum concentration cmax coincideswith the valuesof solubility and CMCwhich were taken from the mentioned references.In some case the respective values were not available so that weestimated them by extrapolation of data given for shorter members of ahomologous series. This concentration refers to the upper limit at whichexperiments can provide information that are not affected by thepresence of precipitates or micelles. The minimum concentration cmin isdefined by Eq. (10) and represents the lower limit from which one canperform experiments with a sufficient accuracy. The adsorption onsettimeand thecharacteristic frequencyare twodynamic characteristics of agiven surfactant at a specific concentration. The two values given in thetables correspond to cmax and cmin, respectively,while of course the lowertime value andhigher frequency correspond to the higher concentration.
To understand the adsorption kinetics in the framework of adiffusion controlled model, the diffusion coefficient of the respectivesurfactant in the corresponding solvent is needed. There are severalgenerally accepted methods for the estimation of the diffusioncoefficients in liquids, mainly derived for particles but also appliedto molecules [74]. These relationships are derived for the case ofinfinitely diluted solutions, however, for practical purposes they arequite accurate for concentrations up to 10 mol%. One of themost oftenused methods is the Wilke–Chang correlation [75]:
D0AB =
7:4⋅10−8 ϕMBð Þ1=2TηBV
0:6A
ð19Þ
where DAB0 —mutual diffusion coefficient of solute A in solvent B, MB—
molecular mass of solvent B, ηB—viscosity of solvent B, VA—molarvolume of solute A at its normal boiling temperature [cm3/mol], ϕ—association factor of solvent B, which can be accepted as 2.6 for water,1.9 for methanol, 1.5 for ethanol and 1 for non-associated solvents. Inturn, VA can be estimated using the Le Bas method. The contributionsof different atoms and groups to VA according to [74] are also quitedifferent. It is noteworthy, that usually the diffusion coefficients ofsurfactants in water are in the range between 10−10 and 10−9 m2/s.Using Eq. (19) we can estimate the diffusions coefficient, for examplefor hexanol, decanol and Triton X-100, and obtain 8.9×10⁻¹⁰ m²/s,6.7×10−10 m²/s and 3.2×10⁻¹⁰ m²/s, respectively.
In Tables 1–4 the adsorption onset time was calculated from theshort time approximation of the Ward and Tordai equation, Eq. (11b),for a flat interface accepting an average value for the diffusioncoefficient for all surfactants of D=5×10⁻¹⁰ m2/s. The values for theother model parameters were obtained from the Langmuir model andgiven in the tables as well. Let us define the adsorption onset time asthe time when the surface pressure rises over 0.1 mN/m which is theminimumvalue that can be recorded by any instruments in Table 4. Asmentioned above, we calculated onset time for two values ofconcentration, cmin and cmax, respectively. To select the correspondingsuitable experimental method for a given situation, one has tocompare the adsorption onset time of the desired surfactant fromTable 1, 2 or 4 with the time range of the instruments given in Table 4.
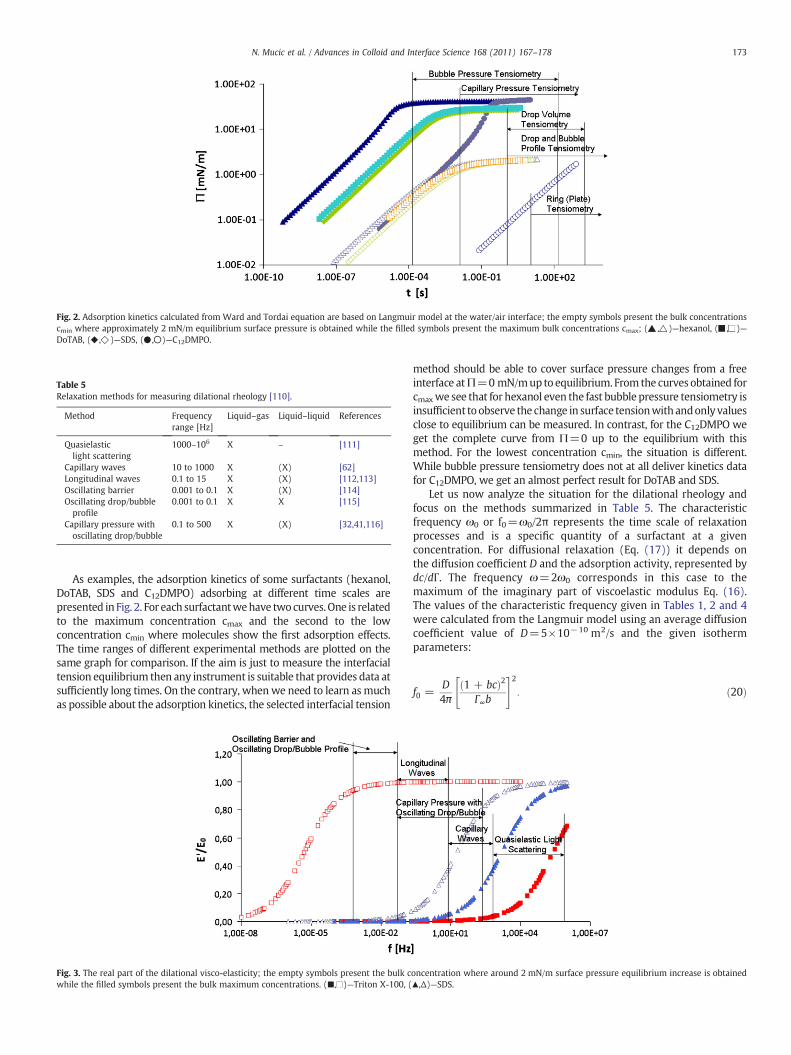
Table 5Relaxation methods for measuring dilational rheology [110].
Method Frequencyrange [Hz]
Liquid–gas Liquid–liquid References
Quasielasticlight scattering
1000–106 X – [111]
Capillary waves 10 to 1000 X (X) [62]Longitudinal waves 0.1 to 15 X (X) [112,113]Oscillating barrier 0.001 to 0.1 X (X) [114]Oscillating drop/bubbleprofile
0.001 to 0.1 X X [115]
Capillary pressure withoscillating drop/bubble
0.1 to 500 X (X) [32,41,116]
Fig. 2. Adsorption kinetics calculated from Ward and Tordai equation are based on Langmuir model at the water/air interface; the empty symbols present the bulk concentrationscmin where approximately 2 mN/m equilibrium surface pressure is obtained while the filled symbols present the maximum bulk concentrations cmax; ( , )—hexanol, ( , )—DoTAB, ( , )—SDS, ( , )—C12DMPO.
173N. Mucic et al. / Advances in Colloid and Interface Science 168 (2011) 167–178
As examples, the adsorption kinetics of some surfactants (hexanol,DoTAB, SDS and C12DMPO) adsorbing at different time scales arepresented in Fig. 2. For each surfactantwehave twocurves.One is relatedto the maximum concentration cmax and the second to the lowconcentration cmin where molecules show the first adsorption effects.The time ranges of different experimental methods are plotted on thesame graph for comparison. If the aim is just to measure the interfacialtension equilibrium then any instrument is suitable that provides data atsufficiently long times. On the contrary, whenwe need to learn as muchas possible about the adsorption kinetics, the selected interfacial tension
Fig. 3. The real part of the dilational visco-elasticity; the empty symbols present the bulk cwhile the filled symbols present the bulk maximum concentrations. (,)—Triton X-100, (
method should be able to cover surface pressure changes from a freeinterface atΠ=0mN/mup to equilibrium. From the curves obtained forcmaxwe see that for hexanol even the fast bubble pressure tensiometry isinsufficient toobserve the change in surface tensionwith andonly valuesclose to equilibrium can be measured. In contrast, for the C12DMPO weget the complete curve from Π=0 up to the equilibrium with thismethod. For the lowest concentration cmin, the situation is different.While bubble pressure tensiometry does not at all deliver kinetics datafor C12DMPO, we get an almost perfect result for DoTAB and SDS.
Let us now analyze the situation for the dilational rheology andfocus on the methods summarized in Table 5. The characteristicfrequency ω0 or f0=ω0/2π represents the time scale of relaxationprocesses and is a specific quantity of a surfactant at a givenconcentration. For diffusional relaxation (Eq. (17)) it depends onthe diffusion coefficient D and the adsorption activity, represented bydc/dΓ. The frequency ω=2ω0 corresponds in this case to themaximum of the imaginary part of viscoelastic modulus Eq. (16).The values of the characteristic frequency given in Tables 1, 2 and 4were calculated from the Langmuir model using an average diffusioncoefficient value of D=5×10⁻¹⁰ m2/s and the given isothermparameters:
f0 =D4π
1 + bcð Þ2Γ∞b
" #2
: ð20Þ
oncentration where around 2 mN/m surface pressure equilibrium increase is obtained,Δ)—SDS.
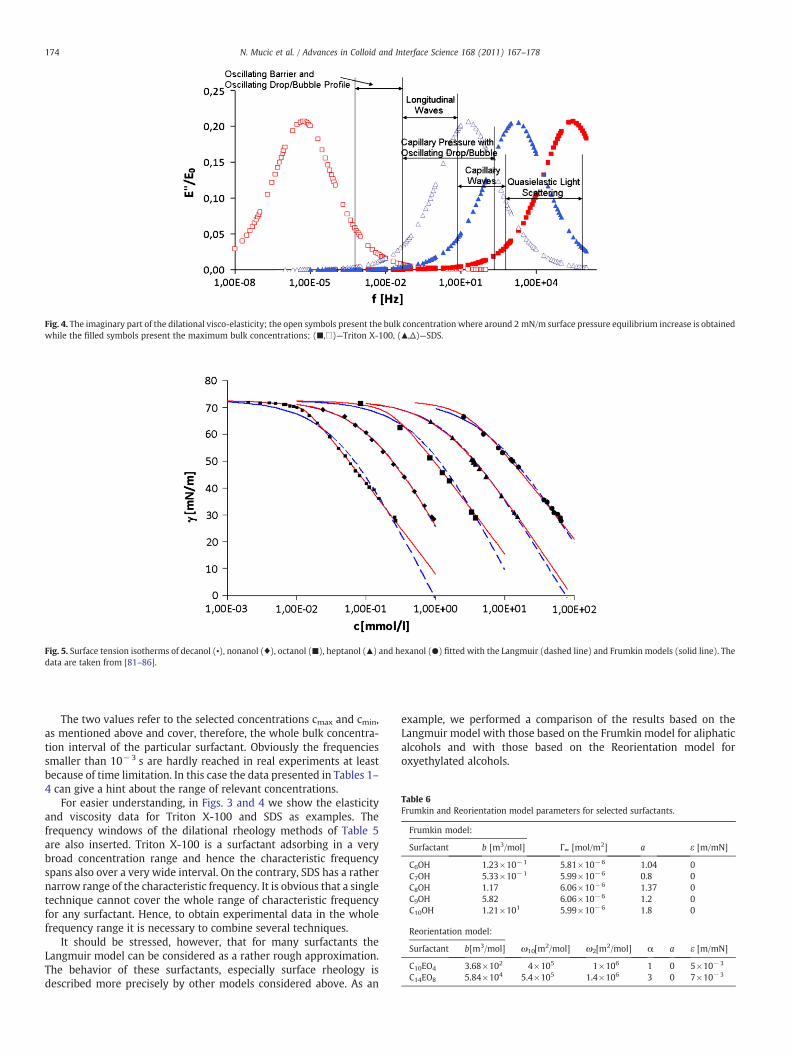
Fig. 4. The imaginary part of the dilational visco-elasticity; the open symbols present the bulk concentration where around 2 mN/m surface pressure equilibrium increase is obtainedwhile the filled symbols present the maximum bulk concentrations; (,)—Triton X-100, (,Δ)—SDS.
Fig. 5. Surface tension isotherms of decanol (), nonanol (♦), octanol (), heptanol () and hexanol () fitted with the Langmuir (dashed line) and Frumkin models (solid line). Thedata are taken from [81–86].
Table 6Frumkin and Reorientation model parameters for selected surfactants.
Frumkin model:
Surfactant b [m3/mol] Γ∞ [mol/m2] a ε [m/mN]
C6OH 1.23×10⁻¹ 5.81×10⁻⁶ 1.04 0C7OH 5.33×10⁻¹ 5.99×10⁻⁶ 0.8 0C8OH 1.17 6.06×10⁻⁶ 1.37 0C9OH 5.82 6.06×10⁻⁶ 1.2 0C10OH 1.21×101 5.99×10⁻⁶ 1.8 0
Reorientation model:
Surfactant b[m3/mol] ω10[m2/mol] ω2[m2/mol] α a ε [m/mN]
C10EO4 3.68×10² 4×10⁵ 1×10⁶ 1 0 5×10⁻³
C14EO8 5.84×10⁴ 5.4×10⁵ 1.4×10⁶ 3 0 7×10⁻³
174 N. Mucic et al. / Advances in Colloid and Interface Science 168 (2011) 167–178
The two values refer to the selected concentrations cmax and cmin,as mentioned above and cover, therefore, the whole bulk concentra-tion interval of the particular surfactant. Obviously the frequenciessmaller than 10−3 s are hardly reached in real experiments at leastbecause of time limitation. In this case the data presented in Tables 1–4 can give a hint about the range of relevant concentrations.
For easier understanding, in Figs. 3 and 4 we show the elasticityand viscosity data for Triton X-100 and SDS as examples. Thefrequency windows of the dilational rheology methods of Table 5are also inserted. Triton X-100 is a surfactant adsorbing in a verybroad concentration range and hence the characteristic frequencyspans also over a very wide interval. On the contrary, SDS has a rathernarrow range of the characteristic frequency. It is obvious that a singletechnique cannot cover the whole range of characteristic frequencyfor any surfactant. Hence, to obtain experimental data in the wholefrequency range it is necessary to combine several techniques.
It should be stressed, however, that for many surfactants theLangmuir model can be considered as a rather rough approximation.The behavior of these surfactants, especially surface rheology isdescribed more precisely by other models considered above. As an
example, we performed a comparison of the results based on theLangmuir model with those based on the Frumkin model for aliphaticalcohols and with those based on the Reorientation model foroxyethylated alcohols.
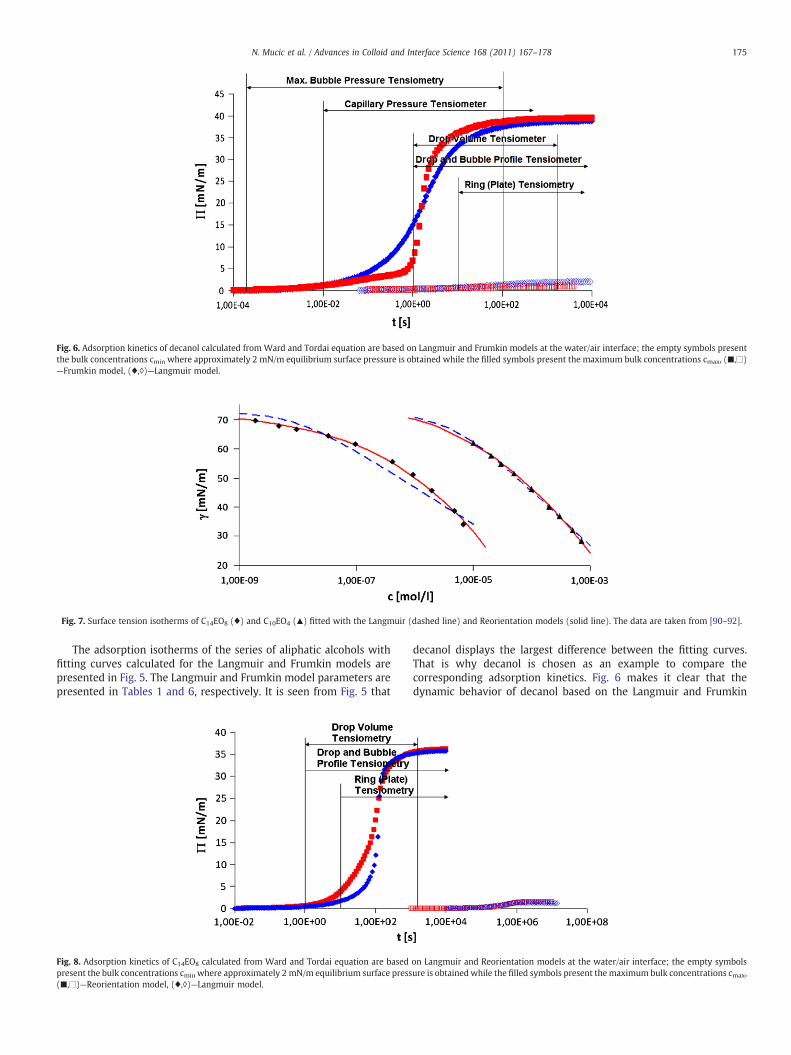
Fig. 6. Adsorption kinetics of decanol calculated from Ward and Tordai equation are based on Langmuir and Frumkin models at the water/air interface; the empty symbols presentthe bulk concentrations cmin where approximately 2 mN/m equilibrium surface pressure is obtained while the filled symbols present the maximum bulk concentrations cmax, (,)—Frumkin model, (♦,◊)—Langmuir model.
Fig. 7. Surface tension isotherms of C14EO8 (♦) and C10EO4 () fitted with the Langmuir (dashed line) and Reorientation models (solid line). The data are taken from [90–92].
175N. Mucic et al. / Advances in Colloid and Interface Science 168 (2011) 167–178
The adsorption isotherms of the series of aliphatic alcohols withfitting curves calculated for the Langmuir and Frumkin models arepresented in Fig. 5. The Langmuir and Frumkin model parameters arepresented in Tables 1 and 6, respectively. It is seen from Fig. 5 that
Fig. 8. Adsorption kinetics of C14EO8 calculated from Ward and Tordai equation are basedpresent the bulk concentrations cmin where approximately 2 mN/m equilibrium surface press(,)—Reorientation model, (♦,◊)—Langmuir model.
decanol displays the largest difference between the fitting curves.That is why decanol is chosen as an example to compare thecorresponding adsorption kinetics. Fig. 6 makes it clear that thedynamic behavior of decanol based on the Langmuir and Frumkin
on Langmuir and Reorientation models at the water/air interface; the empty symbolsure is obtainedwhile the filled symbols present themaximum bulk concentrations cmax,
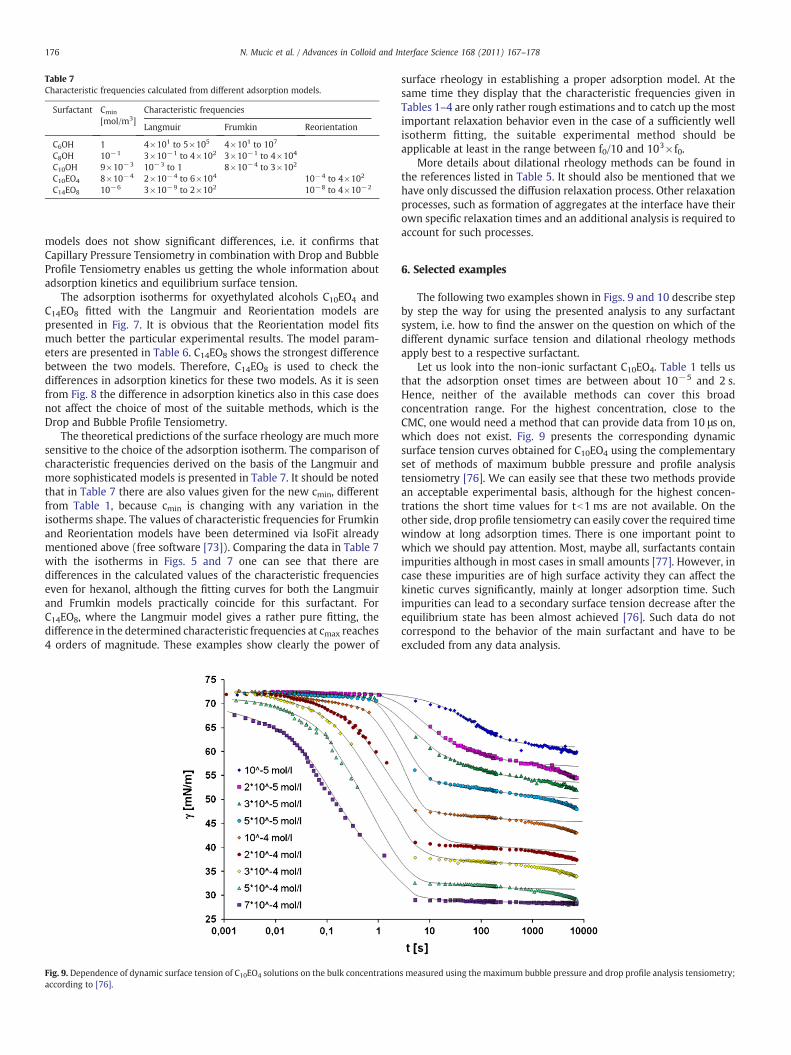
Table 7Characteristic frequencies calculated from different adsorption models.
Surfactant Cmin
[mol/m3]Characteristic frequencies
Langmuir Frumkin Reorientation
C6OH 1 4×101 to 5×10⁵ 4×101 to 107
C8OH 10−1 3×10⁻¹ to 4×10² 3×10⁻¹ to 4×10⁴
C10OH 9×10⁻³ 10−3 to 1 8×10⁻⁴ to 3×10²
C10EO4 8×10⁻⁴ 2×10⁻⁴ to 6×10⁴ 10−4 to 4×10²
C14EO8 10−6 3×10⁻⁹ to 2×10² 10−8 to 4×10⁻²
176 N. Mucic et al. / Advances in Colloid and Interface Science 168 (2011) 167–178
models does not show significant differences, i.e. it confirms thatCapillary Pressure Tensiometry in combination with Drop and BubbleProfile Tensiometry enables us getting the whole information aboutadsorption kinetics and equilibrium surface tension.
The adsorption isotherms for oxyethylated alcohols C10EO4 andC14EO8 fitted with the Langmuir and Reorientation models arepresented in Fig. 7. It is obvious that the Reorientation model fitsmuch better the particular experimental results. The model param-eters are presented in Table 6. C14EO8 shows the strongest differencebetween the two models. Therefore, C14EO8 is used to check thedifferences in adsorption kinetics for these two models. As it is seenfrom Fig. 8 the difference in adsorption kinetics also in this case doesnot affect the choice of most of the suitable methods, which is theDrop and Bubble Profile Tensiometry.
The theoretical predictions of the surface rheology are much moresensitive to the choice of the adsorption isotherm. The comparison ofcharacteristic frequencies derived on the basis of the Langmuir andmore sophisticated models is presented in Table 7. It should be notedthat in Table 7 there are also values given for the new cmin, differentfrom Table 1, because cmin is changing with any variation in theisotherms shape. The values of characteristic frequencies for Frumkinand Reorientation models have been determined via IsoFit alreadymentioned above (free software [73]). Comparing the data in Table 7with the isotherms in Figs. 5 and 7 one can see that there aredifferences in the calculated values of the characteristic frequencieseven for hexanol, although the fitting curves for both the Langmuirand Frumkin models practically coincide for this surfactant. ForC14EO8, where the Langmuir model gives a rather pure fitting, thedifference in the determined characteristic frequencies at cmax reaches4 orders of magnitude. These examples show clearly the power of
Fig. 9. Dependence of dynamic surface tension of C10EO4 solutions on the bulk concentrationaccording to [76].
surface rheology in establishing a proper adsorption model. At thesame time they display that the characteristic frequencies given inTables 1–4 are only rather rough estimations and to catch up the mostimportant relaxation behavior even in the case of a sufficiently wellisotherm fitting, the suitable experimental method should beapplicable at least in the range between f0/10 and 103×f0.
More details about dilational rheology methods can be found inthe references listed in Table 5. It should also be mentioned that wehave only discussed the diffusion relaxation process. Other relaxationprocesses, such as formation of aggregates at the interface have theirown specific relaxation times and an additional analysis is required toaccount for such processes.
6. Selected examples
The following two examples shown in Figs. 9 and 10 describe stepby step the way for using the presented analysis to any surfactantsystem, i.e. how to find the answer on the question on which of thedifferent dynamic surface tension and dilational rheology methodsapply best to a respective surfactant.
Let us look into the non-ionic surfactant C10EO4. Table 1 tells usthat the adsorption onset times are between about 10−5 and 2 s.Hence, neither of the available methods can cover this broadconcentration range. For the highest concentration, close to theCMC, one would need a method that can provide data from 10 μs on,which does not exist. Fig. 9 presents the corresponding dynamicsurface tension curves obtained for C10EO4 using the complementaryset of methods of maximum bubble pressure and profile analysistensiometry [76]. We can easily see that these two methods providean acceptable experimental basis, although for the highest concen-trations the short time values for tb1 ms are not available. On theother side, drop profile tensiometry can easily cover the required timewindow at long adsorption times. There is one important point towhich we should pay attention. Most, maybe all, surfactants containimpurities although in most cases in small amounts [77]. However, incase these impurities are of high surface activity they can affect thekinetic curves significantly, mainly at longer adsorption time. Suchimpurities can lead to a secondary surface tension decrease after theequilibrium state has been almost achieved [76]. Such data do notcorrespond to the behavior of the main surfactant and have to beexcluded from any data analysis.
s measured using the maximum bubble pressure and drop profile analysis tensiometry;
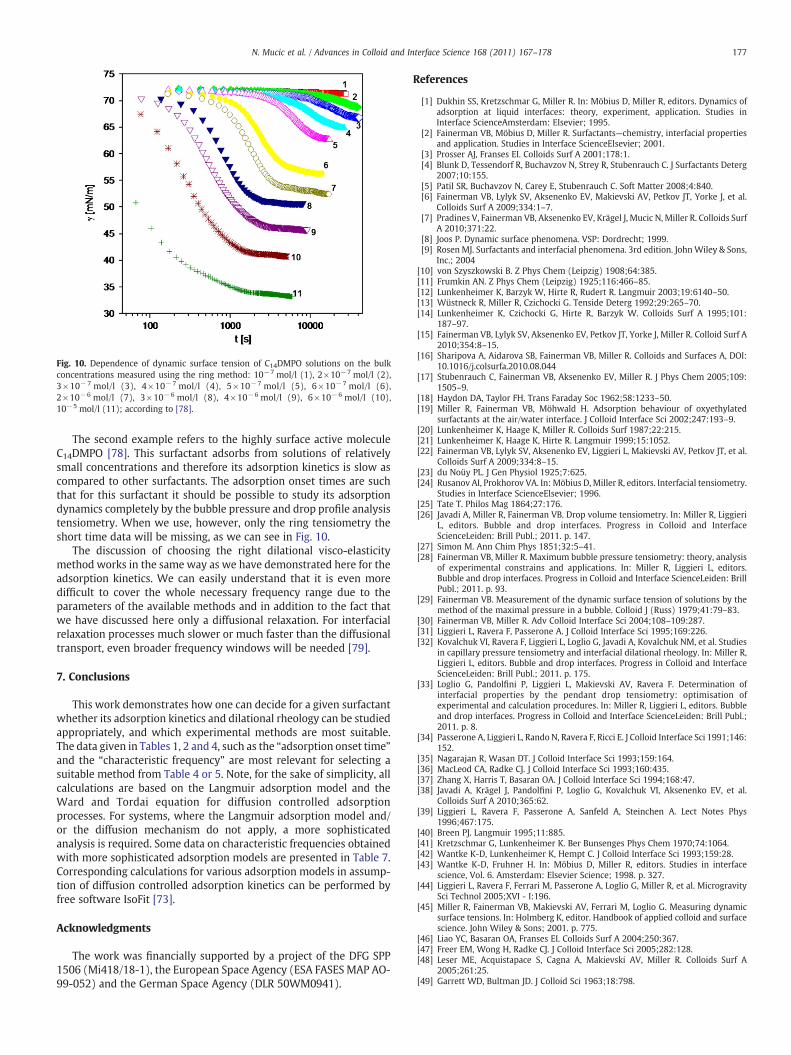
Fig. 10. Dependence of dynamic surface tension of C14DMPO solutions on the bulkconcentrations measured using the ring method: 10−7 mol/l (1), 2×10⁻⁷ mol/l (2),3×10−7 mol/l (3), 4×10− 7 mol/l (4), 5×10⁻⁷ mol/l (5), 6×10− 7 mol/l (6),2×10−6 mol/l (7), 3×10⁻⁶ mol/l (8), 4×10⁻⁶ mol/l (9), 6×10⁻⁶ mol/l (10),10−5 mol/l (11); according to [78].
177N. Mucic et al. / Advances in Colloid and Interface Science 168 (2011) 167–178
The second example refers to the highly surface active moleculeC14DMPO [78]. This surfactant adsorbs from solutions of relativelysmall concentrations and therefore its adsorption kinetics is slow ascompared to other surfactants. The adsorption onset times are suchthat for this surfactant it should be possible to study its adsorptiondynamics completely by the bubble pressure and drop profile analysistensiometry. When we use, however, only the ring tensiometry theshort time data will be missing, as we can see in Fig. 10.
The discussion of choosing the right dilational visco-elasticitymethod works in the same way as we have demonstrated here for theadsorption kinetics. We can easily understand that it is even moredifficult to cover the whole necessary frequency range due to theparameters of the available methods and in addition to the fact thatwe have discussed here only a diffusional relaxation. For interfacialrelaxation processes much slower or much faster than the diffusionaltransport, even broader frequency windows will be needed [79].
7. Conclusions
This work demonstrates how one can decide for a given surfactantwhether its adsorption kinetics and dilational rheology can be studiedappropriately, and which experimental methods are most suitable.The data given in Tables 1, 2 and 4, such as the “adsorption onset time”and the “characteristic frequency” are most relevant for selecting asuitable method from Table 4 or 5. Note, for the sake of simplicity, allcalculations are based on the Langmuir adsorption model and theWard and Tordai equation for diffusion controlled adsorptionprocesses. For systems, where the Langmuir adsorption model and/or the diffusion mechanism do not apply, a more sophisticatedanalysis is required. Some data on characteristic frequencies obtainedwith more sophisticated adsorption models are presented in Table 7.Corresponding calculations for various adsorption models in assump-tion of diffusion controlled adsorption kinetics can be performed byfree software IsoFit [73].
Acknowledgments
The work was financially supported by a project of the DFG SPP1506 (Mi418/18-1), the European Space Agency (ESA FASES MAP AO-99-052) and the German Space Agency (DLR 50WM0941).
References
[1] Dukhin SS, Kretzschmar G, Miller R. In: Möbius D, Miller R, editors. Dynamics ofadsorption at liquid interfaces: theory, experiment, application. Studies inInterface ScienceAmsterdam: Elsevier; 1995.
[2] Fainerman VB, Möbius D, Miller R. Surfactants—chemistry, interfacial propertiesand application. Studies in Interface ScienceElsevier; 2001.
[3] Prosser AJ, Franses EI. Colloids Surf A 2001;178:1.[4] Blunk D, Tessendorf R, Buchavzov N, Strey R, Stubenrauch C. J Surfactants Deterg
2007;10:155.[5] Patil SR, Buchavzov N, Carey E, Stubenrauch C. Soft Matter 2008;4:840.[6] Fainerman VB, Lylyk SV, Aksenenko EV, Makievski AV, Petkov JT, Yorke J, et al.
Colloids Surf A 2009;334:1–7.[7] Pradines V, Fainerman VB, Aksenenko EV, Krägel J, Mucic N, Miller R. Colloids Surf
A 2010;371:22.[8] Joos P. Dynamic surface phenomena. VSP: Dordrecht; 1999.[9] Rosen MJ. Surfactants and interfacial phenomena. 3rd edition. JohnWiley & Sons,
Inc.; 2004[10] von Szyszkowski B. Z Phys Chem (Leipzig) 1908;64:385.[11] Frumkin AN. Z Phys Chem (Leipzig) 1925;116:466–85.[12] Lunkenheimer K, Barzyk W, Hirte R, Rudert R. Langmuir 2003;19:6140–50.[13] Wüstneck R, Miller R, Czichocki G. Tenside Deterg 1992;29:265–70.[14] Lunkenheimer K, Czichocki G, Hirte R, Barzyk W. Colloids Surf A 1995;101:
187–97.[15] Fainerman VB, Lylyk SV, Aksenenko EV, Petkov JT, Yorke J, Miller R. Colloid Surf A
2010;354:8–15.[16] Sharipova A, Aidarova SB, Fainerman VB, Miller R. Colloids and Surfaces A, DOI:
10.1016/j.colsurfa.2010.08.044[17] Stubenrauch C, Fainerman VB, Aksenenko EV, Miller R. J Phys Chem 2005;109:
1505–9.[18] Haydon DA, Taylor FH. Trans Faraday Soc 1962;58:1233–50.[19] Miller R, Fainerman VB, Möhwald H. Adsorption behaviour of oxyethylated
surfactants at the air/water interface. J Colloid Interface Sci 2002;247:193–9.[20] Lunkenheimer K, Haage K, Miller R. Colloids Surf 1987;22:215.[21] Lunkenheimer K, Haage K, Hirte R. Langmuir 1999;15:1052.[22] Fainerman VB, Lylyk SV, Aksenenko EV, Liggieri L, Makievski AV, Petkov JT, et al.
Colloids Surf A 2009;334:8–15.[23] du Noüy PL. J Gen Physiol 1925;7:625.[24] Rusanov AI, Prokhorov VA. In: Möbius D, Miller R, editors. Interfacial tensiometry.
Studies in Interface ScienceElsevier; 1996.[25] Tate T. Philos Mag 1864;27:176.[26] Javadi A, Miller R, Fainerman VB. Drop volume tensiometry. In: Miller R, Liggieri
L, editors. Bubble and drop interfaces. Progress in Colloid and InterfaceScienceLeiden: Brill Publ.; 2011. p. 147.
[27] Simon M. Ann Chim Phys 1851;32:5–41.[28] Fainerman VB, Miller R. Maximum bubble pressure tensiometry: theory, analysis
of experimental constrains and applications. In: Miller R, Liggieri L, editors.Bubble and drop interfaces. Progress in Colloid and Interface ScienceLeiden: BrillPubl.; 2011. p. 93.
[29] Fainerman VB. Measurement of the dynamic surface tension of solutions by themethod of the maximal pressure in a bubble. Colloid J (Russ) 1979;41:79–83.
[30] Fainerman VB, Miller R. Adv Colloid Interface Sci 2004;108–109:287.[31] Liggieri L, Ravera F, Passerone A. J Colloid Interface Sci 1995;169:226.[32] Kovalchuk VI, Ravera F, Liggieri L, Loglio G, Javadi A, Kovalchuk NM, et al. Studies
in capillary pressure tensiometry and interfacial dilational rheology. In: Miller R,Liggieri L, editors. Bubble and drop interfaces. Progress in Colloid and InterfaceScienceLeiden: Brill Publ.; 2011. p. 175.
[33] Loglio G, Pandolfini P, Liggieri L, Makievski AV, Ravera F. Determination ofinterfacial properties by the pendant drop tensiometry: optimisation ofexperimental and calculation procedures. In: Miller R, Liggieri L, editors. Bubbleand drop interfaces. Progress in Colloid and Interface ScienceLeiden: Brill Publ.;2011. p. 8.
[34] Passerone A, Liggieri L, Rando N, Ravera F, Ricci E. J Colloid Interface Sci 1991;146:152.
[35] Nagarajan R, Wasan DT. J Colloid Interface Sci 1993;159:164.[36] MacLeod CA, Radke CJ. J Colloid Interface Sci 1993;160:435.[37] Zhang X, Harris T, Basaran OA. J Colloid Interface Sci 1994;168:47.[38] Javadi A, Krägel J, Pandolfini P, Loglio G, Kovalchuk VI, Aksenenko EV, et al.
Colloids Surf A 2010;365:62.[39] Liggieri L, Ravera F, Passerone A, Sanfeld A, Steinchen A. Lect Notes Phys
1996;467:175.[40] Breen PJ. Langmuir 1995;11:885.[41] Kretzschmar G, Lunkenheimer K. Ber Bunsenges Phys Chem 1970;74:1064.[42] Wantke K-D, Lunkenheimer K, Hempt C. J Colloid Interface Sci 1993;159:28.[43] Wantke K-D, Fruhner H. In: Möbius D, Miller R, editors. Studies in interface
science, Vol. 6. Amsterdam: Elsevier Science; 1998. p. 327.[44] Liggieri L, Ravera F, Ferrari M, Passerone A, Loglio G, Miller R, et al. Microgravity
Sci Technol 2005;XVI - I:196.[45] Miller R, Fainerman VB, Makievski AV, Ferrari M, Loglio G. Measuring dynamic
surface tensions. In: Holmberg K, editor. Handbook of applied colloid and surfacescience. John Wiley & Sons; 2001. p. 775.
[46] Liao YC, Basaran OA, Franses EI. Colloids Surf A 2004;250:367.[47] Freer EM, Wong H, Radke CJ. J Colloid Interface Sci 2005;282:128.[48] Leser ME, Acquistapace S, Cagna A, Makievski AV, Miller R. Colloids Surf A
2005;261:25.[49] Garrett WD, Bultman JD. J Colloid Sci 1963;18:798.
178 N. Mucic et al. / Advances in Colloid and Interface Science 168 (2011) 167–178
[50] Mann JA, Hansen RS. J Colloid Sci 1963;18:805.[51] Davies JT, Vose RW. Proc R Soc Lond A 1965;286:218.[52] Lucassen J, Hansen RS. J Colloid Interface Sci 1966;22:32.[53] Lucassen J, Hansen RS. J Colloid Interface Sci 1967;23:319.[54] Bendure RL, Hansen RS. J Phys Chem 1967;71:2889.[55] Thiessen D, Scheludko A. Kolloid Z Z Polym 1967;218:139.[56] Rayleigh L. Philos Mag 1890;30:386.[57] Kalen LA. Ann Phys 1902;7:440.[58] Kolovrat-Chervinskiy L. J Russ Phys Chem Soc 1904;36:265.[59] Lamb H. Hydrodynamics. New York: Dover; 1932.[60] Levich VG, Soviet Phys. JETP, 10 (1940) 1296; 11 (1941) 340.[61] Langevin D. In: Marcel Dekker, editor. Light scattering by liquid surfaces and
complimentary techniques; 1992. New York.[62] Noskov BA. Interfacial elasticity as studied by wave methods. In: Miller R, Liggieri
L, editors. Interfacial rheology. Leiden: Brill Publ.; 2009. p. 103–36.[63] Langmuir I. J Am Chem Soc 1917;39:1848.[64] Fainerman VB, Miller R. Adsorption isotherms at liquid interfaces. In: Soma-
sundaran P, Hubbard A, editors. Encyclopedia of surface and colloid science, 2ndEdition, 1; 2009. p. 1.
[65] Fainerman VB, Kovalchuk VI, Aksenenko EV, Michel M, Leser ME, Miller R. J PhysChem B 2004;108:13700.
[66] Fainerman VB, Lylyk SV, Aksenenko EV, Makievski AV, Petkov JT, Yorke J, et al.Coll Surf A 2009;334:1.
[67] Miller R, Noskov BA, Fainerman VB, Petkov JG. Impact of micellar kinetics ondynamic interfacial properties of surfactant solutions. In: Platikanov D, ExerowaD, editors. Highlights in colloid science. Wiley-VHC; 2008. p. 247–59.
[68] Ward AFH, Tordai L. J Phys Chem 1946;14:453.[69] Ziller M, Miller R. Colloid Polym Sci 1986;264:611.[70] van den Tempel M, Lucassen J, Lucassen-Reynders EH. J Phys Chem 1965;69:
1798–804.[71] Lucassen J, van den Tempel M. Chem Eng Sci 1972;27:1283.[72] Lucassen J, van den Tempel M. J Colloid Interface Sci 1972;41:491.[73] http://www.thomascat.info/thomascat/Scientific/AdSo/AdSo.htm.[74] Poling BE, Prausnitz JM, O'Connell JP. The properties of gases and liquids. 5th
edition. New York: McGraw-Hill; 2001.[75] Wilke CR, Chang P. Correlation of diffusion coefficients in dilute solution. AIChE J
1955;1:264.[76] Miller R, Olak C, Makievski AV. Tensiometry as a tool for quantitative analysis of
surfactant adsorption. SÖFW; 2004. p. 2. (English version).[77] Lunkenheimer K, Miller R. J Colloid Interface Sci 1987;120:176.[78] Makievski AV, Grigoriev DO. Colloids Surf A 1998;143:233.[79] Liggieri L, Ferrari M, Modelli D, Ravera F. Faraday discuss 2005;129:125--40.[80] Malysa K, Miller R, Lunkenheimer K. Colloids Surf 1991;53:47.[81] Demond AH, Lindher AS. Environ Sci Technol 1993;27:2318.[82] Addison CC. J Chem Soc 1945:98.[83] Hommelen JR. J Colloid Sci 1959;14:385.[84] Fainerman VB, Lylyk SV. Koll Zh 1983;45:500.
[85] Aratono M, Uryu S, Hayami Y, Motomura K, Matuura R. J Colloid Interface Sci1984;98:33.
[86] Wüstneck R, Miller R. Colloids Surf 1990;47:15.[87] Lin S-Y, McKeigue K, Maldarelli C. Langmuir 1991;7:1055.[88] Lin S-Y, Lu T-L, Hwang W-B. Langmuir 1994;10:3442.[89] Miller R, Olak C, Makievski AV. Tensiometry as a tool for quantitative analysis of
surfactant adsorption. SÖFW; 2004. p. 2. (English version).[90] Schulze-Schlarmann J, Stubenrauch C, Miller R. Tenside Surfactants Deterg
2005;42:307.[91] Ueno M, Takasawa Y, Miyashige H, Tabata Y, Meguro K. Colloid Polym Sci
1981;259:761.[92] Fainerman VB, Petkov JT, Miller R. Langmuir 2008;24:6447–52.[93] Fainerman VB, Miller R. Colloids Surf A 1995;97:65.[94] Egan RW, Jones MA, Lehninger AL. Hydrophile–lipophile balance and critical
micelle concentration as key factors influencing surfactant disruption ofmitochondrial membranes. J Biol Chem 1976.
[95] Fainerman VB, Miller R, Makievski AV. Langmuir 1995;11:3054.[96] Janczuk B, Bruque JM, Gonzales–Martin ML, Dorado-Calasanz C. Langmuir
1995;11:4515.[97] El Ghzaoui A, Fabreque R, Cassanas G, Fulconis JM, Delagrange J. Colloid Polym Sci
2000;278:231.[98] Lunkenheimer K, Czichocki G, Hirte R, Barzyk W. Colloids Surf A 1995;101:187.[99] Fainermann VB. Kolloidn Zh 1986;48:512.[100] Czichocki G, Makievski AV, Fainerman VB, Miller R. Colloids Surf A 1997;122:189.[101] Vollhardt D, Czichocki G, Rudert R. Colloids Surf A 1993;76:217.[102] Chen L-W, Chen J-H. J Chem Soc Faraday Trans 1995;91:3873.[103] Tajima K. J Chem Soc Jpn 1973;5:883.[104] Bergeron V. Langmuir 1997;13:3474.[105] Langevin D, Argillier J-F. Macromolecules 1996;29:7412.[106] Lu JR, Thomas RK, Aveyard R, Blinks BP, Cooper P, Fletcher PDI, et al. J Phys Chem
1992;96:10971.[107] Schukin ED, Markina ZN, Zadymova NM. Prog Colloid Polym Sci 1983;68:90.[108] Gunde R, Kumar A, Lehnert-Batar S, Mäder R, Windhab EJ. J Colloid Interface Sci
2001;244:113.[109] Wang W, Ngan KH, Gong J, Angeli P. Colloids Surf A 2009;334:197.[110] Noskov BA. Curr Opin Colloid Interface Sci 2010;15:229.[111] Noskov BA. Interfacial elasticity as studied by wavemethods. In: Miller R, Liggieri
L, editors. Interfacial rheology. Progress in Colloid Interface Sci.Leiden: Brill Publ.;2009. p. 103.
[112] Lucassen J. Trans Faraday Soc 1968;64:2230–5.[113] Lemaire C, Langevin D. Colloids Surf 1992;65:101–12.[114] Noskov BA, Latnikova AV, Lin S-Y, Loglio G, Miller R. Dynamic surface elasticity of
β-casein solutions in the course of adsorption process. J Phys Chem C 2007;111:16895–901.
[115] Benjamins J, Cagna A, Lucassen-Reynders EH. Colloids Surf A 1996;114:245–54.[116] Kovalchuk VI, Ravera F, Liggieri L, Loglio G, Pandolfini P, Makievski AV, et al. Adv
Colloid Interface Sci 2010;161:102–14.

Paper VI Fast dynamic interfacial tension measurements and dilational rheology of interfacial layers by using the capillary pressure technique A. Javadi, J. Krägel, A.V. Makievski, N.M. Kovalchuk, V.I. Kovalchuk, N. Mucic, G. Loglio, P. Pandolfini, M. Karbaschi and R. Miller Colloids and Surfaces A, 407 (2012) 159‐168.
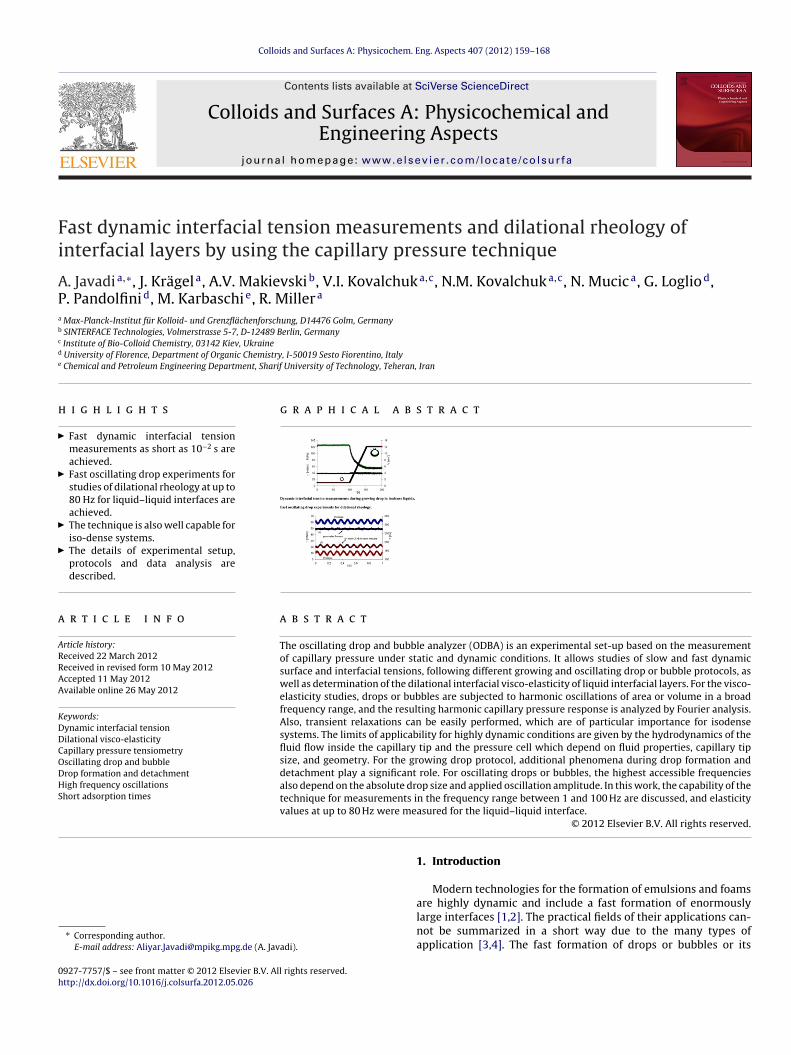
Fi
APa
b
c
d
e
h
a
ARRAA
KDDCODHS
0h
Colloids and Surfaces A: Physicochem. Eng. Aspects 407 (2012) 159– 168
Contents lists available at SciVerse ScienceDirect
Colloids and Surfaces A: Physicochemical andEngineering Aspects
jo ur nal homep a ge: www.elsev ier .com/ locate /co lsur fa
ast dynamic interfacial tension measurements and dilational rheology ofnterfacial layers by using the capillary pressure technique
. Javadia,∗, J. Krägela, A.V. Makievskib, V.I. Kovalchuka,c, N.M. Kovalchuka,c, N. Mucica, G. Logliod,. Pandolfinid, M. Karbaschie, R. Millera
Max-Planck-Institut für Kolloid- und Grenzflächenforschung, D14476 Golm, GermanySINTERFACE Technologies, Volmerstrasse 5-7, D-12489 Berlin, GermanyInstitute of Bio-Colloid Chemistry, 03142 Kiev, UkraineUniversity of Florence, Department of Organic Chemistry, I-50019 Sesto Fiorentino, ItalyChemical and Petroleum Engineering Department, Sharif University of Technology, Teheran, Iran
i g h l i g h t s
Fast dynamic interfacial tensionmeasurements as short as 10−2 s areachieved.Fast oscillating drop experiments forstudies of dilational rheology at up to80 Hz for liquid–liquid interfaces areachieved.The technique is also well capable foriso-dense systems.The details of experimental setup,protocols and data analysis aredescribed.
g r a p h i c a l a b s t r a c t
r t i c l e i n f o
rticle history:eceived 22 March 2012eceived in revised form 10 May 2012ccepted 11 May 2012vailable online 26 May 2012
eywords:ynamic interfacial tensionilational visco-elasticity
a b s t r a c t
The oscillating drop and bubble analyzer (ODBA) is an experimental set-up based on the measurementof capillary pressure under static and dynamic conditions. It allows studies of slow and fast dynamicsurface and interfacial tensions, following different growing and oscillating drop or bubble protocols, aswell as determination of the dilational interfacial visco-elasticity of liquid interfacial layers. For the visco-elasticity studies, drops or bubbles are subjected to harmonic oscillations of area or volume in a broadfrequency range, and the resulting harmonic capillary pressure response is analyzed by Fourier analysis.Also, transient relaxations can be easily performed, which are of particular importance for isodensesystems. The limits of applicability for highly dynamic conditions are given by the hydrodynamics of the
apillary pressure tensiometryscillating drop and bubblerop formation and detachmentigh frequency oscillationshort adsorption times
fluid flow inside the capillary tip and the pressure cell which depend on fluid properties, capillary tipsize, and geometry. For the growing drop protocol, additional phenomena during drop formation anddetachment play a significant role. For oscillating drops or bubbles, the highest accessible frequenciesalso depend on the absolute drop size and applied oscillation amplitude. In this work, the capability of thetechnique for measurements in the frequency range between 1 and 100 Hz are discussed, and elasticity
e me
values at up to 80 Hz wer∗ Corresponding author.E-mail address: [email protected] (A. Javadi).
927-7757/$ – see front matter © 2012 Elsevier B.V. All rights reserved.ttp://dx.doi.org/10.1016/j.colsurfa.2012.05.026
asured for the liquid–liquid interface.© 2012 Elsevier B.V. All rights reserved.
1. Introduction
Modern technologies for the formation of emulsions and foams
are highly dynamic and include a fast formation of enormouslylarge interfaces [1,2]. The practical fields of their applications can-not be summarized in a short way due to the many types ofapplication [3,4]. The fast formation of drops or bubbles or its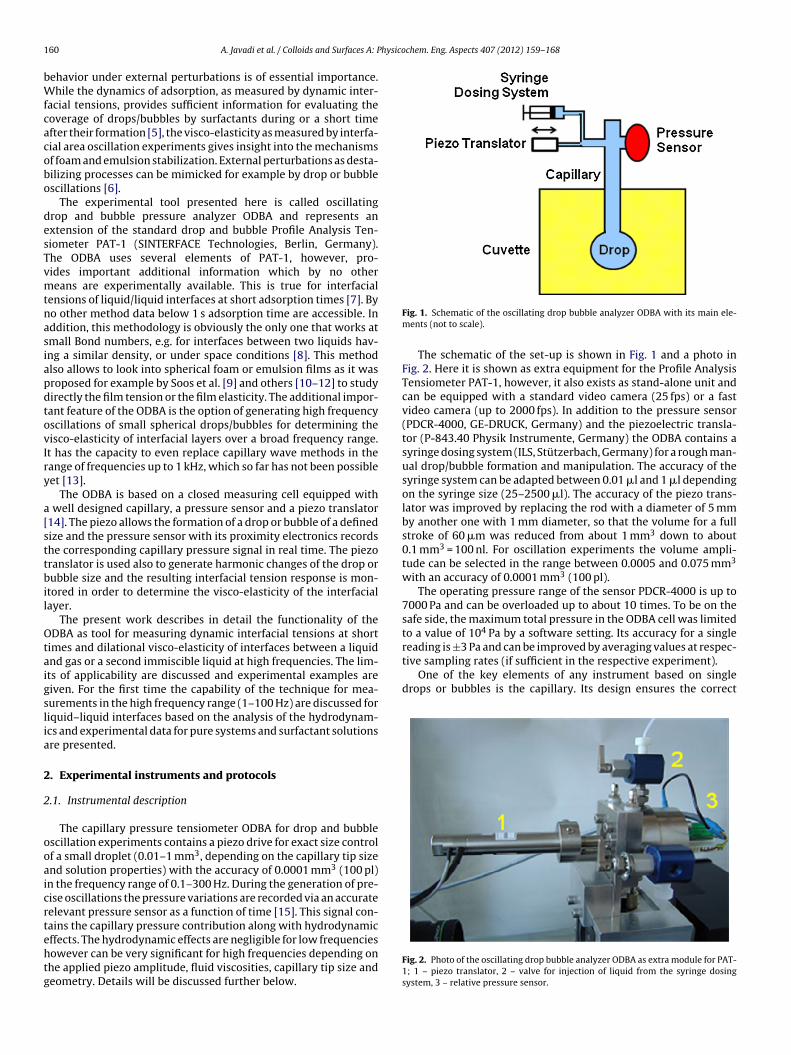
1 hysicochem. Eng. Aspects 407 (2012) 159– 168
bWfcacobo
desTvmtnasiapdtovIry
a[sttbil
Otaigslia
2
2
ooaicrtehtg
reading is ±3 Pa and can be improved by averaging values at respec-tive sampling rates (if sufficient in the respective experiment).
One of the key elements of any instrument based on singledrops or bubbles is the capillary. Its design ensures the correct
60 A. Javadi et al. / Colloids and Surfaces A: P
ehavior under external perturbations is of essential importance.hile the dynamics of adsorption, as measured by dynamic inter-
acial tensions, provides sufficient information for evaluating theoverage of drops/bubbles by surfactants during or a short timefter their formation [5], the visco-elasticity as measured by interfa-ial area oscillation experiments gives insight into the mechanismsf foam and emulsion stabilization. External perturbations as desta-ilizing processes can be mimicked for example by drop or bubblescillations [6].
The experimental tool presented here is called oscillatingrop and bubble pressure analyzer ODBA and represents anxtension of the standard drop and bubble Profile Analysis Ten-iometer PAT-1 (SINTERFACE Technologies, Berlin, Germany).he ODBA uses several elements of PAT-1, however, pro-ides important additional information which by no othereans are experimentally available. This is true for interfacial
ensions of liquid/liquid interfaces at short adsorption times [7]. Byo other method data below 1 s adsorption time are accessible. Inddition, this methodology is obviously the only one that works atmall Bond numbers, e.g. for interfaces between two liquids hav-ng a similar density, or under space conditions [8]. This methodlso allows to look into spherical foam or emulsion films as it wasroposed for example by Soos et al. [9] and others [10–12] to studyirectly the film tension or the film elasticity. The additional impor-ant feature of the ODBA is the option of generating high frequencyscillations of small spherical drops/bubbles for determining theisco-elasticity of interfacial layers over a broad frequency range.t has the capacity to even replace capillary wave methods in theange of frequencies up to 1 kHz, which so far has not been possibleet [13].
The ODBA is based on a closed measuring cell equipped with well designed capillary, a pressure sensor and a piezo translator14]. The piezo allows the formation of a drop or bubble of a definedize and the pressure sensor with its proximity electronics recordshe corresponding capillary pressure signal in real time. The piezoranslator is used also to generate harmonic changes of the drop orubble size and the resulting interfacial tension response is mon-
tored in order to determine the visco-elasticity of the interfacialayer.
The present work describes in detail the functionality of theDBA as tool for measuring dynamic interfacial tensions at short
imes and dilational visco-elasticity of interfaces between a liquidnd gas or a second immiscible liquid at high frequencies. The lim-ts of applicability are discussed and experimental examples areiven. For the first time the capability of the technique for mea-urements in the high frequency range (1–100 Hz) are discussed foriquid–liquid interfaces based on the analysis of the hydrodynam-cs and experimental data for pure systems and surfactant solutionsre presented.
. Experimental instruments and protocols
.1. Instrumental description
The capillary pressure tensiometer ODBA for drop and bubblescillation experiments contains a piezo drive for exact size controlf a small droplet (0.01–1 mm3, depending on the capillary tip sizend solution properties) with the accuracy of 0.0001 mm3 (100 pl)n the frequency range of 0.1–300 Hz. During the generation of pre-ise oscillations the pressure variations are recorded via an accurateelevant pressure sensor as a function of time [15]. This signal con-ains the capillary pressure contribution along with hydrodynamic
ffects. The hydrodynamic effects are negligible for low frequenciesowever can be very significant for high frequencies depending onhe applied piezo amplitude, fluid viscosities, capillary tip size andeometry. Details will be discussed further below.Fig. 1. Schematic of the oscillating drop bubble analyzer ODBA with its main ele-ments (not to scale).
The schematic of the set-up is shown in Fig. 1 and a photo inFig. 2. Here it is shown as extra equipment for the Profile AnalysisTensiometer PAT-1, however, it also exists as stand-alone unit andcan be equipped with a standard video camera (25 fps) or a fastvideo camera (up to 2000 fps). In addition to the pressure sensor(PDCR-4000, GE-DRUCK, Germany) and the piezoelectric transla-tor (P-843.40 Physik Instrumente, Germany) the ODBA contains asyringe dosing system (ILS, Stützerbach, Germany) for a rough man-ual drop/bubble formation and manipulation. The accuracy of thesyringe system can be adapted between 0.01 l and 1 l dependingon the syringe size (25–2500 l). The accuracy of the piezo trans-lator was improved by replacing the rod with a diameter of 5 mmby another one with 1 mm diameter, so that the volume for a fullstroke of 60 m was reduced from about 1 mm3 down to about0.1 mm3 = 100 nl. For oscillation experiments the volume ampli-tude can be selected in the range between 0.0005 and 0.075 mm3
with an accuracy of 0.0001 mm3 (100 pl).The operating pressure range of the sensor PDCR-4000 is up to
7000 Pa and can be overloaded up to about 10 times. To be on thesafe side, the maximum total pressure in the ODBA cell was limitedto a value of 104 Pa by a software setting. Its accuracy for a single
Fig. 2. Photo of the oscillating drop bubble analyzer ODBA as extra module for PAT-1; 1 – piezo translator, 2 – valve for injection of liquid from the syringe dosingsystem, 3 – relative pressure sensor.
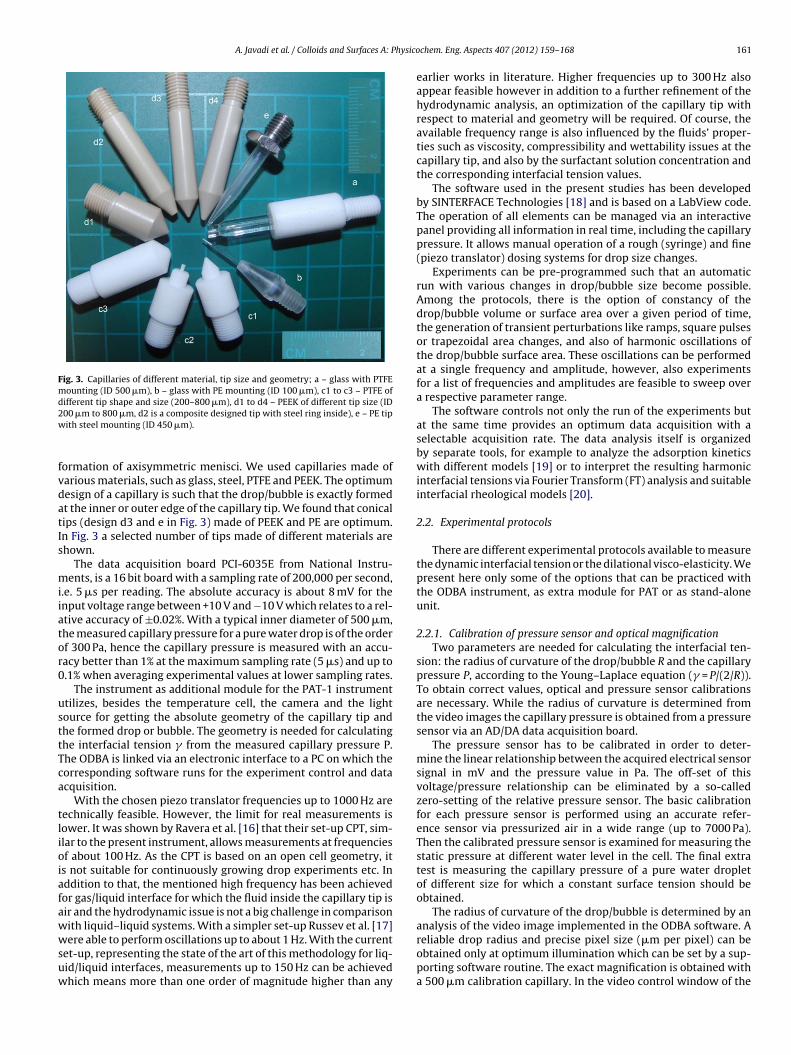
A. Javadi et al. / Colloids and Surfaces A: Physico
Fig. 3. Capillaries of different material, tip size and geometry; a – glass with PTFEmounting (ID 500 m), b – glass with PE mounting (ID 100 m), c1 to c3 – PTFE ofdifferent tip shape and size (200–800 m), d1 to d4 – PEEK of different tip size (ID2w
fvdatIs
miiator0
usttTca
tlioiafawwsuw
reliable drop radius and precise pixel size (m per pixel) can be
00 m to 800 m, d2 is a composite designed tip with steel ring inside), e – PE tipith steel mounting (ID 450 m).
ormation of axisymmetric menisci. We used capillaries made ofarious materials, such as glass, steel, PTFE and PEEK. The optimumesign of a capillary is such that the drop/bubble is exactly formedt the inner or outer edge of the capillary tip. We found that conicalips (design d3 and e in Fig. 3) made of PEEK and PE are optimum.n Fig. 3 a selected number of tips made of different materials arehown.
The data acquisition board PCI-6035E from National Instru-ents, is a 16 bit board with a sampling rate of 200,000 per second,
.e. 5 s per reading. The absolute accuracy is about 8 mV for thenput voltage range between +10 V and −10 V which relates to a rel-tive accuracy of ±0.02%. With a typical inner diameter of 500 m,he measured capillary pressure for a pure water drop is of the orderf 300 Pa, hence the capillary pressure is measured with an accu-acy better than 1% at the maximum sampling rate (5 s) and up to.1% when averaging experimental values at lower sampling rates.
The instrument as additional module for the PAT-1 instrumenttilizes, besides the temperature cell, the camera and the lightource for getting the absolute geometry of the capillary tip andhe formed drop or bubble. The geometry is needed for calculatinghe interfacial tension from the measured capillary pressure P.he ODBA is linked via an electronic interface to a PC on which theorresponding software runs for the experiment control and datacquisition.
With the chosen piezo translator frequencies up to 1000 Hz areechnically feasible. However, the limit for real measurements isower. It was shown by Ravera et al. [16] that their set-up CPT, sim-lar to the present instrument, allows measurements at frequenciesf about 100 Hz. As the CPT is based on an open cell geometry, its not suitable for continuously growing drop experiments etc. Inddition to that, the mentioned high frequency has been achievedor gas/liquid interface for which the fluid inside the capillary tip isir and the hydrodynamic issue is not a big challenge in comparisonith liquid–liquid systems. With a simpler set-up Russev et al. [17]ere able to perform oscillations up to about 1 Hz. With the current
et-up, representing the state of the art of this methodology for liq-id/liquid interfaces, measurements up to 150 Hz can be achievedhich means more than one order of magnitude higher than any
chem. Eng. Aspects 407 (2012) 159– 168 161
earlier works in literature. Higher frequencies up to 300 Hz alsoappear feasible however in addition to a further refinement of thehydrodynamic analysis, an optimization of the capillary tip withrespect to material and geometry will be required. Of course, theavailable frequency range is also influenced by the fluids’ proper-ties such as viscosity, compressibility and wettability issues at thecapillary tip, and also by the surfactant solution concentration andthe corresponding interfacial tension values.
The software used in the present studies has been developedby SINTERFACE Technologies [18] and is based on a LabView code.The operation of all elements can be managed via an interactivepanel providing all information in real time, including the capillarypressure. It allows manual operation of a rough (syringe) and fine(piezo translator) dosing systems for drop size changes.
Experiments can be pre-programmed such that an automaticrun with various changes in drop/bubble size become possible.Among the protocols, there is the option of constancy of thedrop/bubble volume or surface area over a given period of time,the generation of transient perturbations like ramps, square pulsesor trapezoidal area changes, and also of harmonic oscillations ofthe drop/bubble surface area. These oscillations can be performedat a single frequency and amplitude, however, also experimentsfor a list of frequencies and amplitudes are feasible to sweep overa respective parameter range.
The software controls not only the run of the experiments butat the same time provides an optimum data acquisition with aselectable acquisition rate. The data analysis itself is organizedby separate tools, for example to analyze the adsorption kineticswith different models [19] or to interpret the resulting harmonicinterfacial tensions via Fourier Transform (FT) analysis and suitableinterfacial rheological models [20].
2.2. Experimental protocols
There are different experimental protocols available to measurethe dynamic interfacial tension or the dilational visco-elasticity. Wepresent here only some of the options that can be practiced withthe ODBA instrument, as extra module for PAT or as stand-aloneunit.
2.2.1. Calibration of pressure sensor and optical magnificationTwo parameters are needed for calculating the interfacial ten-
sion: the radius of curvature of the drop/bubble R and the capillarypressure P, according to the Young–Laplace equation ( = P/(2/R)).To obtain correct values, optical and pressure sensor calibrationsare necessary. While the radius of curvature is determined fromthe video images the capillary pressure is obtained from a pressuresensor via an AD/DA data acquisition board.
The pressure sensor has to be calibrated in order to deter-mine the linear relationship between the acquired electrical sensorsignal in mV and the pressure value in Pa. The off-set of thisvoltage/pressure relationship can be eliminated by a so-calledzero-setting of the relative pressure sensor. The basic calibrationfor each pressure sensor is performed using an accurate refer-ence sensor via pressurized air in a wide range (up to 7000 Pa).Then the calibrated pressure sensor is examined for measuring thestatic pressure at different water level in the cell. The final extratest is measuring the capillary pressure of a pure water dropletof different size for which a constant surface tension should beobtained.
The radius of curvature of the drop/bubble is determined by ananalysis of the video image implemented in the ODBA software. A
obtained only at optimum illumination which can be set by a sup-porting software routine. The exact magnification is obtained witha 500 m calibration capillary. In the video control window of the
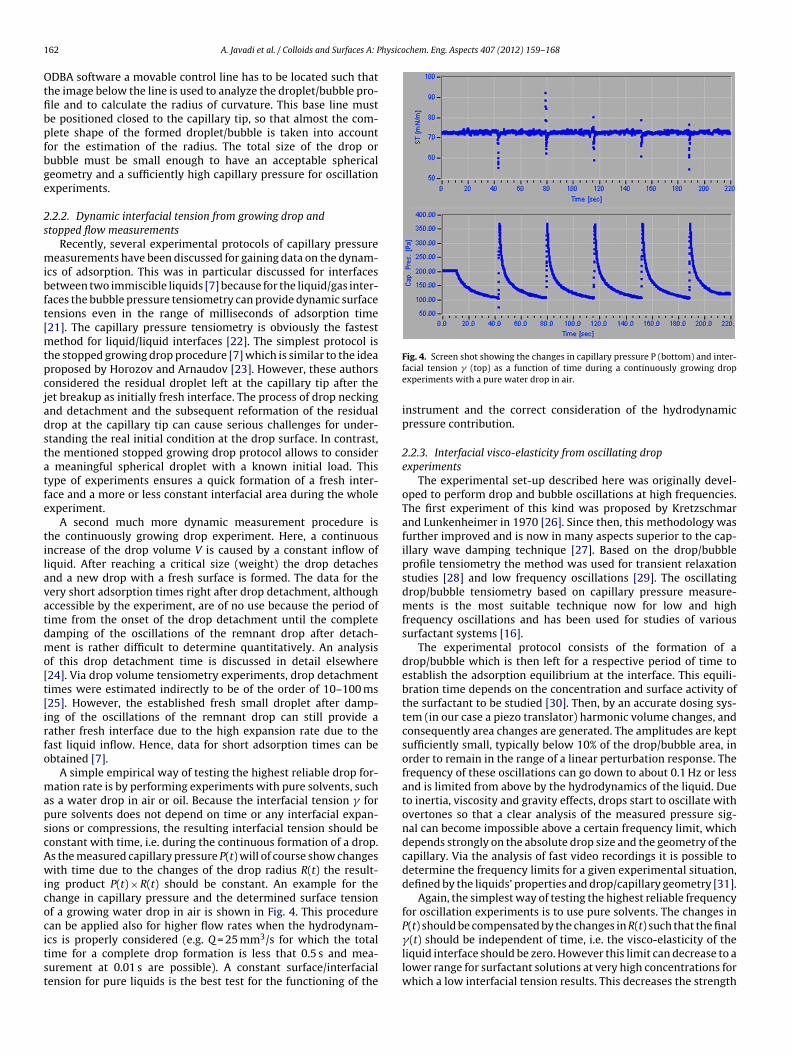
1 hysicochem. Eng. Aspects 407 (2012) 159– 168
Otfibpfbge
2s
mibft[mtpcjadstatfe
tilavatdmo[t[irfo
mapscAwicocitst
62 A. Javadi et al. / Colloids and Surfaces A: P
DBA software a movable control line has to be located such thathe image below the line is used to analyze the droplet/bubble pro-le and to calculate the radius of curvature. This base line muste positioned closed to the capillary tip, so that almost the com-lete shape of the formed droplet/bubble is taken into accountor the estimation of the radius. The total size of the drop orubble must be small enough to have an acceptable sphericaleometry and a sufficiently high capillary pressure for oscillationxperiments.
.2.2. Dynamic interfacial tension from growing drop andtopped flow measurements
Recently, several experimental protocols of capillary pressureeasurements have been discussed for gaining data on the dynam-
cs of adsorption. This was in particular discussed for interfacesetween two immiscible liquids [7] because for the liquid/gas inter-aces the bubble pressure tensiometry can provide dynamic surfaceensions even in the range of milliseconds of adsorption time21]. The capillary pressure tensiometry is obviously the fastest
ethod for liquid/liquid interfaces [22]. The simplest protocol ishe stopped growing drop procedure [7] which is similar to the idearoposed by Horozov and Arnaudov [23]. However, these authorsonsidered the residual droplet left at the capillary tip after theet breakup as initially fresh interface. The process of drop neckingnd detachment and the subsequent reformation of the residualrop at the capillary tip can cause serious challenges for under-tanding the real initial condition at the drop surface. In contrast,he mentioned stopped growing drop protocol allows to consider
meaningful spherical droplet with a known initial load. Thisype of experiments ensures a quick formation of a fresh inter-ace and a more or less constant interfacial area during the wholexperiment.
A second much more dynamic measurement procedure ishe continuously growing drop experiment. Here, a continuousncrease of the drop volume V is caused by a constant inflow ofiquid. After reaching a critical size (weight) the drop detachesnd a new drop with a fresh surface is formed. The data for theery short adsorption times right after drop detachment, althoughccessible by the experiment, are of no use because the period ofime from the onset of the drop detachment until the completeamping of the oscillations of the remnant drop after detach-ent is rather difficult to determine quantitatively. An analysis
f this drop detachment time is discussed in detail elsewhere24]. Via drop volume tensiometry experiments, drop detachmentimes were estimated indirectly to be of the order of 10–100 ms25]. However, the established fresh small droplet after damp-ng of the oscillations of the remnant drop can still provide aather fresh interface due to the high expansion rate due to theast liquid inflow. Hence, data for short adsorption times can bebtained [7].
A simple empirical way of testing the highest reliable drop for-ation rate is by performing experiments with pure solvents, such
s a water drop in air or oil. Because the interfacial tension forure solvents does not depend on time or any interfacial expan-ions or compressions, the resulting interfacial tension should beonstant with time, i.e. during the continuous formation of a drop.s the measured capillary pressure P(t) will of course show changesith time due to the changes of the drop radius R(t) the result-
ng product P(t) × R(t) should be constant. An example for thehange in capillary pressure and the determined surface tensionf a growing water drop in air is shown in Fig. 4. This procedurean be applied also for higher flow rates when the hydrodynam-
cs is properly considered (e.g. Q = 25 mm3/s for which the totalime for a complete drop formation is less that 0.5 s and mea-urement at 0.01 s are possible). A constant surface/interfacialension for pure liquids is the best test for the functioning of theFig. 4. Screen shot showing the changes in capillary pressure P (bottom) and inter-facial tension (top) as a function of time during a continuously growing dropexperiments with a pure water drop in air.
instrument and the correct consideration of the hydrodynamicpressure contribution.
2.2.3. Interfacial visco-elasticity from oscillating dropexperiments
The experimental set-up described here was originally devel-oped to perform drop and bubble oscillations at high frequencies.The first experiment of this kind was proposed by Kretzschmarand Lunkenheimer in 1970 [26]. Since then, this methodology wasfurther improved and is now in many aspects superior to the cap-illary wave damping technique [27]. Based on the drop/bubbleprofile tensiometry the method was used for transient relaxationstudies [28] and low frequency oscillations [29]. The oscillatingdrop/bubble tensiometry based on capillary pressure measure-ments is the most suitable technique now for low and highfrequency oscillations and has been used for studies of varioussurfactant systems [16].
The experimental protocol consists of the formation of adrop/bubble which is then left for a respective period of time toestablish the adsorption equilibrium at the interface. This equili-bration time depends on the concentration and surface activity ofthe surfactant to be studied [30]. Then, by an accurate dosing sys-tem (in our case a piezo translator) harmonic volume changes, andconsequently area changes are generated. The amplitudes are keptsufficiently small, typically below 10% of the drop/bubble area, inorder to remain in the range of a linear perturbation response. Thefrequency of these oscillations can go down to about 0.1 Hz or lessand is limited from above by the hydrodynamics of the liquid. Dueto inertia, viscosity and gravity effects, drops start to oscillate withovertones so that a clear analysis of the measured pressure sig-nal can become impossible above a certain frequency limit, whichdepends strongly on the absolute drop size and the geometry of thecapillary. Via the analysis of fast video recordings it is possible todetermine the frequency limits for a given experimental situation,defined by the liquids’ properties and drop/capillary geometry [31].
Again, the simplest way of testing the highest reliable frequencyfor oscillation experiments is to use pure solvents. The changes inP(t) should be compensated by the changes in R(t) such that the final
(t) should be independent of time, i.e. the visco-elasticity of theliquid interface should be zero. However this limit can decrease to alower range for surfactant solutions at very high concentrations forwhich a low interfacial tension results. This decreases the strength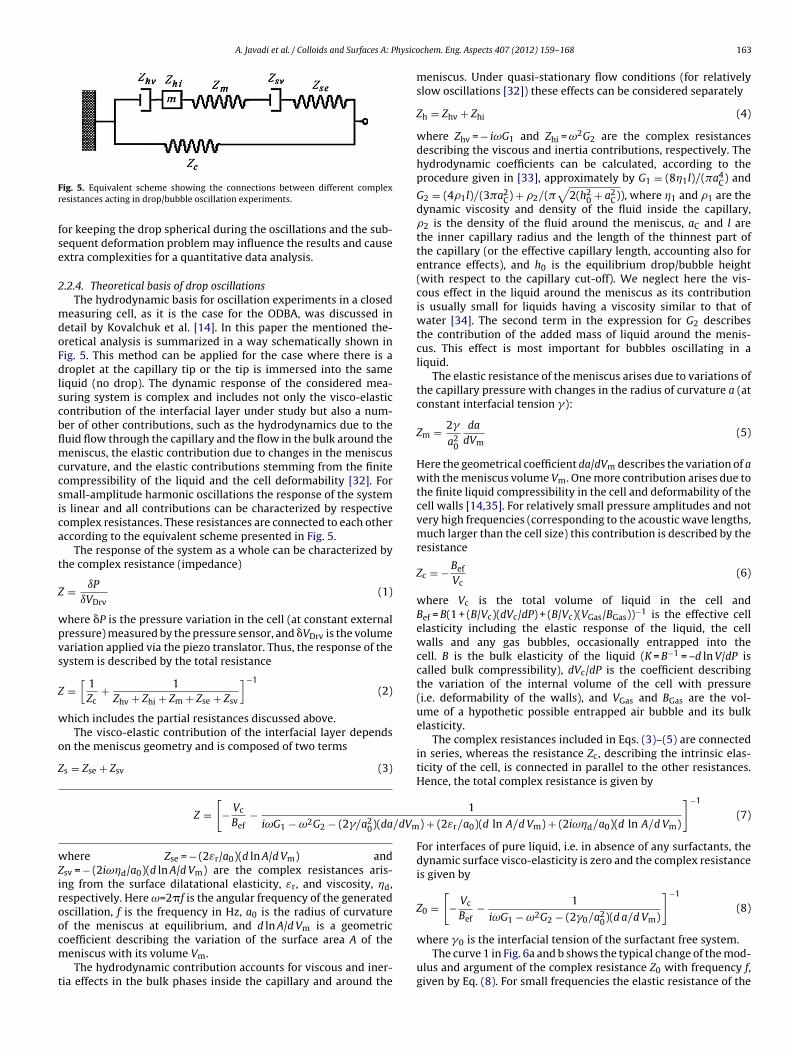
A. Javadi et al. / Colloids and Surfaces A: Physico
Fr
fse
2
mdoFdlscbflmccsica
t
Z
wpvs
Z
w
o
Z
wZiroocm
t
/dVm
ig. 5. Equivalent scheme showing the connections between different complexesistances acting in drop/bubble oscillation experiments.
or keeping the drop spherical during the oscillations and the sub-equent deformation problem may influence the results and causextra complexities for a quantitative data analysis.
.2.4. Theoretical basis of drop oscillationsThe hydrodynamic basis for oscillation experiments in a closed
easuring cell, as it is the case for the ODBA, was discussed inetail by Kovalchuk et al. [14]. In this paper the mentioned the-retical analysis is summarized in a way schematically shown inig. 5. This method can be applied for the case where there is aroplet at the capillary tip or the tip is immersed into the same
iquid (no drop). The dynamic response of the considered mea-uring system is complex and includes not only the visco-elasticontribution of the interfacial layer under study but also a num-er of other contributions, such as the hydrodynamics due to theuid flow through the capillary and the flow in the bulk around theeniscus, the elastic contribution due to changes in the meniscus
urvature, and the elastic contributions stemming from the finiteompressibility of the liquid and the cell deformability [32]. Formall-amplitude harmonic oscillations the response of the systems linear and all contributions can be characterized by respectiveomplex resistances. These resistances are connected to each otherccording to the equivalent scheme presented in Fig. 5.
The response of the system as a whole can be characterized byhe complex resistance (impedance)
= ıP
ıVDrv(1)
here P is the pressure variation in the cell (at constant externalressure) measured by the pressure sensor, and VDrv is the volumeariation applied via the piezo translator. Thus, the response of theystem is described by the total resistance
=[
1Zc
+ 1Zhv + Zhi + Zm + Zse + Zsv
]−1(2)
hich includes the partial resistances discussed above.The visco-elastic contribution of the interfacial layer depends
n the meniscus geometry and is composed of two terms
s = Zse + Zsv (3)
here Zse = − (2εr/a0)(d ln A/d Vm) andsv = − (2iωd/a0)(d ln A/d Vm) are the complex resistances aris-ng from the surface dilatational elasticity, εr, and viscosity, d,espectively. Here ω=2f is the angular frequency of the generatedscillation, f is the frequency in Hz, a0 is the radius of curvaturef the meniscus at equilibrium, and d ln A/d Vm is a geometric
Z =[− Vc
Bef−
iωG1 − ω2G2 − (2/a20)(da
oefficient describing the variation of the surface area A of theeniscus with its volume Vm.The hydrodynamic contribution accounts for viscous and iner-
ia effects in the bulk phases inside the capillary and around the
chem. Eng. Aspects 407 (2012) 159– 168 163
meniscus. Under quasi-stationary flow conditions (for relativelyslow oscillations [32]) these effects can be considered separately
Zh = Zhv + Zhi (4)
where Zhv = − iωG1 and Zhi = ω2G2 are the complex resistancesdescribing the viscous and inertia contributions, respectively. Thehydrodynamic coefficients can be calculated, according to theprocedure given in [33], approximately by G1 = (81l)/(a4
C) and
G2 = (41l)/(3a2C) + 2/(
√2(h2
0 + a2C)), where 1 and 1 are the
dynamic viscosity and density of the fluid inside the capillary,2 is the density of the fluid around the meniscus, aC and l arethe inner capillary radius and the length of the thinnest part ofthe capillary (or the effective capillary length, accounting also forentrance effects), and h0 is the equilibrium drop/bubble height(with respect to the capillary cut-off). We neglect here the vis-cous effect in the liquid around the meniscus as its contributionis usually small for liquids having a viscosity similar to that ofwater [34]. The second term in the expression for G2 describesthe contribution of the added mass of liquid around the menis-cus. This effect is most important for bubbles oscillating in aliquid.
The elastic resistance of the meniscus arises due to variations ofthe capillary pressure with changes in the radius of curvature a (atconstant interfacial tension ):
Zm = 2
a20
da
dVm(5)
Here the geometrical coefficient da/dVm describes the variation of awith the meniscus volume Vm. One more contribution arises due tothe finite liquid compressibility in the cell and deformability of thecell walls [14,35]. For relatively small pressure amplitudes and notvery high frequencies (corresponding to the acoustic wave lengths,much larger than the cell size) this contribution is described by theresistance
Zc = −Bef
Vc(6)
where Vc is the total volume of liquid in the cell andBef = B(1 + (B/Vc)(dVc/dP) + (B/Vc)(VGas/BGas))−1 is the effective cellelasticity including the elastic response of the liquid, the cellwalls and any gas bubbles, occasionally entrapped into thecell. B is the bulk elasticity of the liquid (K = B−1 = –d ln V/dP iscalled bulk compressibility), dVc/dP is the coefficient describingthe variation of the internal volume of the cell with pressure(i.e. deformability of the walls), and VGas and BGas are the vol-ume of a hypothetic possible entrapped air bubble and its bulkelasticity.
The complex resistances included in Eqs. (3)–(5) are connectedin series, whereas the resistance Zc, describing the intrinsic elas-ticity of the cell, is connected in parallel to the other resistances.Hence, the total complex resistance is given by
1
) + (2εr/a0)(d ln A/d Vm) + (2iωd/a0)(d ln A/d Vm)
]−1
(7)
For interfaces of pure liquid, i.e. in absence of any surfactants, thedynamic surface visco-elasticity is zero and the complex resistanceis given by
Z0 =[− Vc
Bef− 1
iωG1 − ω2G2 − (20/a20)(d a/d Vm)
]−1
(8)
where 0 is the interfacial tension of the surfactant free system.The curve 1 in Fig. 6a and b shows the typical change of the mod-
ulus and argument of the complex resistance Z0 with frequency f,given by Eq. (8). For small frequencies the elastic resistance of the
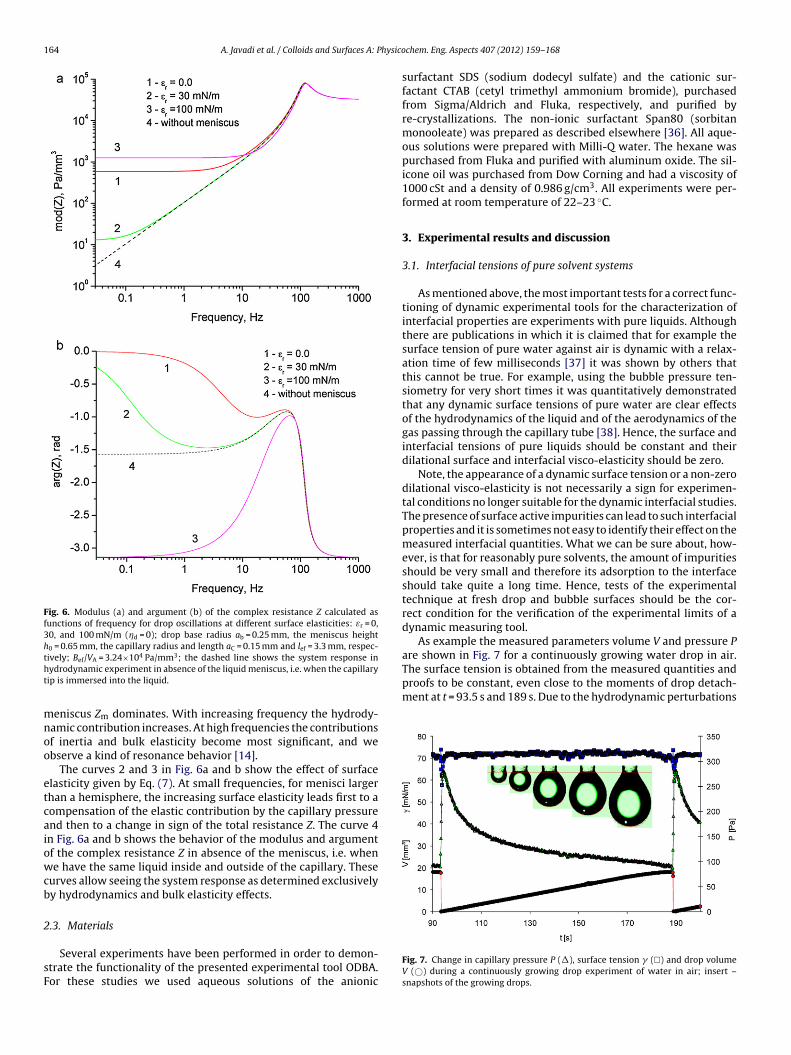
164 A. Javadi et al. / Colloids and Surfaces A: Physico
Fig. 6. Modulus (a) and argument (b) of the complex resistance Z calculated asfunctions of frequency for drop oscillations at different surface elasticities: εr = 0,30, and 100 mN/m (d = 0); drop base radius ab = 0.25 mm, the meniscus heighth0 = 0.65 mm, the capillary radius and length aC = 0.15 mm and lef = 3.3 mm, respec-t 4 3
ht
mnoo
etcaiowcb
2
sF
The surface tension is obtained from the measured quantities andproofs to be constant, even close to the moments of drop detach-ment at t = 93.5 s and 189 s. Due to the hydrodynamic perturbations
ively; Bef/VA = 3.24×10 Pa/mm ; the dashed line shows the system response inydrodynamic experiment in absence of the liquid meniscus, i.e. when the capillaryip is immersed into the liquid.
eniscus Zm dominates. With increasing frequency the hydrody-amic contribution increases. At high frequencies the contributionsf inertia and bulk elasticity become most significant, and webserve a kind of resonance behavior [14].
The curves 2 and 3 in Fig. 6a and b show the effect of surfacelasticity given by Eq. (7). At small frequencies, for menisci largerhan a hemisphere, the increasing surface elasticity leads first to aompensation of the elastic contribution by the capillary pressurend then to a change in sign of the total resistance Z. The curve 4n Fig. 6a and b shows the behavior of the modulus and argumentf the complex resistance Z in absence of the meniscus, i.e. whene have the same liquid inside and outside of the capillary. These
urves allow seeing the system response as determined exclusivelyy hydrodynamics and bulk elasticity effects.
.3. Materials
Several experiments have been performed in order to demon-trate the functionality of the presented experimental tool ODBA.or these studies we used aqueous solutions of the anionic
chem. Eng. Aspects 407 (2012) 159– 168
surfactant SDS (sodium dodecyl sulfate) and the cationic sur-factant CTAB (cetyl trimethyl ammonium bromide), purchasedfrom Sigma/Aldrich and Fluka, respectively, and purified byre-crystallizations. The non-ionic surfactant Span80 (sorbitanmonooleate) was prepared as described elsewhere [36]. All aque-ous solutions were prepared with Milli-Q water. The hexane waspurchased from Fluka and purified with aluminum oxide. The sil-icone oil was purchased from Dow Corning and had a viscosity of1000 cSt and a density of 0.986 g/cm3. All experiments were per-formed at room temperature of 22–23 C.
3. Experimental results and discussion
3.1. Interfacial tensions of pure solvent systems
As mentioned above, the most important tests for a correct func-tioning of dynamic experimental tools for the characterization ofinterfacial properties are experiments with pure liquids. Althoughthere are publications in which it is claimed that for example thesurface tension of pure water against air is dynamic with a relax-ation time of few milliseconds [37] it was shown by others thatthis cannot be true. For example, using the bubble pressure ten-siometry for very short times it was quantitatively demonstratedthat any dynamic surface tensions of pure water are clear effectsof the hydrodynamics of the liquid and of the aerodynamics of thegas passing through the capillary tube [38]. Hence, the surface andinterfacial tensions of pure liquids should be constant and theirdilational surface and interfacial visco-elasticity should be zero.
Note, the appearance of a dynamic surface tension or a non-zerodilational visco-elasticity is not necessarily a sign for experimen-tal conditions no longer suitable for the dynamic interfacial studies.The presence of surface active impurities can lead to such interfacialproperties and it is sometimes not easy to identify their effect on themeasured interfacial quantities. What we can be sure about, how-ever, is that for reasonably pure solvents, the amount of impuritiesshould be very small and therefore its adsorption to the interfaceshould take quite a long time. Hence, tests of the experimentaltechnique at fresh drop and bubble surfaces should be the cor-rect condition for the verification of the experimental limits of adynamic measuring tool.
As example the measured parameters volume V and pressure Pare shown in Fig. 7 for a continuously growing water drop in air.
Fig. 7. Change in capillary pressure P (), surface tension () and drop volumeV (©) during a continuously growing drop experiment of water in air; insert –snapshots of the growing drops.
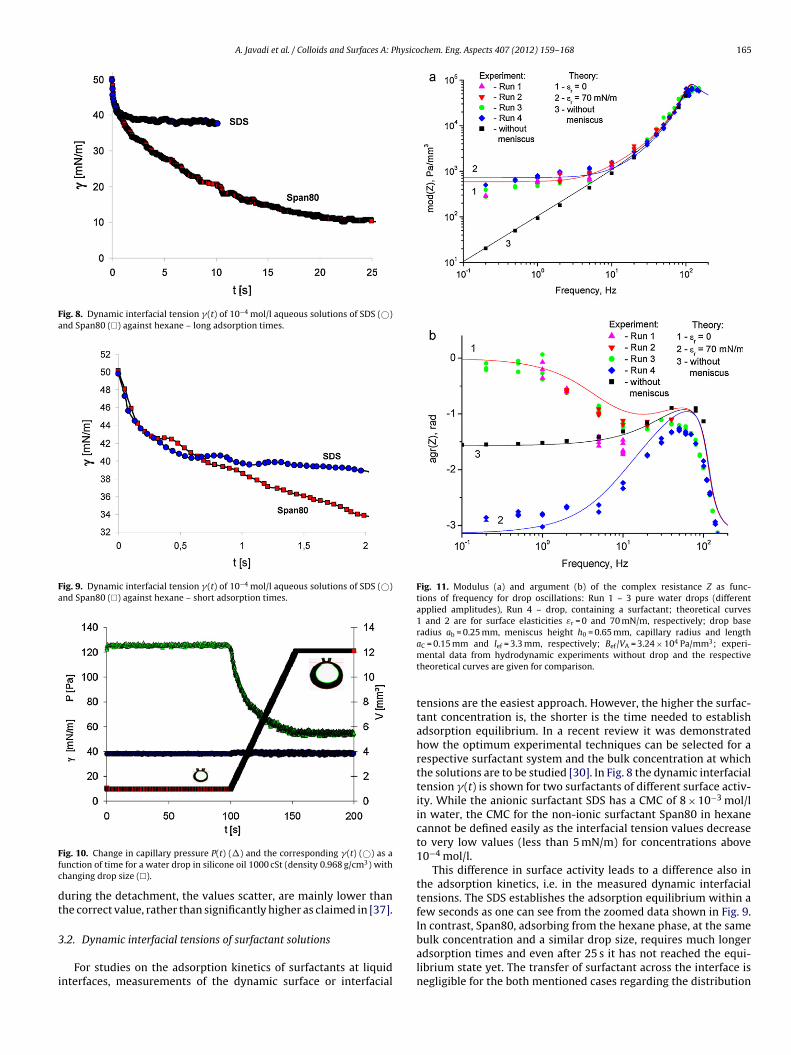
A. Javadi et al. / Colloids and Surfaces A: Physicochem. Eng. Aspects 407 (2012) 159– 168 165
Fig. 8. Dynamic interfacial tension (t) of 10−4 mol/l aqueous solutions of SDS (©)and Span80 () against hexane – long adsorption times.
Fig. 9. Dynamic interfacial tension (t) of 10−4 mol/l aqueous solutions of SDS (©)and Span80 () against hexane – short adsorption times.
Ffc
dt
3
i
Fig. 11. Modulus (a) and argument (b) of the complex resistance Z as func-tions of frequency for drop oscillations: Run 1 – 3 pure water drops (differentapplied amplitudes), Run 4 – drop, containing a surfactant; theoretical curves1 and 2 are for surface elasticities εr = 0 and 70 mN/m, respectively; drop baseradius ab = 0.25 mm, meniscus height h0 = 0.65 mm, capillary radius and lengtha = 0.15 mm and l = 3.3 mm, respectively; B /V = 3.24 × 10⁴ Pa/mm3; experi-
ig. 10. Change in capillary pressure P(t) () and the corresponding (t) (©) as aunction of time for a water drop in silicone oil 1000 cSt (density 0.968 g/cm3) withhanging drop size ().
uring the detachment, the values scatter, are mainly lower thanhe correct value, rather than significantly higher as claimed in [37].
.2. Dynamic interfacial tensions of surfactant solutions
For studies on the adsorption kinetics of surfactants at liquidnterfaces, measurements of the dynamic surface or interfacial
C ef ef A
mental data from hydrodynamic experiments without drop and the respectivetheoretical curves are given for comparison.
tensions are the easiest approach. However, the higher the surfac-tant concentration is, the shorter is the time needed to establishadsorption equilibrium. In a recent review it was demonstratedhow the optimum experimental techniques can be selected for arespective surfactant system and the bulk concentration at whichthe solutions are to be studied [30]. In Fig. 8 the dynamic interfacialtension (t) is shown for two surfactants of different surface activ-ity. While the anionic surfactant SDS has a CMC of 8 × 10⁻³ mol/lin water, the CMC for the non-ionic surfactant Span80 in hexanecannot be defined easily as the interfacial tension values decreaseto very low values (less than 5 mN/m) for concentrations above10−4 mol/l.
This difference in surface activity leads to a difference also inthe adsorption kinetics, i.e. in the measured dynamic interfacialtensions. The SDS establishes the adsorption equilibrium within afew seconds as one can see from the zoomed data shown in Fig. 9.In contrast, Span80, adsorbing from the hexane phase, at the same
bulk concentration and a similar drop size, requires much longeradsorption times and even after 25 s it has not reached the equi-librium state yet. The transfer of surfactant across the interface isnegligible for the both mentioned cases regarding the distribution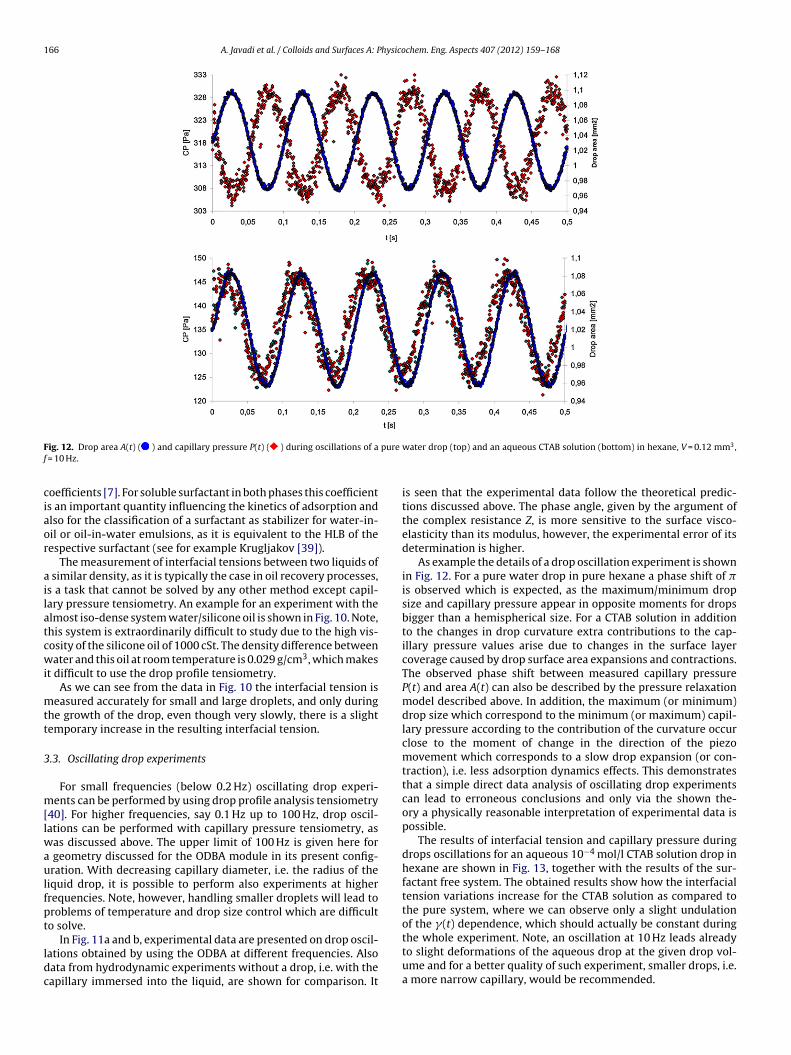
166 A. Javadi et al. / Colloids and Surfaces A: Physicochem. Eng. Aspects 407 (2012) 159– 168
F pure
f
ciaor
ailatcwi
mtt
3
m[lwaulfpt
ldc
ig. 12. Drop area A(t) ( ) and capillary pressure P(t) ( ) during oscillations of a = 10 Hz.
oefficients [7]. For soluble surfactant in both phases this coefficients an important quantity influencing the kinetics of adsorption andlso for the classification of a surfactant as stabilizer for water-in-il or oil-in-water emulsions, as it is equivalent to the HLB of theespective surfactant (see for example Krugljakov [39]).
The measurement of interfacial tensions between two liquids of similar density, as it is typically the case in oil recovery processes,s a task that cannot be solved by any other method except capil-ary pressure tensiometry. An example for an experiment with thelmost iso-dense system water/silicone oil is shown in Fig. 10. Note,his system is extraordinarily difficult to study due to the high vis-osity of the silicone oil of 1000 cSt. The density difference betweenater and this oil at room temperature is 0.029 g/cm3, which makes
t difficult to use the drop profile tensiometry.As we can see from the data in Fig. 10 the interfacial tension is
easured accurately for small and large droplets, and only duringhe growth of the drop, even though very slowly, there is a slightemporary increase in the resulting interfacial tension.
.3. Oscillating drop experiments
For small frequencies (below 0.2 Hz) oscillating drop experi-ents can be performed by using drop profile analysis tensiometry
40]. For higher frequencies, say 0.1 Hz up to 100 Hz, drop oscil-ations can be performed with capillary pressure tensiometry, as
as discussed above. The upper limit of 100 Hz is given here for geometry discussed for the ODBA module in its present config-ration. With decreasing capillary diameter, i.e. the radius of the
iquid drop, it is possible to perform also experiments at higherrequencies. Note, however, handling smaller droplets will lead toroblems of temperature and drop size control which are difficulto solve.
In Fig. 11a and b, experimental data are presented on drop oscil-ations obtained by using the ODBA at different frequencies. Alsoata from hydrodynamic experiments without a drop, i.e. with theapillary immersed into the liquid, are shown for comparison. It
water drop (top) and an aqueous CTAB solution (bottom) in hexane, V = 0.12 mm3,
is seen that the experimental data follow the theoretical predic-tions discussed above. The phase angle, given by the argument ofthe complex resistance Z, is more sensitive to the surface visco-elasticity than its modulus, however, the experimental error of itsdetermination is higher.
As example the details of a drop oscillation experiment is shownin Fig. 12. For a pure water drop in pure hexane a phase shift of is observed which is expected, as the maximum/minimum dropsize and capillary pressure appear in opposite moments for dropsbigger than a hemispherical size. For a CTAB solution in additionto the changes in drop curvature extra contributions to the cap-illary pressure values arise due to changes in the surface layercoverage caused by drop surface area expansions and contractions.The observed phase shift between measured capillary pressureP(t) and area A(t) can also be described by the pressure relaxationmodel described above. In addition, the maximum (or minimum)drop size which correspond to the minimum (or maximum) capil-lary pressure according to the contribution of the curvature occurclose to the moment of change in the direction of the piezomovement which corresponds to a slow drop expansion (or con-traction), i.e. less adsorption dynamics effects. This demonstratesthat a simple direct data analysis of oscillating drop experimentscan lead to erroneous conclusions and only via the shown the-ory a physically reasonable interpretation of experimental data ispossible.
The results of interfacial tension and capillary pressure duringdrops oscillations for an aqueous 10−4 mol/l CTAB solution drop inhexane are shown in Fig. 13, together with the results of the sur-factant free system. The obtained results show how the interfacialtension variations increase for the CTAB solution as compared tothe pure system, where we can observe only a slight undulationof the (t) dependence, which should actually be constant during
the whole experiment. Note, an oscillation at 10 Hz leads alreadyto slight deformations of the aqueous drop at the given drop vol-ume and for a better quality of such experiment, smaller drops, i.e.a more narrow capillary, would be recommended.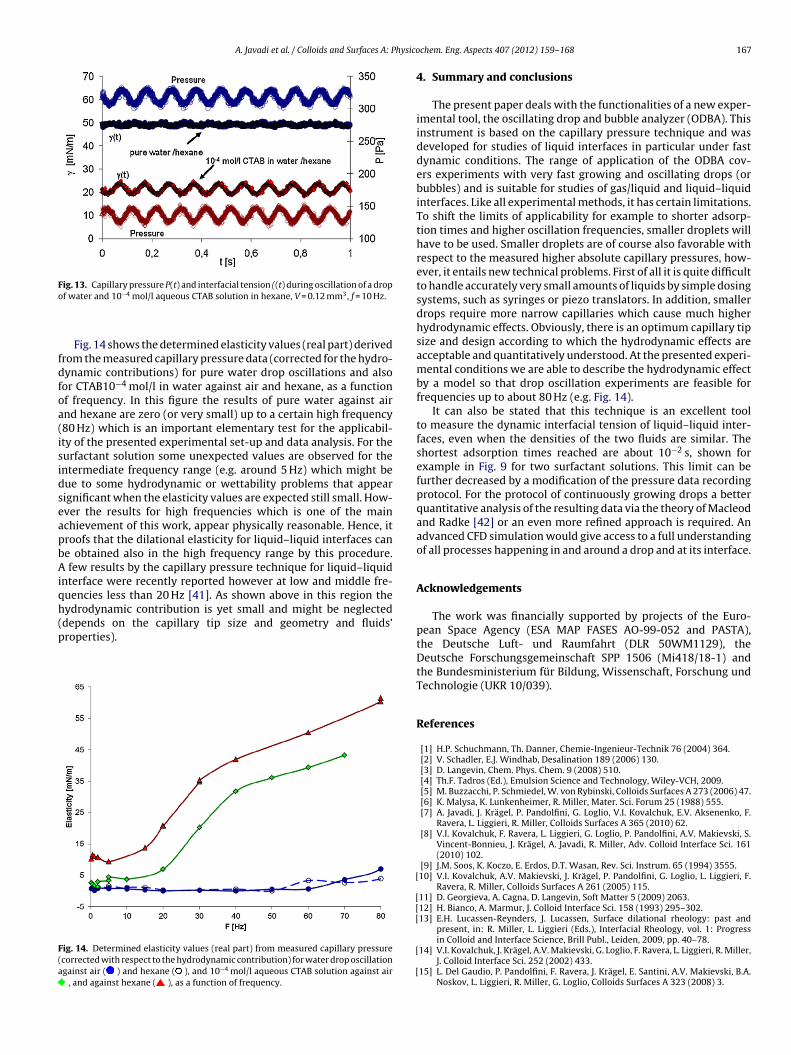
A. Javadi et al. / Colloids and Surfaces A: Physico
Fig. 13. Capillary pressure P(t) and interfacial tension ((t) during oscillation of a dropo
fdfoa(isidseapbAiqh(p
F(a
f water and 10−4 mol/l aqueous CTAB solution in hexane, V = 0.12 mm3, f = 10 Hz.
Fig. 14 shows the determined elasticity values (real part) derivedrom the measured capillary pressure data (corrected for the hydro-ynamic contributions) for pure water drop oscillations and alsoor CTAB10−4 mol/l in water against air and hexane, as a functionf frequency. In this figure the results of pure water against airnd hexane are zero (or very small) up to a certain high frequency80 Hz) which is an important elementary test for the applicabil-ty of the presented experimental set-up and data analysis. For theurfactant solution some unexpected values are observed for thentermediate frequency range (e.g. around 5 Hz) which might beue to some hydrodynamic or wettability problems that appearignificant when the elasticity values are expected still small. How-ver the results for high frequencies which is one of the mainchievement of this work, appear physically reasonable. Hence, itroofs that the dilational elasticity for liquid–liquid interfaces cane obtained also in the high frequency range by this procedure.
few results by the capillary pressure technique for liquid–liquidnterface were recently reported however at low and middle fre-uencies less than 20 Hz [41]. As shown above in this region theydrodynamic contribution is yet small and might be neglecteddepends on the capillary tip size and geometry and fluids’
roperties).ig. 14. Determined elasticity values (real part) from measured capillary pressurecorrected with respect to the hydrodynamic contribution) for water drop oscillationgainst air ( ) and hexane ( ), and 10−4 mol/l aqueous CTAB solution against air
, and against hexane ( ), as a function of frequency.
[
[[[
[
[
chem. Eng. Aspects 407 (2012) 159– 168 167
4. Summary and conclusions
The present paper deals with the functionalities of a new exper-imental tool, the oscillating drop and bubble analyzer (ODBA). Thisinstrument is based on the capillary pressure technique and wasdeveloped for studies of liquid interfaces in particular under fastdynamic conditions. The range of application of the ODBA cov-ers experiments with very fast growing and oscillating drops (orbubbles) and is suitable for studies of gas/liquid and liquid–liquidinterfaces. Like all experimental methods, it has certain limitations.To shift the limits of applicability for example to shorter adsorp-tion times and higher oscillation frequencies, smaller droplets willhave to be used. Smaller droplets are of course also favorable withrespect to the measured higher absolute capillary pressures, how-ever, it entails new technical problems. First of all it is quite difficultto handle accurately very small amounts of liquids by simple dosingsystems, such as syringes or piezo translators. In addition, smallerdrops require more narrow capillaries which cause much higherhydrodynamic effects. Obviously, there is an optimum capillary tipsize and design according to which the hydrodynamic effects areacceptable and quantitatively understood. At the presented experi-mental conditions we are able to describe the hydrodynamic effectby a model so that drop oscillation experiments are feasible forfrequencies up to about 80 Hz (e.g. Fig. 14).
It can also be stated that this technique is an excellent toolto measure the dynamic interfacial tension of liquid–liquid inter-faces, even when the densities of the two fluids are similar. Theshortest adsorption times reached are about 10−2 s, shown forexample in Fig. 9 for two surfactant solutions. This limit can befurther decreased by a modification of the pressure data recordingprotocol. For the protocol of continuously growing drops a betterquantitative analysis of the resulting data via the theory of Macleodand Radke [42] or an even more refined approach is required. Anadvanced CFD simulation would give access to a full understandingof all processes happening in and around a drop and at its interface.
Acknowledgements
The work was financially supported by projects of the Euro-pean Space Agency (ESA MAP FASES AO-99-052 and PASTA),the Deutsche Luft- und Raumfahrt (DLR 50WM1129), theDeutsche Forschungsgemeinschaft SPP 1506 (Mi418/18-1) andthe Bundesministerium für Bildung, Wissenschaft, Forschung undTechnologie (UKR 10/039).
References
[1] H.P. Schuchmann, Th. Danner, Chemie-Ingenieur-Technik 76 (2004) 364.[2] V. Schadler, E.J. Windhab, Desalination 189 (2006) 130.[3] D. Langevin, Chem. Phys. Chem. 9 (2008) 510.[4] Th.F. Tadros (Ed.), Emulsion Science and Technology, Wiley-VCH, 2009.[5] M. Buzzacchi, P. Schmiedel, W. von Rybinski, Colloids Surfaces A 273 (2006) 47.[6] K. Malysa, K. Lunkenheimer, R. Miller, Mater. Sci. Forum 25 (1988) 555.[7] A. Javadi, J. Krägel, P. Pandolfini, G. Loglio, V.I. Kovalchuk, E.V. Aksenenko, F.
Ravera, L. Liggieri, R. Miller, Colloids Surfaces A 365 (2010) 62.[8] V.I. Kovalchuk, F. Ravera, L. Liggieri, G. Loglio, P. Pandolfini, A.V. Makievski, S.
Vincent-Bonnieu, J. Krägel, A. Javadi, R. Miller, Adv. Colloid Interface Sci. 161(2010) 102.
[9] J.M. Soos, K. Koczo, E. Erdos, D.T. Wasan, Rev. Sci. Instrum. 65 (1994) 3555.10] V.I. Kovalchuk, A.V. Makievski, J. Krägel, P. Pandolfini, G. Loglio, L. Liggieri, F.
Ravera, R. Miller, Colloids Surfaces A 261 (2005) 115.11] D. Georgieva, A. Cagna, D. Langevin, Soft Matter 5 (2009) 2063.12] H. Bianco, A. Marmur, J. Colloid Interface Sci. 158 (1993) 295–302.13] E.H. Lucassen-Reynders, J. Lucassen, Surface dilational rheology: past and
present, in: R. Miller, L. Liggieri (Eds.), Interfacial Rheology, vol. 1: Progress
in Colloid and Interface Science, Brill Publ., Leiden, 2009, pp. 40–78.14] V.I. Kovalchuk, J. Krägel, A.V. Makievski, G. Loglio, F. Ravera, L. Liggieri, R. Miller,J. Colloid Interface Sci. 252 (2002) 433.
15] L. Del Gaudio, P. Pandolfini, F. Ravera, J. Krägel, E. Santini, A.V. Makievski, B.A.Noskov, L. Liggieri, R. Miller, G. Loglio, Colloids Surfaces A 323 (2008) 3.
1 hysico
[
[
[[
[
[[
[[
[[[[
[
[
[
[
[
[
[
[
[[
[
68 A. Javadi et al. / Colloids and Surfaces A: P
16] F. Ravera, G. Loglio, P. Pandolfini, E. Santini, L. Liggieri, Colloids Surfaces A 365(2010) 2.
17] S.C. Russev, N. Alexandrov, K.G. Marinova, K.D. Danov, N.D. Denkov, L. Lyutov,V. Vulchev, C. Bilke-Krause, Rev. Sci. Instrum. 79 (2008) 104102–104111.
18] See more information at www.sinterface.com.19] Surfactants – chemistry, interfacial properties and application, in: V.B. Fainer-
man, D. Möbius, R. Miller (Eds.), in: Studies in Interface Science, vol. 13, Elsevier,2001.
20] S.A. Zholob, V.I. Kovalchuk, A.V. Makievski, J. Krägel, V.B. Fainerman, R. Miller,Determination of the dilational elasticity and viscosity from the surface tensionresponse to harmonic area perturbations, in: R. Miller, L. Liggieri (Eds.), Inter-facial Rheology, vol. 1: Progress in Colloid and Interface Science, Brill Publ.,Leiden, 2009, pp. 77–102.
21] V.B. Fainerman, A.V. Makievski, R. Miller, Rev. Sci. Instrum. 75 (2004) 213.22] V.I. Kovalchuk, F. Ravera, L. Liggieri, G. Loglio, A. Javadi, N.M. Kovalchuk, J. Krägel,
Studies in capillary pressure tensiometry and interfacial dilational rheology, in:R. Miller, L. Liggieri (Eds.), Bubble and Drop Interfaces, vol. 2: Progress in Colloidand Interface Science, Brill Publ., Leiden, 2011, p. 143.
23] T. Horozov, L. Arnaudov, J. Colloid Interface Sci. 222 (2000) 146.24] A. Javadi, M. Karbaschi, J. Krägel, N.M. Kovalchuk, E. Bonaccurso, L.Q. Chen,
R. Miller, Drop Pinch-Off quantified by a fast video technique and capillarypressure measurements, in preparation.
25] R. Miller, M. Bree, V.B. Fainerman, Colloids Surfaces A 142 (1998) 237.26] G. Kretzschmar, K. Lunkenheimer, Ber. Bunsenges. Phys. Chem. 74 (1970) 1064.
27] B.A. Noskov, Curr. Opin. Colloid Int. Sci. 15 (2010) 229.28] R. Miller, R. Sedev, K.-H. Schano, Ch. Ng, A.W. Neumann, Colloids Surfaces A 69(1993) 209.29] J. Benjamins, A. Cagna, E.H. Lucassen-Reynders, Colloids Surfaces A 114 (1996)
245.
[
[
[
chem. Eng. Aspects 407 (2012) 159– 168
30] N. Mucic, A. Javadi, N.M. Kovalchuk, R. Miller, Adv. Colloid Interface Sci. 168(2011) 167.
31] A. Javadi, M. Karbaschi, J Krägel, N.M. Kovalchuk, V.I. Kovalchuk, E. Bonaccurso,L.Q. Chen, R. Miller, Limits of harmonic drop oscillations quantified by a fastvideo technique, in preparation.
32] V.I. Kovalchuk, J. Krägel, E.V. Aksenenko, G. Loglio, L. Liggieri, Oscillating bubbleand drop techniques, in: D. Möbius, R. Miller (Eds.), Novel Methods to StudyInterfacial Layers, Studies in Interface Science, vol. 11, Elsevier, Amsterdam,2001, p. 485.
33] V.I. Kovalchuk, J. Krägel, A.V. Makievski, F. Ravera, L. Liggieri, G.Loglio, V.B. Fainerman, R. Miller, J. Colloid Interface Sci. 280 (2004)498.
34] N. Alexandrov, K.G. Marinova, K.D. Danov, I.B. Ivanov, J. Colloid Interface Sci.339 (2009) 545.
35] V.I. Kovalchuk, E.K. Zholkovskij, J. Krägel, R. Miller, V.B. Fainerman, R. Wüstneck,G. Loglio, S.S. Dukhin, J. Colloid Interface Sci. 224 (2000) 245.
36] V.B. Fainerman, A.V. Makievski, D. Vollhardt, S. Siegel, R. Miller, J. Phys. Chem.B 103 (1999) 330.
37] N.N. Kochurova, A.I. Rusanov, J. Colloid Interface Sci. 81 (1981) 297.38] V.B. Fainerman, V.D. Mys, A.V. Makievski, R. Miller, Langmuir 20 (2004)
1721.39] P.M. Kruglyakov, Hydrophile–lipophile balance of surfactants and solid parti-
cles: physicochemical aspects and applications, in: D. Möbius, R. Miller (Eds.),Studies in Interface Science, vol. 9, Elsevier, 2000.
40] M.E. Leser, S. Acquistapace, A. Cagna, A.V. Makievski, R. Miller, Colloids SurfacesA 261 (2005) 25.
41] E. Santini, L. Liggieri, L. Sacca, D. Clausse, F. Ravera, Colloids Surfaces A 309(2007) 270.
42] C.A. MacLeod, C.J. Radke, J. Colloid Interface Sci. 166 (1994) 73.

Paper VII Dynamic properties of CnTAB adsorption layers at the water/oil interface N. Mucic, N.M. Kovalchuk, V. Pradines, A. Javadi, E.V. Aksenenko, J. Krägel and R. Miller Colloids and Surfaces A, submitted 2012
Dynamic properties of CnTAB adsorption layers
at the water/oil interface
N. Mucic1*, N.M. Kovalchuk1,2, V. Pradines3, A. Javadi1, E.V. Aksenenko4, J. Krägel1 and R. Miller1
1 Max Planck Institute of Colloids and Interfaces, 14424 Potsdam/Golm, Germany 2 Institute of Bio‐Colloid Chemistry, 03142 Kiev, Ukraine
3Laboratoire de Chimie de Coordination, 31077 Toulouse cedex 04, France 4 Institute of Colloid Chemistry and Chemistry of Water, 252680 Kiev, Ukraine
Abstract
The dynamic interfacial tension and dilational rheology of alkyltrimethylammonium bromides
(CnTAB) solutions are studied for n = 10, 12, 14 and 16 using drop profile analysis and capillary
pressure tensiometry. The experimental data are analyzed on the basis of two theoretical models,
the Frumkin Ionic Compressibility and the Langmuir Compressibility models [1]. We show that even
the simplified Langmuir Compressibility model is able to adequately describe the dynamic properties
of the investigated ionic surfactants. Dynamic experiments point out the difficulties related to short
chain surfactants due to their very fast adsorption kinetics which cannot be studied with
conventional tensiometer setups.
Keywords: Dynamic interfacial tension, dilational rheology, drop profile analysis tensiometry,
capillary pressure tensiometry, cationic surfactants, alkyltrimethylammonium bromide,
thermodynamic models, water/hexane interface
*corresponding author: [email protected]
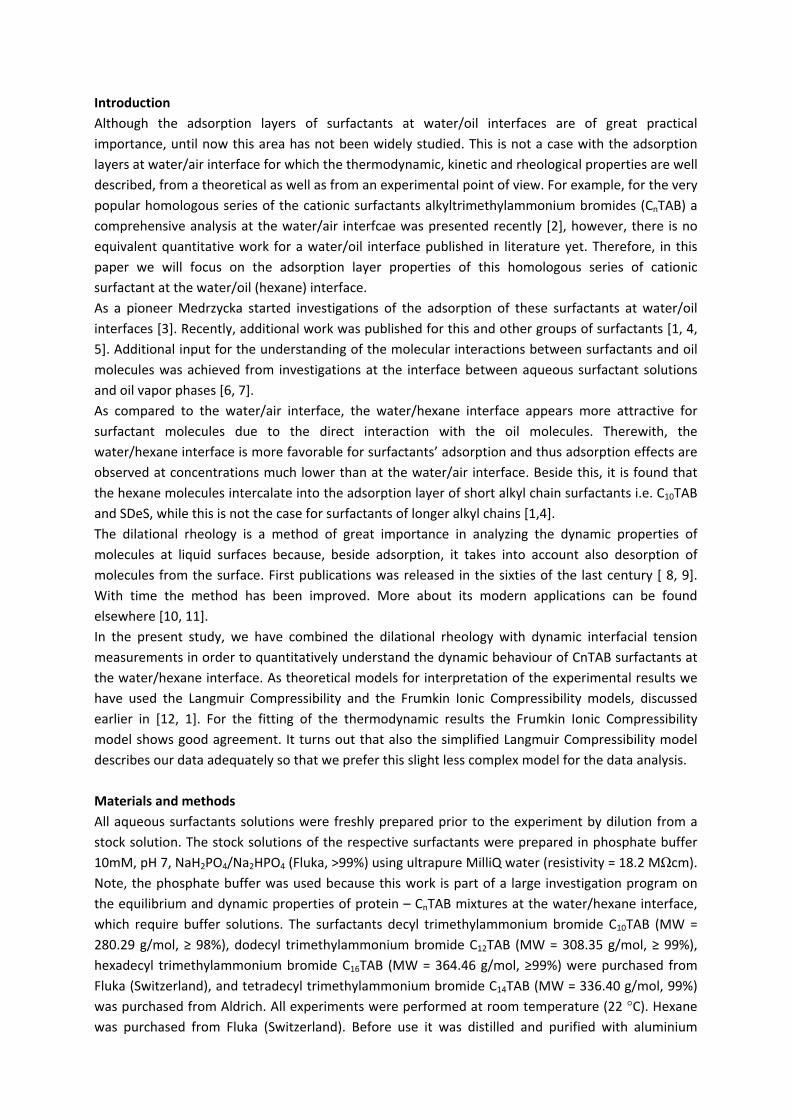
Introduction
Although the adsorption layers of surfactants at water/oil interfaces are of great practical
importance, until now this area has not been widely studied. This is not a case with the adsorption
layers at water/air interface for which the thermodynamic, kinetic and rheological properties are well
described, from a theoretical as well as from an experimental point of view. For example, for the very
popular homologous series of the cationic surfactants alkyltrimethylammonium bromides (CnTAB) a
comprehensive analysis at the water/air interfcae was presented recently [2], however, there is no
equivalent quantitative work for a water/oil interface published in literature yet. Therefore, in this
paper we will focus on the adsorption layer properties of this homologous series of cationic
surfactant at the water/oil (hexane) interface.
As a pioneer Medrzycka started investigations of the adsorption of these surfactants at water/oil
interfaces [3]. Recently, additional work was published for this and other groups of surfactants [1, 4,
5]. Additional input for the understanding of the molecular interactions between surfactants and oil
molecules was achieved from investigations at the interface between aqueous surfactant solutions
and oil vapor phases [6, 7].
As compared to the water/air interface, the water/hexane interface appears more attractive for
surfactant molecules due to the direct interaction with the oil molecules. Therewith, the
water/hexane interface is more favorable for surfactants’ adsorption and thus adsorption effects are
observed at concentrations much lower than at the water/air interface. Beside this, it is found that
the hexane molecules intercalate into the adsorption layer of short alkyl chain surfactants i.e. C10TAB
and SDeS, while this is not the case for surfactants of longer alkyl chains [1,4].
The dilational rheology is a method of great importance in analyzing the dynamic properties of
molecules at liquid surfaces because, beside adsorption, it takes into account also desorption of
molecules from the surface. First publications was released in the sixties of the last century [ 8, 9].
With time the method has been improved. More about its modern applications can be found
elsewhere [10, 11].
In the present study, we have combined the dilational rheology with dynamic interfacial tension
measurements in order to quantitatively understand the dynamic behaviour of CnTAB surfactants at
the water/hexane interface. As theoretical models for interpretation of the experimental results we
have used the Langmuir Compressibility and the Frumkin Ionic Compressibility models, discussed
earlier in [12, 1]. For the fitting of the thermodynamic results the Frumkin Ionic Compressibility
model shows good agreement. It turns out that also the simplified Langmuir Compressibility model
describes our data adequately so that we prefer this slight less complex model for the data analysis.
Materials and methods
All aqueous surfactants solutions were freshly prepared prior to the experiment by dilution from a
stock solution. The stock solutions of the respective surfactants were prepared in phosphate buffer
10mM, pH 7, NaH2PO4/Na2HPO4 (Fluka, >99%) using ultrapure MilliQ water (resistivity = 18.2 MΩcm).
Note, the phosphate buffer was used because this work is part of a large investigation program on
the equilibrium and dynamic properties of protein – CnTAB mixtures at the water/hexane interface,
which require buffer solutions. The surfactants decyl trimethylammonium bromide C10TAB (MW =
280.29 g/mol, ≥ 98%), dodecyl trimethylammonium bromide C12TAB (MW = 308.35 g/mol, ≥ 99%),
hexadecyl trimethylammonium bromide C16TAB (MW = 364.46 g/mol, ≥99%) were purchased from
Fluka (Switzerland), and tetradecyl trimethylammonium bromide C14TAB (MW = 336.40 g/mol, 99%)
was purchased from Aldrich. All experiments were performed at room temperature (22 °C). Hexane
was purchased from Fluka (Switzerland). Before use it was distilled and purified with aluminium
oxide and subsequently saturated with ultrapure MilliQ water. The interfacial tension of the pure
water/hexane interface (with both liquid phases mutually saturated) at room temperature was 51.1
mN/m.
The experimental setups used to obtain the adsorption kinetics of the surfactant solutions against
hexane were the drop Profile Analysis Tensiometer PAT‐1 and the Capillary Pressure Analyzer ODBA‐
1, both products of SINTERFACE Technologies, Berlin, Germany. The visco‐elasticity of the
corresponding adsorption layers was determined from the interfacial tension response to sinusoidal
drop area perturbations using PAT‐1 close to the equilibrium when the interfacial tension reach a
plateau (of the order of max. 104 s). The configuration of these experiments was a drop of aqueous
solution formed in a glass cuvette containing the pure hexane phase.
Theory
Theoretical description of adsorption kinetics is performed using the free software package
SphereSQ [13]. The software is based on the Fick’s equation and enables the direct simulations of
diffusion controlled adsorption kinetics on spherical interface between two liquid phases. It
implements several adsorption models, such as reorientation models and Frumkin models for ionic
and non‐ionic surfactants taking into account intrinsic compressibility of adsorption layer. The
detailed description of the calculation method is given elsewhere [14]. Isotherm parameters are
obtained from simultaneous fitting of measured dependence of equilibrium interfacial tension and
experimental data on surface rheology by means of free software package IsoFit [15].
One of the first adsorption models was proposed by Langmuir [16]. Although it was originally derived
to describe the gas adsorption at solid surfaces, the Langmuir model is also successfully applied to
the adsorption of surfactant molecules at liquid interfaces. This is at least acceptable when a semi‐
quantitative analysis is needed. However, we will focus our discussion here mostly on the Langmuir
model and compare it partially with its more general version, i.e. the Frumkin model. The Frumkin
model assumes additional intermolecular interactions in the adsorption layer.
The adsorption isotherm for the Langmuir model [17] reads:
bc
bct
1
)( (1)
and the corresponding von Szyszkowski‐Langmuir equation of state has the form:
bcRTRT
1ln1ln0 . (2)
Here γ0 is the interfacial tension in absence of surfactants, γ is the interfacial tension at the surfactant
bulk concentration c, Π is the surface pressure, R and T are gas law constant and absolute
temperature, respectively, Γ is the surface concentration, Γ∞ is the maximum adsorption, and b is the
adsorption constant with the dimension of a reciprocal concentration.
The adsorption behaviour of most non‐ionic and ionic surfactants is well described by the Frumkin
model, because it considers the additional lateral interactions between adsorbed surfactant
molecules at the interface. The adsorption isotherm and equation of state, respectively, of the
Frumkin Ionic Compressibility adsorption model was proposed by Pradines et al. for the analysis of
the equilibrium adsorption behaviour of CnTABs and is given as follows [1]:
afcccb 2exp
121
2
(3)
2
0
)1ln(2
RT
. (4)
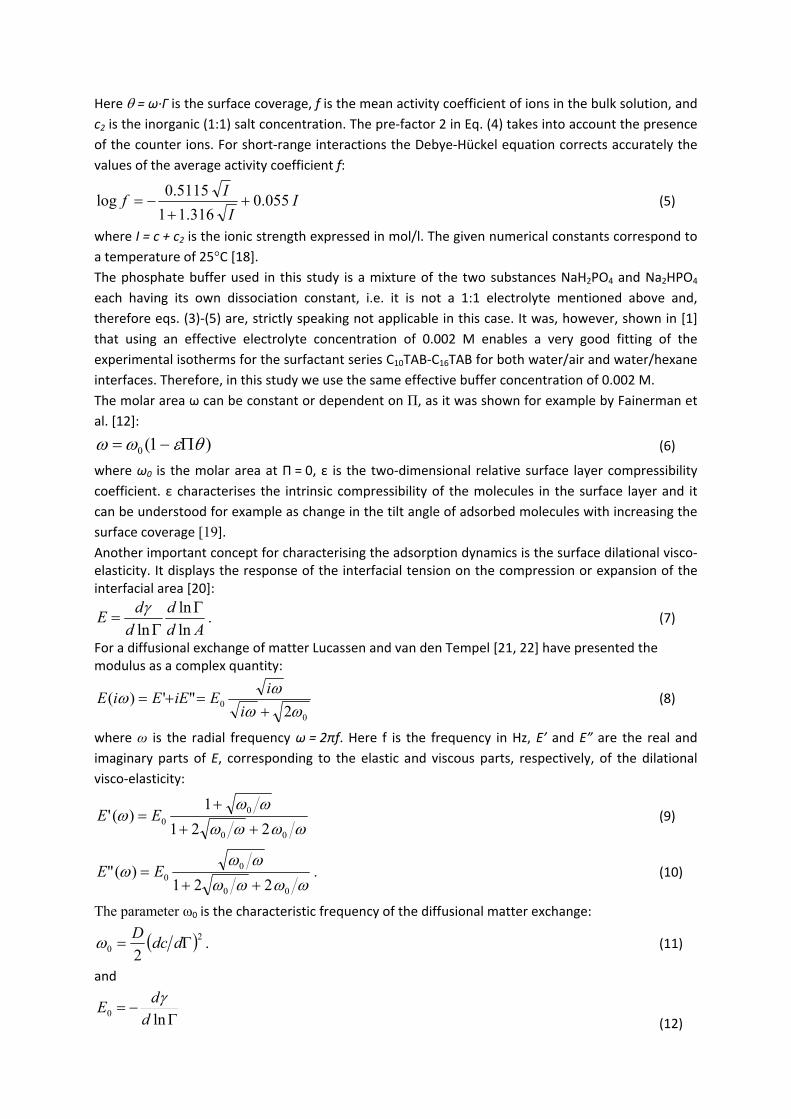
Here = ω∙Γ is the surface coverage, f is the mean activity coefficient of ions in the bulk solution, and
c2 is the inorganic (1:1) salt concentration. The pre‐factor 2 in Eq. (4) takes into account the presence
of the counter ions. For short‐range interactions the Debye‐Hückel equation corrects accurately the
values of the average activity coefficient f:
II
If 055.0
316.11
5115.0log
(5)
where I = c + c2 is the ionic strength expressed in mol/l. The given numerical constants correspond to
a temperature of 25°C [18].
The phosphate buffer used in this study is a mixture of the two substances NaH2PO4 and Na2HPO4
each having its own dissociation constant, i.e. it is not a 1:1 electrolyte mentioned above and,
therefore eqs. (3)‐(5) are, strictly speaking not applicable in this case. It was, however, shown in [1]
that using an effective electrolyte concentration of 0.002 M enables a very good fitting of the
experimental isotherms for the surfactant series C10TAB‐C16TAB for both water/air and water/hexane
interfaces. Therefore, in this study we use the same effective buffer concentration of 0.002 M.
The molar area ω can be constant or dependent on Π, as it was shown for example by Fainerman et
al. [12]:
)1(0 (6)
where ω0 is the molar area at Π = 0, ε is the two‐dimensional relative surface layer compressibility
coefficient. ε characterises the intrinsic compressibility of the molecules in the surface layer and it
can be understood for example as change in the tilt angle of adsorbed molecules with increasing the
surface coverage [19].
Another important concept for characterising the adsorption dynamics is the surface dilational visco‐elasticity. It displays the response of the interfacial tension on the compression or expansion of the interfacial area [20]:
Ad
d
d
dE
ln
ln
ln
. (7)
For a diffusional exchange of matter Lucassen and van den Tempel [21, 22] have presented the modulus as a complex quantity:
0
02
"')(
i
iEiEEiE (8)
where ω is the radial frequency ω = 2πf. Here f is the frequency in Hz, E’ and E” are the real and
imaginary parts of E, corresponding to the elastic and viscous parts, respectively, of the dilational
visco‐elasticity:
00
00
221
1)('
EE (9)
00
00
221)("
EE . (10)
The parameter ω0 is the characteristic frequency of the diffusional matter exchange:
20 2 ddc
D . (11)
and
ln0 d
dE
(12)
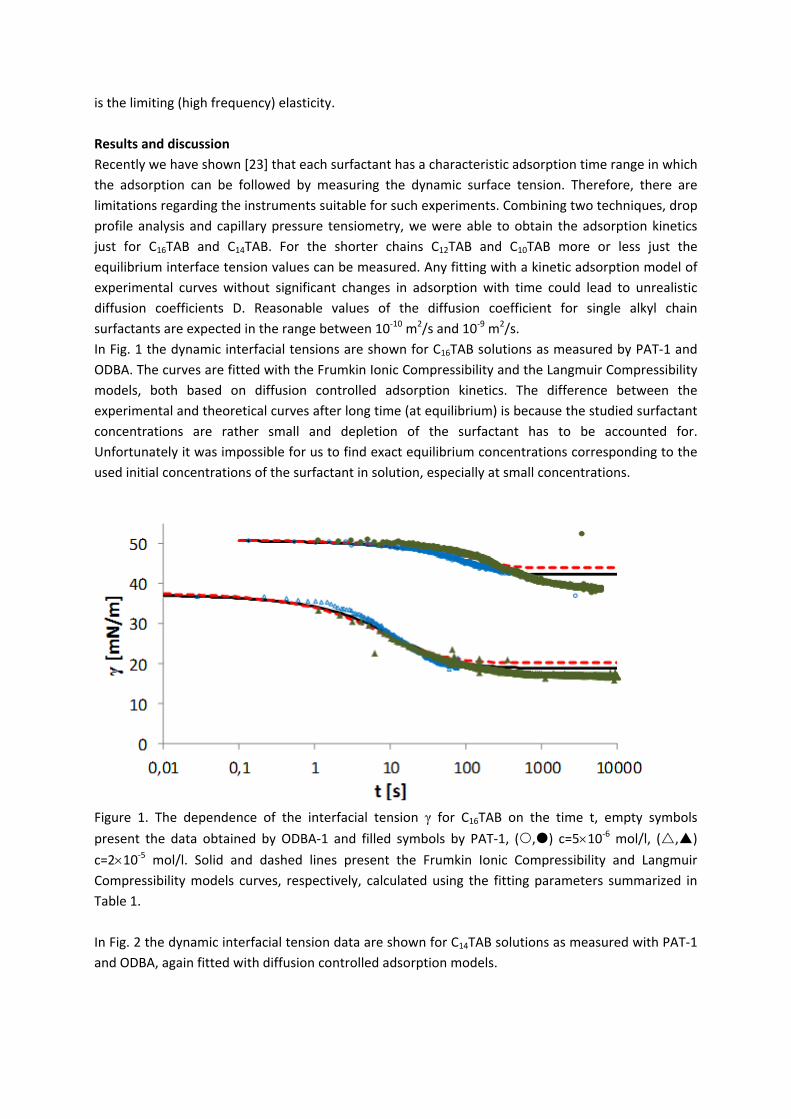
is the limiting (high frequency) elasticity.
Results and discussion
Recently we have shown [23] that each surfactant has a characteristic adsorption time range in which
the adsorption can be followed by measuring the dynamic surface tension. Therefore, there are
limitations regarding the instruments suitable for such experiments. Combining two techniques, drop
profile analysis and capillary pressure tensiometry, we were able to obtain the adsorption kinetics
just for C16TAB and C14TAB. For the shorter chains C12TAB and C10TAB more or less just the
equilibrium interface tension values can be measured. Any fitting with a kinetic adsorption model of
experimental curves without significant changes in adsorption with time could lead to unrealistic
diffusion coefficients D. Reasonable values of the diffusion coefficient for single alkyl chain
surfactants are expected in the range between 10‐10 m2/s and 10‐9 m2/s.
In Fig. 1 the dynamic interfacial tensions are shown for C16TAB solutions as measured by PAT‐1 and
ODBA. The curves are fitted with the Frumkin Ionic Compressibility and the Langmuir Compressibility
models, both based on diffusion controlled adsorption kinetics. The difference between the
experimental and theoretical curves after long time (at equilibrium) is because the studied surfactant
concentrations are rather small and depletion of the surfactant has to be accounted for.
Unfortunately it was impossible for us to find exact equilibrium concentrations corresponding to the
used initial concentrations of the surfactant in solution, especially at small concentrations.
Figure 1. The dependence of the interfacial tension γ for C16TAB on the time t, empty symbols
present the data obtained by ODBA‐1 and filled symbols by PAT‐1, (,) c=510‐6 mol/l, (,)
c=210‐5 mol/l. Solid and dashed lines present the Frumkin Ionic Compressibility and Langmuir
Compressibility models curves, respectively, calculated using the fitting parameters summarized in
Table 1.
In Fig. 2 the dynamic interfacial tension data are shown for C14TAB solutions as measured with PAT‐1
and ODBA, again fitted with diffusion controlled adsorption models.
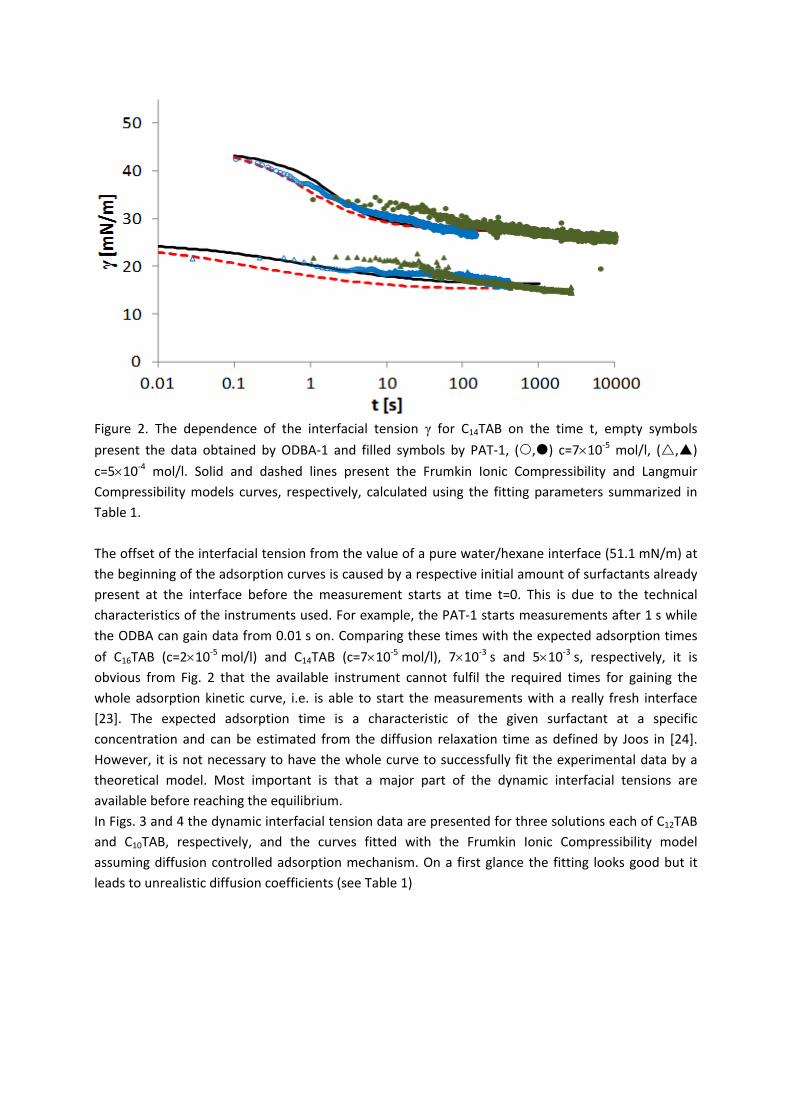
Figure 2. The dependence of the interfacial tension γ for C14TAB on the time t, empty symbols
present the data obtained by ODBA‐1 and filled symbols by PAT‐1, (,) c=710‐5 mol/l, (,)
c=510‐4 mol/l. Solid and dashed lines present the Frumkin Ionic Compressibility and Langmuir
Compressibility models curves, respectively, calculated using the fitting parameters summarized in
Table 1.
The offset of the interfacial tension from the value of a pure water/hexane interface (51.1 mN/m) at
the beginning of the adsorption curves is caused by a respective initial amount of surfactants already
present at the interface before the measurement starts at time t=0. This is due to the technical
characteristics of the instruments used. For example, the PAT‐1 starts measurements after 1 s while
the ODBA can gain data from 0.01 s on. Comparing these times with the expected adsorption times
of C16TAB (c=210‐5 mol/l) and C14TAB (c=710‐5 mol/l), 710‐3 s and 510‐3 s, respectively, it is obvious from Fig. 2 that the available instrument cannot fulfil the required times for gaining the
whole adsorption kinetic curve, i.e. is able to start the measurements with a really fresh interface
[23]. The expected adsorption time is a characteristic of the given surfactant at a specific
concentration and can be estimated from the diffusion relaxation time as defined by Joos in [24].
However, it is not necessary to have the whole curve to successfully fit the experimental data by a
theoretical model. Most important is that a major part of the dynamic interfacial tensions are
available before reaching the equilibrium.
In Figs. 3 and 4 the dynamic interfacial tension data are presented for three solutions each of C12TAB
and C10TAB, respectively, and the curves fitted with the Frumkin Ionic Compressibility model
assuming diffusion controlled adsorption mechanism. On a first glance the fitting looks good but it
leads to unrealistic diffusion coefficients (see Table 1)
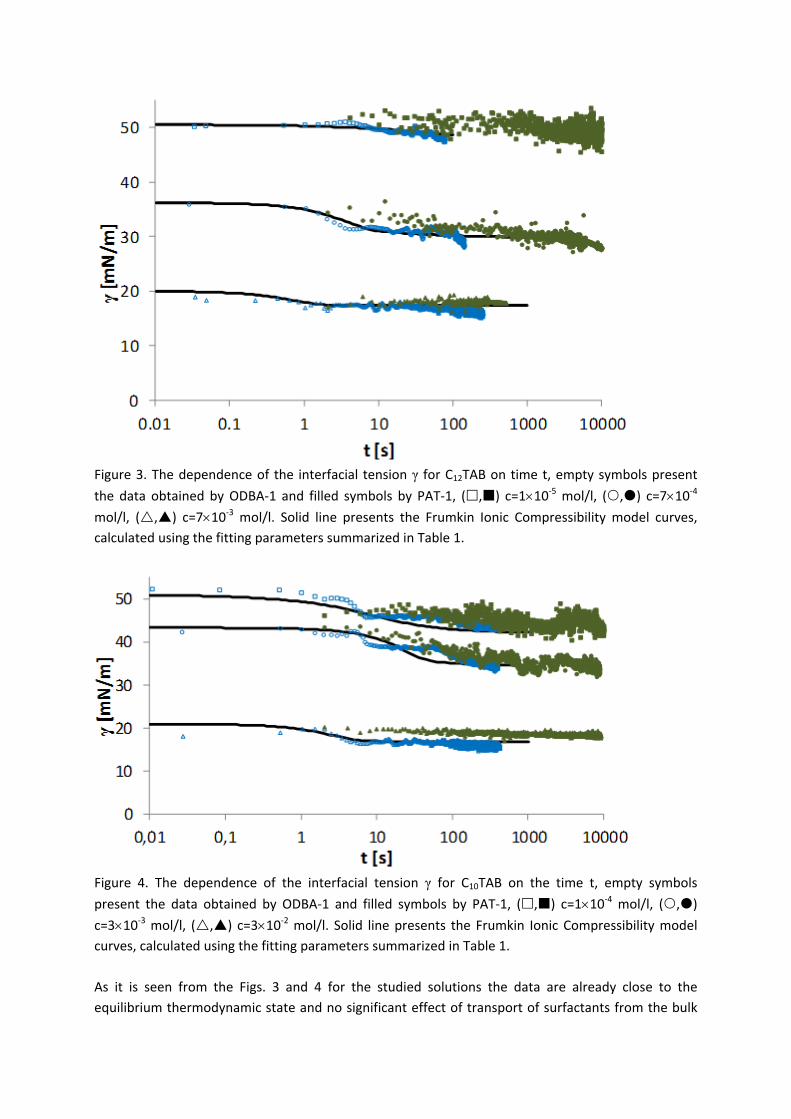
Figure 3. The dependence of the interfacial tension γ for C12TAB on time t, empty symbols present
the data obtained by ODBA‐1 and filled symbols by PAT‐1, (,) c=110‐5 mol/l, (,) c=710‐4 mol/l, (,) c=710‐3 mol/l. Solid line presents the Frumkin Ionic Compressibility model curves,
calculated using the fitting parameters summarized in Table 1.
Figure 4. The dependence of the interfacial tension γ for C10TAB on the time t, empty symbols
present the data obtained by ODBA‐1 and filled symbols by PAT‐1, (,) c=110‐4 mol/l, (,)
c=310‐3 mol/l, (,) c=310‐2 mol/l. Solid line presents the Frumkin Ionic Compressibility model
curves, calculated using the fitting parameters summarized in Table 1.
As it is seen from the Figs. 3 and 4 for the studied solutions the data are already close to the
equilibrium thermodynamic state and no significant effect of transport of surfactants from the bulk
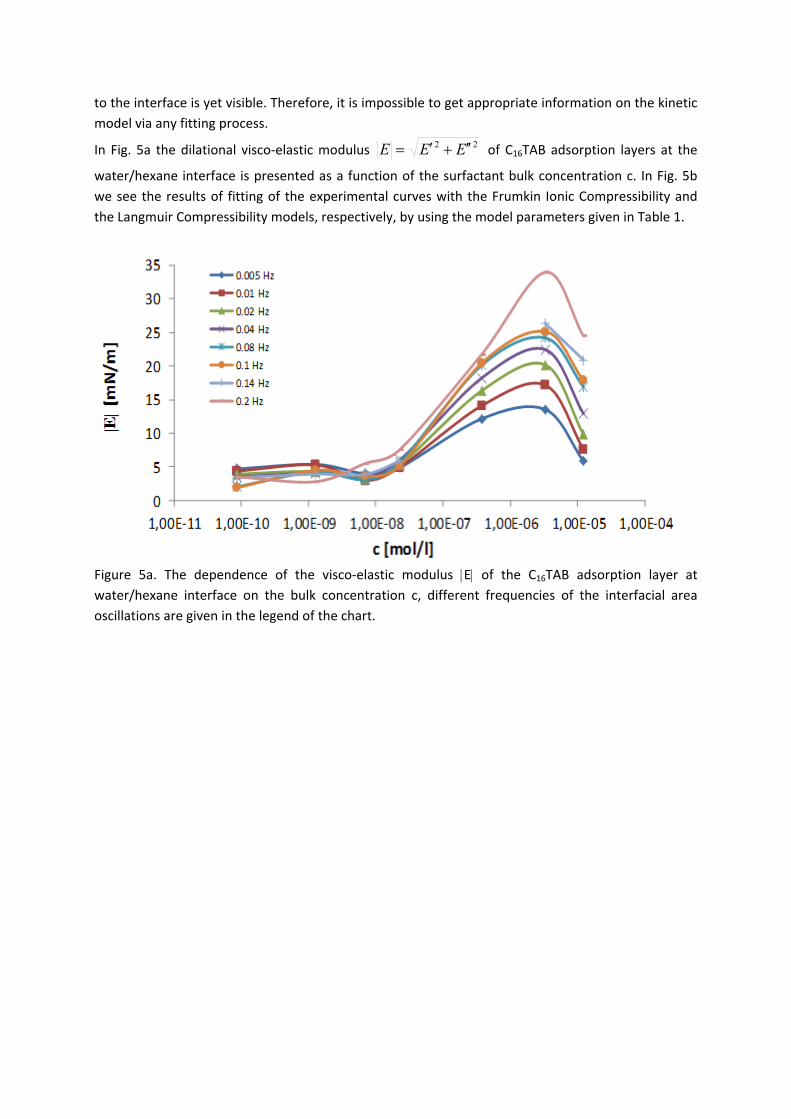
to the interface is yet visible. Therefore, it is impossible to get appropriate information on the kinetic
model via any fitting process.
In Fig. 5a the dilational visco‐elastic modulus 22 EEE of C16TAB adsorption layers at the
water/hexane interface is presented as a function of the surfactant bulk concentration c. In Fig. 5b
we see the results of fitting of the experimental curves with the Frumkin Ionic Compressibility and
the Langmuir Compressibility models, respectively, by using the model parameters given in Table 1.
Figure 5a. The dependence of the visco‐elastic modulus E of the C16TAB adsorption layer at
water/hexane interface on the bulk concentration c, different frequencies of the interfacial area
oscillations are given in the legend of the chart.
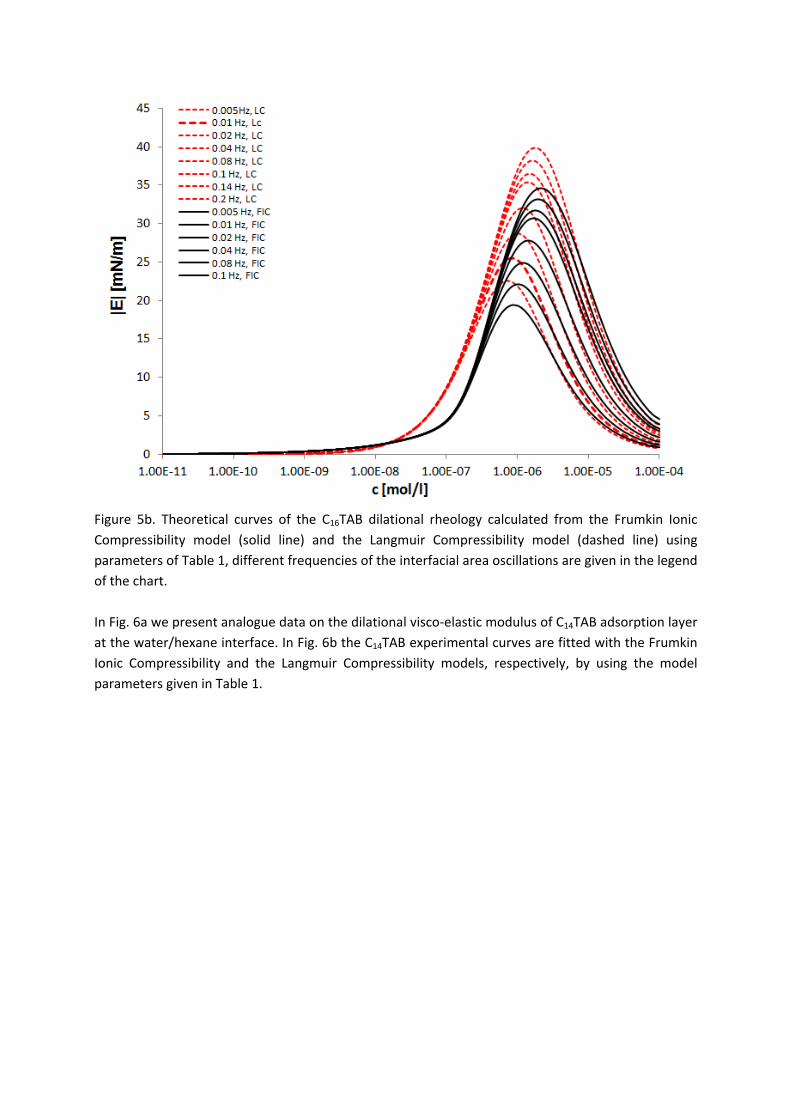
Figure 5b. Theoretical curves of the C16TAB dilational rheology calculated from the Frumkin Ionic
Compressibility model (solid line) and the Langmuir Compressibility model (dashed line) using
parameters of Table 1, different frequencies of the interfacial area oscillations are given in the legend
of the chart.
In Fig. 6a we present analogue data on the dilational visco‐elastic modulus of C14TAB adsorption layer
at the water/hexane interface. In Fig. 6b the C14TAB experimental curves are fitted with the Frumkin
Ionic Compressibility and the Langmuir Compressibility models, respectively, by using the model
parameters given in Table 1.
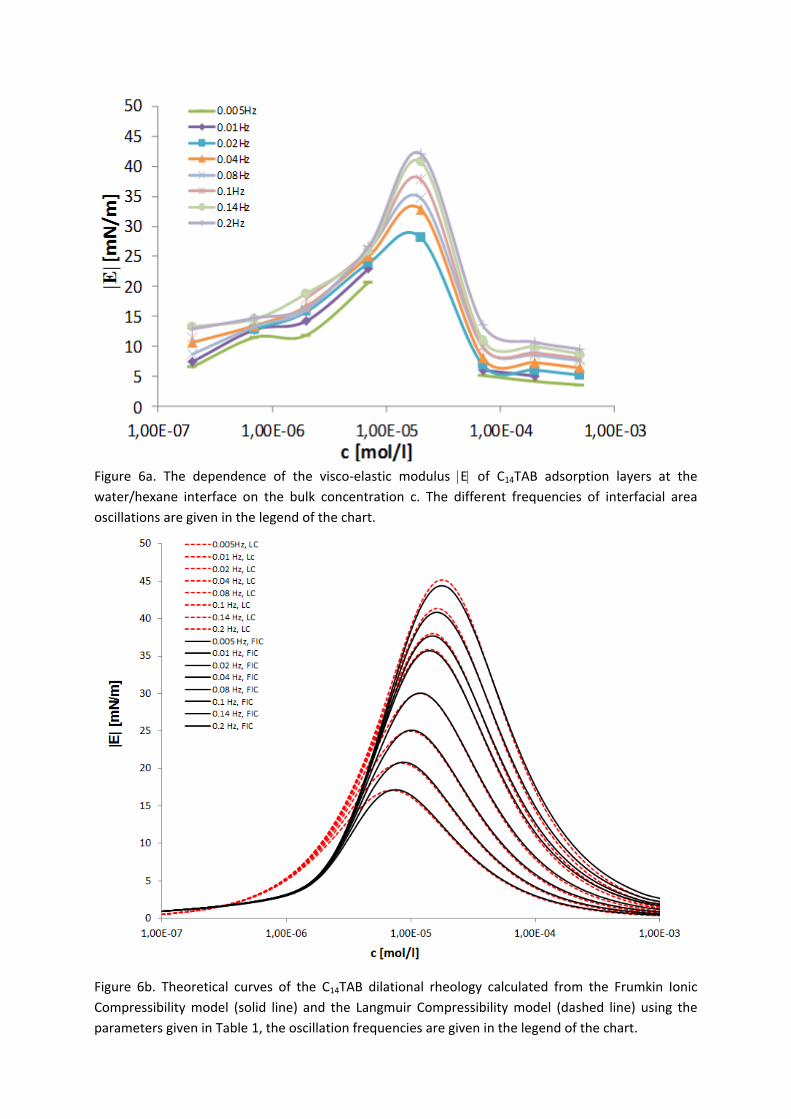
Figure 6a. The dependence of the visco‐elastic modulus E of C14TAB adsorption layers at the
water/hexane interface on the bulk concentration c. The different frequencies of interfacial area
oscillations are given in the legend of the chart.
Figure 6b. Theoretical curves of the C14TAB dilational rheology calculated from the Frumkin Ionic
Compressibility model (solid line) and the Langmuir Compressibility model (dashed line) using the
parameters given in Table 1, the oscillation frequencies are given in the legend of the chart.
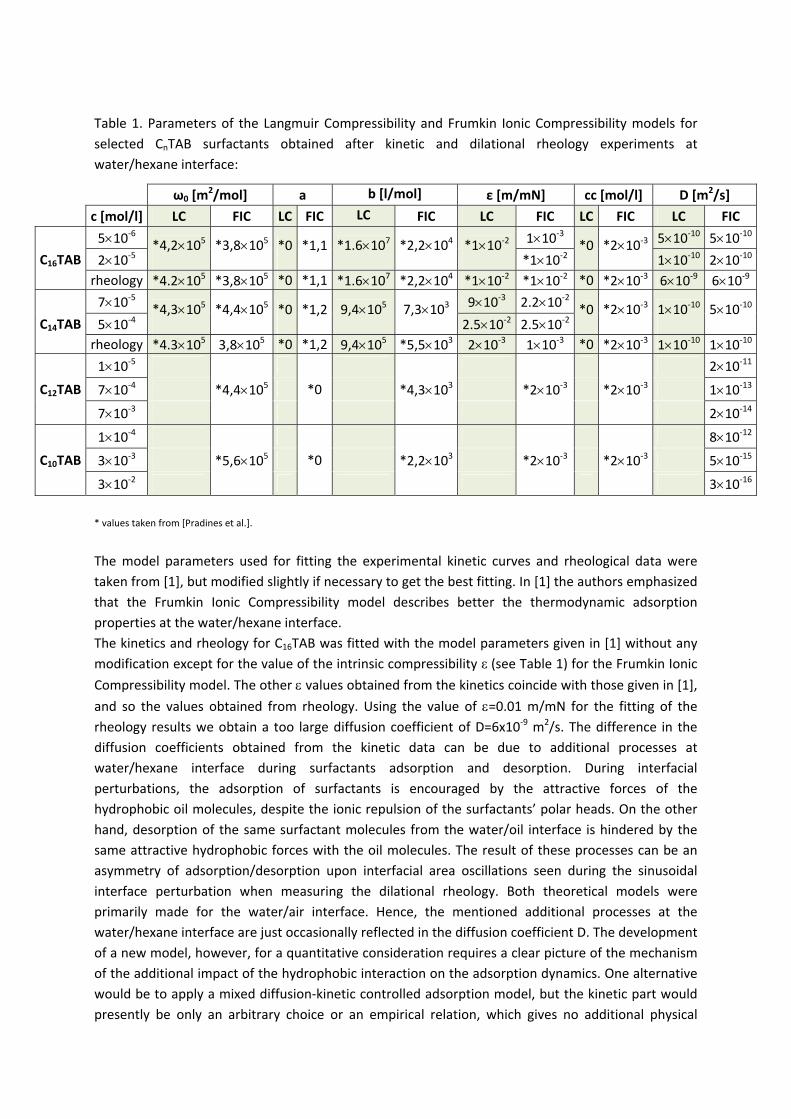
Table 1. Parameters of the Langmuir Compressibility and Frumkin Ionic Compressibility models for
selected CnTAB surfactants obtained after kinetic and dilational rheology experiments at
water/hexane interface:
* values taken from [Pradines et al.].
The model parameters used for fitting the experimental kinetic curves and rheological data were
taken from [1], but modified slightly if necessary to get the best fitting. In [1] the authors emphasized
that the Frumkin Ionic Compressibility model describes better the thermodynamic adsorption
properties at the water/hexane interface.
The kinetics and rheology for C16TAB was fitted with the model parameters given in [1] without any
modification except for the value of the intrinsic compressibility ε (see Table 1) for the Frumkin Ionic
Compressibility model. The other values obtained from the kinetics coincide with those given in [1],
and so the values obtained from rheology. Using the value of =0.01 m/mN for the fitting of the
rheology results we obtain a too large diffusion coefficient of D=6x10‐9 m2/s. The difference in the
diffusion coefficients obtained from the kinetic data can be due to additional processes at
water/hexane interface during surfactants adsorption and desorption. During interfacial
perturbations, the adsorption of surfactants is encouraged by the attractive forces of the
hydrophobic oil molecules, despite the ionic repulsion of the surfactants’ polar heads. On the other
hand, desorption of the same surfactant molecules from the water/oil interface is hindered by the
same attractive hydrophobic forces with the oil molecules. The result of these processes can be an
asymmetry of adsorption/desorption upon interfacial area oscillations seen during the sinusoidal
interface perturbation when measuring the dilational rheology. Both theoretical models were
primarily made for the water/air interface. Hence, the mentioned additional processes at the
water/hexane interface are just occasionally reflected in the diffusion coefficient D. The development
of a new model, however, for a quantitative consideration requires a clear picture of the mechanism
of the additional impact of the hydrophobic interaction on the adsorption dynamics. One alternative
would be to apply a mixed diffusion‐kinetic controlled adsorption model, but the kinetic part would
presently be only an arbitrary choice or an empirical relation, which gives no additional physical
ω0 [m2/mol] a b [l/mol] ε [m/mN] cc [mol/l] D [m2/s]
c [mol/l] LC FIC LC FIC LC FIC LC FIC LC FIC LC FIC
510‐6 *4,2105 *3,8105 *0 *1,1 *1.6107 *2,2104 *110‐2 110‐3 *0 *210‐3 510‐10 510‐10
C16TAB 210‐5 *110‐2 110‐10 210‐10
rheology *4.2105 *3,8105 *0 *1,1 *1.6107 *2,2104 *110‐2 *110‐2 *0 *210‐3 610‐9 610‐9
710‐5 *4,3105 *4,4105 *0 *1,2 9,4105 7,3103 910‐3 2.210‐2 *0 *210‐3 110‐10 510‐10
C14TAB 510‐4 2.510‐2 2.510‐2 rheology *4.3105 3,8105 *0 *1,2 9,4105 *5,5103 210‐3 110‐3 *0 *210‐3 110‐10 110‐10
110‐5 210‐11
C12TAB 710‐4 *4,4105 *0 *4,3103 *210‐3 *210‐3 110‐13
710‐3 210‐14
110‐4 810‐12
C10TAB 310‐3 *5,6105 *0 *2,2103 *210‐3 *210‐3 510‐15
310‐2 310‐16
insight. Therefore, for the time we want to leave the data analysis on the level of efficient diffusion
coefficients.
For C14TAB we obtained two sets of isotherm parameters for the Frumkin Ionic Compressibility
model: ω0=4.4x10⁵ m2/mol, b=7.3 m3/mol and ω0=3.8x10
5 m2/mol, b=5.5 m3/mol. In the first set ω0
coincides with the value given in [1], whereas in the second set b is identical to the one in [1]. We
used the first parameter set for the kinetics, but for the rheology data the second set instead in order
to reach a best fitting. For the Langmuir Compressibility model we get the adsorption equilibrium
constant b about 7 times smaller than that obtained in [1]. This value was used in the fitting of both,
the kinetics and rheology results.
To keep the diffusion coefficients in reasonable limits we had to vary the compressibility constant in
a broad range. The values exceeding 0.02 m/mN are too high, because according to Eq. (6) already at
=0.025 m/mN, the surface coverage would reach a value of 1 and at an interfacial pressure of about
40 mN/m we would obtain ω=0. From Fig 2 it is seen that the kinetic curves for C14TAB reach the
equilibrium state already at much shorter times as compared to C16TAB. This is especially true at a
concentration of c = 510‐4 mol/l, which creates significant problems in model fitting. Thus, the
apparently very high values of the compressibility coefficients can be the consequence of the non‐
suitable time range of data acquisition. At the same time the values 0.001 and 0.002 obtained from the rheological data seem to be too small, because it results in an unreasonable increase in E0. Studies of C12TAB and C10TAB have to be performed at highly concentrated solutions in order to show
the dynamics of the adsorption process, and hence the diffusion of C12TAB and C10TAB is faster than
for the longer chain surfactants. The capabilities of the combination of PAT‐1 and ODBA are
insufficient here, as can be seen from the Figs. 3 and 4, as the dynamic interfacial tensions show
almost equilibrium values.
Conclusions
This paper complements the findings published recently by Pradines et al. [1] and shows that the
adsorption kinetics and dilational rheology depend closely on the choice of the instrument and of the
theoretical model for analyzing the data afterwards. Beside this, it shows that the qualitative and
quantitative interpretations of dynamic CnTAB adsorption layers at water/hexane interface are only
partly satisfactory.
It was shown above that adsorption kinetics of C10TAB and C12TAB at water/hexane interface cannot
be studied with conventional instruments. Basically for these two surfactants, measuring the
dynamic interfacial tensions we have obtained just equilibrium values. The similar results have been
obtained for the dilational rheology, where the interfacial tension response to the drop area
oscillations was too weak due to fast diffusion of the particular surfactants to/from the interface. To
avoid such problems the capillary pressure tensiometer should be utilized better to reach higher
frequencies.
Generally the Langmuir Compressibility model gives good description of all types of data. The perfect
case is if a single diffusion coefficient is used for fitting of the thermodynamic, kinetic and dilational
rheology experimental results. However, for C14TAB surfactants we had to manipulate the model
parameters and chose unrealistic values of the surface layer compressibility values ε for perfect fits.
On the other hand, good fits are obtained for C16TAB rheology results using thermodynamic model
parameters but unrealistic diffusion coefficients D. The different diffusion coefficients are possibly
caused by additional processes going on at the water/hexane interface. It might be that the oil
molecules participate in the dynamics more than expected and those are mechanisms that we
cannot describe yet quantitatively.
References
1 V. Pradines, V.B. Fainerman, E.V. Aksenenko, J. Krägel, N. Mucic, R. Miller, Colloids Surfaces A 371 (2010) 22‐
28.
2 C. Stubenrauch, V.B. Fainerman, E.V. Aksenenko, R. Miller, J. Phys. Chem. B 109 (2005) 1505‐1509.
3 K. Medrzycka, W. Zwierzykowski, J. Colloid Interface Sci. 230 (2000) 67‐72.
4 A. Sharipova, S. Aidarova, A.B. Fainerman, R. Miller, Colloids Surf. A 382 (2011) 181‐185.
5 A. Javadi, N. Mucic, D. Vollhardt, V.B. Fainerman, R. Miller, J. Colloid Interface Sci. 351 (2010) 537‐541.
6 V.B. Fainerman, E.V. Aksenenko, V.I. Kovalchuk, A. Javadi, R. Miller, Soft Matter 7 (2011) 7860‐7865.
7 A. Javadi, N. Moradi, V.B. Fainerman, H. Moehwald, R. Miller, Colloids Surfaces A 391 (2011) 19‐24.
8 W.D. Garrett and J.D. Bultman, J. Colloid Sci., 18 (1963) 798
9 J.A. Mann and R.S. Hansen, J. Colloid Sci., 18 (1963) 805
10 L. Liggieri, M. Ferrari, D. Mondelli, F. Ravera, Faraday Discuss. 129 (2005) 125‐140.
11 R. Miller, J.K. Ferri, A. Javadi, J. Krägel, N. Mucic, R. Wüstneck, Colloid Polym. Sci. 288 (2010) 937‐950.
12 V.B. Fainerman, S.A. Zholob, E.H. Lucassen‐Reynders, R. Miller, J. Colloid Interface Sci. 261 (2003) 180‐183.
13 http://www.thomascat.info/Scientific/AdSo/AdSo.htm
14 V.B. Fainerman, S.V. Lylyk, E.V. Aksenenko, L. Liggieri, A.V. Makievski, J.T. Petkov, J. Yorke, R. Miller, Colloids
Surfaces A 334 (2009) 8‐15
15 http://www.thomascat.info/Scientific/AdSo/AdSo.htm
16 I.J. Langmuir, J. Am. Chem. Soc. 39 (1917) 1848.
17 B. von Szyszkowski, Z. Phys. Chem. (Leipzig) 64 (1908) 385.
18 V.B. Fainerman, E.H. Lucassen‐Reynders, Adv. Colloid Interface Sci. 96 (2002) 295–323.
19 V.B. Fainerman, D. Vollhardt, J. Phys. Chem. B 107 (2003) 3098‐3100.
20 M. van den Tempel, J. Lucassen, E.H. Lucassen‐Reynders, J. Phys. Chem. 69 (1965) 1798–1804.
21 J. Lucassen, M. van den Tempel, Chem. Eng. Sci. 27 (1972) 1283.
22 J. Lucassen, M. van den Tempel, J. Colloid Interface Sci. 41 (1972) 491.
23 N. Mucic, A. Javadi, N.M. Kovalchuk, E.V. Aksenenko, R. Miller, Adv. Colloid Interface Sci. 168 (2011) 167‐
178.
24 P. Joos, Dynamic Surface Phenomena, VPS, Utrecht:1999.

Paper VIII Dynamic interfacial tension of triblock copolymers solutions at the water/hexane interface P. Ramirez, J. Munoz, V.B. Fainerman, E.V. Aksenenko, N. Mucic and R. Miller Colloids and Surfaces A 391 (2011) 119‐124
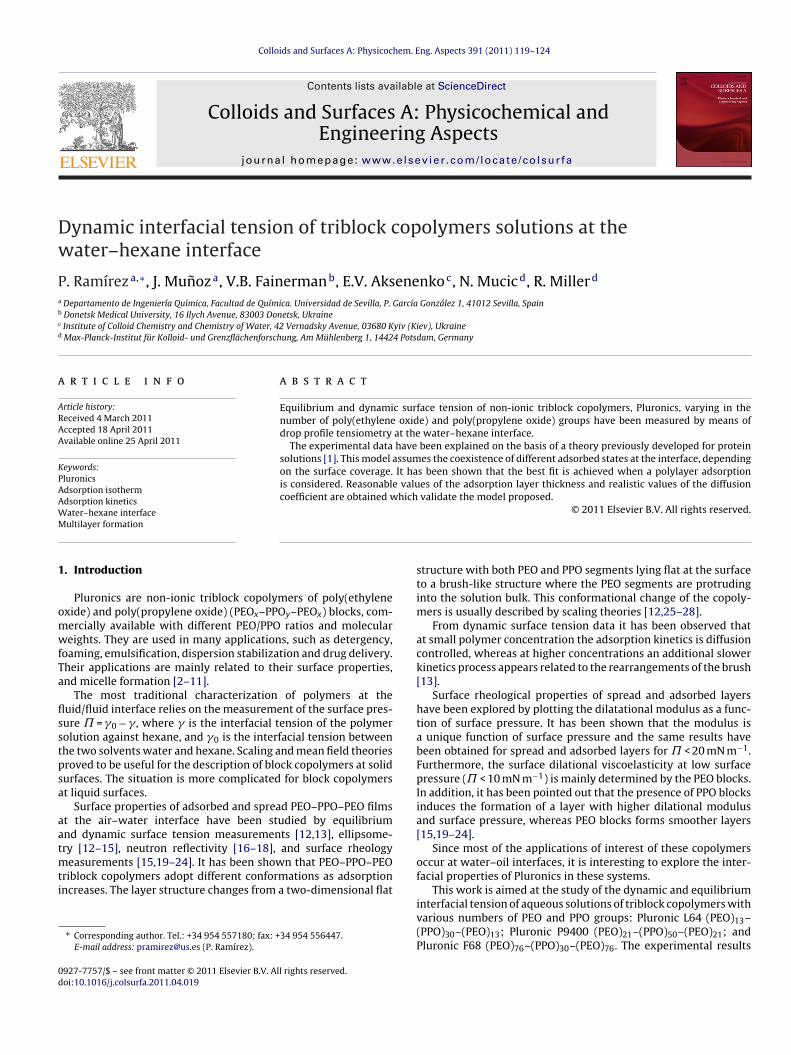
Dw
Pa
b
c
d
a
ARAA
KPAAWM
1
omwfTa
flsstpsa
aatmti
0d
Colloids and Surfaces A: Physicochem. Eng. Aspects 391 (2011) 119– 124
Contents lists available at ScienceDirect
Colloids and Surfaces A: Physicochemical andEngineering Aspects
jo ur nal homep a ge: www.elsev ier .com/ locate /co lsur fa
ynamic interfacial tension of triblock copolymers solutions at theater–hexane interface
. Ramíreza,∗, J. Munoza, V.B. Fainermanb, E.V. Aksenenkoc, N. Mucicd, R. Millerd
Departamento de Ingeniería Química, Facultad de Química. Universidad de Sevilla, P. García González 1, 41012 Sevilla, SpainDonetsk Medical University, 16 Ilych Avenue, 83003 Donetsk, UkraineInstitute of Colloid Chemistry and Chemistry of Water, 42 Vernadsky Avenue, 03680 Kyiv (Kiev), UkraineMax-Planck-Institut für Kolloid- und Grenzflächenforschung, Am Mühlenberg 1, 14424 Potsdam, Germany
r t i c l e i n f o
rticle history:eceived 4 March 2011ccepted 18 April 2011vailable online 25 April 2011
a b s t r a c t
Equilibrium and dynamic surface tension of non-ionic triblock copolymers, Pluronics, varying in thenumber of poly(ethylene oxide) and poly(propylene oxide) groups have been measured by means ofdrop profile tensiometry at the water–hexane interface.
The experimental data have been explained on the basis of a theory previously developed for protein
eywords:luronicsdsorption isothermdsorption kinetics
solutions [1]. This model assumes the coexistence of different adsorbed states at the interface, dependingon the surface coverage. It has been shown that the best fit is achieved when a polylayer adsorptionis considered. Reasonable values of the adsorption layer thickness and realistic values of the diffusioncoefficient are obtained which validate the model proposed.
© 2011 Elsevier B.V. All rights reserved.
ater–hexane interfaceultilayer formation. Introduction
Pluronics are non-ionic triblock copolymers of poly(ethylenexide) and poly(propylene oxide) (PEOx–PPOy–PEOx) blocks, com-ercially available with different PEO/PPO ratios and moleculareights. They are used in many applications, such as detergency,
oaming, emulsification, dispersion stabilization and drug delivery.heir applications are mainly related to their surface properties,nd micelle formation [2–11].
The most traditional characterization of polymers at theuid/fluid interface relies on the measurement of the surface pres-ure = 0 − , where is the interfacial tension of the polymerolution against hexane, and 0 is the interfacial tension betweenhe two solvents water and hexane. Scaling and mean field theoriesroved to be useful for the description of block copolymers at solidurfaces. The situation is more complicated for block copolymerst liquid surfaces.
Surface properties of adsorbed and spread PEO–PPO–PEO filmst the air–water interface have been studied by equilibriumnd dynamic surface tension measurements [12,13], ellipsome-ry [12–15], neutron reflectivity [16–18], and surface rheology
easurements [15,19–24]. It has been shown that PEO–PPO–PEOriblock copolymers adopt different conformations as adsorptionncreases. The layer structure changes from a two-dimensional flat
∗ Corresponding author. Tel.: +34 954 557180; fax: +34 954 556447.E-mail address: [email protected] (P. Ramírez).
927-7757/$ – see front matter © 2011 Elsevier B.V. All rights reserved.oi:10.1016/j.colsurfa.2011.04.019
structure with both PEO and PPO segments lying flat at the surfaceto a brush-like structure where the PEO segments are protrudinginto the solution bulk. This conformational change of the copoly-mers is usually described by scaling theories [12,25–28].
From dynamic surface tension data it has been observed thatat small polymer concentration the adsorption kinetics is diffusioncontrolled, whereas at higher concentrations an additional slowerkinetics process appears related to the rearrangements of the brush[13].
Surface rheological properties of spread and adsorbed layershave been explored by plotting the dilatational modulus as a func-tion of surface pressure. It has been shown that the modulus isa unique function of surface pressure and the same results havebeen obtained for spread and adsorbed layers for < 20 mN m−1.Furthermore, the surface dilational viscoelasticity at low surfacepressure (˘ < 10 mN m−1) is mainly determined by the PEO blocks.In addition, it has been pointed out that the presence of PPO blocksinduces the formation of a layer with higher dilational modulusand surface pressure, whereas PEO blocks forms smoother layers[15,19–24].
Since most of the applications of interest of these copolymersoccur at water–oil interfaces, it is interesting to explore the inter-facial properties of Pluronics in these systems.
This work is aimed at the study of the dynamic and equilibrium
interfacial tension of aqueous solutions of triblock copolymers withvarious numbers of PEO and PPO groups: Pluronic L64 (PEO)13–(PPO)30–(PEO)13; Pluronic P9400 (PEO)21–(PPO)50–(PEO)21; andPluronic F68 (PEO)76–(PPO)30–(PEO)76. The experimental results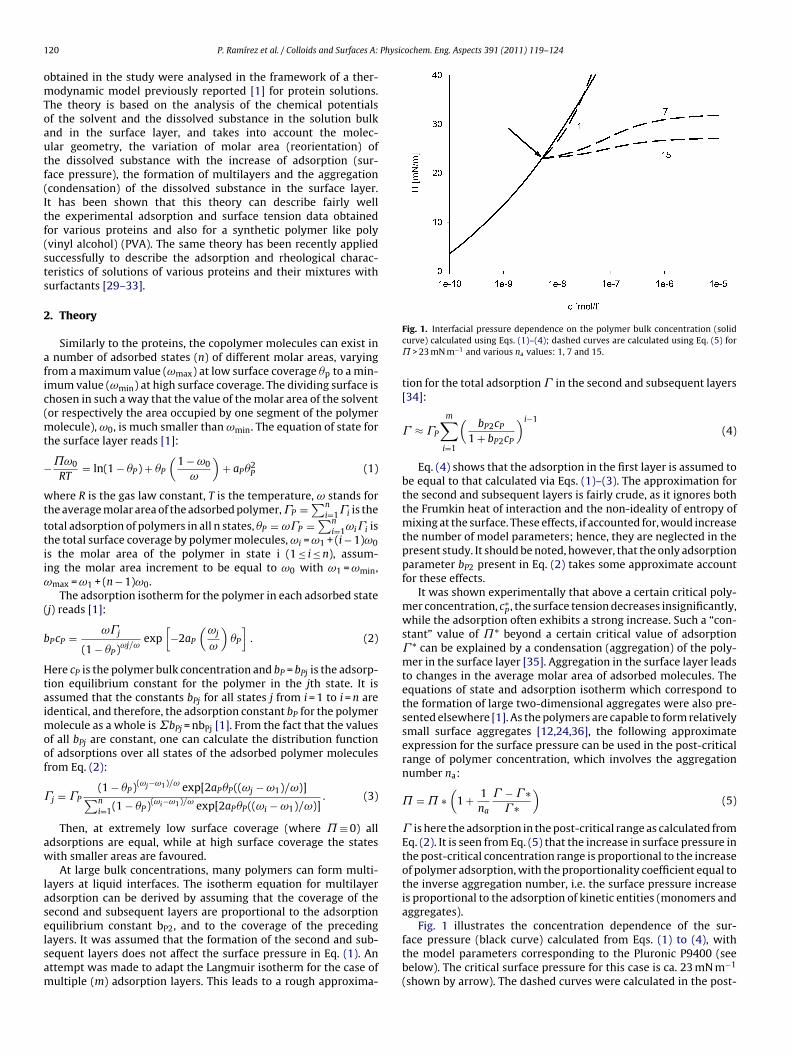
1 Physicochem. Eng. Aspects 391 (2011) 119– 124
omToautf(Itf(sts
2
afic(mt
−
wtttiiω
(
b
Htaimoof
aw
laselsam
20 P. Ramírez et al. / Colloids and Surfaces A:
btained in the study were analysed in the framework of a ther-odynamic model previously reported [1] for protein solutions.
he theory is based on the analysis of the chemical potentialsf the solvent and the dissolved substance in the solution bulknd in the surface layer, and takes into account the molec-lar geometry, the variation of molar area (reorientation) ofhe dissolved substance with the increase of adsorption (sur-ace pressure), the formation of multilayers and the aggregationcondensation) of the dissolved substance in the surface layer.t has been shown that this theory can describe fairly wellhe experimental adsorption and surface tension data obtainedor various proteins and also for a synthetic polymer like polyvinyl alcohol) (PVA). The same theory has been recently applieduccessfully to describe the adsorption and rheological charac-eristics of solutions of various proteins and their mixtures withurfactants [29–33].
. Theory
Similarly to the proteins, the copolymer molecules can exist in number of adsorbed states (n) of different molar areas, varyingrom a maximum value (ωmax) at low surface coverage p to a min-mum value (ωmin) at high surface coverage. The dividing surface ishosen in such a way that the value of the molar area of the solventor respectively the area occupied by one segment of the polymer
olecule), ω0, is much smaller than ωmin. The equation of state forhe surface layer reads [1]:
˘ω0
RT= ln(1 − P) + P
(1 − ω0
ω
)+ aP2
P (1)
here R is the gas law constant, T is the temperature, ω stands forhe average molar area of the adsorbed polymer, P =
∑ni=1i is the
otal adsorption of polymers in all n states, P = ωP =∑n
i=1ωii ishe total surface coverage by polymer molecules, ωi = ω1 + (i − 1)ω0s the molar area of the polymer in state i (1 ≤ i ≤ n), assum-ng the molar area increment to be equal to ω0 with ω1 = ωmin,
max = ω1 + (n − 1)ω0.The adsorption isotherm for the polymer in each adsorbed state
j) reads [1]:
PcP = ωj
(1 − P)ωj/ωexp
[−2aP
(ωj
ω
)P
]. (2)
ere cP is the polymer bulk concentration and bP = bPj is the adsorp-ion equilibrium constant for the polymer in the jth state. It isssumed that the constants bPj for all states j from i = 1 to i = n aredentical, and therefore, the adsorption constant bP for the polymer
olecule as a whole is ˙bPj = nbPj [1]. From the fact that the valuesf all bPj are constant, one can calculate the distribution functionf adsorptions over all states of the adsorbed polymer moleculesrom Eq. (2):
j = P(1 − P)(ωj−ω1)/ω exp[2aPP((ωj − ω1)/ω)]∑ni=1(1 − P)(ωi−ω1)/ω exp[2aPP((ωi − ω1)/ω)]
. (3)
Then, at extremely low surface coverage (where ≡ 0) alldsorptions are equal, while at high surface coverage the statesith smaller areas are favoured.
At large bulk concentrations, many polymers can form multi-ayers at liquid interfaces. The isotherm equation for multilayerdsorption can be derived by assuming that the coverage of theecond and subsequent layers are proportional to the adsorptionquilibrium constant bP2, and to the coverage of the preceding
ayers. It was assumed that the formation of the second and sub-equent layers does not affect the surface pressure in Eq. (1). Anttempt was made to adapt the Langmuir isotherm for the case ofultiple (m) adsorption layers. This leads to a rough approxima-Fig. 1. Interfacial pressure dependence on the polymer bulk concentration (solidcurve) calculated using Eqs. (1)–(4); dashed curves are calculated using Eq. (5) for˘ > 23 mN m−1 and various na values: 1, 7 and 15.
tion for the total adsorption in the second and subsequent layers[34]:
≈ P
m∑i=1
(bP2cP
1 + bP2cP
)i−1
(4)
Eq. (4) shows that the adsorption in the first layer is assumed tobe equal to that calculated via Eqs. (1)–(3). The approximation forthe second and subsequent layers is fairly crude, as it ignores boththe Frumkin heat of interaction and the non-ideality of entropy ofmixing at the surface. These effects, if accounted for, would increasethe number of model parameters; hence, they are neglected in thepresent study. It should be noted, however, that the only adsorptionparameter bP2 present in Eq. (2) takes some approximate accountfor these effects.
It was shown experimentally that above a certain critical poly-mer concentration, c∗
P , the surface tension decreases insignificantly,while the adsorption often exhibits a strong increase. Such a “con-stant” value of ˘* beyond a certain critical value of adsorption * can be explained by a condensation (aggregation) of the poly-mer in the surface layer [35]. Aggregation in the surface layer leadsto changes in the average molar area of adsorbed molecules. Theequations of state and adsorption isotherm which correspond tothe formation of large two-dimensional aggregates were also pre-sented elsewhere [1]. As the polymers are capable to form relativelysmall surface aggregates [12,24,36], the following approximateexpression for the surface pressure can be used in the post-criticalrange of polymer concentration, which involves the aggregationnumber na:
= ∗(
1 + 1na
− ∗ ∗
)(5)
is here the adsorption in the post-critical range as calculated fromEq. (2). It is seen from Eq. (5) that the increase in surface pressure inthe post-critical concentration range is proportional to the increaseof polymer adsorption, with the proportionality coefficient equal tothe inverse aggregation number, i.e. the surface pressure increaseis proportional to the adsorption of kinetic entities (monomers andaggregates).
Fig. 1 illustrates the concentration dependence of the sur-
face pressure (black curve) calculated from Eqs. (1) to (4), withthe model parameters corresponding to the Pluronic P9400 (seebelow). The critical surface pressure for this case is ca. 23 mN m−1(shown by arrow). The dashed curves were calculated in the post-
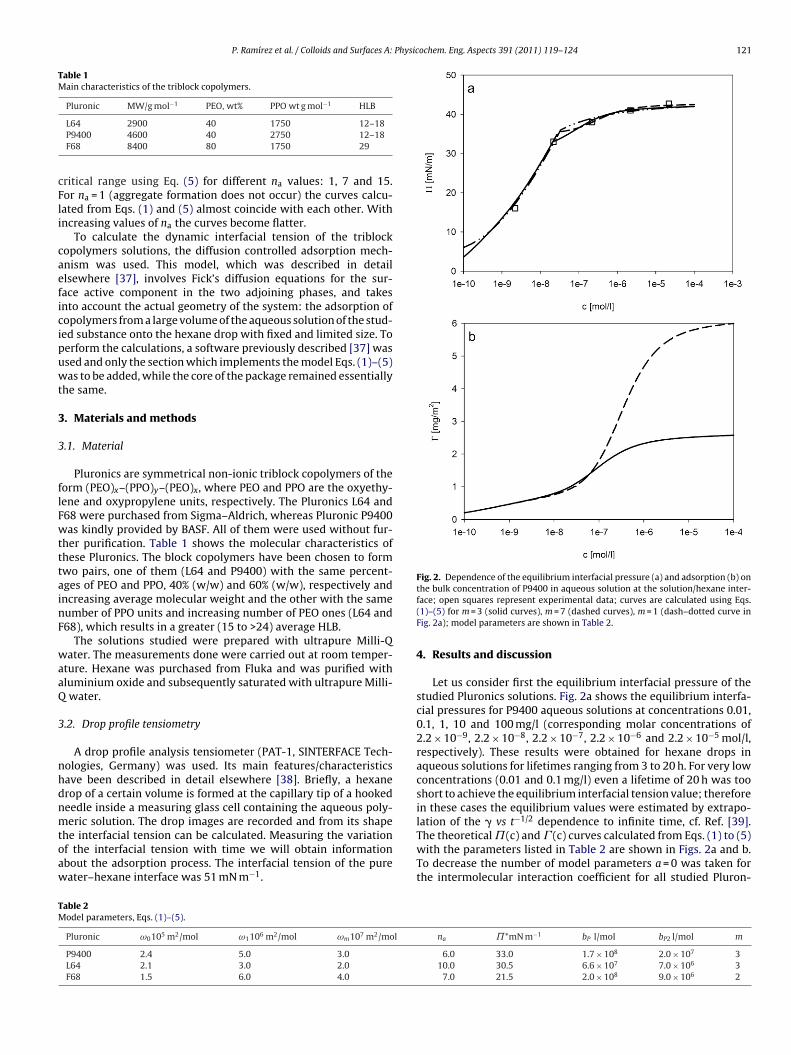
P. Ramírez et al. / Colloids and Surfaces A: Physicochem. Eng. Aspects 391 (2011) 119– 124 121
Table 1Main characteristics of the triblock copolymers.
Pluronic MW/g mol−1 PEO, wt% PPO wt g mol−1 HLB
cFli
caeficipuwt
3
3
flFwtttainF
waaQ
3
nhdnmtoaw
Fig. 2. Dependence of the equilibrium interfacial pressure (a) and adsorption (b) onthe bulk concentration of P9400 in aqueous solution at the solution/hexane inter-
TM
L64 2900 40 1750 12–18P9400 4600 40 2750 12–18F68 8400 80 1750 29
ritical range using Eq. (5) for different na values: 1, 7 and 15.or na = 1 (aggregate formation does not occur) the curves calcu-ated from Eqs. (1) and (5) almost coincide with each other. Withncreasing values of na the curves become flatter.
To calculate the dynamic interfacial tension of the triblockopolymers solutions, the diffusion controlled adsorption mech-nism was used. This model, which was described in detaillsewhere [37], involves Fick’s diffusion equations for the sur-ace active component in the two adjoining phases, and takesnto account the actual geometry of the system: the adsorption ofopolymers from a large volume of the aqueous solution of the stud-ed substance onto the hexane drop with fixed and limited size. Toerform the calculations, a software previously described [37] wassed and only the section which implements the model Eqs. (1)–(5)as to be added, while the core of the package remained essentially
he same.
. Materials and methods
.1. Material
Pluronics are symmetrical non-ionic triblock copolymers of theorm (PEO)x–(PPO)y–(PEO)x, where PEO and PPO are the oxyethy-ene and oxypropylene units, respectively. The Pluronics L64 and68 were purchased from Sigma–Aldrich, whereas Pluronic P9400as kindly provided by BASF. All of them were used without fur-
her purification. Table 1 shows the molecular characteristics ofhese Pluronics. The block copolymers have been chosen to formwo pairs, one of them (L64 and P9400) with the same percent-ges of PEO and PPO, 40% (w/w) and 60% (w/w), respectively andncreasing average molecular weight and the other with the sameumber of PPO units and increasing number of PEO ones (L64 and68), which results in a greater (15 to >24) average HLB.
The solutions studied were prepared with ultrapure Milli-Qater. The measurements done were carried out at room temper-
ture. Hexane was purchased from Fluka and was purified withluminium oxide and subsequently saturated with ultrapure Milli-
water.
.2. Drop profile tensiometry
A drop profile analysis tensiometer (PAT-1, SINTERFACE Tech-ologies, Germany) was used. Its main features/characteristicsave been described in detail elsewhere [38]. Briefly, a hexanerop of a certain volume is formed at the capillary tip of a hookedeedle inside a measuring glass cell containing the aqueous poly-eric solution. The drop images are recorded and from its shape
he interfacial tension can be calculated. Measuring the variationf the interfacial tension with time we will obtain informationbout the adsorption process. The interfacial tension of the pureater–hexane interface was 51 mN m−1.
able 2odel parameters, Eqs. (1)–(5).
Pluronic ω0105 m2/mol ω1106 m2/mol ωm107 m2/mol
P9400 2.4 5.0 3.0
L64 2.1 3.0 2.0
F68 1.5 6.0 4.0
face; open squares represent experimental data; curves are calculated using Eqs.(1)–(5) for m = 3 (solid curves), m = 7 (dashed curves), m = 1 (dash–dotted curve inFig. 2a); model parameters are shown in Table 2.
4. Results and discussion
Let us consider first the equilibrium interfacial pressure of thestudied Pluronics solutions. Fig. 2a shows the equilibrium interfa-cial pressures for P9400 aqueous solutions at concentrations 0.01,0.1, 1, 10 and 100 mg/l (corresponding molar concentrations of2.2 × 10−9, 2.2 × 10⁻⁸, 2.2 × 10⁻⁷, 2.2 × 10⁻⁶ and 2.2 × 10⁻⁵ mol/l,respectively). These results were obtained for hexane drops inaqueous solutions for lifetimes ranging from 3 to 20 h. For very lowconcentrations (0.01 and 0.1 mg/l) even a lifetime of 20 h was tooshort to achieve the equilibrium interfacial tension value; thereforein these cases the equilibrium values were estimated by extrapo-lation of the vs t−1/2 dependence to infinite time, cf. Ref. [39].
The theoretical ˘(c) and (c) curves calculated from Eqs. (1) to (5)with the parameters listed in Table 2 are shown in Figs. 2a and b.To decrease the number of model parameters a = 0 was taken forthe intermolecular interaction coefficient for all studied Pluron-na ˘*mN m−1 bP l/mol bP2 l/mol m
6.0 33.0 1.7 × 10⁸ 2.0 × 10⁷ 310.0 30.5 6.6 × 10⁷ 7.0 × 10⁶ 3
7.0 21.5 2.0 × 10⁸ 9.0 × 10⁶ 2
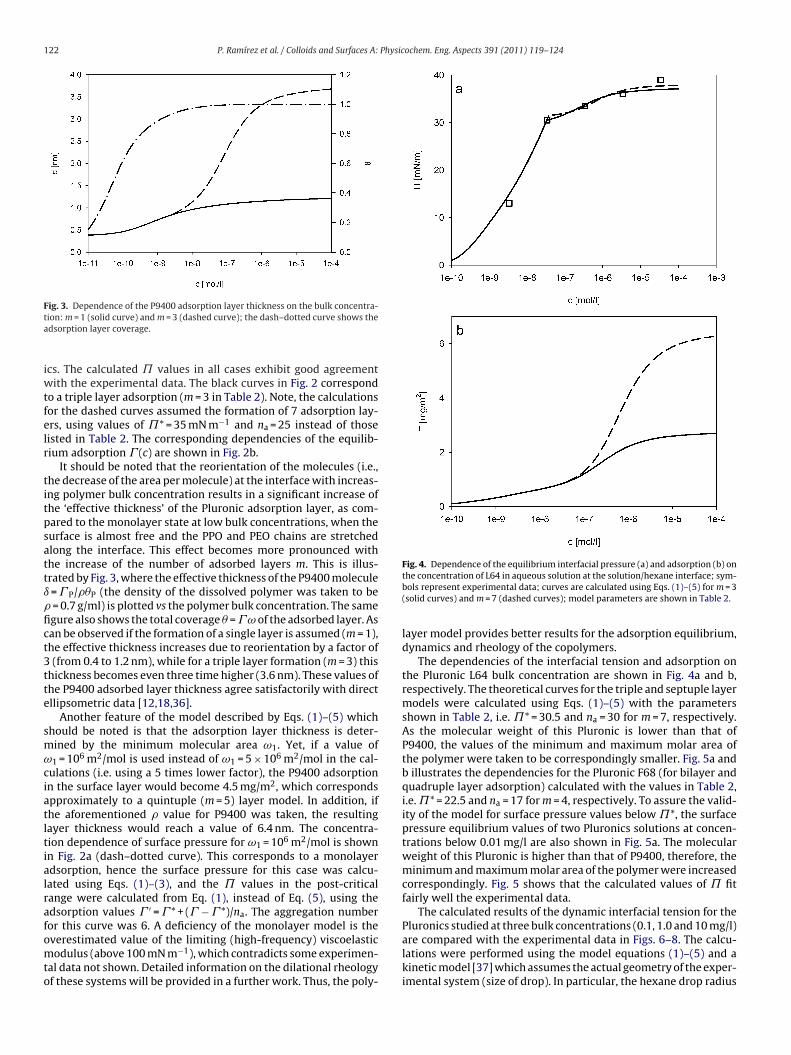
122 P. Ramírez et al. / Colloids and Surfaces A: Physicochem. Eng. Aspects 391 (2011) 119– 124
Fig. 3. Dependence of the P9400 adsorption layer thickness on the bulk concentra-ta
iwtfelr
titpsattıfict3tte
smωciatltialrafomto
Fig. 4. Dependence of the equilibrium interfacial pressure (a) and adsorption (b) on
ion: m = 1 (solid curve) and m = 3 (dashed curve); the dash–dotted curve shows thedsorption layer coverage.
cs. The calculated values in all cases exhibit good agreementith the experimental data. The black curves in Fig. 2 correspond
o a triple layer adsorption (m = 3 in Table 2). Note, the calculationsor the dashed curves assumed the formation of 7 adsorption lay-rs, using values of ˘* = 35 mN m−1 and na = 25 instead of thoseisted in Table 2. The corresponding dependencies of the equilib-ium adsorption (c) are shown in Fig. 2b.
It should be noted that the reorientation of the molecules (i.e.,he decrease of the area per molecule) at the interface with increas-ng polymer bulk concentration results in a significant increase ofhe ‘effective thickness’ of the Pluronic adsorption layer, as com-ared to the monolayer state at low bulk concentrations, when theurface is almost free and the PPO and PEO chains are stretchedlong the interface. This effect becomes more pronounced withhe increase of the number of adsorbed layers m. This is illus-rated by Fig. 3, where the effective thickness of the P9400 molecule
= P/P (the density of the dissolved polymer was taken to be = 0.7 g/ml) is plotted vs the polymer bulk concentration. The samegure also shows the total coverage = ω of the adsorbed layer. Asan be observed if the formation of a single layer is assumed (m = 1),he effective thickness increases due to reorientation by a factor of
(from 0.4 to 1.2 nm), while for a triple layer formation (m = 3) thishickness becomes even three time higher (3.6 nm). These values ofhe P9400 adsorbed layer thickness agree satisfactorily with directllipsometric data [12,18,36].
Another feature of the model described by Eqs. (1)–(5) whichhould be noted is that the adsorption layer thickness is deter-ined by the minimum molecular area ω1. Yet, if a value of1 = 106 m2/mol is used instead of ω1 = 5 × 10⁶ m2/mol in the cal-
ulations (i.e. using a 5 times lower factor), the P9400 adsorptionn the surface layer would become 4.5 mg/m2, which correspondspproximately to a quintuple (m = 5) layer model. In addition, ifhe aforementioned value for P9400 was taken, the resultingayer thickness would reach a value of 6.4 nm. The concentra-ion dependence of surface pressure for ω1 = 106 m2/mol is shownn Fig. 2a (dash–dotted curve). This corresponds to a monolayerdsorption, hence the surface pressure for this case was calcu-ated using Eqs. (1)–(3), and the values in the post-criticalange were calculated from Eq. (1), instead of Eq. (5), using thedsorption values ′ = * + ( − *)/na. The aggregation numberor this curve was 6. A deficiency of the monolayer model is theverestimated value of the limiting (high-frequency) viscoelastic
odulus (above 100 mN m−1), which contradicts some experimen-al data not shown. Detailed information on the dilational rheologyf these systems will be provided in a further work. Thus, the poly-
the concentration of L64 in aqueous solution at the solution/hexane interface; sym-bols represent experimental data; curves are calculated using Eqs. (1)–(5) for m = 3(solid curves) and m = 7 (dashed curves); model parameters are shown in Table 2.
layer model provides better results for the adsorption equilibrium,dynamics and rheology of the copolymers.
The dependencies of the interfacial tension and adsorption onthe Pluronic L64 bulk concentration are shown in Fig. 4a and b,respectively. The theoretical curves for the triple and septuple layermodels were calculated using Eqs. (1)–(5) with the parametersshown in Table 2, i.e. ˘* = 30.5 and na = 30 for m = 7, respectively.As the molecular weight of this Pluronic is lower than that ofP9400, the values of the minimum and maximum molar area ofthe polymer were taken to be correspondingly smaller. Fig. 5a andb illustrates the dependencies for the Pluronic F68 (for bilayer andquadruple layer adsorption) calculated with the values in Table 2,i.e. ˘* = 22.5 and na = 17 for m = 4, respectively. To assure the valid-ity of the model for surface pressure values below ˘*, the surfacepressure equilibrium values of two Pluronics solutions at concen-trations below 0.01 mg/l are also shown in Fig. 5a. The molecularweight of this Pluronic is higher than that of P9400, therefore, theminimum and maximum molar area of the polymer were increasedcorrespondingly. Fig. 5 shows that the calculated values of fitfairly well the experimental data.
The calculated results of the dynamic interfacial tension for thePluronics studied at three bulk concentrations (0.1, 1.0 and 10 mg/l)are compared with the experimental data in Figs. 6–8. The calcu-
lations were performed using the model equations (1)–(5) and akinetic model [37] which assumes the actual geometry of the exper-imental system (size of drop). In particular, the hexane drop radius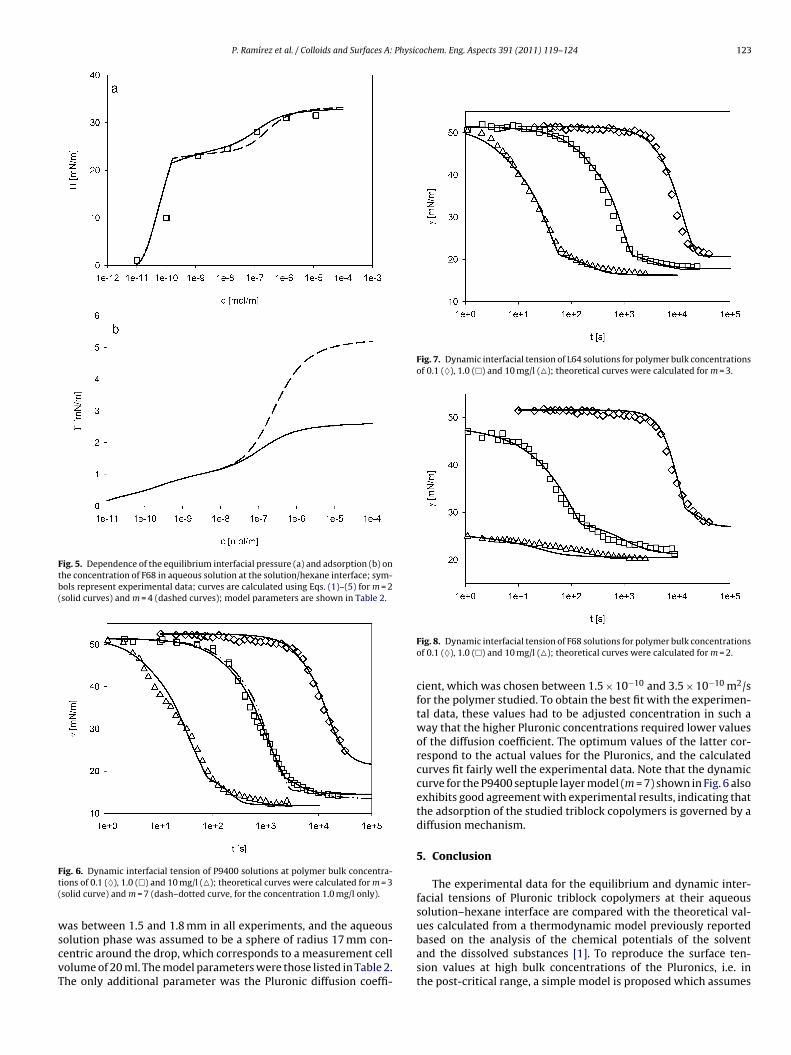
P. Ramírez et al. / Colloids and Surfaces A: Physicochem. Eng. Aspects 391 (2011) 119– 124 123
Fig. 5. Dependence of the equilibrium interfacial pressure (a) and adsorption (b) onthe concentration of F68 in aqueous solution at the solution/hexane interface; sym-bols represent experimental data; curves are calculated using Eqs. (1)–(5) for m = 2(solid curves) and m = 4 (dashed curves); model parameters are shown in Table 2.
Ft(
wscvT
Fig. 7. Dynamic interfacial tension of L64 solutions for polymer bulk concentrationsof 0.1 (♦), 1.0 () and 10 mg/l (); theoretical curves were calculated for m = 3.
ig. 6. Dynamic interfacial tension of P9400 solutions at polymer bulk concentra-ions of 0.1 (♦), 1.0 () and 10 mg/l (); theoretical curves were calculated for m = 3solid curve) and m = 7 (dash–dotted curve, for the concentration 1.0 mg/l only).
as between 1.5 and 1.8 mm in all experiments, and the aqueous
olution phase was assumed to be a sphere of radius 17 mm con-entric around the drop, which corresponds to a measurement cellolume of 20 ml. The model parameters were those listed in Table 2.he only additional parameter was the Pluronic diffusion coeffi-Fig. 8. Dynamic interfacial tension of F68 solutions for polymer bulk concentrationsof 0.1 (♦), 1.0 () and 10 mg/l (); theoretical curves were calculated for m = 2.
cient, which was chosen between 1.5 × 10⁻¹⁰ and 3.5 × 10⁻¹⁰ m2/sfor the polymer studied. To obtain the best fit with the experimen-tal data, these values had to be adjusted concentration in such away that the higher Pluronic concentrations required lower valuesof the diffusion coefficient. The optimum values of the latter cor-respond to the actual values for the Pluronics, and the calculatedcurves fit fairly well the experimental data. Note that the dynamiccurve for the P9400 septuple layer model (m = 7) shown in Fig. 6 alsoexhibits good agreement with experimental results, indicating thatthe adsorption of the studied triblock copolymers is governed by adiffusion mechanism.
5. Conclusion
The experimental data for the equilibrium and dynamic inter-facial tensions of Pluronic triblock copolymers at their aqueoussolution–hexane interface are compared with the theoretical val-ues calculated from a thermodynamic model previously reported
based on the analysis of the chemical potentials of the solventand the dissolved substances [1]. To reproduce the surface ten-sion values at high bulk concentrations of the Pluronics, i.e. inthe post-critical range, a simple model is proposed which assumes
1 Physic
taTmprv
A
CcTacP
R
[
[[
[
[
[
[[[
[[[
[[
[
[
[[[[
[
[
[
[
[
[[
[
24 P. Ramírez et al. / Colloids and Surfaces A:
he proportionality between the surface pressure of the solutionnd the adsorption of the polymer (expressed in kinetic units).his assumption is equivalent with an aggregation of the Pluroniconomers in the post-critical concentration range. The theoretical
redictions agree well with the experimental data for physicallyeasonable values of the adsorption layer thickness and realisticalues of the diffusion coefficient.
cknowledgements
This paper reports part of the results obtained in projectTQ2007-66157PPQ sponsored by the Spanish Ministerio de Cien-ia e Innovación and the European Commission (Feder Programme).he authors kindly acknowledge the financial support received. P.R.lso acknowledges the financial support of Deutscher Akademis-her Austauschdienst (DAAD) and Universidad de Sevilla (IV Planropio de Investigación).
eferences
[1] V.B. Fainerman, E.H. Lucassen-Reynders, R. Miller, Adv. Colloid Interface Sci.106 (2003) 237–259.
[2] P. Alexandridis, B. Lindman, Amphiphilic Block Copolymers: Self-assembly andApplications, Elsevier, 2000.
[3] D.L. Berthier, I. Schmidt, W. Fieber, C. Schatz, A. Furrer, K. Wong, S. Lecomman-doux, Langmuir 26 (2010) 7953–7961.
[4] D. Exerowa, G. Gotchev, T. Kolarov, K. Kristov, B. Levecke, T. Tadros, ColloidsSurf. A 335 (2009) 50–54.
[5] F. Leal-Calderon, V. Schmitt, J. Bibette, Emulsion Science, Basic Principles,Springer, 2007.
[6] X.R. Li, P.Z. Li, Y.H. Zhang, Y.X. Zhou, X.W. Chen, Y.Q. Huang, Y. Liu, Pharm. Res.27 (2010) 1498–1511.
[7] L.L. Schramm, Emulsions, Foams and Suspensions: Fundamentals and Applica-tions, Wiley-VCH, 2005.
[8] T. Tadros, Polymeric surfactants, in: K. Holmberg (Ed.), Novel Surfactants, Mar-cel Dekker, New York, 2003.
[9] T. Tadros, Applied Surfactants, Principles and Applications, Wiley-VCH, Wein-heim, 2005.
10] L. Tavano, R. Muzzalupo, S. Trombino, R. Cassano, A. Pingitore, N. Picci, ColloidsSurf. B 79 (2010) 227–234.
11] U. Zoller, Handbook of Detergents. Part E: Applications, CRC Press, 2009.12] M.G. Munoz, F. Monroy, F. Ortega, R.G. Rubio, D. Langevin, Langmuir 16 (2000)
1083–1093.
[
[
ochem. Eng. Aspects 391 (2011) 119– 124
13] M.G. Munoz, F. Monroy, F. Ortega, R.G. Rubio, D. Langevin, Langmuir 16 (2000)1094–1101.
14] B.R. Blomqvist, J.W. Benjamins, T. Nylander, T. Arnebrant, Langmuir 21 (2005)5061–5068.
15] A. Hambardzumyan, V. Aguie-Beghin, M. Daoud, R. Douillard, Langmuir 20(2004) 756–763.
16] R. Sedev, R. Steitz, G.H. Findenegg, Physica B 315 (2002) 267–272.17] J.B. Vieira, Z.X. Li, R.K. Thomas, J. Phys. Chem. B 106 (2002) 5400–5407.18] J.B. Vieira, Z.X. Li, R.K. Thomas, J. Penfold, J. Phys. Chem. B 106 (2002)
10641–10648.19] B.R. Blomqvist, T. Warnheim, P.M. Claesson, Langmuir 21 (2005) 6373–6384.20] C. Kim, H. Yu, Langmuir 19 (2003) 4460–4464.21] F. Monroy, F. Ortega, R.G. Rubio, B.A. Noskov, Surface rheology studies of spread
and adsorbed polymer layers, in: R. Miller, L. Liggieri (Eds.), Interfacial Rheology,Brill, Leiden, 2009.
22] B.A. Noskov, Curr. Opin. Colloid Interface Sci. 15 (2010) 229–236.23] B.A. Noskov, A.V. Akentiev, G. Loglio, R. Miller, J. Phys. Chem. B 104 (2000)
7923–7931.24] B.A. Noskov, S.Y. Lin, G. Loglio, R.G. Rubio, R. Miller, Langmuir 22 (2006)
2647–2652.25] V. Aguié-Béghin, E. Leclerc, M. Daoud, R. Douillard, J. Colloid Interface Sci. 214
(1999) 143–155.26] P.G. de Gennes, J. Phys. 37 (1976) 1445–1452.27] P.G. de Gennes, Macromolecules 13 (1980) 1069–1075.28] E. Leclerc, M. Daoud, Macromolecules 30 (1997) 293–300.29] V.S. Alahverdjieva, D.O. Grigoriev, V.B. Fainerman, E.V. Aksenenko, R. Miller, H.
Mohwald, J. Phys. Chem. B 112 (2008) 2136–2143.30] C. Kotsmar, V. Pradines, V.S. Alahverdjieva, E.V. Aksenenko, V.B. Fainerman, V.I.
Kovalchuk, J. Krägel, M.E. Leser, B.A. Noskov, R. Miller, Adv. Colloid InterfaceSci. 150 (2009) 41–54.
31] J. Maldonado-Valderrama, V.B. Fainerman, E. Aksenenko, M. Jose Gálvez-Ruiz, M.A. Cabrerizo-Vílchez, R. Miller, Colloids Surf. A 261 (2005)85–92.
32] V. Pradines, J.r. Krägel, V.B. Fainerman, R. Miller, J. Phys. Chem. B 113 (2008)745–751.
33] P. Reis, R. Miller, J. Krägel, M. Leser, V.B. Fainerman, H. Watzke, K. Holmberg,Langmuir 24 (2008) 6812–6819.
34] E.H. Lucassen-Reynders, J. Benjamins, V.B. Fainerman, Curr. Opin. Colloid Inter-face Sci. 15 (2010) 264–270.
35] V.B. Fainerman, R. Miller, Langmuir 15 (1999) 1812–1816.36] M.G. Munoz, F. Monroy, P. Hernandez, F. Ortega, R.G. Rubio, D. Langevin, Lang-
muir 19 (2003) 2147–2154.37] V.B. Fainerman, S.V. Lylyk, E.V. Aksenenko, L. Liggieri, A.V. Makievski, J.T. Petkov,
J. Yorke, R. Miller, Colloids Surf. A 334 (2009) 8–15.
38] G. Loglio, P. Pandolfini, R. Miller, A.V. Makievski, F. Ravera, M. Ferrari, L. Liggieri,Drop and bubble shape analysis as tool for dilational rheology of interfaciallayers, in: D. Möbius, R. Miller (Eds.), Novel Method to Study Interfacial Layers,Elsevier, 2001.
39] V.B. Fainerman, R. Miller, Colloids Surf. A 97 (1995) 65–82.

Paper IX Dilational rheology of polymer/surfactant mixtures at water/hexane interface Sharipova, S. Aidarova, N. Mucic and R. Miller Colloids and Surfaces A 391 (2011) 130‐134
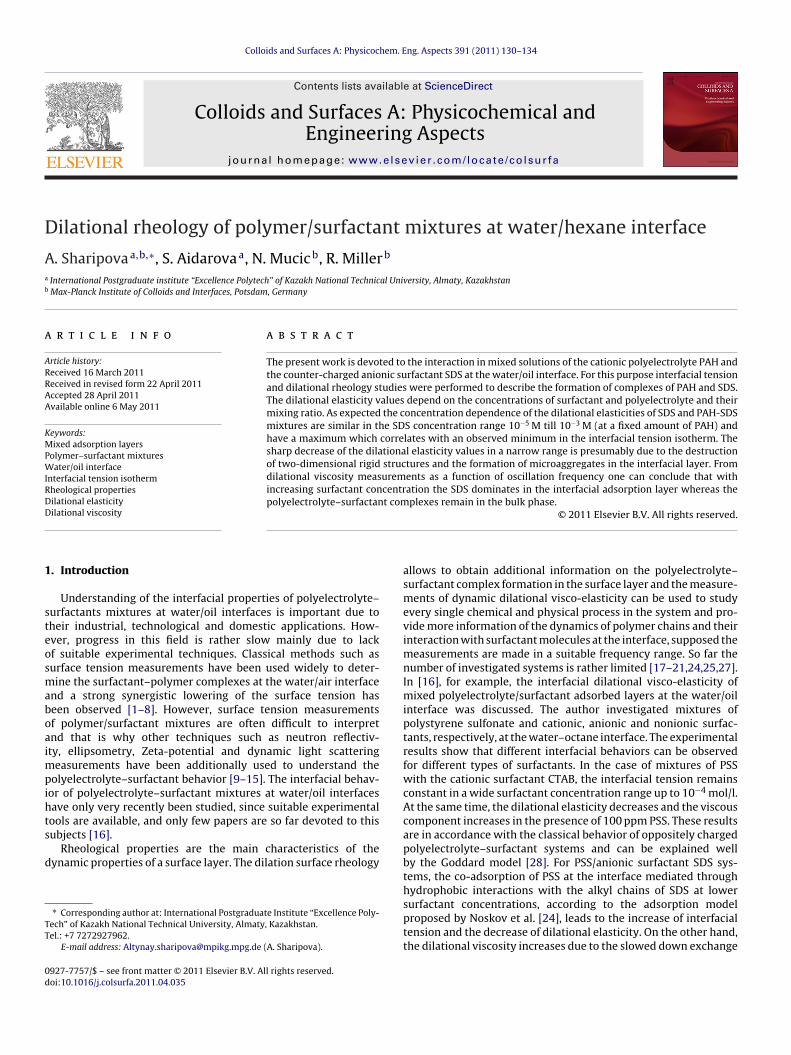
D
Aa
b
a
ARRAA
KMPWIRDD
1
steosmaboaimpihts
d
TT
0d
Colloids and Surfaces A: Physicochem. Eng. Aspects 391 (2011) 130– 134
Contents lists available at ScienceDirect
Colloids and Surfaces A: Physicochemical andEngineering Aspects
journa l h omepa g e: www.elsev ier .com/ locate /co lsur fa
ilational rheology of polymer/surfactant mixtures at water/hexane interface
. Sharipovaa,b,∗, S. Aidarovaa, N. Mucicb, R. Millerb
International Postgraduate institute “Excellence Polytech” of Kazakh National Technical University, Almaty, KazakhstanMax-Planck Institute of Colloids and Interfaces, Potsdam, Germany
r t i c l e i n f o
rticle history:eceived 16 March 2011eceived in revised form 22 April 2011ccepted 28 April 2011vailable online 6 May 2011
eywords:
a b s t r a c t
The present work is devoted to the interaction in mixed solutions of the cationic polyelectrolyte PAH andthe counter-charged anionic surfactant SDS at the water/oil interface. For this purpose interfacial tensionand dilational rheology studies were performed to describe the formation of complexes of PAH and SDS.The dilational elasticity values depend on the concentrations of surfactant and polyelectrolyte and theirmixing ratio. As expected the concentration dependence of the dilational elasticities of SDS and PAH-SDSmixtures are similar in the SDS concentration range 10−5 M till 10−3 M (at a fixed amount of PAH) andhave a maximum which correlates with an observed minimum in the interfacial tension isotherm. The
ixed adsorption layersolymer–surfactant mixturesater/oil interface
nterfacial tension isothermheological propertiesilational elasticity
sharp decrease of the dilational elasticity values in a narrow range is presumably due to the destructionof two-dimensional rigid structures and the formation of microaggregates in the interfacial layer. Fromdilational viscosity measurements as a function of oscillation frequency one can conclude that withincreasing surfactant concentration the SDS dominates in the interfacial adsorption layer whereas thepolyelectrolyte–surfactant complexes remain in the bulk phase.
ilational viscosity
. Introduction
Understanding of the interfacial properties of polyelectrolyte–urfactants mixtures at water/oil interfaces is important due toheir industrial, technological and domestic applications. How-ver, progress in this field is rather slow mainly due to lackf suitable experimental techniques. Classical methods such asurface tension measurements have been used widely to deter-ine the surfactant–polymer complexes at the water/air interface
nd a strong synergistic lowering of the surface tension haseen observed [1–8]. However, surface tension measurementsf polymer/surfactant mixtures are often difficult to interpretnd that is why other techniques such as neutron reflectiv-ty, ellipsometry, Zeta-potential and dynamic light scattering
easurements have been additionally used to understand theolyelectrolyte–surfactant behavior [9–15]. The interfacial behav-
or of polyelectrolyte–surfactant mixtures at water/oil interfacesave only very recently been studied, since suitable experimentalools are available, and only few papers are so far devoted to this
ubjects [16].Rheological properties are the main characteristics of theynamic properties of a surface layer. The dilation surface rheology
∗ Corresponding author at: International Postgraduate Institute “Excellence Poly-ech” of Kazakh National Technical University, Almaty, Kazakhstan.el.: +7 7272927962.
E-mail address: [email protected] (A. Sharipova).
927-7757/$ – see front matter © 2011 Elsevier B.V. All rights reserved.oi:10.1016/j.colsurfa.2011.04.035
© 2011 Elsevier B.V. All rights reserved.
allows to obtain additional information on the polyelectrolyte–surfactant complex formation in the surface layer and the measure-ments of dynamic dilational visco-elasticity can be used to studyevery single chemical and physical process in the system and pro-vide more information of the dynamics of polymer chains and theirinteraction with surfactant molecules at the interface, supposed themeasurements are made in a suitable frequency range. So far thenumber of investigated systems is rather limited [17–21,24,25,27].In [16], for example, the interfacial dilational visco-elasticity ofmixed polyelectrolyte/surfactant adsorbed layers at the water/oilinterface was discussed. The author investigated mixtures ofpolystyrene sulfonate and cationic, anionic and nonionic surfac-tants, respectively, at the water–octane interface. The experimentalresults show that different interfacial behaviors can be observedfor different types of surfactants. In the case of mixtures of PSSwith the cationic surfactant CTAB, the interfacial tension remainsconstant in a wide surfactant concentration range up to 10−4 mol/l.At the same time, the dilational elasticity decreases and the viscouscomponent increases in the presence of 100 ppm PSS. These resultsare in accordance with the classical behavior of oppositely chargedpolyelectrolyte–surfactant systems and can be explained wellby the Goddard model [28]. For PSS/anionic surfactant SDS sys-tems, the co-adsorption of PSS at the interface mediated throughhydrophobic interactions with the alkyl chains of SDS at lower
surfactant concentrations, according to the adsorption modelproposed by Noskov et al. [24], leads to the increase of interfacialtension and the decrease of dilational elasticity. On the other hand,the dilational viscosity increases due to the slowed down exchange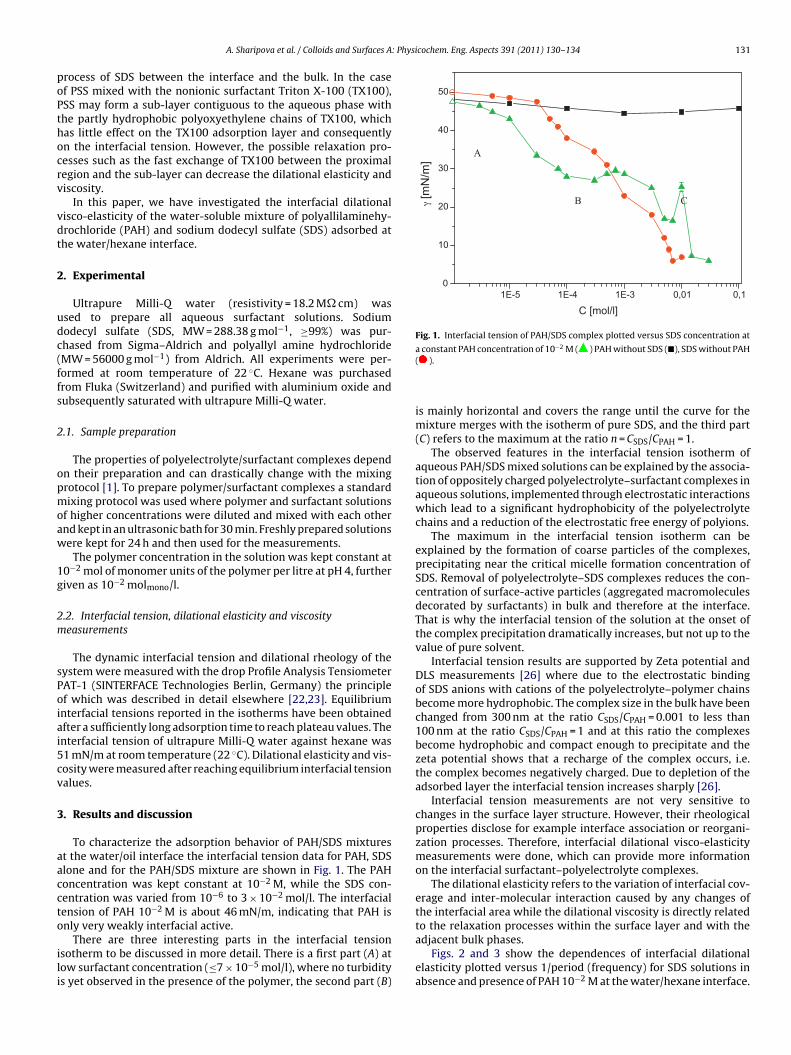
: Physicochem. Eng. Aspects 391 (2011) 130– 134 131
poPthocrv
vdt
2
udc(ffs
2
opmoaw
1g
2m
sPoiai5cv
3
aaccto
ili
0,10,011E-31E-41E-50
10
20
30
40
50
γ [m
N/m
]
C [mol/l]
A
C B
Fig. 1. Interfacial tension of PAH/SDS complex plotted versus SDS concentration at
a constant PAH concentration of 10−2 M ( ) PAH without SDS (), SDS without PAH
A. Sharipova et al. / Colloids and Surfaces A
rocess of SDS between the interface and the bulk. In the casef PSS mixed with the nonionic surfactant Triton X-100 (TX100),SS may form a sub-layer contiguous to the aqueous phase withhe partly hydrophobic polyoxyethylene chains of TX100, whichas little effect on the TX100 adsorption layer and consequentlyn the interfacial tension. However, the possible relaxation pro-esses such as the fast exchange of TX100 between the proximalegion and the sub-layer can decrease the dilational elasticity andiscosity.
In this paper, we have investigated the interfacial dilationalisco-elasticity of the water-soluble mixture of polyallilaminehy-rochloride (PAH) and sodium dodecyl sulfate (SDS) adsorbed athe water/hexane interface.
. Experimental
Ultrapure Milli-Q water (resistivity = 18.2 M cm) wassed to prepare all aqueous surfactant solutions. Sodiumodecyl sulfate (SDS, MW = 288.38 g mol−1, ≥99%) was pur-hased from Sigma–Aldrich and polyallyl amine hydrochlorideMW = 56000 g mol−1) from Aldrich. All experiments were per-ormed at room temperature of 22 C. Hexane was purchasedrom Fluka (Switzerland) and purified with aluminium oxide andubsequently saturated with ultrapure Milli-Q water.
.1. Sample preparation
The properties of polyelectrolyte/surfactant complexes dependn their preparation and can drastically change with the mixingrotocol [1]. To prepare polymer/surfactant complexes a standardixing protocol was used where polymer and surfactant solutions
f higher concentrations were diluted and mixed with each othernd kept in an ultrasonic bath for 30 min. Freshly prepared solutionsere kept for 24 h and then used for the measurements.
The polymer concentration in the solution was kept constant at0−2 mol of monomer units of the polymer per litre at pH 4, furtheriven as 10−2 molmono/l.
.2. Interfacial tension, dilational elasticity and viscosityeasurements
The dynamic interfacial tension and dilational rheology of theystem were measured with the drop Profile Analysis TensiometerAT-1 (SINTERFACE Technologies Berlin, Germany) the principlef which was described in detail elsewhere [22,23]. Equilibriumnterfacial tensions reported in the isotherms have been obtainedfter a sufficiently long adsorption time to reach plateau values. Thenterfacial tension of ultrapure Milli-Q water against hexane was1 mN/m at room temperature (22 C). Dilational elasticity and vis-osity were measured after reaching equilibrium interfacial tensionalues.
. Results and discussion
To characterize the adsorption behavior of PAH/SDS mixturest the water/oil interface the interfacial tension data for PAH, SDSlone and for the PAH/SDS mixture are shown in Fig. 1. The PAHoncentration was kept constant at 10−2 M, while the SDS con-entration was varied from 10−6 to 3 × 10⁻² mol/l. The interfacialension of PAH 10−2 M is about 46 mN/m, indicating that PAH isnly very weakly interfacial active.
There are three interesting parts in the interfacial tensionsotherm to be discussed in more detail. There is a first part (A) atow surfactant concentration (≤7 × 10⁻⁵ mol/l), where no turbiditys yet observed in the presence of the polymer, the second part (B)
( ).
is mainly horizontal and covers the range until the curve for themixture merges with the isotherm of pure SDS, and the third part(C) refers to the maximum at the ratio n = CSDS/CPAH = 1.
The observed features in the interfacial tension isotherm ofaqueous PAH/SDS mixed solutions can be explained by the associa-tion of oppositely charged polyelectrolyte–surfactant complexes inaqueous solutions, implemented through electrostatic interactionswhich lead to a significant hydrophobicity of the polyelectrolytechains and a reduction of the electrostatic free energy of polyions.
The maximum in the interfacial tension isotherm can beexplained by the formation of coarse particles of the complexes,precipitating near the critical micelle formation concentration ofSDS. Removal of polyelectrolyte–SDS complexes reduces the con-centration of surface-active particles (aggregated macromoleculesdecorated by surfactants) in bulk and therefore at the interface.That is why the interfacial tension of the solution at the onset ofthe complex precipitation dramatically increases, but not up to thevalue of pure solvent.
Interfacial tension results are supported by Zeta potential andDLS measurements [26] where due to the electrostatic bindingof SDS anions with cations of the polyelectrolyte–polymer chainsbecome more hydrophobic. The complex size in the bulk have beenchanged from 300 nm at the ratio CSDS/CPAH = 0.001 to less than100 nm at the ratio CSDS/CPAH = 1 and at this ratio the complexesbecome hydrophobic and compact enough to precipitate and thezeta potential shows that a recharge of the complex occurs, i.e.the complex becomes negatively charged. Due to depletion of theadsorbed layer the interfacial tension increases sharply [26].
Interfacial tension measurements are not very sensitive tochanges in the surface layer structure. However, their rheologicalproperties disclose for example interface association or reorgani-zation processes. Therefore, interfacial dilational visco-elasticitymeasurements were done, which can provide more informationon the interfacial surfactant–polyelectrolyte complexes.
The dilational elasticity refers to the variation of interfacial cov-erage and inter-molecular interaction caused by any changes ofthe interfacial area while the dilational viscosity is directly relatedto the relaxation processes within the surface layer and with theadjacent bulk phases.
Figs. 2 and 3 show the dependences of interfacial dilationalelasticity plotted versus 1/period (frequency) for SDS solutions inabsence and presence of PAH 10−2 M at the water/hexane interface.
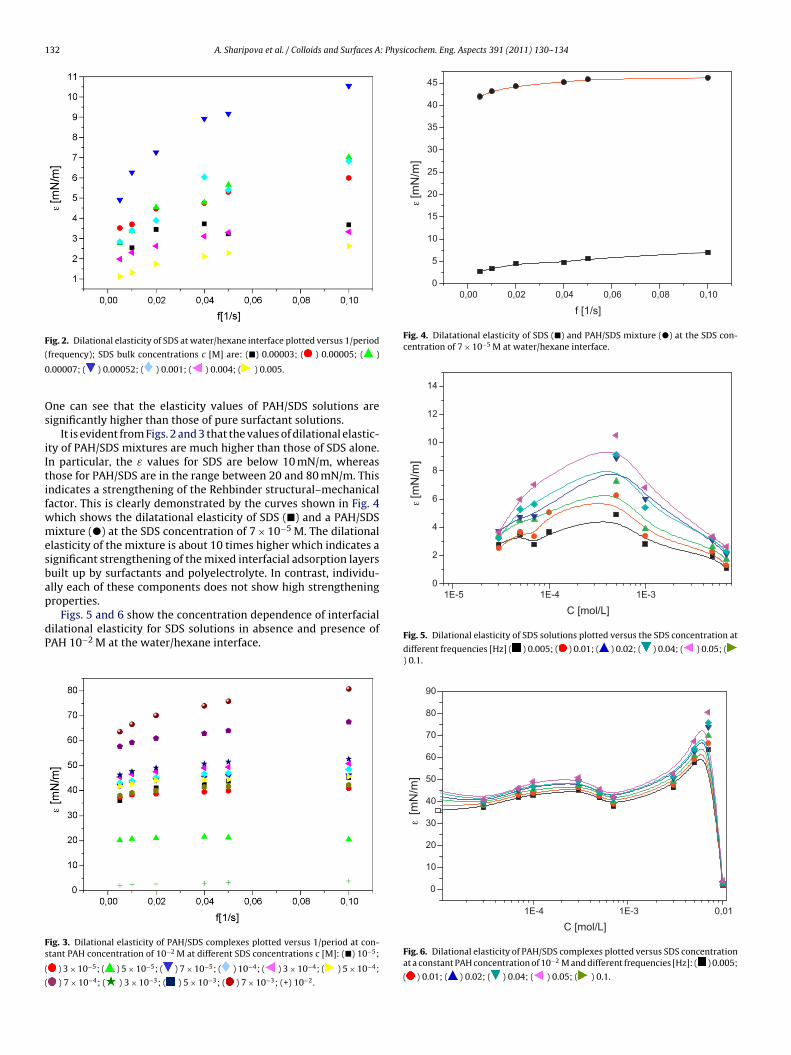
132 A. Sharipova et al. / Colloids and Surfaces A: Physicochem. Eng. Aspects 391 (2011) 130– 134
Fig. 2. Dilational elasticity of SDS at water/hexane interface plotted versus 1/period
(
0
Os
iItifwmesbap
dP
Fs
(
(
0,100,080,060,040,020,000
5
10
15
20
25
30
35
40
45
ε [m
N/m
]
f [1/s]
Fig. 4. Dilatational elasticity of SDS () and PAH/SDS mixture () at the SDS con-centration of 7 × 10⁻⁵ M at water/hexane interface.
1E-31E-41E-50
2
4
6
8
10
12
14
ε [m
N/m
]
frequency); SDS bulk concentrations c [M] are: () 0.00003; ( ) 0.00005; ( )
.00007; ( ) 0.00052; ( ) 0.001; ( ) 0.004; ( ) 0.005.
ne can see that the elasticity values of PAH/SDS solutions areignificantly higher than those of pure surfactant solutions.
It is evident from Figs. 2 and 3 that the values of dilational elastic-ty of PAH/SDS mixtures are much higher than those of SDS alone.n particular, the ε values for SDS are below 10 mN/m, whereashose for PAH/SDS are in the range between 20 and 80 mN/m. Thisndicates a strengthening of the Rehbinder structural–mechanicalactor. This is clearly demonstrated by the curves shown in Fig. 4hich shows the dilatational elasticity of SDS () and a PAH/SDSixture () at the SDS concentration of 7 × 10⁻⁵ M. The dilational
lasticity of the mixture is about 10 times higher which indicates aignificant strengthening of the mixed interfacial adsorption layersuilt up by surfactants and polyelectrolyte. In contrast, individu-lly each of these components does not show high strengtheningroperties.
Figs. 5 and 6 show the concentration dependence of interfacialilational elasticity for SDS solutions in absence and presence ofAH 10−2 M at the water/hexane interface.
ig. 3. Dilational elasticity of PAH/SDS complexes plotted versus 1/period at con-tant PAH concentration of 10−2 M at different SDS concentrations c [M]: () 10−5;
) 3 × 10⁻⁵; ( ) 5 × 10⁻⁵; ( ) 7 × 10⁻⁵; ( ) 10−4; ( ) 3 × 10⁻⁴; ( ) 5 × 10⁻⁴;
) 7 × 10⁻⁴; ( ) 3 × 10⁻³; ( ) 5 × 10⁻³; ( ) 7 × 10⁻³; (+) 10−2.
C [mol/L]
Fig. 5. Dilational elasticity of SDS solutions plotted versus the SDS concentration at
different frequencies [Hz] ( ) 0.005; ( ) 0.01; ( ) 0.02; ( ) 0.04; ( ) 0.05; () 0.1.
0,011E-31E-4
0
10
20
30
40
50
60
70
80
90
ε [m
N/m
]
C [mol/L]
Fig. 6. Dilational elasticity of PAH/SDS complexes plotted versus SDS concentrationat a constant PAH concentration of 10−2 M and different frequencies [Hz]: ( ) 0.005;
( ) 0.01; ( ) 0.02; ( ) 0.04; ( ) 0.05; ( ) 0.1.
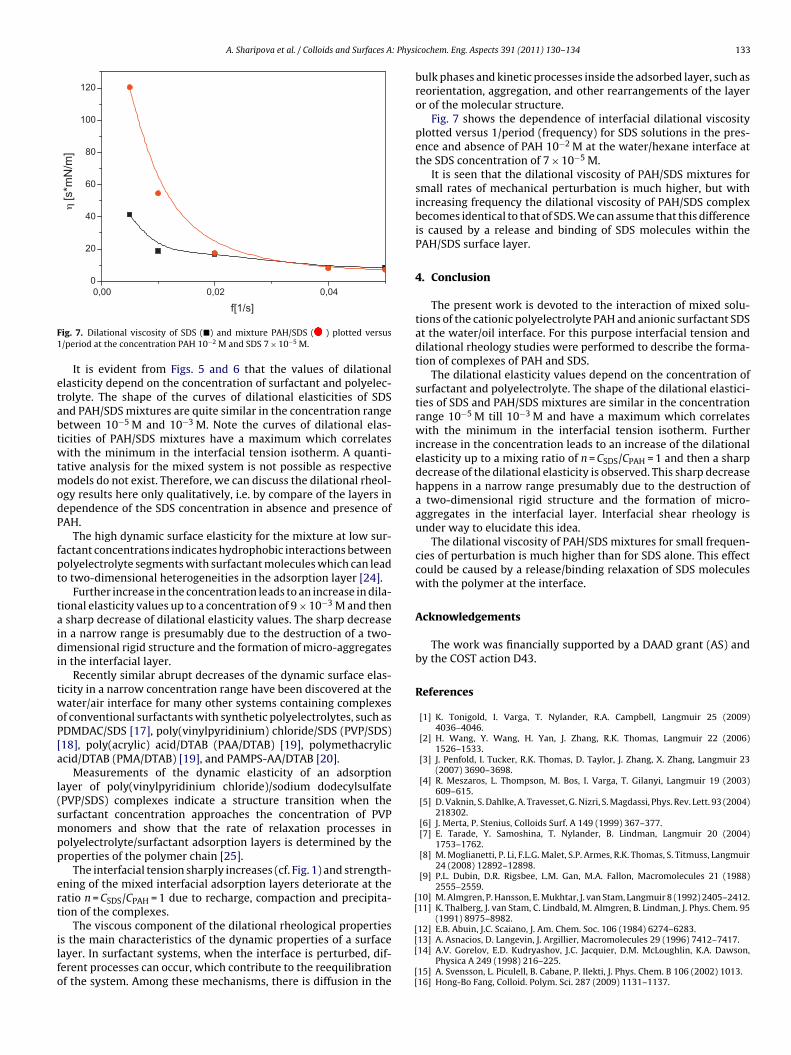
A. Sharipova et al. / Colloids and Surfaces A: Physi
0,040,020,000
20
40
60
80
100
120
η [s
*mN
/m]
f[1/s]
F1
etabtwtmodP
fpt
taidi
twoP[a
l(smpp
ert
ilfo
[[
[
ig. 7. Dilational viscosity of SDS () and mixture PAH/SDS ( ) plotted versus/period at the concentration PAH 10−2 M and SDS 7 × 10⁻⁵ M.
It is evident from Figs. 5 and 6 that the values of dilationallasticity depend on the concentration of surfactant and polyelec-rolyte. The shape of the curves of dilational elasticities of SDSnd PAH/SDS mixtures are quite similar in the concentration rangeetween 10−5 M and 10−3 M. Note the curves of dilational elas-icities of PAH/SDS mixtures have a maximum which correlatesith the minimum in the interfacial tension isotherm. A quanti-
ative analysis for the mixed system is not possible as respectiveodels do not exist. Therefore, we can discuss the dilational rheol-
gy results here only qualitatively, i.e. by compare of the layers inependence of the SDS concentration in absence and presence ofAH.
The high dynamic surface elasticity for the mixture at low sur-actant concentrations indicates hydrophobic interactions betweenolyelectrolyte segments with surfactant molecules which can leado two-dimensional heterogeneities in the adsorption layer [24].
Further increase in the concentration leads to an increase in dila-ional elasticity values up to a concentration of 9 × 10⁻³ M and then
sharp decrease of dilational elasticity values. The sharp decreasen a narrow range is presumably due to the destruction of a two-imensional rigid structure and the formation of micro-aggregates
n the interfacial layer.Recently similar abrupt decreases of the dynamic surface elas-
icity in a narrow concentration range have been discovered at theater/air interface for many other systems containing complexes
f conventional surfactants with synthetic polyelectrolytes, such asDMDAC/SDS [17], poly(vinylpyridinium) chloride/SDS (PVP/SDS)18], poly(acrylic) acid/DTAB (PAA/DTAB) [19], polymethacryliccid/DTAB (PMA/DTAB) [19], and PAMPS-AA/DTAB [20].
Measurements of the dynamic elasticity of an adsorptionayer of poly(vinylpyridinium chloride)/sodium dodecylsulfatePVP/SDS) complexes indicate a structure transition when theurfactant concentration approaches the concentration of PVPonomers and show that the rate of relaxation processes in
olyelectrolyte/surfactant adsorption layers is determined by theroperties of the polymer chain [25].
The interfacial tension sharply increases (cf. Fig. 1) and strength-ning of the mixed interfacial adsorption layers deteriorate at theatio n = CSDS/CPAH = 1 due to recharge, compaction and precipita-ion of the complexes.
The viscous component of the dilational rheological properties
s the main characteristics of the dynamic properties of a surfaceayer. In surfactant systems, when the interface is perturbed, dif-erent processes can occur, which contribute to the reequilibrationf the system. Among these mechanisms, there is diffusion in the[[
[[
cochem. Eng. Aspects 391 (2011) 130– 134 133
bulk phases and kinetic processes inside the adsorbed layer, such asreorientation, aggregation, and other rearrangements of the layeror of the molecular structure.
Fig. 7 shows the dependence of interfacial dilational viscosityplotted versus 1/period (frequency) for SDS solutions in the pres-ence and absence of PAH 10−2 M at the water/hexane interface atthe SDS concentration of 7 × 10⁻⁵ M.
It is seen that the dilational viscosity of PAH/SDS mixtures forsmall rates of mechanical perturbation is much higher, but withincreasing frequency the dilational viscosity of PAH/SDS complexbecomes identical to that of SDS. We can assume that this differenceis caused by a release and binding of SDS molecules within thePAH/SDS surface layer.
4. Conclusion
The present work is devoted to the interaction of mixed solu-tions of the cationic polyelectrolyte PAH and anionic surfactant SDSat the water/oil interface. For this purpose interfacial tension anddilational rheology studies were performed to describe the forma-tion of complexes of PAH and SDS.
The dilational elasticity values depend on the concentration ofsurfactant and polyelectrolyte. The shape of the dilational elastici-ties of SDS and PAH/SDS mixtures are similar in the concentrationrange 10−5 M till 10−3 M and have a maximum which correlateswith the minimum in the interfacial tension isotherm. Furtherincrease in the concentration leads to an increase of the dilationalelasticity up to a mixing ratio of n = CSDS/CPAH = 1 and then a sharpdecrease of the dilational elasticity is observed. This sharp decreasehappens in a narrow range presumably due to the destruction ofa two-dimensional rigid structure and the formation of micro-aggregates in the interfacial layer. Interfacial shear rheology isunder way to elucidate this idea.
The dilational viscosity of PAH/SDS mixtures for small frequen-cies of perturbation is much higher than for SDS alone. This effectcould be caused by a release/binding relaxation of SDS moleculeswith the polymer at the interface.
Acknowledgements
The work was financially supported by a DAAD grant (AS) andby the COST action D43.
References
[1] K. Tonigold, I. Varga, T. Nylander, R.A. Campbell, Langmuir 25 (2009)4036–4046.
[2] H. Wang, Y. Wang, H. Yan, J. Zhang, R.K. Thomas, Langmuir 22 (2006)1526–1533.
[3] J. Penfold, I. Tucker, R.K. Thomas, D. Taylor, J. Zhang, X. Zhang, Langmuir 23(2007) 3690–3698.
[4] R. Meszaros, L. Thompson, M. Bos, I. Varga, T. Gilanyi, Langmuir 19 (2003)609–615.
[5] D. Vaknin, S. Dahlke, A. Travesset, G. Nizri, S. Magdassi, Phys. Rev. Lett. 93 (2004)218302.
[6] J. Merta, P. Stenius, Colloids Surf. A 149 (1999) 367–377.[7] E. Tarade, Y. Samoshina, T. Nylander, B. Lindman, Langmuir 20 (2004)
1753–1762.[8] M. Moglianetti, P. Li, F.L.G. Malet, S.P. Armes, R.K. Thomas, S. Titmuss, Langmuir
24 (2008) 12892–12898.[9] P.L. Dubin, D.R. Rigsbee, L.M. Gan, M.A. Fallon, Macromolecules 21 (1988)
2555–2559.10] M. Almgren, P. Hansson, E. Mukhtar, J. van Stam, Langmuir 8 (1992) 2405–2412.11] K. Thalberg, J. van Stam, C. Lindbald, M. Almgren, B. Lindman, J. Phys. Chem. 95
(1991) 8975–8982.12] E.B. Abuin, J.C. Scaiano, J. Am. Chem. Soc. 106 (1984) 6274–6283.
13] A. Asnacios, D. Langevin, J. Argillier, Macromolecules 29 (1996) 7412–7417.14] A.V. Gorelov, E.D. Kudryashov, J.C. Jacquier, D.M. McLoughlin, K.A. Dawson,Physica A 249 (1998) 216–225.15] A. Svensson, L. Piculell, B. Cabane, P. Ilekti, J. Phys. Chem. B 106 (2002) 1013.16] Hong-Bo Fang, Colloid. Polym. Sci. 287 (2009) 1131–1137.
1 : Phys
[
[
[
[[
[
[
[[
34 A. Sharipova et al. / Colloids and Surfaces A
17] B. Noskov, D. Grigoriev, S. Lin, G. Loglio, R. Miller, Langmuir 23 (2007)9641–9651.
18] B. Noskov, A. Bykov, D. Grigoriev, S. Lin, G. Loglio, R. Miller, Colloids Surf. A 322(2008) 71–78.
19] A. Bykov, S. Lin, G. Loglio, R. Miller, B. Noskov, J. Phys. Chem. C 113 (2009)5664–5671.
20] B. Noskov, G. Loglio, S. Lin, R. Miller, J. Colloid Interface Sci. 301 (2006) 386–394.21] A. Diez-Pascual, F. Monroy, F. Ortega, R. Rubio, R. Miller, B. Noskov, Langmuir
23 (2007) 3802–3808.22] G. Loglio, P. Pandolfini, R. Miller, A.V. Makievski, F. Ravera, M. Ferrari, L.
Liggieri, Novel Methods to Study Interfacial Layers, in: D. Möbius, R. Miller
[
[[
icochem. Eng. Aspects 391 (2011) 130– 134
(Eds.), Studies in Interface Science, vol. 11, Elsevier, Amsterdam, 2001,pp. 439–484.
23] S.A. Zholob, A.V. Makievski, R. Miller, V.B. Fainerman, Adv. Colloid Interface Sci.134–135 (2007) 322.
24] B. Noskov, G. Loglio, R. Miller, J. Phys. Chem. B 108 (2004) 18615–18622.25] A. Bykov, S. Lin, G. Loglio, R. Miller, B. Noskov, Mendeleev Commun. 18 (2008)
342–344.26] A. Sharipova, S. Aidarova, V.B. Fainerman, A. Stocco, P. Cernoch, R. Miller, Col-
loids Surf. A: Physicochem. Eng. Aspects 391 (2011) 112–118.27] B. Noskov, Curr. Opin. Colloid Interface Sci. 15 (2010) 229–236.28] E.D. Goddard, J. Colloid Interface Sci. 256 (2002) 228–235.

Paper X Competitive adsorption at water/oil interface as a tool for controlling the emulsion stability and breaking N. Mucic, B. Reetz and R. Miller Beiersdorf project report, 2012
Competitive adsorption at water/oil interface as a tool for controlling the emulsion stability and breaking
N. Mucic1, B. Reetz1 and R. Miller1
1 Max Planck Institute of Colloids and Interfaces, D14476 Golm, Germany
Introduction Emulsion stability and phase separation are major characteristics of emulsions in general. Good grades of both characteristics guarantee good quality of the emulsion. In our investigation we have focused, by using the fundamental knowledge of interfacial science, to improve these characteristics. Emulsion stability depends on many factors: drops size, drops distribution, used emulsifiers and their concentrations, electrolytes content, oil phases and temperature. In our investigations we have manipulated just with oil phases and emulsifiers at different concentrations assuming that these factors play a main roll also in the emulsion phase separation. Searching for good oil phase and emulsifier we have measured the interfacial tension between aqueous and oil phases on PAT‐1 and ODBA‐1 techniques. Obtained adsorption kinetic isotherms give a good overview on dynamic properties of aqueous surfactants solution/different oils interfaces. To quantify emulsion stability it was measured the emulsion’s life time. The emulsion’s life time is a sum of stability time and breaking time. For a good emulsion the stability time have to be long and breaking time as short as possible. We succeeded in this by involving the surfactants competitive adsorption from both water and oil phases. More about this method will be presented in the text below.
2
Materials and Methods The materials used in this work were kindly provided by Beiersdorf, Hamburg. For the aqueous phase we have received the so called “water with emulsifier” that was used as a stock solution for preparing diluted solutions. No certain information on its concentration and purity is known. For the oil phases we have received a number of different oils: C12‐15 Alkyl Benzoate, C13‐16 Isoparaffin, Caprylic‐Capric Triglyceride, Cyclomethicone, Dicaprylyl, Dimethicone, Ethylhexyl Stearate, Isododecane, Isohexadecane, Isopropyl Palmitate and Polybutene. Likewise, without the information on the water/oil interfacial tension and impurity content we have measure the interfacial tension against pure Milli‐Q water and so concluded about the equilibrium interfacial tension and purity of oils. In a part of the investigation we have measured the surfactant Span80 dissolved in the oil phase. Span80 was purchased from ___ with purity ___. The experimental methods used in the research are described below.
Profile Analysis Tensiometer (PAT‐1) It is a pended drop (or bubble) method, based on the principles of measuring the surface/interfacial tension via analyzing the shape of the measured drop (or bubble). The method is suitable for both liquid‐air and liquid‐liquid interfaces. There is no limitation on the magnitude of surface or interfacial tension, accessible in a broad range of temperatures and external pressures. For measurements at constant interfacial area the time window ranges from about one second up to hours and days so that even extremely slow processes can be easily followed.
Capillary Pressure Analyzer (ODBA) This method is newer generation than PAT‐1. It is established very well and allows recording of the water/air or water/oil interfacial tension with time in a time window down to few milliseconds. This is primarily because the surface/interfacial tension is obtained on another principle, via measuring the capillary pressure in the measured drop (or bubble) with sensitive pressure senzor.
Emulsion stability A typical method for quantification of emulsion stability is measuring of the emulsion’s life time. This means measurement of time after emulsification until the emulsion’s breaking i.e. phase separation. In our experiments we have called this time the total time, ttot. It splits into stability time and breaking time, respectively. The stability time is time until first drops coalesced. The breaking time begins with drops coalescence and end up with the phase separation.
Results and Discussion
In order to determine the impurity content in the investigated oils and their equilibrium interfacial tension, we have measured the interfacial tension at the water/different oils interfaces with time. It is known that impurities adsorb at the interface after some time depending on the impurity concentration in the bulk [N. Mucic et al.], as it is seen in the Fig. 1.
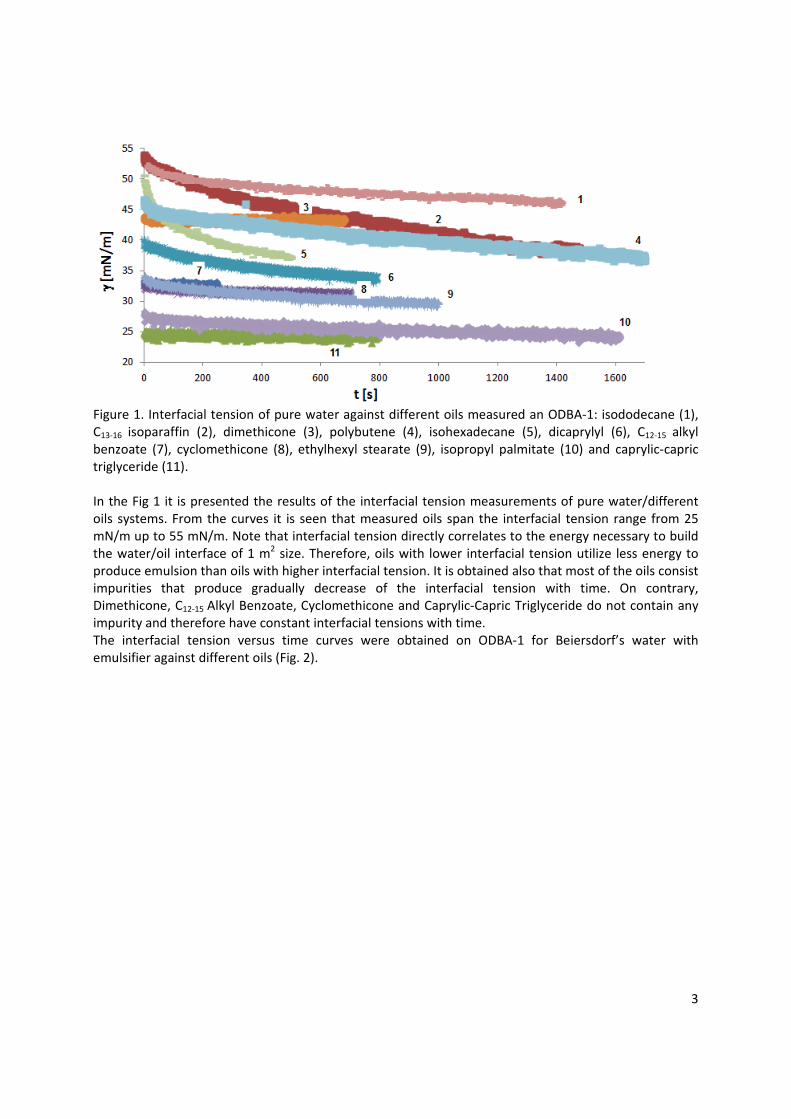
3
Figure 1. Interfacial tension of pure water against different oils measured an ODBA‐1: isododecane (1), C13‐16 isoparaffin (2), dimethicone (3), polybutene (4), isohexadecane (5), dicaprylyl (6), C12‐15 alkyl benzoate (7), cyclomethicone (8), ethylhexyl stearate (9), isopropyl palmitate (10) and caprylic‐capric triglyceride (11). In the Fig 1 it is presented the results of the interfacial tension measurements of pure water/different oils systems. From the curves it is seen that measured oils span the interfacial tension range from 25 mN/m up to 55 mN/m. Note that interfacial tension directly correlates to the energy necessary to build the water/oil interface of 1 m2 size. Therefore, oils with lower interfacial tension utilize less energy to produce emulsion than oils with higher interfacial tension. It is obtained also that most of the oils consist impurities that produce gradually decrease of the interfacial tension with time. On contrary, Dimethicone, C12‐15 Alkyl Benzoate, Cyclomethicone and Caprylic‐Capric Triglyceride do not contain any impurity and therefore have constant interfacial tensions with time. The interfacial tension versus time curves were obtained on ODBA‐1 for Beiersdorf’s water with emulsifier against different oils (Fig. 2).
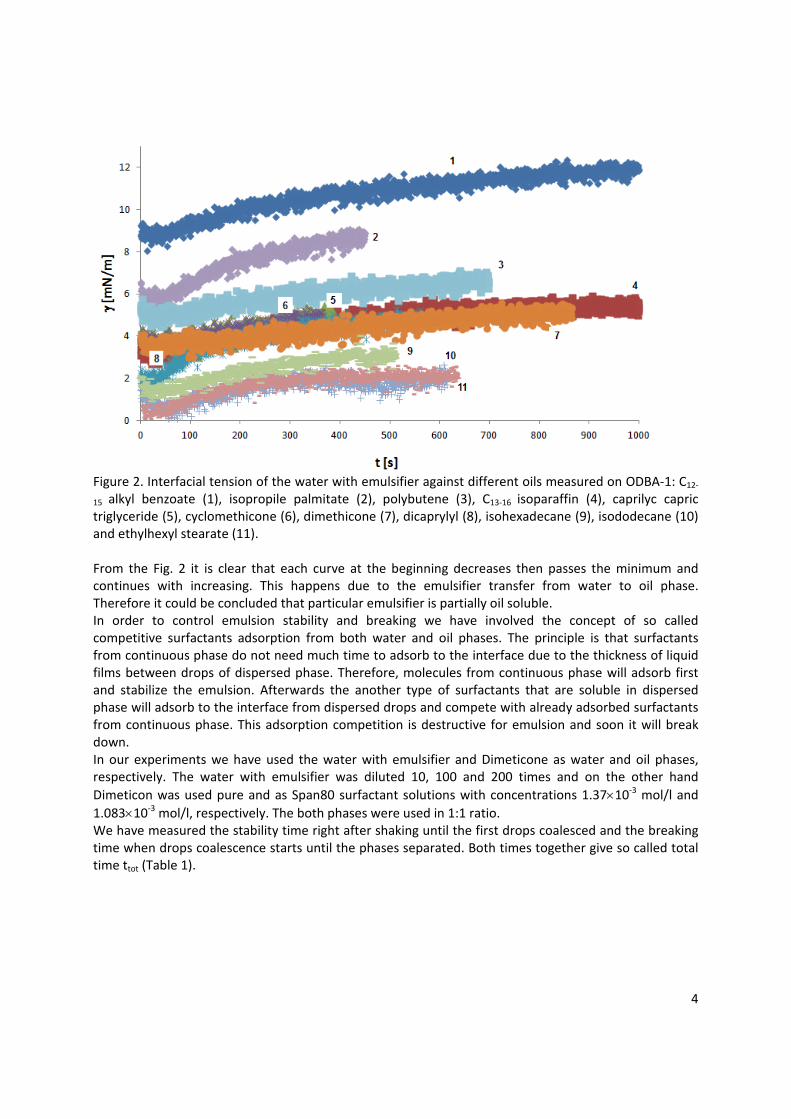
4
Figure 2. Interfacial tension of the water with emulsifier against different oils measured on ODBA‐1: C12‐
15 alkyl benzoate (1), isopropile palmitate (2), polybutene (3), C13‐16 isoparaffin (4), caprilyc capric triglyceride (5), cyclomethicone (6), dimethicone (7), dicaprylyl (8), isohexadecane (9), isododecane (10) and ethylhexyl stearate (11). From the Fig. 2 it is clear that each curve at the beginning decreases then passes the minimum and continues with increasing. This happens due to the emulsifier transfer from water to oil phase. Therefore it could be concluded that particular emulsifier is partially oil soluble. In order to control emulsion stability and breaking we have involved the concept of so called competitive surfactants adsorption from both water and oil phases. The principle is that surfactants from continuous phase do not need much time to adsorb to the interface due to the thickness of liquid films between drops of dispersed phase. Therefore, molecules from continuous phase will adsorb first and stabilize the emulsion. Afterwards the another type of surfactants that are soluble in dispersed phase will adsorb to the interface from dispersed drops and compete with already adsorbed surfactants from continuous phase. This adsorption competition is destructive for emulsion and soon it will break down. In our experiments we have used the water with emulsifier and Dimeticone as water and oil phases, respectively. The water with emulsifier was diluted 10, 100 and 200 times and on the other hand
Dimeticon was used pure and as Span80 surfactant solutions with concentrations 1.3710‐3 mol/l and
1.08310‐3 mol/l, respectively. The both phases were used in 1:1 ratio. We have measured the stability time right after shaking until the first drops coalesced and the breaking time when drops coalescence starts until the phases separated. Both times together give so called total time ttot (Table 1).
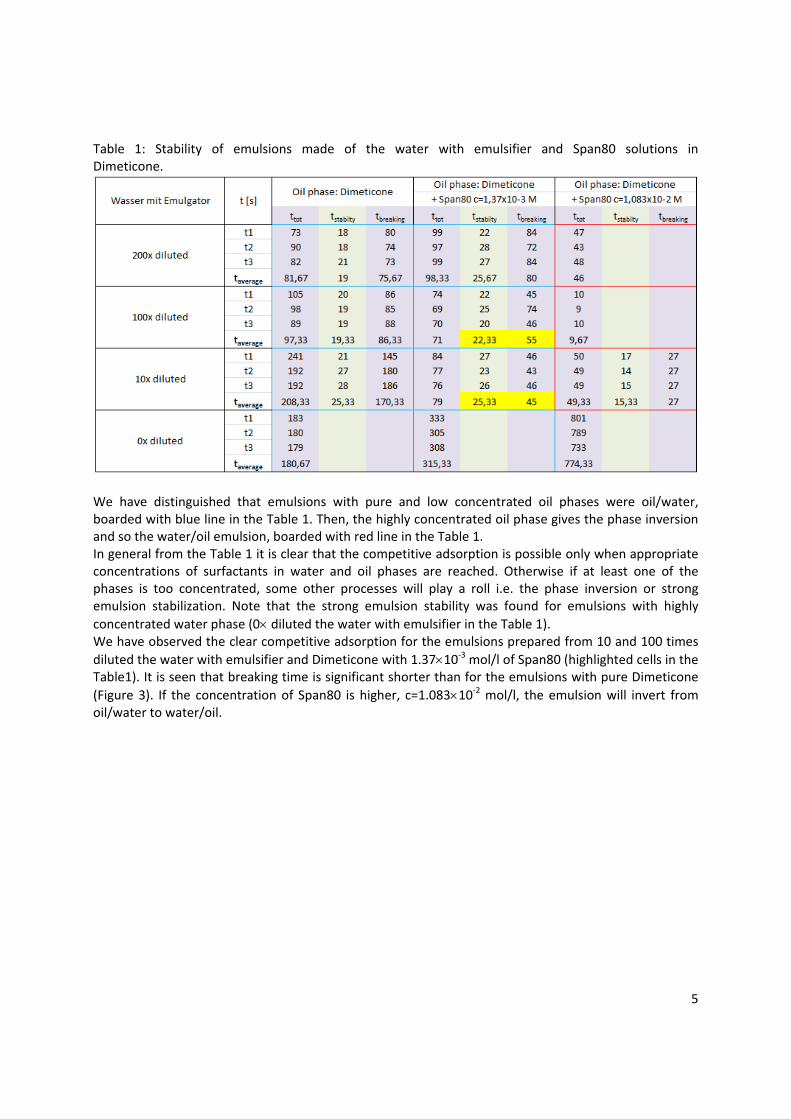
5
Table 1: Stability of emulsions made of the water with emulsifier and Span80 solutions in Dimeticone.
We have distinguished that emulsions with pure and low concentrated oil phases were oil/water, boarded with blue line in the Table 1. Then, the highly concentrated oil phase gives the phase inversion and so the water/oil emulsion, boarded with red line in the Table 1. In general from the Table 1 it is clear that the competitive adsorption is possible only when appropriate concentrations of surfactants in water and oil phases are reached. Otherwise if at least one of the phases is too concentrated, some other processes will play a roll i.e. the phase inversion or strong emulsion stabilization. Note that the strong emulsion stability was found for emulsions with highly
concentrated water phase (0 diluted the water with emulsifier in the Table 1). We have observed the clear competitive adsorption for the emulsions prepared from 10 and 100 times
diluted the water with emulsifier and Dimeticone with 1.3710‐3 mol/l of Span80 (highlighted cells in the Table1). It is seen that breaking time is significant shorter than for the emulsions with pure Dimeticone
(Figure 3). If the concentration of Span80 is higher, c=1.08310‐2 mol/l, the emulsion will invert from oil/water to water/oil.
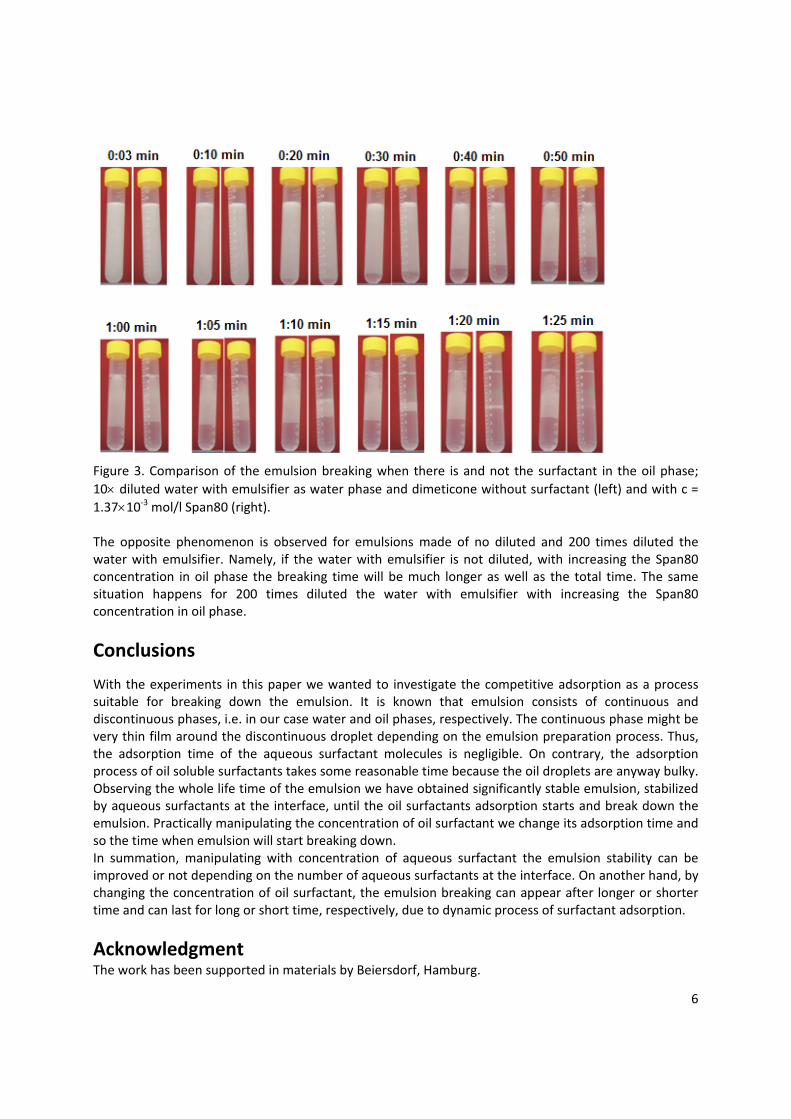
6
Figure 3. Comparison of the emulsion breaking when there is and not the surfactant in the oil phase;
10 diluted water with emulsifier as water phase and dimeticone without surfactant (left) and with c =
1.3710‐3 mol/l Span80 (right). The opposite phenomenon is observed for emulsions made of no diluted and 200 times diluted the water with emulsifier. Namely, if the water with emulsifier is not diluted, with increasing the Span80 concentration in oil phase the breaking time will be much longer as well as the total time. The same situation happens for 200 times diluted the water with emulsifier with increasing the Span80 concentration in oil phase.
Conclusions
With the experiments in this paper we wanted to investigate the competitive adsorption as a process suitable for breaking down the emulsion. It is known that emulsion consists of continuous and discontinuous phases, i.e. in our case water and oil phases, respectively. The continuous phase might be very thin film around the discontinuous droplet depending on the emulsion preparation process. Thus, the adsorption time of the aqueous surfactant molecules is negligible. On contrary, the adsorption process of oil soluble surfactants takes some reasonable time because the oil droplets are anyway bulky. Observing the whole life time of the emulsion we have obtained significantly stable emulsion, stabilized by aqueous surfactants at the interface, until the oil surfactants adsorption starts and break down the emulsion. Practically manipulating the concentration of oil surfactant we change its adsorption time and so the time when emulsion will start breaking down. In summation, manipulating with concentration of aqueous surfactant the emulsion stability can be improved or not depending on the number of aqueous surfactants at the interface. On another hand, by changing the concentration of oil surfactant, the emulsion breaking can appear after longer or shorter time and can last for long or short time, respectively, due to dynamic process of surfactant adsorption.
Acknowledgment The work has been supported in materials by Beiersdorf, Hamburg.