Embed Size (px)
Citation preview

www.wjpps.com │ Vol 10, Issue 7, 2021. │ ISO 9001:2015 Certified Journal │
1
Abdullah et al. World Journal of Pharmacy and Pharmaceutical Sciences
THERMODYNAMIC STUDY OF THE ADSORPTION OF INDYSTRIAL
DYES BY WESTERN DESERT BENTONITE CLAY
Abdullah Kh. Al-Niemi* and Safwan AS. Al-dbouni
Chem. Dept., College of Educ. for Pure Sci., Univ. Mosul, IRAQ.
ABSTRACT
This research involved studying the adsorption of two dyes (Brilliant
green and Brilliant Yellow) using Western Desert bentonite clay for
the purpose of removing them from their aqueous solutions. The
optimal conditions for the process of adsorption of these two dyes such
as the effect of the amount of adsorbent, initial concentration and
temperature were identified. The results of the study showed that the
forces controlling the adsorption process were of a physical nature, and
that the adsorption process occurs by attaching the dye to the surface of
the adsorption spontaneously to form a less random system. Several
models of isothermic equations such as (Lankmeyer, Frindlach) were
applied on the practical results of adsorption, this study showed their application agreement
with mentioned isotherms, by obtaining a linear relationship and a high correlation coefficient
(R) except the) Brilliant Yellow) dye its practical resells did not agreement to the Lankmeyer
isotherm because its correlation coefficient (R) values are low.
KEYWORDS: Thermodermic, adsorption, bentonite clay, dyes, isotherm.
INTRODUCTION
One of the main environmental problems is the presence of dyes in water sources. This
contaminant must be removed from the water by appropriate methods. Although most of these
methods are effective in treating water contaminated with dye pollutants, they are very
expensive and not commercially feasible.[1]
Industrial dyes are widely used in the textile
industry, as their chemical formulas are characterized by containing aromatic and Aryl rings
and effective groups such as (Azo, SO2, and hydroxyl groups) and other groups. Because of
the inefficiency of the dyeing process, some of the dyes used in the liquid waste of textile units
WORLD JOURNAL OF PHARMACY AND PHARMACEUTICAL SCIENCES
SJIF Impact Factor 7.632
Volume 10, Issue 7, 1-21 Research Article ISSN 2278 – 4357
*Corresponding Author
Dr. Abdullah Kh.
Al-Niemi
Chem. Dept., College of
Educ. for Pure Sci., Univ.
Mosul, IRAQ.
Article Received on
24 April 2021,
Revised on 14 May 2021,
Accepted on 04 June 2021
DOI: 10.20959/wjpps20217-19160

www.wjpps.com │ Vol 10, Issue 7, 2021. │ ISO 9001:2015 Certified Journal │
2
Abdullah et al. World Journal of Pharmacy and Pharmaceutical Sciences
are thrown away. The direct discharge of these liquid wastes leads to the formation of toxic
and carcinogenic substances in the reception medium, and the difficulty of their decomposition
due to their complex composition and solubility in water, so it is necessary to find effective
methods for treating wastewater capable of removing this pollution.[2]
Among the most
important methods used in treatment processes is the adsorption process, which is the most
effective and economical way to remove pollutants in low concentrations. The most commonly
used adsorbent is activated carbon. The reason is due to its high surface area due to its porosity,
as it contains branched inner channels of different diameters. However, its price is relatively
high compared to some adsorbent materials available in nature, such as clay, and it also needs
to be activated with chemicals, so the clay is used as a good alternative to activated carbon.[3]
Different types of clays are available due to their high adsorption property.[4]
Bentonite clay is
mainly composed of montorlonite and other clay minerals such as kaolin and palikorskite, and
bentonite clay has a surface with high charges, has the ability to cation exchange, and has a
high surface area and porosity.[5]
That is why bentonite clay was selected in this study for use
in adsorption of the two dyes (Brilliant green, Brilliant Yellow).
MATERIALS AND METHODS
1- Chemicals
The two dyes (Brilliant green and Brilliant Yellow) used in this research were supplied from
Fluka company.
2- Preparing the solutions
In a 1 liter volume bottle, a solution of Brilliant green and Brilliant Yellow dyes was prepared
at a concentration of (1 × 10⁻³
) molar using distilled water as a solvent, and from it different
concentrations were prepared ranging between (1 x 10⁻⁴
- 1 x 10⁻⁶
) M, where (100 ml) of each
concentration was used in the adsorption process in (250 ml) conical flasks (using the dilution
law). For the purpose of carrying out a process that removed these two dyes from their
aqueous solutions by the adsorption process, a one batch method was used), where the conical
flasks were placed in a bath water containing an electric vibrator at a speed (100 cycle /
minute) and for a period of an hour and a half at the laboratory temperature (25 C˚). The
temperature was controlled by using a mercury thermometer for ensuring its stability. The
required water bath temperature for a period of not less than (10 minutes). At each
temperature used, the contents of the flasks were filtered after the adsorption process was
completed using filter paper and the analytical method was used for estimating the residual

www.wjpps.com │ Vol 10, Issue 7, 2021. │ ISO 9001:2015 Certified Journal │
3
Abdullah et al. World Journal of Pharmacy and Pharmaceutical Sciences
dye concentrations through the spectrophotometry apparatus available in our laboratories.
3- Analytical method
Since the materials chosen for this study are colored, so the UV-VIS Spectrophotometer (T92
+) was chosen. As a first step, the value of the maximum absorption wavelength (λmax) was
determined for each dye, which then tracks the change of the amount of adsorbed material
over time and according to the nature of eaeh study. To accomplish this work, (Beer`s
lambert Law) was used to create a calibration curve at the value of (λmax) for each dye by
drawing the relationship between absorption and concentration and according to the equation:
A = ε CL ---------------------------------- (1)
As (A) represents absorption, (ε) is the molar absorption coefficient(Liter.mol-1.cm-1), (C) is
the molar dye concentration, and (L) is the width of the cell (L = 1cm). The term adsorption
capacity and adsorption efficiency or (adsorption percentage) were used to express the
amount of adsorbed material by estimating the amount of residual material from the dye in
the adsorption solution. A calibration curve for each dye was adopted to calculate these
concentrations. The adsorption capacity (qe) of the dye adsorbent can be expressed by the
following equation:
Since (Ce) is (residual concentration) and (Ci) is (initial concentration) of the dye and the
value of (M) represents the weight of the adsorbent material in unit (gm) and the value of (V)
represents the volume of the dye solution used when studying the adsorption unit (Liter), and
the percentage of the removed dye can also be calculated (Adsorbed) or what is called
adsorption efficiency using the following equation:
4- Choose an adsorbent
In this research, clay (Western Sahara bentonite) was used as a good adsorbent as it is
naturally available and inexpensive. Where the adsorbent was in the form of a fine powder
and prepared by the Geological Survey in Baghdad.
5- Instruments
a- Ultraviolet spectral measurement: A Spectrophotometer type (T92 +) was used for this.

www.wjpps.com │ Vol 10, Issue 7, 2021. │ ISO 9001:2015 Certified Journal │
4
Abdullah et al. World Journal of Pharmacy and Pharmaceutical Sciences
The product is from the American company (PG INTERUMENTS), using the purpose
solvent as a (Blank) solution, using quartz and glass cells with a thickness of (1 cm) , and
measurements were made in the range (300 - 800 nm).
b- Water bath with aprogramme vibrator: A programmed vibrator (SW23 Julabo) was
used which contains inside a water bath for the purpose of controlling and regulating the
temperature when studying the adsorption.
c- pH meter: A device of the type (pH 720 WTW 82362 Weilheim) was used in the control
and measurements of the acidic function at the laboratory temperature (25 C˚) and after
calibrating the device with two solutions at an acidity function (4) then (9).
6- Calculation of thermodynamic functions
The values of the adsorption equilibrium constant (K) were calculated at different
temperatures at equilibrium from the ratio between the concentration of the adsorbent and the
residual concentration of the dye solution. The value of (K) and the values of the
ther were calculated at equilibrium state using the
equations following:
Then the previous calculations were re-calculated in the calculation of the thermodynamic
values of the mentioned values based on the values of the Fernelich (Kf) and Langumire (KL)
constants that were found from the application of these isotherms to the practical results for
adsorption, as will be explained later.
7- Adsorption isotherms
The Ferndlich and Lancmayer isotherms were applied on the practical results obtained from
the study of the adsorption system under study, as the values of the Ferendelch constants (Kf,
n) were calculated from the relationship between the value of (log qe and log Ce) according to
the following equation

www.wjpps.com │ Vol 10, Issue 7, 2021. │ ISO 9001:2015 Certified Journal │
5
Abdullah et al. World Journal of Pharmacy and Pharmaceutical Sciences
Also, Lancmayer constant (b) and the theoretical maximum capacity of adsorption (Qmax)
were calculated from the relationship between (Ce / qe) versus (Ce) and according to the
following equation:
The program (Excel) was used to complete the necessary graphs to calculate the values
mentioned in this paragraph.
The structural formula of the two dyes (Brilliant green and Brilliant Yellow) and their
physical properties Table (1)
dye name Dye Structure M.Wt
g / mol
λ max
(nm)
ε max
L.mol-1
.cm-1
Color M.P C˚
Brilliant green (B.g)
[4-[[4-
(diethylamino)phenyl]-
phenylmethylidene]cycl
ohexa- 2,5-dien-1-
ylidene]-
diethylazanium;hydroge
n sulfate
482.64 624 67315 green
crystalline
210
Brilliant Yellow ( B.y )
sodium 4,4'-bis(p-
hydroxyphenylazo)-2,2'-
vinylenedibenzenesulph
onate
603.6 490 34727 orange 250
RESULTS AND DISCUSSION
Analytical method
The best option for completing this study is to use the Spector photometric method as dyes are
colorants chemical, and as an initial step of this study, a calibration curve for each dye is made
at its (λ max) value by preparing solutions with different concentrations in ranges agreement
with the dye sensitivity and its applicability to the Beer-LamBurt equation , The linear
relationship obtained from the application of the Beer-Lambert equation referred to by the
values of the good correlation coefficients (R2) indicates the possibility of applying this
equation to the ranges of concentrations adopted in the formation of the standard curves of the
dyes under study. Figure (2.1) represents the application of the equation. Beer-Lambert to
perform the calibration curve for the dyes under study.

www.wjpps.com │ Vol 10, Issue 7, 2021. │ ISO 9001:2015 Certified Journal │
6
Abdullah et al. World Journal of Pharmacy and Pharmaceutical Sciences
Figure 1: Calibration curve for (B.g) dye. Figure 2: Calibration curve for (B.y) dye.
Effect of adsorbent amount
The purpose of conducting this study is to find an appropriate amount of adsorbent material
that achieves the equilibrium state of the system with an acceptable percentage of it without
the complete removal of color so that we can complete the subsequent study. The concentration
of (4x10⁻⁵
) Molar was used for the dyes under study and different quantities of the adsorbent
material represented by the Western Sahara bentonite clay with doses ranging between (0.1-
0.005) grams and at a temperature of (298C˚) absolute degrees with the stabilization of all
other conditions. The results obtained were listed in Table (2).
Table 2: The effect of the amount of clay (Western Sahara bentonite) on the adsorption
capacity, percentage, at temperature (25 C˚) and Concentration (4x10⁻⁵ M).
The name of
the dye
Ci
(mg/l)
Ce (mg/l) Dose (g) qe (mg/g) The percentage of
% adsorption
B.g 19.30 0.222 0.1 19.07 98.84
0.250 0.075 25.4 98.70
0.322 0.050 37.95 98.33
0.415 0.025 75.54 97.84
0.846 0.010 184.54 95.61
3.111 0.005 323.88 83.88
B.y 24.14 3.146 0.1 20.994 86.96
2.815 0.075 28.433 88.33
2.398 0.050 43.484 90.06
2.659 0.025 85.924 88.98
2.798 0.010 213.42 88.40
2.972 0.005 423.36 87.68
From the observation of Table No. (2), we find that the adsorption capacity and at the
concentration of (4x10⁻⁵
M) molar of the dyes their value decreases, while the percentage of
adsorption increases with the increase in the dose of the adsorbent material represented by the
Western Sahara bentonite. This discrepancy can be explained through two perspectives:
www.wjpps.com │ Vol 10, Issue 7, 2021. │ ISO 9001:2015 Certified Journal │
7
Abdullah et al. World Journal of Pharmacy and Pharmaceutical Sciences
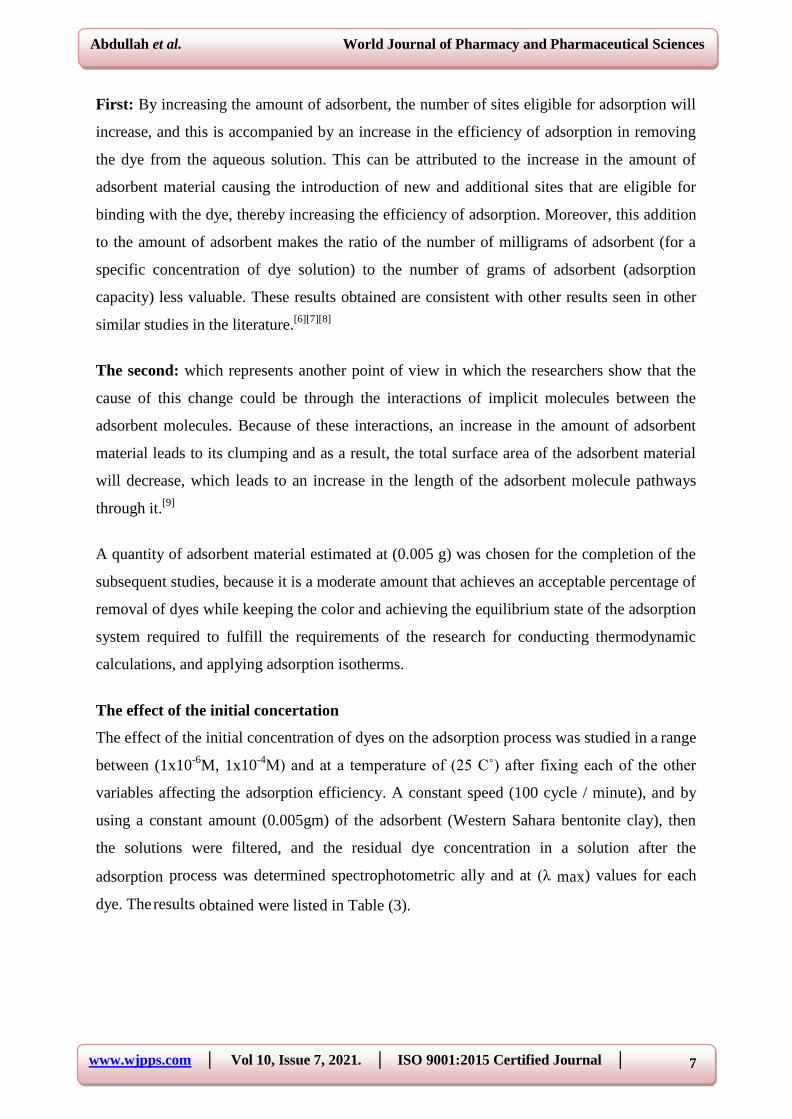
First: By increasing the amount of adsorbent, the number of sites eligible for adsorption will
increase, and this is accompanied by an increase in the efficiency of adsorption in removing
the dye from the aqueous solution. This can be attributed to the increase in the amount of
adsorbent material causing the introduction of new and additional sites that are eligible for
binding with the dye, thereby increasing the efficiency of adsorption. Moreover, this addition
to the amount of adsorbent makes the ratio of the number of milligrams of adsorbent (for a
specific concentration of dye solution) to the number of grams of adsorbent (adsorption
capacity) less valuable. These results obtained are consistent with other results seen in other
similar studies in the literature.[6][7][8]
The second: which represents another point of view in which the researchers show that the
cause of this change could be through the interactions of implicit molecules between the
adsorbent molecules. Because of these interactions, an increase in the amount of adsorbent
material leads to its clumping and as a result, the total surface area of the adsorbent material
will decrease, which leads to an increase in the length of the adsorbent molecule pathways
through it.[9]
A quantity of adsorbent material estimated at (0.005 g) was chosen for the completion of the
subsequent studies, because it is a moderate amount that achieves an acceptable percentage of
removal of dyes while keeping the color and achieving the equilibrium state of the adsorption
system required to fulfill the requirements of the research for conducting thermodynamic
calculations, and applying adsorption isotherms.
The effect of the initial concertation
The effect of the initial concentration of dyes on the adsorption process was studied in a range
between (1x10⁻⁶
M, 1x10⁻⁴
M) and at a temperature of (25 C˚) after fixing each of the other
variables affecting the adsorption efficiency. A constant speed (100 cycle / minute), and by
using a constant amount (0.005gm) of the adsorbent (Western Sahara bentonite clay), then
the solutions were filtered, and the residual dye concentration in a solution after the
adsorption process was determined spectrophotometric ally and at (λ max) values for each
dye. The results obtained were listed in Table (3).

www.wjpps.com │ Vol 10, Issue 7, 2021. │ ISO 9001:2015 Certified Journal │
8
Abdullah et al. World Journal of Pharmacy and Pharmaceutical Sciences
Table 3: The effect of the initial concentration on the percentage of adsorption using)
0.005 g) of Western Sahara bentonite at a temperature of (25 ° C).
The name of
the dye
Ci(M) Ce(mg/l) qe(mg/g) The percentage
of adsorption%
B.g 1×10⁻⁴
34.66 624 64.64
8×10⁻⁵
12.61 520 67.34
6×10⁻⁵
6.16 455.8 78.72
4×10⁻⁵
3.11 323.88 83.88
2×10⁻⁵
1.64 160.2 83.00
1×10⁻⁵
0.82 80 82.98
8×10⁻⁶
0.71 63 81.60
6×10⁻⁶
0.56 46.6 80.62
4×10⁻⁶
0.38 31 80.31
2×10⁻⁶
0.77 15.4 79.79
1×10⁻⁶
0.1 7.6 79.16
B.y 1×10⁻⁴
8.265 1042 86.30
8×10⁻⁵
5.850 848.6 87.98
6×10⁻⁵
4.460 631.4 87.18
4×10⁻⁵
2.972 423.36 87.68
2×10⁻⁵
1.750 206.4 85.50
1×10⁻⁵
0.921 102.1 84.72
8×10⁻⁶
0.695 82.5 85.58
6×10⁻⁶
0.608 60.2 83.20
4×10⁻⁶
0.521 37.7 78.38
2×10⁻⁶
0.347 17.06 71.08
1×10⁻⁶
0.260 6.87 56.92
The range of concentrations used in this study ranged from (1X10⁻⁴
M to 1x10⁻⁶
M). The results
obtained indicated that the increase in the concentration of the dyes under study was
accompanied by an increase in the adsorption efficiency (% adsorption) until reaching the
concentration (4X10⁻⁵
M), where a decrease the adsorption efficiency after this concentration is
accompanied by a decrease in the adsorption capacity. The results showed that the best
concentration to complete the subsequent study is (4X10⁻⁵
M), and we note through the obtained
results that the percentage of adsorption of the two dyes decreases with increasing
concentration and in the range (1x10⁻⁴
M to 4x10⁻⁵
M) and by using a fixed amount of adsorbent.
The previous statement can be explained to the competition between dye molecules for
adsorption on a fixed number of active sites on the surface of a certain amount of adsorbent
resulting from an increase in concentration, which leads as a result to an increase in the
repulsion between the dye molecules among themselves and the active sites on the surface as
a result of increasing their energy This behavior is consistent with what was obtained in
previous studies.[10][11]

www.wjpps.com │ Vol 10, Issue 7, 2021. │ ISO 9001:2015 Certified Journal │
9
Abdullah et al. World Journal of Pharmacy and Pharmaceutical Sciences
Effect of the acidic function of an adsorption medium
The test of the effect of the acidic function of the adsorption medium of the dyes was carried
out at a concentration of (4X10⁻⁵
M) and a temperature (25 C˚) and a quantity of (0.005) g of
bentonite clay Western Sahara. The obtained results were included in Table (4) and Figure (3)
illustrating that.
Table 4: Shows the effect of the acidic function on the percentage of adsorption of the
dyes under study.
The name of the dye pH Ce(mg/l) qe(mg/g) The percentage of adsorption %
B.g 4 2.80 330 85.49
*6.5 3.111 323.88 83.88
9 3.83 309.4 80.15
B.y 4 2.71 428 88.75
*6.8 3.02 422.4 87.48
9 3.615 410.58 85.02
(*) Represents the natural acidic function of dyes.
Figure 3: Shows the relationship between the percentage of adsorption and the acidity
function of the dyes.
When observing Table (4) and Fig. (3), we find that the adsorption efficiency and capacity are
highest when the acidic function (nature pH) and (pH 4 ) of the dyes in their aqueous solution
and this is due to the nature of the overlap between the dyes under study and the nature of the
surface of the clay used in the process. Adsorption this is positive in terms of the economic
cost of the adsorption process.
Temperature effect
The effect of temperature on the adsorption of the dyes in question was studied at an initial
concentration (4x10⁻⁵
M) and a fixed amount of clay adsorbent (Western Sahara bentonite)

www.wjpps.com │ Vol 10, Issue 7, 2021. │ ISO 9001:2015 Certified Journal │
10
Abdullah et al. World Journal of Pharmacy and Pharmaceutical Sciences
with an amount of (0.005) g and a fixed volume of the dye solution (100 ml) and at temperatures
between (50-15 C˚) as these solutions were shaken for a period of (60) minutes at a constant
speed (100 cycle / minute). The results were included in tables (5):
Table 5: The effect of temperature on the percentage of adsorption of the dye (B.g) and
the weight of (0.005g) of Western Sahara bentonite and at the natural (pH).
Ci (M) Tem(K Ce (mg) qe (mg/g) The percentage of
adsorption %
8× 10⁻⁵
288 11.40 544.2 70.47
293 11.61 540 69.93
298 12.61 520 67.34
303 13.12 509.8 66.01
308 14.12 489.8 63.42
313 14.62 479.8 62.13
323 15.41 464 60.08
6× 10⁻⁵
288 5.44 470.2 81.20
293 5.55 468 80.82
298 6.15 456 78.75
303 6.45 450 77.72
308 9.96 379.8 65.59
313 10.39 371.2 64.11
323 10.96 359.8 62.14
288 2.11 343.8 89.06
4× 10⁻⁵
293 2.40 338 87.56
298 2.68 332.4 86.11
303 2.81 329.8 85.44
308 3.01 325.8 84.40
313 3.22 321.6 83.31
323 3.80 310 80.31
2× 10⁻⁵
288 1.32 166.6 86.32
293 1.50 163 84.45
298 1.54 162.2 84.04
303 1.65 160 82.90
308 1.85 156 80.82
313 1.95 154 79.79
323 2.14 150.2 77.82
1× 10⁻⁵
288 0.72 82 85.06
293 0.77 81 84.02
298 0.79 80.6 83.60
303 0.82 80 82.98
308 0.92 78 80.91
313 1.02 76 78.83
323 1.12 74 76.76

www.wjpps.com │ Vol 10, Issue 7, 2021. │ ISO 9001:2015 Certified Journal │
11
Abdullah et al. World Journal of Pharmacy and Pharmaceutical Sciences
Table 6: The effect of temperature on the percentage of dye (B.y) and weight of 0.005g
of Western Sahara bentonite and the natural (pH).
Ci (mg/L) Tem(K ) Ce (mg) qe (mg/g) The percentage of
% adsorption
8× 10⁻⁵
288 4.27 880.2 91.15
293 4.48 876 90.72
298 5.28 860 89.06
303 5.48 855.8 88.62
308 5.99 845.8 87.59
313 6.86 828.4 85.79
323 7.30 819.6 84.87
6× 10⁻⁵
288 3.71 650 89.75
293 4.20 640.2 88.40
298 4.62 631.8 87.24
303 5.02 623.8 86.13
308 5.71 610 84.23
313 6.01 604 83.40
323 6.22 599.8 82.82
4× 10⁻⁵
288 2.15 439.8 91.09
293 2.34 436 90.30
298 2.64 430 89.06
303 2.74 428 88.64
308 3.04 422 87.40
313 3.14 420 86.99
323 3.84 406 84.09
288 1.47 212 87.82
293 1.52 210 87.40
2× 10⁻⁵
298 1.66 208.2 86.24
303 1.65 208.4 86.32
308 1.77 206 85.33
313 1.87 204 84.50
323 2.08 199.8 82.76
1× 10⁻⁵
288 0.73 106 87.89
293 0.88 103 85.40
298 0.93 102 84.57
303 0.97 101.2 83.91
308 1.04 99.8 82.75
313 1.14 97.8 81.09
323 1.19 96.8 80.26
When looking at the two previous tables carefully, we notice the following
1- Within the single dye, by using a fixed concentration, we find that increasing the
temperature in the aforementioned range reduces the adsorption capacity (qe) and its
efficiency (percentage) and this can be attributed to the fact that the controlling force on
the adsorption process is a weak force and that increasing the temperature in the

www.wjpps.com │ Vol 10, Issue 7, 2021. │ ISO 9001:2015 Certified Journal │
12
Abdullah et al. World Journal of Pharmacy and Pharmaceutical Sciences
mentioned range serves to break down the forces That binds the dye to the adsorbent
surface, which stimulates the return of the dye molecules to the solution, thus the
adsorption efficiency decreases and the number of molecules associated with the
adsorption surface decreases, so the adsorption capacity decreases relative to the fixed
mass of the adsorbent used (g). This pattern of change can give an indication that the
bonding forces between the dye molecules and the surface of the clay used are of the type
of weak forces such as Vandervals forces, and that the adsorption process in the studied
system is of a physical nature.
2- At a constant concentration and temperature, the adsorption efficiency and capacity of the
different dyes under study vary depending on many variables related to the type of active
groups associated with the aromatic rings in the molecule in terms of electron propulsion,
as well as the nature of the static body that the dye molecules take and the movement of
electrons in them by the resonance process, which may go along The molecule or its part,
depending on the equatorially of the molecule and the nature of the sequence of double
bonds in it, as well as the spatial disability in it.[12][13][14]
.
The thermodynamic study
The thermodynamic study of the adsorption system is necessary to know the nature of the
adsorption system under study and to know the nature of the forces that control the
adsorption process as well as to know the type of molecular interferences affecting the
process of transferring the dye molecules from the solution to the surface of the slurry that
can occur during the adsorption process, which has a major role in Determine its efficiency.
The values of thermodynamic functions were calculated through equations[4,5,6,7,8]
The
calculated results (∆H, ∆G, ∆S, ∆S , K) have been included in Tables (7,8) and Fig. (4,5)
shows the linear relationships resulting from drawing LnK versus 1/T when applying
VantHoff equation. Used to calculate the values of change in enthalpies.
Figure 4: The relationship between lnK versus 1 / T to calculate the desorption
involution value of the) B.g dye).

www.wjpps.com │ Vol 10, Issue 7, 2021. │ ISO 9001:2015 Certified Journal │
13
Abdullah et al. World Journal of Pharmacy and Pharmaceutical Sciences
Figure 5: The relationship between lnK versus 1 / T to calculate the adsorption
involution value of the) B.y dye).
Table 7: Values of equilibrium constants and thermodynamic functions for the
adsorption of the compound (B.g) and under ideal adsorption conditions.
Ci (M) emp( ) K ∆H ( Kj.mol-1
) ∆ ( Kj.mol-1
) ∆ (j.mol-1
.K-1
) ∆ (j.mol-1
.K-1
)
8× 10⁻⁵
288 2.38 -10.982 -2.05 -31.01 -38.13
293 2.32 -2.04 -30.51 -37.48
298 2.06 -1.78 -30.87 -36.85
303 1.94 -1.66 -30.76 -36.24
308 1.73 -1.40 -31.11 -35.65
313 1.64 -1.27 -31.02 -35.08
323 1.50 -1.07 -30.68 -34.00
6× 10⁻⁵
288 4.32 -25.599 -3.49 -76.76 -88.88
293 4.21 -3.48 -75.49 -87.36
298 3.70 -3.24 -75.03 -85.90
303 3.48 -3.12 -74.12 -84.48
308 1.90 -1.63 -77.82 -83.11
313 1.78 -1.50 -76.99 -81.78
323 1.64 -1.31 -75.19 -79.25
4× 10⁻⁵
288 8.14 -5.00 -32.51 -49.87
293 7.04 -4.75 -32.81 -49.02
298 6.20 -14.364 -4.50 -33.10 -48.20
303 5.86 -4.43 -32.78 -47.40
308 5.41 -4.30 -32.67 -46.63
313 4.99 -4.16 -32.60 -45.89
323 4.07 -3.75 -32.86 -44.47
2× 10⁻⁵
288 6.31 -12.914 -4.40 -29.56 -44.84
293 5.43 -4.116 -30.02 -44.07
298 5.26 -4.112 -29.53 -43.33
303 4.84 -3.95 -29.58 -42.62
308 4.21 -3.66 -30.04 -41.92
313 3.94 -3.56 -29.88 -41.25
323 3.50 -3.35 -29.60 -39.98
1× 10⁻⁵
288 5.69 -12.317 -4.14 -28.39 -42.76
293 5.25 -4.04 -28.24 -42.03
298 5.10 -4.01 -27.87 -41.33

www.wjpps.com │ Vol 10, Issue 7, 2021. │ ISO 9001:2015 Certified Journal │
14
Abdullah et al. World Journal of Pharmacy and Pharmaceutical Sciences
303 4.87 -3.98 -27.51 -40.65
308 4.23 -3.68 -28.04 -39.99
313 3.72 -3.40 -28.48 -39.35
323 3.30 -3.19 -28.25 -38.13
Table 8: Values of equilibrium Constants and Thermodynamic functions for the
adsorption of compound (B.y) at ideal adsorption conditions.
Ci (M) emp( ) K ∆H (Kj.mol-1) ∆ (Kj.mol-1) ∆ (j.mol-1.K-1) ∆ (j.mol-1.K-1)
8× 10⁻⁵
288 10.30
-14.35
-5.57 -30.48 -49.82
293 9.77 -5.55 -30.03 -48.97
298 8.14 -5.17 -30.80 -48.15
303 7.81 -5.16 -30.33 -47.35
308 7.06 -4.99 -30.38 -46.59
313 6.03 -4.65 -30.99 -45.84
323 5.61 -4.61 -30.15 -44.42
6× 10⁻⁵
288 8.76
-13.93
-5.19 -30.34 -48.36
293 7.62 -4.94 -30.68 -47.54
298 6.83 -4.75 -30.80 -46.74
303 6.21 -4.58 -30.85 -45.97
308 5.34 -4.27 -31.36 -45.22
313 5.02 -4.18 -31.15 -44.50
323 4.82 -4.21 -30.09 -43.12
4× 10⁻⁵
288 10.22
-13.89
-5.55 -28.95 -48.22
293 9.31 -5.43 -28.87 -47.40
298 8.14 -5.17 -29.26 -46.61
303 7.81 -5.16 -28.81 -45.84
308 6.94 -4.942 -29.05 -45.09
313 6.68 -4.944 -28.58 -44.37
323 5.28 -4.45 -29.22 -43.00
2× 10⁻⁵
288 7.21
-8.84
-4.71 -14.34 -30.69
293 6.94 -4.70 -14.12 -30.17
298 6.27 -4.53 -14.46 -29.66
303 6.31
-4.63 -13.89 -29.17
308 5.81 -4.50 -14.09 -28.70
313 5.45 -4.39 -14.21 -28.24
323 4.80 -4.18 -14.42 -27.36
1× 10⁻⁵
288 7.26
-12.13
-4.74 -25.65 -42.11
293 5.85 -4.28 -26.79 -41.39
298 5.48 -4.21 -26.57 -40.70
303 5.21 -4.15 -26.33 -40.03
308 4.79 -3.99 -26.42 -39.38
313 4.28 -3.77 -26.70 -38.75
323 4.06 -3.75 -25.94 -37.55
Figures (4 and 5) show good linear relationships, and this is inferred from the values of the
correlation coefficient (R2) and at most of the different temperatures and primary

www.wjpps.com │ Vol 10, Issue 7, 2021. │ ISO 9001:2015 Certified Journal │
15
Abdullah et al. World Journal of Pharmacy and Pharmaceutical Sciences
concentrations selected for this study. In addition, when checking the values of the
thermodynamic functions (∆S, ∆S ,∆G ,∆H) and the values of the equilibrium constants
shown in tables (8.7), we find that they change as follows:
1- We note that the values of the equilibrium constant (K) decrease with increasing the
temperature of one dye and at a constant concentration and this is consistent with the
results obtained in Table (7), which indicate that the adsorption efficiency decreases with
increasing the temperature and is an indication that the forces responsible for the
adsorption process of a physical nature.
2- The values of the change in enthalpy (∆H), which were calculated in a range of
temperatures between (323-288 absolute) and at different initial concentrations, were all-
negative, indicating that the adsorption process is a heat emitter. The fact that its value is
less than (40 kJ / mol) indicates that the forces responsible for the process of bonding
dyes on the surface of the clay are of a physical nature.[15][16]
3- For the purpose of tracking the change in the entropy value, two values have been
calculated for it:
The first: It is the value of (∆S) calculated at equilibrium, that is, when (∆G = 0), and its
value is all-negative at all the selected thermal temperatures and the different concentrations
and in all the dyes under study, this indicates an increase in the regularity state in the studied
systems at equilibrium. on the other hand, we find that the values of (∆S) and at a constant
concentration increase the randomness with increasing temperature, which indicates that the
increase in temperature increases the randomness of the system under study due to the
increase in the return of adsorbed particles to the solution and this is consistent with what was
previously concluded that the studied system is of a physical nature.
Second: To follow the values of (∆S˚) calculated at different conditions for the adsorption
process, we find the following: The negative values of (∆S˚) increase with increasing
temperature in one dye, and thus the automaticity of the studied system will increase with the
temperature.
As for the value (∆H˚) for both dyes, we note that it carries a negative signal, and this
indicates that the adsorption process occurs automatically. The value of (∆H˚) decreases with
its negative value with increasing temperature. This confirms the nature of the heat-emitting
adsorption, and thus it is consistent with the value of (∆S˚) obtained in the same calculations.

www.wjpps.com │ Vol 10, Issue 7, 2021. │ ISO 9001:2015 Certified Journal │
16
Abdullah et al. World Journal of Pharmacy and Pharmaceutical Sciences
Adsorption isotherms
Isotherms are mathematical relationships that are derived and adapted to describe a specific
adsorption system through specific assumptions, which are a good source for obtaining
results related to the nature of different systems by computing some constants specific to each
isotherm[17]
In this study, three isotherms models were chosen for the purpose of their
application to the experimental results. For the adsorption process, they are the Ferendallach
isotherms, Lancmeier and Tekkan.
Isotherm lancemire
This isotherm was applied to the practical results for adsorption of the dyes under study on the
adsorbent material and at equilibrium by drawing the relationship between (Ce / qe) versus
(Ce) and at different temperatures and in the aforementioned range.
Figure 6: Illustrates the Lancmair isotherm of dye adsorption (B.g) on the surface of
Western Sahara bentonite.
Figure 7: Illustrates the Lancmair isotherm for dye adsorption (B.y) on the surface of
the Western Sahara bentonite.

www.wjpps.com │ Vol 10, Issue 7, 2021. │ ISO 9001:2015 Certified Journal │
17
Abdullah et al. World Journal of Pharmacy and Pharmaceutical Sciences
Table 9: Shows the Lancemire reward (Qmax and b) and the correlation coefficients for
my dye adsorption process (B.g, B.y).
The name of the dye Temp(K°) b (L/mg) Qmax (mg/g) R
B.g 288 0.228 769 0.9565
293 0.181 833 0.9474
298 0.191 769 0.9644
303 0.180 769 0.9640
308 0.176 666 0.9597
313 0.159 666 0.9526
323 0.137 666 0.9538
B.y 288 -0.070 -2000 0.7454
293 -0.072 -1666 0.7279
298 -0.056 -2000 0.7233
303 -0.044 -2500 0.5874
308 -0.031 -3333 0.4603
313 -0.029 -3333 0.3993
323 -0.033 -2500 0.7503
Through Table (9), we can include the following points:
1- The Lancemire isotherm equation model applies well to the experimental results for (B.g)
dye. In addition, this is through the accepted linear relationship obtained from the drawing
of (Ce / qe) versus (Ce), where we notice that the value of (R) varied between (0.9538 -
0.9565) and at all temperatures of the studied system, which is an acceptable value.
As for the value of (R) for the (By) dye, we find it decreased from that obtained for the (Bg)
dye, where the quantity ranged between (0.7454 - 0.7503), which is an unacceptable value.
On the values and constants of this isotherm in describing the adsorption system for this dye.
2- The value of (b), which represents a constant value to describe the relationship of the
strength of the dye's binding to the adsorbent surface, as we note that this value in the
(Bg) dye decreases with increasing temperature, and this in turn indicates a decrease in the
strength of the dye's binding to the adsorbent surface due to the increase of the molecular
vibrations of the resulting molecule By increasing its kinetic energy, then it will lead to its
disengagement and return to the solution. This confirms that the studied system for
adsorption of this dye is of a physical nature and that the bonding force between the
surface of the adsorbent material and the dye is of the type Vandervals.
3- The value of (Qmax), which represents the theoretical total adsorption capacity, is greater
than the value of (qe) the process obtained in Table (7), where we note that this value does

www.wjpps.com │ Vol 10, Issue 7, 2021. │ ISO 9001:2015 Certified Journal │
18
Abdullah et al. World Journal of Pharmacy and Pharmaceutical Sciences
not change in a specific typical way with the change of temperature, and this can be
interpreted as the value of (Qmax) It is affected by many factors, including due to the
nature of the adsorbent material, such as the surface area, the method of distributing the
active sites eligible for the adsorption process and their homogeneity on the surface, the
size of the gaps or pores on it, as well as the type of active groups present within their
surface structures or the nature of the adsorbent material, the type of active groups (the
steric shape) and the method of interaction with The adsorption surface and its surface,
these factors together limit the adsorption efficiency and capacity.
Frendlich isotherm
The Ferendallch isotherm equation was applied to my dyes (B.g, B.y) and at different
temperatures (323-288 K°), and by using Western Sahara bentonite as an adsorbent.) and (Kf)
from the slope of straight lines and segments respectively. The values of the constants
calculated from the application of this isotherm were included in Table No. (10) and they
were as follows.
Figure 8: Fernandlech isotherm for adsorption of the (B.g) dye on Western Sahara
bentonite.
Figure 9: Fernandlech isotherm for adsorption of B.y dye on Western Sahara bentonite.

www.wjpps.com │ Vol 10, Issue 7, 2021. │ ISO 9001:2015 Certified Journal │
19
Abdullah et al. World Journal of Pharmacy and Pharmaceutical Sciences
Table 10: The values of the Wernelich constants (Kf, n) and the correlation coefficients
obtained for the adsorption process of my dye (B.g, B.y).
The name of the dye Temp C° n Kf R
B.g 288 1.498 136.77 0.9304
293 1.427 124.33 0.9414
298 1.480 119.64 0.9469
303 1.483 114.63 0.9465
308 1.629 105.36 0.9334
313 1.597 97.94 0.9297
323 1.552 87.35 0.9428
B.y 288 0.842 151.04 0.9913
293 0.802 126.85 0.9889
298 0.839 115.69 0.9927
303 0.861 113.08 0.9894
308 0.887 103.75 0.9873
313 0.896 95.58 0.9856
323 0.881 83.02 0.9970
By noting the values of the results obtained in Table (10), we find the following:
1- The Fernandelch isotherm model applies to the practical results of the studied systems for
both dyes (bg, by), where we notice that the values of the correlation coefficient (R) that
were obtained gave good linear relationships by drawing the relationship between (log qe)
versus (log Ce). Where the value of (R) ranged between (0.9304 - 0.9970) and at all
temperatures, and this indicates the possibility of applying the Frendelsh mathematical
model to these dyes and taking advantage of the values of the constants obtained and
explaining the nature of the studied system.
2- The value of (Kf), which has a relationship with the adsorption capacity, its value
decreases with increasing temperature, and for both dyes under study, this leads to a
reduction in the binding energy of the dye molecules and returns them from the
adsorption surface to the aqueous solution, thus reducing the adsorption capacity. This is
in agreement with what has been observed in studying the effect of temperature on
adsorption capacity. It also supports the physical nature in the process of the studied
system.
3- We note the value of (n), which has a relationship to the intensity of adsorption, that its
value is between decrease and increase with increasing temperature. Also, the value of (n)
for the (B.g) dye is more than (1) and this indicates that adsorption is preferred and good
and indicates that the adsorption system of the studied dye is of a physical nature. It is
known that the value of adsorption intensity (n) is preferred when its value is in the

www.wjpps.com │ Vol 10, Issue 7, 2021. │ ISO 9001:2015 Certified Journal │
20
Abdullah et al. World Journal of Pharmacy and Pharmaceutical Sciences
range.[1-10]
which indicates the occurrence of physical adsorption of the adsorbed material
on the surface of the adsorbent material. However, the values of (n) obtained for (B.y)
dye were less than one and ranged in a range (0.802 - 0.896) These values do not in
conformity with the requirements of the physical adsorption process and are not favorable
in adsorption systems when the values (n) are less than one,[18]
which may refer to implies
(chemisorption) in the adsorption system.[19]
REFERENCES
1. Nihan Kaya, (A comprehensive study on adsorption behavior of some azo dyes from
aqueous solution onto different adsorbents). Water Science & Technology, 2017; 76(2):
478-489.
2. M. H. Ehrampoush, Gh. Ghanizadeh, M. T. Ghaneian (EQUILIBRIUM AND KINETICS
STUDY OF REACTIVE RED 123 DYE REMOVAL FROM AQUEOUS SOLUTION
BY ADSORPTION ON EGGSHELL). Iran. J. Environ. Health. Sci. Eng, 2011; 8(2):
101-108.
3. Giane Gonçalves Lenzi, Maria Eduarda Kounaris Fuziki, Michel Zampieri Fidelis, Yuri
Barros Fávaro, Mauricio Aparecido Ribeiro, Eduardo Sidinei Chaves, Ervin Kaminski
Lenzi, (Caffeine Adsorption onto Bentonite Clay in Suspension and Immobilized), 2020;
63: e20180637.
4. Jiang, JQ, Ashekuzzaman SM. (Development of novel inorganic adsorbent for water
treatment). Curr Opin Chem Eng, 2012; 1(2): 191–9.
5. Barbosa CS, Santana SAA, Bezerra CWB, Silva, HAS. (Removal of phenolic compounds
from aqueous solutions using activated carbon prepared from water hyacinth) (Eichhornia
crassipes): kinetic and thermodynamic equilibriumstudies. Quím Nova, 2014; 37(3):
447-53.
6. Y.Bulut, N.Gozubenli, H.Aydm, (Equilibrium and kinetics studies of adsorption of direct
blue 71 from aqueous solution by wheat shells), J. Hazard. Mater, 2007; 144: 303-305.
7. B. S. Inbaraj, J. T. Chien, G. H. HO, J. Yang and B. H. Chen (Equilibrium and kinetics
studies on sorption of basic dyes by a natural biopolymer poly (ϒ- glutamic acid), j.
Biochemistry and Eng, 2006; 31: 209-211.
8. R. Malik, D. S. Ramteke, S. Wate, (Adsorption of malachite green on groundnut shell
waste based powderd activation carbon), J. was. Manag, 2006; 27: 1-8.
9. S. S. Reddy, B. Kotaiah, N. S. P. Reddy, M. V elum (The removal of composite reactive
dye from unit effluent using sewage sludge derived from activated carbon) Turk. j. Eng
www.wjpps.com │ Vol 10, Issue 7, 2021. │ ISO 9001:2015 Certified Journal │
21
Abdullah et al. World Journal of Pharmacy and Pharmaceutical Sciences
Env. Sic, 2006; 30: 370.
10. M. A. Hanan. (determination azo dyes), 1998; 79(2): 70-80.
11. H. C. Zollinger., (properties and Application of organic Dyes and dyes), 1991; 102(3):
(422).
12. A.A. aljarjuriu (Study of factors affecting the adsorption of some azo dyes and their
complexes), Master Thesis, University of Mosul, 2005.
13. R.T. Abadi, (Study of thermodynamic and kinetics of adsorption of a number of azo dyes
on activated charcoal and new adsorbents), Master Thesis, University of Mosul, 2006.
14. Safwan. AS, Ammar. AH, (Thermodynamic and Kinetics Studies of Adsorption of a
Number of Azo Dyes on a Various Type of modified Clays), PhD thesis, University of
Mosul, 2018.
15. S. Lucas and M. J. Cocero, (Study and modeling of furfural adsorption on activated
carbon under supercritical conditions), 2003. Available on E-Mail: [email protected].
16. Safwan. AS, Ammar. AH, (Thermodynamic and Kinetics Studies of Adsorption of a
Number of Azo Dyes on a Various Type of modified Clays), PhD thesis, University of
Mosul, 2018.
17. F. H. Esteves., (Decolorzation of Azo Dyes By Ozonation Combination with Ultrasonic
Irradiation) Talanta, 2000; 20(2): 1215-1322.
18. Umar, O. A., Raheem, O. M., Lucas, A. H., (Removal of Azo Dye Methyl Orange in
Aqueous Solution by Kaolinite Clay: Equilibrium Isotherms, Kinetics and Error
Analyese) Saudi J Eng Technol, 2020; 422-433.
19. Shahbeig, H., Bagheri, N., Ghorbanian S.A., Hallajisani, A., & Poorkarimi, S. (A new
Adsorption Isotherm Model of Aqueous Solution on Granular Activated Carbon) World
Journal of Modelling and Simulation, 2013; 9(4): 243-254.