Embed Size (px)
Citation preview

INFORMATION TO USERS
This manuscript has been reproduced from the microfilm master. UMI films the text directly from the original or copy submitted. Thus, some thesis and dissertation copies are in typewriter face, while others may be from any type of computer printer.
The quality of this reproduction is dependent upon the quality of the copy submitted. Broken or indistinct print, colored or poor quality illustrations and photographs, print bleedthrough, substandard margins, and improper alignment can adversely affect reproduction.
In the unlikely event that the author did not send UMI a complete manuscript and there are missing pages, these will be noted. Also, if unauthorized copyright material had to be removed, a note will indicate the deletion.
Oversize materials (e.g., maps, drawings, charts) are reproduced by sectioning the original, beginning at the upper left-hand comer and continuing from left to right in equal sections with small overlaps.
Photographs included in the original manuscript have been reproduced xerographically in this copy. Higher quality 6" x 9" black and white photographic prints are available for any photographs or illustrations appearing in this copy for an additional charge. Contact UMI directly to order.
Bell & Howell Information and Learning 300 North Zeeb Road, Ann Arbor, Ml 48106-1346 USA
800-521-0600
®
UMI

THERMODYNAMIC EXCESS FUNCTIONS
FOR MIXTURE ADSORPTION ON ZEOLITES
FLOR REBECA SIPERSTEIN
ADISERTATION
in
Chemical Engineering
Presented to the Faculties of the University of Pennsylvania in Partial
Fulfillment of the Requirements for the Degree of Doctor of Philosophy
2000
Alan L. Myers, Su
Uvmond/J. Gone. Supervisor of Raymond/J. Gone, Supervisor of Dissertation
Talid R. Sinno, Graduate Group Chairperson

UMI Number 9965568
<8 UMI UMI Microform9965568
Copyright 2000 by Bell & Howell Information and Learning Company. All rights reserved. This microform edition is protected against
unauthorized copying under Title 17, United States Code.
Bell & Howell Information and Learning Company 300 North Zeeb Road
P.O. Box 1346 Ann Arbor, Ml 48106-1346

To my father's memory, he would have been proud of this.
To my mother and her contagious love for science.

ACNOWLEDGMENTS
I acknowledge with personal and professional gratitude my advisor Professor Alan L. Myers, whose support helped me thorough difficult times. His guidance and constant encouragement made this work not only possible, but also an enjoyable quest. I thank him for his patience with my lack of eloquence and for understanding my Spanglish as if it was English. I sincerely value his example of scholarship. I could not have asked for a better advisor. Thank you Professor Myers.
A special thanks to my other advisor Professor Raymond Gorte for all his help with the
experimental work and for always having interesting explanations of why the equipment
was not working properly.
It was an honor to count with Dr. David Olson's help on everything related to zeolites.
His inexhaustible enthusiasm was always like a breath of fresh air. I am grateful to the
members of my dissertation committee, Professors Eduardo Glandt and Don Berry for
having interesting inputs from different perspectives.
I was fortunate to interact with Professor Ornan Talu from Cleveland State University
who was very generous in sharing his simulation code with me. Meeting someone with
such high values and strong passion for good research made me a better person and a
better scientist.
The completion of this thesis would not have been possible without the financial support
of the Department of Chemical Engineering and the Department of Mathematics at the
University of Pennsylvania. Financial support provided by NSF and Air Products and
Chemicals is gratefully acknowledged.
iii
The invaluable contributions from former members of the Myers group made smoother my startup in research. Dr. Jude Dunne, for building the calorimeter that was used for this research, Dr. Scott Savitz for showing me how to use the calorimeter, Dr. Albert Stella for always being willing to give advice. Christoph Borst and Max Engelhardt for always being a good sport.
Colleagues and friends made memorable my years at Penn: Dr. Vicki Booker, my first officemate and a true friend; Angel Caballero, for always listening when I was drowning in a glass of water and for all the endless discussions about absolutely irrelevant subjects; Dr. Beatrice Gooding, for her friendship and for tireless constructive criticism to all my presentations.. Finally, to some very special friends that made me forget about research once in a while: Dr. Marisa Ramírez Alesón, Dr. Maria Rubio Misas, Dr. Raquel Sanz and Mar Socas. To Isaac Skromne for 20 years of friendship.
iv
ABSTRACT
THERMODYNAMIC EXCESS FUNCTIONS
FOR MIXTURE ADSORPTION ON ZEOLITES
Flor R. Siperstein
Alan L. Myers and Raymond J. Gorte
Thermodynamic excess functions have been widely used to describe liquid properties be-
cause they quantify deviations from ideal behavior. In this work, thermodynamic excess
functions are used as a tool to understand and predict the behavior of mixtures in micro-
porous materials such as zeolites. The use of excess functions for describing deviations
from ideal mixing in the adsorbed phase differs from liquid solutions in several subtle but
important ways.
Prediction of mixture adsorption is a key factor in the design of adsorption separation
processes. Measuring single-component adsorption properties is easy compared to multi-
component properties. Therefore it is important to have a reliable method of calculating
mixture behavior from pure-component properties. The main obstacle to progress is a
'scarcity of accurate and consistent experimental data over a wide range of temperature v
and loading for testing theories. Almost no data are available on the enthalpy of adsorbed
mixtures, even though such information is necessary for the modeling of fixed bed adsor-
bers.
A custom-made calorimeter was used to measure mixture properties. Thermodynamic
excess functions such as excess enthalpy (heat of mixing) and excess free energy (activity
coefficients) provide a complete thermodynamic description of the effect of temperature,
pressure and composition variables.
The mixtures studied are described within experimental error by a 3-constant equation,
which is thermodynamically consistent and has the correct asymptotic properties at high
and low coverage for gases adsorbed in zeolites. More importantly, it is shown that pure
component properties such as heats of adsorption and saturation capacity can be used to
predict the magnitude of the non-idealities in mixture adsorption.
Predictions of mixture properties for SF6-CH4 mixtures on silicalite using molecular
simulation agree with experimental measurements. Molecular simulation results show
segregation of SE5 and CH4 molecules in different sections of the silicalite pore network.
Deviations from ideal solution are consequence of a non-uniform composition of the ad-
sorbed phase.
vi

TABLE OF CONTENTS
ACKNOWLEDGMENTS üi
ABSTRACT v
TABLE OF CONTENTS vii
LIST OF TABLES xi
LIST OF FIGURES xiii
Chapter 1
Introduction 1
l. I Adsorption 2
1.2 Adsorbents 5
1.2.1 Zeolites 6
1.3 Thesis outline 9
Chapter 2
Adsorption thermodynamics 11
2.1 Heats of Adsorption 12
2.2 Multicomponent adsorption 22
2.3 Empirical models 28
2.4 Conclusions 33
vii

Chapter 3
Adsorption Calorimetry............................................................................................. .35
3.1 Introduction 36
3.2 Design Criteria 37
3.3 Theory 39
3.3.1 Idealized Calorimeter 39
3.3.2 Practical Calorimeter 42
3.4 Description of Instrument 43
3.5 Thermopile calibration 47
3.6 Spurious Heat of Compression in Sample Cell 48
3.7 RGA calibration 50
3.8 Verification of Adsorption Equilibrium 54
3.9 Determination of Differential Heats from Finite Doses 56
3.10 Alternating Dosings of Each Component 59
3.11 Sample calculation 60
3.12 Conclusion 61
Chapter 4
Experimental measurements of adsorption equilibria and heats of adsorption........64
4.1 Materials 66
4.2 Method 69
4.3 Results 70
viii
4.3.1 Single-Gas Isotherms and Isosteric Heats 70
4.3.2 Binary mixtures 78
4.3.3 Ternary mixture 88
4.4 Discussion 92
4.5 Conclusion 104
Chapters
Molecular Simulation of Mixture Adsorption ..........................................................105
5.1 Statistical mechanics 107
5.1.1 Grand Canonical Ensemble 109
-5.1.2 Monte Carlo Simulation 111
5.1.3 Grand Canonical Monte Carlo 113
5.1.4 Radial Distribution Function 118
5.2 Molecular Model 121
5.2.5 Adsorbent-adsorbate interactions 122
5.2.6 Zero coverage properties 127
5.2.7 Adsorbate-Adsorbate 129
5.3 Simulation method 133
5.4 Results and Discussion 137
5.4.1 Pure component 137
5.4.2 Binary Mixture 147
5.5 Conclusion 156
ix
Chapter 6
Conclusions and Future Work ..................................................................................158
6.1 Summary and Conclusions 158
6.2 Future Work 163
References .................................................................................................................165
Appendix 1.................................................................................................................182
Appendix 2 190
x
LIST OF TABLES
Table 1.1 Unit cell composition of industrially important zeolites.................................. 8
Table 2.1 Adsorbe phase heat capacity at high temperature ...........................................18
Table 3.1 Key to Figure 3.1 .44
Table 3.2 Sample calculation of heats of adsorption from alternating dosings A and B of
the pure components. .............................................................................................62
Table 4.1 Properties of the gases studied .......................................................................69
Table 4.2 Constants of Eq. (4.1) for single gas isotherms. P is given in kPa for n in
mol/kg 74
Table 4.3 Constants of Eq. (4.2) for isosteric heats of adsorption of pure gases at 25°C.
Qu is given in kJ/mol for n in molAg. ................................................••••••«•«•••••••••75
Table 4.4 Binary gas mixtures studied.......«.«...««««.......««»«««..«««.»««.«•«»««•«.«78
Table 4.5 Parameters of ABC equation for adsorption of binary mixtures. .»........»...»».83
Table 5.1 General positions for space group Puma»»»»».»»»...»»»» 125
Table 5.2 Lennard-Jones parameters for adsorbate-adsorbate interactions »»».».»»».»131
Table 5.3 Zeolite-adsorbate interaction parameters».»».»..»».„»».»».»»...»»..«»»»»»138
Table 5.4 Parameters for mixtures of SEs and CH» on silicalite for Eq. (2.31). »»«.».»150
xi
Table ALI CO2 on NaX 182
Table A1.2 CO2 on NaX 183
Table A U C2H4 on NaX 183
Table A1.4 C2H4 on NaX 184
Table AL5 C2H4 on NaX 184
Table A1.6 C3H8 on NaX 185
Table A1.7 C2H6 on NaX 185
Table A1.8 C2H6 on NaX 186
Table A1.9 SF6 on NaX 187
Table ALIO SF6 on NaX. 187
Table ALU CR, on silicalite 188
Table A1.12 SF6 on silicalite 188
Table A1.13 SF6 on silicalite 189
Table A2.1 SF6-C2H6 on NaX 190
Table A2.2 C02-C2H8 on NaX 191
Table A2J SF6-CH4 on Silicalite 192
Table A2.4 C2H4-C2H6 on Silicalite 193
Table A2.5 CO2-C2H6 on NaX 194
Table A2.6 CO2-C2H4 on NaX 195
Table A2.7 Ternary equilibrium data for CO2-C2H4-C2H6 on NaX. .„»..»„.»..»„.».„.»196
Table A2.8 Ternary enthalpies of adsorption for CO2-C2H4-C2H6 on NaX ............197
xii

LIST OF FIGURES
Figure 1.1 Density of a fluid near a solid surface...................................................... 3
Figure 1.2 Density of argon adsorbed on TON and VPI zeolite structures at 295 K and 10
kPa. Bulk argon density is given as a reference....................................................... 4
Figure 2.1 Zero coverage isosteric heats of Lennard-Jones spheres on idealized
geometries 19
Figure 2.2 Isosteric heats of adsorption of CO2 on a faujasite model pore with cations of
charges z at different temperatures 21
Figure 3.1 Schematic of the calorimeter and auxiliary equipment 44
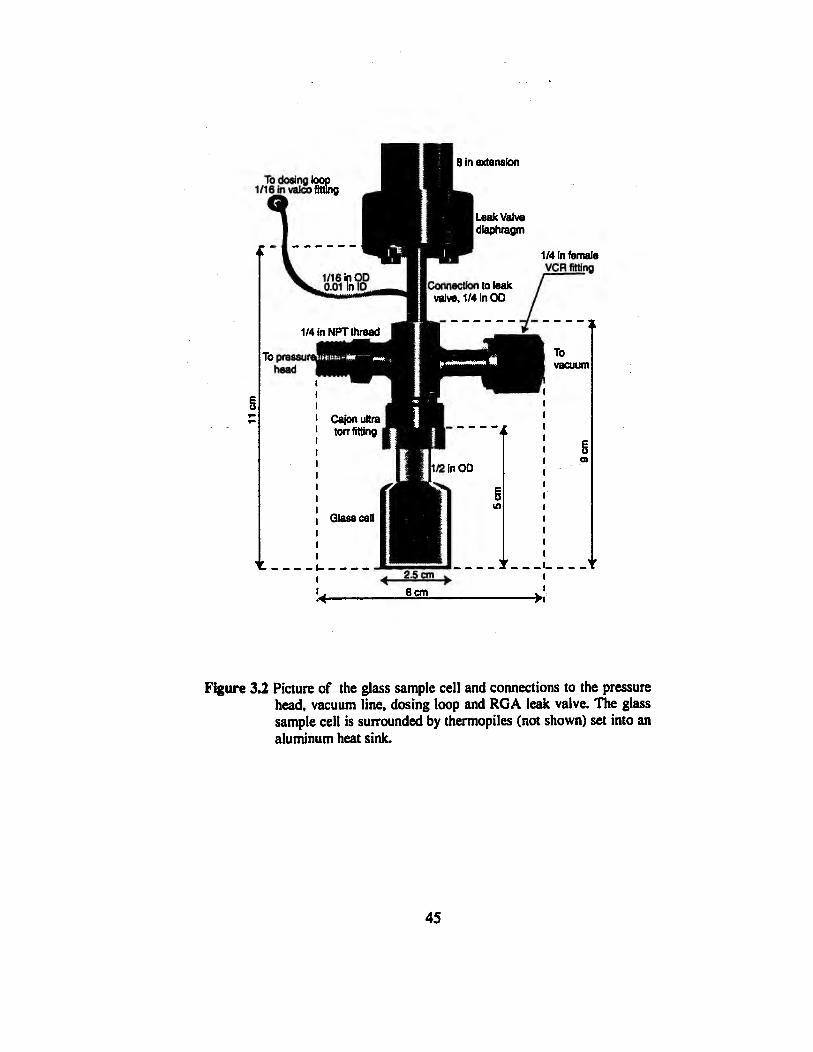
Figure 3.2 Picture of the glass sample cell and connections to the pressure head, vacuum
line, dosing loop and RGA leak valve. The glass sample cell is surrounded by
thermopiles (not shown) set into an aluminum heat sink 45
Figure 3.3 Linear correlation of a spurious sensible heat term for adding a dose of gas.
The difference in pressure is the pressure in the dosing loop minus the pressure in
the sample cell before opening the valve 49
Figure 3.4 Effect of pressure on RGA calibration AT of Eq. (3.15) for mixtures of SF6 and
CH4 53
xiii
Figure 3.5 Calibration of the composition for mixtures of C2H4 and C2H6 based on Eq.
(3.16). The calibration is independent of pressure....„.„».»»...„............»».».»»»„»54
Figure 3.6 Loci of loading by alternate paths for mixtures of SFs and CH4. Black circles
and open circles indicate different paths that intersect at point A............................55
Figure 3.7 Selectivity of SF6 relative to CH4 at 21.5°C. Symbols are the same as those in
Figure 3.6 The selectivity at point A is independent of the order of contacting the
components„„...».»..„.......„„.„.„„.„...».....„„.„.».„„.„„„„..»..„„.».»..»».««««..«.56
Figure 3.8 Comparison of the differential heat of adsorption with experimental heats
determined with finite doses of gas 58
Figure 3.9 Thermopile response, voltage versus time 60
Figure 4.1 MFI structure (view along 010) 67
Figure 4.2 NaX structure indicating ion positions 68
Figure 4 J Isotherms on NaX: CO2 at 293 K, C3H8 at 293 K, C2H4 at 293 K, C2H6 at 293
K, and SF6 and 295 K 72
Figure 4.4 Isotherms on Silicalite. C2H6 at 296 K, SF6 at 298 K, and CH4 at 297 K. Data
from Golden and Sircar for CH» is used to extrapolate at high pressure„„.„.»»»»»73
Figure 4.5 Single component differential enthalpy (isosteric heat) on NaX....................76
Figure 4.6 Single component differential enthalpy (isosteric heat) on silicalite..............77
Figure 4.7 Error in calculated pressure and selectivity plotted in parameter space for the
binary mixture CO2-C2H« on NaX using constants A, fi, and C in Eq. 2.31 »„„..„».81
xiv
Figure 4.8 Experimental and calculated pressure for the systems (A) CO2-C3H8 on NaX;
(B) CO2-C2H6 on NaX; (C) C2H4-C2H6 on NaX; (D) SF6-CH4 on MFI; (E) SE3-C2H6
on NaX; (F) CO2-C2H4 on NaX 84
Figure 4.9 Experimental and calculated gas-phase composition for the systems (A) CO2-
C3H8 on NaX; (B) CO2-C2H6 on NaX; (C) C2H4-C2H6 on NaX; (D) SEs-CH* on
MH; (E) SF5-C2H6 on NaX; (F) CO2-C2H4 on NaX 86
Figure 4.10 Experimental and calculated differential enthalpies for CO2-C2H6 on NaX..
86
Figure 4.11 Experimental and calculated differential enthalpies for CO2 in a CO2-C3H8
mixture adsorbed on NaX 87
Figure 4.12 Comparison of experimental pressure for the ternary system CO2-C2H4-C2H6
on NaX with pressure calculated values „„......„.„.„„„„„„„.„..«..»«..»..»««.««•••«89
Figure 4.13 Comparison of experimental selectivity for the ternary system CO2O) -
C2H4 (2) - C2H6 (3) on NaX with selectivity predicted using IAS (dashed line), and
ABC Eq. (2.31) (solid line) 90
Figure 4.14 Comparison of experimental enthalpy for the ternary system C02(l) - C2H4
(2) - C2H<5 (3) on NaX with predicted values using Eq. (2.27) and Eqs.(2.34)-(2.37).
91
Figure 4.15 Isothermal (295K), isobaric (13.3 kPa) xy diagrams for the systems: (A)
CO2-C3H8 on NaX; (B) CO2-C2H6 on NaX; (C) CO2-C2H4 on NaX; (D) C2H4-C2H6
on NaX; (E) SF6-CH4 on MH; (F) SF6-C2H6 on NaX 94
xv
Figure 4.17 Comparison of infinite dilution differential enthalpies (dashed lines) for the
system CO2-C2H6 on NaX with pure-component heats of adsorption at the same
total loading as the mixture (solid lines). „„.„„»»„„„„„„.„„„„.«..„„„„„„„„„„.„„96
Figure 4.18 Isothermal (295K), isobaric (13.3 kPa) excess enthalpy and excess free
energy for the systems: (A) CO2-C3H8 on NaX; (B) CO2-C2H6 on NaX; (C) C2H4-
C2H6 on NaX; (D) SF6-CH4 on MFI. x\ is the mole fraction of the first component
in the adsorbed phase 97
Figure 4.19 Isothermal (295K), isobaric (13.3 kPa) activity coefficients for the systems:
(A) CO2-C3H8 on NaX; (B) C02-C2H6 on NaX; (C) C2H4-C2H6 on NaX; (D) SF6-
CHionMFI 98
Figure 4.20 Excess chemical potential as a function of fractional coverage (6) at the
equimolar composition (xi=0.5) 100
Figure 4.21 Excess enthalpy as a function of fractional coverage (8) at the equimolar
composition (xt=0.5) 101
Figure 4.22 Correlation of constant A¿=A+BT in Eq. (2.31) with pure component
properties. h° is the enthalpy of adsorption (isosteric heat) at the limit of zero
loading; h* is the molar integral enthalpy of adsorption from Eq (4.2) at saturation;
Vc is the molar critical volume.„.....„..„.„„......„..„.„..„....»....«.».«»»»»»««««»»103
Figure 4.23 Correlation of constant C in Eq. (2.31) with pure component properties, mn
is the saturation capacity from Eq. (4.10) 103
xvi
Figure 5.1 Adsorbent in contact with a reservoir that imposes constant chemical
potential, temperature and composition by exchanging particles and energy. Adapted
from Frenkel and Smit (1996) 109
Figure 5.2 Algorithm for Monte Carlo simulation on a grand canonical ensemble for
adsorption from a mixture ..»»»»»»»»».»...»»..»».»»»»».»».»»»»»»»»».»»„»»»115
Figure S3 Representation of the SÍO4 tetrahedra»»».».»»„»»»».»»...«.««»»».«...««»123
Figure 5.4 Asymmetric unit cell for MFI structure»»»»»».»»»»»».»»....... 125
Figure 5.5 Representation of a two dimensional grid for nodes where the summations to
calculate the energy are stored.».».»»»....».»».»».»»»»»»....„»...«..»»«.«.«.»»».126
Figure 5.6 Second virial coefficient for methane .„»»„„»».»»»»»».»».».»„.„„„.„»»„131
Figure 5.7 Second virial coefficient for SF6».«».»»»»»»»»»»»»».««»»»»»»»»»»»"»132
Figure 5.8 Single component isotherms. Experimental measurements are white symbols
and simulation results are black symbols ......„„.„„.„„»»»»»..»»».».».»»»»»».»»137
Figure 5.9 Single component heats of adsorption. Experimental measurements are white
symbols and simulation results are black symbols. ».»»»»»»„».»»»»»»»»»».»»»138
Figure 5.10 Probability distribution on (a) pure SF6, and (b) pure CH4 at 298 K and
loadings of approximately 4 molecules/unit cell. Black regions represent the volume
of the pore network where there is a probability of 90% to find an adsorbed
molecule, white spheres represent the remaining 10%. »»»„».»»»».»»».»»»»«««140
Figure 5.11 Distribution for pure SF6 and pure CH» along the straight channel in
silicalite, for approximate loadings or 4 molecules/unit cell..............................„..141
Figure 5.12 Pure SF6-SF6 radial distribution function».».»..»».»..»»...».. 142
xvii
Figure 5.13 Pure CH4-CH4 radial distribution function 142
Figure 5.14 Approximate distance of 5.2 Â: (a) distance between an intersection and the
center of the straight channel (b) distance between an intersection and the center of
the sinusoidal channel 144
Figure 5.15 Approximate distance of 7.9 Â: distance between the straight channel and
the sinusoidal channel 144
Figure 5.16 Approximate distance of 10.5 A: (a) distance between two intersections, (b)
distance between two straight channel sections, (c) distance between two sinusoidal
channels................................. 145
Figure 5.17 Approximate distance of 12.2 Â: (a) distance between straight and sinusoidal
channel, (b) between intersections of different straight channels, and (c) between
two sinusoidal channels................... 145
Figure 5.18 Approximate distance of 13.4 Â: distance between an parallel straight
channels in the [001] direction 146
Figure 5.19 Gas-gas dispersion energy contribution for pure components 147
Figure 5.20 Comparison between experimental and simulated results: (a) total loading of
SF6(1) and CH4(2) on silicalite, (b) adsorbed phase mole fraction 148
Figure 5.21 Excess chemical potential as a function of spreading pressure 149
Figure 5.22 Individual enthalpy of adsorption in a mixture of SEs and CH» on silicalite
obtained from simulation...................»».»»..».»».......» 150
Figure 5.23 Probability distribution of: (a) SF6, and (b) CH4 in an almost equimolar
mixture of approximately 4 SEs and 4 CH4 molecules/unit cell, at 298 K and 100
xviii
kPa (yt=0.035, xi=0.56). Black spheres represent the volume of the pore network
where there is a probability of 90% to find an adsorbed molecule, white spheres
represent the remaining 10%. ...........„..»„„.„...„..........„„....».........«.„„„„«...».»151
Figure 5.24 Probability distribution along the straight channel for SF6and CH4 in
silicalite, at 298 K and 100 kPa (yi=0.035, xi=0.56). Solid line is SF6, dashed line is
CH4 152
Figure 5.25 Composition along the straight channel for a mixture of SEs - CH» on
silicalite at 100 kPa and 298 K (y,=0.035, x,=0.56) 153
Figure 5.26 SE5-SE3 radial distribution function in a binary mixture «—155
Figure 5.27 CH4-CH4 radial distribution function in a binary mixture 155
Figure 5.28 SE5-CH4 radial distribution function 156
xix
Chapter 1
Introduction
When asked about the most important technology for the chemical process industries,
most people might assume chemical reactor design. Actually, separation and purification
of the products is more likely to be where value is really added. In the last few years, ad-
sorption separation technologies have become increasingly important. On-site gas gen-
eration is possible, instead of purchasing liquefied gases [Crittenden and Thomas, 1998].
The synthesis of microporous materials has played an important role in the development
of new adsorption technologies. Perhaps the most fundamental issue in tailoring porous
materials is the nature of adsorbent-adsorbate interactions and the relationship between
these interactions and sorption kinetics and thermodynamics. [Barton, et al. 1999].
For adsorption separation technologies, the essential question is the behavior of adsorbed
mixtures. The prediction of mixture adsorption has been studied from different angles:
classical thermodynamic models, statistical mechanics, molecular simulation, and density
functional theory. Nevertheless, the prediction of mixture adsorbed properties remains an
important problem [Talu, 1998]. Any method used to predict mixture adsorption proper-
ties requires at some point a comparison with experimental measurements to validate the
predictions. The main obstacle to progress is a scarcity of accurate and consistent ex-
1
perimental data over a wide range of temperature and loading for testing theories. Almost
no data are available on the enthalpy of adsorbed mixtures, although such information is
necessary for the modeling of fixed bed adsorbers.
In this thesis, the adsorption of multicomponent systems on microporous adsorbents
(zeolites) was investigated through molecular simulation and experiment. In particular,
emphasis was placed on the prediction of mixture properties taking as a starting point
single component experimental data, because measuring single-component adsorption
properties is easy compared to multicomponent properties. The combined approach of
experiment and molecular simulation allows the interpretation of experimental measure-
ments on a molecular level.
The remainder of this chapter introduces some generalities about adsorption on micropo-
rous materials. Finally, an outline of the thesis is also presented.
1.1 Adsorption
Adsorption is the increase in density (or composition) of a fluid in the vicinity of a solid
surface. Experimentally, the amount adsorbed corresponds to the excess material in a
given volume compared to the bulk phase density that results of the interaction of the
fluid with a solid surface. Figure 1.1 shows the density profile of a fluid adsorbed on a
2
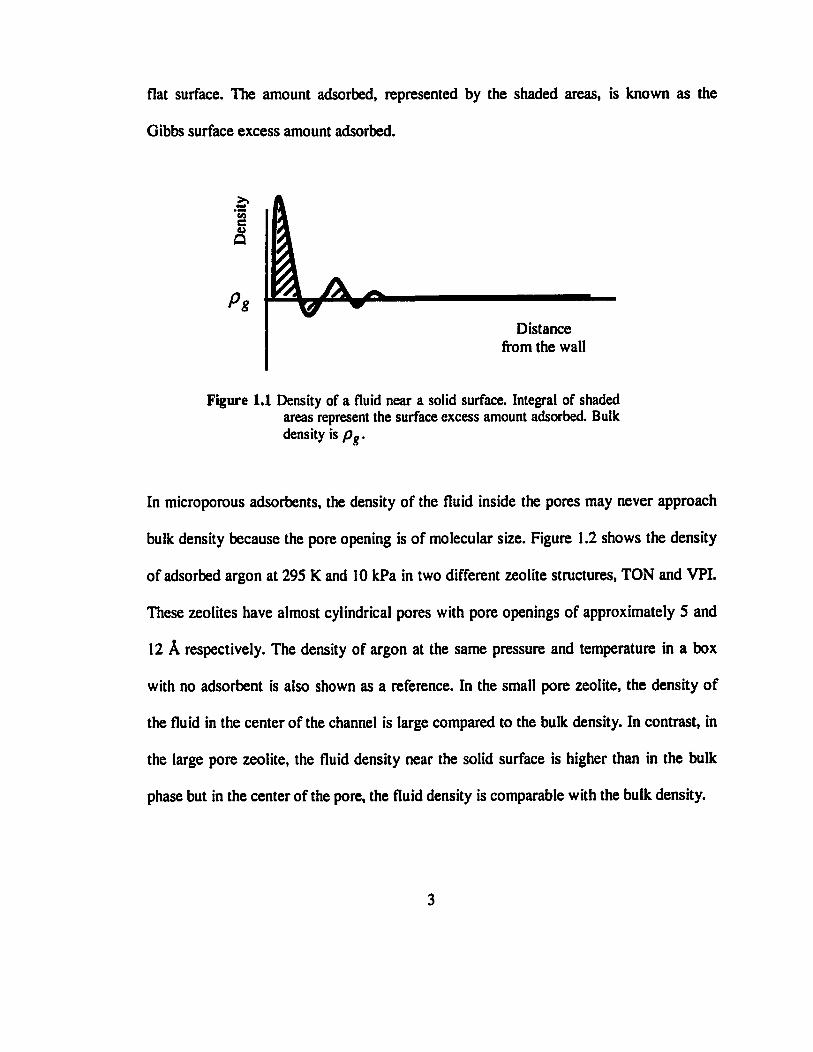
flat surface. The amount adsorbed, represented by the shaded areas, is known as the
Gibbs surface excess amount adsorbed.
"S3 e
&
Figure 1.1 Density of a fluid near a solid surface. Integral of shaded areas represent the surface excess amount adsorbed. Bulk density is p ? .
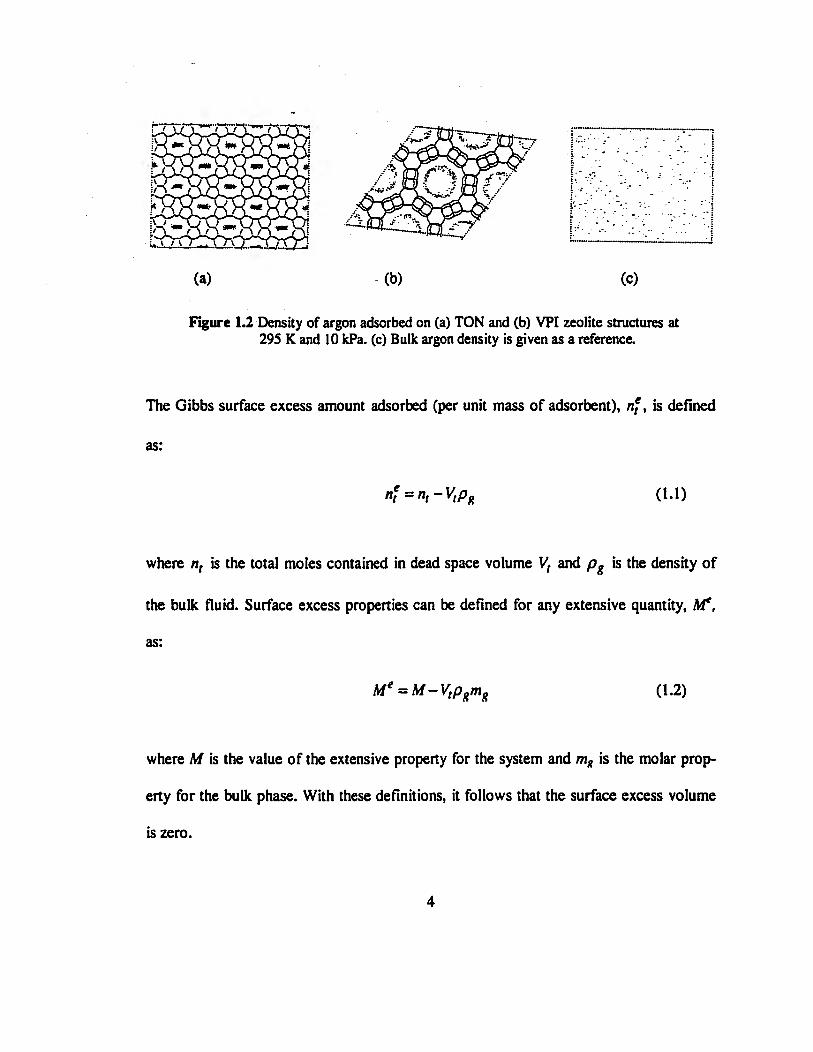
In microporous adsorbents, the density of the fluid inside the pores may never approach
bulk density because the pore opening is of molecular size. Figure 1.2 shows the density
of adsorbed argon at 295 K and 10 kPa in two different zeolite structures, TON and VPI.
These zeolites have almost cylindrical pores with pore openings of approximately 5 and
12 Â respectively. The density of argon at the same pressure and temperature in a box
with no adsorbent is also shown as a reference. In the small pore zeolite, the density of
the fluid in the center of the channel is large compared to the bulk density. In contrast, in
the large pore zeolite, the fluid density near the solid surface is higher than in the bulk
phase but in the center of the pore, the fluid density is comparable with the bulk density.
3
Distance from the wall
I
(a) (b) (c)
Figure 1.2 Density of argon adsorbed on (a) TON and (b) VPI zeolite structures at 295 K and 10 kPa. (c) Bulk argon density is given as a reference.
The Gibbs surface excess amount adsorbed (per unit mass of adsorbent), nf, is defined
as:
nf = nt-VtPg (1.1)
where nt is the total moles contained in dead space volume V, and pg is the density of
the bulk fluid. Surface excess properties can be defined for any extensive quantity, Ai*,
as:
Me = M-Vtpgmg (1.2)
where M is the value of the extensive property for the system and mg is the molar prop-
erty for the bulk phase. With these definitions, it follows that the surface excess volume
is zero.
**e * w '•(*>' m
•f r\ *** »*
[ mr.
Wk
4
This nomenclature becomes confusing when we introduce mixture excess variables.
Mixing excess extensive properties are defined as the difference between the actual prop-
erty value of a solution and the value it would have as an ideal solution holding the inten-
sive properties of the system constant. Throughout this thesis, surface excess properties
will be referred simply by the property name; excess will be reserved for properties like
excess free energy and excess entropy of mixing.
1.2 Adsorbents
To be effective in a commercial separation process, an adsorbent must have a large pore
volume, high selectivity, and be stable over long periods.
Adsorbents are usually classified depending on their pore structure or pore sizes. Amor-
phous adsorbents such as activated carbons, silica gels and aluminas contain complex
networks of interconnected micropores, mesopores and macropores. Crystalline or regu-
lar adsorbents such as zeolites and carbon nanotubes contain pores or channels with well
defined dimensions. It is customary to refer to macropores when the pore diameters are
larger than 50 nm, mesopores when diameters are in the range 2-50 nm, and micropores
for diameters that are smaller than 2 nm.
Different properties of an adsorbent can be used for mixture separation. Equilibrium
separations are possible due to the difference in compositions of an adsorbed and a bulk
5

phase at equilibrium. Differences in adsórbate diffusivities are used for kinetic separa-
tions. Molecular sieving is considered an extreme case of kinetic separations, where pore
openings may be too small to allow penetration by one or more of the adsorbates.
Equilibrium separation factors depend upon the nature of the adsorbate-adsorbent inter-
actions (that is, on whether the surface is polar, non-polar, hydrophilic, hydrophobic, etc.)
and on the process conditions such as temperature, pressure and concentration. Kinetic
separations are generally, but not exclusively, possible only with molecular sieve adsorb-
ents such as zeolites and carbon sieves. The kinetic selectivity in this case is largely de-
termined by the ratio of micropore diffusivities of the components being separated. For a
separation based on kinetics, the size of the adsorbent micropores must be comparable to
the dimensions of the diffusing adsórbate molecules.
This work was focused on mixture adsorption in zeolite type materials. Following is a
brief description of the structure and properties of zeolites.
1.2.1 Zeolites
Zeolites are crystalline microporous solids whose primary building unit consists of a
central atom (T atom) tetrahedrally bonded to four neighboring oxygen atoms. T atoms
are generally Si, Al or P, but may include Ga, Ge, B, Be or Ti [Vaughan, 1988]. These
tetrahedra are connected to form a three dimensional crystal framework. This framework
6
endoses a well-defined pore network that may be one, two or three-dimensional. The
pore network consists of an array of almost cylindrical pores or interconnected cages.
The pore size is determined by the number of atoms that form the pore openings. For ex-
ample, pore openings may be formed by rings of 6, 8, 10 or 12 T atoms connected
through the same number of oxygen atoms. Pore openings formed by rings of 5 T atoms
can admit only the smallest molecules such as water and ammonia. Zeolites containing 8,
10, and 12 oxygen atom rings have pore openings of approximately 0.42, 0.57 and 0.74
nm, respectively, and are penetrable by molecules of increasing size. It is possible for
molecules slightly larger than the pore opening to enter the pore network because of vi-
bration of the crystal lattice [Meier and Olson, 1992; Crittenden and Thomas, 1998].
The empirical formula of a zeolite framework is [MynAhOi ' JSÍO2] where x is greater or
equal to 2, and n is the cation valence. Typical compositions of industrially important
zeolites are in Table 1.1. The ratio of oxygen atoms to combined silicon and aluminum
atoms is always equal to two and therefore each aluminum atom introduces a negative
charge on the zeolite framework which is balanced by an exchangeable cation. Changing
the type of the cation may change the channel size and properties of the zeolite, including
its selectivity in a given chemical system. In addition, the Si/Al ratio can be varied. Thus,
zeolites with widely different adsorptive properties may be tailored by the appropriate
choice of framework structure, cationic form and Si/Al ratio.
7

Table 1.1 Unit cell composition of industrially important zeolites Zeolite
NaX
NaA
Silicalite
Na-Mordenite
Unit cell composition
Na«5Al85Sii07O384
Nai2Al|2Sii2048
SÍ96O192
Nag Al8SÍ4o096
Zeolites are widely used commercially as adsorbents in the petroleum and chemical in-
dustries in both bulk separation and purification processes. Adsorptive zeolite applica-
tions have been discussed by Ruthven (1984). More than 100 synthetic zeolite types are
known; the most important commercial adsorbents are the synthetic types A X, Y, syn-
thetic mordenite and their ion-exchanged varieties. Zeolite A is used as a desiccant, to
remove CO2 from natural gas, and for air purification. Zeolite X is used for pressure
swing H2 purification, and bulk separation of air. X and Y zeolites are used for xylene
purification. Silicalite is used for removal of organics from water [Crittenden and Tho-
mas, 1998].
The naming of the zeolites can be rather confusing. Although there is no standard naming
system for the composition of the material, the International Zeolite Structure Commis-
sion specifies 3-letter codes that identify zeolite structure types. While these codes offi-
cially designate a structure, in general they have little relation to the common name. For
example, ZSM-5 (Zeolite Synthesized by Mobil) has a code structure of MFI, but both
8

silicalite (aluminum-free ZSM-5) and TS-1 (titanium silicate), also have MFI type struc-
ture. For X and Y zeolites, all have a FAU type structure, independent of the aluminum
content or the nature of the non-framework cation present.
1.3 Thesis outline
Prediction of mixture adsorption is the key factor in the design of adsorption separation
processes. Measuring single-component adsorption properties is easy compared to multi-
component properties. Therefore it is extremely important to have a reliable method of
calculating mixture behavior from pure-component properties.
The purpose of this work is to develop new methods for predicting mixture adsorption
behavior based exclusively on pure component information. Two approaches were used:
experimental and computer simulation.
The fundamental thermodynamic concepts necessary for this study are discussed in
Chapter 2. The thermodynamic description of adsorbed mixtures is presented and the
models used in this work are derived. Definitions for heats of adsorption are presented
and the temperature dependency of the heats is discussed.
As mentioned before, to test any method for predicting mixture adsorption it is necessary
to compare its performance with experimental measurements. Chapter 3 contains a de-
9
tailed description of the combined calorimeter-volumetric apparatus used for the meas-
urement of the properties needed to study mixture adsorption, as well as the operation
procedure of the apparatus.
In Chapter 4, the main results from the experimental measurement of pure-component
and mixture adsorption properties are presented. The mixture properties are correlated
using an excess free energy model which allows us to determine the magnitude of the de-
viations from ideal solution observed in the different systems. By identifying the causes
of the non-idealities it is possible to find a relationship between pure-component proper-
ties and the non-ideality observed in adsorbed mixtures. This relationship can be used to
predict mixture adsorption properties.
Molecular simulation was the second approach used to study mixture adsorption. Chapter
5 describes the methodology used for simulating mixtures of SEs and CH4 on silicalite
type zeolite. Comparisons between simulation results and experimental measurements
show good agreement. Molecular simulation results were used to understand the behavior
of mixtures in zeolite type materials from a molecular level. Preferential adsorption in
specific sites, as well as segregation of the adsorbates in a mixture was observed. Pack-
ing effects were observed only at high loadings, resulting in CH» molecules packed be-
tween SE5 molecules.
10
Chapter 2
Adsorption thermodynamics
Adsorption separation equipment design requires an accurate description of the behavior
of fluids in microporous adsorbents. The fluid adsorbed on a solid surface constitutes a
distinguishable phase in the thermodynamic sense although there is no physical boundary
that separates the adsorbed phase from the bulk phase. Then, phase equilibrium may be
considered between the adsorbed phase and unadsorbed fluid in a bulk phase.
A rigorous treatment of adsorption thermodynamics can be found elsewhere [Ruthven,
1984]. In this chapter an overview of the thermodynamics of heats of adsorption and
mixture adsorption is presented. The concepts and equations presented in this chapter
constitute a theoretical framework for the design of the calorimeter (Chapter 3) and will
be used to analyze experimental and molecular simulation results in Chapters 4 and 5 re-
spectively.
This chapter is divided in three sections: section 2.1 deals with the definitions and as-
sumptions for heats of adsorption, section 2.2 contains a general thermodynamic descrip-
tion of mixture adsorption, and finally section 2.3 contains some specific models that
were used for this research.
11

2.1 Heats of Adsorption
The term heat of adsorption is commonly understood as the heat released upon the ad-
sorption of a fluid on a surface. The amount of heat released may be significant and may
influence the performance of the adsorption process in adiabatic units, as in the case of
gas separation. There are several definitions for heats of adsorption. Hill (1949) defines
integral, differential, isothermal and isosteric heats of adsorption.
2.1.1 Heat or Enthalpy of Adsorption for Single Gases
The heat of adsorption used most frequently in the literature is the isosteric heat, usually
written qtt. Unfortunately the terminology "heat of adsorption" is vague and there is dis-
agreement on the definition of isosteric heat. The fact that several other heats of adsorp-
tion (equilibrium, integral, differential) can be defined adds to the confusion. In this
work, well-defined enthalpy variables are used instead of the conventional terminology of
heats of adsorption. In this section is shown how enthalpies of adsorption are related to
the isosteric heats (qa) under certain special conditions.
Consider first the enthalpy H for n moles of pure gas adsorbed at temperature T. H is the
experimental (Gibbs excess) integral enthalpy measured in Joules per kilogram of ad-
sorbent and n is the experimental (Gibbs excess) amount adsorbed in moles per kilogram
of adsorbent. Let h* be the molar enthalpy of the pure, perfect gas at the same tempera-
ture T. The integral enthalpy of adsorption relative to the perfect-gas reference state is:
12
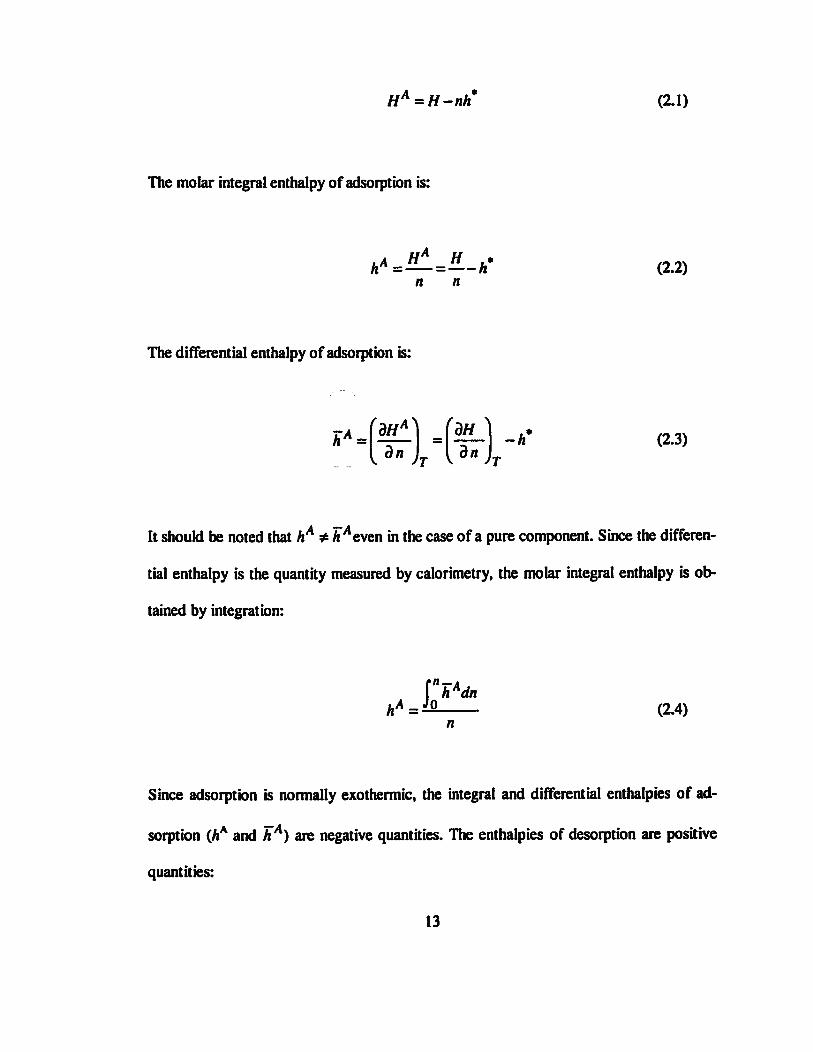
HA=H-nh* (2.1)
The molar integral enthalpy of adsorption is:
ftA=«i=«_A. n n
(2.2)
The differential enthalpy of adsorption is:
hA = rBHA\ (dH )
dn \ J \ 9« i*
- Ä ' (2.3)
It should be noted that hA *• P*even in the case of a pure component. Since the differen-
tial enthalpy is the quantity measured by calorimetry, the molar integral enthalpy is ob-
tained by integration:
* " = _Jo hndn
(2.4)
Since adsorption is normally exothermic, the integral and differential enthalpies of ad-
sorption (/tA and hA) are negative quantities. The enthalpies of desorption are positive
quantities:
13
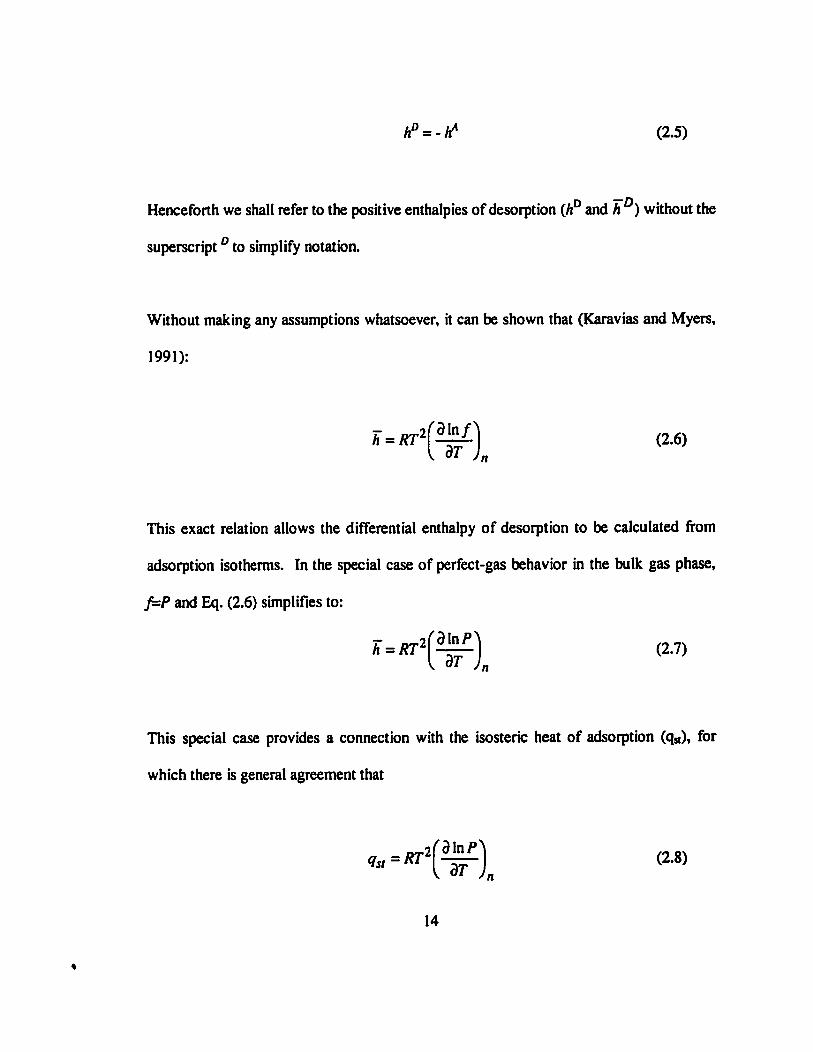
A0*-A* (2.5)
Henceforth we shall refer to the positive enthalpies of desorption (AD and h ) without the
superscriptD to simplify notation.
Without making any assumptions whatsoever, it can be shown that (Karavias and Myers,
1991):
r - « ^
This exact relation allows the differential enthalpy of desorption to be calculated from
adsorption isotherms. In the special case of perfect-gas behavior in the bulk gas phase,
f=P and Eq. (2.6) simplifies to:
*2 h=RV rd\nP\ I 3T )n
(2.7)
This special case provides a connection with the isosteric heat of adsorption (q«)» for
which there is general agreement that
- • < ¥ ) .
14
when the bulk gas obeys the perfect gas law.
The isosteric heat defined by Eq. (2.8) has not been extended to the general case of a
multicomponent, real gas mixture. Eq. (2.6) for differential enthalpy applies to a real gas
and can be generalized for gas mixtures, as shown in the following section.
2.U Enthalpy of adsorption for Mixtures
The integral enthalpy of adsorption in Eq. (2.1) may be extended to a multicomponent
mixture:
/ / M = / / -X^; (2.9)
Defining total adsorption n, = .n,-, the molar integral enthalpy of adsorption is:
h*= = 2*xihi (2.10) nt nt
where x¡ = n¡/n, is the mole fraction of /th component in the adsorbed phase. The differ-
ential enthalpy of adsorption for the ith component is:
hiA =
fwA^ {*ni)T.n, Va"/Jr.„,
-h¡ (2.11)
15
As before, the molar integral enthalpy is obtained by isothermal integration of the differ-
ential enthalpy:
XJ 0 V^ hA=-i- (2.12)
"t
Since integral enthalpy is a state function, the integration in Eq. (2.12) is independent of
the path.
Continuing as before, the negative enthalpies of adsorption (A/4 and A,- ) are replaced by
positive enthalpies of desorption (A,0 and A,0), and the superscript ° is dropped to sim-
plify the notation.
It can be shown that the rigorous extension of Eq. (2.6) for the differential enthalpy of
desorption in a multicomponent mixture is (Karavias and Myers, 1991):
^* r 2 fêk) (2-13)
In the special case of a perfect gas, the fugacity is equal to the partial pressure in the gas
phase (ft = Py¡). In the following discussion, we shall refer to the differential enthalpy of
desorption (h¡) instead of isosteric heat, with the understanding that the two quantities are
the same for a perfect gas. 16
2.1.3 Heat capacity
Heats of adsorption measured experimentally are typically obtained by differentiation of
isotherms based on Eq. (2.7). Typically, three adsorption isotherms are measured at inter-
vals of 30°C, so that the behavior of the system is determined within a band of 60°C, a
region of ±30°C from the middle isotherm.
Another method is to use a calorimeter [Dunne et al. 1997; Siperstein et al. 1999b; Sircar
et al. 1999]. In general, calorimetric measurements are at a single temperature, so the
temperature dependence within the same band of temperature (±30°C) is provided by
thermodynamic equations linked to the heat of adsorption.
Although it is generally accepted that enthalpies or heats of adsorption are constant over
some range of temperature, little is known about the accuracy of the approximation.
Whether the isosteric heat increases or decreases with temperature is also unknown.
The heat capacity at constant loading is obtained by differentiating Eq. (2.3) with respect
to temperature:
Mn-iw\<-dT (2.14)
/ / !
Thus the derivative of the isosteric heat with respect to temperature at constant excess
amount adsorbed is the difference of two heat capacities: the perfect-gas molar heat ca-
pacity less the differential heat capacity in the adsorbed phase.
17
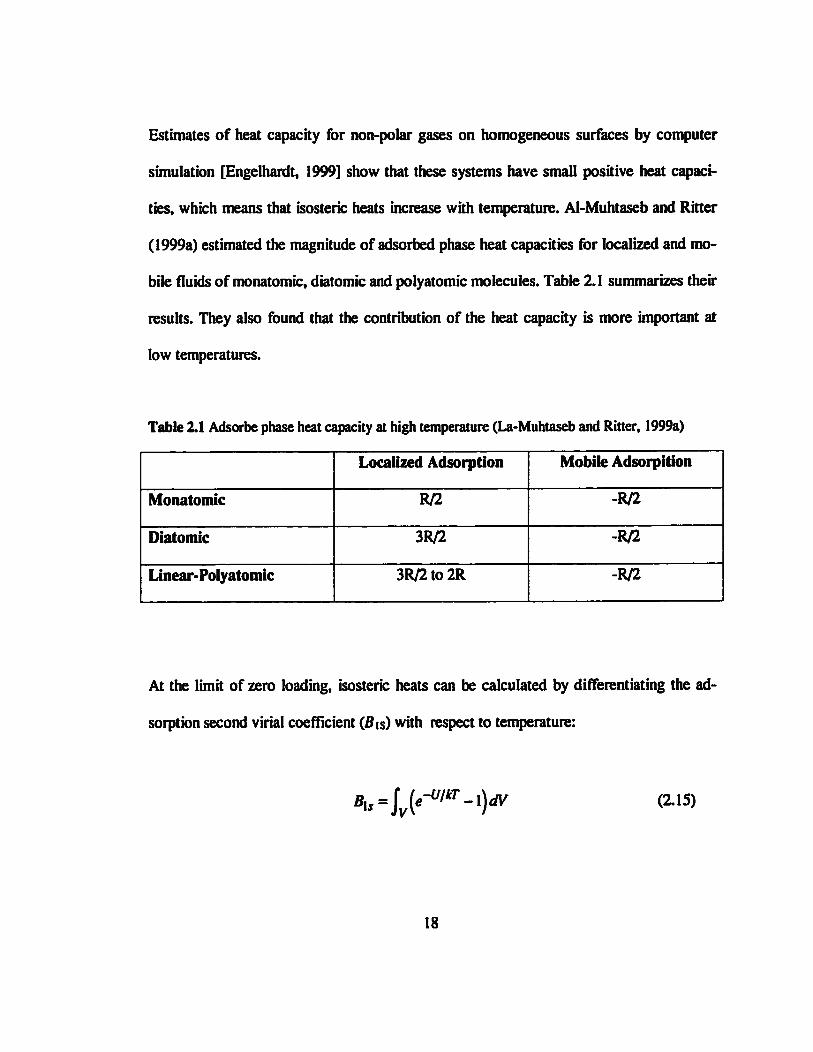
Estimates of heat capacity for non-polar gases on homogeneous surfaces by computer
simulation [Engelhardt, 1999] show that these systems have small positive heat capaci-
ties, which means that isosterk: heats increase with temperature. Al-Muhtaseb and Ritter
(1999a) estimated the magnitude of adsorbed phase heat capacities for localized and mo-
bile fluids of monatomic, diatomic and polyatomic molecules. Table 2.1 summarizes their
results. They also found that the contribution of the heat capacity is more important at
low temperatures.
Table 2.1 Adsorbe phase heat capacity at high temperature (La-Muhtaseb and Ritter, 1999a)
Monatomic
Diatomic
Linear-Polyatomic
Localized Adsorption
R/2
3R/2
3R/2 to 2R
Mobile Adsorpition
-R/2
-R/2
-R/2
At the limit of zero loading, isosteric heats can be calculated by differentiating the ad-
sorption second virial coefficient (¿is) with respect to temperature:
Bxs-\v{e-UlkT-\)dV (2.15)
18
< 7 í r = * rflnß ÍL+kT = - -M-
Ue-U'kTdV
MT) J {e-W-\)dV + kT (2.16)
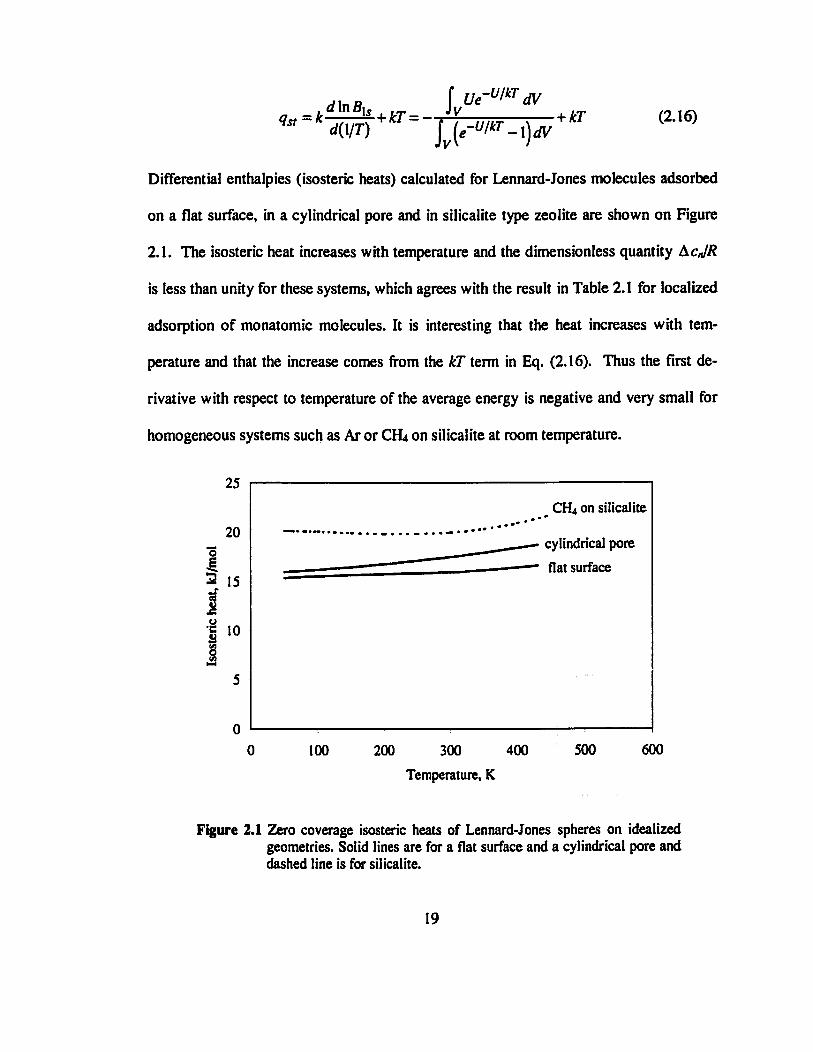
Differential enthalpies (isosteric heats) calculated for Lennard-Jones molecules adsorbed
on a flat surface, in a cylindrical pore and in silicalite type zeolite are shown on Figure
2.1. The isosteric heat increases with temperature and the dimensionless quantity AcJR
is less than unity for these systems, which agrees with the result in Table 2.1 for localized
adsorption of monatomic molecules. It is interesting that the heat increases with tem-
perature and that the increase comes from the IcT term in Eq. (2.16). Thus the first de-
rivative with respect to temperature of the average energy is negative and very small for
homogeneous systems such as Ar or CHt on silicalite at room temperature.
25
20 ô E 3 15 1 o
O
0
__ CH4 on silicalite
cylindrical pore flat surface
100 200 300 400 Temperature, K
500 600
Figure 2.1 Zero coverage isosteric heats of Lennard-Jones spheres on idealized geometries. Solid lines are for a flat surface and a cylindrical pore and dashed line is for silicalite.
19

Results from molecular dynamics (MD) simulation of adsorption of p-xylene on NaY
zeolite [Schrimpf et al. 1995] indicate that the largest contribution to the heat capacity is
the gas-solid interaction, not the gas-gas interaction. Lattice gas models have also been
used [Al-Muhtaseb and Ritter, 1999b] to show that laterat interactions play a small roll in
heat capacities; surface heterogeneity and coverage are more important.
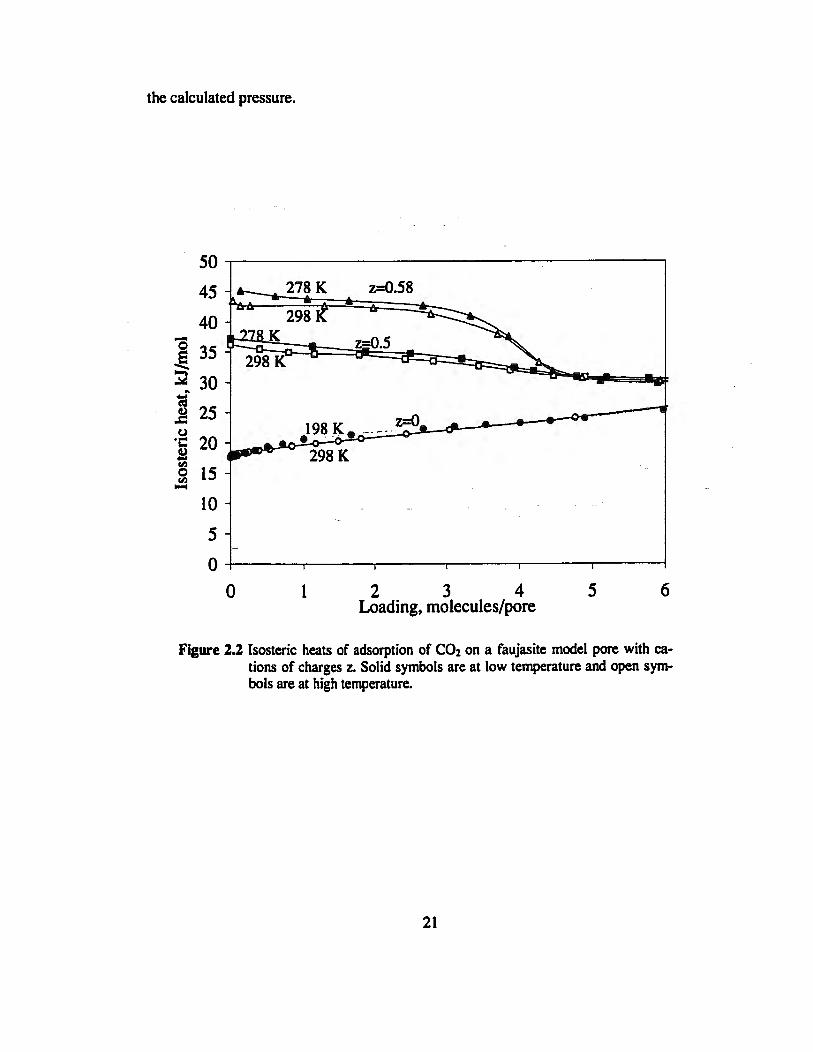
Systems such as CO2 on NaX display energetic heterogeneity induced by high energy
sites adjacent to sodium cations and low energy sites elsewhere in the supercavity. The
isosteric heats on Figure 2.2 was calculated for a spherical Lennard-Jones molecule con-
taining a point quadrupole moment at its center, adsorbed in a smooth spherical super-
cage decorated with cations [Soto and Myers, 1981; Karavias and Myers, 1991b]. The
heat of adsorption decreases with temperature and values of cJR as large as -5 were cal-
culated at low coverage. However, the theoretical heat curve fails to reproduce experi-
mental data for C02 on NaX at 298 K [Dunne et al. 1996b]. Instead of the plateau ob-
served on Figure 2.2, the experimental heats decrease exponentially from 50 to 36 kJ/mol
over the range 0-5 mol/kg. Since the shape of the heat curve on Figure 2.2 is unrealistic,
the large values calculated for heat capacities are questionable.
If the heat capacity en is of order unity (positive for homogeneous systems and negative
for heterogeneous systems), then it can be shown by integration of Eq. (2.8) that the con-
stant isosteric heat approximation over a temperature band of 100 degrees Kelvin (plus or
minus 50 degrees from the isothermal measurements) generates an error of 1% or less in
20
the calculated pressure.
\t± 278 K z=0.58
298
^ 2 9 ^ = t = : : = : : d t : =
198 K 298 K
5 0 2 3 4 Loading, molecules/pore
Figure 2.2 Isosteric heats of adsorption of C02 on a faujasite model pore with ca-tions of charges z. Solid symbols are at low temperature and open sym-bols are at high temperature.
21
2.2 Multicomponent adsorption
Models or correlations for mixed gas adsorption are crucial to the design of adsorptive
gas separation processes. They should be capable of predicting the equilibrium amount
adsorbed from pure gas isotherms for each constituent in the mixture, within given ranges
of operating temperature and total pressure.
The theories for mixed gas adsorption fall into three general categories:
1. Langmuir type equations and correlations [Hill, 1986] including extensions to
heterogeneous adsorbents, different size adsorbates on homogeneous and hetero-
geneous adosorbents [Nitta, et al. 1984], and statistical mechanics models for ad-
sorption [Ruthven, 1982; Martinez and Basmadjian, 1996].
2. Two-dimensional equation of state [Appet, et al. 1998 and references therein].
3. Potential theory [Grant and Manes, 1966].
4. The ideal adsorbed solution theory [Myers and Prausnitz, 1965] and models de-
rived from it, like heterogeneous ideal adsorbed solution [Valenzuela et al. 1988;
Moon and Tien, 1988], and the multispace adsorbed solution [Gusev, et al. 1996].
5. Non-ideal adsorbed phase models for activity coefficients, incluiding the vacany
solution theory [Suwanayuen and Danner, 1980], and the spreading pressure de-
pendant model [Talu and Zweibel, 1986].
The ideal adsorbed solution theory is constructed on the assumptions of an inert homoge-
22

neous adsorbent. This theory does not require a specific functional form of the pure com-
ponent isotherm, but it requires a constant slope of the isotherm at the limit of zero cov-
erage (Henry's Law regime). Following is a detailed treatment for non-ideal adsorption
that reduces to ideal adsorption when the activity coefficients are unity.
2.2.1 Non ideal Adsorption
For adsorption of a gas mixture containing Nc components, the equilibrium condition is
equality of fugacity in the adsorbed and gas phases:
Pyi^fiXiYi « = 1,2,.../Vc (2.17)
where P is pressure, y and x are mole fractions in the gas and adsorbed phase, respec-
tively, $¡ is the fugacity coefficient of component i in the gas phase, f¡ is the fugacity of
the pure component in its standard state, ) ¡ is the activity coefficient of component i in
the adsorbed phase, which is unity for ideal solutions. The standard state is the surface
potential (<I>) given by
<¡> = -RT¡ nd\nf (constant T) (2.18) Jo
for single-component adsorption. For a perfect gas, fugacity (/) is equal to pressure (P)
and:
23
<P = -RT¡Pnd\nP=-RT\ \^^-\dn (constantT) (2.19) JO Jovdln/ iy
For adsorption at temperature T, the surface potential is the chemical potential of the
solid adsorbent relative to its pure state in vacuo at the same temperature.
As shown later, a variable that arises frequently in adsorption thermodynamics is:
m=-— (2.20) RT
since the surface potential (<&) has units of J/kg, yt has units of mol/kg, the same as
loading.
It is convenient to define the excess chemical potential of the adsorbed solution by:
Nc p e = RT^Xi\ny¡ (2.21)
so that adsorbed-phase activity coefficients are determined by partial-molar derivatives:
24
RT\nn = (2.22)
Note that the variables held constant for the differentiation are temperature and ¡p, unlike
the partial molar quantities of solution thermodynamics for which temperature and pres-
sure are fixed. Let the excess reciprocal loading be defined as:
UJ n, ynai
(2.23)
The excess reciprocal loading vanishes for an ¡deal solution. It can be shown [Talu and
Zwiebel, 1986] that Eqs. (2.21) and (2.23) are related by:
(lY Jè/f/FT U J [ Bw )
(2.24) T,x
The prominence of the reciprocal loading variable (I//i) in adsorption thermodynamics
arises from the Gibbs adsorption isotherm, which for single-gas adsorption is obtained
from Eqs. (2.18) and (2.20):
rain/i =J_ (2.25)
25

The concept of selectivity id useful to quantify the ability of an adsorbent to target ad-
sorption of one of the components in a mixture. The selectivity of component 1 relative to
component 2 is defined as:
s _ x\/y\ _ fiYiki 1,2 xi/yi tfn/h
(2.26)
The temperature dependence of the selectivity is given by the temperature dependence of
the fugacities in the standard state, the activity coefficients and the fugacity coefficients.
For the special case of an adsorbed phase in equilibrium with an ideal gas, the tempera-
ture dependence of the selectivity is given by the difference in differential enthalpies of
adsorption of each component in the mixture:
raimu> _fain/2>2>l f i ïL/Qi l _fa.i-fa.i »zn < dT h » "I ar J 37* RT2 . ar .
The previous equations are well known [Valenzuela and Myers, 1989]. In this work, the
equilibrium equations are extended to the differential enthalpy (isosteric heat) in order to
introduce the temperature variable in a systematic way. For the general case of a multi-
component mixture, a real gas, and a nonideal adsorbed solution, it can be shown from
Eq. (2.13) that the differential heat of desorption of the rth component (A,) is equal to:
26
S-V+^pS^) r.JC
+<
X^-Aj^r facv»)'' 87/ }y,x
2*fii-rB(\/nf I ** ) T,x
(2.28)
where
c;= 1 |9lnn° (nffldtoFT,
The superscripts ° refers to the standard state of pure adsórbate at the same temperature
and surface potential as the mixture. A,0 is the differential heat of desorption of the pure
component and hf is the molar integral heat of desorption of the pure component from
Eq. (2.4).
For the special case of an ideal adsorbed solution, }¡ = 1, (l/ri)e = 0, and Eq. (2.27) re-
duces to [Karavias and Myers, 1991]:
A,=A?+-L X^;-(à7-A;)G;
i
(2.29)
27
In the rare case when the differential enthalpy of desorption is constant (independent of
loading), it follows from Eq. (2.4) that hf = h° and ideal solution theory predicts that the
mixture enthalpies are equal to their (constant) pure component values. There are no sim-
plifications of Eqs. (2.27) and (2.29) for the typical case when the differential enthalpy of
the pure gas varies with loading. The empirical approximation that the differential mix-
ture enthalpy is equal to the value for the pure component at the same loading appears to
have no theoretical basis.
2.3 Empirical models
Models for activity coefficients for an adsorbed phase are available in the literature.
Some of them are not thermodynamically consistent. Others require so many adjustable
parameters that a physical interpretation is practically impossible for the model, so it be-
comes an exercise in parameter fitting. The purpose of this work is to present a model of
activity coefficients (excess chemical potential) in the adsorbed phase that can be inter-
preted in terms of enthalpy and entropy of mixing.
2.3.1 ABC equation
The simplest composition dependence for the excess functions is quadratic and a system
with Afie = A>x\Xi is called a quadratic mixture (Rowlinson and Swinton, 1982). If in
addition A0 is independent of temperature, then the excess entropy is zero, a definition
close to that of a regular solution (Hildebrand et al. 1970).
28
For an adsorbed quadratic mixture (Valenzuela and Myers, 1989; Talu et al. 1995):
/ í e*A3x,Jc2(l-<"C*') (2-30)
which assumes that the excess chemical potential is independent of temperature and equal
to the excess enthalpy. A three- constant model of binary adsorption is proposed in this
work. All of the equilibrium properties of the mixture may be calculated from the excess
chemical potential:
fle=(A + BT)xlx2(\-e-Cv') (2.31)
where A, B, and C are constants. Eq.(2.30) will be referred to as the ABC equation to
emphasize that it contains three constants which are independent of temperature, loading,
and composition. This empirical equation is the simplest possible representation of equi-
librium which obeys all of the limits required of any theory [Valuenzuela and Myers,
1989; Talu et al. 1995], especially thermodynamic consistency and reduction to an ideal
adsorbed solution at the limit of zero loading. Although the excess chemical potential has
a quadratic (symmetrical) form for the composition dependency at constant surface po-
tential, the composition dependence at constant pressure has the complicated asymmetric
form observed experimentally.
29
The exponential dependence upon surface potential (4> = -RTy ) gives the correct as-
ymptotes at zero loading and at high loading. It has been shown previously that the expo-
nential dependence upon surface potential agrees with experiment and molecular simula-
tion from zero loading up to saturation [Talu et al. 1995]. The linear dependence of ex-
cess chemical potential upon temperature implies an enthalpy that is independent of tem-
perature, an approximation consistent with the assumption that the differential enthalpies
("heats") are constant over the temperature range of interest.
The excess reciprocal loading is obtained from Eq. (2.23):
{$ {^l/w^™^ <2-32)
This excess function is required to calculate the total loading (/if) from Eq. (2.24). (1/n)'
is finite at the limit of the zero loading as noted previously [Talu et al. 1995]. Although
this may seem incorrect since loading is calculated for ideal solutions by setting (l/rif =
0, note that Eq. (2.24) has the form (~ - <») as n-»0. Eq. (2.31) predicts that the limit of
(1/ nf is zero at high loading (^ -» ~ ) , which is consistent with the existence of a satu-
ration capacity for loading.
The activity coefficients are given by Eq. (2.22):
30
RT In y i = (A+BT)xj(l - e~c * ) (i * y) (2.33)
This equation satisfies the requirement that the activity coefficient is unity at the limit of
zero loading (i/t -*0). At high loading (\fi -»«) , the activity coefficients approach a
constant value corresponding to saturation.
The four partial derivatives in Eq. (2.27) were calculated from Eqs. (2.31) and (2.32):
T,x A±BLCe-Crx2
RT J (/*;) (2.35)
B(\/n)e) BT
y,x
AC -cw Te x\x2
RT2
(2.36)
r31nZL>
=-l±BLAtX,e-cr T,x RT
C-xxx2e~ (2.37)
Application of the Gibbs-Helmholtz relation to Eq. (2.31) yields:
31
I>'=-Á^T\ -A«w(l--Cr) (2.38)
Physically, the excess enthalpy is the molar enthalpy of mixing of the adsorbed solution
at constant surface potential. Note that the enthalpy of mixing is independent of tem-
perature for our model, which is consistent with the assumption that differential enthal-
pies (heats) are independent of temperature.
2.3.2 Multicomponent systems
In preparation for a discussion of experimental data obtained for a ternary mixture, the
previous equations for the binary case are next extended to a multicomponent mixture.
Our assumption of a quadratic composition dependence for the excess functions implies
the dominance of pairwise interactions, so the ABC equation for multicomponent systems
(ternary and higher) is additive in the constituent binaries [Prausintz, et al., 1999]. The
excess chemical potential can be written:
. Ne Nc
«e={ll(Aü+B^h4]-e vW) (2-39)
where Aij, B¡¡, and C¡¡ are the binary parameters for the ABC equation and the constants
vanish for i =/. Specifically, for a ternary mixture:
32
p6= (Al2 + Bl2T)xlx2(l-e-C»V) +
(A,3 + Bl3T)xlx3[\-e-C^)+ (2.40)
(A23+ß23r)A:2X3(l-e-C^)
2.4 Conclusions
Two main concepts were treated in this chapter: heats of adsorption and thermodynamics
of adsorption equilibria.
It is convenient to abandon the nomenclature of heat of adsorption, and adopt well-
defined thermodynamic functions such as enthalpy and internal energy. This will prove to
be important in the following chapters to understand the performance of the calorimeter.
The assumption that heats of adsorption are independent of temperature is valid for ho-
mogeneous adsorbents but it may not be a good assumption on heterogeneous adsorbents.
Unfortunately there is little experimental information about the magnitude and sign of
heat capacities in adsorbed phases [Morrison et al. 1951] to compare it with results of
different models.
33

Relationships for non-ideal adsorption equilibira and enthalpy of adsorption were derived
using as a reference the ideal adsorbed solution. A model with three constants (ABC
equation) is proposed for describing non-ideal adsorption equilibria. This equation con-
tains composition, temperature and surface potential dependence of the excess chemical
potential and can be used to calculate activity coefficients in the adsorbed phase as well
as mixture excess properties (reciprocal loading, enthalpy and entropy). The relationship
between mixture excess properties and the parameters in the ABC equation will help to
understand the causes of non-ideal behavior.
34
Chapter 3
Adsorption Calorimetry
Calorimetry has proven to be an accurate and reliable method to measure heats of ad-
sorption [Dunne et al. 1997]. The importance of knowing the heats of adsorption of a
system is because the temperature dependence of the isotherms and selectivity are given
by the single component heats of adsorption and individual heats of adsorption in a mix-
ture, respectively.
Optimal design of pressure swing adsorption (PSA) units for separation of gaseous mix-
tures is based on experimental equilibrium data for loading and selectivity as a function
of pressure, temperature, and composition. The modeling of thermal effects accompa-
nying adsorption and desorption cycles requires an energy balance based on the heats of
adsorption of individual components of the mixture.
Measurements of loading, selectivity, and heats using conventional methods are expen-
sive and difficult. Heats of adsorption of pure gases, which are usually obtained from
isotherms using the Clapeyron equation, are unreliable unless extra precautions are taken
to ensure reversibility and reproducibility. The calculation of mixture heats from exten-
sions of the Clapeyron equation is impractical [Sircar 1985].
35
This chapter summarizes the design criteria and construction of the combination calo-
rimeter-volumetric apparatus, as well as the procedure developed to study mixture ad-
sorption.
3.1 Introduction
Adsorption calorimetry has been applied extensively to characterize solid adsorbents
[Dios-Cancela et al. 1970], for the characterization of solid acid catalysts by chemisorp-
tion [Parrillo and Gorte, 1992; Chen, et al. 1994], and for studying heterogeneity of zeo-
lite type adsorbents [Masuda, et al. 1980]. Literature surveys of chemisorption calorime-
try [Cardonna-Martinez and Dumesic 1989] and physisorption calorimetry [Morrison,
1987] have been published.
Different types of calorimeters and heats of adsorption associated with them were de-
scribed by Hill (1949). The difference between differential and isosteric heats (internal
energy and enthalpy) is of the order of RT, which is small or negligible for chemisorp-
tion, but it can account for more than 10% of the physisorption energy of light gases.
Calorimetric studies have been performed on commercial and specially built calorime-
ters. Most experiments have been conducted at room temperature and moderately low
pressure, but some work at low temperature and high pressure are also reported in the lit-
erature [Roquero 11999]
36

3.2 Design Criteria
The desired equilibrium information for adsorbed mixtures is the pressure and composi-
tion of the gas phase above the adsorbent for a given loading, as well as the heat evolved
for differential increases in the loading. Because we considered direct, calorimetric
measurements of differential heats to be more reliable than differentiation of isotherms at
various temperatures, the instrument was based on a Tian-Calvet calorimeter. Practical
limitations on the ability to integrate the heat flux in the calorimeter as a function of time
required that equilibrium be established in 30 minutes or less. In order to avoid signifi-
cant perturbations of the system during measurement of the gas-phase composition, we
used a quadrupole mass spectrometer.
The necessity of establishing equilibrium within 30 minutes of changing the sample
loading placed a stringent limitation on the design. First, we excluded adsorption systems
for which diffusion of one of the components was too slow to establish equilibrium
quickly. For most systems of importance in PSA, which requires reversible adsorption,
this is not a severe limitation. To minimize concentration gradients in the sample bed, a
thin layer of adsorbent (»3 mm) was placed on the bottom of calorimeter cell. In addi-
tion to minimizing diffusion time within the bed, the use of a thin adsorbent bed also de-
creased the time necessary for the heat generated by adsorption to be collected by the
thermopiles at the walls of the cell. The size of the calorimeter cell, a one-inch cube, rep-
resents a compromise between sensitivity of the instrument (which increases with the
amount of adsorbent) and the rate of equilibration (which decreases with the cell size).
37

Equilibration within the adsorbent bed is rapid for this configuration: based on a typical
Knudsen diffusion coefficient of 0.01 cm2/s for mixing in the gas phase of the sample
bed, the mixing time is L2/D « (0.3)2 cm2/(0.01) cm2/s = 9 s. While diffusion coefficients
within the particles making up the adsorbent may be much smaller than the Knudsen co-
efficient, particularly for a zeolite, the size of crystals making up a typical zeolite sample
are also quite small. For crystallites on the order of 1 mm, the diffusion coefficient
would have to be significantly below 10"8 cm2/s for mixing to be a limiting factor for
equilibration.
The major limitation for the attainment of adsorption equilibrium is gas-phase mixing in
the region above the sample. Based on a typical gas-phase diffusion coefficient of 0.1
cm2/sec, a tube length of even 10 cm will result in mixing times of 1000 sec. This im-
poses significant challenges on the instrument design. While imposed circulation would
alleviate this problem, forced flow would also complicate the design of the calorimeter
because of convective heat losses. The maximum distance within our apparatus (from the
bottom of the sample cell to the diaphragm of the pressure transducer) was approximately
10 cm. The pressure transducer was chosen for its small dead volume. The leak valve
for the composition measurements was welded directly on the top of the cell to minimize
the dimensions of the apparatus. These design criteria could only be met by a custom-
made calorimeter. The total equipment cost of the apparatus was about $20,000, of which
the major components are the RGA, the pressure transducer, the thermopiles, and the
computer.
38
3.3 Theory
Different heats of adsorption were defined in Chapter 2. The actual heat measured in a
particular calorimeter must be related to the thermodynamic definition of isosteric heat or
differential enthalpy:
As mentioned before, qa is the heat of desorption and it is not a heat but the difference of
two state functions, but the name is well established.
3.3.1 Idealized Calorimeter
An idealized batch calorimeter consists of a dosing cell, sample cell, and valve between
the dosing cell and sample cell completely enclosed in an isothermal calorimeter at tem-
peraure T0. At the start, the valve is closed, both cells are at temperature r0, the pressure
in the dosing loop is P¿ and the pressure in the sample cell is P* with P¿ > Pc.
When the value is opened, an increment of gas expands from the dosing cell into the
sample cell and a portion of the increment adsorbs. The total energy is:
U=U*+U* = utn* + u*n* (3.2)
39
The total energy U includes that of the adsorbent, the walls of the sample cell and dosing
cell, and the valve. However, since the temperature is fixed at T& these energies are
omitted from Eq. (3.2) because they are constant and do not contribute to the change in
energy. The total amount of gas in both cells is n*. The differential of the total energy is:
dU = u* dne + n* du* + u* dn* + n* du* (3.3)
where dU refers to the differential energy change after attainment of adsorption equilib-
rium. Since the temperature is T0 before and after adsorption, du* = 0 and
dU = u*dn* + n*du* + u*dn* + riidut (3.4)
The mass balance is:
n* + n* = constant (3.5)
so
dn* = -dn* (3.6)
Substituting Eq. (3.6) into (3.4):
dU = -u* dn* + «' dn* + n* du* (3.7)
40
The first law for the combined closed system consisting of the dosing cell, sample cell,
and valve is:
dU = dQ (3.8)
where dQ is the heat absorbed by the combined system. For adsorption, dQ is a negative
quantity. Combining Eqs. (3.7) and (3.8):
-dQ = u*dn*-u*dn*-n'dü (3.9)
or
dQ = g
dna ua+na d^_
dna (3.10)
Since A" « «' and h* = u* + zRTo, comparison of Eqs. (3.1) and (3.10) gives:
1st dna (3.11)
This result was derived by Hill (1949). The first term is the differential heat measured by
the idealized calorimeter and the second term is the difference between the enthalpy and
the internal energy in the equilibrium gas phase, z - PV/RT, the compressibility factor in
the gas phase, is close to unity for sub-atmospheric measurements of isosteric heat. The
RTo term at 25°C is 2.5 kJ/mol and typical isosteric heats of adsorption are in the range
10-50 kJ/mol.
41
332 Practical Calorimeter
In the idealized calorimeter, the temperature of the gas in the sample loop decreases upon
expansion while the temperature of the gas in the sample cell increases as it is com-
pressed by the incoming gas. In the absence of adsorption, heat is absorbed by the dos-
ing loop and heat is liberated by the sample cell until the pressures equalize and the tem-
perature returns to RT0. For a perfect gas, the two effects cancel because the enthalpy of a
perfect gas is a function only of temperature.
Our design is a modification of the idealized calorimeter in which only the sample cell is
placed in the calorimeter. Since the dosing loop and valve are external to the calorimeter,
adding a dose of gas to the sample cell generates an exothermic heat of compression in
the sample cell which is not cancelled by absorption of heat in the dosing loop. The spu-
rious heat of compression must be subtracted from the total heat registered by the calo-
rimeter in order to obtain the heat of adsorption. A correction, which typically is about
2% of the total heat, is derived below.
42
3.4 Description of Instrument
A diagram for the calorimeter apparatus is shown in Figure 3.1. A picture of the sample
cell and its connections is shown in Figure 3.2. The glass (Pyrex) cube is the sample cell
for the adsorbent and adsórbate. The use of glass to minimize heat conduction through
the top of the cell is a crucial element of the design. The glass cube is surrounded on all
four sides and on the bottom by square thermal flux meters (not shown in the picture)
obtained from the International Thermal Instrument Company, Del Mar, CA. Each ther-
mopile is a 1-in square polyimide plate with about 100 embedded thermocouples for de-
tecting temperature differences across the plate.
The five thermopiles were connected in series and a similar set in the reference cell was
connected in opposition to improve baseline stability. The combined signal from these
transducers was input to an amplifier on the data acquisition board of a computer. The
sample cell slides into cubical holes cut into an aluminum block (27x 18x 10 cm, mass 13
kg). A silicone-based heat-sink compound was used to ensure good thermal contact be-
tween the Al block and the transducers, and between the transducers and the pyrex cell.
43
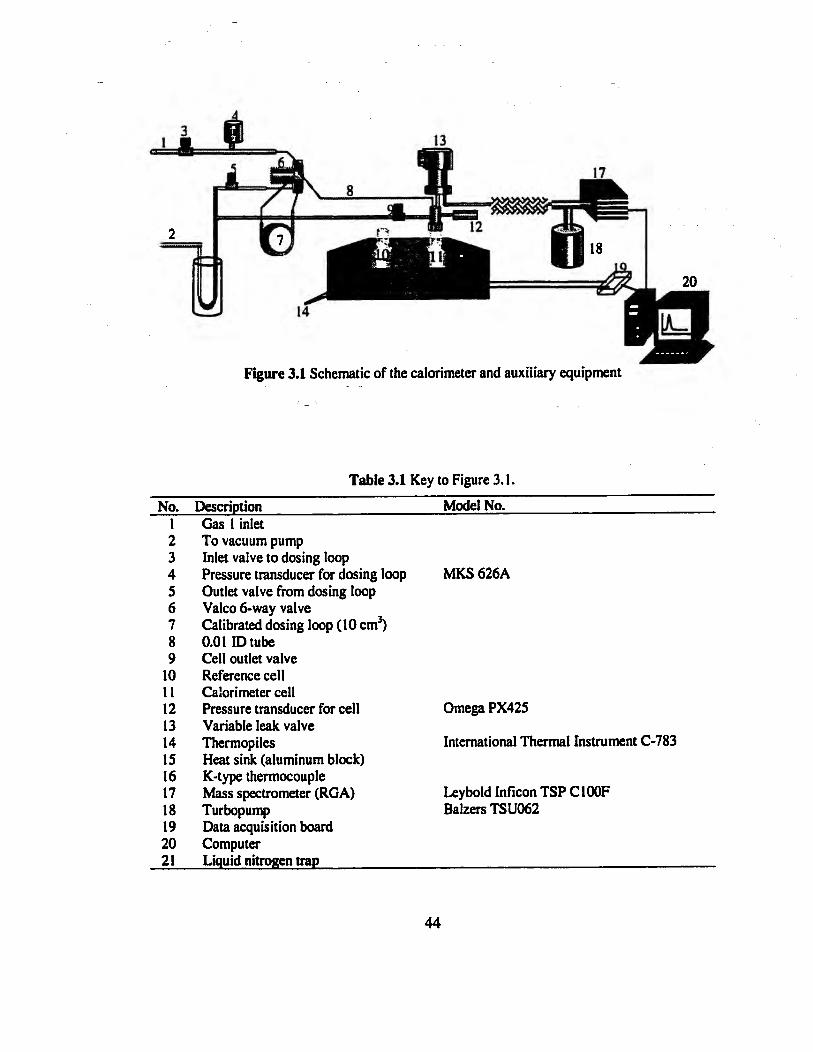
Figure 3.1 Schematic of the calorimeter and auxiliary equipment
Table 3.1 Key to Figure 3.1.
No. Description Model No. 1 Gas I inlet 2 To vacuum pump 3 Inlet valve to dosing loop 4 Pressure transducer for dosing loop 5 Outlet valve from dosing loop 6 Valco 6-way valve 7 Calibrated dosing loop (10 cm3) 8 0.01 ID tube 9 Cell outlet valve
10 Reference ceil 11 Calorimeter cell 12 Pressure transducer for cell 13 Variable leak valve 14 Thermopiles 15 Heat sink (aluminum block) 16 K-type thermocouple 17 Mass spectrometer (RGA) 18 Turbopump 19 Data acquisition board 20 Computer 21 Liquid nitrogen trap
MKS 626A
Omega PX425
International Thermal Instrument C-783
Leybold Inficon TSP C100F Balzers TSU062
44
8 in extension To dosing
1/16 in vain)
1/4 in female VCR fitting
Leak Valve diaphragm
Connection to leak valve. 1/4 in 0 0
1/4 in NPT thread
Topressu head
Cajon ultra torr fitting
1/2 in 00
Qlas8cell
Figure 3.2 Picture of the glass sample cell and connections to the pressure head, vacuum line, dosing loop and RGA leak valve. The glass sample cell is surrounded by thermopiles (not shown) set into an aluminum heat sink.
45

The cubical glass cell shown in Fig. 3.2 was made with a 1/2-in glass tube on the top
which was inserted into a Cajon fitting. This provides a vacuum seal by compression of a
Viton O-ring. The Cajon fitting connects to a custom-made r-connection onto which are
welded the leak valve, the pressure head, the connection to vacuum, and the 0.01-in bore
tube from the dosing loop. The leak valve is connected through a l/4-in0D stainless-steel
tube; the pressure head is connected through a 1/4-in NPT fitting; the valve that opens to
vacuum is connected through a 1/4-in VCR fitting. The pressure head was chosen for its
small dead space (1.2 cm3). The total dead space is 20.6 cm3 for the (empty) sample cell,
the dead space inside the pressure head, and the lines to vacuum, the dosing loop, and the
RGA leak valve.
Gas was introduced to the sample cell from the dosing loop using a six-port Valco sam-
pling valve connected to a small bore (0.01 inID) tube. The small diameter of the tube
prevents backmixing of the mixture into the dosing loop. This tube enters the T-shaped
connector from the back (the welded connection does not appear on Fig. 2) and extends
downward with the opening 5 cm above the bottom of the sample cell. Two small metal
cylinders with a Viton O-ring between them were inserted in the NPT connection to the
pressure head to make a vacuum seal. The adsorbent was covered with a 0.5 cm layer of
glass chips to minimize heat loss through the top of the cell and regenerated in situ.
46
3.5 Thermopile calibration
The primary calibration of the calorimeter (0.0540 W/mV) is based upon the Clapeyron
equation [Dunne96a] applied to a series of adsorption isotherms measured in a separate,
high-precision volumetric apparatus for ethane on silicalite (MFI structure). The calibra-
tion constant for ethane was confirmed by excellent agreement of calorimetric data with
the Clapeyron equation for SFs, CO2, and CH4. The calibration constant was found to be
independent of the amount of adsorbent in the cell.
A secondary calibration based on electrical heating (0.059 W/mV) was 9% higher than
the primary calibration. The voltage signal from the calorimeter was determined as a
function of the rate of heat dissipation dQ/dt - l2R in a platinum resistance wire wrapped
around the outside of the cell in thermal contact with the cell wall and the thermopiles.
Similar difficulties were encountered by Handy et al. [1993]: the voltage to power ratio
for a resistor inside the cell was 9% lower than that for an externally wrapped resistance
wire. The difference was attributed to heat losses. We chose the Clapeyron equation as
the more reliable method of calibration.
47
3.6 Spurious Heat of Compression in Sample Cell
Before taking a measurement, the dosing loop and the sample cell are both at the tem-
perature T0 of the experiment; the pressure inside the sample cell is Pe, and the pressure
in the dosing loop is some higher pressure Pi. Increments of gas are added to the sample
cell by opening the valve between the dosing loop and the cell. The temperature of the
gas inside the dosing loop falls because of the expansion while the temperature of the gas
inside the sample cell rises as it is compressed by the incoming gas. The calorimeter
measures both the latent heat of adsorption and the sensible heat liberated by the com-
pressed gas as it cools to the temperature of the calorimeter. This sensible heat must be
subtracted from the heat registered by the thermopiles to obtain the heat of adsorption.
The spurious heat term generated by compression of the gas inside the cell was deter-
mined by expanding gas from the dosing loop into a sample cell containing no adsorbent.
For a 10 cm3 dosing loop and for a dead space of 18 cm3 in the sample cell, the linear
correlation
ß = aAP (3.12)
for the experimental data shown in Figure 3.3, a=3.94xl0-4 J/Torr. AP is the driving
force for the irreversible expansion: the pressure difference between the dosing loop and
the sample cell.
48
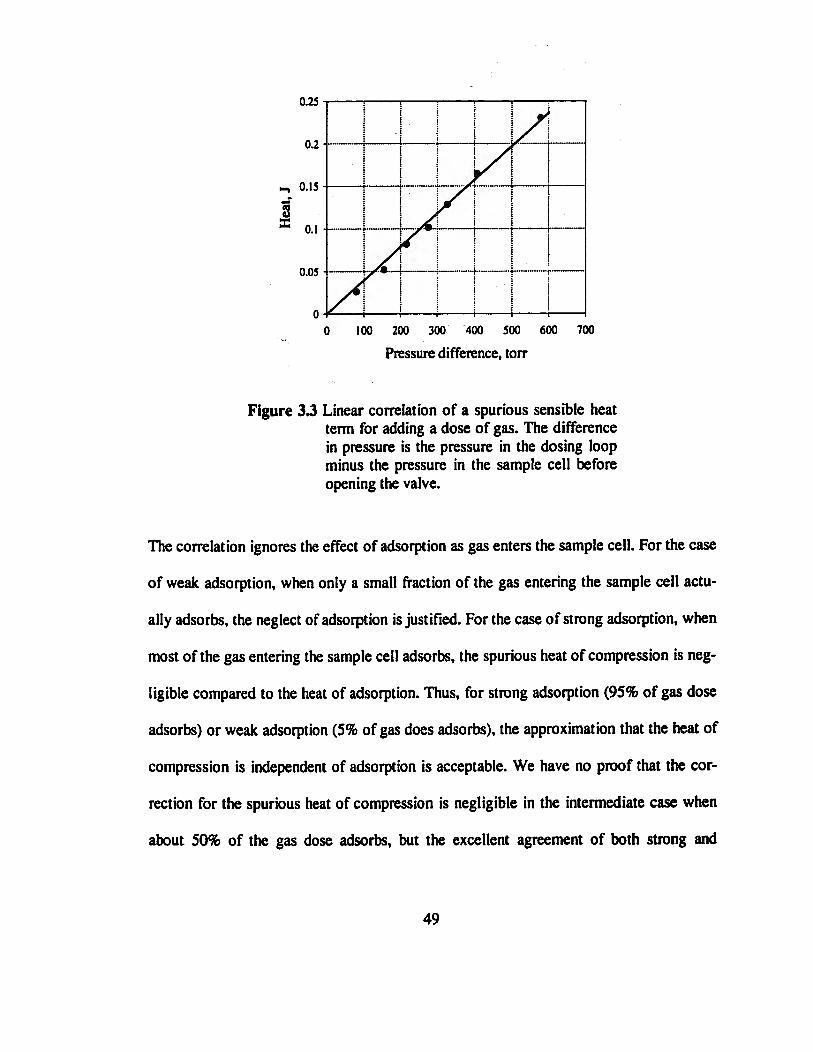
1 I 1 i i J 1111/ t * * t * I
1 ! i / 1 1 x t '" * • w :
/i • / i ' i
I t
i i t 1 Ï
Vt í ! 1 1
y / i ! ! | í . £. 1 j 1 j í • ^^— O 100 200 300 400 500 600 700
Pressure difference, ton-
Figure 33 Linear correlation of a spurious sensible heat term for adding a dose of gas. The difference in pressure is the pressure in the dosing loop minus the pressure in the sample cell before opening the valve.
The correlation ignores the effect of adsorption as gas enters the sample cell. For the case
of weak adsorption, when only a small fraction of the gas entering the sample cell actu-
ally adsorbs, the neglect of adsorption is justified. For the case of strong adsorption, when
most of the gas entering the sample cell adsorbs, the spurious heat of compression is neg-
ligible compared to the heat of adsorption. Thus, for strong adsorption (95% of gas dose
adsorbs) or weak adsorption (5% of gas does adsorbs), the approximation that the heat of
compression is independent of adsorption is acceptable. We have no proof that the cor-
rection for the spurious heat of compression is negligible in the intermediate case when
about 50% of the gas dose adsorbs, but the excellent agreement of both strong and
49
weakly adsorbing gases with the Clapeyron equation is indirect evidence that Eq. 3.12 is
adequate for both strongly and weakly adsorbing gases.
Other calorimeters [Sircar et al. 1999] are designed for isothermal introduction of gas to
the sample cell. This is accomplished by adding increments of gas slowly through a nee-
dle valve so that the temperature of the gas in the dosing loop is equal to the temperature
in the sample cell (To). In the absence of adsorption, the reversible, isothermal introduc-
tion of a gas sample generates an exothermic heat inside the sample cell equal to RT0 per
mole of gas added; the signal for this spurious heat term can be nullified by adding the
same amount of gas to a reference cell wired in reverse polarity. Isothermal dosing is
effective for the measurement of heats of adsorption of pure gases. For mixtures, the fast,
irreversible addition of increments of gas shortens the time required for mixing and
equilibration.
3.7 RGA calibration
The gas phase composition is determined with a residual gas analyzer (RGA), which is
based on mass spectrometry. When a gas is admitted to the RGA, bombardment by elec-
trons causes the molecules to fragment into positive ions of a whole series of masses. The
relative abundance of ions of various masses is characteristic of the particular molecule.
Compositions of gaseous mixtures can be determined by comparing their spectra with
that of the pure compounds determined under the same conditions.
50

For a binary mixture, the calibration constant (K) of the RGA is based upon the relation:
^- = K^- (3.13) n h
where v¡ is the mole fraction of component i in the gas phase and l\ is the intensity of the
mass/charge ratio detected for a particular ion ofthat component. Eq. (3.13) assumes that
the contribution to the intensity l\ is only due to component I, and the intensity h is only
due to component 2. When both components of a binary mixture contribute to the inten-
sity of a peak, the composition of the gas phase can still be determined by solving a sys-
tem of equations for the intensity ratios.
The intensity detected by the mass spectrometer is proportional to the flow rate of the
gaseous molecules through the leak valve. At low pressure, the opening of the leak valve
is small compared with the free mean path of the molecules. The resulting effusive flow
of the gas is directly proportional to its partial pressure and inversely proportional to its
molecular weight, so:
iL^PyifMi) ( 3 1 4 )
51
The free mean path decreases with pressure; at « 100 torr the mean free path is the same
order of magnitude as the opening of the leak-valve. When the ratio of the opening to the
free mean path is in the range from unity to 100, the flow is intermediate between effu-
sive and viscous [Roth, 1982]. For viscous flow, the composition of the gas leaving the
cell and the intensity ratio obeys the simple relation:
JL=fK (3.15) h Pyi
The transition from effusive to viscous flow is important for molecules having a large
ratio of molecular weights, e.g. SF6 (1) and CH« (2) with a molecular weight ratio of 9.
In this case the calibration "constant" AT is a function of the pressure in the cell, as shown
in Figure 4. For gases with smaller ratios of molecular weight, such as C2H4 and C2H6
with a ratio near unity, the calibration constant is effectively independent of pressure.
Figure 5 shows calibration data for C2H4 (component 1) and C2H6 (component 2). Both
molecules contribute to the intensity /2s at m=28 but only C2H6 contributes to the inten-
sity /30 peak at m=30 so
%L=K{—^— (3.16) y\ lis-ho
The average error in composition using the mass spectrometer is less than 1% for mid-
range compositions. The lowest mole fraction that can measured is about 0.0005. The
52
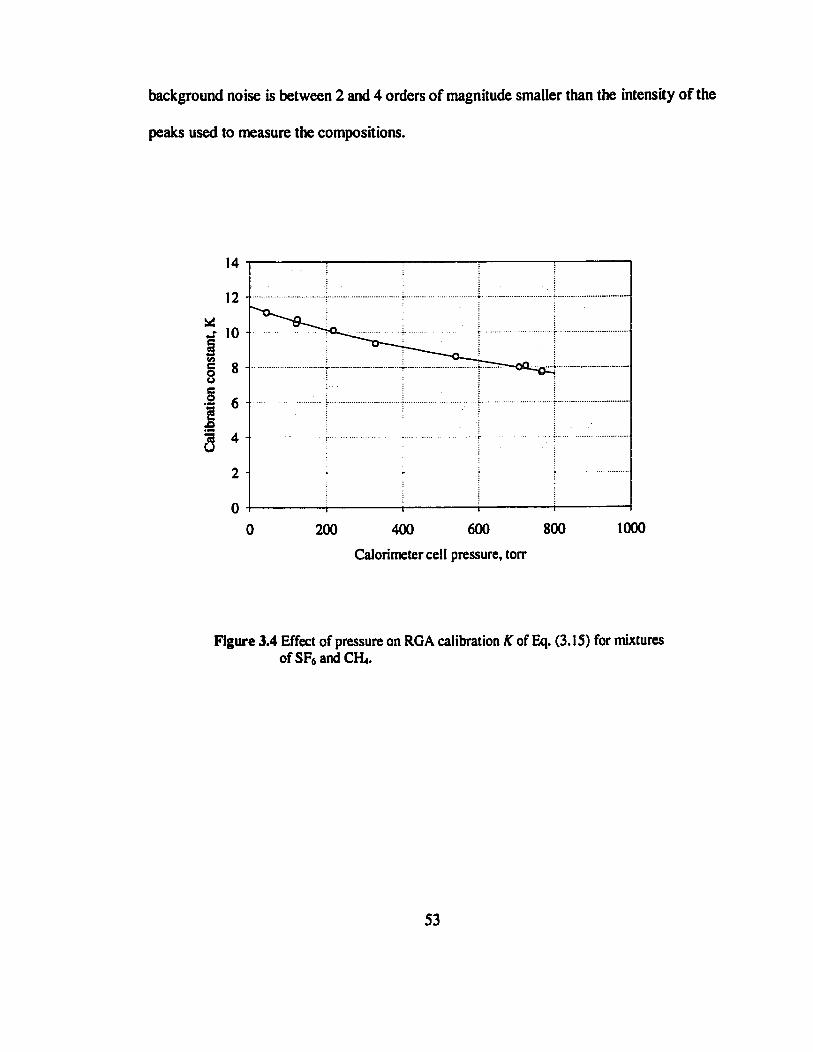
background noise is between 2 and 4 orders of magnitude smaller than the intensity of the
peaks used to measure the compositions.
14
12 -
-r 10
0 ° u
1 6 5 .o
200 400 600 800 Calorimeter cell pressure, ton*
1000
Figure 3.4 Effect of pressure on RGA calibration AT of Eq. (3.15) for mixtures ofSF6andCH4.
53

U 1.5
Figure 3.5 Calibration of the composition for mixtures of CjtU and CiHe based on Eq. (3.16). The calibration is independent of pressure.
3.8 Verification of Adsorption Equilibrium
The mixing time required when a new dose of gas is added to the sample cell containing
a gaseous mixture but no adsorbent is about 15 minutes. [Dunne et al. 1997]. Sampling
the gas phase continuously to check for equilibrium is impracticable because the amount
of gas sampled over 30 min would affect the mass balance used to calculate the amount
adsorbed.
54
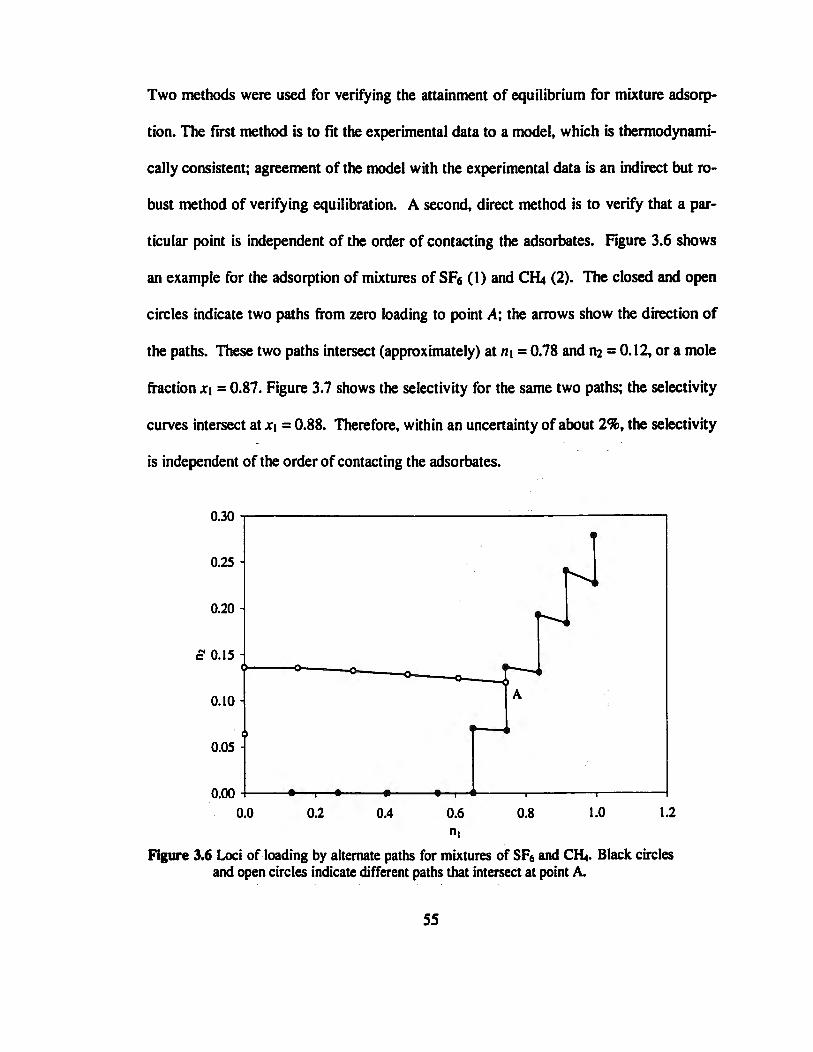
Two methods were used for verifying the attainment of equilibrium for mixture adsorp-
tion. The first method is to fit the experimental data to a model, which is thermodynami-
cally consistent; agreement of the model with the experimental data is an indirect but ro-
bust method of verifying equilibration. A second, direct method is to verify that a par-
ticular point is independent of the order of contacting the adsorbates. Figure 3.6 shows
an example for the adsorption of mixtures of SF* (1) and CH4 (2). The closed and open
circles indicate two paths from zero loading to point A; the arrows show the direction of
the paths. These two paths intersect (approximately) at /it = 0.78 and ri2 = 0.12, or a mole
fraction JCI = 0.87. Figure 3.7 shows the selectivity for the same two paths; the selectivity
curves intersect at xi = 0.88. Therefore, within an uncertainty of about 2%, the selectivity
is independent of the order of contacting the adsorbates.
0.30
0.25
0.20
£0.15
0.10-
0.05
0.00 0.0 0.2 0.4 0.6 0.8 1.0 1.2
n(
Figure 3.6 Loci of loading by alternate paths for mixtures of SF6 and CH4. Black circles and open circles indicate different paths that intersect at point A.
55
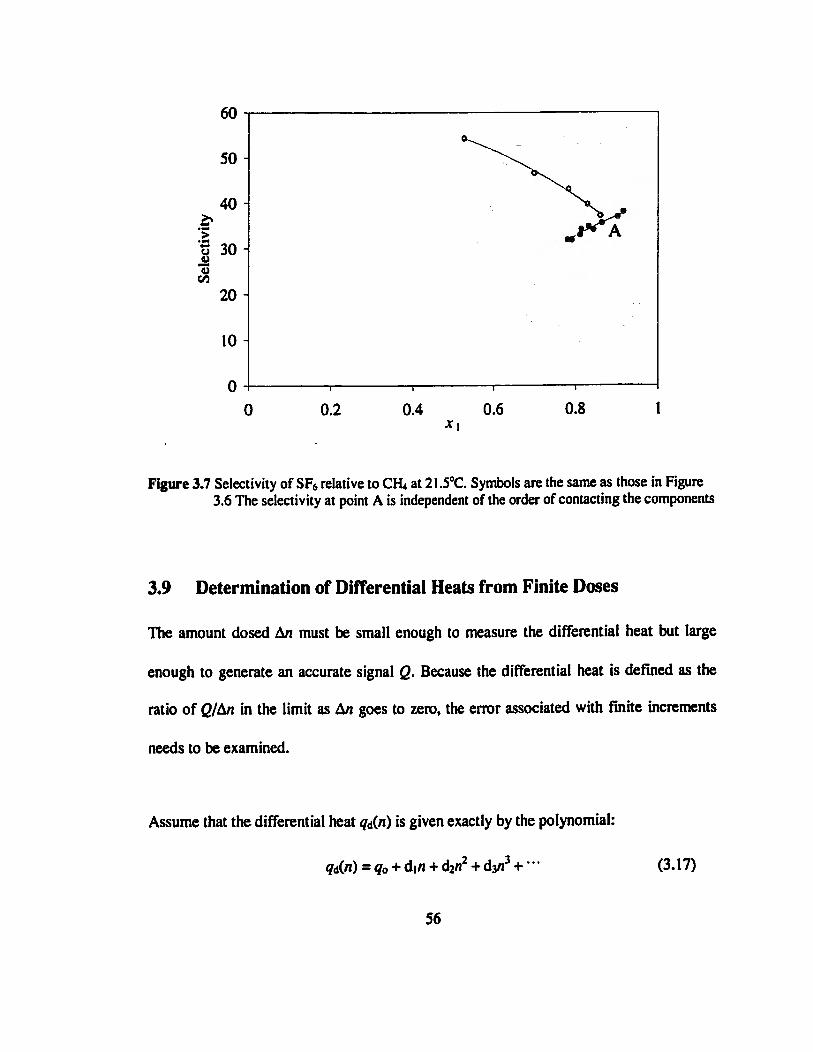
60 -r
5 0 -
4 0 -
1 30-<*>
20-
10-
0 -0
Figure 3.7 Selectivity of SF6 relative to CH4 at 21.5°C. Symbols are the same as those in Figure 3.6 The selectivity at point A is independent of the order of contacting the components
3.9 Determination of Differential Heats from Finite Doses
The amount dosed an must be small enough to measure the differential heat but large
enough to generate an accurate signal Q. Because the differential heat is defined as the
ratio of ß/A/1 in the limit as An goes to zero, the error associated with finite increments
needs to be examined.
Assume that the differential heat q¿(n) is given exactly by the polynomial:
qd(n) = q0 + d|/i + d2/i2 + d^n3 + *" (3.17)
56

For a finite amount of gas adsorbed (An = /12 - «1), the approximate differential heat qs
measured experimentally is
I qd(n)dn qS = -^ (3.18)
n2-nx
qs is the average value of the differential heat measured at the average loading (/ii+/i2)/2.
Comparison of qs with the exact differential heat at the same average loading gives the
error: q6-qd=^x-n2)2+^-(nx+n2)(nx-n2)2^- (3.19)
12 s
The error is of order (n\ - mf. Because the leading term of the error is also proportional
to the second derivative of the heat curve, «75 = <7d for linear heat curves, independently of
the magnitude of the A/t.
Figure 3.8 shows hypothetical differential (solid line) and integral (dashed line) heats of
adsorption. The points show approximate heats qd calculated from Eq. (3.18) for finite
doses n\ - m =0.1,0.5, and 1.0 mol/kg. Only for finite doses as large as 1 mol/kg can the
difference between the exact differential q¿ and the approximate «75 be discerned. Typical
experimental values of An are of the order of 0.1 mol/kg. Except for abrupt changes of
the heat with coverage associated with phase transitions, the error associated with using
finite doses of gases to measure the differential heat is negligible.
57
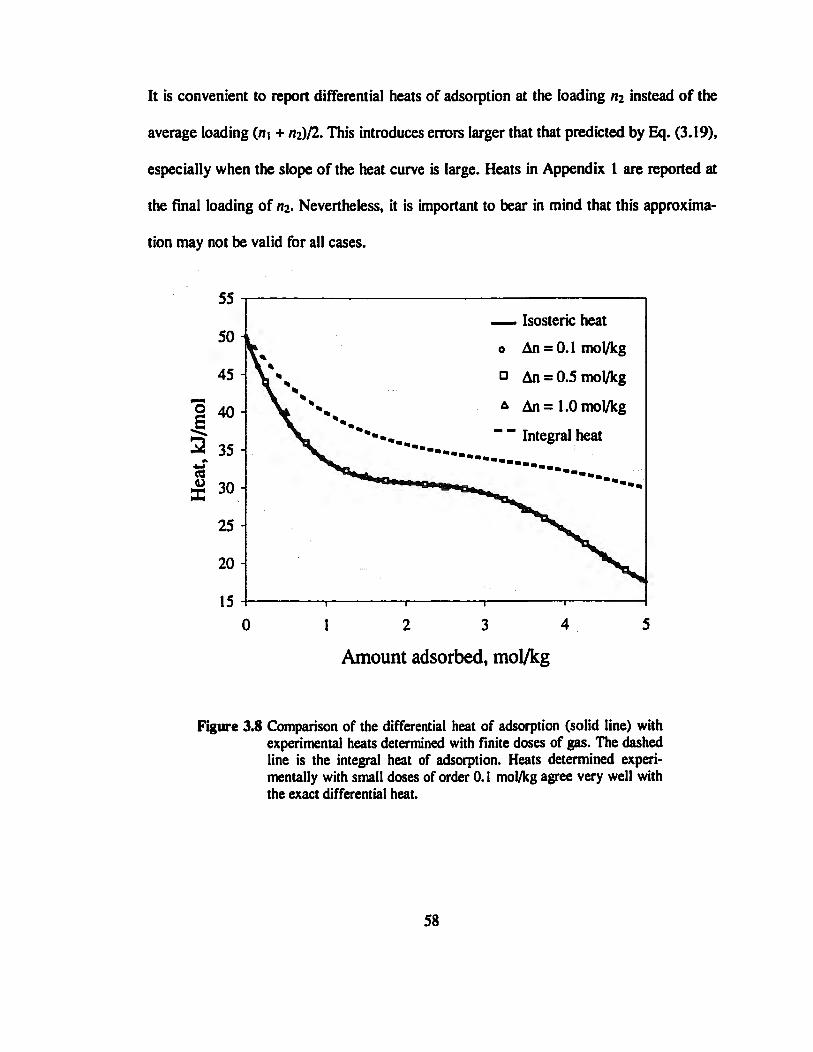
It is convenient to report differential heats of adsorption at the loading m instead of the
average loading («i + «2)/2. This introduces errors larger that that predicted by Eq. (3.19),
especially when the slope of the heat curve is large. Heats in Appendix 1 are reported at
the final loading of m. Nevertheless, it is important to bear in mind that this approxima-
tion may not be valid for all cases.
55 — Isosteric heat
o An = 0.1 mol/kg
D An = 0.5 mol/kg
A An =1.0 mol/kg
" " Integral heat
1 2 3 4
Amount adsorbed, mol/kg
Figure 3.8 Comparison of the differential heat of adsorption (solid line) with experimental heats determined with finite doses of gas. The dashed line is the integral heat of adsorption. Heats determined experi-mentally with small doses of order 0.1 mol/kg agree very well with the exact differential heat.
58
3.10 Alternating Dosings of Each Component
Two independent dosings (A and B) are required to measure the individual differential
heats of adsorption (q\ and qj) from a binary mixture.
ß A = A/i,A<jr,+An,A<7i (3.20)
ß B = A/i,B(7,+A/i,B<7i (3.21)
where QA and QB are the heats registered by the calorimeter and Ant and A/12 are the
amounts adsorbed, or desorbed, of components 1 and 2, respectively. When the system
of equation (3.20) and (3.21) is solved, the individual heats of adsorption are:
QAànB-QBAnA ^ ^ qi~ánfto8- Anfang
)B*nA-QAAnB Q°An?-Q"An[ f 3 2 3 .
Dosing of one component generates a positive incremental adsorption ofthat component
which is normally one or two orders of magnitude larger than the accompanying desorp-
tion of the other component. The solution of Eqs. (3.22) and (3.23) requires that the dos-
59
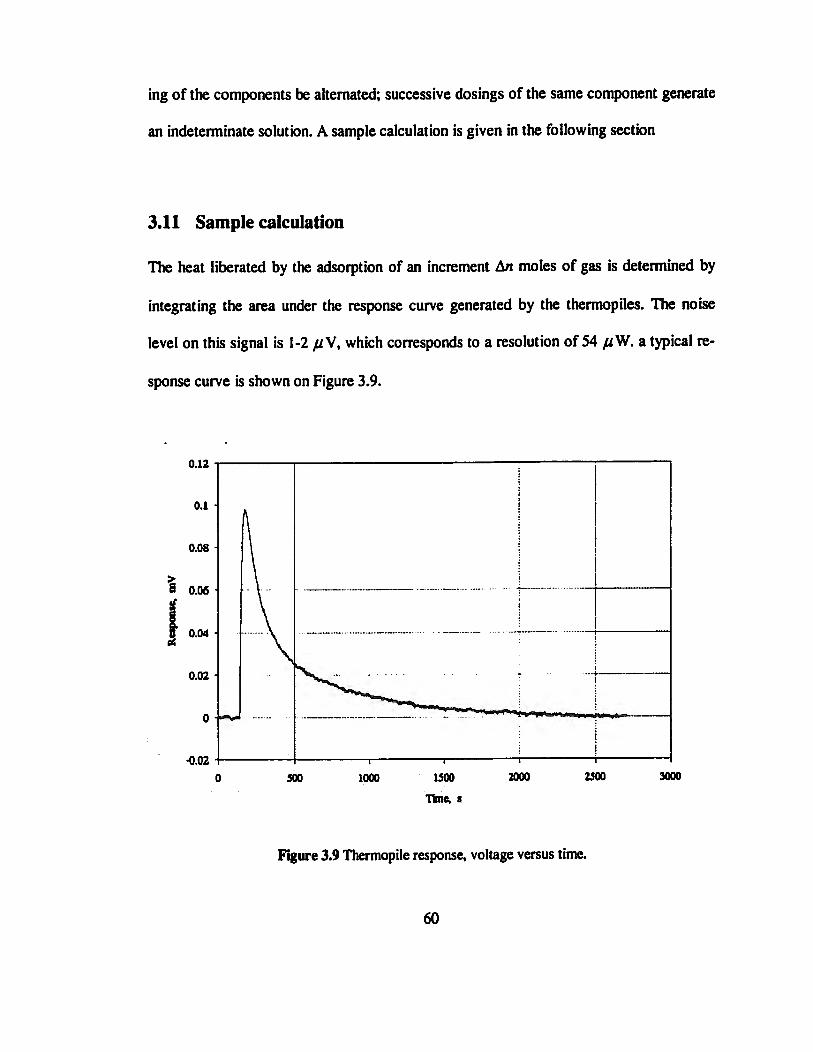
ing of the components be alternated; successive dosings of the same component generate
an indeterminate solution. A sample calculation is given in the following section
3.11 Sample calculation
The heat liberated by the adsorption of an increment An moles of gas is determined by
integrating the area under the response curve generated by the thermopiles. The noise
level on this signal is 1-2 fiV, which corresponds to a resolution of 54 fiW. a typical re-
sponse curve is shown on Figure 3.9.
0.12
H 0.06
0.02-
ii r «^.y..,^. m , . , ,
•0.02 300 1000 1500
Time, i
2000 2300 3000
Figure 3.9 Thermopile response, voltage versus time.
60

Table 3.2 shows a sample calculation of loading and heats of adsorption, for mixtures of
SF6 (1) and CH4 (2), derived from the two points A and B. The incremental loading of
component i for measurement y is calculated by the mass balance equation:
An/=-L 1 RT
Vdyf fpd pd.f
M + Vl
rpC.j-lyCj-\ pC.jyC.P
*c,j-l 7C>J (3.24)
The total loading of component i is ni = nfl+Anî/w, where w is the mass of adsorbent.
The spurious heat term Qsp calculated from Eqs. (3.13) is subtracted from ßA and QB be-
fore calculating the differential heats from Eqs. (3.19) and (3.20). The thermopile cali-
bration constant is K = 0.0540 W/mV.
3.12 Conclusion
A calorimeter that can be used to measure multicomponent adsorption equilibria and in-
dividual heats of adsorption simultaneously was described in this chapter. Important con-
siderations when a mixture calorimeter, such as time of mixing, spurious heat of com-
pression, calibration of the residual gas analyzer and errors associated with considering
finite dosings to measure differential enthalpies are addressed.
61
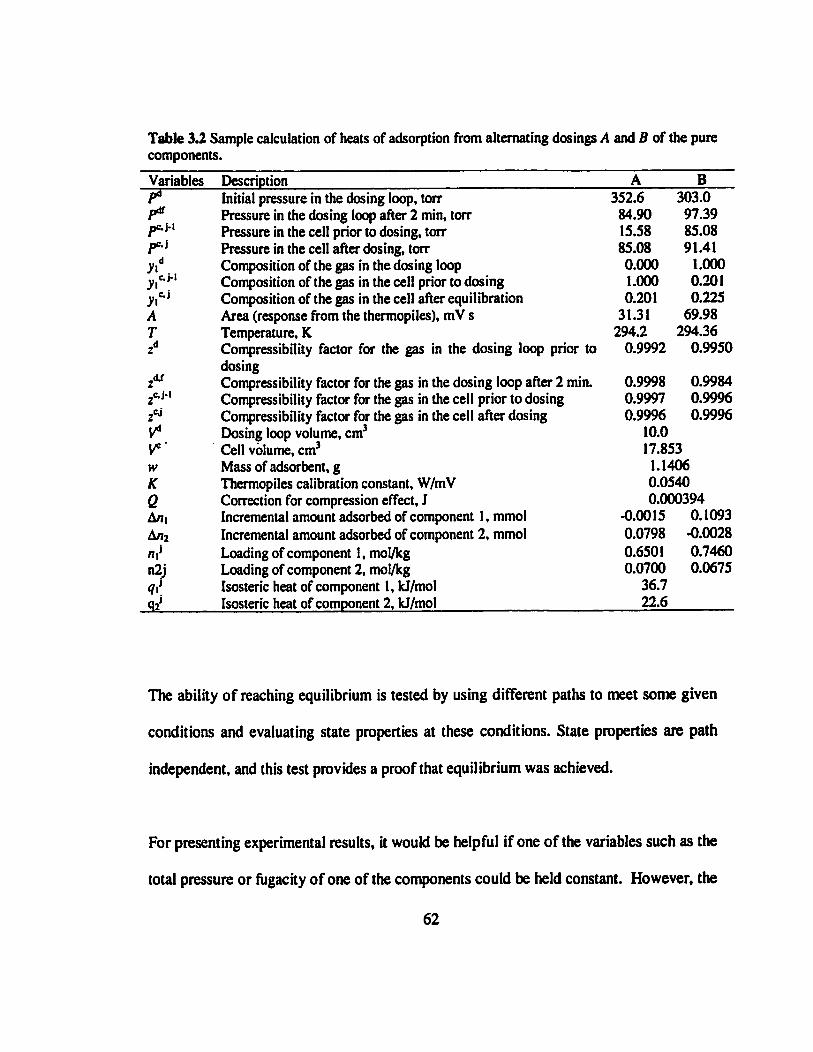
Table 3.2 Sample calculation of heats of adsorption from alternating dosings A and B of the pure components. Variables Description A B_
~ ? Initial pressure in the dosing loop, torr P* Pressure in the dosing loop after 2 min, torr / •J*' Pressure in the cell prior to dosing, torr Pc'i Pressure in the cell after dosing, torr yid Composition of the gas in the dosing loop y fj"' Composition of the gas in the cell prior to dosing y t0*j Composition of the gas in the cell after equilibration A Area (response from the thermopiles), mV s T Temperature, K zd Compressibility factor for the gas in the dosing loop prior to
dosing z** Compressibility factor for the gas in the dosing loop after 2 min. z^"1 Compressibility factor for the gas in the cell prior to dosing z^ Compressibility factor for the gas in the cell after dosing Va Dosing loop volume, cm3
Ve ' Cell volume, cm3
w Mass of adsorbent, g K Thermopiles calibration constant, W/mV Q Correction for compression effect, J An i Incremental amount adsorbed of component 1, mmol A/12 Incremental amount adsorbed of component 2, mmol n ij Loading of component 1, mol/kg n2j Loading of component 2, mol/kg q\\ Isosteric heat of component 1, kJ/mol
_c¿ Isosteric heat of component 2, kJ/mol
352.6 84.90 15.58 85.08 0.000 1.000 0.201 31.31 294.2 0.9992
0.9998 0.9997 0.9996
10.0
303.0 97.39 85.08 91.41 1.000 0.201 0.225 69.98
294.36 0.9950
0.9984 0.9996 0.9996
17.853 1.1406 0.0540 0.000394
•0.0015 0.0798 0.6501 0.0700
36.7 22.6
0.1093 -0.0028 0.7460 0.0675
The ability of reaching equilibrium is tested by using different paths to meet some given
conditions and evaluating state properties at these conditions. State properties are path
independent, and this test provides a proof that equilibrium was achieved.
For presenting experimental results, it would be helpful if one of the variables such as the
total pressure or fugacity of one of the components could be held constant. However, the
62
necessary procedure for alternating doses generates a locus similar to the closed circles
shown on Fig. 3.6. The inability to obtain data along some locus such as an isobar is an-
noying but does not affect the analysis of the experimental data for activity coefficients
and excess functions. After covering the entire phase diagram for a binary mixture by
varying the preloading of the pure components, a model that fits the experimental data
can be used to generate loci such as isobars or constant loading of one component.
63
Chapter 4
Experimental measurements of adsorption equilibria and heats
of adsorption
The ability of porous materials to adsorb fluids selectively is the basis of many industrial
applications, especially catalysis and the separation and purification of gases and liquids.
Industrial applications of adsorption include the recovery of organic solvent vapors, de-
hydration of gases, separation and purification of hydrogen from steam-methane reform-
ers, separation and purification of air, separation of normal paraffins from branch and cy-
clic paraffins, production of olefins from olefin and paraffin mixtures, etc. [Tien, 1994;
Crittenden and Thomas, 1998; Yang, 1987]. Even though adsorption plays an important
role in the gas separation and purification industry, the prediction of multicomponent
equilibria is still one of the most challenging problems in the adsorption field fTalu,
1998].
The main problem is a lack of accurate and consistent experimental data for testing theo-
ries. Almost no data is available on enthalpy of adsorbed mixtures although such infor-
mation is necessary for the modeling of fixed bed adsorbers. Indirect measurements of
mixture heats of adsorption using volumetric or gravimetric methods are possible in prin-
64
ciple but require voluminous data on isobars, isotherms, and loci of constant composition
[Sircar, 1985, 1992].
Recently, different techniques have been used to measure enthalpies of adsorbed mix-
tures: Bajusz et al. (1998a, 1998b) used a steady state isotopic transient kinetic analysis
technique, other studies have used the isosteric method [Bulow, 1994; Bulow and Shen
1998; Hampson and Rees, 1993; Rees. et al. 1991], and lately calorimetric studies have
been reported [Dunne et al. 1997; Siperstein et al. 1999b; Sircar et. al 1999].
The objective of this work is to understand the basis for deviations from ideality of ad-
sorbed mixtures and attempt to predict them on the basis of single-gas properties. Devia-
tions from ideal mixing are expressed as excess functions: excess chemical potential (ac-
tivity coefficients) and excess enthalpy (deviations from ideal enthalpy of mixing). This
excess function approach is analogous to standard methods for expressing nonideal be-
havior in liquid mixtures [Prausnitz et al. 1999].
However, the use of excess functions for describing deviations from ideal mixing in the
adsorbed phase differs from liquid solutions is several subtle but important ways, espe-
cially in how these excess functions are measured experimentally. In the case of bulk liq-
uids, excess functions are measured at constant pressure and temperature. In the case of
adsorbed mixtures, excess properties are referred to the pure component adsorption at the
same temperature and surface potential (Chapter 2).
65
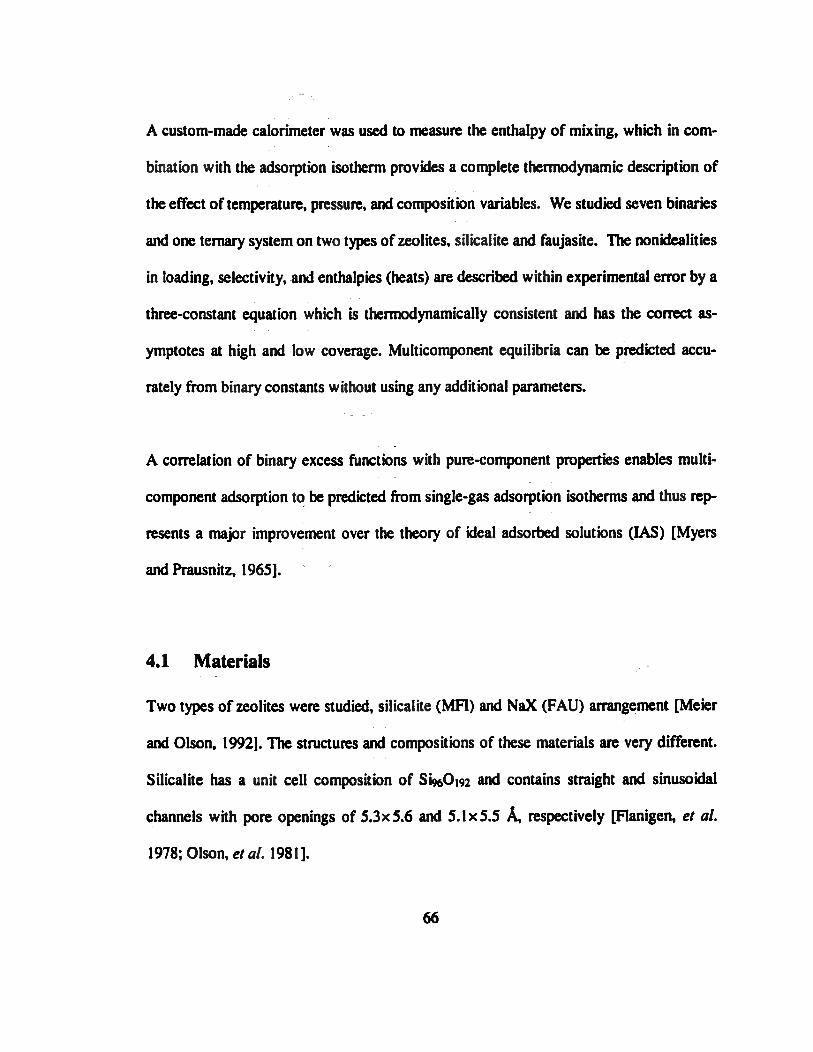
A custom-made calorimeter was used to measure the enthalpy of mixing, which in com-
bination with the adsorption isotherm provides a complete thermodynamic description of
the effect of temperature, pressure, and composition variables. We studied seven binaries
and one ternary system on two types of zeolites, silicalite and faujasite. The nonidealities
in loading, selectivity, and enthalpies (heats) are described within experimental error by a
three-constant equation which is thermodynamically consistent and has the correct as-
ymptotes at high and low coverage. Multicomponent equilibria can be predicted accu-
rately from binary constants without using any additional parameters.
A correlation of binary excess functions with pure-component properties enables multi-
component adsorption to be predicted from single-gas adsorption isotherms and thus rep-
resents a major improvement over the theory of ideal adsorbed solutions (IAS) [Myers
and Prausnitz, 1965].
4.1 Materials
Two types of zeolites were studied, silicalite (MFI) and NaX (FAU) arrangement [Meier
and Olson, 1992]. The structures and compositions of these materials are very different.
Silicalite has a unit cell composition of SfeOm and contains straight and sinusoidal
channels with pore openings of 5.3x5.6 and 5.1x5.5 A, respectively [Flanigen, et al.
1978; Olson, et al. 1981].
66
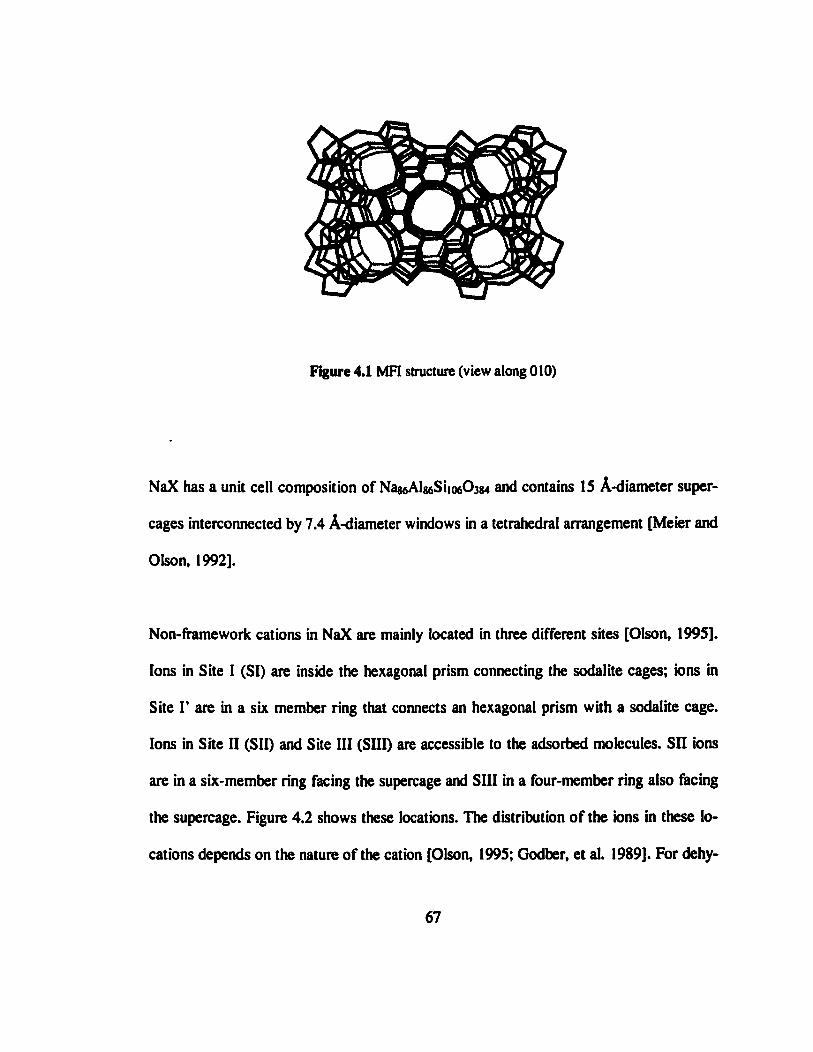
Figure 4.1 MFI structure (view along 010)
NaX has a unit cell composition of NagôAIsôSiioôOsM and contains 15 A-diameter super-
cages interconnected by 7.4 A-diameter windows in a tetrahedral arrangement [Meier and
Olson, 1992].
Non-framework cations in NaX are mainly located in three different sites [Olson, 1995].
Ions in Site I (SI) are inside the hexagonal prism connecting the sodalite cages; ions in
Site I1 are in a six member ring that connects an hexagonal prism with a sodalite cage.
Ions in Site II (Sil) and Site III (SIII) are accessible to the adsorbed molecules. Su ions
are in a six-member ring facing the supercage and SIII in a four-member ring also facing
the supercage. Figure 4.2 shows these locations. The distribution of the tons in these lo-
cations depends on the nature of the cation [Olson, 1995; Godber, et al. 1989]. For dehy-
67

drated NaX, in one unit cell there are 2.9 ions in site I, 29.1 ions in site V, 31 ions in site
II, and 29.8 ions in site III' [Olson, 1995].
SI
SU
. SHI'
Figure 4.2 NaX structure indicating ion positions.
Silicalite provides a practically homogeneous environment for both polar and non-polar
molecules, whereas polar molecules exhibit energetic heterogeneity in NaX due to the
presence of non-framework sodium ions.
We used commercial powders of these zeolites: silicalite (Linde S115) manufactured by
Union Carbide Corp. and NaX (Linde 13X) with a Si/Al ratio of 1.23. Thermogra-
vimetric analysis of the samples yielded dehydrated weights of 99% and 76% of that in
air, respectively [Dunne etal. 1996a, 1996b].
We studied a variety of polar and non-polar gases. Gases used in the experiments were
from Air Products & Chemicals, Inc. (SF6, 99.99%; C2H4, 99.5%; C2H6, 99%; C3Hg,
68

99.5%) and from Aireo (CO2,99.99%; CH4,99.99%). Table 4.1 summarizes the proper-
ties of these gases.
Table 4.1 Properties of the gases studied*
Property
Critical temperature, 7c, K
Critical pressure, Pc, kPa
Critical volume, Vc, cm3/mol
Ascentric factor, (0
Quadrupole moment, 0/10'26 esu
Polarizability, a/10*24, cm3
"Taken from Smith, et al. 1999;
CH4
190.6
45.99
98.6
0.012
0
2.5
leid et al.
CjH«,
305.3
48.72
145.5
0.100
<1
4.5
C,H,
369.8
42.48
300.0
0.153
C A
282.3
50.40
131.
0.087
xn-3.5 yr- 1.7 rr. 1.8
4.2
CO,
304.2
73.83
94.0
0.244
-4.5
2.6
986, and Gray and Gubbins, 1984.
SF<
318.7
37.6
198.8
0.286
0
4.5-6.5
4.2 Method
The multicomponent calorimeter and the experimental procedure were described in detail
in Chapter 3. Some particular details for the conditions of the experiment are presented in
this section.
The pretreatment procedure for the sample was heating in situ under vacuum from room
temperature to 110°C over 24 hours for a fresh sample, or 12 hours when regenerating a
69
used sample; followed by heating over a period of 12 h from 110°C to 350°C and finally,
maintaining the temperature at 350°C for 12 h.
For binary and ternary mixture measurements, the components were dosed alternately in
order to measure the mixture enthalpies. The composition of the equilibrium gas was
measured with a mass spectrometer through a leak valve attached to the sample cell.
Loadings of both components were calculated from mass balances using standard volu-
metric procedures. The attainment of equilibrium was verified by reversing the order in
which the components were added to the sample cell as described in Chapter 3.
4.3 Results
4.3.1 Single-Gas Isotherms and Isosteric Heats
Calculations of mixture properties such as adsorbed-phase activity coefficients are ex-
tremely sensitive to the properties of the single adsorbates. For this reason, we devoted
special attention to the reproducibility of the experimental data. Reversibility was estab-
lished by comparing points obtained by adsorption and desorption. Single gas isotherms
are shown in Figures 4.3-4.4. The three experimental points for CH4 on silicalite at pres-
sures above 1 bar were taken from Golden and Sircar [1994] in order to avoid having to
extrapolate our data to high pressure for mixture calculations. The experimental data are
tabulated in Appendix 1.
70
In preparation for calculating thermodynamic properties, the single gas isotherms were
fitted with a modified virial equation:
HP = n—2ΗexpjCi/i+C2n2 + C3n3 + C4n4} (4.1)
Constants for Eq. (4.1) are given in Table 4.2. The virial equation extrapolates properly to
zero pressure: lim P - O (dn/dp) = H. The factor m/Qn-n) was added to enforce Lang-
muirian behavior at high pressure where the virial expansion used by itself diverges.
Thus Eq. (4.1) has the correct asymptotic behavior at high and low pressure plus suffi-
cient flexibility to fit all of the isotherms within experimental error. The average differ-
ence between the experimental pressure and the value that was calculated by Eq. (4.1) is
1.1%.
The differential enthalpies (heats) of adsorption shown in Figures 4.5 and 4.6 were fit by
a Maclaurin series:
ßa = Go + D m + D2n2 + Dm1 + D*n* (42)
Constants for Eq. (4.2) are given in Table (4.3). The average error between the experi-
mental and calculated enthalpy is 1.3%.
71
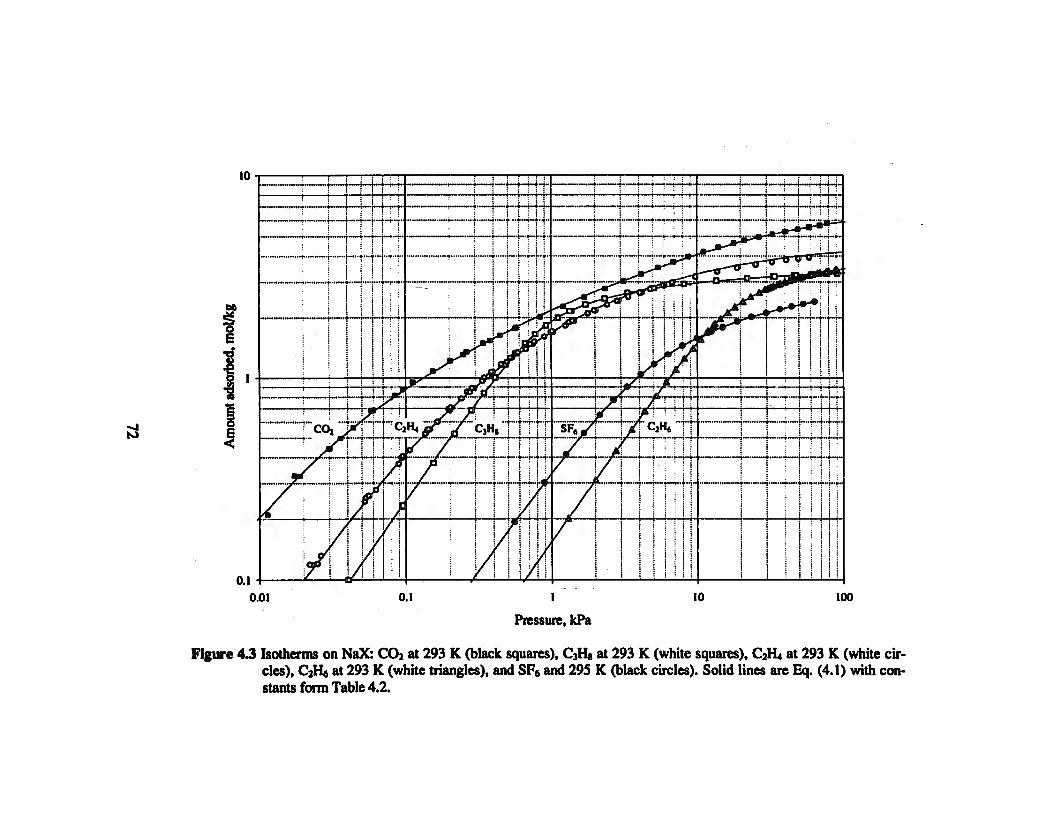
on
S E TÍ
41 o •a
u •
1 •
!
"'cor:
k '••-/
i — r - H
i |
1 |
!
"I
*•••:—
1 ! t : t : : I : t
i i
1/ rr ;
• : ; ' i
! ! • I
•'•»••t"
• v /*, -Q
; ! • ï ; i • 1 ! f
• : ' i !
! i
: »
" 7
; i
i
i I
i 1
i
! : ! ! 1 t
i ] \ 4.4-L
j ! | | . Liij ""jTT'i
i M !
* j / 7 !
•«^ / i ^ZY CJH, r
/
í
i J
t
1
(*• i : i
I ! • ;
—;.....
/
\ ! : i ¡ ' i
• «-..«...i ¿.«.«.j i.,-±„2~2jfr»
''"SF¡'7f""""
-LUÍ MIL | i>£
TffcA'it y \ / i i M n
' '• / i | • ¿ A....—Í i I i L.i.L / ! M M11 !
/ \ i 1 ! ! ! Il / ! | i ! Mi| 1 ! M Mil
1 1 M MÍ!
: i . ; : " " ; ;
í '• • 1 • : ! j i I ! : t i
1 1 i ! ' •
— ^M~*^ • i i 1 U U T"r*t"
í
-"••"T"—
; i
! ! i ! ;
. „ . f n ^ . ^ H f , .
¡ i ;
1 i ! ! | I ¡ i i : i i i ! i
0.01 0.1 10 100
Pressure, kPa
Figure 43 Isotherms on NaX: C02 at 293 K (black squares), C3Hg at 293 K (white squares), C2H4 at 293 K (white cir-cles), C2Ü6 at 293 K (white triangles), and SF6 and 295 K 0>lack circles). Solid lines are Eq. (4.1) with con-stants form Table 4.2.
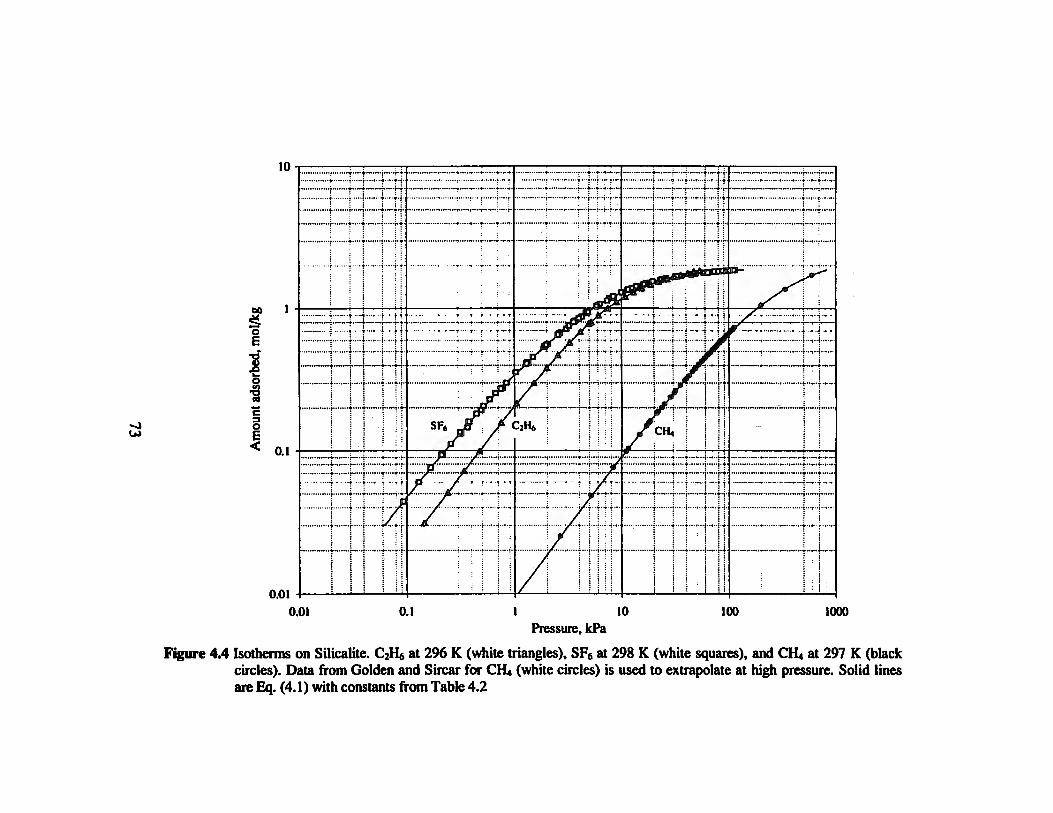
»J
S o E
1 o 1 3 O E <
0.01 0.01 0.1 10 100 1000
Pressure, kPa Figure 4.4 Isotherms on Silicalite. C2H6 at 296 K (white triangles), SF6 at 298 K (white squares), and CIL. at 297 K (black
circles). Data from Golden and Sircar for CH4 (white circles) is used to extrapolate at high pressure. Solid lines are Eq. (4.1) with constants from Table 4.2

Tabk 4.2 Constants of Eq. (4.1) for single gas isotherms. P is given in kPa for n in mol/kg.
Gas
CO2
C3H8
C2H4
C2H6
SF6
SF6
QH*
CH4
Zeolite
NaX
NaX
NaX
NaX
NaX
Silicalite
Silicalite
Silicalite
H
mol/(kgkPa)
27.253
2.3657
5.2039
0.1545
0.3623
0.5010
0.2145
0.00945
c,
1.2338
-0.5251
0.3850
-0.2670
-0.0661
0.8010
-0.2752
0.0837
c2
-0.1241
0.3367
0.0075
-0.0499
-0.0491
-0.7501
0.1272
-0.0470
c3
0.0038
-0.2419
0.0012
0.0192
0.1115
0.2357
0.0
0.0
c4
0.0
0.0648
0.0012
0.0
0.0
0.0
0.0
0.0
m
mol/kg
6.4674
3.4288
4.5341
3.8937
3.4393
1.9495
2.1534
2.4578
T
°C
20.0
20.0
20.0
20.0
22.3
25.0
23.0
24.0
Error
%
3.0
1.3
1.6
0.2
0.2
1.4
0.6
0.4

Two different runs are reported in Table 4.3 for CO2 on NaX. The heats for run II were
made on a different sample of NaX and are about 2 kJ/mol higher but the single gas iso-
therms for these two runs were indistinguishable. Possible reasons for this disagreement
may be different purity of the gas, as well as variations in zeolite composition.
Table 43 Constants of Eq. (4.2) for isosteric heats of adsorption of pure gases at 25°C. Qa is given in kJ/mol for n in mol/kg.
Gas
CO2
CO2
C3H8
QH4
C2H6
SF6
SF6
C2H«
cm
Zeolite
NaX
NaX (II)
NaX
NaX
NaX
NaX
Silicalite
Silicalite
Silicalite
kJ/mol
47.776
49.410
34.400
41.836
26.893
28.368
35.908
31.130
21.103
D\
-1.8994
1.2389
-1.4850
-0.3215
1.1719
0.9789
1.8088
0.5581
0.1924
D2
-2.2273
-4.1093
2.7846
1.2203
-0.0328
0.3086
-3.4915
0.0
0.0
D3
0.7006
1.1639
-0.3180
-0.9452
0.1195
0.5204
2.2187
0.0
0.0
DA
-0.0562
-0.0965
0.0
0.1576
0.0
0.0
0.0
0.0
0.0
Error
%
1.3
1.2
0.7
0.7
1.0
1.3
1.6
1.0
1.5
75

o E
u •c a
C/l O C/3
. M .
J: •S e u
c
60
50
40
30
20
o ^ C 3 H ,
• »oOrf* C2H4 "¿Q
10 -
COj/NaXdD
goflB0*»
0 1 2 3 4 Amount adsorbed, mol/kg
Figure 43 Differential enthalpy (isosteric heat) on NaX. Solid lines are Eq. (4.2) with con-stants from Table 4.3.
76
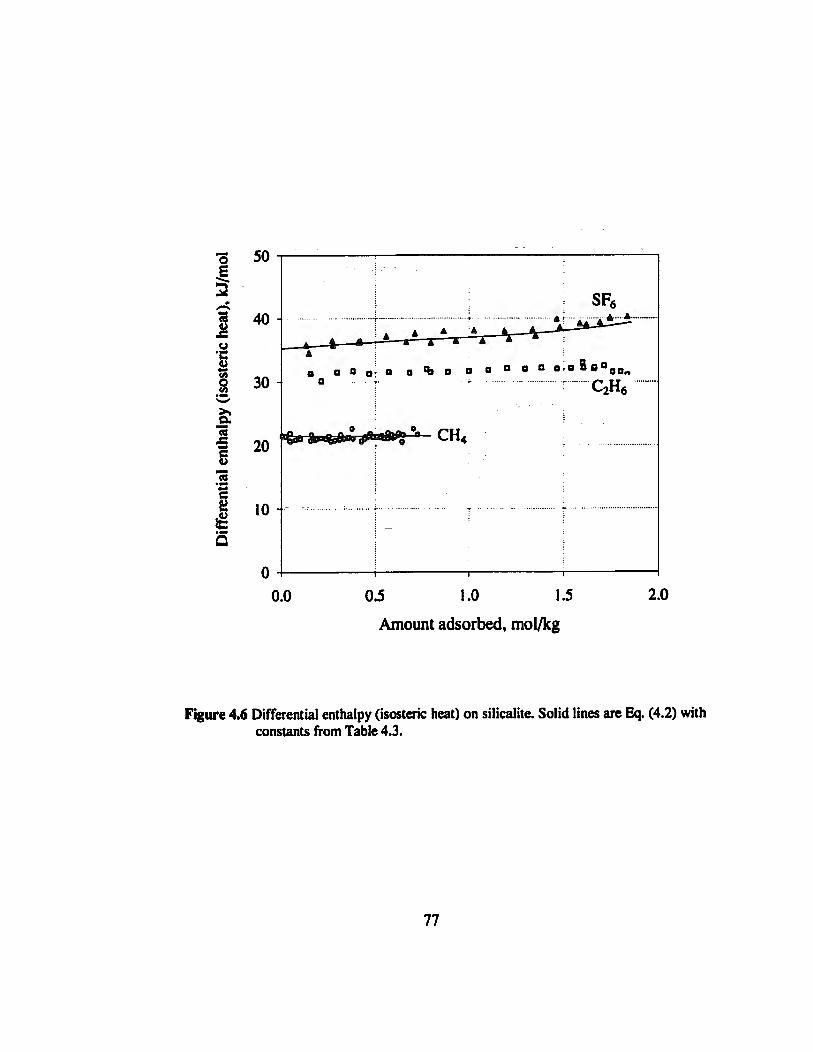
•3 50 E
3 u x: u •c S ai
8 "3 JZ
40 -
30
€ 20
K 10
0.0 0.5 1.0 1.5
Amount adsorbed, mol/kg
2.0
Figure 4.6 Differential enthalpy (isosteric heat) on silicalite. Solid lines are Eq. (4.2) with constants from Table 4.3.
77
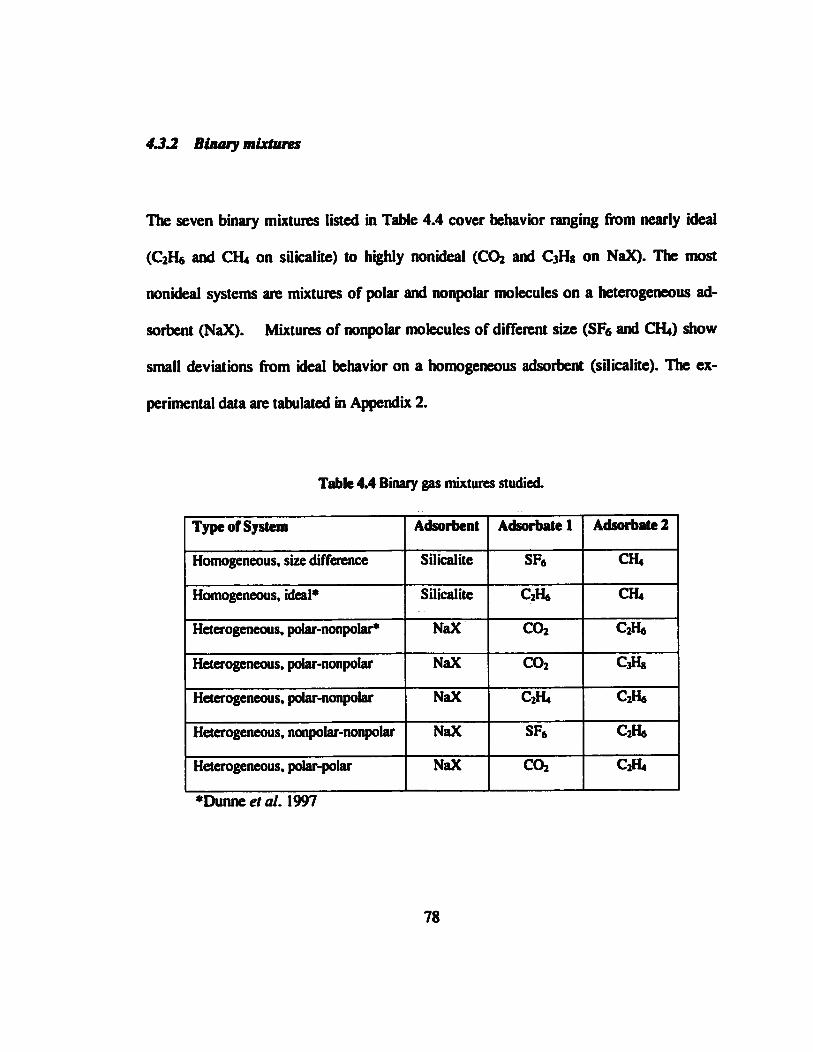
432 Binary mixtures
The seven binary mixtures listed in Table 4.4 cover behavior ranging from nearly ideal
(C2H6 and CR» on silicalite) to highly nonideal (CO* and C3H8 on NaX). The most
nonideal systems are mixtures of polar and nonpolar molecules on a heterogeneous ad-
sorbent (NaX). Mixtures of nonpolar molecules of different size (SFô and CH4) show
small deviations from ideal behavior on a homogeneous adsorbent (silicalite). The ex-
perimental data are tabulated in Appendix 2.
Table 4.4 Binary gas mixtures studied.
Type of System
Homogeneous, size difference
Homogeneous, ideal*
Heterogeneous, polar-nonpolar*
Heterogeneous, polar-nonpolar
Heterogeneous, polar-nonpolar
Heterogeneous, nonpolar-nonpolar
Heterogeneous, polar-polar
Adsorbent
Silicalite
Silicalite
NaX
NaX
NaX
NaX
NaX
Adsorbate 1
SF6
C2H6
CO2
CO2
C2H4
SF6
CO2
Adsorbate 2
CH4
CH4
C2H«
CsHg
c2m C2H6
C2H4
•Dunne et al. 1997
78
As pointed out in Chapter 2, surface potential is needed for mixture calculations. Com-
bining equations (2.19) and (2.20) for surface potential we get:
Y RT Jo )o\B\nn)T (4.3)
Substitution of Eq. (4.1) into (4.3) gives for pure adsorbates:
<Kn) = -C,/i2 + - C 2 n 3 +-C3/14 +-C4/15 -mini 1 - — ) (4.4) 2 3 4 5 v mj
Using individual loadings (m, n2) and temperature as independent variables for binary
mixtures, the total loading is nt = (/it + /t2) and the composition of the adsorbed phase is
JCI = njnt. The surface potential in the mixture Íyf = i/f\ - ¡fi2) was determined by solving
Eq. (2.23):
_L=£L+Í2.+ "/ «I n2
'i" Kn J
(4.5)
79
Inversion of Eq. (4.4) yields the functions nftyr) and n2{yf) at the common standard
state (y). Substitution of these two functions plus Eq. (2.32) for (l//i)c into Eq. (4.5)
yields a single equation in a single unknown (y> ). The corresponding pressures (P° and
Pz) at the standard state are given by Eq. (4.1). Adsorbed-phase activity coefficients are
calculated from Eq. (2.33). Finally, Eq. (2.17) written for component nos. 1 and 2 and
perfect-gas behavior (0,- = 1 ) for our low pressure measurements:
Py\ = P\Y\X\ (4-6)
Py2 = P2y2x2 (4.7)
are solved for the dependent variables P and y\\ the selectivity is given explicitly by Eq.
(2.26). Thus, the dependent variables (P, y\, and su) were calculated for the set of inde-
pendent variables (T, nu n2) and compared with experiment.
Calculation of dependent variables for a binary mixture by Eqs. (4.4) - (4.7) presupposes
knowledge of the values of two constants: C and A0 = (A+BT). Values for C and A0 were
extracted by minimizing the error in calculated values of pressure (P) and selectivity
( î U ) . Figure 4.7 shows a typical contour plot for the error in parameter space. After ex-
tracting parameters A0 and C for a binary mixture at a particular temperature, the values
of A and B were determined by minimizing the error between the experimental differen-
tial enthalpies (heats) of adsorption and the values calculated from Eq. (2.38) under the
constraint that A0 = (A+BT). This two-step procedure is far more effective than trying to
80
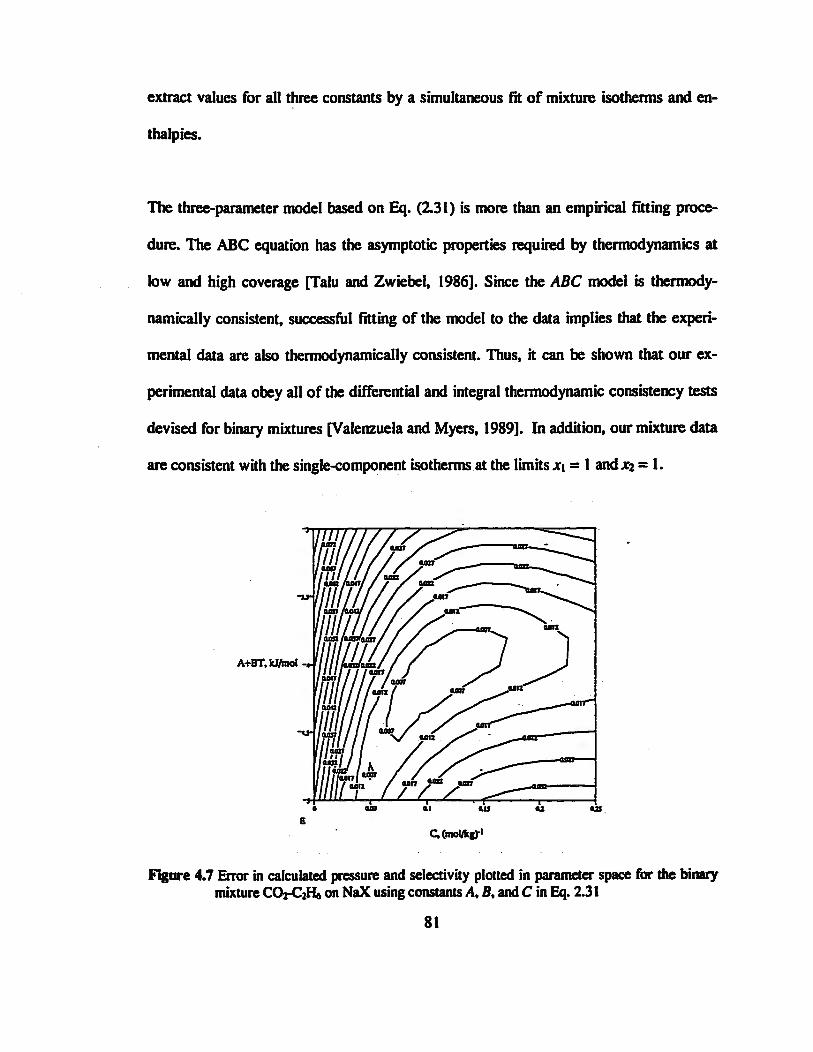
extract values for all three constants by a simultaneous fit of mixture isotherms and en-
thalpies.
The three-parameter model based on Eq. (2.31) is more than an empirical fitting proce-
dure. The ABC equation has the asymptotic properties required by thermodynamics at
low and high coverage [Talu and Zwiebel, 1986]. Since the ABC model is thermody-
namically consistent, successful fitting of the model to the data implies that the experi-
mental data are also thermodynamically consistent. Thus, it can be shown that our ex-
perimental data obey all of the differential and integral thermodynamic consistency tests
devised for binary mixtures [Valenzuela and Myers, 1989]. In addition, our mixture data
are consistent with the single-component isotherms at the limits JCI = 1 and JC2 = 1.
z 777 m aap 111
u n / i w / « i W
urc - j j -IOJ7
.
/ / u n
ora
Hnrt UJ7
•
A+BT. tr/mot u n u n ion I ion f I
U/h.
ion ion u n
i ma
n— loa
MOT - o - u n u n u n i
aro I MIT " P i-r/rr/ UJ 11 123 au
B C. fowl/kg)-'
Figure 4.7 Error in calculated pressure and selectivity plotted in parameter space for the binary mixture CO2-C2H6 on NaX using constants A, B, and C in Eq. 2.31
81

Models with two parameters fail to fit the data within experimental error. Models with
four or more parameters can be devised but the parameters may have less physical sig-
nificance. The three parameters in (2.31) account fon (1) the degree of nonideality (A +
BT), (2) the variation of nonideality with loading (Q, and (3) the variation of nonideality
with temperature (A).
The constants of the ABC equation derived from experimental data for the binary mix-
tures are reported in Table 4.5.
Figures 4.8 and 4.9 show a comparison of the experimental and calculated pressure and
gas phase composition using the ABC equation for six systems: five non-ideal mixtures
and one ¡deal mixture (SF6-C2H6 on NaX). The data for Cm-QH* on MFI can be found
elsewhere [Dunne et al. 1997]. Selectivities and pressures calculated with the ABC
equation are in very good agreement with experimental data. The average error in the
calculated pressure for the systems shown on Figure 4.8 is 5%. The average error in the
calculated vapor mole fraction for the systems shown on Figure 4.9 is 8%.
The experimental heats of adsorption are larger than the ideal values, which is consistent
with the negative deviations from ideal behavior observed for the selectivities. For exam-
ple, heats of adsorption of CCh and C2Hö in a binary mixture are shown in Figure 4.10. In
some cases, fitting heats of adsorption of both components with only one constant does
not give enough flexibility to capture the shape of the heat curves measured experimen-
82
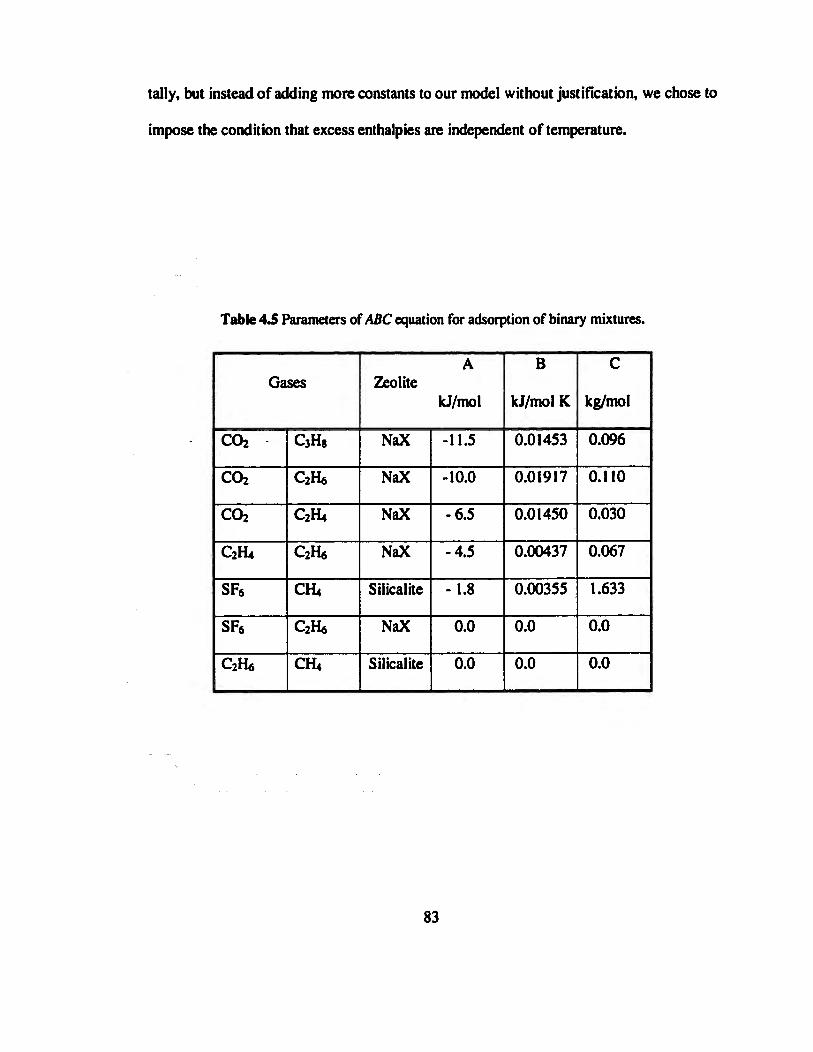
tally, but instead of adding more constants to our model without justification, we chose to
impose the condition that excess enthalpies are independent of temperature.
Table 4.5 Parameters of ABC equation for adsorption of binary mixtures.
Gases
cc CCfe
CC^
C2R,
SF6
SF6
C2H6
C3H8
C2H6
C2H4
QHo
CH4
C2H6
CH4
A Zeolite
kJ/mol
NaX
NaX
NaX
NaX
Silicalite
NaX
Silicalite
-11.5
-10.0
-6.5
-4.5
-1.8
0.0
0.0
B
kJ/molK
0.01453
0.01917
0.01450
0.00437
0.00355
0.0
0.0
C
kg/mol
0.096
0.110
0.030
0.067
1.633
0.0
0.0
83
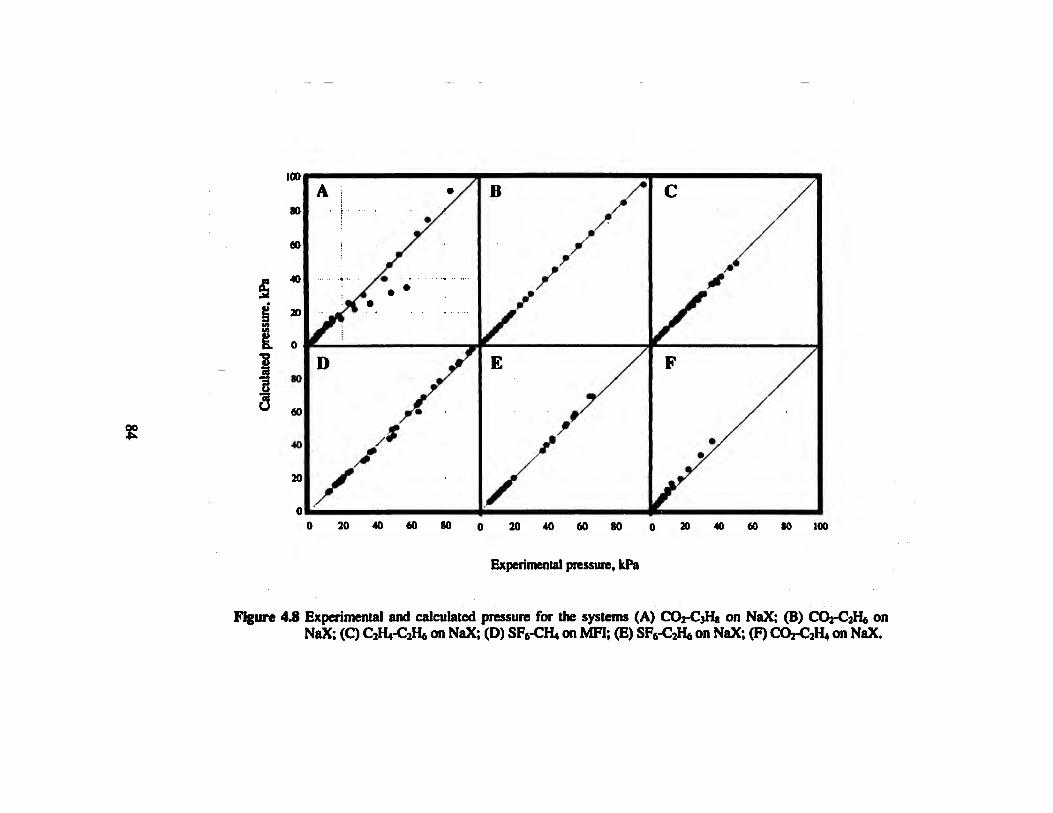
"8 3
100
80
CO
40
20
0
80
60
40
20
A | •/ • y
» ./• / • *
y1» *
• /
/
/ /
E /
/
C /
*
F /
0 20 40 60 80 20 4 0 6 0 8 0 0 20 40 60 »0 100
Experimental pressure, kPa
ure 4.8 Experimental and calculated pressure for the systems (A) CO2-C3H8 on NaX; (B) CO2-C2H6 on NaX; (C) C2H4-C2H6 on NaX; (D) SFs-CH* on MH; (E) SF6-C2H6 on NaX; (F) CO2-C2H4 on NaX.
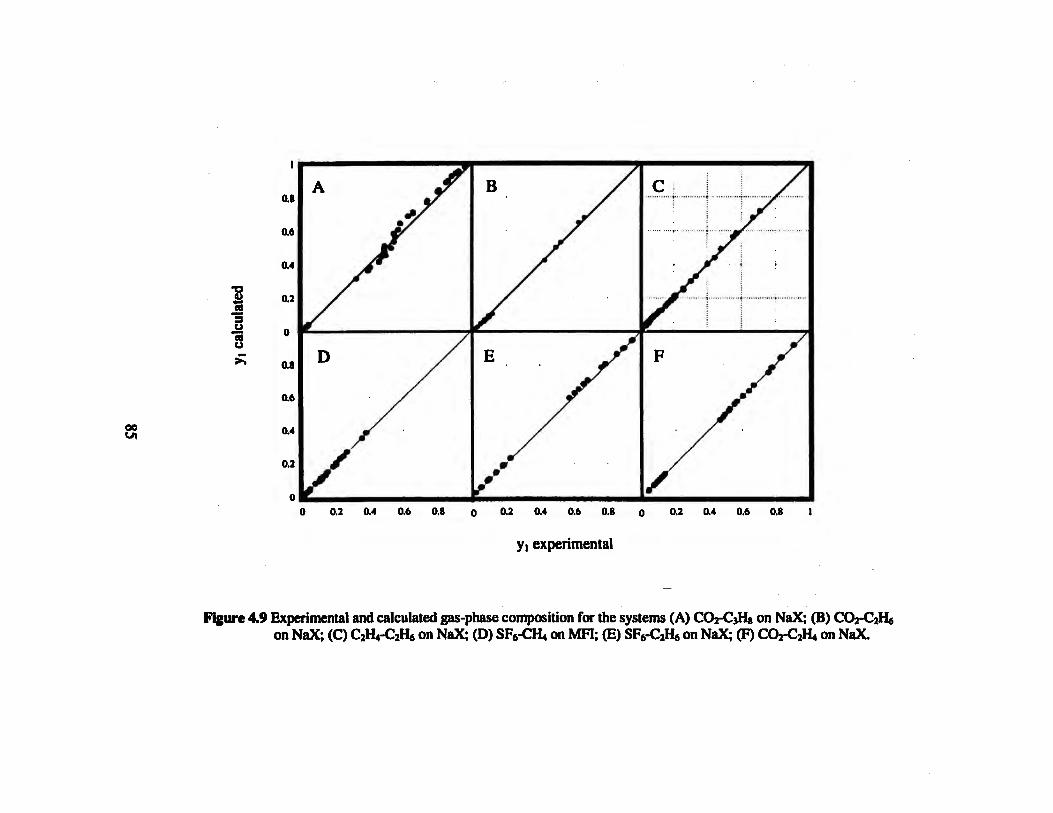
A j?
D /
/
B /
V
F « ^
1.4 0.6 0.8 o 0.2 04 0.6 0.8 I
Si 3 O at u ;£
as
0.6
0.4
0.2
0
08
0.6
0.4
0.2
0
yi experimental
Figure 4.9 Experimental and calculated gas-phase composition for the systems (A) COr-CjHg on NaX; (B) CO2-C2H6 on NaX; (C) C2H4-C2H6 on NaX; (D) SFj-Cm on MH; (E) SF6-C2H6 on NaX; (F) CO2-C2H4 on NaX.
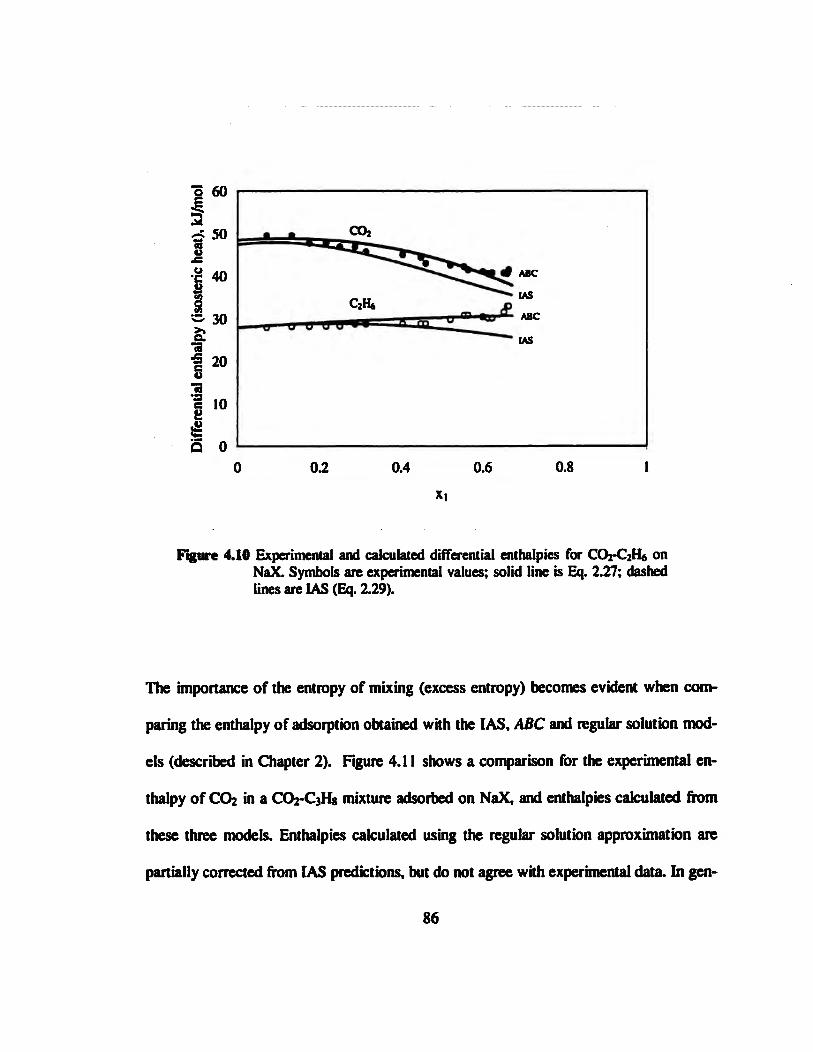
o 0.2 0.4 0.6 0.8 X|
Figure 4.10 Experimental and calculated differential enthalpies for CO2-C2H6 on NaX. Symbols are experimental values; solid line is Eq. 2.27; dashed lines are IAS (Eq. 2.29).
The importance of the entropy of mixing (excess entropy) becomes evident when com-
paring the enthalpy of adsorption obtained with the IAS, ABC and regular solution mod-
els (described in Chapter 2). Figure 4.11 shows a comparison for the experimental en-
thalpy of CO2 in a COrCaHg mixture adsorbed on NaX, and enthalpies calculated from
these three models. Enthalpies calculated using the regular solution approximation are
partially corrected from IAS predictions, but do not agree with experimental data. In gen-
86
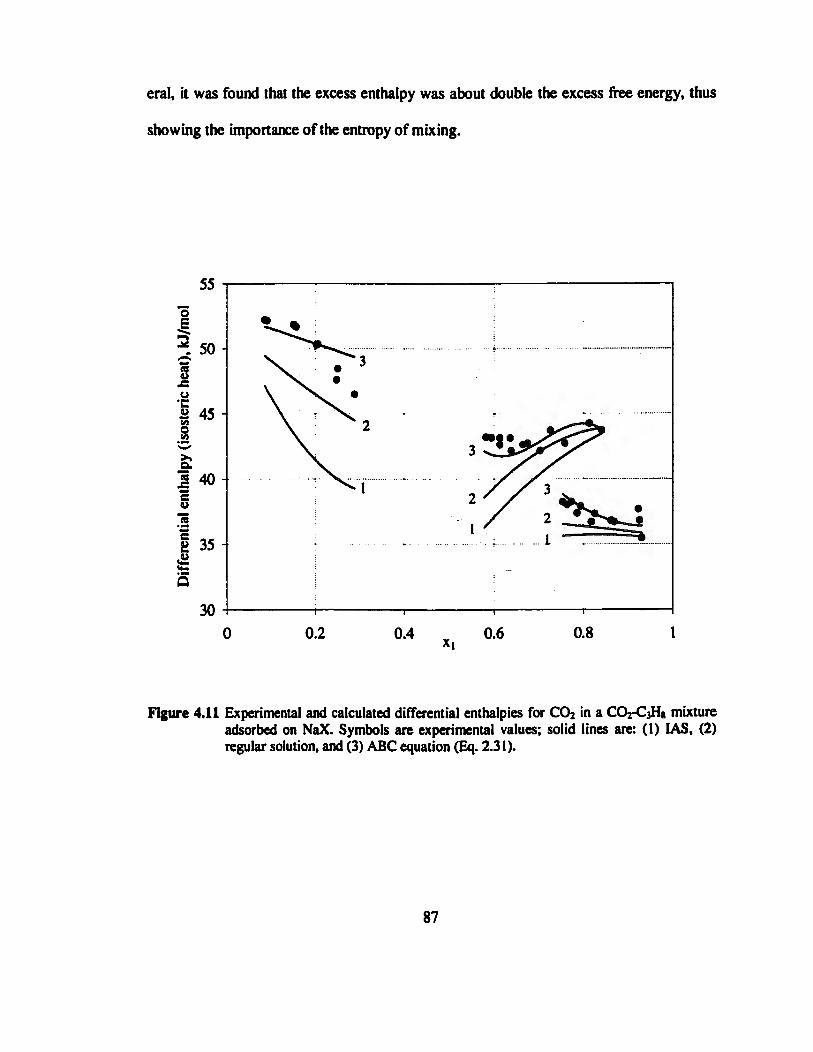
eral, it was found that the excess enthalpy was about double the excess free energy, thus
showing the importance of the entropy of mixing.
a 45
g 35 -
Figure 4.11 Experimental and calculated differential enthalpies for CO2 in a CO2-C3H8 mixture adsorbed on NaX. Symbols are experimental values; solid lines are: (1) IAS, (2) regular solution, and (3) ABC equation (Eq. 2.31).
87

433 Ternary mixture
Ternary adsorption equilibria predicted from Eq. (2.40) using data for the three constitu-
ent binaries were compared with experiment for the system C02-C2H4-C2H6 on NaX.
This system was selected because one of the binary pairs (C02-C2H6 on NaX) is highly
nonideal. The other two pairs are moderately non-ideal ( C O r C ^ and QH4-QH6.
Measurements are concentrated in the region of high loading where nonidealities are the
strongest.
Figures 4.12 and 4.13 compare calculated pressures and selectivities. The calculated pres-
sure in Figure 4.12 is larger than the experimental value; the average difference is 8%.
The predictions for selectivity in Figure 4.13 are in excellent agreement with experiment
except for the pair C02-C2H6, for which the average error in calculated selectivity (s\j) is
15%. For the same pair in the absence of a third component, the average error in the pres-
sure calculated from the ABC equation is 9% and the average error in the selectivity cal-
culated by the ABC equation is 11%. Thus the errors in Eq. (2.40) for a ternary system are
comparable with the fitted equations for the constituent binaries. Figure 4.14 shows that
enthalpies calculated for the ternary mixture are in excellent agreement with experiment.
It is concluded that ternary equilibria can be predicted from binaries with errors compa-
rable to the experimental uncertainty in the binary measurements.
88
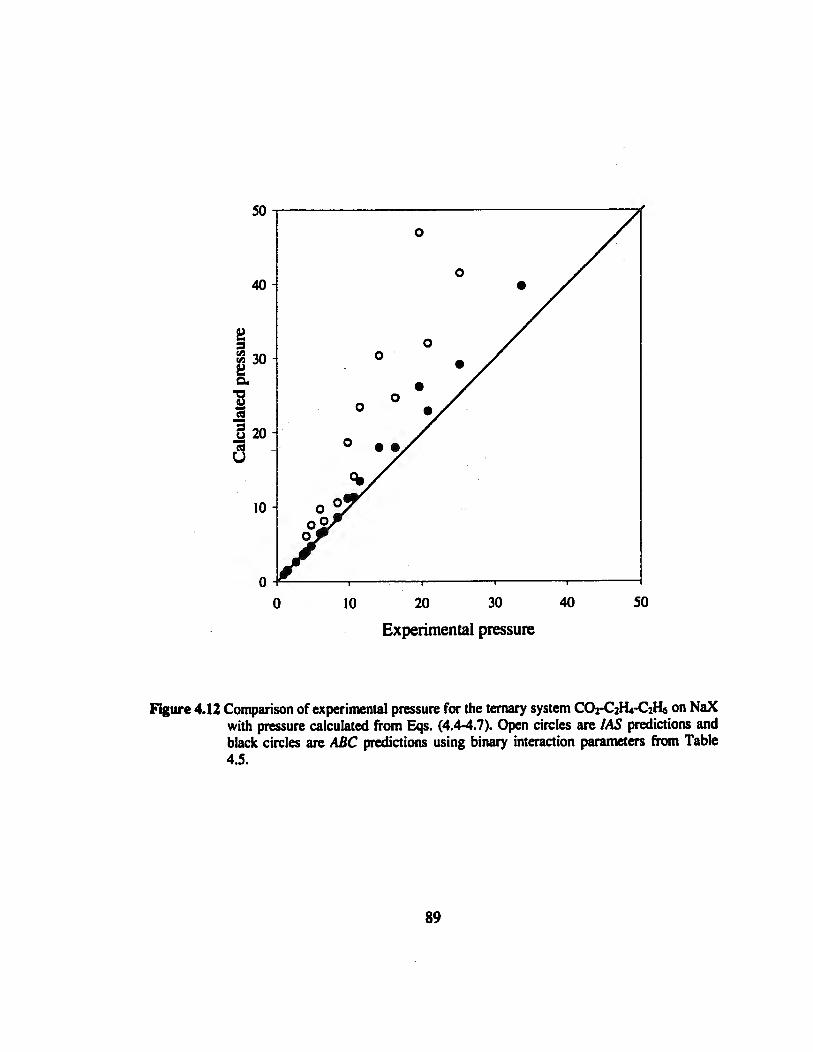
"8
10 20 30 40
Experimental pressure 50
Figure 4.12 Comparison of experimental pressure for the ternary system CO2-C2H4-C2H6 on NaX with pressure calculated from Eqs. (4.4-4.7). Open circles are IAS predictions and black circles are A0C predictions using binary interaction parameters from Table 4.5.
89

s
40
35
30
25
CO
g 20
15
10
Preloading of C0 2 * • *
SI3
VA
A A *
< ^ * _
Preloading of C2H4
• •
*
\ S,3 A \
A X ^ _
L A A V » .
8 2 3 " " ' -
0
Total loading, mol/kg
Figure 4.13 Comparison of experimental selectivity for the ternary system COi(l) - C2H4 (2) - C2H6 (3) on NaX with selectivity predicted using IAS (dashed line), and ABC Eq. (2.31) (solid line).

NO
50
ô 45 I 2 40 cd I 35 o ï 30 tu o 0 25
]¡ 20
> . 3 •a 1 10 Ë 5 5
0
CO! * * * , , _
C2H4 +Ç5
C2H6
Preloading C0 2
CO »at«.
m C2H4 ^ Î W *
C2H6 XXX
X xnc
Preloading C2H4
4 O 2
Total loading, mol/kg
Figure 4.14 Comparison of experimental enthalpy for the ternary system CO2O) - C2H4 (2) - C2HA (3) on NaX with predicted values using Eq. (2.27) and Eqs.(2.34)-(2.37) (solid line).
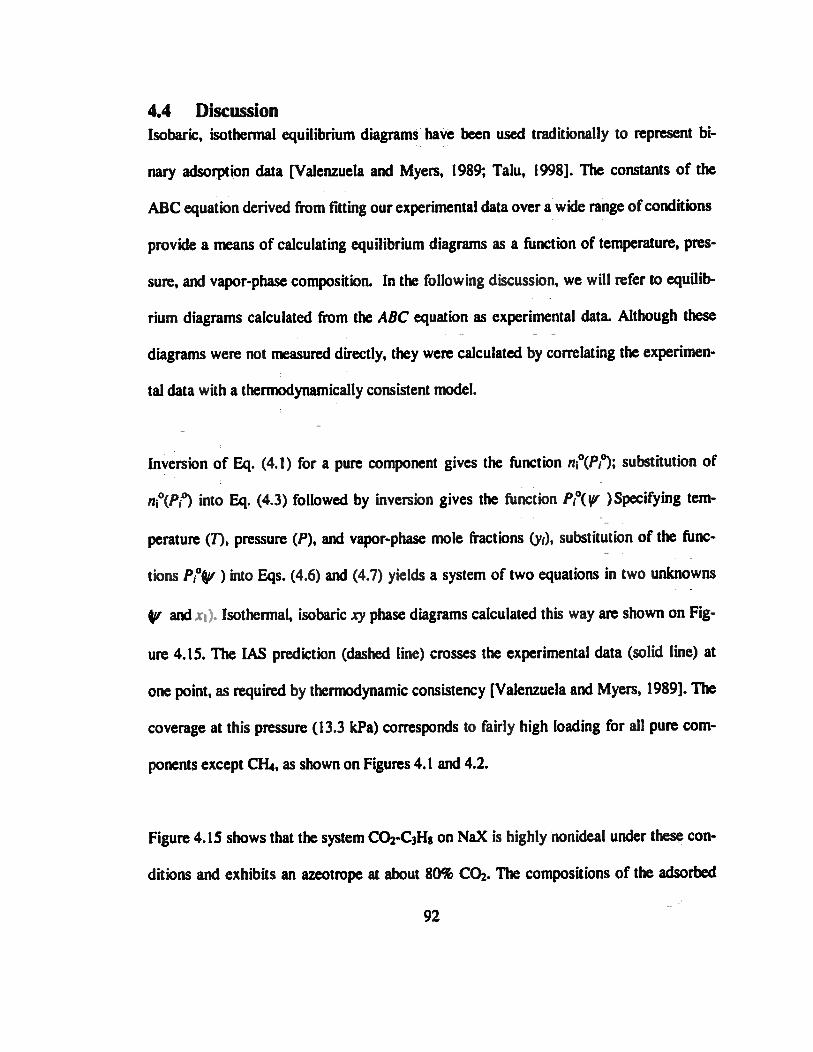
4.4 Discussion Isobaric, isothermal equilibrium diagrams have been used traditionally to represent bi-
nary adsorption data [Valenzuela and Myers, 1989; Talu, 1998]. The constants of the
ABC equation derived from fitting our experimental data over a wide range of conditions
provide a means of calculating equilibrium diagrams as a function of temperature, pres-
sure, and vapor-phase composition. In the following discussion, we will refer to equilib-
rium diagrams calculated from the ABC equation as experimental data. Although these
diagrams were not measured directly, they were calculated by correlating the experimen-
tal data with a thermodynamically consistent model.
Inversion of Eq. (4.1) for a pure component gives the function n°(P¡°); substitution of
n°(P¡°) into Eq. (4.3) followed by inversion gives the function Pftyr )Specifying tem-
perature (T), pressure (P), and vapor-phase mole fractions (y¡), substitution of the func-
tions /Vty ) into Eqs. (4.6) and (4.7) yields a system of two equations in two unknowns
fy and JCI). Isothermal, isobaric xy phase diagrams calculated this way are shown on Fig-
ure 4.15. The IAS prediction (dashed line) crosses the experimental data (solid line) at
one point, as required by thermodynamic consistency [Valenzuela and Myers, 1989]. The
coverage at this pressure (13.3 kPa) corresponds to fairly high loading for all pure com-
ponents except CH4, as shown on Figures 4.1 and 4.2.
Figure 4.15 shows that the system COrCaHg on NaX is highly nonideal under these con-
ditions and exhibits an azeotrope at about 80% CO* The compositions of the adsorbed
92
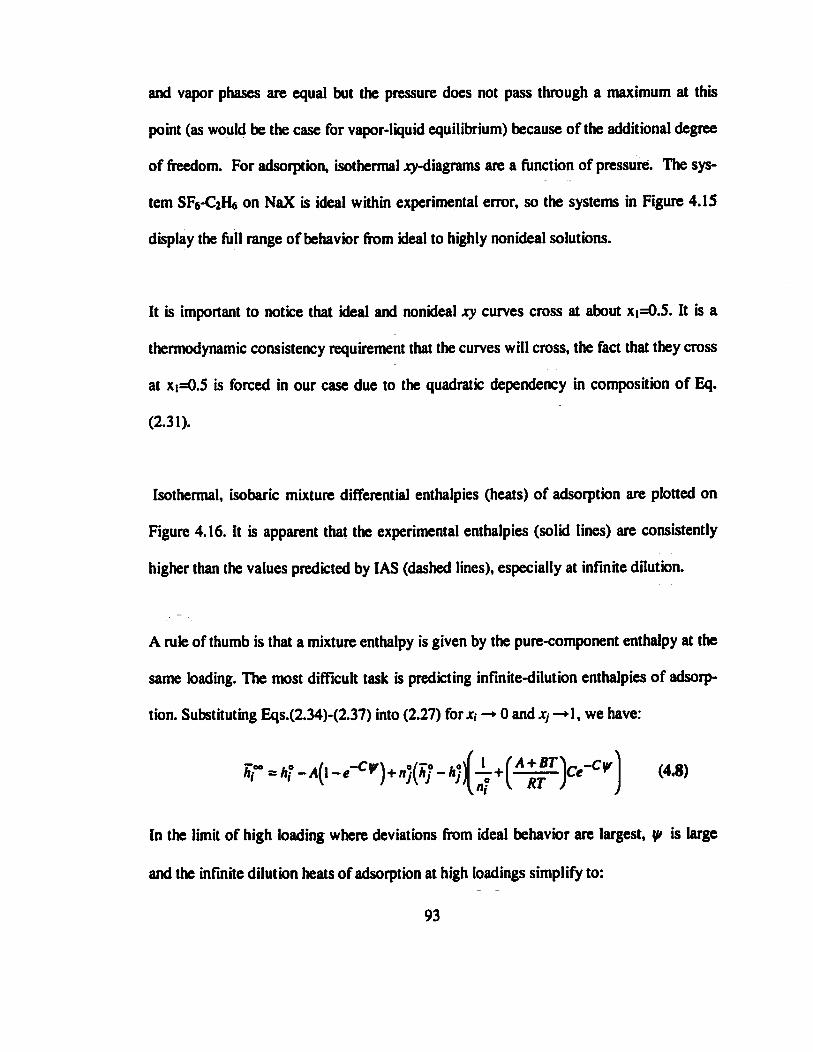
and vapor phases are equal but the pressure does not pass through a maximum at this
point (as would be the case for vapor-liquid equilibrium) because of the additional degree
of freedom. For adsorption, isothermal jrv-diagrams are a function of pressure. The sys-
tem SEs-QHfi on NaX is ideal within experimental error, so the systems in Figure 4.15
display the full range of behavior from ideal to highly nonideal solutions.
It is important to notice that ideal and nonkleal xy curves cross at about xi=0.5. It is a
thermodynamic consistency requirement that the curves will cross, the fact that they cross
at xi=0.5 is forced in our case due to the quadratic dependency in composition of Eq.
(2.31).
Isothermal, isobaric mixture differential enthalpies (heats) of adsorption are plotted on
Figure 4.16. It is apparent that the experimental enthalpies (solid lines) are consistently
higher than the values predicted by IAS (dashed lines), especially at infinite dilution.
A rule of thumb is that a mixture enthalpy is given by the pure-component enthalpy at the
same loading. The most difficult task is predicting infinite-dilution enthalpies of adsorp-
tion. Substituting Eqs.(2.34)-(2.37) into (2.27) for x, -» 0 and Xj-*\, we have:
In the limit of high loading where deviations from ideal behavior are largest, yt is large
and the infinite dilution heats of adsorption at high loadings simplify to:
93

/ * s
1/
/ D
/ B
/ E / / F
0 0.2 0.4 0.6 0.8 0 02 0.4 0.6 0.8 0 0.2 0.4 0.6 0.8 I
y«
Figure 4.15 Isothermal (295K), isobaric (13.3 kPa) xy diagrams for the systems: (A) C02-C3H8 on NaX; (B) C02-C2Hô on NaX; (C) COrC2H« on NaX; (D) CjtU-dlh on NaX; (E) SFs-ŒU on MFI; (F) SF6-C2H6 on NaX. Dashed lines are predictions of IAS theory.
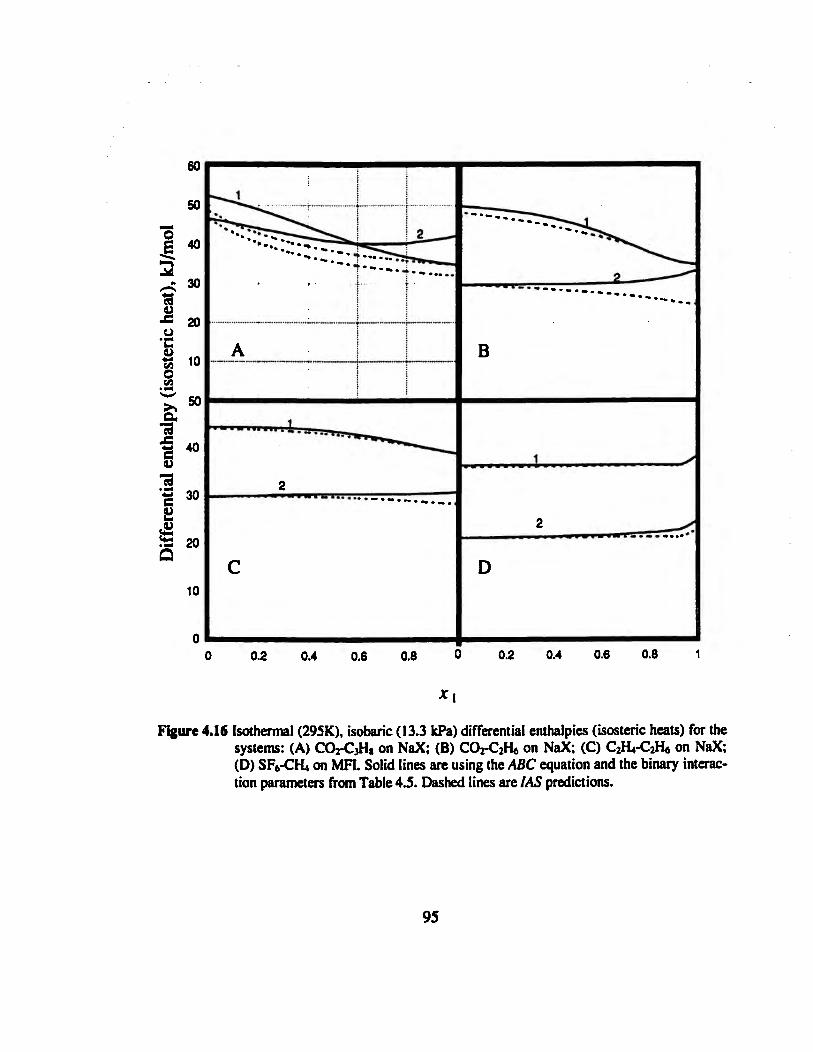
1 50 : :
S <° 30 f
3 : eu •C 20
t
B eu r 10 i CA
Vi
>> »
3 40 y CU •
*S 30 eu cu
20
0 0.2 0.4 0.6 0.8 0 02 0.4 0.6 0.8 1
Figure 4.16 Isothermal (295K), isobaric (13.3 kPa) differential enthalpies (isosteric heats) for the systems: (A) COj-CjH« on NaX; (B) COrC2Hô on NaX; (C) C2H4-C2H6 on NaX; (D) SF6-CH4 on MFI. Solid lines are using the AflC equation and the binary interac-tion parameters from Table 4.5. Dashed lines are IAS predictions.
95

For an ideal solution, A - 0; for real solutions A is normally negative, corresponding to an
exothermic enthalpy of mixing (see Table 4.5). Eq. (4.9) shows that for non-ideal mix-
tures at high loading, infinite-dilution enthalpies should be larger than those predicted by
IAS theory. However, it is not possible to predict when IAS predictions of individual
mixture enthalpies are better than the rule of thumb. Figure 4.17 shows a comparison of
pure-component differential enthalpies (solid lines) with infinite-dilution enthalpies
(dashed lines) for the system CC^ and C2H« in NaX.
o • i 2 A . 1 8 > >% Q.
S •a •g | is S
60
50
40
30 •
20
10
0 • 0
Figure 4.17 Comparison of infinite dilution differential enthalpies (dashed lines) for the system CO2-C2H6 on NaX with pure-component heats of adsorption at the same total load-ing as the mixture (solid lines).
When the pure-component enthalpy increases with loading, as for QH«, the infinite-
dilution enthalpy is well represented by the pure-component enthalpy at the same loading 96
0.5 1 13 2 US 3 Amount adsorbed, mol/kg
3.5

as the total loading of the mixture, but for C02 in the same mixture, the infinite-dilution
enthalpy is closer to the IAS prediction or to the zero coverage enthalpy than to the pure-
component enthalpy at the same total loading.
The excess functions provide a quantitative comparison of the deviations from ideality.
Isobaric, isothermal excess functions are shown on Figure 4.18 and activity coefficients
are shown on Figure 4.19, both for a constant pressure of 13.3 kPa. The excess enthalpy
and excess chemical potential functions are negative. Since the excess enthalpy is always
larger in absolute terms than the excess chemical potential, the nonidealities in these sys-
tems are enthalpy driven. Entropie effects (Tse = he -fie) are small but important.
•3
0
-400
-800
•1200
•1600 A x h« / x. »y B
Figure 4.18 Isothermal (295K), isobaric (13.3 kPa) excess enthalpy and excess free energy for the systems: (A) CO2-C3H» on NaX; (B) CO2-C2H6 on NaX; (C) C2H4-C2H6 on NaX; (D) SFyCft on MFI. x\ is the mole fraction of the first component in the adsorbed phase.
97

0.8
0.2 0.4 0.6 0.8 0' 0.2 0.4 0.6 0.8
Figure 4.19 Isothermal (295K), isobaric (13.3 kPa) activity coefficients for the systems: (A) COr C3H8 on NaX; (B) COrC2H6 on NaX; (C) C2H4-C2H6 on NaX; (D) SFs-CH* on MH.
Since Eq. (2.31) is quadratic in composition, the curves for the excess functions are
symmetric at constant surface potential. Under the conditions of constant pressure im-
posed on Figures 4.18 and 4.19, the curves have the minimum displaced towards the
component with the higher loading (higher surface potential).
98
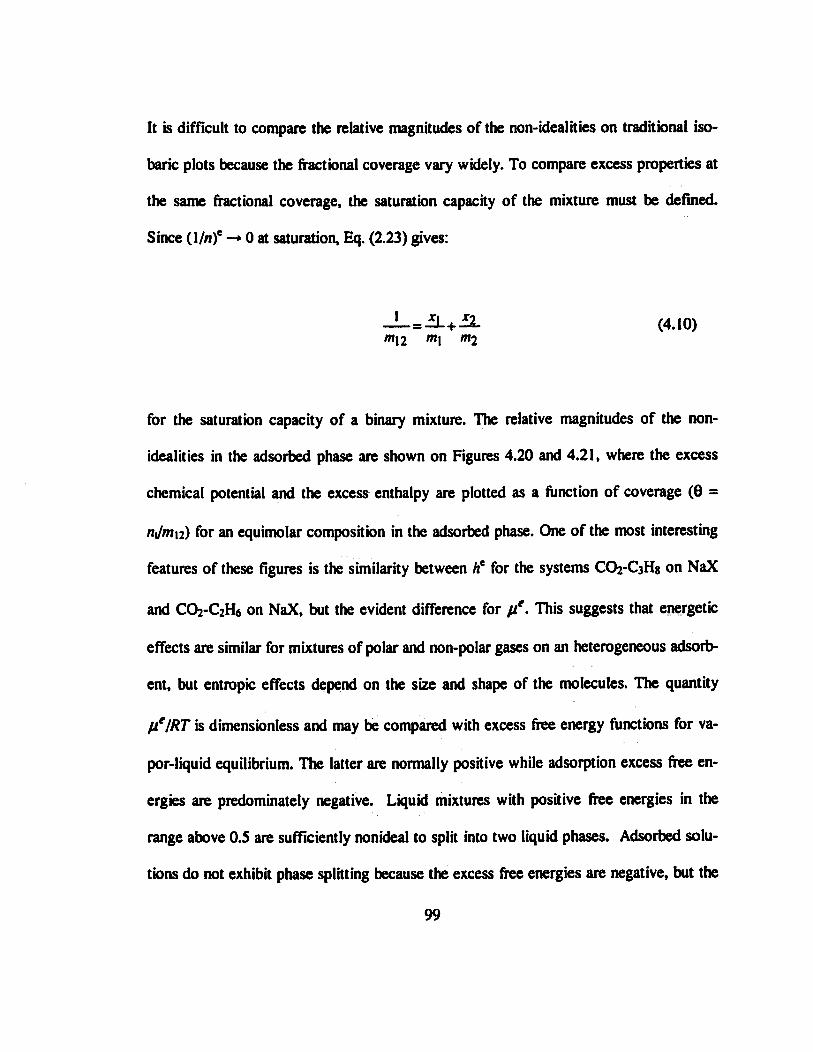
It is difficult to compare the relative magnitudes of the non-idealities on traditional iso-
baric plots because the fractional coverage vary widely. To compare excess properties at
the same fractional coverage, the saturation capacity of the mixture must be denned.
Since (l//i)e -* 0 at saturation, Eq. (2.23) gives:
JL=il_+i2_ (4.10) /Wj2 m\ m2
for the saturation capacity of a binary mixture. The relative magnitudes of the non-
idealities in the adsorbed phase are shown on Figures 4.20 and 4.21, where the excess
chemical potential and the excess enthalpy are plotted as a function of coverage (6 =
njntn) for an equimolar composition in the adsorbed phase. One of the most interesting
features of these figures is the similarity between he for the systems COrCsHg on NaX
and C02-C2H6 on NaX, but the evident difference for ¡Ie. This suggests that energetic
effects are similar for mixtures of polar and non-polar gases on an heterogeneous adsorb-
ent, but entropie effects depend on the size and shape of the molecules. The quantity
p'IRT is dimensionless and may be compared with excess free energy functions for va-
por-liquid equilibrium. The latter are normally positive while adsorption excess free en-
ergies are predominately negative. Liquid mixtures with positive free energies in the
range above 0.5 are sufficiently nonideal to split into two liquid phases. Adsorbed solu-
tions do not exhibit phase splitting because the excess free energies are negative, but the
99

values of peIRT for the systems C02-C3H8 and C02-C2H6 on NaX place these systems
into the highly nonideal category. The other binaries display moderate negative devia-
tions from Raoults law.
-0.2
5 -0.4
-0.6
-0.8
COz/CjHt/NaX SF./CH4/MFI
GiH4/Gz\yH&-
COj/CîfVNaX
0.2 0.4 0.6
CCVCaHa/NaX
0.8
Figure 4.20 Excess chemical potential as a function of fractional coverage (6) at the equimolar composition (t|=0.5)
Figure 4.20 shows that the excess chemical potential is negative for all of these systems.
These negative deviations from Raoult's law can be explained. If one molecule has mul-
tiple sites with different energies but the energy of adsorption of the other molecule is
100
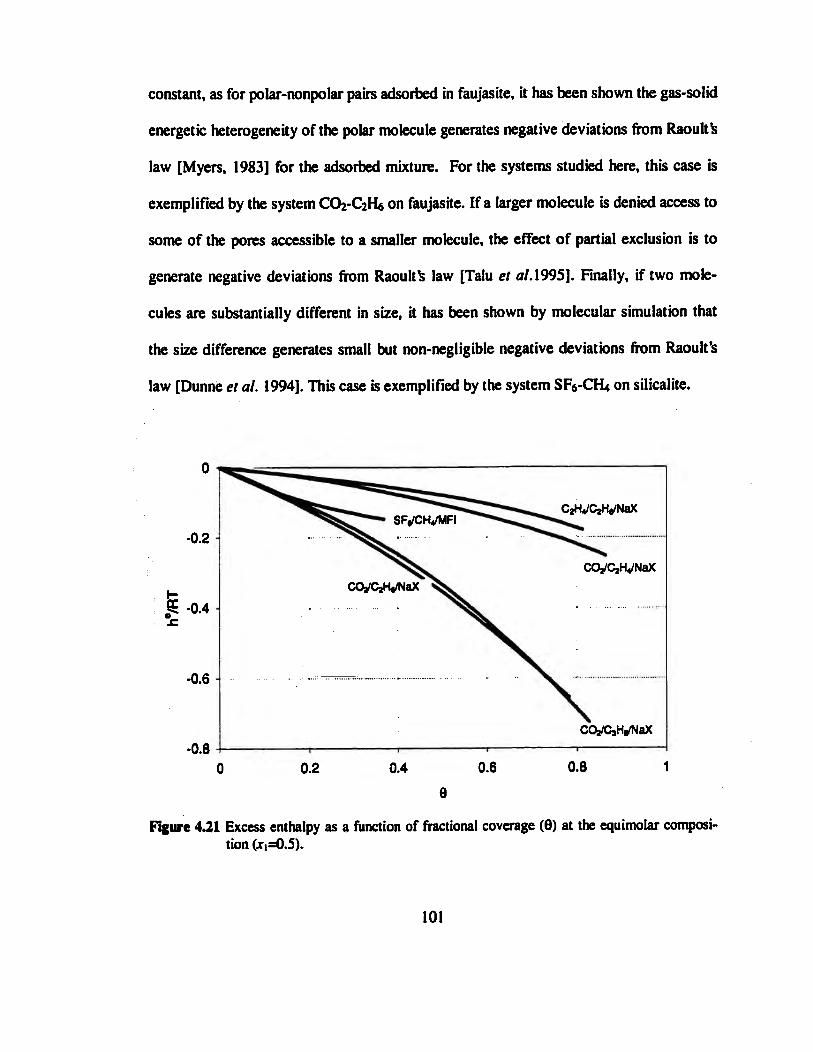
constant, as for polar-nonpolar pairs adsorbed in faujasite, it has been shown the gas-solid
energetic heterogeneity of the polar molecule generates negative deviations from Raoultfc
law [Myers, 1983] for the adsorbed mixture. For the systems studied here, this case is
exemplified by the system C02-C2H6 on faujasite. If a larger molecule is denied access to
some of the pores accessible to a smaller molecule, the effect of partial exclusion is to
generate negative deviations from Raoultfc law [Talu et al. 1995], Finally, if two mole-
cules are substantially different in size, it has been shown by molecular simulation that
the size difference generates small but non-negligible negative deviations from Raoult's
law [Dunne et al. 1994]. This case is exemplified by the system SF5-CH4 on silicalite.
CWCjIVNaX SF./CH4/MFI
COj/CjI-VNaX COj/CjH^NaX
0.6
CQz/CjHe/NaX -0.8 -I 1 1 1 ' !
0 0.2 0.4 0.6 0.8 1 8
Figure 4.21 Excess enthalpy as a function of fractional coverage (6) at the equimolar composi-tion (xi=0.5).
101
A major goal of this work is to develop a methodology for predicting non-ideal mixture
adsorption from pure-component properties. The important properties are: (i) the-zero-
coverage enthalpy or Henry constant, both of which describe the interaction of a single
molecule with the bare solid, (ii) the integral enthalpy at saturation, which when com-
pared to the zero-coverage enthalpy provides information of the energetic heterogeneity
of the system, and (Hi) the critical volumes of the adsorbates for comparing the relative
sizes of the molecules. Figure 4.22 shows a correlation for Ag=A+BT with energetic and
steric factors. The correlation captures well the trend for the systems studied, including
an ideal system: SF6-C2H6 on NaX, and a system studied by Kabir et al. [1998]: CH4-
C2Hé on zeolite 5 A. Figure 4.23 shows that the constant C in Eq. (2.31) decreases expo-
nentially with the saturation capacity of the mixture. In Figure 4.23 we included the sys-
tem C02-C2H6 on zeolite 5A that is not included in Figure 4.22 because we do not have
enough information about the heats of adsorption of C02 on 5A.
The correlation in Figures 4.22 and 4.23 provides a means of predicting multicomponent
adsorption equilibria from single-gas isotherms and enthalpies (heats) of adsorption as a
function of temperature, pressure, and gas-phase composition. Although the correlation is
based on experimental data for only 7 binaries and three types of zeolites, these systems
were carefully selected to cover a wide range of size differences and energetic effects.
Although additional experiments are needed to test the reliability of this method, the cor-
relation represents a large step toward the goal of predicting mixture equilibria.
102
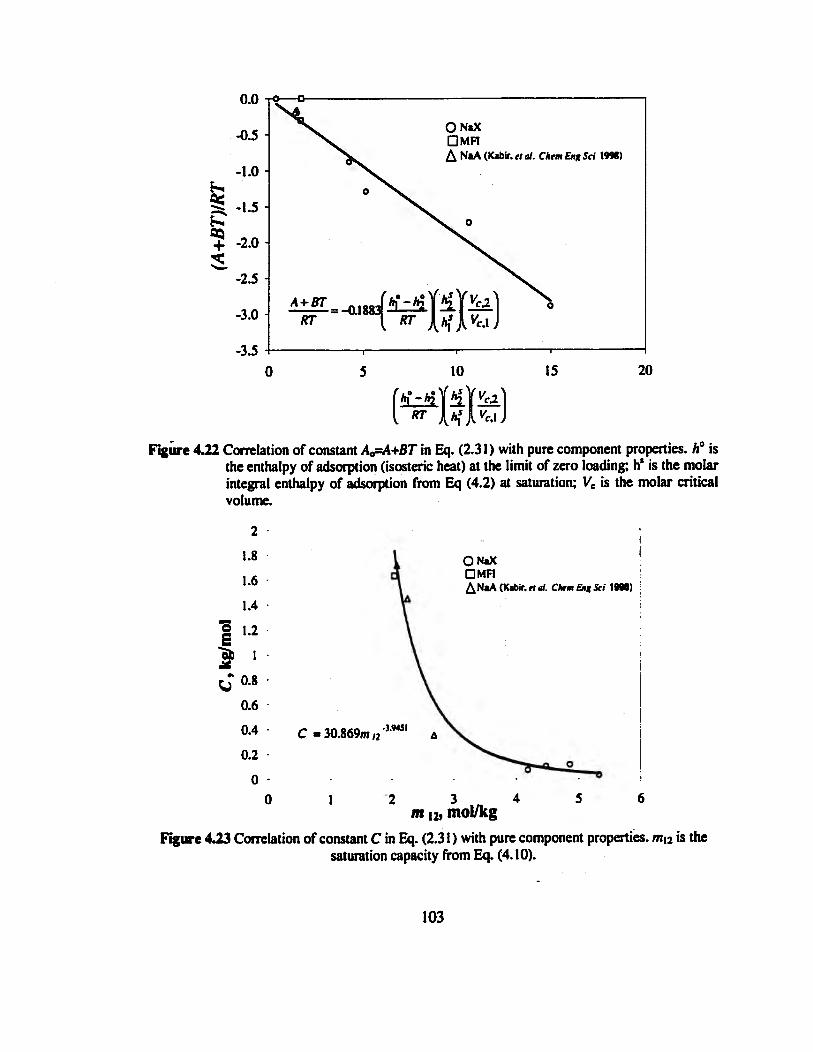
ONiX DMFI A NaA (Kibir. el al. Chem Eng Sei I9M)
-2.5
-3.0
-3.5 íF-H^IíW
10 — i —
15 20
Figure 4.22 Correlation of constant A^A+BT in Eq. (2.31) with pure component properties. A0 is the enthalpy of adsorption (isosteric heat) at the limit of zero loading; h* is the molar integral enthalpy of adsorption from Eq (4.2) at saturation; Ve is the molar critical volume.
2
1.8
1.6
1.4
1 1.2 E
2> « J 0.8
0.6
0.4
0.2
0
ONiX DMFI A NaA (K»bir. n at. Cktm Eng Sei 19M)
C -30.869m, -3.943I
m n, mol/kg Figure 423 Correlation of constant C in Eq. (2.31 ) with pure component properties. mi2 is the
saturation capacity from Eq. (4.10).
103
4.5 Conclusion
Isothermal measurements of adsorption equilibria and heats of adsorption describe the
equilibrium behavior of mixtures as a function of temperature, pressure, and composition.
Previous models of mixture adsorption were limited to isothermal systems; mixture en-
thalpies (heats) allows the effect of temperature to be introduced into the phase equilib-
rium calculations in a systematic way.
The model for the excess chemical potential in Eq. (2.31), along with single-component
isotherms and enthalpies, provides a complete thermodynamic description of mixture ad-
sorption. The sensitivity of mixture calculations to the accuracy of the single-gas meas-
urements cannot be over-emphasized.
An experiment on ternary adsorption indicates that the experimental data can be predicted
within the accuracy of the experiment from data for the constituent binary systems.
A correlation between the binary interaction parameters in Eq. (2.31) and pure compo-
nent properties is presented. This correlation is intended for predicting multicomponent
adsorption from single-gas adsorption isotherms and enthalpies (heats) of adsorption. The
correlation, which accounts for entropie effects and energetic heterogeneity induced by
differences in polarity, represents a major improvement over the theory of ideal adsorbed
solutions (IAS).
104
Chapters
Molecular Simulation of Mixture Adsorption
Molecular simulations, which are now an established tool in many branches of science,
rely on the use of high-speed computers to represent dynamic or equilibrium behavior of
a physical system. A molecular simulation computes the behavior of particles that inter-
act according to a specific potential. Although the number of molecules in the simulation
box is about 20 orders of magnitude smaller than in any macroscopic system, these small
systems can usually mimic macroscopic properties.
The results of computer simulations are compared with those of real experiments to test
the underlying potential model. If the model is a good one, the simulation results can be
used to make predictions for systems which are difficult to measure experimentally. The
accuracy of predictions obtained with molecular simulations is closely linked to the abil-
ity of reproducing experimentally measured properties when available. Simulations that
use an unrealistic description of the system studied will lead to incorrect predictions.
During the last ten years, there has been an increasing interest on mixture adsorption
simulation. Simulations in idealized geometries such as slits, cylindrical and spherical
pores have shown the importance of the solid geometry, molecular structure, as well as
105
packing effects [Keffer et al. 1996, and Nicholson and Gubbins 1996]. Curry and Cush-
man (1995) showed that the structure of the solid becomes irrelevant above twice the
collision diameter of the adsorbates when the atoms of the surface are smaller than the
adsorbates, but if the atoms in the surface are larger than the adsórbate, the effect is ex-
tended above three times the collision diameter. Then, for adsorption of small molecules
in tight pores, such as those found in zeolites, the detailed structure of the material may
play an important role.
Molecular simulations of mixture adsorption on zeolite-type materials have attracted con-
siderable attention because of the many industrial applications of zeolites. Karavias and
Myers (1991), Dunne and Myers (1994), and Dunne et al. (1996) used a spherical pore
decorated with cations to represent NaX type zeolite and studied mixtures of polar and
non-polar adsorbates as well as different size adsorbates. Negative deviation from ideal
behavior were observed as a result of packing effects and in mixtures of polar and non-
polar adsorbates due to the difference in ion-adsorbate interactions. Maddox and Rowlin-
son (1993) studied a mixture of methane and nitrogen on Y-type zeolite. Razmus and
Hall (1991) studied mixtures of nitrogen and oxygen on 5A-type zeolite. Van Tassel, et
al. also studied 5A-type zeolites but concentrated their work on spherical, non-polar
molecules.
Mixture adsorption on silicalite has been studied by different research groups in order to
concentrate on dispersion interactions, ignoring coulombic interactions [Heuchel, et al.
106
1997; Clark, et al. 1998; Czaplewski and Snurr, 1999, Macedonia and Maginn, 1999; Du,
et al. 1998; Vlugt, et al. 1999; Gergkiis and Theoeorou, 1999]. Adsorption simulation for
a mixture of SF6 and CH4 on silicalite is used in this work to illustrate our ability to re-
produce experimental results measured with the mixture calorimeter using only pure
component properties to obtain interaction parameters. A brief review of the fundamental
concepts necessary for the simulation is also included.
5.1 Statistical mechanics
Macroscopic properties of the system are completely defined by the few variables char-
acterizing the thermodynamic state such as the number of particles, the temperature and
the pressure, not by the very many atomic positions and momenta that define the instan-
taneous mechanical state of the system.
From a microscopic perspective, there is an enormous number of states consistent with
fixed macroscopic properties. The value of a thermodynamic property can be calculated
by taking averages from the microscopic systems that are consistent with some given
macroscopic properties.
The microscopic state of a system may be specified in terms of the positions and mo-
menta of all its constituents. Assuming that a classical description is adequate, we may
write the Hamiltonian ¿fofa system of N molecules as the sum of kinetic and potential
energy of the set of coordinates q, and momenta p, of each molecule i: 107
;nq,p)=^(p)+2-lq) (5.1)
The generalized coordinates q may be the set of Cartesian coordinates r¡ of each atom in
the system, or include also the molecular orientations (Q<).
The concept of an ensemble, introduced by Gibbs, is useful to understand the relation
between microscopic and macroscopic properties. An ensemble is a collection of a very
large number of systems, each constructed to conform with the desired macroscopic
thermodynamic properties [McQuarrie, 1976]. Each state is represented an equal number
of times according to the principle of equal a priori probabilities. Then a macroscopic
property .»'corresponds to the ensemble average.
The ergodic hypothesis states that a large number of observations made on a single sys-
tem at different times have the same statistical properties as observing N arbitrarily cho-
sen systems at the same time from an ensemble of similar systems.
*** = (ensemble » Wtime <5-2>
108
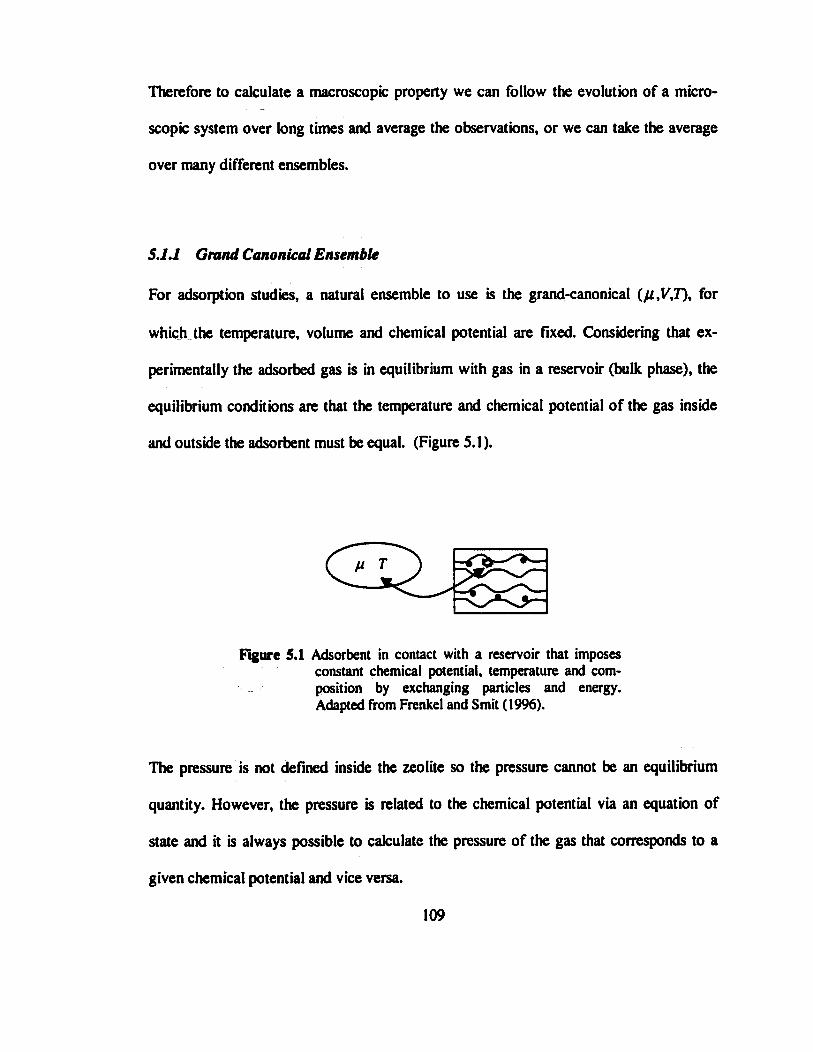
Therefore to calculate a macroscopic property we can follow the evolution of a micro-
scopic system over long times and average the observations, or we can take the average
over many different ensembles.
5.1.1 Grand Canonical Ensemble
For adsorption studies, a natural ensemble to use is the grand-canonical (ß,V,T), for
which the temperature, volume and chemical potential are fixed. Considering that ex-
perimentally the adsorbed gas is in equilibrium with gas in a reservoir (bulk phase), the
equilibrium conditions are that the temperature and chemical potential of the gas inside
and outside the adsorbent must be equal. (Figure 5.1 ).
Figure 5.1 Adsorbent in contact with a reservoir that imposes constant chemical potential, temperature and com-position by exchanging particles and energy. Adapted from Frenkel and Smit (1996).
The pressure is not defined inside the zeolite so the pressure cannot be an equilibrium
quantity. However, the pressure is related to the chemical potential via an equation of
state and it is always possible to calculate the pressure of the gas that corresponds to a
given chemical potential and vice versa.
109

The statistical mechanical derivation for this ensemble can be found elsewhere [McQuar-
rie, 1976]. Average macroscopk: properties can be calculated using the following formu-
las for energy and average number of adsórbate molecules:
c r C K . Ä T O - r l l ^ i ^ k " ^ ^ - ^ (5-3) - N j
N(V,ß,r) = ^lN(V)e-^V)e-^ * N j
where the grand canonical partition function is:
N j N
H kT
' kT
If we denote q the canonical partition function of a single molecule, for a system of N in-
distinguishable non-interacting particles, the partition function Q is:
(5.4)
(5.5)
(5.6)
(5.7)
110
Q = Ç (5.8)
where q is only a function of temperature. For monatomic molecules, q is simply the
translational partition function. Then the probability p for the system to be in energy
state y and have N molecules is:
H S N\
5.12 Monte Carlo Simulation
Monte Carlo (MC) simulations are based on the notion of averaging over ensembles. In
MC simulations an appropriate ensemble is choose and physical quantities are evaluated
in this ensemble. Allen and Tildesley (1987) Frenkel and Smit (1996) give an excellent
description of molecular simulation methods.
A general Monte Carlo algorithm consists on the following steps [Allen and Tildesley,
1987; Frenkel and Smit, 1996]:
1. Specify an initial state, m, (a point in the phase space of the system studied).
2. Starting from a state m generate randomly a new state n.
3. Evaluate the transition probability %m defined in such a way that assures microscopic
reversibility:
111

nmnPm=nnmPn (5-10)
where p is the probability to attain a given state, and iZmn is the transition probability.
4. Generate a random number 4 such that 0 £ Ç £ 1
5. If Kmn < % then remain in the old state m and go to (2)
6. If TT«« > % then accept the new state n and go to (2)
The steps (5) and (6) correspond to making the transition m-*n with the probability TW
In the Metropolis algorithm, TU, is defined as:
Xmn = C*nmPn/Pm when prt/pm < 1 *mn = <*mn when /?„//>/* £ 1 (5.11) T m / i ^ - Z * ™ whenm = /i
m*/i
where ûny, are elements of a symmetric matrix called the underlying matrix of the
Markov chain. It is easy to show that if the amn are positive real numbers, microscopic
reversibility holds. For example, take the case where pn/pm < 1 :
nmn-amnPn/Pm (5.12)
and Eq. (5.11) becomes:
{<*mnPn/Pm)Pm = *nmPn (5-13)
112
since a^ = a ^ , , Eq. (5.13) gives:
&mnPn ~ ^mnPn
Bias sampling techniques use non-symmetrical transition matrices, which require differ-
ent definitions for the acceptance probability in order to satisfy microscopic reversibility.
*mn ~ <*mn{anmPnlamnPm) w h e n <*nmPnl*mnPm < l
Xmn = <*mn w h e n <*nmPnl<XmnPm * 1 (5-14) T m / i ^ - S * ' « / ! when m =/i
The ratio (Qnm/cimn ) can be, for example, the ratio of accessible volume to total volume
in the simulation box, as described in section 5.3.
In any MC study, the system must be allowed to relax first since the starting configura-
tion may not correspond to thermodynamic equilibrium. Thermodynamic properties that
are calculated from averaging over many ensembles start after the system has reached
equilibrium.
5.13 Grand Canonical Monte Carlo
As mentioned before, in the grand canonical ensemble, the independent variables are the
temperature, volume and chemical potential of the species in the system. The grand ca-
113
nonical Monte Carlo (GCMC) simulation is commonly used in adsorption because speci-
fying the chemical potential allows us to have an imaginary bulk phase in equilibrium
with the adsorbed phase. This imaginary bulk phase acts as a reservoir imposing its tem-
perature and chemical potential while allowing the exchange of molecules between the
reservoir and the system. The advantage of having an imaginary bulk phase is that we can
concentrate on the behavior of the adsórbate inside the pores rather than at the interface.
Experimentally, the pressure is specified instead of the chemical potential of the system.
To compare the experimental data with simulation results it is necessary to determine the
pressure that corresponds to a given value of chemical potential and temperature of the
reservoir. In the limit of zero density, for a system consisting of non-interacting atoms,
the partition function reduces to the ideal gas partition function and the chemical poten-
tial is given by [Frenkel and Smit, 1996]:
fi = fi°(T)+kT\n(P) (5.15)
where M°(T) is the chemical potential in the reference state and it depends only on the
temperature [Hill, 1986].
The general procedure for a GCMC simulation using a non-biased sampling is summa-
rized in Figure 5.2.
A random decision is made to choose one of the components in the mixture (for pure
components this step does not exist). Then a random decision is made to choose a type of 114
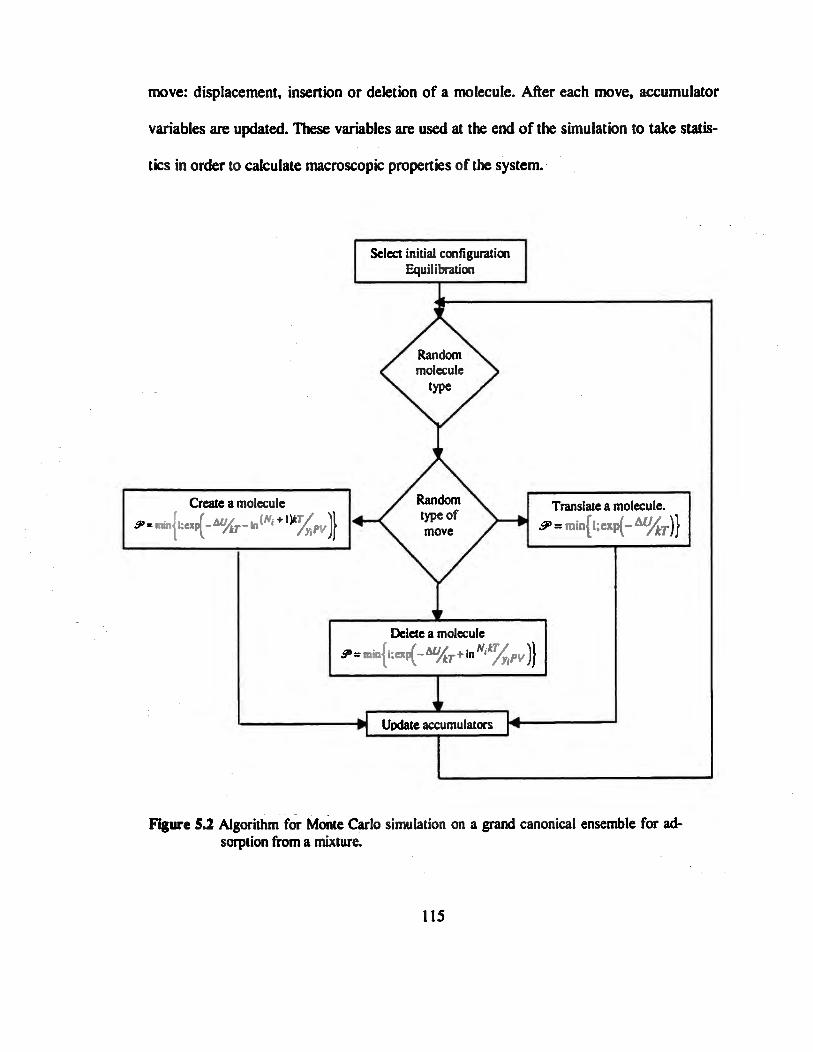
move: displacement, insertion or deletion of a molecule. After each move, accumulator
variables are updated. These variables are used at the end of the simulation to take statis-
tics in order to calculate macroscopic properties of the system.
Create a molecule 5»* mill' i n j u e x ^ - l n W ^ }
Select initial configuration Equilibration
Random molecule
type
Random type of move
Translate a molecule. .^ = min{l;exp(-A%.)}
Delete a molecule *=m¡n{.:exp(-a%.+.n"%,v)}
I £ Update accumulators
Figure 5.2 Algorithm for Monte Carlo simulation on a grand canonical ensemble for ad-sorption from a mixture.
115
In the case of biased sampling, the probability for creating or destroying a molecule
needs to be corrected by a factor ( a ^ / a^, ).
Among the macroscopic properties of interest for adsorption are the amount adsorbed of
each component and the enthalpy of adsorption (isosteric heat). The isosteric heat of ad-
sorption is defined as a difference of partial molar properties of the adsorbed and bulk
phases (Chapter 2). The isosteric heat of component i is:
aaj - - + RT + hR (5.16)
where hR is the departure difference between the partial molar enthalpy and the molar gas
enthalpy in the bulk phase. In principle, the partial derivative needed to calculate the iso-
steric heat could be obtained from differentiation of the isotherms for pure components.
This procedure is impractical for mixtures because the amounts adsorbed of each compo-
nent are not independent variables in a GCMC simulation; the independent variables are
the temperature and chemical potentials.
The partial derivative can be calculated from fluctuations in the grand canonical ensem-
ble. If we express the partial derivative from Eq. (5.16) as (Nicholson and Parsonage,
1982):
rBU\ =Y(_BU_) { BN i )
(5.17)
*/«l T.NM
116
Both derivatives in Eq. (5.17) can be expressed as fluctuations in the grand canonical en-
semble. The first term is:
t & L -i(u'Nt) (5-,8) where the notation f(X,Y)={XY)-{X){Y) stands for the fluctuation of any X-Y pair.
1\K(Bßf<iicßNi) derivatives are the solution of a linear algebraic system of the form:
FX = I (5.19)
where F=l/tAWVy)J and X={(BfiMk/BN¡)}, and I is the unity matrix. It follows that for
single gas adsorption, and considering the bulk phase an ideal gas:
'«-jum (5-20)
and for a binary mixture, the individual heats of adsorption are:
_ f{U,N2)f{Nx,N2)-f{U,Nx)f[N2,N2) ^ qs,tl m,Nl)f{W2)-f(N\.N2)f{N2>N\)
(5.21)
qa'2 m^fiN^N^-m^fiN^Ni)
117
5.1.4 Radial Distribution Function
The radial distribution function, g(r), characterizes the local structure of the system. The
radial distribution function for an ideal gas is unity and for any other system it can be
considered as the fractional deviation from the ideal gas approximation for the true two-
particle distribution function [Chandler, 1987].
The radial distribution function contains information about the structure of the system,
but it has not been used extensively to understand the structure of fluids confined in mi-
croporous materials. One of the difficulties is that the presence of the solid adsorbent
generates an anisotropic medium and the interpretation of g(r) becomes difficult. A two-
dimensional g(r) has been used to describe the structure of adsorbed fluids in slit pores
[Curry and Cushman, 1995; Shevade and Gubbins, 1999] or plane surfaces. Macedonia
and Maggin [1998] presented g(r) for adsorption of alkanes on silicalite, indicating that
long-range structure is observed in the adsórbate. Gergkiis and Theodorou (1999) calcu-
lated radial distribution functions for mixtures of methane and n-butane on silicalite to
show that methane tend to pack at the intersections as the loading of n-butane increases.
In a system of N particles in a volume V, the probability that each molecule i will be at r¡
is given by:
P(A/)(ri TN)dT^dTN^dTJ'"drN (5.22)
118

where Z/v is the configurational integral. The probability that a subset of n molecules will
be at some specific configuration, irrespective of the configuration of the remaining
molecules, is obtained by integrating Eq. (5.22) over the coordinates of molecules n+l
through N. In a system of N particles, the probability that any n molecules will be at r¡...
r„ is given by
(N-n)! ZN P{
because there are N choices for the first molecule, N-\ for the second, etc. For a fluid, the
probability of finding a molecule at dr/ is independent of r¡, and it is simply the density
of the fluid:
P = ¿Jp ( , ) ( r i )¿r ,=£ (5.24)
By definition, the radial distribution function is [McQuarrie, 1976]:
g<2)(rt,r2) = " ! He'UlkTdr^dTN (5.25)
In a liquid of spherically symmetric molecules, g(2)(r|,r2) depends only on the relative
distance between molecules 1 and 2. The standard notation is to write g(2)(n,r2) as g(r).
119
The probability of observing a second molecule in a volume dr given that there is a
molecule at the origin of r is given by pg(r).
An equivalent definition for the radial distribution function takes an ensemble averages
over pairs of molecules [Allen and Tildeley, 1984]:
g00 = - \ / ( / (5.26) P äV(r)
where N(r) is the number of molecules at a distance r taking as the origin any molecule
and dV(r) is the differential volume of a shell of radius r. Then g(r) is the deviation be-
tween the average local density at a distance r and the bulk density p.
In practice, a histogram is complied of all pair separations falling within each range Ar,
and replacing dV by the volume of a spherical shell of thickness Ar and radius r.
The radial distribution function provides information about the structure of the system,
because any property that is pair additive can be expressed in the form:
M - ( S S «w ) - Wo" «w»"** (5-27)
120
The gas-solid and gas-gas radial distribution functions can be used to calculate the en-
thalpy of adsorption. In practice a direct evaluation of these quantities is usually more
accurate. In this work fluid-fluid radial distribution functions of adsorbed species are
used to understand packing effects in the adsorbed phase.
5.2 Molecular Model
The success of a simulation rests on the realism of the model describing the intermolecu-
lar interactions of a physical system. In particular, in adsorption problems, these inter-
molecular interactions can be divided into two main groups of potentials:
a) Solid-fluid potentials, which describe the interactions between the adsorbent and the
adsórbate, and
b) Fluid-fluid potentials, which describe the interactions between the adsorbed mole-
cules.
The potentials may be based upon rigorous quantum mechanical theories and parameters
determined from ah initio calculations, or on empirical expressions with parameters ex-
tracted from experimental data such as Henry constants and heats of adsorption. In the
case of multicomponent systems, mixing rules are necessary to define the interactions
between different species.
121

533 Adsorbent-adsorbate interactions
Zeolites are porous crystalline aluminosilicates which have well defined pore sizes and
pore structures. Pores in zeolites can be straight-channels as in TON, interconnected
channels like in MFI, channels with side pockets like MOR, or cages connected by rela-
tively small windows like FAU.
Different approximations have been used to describe the interactions between the zeolite
framework and the adsórbate; from an idealized geometry such as a spherical cavity for
FAU [Soto and Myers, 1981; Karavias and Myers 1991; Woods et al. 1988; Woods and
Rowlinson, 1989; Dunne and Myers, 1994] or LTA [Stroud, et al. 1976] type zeolites,
and cylindrical pores for TON, MTW and UTD-1 [Savitz, et al. 1998], to models that in-
clude all atoms and consider flexible frameworks [Faux, 1998 and 1999; Fritzsche, et al.
1998.
Simpler models for zeolite structure allow faster simulations, although obviously more
detailed models will produce more realistic results. A compromise between a very de-
tailed description of the zeolite and calculation speed is a necessity.
The crystal lattice of silicalite contains no aluminum atoms; the unit cell composition is
S ¡960192. The lattice parameters for the silicalite unit cell have been determined by Olson
et al. (1981) from X-ray diffraction studies and are reported as 20.07, 19.92, and 13.42 Â
in the Pnma space group (orthorhombic). Silicalite contains interconnected pores that are
122

slightly elliptical in cross section and about 5.5 Â in diameter. One set of pores directed
along the [010] axis follows a linear path through the crystal. A second set of pores fol-
lows a sinusoidal path, the average direction of which is along the [100] axis. For the
simulation, it was assumed that the silicalite crystal has a perfect lattice with all frame-
work atoms rigidly fixed in space at the positions determined by Olson et al. (1981).
It was also assumed that the framework silicon atoms do not interact significantly with
the adsorbed molecules, as in the work of June, et al. (1990). This assumption is justified
because the silicon atoms are located at the centers of the SK>4 tetrahedra (Figure 5.3) and
are not in direct contact with the adsorbed molecules.
Figure S3 Representation of the Si04 tetrahedra.
V
123
Considering only dispersion interactions, the zeolite-adsorbate interaction energy is the
sum of the interaction energies between an adsórbate (A) and the oxygen atoms in the
zeolite framework:
No
I« I
£ZA riA J
'2 f £ZA VriA J
61
Nof . \ 1 2 No
i=\\riAJ ,=|
Nof j \6
KriAj
(5.28)
Efficient methods are needed to estimate these summations. It is not practical to perform
a summation over ail the oxygen atoms in the simulation box every time an adsórbate
molecule changes its position. Considering that the positions of all oxygen atoms are
known and assumed to be fixed, it is convenient to use a three dimensional grid contain-
ing the summations in Eq. (5.28) [Li and Talu, 1993; June, et al. 1990]. These summa-
tions are done only once prior to the calculation of any thermodynamic property. The
potential energy at any point can be interpolated from the eight nodes surrounding it. The
smaller the separation between the nodes of the grid, the more valid it is to use a linear
interpolation, but small node separations require large amounts of memory. A separation
of approximately 0.1 A and linear interpolations were used in this work. June, et al.
(1990) used separations of 0.2 À between nodes and interpolation was performed using a
three dimensional cubic spline.
124
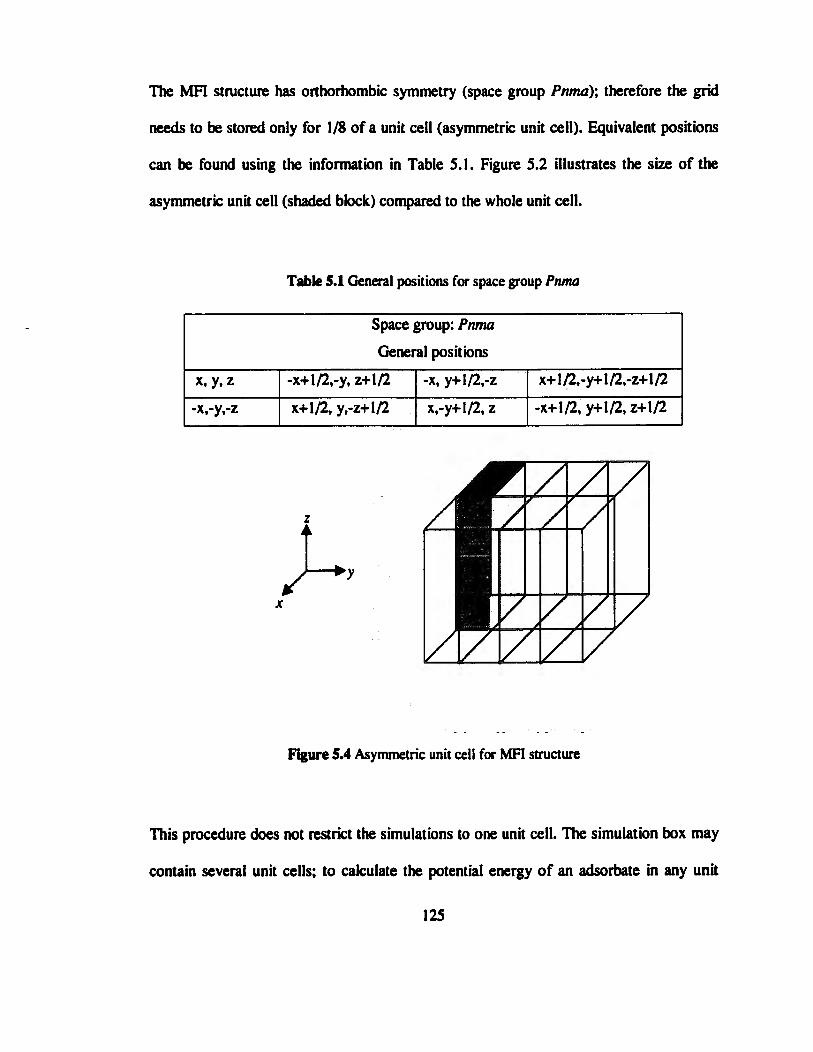
The MFI structure has orthorhombic symmetry (space group Pnma); therefore the grid
needs to be stored only for 1/8 of a unit cell (asymmetric unit cell). Equivalent positions
can be found using the information in Table 5.1. Figure 5.2 illustrates the size of the
asymmetric unit cell (shaded block) compared to the whole unit cell.
Table 5.1 General positions for space group Pnma
Space group: Pnma
General positions
x, y.z
-x,-y,-z
-x+l/2,-y, z+1/2
x+1/2, y,-z+l/2
-x, y+l/2,-z
x,-y+l/2, z
x+l/2,-y+l/2,-z+l/2
-x+1/2, y+1/2, z+1/2
AW/ • / /
w/ V//
/ / • /
/ ' /
Figure 5.4 Asymmetric unit cell for MFI structure
This procedure does not restrict the simulations to one unit cell. The simulation box may
contain several unit cells; to calculate the potential energy of an adsórbate in any unit
125

cell, the position is "mapped" to the "first" unit cell. Then the zeolite-adsorbate interac-
tion energy is calculated as if the molecule was in the "first" unit cell.
It is not necessary to tabulate every point for a three dimensional grid in the asymmetric
unit cell. Assuming a hard core for the oxygen atoms (diameter = 1.9 À), only the points
that do not overlap with this hard core are tabulated. This reduces by two thirds the mem-
ory requirements from approximately 600,000 nodes to less than 200,000.
For the interpolations near the edge of the asymmetric unit cell, it is convenient to include
one shell of nodes outside the asymmetric unit cell, as illustrated in Figure 5.5. Care must
be taken not to include the nodes in this shell for the calculation of zero coverage proper-
ties or to attempt insertions.
*
Figure 5.5 Representation of a two dimensional grid for nodes where the summations to calculate the energy are stored. (*) represents a point where nodes outside the asymmetric unit cell would be needed to inter-polate the zeolite-adsorbate interaction energy.
Once the grid is generated, the interaction parameters (£ZA>°ZA) m ^4* (5.28) are ob-
tained by fitting the pure component isotherm and heats of adsorption. Talu and Myers
126
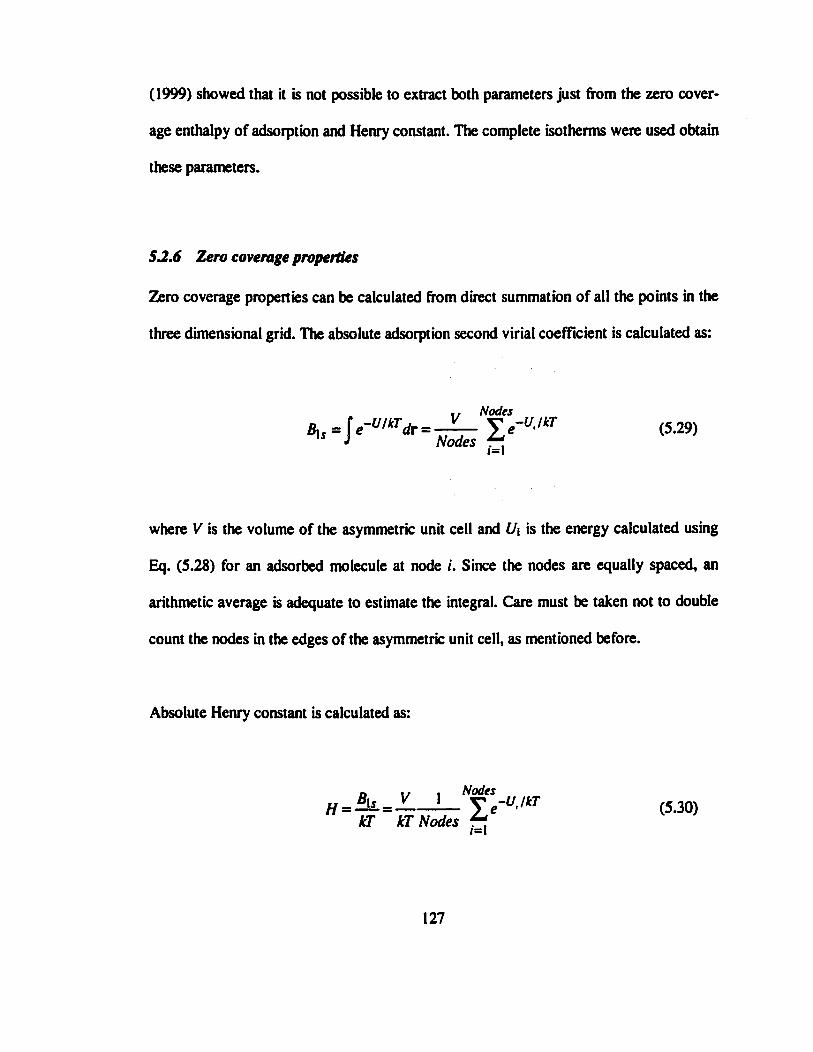
(1999) showed that it is not possible to extract both parameters just from the zero cover-
age enthalpy of adsorption and Henry constant. The complete isotherms were used obtain
these parameters.
52.6 Zero coverage properties
Zero coverage properties can be calculated from direct summation of all the points in the
three dimensional grid. The absolute adsorption second virial coefficient is calculated as:
. . Nodes Bi, = fe-u'k Tdr = - ? - Te-u>lkT (5.29)
" ¡ Nodes ?*. i=l
where V is the volume of the asymmetric unit cell and U\ is the energy calculated using
Eq. (5.28) for an adsorbed molecule at node /*. Since the nodes are equally spaced, an
arithmetic average is adequate to estimate the integral. Care must be taken not to double
count the nodes in the edges of the asymmetric unit cell, as mentioned before.
Absolute Henry constant is calculated as:
„ „ . Nodes
H=*is.=X.-L- Ye-v,«T (5J0) kT kT Nodes . ,
127

Gibbs surface excess Henry constant is given by:
De ,, . Nodes He = B^=V__J_ X\e-U-/kT-l (5.31)
VT LT MnJa* ¿* 1=1
For strongly adsorbed gases, the difference between H and ff is negligible but for light
adsorbed gases such as argon on silicalite or methane on siliceous faujasite, a small dif-
ference exists between absolute and Gibbs surface excess properties.
It is important not to confuse Gibbs surface excess properties with mixture excess prop-
erties. Experimental variables are always Gibbs surface excess (Talu and Myers, 1999),
regardless if the adsorbed phase is a pure component, an ideal or non-ideal mixture.
Mixture excess is the difference in a given property (such as enthalpy, or entropy) when
compared to an ideal solution.
Absolute and surface excess enthalpies of adsorption can be define using absolute and
excess Henry constants:
Nodes t t
Ul-U,lkT *p_=¿lniU--L=L_Í (5.32) R d(MT) N^e-UilkT
/=!
128
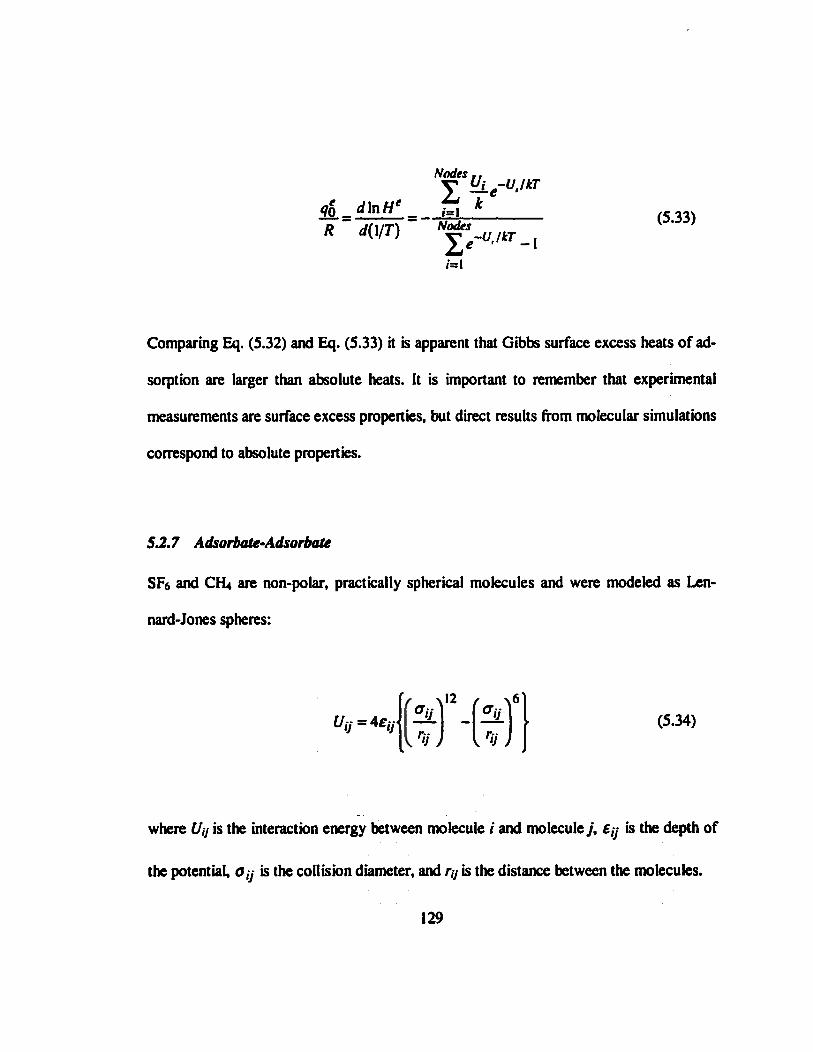
Nodes
qp =d\tlHe =
R d(l/T) i=\
Uj_e-U,lkT k
Nodes ¿ « " " • ' " • - I i=l
(5.33)
Comparing Eq. (S.32) and Eq. (5.33) it is apparent that Gibbs surface excess heats of ad-
sorption are larger than absolute heats. It is important to remember that experimental
measurements are surface excess properties, but direct results from molecular simulations
correspond to absolute properties.
52.7 Adsorbate-Adsorbate
SF6 and CH* are non-polar, practically spherical molecules and were modeled as Len-
nard-Jones spheres:
U¡j=4eir \rÜJ
12
\rü J (5.34)
where (/¡j is the interaction energy between molecule / and molecule j , £¡¡ is the depth of
the potential, a y is the collision diameter, and r¡¡ is the distance between the molecules.
129
The parameters e¡¡ and a ¡¡wert obtained from fitting the gas second virial coefficient for
the pure components. In the case of methane, the Lennard-Jones potential describes the
second virial coefficient over a broad range of temperatures (Figure 5.6).
Using the Lennard-Jones potential for SF«, it is not possible to fit the second virial coeffi-
cient as well as for methane (Figure S.7). A better description for the potential energy is
needed to describe the gas second virial coefficient for SF¿ over a broad range of tem-
peratures.
More importantly, the best fit to the gas second virial coefficient experimental data for
SFs gives collision diameter that are too large and therefore yield the incorrect saturation
capacity. Table 5.2 contains the parameters for SF* and CH4 used for calculating the ad-
sorbate-adsorbate interactions, as well as other parameters available in the literature.
Critical volumes for SFs and Ar are 198.8 and 74.9 cm3/mol respectively. Considering
that the ratio of collision diameters should be proportional to the ratio of the cube roots of
the ratio of critical volumes (1.38), and taking 3.4 Â [Talu and Myers, 1999] as the colli-
sion diameter for Ar, the collision diameter of SFô should be 4.7 A. Then a collision di-
ameter of 4.9 À is reasonable.
130

Table 52 Lennard-Jones parameters for adsorbate-adsorbate interactions
SFs-SFs
£ * K
252.4
180.9
200.9
222.1
(T.À
4.90
6.07
5.51
5.13
Reference
This work
Best fit to experimental B
Hirshfelder, et al. 1965
Rtid,etal. 1987
CH4-CH4 151.2
148.0
3.74
3.73
This work
Hirshfelder, et al. 1965
D Dymond & Smith, 1980 — Hirschfelder, 1965 A Michels, 1936 x This work J
ISO 200 250 300 350 400 450 Temperature
Figure 5.6 Second virial coefficient for methane.
131
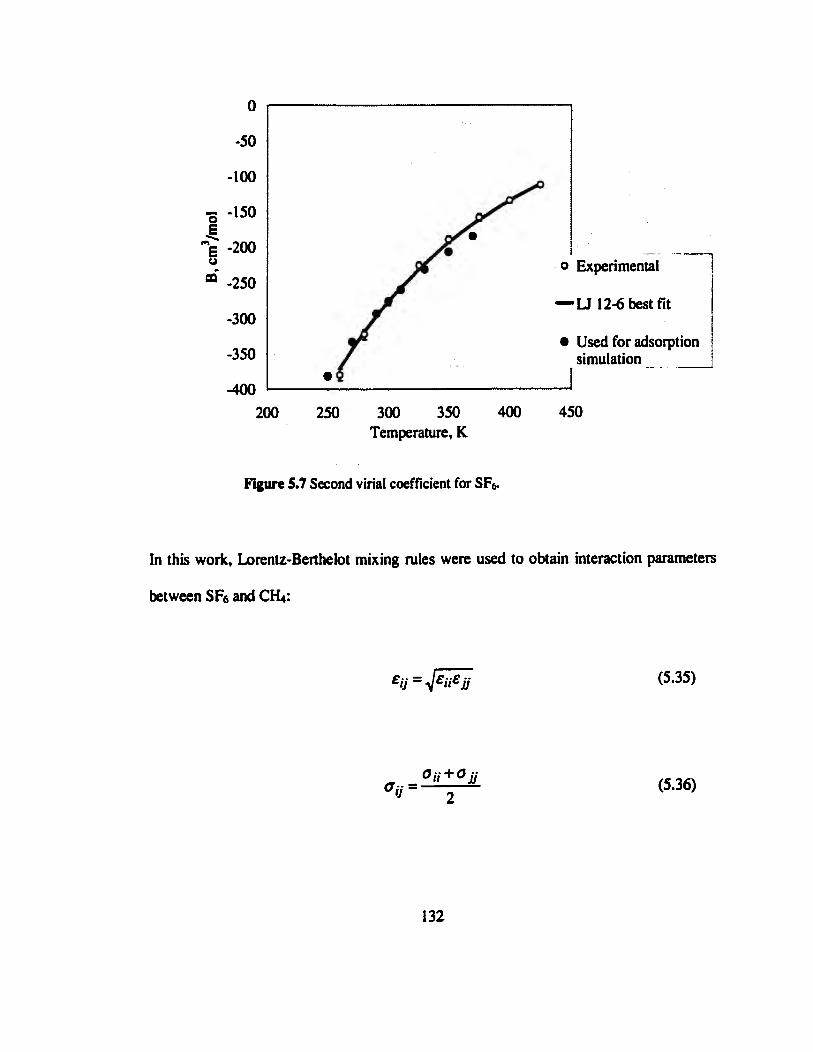
o -50
-100
•S -150 .E
~E -200
" -250
-300
-350
-400 200 250 300 350 400
Temperature, K
o Experimental
— U 12-6 best fit
• Used for adsorption simulation
450
Figure 5.7 Second virial coefficient for SF*
In this work, Lorentz-Berthelot mixing rules were used to obtain interaction parameters
between SFe and QL:
eiJ * 4£i,eü (5.35)
er °»+0IÍ aa—n—
(5.36)
132
5.3 Simulation method
The algorithm used for the simulation of Lennard-Jones molecules in silicalite is similar
to the one used by Talu and Myers [1999].
No molecules were placed inside the zeolite pore network at the start of a run for the
lowest pressure calculated. All the following calculations were started with the final con-
figuration of the previous calculation. The first 10% of the cycles were discarded to allow
the system reach equilibrium before taking statistics. Each simulation was divided into
ten blocks and it was assumed that the system has reached equilibrium if the results of the
first block are within the standard deviation of the results from the following blocks.
Displacements were handled using the normal Metropolis method. The maximum al-
lowed displacement was adjusted during the simulation to give an average acceptance
ratio of 50% for the attempted moves. Typical displacements were of the order of 0.5 A.
The procedure to insert a molecule was similar to the one used by Macedonia and
Maginn (1999). As described in Section 5.2.1, the zeolite cell was discretized into small
cubes having a volume of approximately 0.001 Â3. A potential energy can be assigned to
each cube by placing a probe atom in the center of the cube and computing the energy of
the probe. Using this potential energy, the cubes are grouped into regions that have
roughly the same potential. In this work, only two regions were considered: the ones
where there is overlap with the zeolite framework and therefore the potential energy is
133
infinite, and the region corresponding to the pore network. No attempts to insert a mole-
cule were made where there is overlap with the zeolite framework; instead a cube y that
belongs to the pore network (or node from the grid) was selected at random. The prob-
ability of selecting this cube (or node) is \/N¡, where N¡ is the number of nodes in the
asymmetric unit cell (not counting the shell outside the asymmetric unit cell). Finally a
position r within this cube is selected at random, with associated probability dV/V*, where
dV isa. differential volume associated with the molecule being inserted and Ve is the vol-
ume of the cube. One can then write the total probability of attempting to place a mole-
cule at position r as:
1 dV ,_„_x a^T,V (5-37)
For the reverse move (deleting an atom), the associated probability is:
dV <*nm=y (5-38)
where V is the total volume of the system. The total volume of the system is required in
Eq. (5.38) because once a molecule is present in the system in state m, its location can be
anywhere in volume V. The ratio of attempt probabilities is:
134
\amnJ N¡VC V¡ (5.39)
where V is the volume of the asymmetric unit cell, N¡ is the number of nodes in the
asymmetric unit cell that do not overlap with the zeolite framework, and Ve is the volume
of a cube associated with each node, and V¡ is the "accessible" volume of in the zeolite.
This "accessible" volume is not necessarily the micropore volume, because an arbitrarily
small collision diameter of 1.9 Â was used as a hard core for the oxygen atoms. Most
likely, this "accessible" volume overestimates the micropore volume.
The probability to accept an insertion is given by:
^4H-A^- , n (" i + , ) '%^ (5.40)
and the probability for deletions is:
& - min> l ; ^ c x p ( - A % r + l „ ^ % w ) } (5.41)
135
With this methodology for insertions, care must be taken not to attempt insertions at the
nodes that form the outer shell of the asymmetric unit cell (Figure 5.5). This would imply
that the border of the asymmetric unit cell is sampled more often than the rest of the
simulation box. This methodology can be viewed as the simplest case of energy-biased
insertions [Snurr, etal. 1993]
Convergence problems may arise in a GCMC simulation particularly when the system
density is near that of a dense fluid. These problems arise from low acceptance ratios for
creation attempts. Mazei (1987) showed that liquid densities calculated by GCMC are
quite accurate even when the acceptance ratio for particle creation steps is as low as
0.1%. In this simulations the lowest acceptance ratio for insertions were of the order of
0.16% for SF6 and 1.5% for CH4.
The total number of cycles necessary to achieve an acceptable accuracy depends on the
density, the molecule simulated and the number of components. For pure components the
simulations used between 1.5-3 millions of cycles. For mixtures the simulations used 5
millions of cycles. A cycle consisted on one attempt to move a molecule, one attempted
insertion, and one attempted deletion.
Low-pressure results were tested with different sizes of simulation boxes to assure there
was at least one molecule present at all times.
136

5.4 Results and Discussion
5.4.1 Pure component
Single component zeolite-adsorbate interaction parameters were obtained by fitting the
isotherms and heats of adsorption (Figures 5.8 and 5.9). Table 5.3 contains the parame-
ters obtained from this fitting and parameters available in the literature for comparison.
10
1 -00
o E BÔ 0 . 1 -c
0.01
0.001 0.1
0*f> • a
/
o Experiment: SF6 • Simulation: SF6 o Experiment: CH4 • Simulation: CH4
1 „ 1 0 , „ 100 Pressure, kPa
1000
Figure 5.8 Single component isotherms. Experimental measurements (Appen-dix 1) are white symbols and simulation results are black symbols.
137

45
"3 40
S 35
30
J 25
à 20 73 •S S IS -a
ë 10
s s
0
co o o%
0 O o o o ,o o ft • • • • • f e »
0.5
o Experiment SF6 • Simulation: SFö • Simulation: CH4 a Experiment CH4
I 1.5 Loading, mol/kg
2.5
Figure 5.9 Single component heats of adsorption. Experimental measurements (Appendix 1) are white symbols and simulation results are black symbols.
Table S3 Zeolite-adsorbate interaction parameters
SFö-O
eßcK 118.7
147.21
(7,À
4.085
3.97
Reference
This work
Clark, et al. 1998
CH4-O
104.5
169.3
148.4
133.3
97.5
90.79
3.502
3.187
3.14
3.214
3.885
3.697
This work
Bezus, et al. 1974
Hufton, 1991
Goodbody, étal. 1991 Maginn, et al. 1993 Clark, étal. 1998
Demontis, et al. 1992
Smit, 1995
138
The wide range of parameters used to describe CH4-O interactions in zeolites is evidence
of the uncertainty in obtaining parameters to describe adsorbate-adsrobent interactions.
Talu and Myers (1999) showed that zero coverage properties (differential enthalpy of ad-
sorption and Henry's constant) are not enough to extract the two parameters for the Len-
nard-Jones potential. In this work, not only the zero coverage properties were used to
obtain the Lennard-Jones interaction parameters, but the whole isotherm and heats of ad-
sorption were used.
The microscopic distribution of the adsorbates in the pore network can be analyzed from
the simulation results. SFs adsorbs preferentially in the intersection of the straight and
sinusoidal channels (Figure 5.10), which agrees with results obtained by Clark, et al.
(1998) and Czaplewski and Snurr (1999). In contrast, methane adsorbs almost uniformly
in the channels (straight and sinusoidal) and the intersections. Black regions in Figure
5.10 correspond to sites in the silicalite pore network where there is a 90% probability to
find a given adsórbate, either SFs or CH4 at 298K at approximate loadings of 4 mole-
cules/unit cell. An interesting but unsurprising observation is that since SFs is a bigger
molecule, it is found practically in the center of the channels only, whereas CH4 can ex-
plore a wider section of the channels.
139
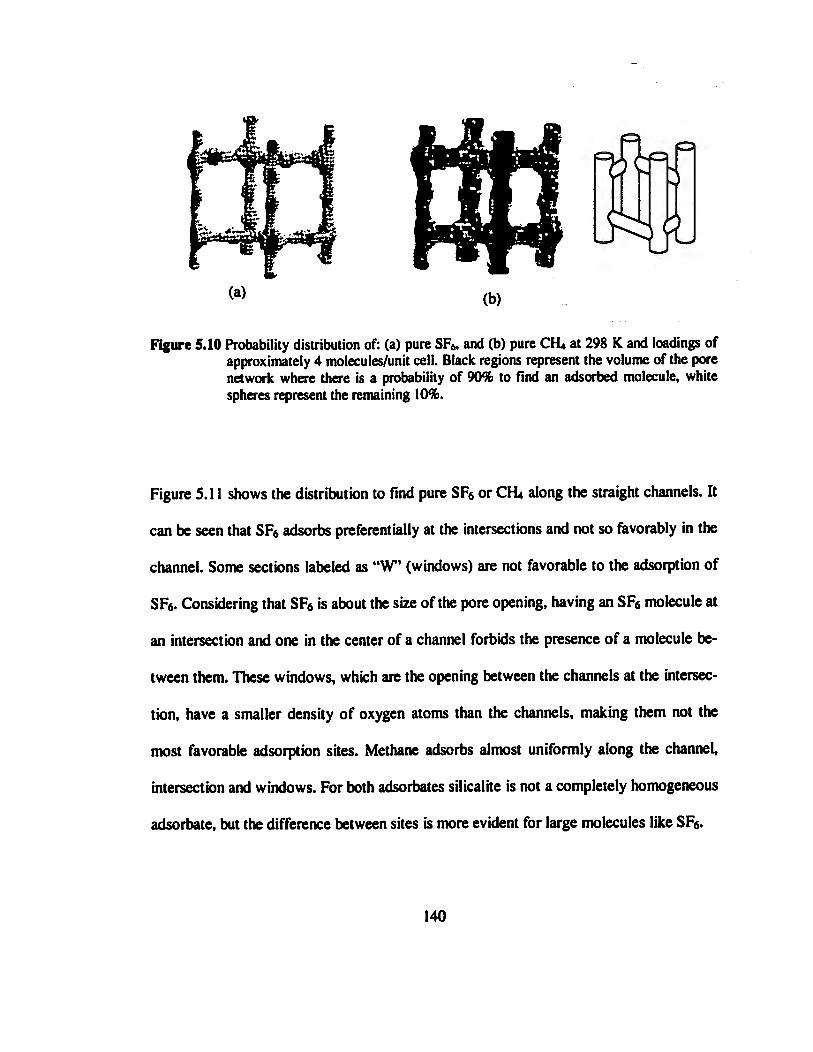
rwï ffffTf CS
*»*
Figure 5.10 Probability distribution of: (a) pure SFs, and (b) pure CrL at 298 K and loadings of approximately 4 molecules/unit cell. Black regions represent the volume of the pore network where there is a probability of 90% to find an adsorbed molecule, white spheres represent the remaining 10%.
Figure 5.11 shows the distribution to find pure SF6 or CH4 along the straight channels. It
can be seen that SF6 adsorbs preferentially at the intersections and not so favorably in the
channel. Some secttons labeled as "W" (windows) are not favorable to the adsorption of
SF6. Considering that SF6 is about the size of the pore opening, having an SF6 molecule at
an intersection and one in the center of a channel forbids the presence of a molecule be-
tween them. These windows, which are the opening between the channels at the intersec-
tion, have a smaller density of oxygen atoms than the channels, making them not the
most favorable adsorption sites. Methane adsorbs almost uniformly along the channel,
intersection and windows. For both adsorbates silicalite is not a completely homogeneous
adsórbate, but the difference between sites is more evident for large molecules like SFs.
140
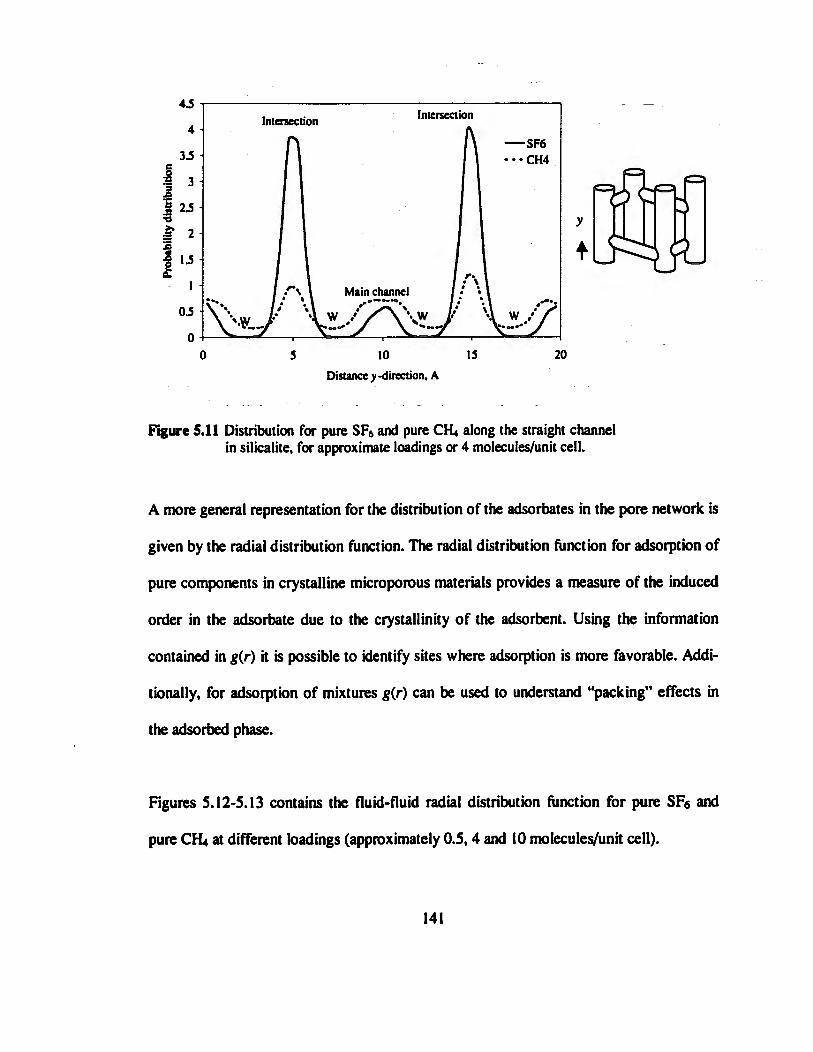
4.5 ••
4
35 • I" § 15-'•o í 2-
I
O5
O •• O
Figure 5.11 Distribution for pure SF6 and pure CR» along the straight channel in silicalite, for approximate loadings or 4 molecules/unit cell.
A more general representation for the distribution of the adsorbates in the pore network is
given by the radial distributton functton. The radial distribution functton for adsorption of
pure components in crystalline microporous materials provides a measure of the induced
order in the adsórbate due to the crystallinity of the adsorbent. Using the information
contained in g(r) it is possible to identify sites where adsorption is more favorable. Addi-
tionally, for adsorptton of mixtures g(r) can be used to understand "packing" effects in
the adsorbed phase.
Figures 5.12-5.13 contains the fluid-fluid radial distributton function for pure SFs and
pure CH4 at different loadings (approximately 0.5,4 and 10 molecules/unit cell).
141
Intersection Intersection SF6
• - C H 4
Main channel
S 5 10 15
Distance y -direction, A 20
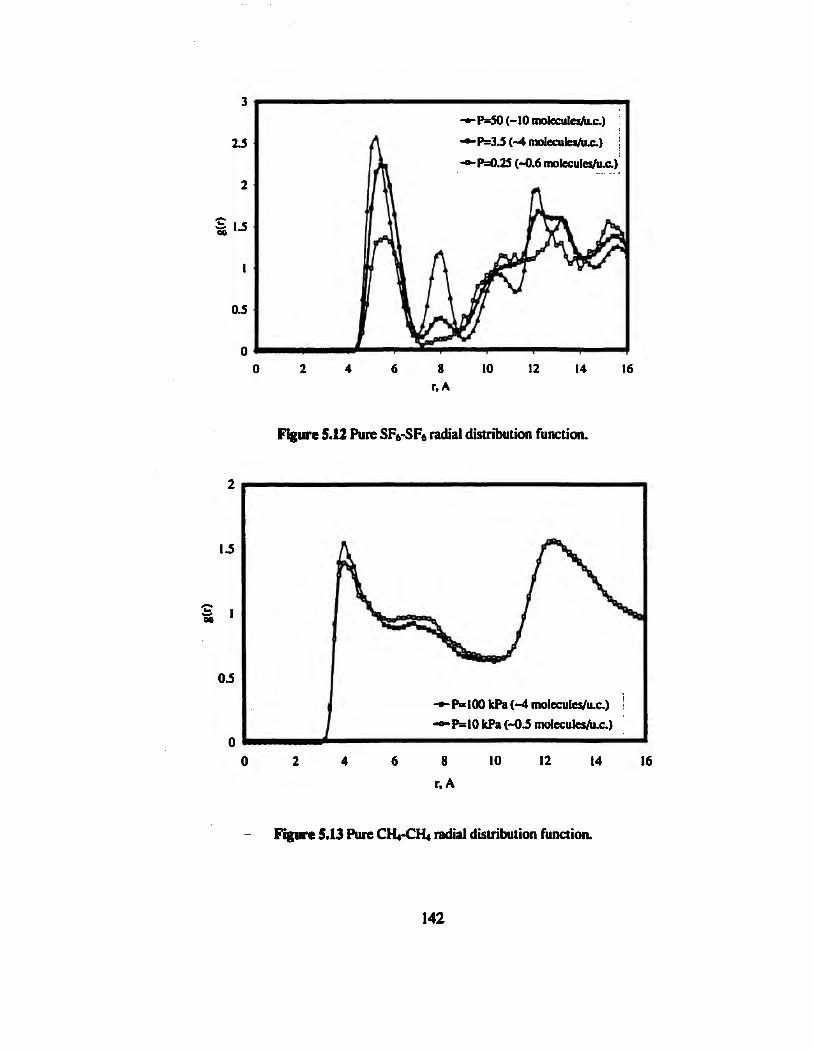
3
2J i
«»•5
I
0.5 1
0
-*-P=50 (-10 moleculestox.) •*- P=3 5 (~4 molecules/ux.) -o-P=0.25 (-0.6 molecules/u.c.)
Figure 5.12 Pure SF6-SF6 radial distribution function.
15
05
-*- P=100 kPa (-4 molecules/u.c.) -o- P= 10 kPa (-0.5 moiecuIes/u.c.)
8 r.A
10 12 14 16
Figure 5.13 Pure CH4-CH4 radial distribution function.
142
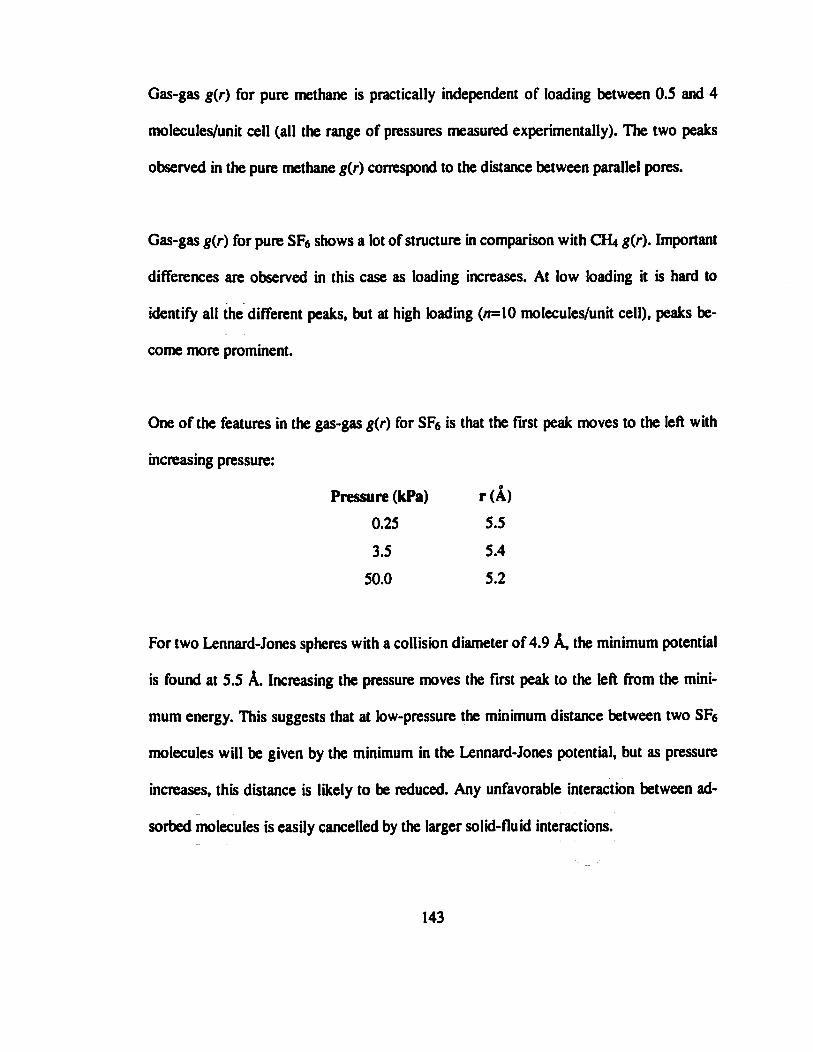
Gas-gas g(r) for pure methane is practically independent of loading between 0.5 and 4
molecules/unit cell (all the range of pressures measured experimentally). The two peaks
observed in the pure methane g(r) correspond to the distance between parallel pores.
Gas-gas g(r) for pure SF6 shows a lot of structure in comparison with CR» g(r). Important
differences are observed in this case as loading increases. At low loading it is hard to
identify all the different peaks, but at high loading («=10 molecules/unit cell), peaks be-
come more prominent.
One of the features in the gas-gas g(r) for SF6 is that the first peak moves to the left with
increasing pressure:
Pressure (kPa) r (Â)
0.25 5.5 3.5 5.4
50.0 5.2
For two Lennard-Jones spheres with a collision diameter of 4.9 A, the minimum potential
is found at 5.5 Â. Increasing the pressure moves the first peak to the left from the mini-
mum energy. This suggests that at low-pressure the minimum distance between two SFs
molecules will be given by the minimum in the Lennard-Jones potential, but as pressure
increases, this distance is likely to be reduced. Any unfavorable interaction between ad-
sorbed molecules is easily cancelled by the larger solid-fluid interactions.
143
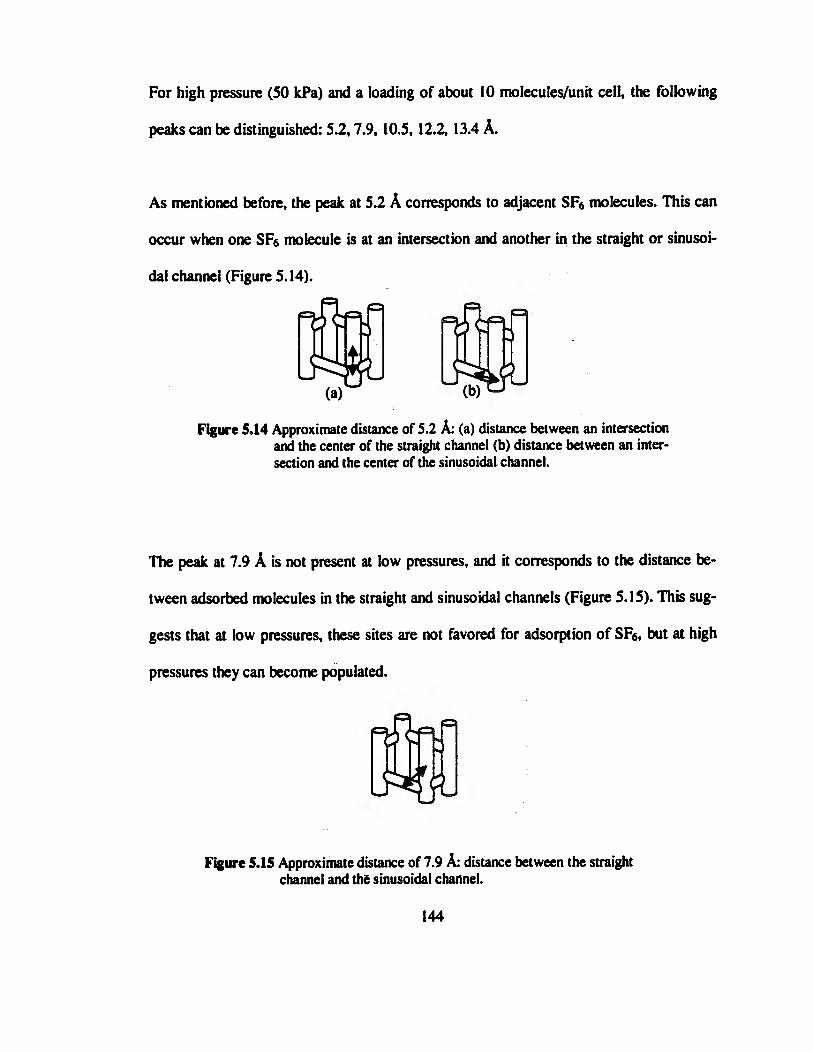
For high pressure (50 kPa) and a loading of about 10 molecules/unit cell, the following
peaks can be distinguished: 5.2,7.9,10.5,12.2,13.4 Â.
As menttoned before, the peak at 5.2 Â corresponds to adjacent SF6 molecules. This can
occur when one SF6 molecule is at an intersection and another in the straight or sinusoi-
dal channel (Figure 5.14).
(b) (a
Figure 5.14 Approximate distance of 5.2 Â: (a) distance between an intersection and the center of the straight channel (b) distance between an inter-section and the center of the sinusoidal channel.
The peak at 7.9 A is not present at low pressures, and it corresponds to the distance be-
tween adsorbed molecules in the straight and sinusoidal channels (Figure 5.15). This sug-
gests that at low pressures, these sites are not favored for adsorption of SFs, but at high
pressures they can become populated.
Figure 5.15 Approximate distance of 7.9 Â: distance between the straight channel and the sinusoidal channel.
144

Peaks at 10.5 Â and higher may be the result of various contributions. For example, two
intersections connected by a straight channel, or two secttons of a straight channel con-
nected by an intersection are at approximately 10.5 Â. Two sections of a sinusoidal chan-
nel separated by an intersection are also at approximately 10.5 Â (Figure 5.16).
(a) (b) (c)
Figure 5.16 Approximate distance of 10.5 Â: (a) distance between two intersections, (b) distance between two straight channel sections, (c) distance between two sinusoidal channels.
At an approximate distance of 12.2 A are large peaks both for SFs and CR». This corre-
sponds to the distance between parallel pores, as well as some other contributions.
(a) (b) W
Figure 5.17 Approximate distance of 12.2 A: (a) distance between straight and sinusoidal chan-nel, (b) between intersections of different straight channels, and (c) between two si-nusoidal channels.
145
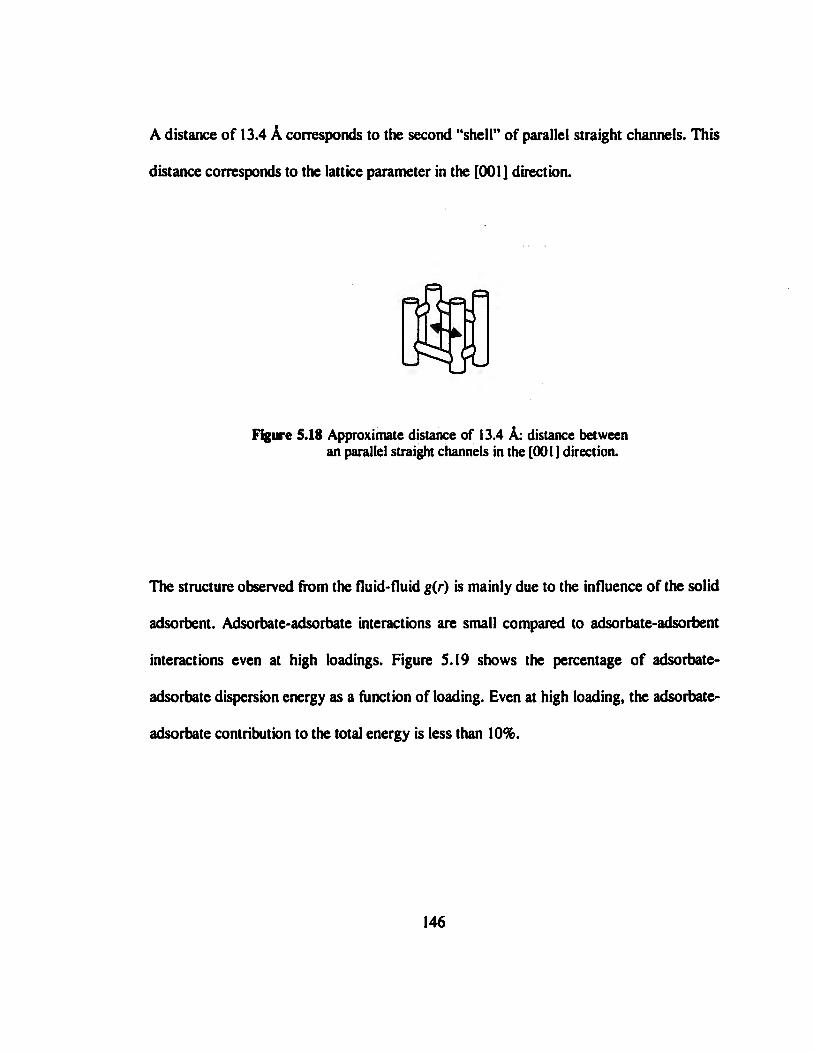
A distance of 13.4 A corresponds to the second "shell" of parallel straight channels. This
distance corresponds to the lattice parameter in the [001] direction.
Figure 5.18 Approximate distance of 13.4 A: distance between an parallel straight channels in the [001 ] direction.
The structure observed from the fluid-fluid g(r) is mainly due to the influence of the solid
adsorbent. Adsorbate-adsorbate interactions are small compared to adsorbate-adsorbent
interactions even at high loadings. Figure 5.19 shows the percentage of adsorbate-
adsorbate dispersion energy as a function of loading. Even at high loading, the adsorbate-
adsorbate contribution to the total energy is less than 10%.
146

cd •Ê 3 •o < • o ea •e •o <
8 7
£6 >» S?5 Ë
e 3 CA ¿
•o 1 0
Figure 5.19 Dispersion energy contribution for pure components
5.42 Binary Mixture
Binary mixtures were simulated using the procedure for pure components. One objective
was to test our ability to predict mixture adsorption from pure component isotherms. For
the SF6-CH4 mixture on silicalite, the system can be represented by only dispersion ener-
gies. From the pure component simulations we observed that the adsorbate-adsorbate in-
teractions are small compared to the adsorbent-adsorbate interactions. Even for fluids
with strong interactions in the bulk phase, as water and methanol, the fluid-fluid interac-
tions in micropores become less important due to confinement [Shevade, et al. 1999].
Therefore the hypothesis is that the correct adsorbent-adsorbate interactton parameters for
pure components allow mixture adsorptton to be predicted.
147
SF6
CIL
1 1
0 2 4 6 8 10
Loading, molecules/unit cell
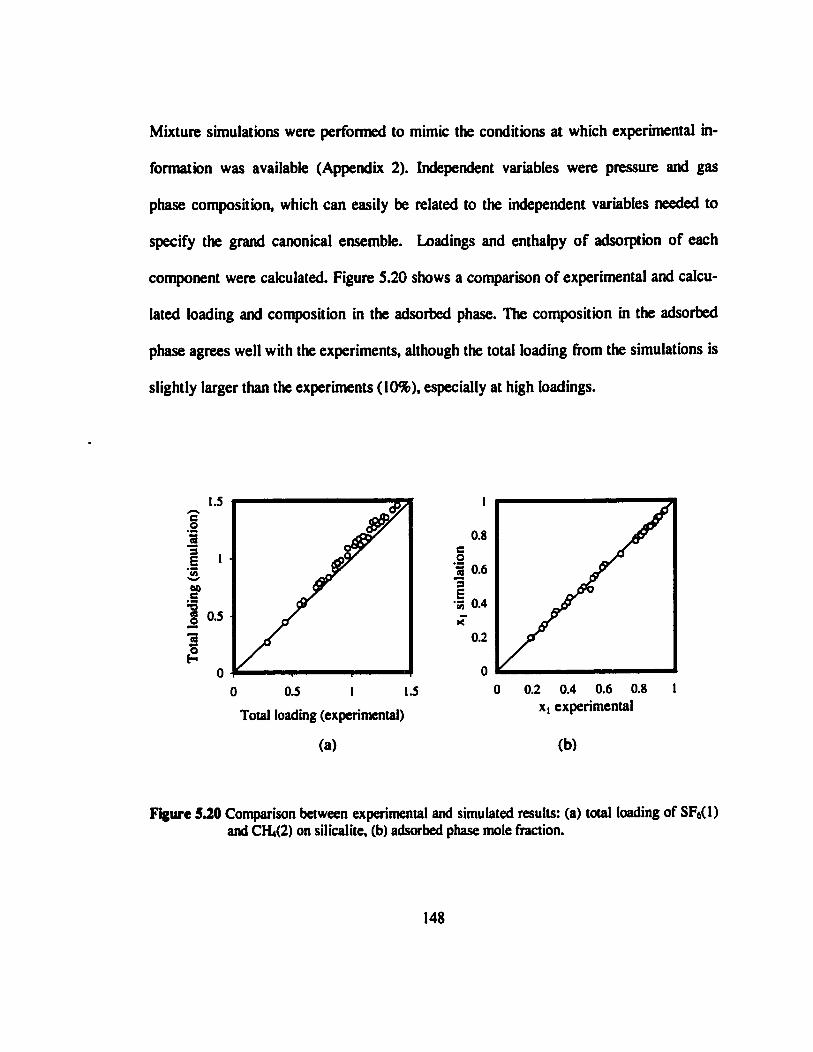
Mixture simulations were performed to mimic the conditions at which experimental in-
formation was available (Appendix 2). Independent variables were pressure and gas
phase composition, which can easily be related to the independent variables needed to
specify the grand canonical ensemble. Loadings and enthalpy of adsorptton of each
component were calculated. Figure 5.20 shows a comparison of experimental and calcu-
lated loading and composition in the adsorbed phase. The composition in the adsorbed
phase agrees well with the experiments, although the total loading from the simulations is
slightly larger than the experiments (10%), especially at high loadings.
05 i 1.5
Total loading (experimental)
(a)
3 0.6
5 0.4
0.2 0.4 0.6 0.8 X| experimental
(b)
Figure 5 JO Comparison between experimental and simulated results: (a) total loading of SF6(1) and CrL(2) on silicalite, (b) adsorbed phase mole fraction.
148
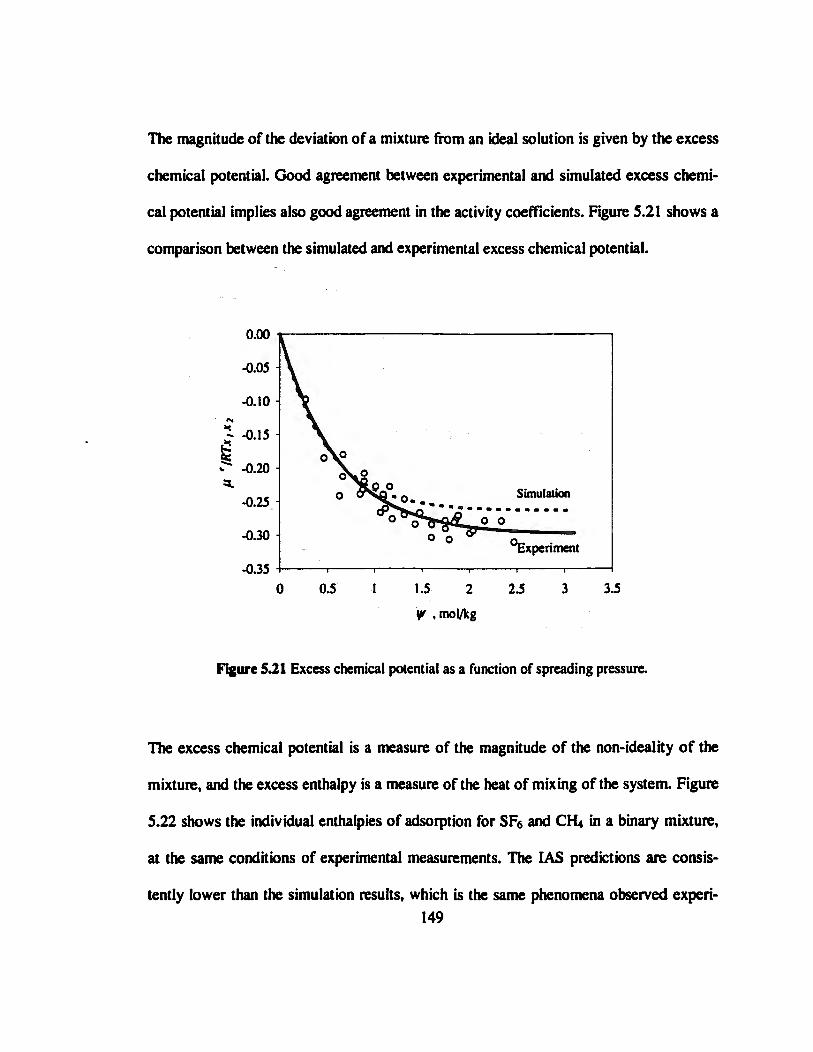
The magnitude of the deviation of a mixture from an ¡deal solution is given by the excess
chemical potential. Good agreement between experimental and simulated excess chemi-
cal potential implies also good agreement in the activity coefficients. Figure 5.21 shows a
comparison between the simulated and experimental excess chemical potential.
-0.05
~ -0.15
-0.30
yr .mol/kg
Simulation
experiment
35
Figure 5.21 Excess chemical potential as a function of spreading pressure.
The excess chemical potential is a measure of the magnitude of the non-ideality of the
mixture, and the excess enthalpy is a measure of the heat of mixing of the system. Figure
5.22 shows the individual enthalpies of adsorption for SF6 and CHi in a binary mixture,
at the same conditions of experimental measurements. The IAS predictions are consis-
tently lower than the simulation results, which is the same phenomena observed experi-149
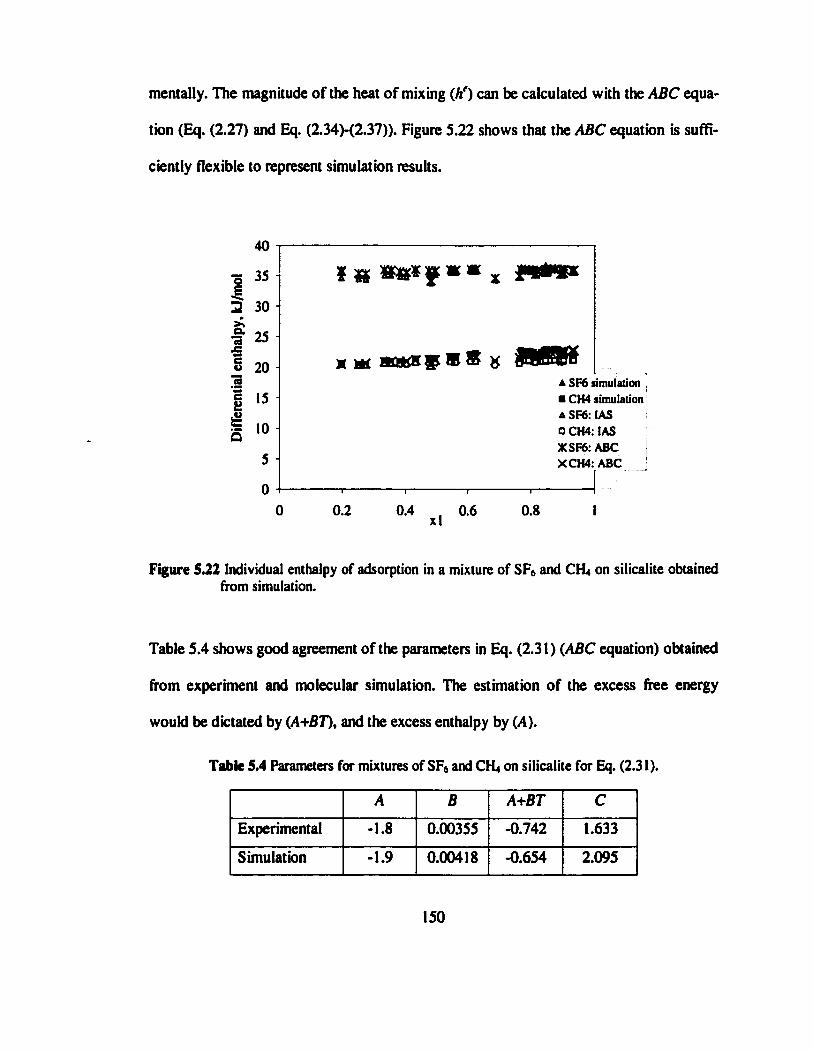
mentally. The magnitude of the heat of mixing (hf) can be calculated with the AßC equa-
tion (Eq. (2.27) and Eq. (2.34M2.37)). Figure 5.22 shows that the ABC equation is suffi-
ciently flexible to represent simulatton results.
40
Ö 35
22 30
t 25 4
S 20 1 I 15 I «o
5
0
I n Ä»*f
x w nwsfSfi g IH9RÍ A SF6 simulation {
• CH4 simulation A SF6: IAS a CH4: IAS XSF6:ABC j XCH4: ABC !
0.2 0.4 , 0.6 xl 0.8
Figure 5.22 Individual enthalpy of adsorption in a mixture of SF6 and CH* on silicalite obtained from simulation.
Table 5.4 shows good agreement of the parameters in Eq. (2.31) (AßC equation) obtained
from experiment and molecular simulatton. The estimation of the excess free energy
would be dictated by (A+BT), and the excess enthalpy by (A).
Table 5.4 Parameters for mixtures of SF6 and CrL on silicalite for Eq. (2.31).
Experimental
Simulatton
A -1.8
-1.9
B 0.00355
0.00418
A+BT
-0.742
-0.654
C 1.633
2.095
150
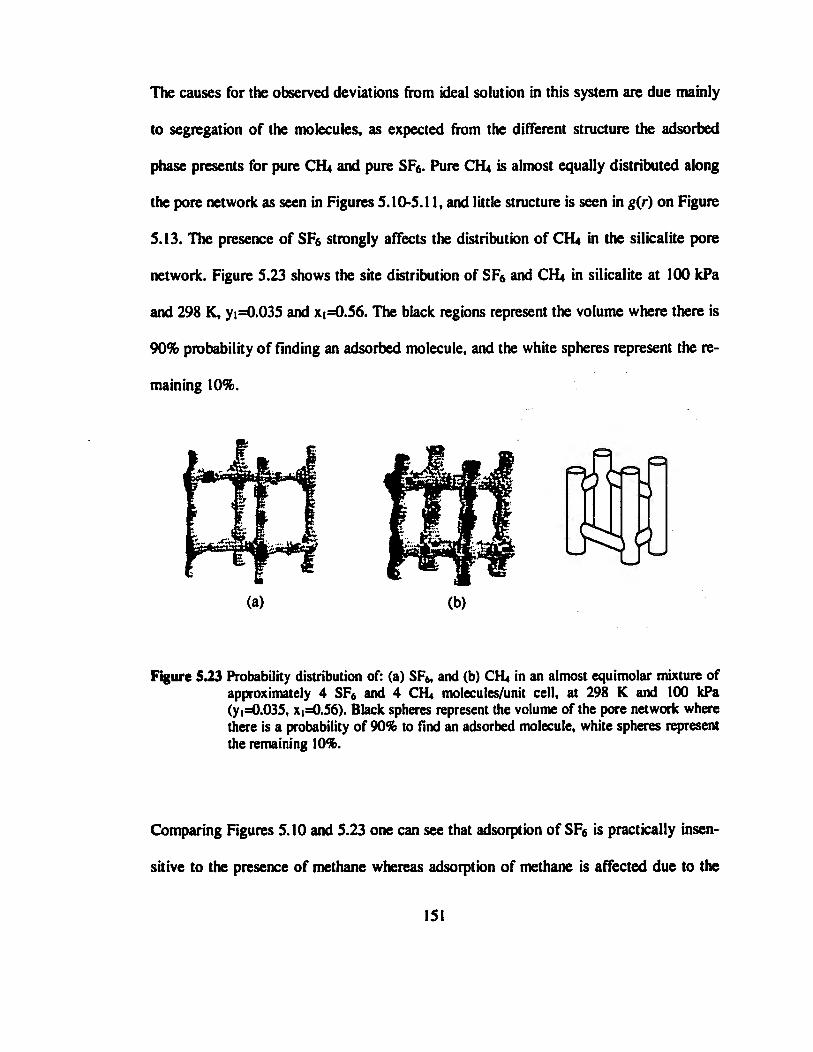
The causes for the observed deviattons from ideal solution in this system are due mainly
to segregation of the molecules, as expected from the different structure the adsorbed
phase presents for pure CH4 and pure SFs. Pure CH* is almost equally distributed along
the pore network as seen in Figures 5.10-5.11, and little structure is seen in g(r) on Figure
5.13. The presence of SF6 strongly affects the distributton of CH4 in the silicalite pore
network. Figure 5.23 shows the site distributton of SFs and CH4 in silicalite at 100 kPa
and 298 K, yi=0.035 and X|=0.56. The black regions represent the volume where there is
90% probability of finding an adsorbed molecule, and the white spheres represent the re-
maining 10%.
ññfl Inf (a) (b)
Figure 5.23 Probability distribution of: (a) SF6, and (b) CR« in an almost equimolar mixture of approximately 4 SF6 and 4 CH« molecules/unit cell, at 298 K and 100 kPa (yt=0.035, X|=0.56). Black spheres represent the volume of the pore network where there is a probability of 90% to find an adsorbed molecule, white spheres represent the remaining 10%.
Comparing Figures 5.10 and 5.23 one can see that adsorption of SF6 is practically insen-
sitive to the presence of methane whereas adsorptton of methane is affected due to the
151
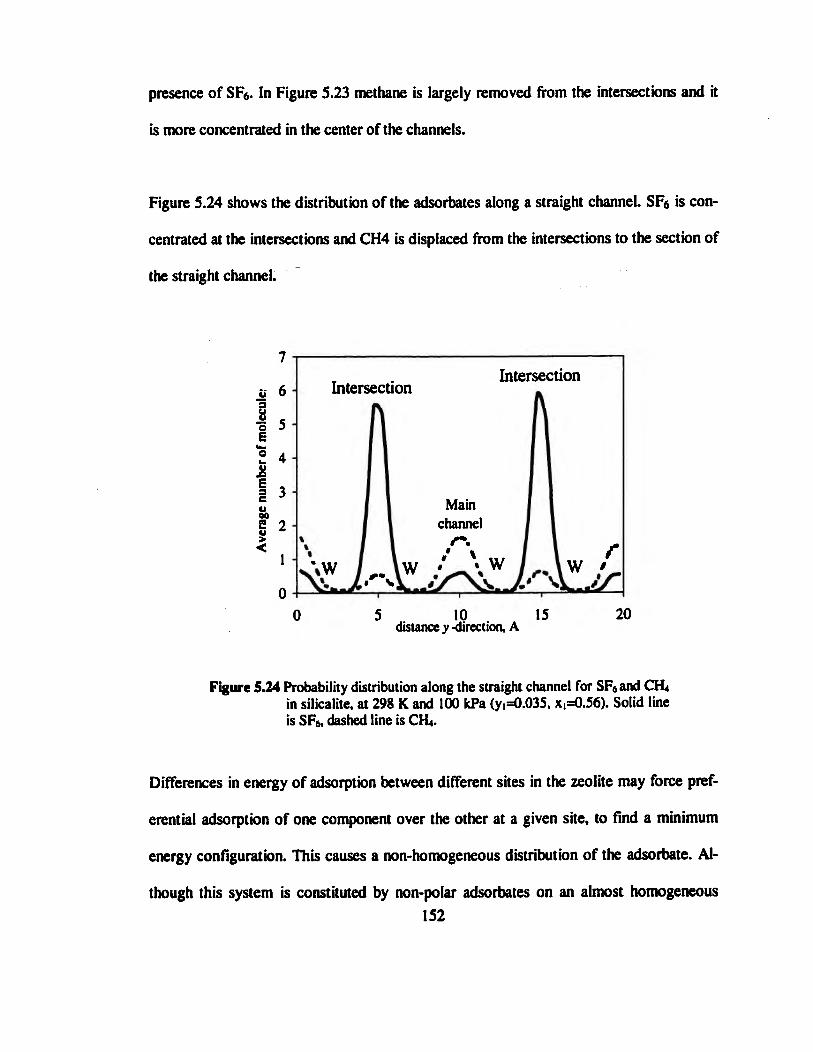
presence of SF6. In Figure 5.23 methane is largely removed from the intersections and it
is more concentrated in the center of the channels.
Figure 5.24 shows the distributton of the adsorbates along a straight channel. SFs is con-
centrated at the intersecttons and CH4 is displaced from the intersecttons to the section of
the straight channel.
7
ü 6
E a e u e > <
5-\
4
3-1
2
1
Intersection
Q -I V u «
Intersection
Main channel
W / » W
•au
5 10 15 distance y -direction, A
20
Figure 5.24 Probability distribution along the straight channel for SF6and CIL in silicalite, at 298 K and 100 kPa (y,=0.035, x,=0.56). Solid line is SFs, dashed line is CH«.
Differences in energy of adsorptton between different sites in the zeolite may force pref-
erential adsorptton of one component over the other at a given site, to find a minimum
energy configuration. This causes a non-homogeneous distribution of the adsórbate. Al-
though this system is constituted by non-polar adsorbates on an almost homogeneous 152
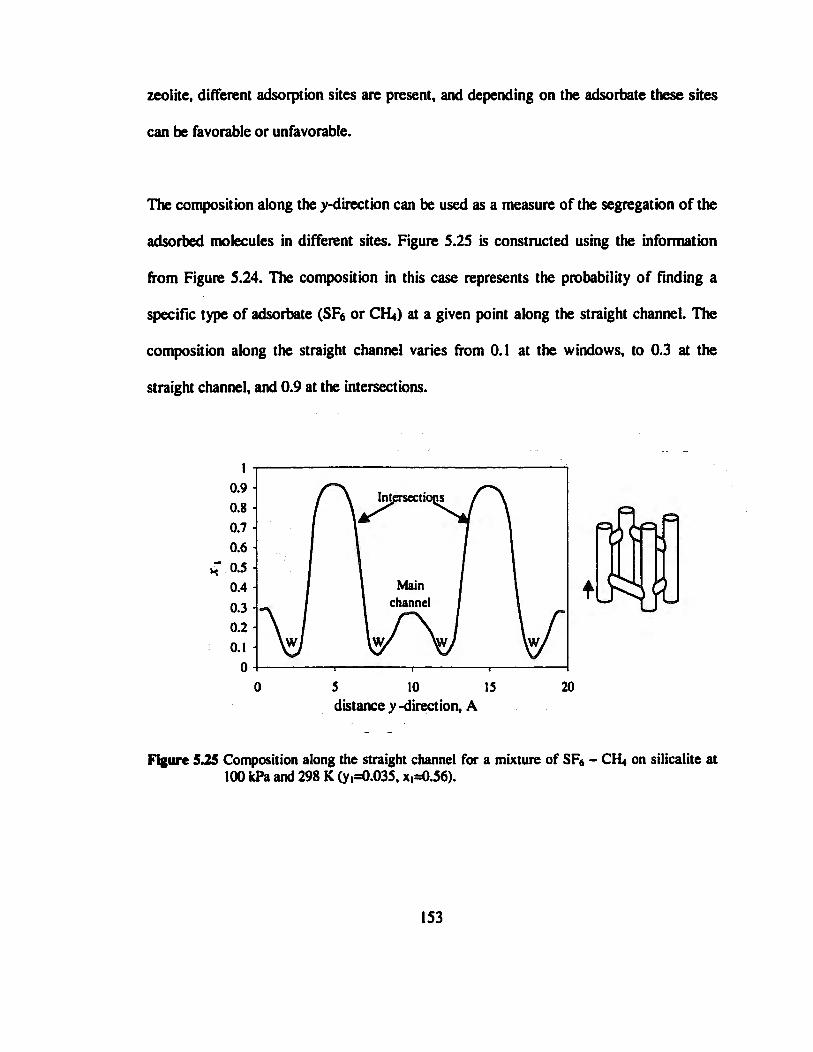
zeolite, different adsorptton sites are present, and depending on the adsórbate these sites
can be favorable or unfavorable.
The compositton along the y-directton can be used as a measure of the segregation of the
adsorbed molecules in different sites. Figure 5.25 is constructed using the information
from Figure 5.24. The compositton in this case represents the probability of finding a
specific type of adsórbate (SFs or CH4) at a given point along the straight channel. The
compositton along the straight channel varies from 0.1 at the windows, to 0.3 at the
straight channel, and 0.9 at the intersecttons.
Inl lmersec 0.8
0.6
Main 0.4 channel
W 0. 1
0 5 10 IS 20 distance y -direction, A
Figure 5.25 Composition along the straight channel for a mixture of SF6 - CH4 on silicalite at 100 kPa and 298 K (yi=0.035, x,=0.56).
153
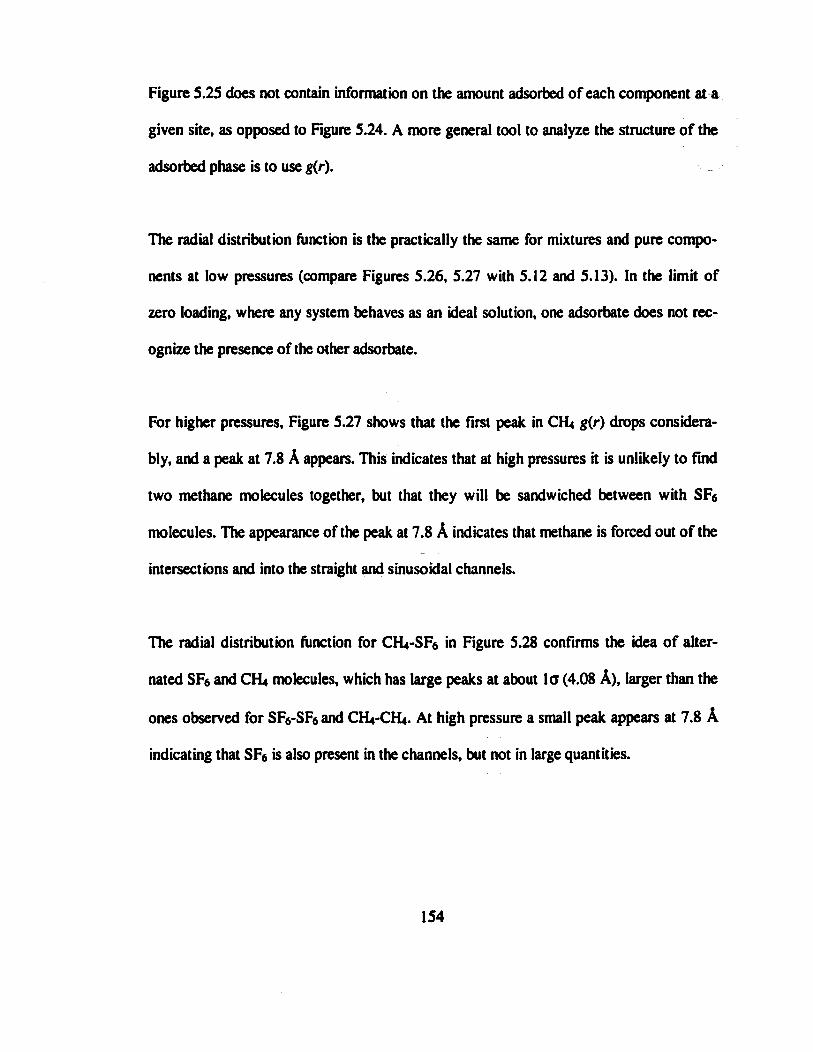
Figure 5.25 does not contain information on the amount adsorbed of each component at a
given site, as opposed to Figure 5.24. A more general tool to analyze the structure of the
adsorbed phase is to use g(r).
The radial distributton functton is the practically the same for mixtures and pure compo-
nents at low pressures (compare Figures 5.26, 5.27 with 5.12 and 5.13). In the limit of
zero loading, where any system behaves as an ideal solution, one adsórbate does not rec-
ognize the presence of the other adsórbate.
For higher pressures. Figure 5.27 shows that the first peak in CR» g(r) drops considera-
bly, and a peak at 7.8 A appears. This indicates that at high pressures it is unlikely to find
two methane molecules together, but that they will be sandwiched between with SFs
molecules. The appearance of the peak at 7.8 A indicates that methane is forced out of the
intersections and into the straight and sinusoidal channels.
The radial distributton function for CrL-SF6 in Figure 5.28 confirms the idea of alter-
nated SFs and CR» molecules, which has large peaks at about lo (4.08 A), larger than the
ones observed for SF6-SF6 and CH4-CH4. At high pressure a small peak appears at 7.8 A
indicating that SF6 is also present in the channels, but not in large quantities.
154

25
15
05
-P» IOOkPa.yl »0.035.xl«056 j (-4 SF6 molecules/ux.)
•P»IOkPa,yI»0.025.xl»OJ3 i [-05 SF6 motecules/ux.)
0 1 2 3 4 S 6 7 8 9 10 U 12 13 14 15 16 r.A
Figure 526 SF6-SF6 radial distribution function in a binary mixture.
2 1.8 1.6 1.4 1.2
1 0.8 0.6 0.4 0.2
0
•*- P = 100 kPa, yl - 0.035. xl= 056 (-4 CH4 molcculcs/u.c.)
— P= I0kPa,yl =0.025. xl=0.53 (-0.5 CH4 molecules/u.c.)
1 2 3 4 5 6 7 8 9 10 11 12 13 14 15 16 r,A
Figure 521CH4-CH4 radial distribution function in a binary mixture.
155
P= lOOkPa, yl »0.035. xl»0.56 (-4 SF6 and -4 CH4 molecules/u.c)
P» lOkPa. yl «0.025. x I» 0.53 (-05 SF6 and 05 CH4 molccules/ux)
1.5
0 »ooooqi i
0 I 2 3 4 S 6 7 8 9 10 II 12 13 14 15 16 r,A
Figure 5.28 SF6-CR, radial distribution function.
5.5 Conclusion
Molecular simulatton for mixture adsorptton of CH4 and SF6 was presented. Good
agreement with experimental data can be accomplished by selecting the force field that
represents the system studied. In our case, both CH4 and SF6 are well described by the
Lennard-Jones potential.
The ability to represent mixture adsorptton using only pure component experimental in-
formation lies on two premises: the adsorbate-adsorbent interactions are far more impor-
tant than the adsorbate-adsorbate interactions, and the force-field used to represent the
156

system captures the physics of the problem. From the single component adsorption
simulattons it was clear that adsorbate-adsorbate interactton energy was less than 10% of
the total energy. Even for fluids that interact strongly in a bulk phase, like alcohol and
water, it has been shown [Shevade, et al. 1999] that the hydrogen bonding is weaker in
the adsorbed phase than in the bulk phase. Then the importance of interactions between
fluid molecules in the adsorbed phase is less than in a bulk phase, and mixture adsorption
can indeed be predicted from pure component properties.
The deviattons from ideality in the mixture studied can be explained by the different be-
havior of each adsórbate in the presence of the adsorbent, and the existence of sites of
different energy that favor the adsorptton of different molecules. At high loadings, pack-
ing effects become evident. In contrast to the work done by Gergkiis and Theodorou
(1999), where methane molecules were likely to be adjacent to each other in a methane -
n-butane mixture, we found that it is not likely to find adjacent methane molecules in the
presence of SF6. This suggests that not only the size of the adsórbate but also the shape
becomes important when packing effects are observed.
157
Chapter 6
Conclusions and Future Work
6.1 Summary and Conclusions
Prediction of mixture adsorptton is the key factor in the design of adsorptton separation
processes. The purpose of this work was to develop new methods for predicting mixture
adsorptton behavtor based exclusively on pure component informatton. Two approaches
were used: experimental and molecular simulatton.
Negative deviattons from ideal behavtor were observed in all non-ideal systems, both ex-
perimentally and with molecular simulattons. In bulk liquids, positive H* is usually ob-
served when interacttons between unlike molecules in a mixture are weaker than between
like molecules, as in mixtures of non-polar molecules. Negative ff is observed when
interacttons between unlike molecules are favored, as in cases where hydrogen bonds can
be created [Smith et al. 1996]. From the molecular simulations results in Chapter 5, we
know that adsorbate-adsorbate contributions are a small fraction of the total interaction
energy. Then the non-idealites are more likely due to differences in solid-fluid interac-
ttons than in fluid-fluid interacttons.
158
The segregatton of adsorbates into favorable adsorptton sites was observed from mo-
lecular simulattons. If the presence of an additional adsórbate drives each adsórbate to its
most favorable adsorptton site, the result will be a more favorable interactton energy than
if there was no segregatton. Thus the negative ff is not a consequence of favorable inter-
acttons between the adsorbates, but a segregatton of the adsorbates into their most favor-
able sites. This segregatton can be because of the structure of the adsórbate (Chapter 5),
or it can be observed in mixtures of polar and non-polar fluids on highly heterogeneous
adsorbents (Karavias and Myers, 1991).
In bulk fluid mixtures with different size molecules, positive excess entropy is observed,
with an approximate upper bound given by the Flory-Huggins equation [Smith et al.
1996]. In the case of mixture adsorption, even for systems with non-polar adsorbates of
different size, negative excess entropy of adsorptton was observed. This can be attributed
to the more localized adsorptton that results because of the presence of a second adsór-
bate.
Considering that the non-idealities in the adsorbed phase are a result of segregation of the
adsorbates into favorable sites, the magnitude of the non-idealities should be related to
single component properties, such as the presence or absence of particular adsorptton
sites and the energy associated with them, as well as the ability of the second component
to cause this segregatton.
159
In Chapter 4, the mixture properties measured experimentally were correlated using an
excess free energy model, which allows us to determine the magnitude of the deviations
from ideal solution observed in the different systems. By identifying the causes of non-
idealities, it is possible to find a relationship between pure-component properties and the
non-ideality observed in adsorbed mixtures. Then, this relationship can be used to predict
mixture adsorptton properties.
Figure 4.22 shows a correlatton between pure component parameters and the non-ideality
in the adsorbed phase. The magnitude of the non-ideality in the adsorbed phase is related
to the difference in zero coverage enthalpy of adsorptton. In an ideal mixture, the interac-
ttons between like and unlike molecules should be the same, or very similar. The zero
coverage enthalpy of adsorptton is a measure of the interactton energy of an adsorbed
molecule on a clean surface. Therefore the difference between the zero coverage enthal-
pies of the adsorbates in a mixture can be seen as a measure of how different are the ad-
sorbates; this difference should be proportional to the non-ideality of the system.
The "ability" of a mixture to segregate into the most favorable sites for each adsórbate
needs to be accounted for. On a perfectly homogeneous adsorbent this segregation would
not occur, assuming that the size of the molecules is the same. Imagine the case where we
have a perfectly smooth surface with no site preference for either adsórbate. The single
component heats of adsorptton would be practically independent of loading (or slightly
increasing with loading due to adsorbate-adsorbate interacttons). This system would not
160
favor segregatton of the molecules. Now imagine a system where difference in the zero
coverage heats is the same as before, but there are sites with different energy of adsorp-
tton for the strongly adsorbed molecule (enthalpy of adsorptton decreasing with cover-
age), while the weak adsorbed molecule shows an enthalpy of adsorptton independent of
loading. This system is more likely to show segregation of the adsorbates into different
sites. The presence of a second adsórbate allows the strong adsorbed molecules to accu-
mulate at the most favorable energy sites, leaving the weak adsorbed molecules on the
low energy sites.
In order to account for this effect it is not enough to look only at zero coverage proper-
ties. It is necessary to use the informatton available form the whole heat profile. Assum-
ing the magnitude of the non-ideality is proportional to the difference in zero coverage
heats of adsorption a correctton factor using the information of the heat profiles is needed
to account for the segregatton of adsorbates. Assuming this correctton to be the ratio of
integral enthalpies of adsorptton, if enthalpies are independent of loading hilh\ is less
than one, because component (1) is the strongly adsorbed component. Thus, the solution
is less non-ideal that what the difference in zero coverage enthalpies would predict.
For a case where enthalpies vary with loading, A//A|* can be larger than for heats inde-
pendent of loading. In extreme cases where the heats of adsorptton of the weak compo-
nent increase strongly with loading, but the heats of the strong adsorbed component de-
161
crease with loading, then hflhx can be larger than one, indicating a strongly non-ideal
system.
The ratio of critical volumes was used to account for adsorbates of different size. Ad-
sorption is mainly the result of dispersion forces between the adsórbate and a solid sur-
face. When the only contribution to the adsorptton energy is dispersion interacttons,
stronger adsorptton is expected for large molecules. In such cases, Vc,^Vc,i will be less
than one, indicating a more ideal system. When Vc,2Arc,i is larger then one, smaller
molecules are adsorbed stronger than large molecules, indicating the existence of a con-
tribution to the energy of adsorptton other than dispersion, as in C3H8-CO2 on NaX where
ton-quadrupole interactions for CO2 are important. The existence of different types of
interacttons will favor the segregatton of the adsorbates, leading to strong non-ideal sys-
tems.
In summary, in this work two methods were presented to predict mixture adsorption
based on single component properties. By relating the magnitude of the non-idealities to
pure component properties, correlations that can be used for the prediction of mixture ad-
sorptton were derived. Computer simulattons provide molecular level information of the
system studied. In the case of mixture adsorptton, it allows us to understand the behavtor
of mixtures in micropores, and the causes of non-idealities.
162
6.2 Future Work
Understanding the behavtor of mixtures in microporous materials is important for the de-
sign of more efficient separation processes. One of the most important obstacles to prog-
ress in the field of adsorptton is the lack of high quality experimental data. Adsorptton
calorimetry has proven to be a useful tool to measure multicomponent properties such as
selectivities and heats of adsorptton. The combination of calorimeter-volumetric appara-
tus used in this work can be used to study other important factors that affect segregatton
of adsorbates in porous materials, such as the framework composition, the nature of the
non-framework cations, and the shape of the adsorbates.
Other important problems that can be studied with adsorptton calorimetry include the
measurement of heat capacities. It is generally accepted that heats of adsorptton are ap-
proximately independent of temperature, but there are few experimental measurements of
the magnitude of the heat capacity on homogeneous and heterogeneous adsorbents. Com-
puter simulattons suggest that heat capacities are negligible for homogeneous adsorbents,
but can be sizeable for heterogeneous adsorbents. More importantly, the variation of en-
thalpy of adsorptton with temperature plays an important role in the variation of selectiv-
ity with temperature.
One attractive method for predicting mixture adsorptton is molecular simulatton. When
using molecular simulatton it is necessary to model adsorbate-adsorbent and adsorbate-
adsorbate interacttons. The better the description of these interacttons the better the re-
163

suits, but a detailed description can be extraordinarily time consuming in computer time.
Simulatton techniques that provkle realistic representations of real systems are needed for
complex systems, such as those that have electrostatic interacttons as well as dispersion
interacttons. Better representations of the adsorbents are also needed to study frameworks
with different compositions.
Molecular simulattons have the advantage that they can be used to extract a molecular
level interpretation for macroscopic phenomena. In the case of mixture adsorptton, we
can extract causes for the non-ideality, such as molecular segregation and packing effects.
By understanding the causes of non-idealities in the adsorbed phase, we should be able to
develop practical models for mixture adsorptton which can be applied to the design of
adsorption separation equipment, tailoring new adsorbents and new applications.
164

References
Allen, M.P. Tildesley, DJ. Computer Simulation of Liquids Oxford University Press,
1987.
Al-Muhtaseb, Shaheen A; Ritter, James A. "A Statistical Mechanical Perspective on the
Temperature Dependence of the Isosteric Heat of Adsorption and Adsorbed Phase
Heat Capacity"/. Phys. Chem. B 1999a, /05(38), 8104-8115.
Al-Muhtaseb, Shaheen A.; Ritter, James A. "Roles of Surface Heterogeneity and Lateral
Interactions on the Isosteric Heat of Adsorption and Adsorbed Phase Heat Capac-
ity"/. Phys. Chem. B 1999b, 103( 13), 2467-2479.
Appel, W.S.; LeVan, M.D.; Finn, J.E. "Nonkleal Adsorption Equilibria Described by
Pure Component Isotherms and Virial Mixture Coefficients" Ind Eng Chem Res
1998,37,4774-4782.
Bajusz, I-G.; Goodwin, J.G. Jr.; Galloway, D.; Greenlay, N. "Effect of Ca2* Exchange on
Adsorptton of N2-O2 Mixtures by NaCaX Zeolite" Langmuir 1998a, 14, 2876-
2883.
165
Bajusz, I-G.; Goodwin, J.G. Jr.; Galloway, D.; Greenlay, N. "Isotopic Transient Study of
Multicomponent N2 and O2 Adsorptton on CaX Zeolite" Langmuir 1998, 14,
1846-1852.
Barton, TJ.; Bull, L.M.; Klemperer, W.G.; Loy, D.A.; McEnaney, B.; Misono, M.; Mon-
son, P.A.; Pez, G.; Scherer, G.W.; Vartuli, J.C; Yaghi, O.M. 'Tailored Porous
Materials" Chem. Mater. 1999, / / , 2633-2656.
Bezus, A.G.; Kiselev, A.V.; Lopatkin, A.A.; Du, P.Q. / . CColloid Interface Sei. 1973,
45(2), 386-395.
Berezin, G. I.; Kiselev, A. V.; Sinitsyn, V. A. "Heat capacity of water/potassium sodium
X zeolite adsorption system"/. Chem. Soc., Faraday Trans. 1 1973, 69(3), 614-
619.
Bulow, M. "Determinatton of sorptton thermodynamic functions for multicomponent gas
mixtures sorbed by molecular sieves" Stud. Surf. Sei. Catal. 1994,83,209-215.
Bulow, M. and Shen, D. "Sorptton of atmospheric gases on a faujasite-type zeolite - an
isosteric investigation" Fundam. Adsorpt., 1998, 6, 87-92. Editors): Meunier,
Francis. Publisher: Elsevier, Paris, Fr.
166
Cardona-Martínez, N. and J.A. Dumesic, 1989, Adv Catal. Lett. 38,149-2440
Chandler, D. Introduction to Modern Statistical Mechanics Oxford University Press,
1987.
Chen, D.T.; L. Zhang, C. Yi, and J.A. Dumesic, "Methylamine synthesis over solid acid
catalysts: microcalorimetric and infrared spectroscopic studies of adsorbed spe-
cies"/. Catal. 1994,146,257-267
Clark, L.A.; Gupta, A.; Snurr, R.Q. "Siting and Segregation Effects of Simple Molecules
in Zeolites MR, MOR, and BOG"/. Phys. Chem. B 1998,102,6720-6731.
Crittenden B. and Thomas J. Adsorption Technology & Design Butterworth Heinemann,
Great Britain, 1998.
Curry, J. E.; Cushman, John H. "Binary mixtures of simple fluids in structured slit mi-
cropores" Mol. Phys. 1995,55, 173-192.
Czaplewski, K.F.; Snurr, R.Q. "Hierarchical approach for simulation of binary adsorption
in silicalite" AIChEJ. 1999,45,2223-2236.
167
Demontis, P.; Suffritti, G.B.; Fois, E.S.; Quartieri, S. "Molecular dynamics studies on
zeolites. 6. Temperature dependence of diffusion of methane in silicalite"/. Phys.
Chem. 1992,96. 1482-1490.
Dios Cancela, G.; Rouquerol, F.; Rouquerol, J. "Calorimetric study of microporosity" / .
Chim. Phys. Physicochim. Biol. 1970,67,609-616.
Du, Z.; Manos, G.; Vlugt, TJ.H.; Smit, B. "Molecular simulation of adsorption of short
linear alkanes and their mixtures in silicalite" AlChEJ. 1998,44,1756-1764.
Dunne, J. A.; Mariwala, R.; Rao, M.; Sircar, S.; Gorte, R. J.; Myers, A. L. 4*Calorimetric
Heats of Adsorption and Adsorptton Isotherms. 1. O2, N2, Ar, CO2, CH4, C2H6,
and SFs on Silicalite" Langmuir 1996a, 72(24), 5888-5895.
Dunne, J. A.; Rao, M.; Sircar, S.; Gorte, R. J.; Myers, A. L. "Calorimetric Heats of Ad-
sorption and Adsorptton Isotherms. 2. O2, N2, Ar, CO2, CH4, C2HS, and SFs on
NaX, H-ZSM-5, and Na-ZSM-5 Zeolites" Langmuir 1996b, 72(24), 5896-5904.
Dunne, J. A.; Rao, M.; Sircar, S.; Gorte, R. J.; Myers, A. L. "Calorimetric Heats of Ad-
sorption and Adsorption Isotherms. 3. Mixtures of CH4 and C2H6 in Silicalite and
Mixtures of CO2 and C2rl6 in NaX" Langmuir 1997, 7J(16), 4333-4341.
168
Dunne, J. and A.L. Myers, "Adsorption of Gas Mixtures in Micropores: Effect of Differ-
ence in Size of Adsorbate Molecules" Chem. Eng. Sei. 1994,49,2941-251.
Dymond, J. H.; Smith, E. B. The Second Virial Coefficients of Pure Gases and Mixtures:
A Critical Compilation. Oxford University Press, Fair Lawn, N. J. 1979.
Ewing G. W. Instrumental Methods of Chemical Analysis. Third edition. McGraw-Hill
Book Company 1969, pp. 394-400.
Engelhardt, Diploma Thesis University of Pennsylvania-Technical University of Munich
1999.
Faux, D.A. "Molecular Dynamics Studies of Hydrated Zeolite 4A" / . Phys. Chem. B
1999, 103,7803-7808.
Faux, D.A. "Molecular Dynamics Studies of Sodium Diffusion in Hydrated Naf-Zeolite-
4A"/. Phys. Chem. B 1998,102,10658-10662.
Flanigen, E.M.; Bennett, J.M.; Grose, R.W.; Cohen, J.P.; Patton, R.L.; Kirchner, R.M.;
Smith, J.V. "Silicalite, a new hydrophobic crystalline silica molecular sieve" Na-
ture, 1978,277,512-516.
169
Frenkel, D. Smit, B. Understanding Molecular Simulation: from Algorithms to Applica-
tions Academic Press, U.S.A 1996.
Fritzsche, S.; Wolfsberg, M.; Haberlandt, R.; Demontis, P.; Suffritti. G. B.; Tilocca, A.
"About the influence of lattice vibrations on the diffusion of methane in a cation-
free LTA zeolite" Chem. Phys. Lett. 1998, 296,253-258.
Gergidis, L.N.; Theodorou, D.N. "Molecular dynamics simulation of n-butane-methane
mixtures in silicalite"/. Phys. Chem. B 1999,103, 3380-3390.
Golden, T. C; Sircar, S. "Gas adsorption of silicalite" / . Colloid Interface Sei. 1994,
762(1), 182-188.
Godber, J.; Baker, M.D.; Ozin, G.A. "Far-IR Spectroscopy of Alkali-Metal and Alkaline-
Earth Cations in Faujasite Zeolites"/. Phys. Chem. 1989,93,1409-1421.
Goodbody, S J.; Watanabe, K.; MacGowan, D.; Walton, J.P.R.B.; Quirke, N. "Molecular
simulation of methane and butane in silicalite" / . Chem Soc. Faraday Trans.
1991,87.1951-1958.
Grant, RJ. and Manes, M. "Adsorption of Binary Hydrocarbon Gas Mixtures on Acti-
vated Carbon Ind. Eng. Chem. Fund. 1966,5,490-498..
170
Gray, CG. and K.E. Gubbins. Theory of molecular fluids. Volume 1: Fundamentals,
Clarendon Press-Oxford 1984.
Gusev V, OBrien JA, Jensen CRC, Seaton NA "Theory for multicomponent adsorptton
equilibrium: Multispace adsorptton model" AIChEJ 1996,42(10) 2773-2783.
Handy, T.L.; Sharma, S.B.; Spiewak, B.E.; Dumesic, J.A. "A Tian-Calvet heat-flux mi-
crocalorimeter for measurement of differential heats of adsorptton" Meas. Sei.
Techno!. 1993,4,1350-1356.
Hampson, J.A.; Rees, L.V.C. "Adsorptton of Ethane and Propane in Silicalite-1 and Zeo-
lite NaY: Determination of Single Component, Mixutre and Partial Adsorptton
Data using an Isosteric System" / . Chem. Soc., Faraday Trans. 1993, 86(16)
3169-3176.
Heuchel, M.; Snurr, R.Q.; Buss, E "Adsorption of CH4-CF< Mixtures in Silicalite: Simu-
lation, Experiment, and Theory" Langmuir 1997,13,6795-6804.
Hildebrand, Joel H.; Prausnitz, John M.; Scott, Robert L. Regular and Related Solutions.
The Solubility of Gases, Liquids, and Solids. Van Nostrand Reinhold Publisher,
New York, N. Y. 1970.
171
Hill, T.L. "Statistical Mechanics of Adsorptton. V. Thermodynamics and Heat of Ad-
sorption"/. Chem. Phys. 1949, 77(6), 520-535.
Hill, T.L. An Introduction to Statistical Thermodynamics Dover Publication Inc. 1986.
Hirschfelder, J. O.; Curtiss, CF.; Bird, R.B. Molecular theory of gases and liquids New
York, Wiley, 1965.
Hufton, J.R. "Analysis of the adsorptton of methane on silicalite by a simplified molecu-
lar dynamics simulation"/. Phys. Chem. 1991,95,8836-8839.
International Zeolite Association Structure Commission.
http://www.iza-sc.ethz.ch/IZA-SC/
June, R.L.; Bell, A.T.; Theodorou, D.N. "Prediction of Low Occupancy Sorptton of Al-
kanes in Silicalite" J Phys. Chem. 1990, 94, 1508-1516.
Kabir, H.; Grevillot, G; Tondeur, D. "Equilibria and activity coefficients for non-ideal
adsorbed mixtures from perturbation chromatography" Chem. Eng. Sei. 1998,
55(9), 1639-1654.
Karavias, F.; Myers, A. L. "Isosteric heats of multicomponent adsorptton: thermody-
namics and computer simulattons" Langmuir 1991, 7,3118-3126.
172
Karavias, F; Myers, A.L. "Monte Carlo Simulattons of Adsorptton of Nonpolar and Polar
Molecules in Zeolite X' Molecular Simulation 1991b, 8, 23-50. Karavias, F;
Myers, A.L. "Monte Carlo Simulattons of Binary Gas Adsorptton in Zeolite
Cavities" Molecular Simulation 1991b, 8,23-50.
Keffer, D.; Davis, H.T.; McCormick, A.V. "Effect of Loading and Nanopore Shape on
Binary Adsorption Selectivity"/. Phys. Chem. 1996,100, 638-645.
Li, J.; Talu, O. "Structural effect of molecular simulations of tight-pore systems" / .
Chem. Soc., Faraday Trans. 1993,89, 1683-1687.
Macedonia, M.D.; Maginn, EJ. "A biased grand canonical Monte Carlo method for
simulating adsorptton using all-atom and branched united atom models" Molecu-
lar Physics 1999,96,1375-1390.
Maddox, M.W.; Rowlinson, J.S. "Computer simulation of the adsorption of a fluid mix-
ture in zeolite Y 7 . CA<?m. Soc., Faraday Trans. 1993,89,3619-3621.
Maginn, E J.; Bell, A.T.; Theodorou, D.N. •Transport diffusivity of methane in silicalite
from equilibrium and nonequilibrium simulations."/. Phys. Chem. 1993, 97,
4173-4181.
173
Martinez, G.M. Basmadjian, D. 'Towards a General Gas Adsorption Isotherm" Chem.
Eng. Sei. 1996,57,1043-54.
Masuda, T.; Tsutsumi, K.; Takahashi, H. "Infrared and calorimetric studies of adsorbed
carbon dioxide on NaA and CaNaA zeolites" / . Colloid interface Sei. 1980, 77,
232-237.
Masuda, T.; Tsutsumi, K; Takahashi, H. "Calorimetric evidence for nonspecific and spe-
cific interacttons of several gases with surfaces of NaA and CaNaA zeolites" / .
Colloid. Interface Sei 1980, 77(1), 238-242.
McQuarrie, D.A. Statistical Mechanics Harper Collins Publishers, New York, NY, 1976.
Meier, W.M.; Olson, D.H. Atlas of Zeolite Structure Types Butterworth-Heinemann,
Third edition., Stoneham, MA 1992.
Moon, H., Tien, C, "Adsorption of gas mixtures on adsorbents with heterogeneous sur-
faces" Chem. Eng. Sei. 1988,43,2967-2980
Morrison, J. A.; Los, J. M.; Drain, L. E. "The Heat Capacity, Integral Heat of Adsorptton
and Entropy of Argon adsorbed on Titanium Dioxide" Trans. Faraday Soc. 1951,
47. 1029.
174
Morrison, J.A. "Calorimetry in the study of physical adsorptton" Pure Appl. Chem. 1987,
59,7-14.
Myers, A.L., "Activity Coefficients of Mixtures Adsorbed on Heterogeneous Surfaces",
AIChEJ. 1983,29.691.
Myers, A.L.; Prausnitz, J.M. "Thermodynamics of Mixed-Gas Adsorptton" AIChE /.,
1965,77, 121-127.
Nicholson, D.; Gubbins, K.E. "Separation of carbon dioxide-methane mixtures by ad-
sorption: effects of geometry and energetics on selectivity" / . Chem. Phys. 1996,
704,8126-8134.
Nicholson, D., Parsonage, N.G. Computer Simulation and the Statistical Mechanics of
Adsorption, Academic Press, London (1982)
Nitta, T.; Kuro-oka, M.; Katayama, T. "An adsorptton isotherm for multi-site occupancy
model for heterogeneous surface" 1984, / . Chem. Eng. Japan, 71,45-51.
Nitta, T.; Shigetomi, T.; Kuro-oka, M.; Katayama, T. "An adsorptton isotherm for multi-
site occupancy model for homogenous surface" 1984, / . Chem. Eng. Japan, 7,39-
44.
175
Olson, D.H. " The crystal structure of dehydrated NaX" Zeolites 1995, 75,439-443.
Olson, D.H.; Kokotailo, G.T.; Lawton, S.L.; Meier, W.M. "Crystal Structure and Struc-
ture-Related Properties of ZSM-5"/. Phys. Chem. 1981,85,2238-2243.
Parrilto, DJ. and Gorte, RJ. "Characterizatton of stoichiometric adsorption complexes in
H-ZSM-5 using microcalorimetry" Catal. Lett. 1992, 76, 17-25.
Prausnitz, J.M., R.N. Lichtenthaler, E.G. de Azevedo, Molecular Thermodynamics of
Fluid-Phase Equilibria Third Edition, Prentice-Hall 1999.
Razmus, D.M, Hall, CK. "Predictton of Gad Adsorptton in 5A Zeolite Using Monte
Carlo Simulattons" AIChE J. 1991,37,769-779.
Rees, L.V.C.; Hampson, J. Brückner, P. "Sorptton of single gases and their binary mix-
tures in zeolites" in Proceedings of the NATO Advanced Study Institute on Zeo-
lite Microporous Solids: Synthesis, Structure and Reactivity, edited by Derouane,
E.G.; Lemos, F.; Naccache, C and Ribeiro F.R. Kluwer Academic Publishers.
1991.
Reid, R.C.; Prausnitz, J.M.; Poling, B.E. The Properties of Gases and Liquids. USA.,
MacGraw Hill, New York, N. Y., 1987.
176
Rouquerol, F.; Rouquerol, J.; Sing, K. Adsorption by Powders and Porous Solids: Prin-
ciples, Methodology and Applications. Academic Press, San Diego, CA 1999.
Roth, A. Vacuum technology Second edition. North-Holland. Elsevier Science Pub. 1982.
pp63.
Rowlinson, J. S.; Swinton, F. L. Liquids in Liquid Mixtures 3rd Ed. Butterworth Scien-
tific. London, UK 1982.
Ruthven, D.M. "A simple theorethical isotherm for zeolites: further comments" Zeolites
1982,2, 242-243
Ruthven, D.M. Principles of Adsorption and Adsorption Processes 1984, John Wiley &
Sons, New York.
Savitz, S.; Siperstein, F.; Gorte, RJ.; Myers, A.L. "Calorimetric Study of Adsorption of
Alkanes in High-Silica Zeolites"/. Phys. Chem. B 1998,102,6865-6872.
Schrimpf, G.; Tavitian, B.; Espinal, D. "Computer Simulation of the Structure, Energet-
ics, and Diffusion Properties of p-Xylene in Zeolite Na-Y' / . Phys. Chem. 1995,
99, 10932-10941.
177

Shevade, A.V.; Jiang, S.; Gubbins, K.E. "Adsorption of water-methanol mixtures in car-
bon and alumino-silicate pores: a molecular simulation study'* Mol. Phys. 1999,
97,1139-1148.
Siperstein, F. and Myers, A. L. "Adsorption in Zeolites: Loading, Heats, and Entropies of
Pure and Mixed Gases" Presented in AIChE annual meeting, 1999a.
Siperstein, F.; Gorte, R. J.; Myers, A. L. "A New Calorimeter for Simultaneous Meas-
urements of Loading and Heats of Adsorptton from Gaseous Mixtures" Langmuir,
1999b, 75, 1570-1576.
Siperstein, F.; Gorte, R.J.; Myers, A.L. "Thermodynamic Excess Functions for Binary
Gas Mixtures Adsorbed in Zeolites" Adsorption 1999c, 5,169-176.
Sircar, S. "Excess properties and Thermodynamics of Multicomponent Gas Adsorption"
/ . Chem. Soc., Faraday Trans. 1.1985,81, 1527-1540.
Sircar, S. "Isosteric Heats of Multicomponent Gas Adsorptton on Heterogeneous Adsorb-
ents" Langmuir 1991, 7, 3065-3069.
Sircar, S.; Mohr, R.; Ristic, C; Rao, M. B. "Isosteric Heat of Adsorption: Theory and
Experiment"/.Phys.Chem.B 1999, 70J(31), 6539-6546.
178
Smit, B. "Simulating the Adsorption Isotherms of Methane, Ethane, and Propane in the
Zeolite Silicalite"/. Phys. Chem. 1995,99(15), 5597-5630.
Smith, J.M.; Van Ness, H.C.; Abbott, M.M. Introduction to Chemical Engineering Ther-
modynamics, Fifth edition, Mc Graw Hill U.S.A. (1996).
Snurr, R.Q.; Bell, A.T.; Theodorou, D.N. "Prediction of Adsorption of Aromatic Hdro-
carbons in Silicalite from Grand Canonical Monte Carlo Simulations with Biased
Insertions" J. Phys. Chem. 1993,97,13742-13752.
Solot Suwanayuen, Ronald P. Danner, "Vacancy Solution Theory of Adsorption From
Gas Mixtures" AIChE J. 1980,26(1), 76-83.
Soto, J.L and Myers, AL "Monte Carlo studies of adsorptton in molecular sieves" Mol.
Phys. 1981,42,971-983.
Stroud, HJ.F., Richards, E., Limcharoen, P., Parsonage, N.G. 'Thermodynamic study of
the Linde sieve 5AfMethane system" / Chem. Soc., Faraday Trans. 1,1976, 72,
942.
Suwanayuen, S.; Danner, R.P. "Vacancy solution theory of adsorption from gas mix-
tures" AIChE J. 1980,26, 76-83.
179

Talu O. "Needs, status, techniques and problems with binary gas adsorption experiments"
Adv. in Colloid and Interface Sei. 1998,76-77,227-269.
Talu, O. and A.L. Myers, "Rigorous Thermodynamic Treatment of Adsorption", A7CA£
/ . 1988,54,1887-1893..
Talu, O. and Myers, A.L. submitted to AIChE J. 1999
Talu, O.; Li, J.; Myers, A.L. "Activity coefficients of adsorbed mixtures" Adsorption
1995,7,103-112.
Talu, O.; Zwiebel, I. "Multicomponent Adsorption Equilibria of Nonideal Mixutres"
AIChE J. 1986,52, 1263-1276.
Tien, C Adsorption Calculations and Modeling Butterworth-Heinemann Series in
Chemical Engineering, Newton, MA, (1994).
Valenzuela, D.P.; Myers, A.L. Adsorption Equilibrium Data Handbook, Prentice-Hall,
Englewood Cliffs, NJ, (1989).
Valenzuela, D.P.; Myers, A.L.; Talu, O.; Zweibel, I. "Adsorption of gas mixtures: effect
of energetic heterogeneity" AIChE J. 1988,54,397-402.
180

Van Tassel, P.R.; Davis, H.T.; McCormick, A.V. "Adsorption of binary mixtures in a
zeolite micropore" Mol. Simul. 1996,77, 239-254.
Vaughan, D. E. W. "The synthesis and manufacture of zeolites" Chem. Eng. Prog. 1988,
84(2), 25-31.
Vlugt, T. J. H.; Krishna, R.; Smit, B. "Molecular Simulations of Adsorption Isotherms for
Linear and Branched Alkanes and Their Mixtures in Silicalite" / . Phys. Chem. B
1999,705,1102-1118.
Yang, R. T. Gas Separation by Adsorption Processes Butterworths series in Chemical
Engineering. (1987).
181
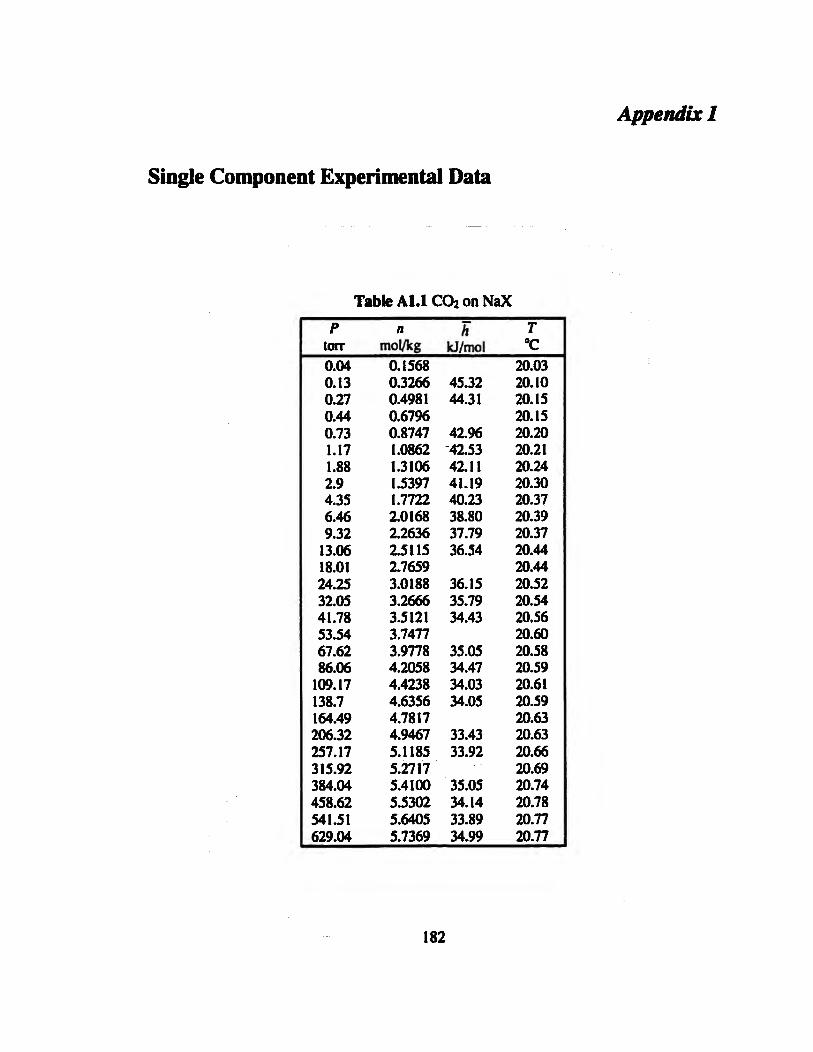
Single Component Experimental Data
Table ALI CO2 on NaX p
torr 0.04 0.13 0.27 0.44 0.73 1.17 1.88 2.9 4.35 6.46 9.32
13.06 18.01 24.25 32.05 41.78 53.54 67.62 86.06
109.17 138.7 164.49 206.32 257.17 315.92 384.04 458.62 541.51 629.04
n mol/kg
0.1568 0.3266 0.4981 0.6796 0.8747 1.0862 1.3106 1.5397 1.7722 2.0168 2.2636 2.5115 2.7659 3.0188 3.2666 3.5121 3.7477 3.9778 4.2058 4.4238 4.6356 4.7817 4.9467 5.1185 5.2717 5.4100 5.5302 5.6405 5.7369
A kJ/mol
45.32 44.31
42.96 42.53 42.11 41.19 40.23 38.80 37.79 36.54
36.15 35.79 34.43
35.05 34.47 34.03 34.05
33.43 33.92
35.05 34.14 33.89 34.99
T °C
20.03 20.10 20.15 20.15 20.20 20.21 20.24 20.30 20.37 20.39 20.37 20.44 20.44 20.52 20.54 20.56 20.60 20.58 20.59 20.61 20.59 20.63 20.63 20.66 20.69 20.74 20.78 20.77 20.77
182
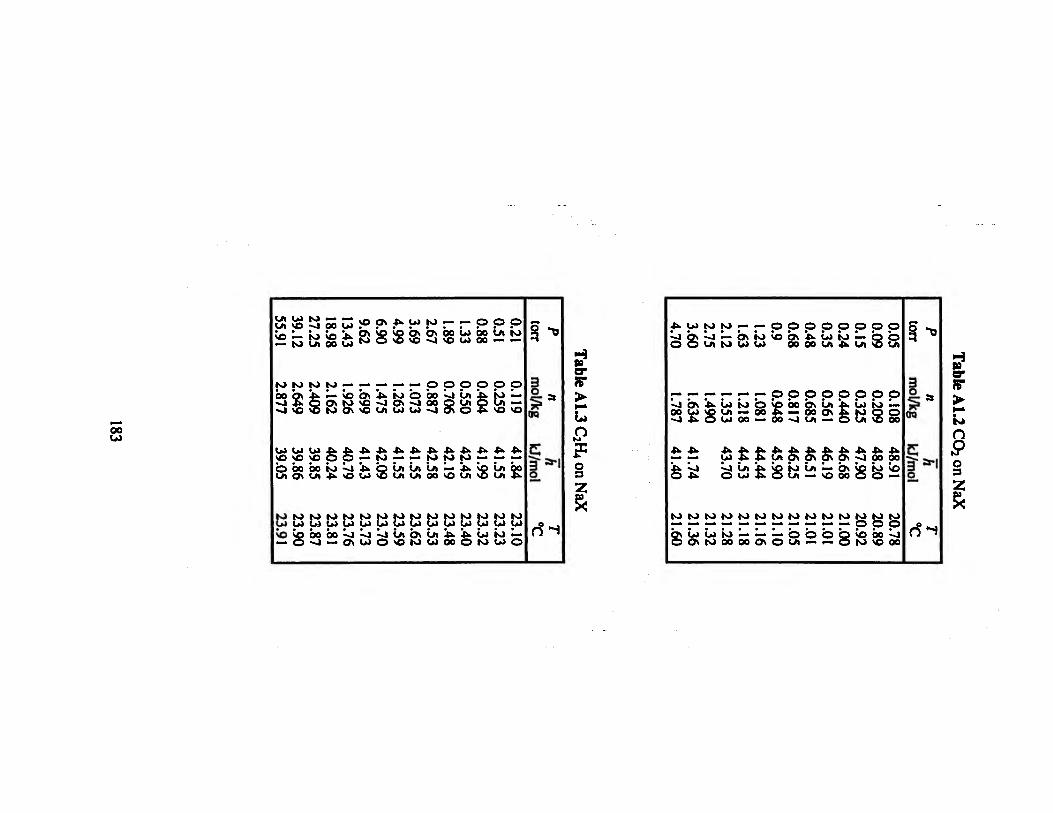
27.25 39.12 55.91
2.409 2.649 2.877
U) Ul u> SO SO SO © bo bo Ul OS U|
23.87 23.90 23.91
S r ¡ * o » * w M - - o CoVOSSOSOOsOSOOWOO g £ ¡ N O « « v 4 « W M
t o — — — — — p p p p — s o b \ * . t o ö b o i j ü i l u O S I O S O ^ J O S o J O O O U l p
O O — to — — t o t o t o — • • • • • • • • • • t O - 0 4 > * Q U i U i U i - * . s O ^ l O W s S U i U i O O s O U l s O
0.21 0.51
0.119 0.259
41.84 41.55
t o t o t o t o t o t o t o i o i o t o t o t o u u u u u u u u u u u u • • • • • • • • • * • • — 0 S U ) O s 0 t O U > 0 0 O t O U > O
3"*
mol/kg
3~a-| o_
o°-i
5? er S" • Ü o O 3 2: ft
« k U i t O t O - — O O O O O O O O • • « • • • • • • • • • a « v l f t v J - 0 \ W * O v - U W K J - 0 0 O O Ul t o U) U» 00 00 Ul 4k Ul SO Ul
— — — — — — O O O O O O O O • • • • • • • • • • • • a * * J 0 s 4 > . U ) t O O s p 0 0 0 S U i 4 > U > » 0 — o o u y p u i « oo 4* — oo os 5 to Q O
•u 4*. 4* * . 4k. 4» Cv v i 00 OG
ê ^j ^ J ù I « . S O K > U I — b s s o t o s o 4». O U> 4^ O Ui — V O 0 0 O O —
* . 4> u* * . £ CA Ö\ Ö\ ÖS
I O t O t O t O N > | O I O t O t O K > t O N > t O I O — — — — — — — — — — — o o o • • • • • • • • • • • • • * S U> U> IO — — — O O O Q S O O O < 0
O s t O O O O O O s O U l — — O I O S O 0 0
3"*
1= OQ
d-J
er S-
to
n
I

— S è t o o È o o s — g i 3 è s o — r r i ö N ° o > o * w , w w , s * — ° <=> S & 2 £ è 2 ! S w « S 8 5 u i 2 2 ^ « ~ ^ 3 i o t o o o u , s o 4 k
U l U > U > U > U > U t U > U ) | O I O t O t O t O - — — — — — — O O O O O O • • • • • • • • • « • • • • • • • « a • • • » • • • s O O O O O v l O \ U l U > — s O v l V l U l O O O - J U l U i U » — Q O O O S U l W I O — L « | v O t 0 4 k U > — Ul «J OS Ul Ul — * S O O — 4 k 4 k ~ J O U i s 0 4 k S O U i — O U> Ul — - J — 0 0 O s s 0 U l U > O O s U > v l 0 0 — 0 s O U i O 4 k 0 s « 0 U > s 0
v O v O O O v O v o O O O O O O v O v o O è è £ £ v O U ) O S U > O O S ^ - O U ) 4 k 4 k O s s 0 4 k O O U I U I O S O O - U l O t O — v l t O S O O O O U J
— — — — lb — — — — v l v l l n Ñ O — ù i ù i U J O — 4 k 4 k O 0 4 k > O U > O s 4 k
l o t o i o t o t o t o t o i o t o t o t o t o t o t o t o t o i o t o t o i o i o i o t o i o t o t o ooooooooooooooooooooooœoo>iv)v)vi>iv)>ivio«o\o\oia\ • • • • • • • • • • • • • • • • • • • • e • _ • • • • 4 k 4 k 4 k 4 k i » v » U > U > U > t O t O — Q « > I O \ U i A U » — s O O O v J U l U ) 0 0 v l | O t O 0 0 > O U t U J O U i t O v l 4 k 0 S - ' J U ) 0 s 0 S t O 0 0 | O — 4k — 4kO0
s
1= OQ
3~»"l
d H
5? cr
>
n F o a 2:
4.72 6.40 8.72 12.02
00 bv u> to
42.38 42.23 40.97 42.03
.p. 4k 4k 4k 4k U> to ÎO to Ul OS -J
0.23 0.49 0.84 1.28 1.87 2.60 3.49
O 00 Ov Ul Ul to — — Ul OO tO vi 4k IO 00 0 os ui to to 0
4k 4k 4k 4k 4k 4k 4k to to to to — — — — to Ju © so vi bo to Ul OS os to to vO
to to to 10 to to to 4. 4. u w w u 0 0 Ö vb bo bo vi os Œ u> os to — —
Î - »
n m
ol/kg h
kJ/mol
O°H
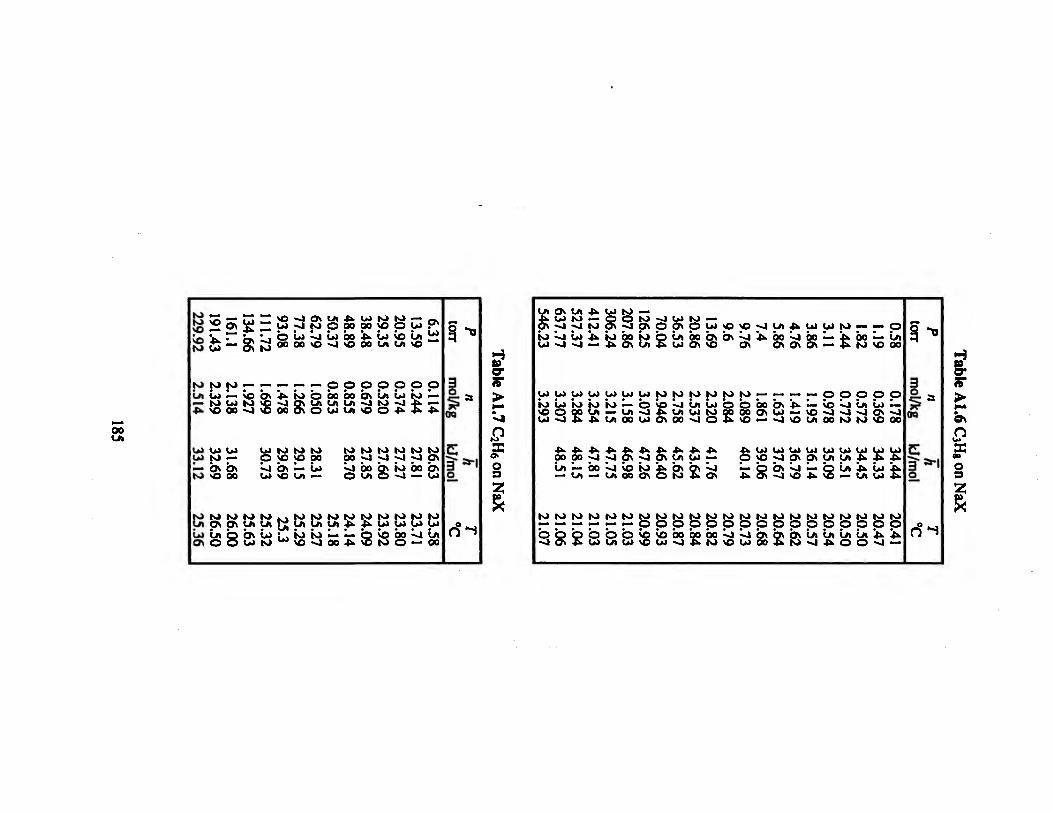
00 Ul
¡ á s - S — s o v i o s u i 4 k i * i t o t o — g. S Z » S - W ^ M O O O O O V O O W P * i o i v h v o O W v l W O O * W * Ü l ^ S u J ~ Ö ^ í o 0 0 0 0 v O ~ J v O 0 0 , J ' ' - " , o
• • • • • • • • • • • • • • a UlUt — v o o s - ^ t o o o o o o o s u i u i t o -— M U ) t O V O v l O s U i U l U | v l t O v l 4 k — 4 k s 0 0 0 v ] v O 0 0 O s O U ) U | S O O 4 k 4 k 4 k
Ul U» Ui ui to to to to to to to to to Ul tO — © SO SO 00 O O v l v l v l v l O S — bs bs vi bs — It» vi bo b\ to bo bs tO vO 00 U» vO Ul — O U i O v l — u>
23.58 23.71 23.80 23.92 24.09 24.14 25.18 25.27 25.29 25.3 25.32 25.63 26.00 26.50 25.36
n m
ol/kg
o_
o°-i
2-cr ST >
n o s I
Ul OS Ul 4k U) t o — 4kU>IO — © O t O v l U > t O — OS v i v i to OS " ~ — - -v i OS O OS o V O s O v l U i 4 k U J U J t O — — o I O v l U > 4 k t O 0 0 i O © U l 0 0 O S O S v l 4 k 0 0 v l 0 0 — 4> 00 — Ul U J v l v l — 4 k O S U Í 4 k U ) O S s O OS OSOSOS — 4 k | O s O 0 0
O l U l U l U l U l U l U l t O I O t O t O t O l O — — — — o o o o © • • • • • • • • • • • • • • • • • • • • • a ( O U W W W - © v p v J C H U i O O 0 0 O v 4 k — VO v i Ul Ul — v O O O O U i — U i v ] 4 k U i U ) t O Q 0 0 0 O S U > — v O v l v l v l O S v ] U > v l 4 k 4 k U l 0 0 U > 0 S 0 0 v l O 4 k s O — v l v O U l O O I O t O S O O O
4k 4k 4k 4k 4k 4k 00 00 vi vi OS v] Ul — 00 v] ÑO to — Ul — Ul 00 OS
* 4k 4k Ul Ul
4k A W W U U W W U V V ) — O s O v l O S O S U i U i 4 k 4 k 4 k
è°J£^ os — O OS v i — 4k Os v i vo 4k S Ul 4k Ul 4> — Ol Ul Jk
w w w w w w w w w w w w w w w w w w w w w w — — — — — — o o o o o o o o o o o o o o o o Ö Q O Ö Ö ö s Q s o b o b o b o v i v j b s ( ^ b s u i U i U i u i 4 k 4 k 82 Ul Ul Ul 8 to v i 4k O O vi —
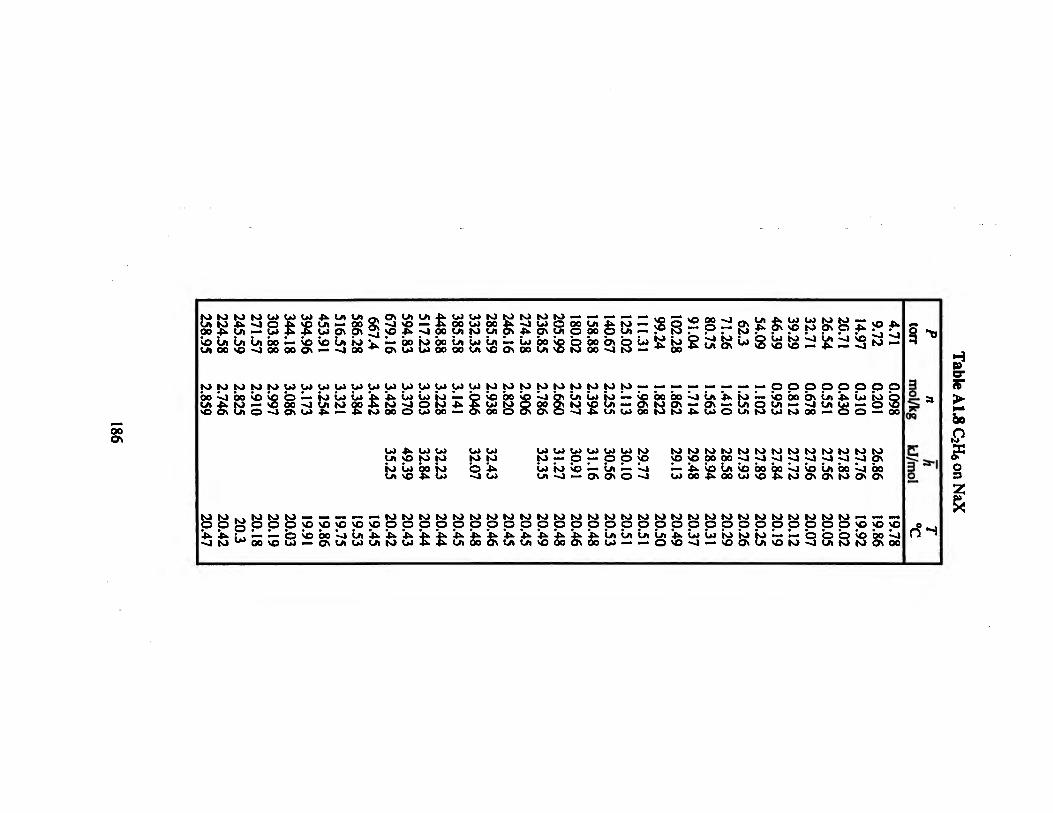
OS Ul Ul 4> v l vO — 4k __ _. __ ^ v O - l k v l O O U l t O U l SO Ul Ul Ul 00 — VO SO Ul to j UlOOVOvlOOOOOS — vlOO
to — o — w 4> Ul Ul tO IO — Os so to Os O 4k
t O t O t O t O U l U l U 1 4 k U l U l a . U i t 0 4 k v l o Ç s p u i — oo 2j 00 4k Ui — w 4k 4k Ui OS OS 3 - - - . _ _ - _ . - - _ • . . . . . . . . •£* — b o i o b o u i u i u i — u i b o s o o b o b s o u i ^ ' s j e ^ ^ u j Q u i t o v i y i v i v © * o > w ß o o o o { A s o » o o S s ? S o o " S - * o o 5 u , a i 6 v o y 0 - * ' ' - * J
u i u i t o t o i o t o t o — — — — — ya O O U 1 0 0 4 k v l U 1 0 0 0 U l 4 k t O — S O
O S 4 k O S U l O O O O U l — î ° " vO 4k v l "vl to —
t o t o t o t o t o u i u i u i u i u i u i u i u i u i u i u i u i t o t o t o t o i o i o t o i o t o 4>4kUlUl tO — ©sOOOvOvl 00 v l
VO OS OOvOvOO — t O U l U l IO — VÖ 00 v l Ul to 00 U i O v l O s U l 4 k — 4k 4k to v l o IO 4k
to OO O Ul oo —
— — — — — — — p p o o o o o o u i u i t o — s p ô o b o v i ù i 4 k to — s o b o b s û i ^ k U i w Q tovoui — os to os — os — u i o u i — v i u i u i — o 05 v ! 4 k U i v > 1 0 0 t O t 0 4 k v > 1 0 U i t O U I t O a o - O O — oo
Ul 4k U l Ul U l VO tO tO
K 2 to U l
W W W W U W W W N t o t o to — O — O O vO Ö 4 k Ul to so — Ul — vl v l Ul Ul v l — OS OS O v l
w w w w w w w w w w w w w V O S O O O O O v l v l v l v l v I v l v l v l O S — 4k VO Ul SO 00 Ul 00 4k 0O Ul so s vl SO Ul O0 v] to OS OS IO OS
00 OS
to t o t o t o — — — — — t o t o t o t o i o t o t o t o t o i o t o t o t o t o t o t o t o i o i o i o t o t o t o t o t o t o t o i o — — — O O O s o s o s o s o s o O O O O O O O O O O O O O O O O O O O O O O O O O O O O s o s o s o
. . _. • • • • • • • • • • • * • • • • • • • • • • • • • • • • • • • • • • • • • • « 4 k 4 k ¡ . — — O s O O O v l C n 4 k 4 k 4 k 4 k 4 k 4 k 4 k 4 k 4 k 4 k 4 k 4 k 4 k 4 k C n U i U i U i 4 k U i U l t O I O t O — — O O O s O O O v l v | IO 4** 00 V© Ul — O S U l U l U l t O U l 4 k 4 k U l O O O S U l U | V O O O O S O O U l — — O s O v l — v O O S U I v O t O v l l s i t O t O O S O O
o o
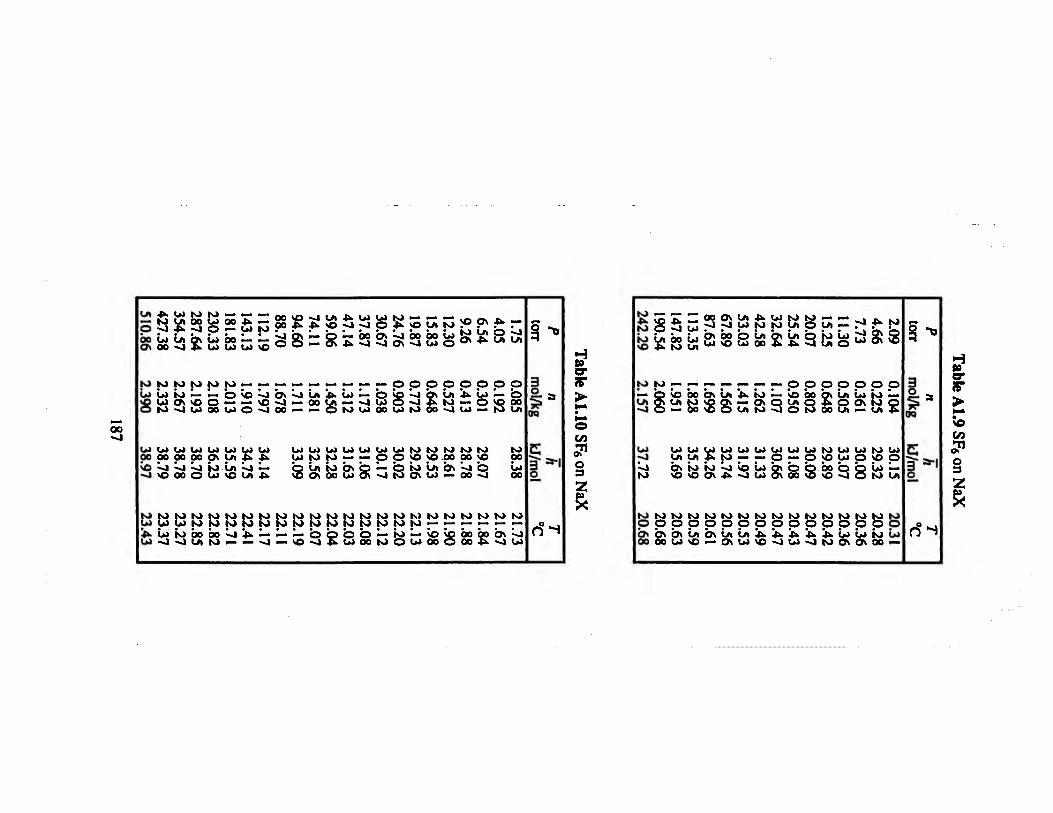
Ul 4k Ul NI NI — — — /vivo — t o u i o o u i o o 4 k — 2 2 T ? O v i 4 k v i o — U i t O
_ v l U i 4 k U l U l t O — — — 0 0 4 k 4 k s O v l v l 0 4 k s O U l t O boûiuibsûibo — — S i a * " 2 r ° ? ° ¡ ^ O S O 0 v l 4 k U l U l U l 3 0 0 — O S 4 k v l v l O S
vO OS 4k — oo oo ui y S? f5 hi
to to to to to to O O O O O O O O Ul Ul Kl — — O v O v l O S v l U i 4 k U l — O s p v l Q S U i 4 k U i — o vO Ul OS vO O — — sOv l — OO Ul — v l Ul O v l 4k tO — O SO 00 O t O v l U l O O U l O v l O O — — O t O U l O O U l t O O O v l U l — t O U l
U 1 U 1 U 1 U 1 U 1 U 1 U 1 U 1 popooooopsytJËJU v O v j ^ l ^ J t o U i v l — v l v O O O O U l s O U l 4 k
W W W W W W W W W M W K ) U l t O t O — — o o v o s o o o o o s o s Ul IO OS Q —
Os oo u i Os v i O tO Ul OS v l o to OS Ul — 00 v l
to 00 00
I O t O t O K ) t O t O K ) t O t O t O t O t O t O t o i o t o t o t o t o t o - — — — — —
Ö t o t o t o t o t o t o t o t o t o u i u i t o t o t o t o t o t o t o 4 k U l | O 0 0 0 0 v l 4 k — — — O O O O — tO — VO «O 00 00 OS v l U l v l v l U i t O — — v l — v O v l 4 k U 1 0 0 t O O U 1 0 0 0 0 0 4 k v l U l
er S" >
Vi o7i o
&
^? üñ Jk — 0 0 O S U l 4 k U l t O I O — — ^ . j v i o f S S è r j v i v i u i i o t o u i o u i — r4 ^ M ig 2 S S 2 S S ifi £ 2 3 K o" a a s • • • • • • • • • • • • • • • a — Q s O 0 0 O S U i 4 k t O — SO 00 OS Ul Ul IO — U i A U i t O s Q O S — O S O U l Q 4 k O O S t O O v l O — 0 0 < O O U i t O v l O K > 0 0 U i — U i4k
Ul W W W W W W U W W W W W M W v l Ul Ul 4k Kl — — O — p s O U l p s O O vj b s t o t o v i v o u i b s ö ö b o ö b u i — IO s 0 v O O s 4 k v l U l O s 0 0 v e v O v l O t O Ul
w w w w w w w w w w w w w w w w o p p o o p p o p © © p o p o © b s b s b s u i b s u i u i 4 k 4 k 4 k 4 k 4 k u i u i t o ú i OOOOUlsO — O S U l s O v l U l v l t O O S O S O O —
5-«
n m
ol/kg h
U/m
ol
n°H
2 a
O"
ir se
5e1
o* o 3
z ft
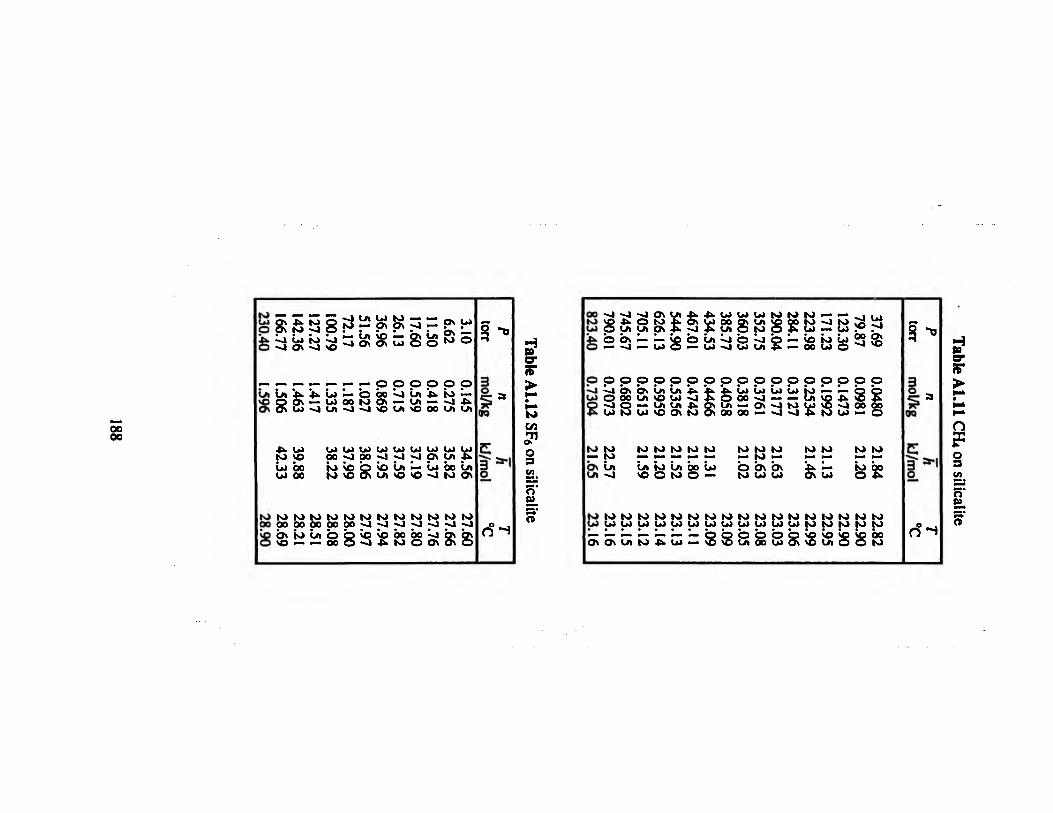
• • • • • • • • • • • • • U l U l 4k 4k U l — © 0 0 v l U i 4 k | O — v O © O S — U I O O I O O S — U l — v l 4 k O S O S U l v l U i v J v l v O U l v O O O U l U í
4k Ul U I U I U I U I U I U I U I U I U J tO VO O 0 v ] 0 0 v ) v ] v l O S U l 4 k • • • • • • • • • • • U l 00 t O s Q O s O U i — U l O O U l Ul oo t o v o o s u i v o v o v i t o o s
w w w w w w w w w w w w w O O O O O O O O O O O O v l v l v l v l v l v l v l s o b s t o u i ö o s o s o b o b o v i b i b s © V O — — 0 0 © v l 4 k t O O O S O s O
S - *
n m
ol/kg h
U/m
ol
o°^
er S" > to v¡ 3» o 3 en
O
O
00 v] vi vi os K> )0 4k O to Ul O Ul Ul OS
bs — — vi — Ul
©•2 fsgpo
Ul s ui to to to — —
©'S vi © vi vi Ul Ul 2 = Ö U1 o
vi Ul VO vi bo bs vi VO
o o o o o o o o o o o o o o o o o o • • • • • • • • • • • • • • • • - -v l v l O v O v U i U l 4 k ^ ^ U l U l U l U l t O — — ' © O O U l s O U l v l ^ O O O v l — — U | V 0 4 k
Ul © vi O — Ui Ui 4k Jk Ul W Ul VO OS to
S£ Ul — O S v l t O U l s O v l O O O O 0 0 0 0 — v i v ) 4k N) U l — O
— bs U l
to Ul
to to U l v i
to U l
to U l
to to to to
ui to In bo SO O tO ©
to U l
to Ul
to Ul
to
U l
to U l b
to U l b
IO
b to
to U l b
to IO bs U l
to U l b
to
bs U l
b to U l b
to i IO to so
to
uî
to to to to SO so
to
to ©
to to so
to
£ to to bo
OS Os Ul K) 4k U l
3
i OQ
d-J
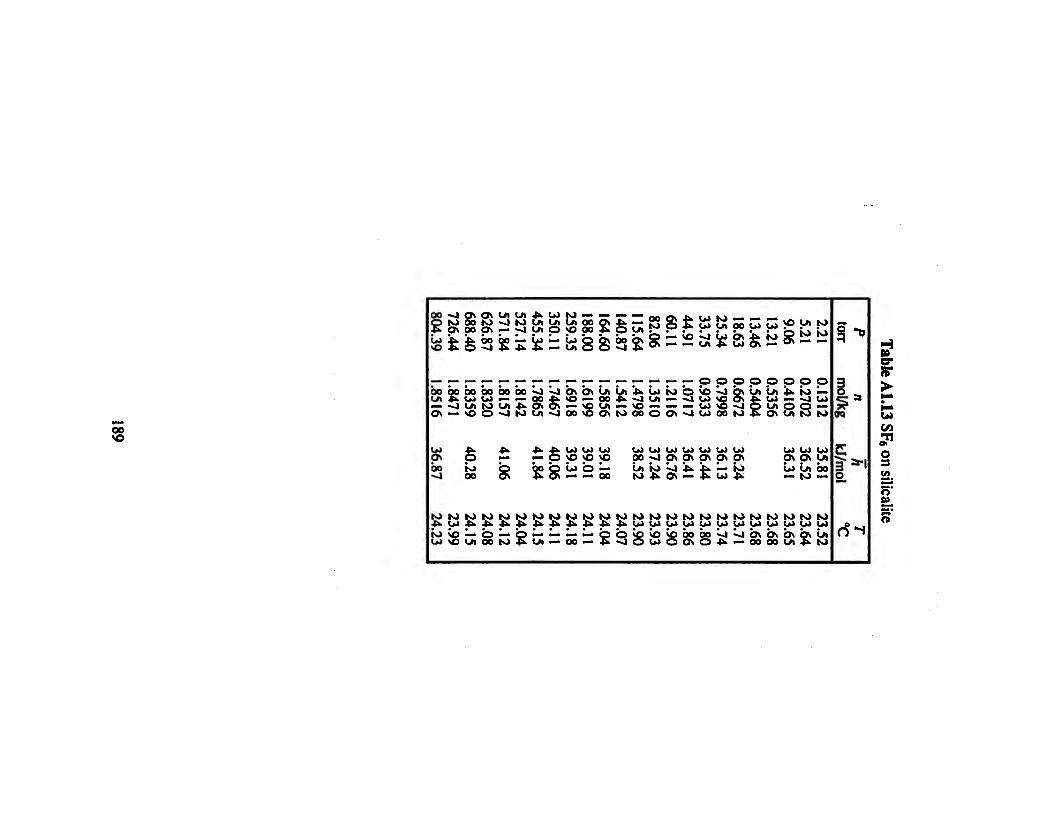
00 so
0 0 0 0 0 0 0 0 v l v l O v O S U l U l 4 k U l t O 00 00 Ul 4k Uî Uî — v l Ui to . _ _ OS — s O O v l t O U i v l — — OOXkVO — O O ^ v l U i — v l U l VO OS Ul 4k OS OS — sQ Ui — s o — — — Ul vO v l
oo s O s t O O O O O S v l U l O O t O
O O O O O O O O O S O v l b v U i U i i k t O — . . . ._ x .. u i — v l Ul
Ul O © — OS Ul to to
OS bo vl
Ul Ul Ul SO so SO
b bo b ui © — OS 4k OS — — 00
to 00
Ul Ul Ul Ul Ul Ul Ul 00 vl os OS OS OS OS Ul IO vl tO 4k os
4k 4k — to — 4k Ul 4k
Ul Ul Ul OS OS Ul úi ui bo — IO —
t o t o t o t o t o t o t o t o t o t o t o t o r o t o i o t o i o i o t o t o t o t o r o t o 4 k U l « . « . 4 k 4 k 4 k 4 k 4 k 4 k 4 k 4 k U l U l U l U l U l U l U l U l U l U l U l U l tO so — O — Ul SO Ul 00 IO 4kûi — óo — 4kviO
VpOOOOvIvlOVOSOS O 0 s 0 4 k — OOOOUi gu . to
1= OQ
o
ñ^
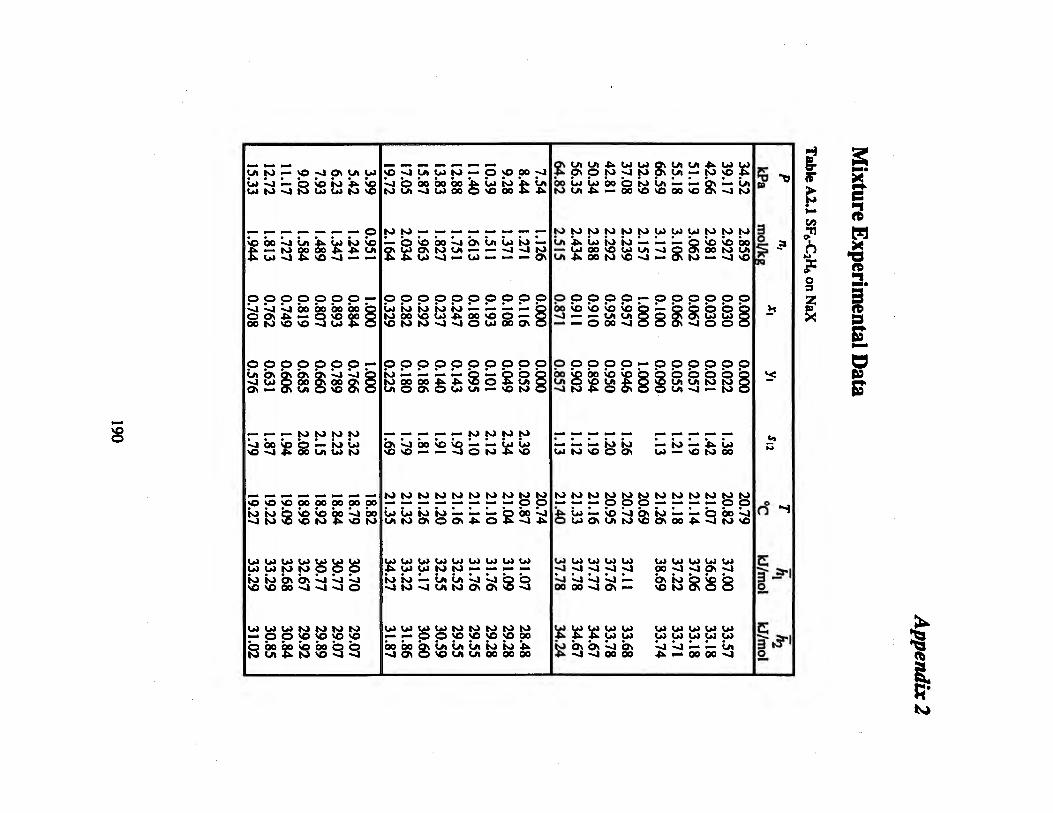
Ul to — so v] OS Ul • • • • • • • Ul v l — © \o tO 4k Ul IO v] to Ul Ul to
• • * • • * • SO 00 v] Ui 4k ui to 4k — to OO 00 4k 4k 4k Ul v | 4k SO v l —
© © © © © © © v i v i v i oo oo oo oo © OS 4k — © SO 00 00 to SO SO v l Ul 4k
p p p p p p p üi bs < bs bv vi vi v l Ul © 00 » oo g> OS — OS Ul O s© OS
— — — JO to to to vi bo sp b — to ui VO v l 4k 00 Ul u i to
SO SO SO OO 00 00 00 IO tO b SO SO bo v l v l to vfi VO to 4k VO
Ul Ul Ul Ul Ul Ul Ul Ul ui to to © p © io to bs bs vi vi vi SO SO 00 v l v l v l O
Ul u i u i to to to to — O O so so SO so b bo bo vo bo b © tO Ul *k (O SO v l v l
U l
© VO U l
i I
00 bo to
s O v l U i U l t O — p s O O O v l v i b b o b o b o ^ ù i t o ^ u i t O U | v l U l O 0 © v O O 0 4 k 4 k
• • • • • • • • • • — © v O O O v l O s U l U l t O — OS Ul OS W Ul — — v l v l t O 4k 4k W v l — ui — — — OS
oppppppppp w w W W W — — — — © tOOOVOU14kOOvOO — p s O I O t O v l v l O U l O O O S ©
o o o o o o o o o o • • * * * •> • •_ •_ «•. to — — — — o — o o © | 0 0 0 0 0 4 k 4 k Q 5 0 4 k U l © U l O O s O U l U i - s o t o o
b s v i b o v o s o — — u i u i vovo — — v l O t 0 4 k S O
w w w w w w w w w w • • • • • • • • • • U l U l t O t O - — — O O O v l U i t O O s O O S 4 k 0 4 k v l 4 k
w w w w w w w w w 4¿ w w to w — — — — ¡oto — u i û i v i v i b b - J t O v l U i t O O s O S S O v l
w w w w w w w w w — — p p s p v o s o s o p o b o b o Ö N U i U i U i w w i k v l O S O S O U l U l O O O O O O
OS Ul Ul 4k W W OS *«. ps © to vl JO OS bo w w bo © to ui W U l 4k — 00 VO vO
to to to to to to Ul Ul 4k W to ÍO — — — W 00 so W Ul v l Ul 4k oo to SO v l —
© © © © © — © bo vo vo vo s© b — v] — — Ui Ui S © — — O 00 v l © ©
p p p p p ^ p bo vo bo so so b b Ul O SO Ul 4> o v5 v l tO 4k O OS O ©
• • • • • • — — — W W — w w vo O OS w
34.52 39.17 42.66 51.19 55.18
W W W W W — b so so bo © os oo w ui 0s W — vl so
o o o o o © b o o b » OS Ul Ul o Os v l O O ©
o o o o o b o b o © Ul Ul w w o Ul vl — w o
W — 4k ú l — vo W 0O
w w w w w w w w w w w w — — — p o p — — — — p p £. w — s o v i b s w — — © b o v i O W O S U l W S O O S 0 0 4 k v l W v O
W W W Ul W U l v l v l v l v l v l 00 v i i j la v i — bs 00 00 v l OS — VD
33.74
33.68 33.78 34.67 34.67 34.24
37.00 36.90 37.06 37.22
W W W Ul w w w w v l — — U l — 00 00 v j
ta
n, m
ol/kg V,
v:
¿1
d ^
3*^"l o_
3*t?l o_
g w CO
s o s
M a
Ä B
m •o «
I 9 E 5
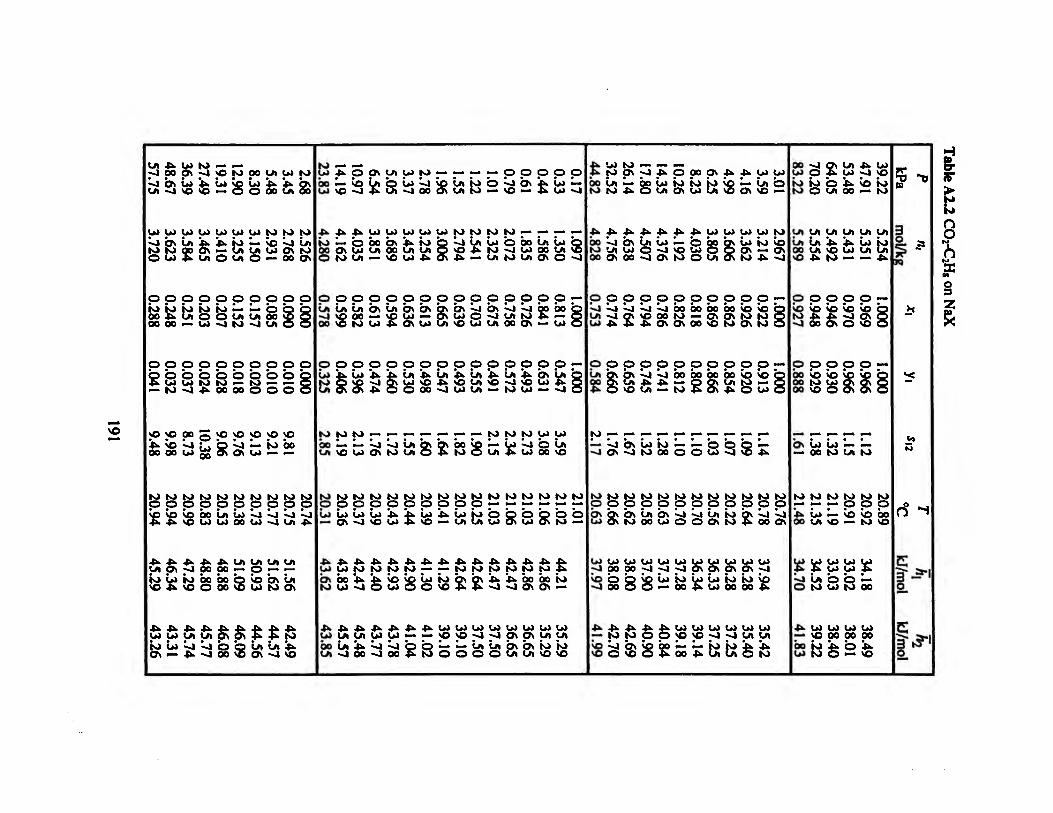
Ul 4k W W — — v l O O O S v l v O W O O U t U l W • • • • • • • • • • v l O S U l 4 k W S O W 4 k ^ O s U l v l v o s o — O O 00 U l 00
W W W W W W W W W W
• * • • • • • • • • v l OS U l 4k 4k W — so v l U i W W 00 OS — U l U l W O S W O W 4 k U i O U l O — ooos
o o o o o o o o o o to w w to w — — b o b 0 0 4 k U i O O U i U i O o S © 0 0 0 0 — W v l W v l U i O ©
© o o o o o o o o o
• • • • • • • • > • • g o o o o o o o o © W U 1 W W — w — — ©
— W v l 4 k 0 0 0 0 0 0 © 0
SO so 00 vo so so vO vO è s o v i r ^ p v i — w o o
oo w gg OS OS w — —
w w w w w w w w w w
o o o o o o o o o o
. . . . . . . . . . O0 Ul Ul vl vl v] v] W W O0 Ul vl Ui 4k
4k 4k $
S£ 4k 4k Ui Ui Ui Ui oo oo — © — —
W Ul w oo so 4k vo ©
00 ©
oo 05
SO OS Ul Ul W OS
w w u i u i d s o s l t i f k t o W Û l v l v ] b b Û i Û i 4 k OS— 4k v l O0 v i OS v l SO
w — — W 4k O OS u « w w — — — — p p p p p bo — s o u i © û i v i \ o u i i o © v i b s * . û i — W s O v l 4 k U i v l 0 0 O s U l W > - s O - 4 k W v ]
4 k 4 k 4 k w w w w w io — © bo bs 4k to © O O O S W U l O O U i U i © O W U i — vo W 4k OS
w w w w — — — — vi ui w © bo ûi w
Z£X vl Ul 0O Ui vO W Ui OS O vl
4 k 4 k 4 k 4 k 4 k 4 k 4 k U l W U l W W b o v i b s û i w — b b o o v w i o v o W U l W O v l v O W O p O v — OS 0 0 O s O 0 v i o s W © U i O s W 4 k v i
o o p p p p p p p p p p p p p ^ -û i ù i û i b s û i b s b s b v b s v i b s v i v i b o b o b v l S O O O — S O W — O S U l O v l U i W Í k — © O O v O W U l 4 k O S W U l S O W U l O O O S — U l ©
o o o o o o o o o o o o o o o
- - • • • • • • • • • • « • a W 4 k 4 k U i 4 k U l 4 k U i 4 k U i 4 k O s U | v O v l O v U l v 0 4 k v O U | V O v l v O U l 4 k O s 4 k © O O O v l W U l — W U 1 — v l
U l
w w w W W W W Ul 00 — — v l v l U i Q s O S O O V O — W v l O U i U i v o W 0 S W U i O 4 k W O U i 4 k W 0 0 v O
w w w w w w w w w w w w w w w w
p p p p p p p p p p ^ ^ - ^ - ^ - ^ ^ û i û i û i û i J U 4 k W 4 k w i o b b b b b b — O S v l v O U l S s O — U l U l W O S W O S W —
6 OS
4k 4k W W 00 4k Ul vl
4k W
è 4k W SO Ul
4k W
S 4k 4k
Ul w
O so
4k 4k 4k 4k 4k 4k W W W W W W £ 2 2 4k 4k 00 00 w vl vl OS OS —
4 k 4 k 4 k 4 k 4 k 4 k 4 k W W W W W W W U l W U l U l W W — — s O s O v l v l O S O s U l U l 00 Ul U l v l 0 0
v i v í © © — — U I U I O S O S W W v l 0 0 4 k W © O © © U l U | S 0 s 0
boUi — ô o U i w w w s o — U i © W W 4 k O U i O S W U | s O O S v O —
w w — — — W OS v l 4k © 00 OS
4k 4k W W
o o o o o o o o o o • • • • • • • • • > « . v l v l v l v l v l O O O O O O O O V O V O Ul v l OS VO OO w — o s o s w w w ^ ^ - -
© —
4 k O s O s o o s o w O S W
o o o o o o o o o o o
• • > • • • • • • • • • ) U l Q s O S v l v l O O O O O O O O V O S O 00 O» U l 4k 4k — © OS U l W — 4 k © s o U i — W 4k OS 4k b Ul
w — — — — — — — — — v i b s û i w — ! - b b v l O S v l W O O O O U l v ]
2 4k
w w w w w w w w w w w w
o o o o o o o o o o o o os 8 OS U l Os v l v l U i w W 00 U l O O OS w 2 v l v l
oo os
w w w w w w w w w w w v l O O O O v l v l v l O v O S O S O S v l v5§8Si¿ w
00 W W W SO Ul 00 00 4k
4 k 4 k 4 k 4 k 4 k W W U l W U l W — w w p p s o s p v i v i y i y i
v O O v o S S S O i k u í u í u W
00 vl OS Ul 4k w W © 4k w vl vo w w b 4k vo to W © Ul 00 — w
Ul Ul Ul Ul Ul Ul ûi Ui 4k 4k Ûl W 00 Ul VO W Ul Ul vo 4k W — — -tk If
1Q
p p p p p 00 SO SO SO SO 00 W W Oi OS 00 SO © OS OS
Os Ul w — — — 00 W Ul w
w w w w w w
— — — © © o
. . . . . . 4k w — so SO 00 00 Ul vo — W VO W W W W Ul S 4k Ul Ul í*k vl Ûl © © — O W Ul W 00
4k w w w w — SO 00 00 00 00 W *4k b 4k Ul W © — vo
Ï-*
ri ~»
3" -l o
i-iî-i
i S" 13 n p
o
9 I
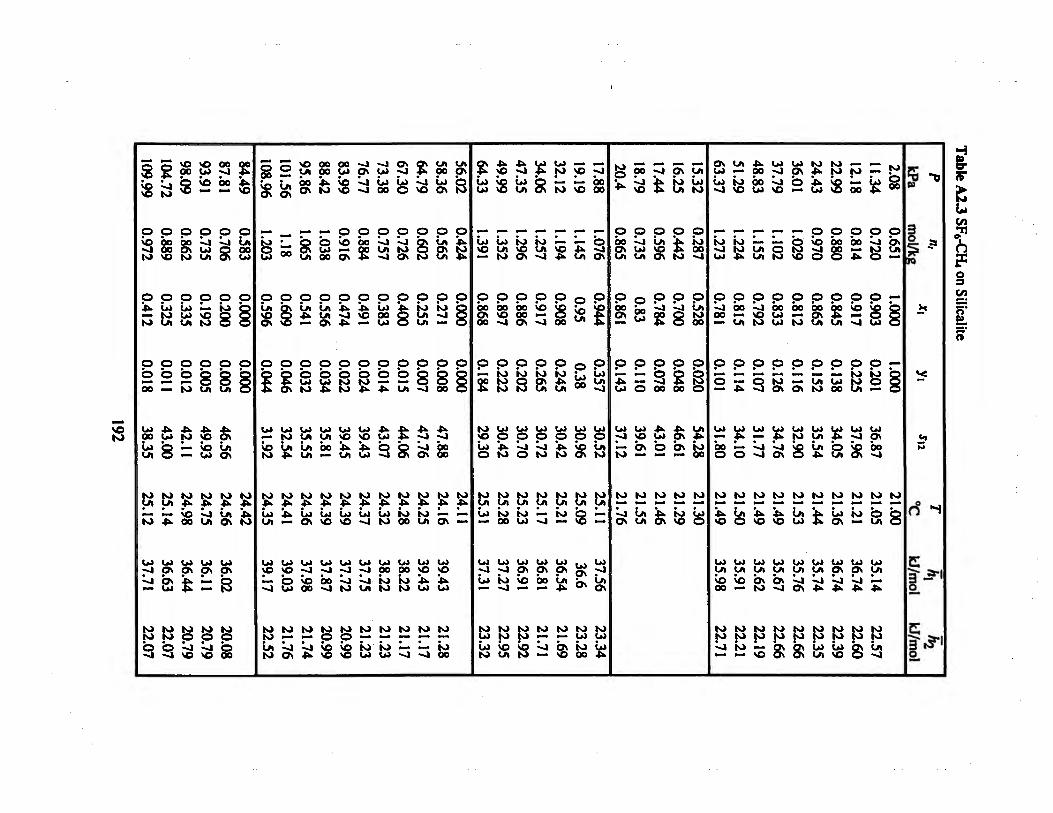
so
104.72 109.99
0.889 0.972
0.325 0.412
0.011 0.018
43.00 38.35
25.14 25.12
36.63 37.71
22.07 22.07
SO OO
S
© bo OS w
p Û1 W Ul
o b w
4k W
SO oo
Ul OS •
ë vl SO
VO
w SO
o vl Ul Ul
p SO to
oo vl bo
o
o
o o Ul Ul
SO
w
• vl Ul
Ul OS •
ë vl SO
Ûl os
Ul OS
Í3
ë b 00
32
o Ûl 00 Ul
p
p
2 w
o 00
§ w
p Ûl SO os
p
Ul
SO
w
ûl Ul
Ul SO
vl
w w Ûl
w
o
Os
oo
p
p
w w 4?
s £ Ul vO b w
w Cl os
vo Ul bo os
1 Ul
o
o b w w
w Ul Ûl Ul
w 4k Ûl
os
Ul vl SO 00
w 5
00 00
w
b Ul 00
o Ûl Ul Os
o b iß!
Ul Ul bo
w 4k ûl SO
Ul vl bo vl
ë
oo w
is © VO
o>
© vî 4k
o
s w w SO 4k Ul
w 4k ûl vO
Ul vl vl
w
w o SO SO
vi OS vi vi
p bo
o 4k SO
o b
Ul SO 4k Ul
5k • w vi
w vi • vi Ul
w
•vi Ul Û1 oo
o vi Ul vi
p Ul 00 w
o o
w
3
ûl
w
Ul 00 w to
— io w
Os vl
w o o vl
w os
p
© b uî
8
io 00
Ul 00
io
JO
vî
vl SO
o 8 w o Ul
Ul 00 ûl OS
o k os Ul
o
o o 88 vl oo
5 vl Os
w Ul
w sO 4k Ul
¡o P—n
vl
4k vl
bo 00
• 5s
Ul SO 4k w
w io 00
Ul OS
w
o 4k
p
p
M
49.99 64.33
W Ul SO Ul
— w
p p bo bo OS SO 00 vl
o o — w 3Z là
W Ul vp O ûl 4k
o w
ûl Ul
Ȉ sO OS
p bo 00 OS
o w w
Ul p vl o
it 8
vl
o SO vl
o io OS Ul
Ul p vl w
w w w
I o
s 00
o Ul
Ul
o 4k
w
SO
sô
Ul
p VO Ul
0 • w 00
w 0 SO Os
vl bo 00
OS
0
I 0 Ûl Ul vl
Ul 0 Ûl
w to w w w w w w Ul Ul Ul Ul Ul Ul Ul
ûl w io — io b — — 00 W vl — v© —
Ul Ul vl vl ûl W — vl
w w Ul w w so W Ul
Ul
os sO
w w • SO w
Ul
os bo
w vl
Ul os Ûl 4k
50
SO
Ul Os bs
w Ul
io 00
w vl Ûl Os
w w
w © 4k
p bo os Ul
p bo os
0 • it Uî
Ul vl
w
w vl os
oô vl sO
p vl w Ul
p bo w
p
0
Ul SO bs
w Ûl Ul
16.25 17.44
0 Ûl SO os
0
w
p p Vl vl
28 0
3 00
4k
w b
w
0
00
bs
w vO
Ûl ûl w
0 io 00 •vl
0 Ûl w 00
0
§ Ul 4k
io 00
w ûl 0
OS
w ûl vl
3 Ul
p vl 00
0 • 0
w bo 0
w 4k vO
Ul Ul VO 00
w w vl
Ul
vo
io
p bo Ul
0 *
• 0
w Ûl 0
Ul Ul SO
w w io
00 bo w
Ul
p vl SO w
p 3
Ul
vl vl
w 4k SO
Ul Ul bs w
w w . SO
Ul vl vl SO
0 w
p bo w w
p w OS
vl OS
w 4k VO
Uî Ul bs vl
Ul os b
b SO
p bo w
p OS
w w
w Ûl
w
w Ul vl
os
w w w w 8s8
4k
w
0 vO vl 0
p bo p> Ul
p Ul
w
w Ul
4?
w
Uî Ul vl 4k
w ûl Ul
w w Î8
0 bo 00 0
0
2 Ul
p w 00
it s w • w os
w os vl 4k
w w ûl so
w ÔÔ
0 bo
0 VO vl
0
w vl SO OS
w to
Ul os vl 4k
w w 8
2.08 11.34 ? • •
0 0 3 vi bs S. a O — 2T
1Q
0 —
w 0
0 —
ë§ Ul
os bo vl
w w
88
Uî Ul
4k
w w Ûl vl
*
w:
¿1
d «H
3-^-1 o.
3-.S-I o.
i S" go w Vi
5°
o 3 Vi ïï
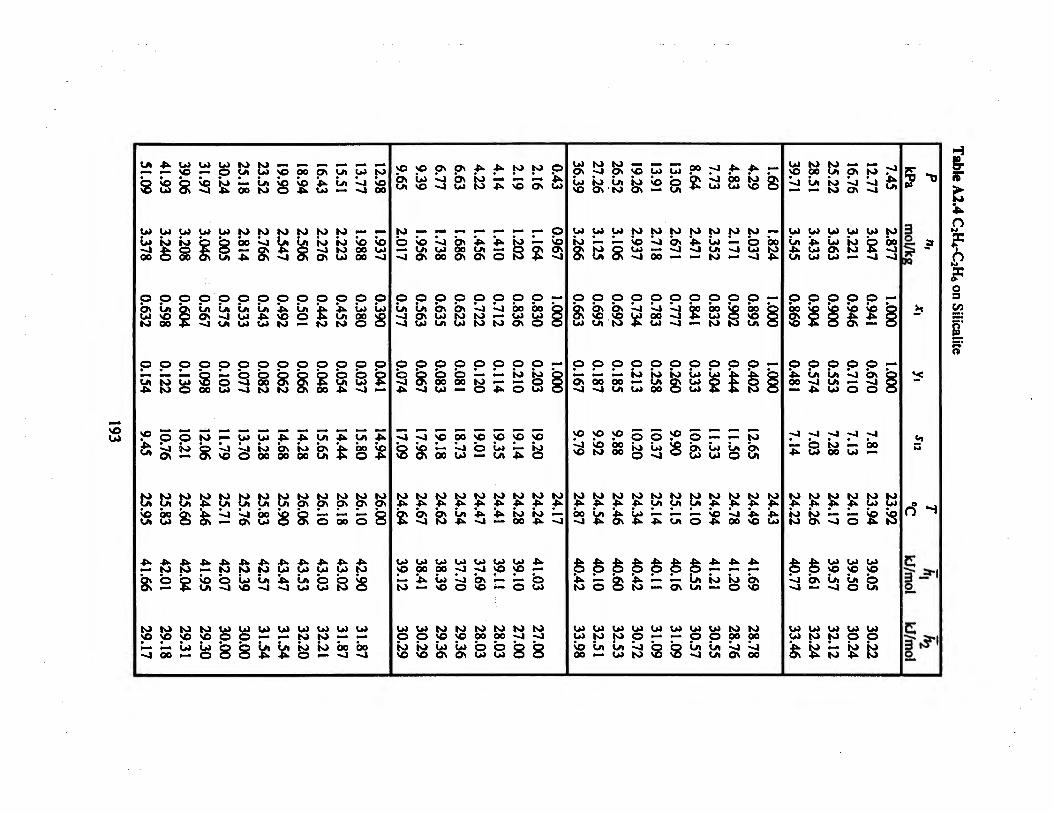
SO U l
41.93 51.09
3.240 3.378
0.598 0.632
0.122 0.154
10.76 9.45
w VO
v8
U l
ë 00
p
o • w o
o »o
w VO v l
w
o Os v l
O
s oo
to
fe
24.46 25.60 25.83 25.95
42.01 41.66
29.18 29.17 w
4k
SO U l
SO û> ©
23.52 25.18 30.24
w w w b bo v i Ul 4k 8s
p o p Û l Û l Û | v i w 4 k U l U l U î
O O O — © b O v l 00 W v l w
— U l w v l L i i o sO O 00
es
to
is 0
O
8 w
4k bs 00
0 0
z M Ûl
8
0 Û l 0
p
4k W 00
W W W W W y i u i y i y i pv v l v l bo sp © — OS U l © os
4k 4k 4k W W W O û l û i v ] VO v ]
U l W W © © — 8 8 4?
4 k W '4k v l
U l
4k W Û l U l
U l ¡0 ë
5s • 4k U l
to h* OS
0
w
0
2 0 0
U l bs
w ps 0
4k w b w
w ¡0 to
U l Û l
to N to w
0 • 4k U l W
0
4k
W OS
0 0
W t v l v l
SO 0 0 0 0
p w 0 0 0
0 s v l
U l bo O
W OS 0
4k 4k W W
U l
bo v l
w bo v l
W t SO O0
SO U l v l
O Û l
8 0
2
4k
Z
W OS
8
sO bs U l
b vî
p Ûl v l - J
O
3 4k
SO Li SO
SO U l Os
0 Û l OS w
0
15
- O V l
sä s 2
U î vO Î3
w 0 te SO
s 3
U l 0 0 4 k
w 0 so
OS v i •vi
v i w 00
p O l U l U l
0
g w
so 00
bs w
w 0 0 w so
•d so w Os
Os bs w
bs 0 0 OS
p Os F* U l
0 1 00 v i U l
s fc
w v i v i 0
•d VO Û1 OS
4k
w
OS
p v i t o w
p
ë
sO b
's w v i bs vo
0 0
s
4k
4k
0
0 t v i w
p
4k
so w U l
4k
U l SO
w 00 b w
t o
SO
PS
p bo w OS
p
0
so
io 0 0
w SO
0
0.43 2.16
— so
£3 p — bo © w © 0 0
© — es U l 0
sO
ë
io — 4k v l
4k
3 3 8 8
w w w OS v l Os û l W Û l SO os w
w w w W — —
Os U i OS
p o p OS OS OS Os vo vo W U l w
p o p öv 00 00 v l v l U l
VO so vo • • • v i VO 0 0 SO W 0 0
y £ y 4k 4k 4k bo ui £. v i 4k Os
SO w OS
to so U l v i
0 t v i
0 ÍO w
p w 0
û l 5
8.64 13.05 13.91
w w w v i bs 4k — v i v i 0 0 — —
0 0 0 t • • v i v i 0 0 0 0 v i 4k W v i —
p o p w w w Ul OS w 00 0 w
© i° 5 w g bs v i O W
4k Ui ©
è è è è ê è è 4k — bs 4k — — û i w 0 © W — OS U l
w w w w w w SO U l U l 0 0 — w
U l 0 v i to
W U l w — — © S 8 vi
•vi v i w
to w U l
p bo w w
p
w Ul
w 4k
4?
4k
¡0
w 0 U l U l
4k 00 w
vî
0 s w
0
1
v l 0 0
4k
ë
00
oi
1.60 4.29
w — b bo U l w v l 4k
p — bo © vo © U l ©
© —
w bs U l
4k 4 k 4k 4k VO U l
4k
bs VO
w 0 0 v l 0 0
28.51 39.71
w w Û i 4k •U. w U l w
p p bo so vO 4k
0 0 4k Û l 0 0 v l — .4k
v l v l
• • — 0 4k W
•** 4k io w w os
èè v i bs •vl —
w w w w
.8 to
w w Os Ul
p
0 Û l U l w
•vl • w 00
vî
w vO Û l v l
w w • to
os v l os
U l Kl w
0 •
0 • v l 0
v l
w
0
w VO Û l 0
7.45 12.77
w w 2 2S v i v i
0 — • •
© —
11 v l bo
Z w
U l SO b U l
W U l 0 0
Í •*
3 ° v M
H
v ;
¿1 Î3
ri -ï
3--5-1 0
c 3-.S-I 0
H g-»• 4k
n S Kl
o s Cfl
Í
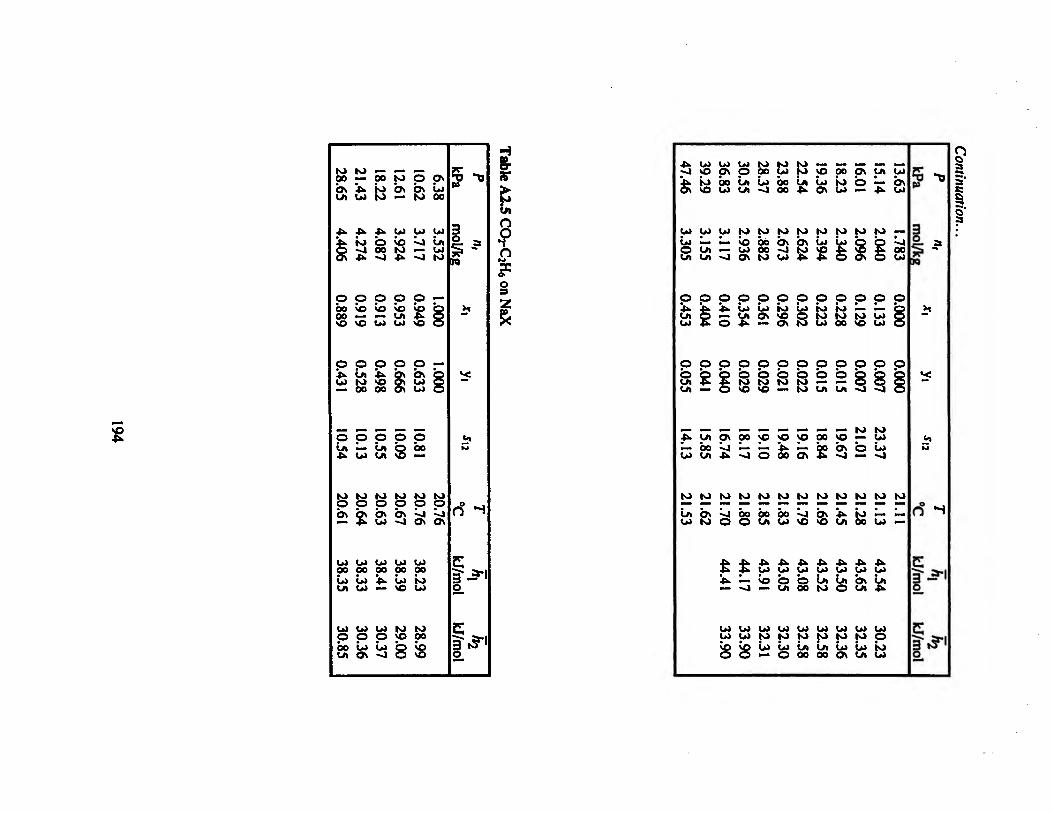
*
21.43 28.65
4.274 4.406
0.919 0.889
0.528 0.431
10.13 10.54
20.64 20.61
38.33 38.35
30.36 30.85
öÖ io w
4k b 00 vl
p VO
W
O
è 00
o Ûl Ul
w o bs w
w 00 4k
Ul
O ûl vl
W bs
w SO
© VO Ul Ul
o
1 o s w o
3 w oo w sO
8
6.38 10.62
3.532 3.717
1.000 0.949
1.000 0.633
5 bo
20.76 20.76
Uî
po w w
w 00 SO sO
5 •* B»
i a w
H
v:
¿i
o° H
o_
3" 3-1 o_
S"
? o s
39.29 47.46
3.155 3.305
0.404 0.453
0.041 0.055
15.85 14.13
w w Ul Os W W
30.55 36.83
2.936 3.117
0.354 0.410
0.029 0.040
18.17 16.74
w w v] oo O O
44.17 44.41
33.90 33.90
w po ûî vl
W bo 00 w
p w Os
O b •à «O
SO
O
W 00 Ul
4k w VO
w w ûl
w w bo 00
w bs vl
w
p w VO OS
O
Ë
vO 4k 00
W
00
w
4k Ul
b Ul
Ul
w ûî o
8 2
w bs
p ûl
o s w
SO
OS
W vl sO
4k W
b 00
w w Ûl 00
VO ûl OS
w ûl
t p io
o b ui
00
w
s
6 Ûl
w
w Ul 00
8
w
p io w 00
© o ûi
SO
bs vl
w
S
4k w Ûl
o
w w ûl OS
5s b
w
p
VO
13.63 15.14
1.783 2.040
0.000 0.133
0.000 0.007 0.007
w b
w w 00
4k
w bs Ul
w w ûî Ul
w w ûî vl
W W
w —
6 Ûl 4k
W
p io w
§ ~o
n, m
ol/kg
H
v:
¿i
rf H
3" .3-1 o.
5v. l-lî-l o_
a | a
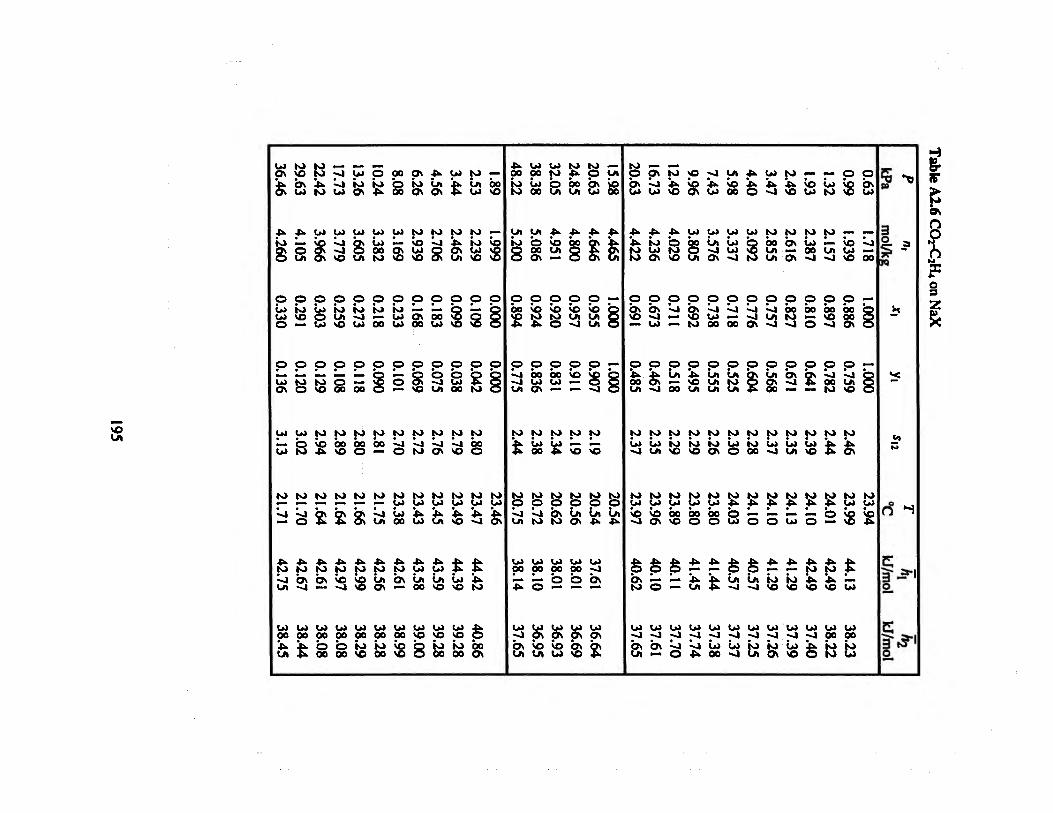
so
29.63 36.46
4.105 4.260
0.291 0.330
0.120 0.136
3.02 3.13
21.70 21.71
42.67 42.75
38.44 38.45
w w • 4k to
W • VO
8 © ûl O W
o » w so
w
z
vî vl w
Ul vl vl SO
©
SO
o • o oo
w bo sO
w io OS
Ul
Ul
o w
p
ôo
w bo O
w w w
fc i 8 4k W bs
Ul 00
b 00
4k W VO vl
Uî 00
b 00
4k W
W 00 •à sO
o
Ul ûl 00 w
o w 00
p
w bo
— vl Ul
w Ûl os
w 00 io 00
00
b 00
Ul
Ô*s sO
o io w w
p o
w » vl
o
w w ûl 00
4k w bs
OS io OS
w VO w sO
p OS 00
o
8 SO
w • vl
w
Ö 4k w
4k w Ûl 00
Ul Uî 00 SO
588
4k Ûl OS
w vl
8 p oô w
o b vl Ul
w vl OS
w w
4k w Ûl VO
w SO io 00
w •
w
Ul
o s SO
o b Ul 00
w vl SO
Ö 4k SO
w Ûl w
w io w VO
p
8
o
2 w
w bo
o
w w
ûl 4k VO W
Uî VO w 00
è bo OS
bo sO
5 sO
p
p
w w
4k oo io w
Ul
i p bo
p vl vl Ul
w
vl Ul
Ul 00
4k
Ul vl
w 00 ûl 00
Ul
b 00 Os
o • sO 4°
p bo Ul OS
w ûî oo
w
o • vl w Ul 00
o
w os so Ul
w w
8
4k vO Ul
o vO
ë p bo Ul
w
w o bs w
Ul 00
b
w os vo w
bo Ul
4k bo
8 p VO Ul vl
o SO
w
SO
w
o Ûl os
Ul 00
b
Ul Os bs SO
w o bs w
ûi
4k 4k
o VO Ul Ul
o
w
vO
w o Ûl 4k
Uî vl bs
Uî os
2
i i
ë 2
ë bs w
4k
w w
o sO
o 4k oo Ul
w ûl vl
w w • sO vl
5s vl w
4k io w OS
o bs vl w
o
vl
w ûl Ul
w w SO OS
w 4k VO
4k
sO
o vl
o Ûl Ôô
w
sO
SO
w bo © Ul
o bs VO
w
O
Ul
w hi vO
bo bo so O
è è ê bs — — w © —
w vl bs Ul
Uî vl bs
Ul vi • vi
o
4k
5 Ul vi
2
vi 4k w
Ul Ûl vi OS
p vi w 00
o Ûl Ul Ul
w w OS
w w bo
o 4k
w vi Û1 00
Ul SO 00
Ul w w vi
p vi
So
p Ûl
w ûî
o
s
4k
ê
w
s w
p vl vl OS
p
w w 00
o
èè Ûl Ûl vl vl
w vl ûl •vl
Uî vl
w
w bo Ul Ul
p vl Ul vl
o Ûl OS 00
w ûl vl
o
4k
io VO
w vl io OS
w 4k SO
w bs 5s
p bo vi
o bs vl
w ûl Ul
Ul
4k
hi VO
w vl ûî so
VO Ul
w ûl 00 vl
p bo ©
o 2
w ûl SO
©
6
0.99 1.32
w — — ib Ul w vl VO
p p bo bo SO 00 vl os
o o vl vl O0 Ul W so
w w
S u 2 8
wfc 4k -VO Uî
Ul w w vl 00 oo
o bs Ul
s? •*
- 3 00 JQ
i i
w w
H
v:
¿1
d H
3"^-| o_
3-t?"
n
o ï
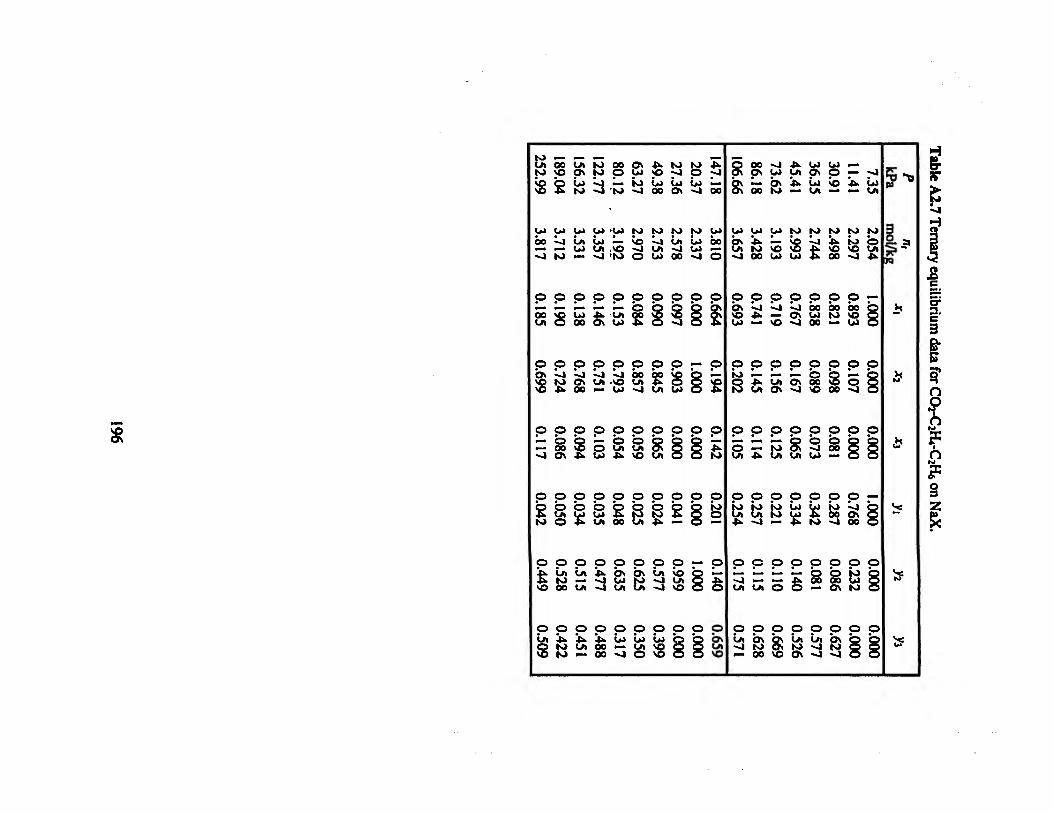
o\
U i Ô Ô Û i î o o o O s 4 k W W 4 k w v o p s t o p u i s o v i p v i SO b ûî v i — ¡O û l û l û l — v O 4 k W v l ' W v l 0 0 O S v ] 0 0
W U I W W - U I W W W W U I b o v i û i w — so v i ûi ûi bo — — W U l . v O v l U i v l W -v l W — v l ' W O U l O O v l O
o o o o o o o o — o v l v l v l v l O O O p v O © — - - ~ " vo Ui 4k © © vp
W vl Ul W O 4k VO to OS uî vO 4k OO —
o o o © o o — b b •— b b — 00 s© © Ui Ui vl Os 4k Ul 4k vO
o o o o o o o o b b b b b b
p p p p p p p p ^ ! u û i û i 4 k b s b s û t s o b 4 k W — v i u î W v i u i S v O O O U l v l U i U i v l v O © è
o o o o o o o o o o • • • • • • • • • a U l 4 k 4 k 4 k W W W Q Q p S S W U l O O — U I S O
W — 00 v l © VO
8 8
00 v l 4k W W os ui ui os o — bs *4k û l vo 00 W — Ul —
— v l 4k ûl — U l
w w w w w w w w • • • « # • • • Ov 4k — VQ v l 4k W O U l W v O v 0 4 k S O v O U i v l O 0 W W 4 k O 0 v l 4 k
•5* ÏQ
p o o p o p © — O S v l v I v l O O O O O O O VD 4k — Os U l W VO O W — v O v l O O — w o
o o o o o o o © • • • • • • • • w — — — o o — © S 4k y i os oo 05 © p
Ul OS v l VO 00 v l o
o o o o o o o © "— — — b b b b b O — w o s v i o o p © Ul 4k U l U l W — O ©
o o o o o o o — w v i b 00 Os p
W v l 00 o
w w w Uî w U U W W ^ 4k v i
o o o o o o o o ê
— — — — b b io ! 00 00 W ( — os w <
p p p p p p p p û i b s b s û i û i b s b b v l W O S W v l w P © — 00 so Os v l v l O O
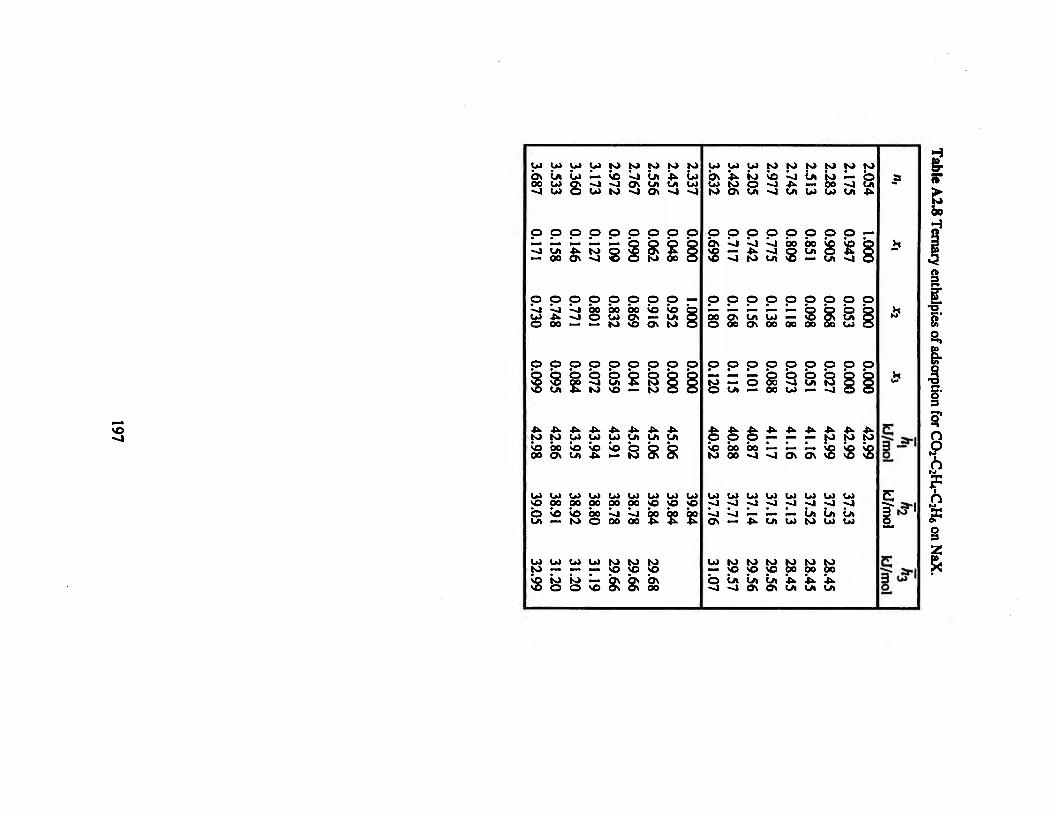
SO v j
3.533 3.687
0.158 0.171
0.748 0.730
0.095 0.099
42.86 42.98
38.91 39.05
31.20 32.99
U l w
8 p
o v l v l
O b 2 4k U l VO U l
U l oo SO w
w
U l
v l U l
©
vÎ
p bo O
©
3 w
4 k W
U l 0 0 bo ©
w
SO
w « SO v l w
p 8
p bo w w
o
8 vO
4k W VO
w 0 0 v l 0 0
w • v l Ov v l
p
p bo OS vo
O
2
4 k U l
8
U l 0 0 v l 0 0
!o!o 88
w w w Ûl 4k W U l U l U l OS v l v l
o o © 82 8 W 00 o
o o — SO so b Si w 8
p o p
4k 4k U l U l
88 w w w vo vo vO
2 2 2
bs oo
w bs U l to
o bs
© ÖÖ o
p
ë
U l 4k w Ov
o v l
vî
p 5s oo
p
G!
U l io 8 O
p Os
p o
è ê ê so bo bo W 00 v l
w v l v l Os
w
U l v l v l
•a SO Ûl v l
w v l
VO Û l OS
w SO •vl v l
o v l v l U l
p w oo
O
g 0 0
4k
vî
W v l
ui
SO Û l OS
w v l
o bo 8
p 0 0
o 3 w
4k
5s
w v l
w
w 0 0
b
w Ûl w
o bo U l
2.175 2.283
o o s'z U l v l
o © o 8 8 8 OO 0 0 U l
o 8
4k
5s
w v l Ûl w
w 0 0
b
o o
w i i p
p
4k 4k 4k W W W
Sígjg
w w v l v l Û l Û l w w
w 0 0
b
a
H
if
¿7
3" .3-1 o
f-3" 3-¿n o